Nashua, MT Map & Demographics
Nashua Map
Nashua Overview
$30,327
PER CAPITA INCOME
$69,375
AVG FAMILY INCOME
$53,750
AVG HOUSEHOLD INCOME
11.0%
WAGE / INCOME GAP [ % ]
89.0¢/ $1
WAGE / INCOME GAP [ $ ]
0.41
INEQUALITY / GINI INDEX
314
TOTAL POPULATION
169
MALE POPULATION
145
FEMALE POPULATION
116.55
MALES / 100 FEMALES
85.80
FEMALES / 100 MALES
45.6
MEDIAN AGE
3.6
AVG FAMILY SIZE
2.3
AVG HOUSEHOLD SIZE
121
LABOR FORCE [ PEOPLE ]
47.1%
PERCENT IN LABOR FORCE
10.7%
UNEMPLOYMENT RATE
Nashua Zip Codes
Nashua Area Codes
Income in Nashua
Income Overview in Nashua
Per Capita Income in Nashua is $30,327, while median incomes of families and households are $69,375 and $53,750 respectively.
| Characteristic | Number | Measure |
| Per Capita Income | 314 | $30,327 |
| Median Family Income | 59 | $69,375 |
| Mean Family Income | 59 | $80,627 |
| Median Household Income | 137 | $53,750 |
| Mean Household Income | 137 | $66,378 |
| Income Deficit | 59 | $0 |
| Wage / Income Gap (%) | 314 | 10.99% |
| Wage / Income Gap ($) | 314 | 89.01¢ per $1 |
| Gini / Inequality Index | 314 | 0.41 |
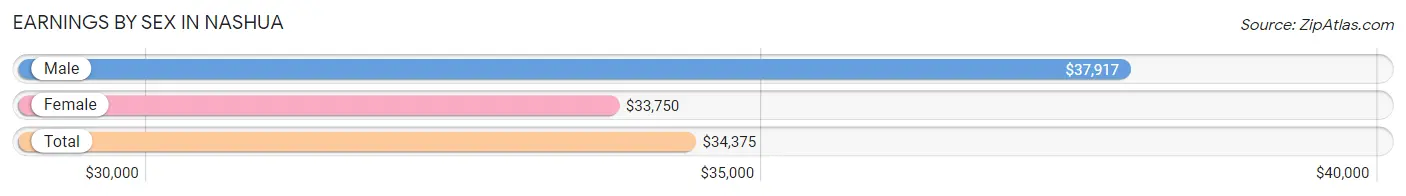
Earnings by Sex in Nashua
Average Earnings in Nashua are $34,375, $37,917 for men and $33,750 for women, a difference of 11.0%.
| Sex | Number | Average Earnings |
| Male | 83 (59.7%) | $37,917 |
| Female | 56 (40.3%) | $33,750 |
| Total | 139 (100.0%) | $34,375 |
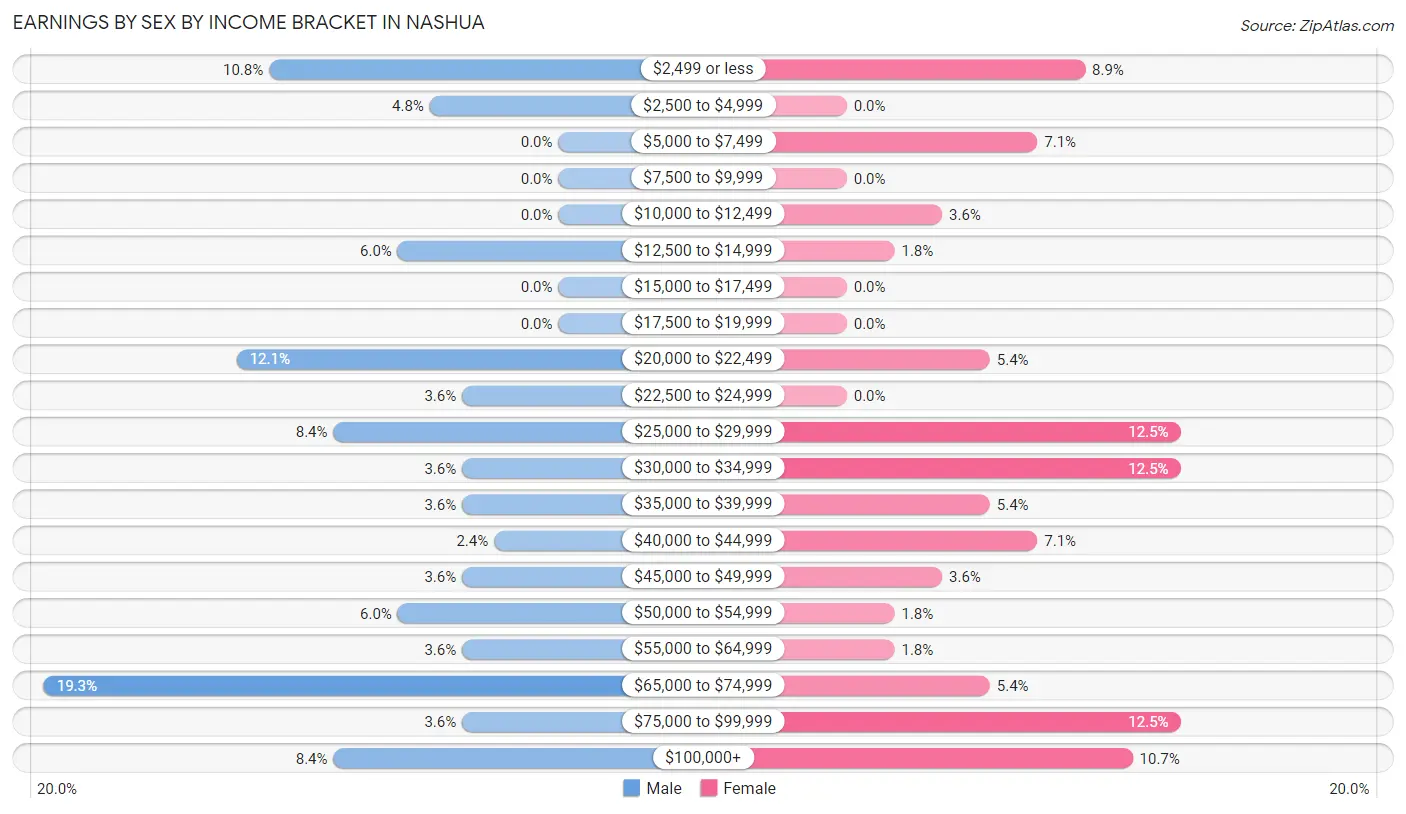
Earnings by Sex by Income Bracket in Nashua
The most common earnings brackets in Nashua are $65,000 to $74,999 for men (16 | 19.3%) and $25,000 to $29,999 for women (7 | 12.5%).
| Income | Male | Female |
| $2,499 or less | 9 (10.8%) | 5 (8.9%) |
| $2,500 to $4,999 | 4 (4.8%) | 0 (0.0%) |
| $5,000 to $7,499 | 0 (0.0%) | 4 (7.1%) |
| $7,500 to $9,999 | 0 (0.0%) | 0 (0.0%) |
| $10,000 to $12,499 | 0 (0.0%) | 2 (3.6%) |
| $12,500 to $14,999 | 5 (6.0%) | 1 (1.8%) |
| $15,000 to $17,499 | 0 (0.0%) | 0 (0.0%) |
| $17,500 to $19,999 | 0 (0.0%) | 0 (0.0%) |
| $20,000 to $22,499 | 10 (12.0%) | 3 (5.4%) |
| $22,500 to $24,999 | 3 (3.6%) | 0 (0.0%) |
| $25,000 to $29,999 | 7 (8.4%) | 7 (12.5%) |
| $30,000 to $34,999 | 3 (3.6%) | 7 (12.5%) |
| $35,000 to $39,999 | 3 (3.6%) | 3 (5.4%) |
| $40,000 to $44,999 | 2 (2.4%) | 4 (7.1%) |
| $45,000 to $49,999 | 3 (3.6%) | 2 (3.6%) |
| $50,000 to $54,999 | 5 (6.0%) | 1 (1.8%) |
| $55,000 to $64,999 | 3 (3.6%) | 1 (1.8%) |
| $65,000 to $74,999 | 16 (19.3%) | 3 (5.4%) |
| $75,000 to $99,999 | 3 (3.6%) | 7 (12.5%) |
| $100,000+ | 7 (8.4%) | 6 (10.7%) |
| Total | 83 (100.0%) | 56 (100.0%) |
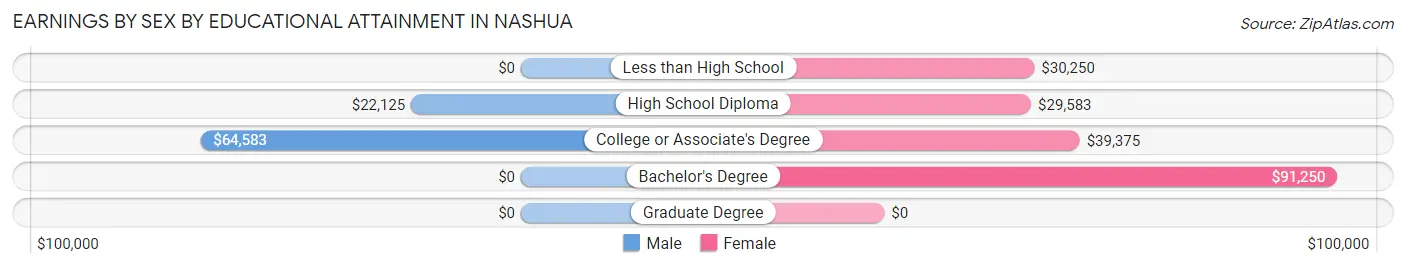
Earnings by Sex by Educational Attainment in Nashua
Average earnings in Nashua are $45,000 for men and $36,250 for women, a difference of 19.4%. Men with an educational attainment of college or associate's degree enjoy the highest average annual earnings of $64,583, while those with high school diploma education earn the least with $22,125. Women with an educational attainment of bachelor's degree earn the most with the average annual earnings of $91,250, while those with high school diploma education have the smallest earnings of $29,583.
| Educational Attainment | Male Income | Female Income |
| Less than High School | - | - |
| High School Diploma | $22,125 | $29,583 |
| College or Associate's Degree | $64,583 | $39,375 |
| Bachelor's Degree | - | - |
| Graduate Degree | - | - |
| Total | $45,000 | $36,250 |
Family Income in Nashua
Family Income Brackets in Nashua
According to the Nashua family income data, there are 15 families falling into the $50,000 to $74,999 income range, which is the most common income bracket and makes up 25.4% of all families.
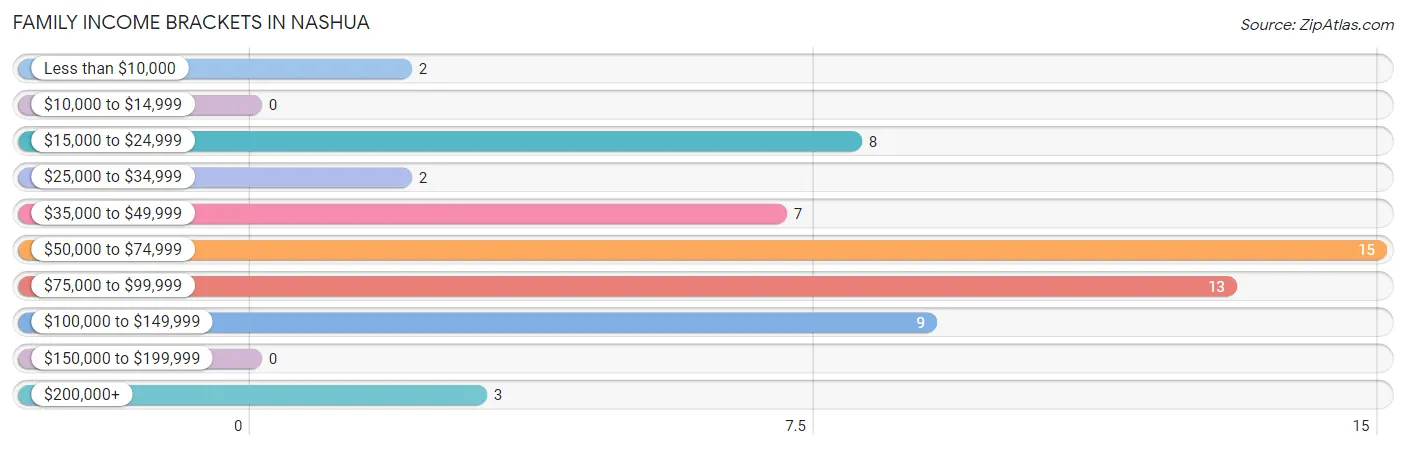
| Income Bracket | # Families | % Families |
| Less than $10,000 | 2 | 3.4% |
| $10,000 to $14,999 | 0 | 0.0% |
| $15,000 to $24,999 | 8 | 13.6% |
| $25,000 to $34,999 | 2 | 3.4% |
| $35,000 to $49,999 | 7 | 11.9% |
| $50,000 to $74,999 | 15 | 25.4% |
| $75,000 to $99,999 | 13 | 22.0% |
| $100,000 to $149,999 | 9 | 15.3% |
| $150,000 to $199,999 | 0 | 0.0% |
| $200,000+ | 3 | 5.1% |
Family Income by Famaliy Size in Nashua
5-person families (7 | 11.9%) account for the highest median family income in Nashua with $69,583 per family, while 2-person families (32 | 54.2%) have the highest median income of $27,500 per family member.
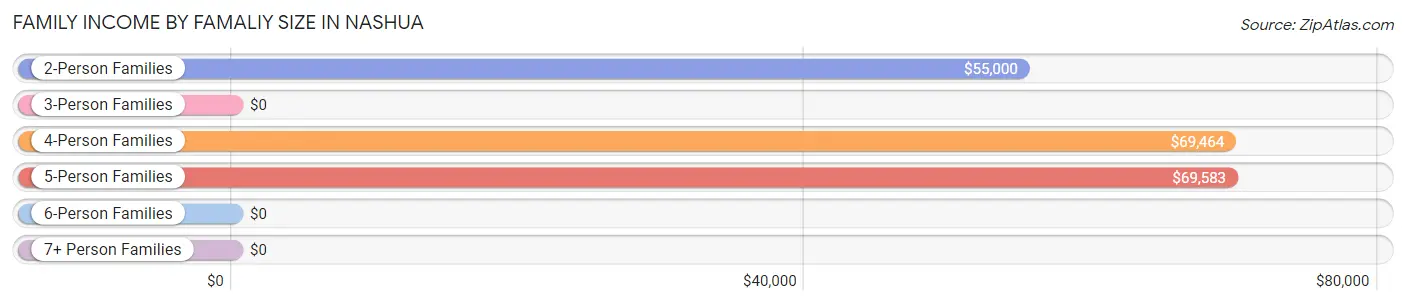
| Income Bracket | # Families | Median Income |
| 2-Person Families | 32 (54.2%) | $55,000 |
| 3-Person Families | 1 (1.7%) | $0 |
| 4-Person Families | 15 (25.4%) | $69,464 |
| 5-Person Families | 7 (11.9%) | $69,583 |
| 6-Person Families | 1 (1.7%) | $0 |
| 7+ Person Families | 3 (5.1%) | $0 |
| Total | 59 (100.0%) | $69,375 |
Family Income by Number of Earners in Nashua
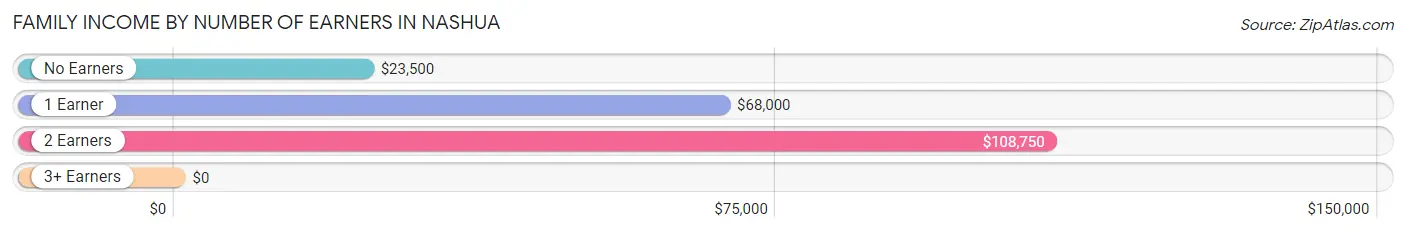
| Number of Earners | # Families | Median Income |
| No Earners | 10 (17.0%) | $23,500 |
| 1 Earner | 24 (40.7%) | $68,000 |
| 2 Earners | 19 (32.2%) | $108,750 |
| 3+ Earners | 6 (10.2%) | $0 |
| Total | 59 (100.0%) | $69,375 |
Household Income in Nashua
Household Income Brackets in Nashua
With 25 households falling in the category, the $100,000 to $149,999 income range is the most frequent in Nashua, accounting for 18.2% of all households.
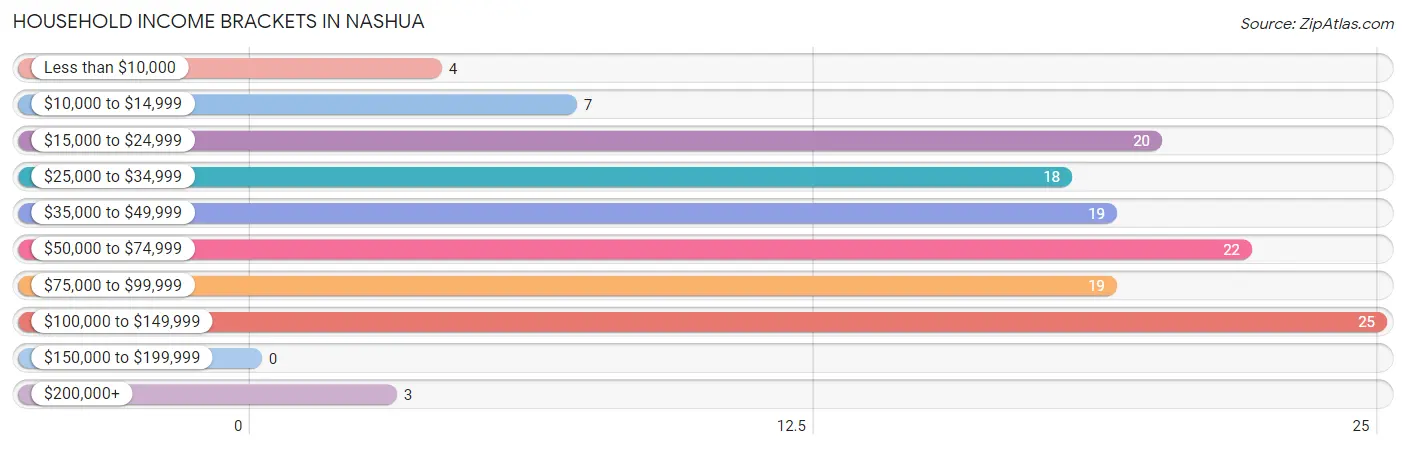
| Income Bracket | # Households | % Households |
| Less than $10,000 | 4 | 2.9% |
| $10,000 to $14,999 | 7 | 5.1% |
| $15,000 to $24,999 | 20 | 14.6% |
| $25,000 to $34,999 | 18 | 13.1% |
| $35,000 to $49,999 | 19 | 13.9% |
| $50,000 to $74,999 | 22 | 16.1% |
| $75,000 to $99,999 | 19 | 13.9% |
| $100,000 to $149,999 | 25 | 18.2% |
| $150,000 to $199,999 | 0 | 0.0% |
| $200,000+ | 3 | 2.2% |
Household Income by Householder Age in Nashua
The median household income in Nashua is $53,750, with the highest median household income of $91,250 found in the 45 to 64 years age bracket for the primary householder. A total of 45 households (32.9%) fall into this category. Meanwhile, the 15 to 24 years age bracket for the primary householder has the lowest median household income of $0, with 1 households (0.7%) in this group.
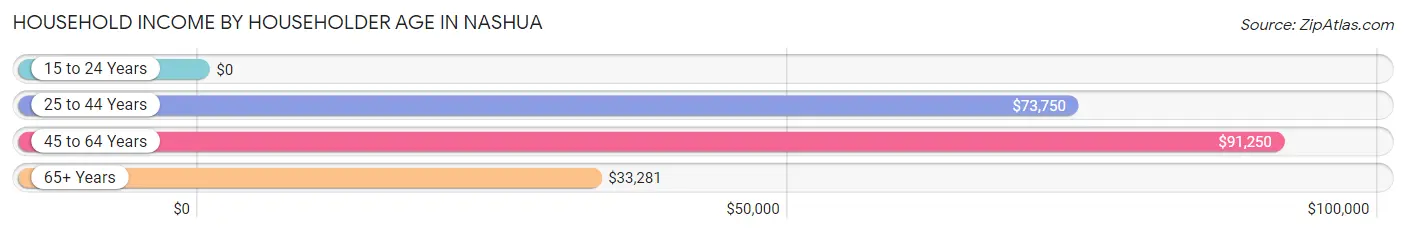
| Income Bracket | # Households | Median Income |
| 15 to 24 Years | 1 (0.7%) | $0 |
| 25 to 44 Years | 36 (26.3%) | $73,750 |
| 45 to 64 Years | 45 (32.9%) | $91,250 |
| 65+ Years | 55 (40.2%) | $33,281 |
| Total | 137 (100.0%) | $53,750 |
Poverty in Nashua
Income Below Poverty by Sex and Age in Nashua
With 23.1% poverty level for males and 17.2% for females among the residents of Nashua, under 5 year old males and 18 to 24 year old females are the most vulnerable to poverty, with 7 males (50.0%) and 1 females (100.0%) in their respective age groups living below the poverty level.
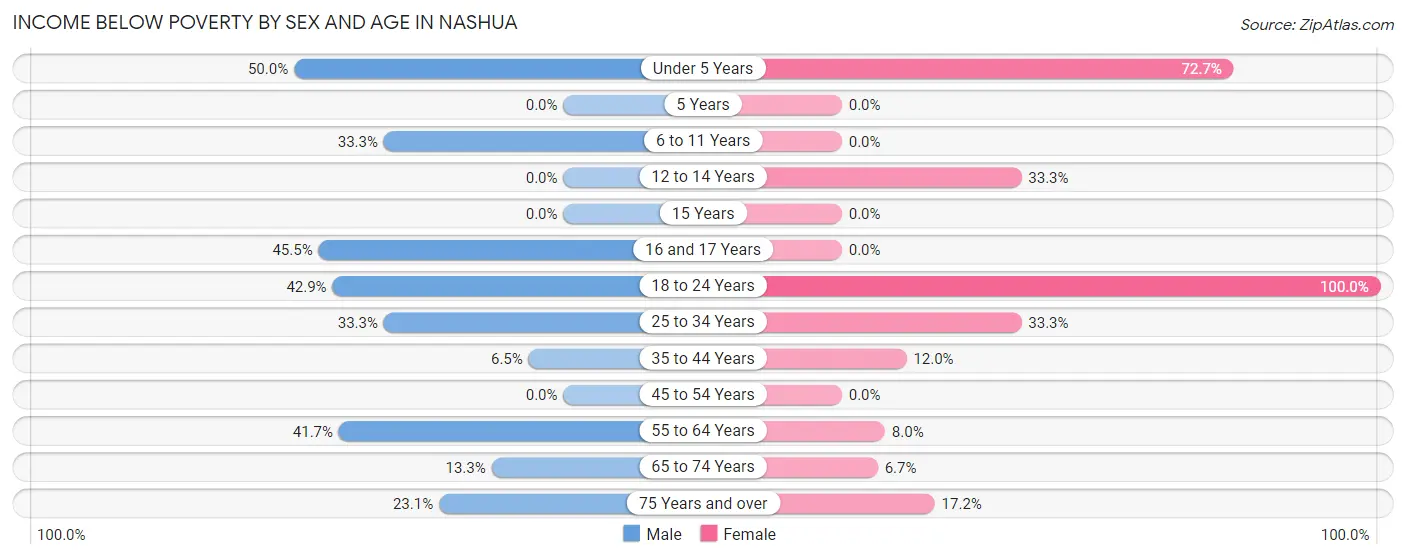
| Age Bracket | Male | Female |
| Under 5 Years | 7 (50.0%) | 8 (72.7%) |
| 5 Years | 0 (0.0%) | 0 (0.0%) |
| 6 to 11 Years | 3 (33.3%) | 0 (0.0%) |
| 12 to 14 Years | 0 (0.0%) | 1 (33.3%) |
| 15 Years | 0 (0.0%) | 0 (0.0%) |
| 16 and 17 Years | 5 (45.5%) | 0 (0.0%) |
| 18 to 24 Years | 3 (42.9%) | 1 (100.0%) |
| 25 to 34 Years | 2 (33.3%) | 4 (33.3%) |
| 35 to 44 Years | 2 (6.5%) | 3 (12.0%) |
| 45 to 54 Years | 0 (0.0%) | 0 (0.0%) |
| 55 to 64 Years | 10 (41.7%) | 2 (8.0%) |
| 65 to 74 Years | 4 (13.3%) | 1 (6.7%) |
| 75 Years and over | 3 (23.1%) | 5 (17.2%) |
| Total | 39 (23.1%) | 25 (17.2%) |
Income Above Poverty by Sex and Age in Nashua
According to the poverty statistics in Nashua, males aged 12 to 14 years and females aged 6 to 11 years are the age groups that are most secure financially, with 100.0% of males and 100.0% of females in these age groups living above the poverty line.
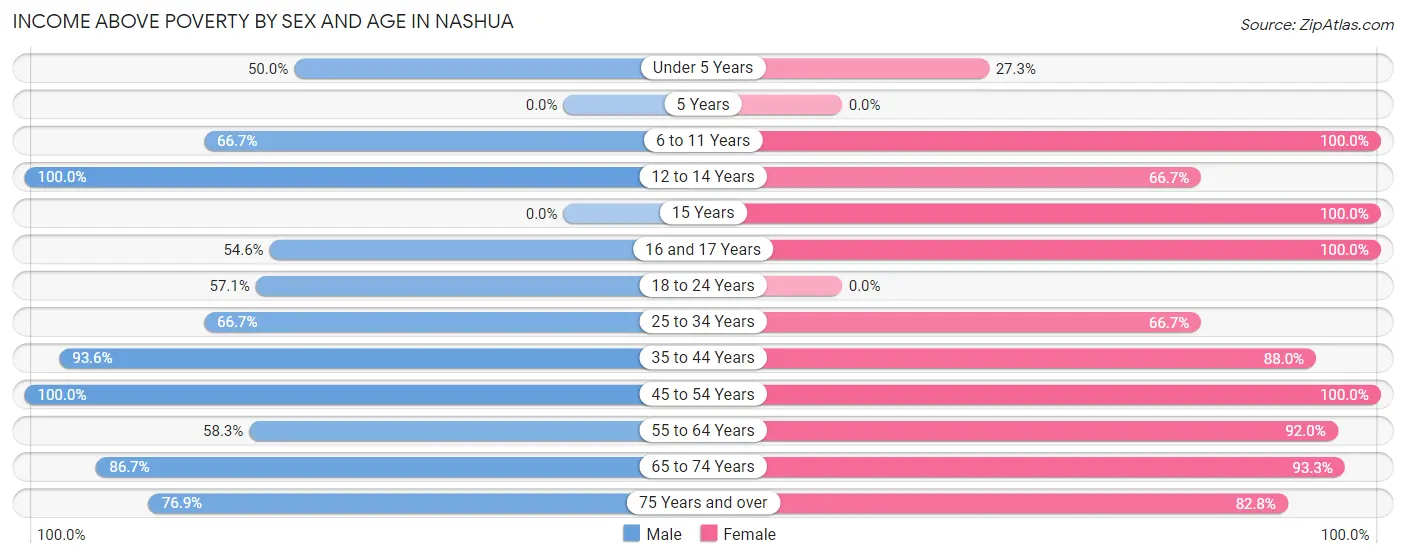
| Age Bracket | Male | Female |
| Under 5 Years | 7 (50.0%) | 3 (27.3%) |
| 5 Years | 0 (0.0%) | 0 (0.0%) |
| 6 to 11 Years | 6 (66.7%) | 9 (100.0%) |
| 12 to 14 Years | 9 (100.0%) | 2 (66.7%) |
| 15 Years | 0 (0.0%) | 2 (100.0%) |
| 16 and 17 Years | 6 (54.5%) | 2 (100.0%) |
| 18 to 24 Years | 4 (57.1%) | 0 (0.0%) |
| 25 to 34 Years | 4 (66.7%) | 8 (66.7%) |
| 35 to 44 Years | 29 (93.5%) | 22 (88.0%) |
| 45 to 54 Years | 15 (100.0%) | 11 (100.0%) |
| 55 to 64 Years | 14 (58.3%) | 23 (92.0%) |
| 65 to 74 Years | 26 (86.7%) | 14 (93.3%) |
| 75 Years and over | 10 (76.9%) | 24 (82.8%) |
| Total | 130 (76.9%) | 120 (82.8%) |
Income Below Poverty Among Married-Couple Families in Nashua
The poverty statistics for married-couple families in Nashua show that 10.2% or 5 of the total 49 families live below the poverty line. Families with 3 or 4 children have the highest poverty rate of 25.0%, comprising of 2 families. On the other hand, families with 1 or 2 children have the lowest poverty rate of 0.0%, which includes 0 families.
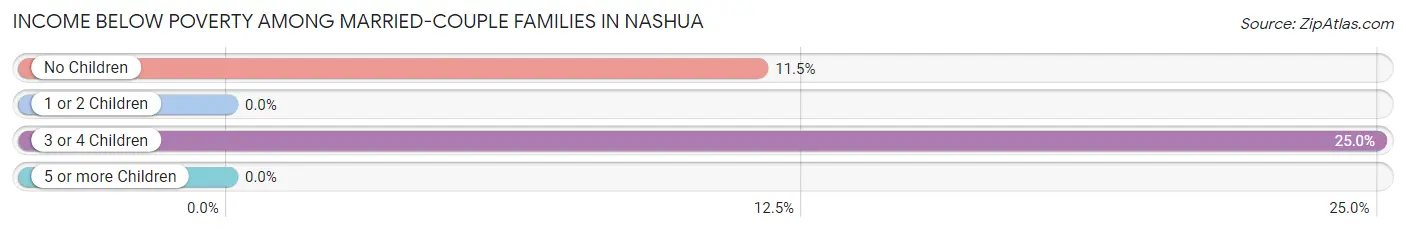
| Children | Above Poverty | Below Poverty |
| No Children | 23 (88.5%) | 3 (11.5%) |
| 1 or 2 Children | 12 (100.0%) | 0 (0.0%) |
| 3 or 4 Children | 6 (75.0%) | 2 (25.0%) |
| 5 or more Children | 3 (100.0%) | 0 (0.0%) |
| Total | 44 (89.8%) | 5 (10.2%) |
Income Below Poverty Among Single-Parent Households in Nashua
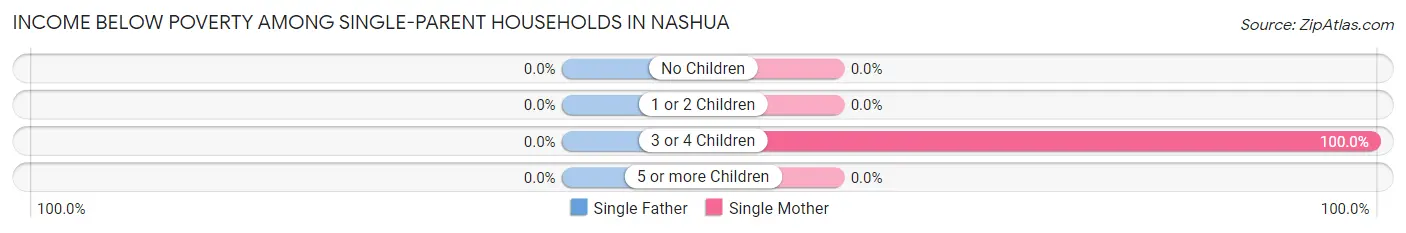
| Children | Single Father | Single Mother |
| No Children | 0 (0.0%) | 0 (0.0%) |
| 1 or 2 Children | 0 (0.0%) | 0 (0.0%) |
| 3 or 4 Children | 0 (0.0%) | 2 (100.0%) |
| 5 or more Children | 0 (0.0%) | 0 (0.0%) |
| Total | 0 (0.0%) | 2 (33.3%) |
Income Below Poverty Among Married-Couple vs Single-Parent Households in Nashua
The poverty data for Nashua shows that 5 of the married-couple family households (10.2%) and 2 of the single-parent households (20.0%) are living below the poverty level. Within the married-couple family households, those with 3 or 4 children have the highest poverty rate, with 2 households (25.0%) falling below the poverty line. Among the single-parent households, those with 3 or 4 children have the highest poverty rate, with 2 household (100.0%) living below poverty.
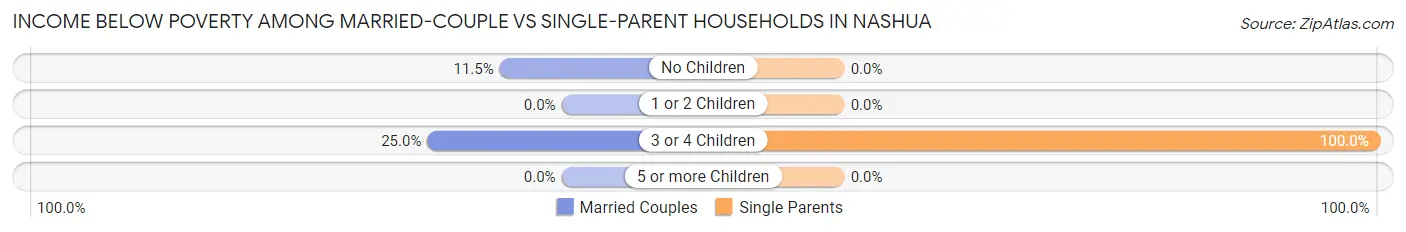
| Children | Married-Couple Families | Single-Parent Households |
| No Children | 3 (11.5%) | 0 (0.0%) |
| 1 or 2 Children | 0 (0.0%) | 0 (0.0%) |
| 3 or 4 Children | 2 (25.0%) | 2 (100.0%) |
| 5 or more Children | 0 (0.0%) | 0 (0.0%) |
| Total | 5 (10.2%) | 2 (20.0%) |
Race in Nashua
The most populous races in Nashua are White / Caucasian (264 | 84.1%), Some other Race (30 | 9.6%), and Hispanic or Latino (13 | 4.1%).
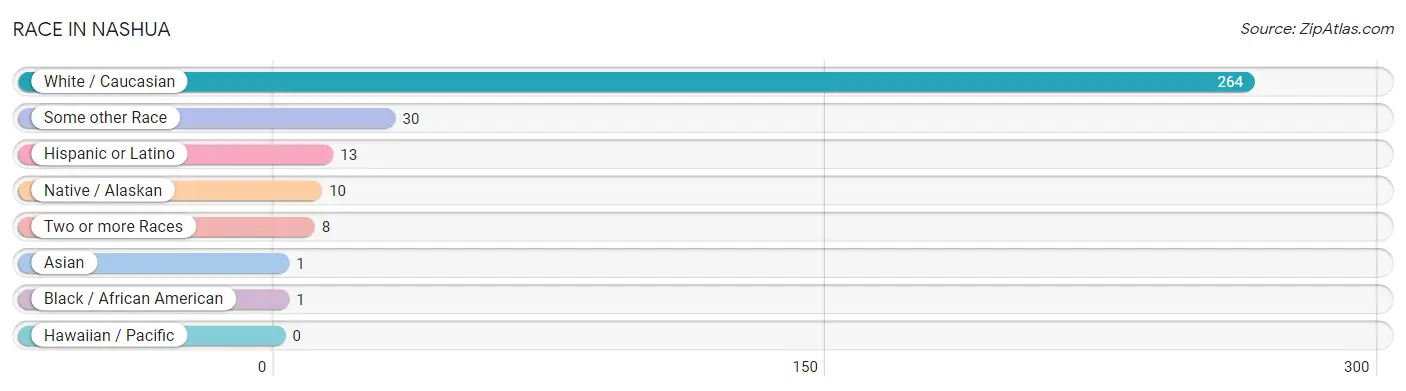
| Race | # Population | % Population |
| Asian | 1 | 0.3% |
| Black / African American | 1 | 0.3% |
| Hawaiian / Pacific | 0 | 0.0% |
| Hispanic or Latino | 13 | 4.1% |
| Native / Alaskan | 10 | 3.2% |
| White / Caucasian | 264 | 84.1% |
| Two or more Races | 8 | 2.5% |
| Some other Race | 30 | 9.6% |
| Total | 314 | 100.0% |
Ancestry in Nashua
The most populous ancestries reported in Nashua are German (71 | 22.6%), Norwegian (65 | 20.7%), American (25 | 8.0%), Swedish (24 | 7.6%), and Irish (20 | 6.4%), together accounting for 65.3% of all Nashua residents.
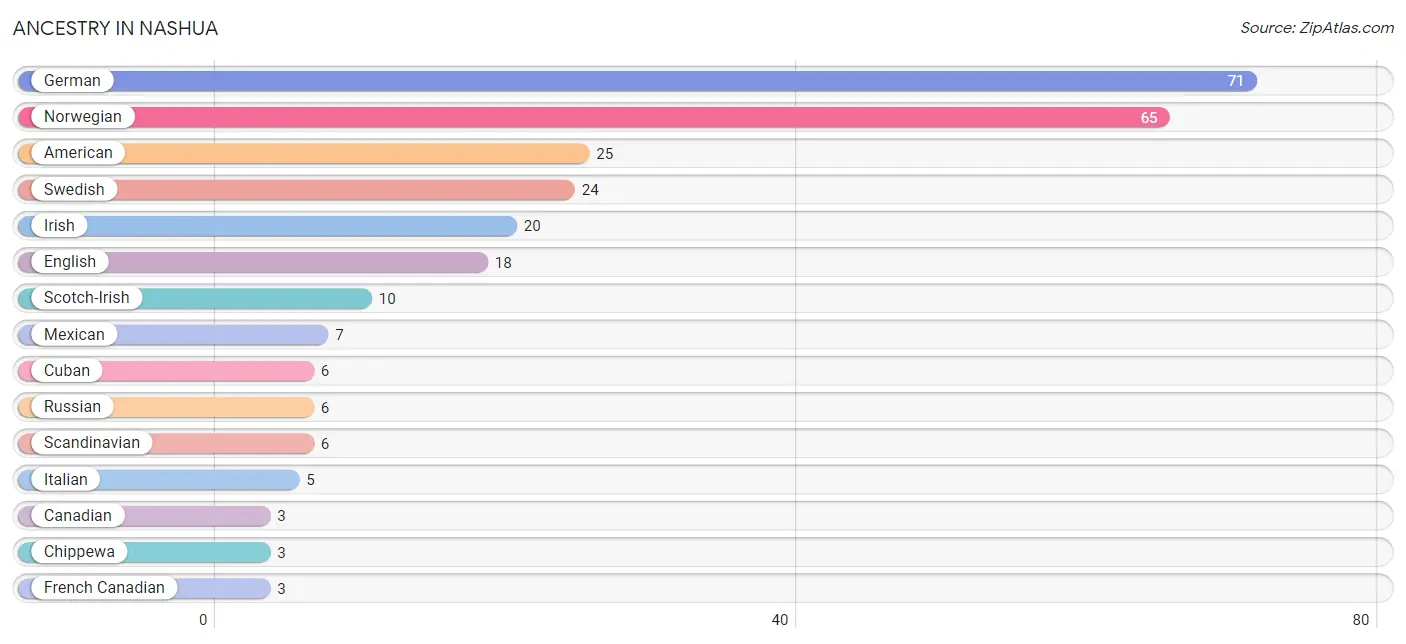
| Ancestry | # Population | % Population |
| American | 25 | 8.0% |
| Burmese | 1 | 0.3% |
| Canadian | 3 | 1.0% |
| Chippewa | 3 | 1.0% |
| Cuban | 6 | 1.9% |
| Czech | 1 | 0.3% |
| English | 18 | 5.7% |
| European | 2 | 0.6% |
| French | 2 | 0.6% |
| French Canadian | 3 | 1.0% |
| German | 71 | 22.6% |
| Irish | 20 | 6.4% |
| Italian | 5 | 1.6% |
| Korean | 1 | 0.3% |
| Mexican | 7 | 2.2% |
| Norwegian | 65 | 20.7% |
| Pennsylvania German | 3 | 1.0% |
| Russian | 6 | 1.9% |
| Scandinavian | 6 | 1.9% |
| Scotch-Irish | 10 | 3.2% |
| Swedish | 24 | 7.6% | View All 21 Rows |
Immigrants in Nashua
The most numerous immigrant groups reported in Nashua came from Central America (7 | 2.2%), Latin America (7 | 2.2%), Mexico (7 | 2.2%), Asia (1 | 0.3%), and Philippines (1 | 0.3%), together accounting for 7.3% of all Nashua residents.
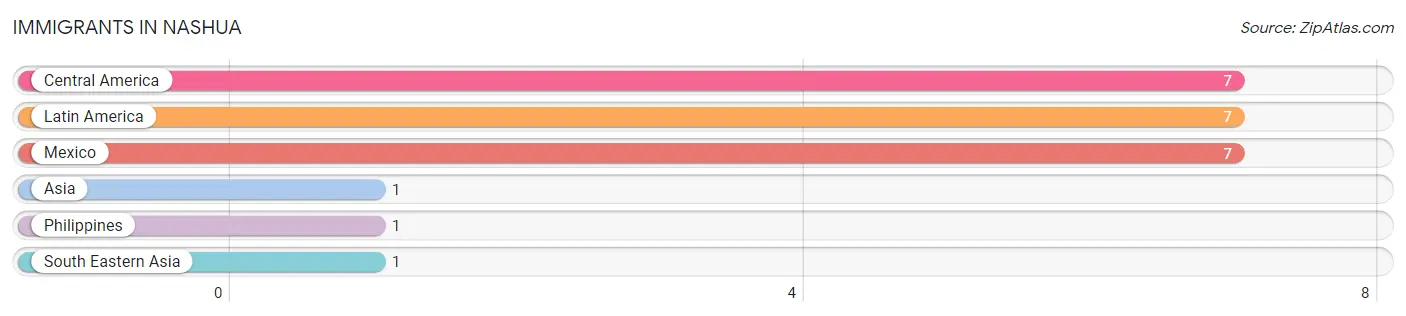
| Immigration Origin | # Population | % Population |
| Asia | 1 | 0.3% |
| Central America | 7 | 2.2% |
| Latin America | 7 | 2.2% |
| Mexico | 7 | 2.2% |
| Philippines | 1 | 0.3% |
| South Eastern Asia | 1 | 0.3% | View All 6 Rows |
Sex and Age in Nashua
Sex and Age in Nashua
The most populous age groups in Nashua are 35 to 39 Years (18 | 10.6%) for men and 55 to 59 Years (18 | 12.4%) for women.
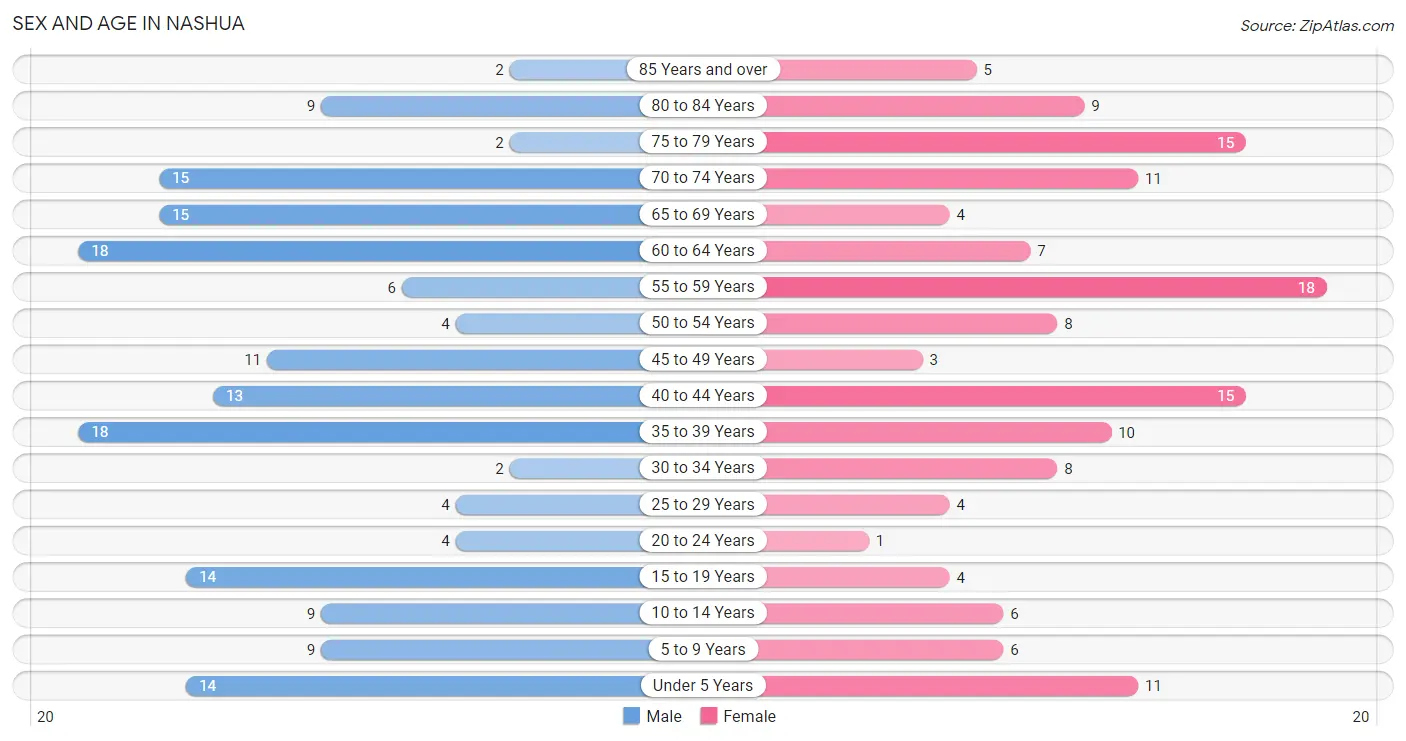
| Age Bracket | Male | Female |
| Under 5 Years | 14 (8.3%) | 11 (7.6%) |
| 5 to 9 Years | 9 (5.3%) | 6 (4.1%) |
| 10 to 14 Years | 9 (5.3%) | 6 (4.1%) |
| 15 to 19 Years | 14 (8.3%) | 4 (2.8%) |
| 20 to 24 Years | 4 (2.4%) | 1 (0.7%) |
| 25 to 29 Years | 4 (2.4%) | 4 (2.8%) |
| 30 to 34 Years | 2 (1.2%) | 8 (5.5%) |
| 35 to 39 Years | 18 (10.6%) | 10 (6.9%) |
| 40 to 44 Years | 13 (7.7%) | 15 (10.3%) |
| 45 to 49 Years | 11 (6.5%) | 3 (2.1%) |
| 50 to 54 Years | 4 (2.4%) | 8 (5.5%) |
| 55 to 59 Years | 6 (3.5%) | 18 (12.4%) |
| 60 to 64 Years | 18 (10.6%) | 7 (4.8%) |
| 65 to 69 Years | 15 (8.9%) | 4 (2.8%) |
| 70 to 74 Years | 15 (8.9%) | 11 (7.6%) |
| 75 to 79 Years | 2 (1.2%) | 15 (10.3%) |
| 80 to 84 Years | 9 (5.3%) | 9 (6.2%) |
| 85 Years and over | 2 (1.2%) | 5 (3.5%) |
| Total | 169 (100.0%) | 145 (100.0%) |
Families and Households in Nashua
Median Family Size in Nashua
The median family size in Nashua is 3.63 persons per family, with single female/mother families (6 | 10.2%) accounting for the largest median family size of 5.33 persons per family. On the other hand, single male/father families (4 | 6.8%) represent the smallest median family size with 2.50 persons per family.
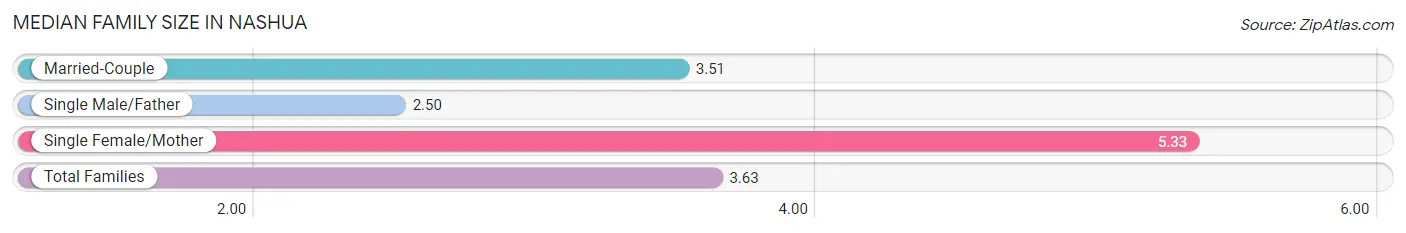
| Family Type | # Families | Family Size |
| Married-Couple | 49 (83.1%) | 3.51 |
| Single Male/Father | 4 (6.8%) | 2.50 |
| Single Female/Mother | 6 (10.2%) | 5.33 |
| Total Families | 59 (100.0%) | 3.63 |
Median Household Size in Nashua
The median household size in Nashua is 2.27 persons per household, with single female/mother households (6 | 4.4%) accounting for the largest median household size of 6 persons per household. non-family households (78 | 56.9%) represent the smallest median household size with 1.19 persons per household.
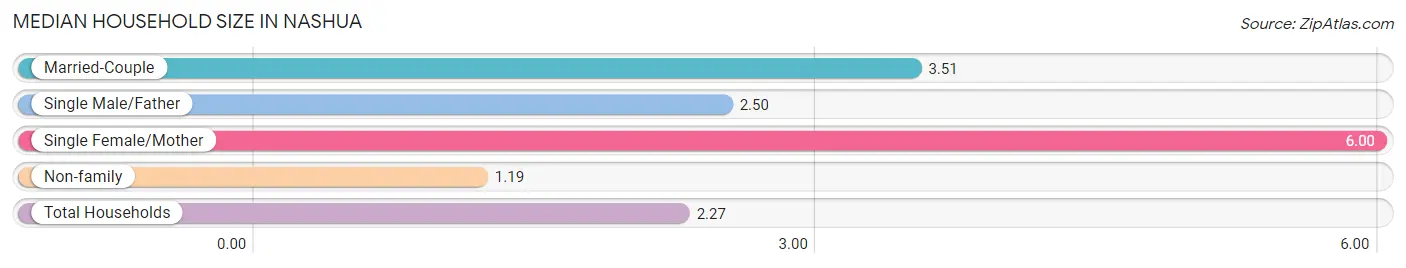
| Household Type | # Households | Household Size |
| Married-Couple | 49 (35.8%) | 3.51 |
| Single Male/Father | 4 (2.9%) | 2.50 |
| Single Female/Mother | 6 (4.4%) | 6.00 |
| Non-family | 78 (56.9%) | 1.19 |
| Total Households | 137 (100.0%) | 2.27 |
Household Size by Marriage Status in Nashua
Out of a total of 137 households in Nashua, 59 (43.1%) are family households, while 78 (56.9%) are nonfamily households. The most numerous type of family households are 2-person households, comprising 30, and the most common type of nonfamily households are 1-person households, comprising 66.
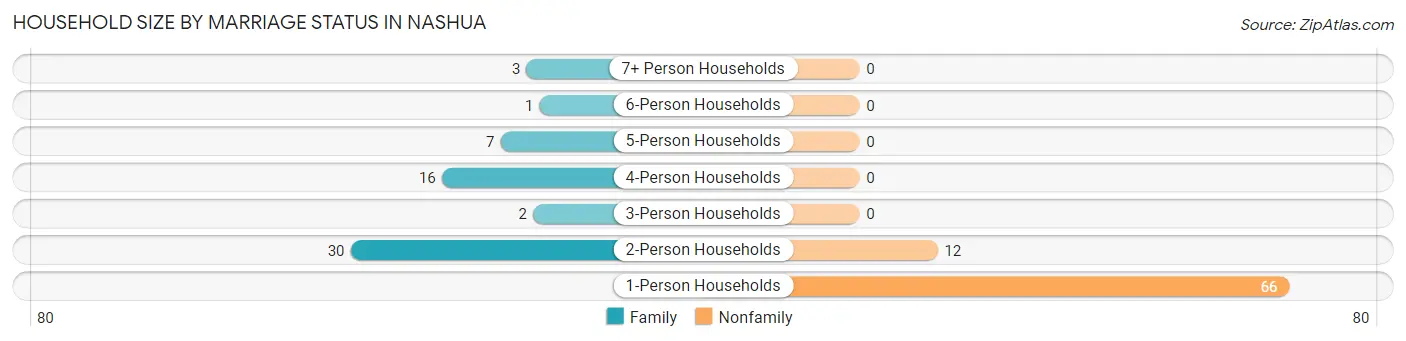
| Household Size | Family Households | Nonfamily Households |
| 1-Person Households | - | 66 (48.2%) |
| 2-Person Households | 30 (21.9%) | 12 (8.8%) |
| 3-Person Households | 2 (1.5%) | 0 (0.0%) |
| 4-Person Households | 16 (11.7%) | 0 (0.0%) |
| 5-Person Households | 7 (5.1%) | 0 (0.0%) |
| 6-Person Households | 1 (0.7%) | 0 (0.0%) |
| 7+ Person Households | 3 (2.2%) | 0 (0.0%) |
| Total | 59 (43.1%) | 78 (56.9%) |
Female Fertility in Nashua
Fertility by Age in Nashua
Average fertility rate in Nashua is 22.0 births per 1,000 women. Women in the age bracket of 20 to 34 years have the highest fertility rate with 77.0 births per 1,000 women. Women in the age bracket of 20 to 34 years acount for 100.0% of all women with births.
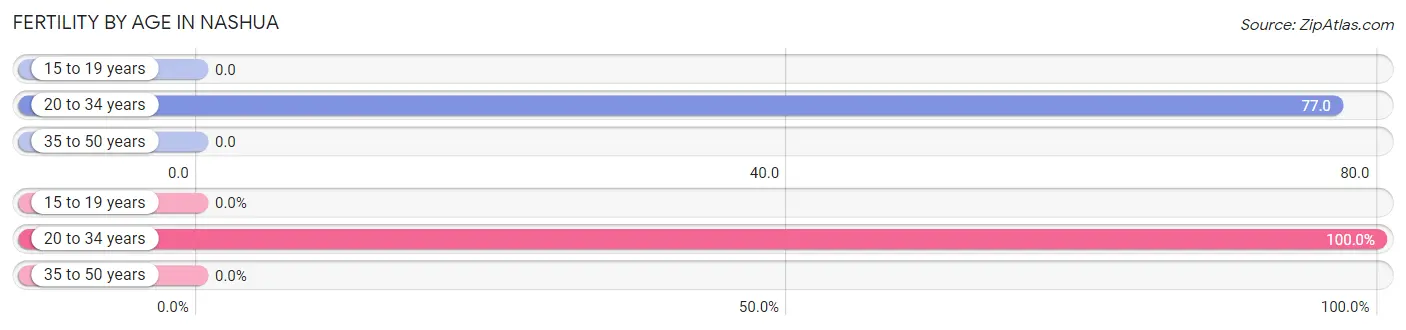
| Age Bracket | Women with Births | Births / 1,000 Women |
| 15 to 19 years | 0 (0.0%) | 0.0 |
| 20 to 34 years | 1 (100.0%) | 77.0 |
| 35 to 50 years | 0 (0.0%) | 0.0 |
| Total | 1 (100.0%) | 22.0 |
Fertility by Age by Marriage Status in Nashua
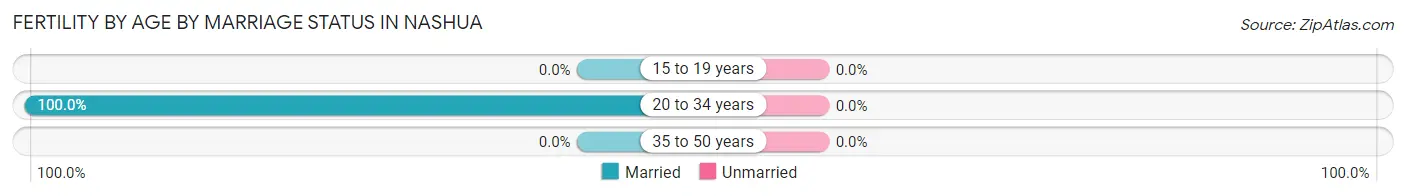
| Age Bracket | Married | Unmarried |
| 15 to 19 years | 0 (0.0%) | 0 (0.0%) |
| 20 to 34 years | 1 (100.0%) | 0 (0.0%) |
| 35 to 50 years | 0 (0.0%) | 0 (0.0%) |
| Total | 1 (100.0%) | 0 (0.0%) |
Fertility by Education in Nashua
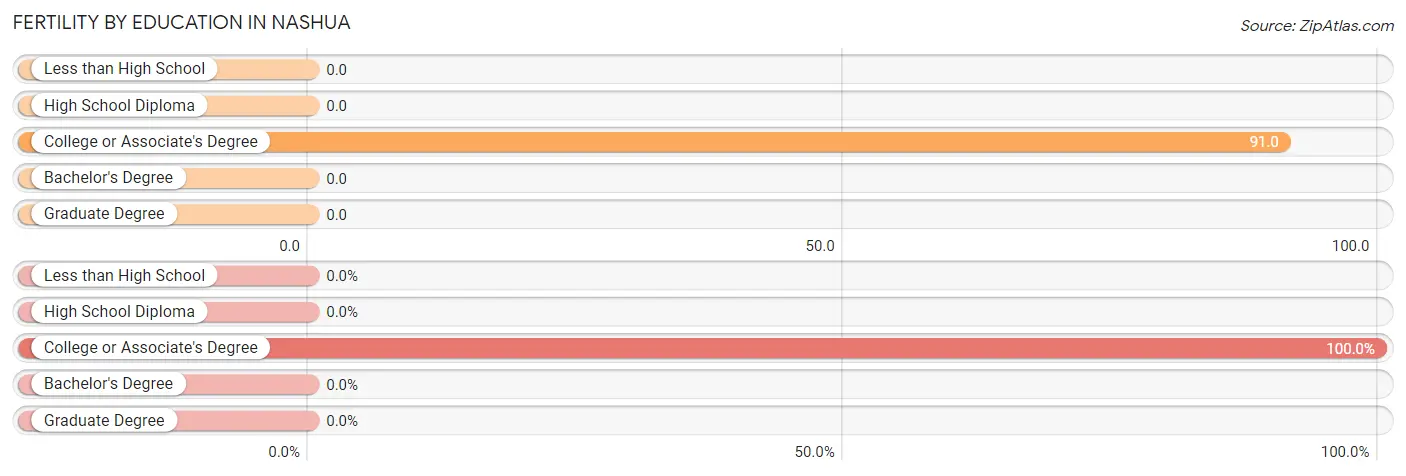
| Educational Attainment | Women with Births | Births / 1,000 Women |
| Less than High School | 0 (0.0%) | 0.0 |
| High School Diploma | 0 (0.0%) | 0.0 |
| College or Associate's Degree | 1 (100.0%) | 91.0 |
| Bachelor's Degree | 0 (0.0%) | 0.0 |
| Graduate Degree | 0 (0.0%) | 0.0 |
| Total | 1 (100.0%) | 22.0 |
Fertility by Education by Marriage Status in Nashua
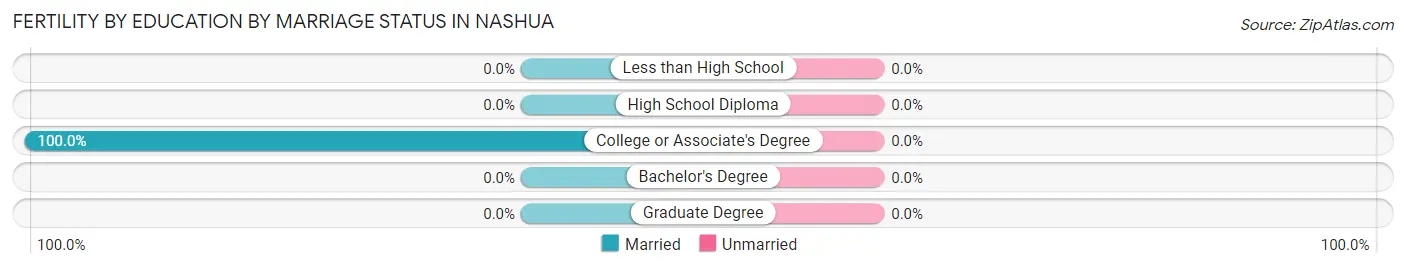
| Educational Attainment | Married | Unmarried |
| Less than High School | 0 (0.0%) | 0 (0.0%) |
| High School Diploma | 0 (0.0%) | 0 (0.0%) |
| College or Associate's Degree | 1 (100.0%) | 0 (0.0%) |
| Bachelor's Degree | 0 (0.0%) | 0 (0.0%) |
| Graduate Degree | 0 (0.0%) | 0 (0.0%) |
| Total | 1 (100.0%) | 0 (0.0%) |
Employment Characteristics in Nashua
Employment by Class of Employer in Nashua
Among the 106 employed individuals in Nashua, private company employees (57 | 53.8%), state government employees (22 | 20.7%), and local government employees (10 | 9.4%) make up the most common classes of employment.
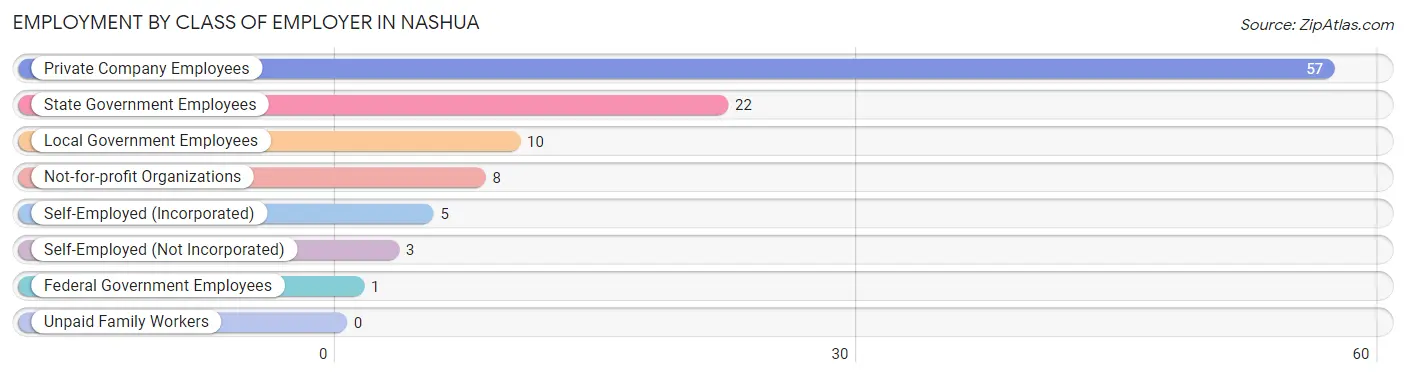
| Employer Class | # Employees | % Employees |
| Private Company Employees | 57 | 53.8% |
| Self-Employed (Incorporated) | 5 | 4.7% |
| Self-Employed (Not Incorporated) | 3 | 2.8% |
| Not-for-profit Organizations | 8 | 7.5% |
| Local Government Employees | 10 | 9.4% |
| State Government Employees | 22 | 20.7% |
| Federal Government Employees | 1 | 0.9% |
| Unpaid Family Workers | 0 | 0.0% |
| Total | 106 | 100.0% |
Employment Status by Age in Nashua
According to the labor force statistics for Nashua, out of the total population over 16 years of age (257), 47.1% or 121 individuals are in the labor force, with 10.7% or 13 of them unemployed. The age group with the highest labor force participation rate is 20 to 24 years, with 100.0% or 5 individuals in the labor force. Within the labor force, the 20 to 24 years age range has the highest percentage of unemployed individuals, with 60.0% or 3 of them being unemployed.
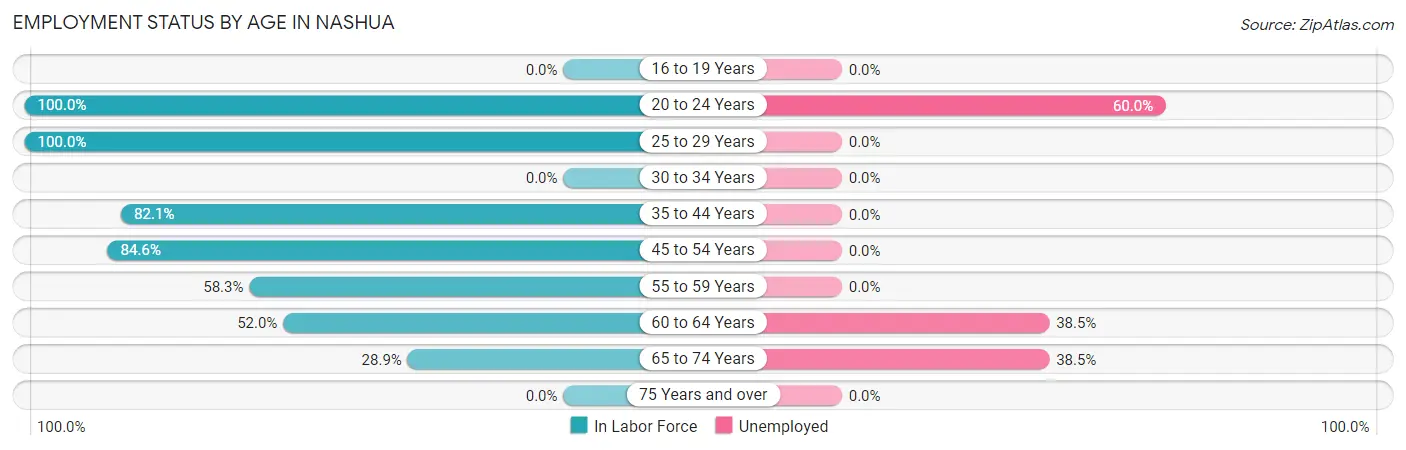
| Age Bracket | In Labor Force | Unemployed |
| 16 to 19 Years | 0 (0.0%) | 0 (0.0%) |
| 20 to 24 Years | 5 (100.0%) | 3 (60.0%) |
| 25 to 29 Years | 8 (100.0%) | 0 (0.0%) |
| 30 to 34 Years | 0 (0.0%) | 0 (0.0%) |
| 35 to 44 Years | 46 (82.1%) | 0 (0.0%) |
| 45 to 54 Years | 22 (84.6%) | 0 (0.0%) |
| 55 to 59 Years | 14 (58.3%) | 0 (0.0%) |
| 60 to 64 Years | 13 (52.0%) | 5 (38.5%) |
| 65 to 74 Years | 13 (28.9%) | 5 (38.5%) |
| 75 Years and over | 0 (0.0%) | 0 (0.0%) |
| Total | 121 (47.1%) | 13 (10.7%) |
Employment Status by Educational Attainment in Nashua
According to labor force statistics for Nashua, 69.1% of individuals (103) out of the total population between 25 and 64 years of age (149) are in the labor force, with 4.9% or 5 of them being unemployed. The group with the highest labor force participation rate are those with the educational attainment of bachelor's degree or higher, with 93.3% or 28 individuals in the labor force. Within the labor force, individuals with high school diploma education have the highest percentage of unemployment, with 13.5% or 5 of them being unemployed.
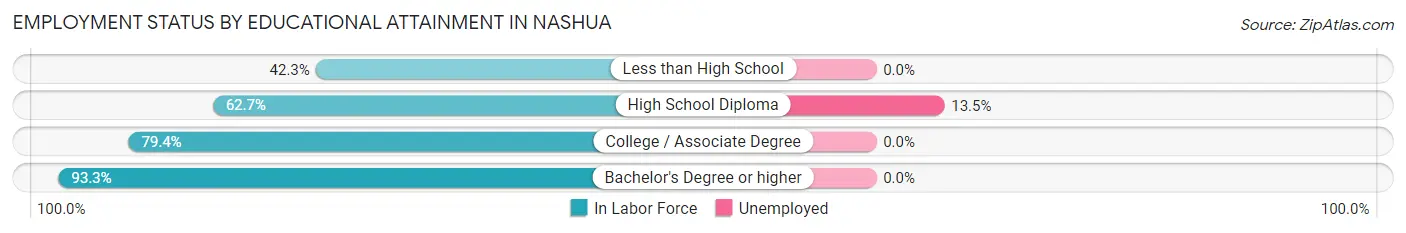
| Educational Attainment | In Labor Force | Unemployed |
| Less than High School | 11 (42.3%) | 0 (0.0%) |
| High School Diploma | 37 (62.7%) | 8 (13.5%) |
| College / Associate Degree | 27 (79.4%) | 0 (0.0%) |
| Bachelor's Degree or higher | 28 (93.3%) | 0 (0.0%) |
| Total | 103 (69.1%) | 7 (4.9%) |
Employment Occupations by Sex in Nashua
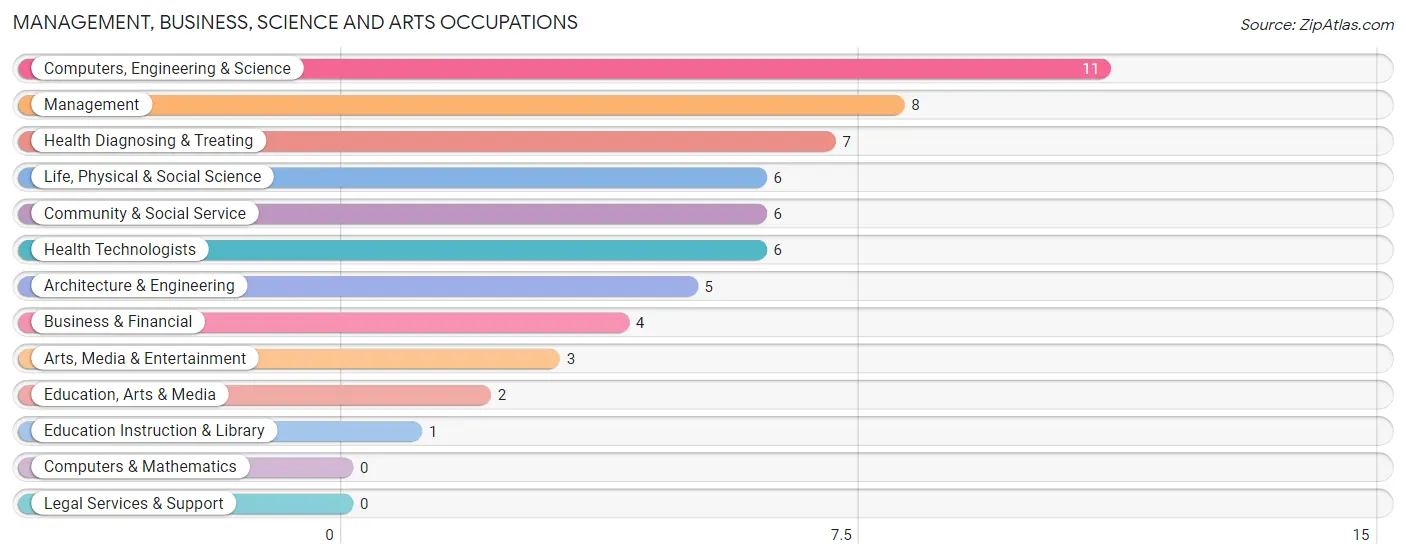
Management, Business, Science and Arts Occupations
The most common Management, Business, Science and Arts occupations in Nashua are Computers, Engineering & Science (11 | 10.2%), Management (8 | 7.4%), Health Diagnosing & Treating (7 | 6.5%), Life, Physical & Social Science (6 | 5.6%), and Community & Social Service (6 | 5.6%).
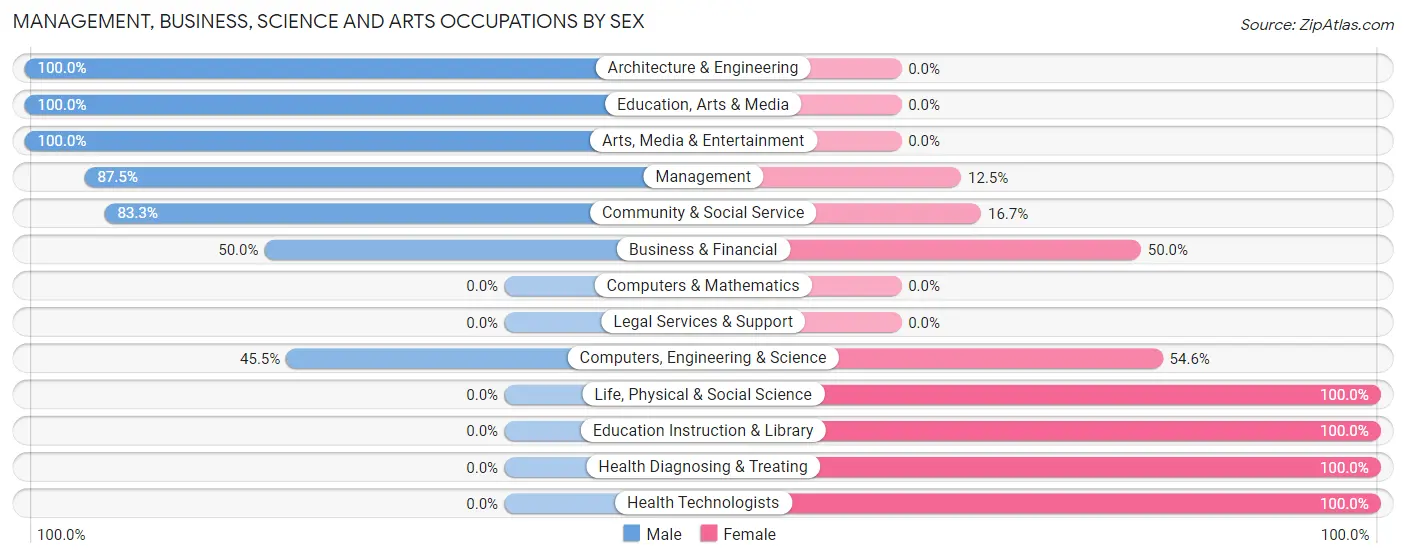
Management, Business, Science and Arts Occupations by Sex
Within the Management, Business, Science and Arts occupations in Nashua, the most male-oriented occupations are Architecture & Engineering (100.0%), Education, Arts & Media (100.0%), and Arts, Media & Entertainment (100.0%), while the most female-oriented occupations are Life, Physical & Social Science (100.0%), Education Instruction & Library (100.0%), and Health Diagnosing & Treating (100.0%).
| Occupation | Male | Female |
| Management | 7 (87.5%) | 1 (12.5%) |
| Business & Financial | 2 (50.0%) | 2 (50.0%) |
| Computers, Engineering & Science | 5 (45.5%) | 6 (54.5%) |
| Computers & Mathematics | 0 (0.0%) | 0 (0.0%) |
| Architecture & Engineering | 5 (100.0%) | 0 (0.0%) |
| Life, Physical & Social Science | 0 (0.0%) | 6 (100.0%) |
| Community & Social Service | 5 (83.3%) | 1 (16.7%) |
| Education, Arts & Media | 2 (100.0%) | 0 (0.0%) |
| Legal Services & Support | 0 (0.0%) | 0 (0.0%) |
| Education Instruction & Library | 0 (0.0%) | 1 (100.0%) |
| Arts, Media & Entertainment | 3 (100.0%) | 0 (0.0%) |
| Health Diagnosing & Treating | 0 (0.0%) | 7 (100.0%) |
| Health Technologists | 0 (0.0%) | 6 (100.0%) |
| Total (Category) | 19 (52.8%) | 17 (47.2%) |
| Total (Overall) | 59 (54.6%) | 49 (45.4%) |
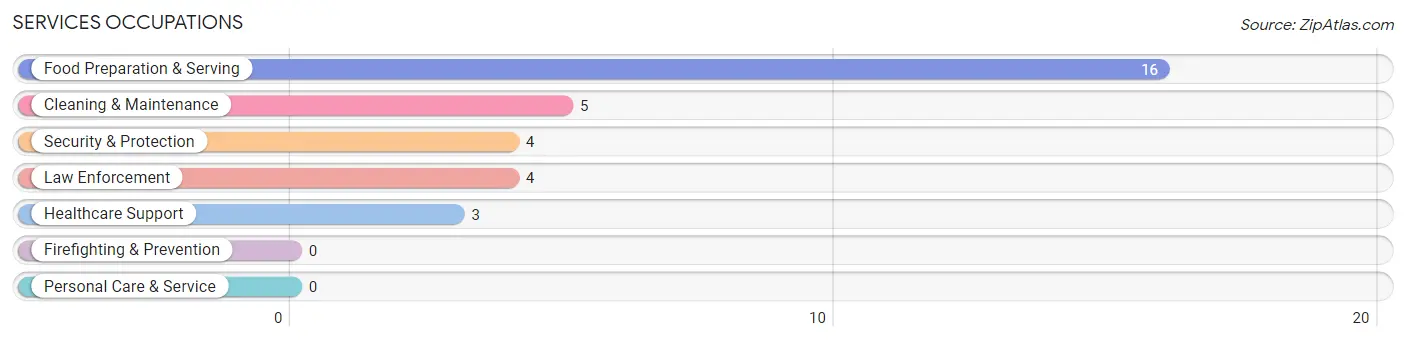
Services Occupations
The most common Services occupations in Nashua are Food Preparation & Serving (16 | 14.8%), Cleaning & Maintenance (5 | 4.6%), Security & Protection (4 | 3.7%), Law Enforcement (4 | 3.7%), and Healthcare Support (3 | 2.8%).
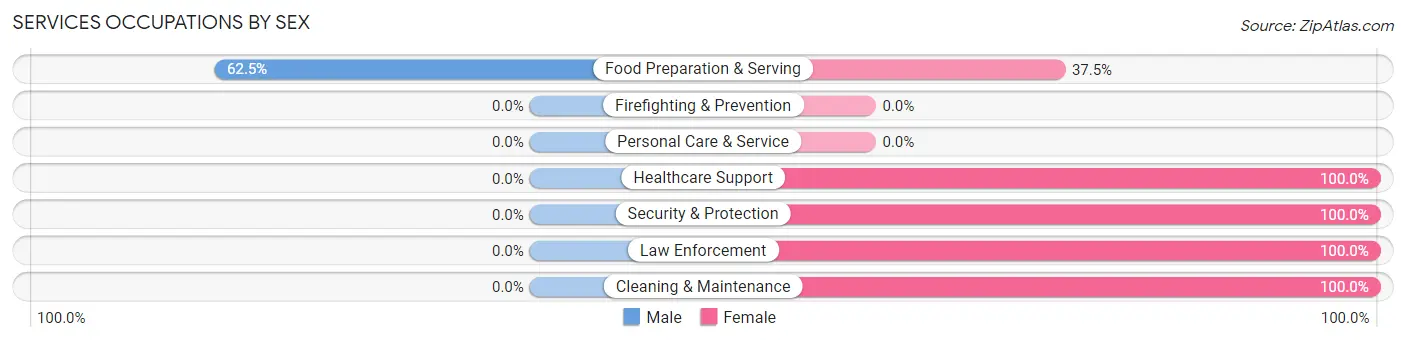
Services Occupations by Sex
| Occupation | Male | Female |
| Healthcare Support | 0 (0.0%) | 3 (100.0%) |
| Security & Protection | 0 (0.0%) | 4 (100.0%) |
| Firefighting & Prevention | 0 (0.0%) | 0 (0.0%) |
| Law Enforcement | 0 (0.0%) | 4 (100.0%) |
| Food Preparation & Serving | 10 (62.5%) | 6 (37.5%) |
| Cleaning & Maintenance | 0 (0.0%) | 5 (100.0%) |
| Personal Care & Service | 0 (0.0%) | 0 (0.0%) |
| Total (Category) | 10 (35.7%) | 18 (64.3%) |
| Total (Overall) | 59 (54.6%) | 49 (45.4%) |
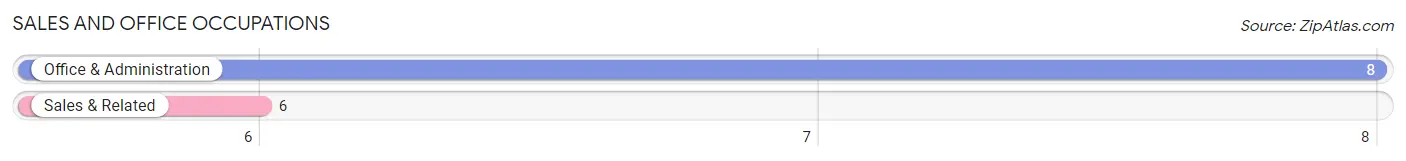
Sales and Office Occupations
The most common Sales and Office occupations in Nashua are Office & Administration (8 | 7.4%), and Sales & Related (6 | 5.6%).
Sales and Office Occupations by Sex
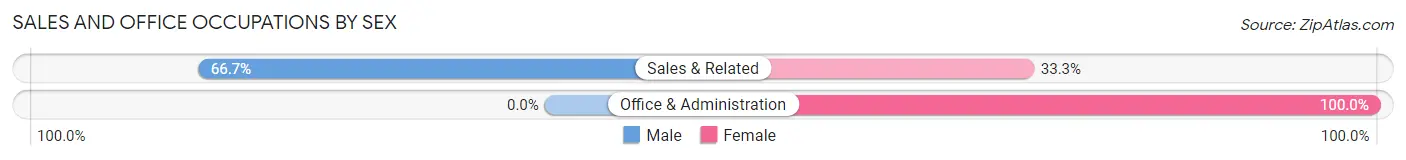
| Occupation | Male | Female |
| Sales & Related | 4 (66.7%) | 2 (33.3%) |
| Office & Administration | 0 (0.0%) | 8 (100.0%) |
| Total (Category) | 4 (28.6%) | 10 (71.4%) |
| Total (Overall) | 59 (54.6%) | 49 (45.4%) |
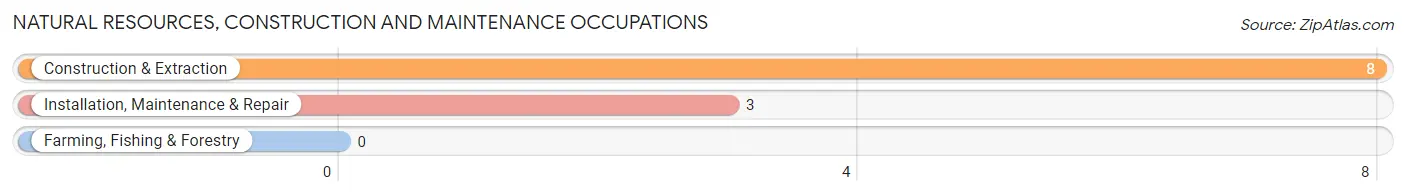
Natural Resources, Construction and Maintenance Occupations
The most common Natural Resources, Construction and Maintenance occupations in Nashua are Construction & Extraction (8 | 7.4%), and Installation, Maintenance & Repair (3 | 2.8%).
Natural Resources, Construction and Maintenance Occupations by Sex
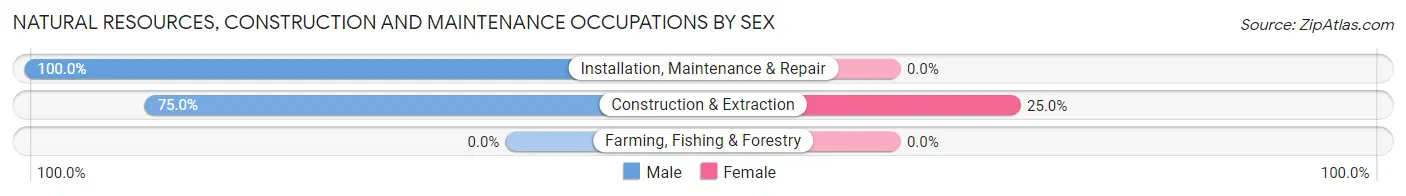
| Occupation | Male | Female |
| Farming, Fishing & Forestry | 0 (0.0%) | 0 (0.0%) |
| Construction & Extraction | 6 (75.0%) | 2 (25.0%) |
| Installation, Maintenance & Repair | 3 (100.0%) | 0 (0.0%) |
| Total (Category) | 9 (81.8%) | 2 (18.2%) |
| Total (Overall) | 59 (54.6%) | 49 (45.4%) |
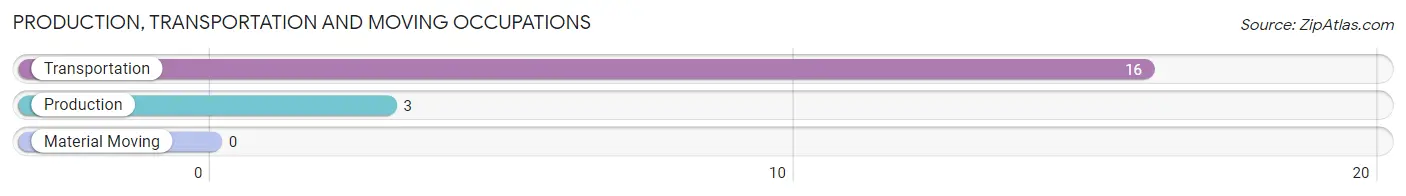
Production, Transportation and Moving Occupations
The most common Production, Transportation and Moving occupations in Nashua are Transportation (16 | 14.8%), and Production (3 | 2.8%).
Production, Transportation and Moving Occupations by Sex
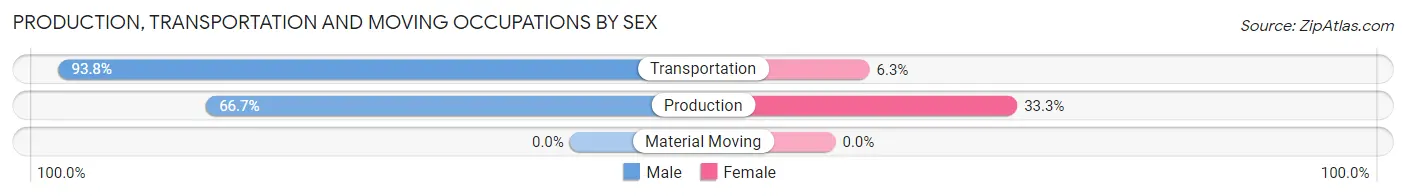
| Occupation | Male | Female |
| Production | 2 (66.7%) | 1 (33.3%) |
| Transportation | 15 (93.8%) | 1 (6.2%) |
| Material Moving | 0 (0.0%) | 0 (0.0%) |
| Total (Category) | 17 (89.5%) | 2 (10.5%) |
| Total (Overall) | 59 (54.6%) | 49 (45.4%) |
Employment Industries by Sex in Nashua
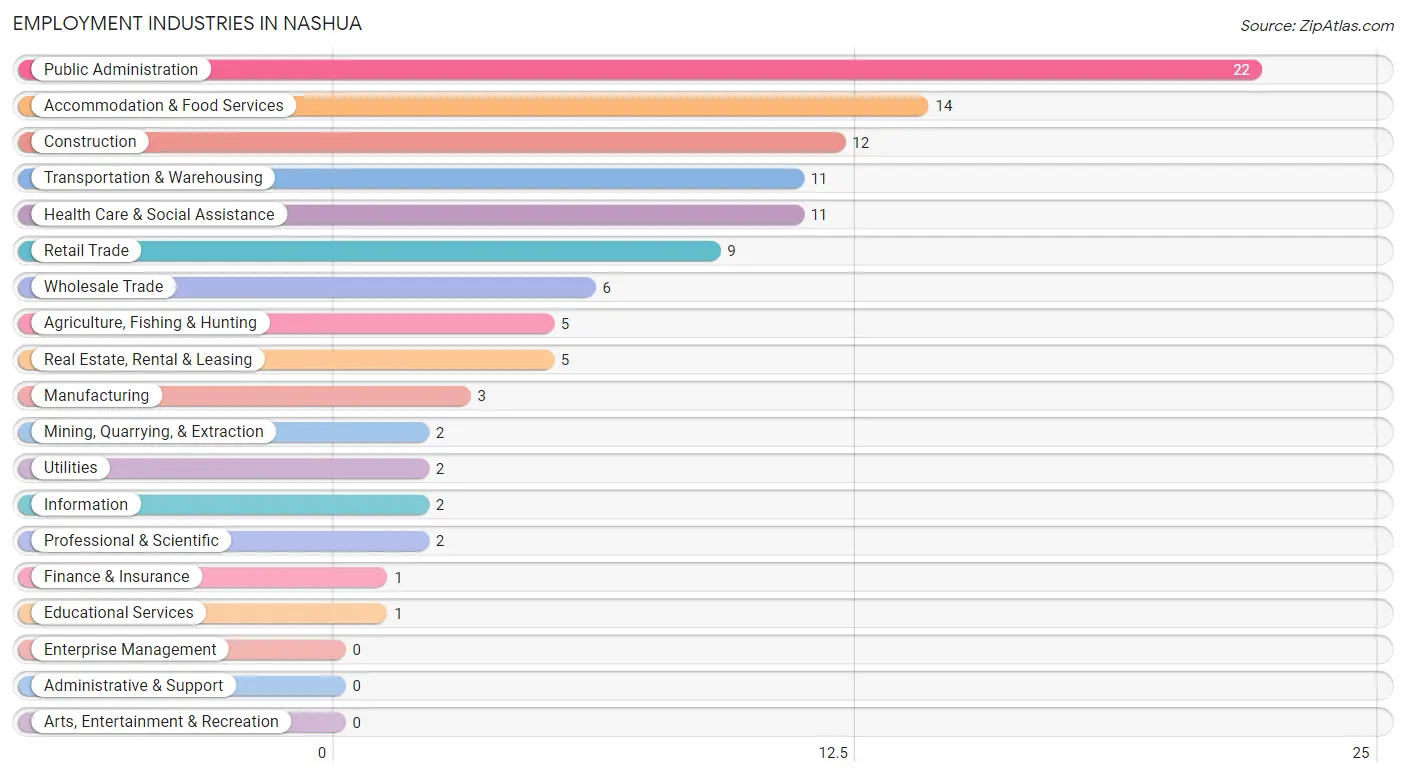
Employment Industries in Nashua
The major employment industries in Nashua include Public Administration (22 | 20.4%), Accommodation & Food Services (14 | 13.0%), Construction (12 | 11.1%), Transportation & Warehousing (11 | 10.2%), and Health Care & Social Assistance (11 | 10.2%).
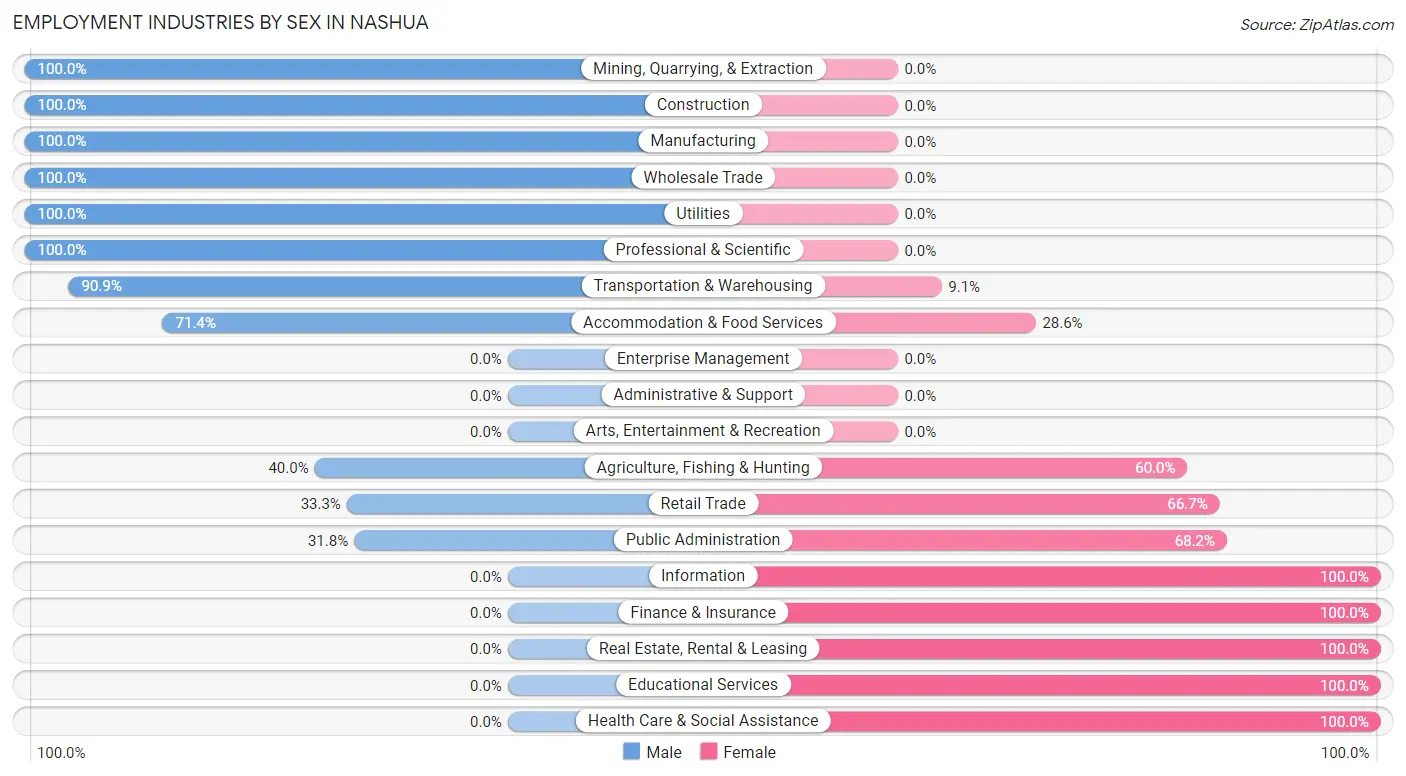
Employment Industries by Sex in Nashua
The Nashua industries that see more men than women are Mining, Quarrying, & Extraction (100.0%), Construction (100.0%), and Manufacturing (100.0%), whereas the industries that tend to have a higher number of women are Information (100.0%), Finance & Insurance (100.0%), and Real Estate, Rental & Leasing (100.0%).
| Industry | Male | Female |
| Agriculture, Fishing & Hunting | 2 (40.0%) | 3 (60.0%) |
| Mining, Quarrying, & Extraction | 2 (100.0%) | 0 (0.0%) |
| Construction | 12 (100.0%) | 0 (0.0%) |
| Manufacturing | 3 (100.0%) | 0 (0.0%) |
| Wholesale Trade | 6 (100.0%) | 0 (0.0%) |
| Retail Trade | 3 (33.3%) | 6 (66.7%) |
| Transportation & Warehousing | 10 (90.9%) | 1 (9.1%) |
| Utilities | 2 (100.0%) | 0 (0.0%) |
| Information | 0 (0.0%) | 2 (100.0%) |
| Finance & Insurance | 0 (0.0%) | 1 (100.0%) |
| Real Estate, Rental & Leasing | 0 (0.0%) | 5 (100.0%) |
| Professional & Scientific | 2 (100.0%) | 0 (0.0%) |
| Enterprise Management | 0 (0.0%) | 0 (0.0%) |
| Administrative & Support | 0 (0.0%) | 0 (0.0%) |
| Educational Services | 0 (0.0%) | 1 (100.0%) |
| Health Care & Social Assistance | 0 (0.0%) | 11 (100.0%) |
| Arts, Entertainment & Recreation | 0 (0.0%) | 0 (0.0%) |
| Accommodation & Food Services | 10 (71.4%) | 4 (28.6%) |
| Public Administration | 7 (31.8%) | 15 (68.2%) |
| Total | 59 (54.6%) | 49 (45.4%) |
Education in Nashua
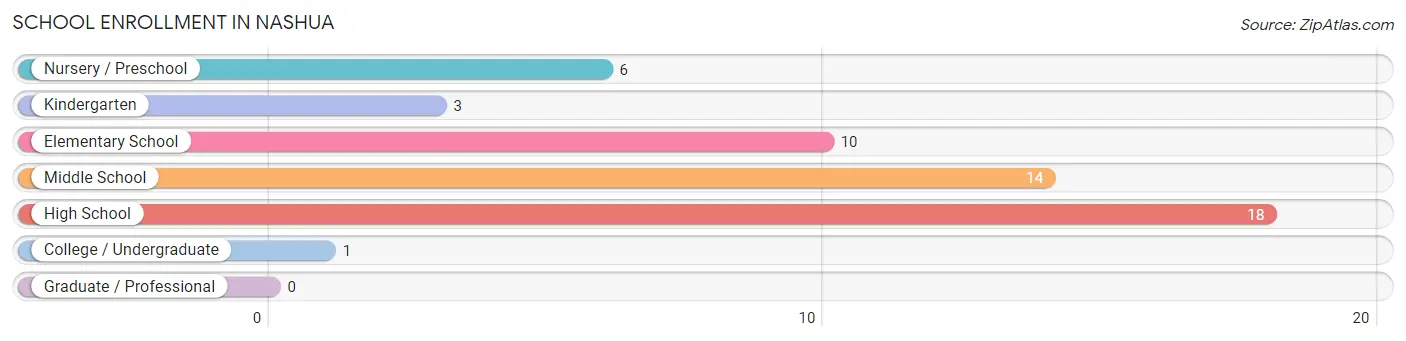
School Enrollment in Nashua
The most common levels of schooling among the 52 students in Nashua are high school (18 | 34.6%), middle school (14 | 26.9%), and elementary school (10 | 19.2%).
| School Level | # Students | % Students |
| Nursery / Preschool | 6 | 11.5% |
| Kindergarten | 3 | 5.8% |
| Elementary School | 10 | 19.2% |
| Middle School | 14 | 26.9% |
| High School | 18 | 34.6% |
| College / Undergraduate | 1 | 1.9% |
| Graduate / Professional | 0 | 0.0% |
| Total | 52 | 100.0% |
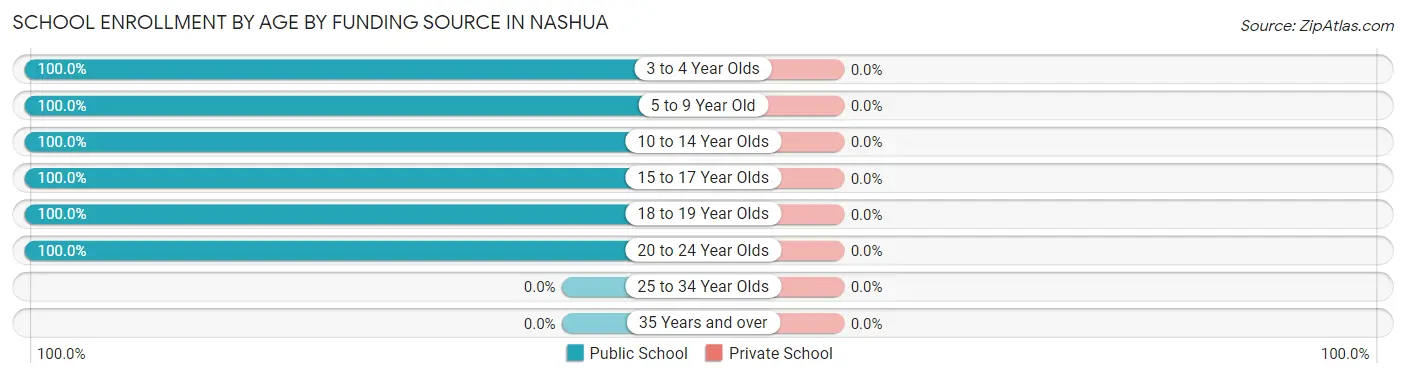
School Enrollment by Age by Funding Source in Nashua
| Age Bracket | Public School | Private School |
| 3 to 4 Year Olds | 3 (100.0%) | 0 (0.0%) |
| 5 to 9 Year Old | 15 (100.0%) | 0 (0.0%) |
| 10 to 14 Year Olds | 15 (100.0%) | 0 (0.0%) |
| 15 to 17 Year Olds | 15 (100.0%) | 0 (0.0%) |
| 18 to 19 Year Olds | 3 (100.0%) | 0 (0.0%) |
| 20 to 24 Year Olds | 1 (100.0%) | 0 (0.0%) |
| 25 to 34 Year Olds | 0 (0.0%) | 0 (0.0%) |
| 35 Years and over | 0 (0.0%) | 0 (0.0%) |
| Total | 52 (100.0%) | 0 (0.0%) |
Educational Attainment by Field of Study in Nashua
Education (16 | 25.0%), bio, nature & agricultural (12 | 18.8%), science & technology (8 | 12.5%), liberal arts & history (7 | 10.9%), and engineering (6 | 9.4%) are the most common fields of study among 64 individuals in Nashua who have obtained a bachelor's degree or higher.
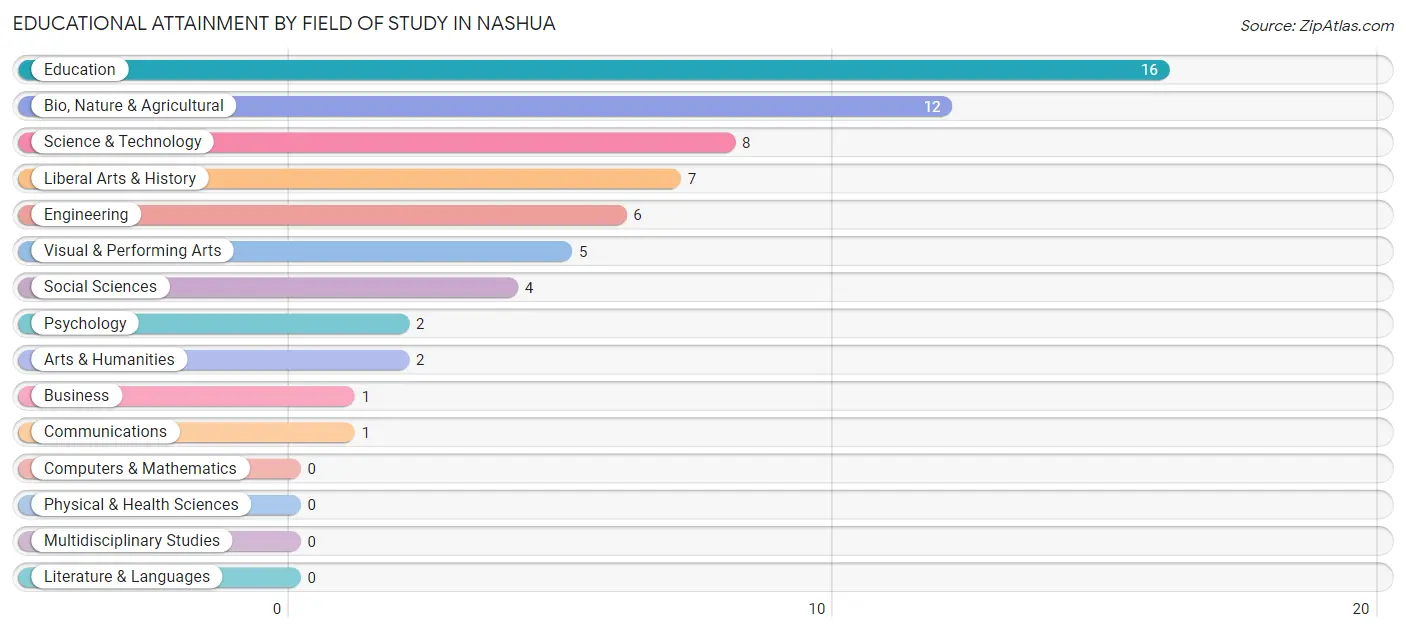
| Field of Study | # Graduates | % Graduates |
| Computers & Mathematics | 0 | 0.0% |
| Bio, Nature & Agricultural | 12 | 18.8% |
| Physical & Health Sciences | 0 | 0.0% |
| Psychology | 2 | 3.1% |
| Social Sciences | 4 | 6.2% |
| Engineering | 6 | 9.4% |
| Multidisciplinary Studies | 0 | 0.0% |
| Science & Technology | 8 | 12.5% |
| Business | 1 | 1.6% |
| Education | 16 | 25.0% |
| Literature & Languages | 0 | 0.0% |
| Liberal Arts & History | 7 | 10.9% |
| Visual & Performing Arts | 5 | 7.8% |
| Communications | 1 | 1.6% |
| Arts & Humanities | 2 | 3.1% |
| Total | 64 | 100.0% |
Transportation & Commute in Nashua
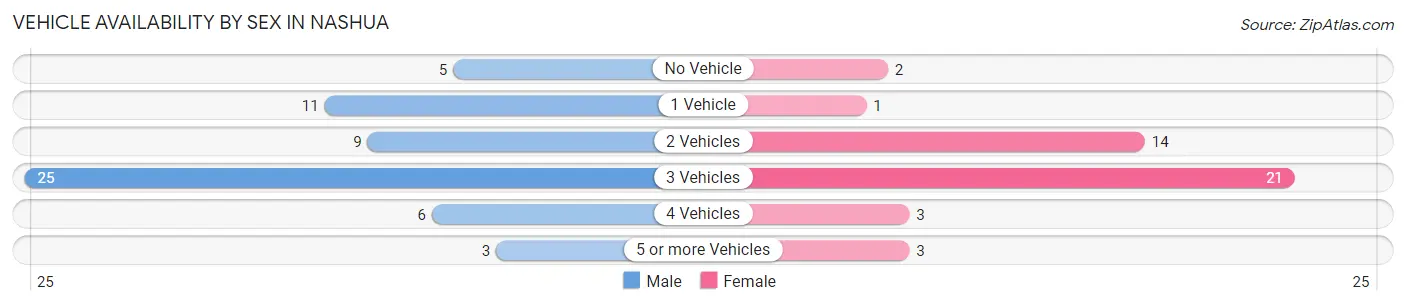
Vehicle Availability by Sex in Nashua
The most prevalent vehicle ownership categories in Nashua are males with 3 vehicles (25, accounting for 42.4%) and females with 3 vehicles (21, making up 56.8%).
| Vehicles Available | Male | Female |
| No Vehicle | 5 (8.5%) | 2 (4.5%) |
| 1 Vehicle | 11 (18.6%) | 1 (2.3%) |
| 2 Vehicles | 9 (15.2%) | 14 (31.8%) |
| 3 Vehicles | 25 (42.4%) | 21 (47.7%) |
| 4 Vehicles | 6 (10.2%) | 3 (6.8%) |
| 5 or more Vehicles | 3 (5.1%) | 3 (6.8%) |
| Total | 59 (100.0%) | 44 (100.0%) |
Commute Time in Nashua
The most frequently occuring commute durations in Nashua are 15 to 19 minutes (42 commuters, 40.0%), 20 to 24 minutes (27 commuters, 25.7%), and 10 to 14 minutes (12 commuters, 11.4%).
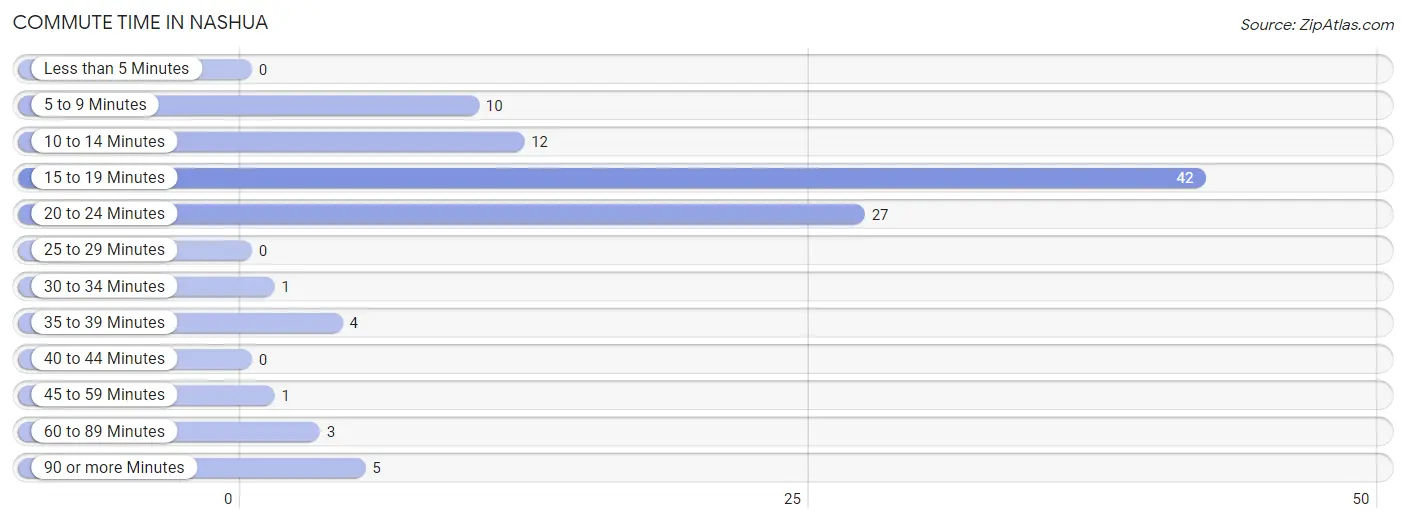
| Commute Time | # Commuters | % Commuters |
| Less than 5 Minutes | 0 | 0.0% |
| 5 to 9 Minutes | 10 | 9.5% |
| 10 to 14 Minutes | 12 | 11.4% |
| 15 to 19 Minutes | 42 | 40.0% |
| 20 to 24 Minutes | 27 | 25.7% |
| 25 to 29 Minutes | 0 | 0.0% |
| 30 to 34 Minutes | 1 | 0.9% |
| 35 to 39 Minutes | 4 | 3.8% |
| 40 to 44 Minutes | 0 | 0.0% |
| 45 to 59 Minutes | 1 | 0.9% |
| 60 to 89 Minutes | 3 | 2.9% |
| 90 or more Minutes | 5 | 4.8% |
Commute Time by Sex in Nashua
The most common commute times in Nashua are 15 to 19 minutes (27 commuters, 45.8%) for males and 20 to 24 minutes (22 commuters, 47.8%) for females.
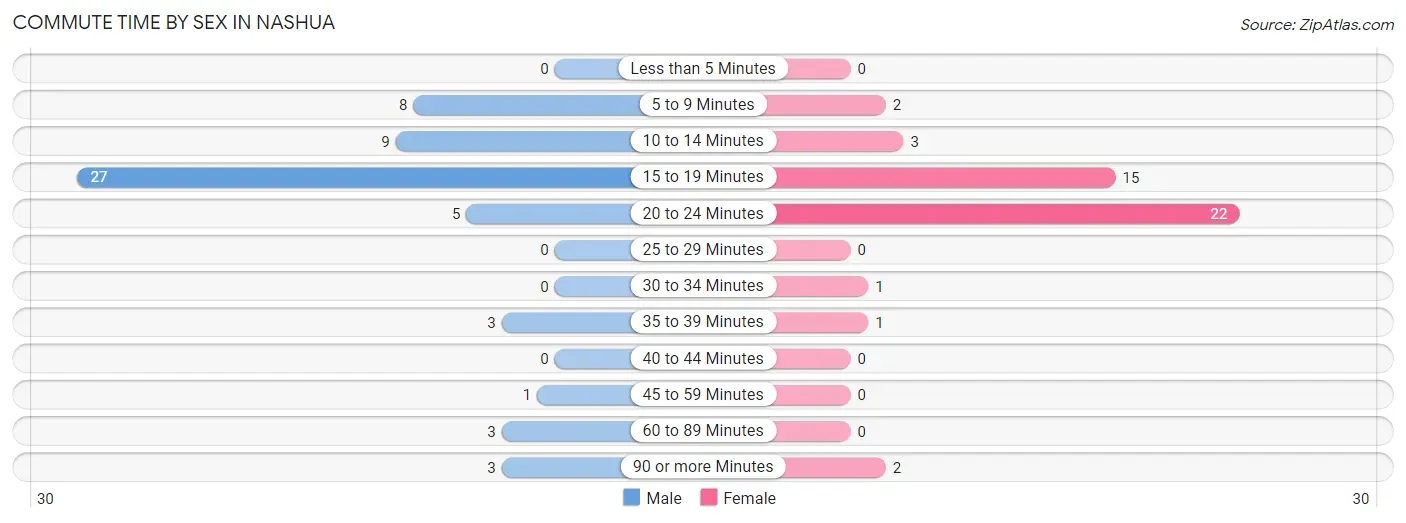
| Commute Time | Male | Female |
| Less than 5 Minutes | 0 (0.0%) | 0 (0.0%) |
| 5 to 9 Minutes | 8 (13.6%) | 2 (4.3%) |
| 10 to 14 Minutes | 9 (15.2%) | 3 (6.5%) |
| 15 to 19 Minutes | 27 (45.8%) | 15 (32.6%) |
| 20 to 24 Minutes | 5 (8.5%) | 22 (47.8%) |
| 25 to 29 Minutes | 0 (0.0%) | 0 (0.0%) |
| 30 to 34 Minutes | 0 (0.0%) | 1 (2.2%) |
| 35 to 39 Minutes | 3 (5.1%) | 1 (2.2%) |
| 40 to 44 Minutes | 0 (0.0%) | 0 (0.0%) |
| 45 to 59 Minutes | 1 (1.7%) | 0 (0.0%) |
| 60 to 89 Minutes | 3 (5.1%) | 0 (0.0%) |
| 90 or more Minutes | 3 (5.1%) | 2 (4.3%) |
Time of Departure to Work by Sex in Nashua
The most frequent times of departure to work in Nashua are 6:00 AM to 6:29 AM (14, 23.7%) for males and 7:30 AM to 7:59 AM (12, 26.1%) for females.
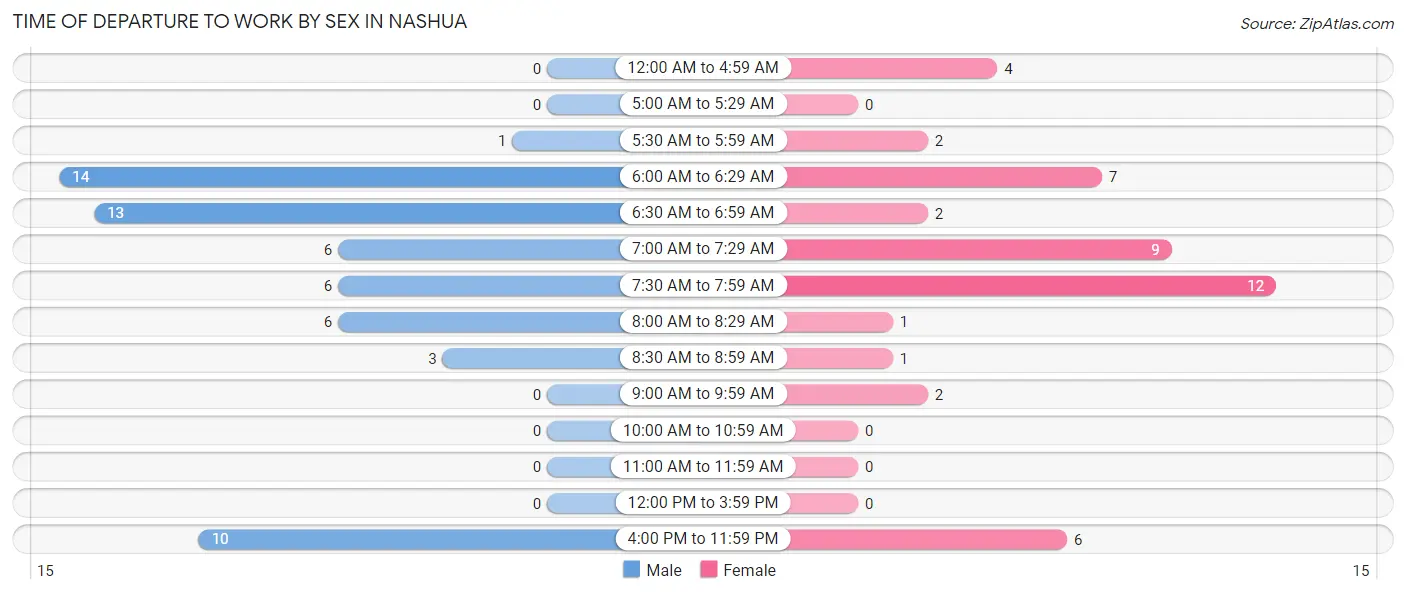
| Time of Departure | Male | Female |
| 12:00 AM to 4:59 AM | 0 (0.0%) | 4 (8.7%) |
| 5:00 AM to 5:29 AM | 0 (0.0%) | 0 (0.0%) |
| 5:30 AM to 5:59 AM | 1 (1.7%) | 2 (4.3%) |
| 6:00 AM to 6:29 AM | 14 (23.7%) | 7 (15.2%) |
| 6:30 AM to 6:59 AM | 13 (22.0%) | 2 (4.3%) |
| 7:00 AM to 7:29 AM | 6 (10.2%) | 9 (19.6%) |
| 7:30 AM to 7:59 AM | 6 (10.2%) | 12 (26.1%) |
| 8:00 AM to 8:29 AM | 6 (10.2%) | 1 (2.2%) |
| 8:30 AM to 8:59 AM | 3 (5.1%) | 1 (2.2%) |
| 9:00 AM to 9:59 AM | 0 (0.0%) | 2 (4.3%) |
| 10:00 AM to 10:59 AM | 0 (0.0%) | 0 (0.0%) |
| 11:00 AM to 11:59 AM | 0 (0.0%) | 0 (0.0%) |
| 12:00 PM to 3:59 PM | 0 (0.0%) | 0 (0.0%) |
| 4:00 PM to 11:59 PM | 10 (17.0%) | 6 (13.0%) |
| Total | 59 (100.0%) | 46 (100.0%) |
Housing Occupancy in Nashua
Occupancy by Ownership in Nashua
Of the total 137 dwellings in Nashua, owner-occupied units account for 108 (78.8%), while renter-occupied units make up 29 (21.2%).
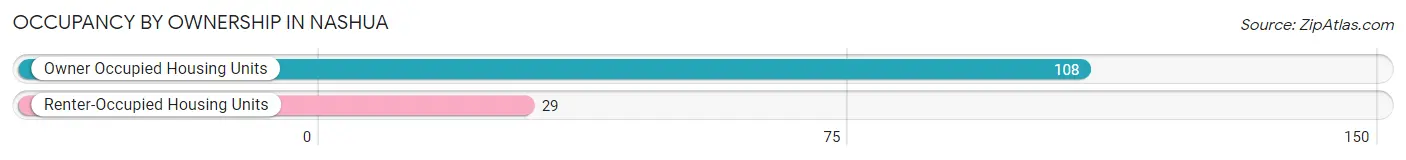
| Occupancy | # Housing Units | % Housing Units |
| Owner Occupied Housing Units | 108 | 78.8% |
| Renter-Occupied Housing Units | 29 | 21.2% |
| Total Occupied Housing Units | 137 | 100.0% |
Occupancy by Household Size in Nashua
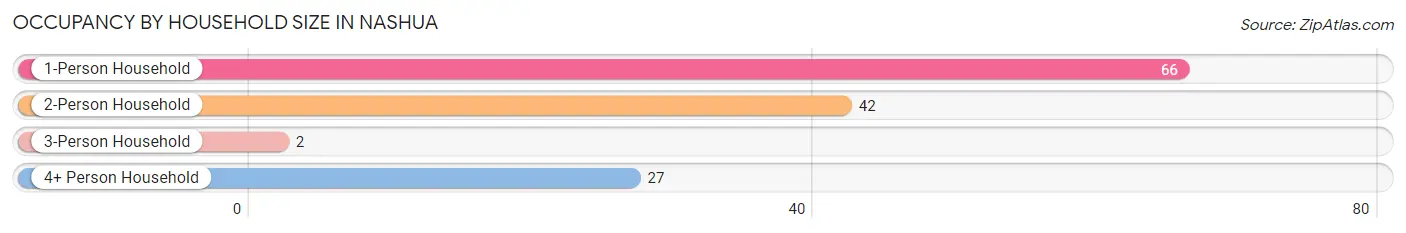
| Household Size | # Housing Units | % Housing Units |
| 1-Person Household | 66 | 48.2% |
| 2-Person Household | 42 | 30.7% |
| 3-Person Household | 2 | 1.5% |
| 4+ Person Household | 27 | 19.7% |
| Total Housing Units | 137 | 100.0% |
Occupancy by Ownership by Household Size in Nashua
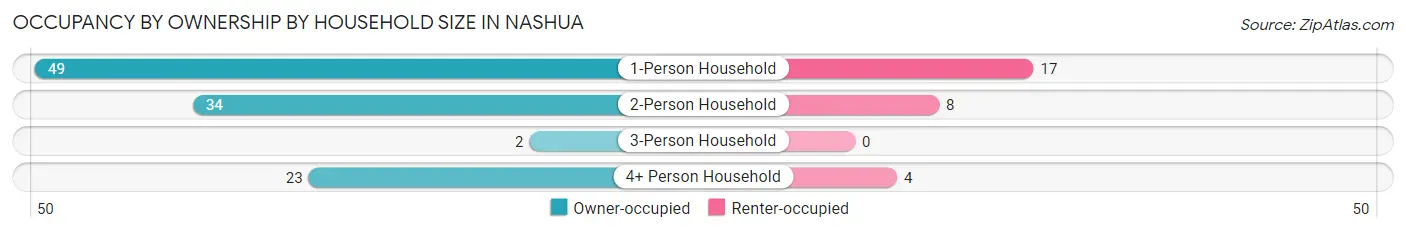
| Household Size | Owner-occupied | Renter-occupied |
| 1-Person Household | 49 (74.2%) | 17 (25.8%) |
| 2-Person Household | 34 (80.9%) | 8 (19.1%) |
| 3-Person Household | 2 (100.0%) | 0 (0.0%) |
| 4+ Person Household | 23 (85.2%) | 4 (14.8%) |
| Total Housing Units | 108 (78.8%) | 29 (21.2%) |
Occupancy by Educational Attainment in Nashua
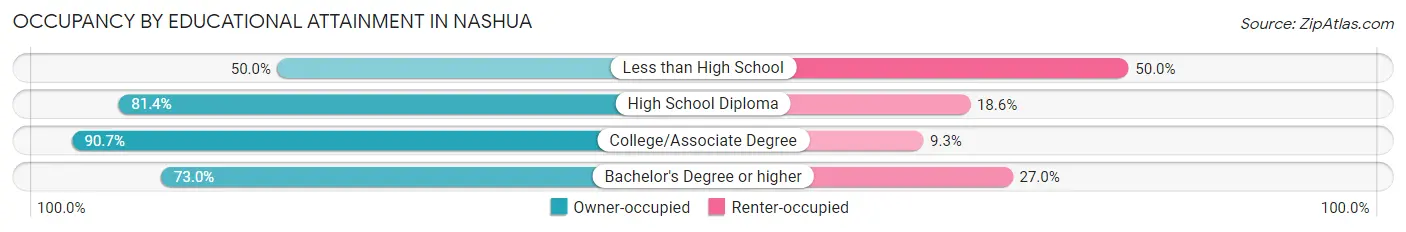
| Household Size | Owner-occupied | Renter-occupied |
| Less than High School | 7 (50.0%) | 7 (50.0%) |
| High School Diploma | 35 (81.4%) | 8 (18.6%) |
| College/Associate Degree | 39 (90.7%) | 4 (9.3%) |
| Bachelor's Degree or higher | 27 (73.0%) | 10 (27.0%) |
Occupancy by Age of Householder in Nashua
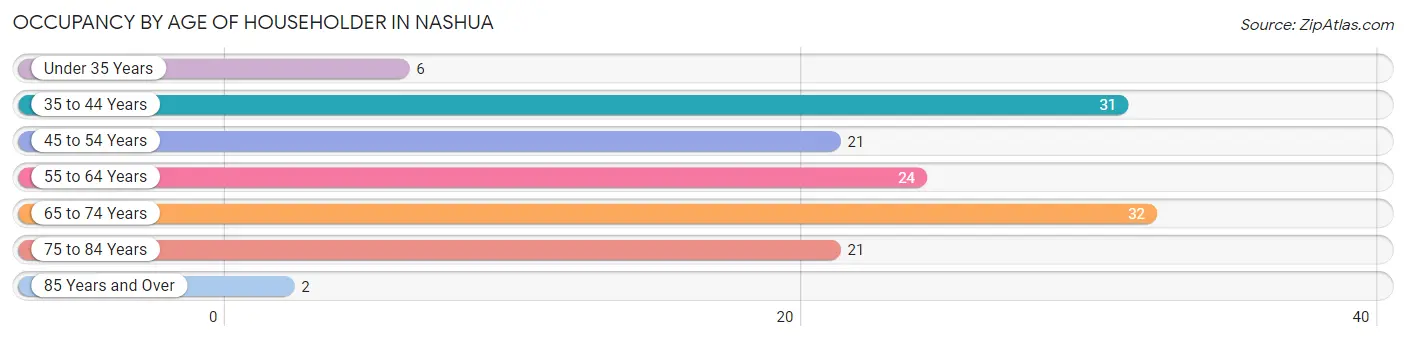
| Age Bracket | # Households | % Households |
| Under 35 Years | 6 | 4.4% |
| 35 to 44 Years | 31 | 22.6% |
| 45 to 54 Years | 21 | 15.3% |
| 55 to 64 Years | 24 | 17.5% |
| 65 to 74 Years | 32 | 23.4% |
| 75 to 84 Years | 21 | 15.3% |
| 85 Years and Over | 2 | 1.5% |
| Total | 137 | 100.0% |
Housing Finances in Nashua
Median Income by Occupancy in Nashua
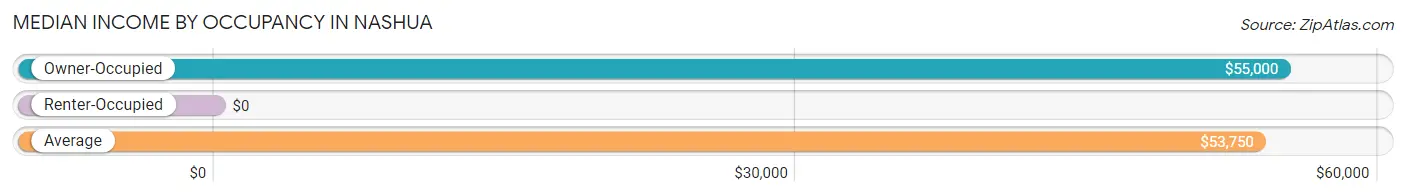
| Occupancy Type | # Households | Median Income |
| Owner-Occupied | 108 (78.8%) | $55,000 |
| Renter-Occupied | 29 (21.2%) | $0 |
| Average | 137 (100.0%) | $53,750 |
Occupancy by Householder Income Bracket in Nashua
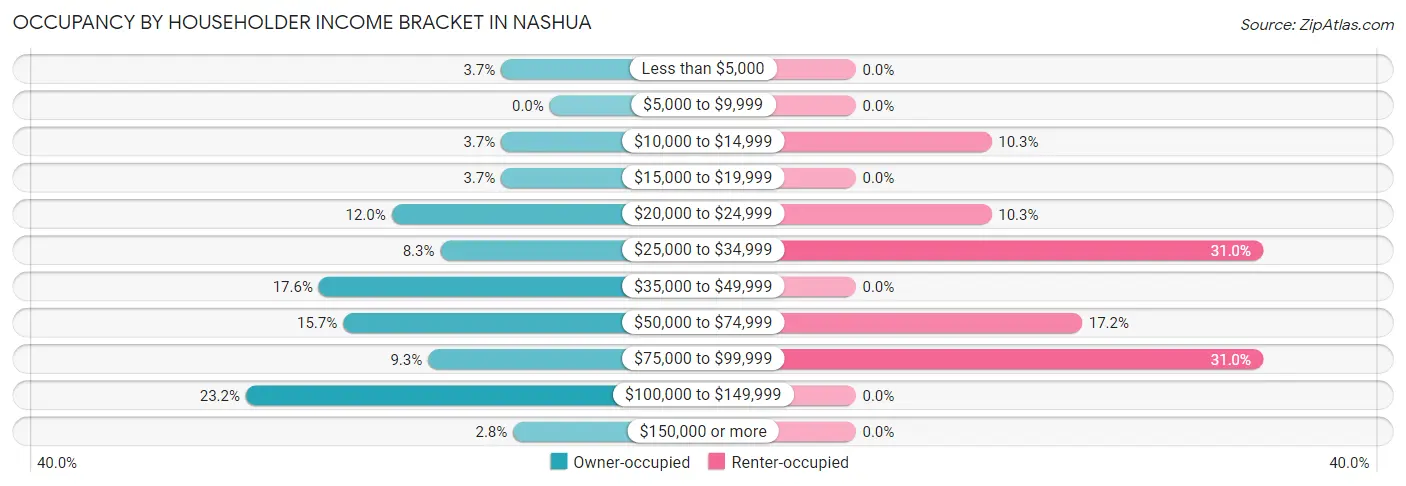
| Income Bracket | Owner-occupied | Renter-occupied |
| Less than $5,000 | 4 (3.7%) | 0 (0.0%) |
| $5,000 to $9,999 | 0 (0.0%) | 0 (0.0%) |
| $10,000 to $14,999 | 4 (3.7%) | 3 (10.3%) |
| $15,000 to $19,999 | 4 (3.7%) | 0 (0.0%) |
| $20,000 to $24,999 | 13 (12.0%) | 3 (10.3%) |
| $25,000 to $34,999 | 9 (8.3%) | 9 (31.0%) |
| $35,000 to $49,999 | 19 (17.6%) | 0 (0.0%) |
| $50,000 to $74,999 | 17 (15.7%) | 5 (17.2%) |
| $75,000 to $99,999 | 10 (9.3%) | 9 (31.0%) |
| $100,000 to $149,999 | 25 (23.2%) | 0 (0.0%) |
| $150,000 or more | 3 (2.8%) | 0 (0.0%) |
| Total | 108 (100.0%) | 29 (100.0%) |
Monthly Housing Cost Tiers in Nashua
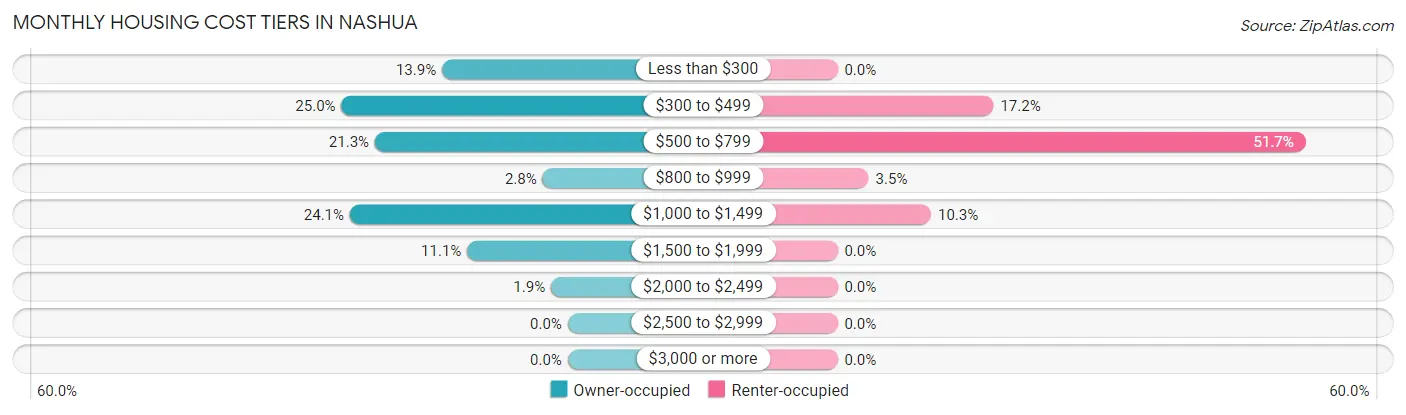
| Monthly Cost | Owner-occupied | Renter-occupied |
| Less than $300 | 15 (13.9%) | 0 (0.0%) |
| $300 to $499 | 27 (25.0%) | 5 (17.2%) |
| $500 to $799 | 23 (21.3%) | 15 (51.7%) |
| $800 to $999 | 3 (2.8%) | 1 (3.5%) |
| $1,000 to $1,499 | 26 (24.1%) | 3 (10.3%) |
| $1,500 to $1,999 | 12 (11.1%) | 0 (0.0%) |
| $2,000 to $2,499 | 2 (1.8%) | 0 (0.0%) |
| $2,500 to $2,999 | 0 (0.0%) | 0 (0.0%) |
| $3,000 or more | 0 (0.0%) | 0 (0.0%) |
| Total | 108 (100.0%) | 29 (100.0%) |
Physical Housing Characteristics in Nashua
Housing Structures in Nashua
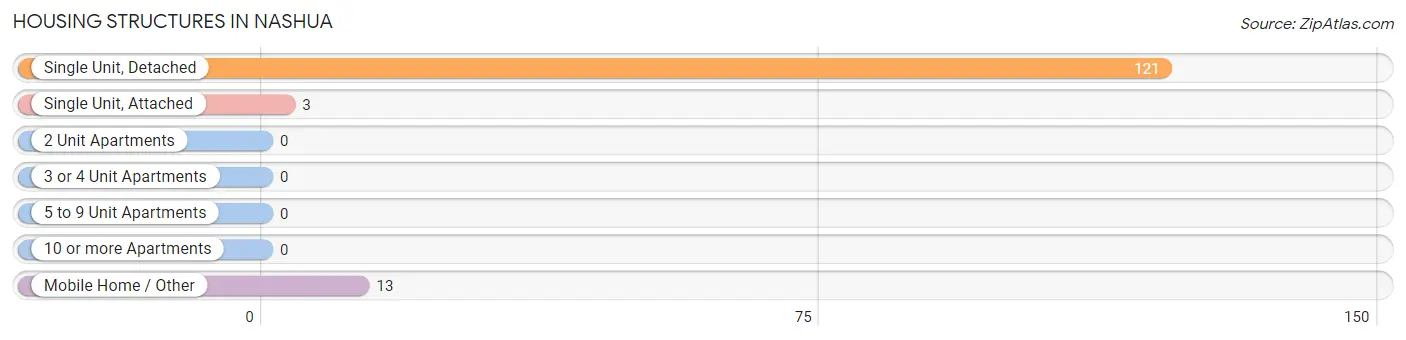
| Structure Type | # Housing Units | % Housing Units |
| Single Unit, Detached | 121 | 88.3% |
| Single Unit, Attached | 3 | 2.2% |
| 2 Unit Apartments | 0 | 0.0% |
| 3 or 4 Unit Apartments | 0 | 0.0% |
| 5 to 9 Unit Apartments | 0 | 0.0% |
| 10 or more Apartments | 0 | 0.0% |
| Mobile Home / Other | 13 | 9.5% |
| Total | 137 | 100.0% |
Housing Structures by Occupancy in Nashua
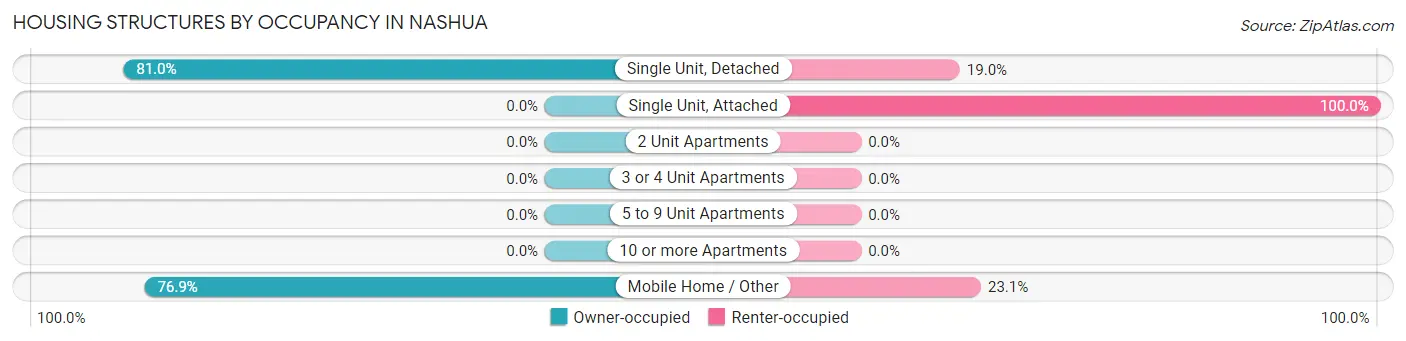
| Structure Type | Owner-occupied | Renter-occupied |
| Single Unit, Detached | 98 (81.0%) | 23 (19.0%) |
| Single Unit, Attached | 0 (0.0%) | 3 (100.0%) |
| 2 Unit Apartments | 0 (0.0%) | 0 (0.0%) |
| 3 or 4 Unit Apartments | 0 (0.0%) | 0 (0.0%) |
| 5 to 9 Unit Apartments | 0 (0.0%) | 0 (0.0%) |
| 10 or more Apartments | 0 (0.0%) | 0 (0.0%) |
| Mobile Home / Other | 10 (76.9%) | 3 (23.1%) |
| Total | 108 (78.8%) | 29 (21.2%) |
Housing Structures by Number of Rooms in Nashua
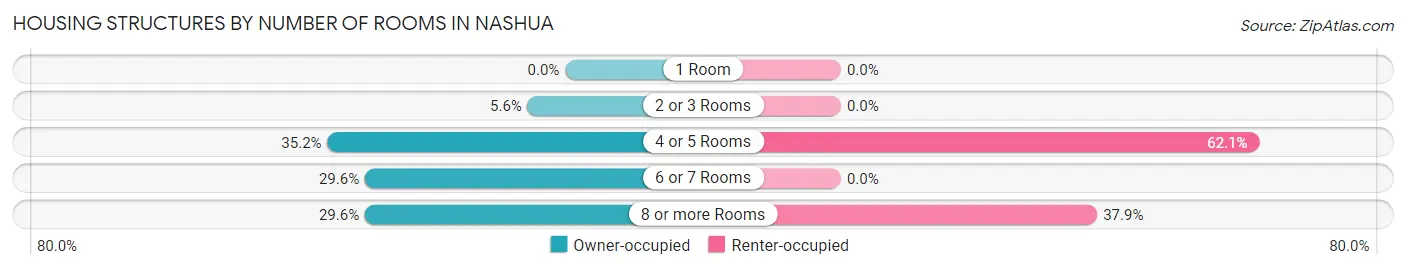
| Number of Rooms | Owner-occupied | Renter-occupied |
| 1 Room | 0 (0.0%) | 0 (0.0%) |
| 2 or 3 Rooms | 6 (5.6%) | 0 (0.0%) |
| 4 or 5 Rooms | 38 (35.2%) | 18 (62.1%) |
| 6 or 7 Rooms | 32 (29.6%) | 0 (0.0%) |
| 8 or more Rooms | 32 (29.6%) | 11 (37.9%) |
| Total | 108 (100.0%) | 29 (100.0%) |
Housing Structure by Heating Type in Nashua
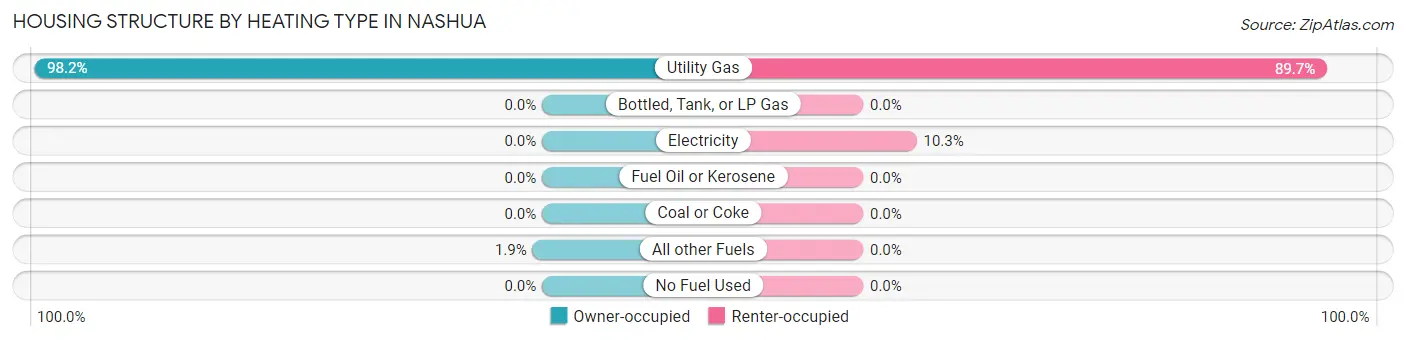
| Heating Type | Owner-occupied | Renter-occupied |
| Utility Gas | 106 (98.2%) | 26 (89.7%) |
| Bottled, Tank, or LP Gas | 0 (0.0%) | 0 (0.0%) |
| Electricity | 0 (0.0%) | 3 (10.3%) |
| Fuel Oil or Kerosene | 0 (0.0%) | 0 (0.0%) |
| Coal or Coke | 0 (0.0%) | 0 (0.0%) |
| All other Fuels | 2 (1.8%) | 0 (0.0%) |
| No Fuel Used | 0 (0.0%) | 0 (0.0%) |
| Total | 108 (100.0%) | 29 (100.0%) |
Household Vehicle Usage in Nashua
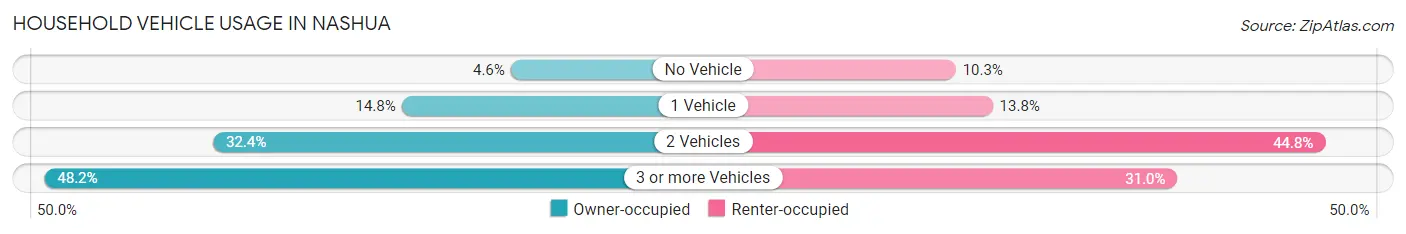
| Vehicles per Household | Owner-occupied | Renter-occupied |
| No Vehicle | 5 (4.6%) | 3 (10.3%) |
| 1 Vehicle | 16 (14.8%) | 4 (13.8%) |
| 2 Vehicles | 35 (32.4%) | 13 (44.8%) |
| 3 or more Vehicles | 52 (48.1%) | 9 (31.0%) |
| Total | 108 (100.0%) | 29 (100.0%) |
Real Estate & Mortgages in Nashua
Real Estate and Mortgage Overview in Nashua
| Characteristic | Without Mortgage | With Mortgage |
| Housing Units | 57 | 51 |
| Median Property Value | $64,500 | $186,300 |
| Median Household Income | $36,477 | $0 |
| Monthly Housing Costs | $417 | $0 |
| Real Estate Taxes | $1,250 | $1 |
Property Value by Mortgage Status in Nashua
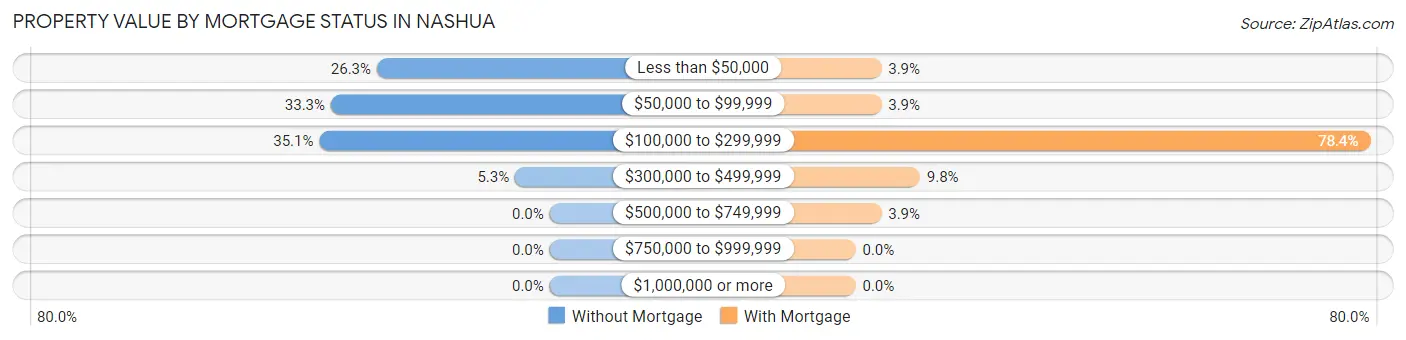
| Property Value | Without Mortgage | With Mortgage |
| Less than $50,000 | 15 (26.3%) | 2 (3.9%) |
| $50,000 to $99,999 | 19 (33.3%) | 2 (3.9%) |
| $100,000 to $299,999 | 20 (35.1%) | 40 (78.4%) |
| $300,000 to $499,999 | 3 (5.3%) | 5 (9.8%) |
| $500,000 to $749,999 | 0 (0.0%) | 2 (3.9%) |
| $750,000 to $999,999 | 0 (0.0%) | 0 (0.0%) |
| $1,000,000 or more | 0 (0.0%) | 0 (0.0%) |
| Total | 57 (100.0%) | 51 (100.0%) |
Household Income by Mortgage Status in Nashua
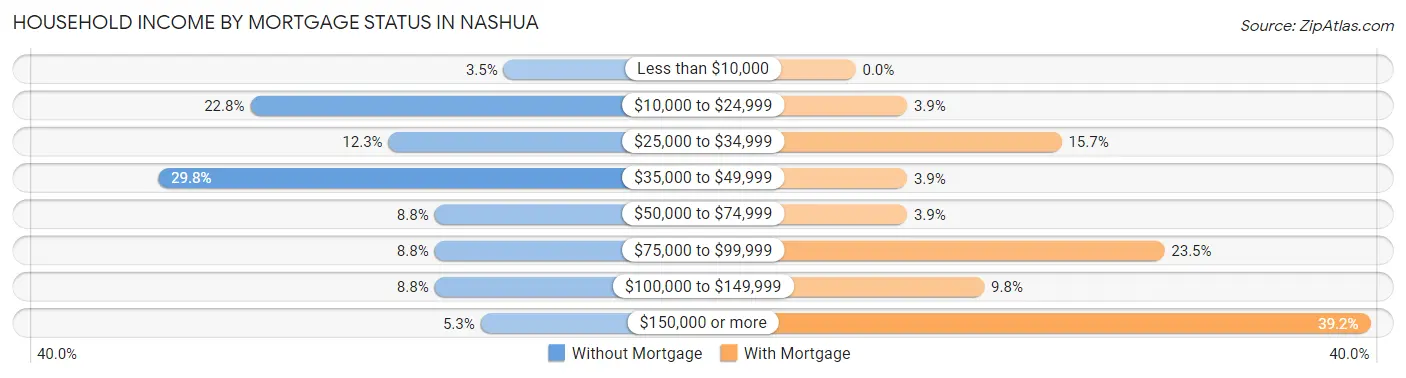
| Household Income | Without Mortgage | With Mortgage |
| Less than $10,000 | 2 (3.5%) | 0 (0.0%) |
| $10,000 to $24,999 | 13 (22.8%) | 2 (3.9%) |
| $25,000 to $34,999 | 7 (12.3%) | 8 (15.7%) |
| $35,000 to $49,999 | 17 (29.8%) | 2 (3.9%) |
| $50,000 to $74,999 | 5 (8.8%) | 2 (3.9%) |
| $75,000 to $99,999 | 5 (8.8%) | 12 (23.5%) |
| $100,000 to $149,999 | 5 (8.8%) | 5 (9.8%) |
| $150,000 or more | 3 (5.3%) | 20 (39.2%) |
| Total | 57 (100.0%) | 51 (100.0%) |
Property Value to Household Income Ratio in Nashua
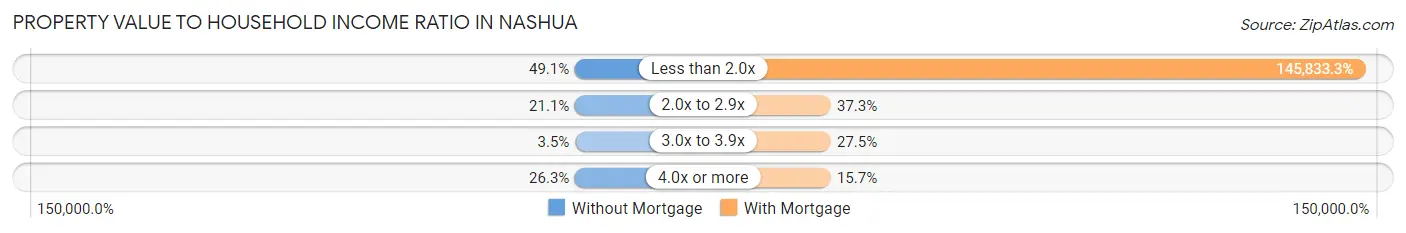
| Value-to-Income Ratio | Without Mortgage | With Mortgage |
| Less than 2.0x | 28 (49.1%) | 74,375 (145,833.3%) |
| 2.0x to 2.9x | 12 (21.0%) | 19 (37.2%) |
| 3.0x to 3.9x | 2 (3.5%) | 14 (27.5%) |
| 4.0x or more | 15 (26.3%) | 8 (15.7%) |
| Total | 57 (100.0%) | 51 (100.0%) |
Real Estate Taxes by Mortgage Status in Nashua
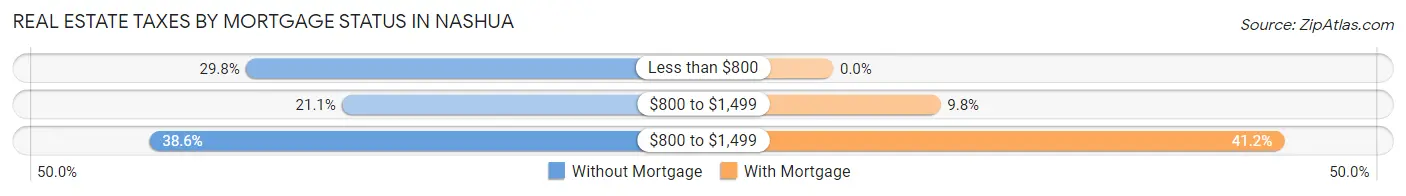
| Property Taxes | Without Mortgage | With Mortgage |
| Less than $800 | 17 (29.8%) | 0 (0.0%) |
| $800 to $1,499 | 12 (21.0%) | 5 (9.8%) |
| $800 to $1,499 | 22 (38.6%) | 21 (41.2%) |
| Total | 57 (100.0%) | 51 (100.0%) |
Health & Disability in Nashua
Health Insurance Coverage by Age in Nashua
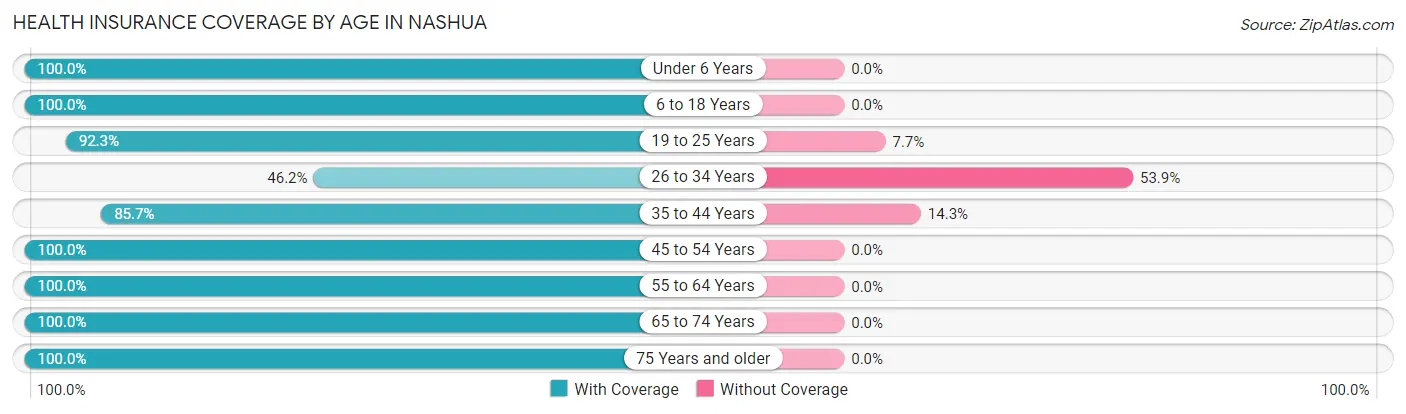
| Age Bracket | With Coverage | Without Coverage |
| Under 6 Years | 25 (100.0%) | 0 (0.0%) |
| 6 to 18 Years | 45 (100.0%) | 0 (0.0%) |
| 19 to 25 Years | 12 (92.3%) | 1 (7.7%) |
| 26 to 34 Years | 6 (46.2%) | 7 (53.8%) |
| 35 to 44 Years | 48 (85.7%) | 8 (14.3%) |
| 45 to 54 Years | 26 (100.0%) | 0 (0.0%) |
| 55 to 64 Years | 49 (100.0%) | 0 (0.0%) |
| 65 to 74 Years | 45 (100.0%) | 0 (0.0%) |
| 75 Years and older | 42 (100.0%) | 0 (0.0%) |
| Total | 298 (94.9%) | 16 (5.1%) |
Health Insurance Coverage by Citizenship Status in Nashua
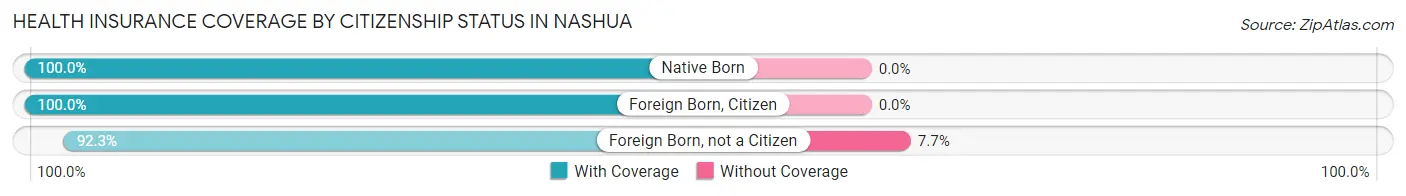
| Citizenship Status | With Coverage | Without Coverage |
| Native Born | 25 (100.0%) | 0 (0.0%) |
| Foreign Born, Citizen | 45 (100.0%) | 0 (0.0%) |
| Foreign Born, not a Citizen | 12 (92.3%) | 1 (7.7%) |
Health Insurance Coverage by Household Income in Nashua
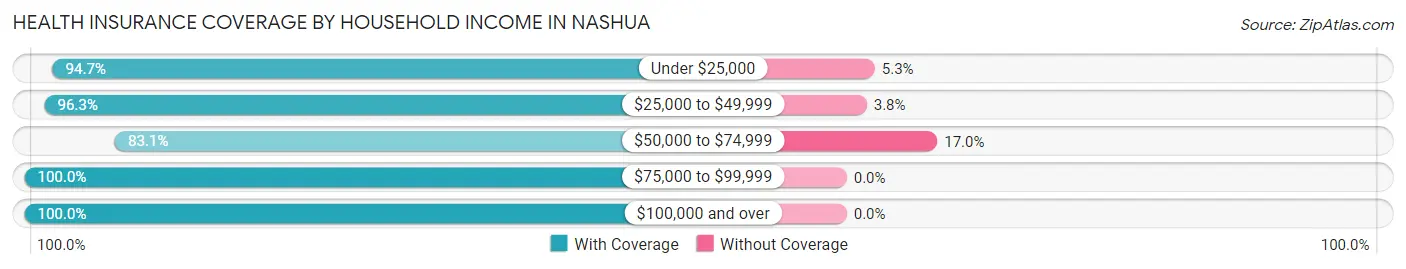
| Household Income | With Coverage | Without Coverage |
| Under $25,000 | 54 (94.7%) | 3 (5.3%) |
| $25,000 to $49,999 | 77 (96.3%) | 3 (3.7%) |
| $50,000 to $74,999 | 49 (83.1%) | 10 (17.0%) |
| $75,000 to $99,999 | 56 (100.0%) | 0 (0.0%) |
| $100,000 and over | 59 (100.0%) | 0 (0.0%) |
Public vs Private Health Insurance Coverage by Age in Nashua
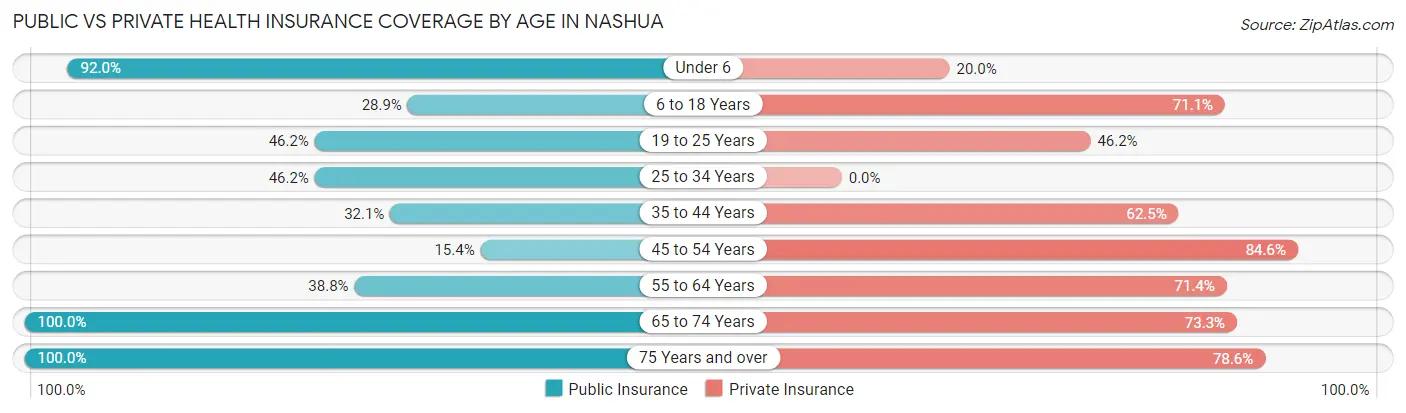
| Age Bracket | Public Insurance | Private Insurance |
| Under 6 | 23 (92.0%) | 5 (20.0%) |
| 6 to 18 Years | 13 (28.9%) | 32 (71.1%) |
| 19 to 25 Years | 6 (46.2%) | 6 (46.2%) |
| 25 to 34 Years | 6 (46.2%) | 0 (0.0%) |
| 35 to 44 Years | 18 (32.1%) | 35 (62.5%) |
| 45 to 54 Years | 4 (15.4%) | 22 (84.6%) |
| 55 to 64 Years | 19 (38.8%) | 35 (71.4%) |
| 65 to 74 Years | 45 (100.0%) | 33 (73.3%) |
| 75 Years and over | 42 (100.0%) | 33 (78.6%) |
| Total | 176 (56.0%) | 201 (64.0%) |
Disability Status by Sex by Age in Nashua
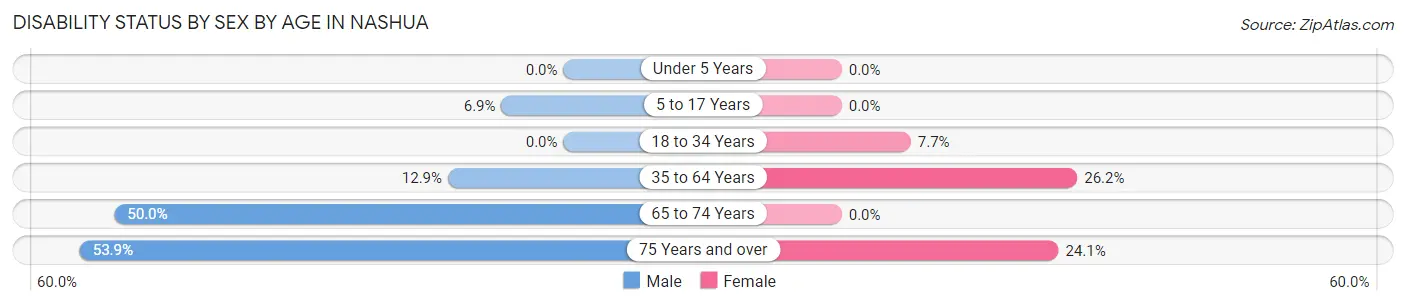
| Age Bracket | Male | Female |
| Under 5 Years | 0 (0.0%) | 0 (0.0%) |
| 5 to 17 Years | 2 (6.9%) | 0 (0.0%) |
| 18 to 34 Years | 0 (0.0%) | 1 (7.7%) |
| 35 to 64 Years | 9 (12.9%) | 16 (26.2%) |
| 65 to 74 Years | 15 (50.0%) | 0 (0.0%) |
| 75 Years and over | 7 (53.8%) | 7 (24.1%) |
Disability Class by Sex by Age in Nashua
Disability Class: Hearing Difficulty
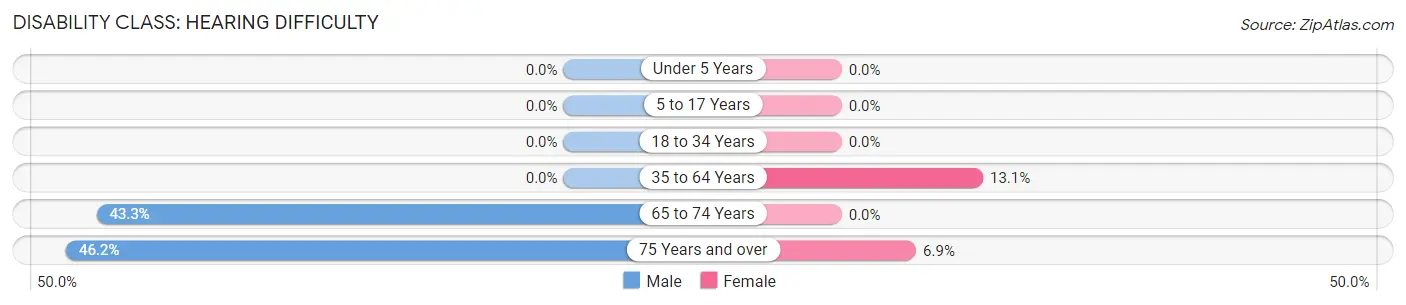
| Age Bracket | Male | Female |
| Under 5 Years | 0 (0.0%) | 0 (0.0%) |
| 5 to 17 Years | 0 (0.0%) | 0 (0.0%) |
| 18 to 34 Years | 0 (0.0%) | 0 (0.0%) |
| 35 to 64 Years | 0 (0.0%) | 8 (13.1%) |
| 65 to 74 Years | 13 (43.3%) | 0 (0.0%) |
| 75 Years and over | 6 (46.2%) | 2 (6.9%) |
Disability Class: Vision Difficulty
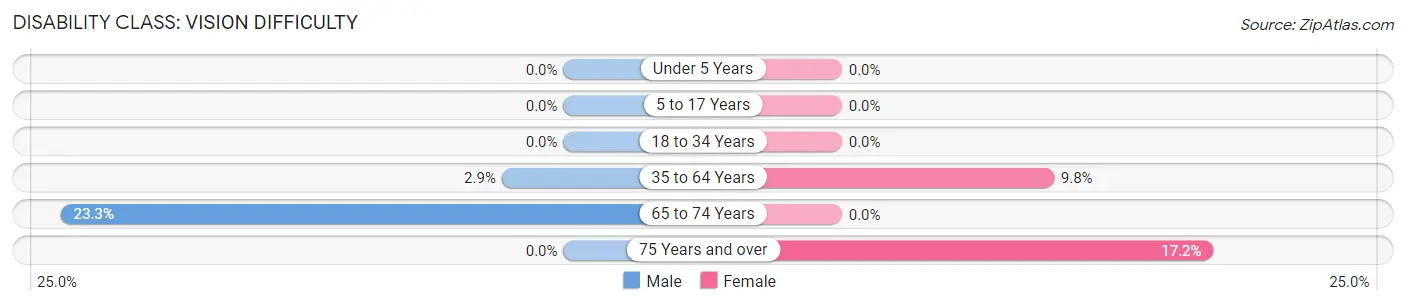
| Age Bracket | Male | Female |
| Under 5 Years | 0 (0.0%) | 0 (0.0%) |
| 5 to 17 Years | 0 (0.0%) | 0 (0.0%) |
| 18 to 34 Years | 0 (0.0%) | 0 (0.0%) |
| 35 to 64 Years | 2 (2.9%) | 6 (9.8%) |
| 65 to 74 Years | 7 (23.3%) | 0 (0.0%) |
| 75 Years and over | 0 (0.0%) | 5 (17.2%) |
Disability Class: Cognitive Difficulty
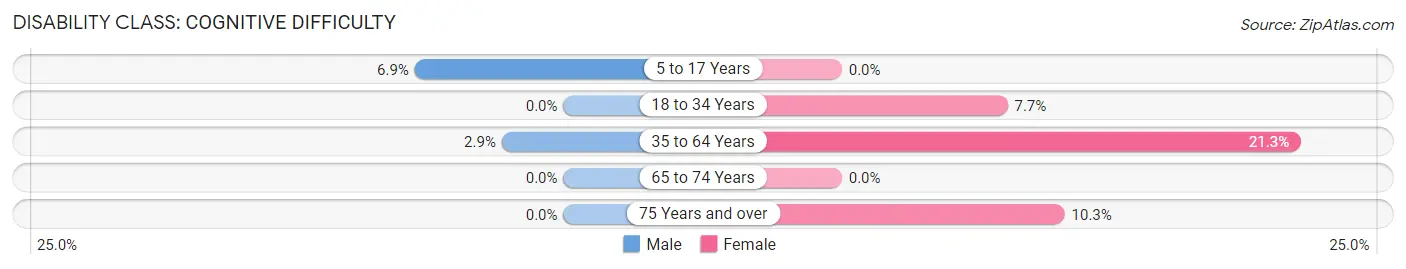
| Age Bracket | Male | Female |
| 5 to 17 Years | 2 (6.9%) | 0 (0.0%) |
| 18 to 34 Years | 0 (0.0%) | 1 (7.7%) |
| 35 to 64 Years | 2 (2.9%) | 13 (21.3%) |
| 65 to 74 Years | 0 (0.0%) | 0 (0.0%) |
| 75 Years and over | 0 (0.0%) | 3 (10.3%) |
Disability Class: Ambulatory Difficulty
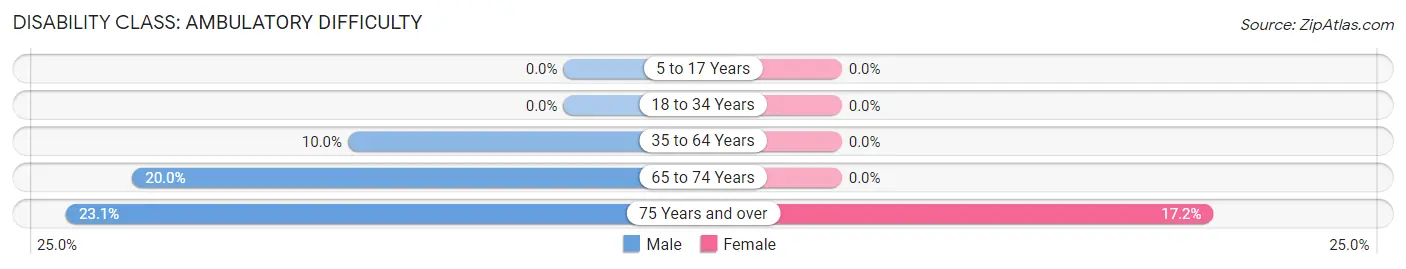
| Age Bracket | Male | Female |
| 5 to 17 Years | 0 (0.0%) | 0 (0.0%) |
| 18 to 34 Years | 0 (0.0%) | 0 (0.0%) |
| 35 to 64 Years | 7 (10.0%) | 0 (0.0%) |
| 65 to 74 Years | 6 (20.0%) | 0 (0.0%) |
| 75 Years and over | 3 (23.1%) | 5 (17.2%) |
Disability Class: Self-Care Difficulty
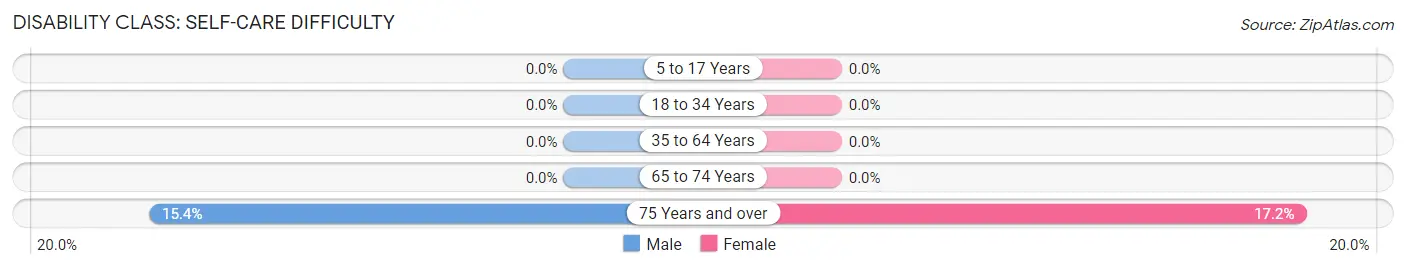
| Age Bracket | Male | Female |
| 5 to 17 Years | 0 (0.0%) | 0 (0.0%) |
| 18 to 34 Years | 0 (0.0%) | 0 (0.0%) |
| 35 to 64 Years | 0 (0.0%) | 0 (0.0%) |
| 65 to 74 Years | 0 (0.0%) | 0 (0.0%) |
| 75 Years and over | 2 (15.4%) | 5 (17.2%) |
Technology Access in Nashua
Computing Device Access in Nashua
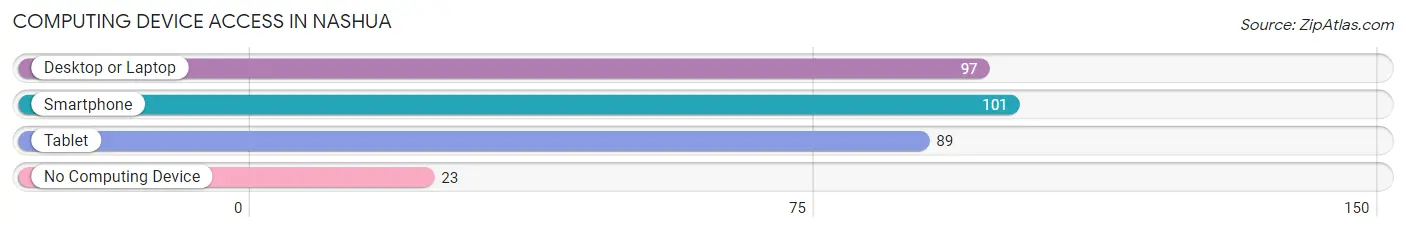
| Device Type | # Households | % Households |
| Desktop or Laptop | 97 | 70.8% |
| Smartphone | 101 | 73.7% |
| Tablet | 89 | 65.0% |
| No Computing Device | 23 | 16.8% |
| Total | 137 | 100.0% |
Internet Access in Nashua
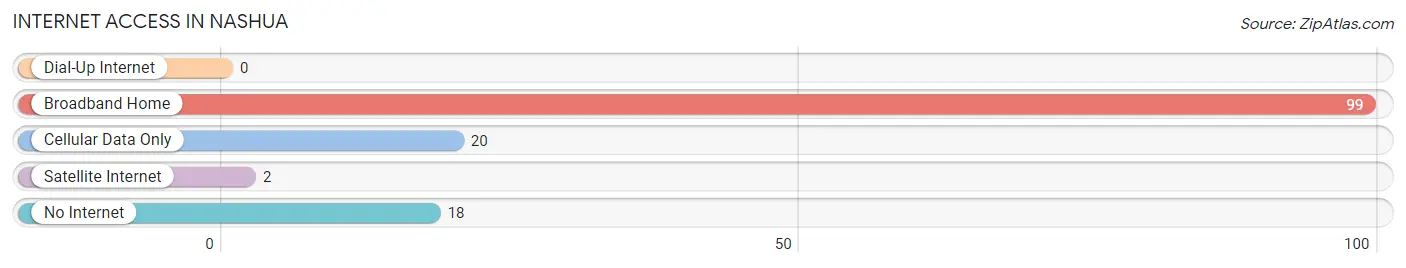
| Internet Type | # Households | % Households |
| Dial-Up Internet | 0 | 0.0% |
| Broadband Home | 99 | 72.3% |
| Cellular Data Only | 20 | 14.6% |
| Satellite Internet | 2 | 1.5% |
| No Internet | 18 | 13.1% |
| Total | 137 | 100.0% |
Nashua Summary
Nashua, Montana is a small town located in the western part of the state, near the border with Idaho. It is situated in the Flathead Valley, a region of the Rocky Mountains known for its stunning scenery and abundant wildlife. The town is home to just over 500 people, and is the county seat of Flathead County.
History
Nashua was founded in 1883 by a group of settlers from the Midwest. The town was named after Nashua, New Hampshire, the hometown of one of the settlers. The town quickly grew, and by the early 1900s, it had become a bustling center of commerce and industry. The town was home to several sawmills, a flour mill, a creamery, and a number of other businesses.
In the early 1900s, Nashua was also home to a large Chinese population. The Chinese immigrants had come to the area to work in the mines and on the railroads. The Chinese community was a vibrant part of the town, and the Chinese New Year was celebrated with great enthusiasm.
Geography
Nashua is located in the Flathead Valley, a region of the Rocky Mountains. The town is situated at an elevation of 3,400 feet, and is surrounded by mountains and forests. The Flathead River runs through the town, and the nearby Flathead Lake is the largest natural freshwater lake in the western United States.
The climate in Nashua is mild and temperate. Summers are warm and dry, while winters are cold and snowy. The average annual temperature is around 45 degrees Fahrenheit.
Economy
Nashua’s economy is largely based on agriculture and tourism. The town is home to several farms, and the surrounding area is known for its production of hay, wheat, and other crops. The town is also a popular tourist destination, and is home to several resorts and campgrounds.
The town is also home to several small businesses, including restaurants, shops, and a grocery store. The town is served by the Flathead Valley Community College, which offers a variety of educational programs.
Demographics
As of the 2010 census, Nashua had a population of 517 people. The racial makeup of the town was 95.3% White, 0.6% Native American, 0.2% Asian, 0.2% from other races, and 3.7% from two or more races. The median household income was $37,500, and the median age was 44.
Nashua is a small, close-knit community. The town is home to several churches, and the local school district serves the town and the surrounding area. The town is also home to a number of parks and recreational areas, including the Flathead National Forest and the Flathead River.
Common Questions
What is Per Capita Income in Nashua?
Per Capita income in Nashua is $30,327.
What is the Median Family Income in Nashua?
Median Family Income in Nashua is $69,375.
What is the Median Household income in Nashua?
Median Household Income in Nashua is $53,750.
What is Income or Wage Gap in Nashua?
Income or Wage Gap in Nashua is 11.0%.
Women in Nashua earn 89.0 cents for every dollar earned by a man.
What is Inequality or Gini Index in Nashua?
Inequality or Gini Index in Nashua is 0.41.
What is the Total Population of Nashua?
Total Population of Nashua is 314.
What is the Total Male Population of Nashua?
Total Male Population of Nashua is 169.
What is the Total Female Population of Nashua?
Total Female Population of Nashua is 145.
What is the Ratio of Males per 100 Females in Nashua?
There are 116.55 Males per 100 Females in Nashua.
What is the Ratio of Females per 100 Males in Nashua?
There are 85.80 Females per 100 Males in Nashua.
What is the Median Population Age in Nashua?
Median Population Age in Nashua is 45.6 Years.
What is the Average Family Size in Nashua
Average Family Size in Nashua is 3.6 People.
What is the Average Household Size in Nashua
Average Household Size in Nashua is 2.3 People.
How Large is the Labor Force in Nashua?
There are 121 People in the Labor Forcein in Nashua.
What is the Percentage of People in the Labor Force in Nashua?
47.1% of People are in the Labor Force in Nashua.
What is the Unemployment Rate in Nashua?
Unemployment Rate in Nashua is 10.7%.