Poplar, MT Map & Demographics
Poplar Map
Poplar Overview
$18,848
PER CAPITA INCOME
$65,625
AVG FAMILY INCOME
$44,712
AVG HOUSEHOLD INCOME
24.5%
WAGE / INCOME GAP [ % ]
75.5¢/ $1
WAGE / INCOME GAP [ $ ]
$7,144
FAMILY INCOME DEFICIT
0.46
INEQUALITY / GINI INDEX
758
TOTAL POPULATION
382
MALE POPULATION
376
FEMALE POPULATION
101.60
MALES / 100 FEMALES
98.43
FEMALES / 100 MALES
28.9
MEDIAN AGE
4.1
AVG FAMILY SIZE
3.1
AVG HOUSEHOLD SIZE
222
LABOR FORCE [ PEOPLE ]
37.1%
PERCENT IN LABOR FORCE
2.7%
UNEMPLOYMENT RATE
Poplar Zip Codes
Poplar Area Codes
Income in Poplar
Income Overview in Poplar
Per Capita Income in Poplar is $18,848, while median incomes of families and households are $65,625 and $44,712 respectively.
| Characteristic | Number | Measure |
| Per Capita Income | 758 | $18,848 |
| Median Family Income | 149 | $65,625 |
| Mean Family Income | 149 | $65,831 |
| Median Household Income | 241 | $44,712 |
| Mean Household Income | 241 | $54,333 |
| Income Deficit | 149 | $7,144 |
| Wage / Income Gap (%) | 758 | 24.50% |
| Wage / Income Gap ($) | 758 | 75.50¢ per $1 |
| Gini / Inequality Index | 758 | 0.46 |
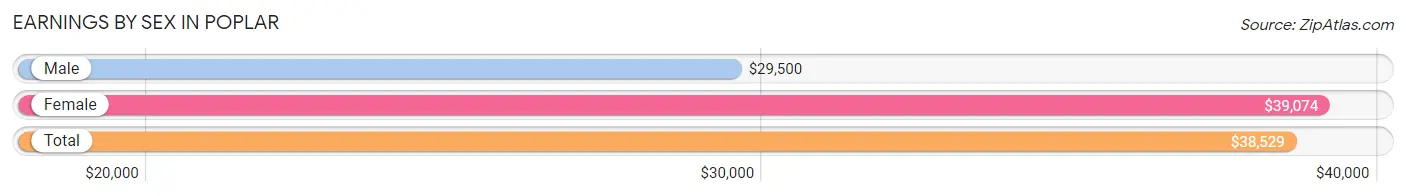
Earnings by Sex in Poplar
Average Earnings in Poplar are $38,529, $29,500 for men and $39,074 for women, a difference of 24.5%.
| Sex | Number | Average Earnings |
| Male | 116 (49.6%) | $29,500 |
| Female | 118 (50.4%) | $39,074 |
| Total | 234 (100.0%) | $38,529 |
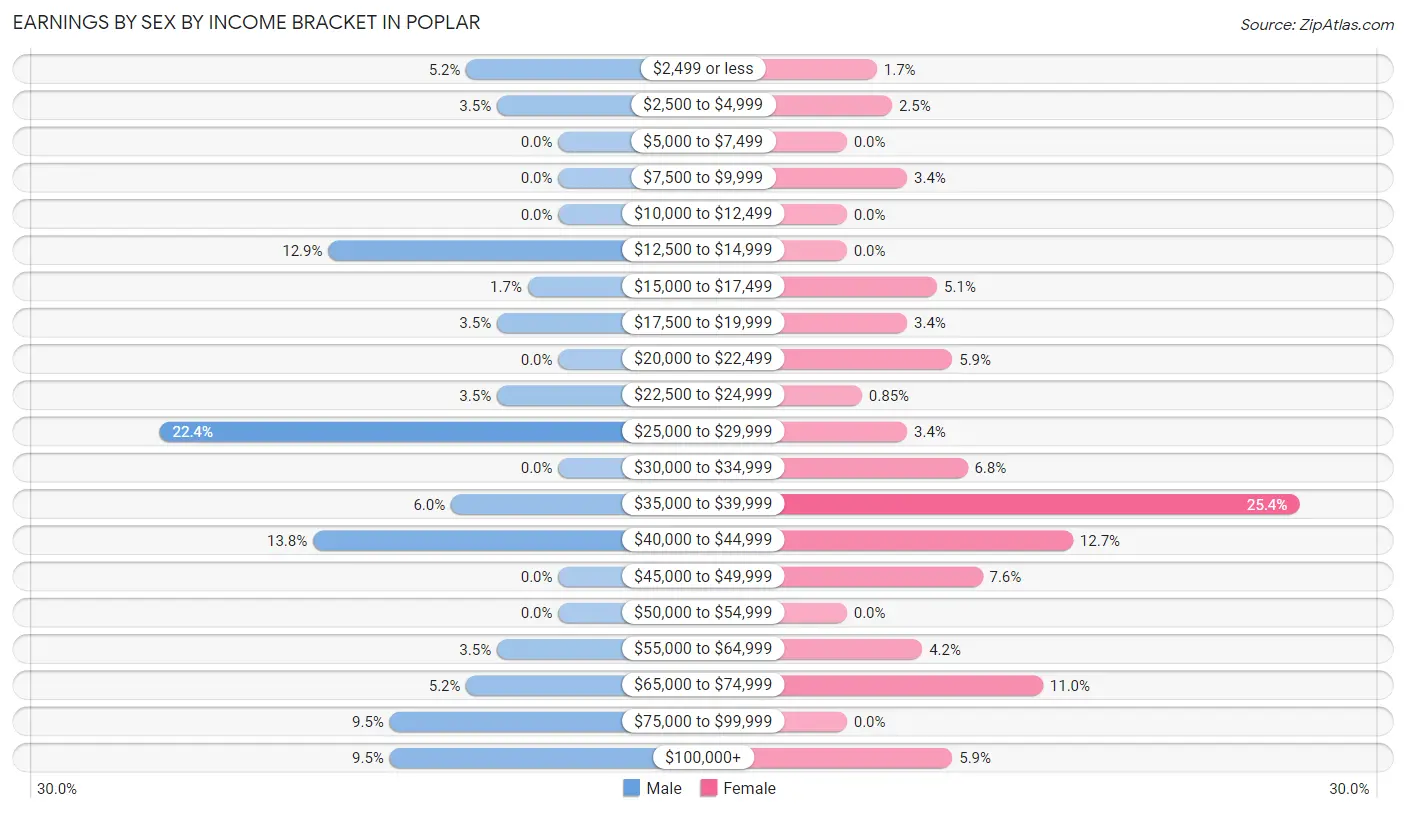
Earnings by Sex by Income Bracket in Poplar
The most common earnings brackets in Poplar are $25,000 to $29,999 for men (26 | 22.4%) and $35,000 to $39,999 for women (30 | 25.4%).
| Income | Male | Female |
| $2,499 or less | 6 (5.2%) | 2 (1.7%) |
| $2,500 to $4,999 | 4 (3.5%) | 3 (2.5%) |
| $5,000 to $7,499 | 0 (0.0%) | 0 (0.0%) |
| $7,500 to $9,999 | 0 (0.0%) | 4 (3.4%) |
| $10,000 to $12,499 | 0 (0.0%) | 0 (0.0%) |
| $12,500 to $14,999 | 15 (12.9%) | 0 (0.0%) |
| $15,000 to $17,499 | 2 (1.7%) | 6 (5.1%) |
| $17,500 to $19,999 | 4 (3.5%) | 4 (3.4%) |
| $20,000 to $22,499 | 0 (0.0%) | 7 (5.9%) |
| $22,500 to $24,999 | 4 (3.5%) | 1 (0.9%) |
| $25,000 to $29,999 | 26 (22.4%) | 4 (3.4%) |
| $30,000 to $34,999 | 0 (0.0%) | 8 (6.8%) |
| $35,000 to $39,999 | 7 (6.0%) | 30 (25.4%) |
| $40,000 to $44,999 | 16 (13.8%) | 15 (12.7%) |
| $45,000 to $49,999 | 0 (0.0%) | 9 (7.6%) |
| $50,000 to $54,999 | 0 (0.0%) | 0 (0.0%) |
| $55,000 to $64,999 | 4 (3.5%) | 5 (4.2%) |
| $65,000 to $74,999 | 6 (5.2%) | 13 (11.0%) |
| $75,000 to $99,999 | 11 (9.5%) | 0 (0.0%) |
| $100,000+ | 11 (9.5%) | 7 (5.9%) |
| Total | 116 (100.0%) | 118 (100.0%) |
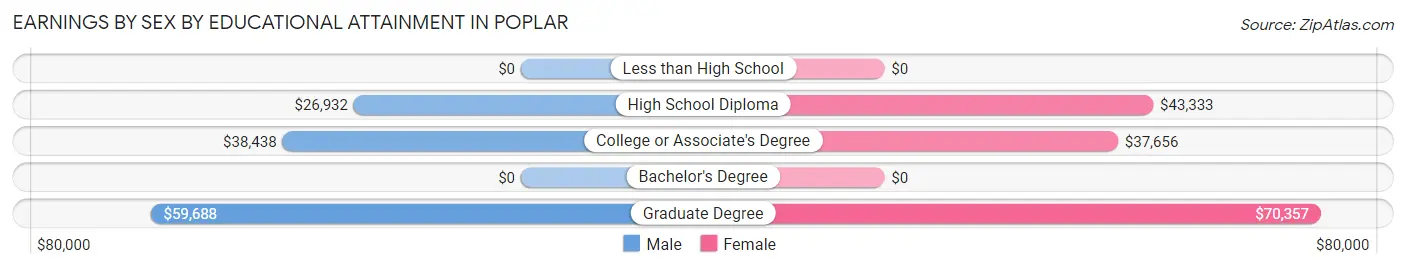
Earnings by Sex by Educational Attainment in Poplar
Average earnings in Poplar are $29,500 for men and $42,083 for women, a difference of 29.9%. Men with an educational attainment of graduate degree enjoy the highest average annual earnings of $59,688, while those with high school diploma education earn the least with $26,932. Women with an educational attainment of graduate degree earn the most with the average annual earnings of $70,357, while those with college or associate's degree education have the smallest earnings of $37,656.
| Educational Attainment | Male Income | Female Income |
| Less than High School | - | - |
| High School Diploma | $26,932 | $43,333 |
| College or Associate's Degree | $38,438 | $37,656 |
| Bachelor's Degree | - | - |
| Graduate Degree | $59,688 | $70,357 |
| Total | $29,500 | $42,083 |
Family Income in Poplar
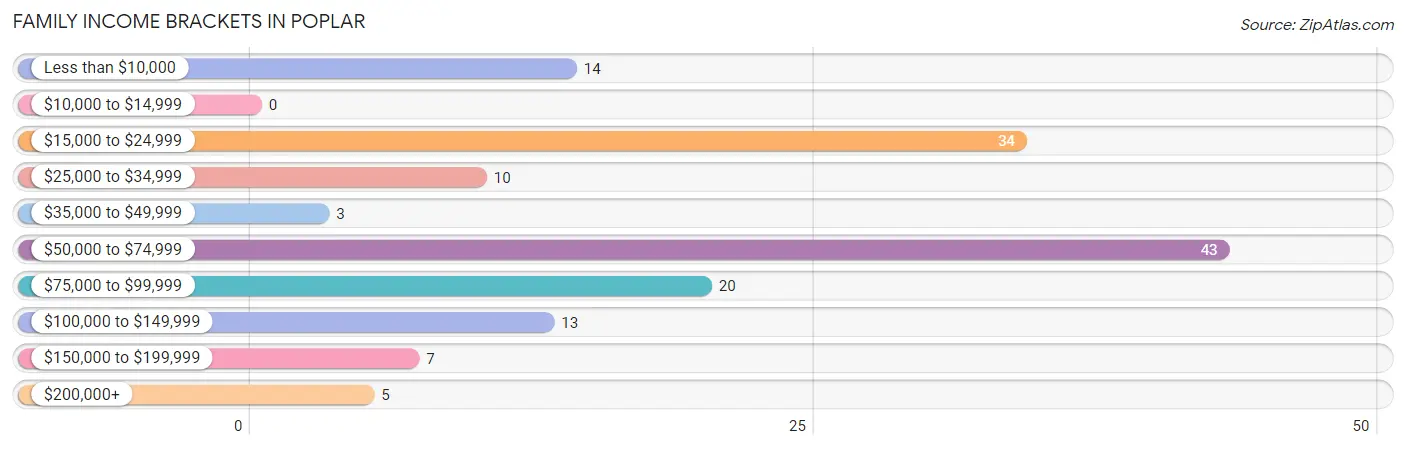
Family Income Brackets in Poplar
According to the Poplar family income data, there are 43 families falling into the $50,000 to $74,999 income range, which is the most common income bracket and makes up 28.9% of all families.
| Income Bracket | # Families | % Families |
| Less than $10,000 | 14 | 9.4% |
| $10,000 to $14,999 | 0 | 0.0% |
| $15,000 to $24,999 | 34 | 22.8% |
| $25,000 to $34,999 | 10 | 6.7% |
| $35,000 to $49,999 | 3 | 2.0% |
| $50,000 to $74,999 | 43 | 28.9% |
| $75,000 to $99,999 | 20 | 13.4% |
| $100,000 to $149,999 | 13 | 8.7% |
| $150,000 to $199,999 | 7 | 4.7% |
| $200,000+ | 5 | 3.4% |
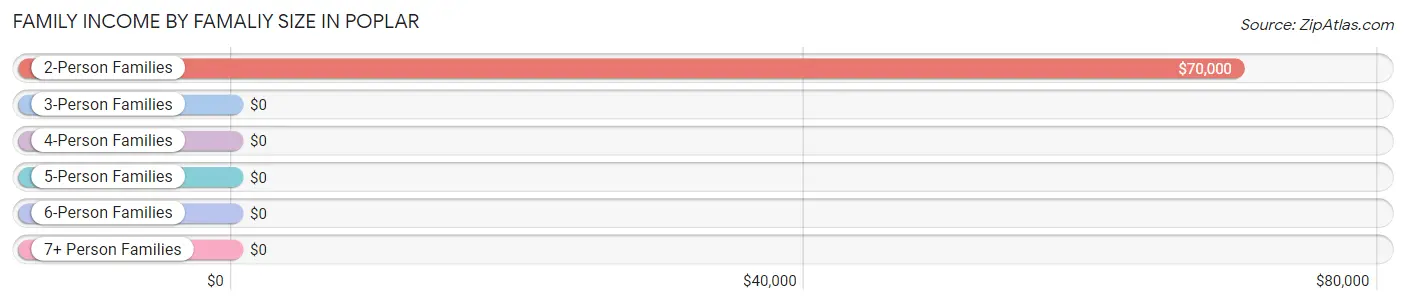
Family Income by Famaliy Size in Poplar
2-person families (56 | 37.6%) account for the highest median family income in Poplar with $70,000 per family, while 2-person families (56 | 37.6%) have the highest median income of $35,000 per family member.
| Income Bracket | # Families | Median Income |
| 2-Person Families | 56 (37.6%) | $70,000 |
| 3-Person Families | 67 (45.0%) | $0 |
| 4-Person Families | 14 (9.4%) | $0 |
| 5-Person Families | 5 (3.4%) | $0 |
| 6-Person Families | 3 (2.0%) | $0 |
| 7+ Person Families | 4 (2.7%) | $0 |
| Total | 149 (100.0%) | $65,625 |
Family Income by Number of Earners in Poplar
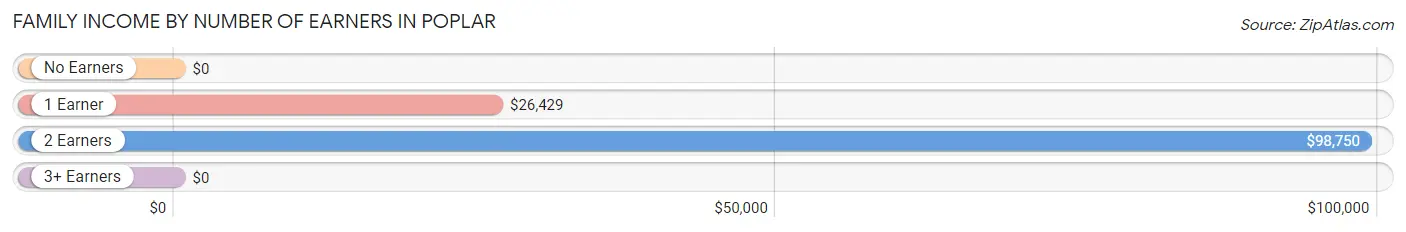
| Number of Earners | # Families | Median Income |
| No Earners | 61 (40.9%) | $0 |
| 1 Earner | 36 (24.2%) | $26,429 |
| 2 Earners | 47 (31.5%) | $98,750 |
| 3+ Earners | 5 (3.4%) | $0 |
| Total | 149 (100.0%) | $65,625 |
Household Income in Poplar
Household Income Brackets in Poplar
With 60 households falling in the category, the $50,000 to $74,999 income range is the most frequent in Poplar, accounting for 24.9% of all households. In contrast, only 1 households (0.4%) fall into the $10,000 to $14,999 income bracket, making it the least populous group.
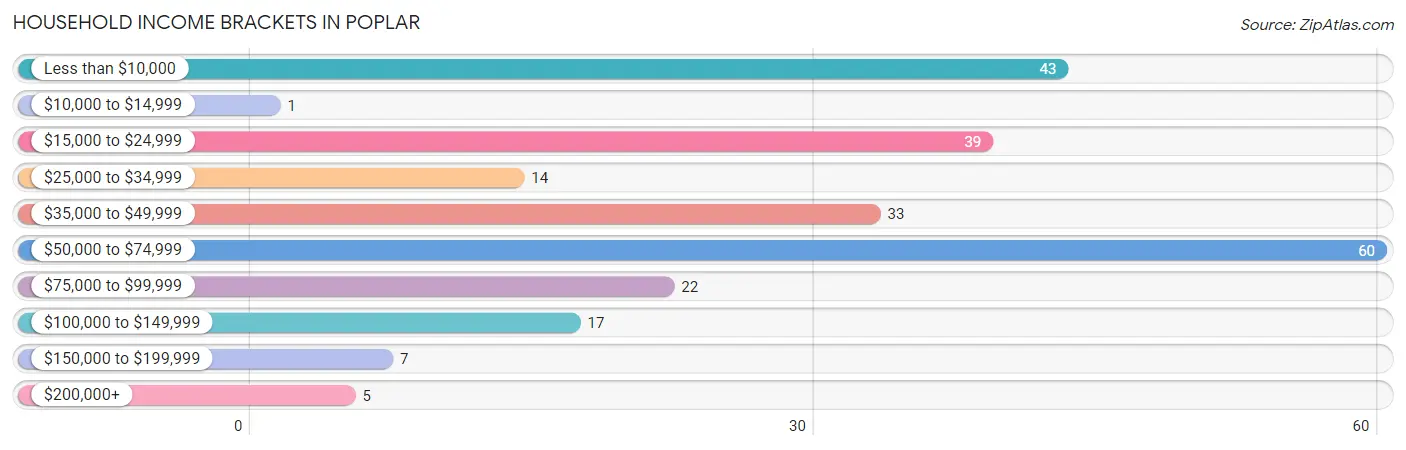
| Income Bracket | # Households | % Households |
| Less than $10,000 | 43 | 17.8% |
| $10,000 to $14,999 | 1 | 0.4% |
| $15,000 to $24,999 | 39 | 16.2% |
| $25,000 to $34,999 | 14 | 5.8% |
| $35,000 to $49,999 | 33 | 13.7% |
| $50,000 to $74,999 | 60 | 24.9% |
| $75,000 to $99,999 | 22 | 9.1% |
| $100,000 to $149,999 | 17 | 7.1% |
| $150,000 to $199,999 | 7 | 2.9% |
| $200,000+ | 5 | 2.1% |
Household Income by Householder Age in Poplar
The median household income in Poplar is $44,712, with the highest median household income of $70,521 found in the 65+ years age bracket for the primary householder. A total of 78 households (32.4%) fall into this category. Meanwhile, the 15 to 24 years age bracket for the primary householder has the lowest median household income of $0, with 3 households (1.2%) in this group.
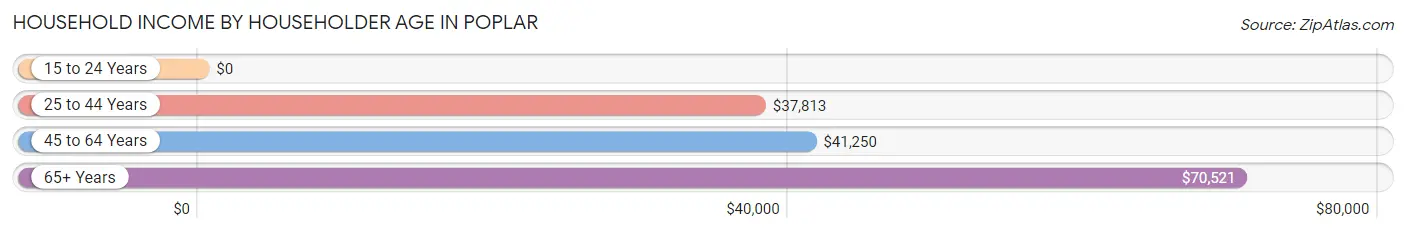
| Income Bracket | # Households | Median Income |
| 15 to 24 Years | 3 (1.2%) | $0 |
| 25 to 44 Years | 55 (22.8%) | $37,813 |
| 45 to 64 Years | 105 (43.6%) | $41,250 |
| 65+ Years | 78 (32.4%) | $70,521 |
| Total | 241 (100.0%) | $44,712 |
Poverty in Poplar
Income Below Poverty by Sex and Age in Poplar
With 31.1% poverty level for males and 37.2% for females among the residents of Poplar, under 5 year old males and 35 to 44 year old females are the most vulnerable to poverty, with 22 males (100.0%) and 19 females (76.0%) in their respective age groups living below the poverty level.
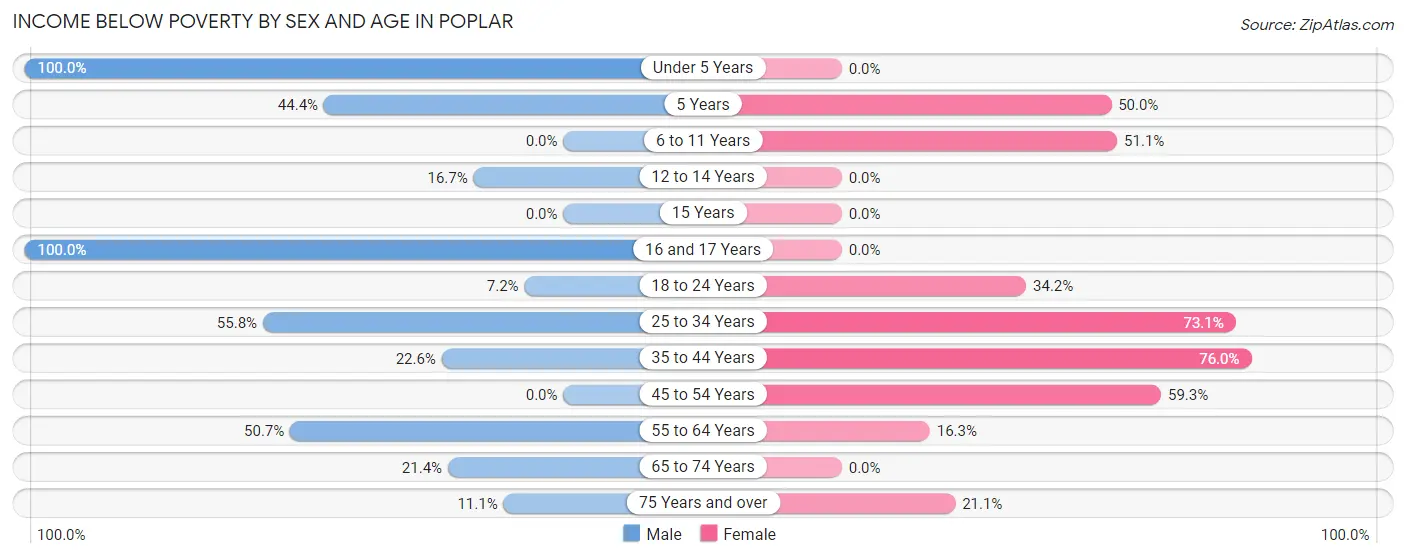
| Age Bracket | Male | Female |
| Under 5 Years | 22 (100.0%) | 0 (0.0%) |
| 5 Years | 4 (44.4%) | 3 (50.0%) |
| 6 to 11 Years | 0 (0.0%) | 23 (51.1%) |
| 12 to 14 Years | 4 (16.7%) | 0 (0.0%) |
| 15 Years | 0 (0.0%) | 0 (0.0%) |
| 16 and 17 Years | 7 (100.0%) | 0 (0.0%) |
| 18 to 24 Years | 6 (7.2%) | 13 (34.2%) |
| 25 to 34 Years | 29 (55.8%) | 38 (73.1%) |
| 35 to 44 Years | 7 (22.6%) | 19 (76.0%) |
| 45 to 54 Years | 0 (0.0%) | 32 (59.3%) |
| 55 to 64 Years | 35 (50.7%) | 8 (16.3%) |
| 65 to 74 Years | 3 (21.4%) | 0 (0.0%) |
| 75 Years and over | 2 (11.1%) | 4 (21.0%) |
| Total | 119 (31.1%) | 140 (37.2%) |
Income Above Poverty by Sex and Age in Poplar
According to the poverty statistics in Poplar, males aged 6 to 11 years and females aged under 5 years are the age groups that are most secure financially, with 100.0% of males and 100.0% of females in these age groups living above the poverty line.
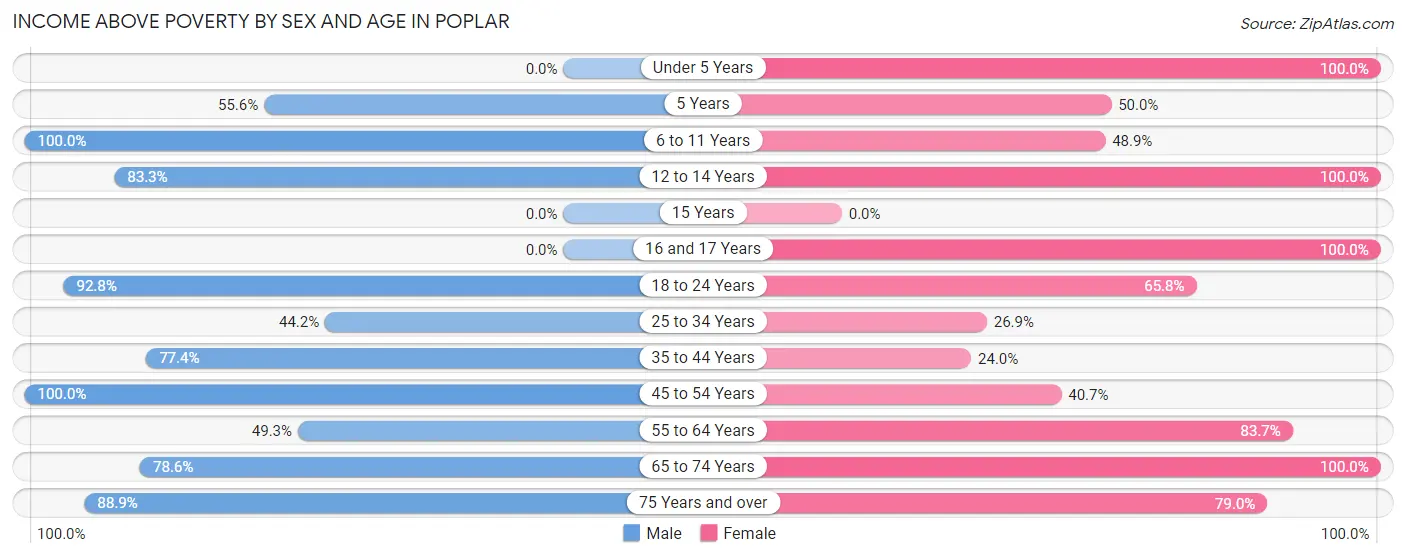
| Age Bracket | Male | Female |
| Under 5 Years | 0 (0.0%) | 22 (100.0%) |
| 5 Years | 5 (55.6%) | 3 (50.0%) |
| 6 to 11 Years | 27 (100.0%) | 22 (48.9%) |
| 12 to 14 Years | 20 (83.3%) | 4 (100.0%) |
| 15 Years | 0 (0.0%) | 0 (0.0%) |
| 16 and 17 Years | 0 (0.0%) | 28 (100.0%) |
| 18 to 24 Years | 77 (92.8%) | 25 (65.8%) |
| 25 to 34 Years | 23 (44.2%) | 14 (26.9%) |
| 35 to 44 Years | 24 (77.4%) | 6 (24.0%) |
| 45 to 54 Years | 26 (100.0%) | 22 (40.7%) |
| 55 to 64 Years | 34 (49.3%) | 41 (83.7%) |
| 65 to 74 Years | 11 (78.6%) | 34 (100.0%) |
| 75 Years and over | 16 (88.9%) | 15 (78.9%) |
| Total | 263 (68.9%) | 236 (62.8%) |
Income Below Poverty Among Married-Couple Families in Poplar
The poverty statistics for married-couple families in Poplar show that 28.2% or 22 of the total 78 families live below the poverty line. Families with 1 or 2 children have the highest poverty rate of 64.5%, comprising of 20 families. On the other hand, families with 5 or more children have the lowest poverty rate of 0.0%, which includes 0 families.
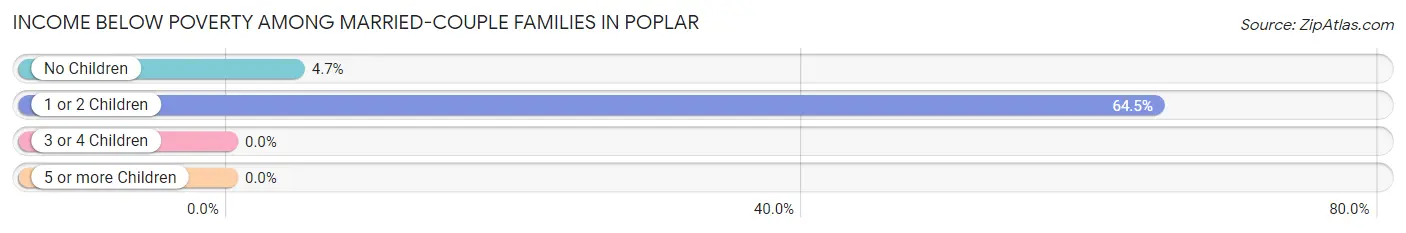
| Children | Above Poverty | Below Poverty |
| No Children | 41 (95.4%) | 2 (4.6%) |
| 1 or 2 Children | 11 (35.5%) | 20 (64.5%) |
| 3 or 4 Children | 0 (0.0%) | 0 (0.0%) |
| 5 or more Children | 4 (100.0%) | 0 (0.0%) |
| Total | 56 (71.8%) | 22 (28.2%) |
Income Below Poverty Among Single-Parent Households in Poplar
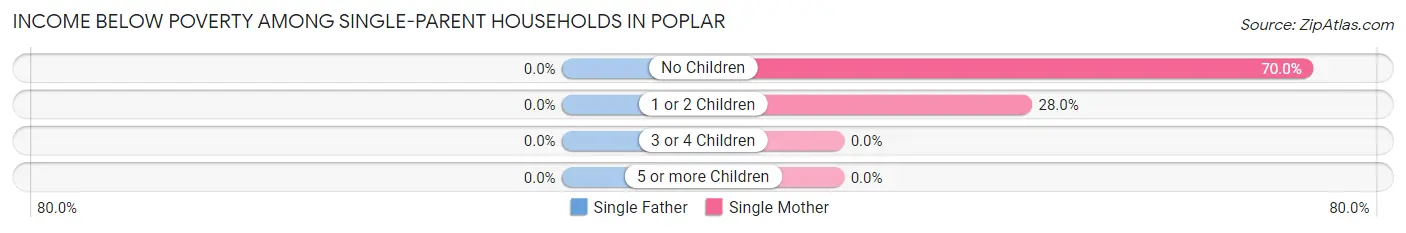
| Children | Single Father | Single Mother |
| No Children | 0 (0.0%) | 7 (70.0%) |
| 1 or 2 Children | 0 (0.0%) | 14 (28.0%) |
| 3 or 4 Children | 0 (0.0%) | 0 (0.0%) |
| 5 or more Children | 0 (0.0%) | 0 (0.0%) |
| Total | 0 (0.0%) | 21 (35.0%) |
Income Below Poverty Among Married-Couple vs Single-Parent Households in Poplar
The poverty data for Poplar shows that 22 of the married-couple family households (28.2%) and 21 of the single-parent households (29.6%) are living below the poverty level. Within the married-couple family households, those with 1 or 2 children have the highest poverty rate, with 20 households (64.5%) falling below the poverty line. Among the single-parent households, those with no children have the highest poverty rate, with 7 household (46.7%) living below poverty.
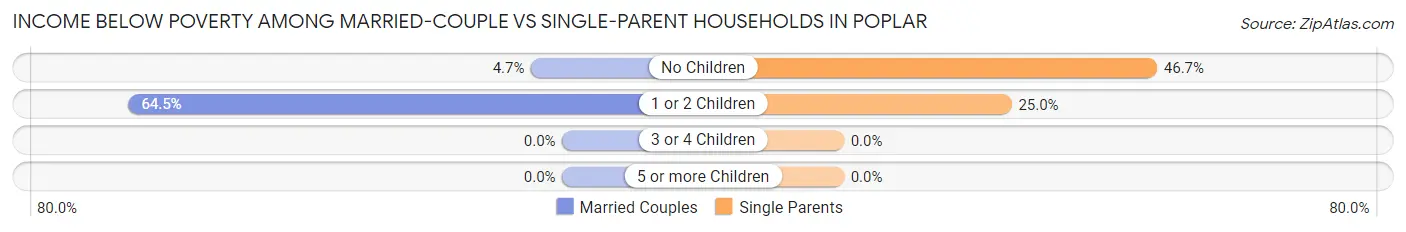
| Children | Married-Couple Families | Single-Parent Households |
| No Children | 2 (4.6%) | 7 (46.7%) |
| 1 or 2 Children | 20 (64.5%) | 14 (25.0%) |
| 3 or 4 Children | 0 (0.0%) | 0 (0.0%) |
| 5 or more Children | 0 (0.0%) | 0 (0.0%) |
| Total | 22 (28.2%) | 21 (29.6%) |
Race in Poplar
The most populous races in Poplar are Native / Alaskan (609 | 80.3%), White / Caucasian (130 | 17.2%), and Hispanic or Latino (33 | 4.3%).
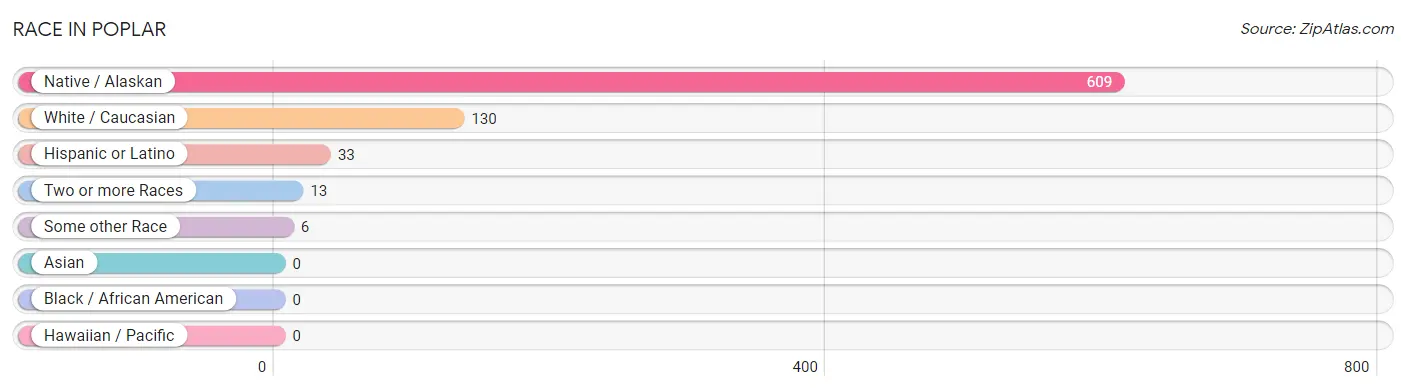
| Race | # Population | % Population |
| Asian | 0 | 0.0% |
| Black / African American | 0 | 0.0% |
| Hawaiian / Pacific | 0 | 0.0% |
| Hispanic or Latino | 33 | 4.3% |
| Native / Alaskan | 609 | 80.3% |
| White / Caucasian | 130 | 17.2% |
| Two or more Races | 13 | 1.7% |
| Some other Race | 6 | 0.8% |
| Total | 758 | 100.0% |
Ancestry in Poplar
The most populous ancestries reported in Poplar are Sioux (79 | 10.4%), Norwegian (50 | 6.6%), Irish (45 | 5.9%), Chippewa (28 | 3.7%), and Arapaho (25 | 3.3%), together accounting for 29.9% of all Poplar residents.
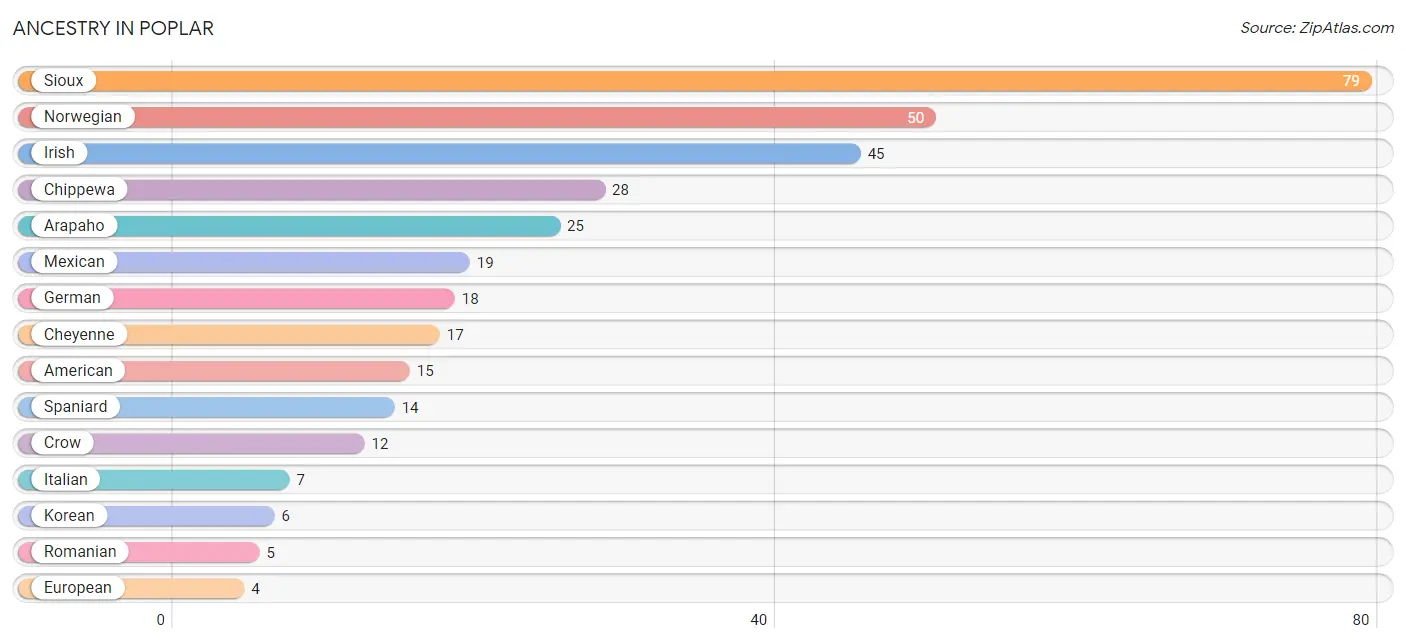
| Ancestry | # Population | % Population |
| American | 15 | 2.0% |
| Arapaho | 25 | 3.3% |
| Cherokee | 3 | 0.4% |
| Cheyenne | 17 | 2.2% |
| Chippewa | 28 | 3.7% |
| Crow | 12 | 1.6% |
| Czech | 3 | 0.4% |
| Danish | 3 | 0.4% |
| Dutch | 1 | 0.1% |
| English | 2 | 0.3% |
| European | 4 | 0.5% |
| German | 18 | 2.4% |
| Irish | 45 | 5.9% |
| Italian | 7 | 0.9% |
| Korean | 6 | 0.8% |
| Mexican | 19 | 2.5% |
| Norwegian | 50 | 6.6% |
| Polish | 4 | 0.5% |
| Romanian | 5 | 0.7% |
| Sioux | 79 | 10.4% |
| Spaniard | 14 | 1.8% | View All 21 Rows |
Immigrants in Poplar

| Immigration Origin | # Population | % Population | View All 0 Rows |
Sex and Age in Poplar
Sex and Age in Poplar
The most populous age groups in Poplar are 20 to 24 Years (71 | 18.6%) for men and 5 to 9 Years (47 | 12.5%) for women.
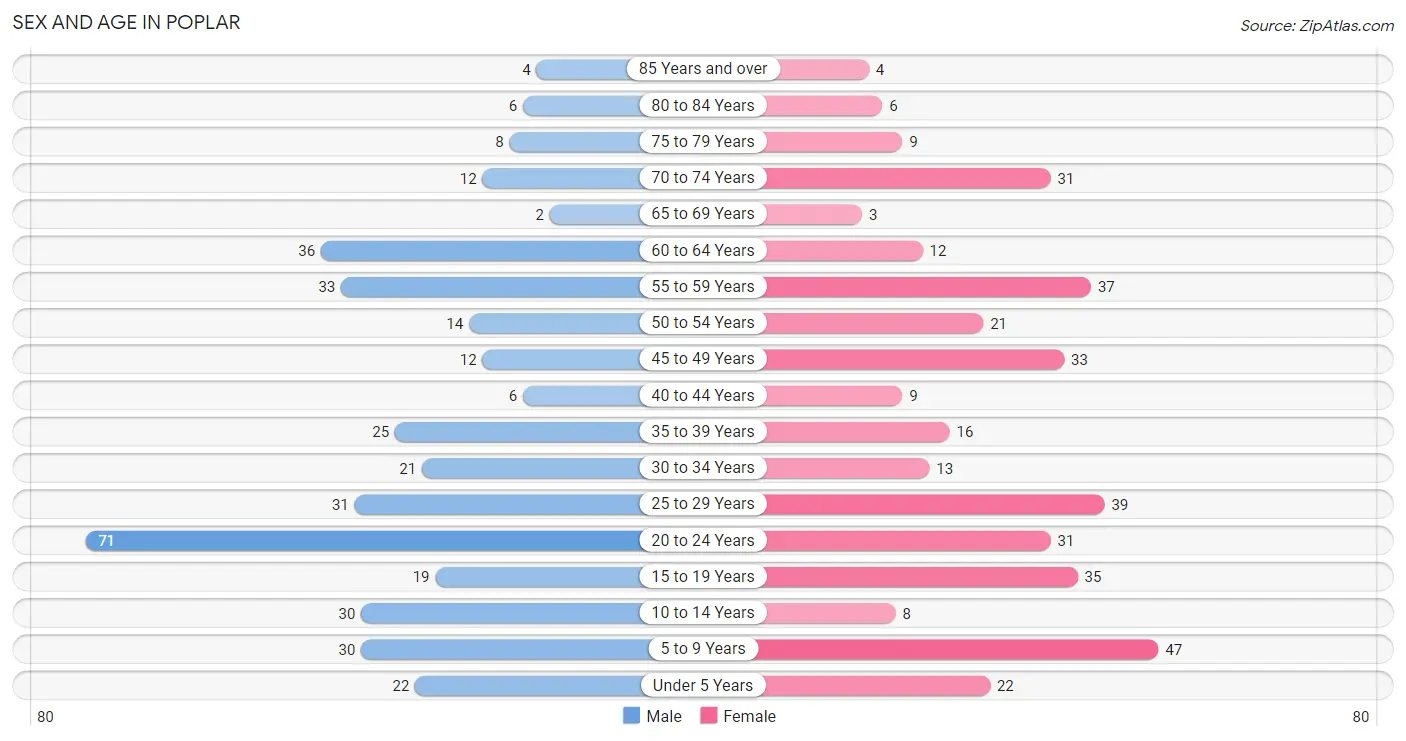
| Age Bracket | Male | Female |
| Under 5 Years | 22 (5.8%) | 22 (5.9%) |
| 5 to 9 Years | 30 (7.9%) | 47 (12.5%) |
| 10 to 14 Years | 30 (7.9%) | 8 (2.1%) |
| 15 to 19 Years | 19 (5.0%) | 35 (9.3%) |
| 20 to 24 Years | 71 (18.6%) | 31 (8.2%) |
| 25 to 29 Years | 31 (8.1%) | 39 (10.4%) |
| 30 to 34 Years | 21 (5.5%) | 13 (3.5%) |
| 35 to 39 Years | 25 (6.5%) | 16 (4.3%) |
| 40 to 44 Years | 6 (1.6%) | 9 (2.4%) |
| 45 to 49 Years | 12 (3.1%) | 33 (8.8%) |
| 50 to 54 Years | 14 (3.7%) | 21 (5.6%) |
| 55 to 59 Years | 33 (8.6%) | 37 (9.8%) |
| 60 to 64 Years | 36 (9.4%) | 12 (3.2%) |
| 65 to 69 Years | 2 (0.5%) | 3 (0.8%) |
| 70 to 74 Years | 12 (3.1%) | 31 (8.2%) |
| 75 to 79 Years | 8 (2.1%) | 9 (2.4%) |
| 80 to 84 Years | 6 (1.6%) | 6 (1.6%) |
| 85 Years and over | 4 (1.1%) | 4 (1.1%) |
| Total | 382 (100.0%) | 376 (100.0%) |
Families and Households in Poplar
Median Family Size in Poplar
The median family size in Poplar is 4.11 persons per family, with single female/mother families (60 | 40.3%) accounting for the largest median family size of 4.8 persons per family. On the other hand, single male/father families (11 | 7.4%) represent the smallest median family size with 3.45 persons per family.
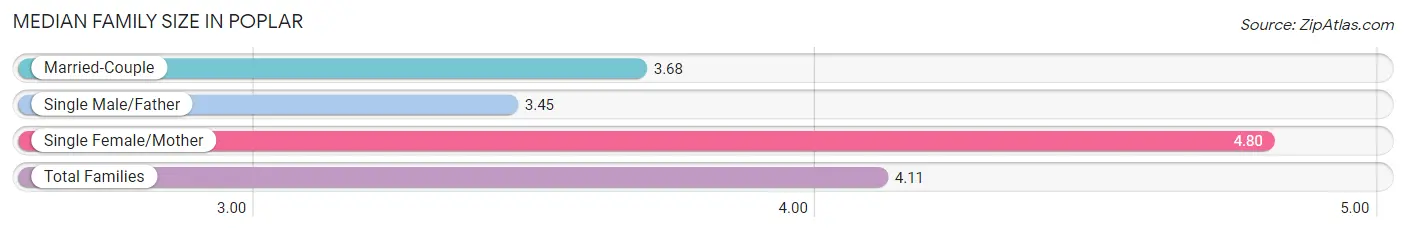
| Family Type | # Families | Family Size |
| Married-Couple | 78 (52.3%) | 3.68 |
| Single Male/Father | 11 (7.4%) | 3.45 |
| Single Female/Mother | 60 (40.3%) | 4.80 |
| Total Families | 149 (100.0%) | 4.11 |
Median Household Size in Poplar
The median household size in Poplar is 3.13 persons per household, with single female/mother households (60 | 24.9%) accounting for the largest median household size of 5.53 persons per household. non-family households (92 | 38.2%) represent the smallest median household size with 1.05 persons per household.
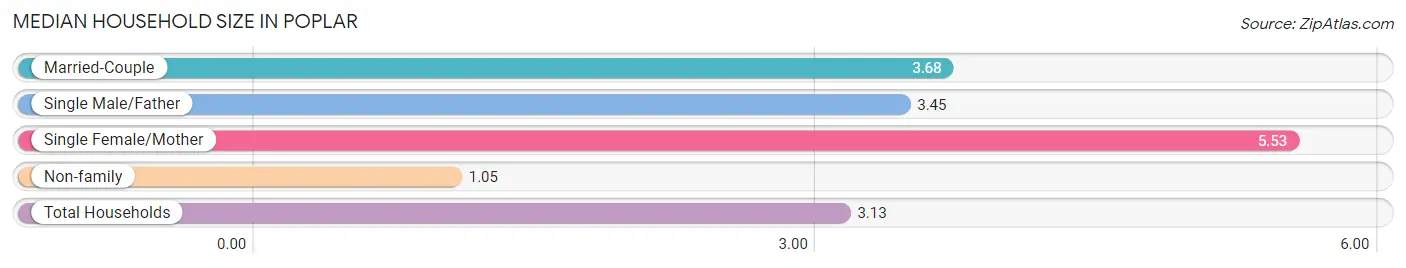
| Household Type | # Households | Household Size |
| Married-Couple | 78 (32.4%) | 3.68 |
| Single Male/Father | 11 (4.6%) | 3.45 |
| Single Female/Mother | 60 (24.9%) | 5.53 |
| Non-family | 92 (38.2%) | 1.05 |
| Total Households | 241 (100.0%) | 3.13 |
Household Size by Marriage Status in Poplar
Out of a total of 241 households in Poplar, 149 (61.8%) are family households, while 92 (38.2%) are nonfamily households. The most numerous type of family households are 3-person households, comprising 66, and the most common type of nonfamily households are 1-person households, comprising 90.
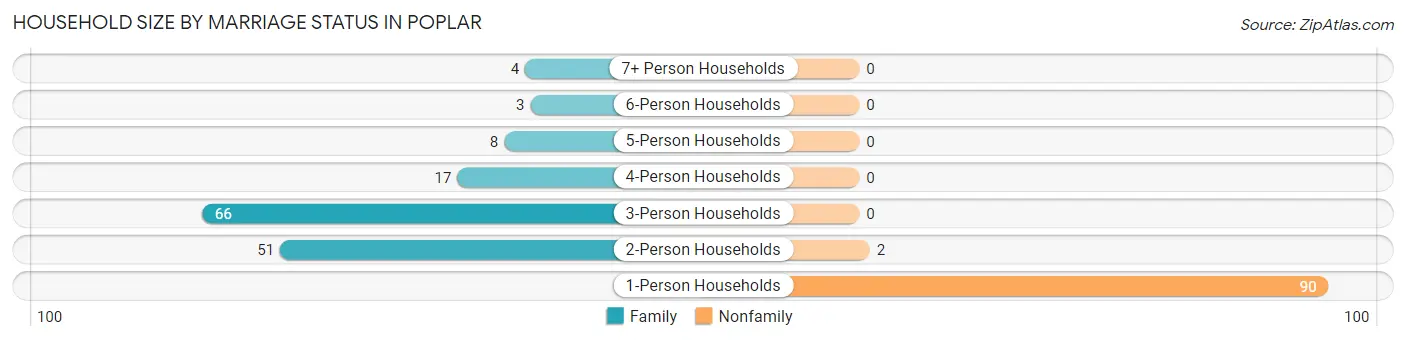
| Household Size | Family Households | Nonfamily Households |
| 1-Person Households | - | 90 (37.3%) |
| 2-Person Households | 51 (21.2%) | 2 (0.8%) |
| 3-Person Households | 66 (27.4%) | 0 (0.0%) |
| 4-Person Households | 17 (7.0%) | 0 (0.0%) |
| 5-Person Households | 8 (3.3%) | 0 (0.0%) |
| 6-Person Households | 3 (1.2%) | 0 (0.0%) |
| 7+ Person Households | 4 (1.7%) | 0 (0.0%) |
| Total | 149 (61.8%) | 92 (38.2%) |
Female Fertility in Poplar
Fertility by Age in Poplar
| Age Bracket | Women with Births | Births / 1,000 Women |
| 15 to 19 years | 0 (0.0%) | 0.0 |
| 20 to 34 years | 0 (0.0%) | 0.0 |
| 35 to 50 years | 0 (0.0%) | 0.0 |
| Total | 0 (0.0%) | 0.0 |
Fertility by Age by Marriage Status in Poplar
| Age Bracket | Married | Unmarried |
| 15 to 19 years | 0 (0.0%) | 0 (0.0%) |
| 20 to 34 years | 0 (0.0%) | 0 (0.0%) |
| 35 to 50 years | 0 (0.0%) | 0 (0.0%) |
| Total | 0 (0.0%) | 0 (0.0%) |
Fertility by Education in Poplar
| Educational Attainment | Women with Births | Births / 1,000 Women |
| Less than High School | 0 (0.0%) | 0.0 |
| High School Diploma | 0 (0.0%) | 0.0 |
| College or Associate's Degree | 0 (0.0%) | 0.0 |
| Bachelor's Degree | 0 (0.0%) | 0.0 |
| Graduate Degree | 0 (0.0%) | 0.0 |
| Total | 0 (0.0%) | 0.0 |
Fertility by Education by Marriage Status in Poplar
| Educational Attainment | Married | Unmarried |
| Less than High School | 0 (0.0%) | 0 (0.0%) |
| High School Diploma | 0 (0.0%) | 0 (0.0%) |
| College or Associate's Degree | 0 (0.0%) | 0 (0.0%) |
| Bachelor's Degree | 0 (0.0%) | 0 (0.0%) |
| Graduate Degree | 0 (0.0%) | 0 (0.0%) |
| Total | 0 (0.0%) | 0 (0.0%) |
Employment Characteristics in Poplar
Employment by Class of Employer in Poplar
Among the 216 employed individuals in Poplar, local government employees (111 | 51.4%), private company employees (44 | 20.4%), and federal government employees (28 | 13.0%) make up the most common classes of employment.
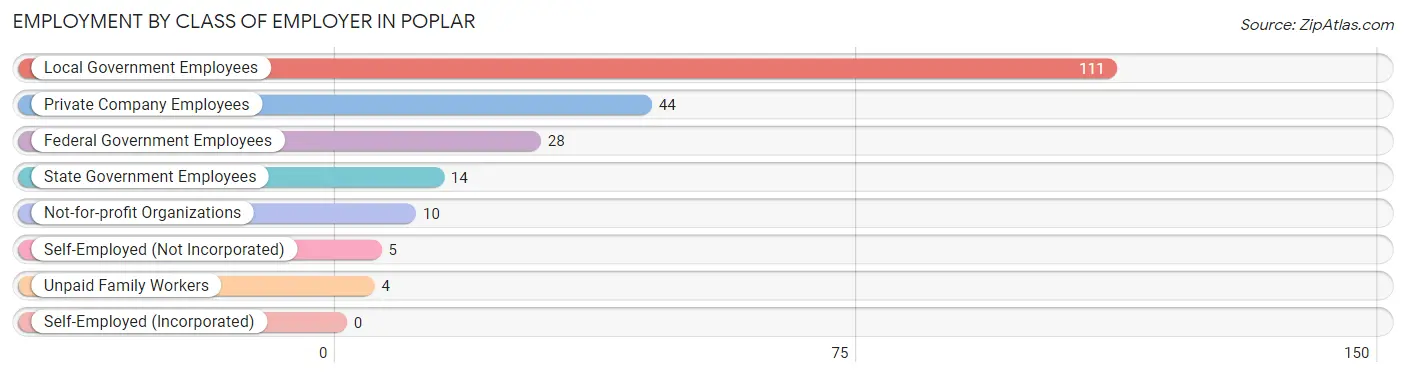
| Employer Class | # Employees | % Employees |
| Private Company Employees | 44 | 20.4% |
| Self-Employed (Incorporated) | 0 | 0.0% |
| Self-Employed (Not Incorporated) | 5 | 2.3% |
| Not-for-profit Organizations | 10 | 4.6% |
| Local Government Employees | 111 | 51.4% |
| State Government Employees | 14 | 6.5% |
| Federal Government Employees | 28 | 13.0% |
| Unpaid Family Workers | 4 | 1.8% |
| Total | 216 | 100.0% |
Employment Status by Age in Poplar
According to the labor force statistics for Poplar, out of the total population over 16 years of age (599), 37.1% or 222 individuals are in the labor force, with 2.7% or 6 of them unemployed. The age group with the highest labor force participation rate is 35 to 44 years, with 66.1% or 37 individuals in the labor force. Within the labor force, the 30 to 34 years age range has the highest percentage of unemployed individuals, with 20.0% or 3 of them being unemployed.
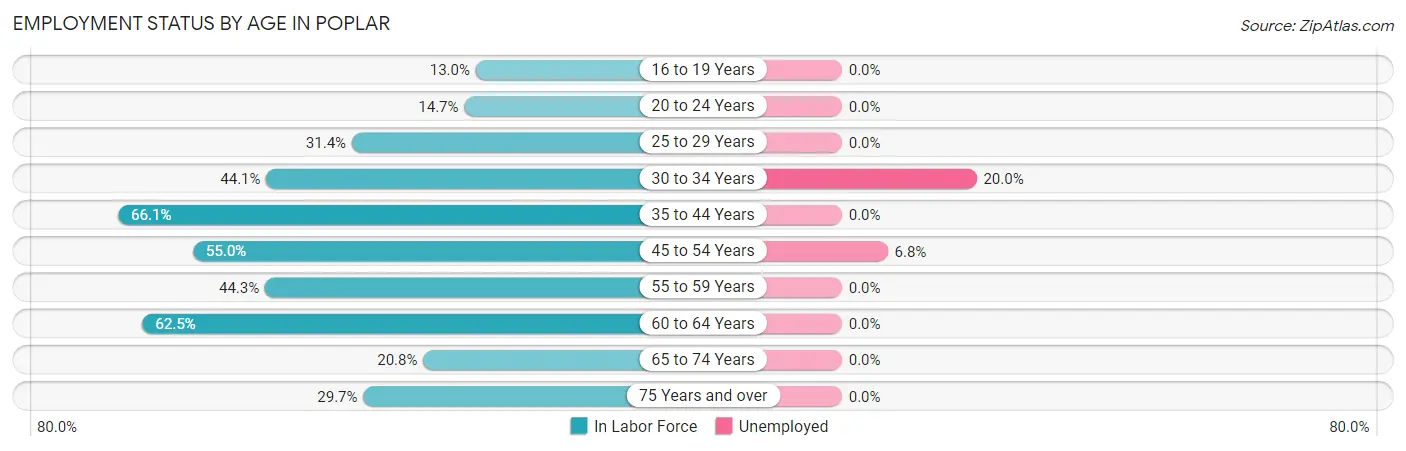
| Age Bracket | In Labor Force | Unemployed |
| 16 to 19 Years | 7 (13.0%) | 0 (0.0%) |
| 20 to 24 Years | 15 (14.7%) | 0 (0.0%) |
| 25 to 29 Years | 22 (31.4%) | 0 (0.0%) |
| 30 to 34 Years | 15 (44.1%) | 3 (20.0%) |
| 35 to 44 Years | 37 (66.1%) | 0 (0.0%) |
| 45 to 54 Years | 44 (55.0%) | 3 (6.8%) |
| 55 to 59 Years | 31 (44.3%) | 0 (0.0%) |
| 60 to 64 Years | 30 (62.5%) | 0 (0.0%) |
| 65 to 74 Years | 10 (20.8%) | 0 (0.0%) |
| 75 Years and over | 11 (29.7%) | 0 (0.0%) |
| Total | 222 (37.1%) | 6 (2.7%) |
Employment Status by Educational Attainment in Poplar
According to labor force statistics for Poplar, 50.0% of individuals (179) out of the total population between 25 and 64 years of age (358) are in the labor force, with 3.4% or 6 of them being unemployed. The group with the highest labor force participation rate are those with the educational attainment of bachelor's degree or higher, with 100.0% or 55 individuals in the labor force. Within the labor force, individuals with college / associate degree education have the highest percentage of unemployment, with 7.7% or 6 of them being unemployed.
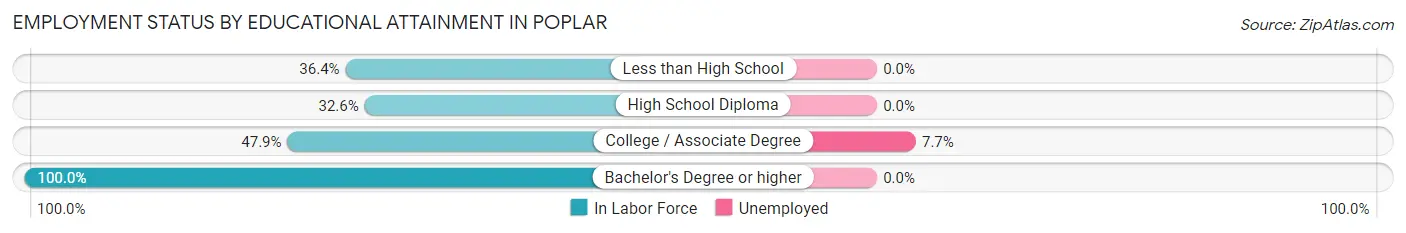
| Educational Attainment | In Labor Force | Unemployed |
| Less than High School | 4 (36.4%) | 0 (0.0%) |
| High School Diploma | 42 (32.6%) | 0 (0.0%) |
| College / Associate Degree | 78 (47.9%) | 13 (7.7%) |
| Bachelor's Degree or higher | 55 (100.0%) | 0 (0.0%) |
| Total | 179 (50.0%) | 12 (3.4%) |
Employment Occupations by Sex in Poplar
Management, Business, Science and Arts Occupations
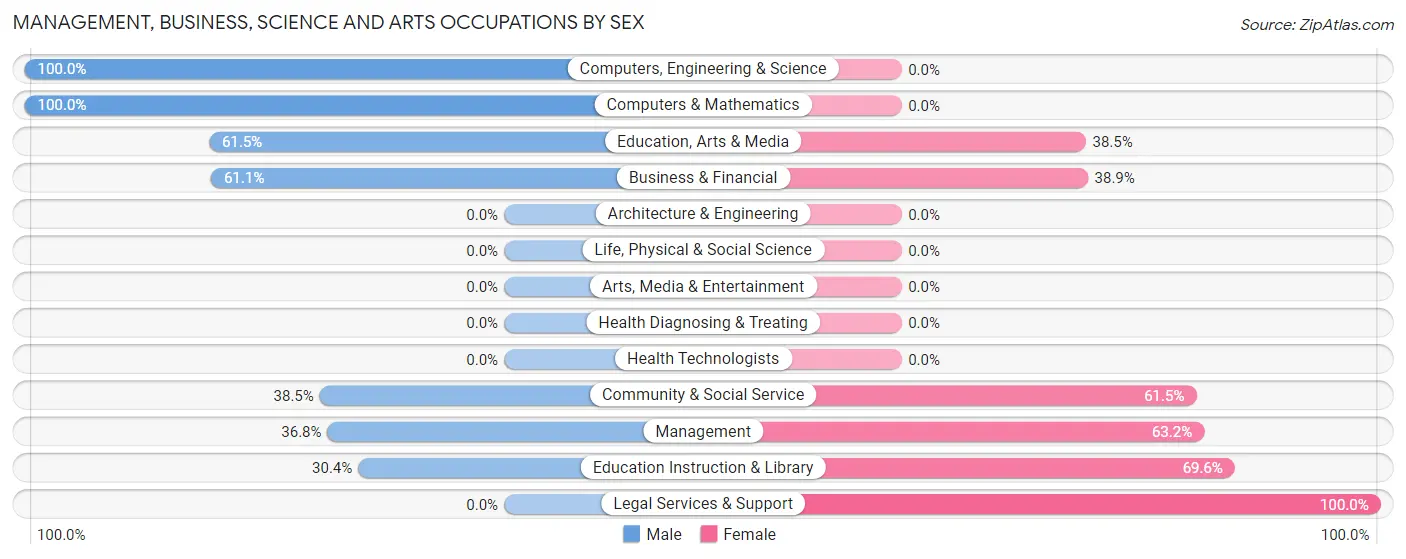
The most common Management, Business, Science and Arts occupations in Poplar are Community & Social Service (39 | 18.3%), Education Instruction & Library (23 | 10.8%), Management (19 | 8.9%), Business & Financial (18 | 8.5%), and Education, Arts & Media (13 | 6.1%).
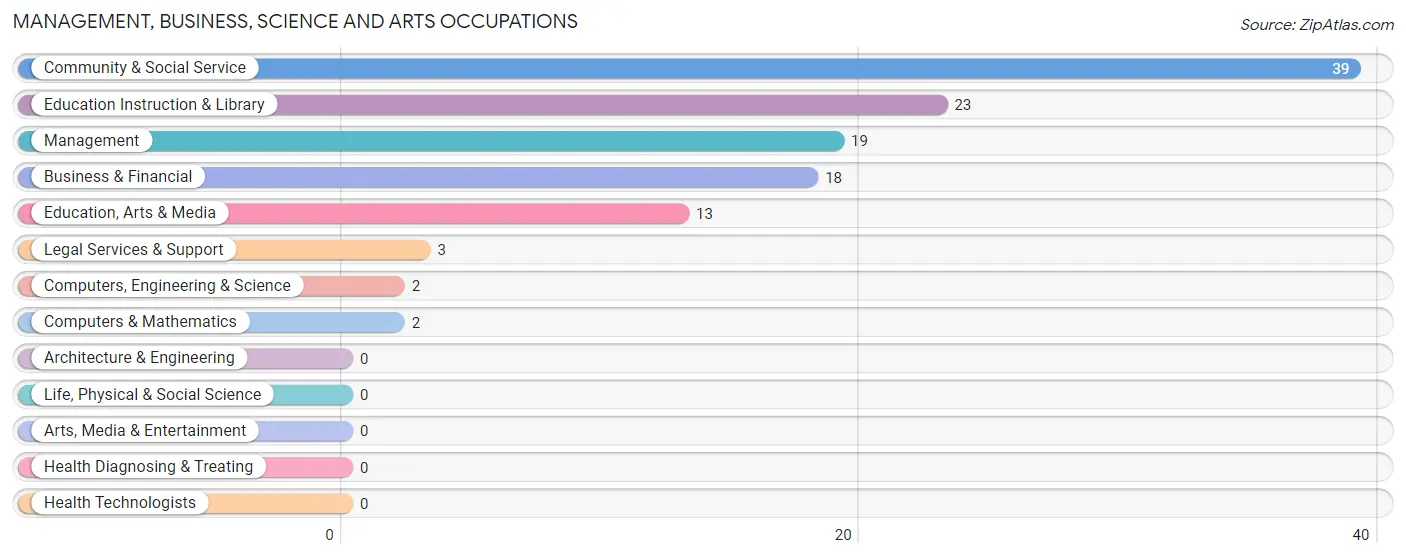
Management, Business, Science and Arts Occupations by Sex
Within the Management, Business, Science and Arts occupations in Poplar, the most male-oriented occupations are Computers, Engineering & Science (100.0%), Computers & Mathematics (100.0%), and Education, Arts & Media (61.5%), while the most female-oriented occupations are Legal Services & Support (100.0%), Education Instruction & Library (69.6%), and Management (63.2%).
| Occupation | Male | Female |
| Management | 7 (36.8%) | 12 (63.2%) |
| Business & Financial | 11 (61.1%) | 7 (38.9%) |
| Computers, Engineering & Science | 2 (100.0%) | 0 (0.0%) |
| Computers & Mathematics | 2 (100.0%) | 0 (0.0%) |
| Architecture & Engineering | 0 (0.0%) | 0 (0.0%) |
| Life, Physical & Social Science | 0 (0.0%) | 0 (0.0%) |
| Community & Social Service | 15 (38.5%) | 24 (61.5%) |
| Education, Arts & Media | 8 (61.5%) | 5 (38.5%) |
| Legal Services & Support | 0 (0.0%) | 3 (100.0%) |
| Education Instruction & Library | 7 (30.4%) | 16 (69.6%) |
| Arts, Media & Entertainment | 0 (0.0%) | 0 (0.0%) |
| Health Diagnosing & Treating | 0 (0.0%) | 0 (0.0%) |
| Health Technologists | 0 (0.0%) | 0 (0.0%) |
| Total (Category) | 35 (44.9%) | 43 (55.1%) |
| Total (Overall) | 110 (51.6%) | 103 (48.4%) |
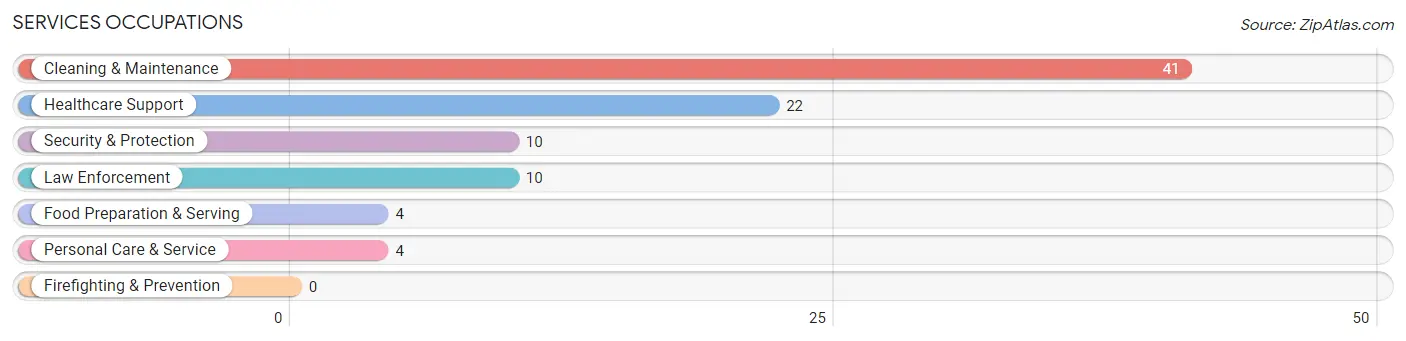
Services Occupations
The most common Services occupations in Poplar are Cleaning & Maintenance (41 | 19.3%), Healthcare Support (22 | 10.3%), Security & Protection (10 | 4.7%), Law Enforcement (10 | 4.7%), and Food Preparation & Serving (4 | 1.9%).
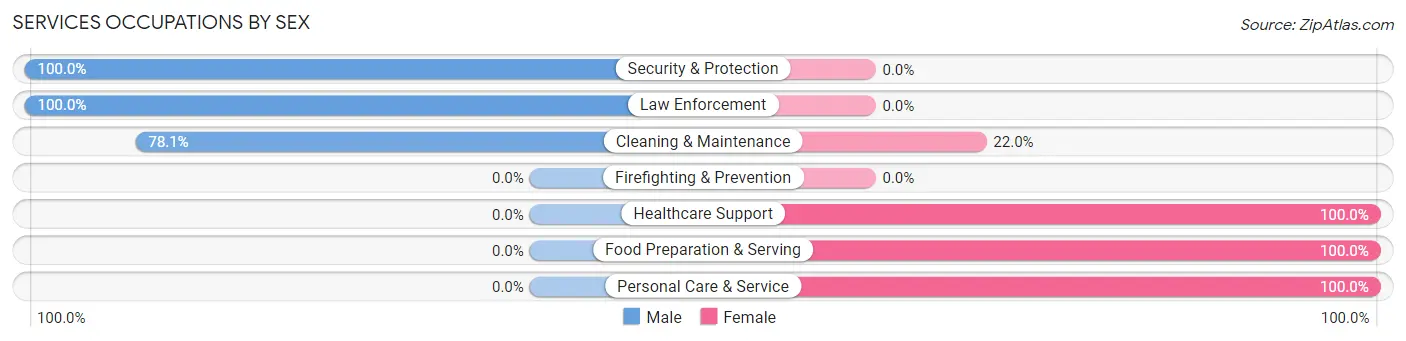
Services Occupations by Sex
Within the Services occupations in Poplar, the most male-oriented occupations are Security & Protection (100.0%), Law Enforcement (100.0%), and Cleaning & Maintenance (78.0%), while the most female-oriented occupations are Healthcare Support (100.0%), Food Preparation & Serving (100.0%), and Personal Care & Service (100.0%).
| Occupation | Male | Female |
| Healthcare Support | 0 (0.0%) | 22 (100.0%) |
| Security & Protection | 10 (100.0%) | 0 (0.0%) |
| Firefighting & Prevention | 0 (0.0%) | 0 (0.0%) |
| Law Enforcement | 10 (100.0%) | 0 (0.0%) |
| Food Preparation & Serving | 0 (0.0%) | 4 (100.0%) |
| Cleaning & Maintenance | 32 (78.0%) | 9 (22.0%) |
| Personal Care & Service | 0 (0.0%) | 4 (100.0%) |
| Total (Category) | 42 (51.8%) | 39 (48.1%) |
| Total (Overall) | 110 (51.6%) | 103 (48.4%) |
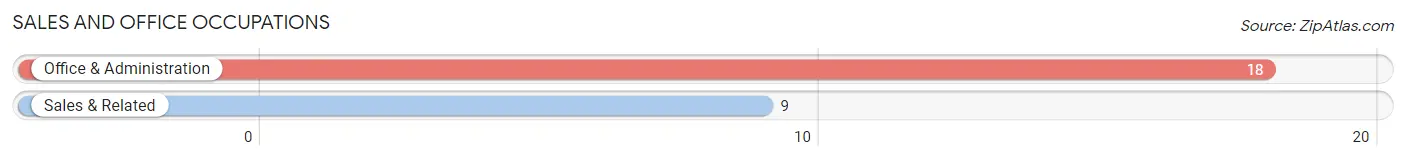
Sales and Office Occupations
The most common Sales and Office occupations in Poplar are Office & Administration (18 | 8.5%), and Sales & Related (9 | 4.2%).
Sales and Office Occupations by Sex
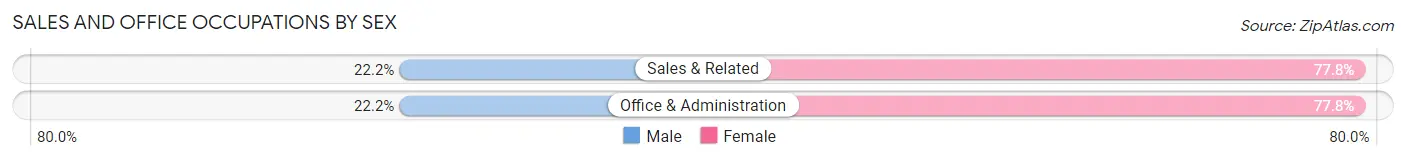
| Occupation | Male | Female |
| Sales & Related | 2 (22.2%) | 7 (77.8%) |
| Office & Administration | 4 (22.2%) | 14 (77.8%) |
| Total (Category) | 6 (22.2%) | 21 (77.8%) |
| Total (Overall) | 110 (51.6%) | 103 (48.4%) |
Natural Resources, Construction and Maintenance Occupations
The most common Natural Resources, Construction and Maintenance occupations in Poplar are Installation, Maintenance & Repair (7 | 3.3%), and Construction & Extraction (3 | 1.4%).

Natural Resources, Construction and Maintenance Occupations by Sex
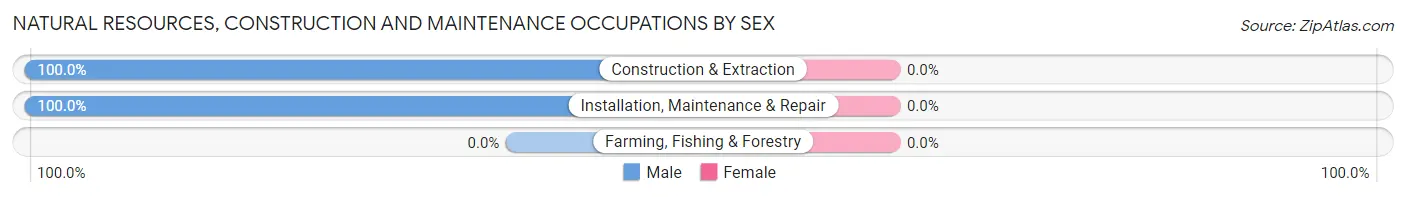
| Occupation | Male | Female |
| Farming, Fishing & Forestry | 0 (0.0%) | 0 (0.0%) |
| Construction & Extraction | 3 (100.0%) | 0 (0.0%) |
| Installation, Maintenance & Repair | 7 (100.0%) | 0 (0.0%) |
| Total (Category) | 10 (100.0%) | 0 (0.0%) |
| Total (Overall) | 110 (51.6%) | 103 (48.4%) |
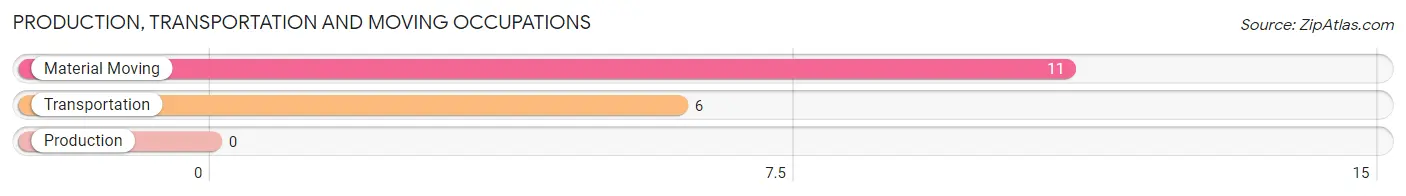
Production, Transportation and Moving Occupations
The most common Production, Transportation and Moving occupations in Poplar are Material Moving (11 | 5.2%), and Transportation (6 | 2.8%).
Production, Transportation and Moving Occupations by Sex
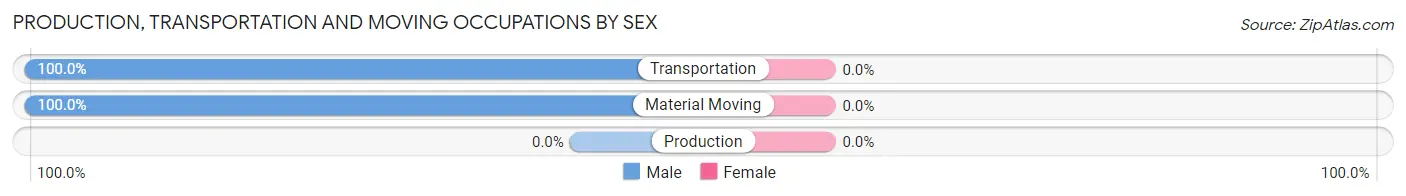
| Occupation | Male | Female |
| Production | 0 (0.0%) | 0 (0.0%) |
| Transportation | 6 (100.0%) | 0 (0.0%) |
| Material Moving | 11 (100.0%) | 0 (0.0%) |
| Total (Category) | 17 (100.0%) | 0 (0.0%) |
| Total (Overall) | 110 (51.6%) | 103 (48.4%) |
Employment Industries by Sex in Poplar
Employment Industries in Poplar
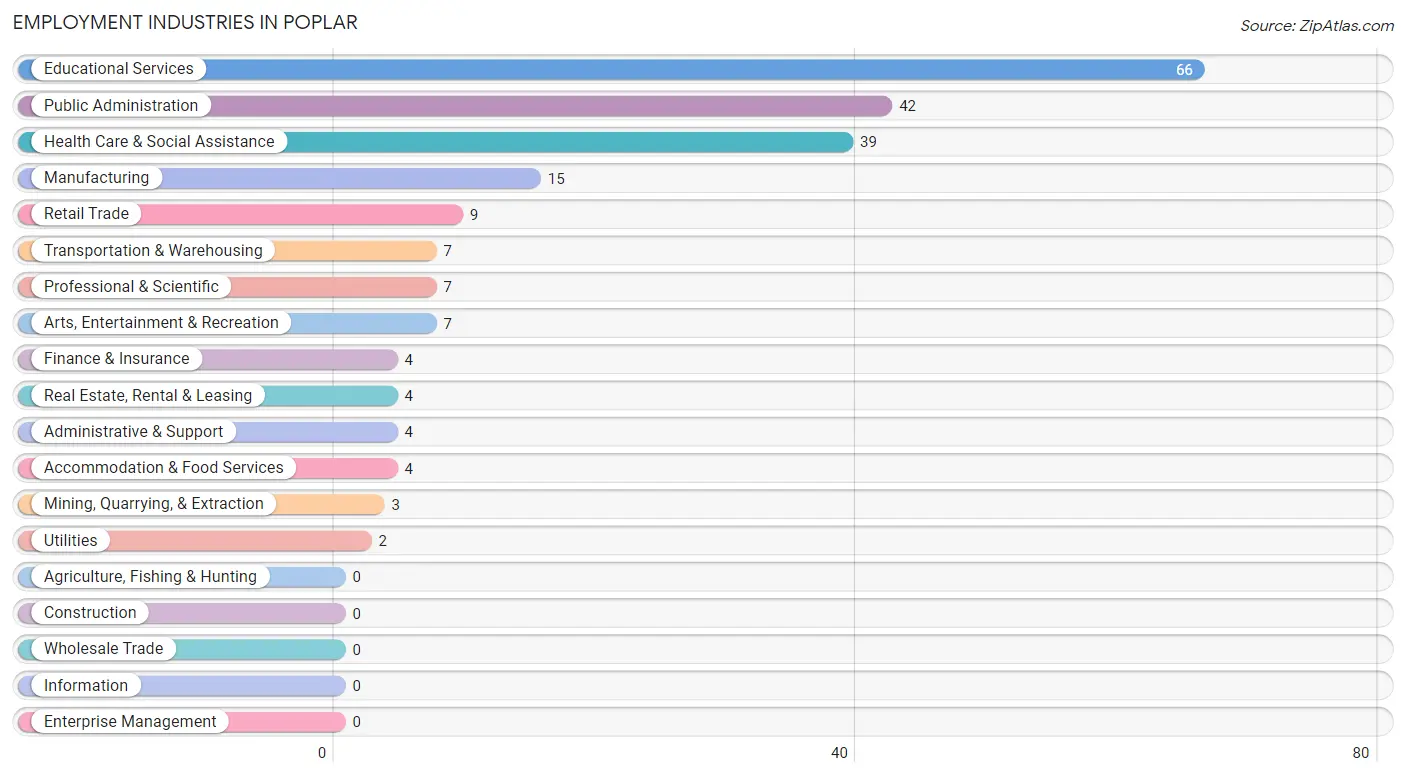
The major employment industries in Poplar include Educational Services (66 | 31.0%), Public Administration (42 | 19.7%), Health Care & Social Assistance (39 | 18.3%), Manufacturing (15 | 7.0%), and Retail Trade (9 | 4.2%).
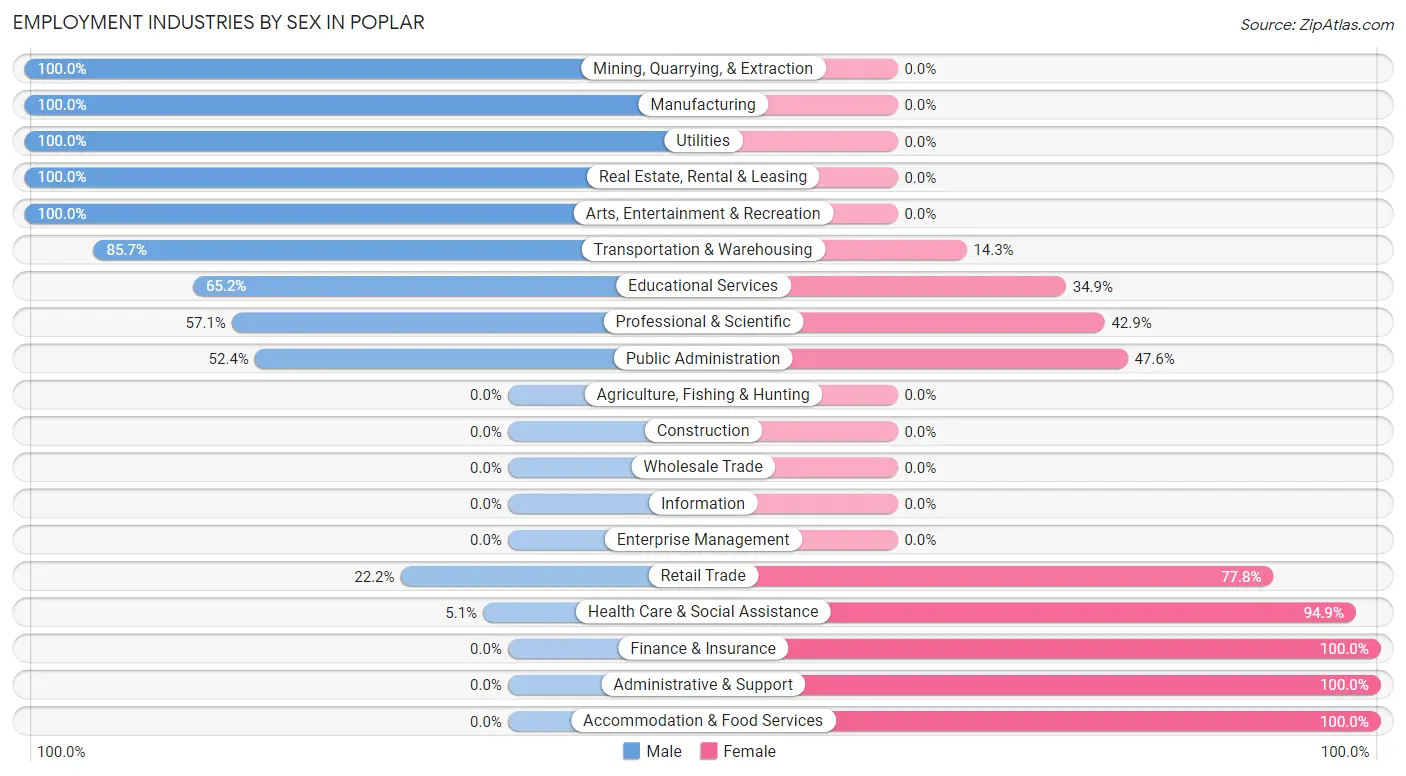
Employment Industries by Sex in Poplar
The Poplar industries that see more men than women are Mining, Quarrying, & Extraction (100.0%), Manufacturing (100.0%), and Utilities (100.0%), whereas the industries that tend to have a higher number of women are Finance & Insurance (100.0%), Administrative & Support (100.0%), and Accommodation & Food Services (100.0%).
| Industry | Male | Female |
| Agriculture, Fishing & Hunting | 0 (0.0%) | 0 (0.0%) |
| Mining, Quarrying, & Extraction | 3 (100.0%) | 0 (0.0%) |
| Construction | 0 (0.0%) | 0 (0.0%) |
| Manufacturing | 15 (100.0%) | 0 (0.0%) |
| Wholesale Trade | 0 (0.0%) | 0 (0.0%) |
| Retail Trade | 2 (22.2%) | 7 (77.8%) |
| Transportation & Warehousing | 6 (85.7%) | 1 (14.3%) |
| Utilities | 2 (100.0%) | 0 (0.0%) |
| Information | 0 (0.0%) | 0 (0.0%) |
| Finance & Insurance | 0 (0.0%) | 4 (100.0%) |
| Real Estate, Rental & Leasing | 4 (100.0%) | 0 (0.0%) |
| Professional & Scientific | 4 (57.1%) | 3 (42.9%) |
| Enterprise Management | 0 (0.0%) | 0 (0.0%) |
| Administrative & Support | 0 (0.0%) | 4 (100.0%) |
| Educational Services | 43 (65.1%) | 23 (34.8%) |
| Health Care & Social Assistance | 2 (5.1%) | 37 (94.9%) |
| Arts, Entertainment & Recreation | 7 (100.0%) | 0 (0.0%) |
| Accommodation & Food Services | 0 (0.0%) | 4 (100.0%) |
| Public Administration | 22 (52.4%) | 20 (47.6%) |
| Total | 110 (51.6%) | 103 (48.4%) |
Education in Poplar
School Enrollment in Poplar
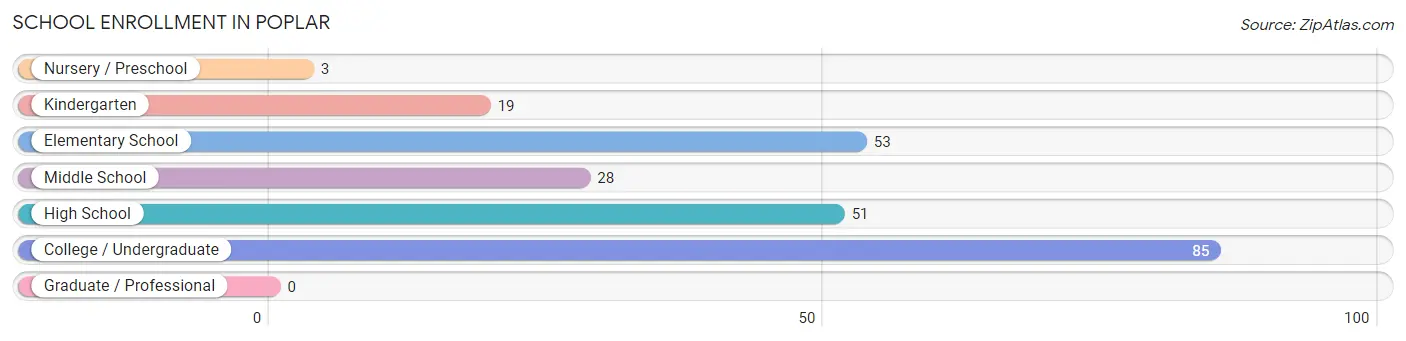
The most common levels of schooling among the 239 students in Poplar are college / undergraduate (85 | 35.6%), elementary school (53 | 22.2%), and high school (51 | 21.3%).
| School Level | # Students | % Students |
| Nursery / Preschool | 3 | 1.3% |
| Kindergarten | 19 | 8.0% |
| Elementary School | 53 | 22.2% |
| Middle School | 28 | 11.7% |
| High School | 51 | 21.3% |
| College / Undergraduate | 85 | 35.6% |
| Graduate / Professional | 0 | 0.0% |
| Total | 239 | 100.0% |
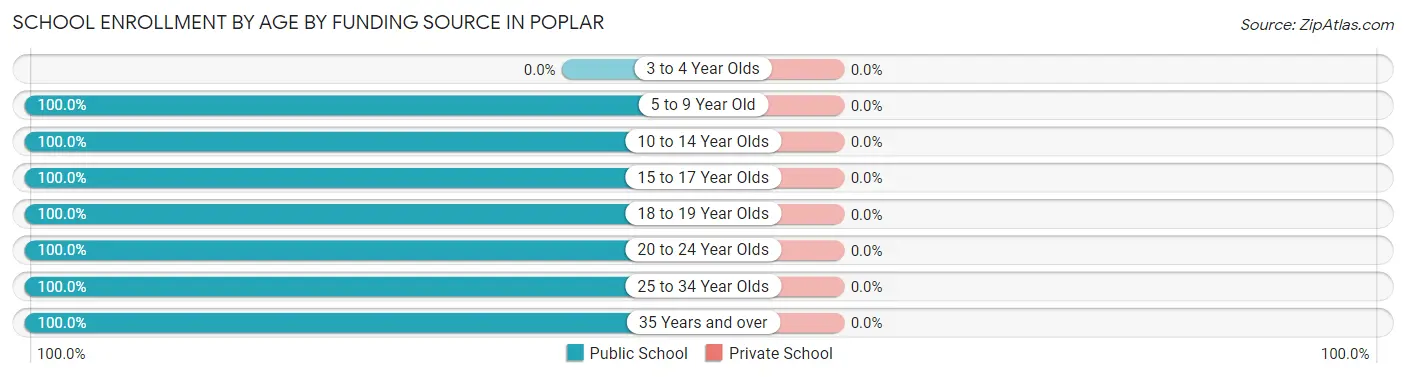
School Enrollment by Age by Funding Source in Poplar
| Age Bracket | Public School | Private School |
| 3 to 4 Year Olds | 0 (0.0%) | 0 (0.0%) |
| 5 to 9 Year Old | 69 (100.0%) | 0 (0.0%) |
| 10 to 14 Year Olds | 38 (100.0%) | 0 (0.0%) |
| 15 to 17 Year Olds | 35 (100.0%) | 0 (0.0%) |
| 18 to 19 Year Olds | 12 (100.0%) | 0 (0.0%) |
| 20 to 24 Year Olds | 59 (100.0%) | 0 (0.0%) |
| 25 to 34 Year Olds | 12 (100.0%) | 0 (0.0%) |
| 35 Years and over | 14 (100.0%) | 0 (0.0%) |
| Total | 239 (100.0%) | 0 (0.0%) |
Educational Attainment by Field of Study in Poplar
Education (23 | 30.7%), business (10 | 13.3%), psychology (7 | 9.3%), arts & humanities (7 | 9.3%), and social sciences (6 | 8.0%) are the most common fields of study among 75 individuals in Poplar who have obtained a bachelor's degree or higher.
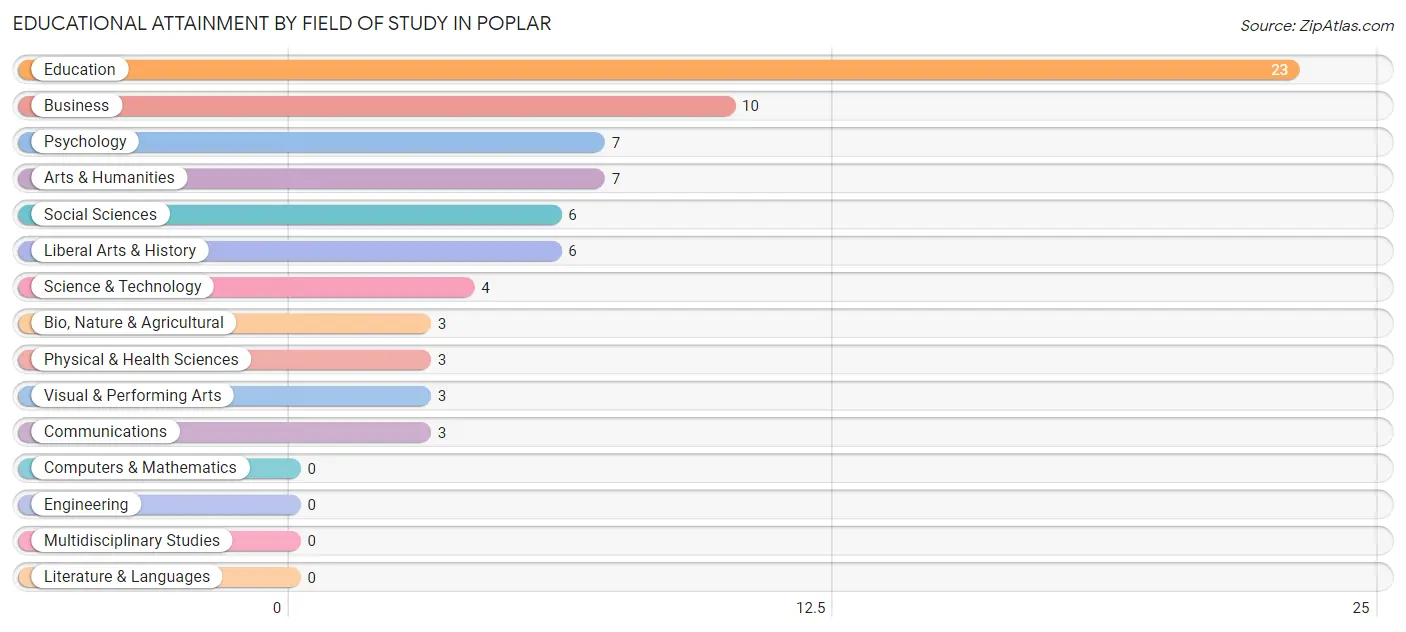
| Field of Study | # Graduates | % Graduates |
| Computers & Mathematics | 0 | 0.0% |
| Bio, Nature & Agricultural | 3 | 4.0% |
| Physical & Health Sciences | 3 | 4.0% |
| Psychology | 7 | 9.3% |
| Social Sciences | 6 | 8.0% |
| Engineering | 0 | 0.0% |
| Multidisciplinary Studies | 0 | 0.0% |
| Science & Technology | 4 | 5.3% |
| Business | 10 | 13.3% |
| Education | 23 | 30.7% |
| Literature & Languages | 0 | 0.0% |
| Liberal Arts & History | 6 | 8.0% |
| Visual & Performing Arts | 3 | 4.0% |
| Communications | 3 | 4.0% |
| Arts & Humanities | 7 | 9.3% |
| Total | 75 | 100.0% |
Transportation & Commute in Poplar
Vehicle Availability by Sex in Poplar
The most prevalent vehicle ownership categories in Poplar are males with 2 vehicles (44, accounting for 38.9%) and females with 2 vehicles (21, making up 42.7%).
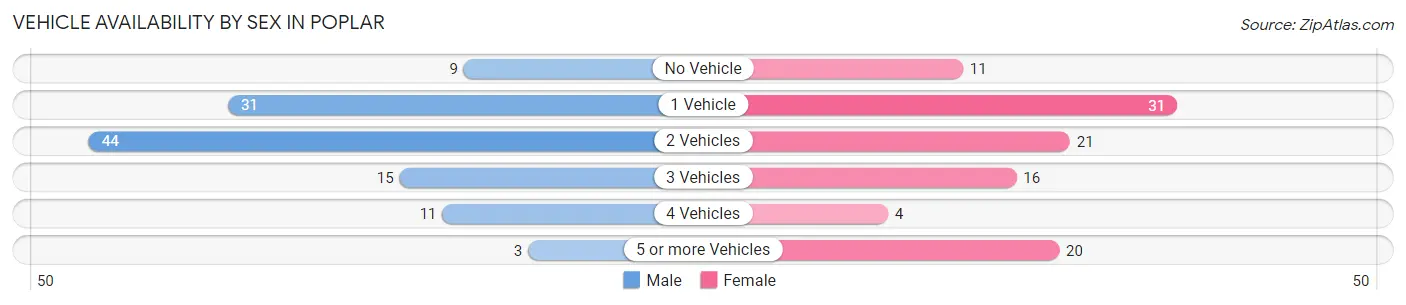
| Vehicles Available | Male | Female |
| No Vehicle | 9 (8.0%) | 11 (10.7%) |
| 1 Vehicle | 31 (27.4%) | 31 (30.1%) |
| 2 Vehicles | 44 (38.9%) | 21 (20.4%) |
| 3 Vehicles | 15 (13.3%) | 16 (15.5%) |
| 4 Vehicles | 11 (9.7%) | 4 (3.9%) |
| 5 or more Vehicles | 3 (2.6%) | 20 (19.4%) |
| Total | 113 (100.0%) | 103 (100.0%) |
Commute Time in Poplar
The most frequently occuring commute durations in Poplar are 5 to 9 minutes (77 commuters, 37.0%), less than 5 minutes (31 commuters, 14.9%), and 20 to 24 minutes (29 commuters, 13.9%).
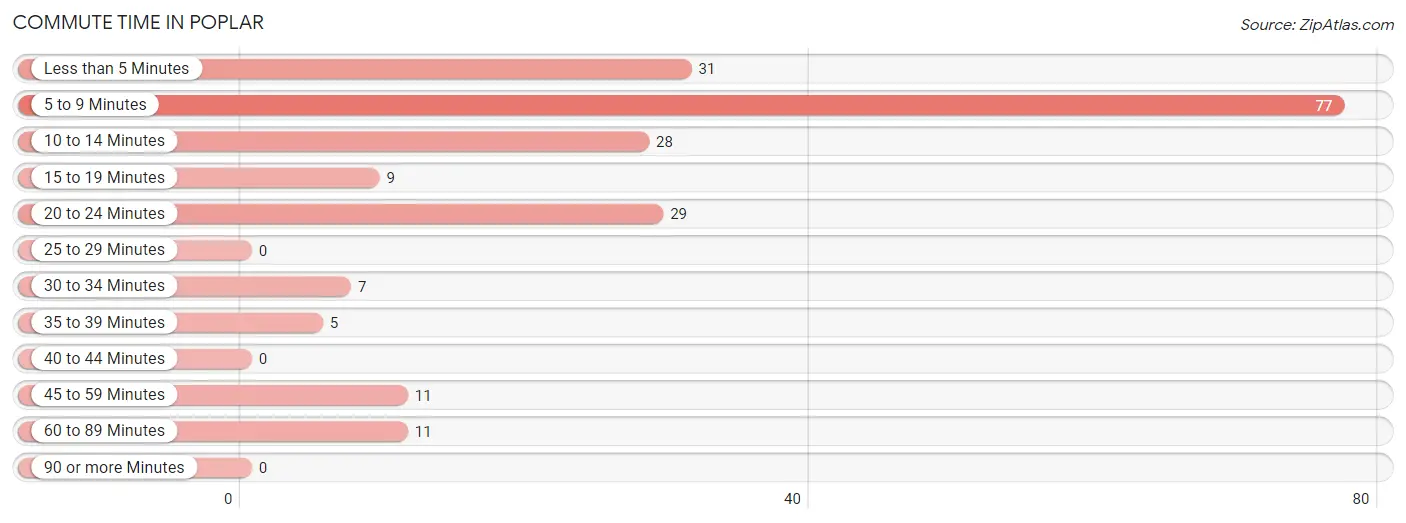
| Commute Time | # Commuters | % Commuters |
| Less than 5 Minutes | 31 | 14.9% |
| 5 to 9 Minutes | 77 | 37.0% |
| 10 to 14 Minutes | 28 | 13.5% |
| 15 to 19 Minutes | 9 | 4.3% |
| 20 to 24 Minutes | 29 | 13.9% |
| 25 to 29 Minutes | 0 | 0.0% |
| 30 to 34 Minutes | 7 | 3.4% |
| 35 to 39 Minutes | 5 | 2.4% |
| 40 to 44 Minutes | 0 | 0.0% |
| 45 to 59 Minutes | 11 | 5.3% |
| 60 to 89 Minutes | 11 | 5.3% |
| 90 or more Minutes | 0 | 0.0% |
Commute Time by Sex in Poplar
The most common commute times in Poplar are 5 to 9 minutes (23 commuters, 21.7%) for males and 5 to 9 minutes (54 commuters, 52.9%) for females.
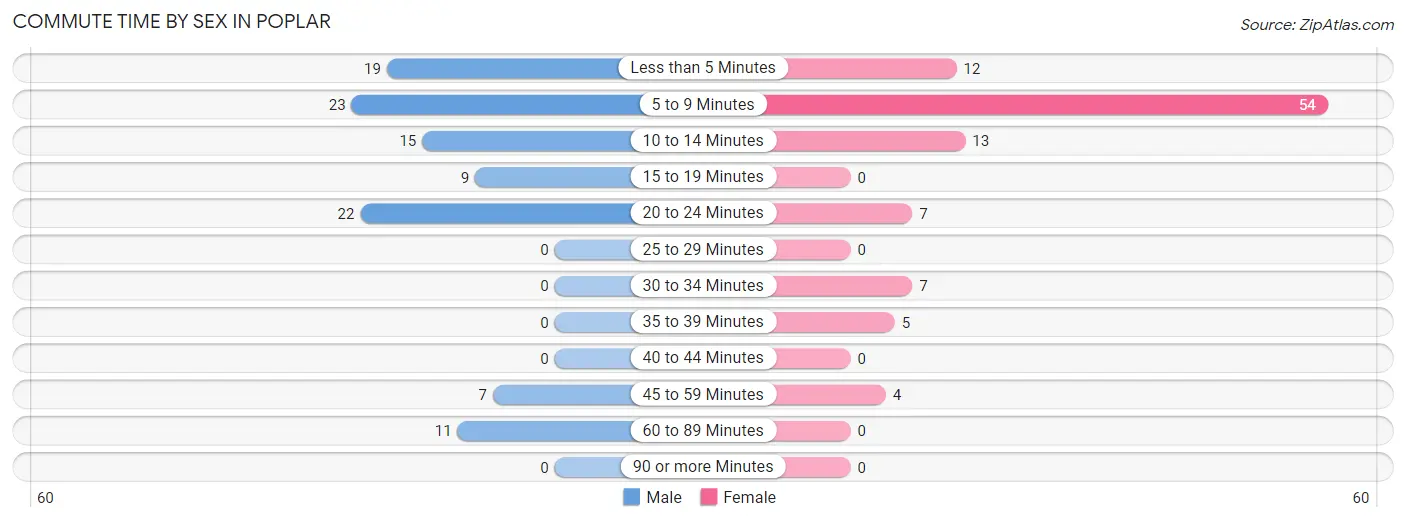
| Commute Time | Male | Female |
| Less than 5 Minutes | 19 (17.9%) | 12 (11.8%) |
| 5 to 9 Minutes | 23 (21.7%) | 54 (52.9%) |
| 10 to 14 Minutes | 15 (14.1%) | 13 (12.8%) |
| 15 to 19 Minutes | 9 (8.5%) | 0 (0.0%) |
| 20 to 24 Minutes | 22 (20.7%) | 7 (6.9%) |
| 25 to 29 Minutes | 0 (0.0%) | 0 (0.0%) |
| 30 to 34 Minutes | 0 (0.0%) | 7 (6.9%) |
| 35 to 39 Minutes | 0 (0.0%) | 5 (4.9%) |
| 40 to 44 Minutes | 0 (0.0%) | 0 (0.0%) |
| 45 to 59 Minutes | 7 (6.6%) | 4 (3.9%) |
| 60 to 89 Minutes | 11 (10.4%) | 0 (0.0%) |
| 90 or more Minutes | 0 (0.0%) | 0 (0.0%) |
Time of Departure to Work by Sex in Poplar
The most frequent times of departure to work in Poplar are 7:30 AM to 7:59 AM (42, 39.6%) for males and 7:30 AM to 7:59 AM (37, 36.3%) for females.
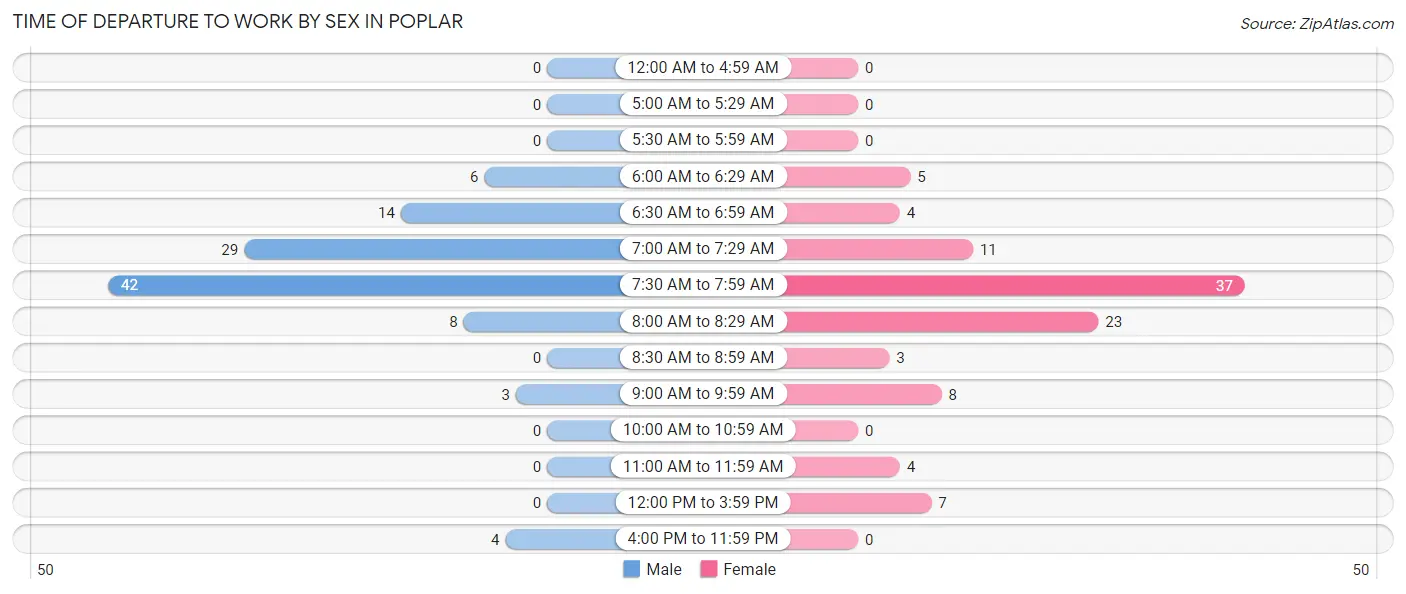
| Time of Departure | Male | Female |
| 12:00 AM to 4:59 AM | 0 (0.0%) | 0 (0.0%) |
| 5:00 AM to 5:29 AM | 0 (0.0%) | 0 (0.0%) |
| 5:30 AM to 5:59 AM | 0 (0.0%) | 0 (0.0%) |
| 6:00 AM to 6:29 AM | 6 (5.7%) | 5 (4.9%) |
| 6:30 AM to 6:59 AM | 14 (13.2%) | 4 (3.9%) |
| 7:00 AM to 7:29 AM | 29 (27.4%) | 11 (10.8%) |
| 7:30 AM to 7:59 AM | 42 (39.6%) | 37 (36.3%) |
| 8:00 AM to 8:29 AM | 8 (7.5%) | 23 (22.6%) |
| 8:30 AM to 8:59 AM | 0 (0.0%) | 3 (2.9%) |
| 9:00 AM to 9:59 AM | 3 (2.8%) | 8 (7.8%) |
| 10:00 AM to 10:59 AM | 0 (0.0%) | 0 (0.0%) |
| 11:00 AM to 11:59 AM | 0 (0.0%) | 4 (3.9%) |
| 12:00 PM to 3:59 PM | 0 (0.0%) | 7 (6.9%) |
| 4:00 PM to 11:59 PM | 4 (3.8%) | 0 (0.0%) |
| Total | 106 (100.0%) | 102 (100.0%) |
Housing Occupancy in Poplar
Occupancy by Ownership in Poplar
Of the total 241 dwellings in Poplar, owner-occupied units account for 165 (68.5%), while renter-occupied units make up 76 (31.5%).
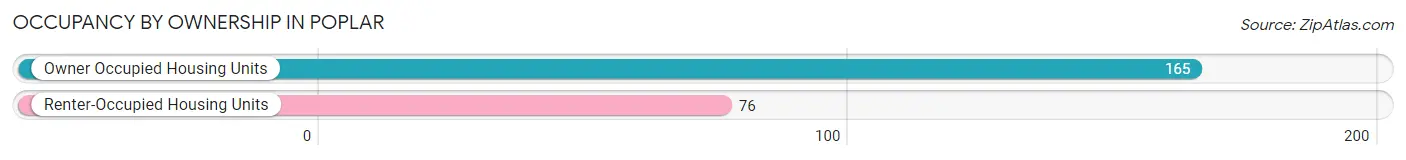
| Occupancy | # Housing Units | % Housing Units |
| Owner Occupied Housing Units | 165 | 68.5% |
| Renter-Occupied Housing Units | 76 | 31.5% |
| Total Occupied Housing Units | 241 | 100.0% |
Occupancy by Household Size in Poplar
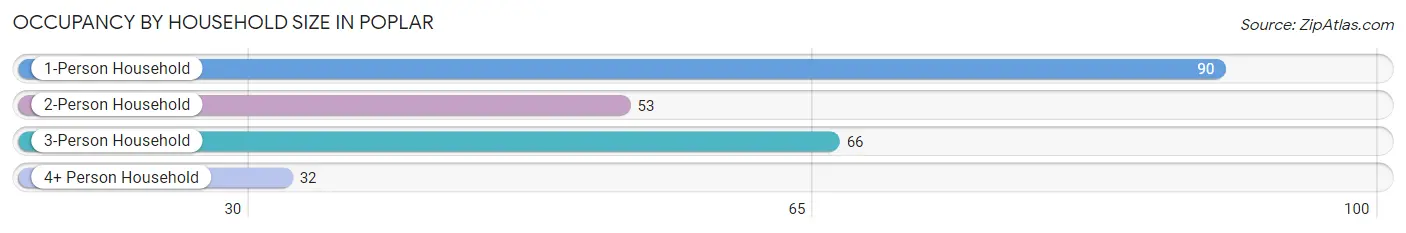
| Household Size | # Housing Units | % Housing Units |
| 1-Person Household | 90 | 37.3% |
| 2-Person Household | 53 | 22.0% |
| 3-Person Household | 66 | 27.4% |
| 4+ Person Household | 32 | 13.3% |
| Total Housing Units | 241 | 100.0% |
Occupancy by Ownership by Household Size in Poplar
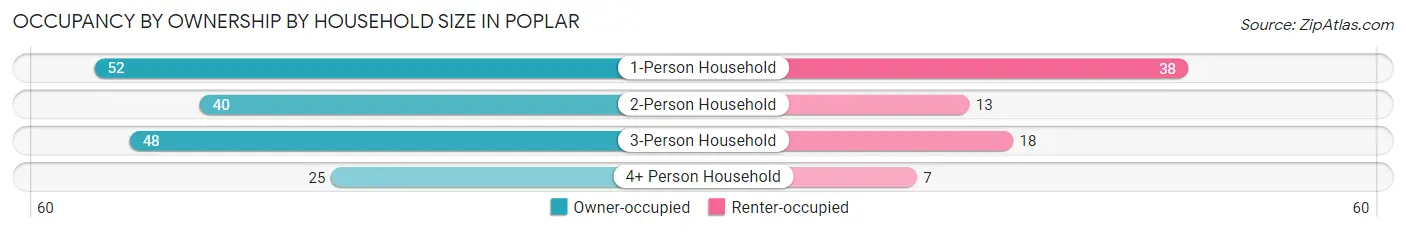
| Household Size | Owner-occupied | Renter-occupied |
| 1-Person Household | 52 (57.8%) | 38 (42.2%) |
| 2-Person Household | 40 (75.5%) | 13 (24.5%) |
| 3-Person Household | 48 (72.7%) | 18 (27.3%) |
| 4+ Person Household | 25 (78.1%) | 7 (21.9%) |
| Total Housing Units | 165 (68.5%) | 76 (31.5%) |
Occupancy by Educational Attainment in Poplar
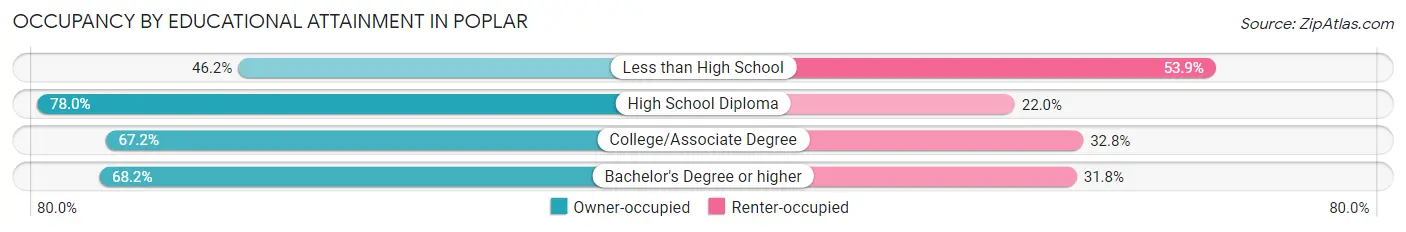
| Household Size | Owner-occupied | Renter-occupied |
| Less than High School | 6 (46.2%) | 7 (53.8%) |
| High School Diploma | 39 (78.0%) | 11 (22.0%) |
| College/Associate Degree | 90 (67.2%) | 44 (32.8%) |
| Bachelor's Degree or higher | 30 (68.2%) | 14 (31.8%) |
Occupancy by Age of Householder in Poplar
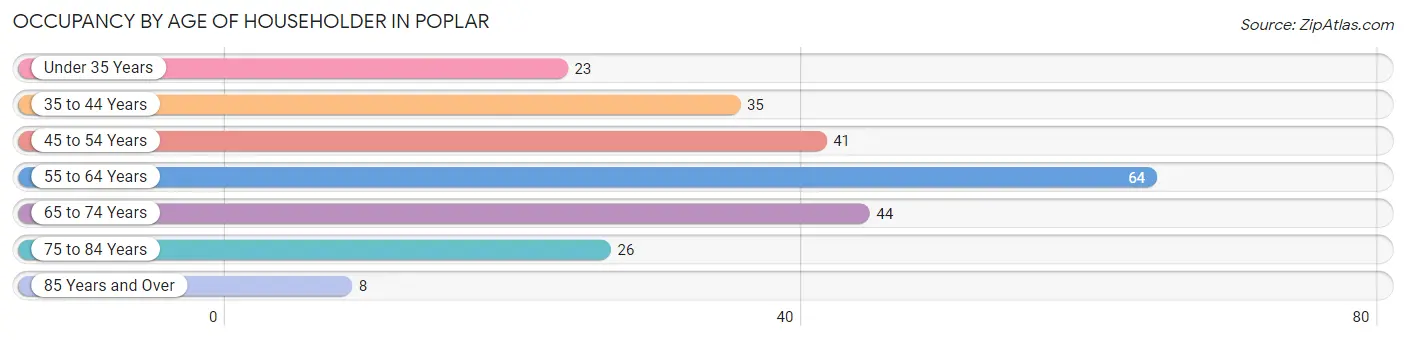
| Age Bracket | # Households | % Households |
| Under 35 Years | 23 | 9.5% |
| 35 to 44 Years | 35 | 14.5% |
| 45 to 54 Years | 41 | 17.0% |
| 55 to 64 Years | 64 | 26.6% |
| 65 to 74 Years | 44 | 18.3% |
| 75 to 84 Years | 26 | 10.8% |
| 85 Years and Over | 8 | 3.3% |
| Total | 241 | 100.0% |
Housing Finances in Poplar
Median Income by Occupancy in Poplar
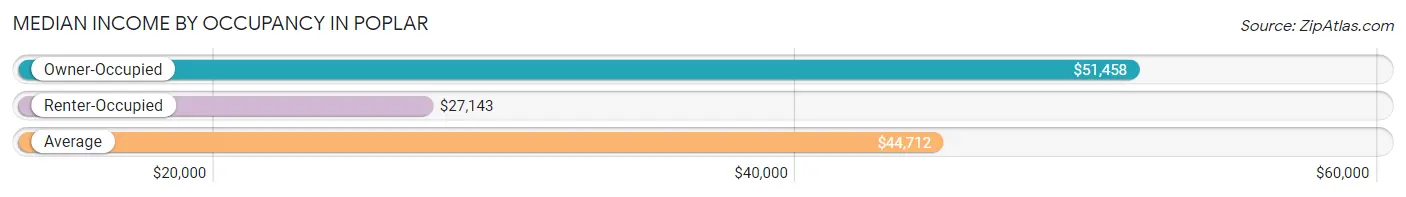
| Occupancy Type | # Households | Median Income |
| Owner-Occupied | 165 (68.5%) | $51,458 |
| Renter-Occupied | 76 (31.5%) | $27,143 |
| Average | 241 (100.0%) | $44,712 |
Occupancy by Householder Income Bracket in Poplar
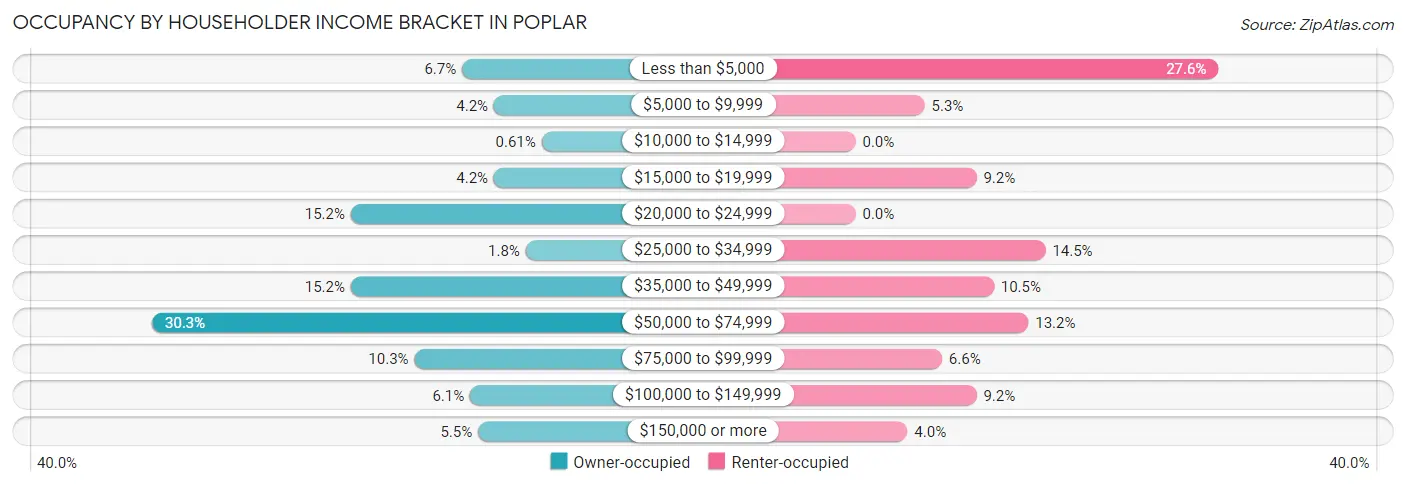
| Income Bracket | Owner-occupied | Renter-occupied |
| Less than $5,000 | 11 (6.7%) | 21 (27.6%) |
| $5,000 to $9,999 | 7 (4.2%) | 4 (5.3%) |
| $10,000 to $14,999 | 1 (0.6%) | 0 (0.0%) |
| $15,000 to $19,999 | 7 (4.2%) | 7 (9.2%) |
| $20,000 to $24,999 | 25 (15.1%) | 0 (0.0%) |
| $25,000 to $34,999 | 3 (1.8%) | 11 (14.5%) |
| $35,000 to $49,999 | 25 (15.1%) | 8 (10.5%) |
| $50,000 to $74,999 | 50 (30.3%) | 10 (13.2%) |
| $75,000 to $99,999 | 17 (10.3%) | 5 (6.6%) |
| $100,000 to $149,999 | 10 (6.1%) | 7 (9.2%) |
| $150,000 or more | 9 (5.4%) | 3 (4.0%) |
| Total | 165 (100.0%) | 76 (100.0%) |
Monthly Housing Cost Tiers in Poplar
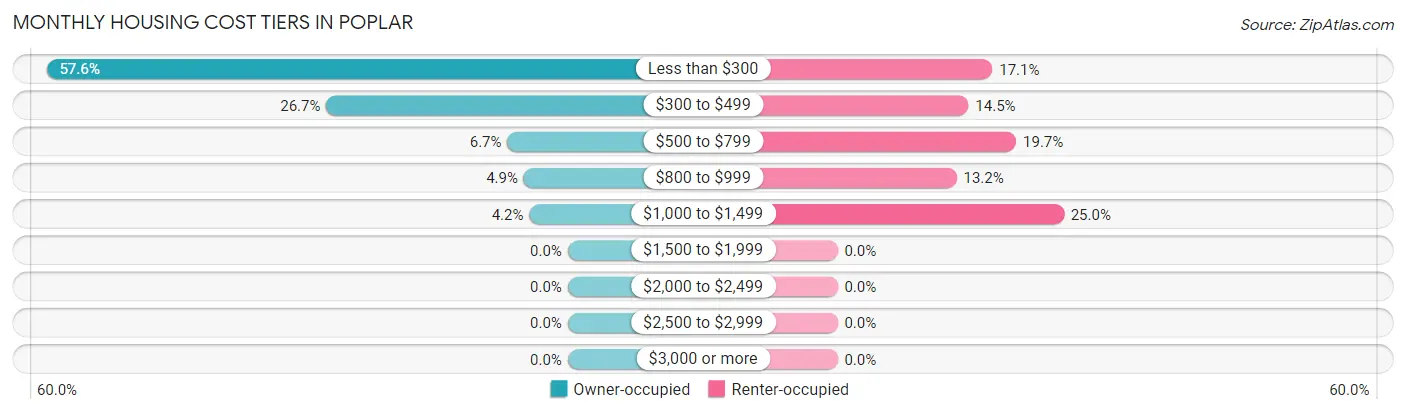
| Monthly Cost | Owner-occupied | Renter-occupied |
| Less than $300 | 95 (57.6%) | 13 (17.1%) |
| $300 to $499 | 44 (26.7%) | 11 (14.5%) |
| $500 to $799 | 11 (6.7%) | 15 (19.7%) |
| $800 to $999 | 8 (4.9%) | 10 (13.2%) |
| $1,000 to $1,499 | 7 (4.2%) | 19 (25.0%) |
| $1,500 to $1,999 | 0 (0.0%) | 0 (0.0%) |
| $2,000 to $2,499 | 0 (0.0%) | 0 (0.0%) |
| $2,500 to $2,999 | 0 (0.0%) | 0 (0.0%) |
| $3,000 or more | 0 (0.0%) | 0 (0.0%) |
| Total | 165 (100.0%) | 76 (100.0%) |
Physical Housing Characteristics in Poplar
Housing Structures in Poplar
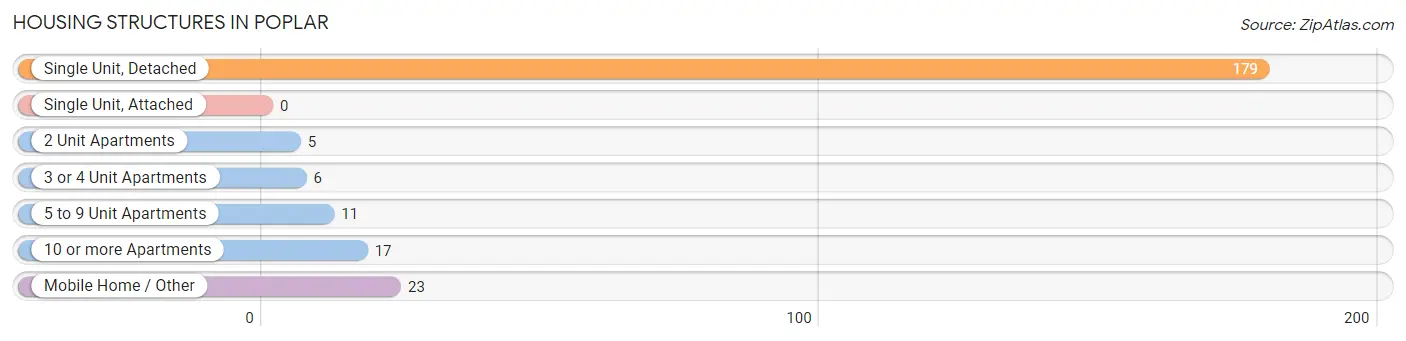
| Structure Type | # Housing Units | % Housing Units |
| Single Unit, Detached | 179 | 74.3% |
| Single Unit, Attached | 0 | 0.0% |
| 2 Unit Apartments | 5 | 2.1% |
| 3 or 4 Unit Apartments | 6 | 2.5% |
| 5 to 9 Unit Apartments | 11 | 4.6% |
| 10 or more Apartments | 17 | 7.0% |
| Mobile Home / Other | 23 | 9.5% |
| Total | 241 | 100.0% |
Housing Structures by Occupancy in Poplar
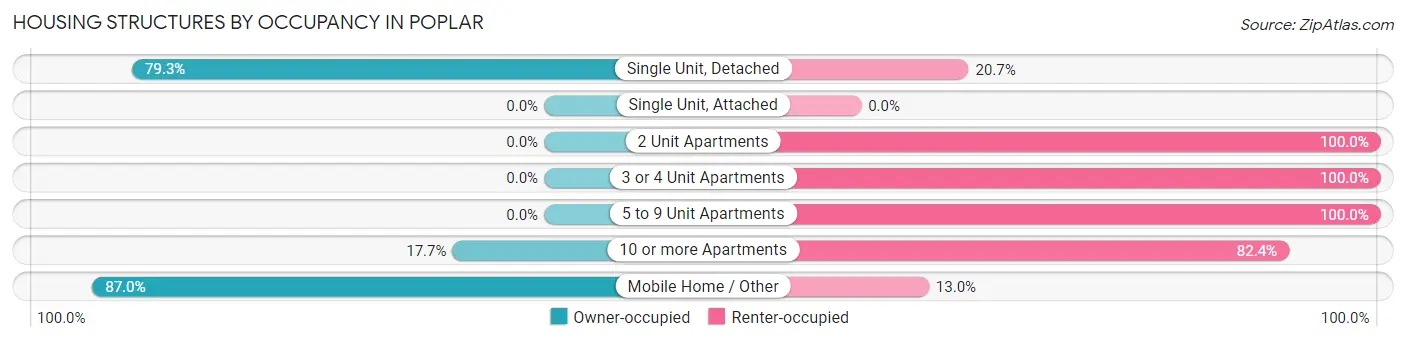
| Structure Type | Owner-occupied | Renter-occupied |
| Single Unit, Detached | 142 (79.3%) | 37 (20.7%) |
| Single Unit, Attached | 0 (0.0%) | 0 (0.0%) |
| 2 Unit Apartments | 0 (0.0%) | 5 (100.0%) |
| 3 or 4 Unit Apartments | 0 (0.0%) | 6 (100.0%) |
| 5 to 9 Unit Apartments | 0 (0.0%) | 11 (100.0%) |
| 10 or more Apartments | 3 (17.6%) | 14 (82.4%) |
| Mobile Home / Other | 20 (87.0%) | 3 (13.0%) |
| Total | 165 (68.5%) | 76 (31.5%) |
Housing Structures by Number of Rooms in Poplar
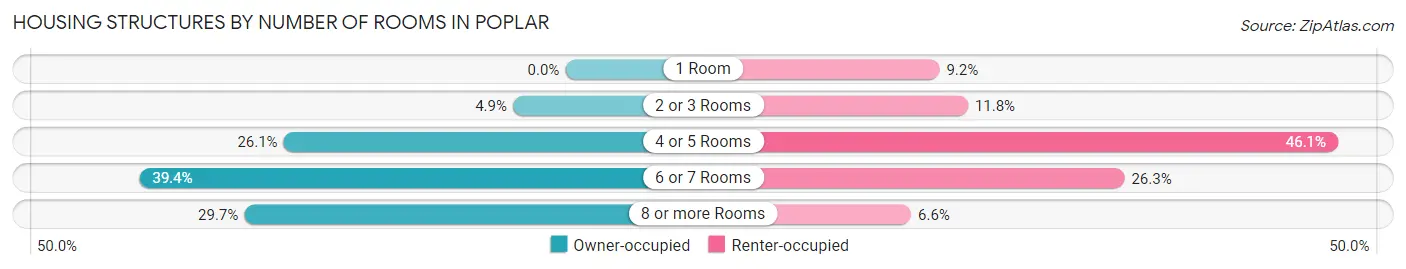
| Number of Rooms | Owner-occupied | Renter-occupied |
| 1 Room | 0 (0.0%) | 7 (9.2%) |
| 2 or 3 Rooms | 8 (4.9%) | 9 (11.8%) |
| 4 or 5 Rooms | 43 (26.1%) | 35 (46.1%) |
| 6 or 7 Rooms | 65 (39.4%) | 20 (26.3%) |
| 8 or more Rooms | 49 (29.7%) | 5 (6.6%) |
| Total | 165 (100.0%) | 76 (100.0%) |
Housing Structure by Heating Type in Poplar
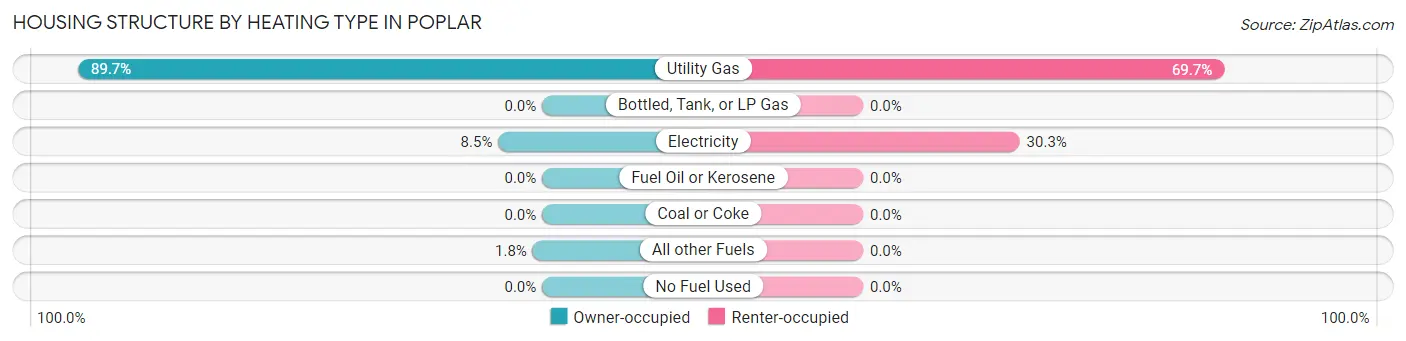
| Heating Type | Owner-occupied | Renter-occupied |
| Utility Gas | 148 (89.7%) | 53 (69.7%) |
| Bottled, Tank, or LP Gas | 0 (0.0%) | 0 (0.0%) |
| Electricity | 14 (8.5%) | 23 (30.3%) |
| Fuel Oil or Kerosene | 0 (0.0%) | 0 (0.0%) |
| Coal or Coke | 0 (0.0%) | 0 (0.0%) |
| All other Fuels | 3 (1.8%) | 0 (0.0%) |
| No Fuel Used | 0 (0.0%) | 0 (0.0%) |
| Total | 165 (100.0%) | 76 (100.0%) |
Household Vehicle Usage in Poplar
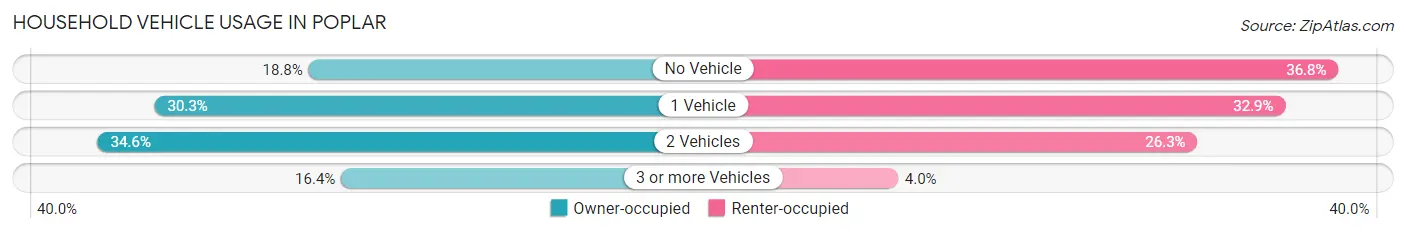
| Vehicles per Household | Owner-occupied | Renter-occupied |
| No Vehicle | 31 (18.8%) | 28 (36.8%) |
| 1 Vehicle | 50 (30.3%) | 25 (32.9%) |
| 2 Vehicles | 57 (34.5%) | 20 (26.3%) |
| 3 or more Vehicles | 27 (16.4%) | 3 (4.0%) |
| Total | 165 (100.0%) | 76 (100.0%) |
Real Estate & Mortgages in Poplar
Real Estate and Mortgage Overview in Poplar
| Characteristic | Without Mortgage | With Mortgage |
| Housing Units | 142 | 23 |
| Median Property Value | $60,000 | $114,600 |
| Median Household Income | $50,417 | $0 |
| Monthly Housing Costs | $178 | $0 |
| Real Estate Taxes | $711 | $0 |
Property Value by Mortgage Status in Poplar
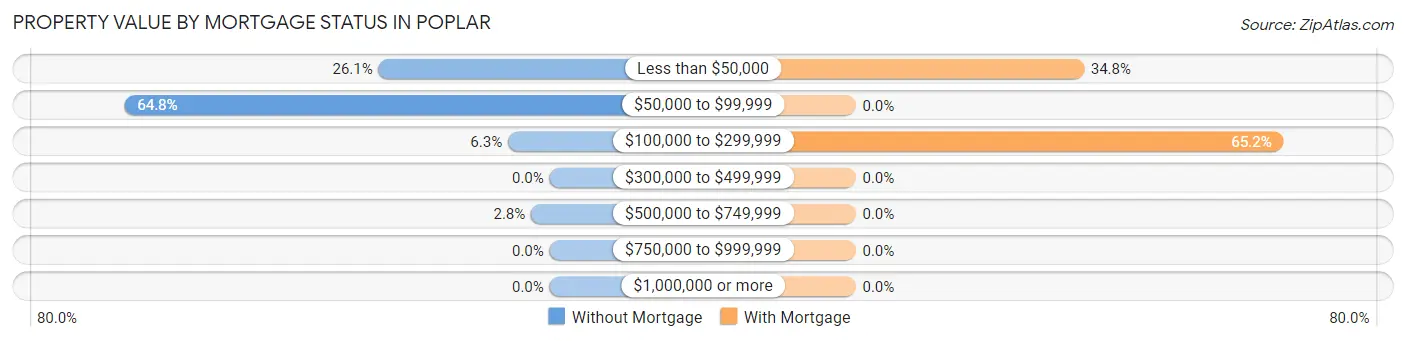
| Property Value | Without Mortgage | With Mortgage |
| Less than $50,000 | 37 (26.1%) | 8 (34.8%) |
| $50,000 to $99,999 | 92 (64.8%) | 0 (0.0%) |
| $100,000 to $299,999 | 9 (6.3%) | 15 (65.2%) |
| $300,000 to $499,999 | 0 (0.0%) | 0 (0.0%) |
| $500,000 to $749,999 | 4 (2.8%) | 0 (0.0%) |
| $750,000 to $999,999 | 0 (0.0%) | 0 (0.0%) |
| $1,000,000 or more | 0 (0.0%) | 0 (0.0%) |
| Total | 142 (100.0%) | 23 (100.0%) |
Household Income by Mortgage Status in Poplar
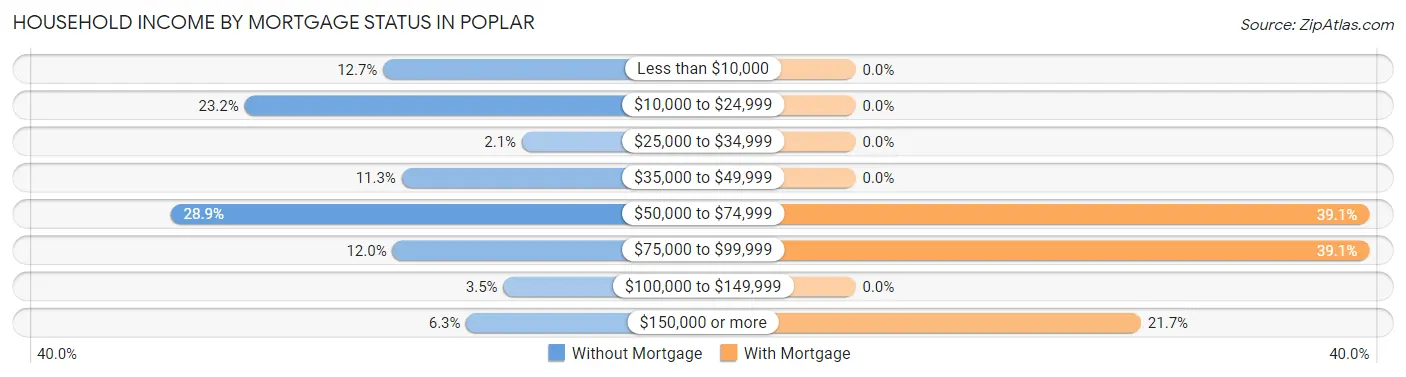
| Household Income | Without Mortgage | With Mortgage |
| Less than $10,000 | 18 (12.7%) | 0 (0.0%) |
| $10,000 to $24,999 | 33 (23.2%) | 0 (0.0%) |
| $25,000 to $34,999 | 3 (2.1%) | 0 (0.0%) |
| $35,000 to $49,999 | 16 (11.3%) | 0 (0.0%) |
| $50,000 to $74,999 | 41 (28.9%) | 9 (39.1%) |
| $75,000 to $99,999 | 17 (12.0%) | 9 (39.1%) |
| $100,000 to $149,999 | 5 (3.5%) | 0 (0.0%) |
| $150,000 or more | 9 (6.3%) | 5 (21.7%) |
| Total | 142 (100.0%) | 23 (100.0%) |
Property Value to Household Income Ratio in Poplar
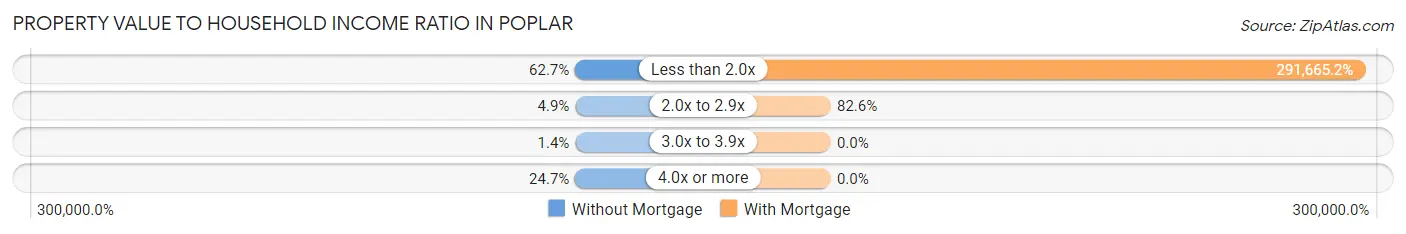
| Value-to-Income Ratio | Without Mortgage | With Mortgage |
| Less than 2.0x | 89 (62.7%) | 67,083 (291,665.2%) |
| 2.0x to 2.9x | 7 (4.9%) | 19 (82.6%) |
| 3.0x to 3.9x | 2 (1.4%) | 0 (0.0%) |
| 4.0x or more | 35 (24.6%) | 0 (0.0%) |
| Total | 142 (100.0%) | 23 (100.0%) |
Real Estate Taxes by Mortgage Status in Poplar
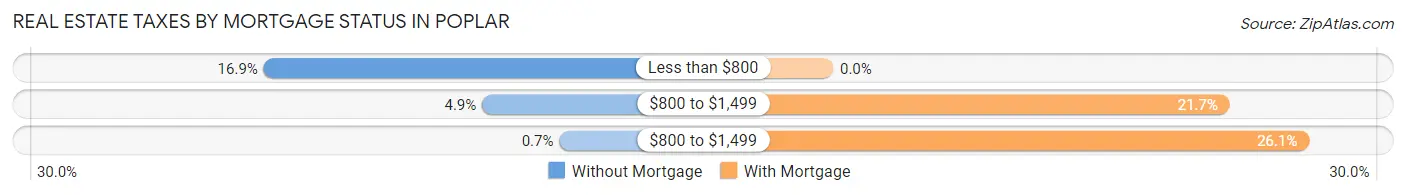
| Property Taxes | Without Mortgage | With Mortgage |
| Less than $800 | 24 (16.9%) | 0 (0.0%) |
| $800 to $1,499 | 7 (4.9%) | 5 (21.7%) |
| $800 to $1,499 | 1 (0.7%) | 6 (26.1%) |
| Total | 142 (100.0%) | 23 (100.0%) |
Health & Disability in Poplar
Health Insurance Coverage by Age in Poplar
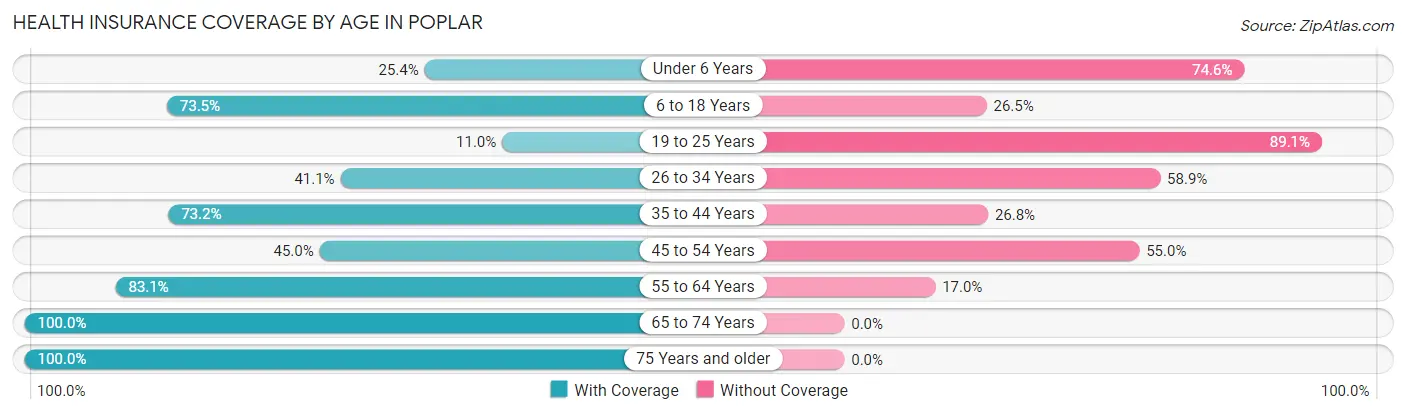
| Age Bracket | With Coverage | Without Coverage |
| Under 6 Years | 15 (25.4%) | 44 (74.6%) |
| 6 to 18 Years | 108 (73.5%) | 39 (26.5%) |
| 19 to 25 Years | 15 (11.0%) | 122 (89.0%) |
| 26 to 34 Years | 30 (41.1%) | 43 (58.9%) |
| 35 to 44 Years | 41 (73.2%) | 15 (26.8%) |
| 45 to 54 Years | 36 (45.0%) | 44 (55.0%) |
| 55 to 64 Years | 98 (83.1%) | 20 (17.0%) |
| 65 to 74 Years | 48 (100.0%) | 0 (0.0%) |
| 75 Years and older | 37 (100.0%) | 0 (0.0%) |
| Total | 428 (56.7%) | 327 (43.3%) |
Health Insurance Coverage by Citizenship Status in Poplar
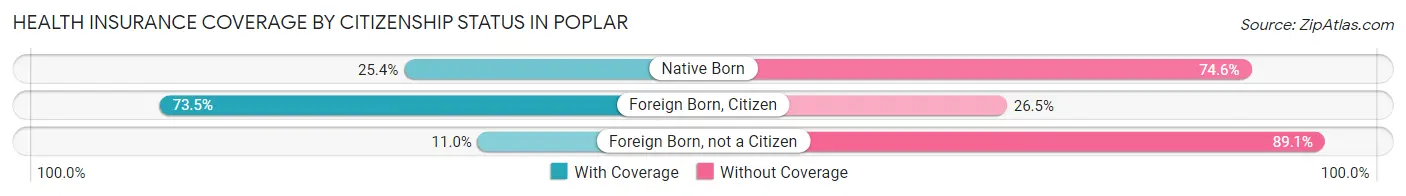
| Citizenship Status | With Coverage | Without Coverage |
| Native Born | 15 (25.4%) | 44 (74.6%) |
| Foreign Born, Citizen | 108 (73.5%) | 39 (26.5%) |
| Foreign Born, not a Citizen | 15 (11.0%) | 122 (89.0%) |
Health Insurance Coverage by Household Income in Poplar
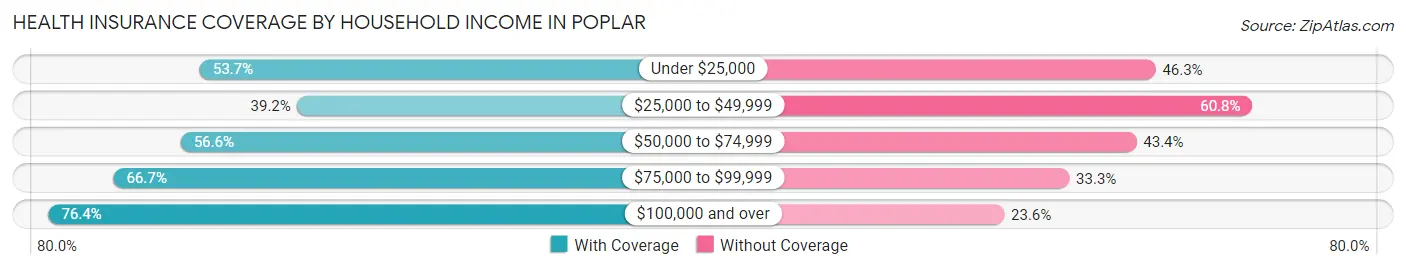
| Household Income | With Coverage | Without Coverage |
| Under $25,000 | 115 (53.7%) | 99 (46.3%) |
| $25,000 to $49,999 | 51 (39.2%) | 79 (60.8%) |
| $50,000 to $74,999 | 133 (56.6%) | 102 (43.4%) |
| $75,000 to $99,999 | 44 (66.7%) | 22 (33.3%) |
| $100,000 and over | 81 (76.4%) | 25 (23.6%) |
Public vs Private Health Insurance Coverage by Age in Poplar
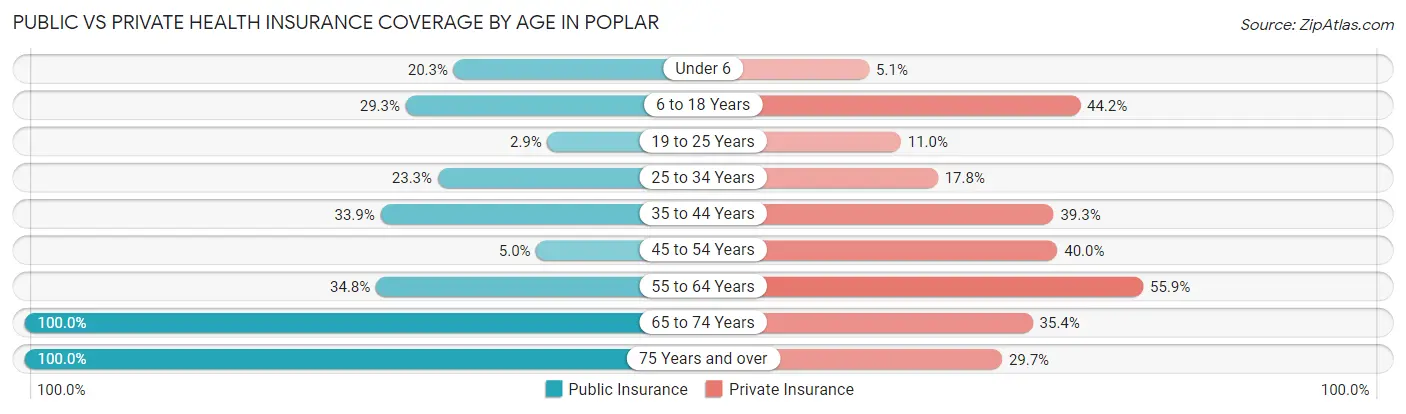
| Age Bracket | Public Insurance | Private Insurance |
| Under 6 | 12 (20.3%) | 3 (5.1%) |
| 6 to 18 Years | 43 (29.2%) | 65 (44.2%) |
| 19 to 25 Years | 4 (2.9%) | 15 (11.0%) |
| 25 to 34 Years | 17 (23.3%) | 13 (17.8%) |
| 35 to 44 Years | 19 (33.9%) | 22 (39.3%) |
| 45 to 54 Years | 4 (5.0%) | 32 (40.0%) |
| 55 to 64 Years | 41 (34.7%) | 66 (55.9%) |
| 65 to 74 Years | 48 (100.0%) | 17 (35.4%) |
| 75 Years and over | 37 (100.0%) | 11 (29.7%) |
| Total | 225 (29.8%) | 244 (32.3%) |
Disability Status by Sex by Age in Poplar
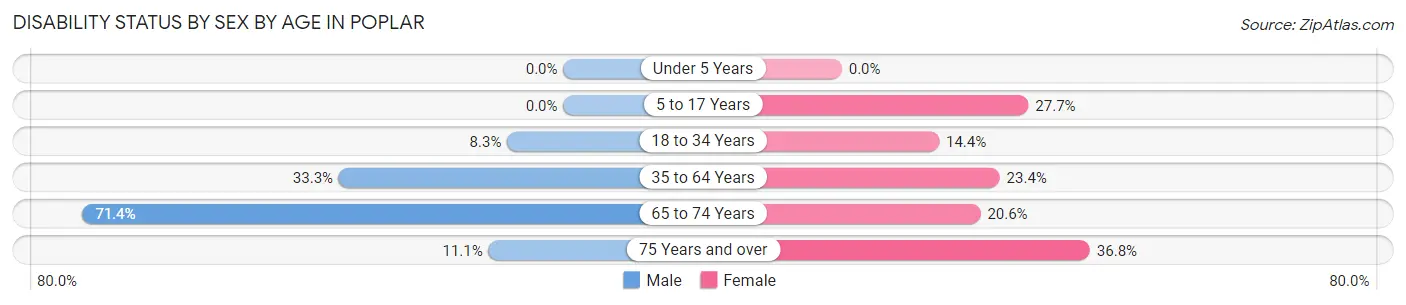
| Age Bracket | Male | Female |
| Under 5 Years | 0 (0.0%) | 0 (0.0%) |
| 5 to 17 Years | 0 (0.0%) | 23 (27.7%) |
| 18 to 34 Years | 11 (8.3%) | 13 (14.4%) |
| 35 to 64 Years | 42 (33.3%) | 30 (23.4%) |
| 65 to 74 Years | 10 (71.4%) | 7 (20.6%) |
| 75 Years and over | 2 (11.1%) | 7 (36.8%) |
Disability Class by Sex by Age in Poplar
Disability Class: Hearing Difficulty
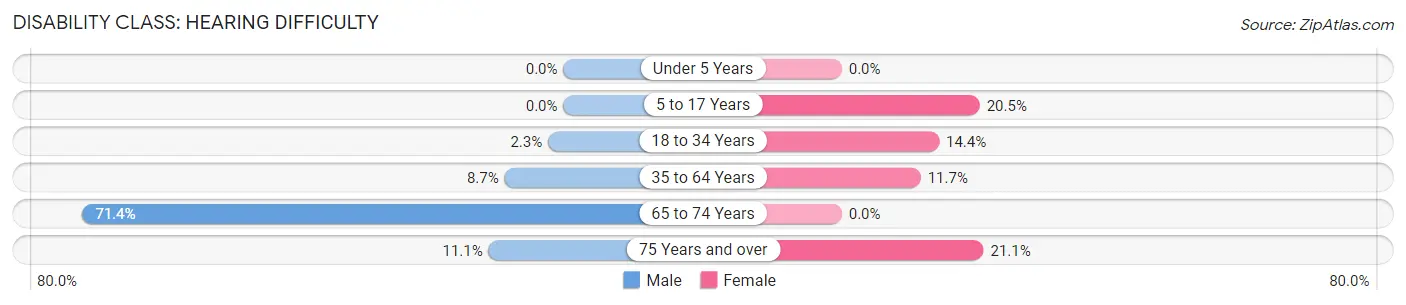
| Age Bracket | Male | Female |
| Under 5 Years | 0 (0.0%) | 0 (0.0%) |
| 5 to 17 Years | 0 (0.0%) | 17 (20.5%) |
| 18 to 34 Years | 3 (2.3%) | 13 (14.4%) |
| 35 to 64 Years | 11 (8.7%) | 15 (11.7%) |
| 65 to 74 Years | 10 (71.4%) | 0 (0.0%) |
| 75 Years and over | 2 (11.1%) | 4 (21.0%) |
Disability Class: Vision Difficulty
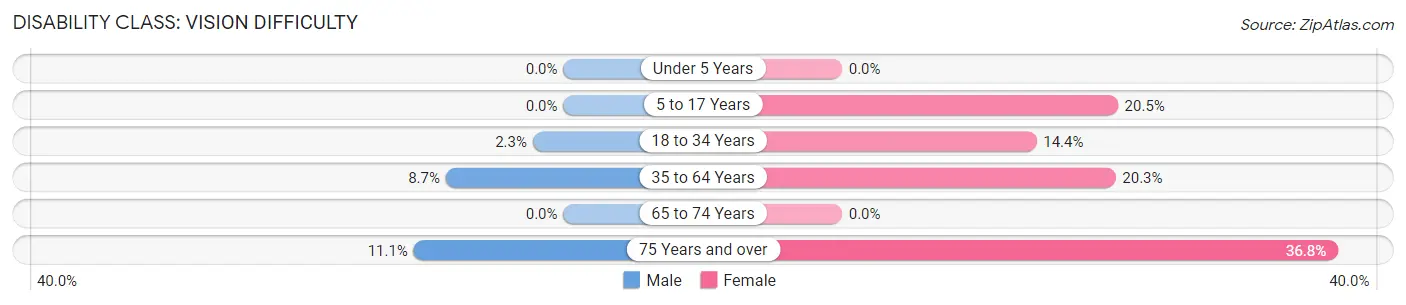
| Age Bracket | Male | Female |
| Under 5 Years | 0 (0.0%) | 0 (0.0%) |
| 5 to 17 Years | 0 (0.0%) | 17 (20.5%) |
| 18 to 34 Years | 3 (2.3%) | 13 (14.4%) |
| 35 to 64 Years | 11 (8.7%) | 26 (20.3%) |
| 65 to 74 Years | 0 (0.0%) | 0 (0.0%) |
| 75 Years and over | 2 (11.1%) | 7 (36.8%) |
Disability Class: Cognitive Difficulty
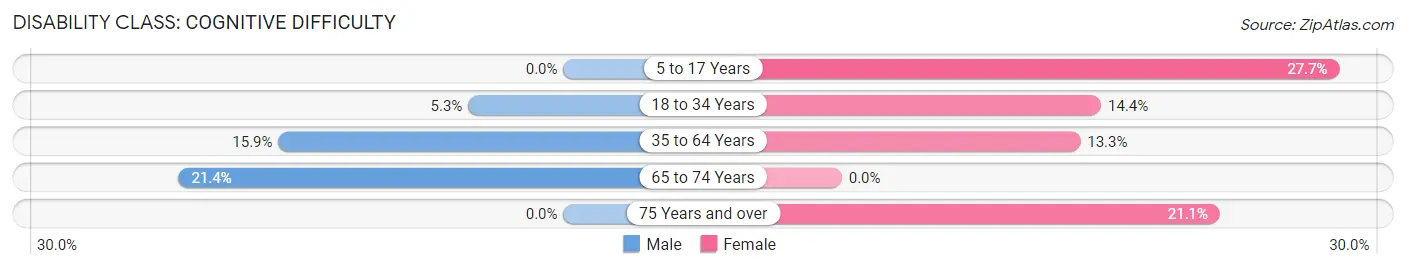
| Age Bracket | Male | Female |
| 5 to 17 Years | 0 (0.0%) | 23 (27.7%) |
| 18 to 34 Years | 7 (5.3%) | 13 (14.4%) |
| 35 to 64 Years | 20 (15.9%) | 17 (13.3%) |
| 65 to 74 Years | 3 (21.4%) | 0 (0.0%) |
| 75 Years and over | 0 (0.0%) | 4 (21.0%) |
Disability Class: Ambulatory Difficulty
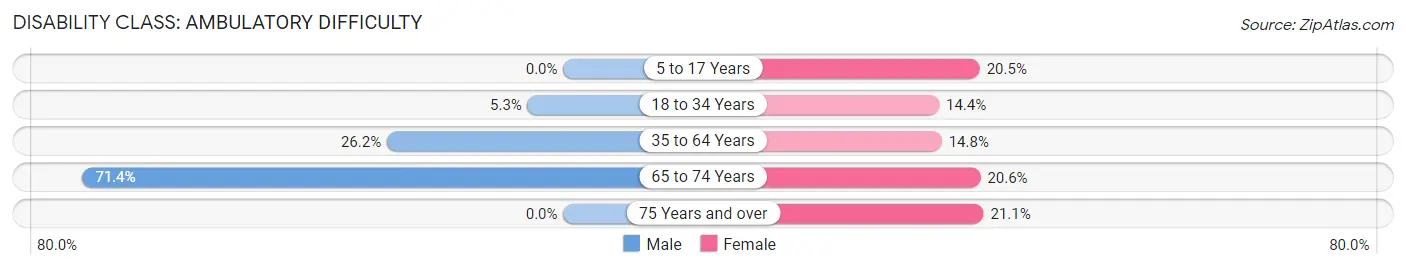
| Age Bracket | Male | Female |
| 5 to 17 Years | 0 (0.0%) | 17 (20.5%) |
| 18 to 34 Years | 7 (5.3%) | 13 (14.4%) |
| 35 to 64 Years | 33 (26.2%) | 19 (14.8%) |
| 65 to 74 Years | 10 (71.4%) | 7 (20.6%) |
| 75 Years and over | 0 (0.0%) | 4 (21.0%) |
Disability Class: Self-Care Difficulty
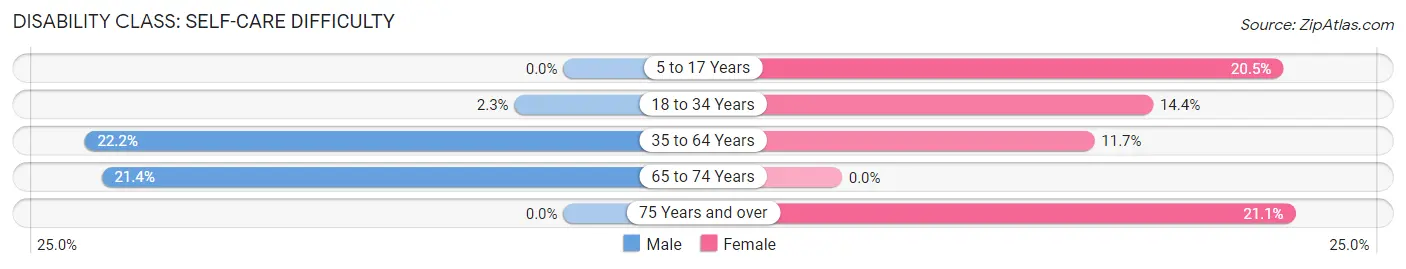
| Age Bracket | Male | Female |
| 5 to 17 Years | 0 (0.0%) | 17 (20.5%) |
| 18 to 34 Years | 3 (2.3%) | 13 (14.4%) |
| 35 to 64 Years | 28 (22.2%) | 15 (11.7%) |
| 65 to 74 Years | 3 (21.4%) | 0 (0.0%) |
| 75 Years and over | 0 (0.0%) | 4 (21.0%) |
Technology Access in Poplar
Computing Device Access in Poplar
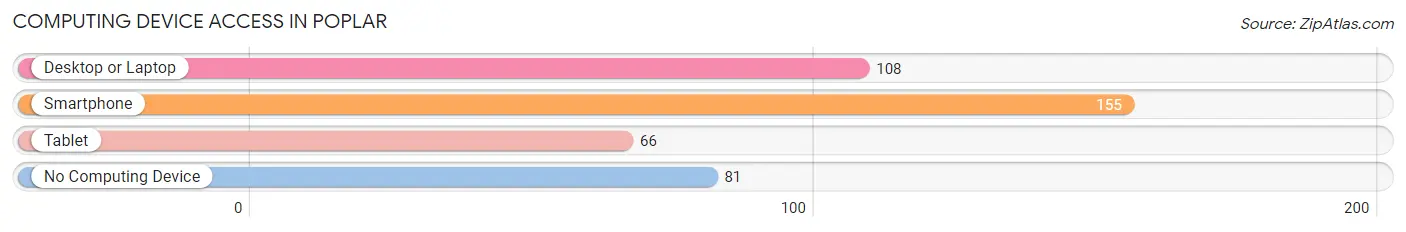
| Device Type | # Households | % Households |
| Desktop or Laptop | 108 | 44.8% |
| Smartphone | 155 | 64.3% |
| Tablet | 66 | 27.4% |
| No Computing Device | 81 | 33.6% |
| Total | 241 | 100.0% |
Internet Access in Poplar
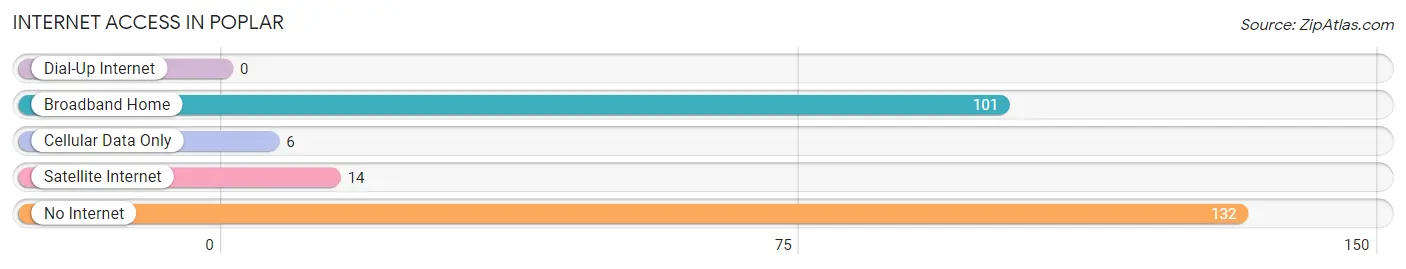
| Internet Type | # Households | % Households |
| Dial-Up Internet | 0 | 0.0% |
| Broadband Home | 101 | 41.9% |
| Cellular Data Only | 6 | 2.5% |
| Satellite Internet | 14 | 5.8% |
| No Internet | 132 | 54.8% |
| Total | 241 | 100.0% |
Poplar Summary
Poplar, Montana is a small town located in the northeastern corner of the state, near the North Dakota border. It is the county seat of Roosevelt County and is the largest town in the county. The town was founded in 1910 and has a population of 1,743 as of the 2010 census.
Geography
Poplar is located in the northeastern corner of Montana, near the North Dakota border. It is situated in the Missouri River Valley, at an elevation of 2,068 feet. The town is located on the Fort Peck Indian Reservation, which is home to the Assiniboine and Sioux Tribes of the Fort Peck Indian Reservation. The town is surrounded by rolling hills and prairies, and is located near the Missouri River.
Climate
Poplar has a semi-arid climate, with hot summers and cold winters. The average high temperature in July is 85°F, and the average low temperature in January is -7°F. The town receives an average of 16 inches of precipitation per year, with most of it falling in the spring and summer months.
Economy
Poplar’s economy is largely based on agriculture and tourism. The town is home to several farms and ranches, and the surrounding area is known for its wheat, barley, and hay production. The town is also home to several small businesses, including a grocery store, a hardware store, and a few restaurants.
Tourism is an important part of the local economy, as the town is located near several popular attractions, including the Fort Peck Dam and the Fort Peck Indian Reservation. The town is also home to the Poplar Cultural Center, which is a museum and cultural center dedicated to preserving the history and culture of the Assiniboine and Sioux Tribes of the Fort Peck Indian Reservation.
Demographics
As of the 2010 census, Poplar had a population of 1,743. The racial makeup of the town was 94.3% White, 0.2% African American, 2.3% Native American, 0.2% Asian, 0.1% Pacific Islander, 0.7% from other races, and 2.2% from two or more races. Hispanic or Latino of any race were 2.2% of the population.
The median income for a household in Poplar was $30,938, and the median income for a family was $35,625. The per capita income for the town was $15,845. About 17.2% of the population was below the poverty line.
Conclusion
Poplar, Montana is a small town located in the northeastern corner of the state, near the North Dakota border. It is the county seat of Roosevelt County and is the largest town in the county. The town has a semi-arid climate, with hot summers and cold winters. The economy of Poplar is largely based on agriculture and tourism, and the town is home to several farms and ranches, as well as several small businesses. The population of Poplar was 1,743 as of the 2010 census, and the median income for a household was $30,938. Poplar is home to the Poplar Cultural Center, which is a museum and cultural center dedicated to preserving the history and culture of the Assiniboine and Sioux Tribes of the Fort Peck Indian Reservation.
Common Questions
What is Per Capita Income in Poplar?
Per Capita income in Poplar is $18,848.
What is the Median Family Income in Poplar?
Median Family Income in Poplar is $65,625.
What is the Median Household income in Poplar?
Median Household Income in Poplar is $44,712.
What is Income or Wage Gap in Poplar?
Income or Wage Gap in Poplar is 24.5%.
Women in Poplar earn 75.5 cents for every dollar earned by a man.
What is Family Income Deficit in Poplar?
Family Income Deficit in Poplar is $7,144.
Families that are below poverty line in Poplar earn $7,144 less on average than the poverty threshold level.
What is Inequality or Gini Index in Poplar?
Inequality or Gini Index in Poplar is 0.46.
What is the Total Population of Poplar?
Total Population of Poplar is 758.
What is the Total Male Population of Poplar?
Total Male Population of Poplar is 382.
What is the Total Female Population of Poplar?
Total Female Population of Poplar is 376.
What is the Ratio of Males per 100 Females in Poplar?
There are 101.60 Males per 100 Females in Poplar.
What is the Ratio of Females per 100 Males in Poplar?
There are 98.43 Females per 100 Males in Poplar.
What is the Median Population Age in Poplar?
Median Population Age in Poplar is 28.9 Years.
What is the Average Family Size in Poplar
Average Family Size in Poplar is 4.1 People.
What is the Average Household Size in Poplar
Average Household Size in Poplar is 3.1 People.
How Large is the Labor Force in Poplar?
There are 222 People in the Labor Forcein in Poplar.
What is the Percentage of People in the Labor Force in Poplar?
37.1% of People are in the Labor Force in Poplar.
What is the Unemployment Rate in Poplar?
Unemployment Rate in Poplar is 2.7%.