Plains, MT Map & Demographics
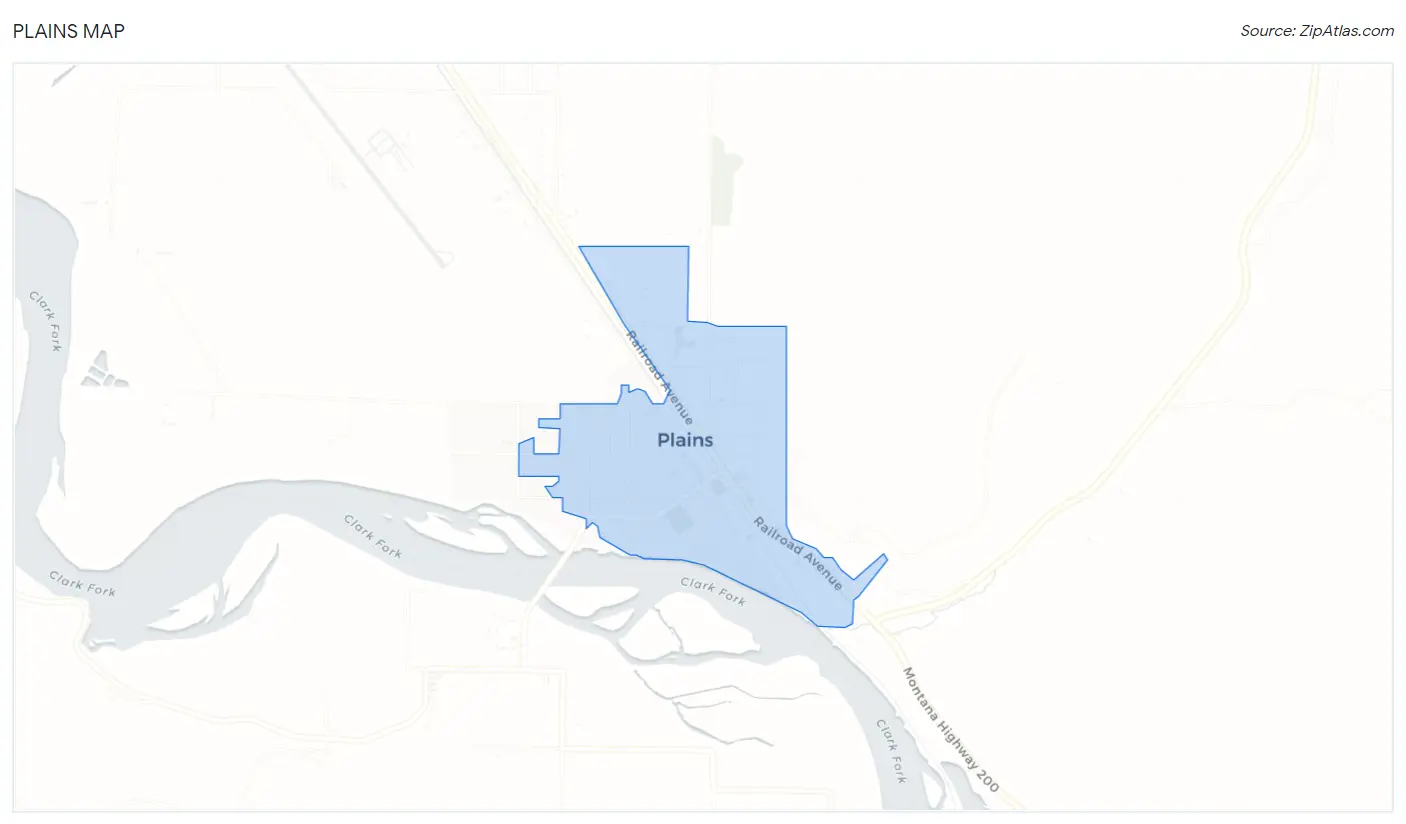
Plains Map
Plains Overview
$28,828
PER CAPITA INCOME
$57,639
AVG FAMILY INCOME
$25,313
AVG HOUSEHOLD INCOME
34.8%
WAGE / INCOME GAP [ % ]
65.2¢/ $1
WAGE / INCOME GAP [ $ ]
0.50
INEQUALITY / GINI INDEX
1,181
TOTAL POPULATION
624
MALE POPULATION
557
FEMALE POPULATION
112.03
MALES / 100 FEMALES
89.26
FEMALES / 100 MALES
43.8
MEDIAN AGE
2.8
AVG FAMILY SIZE
1.8
AVG HOUSEHOLD SIZE
520
LABOR FORCE [ PEOPLE ]
51.6%
PERCENT IN LABOR FORCE
2.5%
UNEMPLOYMENT RATE
Plains Zip Codes
Plains Area Codes
Income in Plains
Income Overview in Plains
Per Capita Income in Plains is $28,828, while median incomes of families and households are $57,639 and $25,313 respectively.
| Characteristic | Number | Measure |
| Per Capita Income | 1,181 | $28,828 |
| Median Family Income | 205 | $57,639 |
| Mean Family Income | 205 | $87,715 |
| Median Household Income | 620 | $25,313 |
| Mean Household Income | 620 | $47,904 |
| Income Deficit | 205 | $0 |
| Wage / Income Gap (%) | 1,181 | 34.83% |
| Wage / Income Gap ($) | 1,181 | 65.17¢ per $1 |
| Gini / Inequality Index | 1,181 | 0.50 |
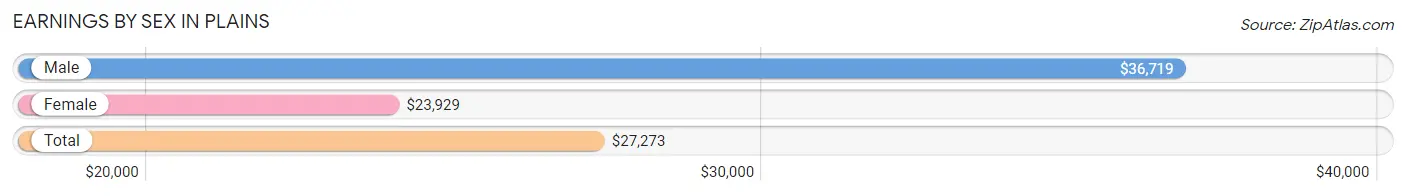
Earnings by Sex in Plains
Average Earnings in Plains are $27,273, $36,719 for men and $23,929 for women, a difference of 34.8%.
| Sex | Number | Average Earnings |
| Male | 368 (58.8%) | $36,719 |
| Female | 258 (41.2%) | $23,929 |
| Total | 626 (100.0%) | $27,273 |
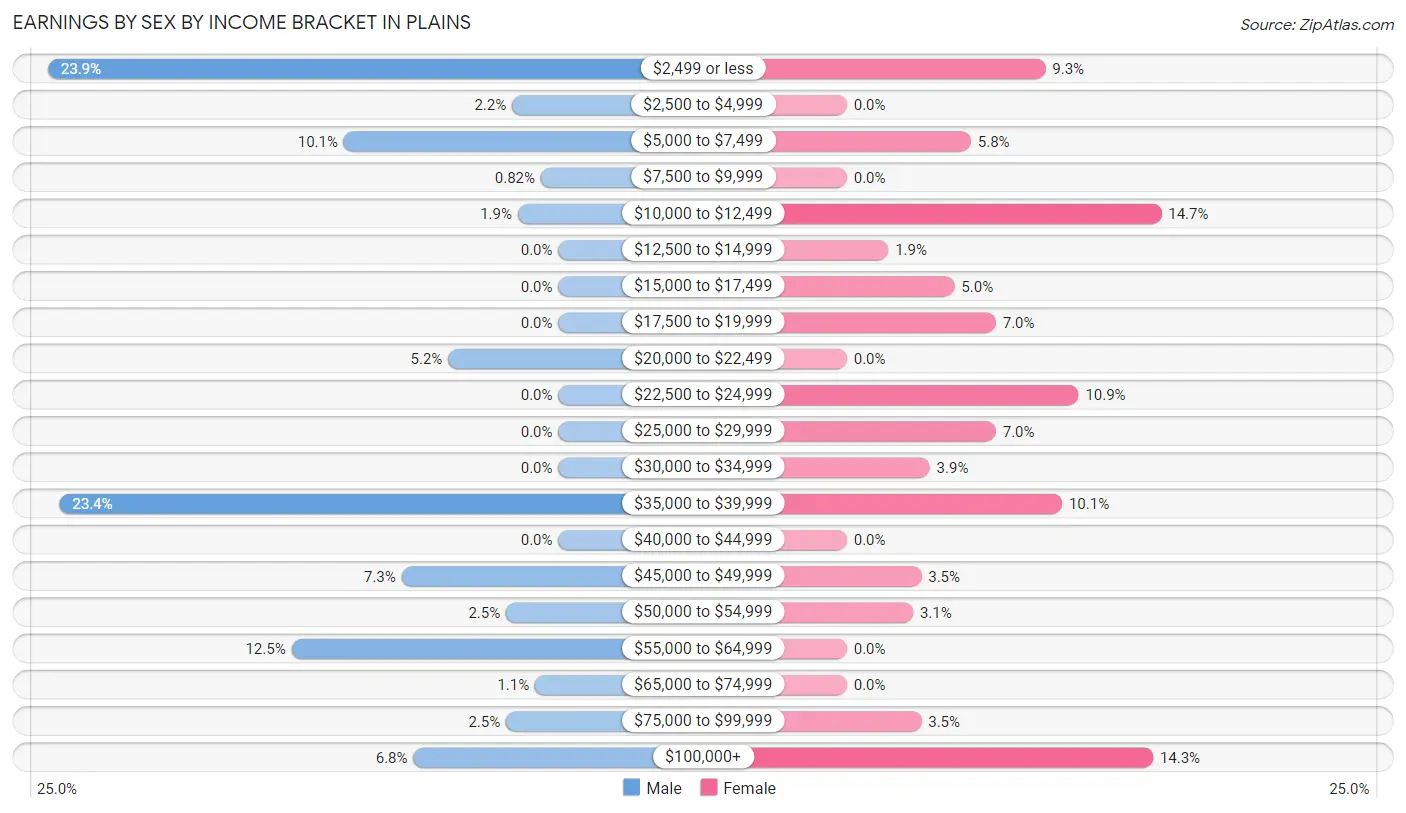
Earnings by Sex by Income Bracket in Plains
The most common earnings brackets in Plains are $2,499 or less for men (88 | 23.9%) and $10,000 to $12,499 for women (38 | 14.7%).
| Income | Male | Female |
| $2,499 or less | 88 (23.9%) | 24 (9.3%) |
| $2,500 to $4,999 | 8 (2.2%) | 0 (0.0%) |
| $5,000 to $7,499 | 37 (10.1%) | 15 (5.8%) |
| $7,500 to $9,999 | 3 (0.8%) | 0 (0.0%) |
| $10,000 to $12,499 | 7 (1.9%) | 38 (14.7%) |
| $12,500 to $14,999 | 0 (0.0%) | 5 (1.9%) |
| $15,000 to $17,499 | 0 (0.0%) | 13 (5.0%) |
| $17,500 to $19,999 | 0 (0.0%) | 18 (7.0%) |
| $20,000 to $22,499 | 19 (5.2%) | 0 (0.0%) |
| $22,500 to $24,999 | 0 (0.0%) | 28 (10.8%) |
| $25,000 to $29,999 | 0 (0.0%) | 18 (7.0%) |
| $30,000 to $34,999 | 0 (0.0%) | 10 (3.9%) |
| $35,000 to $39,999 | 86 (23.4%) | 26 (10.1%) |
| $40,000 to $44,999 | 0 (0.0%) | 0 (0.0%) |
| $45,000 to $49,999 | 27 (7.3%) | 9 (3.5%) |
| $50,000 to $54,999 | 9 (2.5%) | 8 (3.1%) |
| $55,000 to $64,999 | 46 (12.5%) | 0 (0.0%) |
| $65,000 to $74,999 | 4 (1.1%) | 0 (0.0%) |
| $75,000 to $99,999 | 9 (2.5%) | 9 (3.5%) |
| $100,000+ | 25 (6.8%) | 37 (14.3%) |
| Total | 368 (100.0%) | 258 (100.0%) |
Earnings by Sex by Educational Attainment in Plains
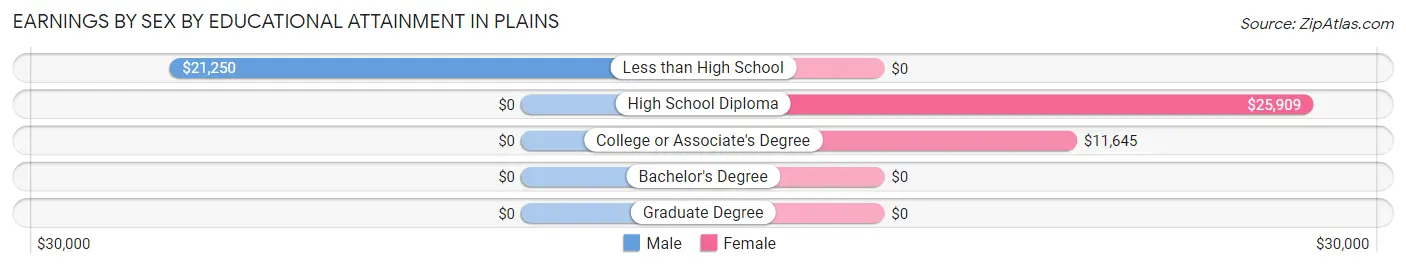
| Educational Attainment | Male Income | Female Income |
| Less than High School | $21,250 | $0 |
| High School Diploma | - | - |
| College or Associate's Degree | - | - |
| Bachelor's Degree | - | - |
| Graduate Degree | - | - |
| Total | - | - |
Family Income in Plains
Family Income Brackets in Plains
According to the Plains family income data, there are 35 families falling into the $15,000 to $24,999 income range, which is the most common income bracket and makes up 17.1% of all families.
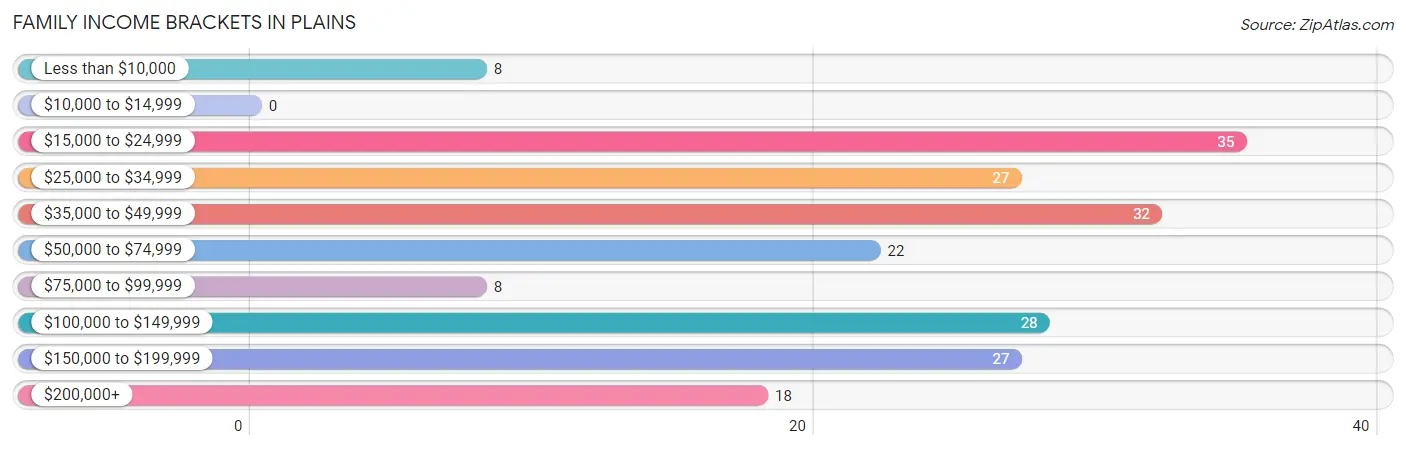
| Income Bracket | # Families | % Families |
| Less than $10,000 | 8 | 3.9% |
| $10,000 to $14,999 | 0 | 0.0% |
| $15,000 to $24,999 | 35 | 17.1% |
| $25,000 to $34,999 | 27 | 13.2% |
| $35,000 to $49,999 | 32 | 15.6% |
| $50,000 to $74,999 | 22 | 10.7% |
| $75,000 to $99,999 | 8 | 3.9% |
| $100,000 to $149,999 | 28 | 13.7% |
| $150,000 to $199,999 | 27 | 13.2% |
| $200,000+ | 18 | 8.8% |
Family Income by Famaliy Size in Plains
4-person families (43 | 21.0%) account for the highest median family income in Plains with $63,393 per family, while 2-person families (101 | 49.3%) have the highest median income of $22,570 per family member.
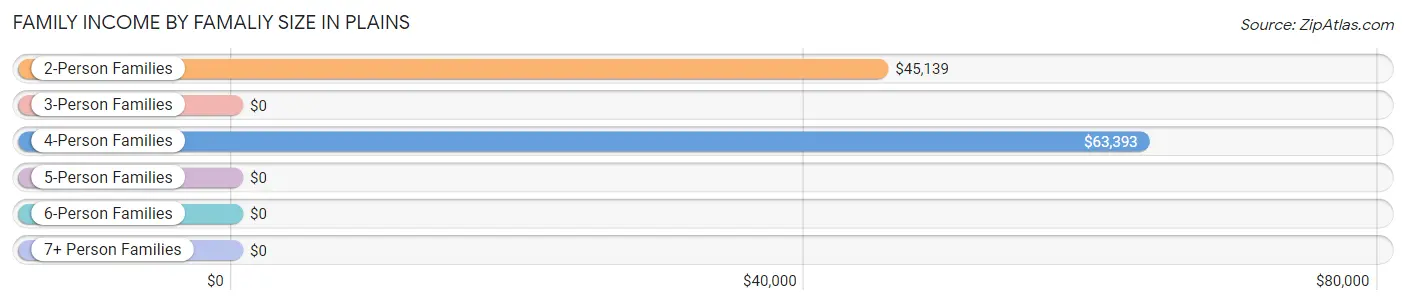
| Income Bracket | # Families | Median Income |
| 2-Person Families | 101 (49.3%) | $45,139 |
| 3-Person Families | 51 (24.9%) | $0 |
| 4-Person Families | 43 (21.0%) | $63,393 |
| 5-Person Families | 10 (4.9%) | $0 |
| 6-Person Families | 0 (0.0%) | $0 |
| 7+ Person Families | 0 (0.0%) | $0 |
| Total | 205 (100.0%) | $57,639 |
Family Income by Number of Earners in Plains
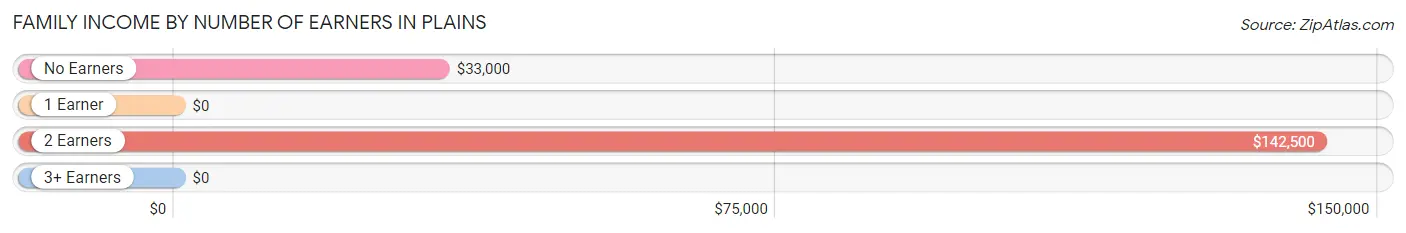
| Number of Earners | # Families | Median Income |
| No Earners | 36 (17.6%) | $33,000 |
| 1 Earner | 89 (43.4%) | $0 |
| 2 Earners | 70 (34.2%) | $142,500 |
| 3+ Earners | 10 (4.9%) | $0 |
| Total | 205 (100.0%) | $57,639 |
Household Income in Plains
Household Income Brackets in Plains
With 188 households falling in the category, the $15,000 to $24,999 income range is the most frequent in Plains, accounting for 30.3% of all households. In contrast, only 18 households (2.9%) fall into the $200,000+ income bracket, making it the least populous group.
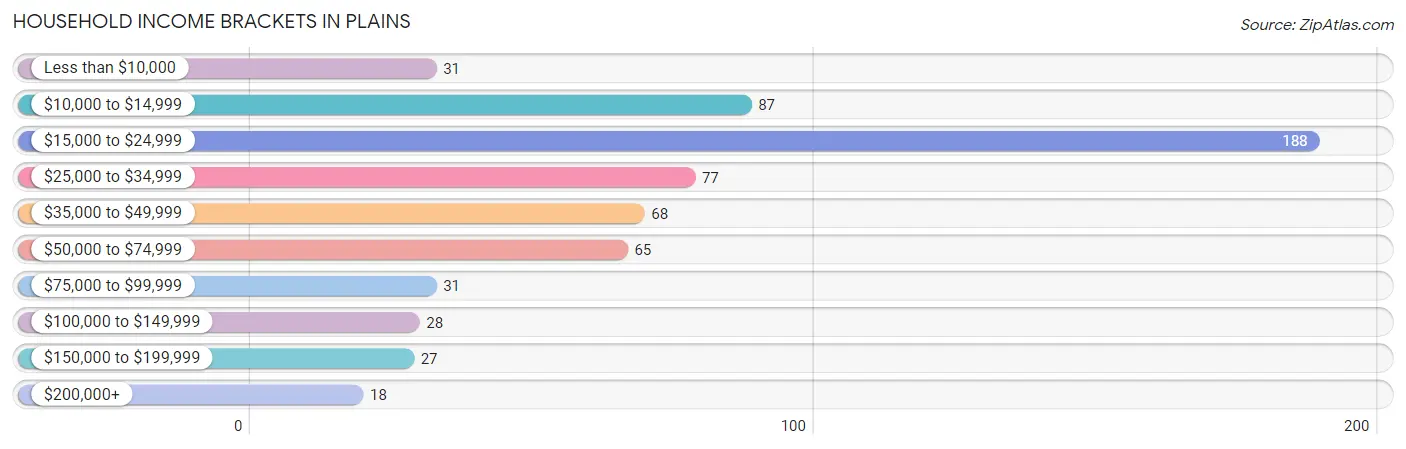
| Income Bracket | # Households | % Households |
| Less than $10,000 | 31 | 5.0% |
| $10,000 to $14,999 | 87 | 14.0% |
| $15,000 to $24,999 | 188 | 30.3% |
| $25,000 to $34,999 | 77 | 12.4% |
| $35,000 to $49,999 | 68 | 11.0% |
| $50,000 to $74,999 | 65 | 10.5% |
| $75,000 to $99,999 | 31 | 5.0% |
| $100,000 to $149,999 | 28 | 4.5% |
| $150,000 to $199,999 | 27 | 4.4% |
| $200,000+ | 18 | 2.9% |
Household Income by Householder Age in Plains
The median household income in Plains is $25,313, with the highest median household income of $46,776 found in the 15 to 24 years age bracket for the primary householder. A total of 61 households (9.8%) fall into this category. Meanwhile, the 25 to 44 years age bracket for the primary householder has the lowest median household income of $21,936, with 203 households (32.7%) in this group.
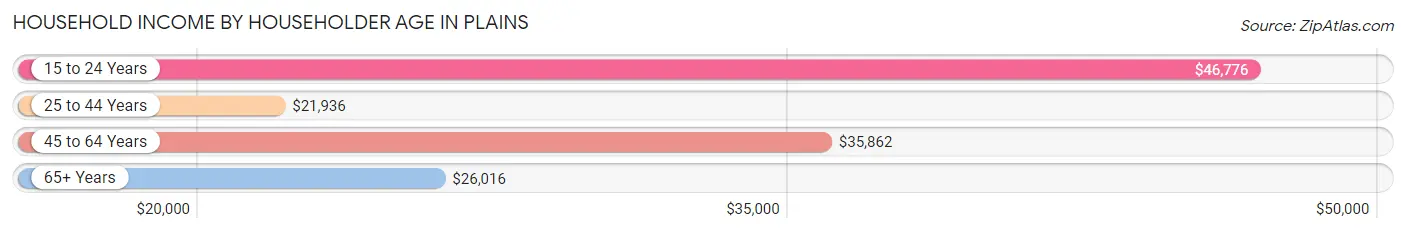
| Income Bracket | # Households | Median Income |
| 15 to 24 Years | 61 (9.8%) | $46,776 |
| 25 to 44 Years | 203 (32.7%) | $21,936 |
| 45 to 64 Years | 162 (26.1%) | $35,862 |
| 65+ Years | 194 (31.3%) | $26,016 |
| Total | 620 (100.0%) | $25,313 |
Poverty in Plains
Income Below Poverty by Sex and Age in Plains
With 13.8% poverty level for males and 26.8% for females among the residents of Plains, 45 to 54 year old males and 15 year old females are the most vulnerable to poverty, with 11 males (47.8%) and 20 females (100.0%) in their respective age groups living below the poverty level.
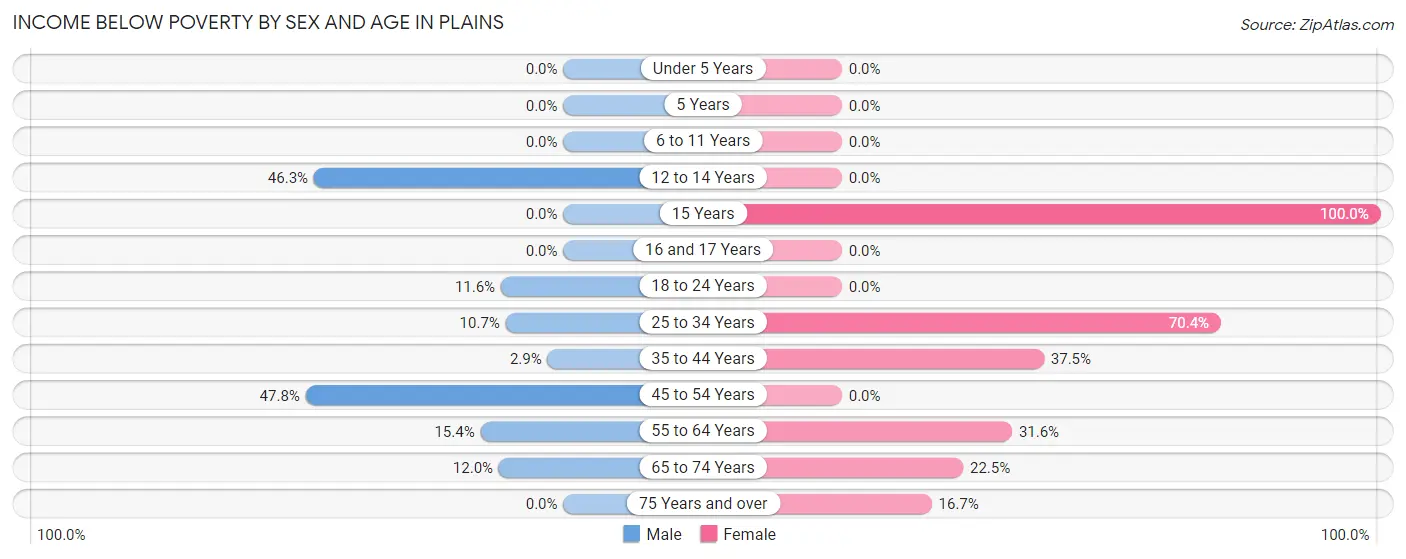
| Age Bracket | Male | Female |
| Under 5 Years | 0 (0.0%) | 0 (0.0%) |
| 5 Years | 0 (0.0%) | 0 (0.0%) |
| 6 to 11 Years | 0 (0.0%) | 0 (0.0%) |
| 12 to 14 Years | 25 (46.3%) | 0 (0.0%) |
| 15 Years | 0 (0.0%) | 20 (100.0%) |
| 16 and 17 Years | 0 (0.0%) | 0 (0.0%) |
| 18 to 24 Years | 11 (11.6%) | 0 (0.0%) |
| 25 to 34 Years | 3 (10.7%) | 38 (70.4%) |
| 35 to 44 Years | 3 (2.9%) | 33 (37.5%) |
| 45 to 54 Years | 11 (47.8%) | 0 (0.0%) |
| 55 to 64 Years | 20 (15.4%) | 30 (31.6%) |
| 65 to 74 Years | 11 (12.0%) | 9 (22.5%) |
| 75 Years and over | 0 (0.0%) | 16 (16.7%) |
| Total | 84 (13.8%) | 146 (26.8%) |
Income Above Poverty by Sex and Age in Plains
According to the poverty statistics in Plains, males aged under 5 years and females aged under 5 years are the age groups that are most secure financially, with 100.0% of males and 100.0% of females in these age groups living above the poverty line.
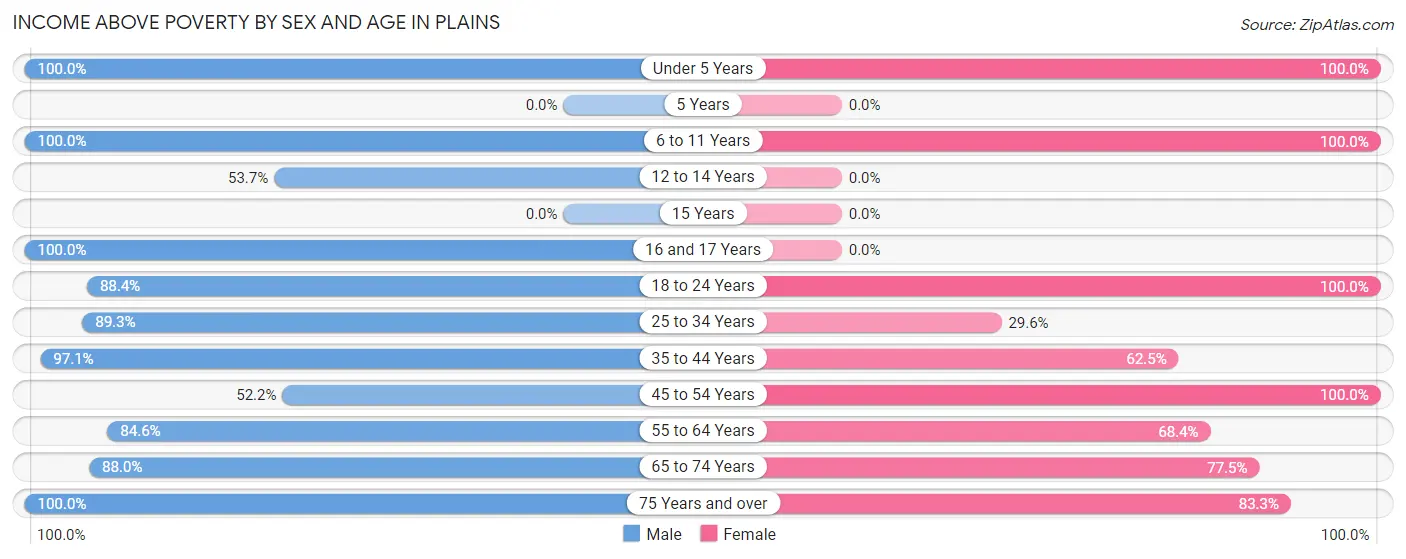
| Age Bracket | Male | Female |
| Under 5 Years | 18 (100.0%) | 7 (100.0%) |
| 5 Years | 0 (0.0%) | 0 (0.0%) |
| 6 to 11 Years | 13 (100.0%) | 54 (100.0%) |
| 12 to 14 Years | 29 (53.7%) | 0 (0.0%) |
| 15 Years | 0 (0.0%) | 0 (0.0%) |
| 16 and 17 Years | 21 (100.0%) | 0 (0.0%) |
| 18 to 24 Years | 84 (88.4%) | 46 (100.0%) |
| 25 to 34 Years | 25 (89.3%) | 16 (29.6%) |
| 35 to 44 Years | 99 (97.1%) | 55 (62.5%) |
| 45 to 54 Years | 12 (52.2%) | 44 (100.0%) |
| 55 to 64 Years | 110 (84.6%) | 65 (68.4%) |
| 65 to 74 Years | 81 (88.0%) | 31 (77.5%) |
| 75 Years and over | 32 (100.0%) | 80 (83.3%) |
| Total | 524 (86.2%) | 398 (73.2%) |
Income Below Poverty Among Married-Couple Families in Plains
The poverty statistics for married-couple families in Plains show that 5.2% or 8 of the total 155 families live below the poverty line. Families with no children have the highest poverty rate of 8.8%, comprising of 8 families. On the other hand, families with 1 or 2 children have the lowest poverty rate of 0.0%, which includes 0 families.
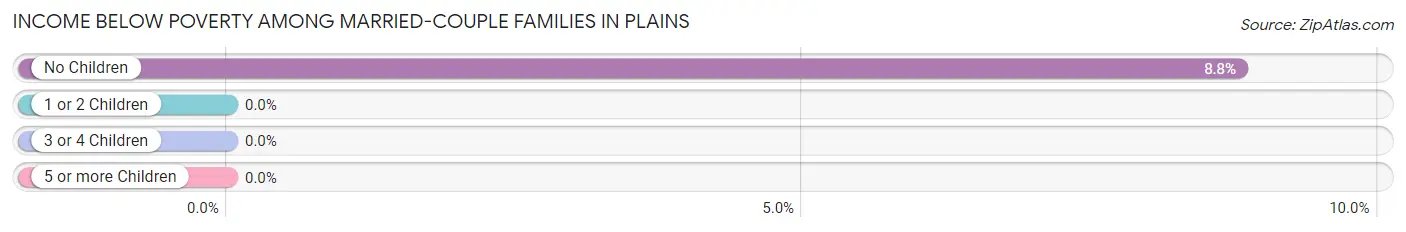
| Children | Above Poverty | Below Poverty |
| No Children | 83 (91.2%) | 8 (8.8%) |
| 1 or 2 Children | 64 (100.0%) | 0 (0.0%) |
| 3 or 4 Children | 0 (0.0%) | 0 (0.0%) |
| 5 or more Children | 0 (0.0%) | 0 (0.0%) |
| Total | 147 (94.8%) | 8 (5.2%) |
Income Below Poverty Among Single-Parent Households in Plains
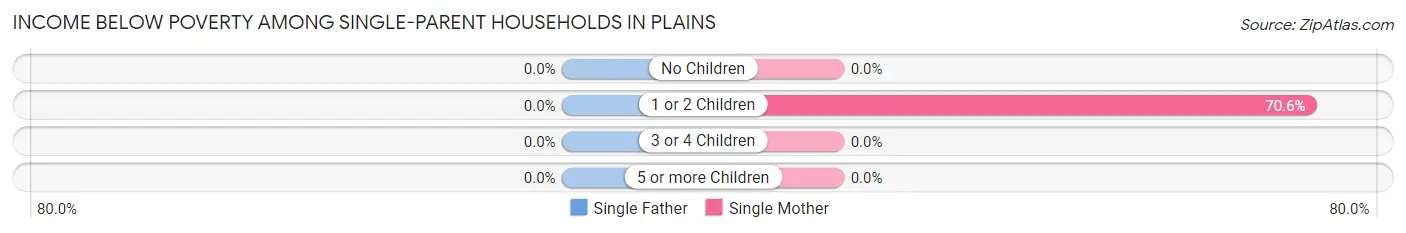
| Children | Single Father | Single Mother |
| No Children | 0 (0.0%) | 0 (0.0%) |
| 1 or 2 Children | 0 (0.0%) | 24 (70.6%) |
| 3 or 4 Children | 0 (0.0%) | 0 (0.0%) |
| 5 or more Children | 0 (0.0%) | 0 (0.0%) |
| Total | 0 (0.0%) | 24 (48.0%) |
Income Below Poverty Among Married-Couple vs Single-Parent Households in Plains
The poverty data for Plains shows that 8 of the married-couple family households (5.2%) and 24 of the single-parent households (48.0%) are living below the poverty level. Within the married-couple family households, those with no children have the highest poverty rate, with 8 households (8.8%) falling below the poverty line. Among the single-parent households, those with 1 or 2 children have the highest poverty rate, with 24 household (70.6%) living below poverty.
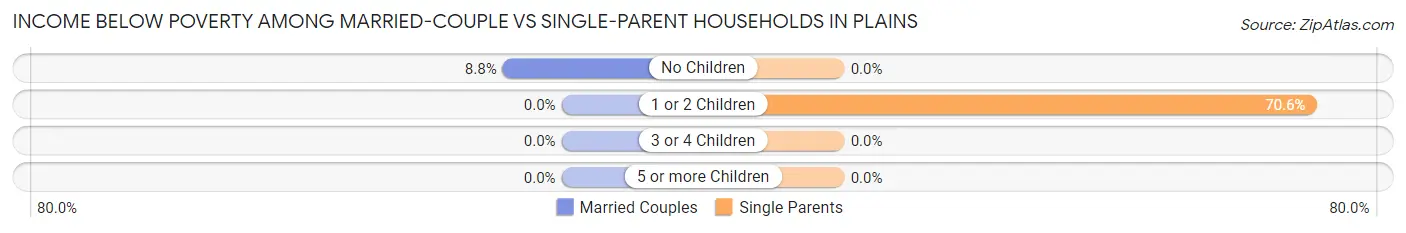
| Children | Married-Couple Families | Single-Parent Households |
| No Children | 8 (8.8%) | 0 (0.0%) |
| 1 or 2 Children | 0 (0.0%) | 24 (70.6%) |
| 3 or 4 Children | 0 (0.0%) | 0 (0.0%) |
| 5 or more Children | 0 (0.0%) | 0 (0.0%) |
| Total | 8 (5.2%) | 24 (48.0%) |
Race in Plains
The most populous races in Plains are White / Caucasian (1,053 | 89.2%), Two or more Races (84 | 7.1%), and Native / Alaskan (40 | 3.4%).
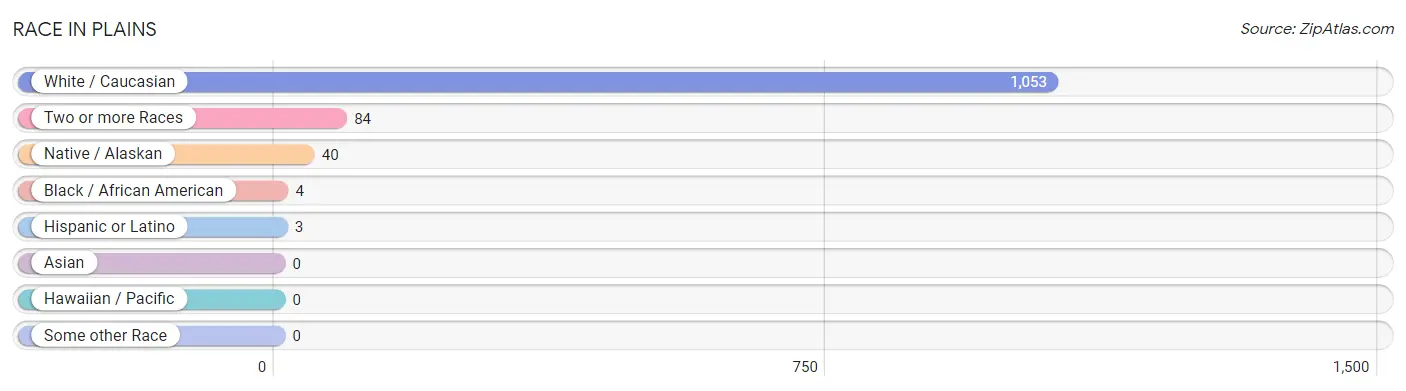
| Race | # Population | % Population |
| Asian | 0 | 0.0% |
| Black / African American | 4 | 0.3% |
| Hawaiian / Pacific | 0 | 0.0% |
| Hispanic or Latino | 3 | 0.3% |
| Native / Alaskan | 40 | 3.4% |
| White / Caucasian | 1,053 | 89.2% |
| Two or more Races | 84 | 7.1% |
| Some other Race | 0 | 0.0% |
| Total | 1,181 | 100.0% |
Ancestry in Plains
The most populous ancestries reported in Plains are German (325 | 27.5%), Norwegian (163 | 13.8%), Irish (149 | 12.6%), Swedish (130 | 11.0%), and American (108 | 9.1%), together accounting for 74.1% of all Plains residents.
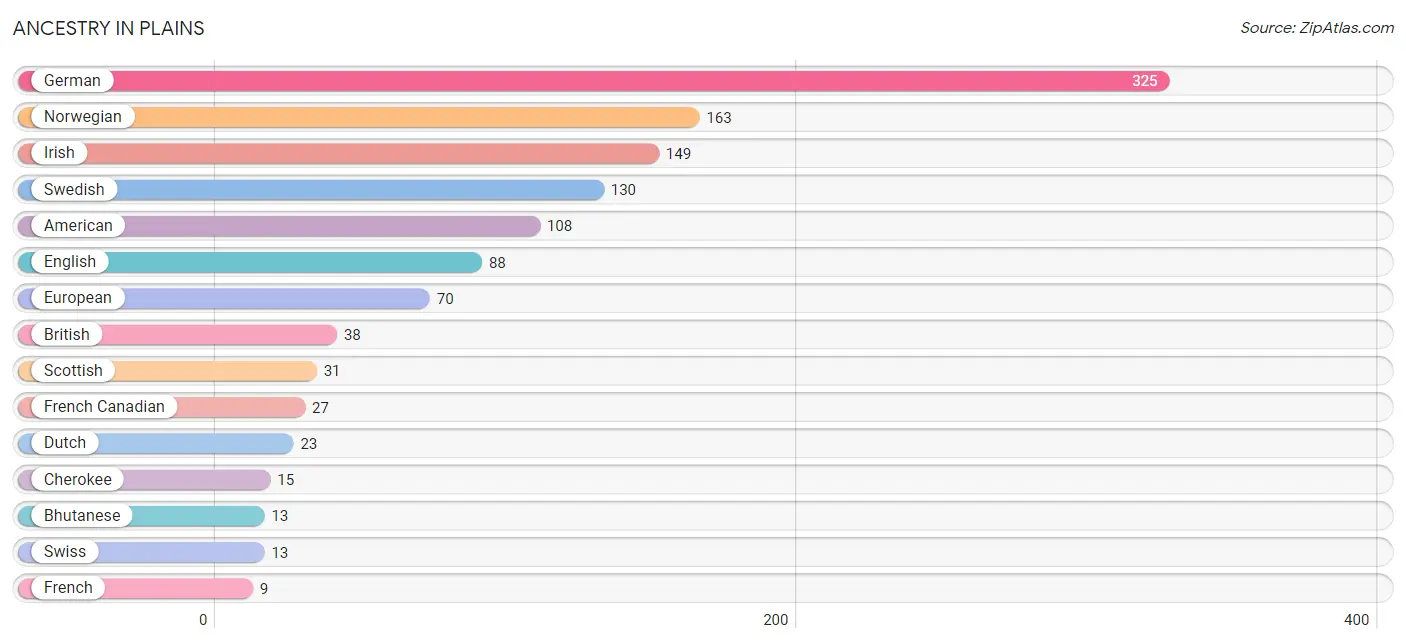
| Ancestry | # Population | % Population |
| American | 108 | 9.1% |
| Bhutanese | 13 | 1.1% |
| Blackfeet | 1 | 0.1% |
| British | 38 | 3.2% |
| Cherokee | 15 | 1.3% |
| Crow | 1 | 0.1% |
| Dutch | 23 | 1.9% |
| English | 88 | 7.4% |
| European | 70 | 5.9% |
| French | 9 | 0.8% |
| French Canadian | 27 | 2.3% |
| German | 325 | 27.5% |
| Irish | 149 | 12.6% |
| Italian | 4 | 0.3% |
| Korean | 4 | 0.3% |
| Mexican | 3 | 0.3% |
| Norwegian | 163 | 13.8% |
| Samoan | 3 | 0.3% |
| Scandinavian | 9 | 0.8% |
| Scottish | 31 | 2.6% |
| Swedish | 130 | 11.0% |
| Swiss | 13 | 1.1% | View All 22 Rows |
Immigrants in Plains
The most numerous immigrant groups reported in Plains came from Canada (8 | 0.7%), Asia (4 | 0.3%), England (4 | 0.3%), Europe (4 | 0.3%), and Northern Europe (4 | 0.3%), together accounting for 2.0% of all Plains residents.
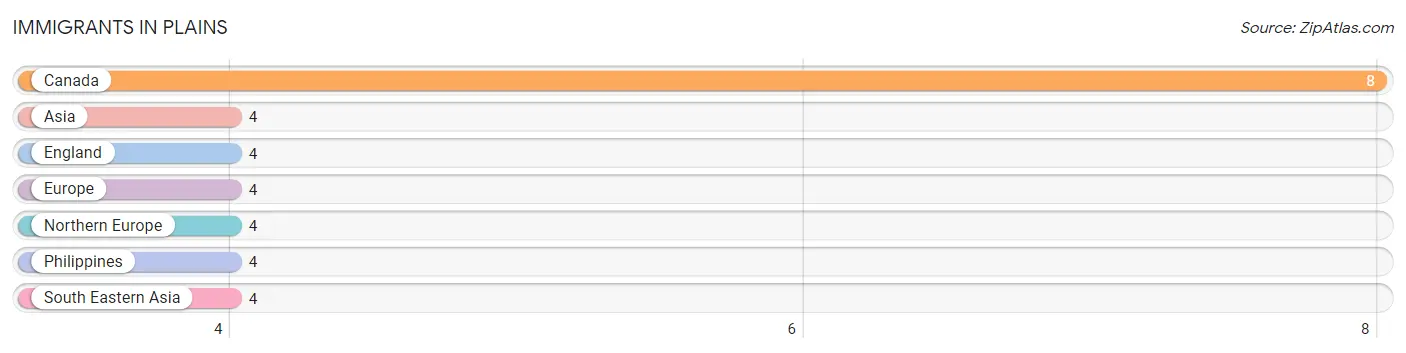
| Immigration Origin | # Population | % Population |
| Asia | 4 | 0.3% |
| Canada | 8 | 0.7% |
| England | 4 | 0.3% |
| Europe | 4 | 0.3% |
| Northern Europe | 4 | 0.3% |
| Philippines | 4 | 0.3% |
| South Eastern Asia | 4 | 0.3% | View All 7 Rows |
Sex and Age in Plains
Sex and Age in Plains
The most populous age groups in Plains are 55 to 59 Years (91 | 14.6%) for men and 35 to 39 Years (79 | 14.2%) for women.
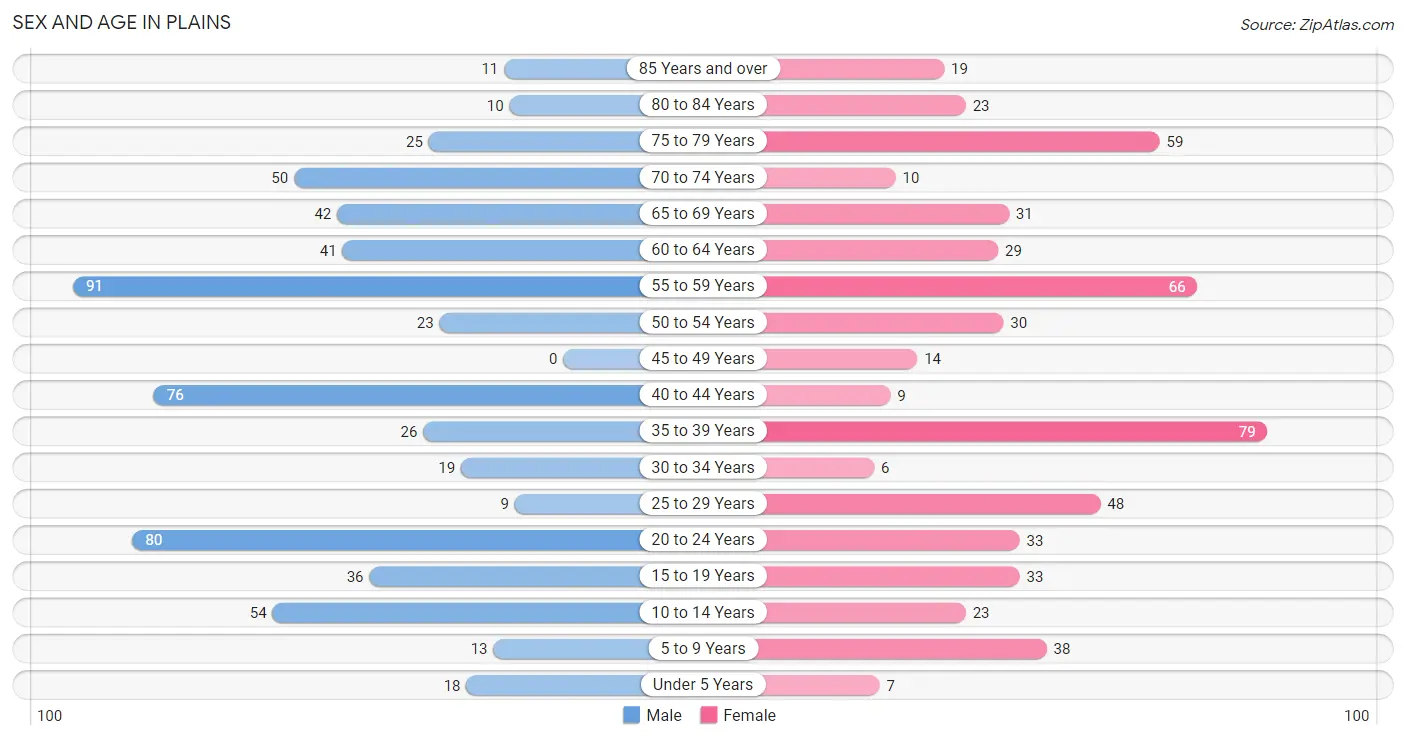
| Age Bracket | Male | Female |
| Under 5 Years | 18 (2.9%) | 7 (1.3%) |
| 5 to 9 Years | 13 (2.1%) | 38 (6.8%) |
| 10 to 14 Years | 54 (8.6%) | 23 (4.1%) |
| 15 to 19 Years | 36 (5.8%) | 33 (5.9%) |
| 20 to 24 Years | 80 (12.8%) | 33 (5.9%) |
| 25 to 29 Years | 9 (1.4%) | 48 (8.6%) |
| 30 to 34 Years | 19 (3.0%) | 6 (1.1%) |
| 35 to 39 Years | 26 (4.2%) | 79 (14.2%) |
| 40 to 44 Years | 76 (12.2%) | 9 (1.6%) |
| 45 to 49 Years | 0 (0.0%) | 14 (2.5%) |
| 50 to 54 Years | 23 (3.7%) | 30 (5.4%) |
| 55 to 59 Years | 91 (14.6%) | 66 (11.8%) |
| 60 to 64 Years | 41 (6.6%) | 29 (5.2%) |
| 65 to 69 Years | 42 (6.7%) | 31 (5.6%) |
| 70 to 74 Years | 50 (8.0%) | 10 (1.8%) |
| 75 to 79 Years | 25 (4.0%) | 59 (10.6%) |
| 80 to 84 Years | 10 (1.6%) | 23 (4.1%) |
| 85 Years and over | 11 (1.8%) | 19 (3.4%) |
| Total | 624 (100.0%) | 557 (100.0%) |
Families and Households in Plains
Median Family Size in Plains
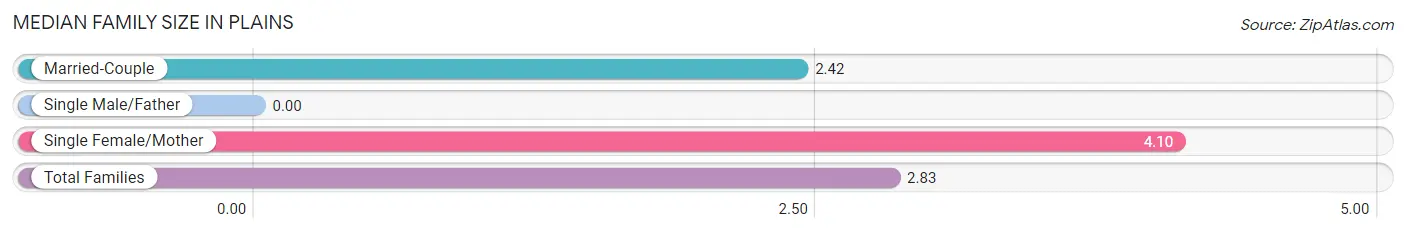
| Family Type | # Families | Family Size |
| Married-Couple | 155 (75.6%) | 2.42 |
| Single Male/Father | 0 (0.0%) | - |
| Single Female/Mother | 50 (24.4%) | 4.10 |
| Total Families | 205 (100.0%) | 2.83 |
Median Household Size in Plains
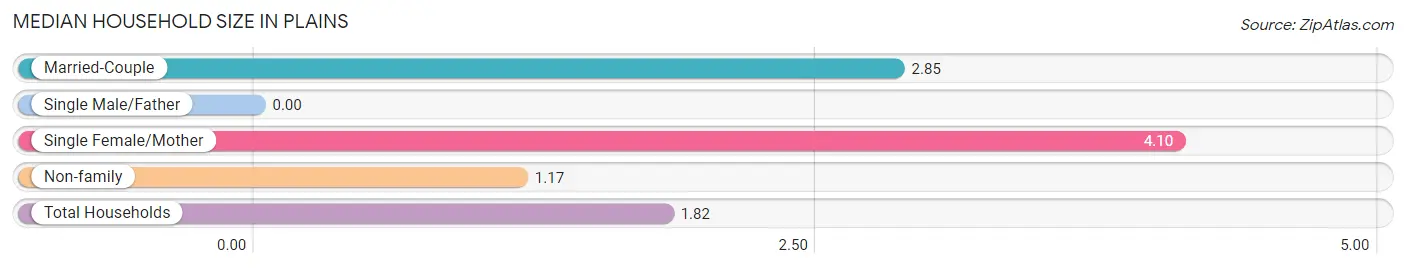
| Household Type | # Households | Household Size |
| Married-Couple | 155 (25.0%) | 2.85 |
| Single Male/Father | 0 (0.0%) | - |
| Single Female/Mother | 50 (8.1%) | 4.10 |
| Non-family | 415 (66.9%) | 1.17 |
| Total Households | 620 (100.0%) | 1.82 |
Household Size by Marriage Status in Plains
Out of a total of 620 households in Plains, 205 (33.1%) are family households, while 415 (66.9%) are nonfamily households. The most numerous type of family households are 2-person households, comprising 88, and the most common type of nonfamily households are 1-person households, comprising 358.
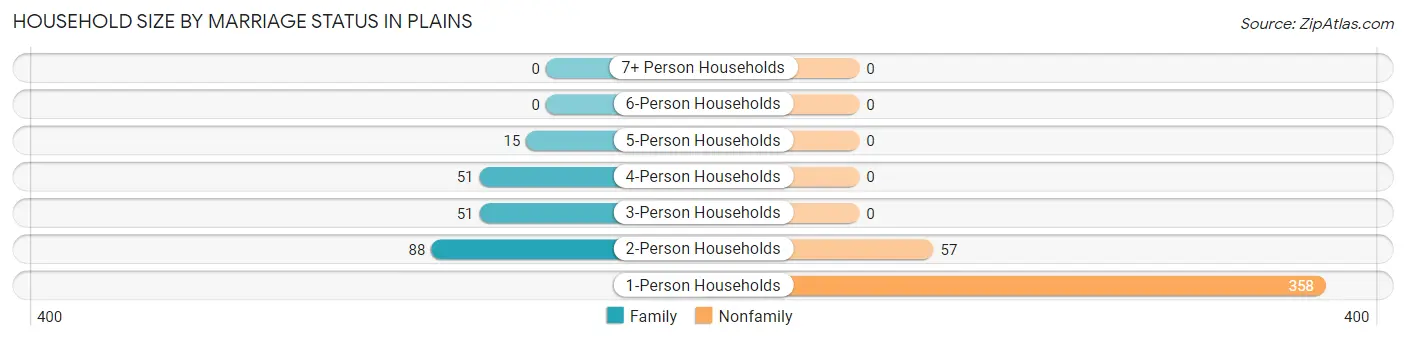
| Household Size | Family Households | Nonfamily Households |
| 1-Person Households | - | 358 (57.7%) |
| 2-Person Households | 88 (14.2%) | 57 (9.2%) |
| 3-Person Households | 51 (8.2%) | 0 (0.0%) |
| 4-Person Households | 51 (8.2%) | 0 (0.0%) |
| 5-Person Households | 15 (2.4%) | 0 (0.0%) |
| 6-Person Households | 0 (0.0%) | 0 (0.0%) |
| 7+ Person Households | 0 (0.0%) | 0 (0.0%) |
| Total | 205 (33.1%) | 415 (66.9%) |
Female Fertility in Plains
Fertility by Age in Plains
| Age Bracket | Women with Births | Births / 1,000 Women |
| 15 to 19 years | 0 (0.0%) | 0.0 |
| 20 to 34 years | 0 (0.0%) | 0.0 |
| 35 to 50 years | 0 (0.0%) | 0.0 |
| Total | 0 (0.0%) | 0.0 |
Fertility by Age by Marriage Status in Plains
| Age Bracket | Married | Unmarried |
| 15 to 19 years | 0 (0.0%) | 0 (0.0%) |
| 20 to 34 years | 0 (0.0%) | 0 (0.0%) |
| 35 to 50 years | 0 (0.0%) | 0 (0.0%) |
| Total | 0 (0.0%) | 0 (0.0%) |
Fertility by Education in Plains
| Educational Attainment | Women with Births | Births / 1,000 Women |
| Less than High School | 0 (0.0%) | 0.0 |
| High School Diploma | 0 (0.0%) | 0.0 |
| College or Associate's Degree | 0 (0.0%) | 0.0 |
| Bachelor's Degree | 0 (0.0%) | 0.0 |
| Graduate Degree | 0 (0.0%) | 0.0 |
| Total | 0 (0.0%) | 0.0 |
Fertility by Education by Marriage Status in Plains
| Educational Attainment | Married | Unmarried |
| Less than High School | 0 (0.0%) | 0 (0.0%) |
| High School Diploma | 0 (0.0%) | 0 (0.0%) |
| College or Associate's Degree | 0 (0.0%) | 0 (0.0%) |
| Bachelor's Degree | 0 (0.0%) | 0 (0.0%) |
| Graduate Degree | 0 (0.0%) | 0 (0.0%) |
| Total | 0 (0.0%) | 0 (0.0%) |
Employment Characteristics in Plains
Employment by Class of Employer in Plains
Among the 507 employed individuals in Plains, private company employees (341 | 67.3%), self-employed (not incorporated) (58 | 11.4%), and federal government employees (54 | 10.6%) make up the most common classes of employment.
| Employer Class | # Employees | % Employees |
| Private Company Employees | 341 | 67.3% |
| Self-Employed (Incorporated) | 0 | 0.0% |
| Self-Employed (Not Incorporated) | 58 | 11.4% |
| Not-for-profit Organizations | 27 | 5.3% |
| Local Government Employees | 19 | 3.7% |
| State Government Employees | 8 | 1.6% |
| Federal Government Employees | 54 | 10.6% |
| Unpaid Family Workers | 0 | 0.0% |
| Total | 507 | 100.0% |
Employment Status by Age in Plains
According to the labor force statistics for Plains, out of the total population over 16 years of age (1,008), 51.6% or 520 individuals are in the labor force, with 2.5% or 13 of them unemployed. The age group with the highest labor force participation rate is 25 to 29 years, with 100.0% or 57 individuals in the labor force. Within the labor force, the 45 to 54 years age range has the highest percentage of unemployed individuals, with 29.5% or 13 of them being unemployed.
| Age Bracket | In Labor Force | Unemployed |
| 16 to 19 Years | 42 (85.7%) | 0 (0.0%) |
| 20 to 24 Years | 87 (77.0%) | 0 (0.0%) |
| 25 to 29 Years | 57 (100.0%) | 0 (0.0%) |
| 30 to 34 Years | 25 (100.0%) | 0 (0.0%) |
| 35 to 44 Years | 111 (58.4%) | 0 (0.0%) |
| 45 to 54 Years | 44 (65.7%) | 13 (29.5%) |
| 55 to 59 Years | 106 (67.5%) | 0 (0.0%) |
| 60 to 64 Years | 27 (38.6%) | 0 (0.0%) |
| 65 to 74 Years | 8 (6.0%) | 0 (0.0%) |
| 75 Years and over | 13 (8.8%) | 0 (0.0%) |
| Total | 520 (51.6%) | 13 (2.5%) |
Employment Status by Educational Attainment in Plains
According to labor force statistics for Plains, 65.4% of individuals (370) out of the total population between 25 and 64 years of age (566) are in the labor force, with 3.5% or 13 of them being unemployed. The group with the highest labor force participation rate are those with the educational attainment of bachelor's degree or higher, with 100.0% or 66 individuals in the labor force. Within the labor force, individuals with less than high school education have the highest percentage of unemployment, with 34.2% or 13 of them being unemployed.
| Educational Attainment | In Labor Force | Unemployed |
| Less than High School | 38 (60.3%) | 22 (34.2%) |
| High School Diploma | 209 (58.4%) | 0 (0.0%) |
| College / Associate Degree | 57 (72.2%) | 0 (0.0%) |
| Bachelor's Degree or higher | 66 (100.0%) | 0 (0.0%) |
| Total | 370 (65.4%) | 20 (3.5%) |
Employment Occupations by Sex in Plains
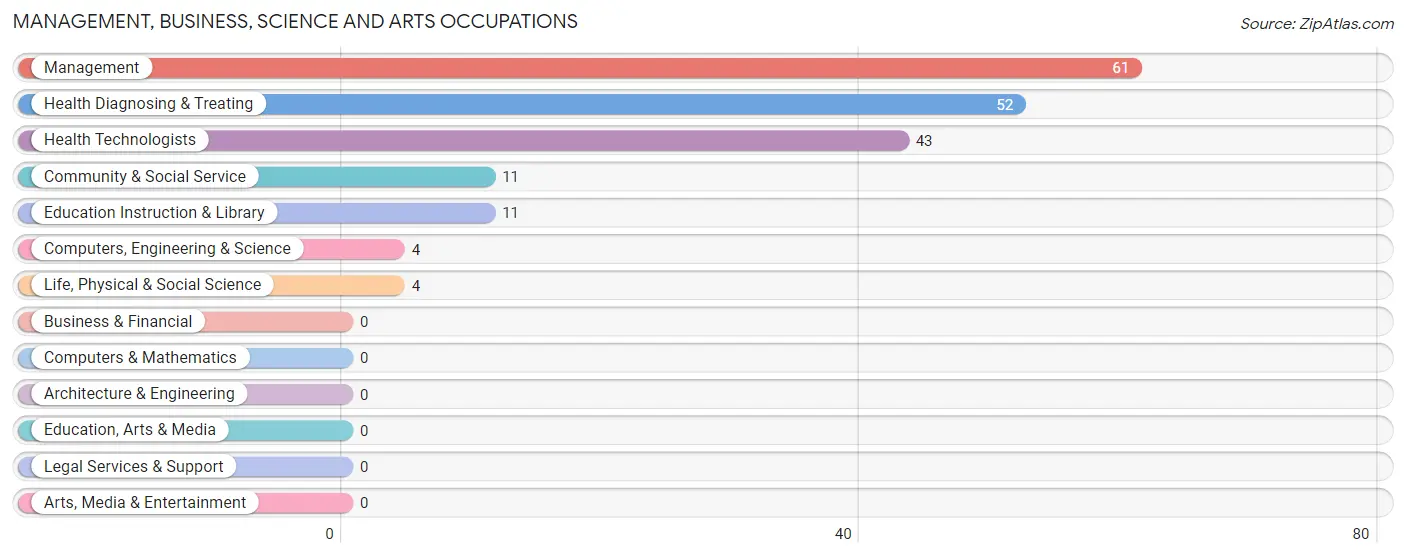
Management, Business, Science and Arts Occupations
The most common Management, Business, Science and Arts occupations in Plains are Management (61 | 12.0%), Health Diagnosing & Treating (52 | 10.3%), Health Technologists (43 | 8.5%), Community & Social Service (11 | 2.2%), and Education Instruction & Library (11 | 2.2%).
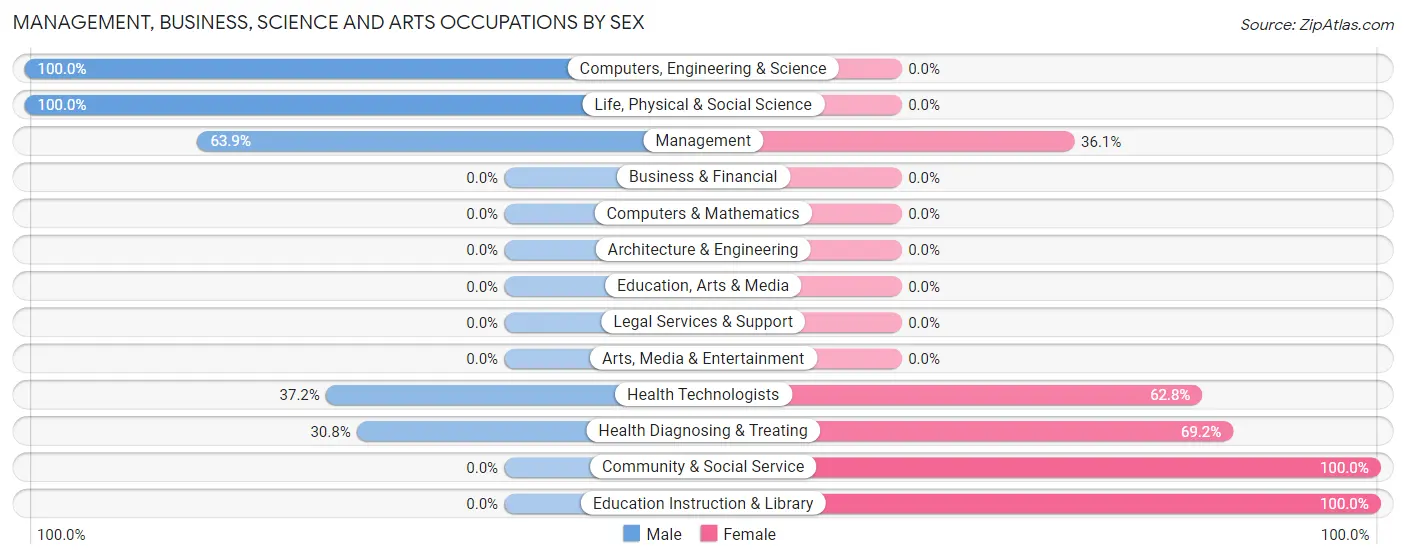
Management, Business, Science and Arts Occupations by Sex
Within the Management, Business, Science and Arts occupations in Plains, the most male-oriented occupations are Computers, Engineering & Science (100.0%), Life, Physical & Social Science (100.0%), and Management (63.9%), while the most female-oriented occupations are Community & Social Service (100.0%), Education Instruction & Library (100.0%), and Health Diagnosing & Treating (69.2%).
| Occupation | Male | Female |
| Management | 39 (63.9%) | 22 (36.1%) |
| Business & Financial | 0 (0.0%) | 0 (0.0%) |
| Computers, Engineering & Science | 4 (100.0%) | 0 (0.0%) |
| Computers & Mathematics | 0 (0.0%) | 0 (0.0%) |
| Architecture & Engineering | 0 (0.0%) | 0 (0.0%) |
| Life, Physical & Social Science | 4 (100.0%) | 0 (0.0%) |
| Community & Social Service | 0 (0.0%) | 11 (100.0%) |
| Education, Arts & Media | 0 (0.0%) | 0 (0.0%) |
| Legal Services & Support | 0 (0.0%) | 0 (0.0%) |
| Education Instruction & Library | 0 (0.0%) | 11 (100.0%) |
| Arts, Media & Entertainment | 0 (0.0%) | 0 (0.0%) |
| Health Diagnosing & Treating | 16 (30.8%) | 36 (69.2%) |
| Health Technologists | 16 (37.2%) | 27 (62.8%) |
| Total (Category) | 59 (46.1%) | 69 (53.9%) |
| Total (Overall) | 283 (55.8%) | 224 (44.2%) |
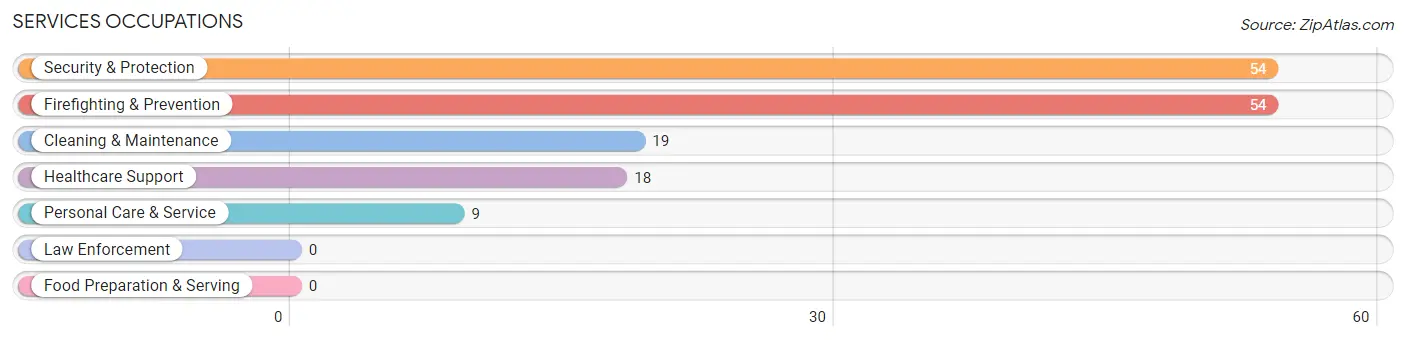
Services Occupations
The most common Services occupations in Plains are Security & Protection (54 | 10.6%), Firefighting & Prevention (54 | 10.6%), Cleaning & Maintenance (19 | 3.7%), Healthcare Support (18 | 3.5%), and Personal Care & Service (9 | 1.8%).
Services Occupations by Sex
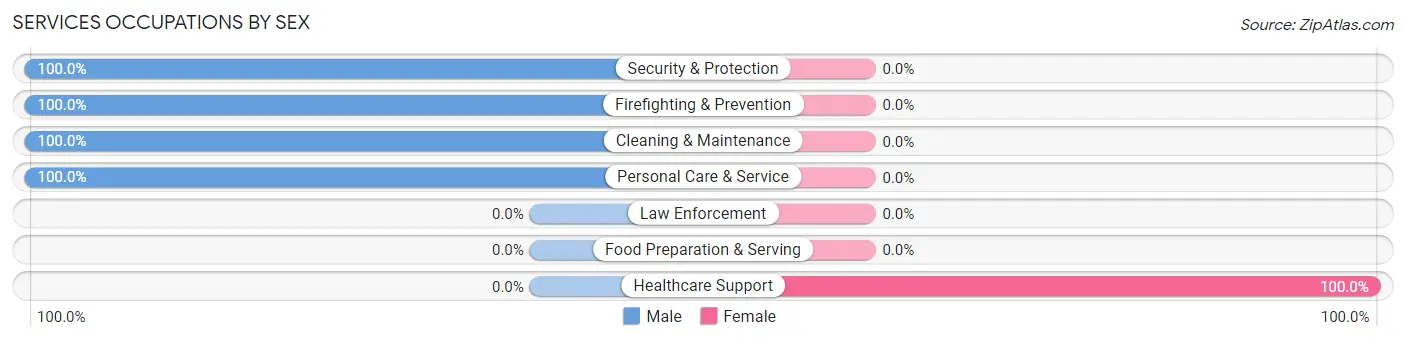
| Occupation | Male | Female |
| Healthcare Support | 0 (0.0%) | 18 (100.0%) |
| Security & Protection | 54 (100.0%) | 0 (0.0%) |
| Firefighting & Prevention | 54 (100.0%) | 0 (0.0%) |
| Law Enforcement | 0 (0.0%) | 0 (0.0%) |
| Food Preparation & Serving | 0 (0.0%) | 0 (0.0%) |
| Cleaning & Maintenance | 19 (100.0%) | 0 (0.0%) |
| Personal Care & Service | 9 (100.0%) | 0 (0.0%) |
| Total (Category) | 82 (82.0%) | 18 (18.0%) |
| Total (Overall) | 283 (55.8%) | 224 (44.2%) |
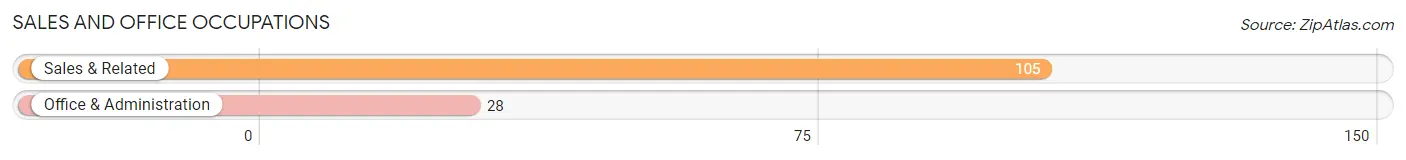
Sales and Office Occupations
The most common Sales and Office occupations in Plains are Sales & Related (105 | 20.7%), and Office & Administration (28 | 5.5%).
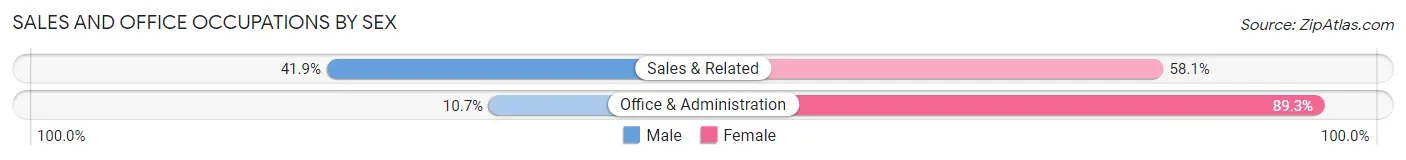
Sales and Office Occupations by Sex
| Occupation | Male | Female |
| Sales & Related | 44 (41.9%) | 61 (58.1%) |
| Office & Administration | 3 (10.7%) | 25 (89.3%) |
| Total (Category) | 47 (35.3%) | 86 (64.7%) |
| Total (Overall) | 283 (55.8%) | 224 (44.2%) |
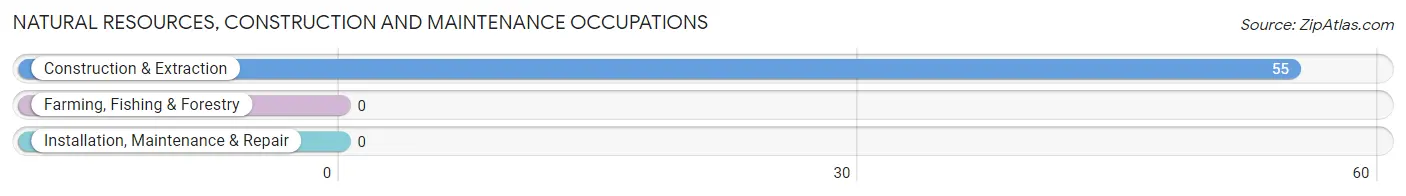
Natural Resources, Construction and Maintenance Occupations
The most common Natural Resources, Construction and Maintenance occupations in Plains are , and Construction & Extraction (55 | 10.8%).
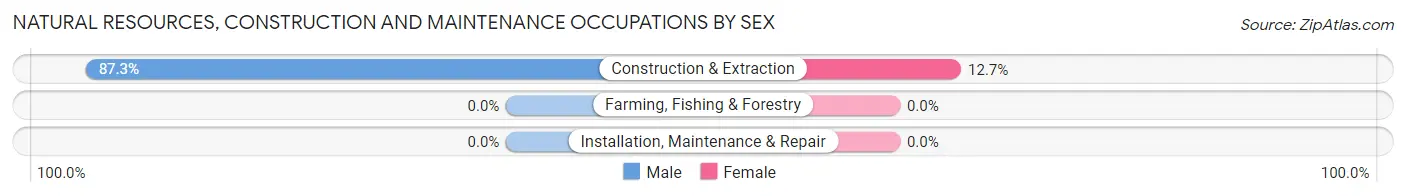
Natural Resources, Construction and Maintenance Occupations by Sex
| Occupation | Male | Female |
| Farming, Fishing & Forestry | 0 (0.0%) | 0 (0.0%) |
| Construction & Extraction | 48 (87.3%) | 7 (12.7%) |
| Installation, Maintenance & Repair | 0 (0.0%) | 0 (0.0%) |
| Total (Category) | 48 (87.3%) | 7 (12.7%) |
| Total (Overall) | 283 (55.8%) | 224 (44.2%) |
Production, Transportation and Moving Occupations
The most common Production, Transportation and Moving occupations in Plains are Production (50 | 9.9%), Transportation (24 | 4.7%), and Material Moving (17 | 3.4%).
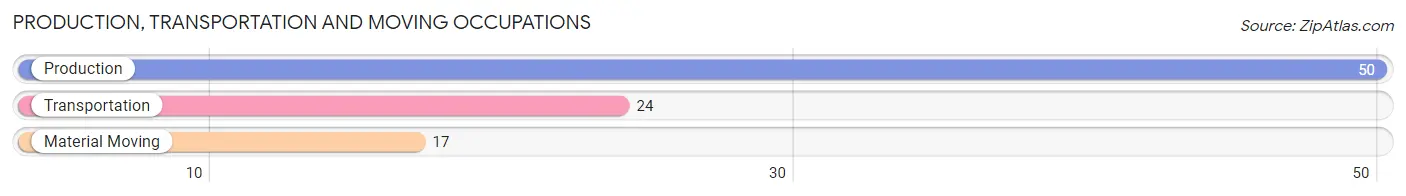
Production, Transportation and Moving Occupations by Sex
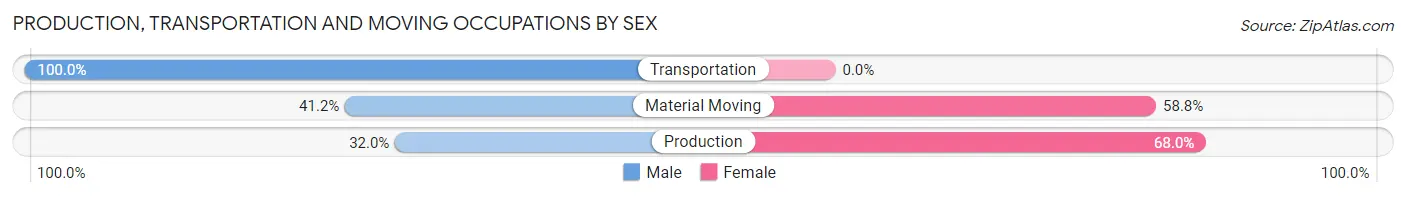
| Occupation | Male | Female |
| Production | 16 (32.0%) | 34 (68.0%) |
| Transportation | 24 (100.0%) | 0 (0.0%) |
| Material Moving | 7 (41.2%) | 10 (58.8%) |
| Total (Category) | 47 (51.6%) | 44 (48.3%) |
| Total (Overall) | 283 (55.8%) | 224 (44.2%) |
Employment Industries by Sex in Plains
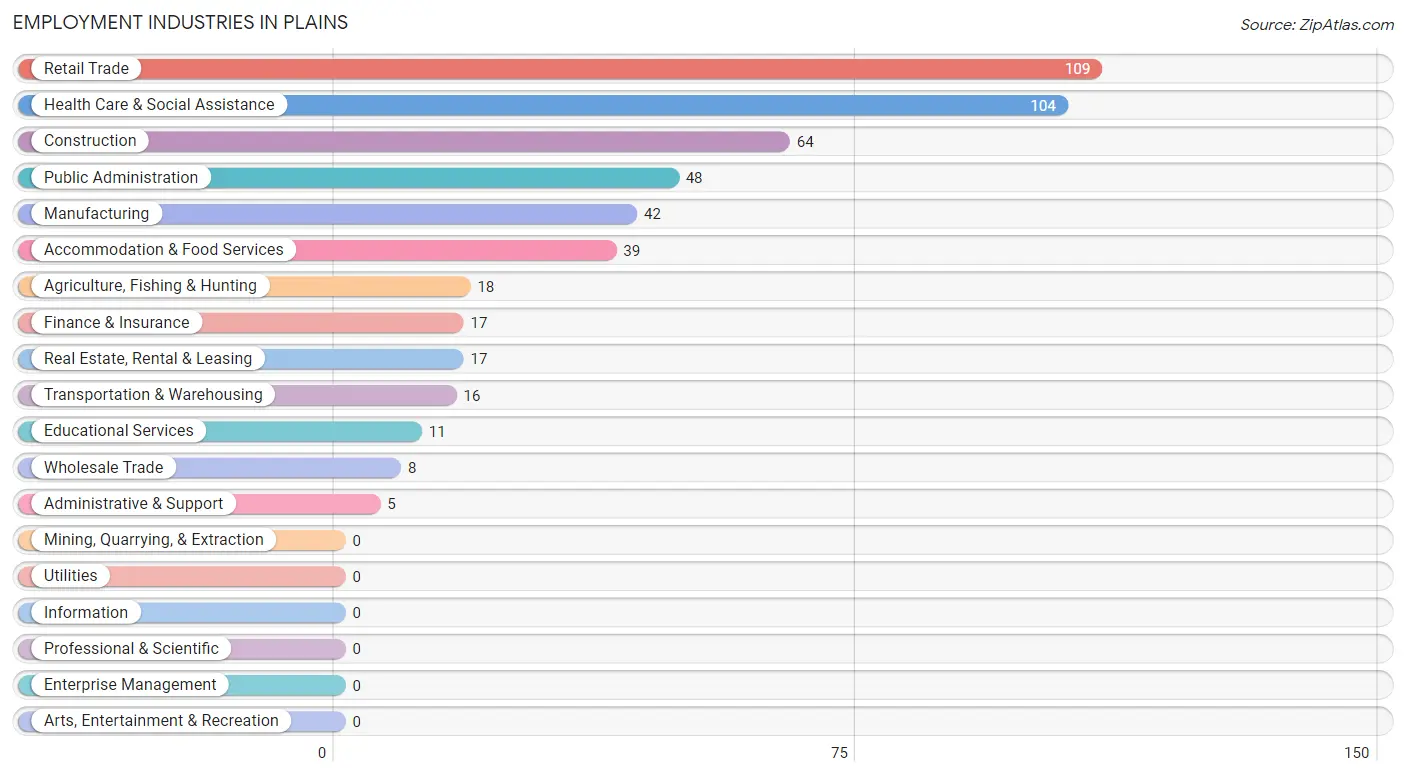
Employment Industries in Plains
The major employment industries in Plains include Retail Trade (109 | 21.5%), Health Care & Social Assistance (104 | 20.5%), Construction (64 | 12.6%), Public Administration (48 | 9.5%), and Manufacturing (42 | 8.3%).
Employment Industries by Sex in Plains
The Plains industries that see more men than women are Agriculture, Fishing & Hunting (100.0%), Wholesale Trade (100.0%), and Transportation & Warehousing (100.0%), whereas the industries that tend to have a higher number of women are Finance & Insurance (100.0%), Real Estate, Rental & Leasing (100.0%), and Administrative & Support (100.0%).
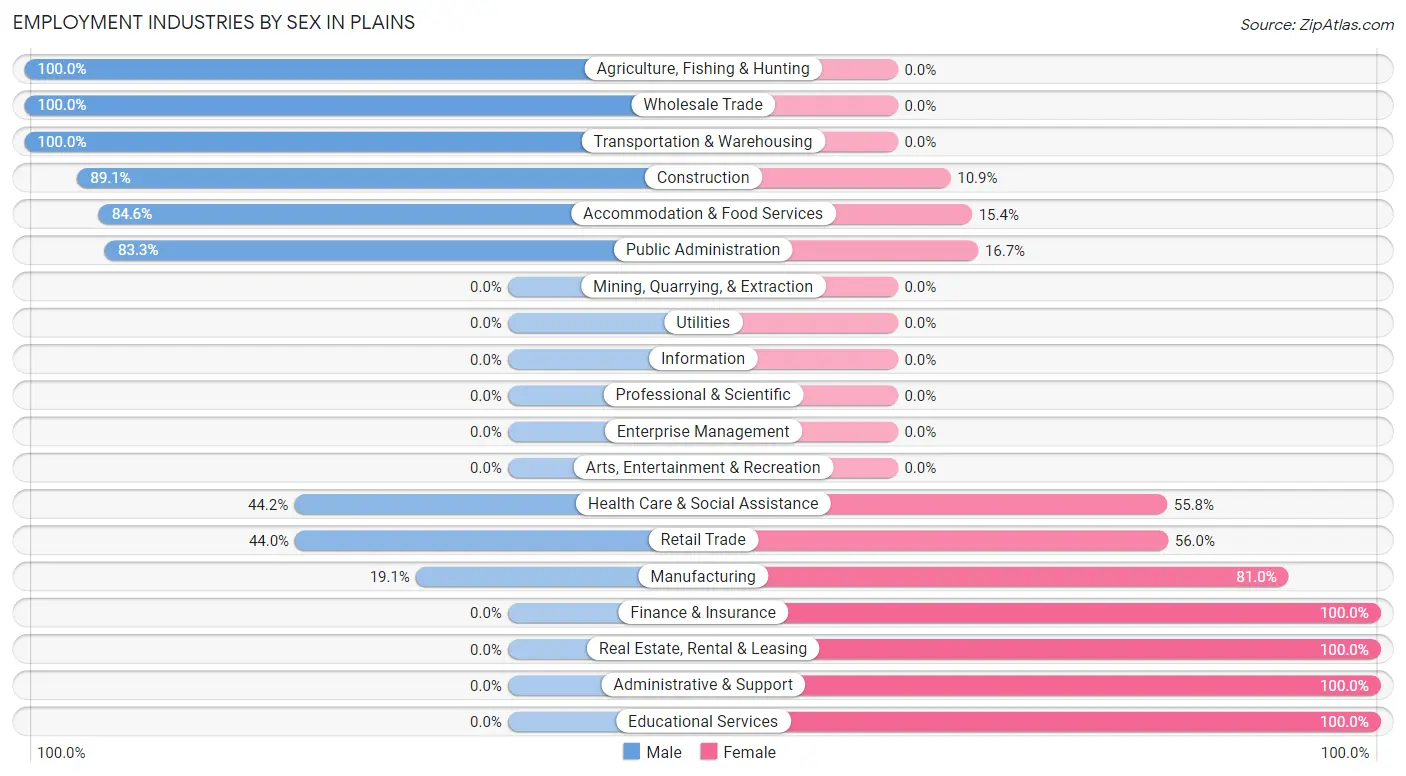
| Industry | Male | Female |
| Agriculture, Fishing & Hunting | 18 (100.0%) | 0 (0.0%) |
| Mining, Quarrying, & Extraction | 0 (0.0%) | 0 (0.0%) |
| Construction | 57 (89.1%) | 7 (10.9%) |
| Manufacturing | 8 (19.1%) | 34 (80.9%) |
| Wholesale Trade | 8 (100.0%) | 0 (0.0%) |
| Retail Trade | 48 (44.0%) | 61 (56.0%) |
| Transportation & Warehousing | 16 (100.0%) | 0 (0.0%) |
| Utilities | 0 (0.0%) | 0 (0.0%) |
| Information | 0 (0.0%) | 0 (0.0%) |
| Finance & Insurance | 0 (0.0%) | 17 (100.0%) |
| Real Estate, Rental & Leasing | 0 (0.0%) | 17 (100.0%) |
| Professional & Scientific | 0 (0.0%) | 0 (0.0%) |
| Enterprise Management | 0 (0.0%) | 0 (0.0%) |
| Administrative & Support | 0 (0.0%) | 5 (100.0%) |
| Educational Services | 0 (0.0%) | 11 (100.0%) |
| Health Care & Social Assistance | 46 (44.2%) | 58 (55.8%) |
| Arts, Entertainment & Recreation | 0 (0.0%) | 0 (0.0%) |
| Accommodation & Food Services | 33 (84.6%) | 6 (15.4%) |
| Public Administration | 40 (83.3%) | 8 (16.7%) |
| Total | 283 (55.8%) | 224 (44.2%) |
Education in Plains
School Enrollment in Plains
The most common levels of schooling among the 204 students in Plains are high school (77 | 37.8%), elementary school (60 | 29.4%), and middle school (36 | 17.6%).
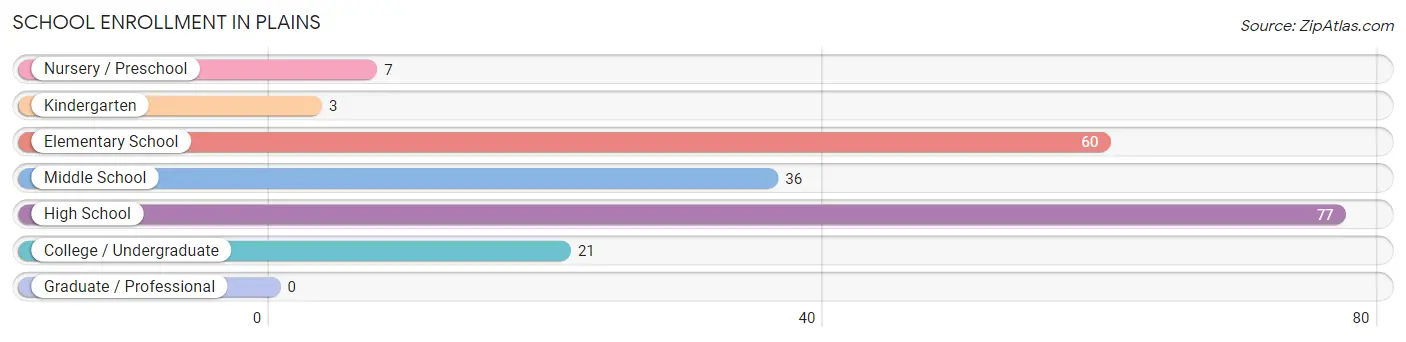
| School Level | # Students | % Students |
| Nursery / Preschool | 7 | 3.4% |
| Kindergarten | 3 | 1.5% |
| Elementary School | 60 | 29.4% |
| Middle School | 36 | 17.6% |
| High School | 77 | 37.8% |
| College / Undergraduate | 21 | 10.3% |
| Graduate / Professional | 0 | 0.0% |
| Total | 204 | 100.0% |
School Enrollment by Age by Funding Source in Plains
Out of a total of 204 students who are enrolled in schools in Plains, 20 (9.8%) attend a private institution, while the remaining 184 (90.2%) are enrolled in public schools. The age group of 18 to 19 year olds has the highest likelihood of being enrolled in private schools, with 13 (46.4% in the age bracket) enrolled. Conversely, the age group of 3 to 4 year olds has the lowest likelihood of being enrolled in a private school, with 7 (100.0% in the age bracket) attending a public institution.
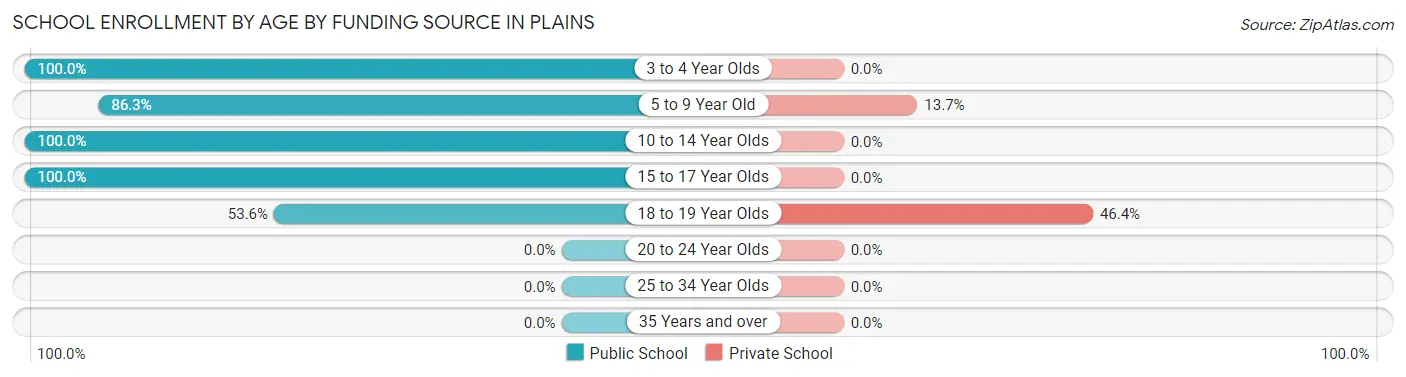
| Age Bracket | Public School | Private School |
| 3 to 4 Year Olds | 7 (100.0%) | 0 (0.0%) |
| 5 to 9 Year Old | 44 (86.3%) | 7 (13.7%) |
| 10 to 14 Year Olds | 77 (100.0%) | 0 (0.0%) |
| 15 to 17 Year Olds | 41 (100.0%) | 0 (0.0%) |
| 18 to 19 Year Olds | 15 (53.6%) | 13 (46.4%) |
| 20 to 24 Year Olds | 0 (0.0%) | 0 (0.0%) |
| 25 to 34 Year Olds | 0 (0.0%) | 0 (0.0%) |
| 35 Years and over | 0 (0.0%) | 0 (0.0%) |
| Total | 184 (90.2%) | 20 (9.8%) |
Educational Attainment by Field of Study in Plains
Education (38 | 25.9%), arts & humanities (36 | 24.5%), bio, nature & agricultural (29 | 19.7%), science & technology (26 | 17.7%), and business (10 | 6.8%) are the most common fields of study among 147 individuals in Plains who have obtained a bachelor's degree or higher.
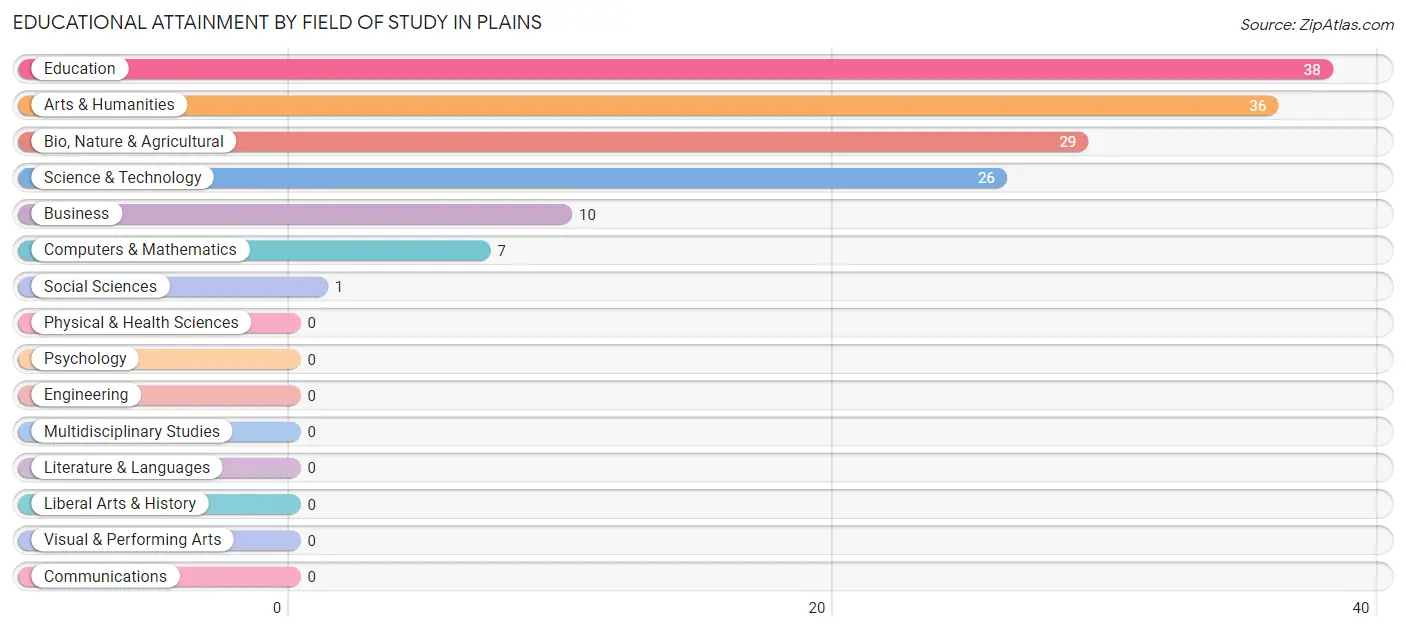
| Field of Study | # Graduates | % Graduates |
| Computers & Mathematics | 7 | 4.8% |
| Bio, Nature & Agricultural | 29 | 19.7% |
| Physical & Health Sciences | 0 | 0.0% |
| Psychology | 0 | 0.0% |
| Social Sciences | 1 | 0.7% |
| Engineering | 0 | 0.0% |
| Multidisciplinary Studies | 0 | 0.0% |
| Science & Technology | 26 | 17.7% |
| Business | 10 | 6.8% |
| Education | 38 | 25.9% |
| Literature & Languages | 0 | 0.0% |
| Liberal Arts & History | 0 | 0.0% |
| Visual & Performing Arts | 0 | 0.0% |
| Communications | 0 | 0.0% |
| Arts & Humanities | 36 | 24.5% |
| Total | 147 | 100.0% |
Transportation & Commute in Plains
Vehicle Availability by Sex in Plains
The most prevalent vehicle ownership categories in Plains are males with 2 vehicles (162, accounting for 60.9%) and females with 2 vehicles (40, making up 72.3%).
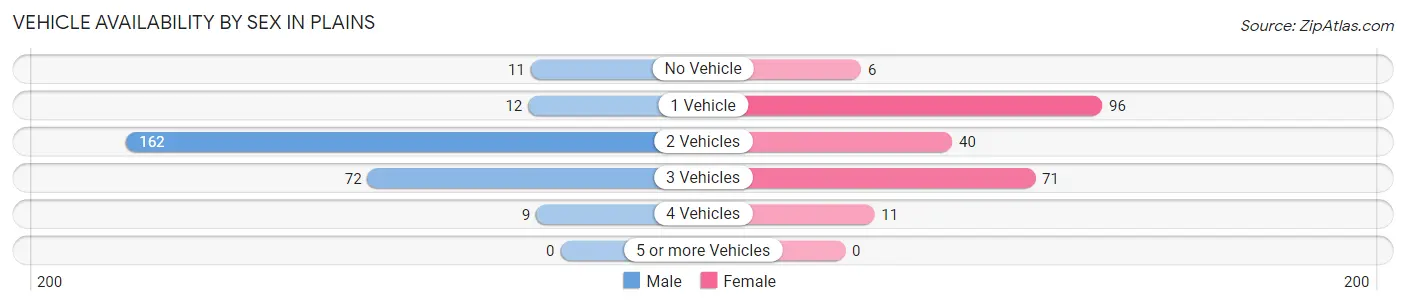
| Vehicles Available | Male | Female |
| No Vehicle | 11 (4.1%) | 6 (2.7%) |
| 1 Vehicle | 12 (4.5%) | 96 (42.9%) |
| 2 Vehicles | 162 (60.9%) | 40 (17.9%) |
| 3 Vehicles | 72 (27.1%) | 71 (31.7%) |
| 4 Vehicles | 9 (3.4%) | 11 (4.9%) |
| 5 or more Vehicles | 0 (0.0%) | 0 (0.0%) |
| Total | 266 (100.0%) | 224 (100.0%) |
Commute Time in Plains
The most frequently occuring commute durations in Plains are less than 5 minutes (131 commuters, 32.2%), 5 to 9 minutes (127 commuters, 31.2%), and 15 to 19 minutes (59 commuters, 14.5%).
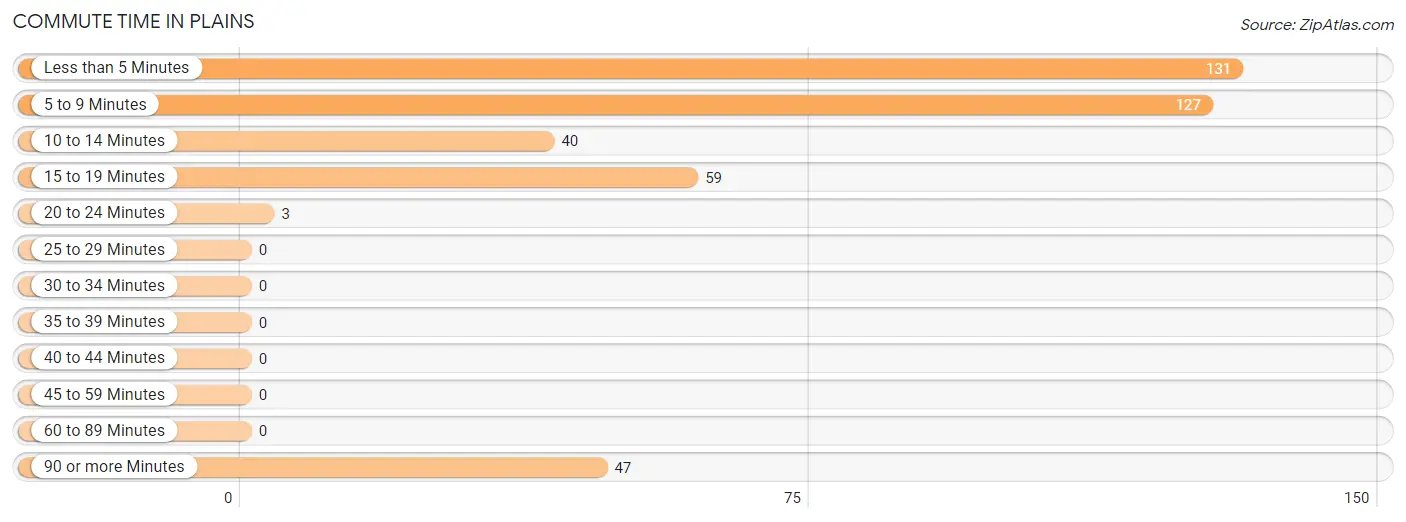
| Commute Time | # Commuters | % Commuters |
| Less than 5 Minutes | 131 | 32.2% |
| 5 to 9 Minutes | 127 | 31.2% |
| 10 to 14 Minutes | 40 | 9.8% |
| 15 to 19 Minutes | 59 | 14.5% |
| 20 to 24 Minutes | 3 | 0.7% |
| 25 to 29 Minutes | 0 | 0.0% |
| 30 to 34 Minutes | 0 | 0.0% |
| 35 to 39 Minutes | 0 | 0.0% |
| 40 to 44 Minutes | 0 | 0.0% |
| 45 to 59 Minutes | 0 | 0.0% |
| 60 to 89 Minutes | 0 | 0.0% |
| 90 or more Minutes | 47 | 11.6% |
Commute Time by Sex in Plains
The most common commute times in Plains are 5 to 9 minutes (94 commuters, 36.7%) for males and less than 5 minutes (66 commuters, 43.7%) for females.
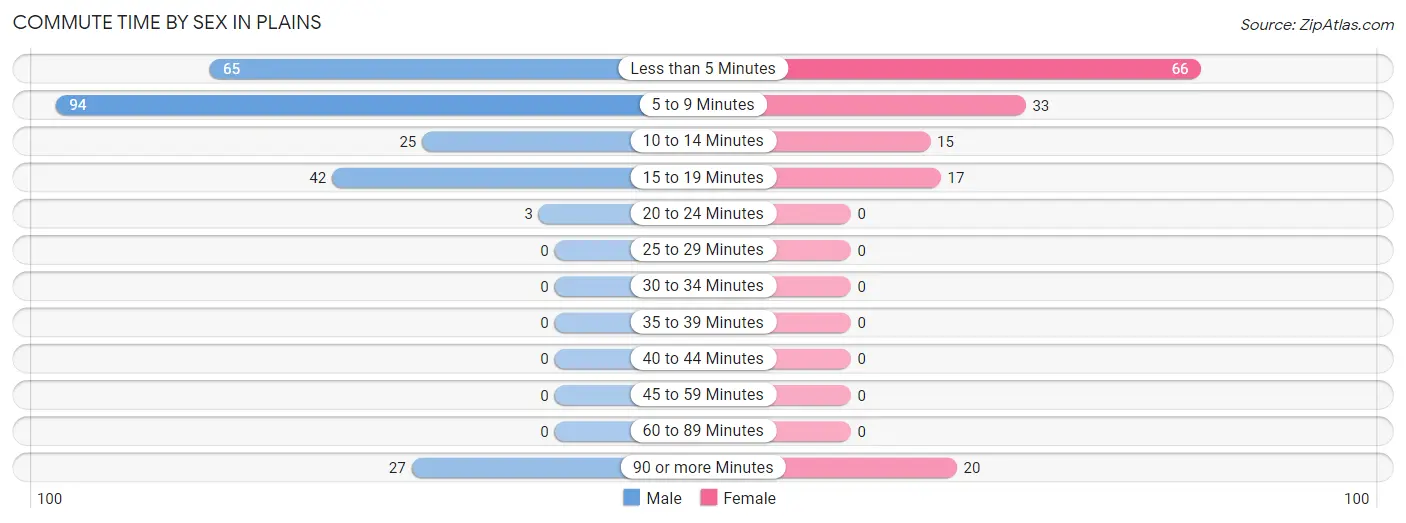
| Commute Time | Male | Female |
| Less than 5 Minutes | 65 (25.4%) | 66 (43.7%) |
| 5 to 9 Minutes | 94 (36.7%) | 33 (21.8%) |
| 10 to 14 Minutes | 25 (9.8%) | 15 (9.9%) |
| 15 to 19 Minutes | 42 (16.4%) | 17 (11.3%) |
| 20 to 24 Minutes | 3 (1.2%) | 0 (0.0%) |
| 25 to 29 Minutes | 0 (0.0%) | 0 (0.0%) |
| 30 to 34 Minutes | 0 (0.0%) | 0 (0.0%) |
| 35 to 39 Minutes | 0 (0.0%) | 0 (0.0%) |
| 40 to 44 Minutes | 0 (0.0%) | 0 (0.0%) |
| 45 to 59 Minutes | 0 (0.0%) | 0 (0.0%) |
| 60 to 89 Minutes | 0 (0.0%) | 0 (0.0%) |
| 90 or more Minutes | 27 (10.5%) | 20 (13.3%) |
Time of Departure to Work by Sex in Plains
The most frequent times of departure to work in Plains are 5:30 AM to 5:59 AM (72, 28.1%) for males and 9:00 AM to 9:59 AM (56, 37.1%) for females.
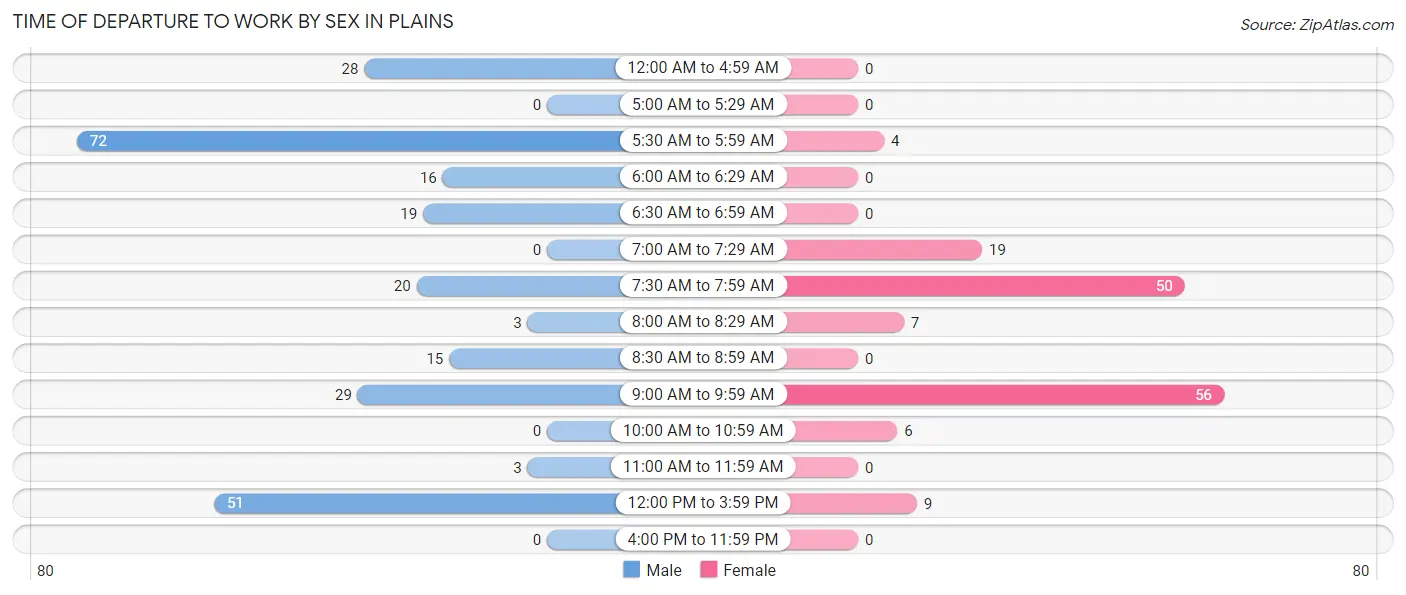
| Time of Departure | Male | Female |
| 12:00 AM to 4:59 AM | 28 (10.9%) | 0 (0.0%) |
| 5:00 AM to 5:29 AM | 0 (0.0%) | 0 (0.0%) |
| 5:30 AM to 5:59 AM | 72 (28.1%) | 4 (2.6%) |
| 6:00 AM to 6:29 AM | 16 (6.2%) | 0 (0.0%) |
| 6:30 AM to 6:59 AM | 19 (7.4%) | 0 (0.0%) |
| 7:00 AM to 7:29 AM | 0 (0.0%) | 19 (12.6%) |
| 7:30 AM to 7:59 AM | 20 (7.8%) | 50 (33.1%) |
| 8:00 AM to 8:29 AM | 3 (1.2%) | 7 (4.6%) |
| 8:30 AM to 8:59 AM | 15 (5.9%) | 0 (0.0%) |
| 9:00 AM to 9:59 AM | 29 (11.3%) | 56 (37.1%) |
| 10:00 AM to 10:59 AM | 0 (0.0%) | 6 (4.0%) |
| 11:00 AM to 11:59 AM | 3 (1.2%) | 0 (0.0%) |
| 12:00 PM to 3:59 PM | 51 (19.9%) | 9 (6.0%) |
| 4:00 PM to 11:59 PM | 0 (0.0%) | 0 (0.0%) |
| Total | 256 (100.0%) | 151 (100.0%) |
Housing Occupancy in Plains
Occupancy by Ownership in Plains
Of the total 620 dwellings in Plains, owner-occupied units account for 319 (51.4%), while renter-occupied units make up 301 (48.5%).
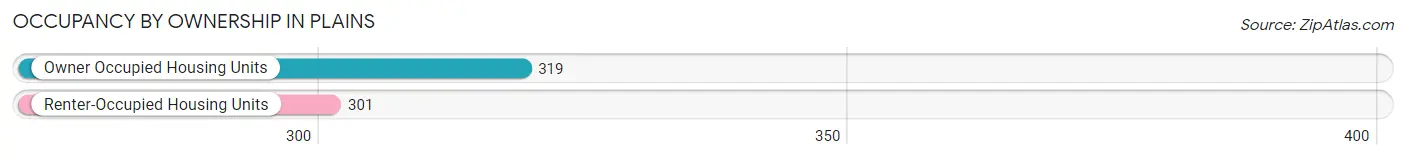
| Occupancy | # Housing Units | % Housing Units |
| Owner Occupied Housing Units | 319 | 51.4% |
| Renter-Occupied Housing Units | 301 | 48.5% |
| Total Occupied Housing Units | 620 | 100.0% |
Occupancy by Household Size in Plains
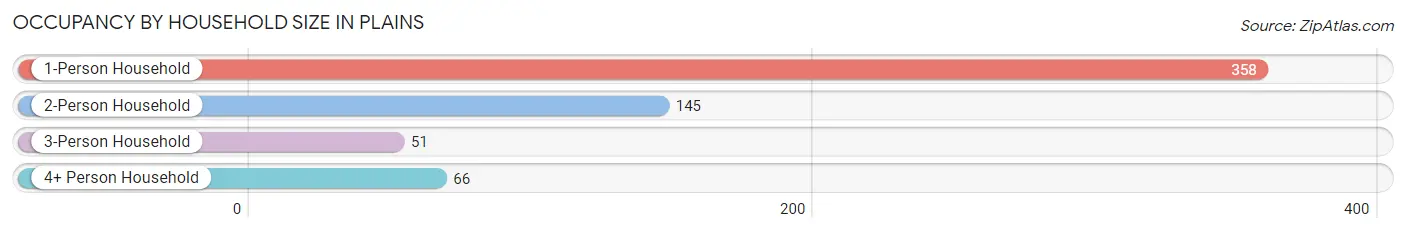
| Household Size | # Housing Units | % Housing Units |
| 1-Person Household | 358 | 57.7% |
| 2-Person Household | 145 | 23.4% |
| 3-Person Household | 51 | 8.2% |
| 4+ Person Household | 66 | 10.6% |
| Total Housing Units | 620 | 100.0% |
Occupancy by Ownership by Household Size in Plains
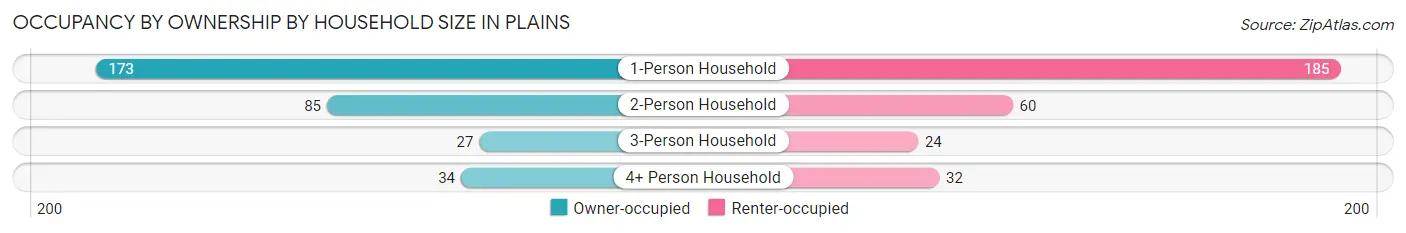
| Household Size | Owner-occupied | Renter-occupied |
| 1-Person Household | 173 (48.3%) | 185 (51.7%) |
| 2-Person Household | 85 (58.6%) | 60 (41.4%) |
| 3-Person Household | 27 (52.9%) | 24 (47.1%) |
| 4+ Person Household | 34 (51.5%) | 32 (48.5%) |
| Total Housing Units | 319 (51.4%) | 301 (48.5%) |
Occupancy by Educational Attainment in Plains
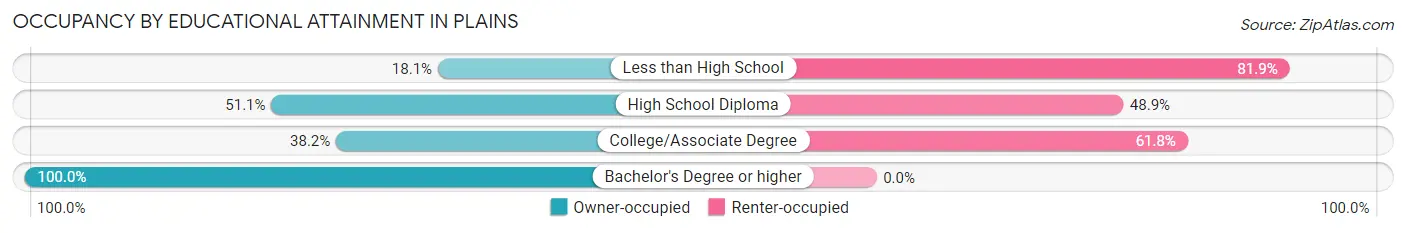
| Household Size | Owner-occupied | Renter-occupied |
| Less than High School | 13 (18.1%) | 59 (81.9%) |
| High School Diploma | 165 (51.1%) | 158 (48.9%) |
| College/Associate Degree | 52 (38.2%) | 84 (61.8%) |
| Bachelor's Degree or higher | 89 (100.0%) | 0 (0.0%) |
Occupancy by Age of Householder in Plains
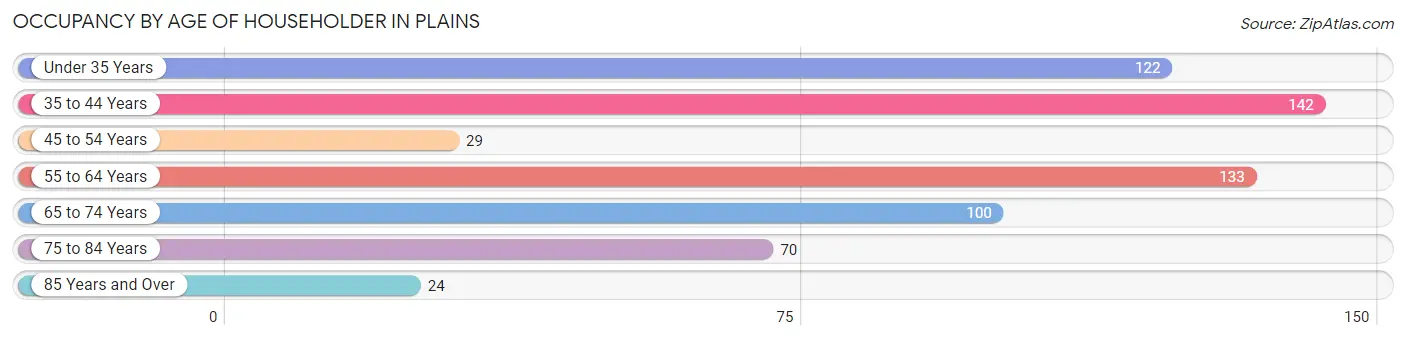
| Age Bracket | # Households | % Households |
| Under 35 Years | 122 | 19.7% |
| 35 to 44 Years | 142 | 22.9% |
| 45 to 54 Years | 29 | 4.7% |
| 55 to 64 Years | 133 | 21.4% |
| 65 to 74 Years | 100 | 16.1% |
| 75 to 84 Years | 70 | 11.3% |
| 85 Years and Over | 24 | 3.9% |
| Total | 620 | 100.0% |
Housing Finances in Plains
Median Income by Occupancy in Plains
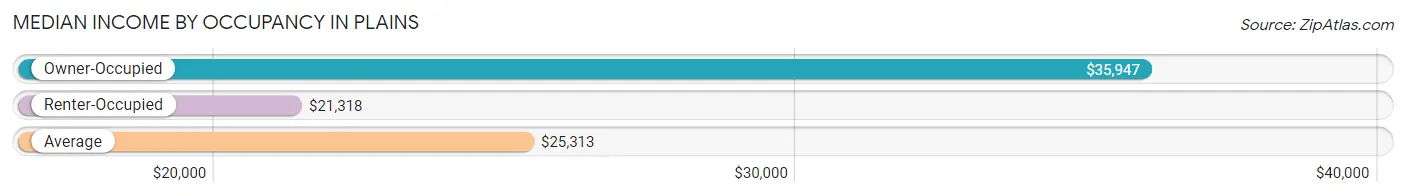
| Occupancy Type | # Households | Median Income |
| Owner-Occupied | 319 (51.4%) | $35,947 |
| Renter-Occupied | 301 (48.5%) | $21,318 |
| Average | 620 (100.0%) | $25,313 |
Occupancy by Householder Income Bracket in Plains
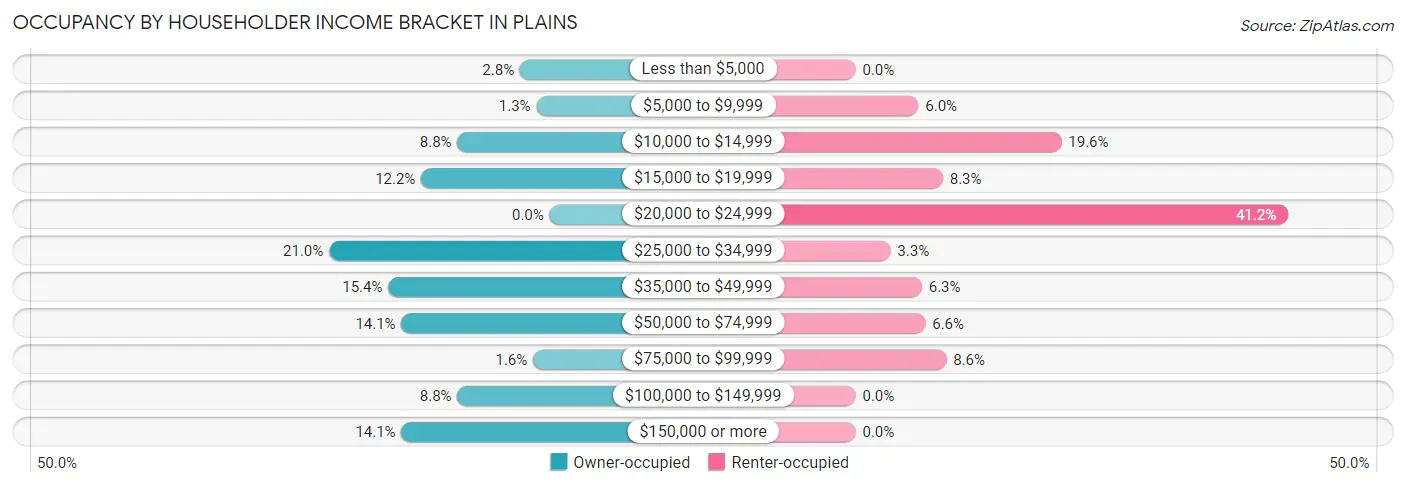
| Income Bracket | Owner-occupied | Renter-occupied |
| Less than $5,000 | 9 (2.8%) | 0 (0.0%) |
| $5,000 to $9,999 | 4 (1.3%) | 18 (6.0%) |
| $10,000 to $14,999 | 28 (8.8%) | 59 (19.6%) |
| $15,000 to $19,999 | 39 (12.2%) | 25 (8.3%) |
| $20,000 to $24,999 | 0 (0.0%) | 124 (41.2%) |
| $25,000 to $34,999 | 67 (21.0%) | 10 (3.3%) |
| $35,000 to $49,999 | 49 (15.4%) | 19 (6.3%) |
| $50,000 to $74,999 | 45 (14.1%) | 20 (6.6%) |
| $75,000 to $99,999 | 5 (1.6%) | 26 (8.6%) |
| $100,000 to $149,999 | 28 (8.8%) | 0 (0.0%) |
| $150,000 or more | 45 (14.1%) | 0 (0.0%) |
| Total | 319 (100.0%) | 301 (100.0%) |
Monthly Housing Cost Tiers in Plains
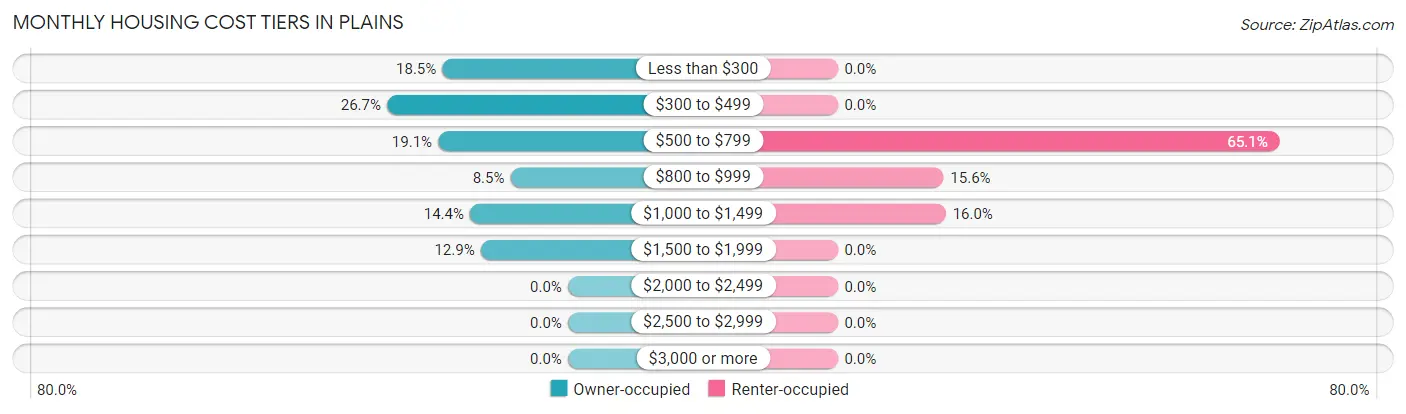
| Monthly Cost | Owner-occupied | Renter-occupied |
| Less than $300 | 59 (18.5%) | 0 (0.0%) |
| $300 to $499 | 85 (26.7%) | 0 (0.0%) |
| $500 to $799 | 61 (19.1%) | 196 (65.1%) |
| $800 to $999 | 27 (8.5%) | 47 (15.6%) |
| $1,000 to $1,499 | 46 (14.4%) | 48 (16.0%) |
| $1,500 to $1,999 | 41 (12.9%) | 0 (0.0%) |
| $2,000 to $2,499 | 0 (0.0%) | 0 (0.0%) |
| $2,500 to $2,999 | 0 (0.0%) | 0 (0.0%) |
| $3,000 or more | 0 (0.0%) | 0 (0.0%) |
| Total | 319 (100.0%) | 301 (100.0%) |
Physical Housing Characteristics in Plains
Housing Structures in Plains
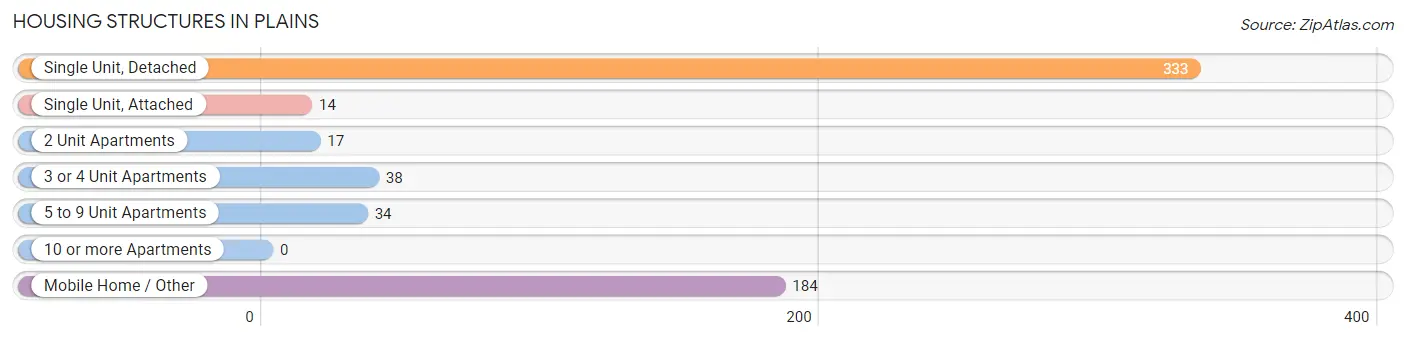
| Structure Type | # Housing Units | % Housing Units |
| Single Unit, Detached | 333 | 53.7% |
| Single Unit, Attached | 14 | 2.3% |
| 2 Unit Apartments | 17 | 2.7% |
| 3 or 4 Unit Apartments | 38 | 6.1% |
| 5 to 9 Unit Apartments | 34 | 5.5% |
| 10 or more Apartments | 0 | 0.0% |
| Mobile Home / Other | 184 | 29.7% |
| Total | 620 | 100.0% |
Housing Structures by Occupancy in Plains
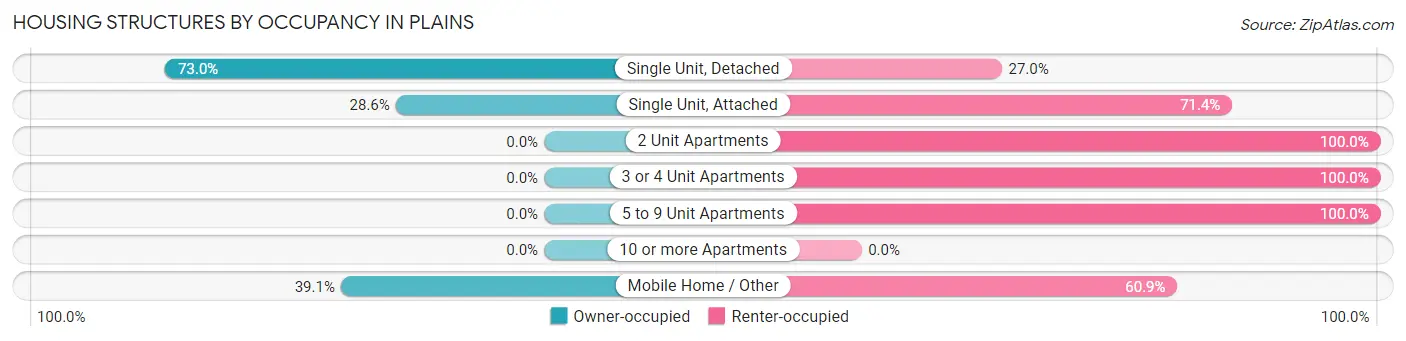
| Structure Type | Owner-occupied | Renter-occupied |
| Single Unit, Detached | 243 (73.0%) | 90 (27.0%) |
| Single Unit, Attached | 4 (28.6%) | 10 (71.4%) |
| 2 Unit Apartments | 0 (0.0%) | 17 (100.0%) |
| 3 or 4 Unit Apartments | 0 (0.0%) | 38 (100.0%) |
| 5 to 9 Unit Apartments | 0 (0.0%) | 34 (100.0%) |
| 10 or more Apartments | 0 (0.0%) | 0 (0.0%) |
| Mobile Home / Other | 72 (39.1%) | 112 (60.9%) |
| Total | 319 (51.4%) | 301 (48.5%) |
Housing Structures by Number of Rooms in Plains
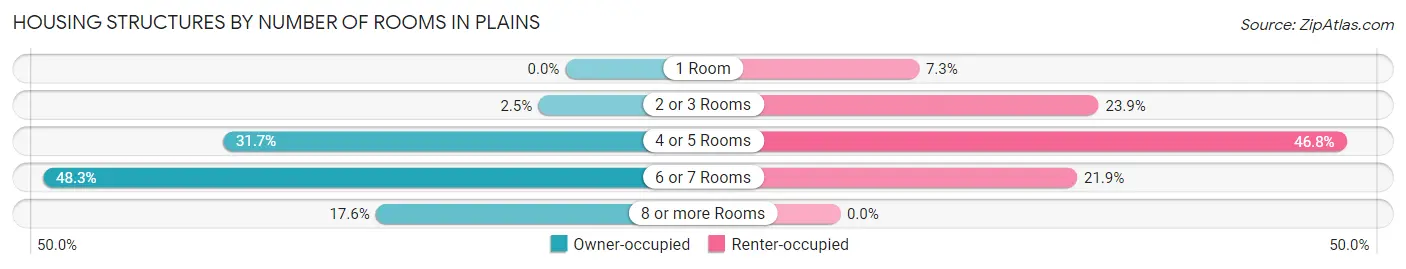
| Number of Rooms | Owner-occupied | Renter-occupied |
| 1 Room | 0 (0.0%) | 22 (7.3%) |
| 2 or 3 Rooms | 8 (2.5%) | 72 (23.9%) |
| 4 or 5 Rooms | 101 (31.7%) | 141 (46.8%) |
| 6 or 7 Rooms | 154 (48.3%) | 66 (21.9%) |
| 8 or more Rooms | 56 (17.5%) | 0 (0.0%) |
| Total | 319 (100.0%) | 301 (100.0%) |
Housing Structure by Heating Type in Plains
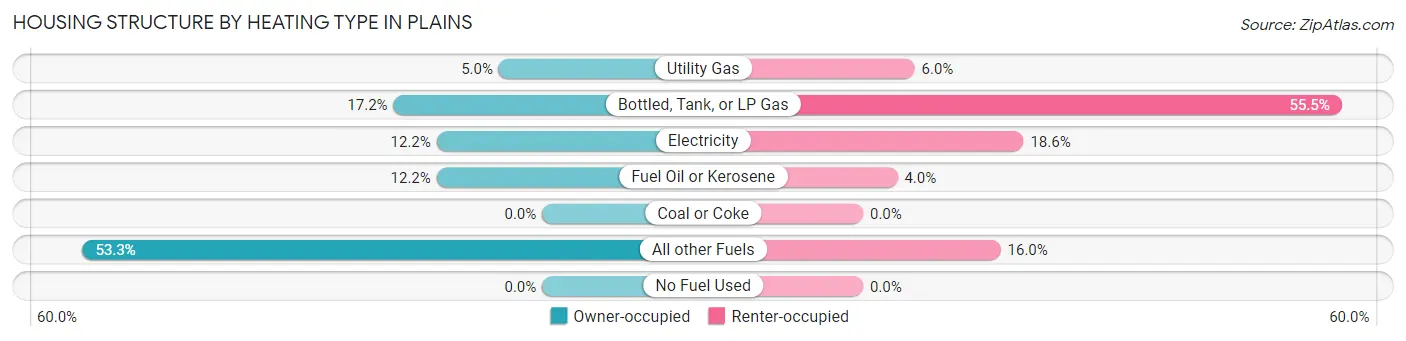
| Heating Type | Owner-occupied | Renter-occupied |
| Utility Gas | 16 (5.0%) | 18 (6.0%) |
| Bottled, Tank, or LP Gas | 55 (17.2%) | 167 (55.5%) |
| Electricity | 39 (12.2%) | 56 (18.6%) |
| Fuel Oil or Kerosene | 39 (12.2%) | 12 (4.0%) |
| Coal or Coke | 0 (0.0%) | 0 (0.0%) |
| All other Fuels | 170 (53.3%) | 48 (16.0%) |
| No Fuel Used | 0 (0.0%) | 0 (0.0%) |
| Total | 319 (100.0%) | 301 (100.0%) |
Household Vehicle Usage in Plains
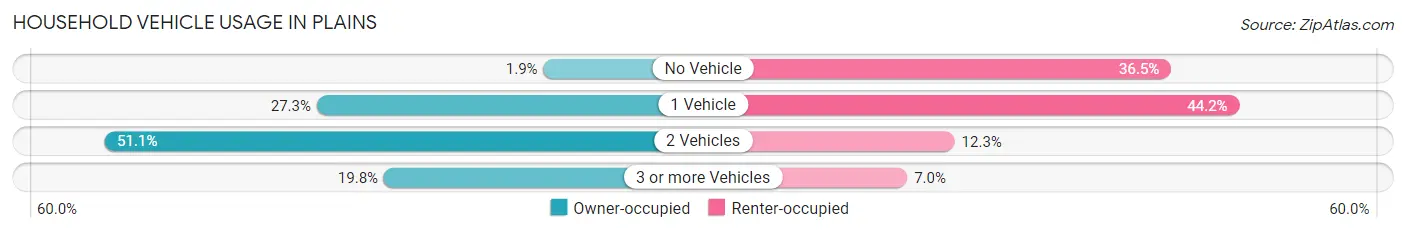
| Vehicles per Household | Owner-occupied | Renter-occupied |
| No Vehicle | 6 (1.9%) | 110 (36.5%) |
| 1 Vehicle | 87 (27.3%) | 133 (44.2%) |
| 2 Vehicles | 163 (51.1%) | 37 (12.3%) |
| 3 or more Vehicles | 63 (19.8%) | 21 (7.0%) |
| Total | 319 (100.0%) | 301 (100.0%) |
Real Estate & Mortgages in Plains
Real Estate and Mortgage Overview in Plains
| Characteristic | Without Mortgage | With Mortgage |
| Housing Units | 153 | 166 |
| Median Property Value | $175,700 | $251,800 |
| Median Household Income | $28,417 | $45 |
| Monthly Housing Costs | $322 | $0 |
| Real Estate Taxes | - | - |
Property Value by Mortgage Status in Plains
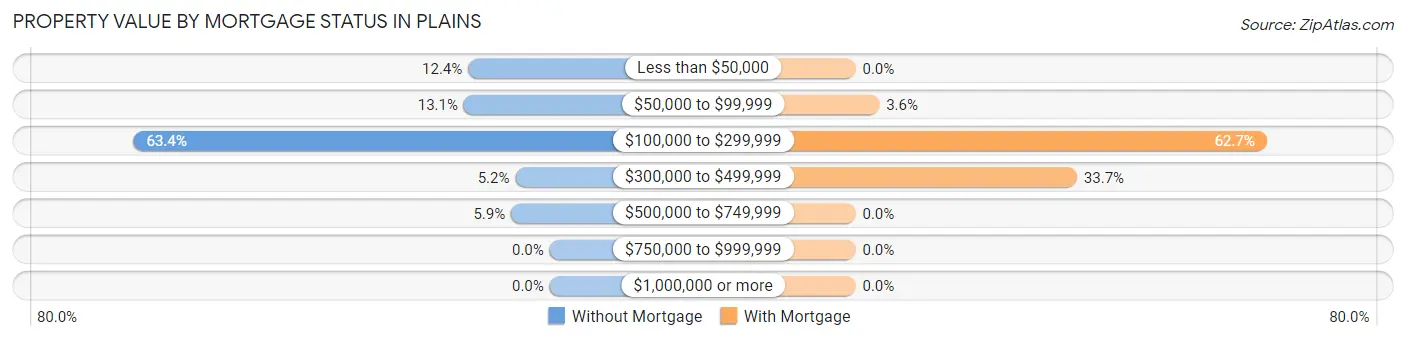
| Property Value | Without Mortgage | With Mortgage |
| Less than $50,000 | 19 (12.4%) | 0 (0.0%) |
| $50,000 to $99,999 | 20 (13.1%) | 6 (3.6%) |
| $100,000 to $299,999 | 97 (63.4%) | 104 (62.6%) |
| $300,000 to $499,999 | 8 (5.2%) | 56 (33.7%) |
| $500,000 to $749,999 | 9 (5.9%) | 0 (0.0%) |
| $750,000 to $999,999 | 0 (0.0%) | 0 (0.0%) |
| $1,000,000 or more | 0 (0.0%) | 0 (0.0%) |
| Total | 153 (100.0%) | 166 (100.0%) |
Household Income by Mortgage Status in Plains
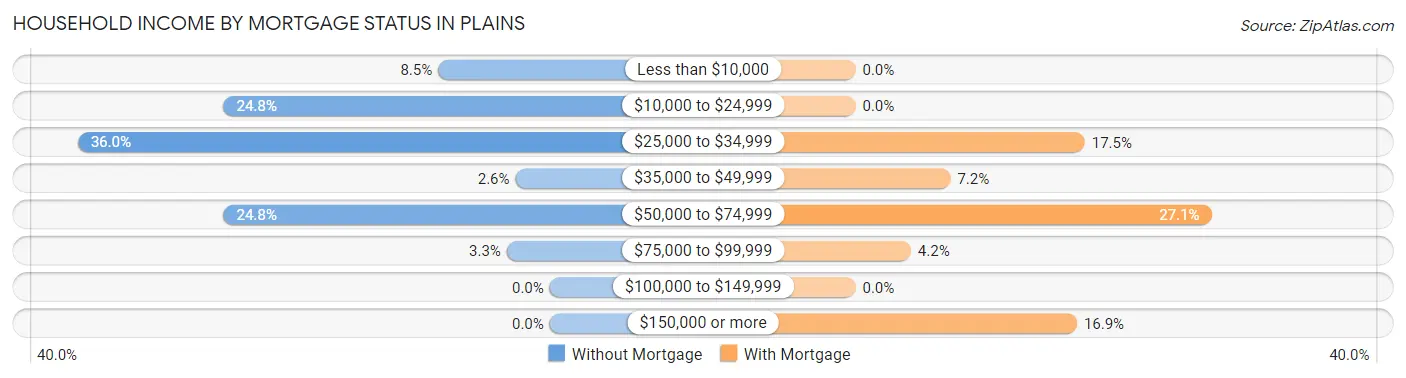
| Household Income | Without Mortgage | With Mortgage |
| Less than $10,000 | 13 (8.5%) | 0 (0.0%) |
| $10,000 to $24,999 | 38 (24.8%) | 0 (0.0%) |
| $25,000 to $34,999 | 55 (35.9%) | 29 (17.5%) |
| $35,000 to $49,999 | 4 (2.6%) | 12 (7.2%) |
| $50,000 to $74,999 | 38 (24.8%) | 45 (27.1%) |
| $75,000 to $99,999 | 5 (3.3%) | 7 (4.2%) |
| $100,000 to $149,999 | 0 (0.0%) | 0 (0.0%) |
| $150,000 or more | 0 (0.0%) | 28 (16.9%) |
| Total | 153 (100.0%) | 166 (100.0%) |
Property Value to Household Income Ratio in Plains
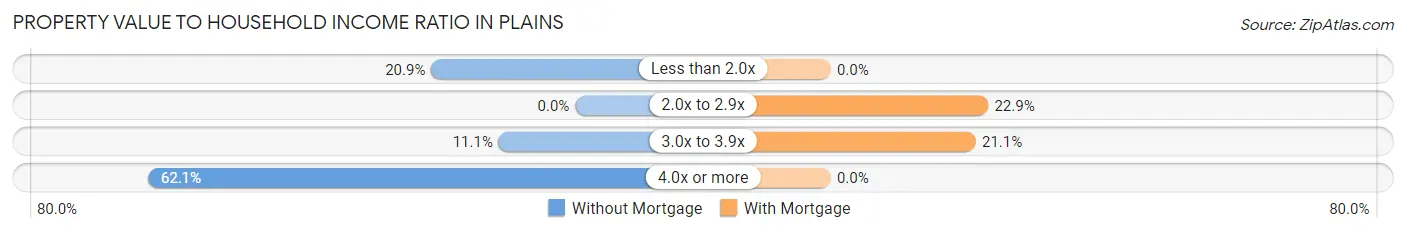
| Value-to-Income Ratio | Without Mortgage | With Mortgage |
| Less than 2.0x | 32 (20.9%) | 0 (0.0%) |
| 2.0x to 2.9x | 0 (0.0%) | 38 (22.9%) |
| 3.0x to 3.9x | 17 (11.1%) | 35 (21.1%) |
| 4.0x or more | 95 (62.1%) | 0 (0.0%) |
| Total | 153 (100.0%) | 166 (100.0%) |
Real Estate Taxes by Mortgage Status in Plains
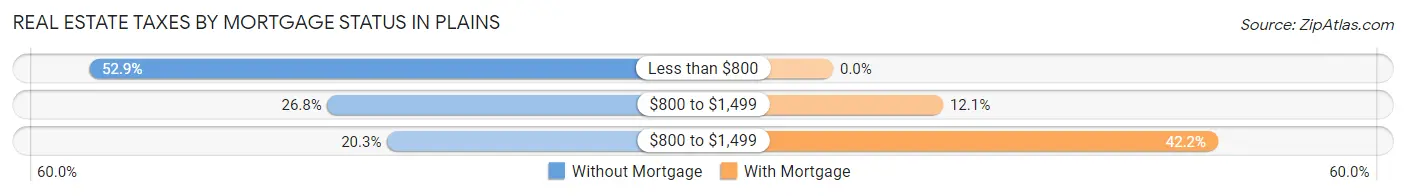
| Property Taxes | Without Mortgage | With Mortgage |
| Less than $800 | 81 (52.9%) | 0 (0.0%) |
| $800 to $1,499 | 41 (26.8%) | 20 (12.0%) |
| $800 to $1,499 | 31 (20.3%) | 70 (42.2%) |
| Total | 153 (100.0%) | 166 (100.0%) |
Health & Disability in Plains
Health Insurance Coverage by Age in Plains
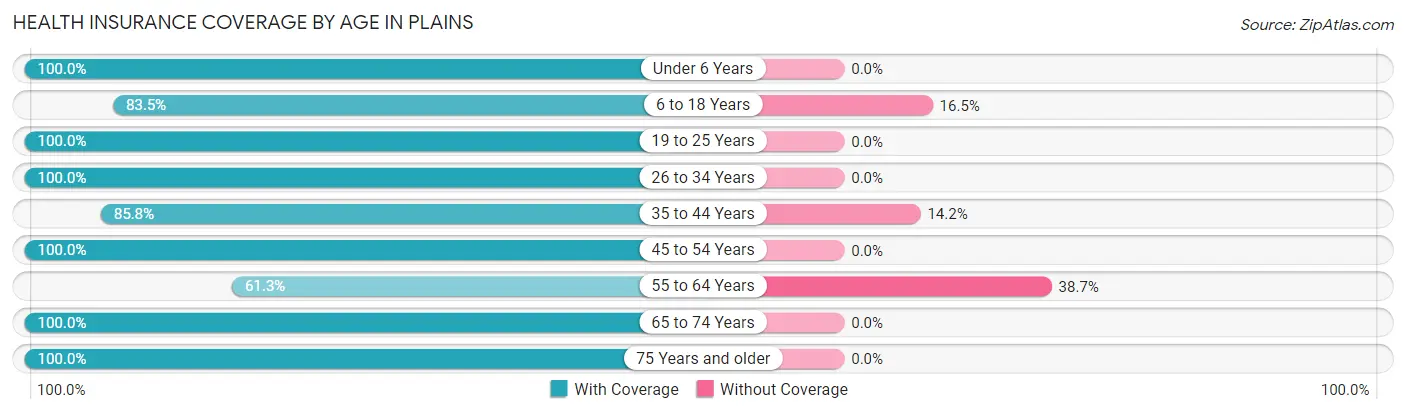
| Age Bracket | With Coverage | Without Coverage |
| Under 6 Years | 25 (100.0%) | 0 (0.0%) |
| 6 to 18 Years | 147 (83.5%) | 29 (16.5%) |
| 19 to 25 Years | 150 (100.0%) | 0 (0.0%) |
| 26 to 34 Years | 66 (100.0%) | 0 (0.0%) |
| 35 to 44 Years | 163 (85.8%) | 27 (14.2%) |
| 45 to 54 Years | 67 (100.0%) | 0 (0.0%) |
| 55 to 64 Years | 138 (61.3%) | 87 (38.7%) |
| 65 to 74 Years | 132 (100.0%) | 0 (0.0%) |
| 75 Years and older | 128 (100.0%) | 0 (0.0%) |
| Total | 1,016 (87.7%) | 143 (12.3%) |
Health Insurance Coverage by Citizenship Status in Plains
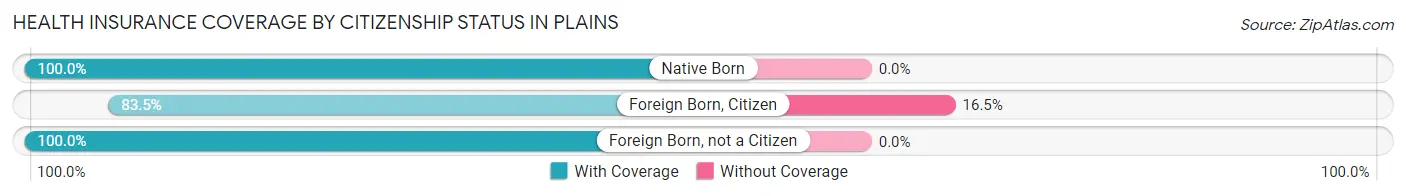
| Citizenship Status | With Coverage | Without Coverage |
| Native Born | 25 (100.0%) | 0 (0.0%) |
| Foreign Born, Citizen | 147 (83.5%) | 29 (16.5%) |
| Foreign Born, not a Citizen | 150 (100.0%) | 0 (0.0%) |
Health Insurance Coverage by Household Income in Plains
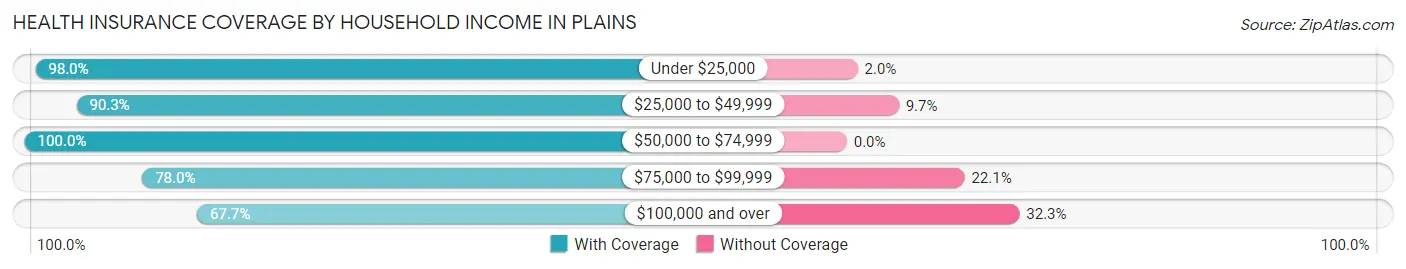
| Household Income | With Coverage | Without Coverage |
| Under $25,000 | 388 (98.0%) | 8 (2.0%) |
| $25,000 to $49,999 | 195 (90.3%) | 21 (9.7%) |
| $50,000 to $74,999 | 125 (100.0%) | 0 (0.0%) |
| $75,000 to $99,999 | 99 (77.9%) | 28 (22.1%) |
| $100,000 and over | 180 (67.7%) | 86 (32.3%) |
Public vs Private Health Insurance Coverage by Age in Plains
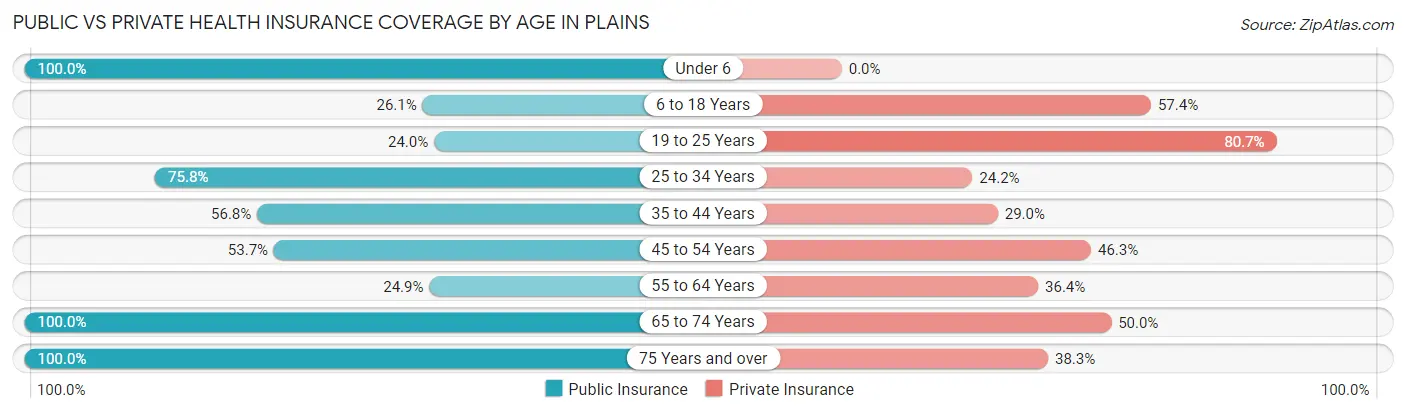
| Age Bracket | Public Insurance | Private Insurance |
| Under 6 | 25 (100.0%) | 0 (0.0%) |
| 6 to 18 Years | 46 (26.1%) | 101 (57.4%) |
| 19 to 25 Years | 36 (24.0%) | 121 (80.7%) |
| 25 to 34 Years | 50 (75.8%) | 16 (24.2%) |
| 35 to 44 Years | 108 (56.8%) | 55 (28.9%) |
| 45 to 54 Years | 36 (53.7%) | 31 (46.3%) |
| 55 to 64 Years | 56 (24.9%) | 82 (36.4%) |
| 65 to 74 Years | 132 (100.0%) | 66 (50.0%) |
| 75 Years and over | 128 (100.0%) | 49 (38.3%) |
| Total | 617 (53.2%) | 521 (45.0%) |
Disability Status by Sex by Age in Plains
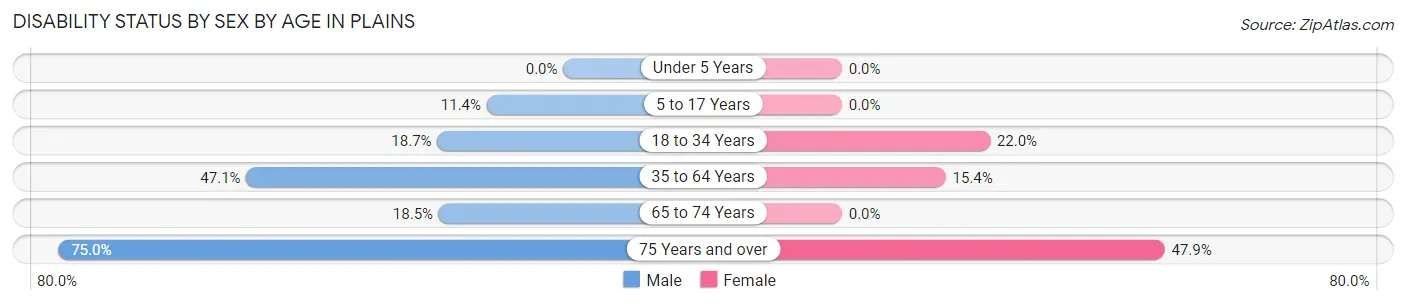
| Age Bracket | Male | Female |
| Under 5 Years | 0 (0.0%) | 0 (0.0%) |
| 5 to 17 Years | 10 (11.4%) | 0 (0.0%) |
| 18 to 34 Years | 23 (18.7%) | 22 (22.0%) |
| 35 to 64 Years | 120 (47.1%) | 35 (15.4%) |
| 65 to 74 Years | 17 (18.5%) | 0 (0.0%) |
| 75 Years and over | 24 (75.0%) | 46 (47.9%) |
Disability Class by Sex by Age in Plains
Disability Class: Hearing Difficulty
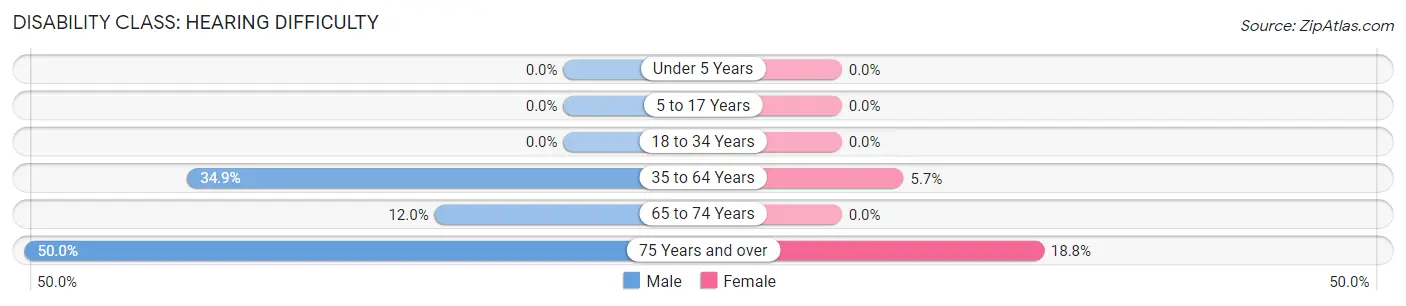
| Age Bracket | Male | Female |
| Under 5 Years | 0 (0.0%) | 0 (0.0%) |
| 5 to 17 Years | 0 (0.0%) | 0 (0.0%) |
| 18 to 34 Years | 0 (0.0%) | 0 (0.0%) |
| 35 to 64 Years | 89 (34.9%) | 13 (5.7%) |
| 65 to 74 Years | 11 (12.0%) | 0 (0.0%) |
| 75 Years and over | 16 (50.0%) | 18 (18.8%) |
Disability Class: Vision Difficulty
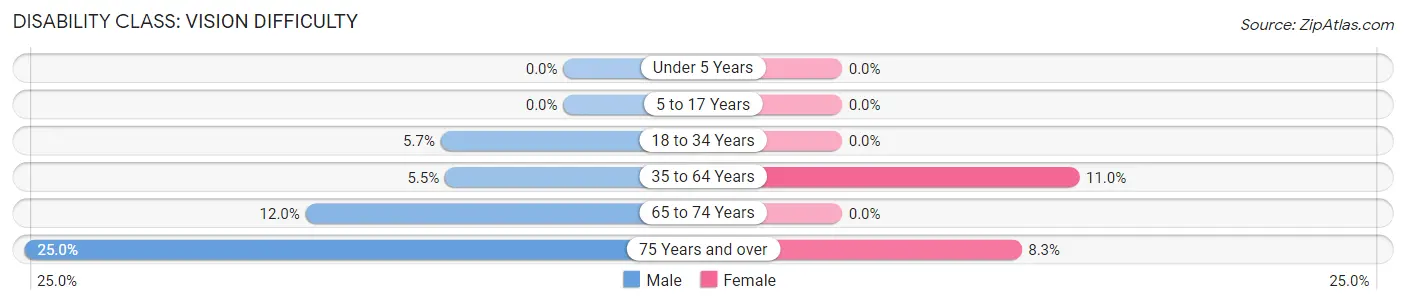
| Age Bracket | Male | Female |
| Under 5 Years | 0 (0.0%) | 0 (0.0%) |
| 5 to 17 Years | 0 (0.0%) | 0 (0.0%) |
| 18 to 34 Years | 7 (5.7%) | 0 (0.0%) |
| 35 to 64 Years | 14 (5.5%) | 25 (11.0%) |
| 65 to 74 Years | 11 (12.0%) | 0 (0.0%) |
| 75 Years and over | 8 (25.0%) | 8 (8.3%) |
Disability Class: Cognitive Difficulty
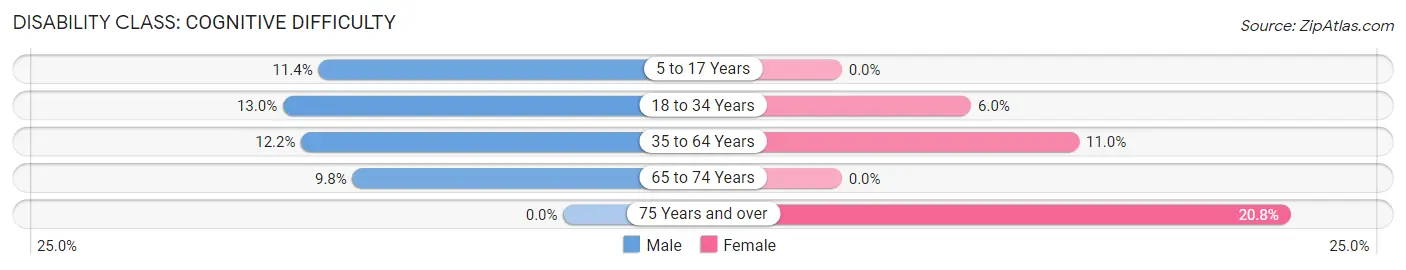
| Age Bracket | Male | Female |
| 5 to 17 Years | 10 (11.4%) | 0 (0.0%) |
| 18 to 34 Years | 16 (13.0%) | 6 (6.0%) |
| 35 to 64 Years | 31 (12.2%) | 25 (11.0%) |
| 65 to 74 Years | 9 (9.8%) | 0 (0.0%) |
| 75 Years and over | 0 (0.0%) | 20 (20.8%) |
Disability Class: Ambulatory Difficulty
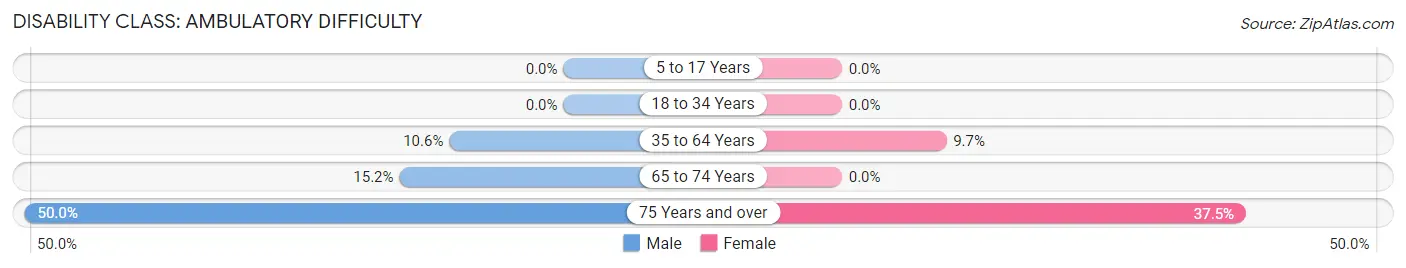
| Age Bracket | Male | Female |
| 5 to 17 Years | 0 (0.0%) | 0 (0.0%) |
| 18 to 34 Years | 0 (0.0%) | 0 (0.0%) |
| 35 to 64 Years | 27 (10.6%) | 22 (9.7%) |
| 65 to 74 Years | 14 (15.2%) | 0 (0.0%) |
| 75 Years and over | 16 (50.0%) | 36 (37.5%) |
Disability Class: Self-Care Difficulty
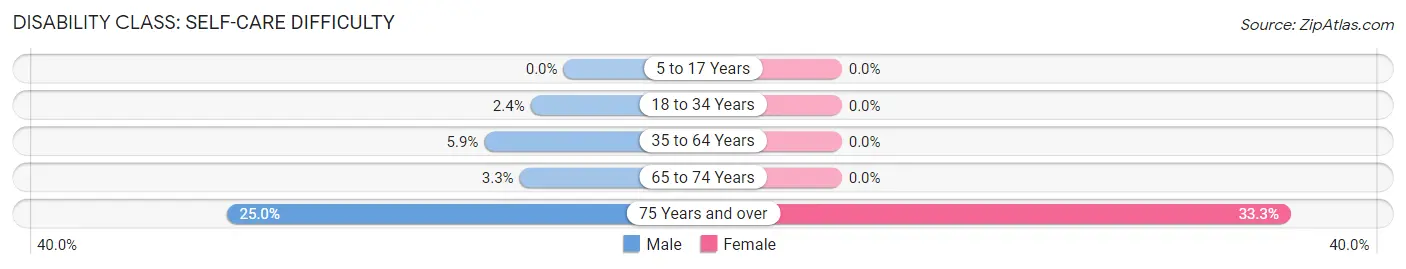
| Age Bracket | Male | Female |
| 5 to 17 Years | 0 (0.0%) | 0 (0.0%) |
| 18 to 34 Years | 3 (2.4%) | 0 (0.0%) |
| 35 to 64 Years | 15 (5.9%) | 0 (0.0%) |
| 65 to 74 Years | 3 (3.3%) | 0 (0.0%) |
| 75 Years and over | 8 (25.0%) | 32 (33.3%) |
Technology Access in Plains
Computing Device Access in Plains
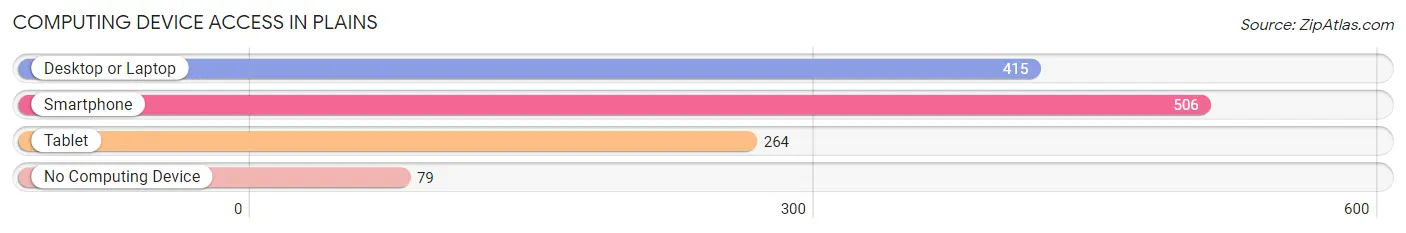
| Device Type | # Households | % Households |
| Desktop or Laptop | 415 | 66.9% |
| Smartphone | 506 | 81.6% |
| Tablet | 264 | 42.6% |
| No Computing Device | 79 | 12.7% |
| Total | 620 | 100.0% |
Internet Access in Plains
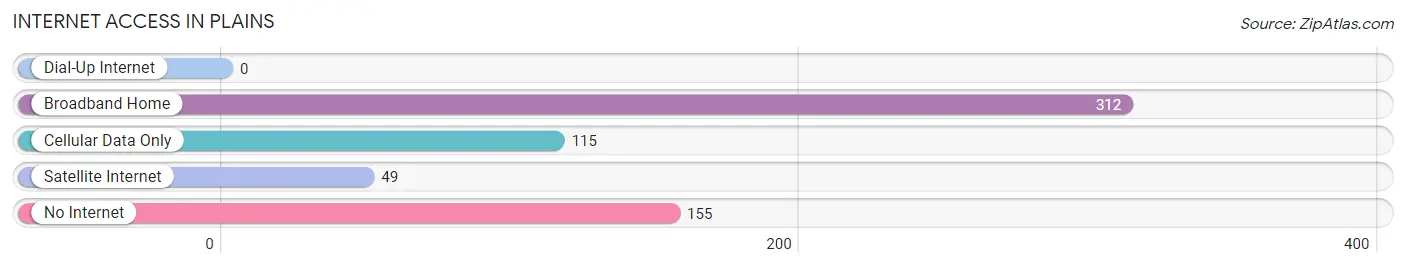
| Internet Type | # Households | % Households |
| Dial-Up Internet | 0 | 0.0% |
| Broadband Home | 312 | 50.3% |
| Cellular Data Only | 115 | 18.5% |
| Satellite Internet | 49 | 7.9% |
| No Internet | 155 | 25.0% |
| Total | 620 | 100.0% |
Plains Summary
Plains, Montana is a small town located in Sanders County, in the northwestern part of the state. It is situated on the banks of the Clark Fork River, near the Idaho border. The town was founded in 1883 and has a population of approximately 1,000 people.
History
Plains was founded in 1883 by a group of settlers from the Midwest. The town was named after the nearby Plains Indian Reservation, which was established in 1887. The town was originally a trading post for the local Native American tribes, and it quickly grew into a small farming community. The town was incorporated in 1895 and the first post office was established in 1896.
In the early 1900s, the town began to experience a period of growth and prosperity. The railroad arrived in 1906, and the town was connected to the rest of the state by the Great Northern Railway. The railroad brought new businesses and industries to the area, and the population of Plains began to grow.
Geography
Plains is located in the northwestern part of Montana, in Sanders County. The town is situated on the banks of the Clark Fork River, near the Idaho border. The town is surrounded by rolling hills and mountains, and the nearby Cabinet Mountains provide a beautiful backdrop. The climate in Plains is generally mild, with cold winters and warm summers.
Economy
The economy of Plains is largely based on agriculture and tourism. The town is home to several small farms, which produce a variety of crops, including wheat, barley, and hay. The nearby Cabinet Mountains provide a popular destination for outdoor recreation, and the town is home to several campgrounds and resorts.
Demographics
As of the 2010 census, the population of Plains was 1,000. The town is predominantly white, with a small Native American population. The median household income in Plains is $35,000, and the median home value is $125,000. The town has a low unemployment rate, and the majority of the population is employed in the agricultural and tourism industries.
Conclusion
Plains, Montana is a small town located in Sanders County, in the northwestern part of the state. It is situated on the banks of the Clark Fork River, near the Idaho border. The town was founded in 1883 and has a population of approximately 1,000 people. The economy of Plains is largely based on agriculture and tourism, and the town is home to several small farms and resorts. The population of Plains is predominantly white, with a small Native American population. The median household income in Plains is $35,000, and the median home value is $125,000.
Common Questions
What is Per Capita Income in Plains?
Per Capita income in Plains is $28,828.
What is the Median Family Income in Plains?
Median Family Income in Plains is $57,639.
What is the Median Household income in Plains?
Median Household Income in Plains is $25,313.
What is Income or Wage Gap in Plains?
Income or Wage Gap in Plains is 34.8%.
Women in Plains earn 65.2 cents for every dollar earned by a man.
What is Inequality or Gini Index in Plains?
Inequality or Gini Index in Plains is 0.50.
What is the Total Population of Plains?
Total Population of Plains is 1,181.
What is the Total Male Population of Plains?
Total Male Population of Plains is 624.
What is the Total Female Population of Plains?
Total Female Population of Plains is 557.
What is the Ratio of Males per 100 Females in Plains?
There are 112.03 Males per 100 Females in Plains.
What is the Ratio of Females per 100 Males in Plains?
There are 89.26 Females per 100 Males in Plains.
What is the Median Population Age in Plains?
Median Population Age in Plains is 43.8 Years.
What is the Average Family Size in Plains
Average Family Size in Plains is 2.8 People.
What is the Average Household Size in Plains
Average Household Size in Plains is 1.8 People.
How Large is the Labor Force in Plains?
There are 520 People in the Labor Forcein in Plains.
What is the Percentage of People in the Labor Force in Plains?
51.6% of People are in the Labor Force in Plains.
What is the Unemployment Rate in Plains?
Unemployment Rate in Plains is 2.5%.