Glasgow, MT Map & Demographics
Glasgow Map
Glasgow Overview
$32,294
PER CAPITA INCOME
$83,976
AVG FAMILY INCOME
$65,850
AVG HOUSEHOLD INCOME
44.8%
WAGE / INCOME GAP [ % ]
55.2¢/ $1
WAGE / INCOME GAP [ $ ]
0.39
INEQUALITY / GINI INDEX
3,208
TOTAL POPULATION
1,533
MALE POPULATION
1,675
FEMALE POPULATION
91.52
MALES / 100 FEMALES
109.26
FEMALES / 100 MALES
40.6
MEDIAN AGE
3.3
AVG FAMILY SIZE
2.6
AVG HOUSEHOLD SIZE
1,651
LABOR FORCE [ PEOPLE ]
68.6%
PERCENT IN LABOR FORCE
0.8%
UNEMPLOYMENT RATE
Glasgow Zip Codes
Glasgow Area Codes
Income in Glasgow
Income Overview in Glasgow
Per Capita Income in Glasgow is $32,294, while median incomes of families and households are $83,976 and $65,850 respectively.
| Characteristic | Number | Measure |
| Per Capita Income | 3,208 | $32,294 |
| Median Family Income | 753 | $83,976 |
| Mean Family Income | 753 | $94,951 |
| Median Household Income | 1,189 | $65,850 |
| Mean Household Income | 1,189 | $79,031 |
| Income Deficit | 753 | $0 |
| Wage / Income Gap (%) | 3,208 | 44.82% |
| Wage / Income Gap ($) | 3,208 | 55.18¢ per $1 |
| Gini / Inequality Index | 3,208 | 0.39 |
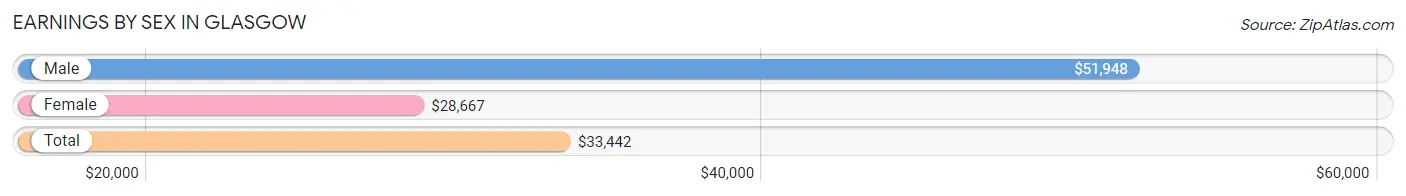
Earnings by Sex in Glasgow
Average Earnings in Glasgow are $33,442, $51,948 for men and $28,667 for women, a difference of 44.8%.
| Sex | Number | Average Earnings |
| Male | 821 (49.0%) | $51,948 |
| Female | 856 (51.0%) | $28,667 |
| Total | 1,677 (100.0%) | $33,442 |
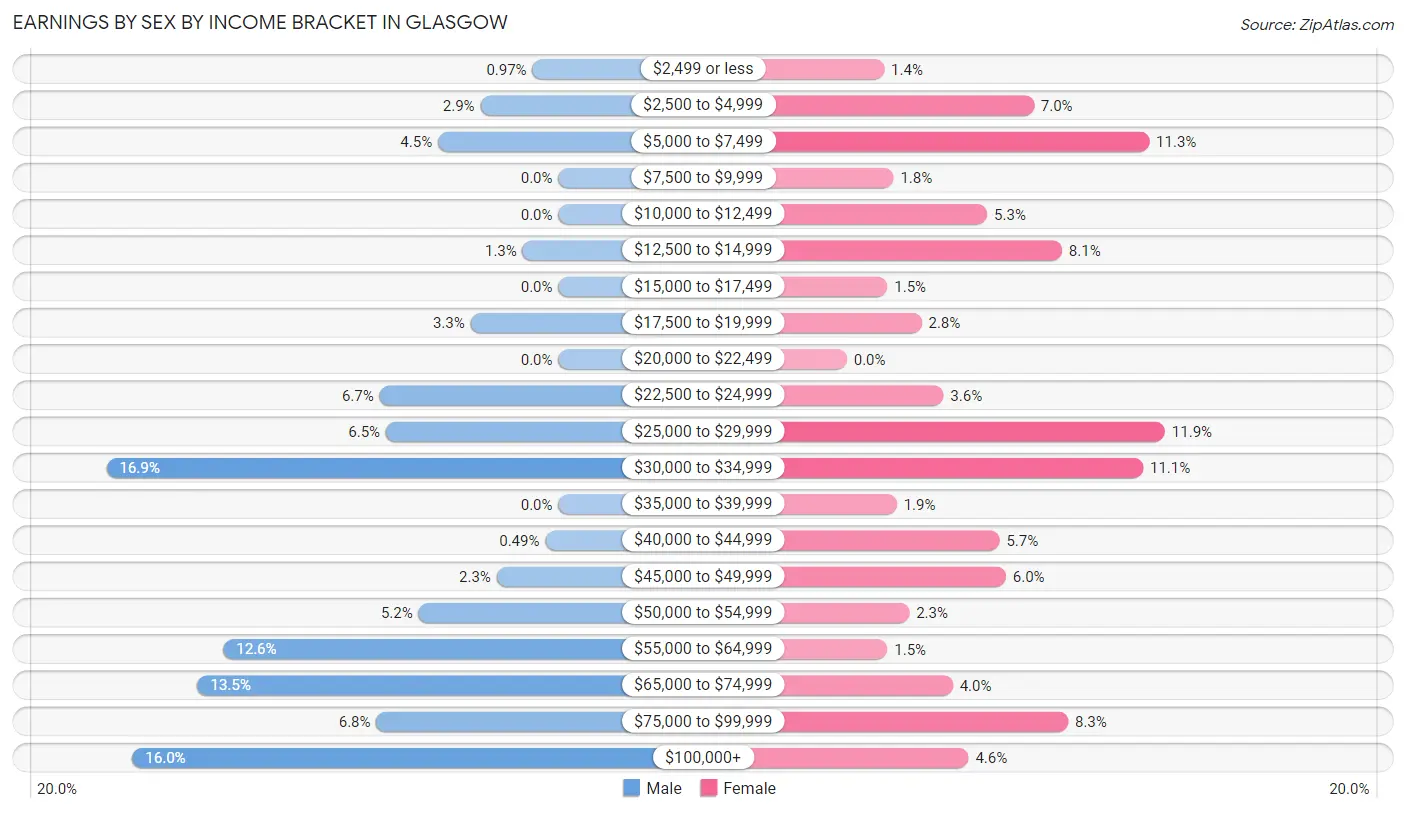
Earnings by Sex by Income Bracket in Glasgow
The most common earnings brackets in Glasgow are $30,000 to $34,999 for men (139 | 16.9%) and $25,000 to $29,999 for women (102 | 11.9%).
| Income | Male | Female |
| $2,499 or less | 8 (1.0%) | 12 (1.4%) |
| $2,500 to $4,999 | 24 (2.9%) | 60 (7.0%) |
| $5,000 to $7,499 | 37 (4.5%) | 97 (11.3%) |
| $7,500 to $9,999 | 0 (0.0%) | 15 (1.8%) |
| $10,000 to $12,499 | 0 (0.0%) | 45 (5.3%) |
| $12,500 to $14,999 | 11 (1.3%) | 69 (8.1%) |
| $15,000 to $17,499 | 0 (0.0%) | 13 (1.5%) |
| $17,500 to $19,999 | 27 (3.3%) | 24 (2.8%) |
| $20,000 to $22,499 | 0 (0.0%) | 0 (0.0%) |
| $22,500 to $24,999 | 55 (6.7%) | 31 (3.6%) |
| $25,000 to $29,999 | 53 (6.5%) | 102 (11.9%) |
| $30,000 to $34,999 | 139 (16.9%) | 95 (11.1%) |
| $35,000 to $39,999 | 0 (0.0%) | 16 (1.9%) |
| $40,000 to $44,999 | 4 (0.5%) | 49 (5.7%) |
| $45,000 to $49,999 | 19 (2.3%) | 51 (6.0%) |
| $50,000 to $54,999 | 43 (5.2%) | 20 (2.3%) |
| $55,000 to $64,999 | 103 (12.6%) | 13 (1.5%) |
| $65,000 to $74,999 | 111 (13.5%) | 34 (4.0%) |
| $75,000 to $99,999 | 56 (6.8%) | 71 (8.3%) |
| $100,000+ | 131 (16.0%) | 39 (4.6%) |
| Total | 821 (100.0%) | 856 (100.0%) |
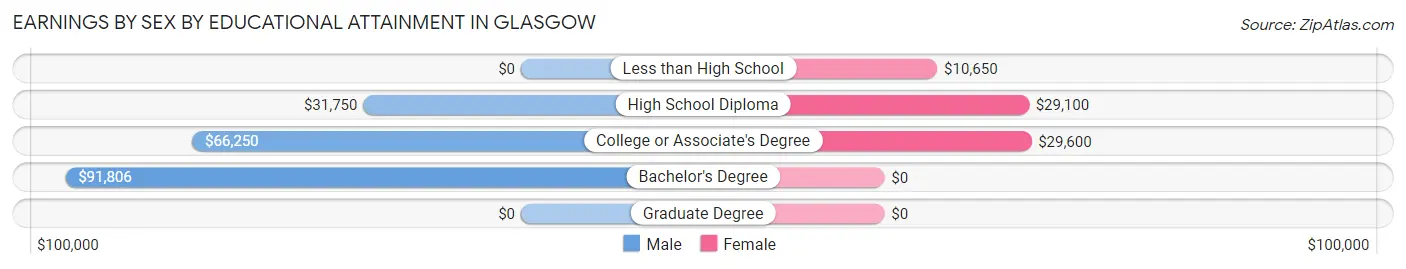
Earnings by Sex by Educational Attainment in Glasgow
Average earnings in Glasgow are $52,404 for men and $31,806 for women, a difference of 39.3%. Men with an educational attainment of bachelor's degree enjoy the highest average annual earnings of $91,806, while those with high school diploma education earn the least with $31,750. Women with an educational attainment of college or associate's degree earn the most with the average annual earnings of $29,600, while those with less than high school education have the smallest earnings of $10,650.
| Educational Attainment | Male Income | Female Income |
| Less than High School | - | - |
| High School Diploma | $31,750 | $29,100 |
| College or Associate's Degree | $66,250 | $29,600 |
| Bachelor's Degree | $91,806 | $0 |
| Graduate Degree | - | - |
| Total | $52,404 | $31,806 |
Family Income in Glasgow
Family Income Brackets in Glasgow
According to the Glasgow family income data, there are 224 families falling into the $75,000 to $99,999 income range, which is the most common income bracket and makes up 29.7% of all families.
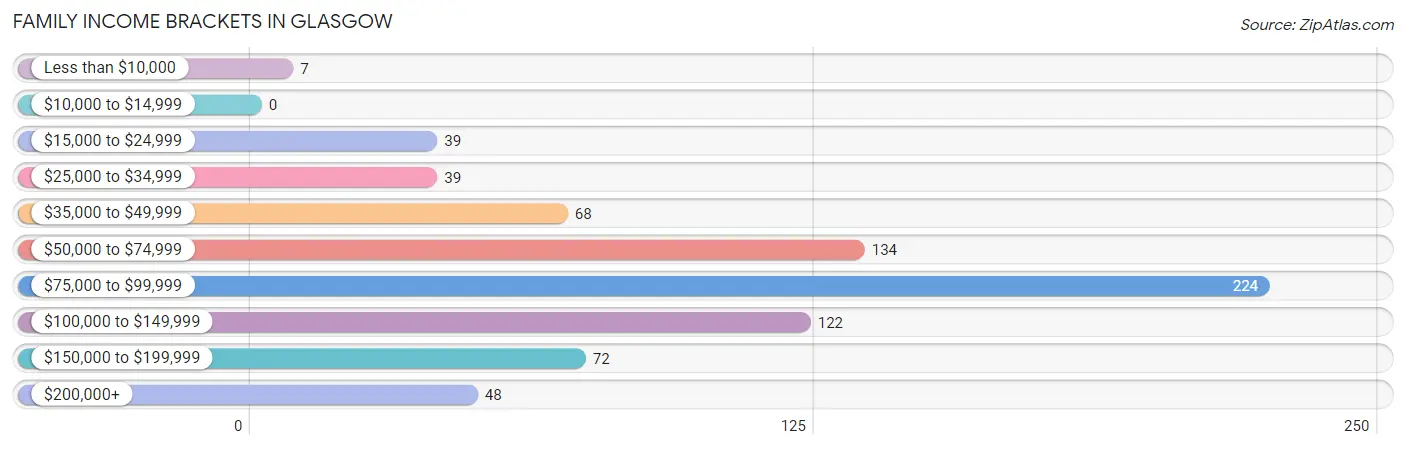
| Income Bracket | # Families | % Families |
| Less than $10,000 | 7 | 0.9% |
| $10,000 to $14,999 | 0 | 0.0% |
| $15,000 to $24,999 | 39 | 5.2% |
| $25,000 to $34,999 | 39 | 5.2% |
| $35,000 to $49,999 | 68 | 9.0% |
| $50,000 to $74,999 | 134 | 17.8% |
| $75,000 to $99,999 | 224 | 29.7% |
| $100,000 to $149,999 | 122 | 16.2% |
| $150,000 to $199,999 | 72 | 9.6% |
| $200,000+ | 48 | 6.4% |
Family Income by Famaliy Size in Glasgow
4-person families (145 | 19.3%) account for the highest median family income in Glasgow with $137,083 per family, while 4-person families (145 | 19.3%) have the highest median income of $34,271 per family member.
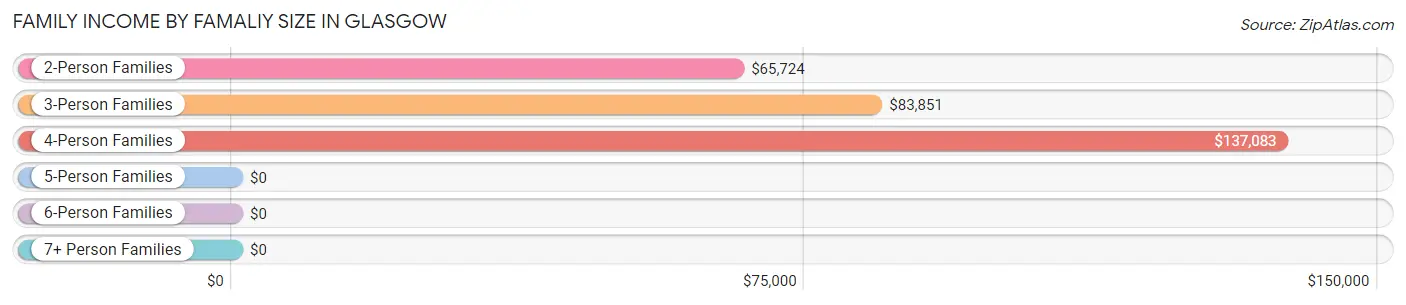
| Income Bracket | # Families | Median Income |
| 2-Person Families | 407 (54.0%) | $65,724 |
| 3-Person Families | 154 (20.4%) | $83,851 |
| 4-Person Families | 145 (19.3%) | $137,083 |
| 5-Person Families | 35 (4.6%) | $0 |
| 6-Person Families | 0 (0.0%) | $0 |
| 7+ Person Families | 12 (1.6%) | $0 |
| Total | 753 (100.0%) | $83,976 |
Family Income by Number of Earners in Glasgow
The median family income in Glasgow is $83,976, with families comprising 3+ earners (130) having the highest median family income of $121,042, while families with no earners (78) have the lowest median family income of $36,346, accounting for 17.3% and 10.4% of families, respectively.
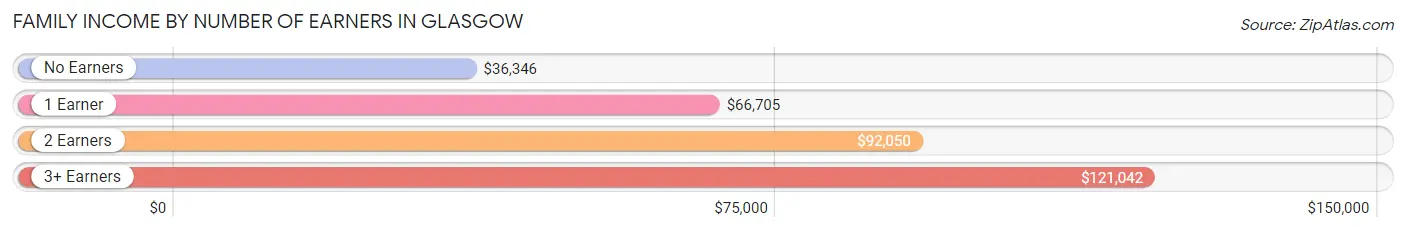
| Number of Earners | # Families | Median Income |
| No Earners | 78 (10.4%) | $36,346 |
| 1 Earner | 305 (40.5%) | $66,705 |
| 2 Earners | 240 (31.9%) | $92,050 |
| 3+ Earners | 130 (17.3%) | $121,042 |
| Total | 753 (100.0%) | $83,976 |
Household Income in Glasgow
Household Income Brackets in Glasgow
With 254 households falling in the category, the $75,000 to $99,999 income range is the most frequent in Glasgow, accounting for 21.4% of all households. In contrast, only 34 households (2.9%) fall into the less than $10,000 income bracket, making it the least populous group.
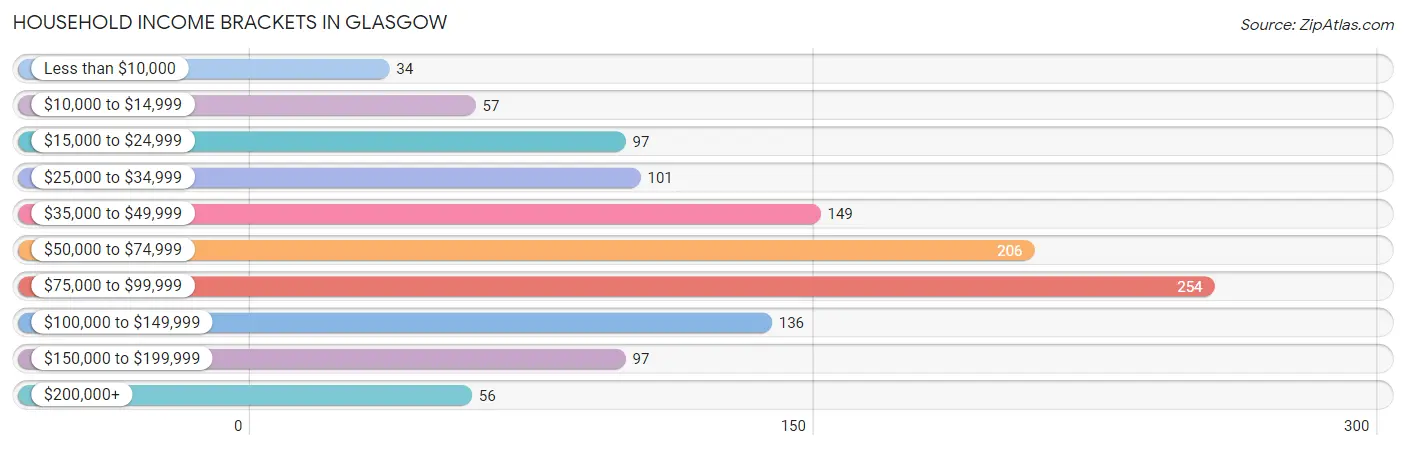
| Income Bracket | # Households | % Households |
| Less than $10,000 | 34 | 2.9% |
| $10,000 to $14,999 | 57 | 4.8% |
| $15,000 to $24,999 | 97 | 8.2% |
| $25,000 to $34,999 | 101 | 8.5% |
| $35,000 to $49,999 | 149 | 12.5% |
| $50,000 to $74,999 | 206 | 17.3% |
| $75,000 to $99,999 | 254 | 21.4% |
| $100,000 to $149,999 | 136 | 11.4% |
| $150,000 to $199,999 | 97 | 8.2% |
| $200,000+ | 56 | 4.7% |
Household Income by Householder Age in Glasgow
The median household income in Glasgow is $65,850, with the highest median household income of $88,214 found in the 45 to 64 years age bracket for the primary householder. A total of 416 households (35.0%) fall into this category. Meanwhile, the 65+ years age bracket for the primary householder has the lowest median household income of $36,969, with 419 households (35.2%) in this group.
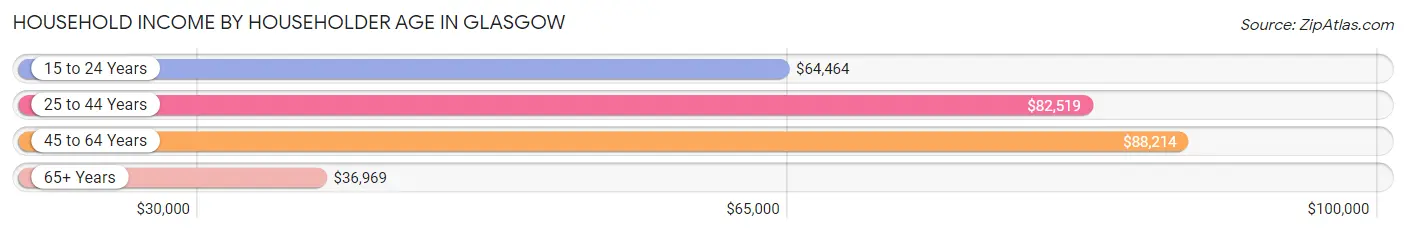
| Income Bracket | # Households | Median Income |
| 15 to 24 Years | 21 (1.8%) | $64,464 |
| 25 to 44 Years | 333 (28.0%) | $82,519 |
| 45 to 64 Years | 416 (35.0%) | $88,214 |
| 65+ Years | 419 (35.2%) | $36,969 |
| Total | 1,189 (100.0%) | $65,850 |
Poverty in Glasgow
Income Below Poverty by Sex and Age in Glasgow
With 6.9% poverty level for males and 11.4% for females among the residents of Glasgow, 25 to 34 year old males and 6 to 11 year old females are the most vulnerable to poverty, with 42 males (31.3%) and 52 females (38.8%) in their respective age groups living below the poverty level.
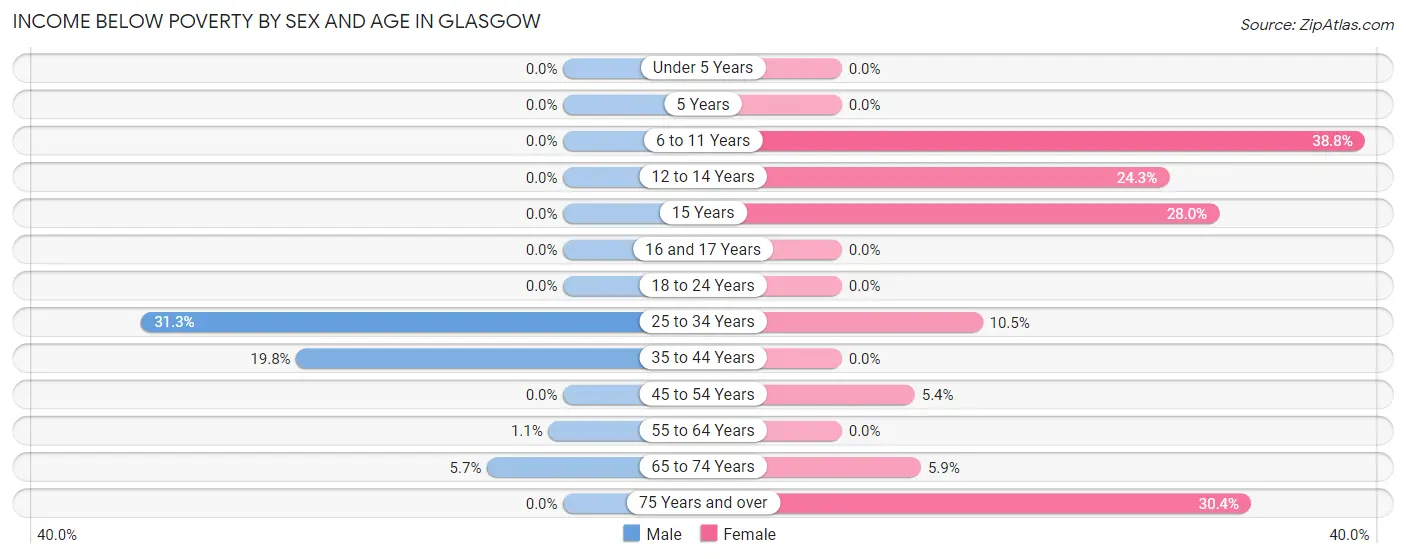
| Age Bracket | Male | Female |
| Under 5 Years | 0 (0.0%) | 0 (0.0%) |
| 5 Years | 0 (0.0%) | 0 (0.0%) |
| 6 to 11 Years | 0 (0.0%) | 52 (38.8%) |
| 12 to 14 Years | 0 (0.0%) | 26 (24.3%) |
| 15 Years | 0 (0.0%) | 7 (28.0%) |
| 16 and 17 Years | 0 (0.0%) | 0 (0.0%) |
| 18 to 24 Years | 0 (0.0%) | 0 (0.0%) |
| 25 to 34 Years | 42 (31.3%) | 21 (10.4%) |
| 35 to 44 Years | 44 (19.8%) | 0 (0.0%) |
| 45 to 54 Years | 0 (0.0%) | 9 (5.4%) |
| 55 to 64 Years | 2 (1.1%) | 0 (0.0%) |
| 65 to 74 Years | 10 (5.7%) | 11 (5.9%) |
| 75 Years and over | 0 (0.0%) | 58 (30.4%) |
| Total | 98 (6.9%) | 184 (11.4%) |
Income Above Poverty by Sex and Age in Glasgow
According to the poverty statistics in Glasgow, males aged under 5 years and females aged under 5 years are the age groups that are most secure financially, with 100.0% of males and 100.0% of females in these age groups living above the poverty line.
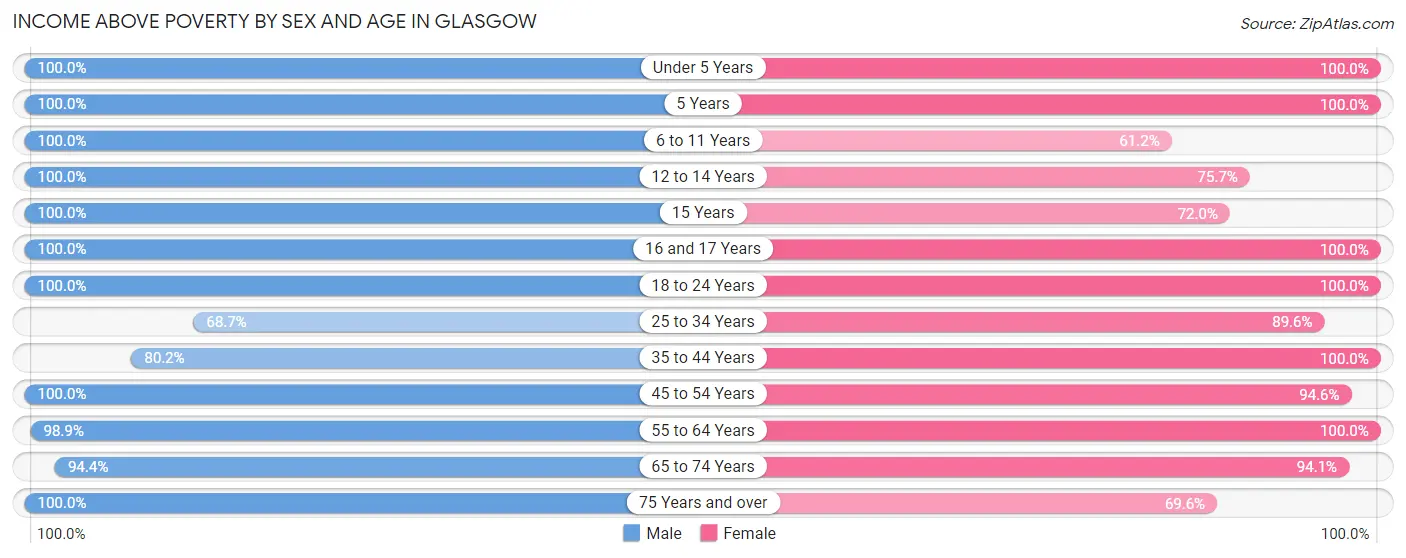
| Age Bracket | Male | Female |
| Under 5 Years | 114 (100.0%) | 70 (100.0%) |
| 5 Years | 139 (100.0%) | 10 (100.0%) |
| 6 to 11 Years | 76 (100.0%) | 82 (61.2%) |
| 12 to 14 Years | 19 (100.0%) | 81 (75.7%) |
| 15 Years | 47 (100.0%) | 18 (72.0%) |
| 16 and 17 Years | 21 (100.0%) | 79 (100.0%) |
| 18 to 24 Years | 31 (100.0%) | 87 (100.0%) |
| 25 to 34 Years | 92 (68.7%) | 180 (89.5%) |
| 35 to 44 Years | 178 (80.2%) | 111 (100.0%) |
| 45 to 54 Years | 207 (100.0%) | 157 (94.6%) |
| 55 to 64 Years | 179 (98.9%) | 252 (100.0%) |
| 65 to 74 Years | 167 (94.4%) | 176 (94.1%) |
| 75 Years and over | 63 (100.0%) | 133 (69.6%) |
| Total | 1,333 (93.1%) | 1,436 (88.6%) |
Income Below Poverty Among Married-Couple Families in Glasgow
The poverty statistics for married-couple families in Glasgow show that 2.7% or 16 of the total 583 families live below the poverty line. Families with 3 or 4 children have the highest poverty rate of 45.7%, comprising of 16 families. On the other hand, families with no children have the lowest poverty rate of 0.0%, which includes 0 families.
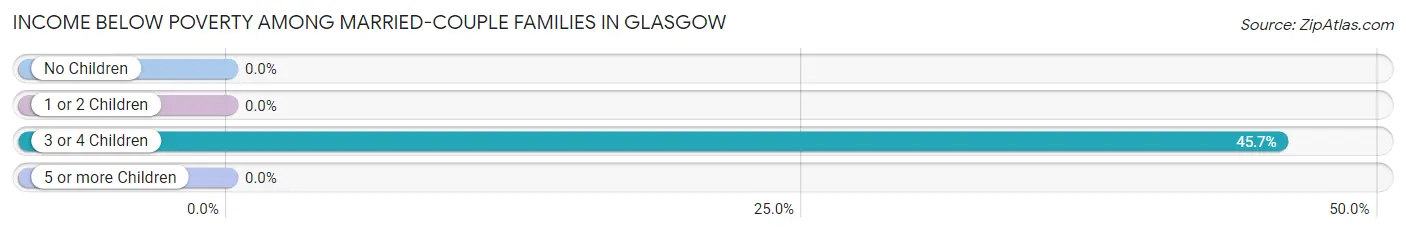
| Children | Above Poverty | Below Poverty |
| No Children | 324 (100.0%) | 0 (0.0%) |
| 1 or 2 Children | 212 (100.0%) | 0 (0.0%) |
| 3 or 4 Children | 19 (54.3%) | 16 (45.7%) |
| 5 or more Children | 12 (100.0%) | 0 (0.0%) |
| Total | 567 (97.3%) | 16 (2.7%) |
Income Below Poverty Among Single-Parent Households in Glasgow
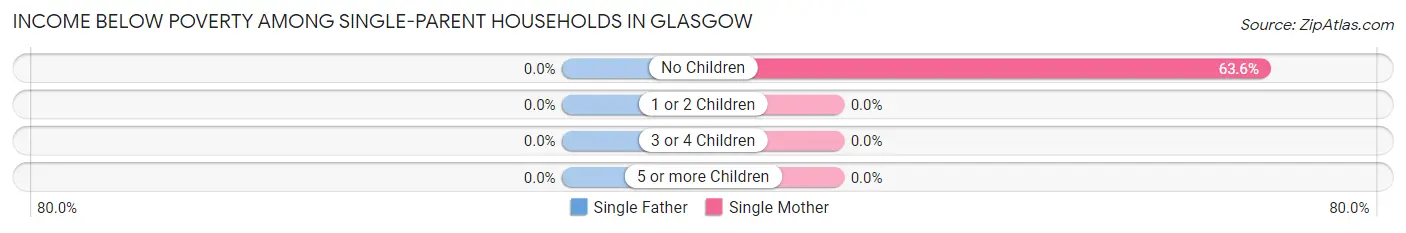
| Children | Single Father | Single Mother |
| No Children | 0 (0.0%) | 7 (63.6%) |
| 1 or 2 Children | 0 (0.0%) | 0 (0.0%) |
| 3 or 4 Children | 0 (0.0%) | 0 (0.0%) |
| 5 or more Children | 0 (0.0%) | 0 (0.0%) |
| Total | 0 (0.0%) | 7 (5.1%) |
Income Below Poverty Among Married-Couple vs Single-Parent Households in Glasgow
The poverty data for Glasgow shows that 16 of the married-couple family households (2.7%) and 7 of the single-parent households (4.1%) are living below the poverty level. Within the married-couple family households, those with 3 or 4 children have the highest poverty rate, with 16 households (45.7%) falling below the poverty line. Among the single-parent households, those with no children have the highest poverty rate, with 7 household (17.1%) living below poverty.
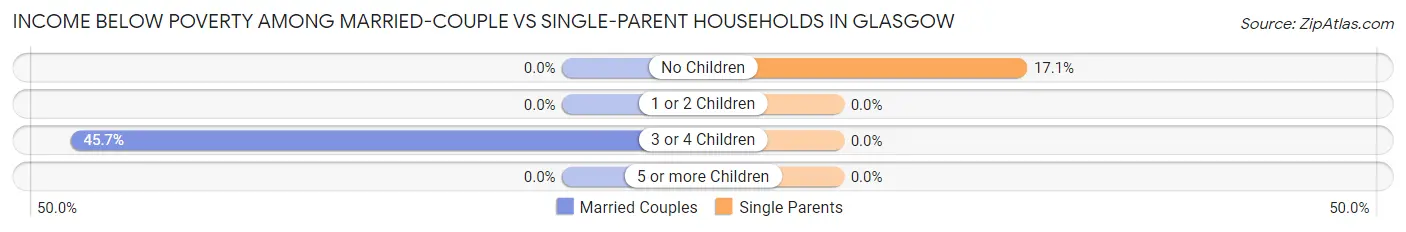
| Children | Married-Couple Families | Single-Parent Households |
| No Children | 0 (0.0%) | 7 (17.1%) |
| 1 or 2 Children | 0 (0.0%) | 0 (0.0%) |
| 3 or 4 Children | 16 (45.7%) | 0 (0.0%) |
| 5 or more Children | 0 (0.0%) | 0 (0.0%) |
| Total | 16 (2.7%) | 7 (4.1%) |
Race in Glasgow
The most populous races in Glasgow are White / Caucasian (2,957 | 92.2%), Two or more Races (125 | 3.9%), and Native / Alaskan (100 | 3.1%).
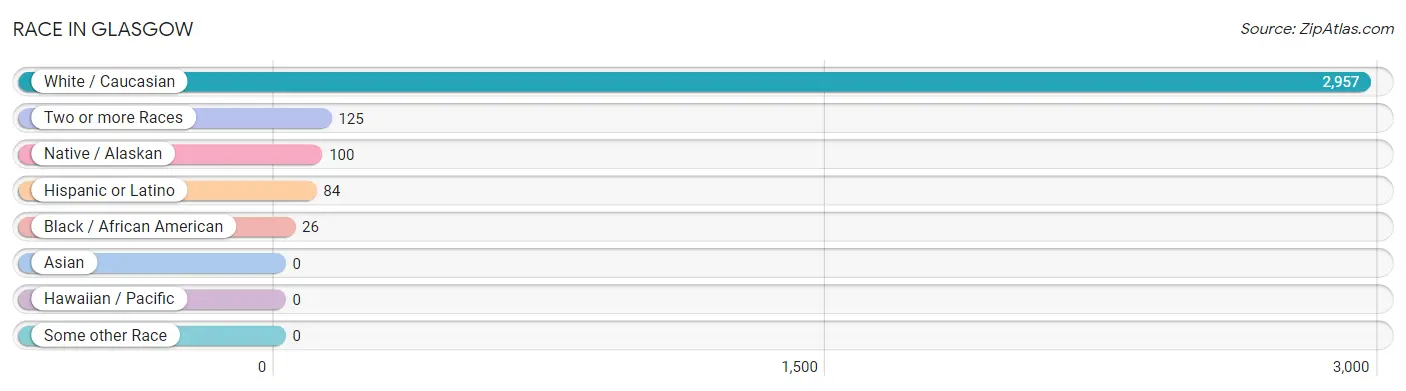
| Race | # Population | % Population |
| Asian | 0 | 0.0% |
| Black / African American | 26 | 0.8% |
| Hawaiian / Pacific | 0 | 0.0% |
| Hispanic or Latino | 84 | 2.6% |
| Native / Alaskan | 100 | 3.1% |
| White / Caucasian | 2,957 | 92.2% |
| Two or more Races | 125 | 3.9% |
| Some other Race | 0 | 0.0% |
| Total | 3,208 | 100.0% |
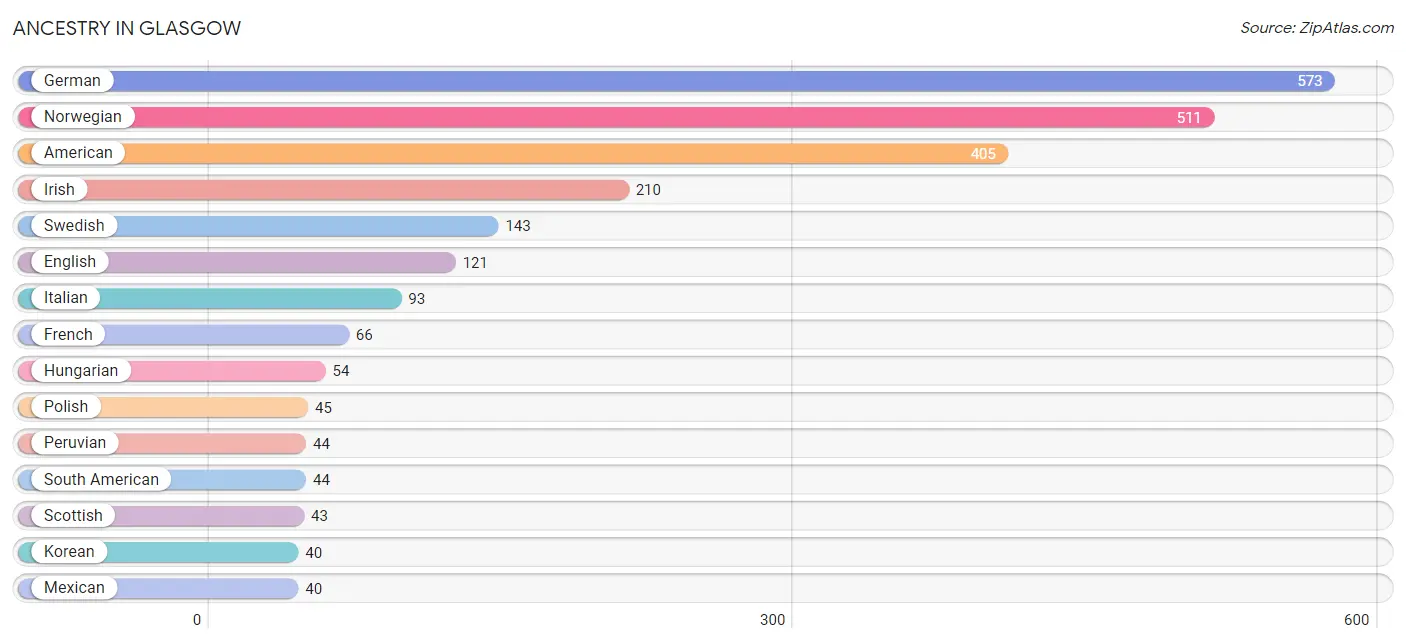
Ancestry in Glasgow
The most populous ancestries reported in Glasgow are German (573 | 17.9%), Norwegian (511 | 15.9%), American (405 | 12.6%), Irish (210 | 6.6%), and Swedish (143 | 4.5%), together accounting for 57.4% of all Glasgow residents.
| Ancestry | # Population | % Population |
| American | 405 | 12.6% |
| Arab | 9 | 0.3% |
| Belgian | 7 | 0.2% |
| Bhutanese | 17 | 0.5% |
| Chippewa | 8 | 0.3% |
| Crow | 4 | 0.1% |
| Danish | 36 | 1.1% |
| Dutch | 23 | 0.7% |
| English | 121 | 3.8% |
| European | 15 | 0.5% |
| Finnish | 5 | 0.2% |
| French | 66 | 2.1% |
| French Canadian | 5 | 0.2% |
| German | 573 | 17.9% |
| Hungarian | 54 | 1.7% |
| Irish | 210 | 6.6% |
| Italian | 93 | 2.9% |
| Korean | 40 | 1.3% |
| Lebanese | 9 | 0.3% |
| Mexican | 40 | 1.3% |
| Norwegian | 511 | 15.9% |
| Peruvian | 44 | 1.4% |
| Polish | 45 | 1.4% |
| Russian | 14 | 0.4% |
| Scandinavian | 23 | 0.7% |
| Scotch-Irish | 14 | 0.4% |
| Scottish | 43 | 1.3% |
| Sioux | 7 | 0.2% |
| Slovak | 4 | 0.1% |
| South American | 44 | 1.4% |
| Swedish | 143 | 4.5% |
| Swiss | 6 | 0.2% |
| Ukrainian | 13 | 0.4% | View All 33 Rows |
Immigrants in Glasgow

| Immigration Origin | # Population | % Population | View All 0 Rows |
Sex and Age in Glasgow
Sex and Age in Glasgow
The most populous age groups in Glasgow are 5 to 9 Years (222 | 14.5%) for men and 10 to 14 Years (174 | 10.4%) for women.
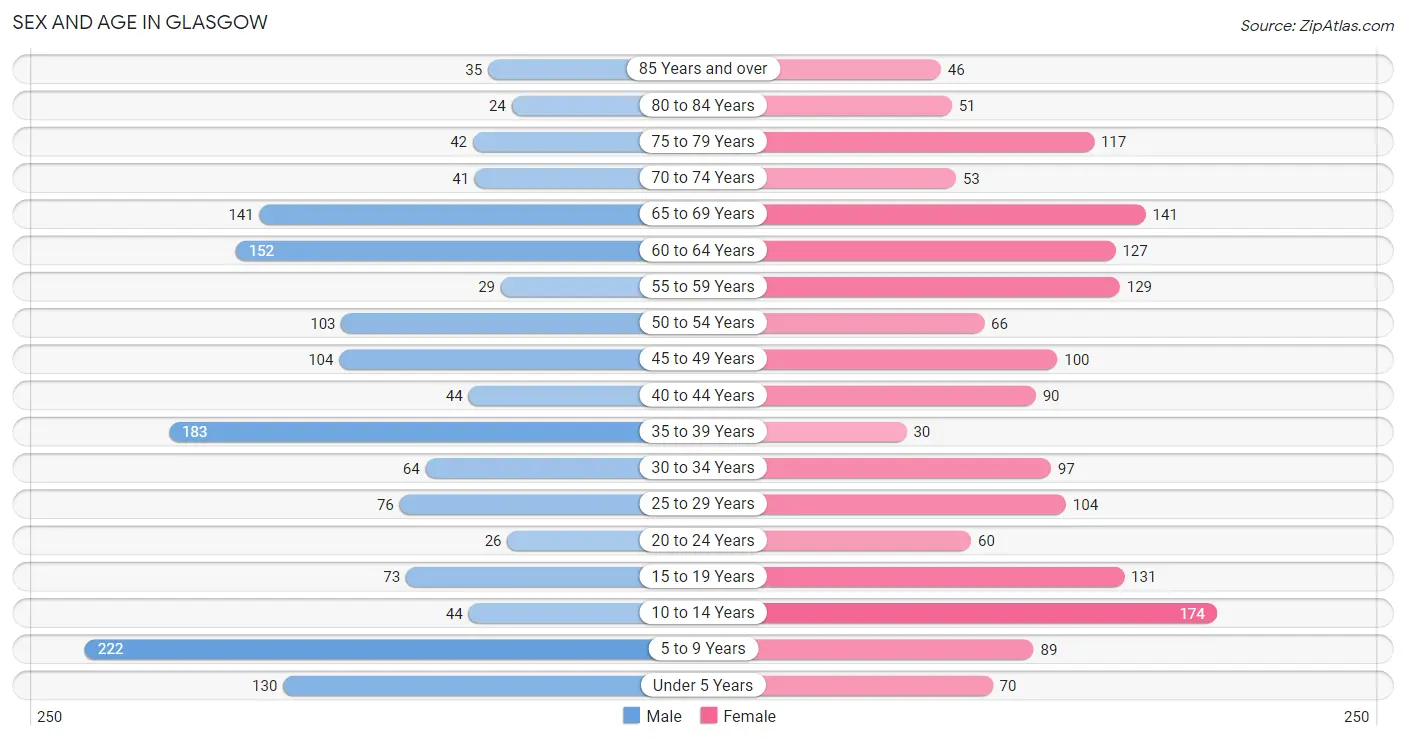
| Age Bracket | Male | Female |
| Under 5 Years | 130 (8.5%) | 70 (4.2%) |
| 5 to 9 Years | 222 (14.5%) | 89 (5.3%) |
| 10 to 14 Years | 44 (2.9%) | 174 (10.4%) |
| 15 to 19 Years | 73 (4.8%) | 131 (7.8%) |
| 20 to 24 Years | 26 (1.7%) | 60 (3.6%) |
| 25 to 29 Years | 76 (5.0%) | 104 (6.2%) |
| 30 to 34 Years | 64 (4.2%) | 97 (5.8%) |
| 35 to 39 Years | 183 (11.9%) | 30 (1.8%) |
| 40 to 44 Years | 44 (2.9%) | 90 (5.4%) |
| 45 to 49 Years | 104 (6.8%) | 100 (6.0%) |
| 50 to 54 Years | 103 (6.7%) | 66 (3.9%) |
| 55 to 59 Years | 29 (1.9%) | 129 (7.7%) |
| 60 to 64 Years | 152 (9.9%) | 127 (7.6%) |
| 65 to 69 Years | 141 (9.2%) | 141 (8.4%) |
| 70 to 74 Years | 41 (2.7%) | 53 (3.2%) |
| 75 to 79 Years | 42 (2.7%) | 117 (7.0%) |
| 80 to 84 Years | 24 (1.6%) | 51 (3.0%) |
| 85 Years and over | 35 (2.3%) | 46 (2.8%) |
| Total | 1,533 (100.0%) | 1,675 (100.0%) |
Families and Households in Glasgow
Median Family Size in Glasgow
The median family size in Glasgow is 3.26 persons per family, with married-couple families (583 | 77.4%) accounting for the largest median family size of 3.29 persons per family. On the other hand, single male/father families (34 | 4.5%) represent the smallest median family size with 3.06 persons per family.
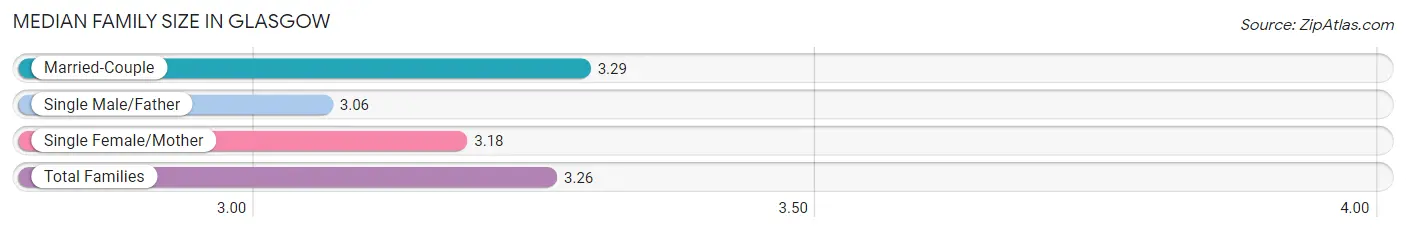
| Family Type | # Families | Family Size |
| Married-Couple | 583 (77.4%) | 3.29 |
| Single Male/Father | 34 (4.5%) | 3.06 |
| Single Female/Mother | 136 (18.1%) | 3.18 |
| Total Families | 753 (100.0%) | 3.26 |
Median Household Size in Glasgow
The median household size in Glasgow is 2.58 persons per household, with single female/mother households (136 | 11.4%) accounting for the largest median household size of 3.62 persons per household. non-family households (436 | 36.7%) represent the smallest median household size with 1.14 persons per household.
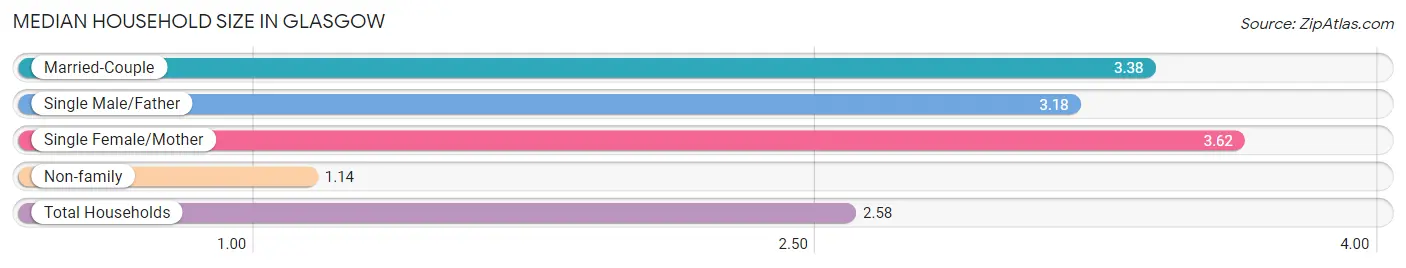
| Household Type | # Households | Household Size |
| Married-Couple | 583 (49.0%) | 3.38 |
| Single Male/Father | 34 (2.9%) | 3.18 |
| Single Female/Mother | 136 (11.4%) | 3.62 |
| Non-family | 436 (36.7%) | 1.14 |
| Total Households | 1,189 (100.0%) | 2.58 |
Household Size by Marriage Status in Glasgow
Out of a total of 1,189 households in Glasgow, 753 (63.3%) are family households, while 436 (36.7%) are nonfamily households. The most numerous type of family households are 2-person households, comprising 396, and the most common type of nonfamily households are 1-person households, comprising 405.
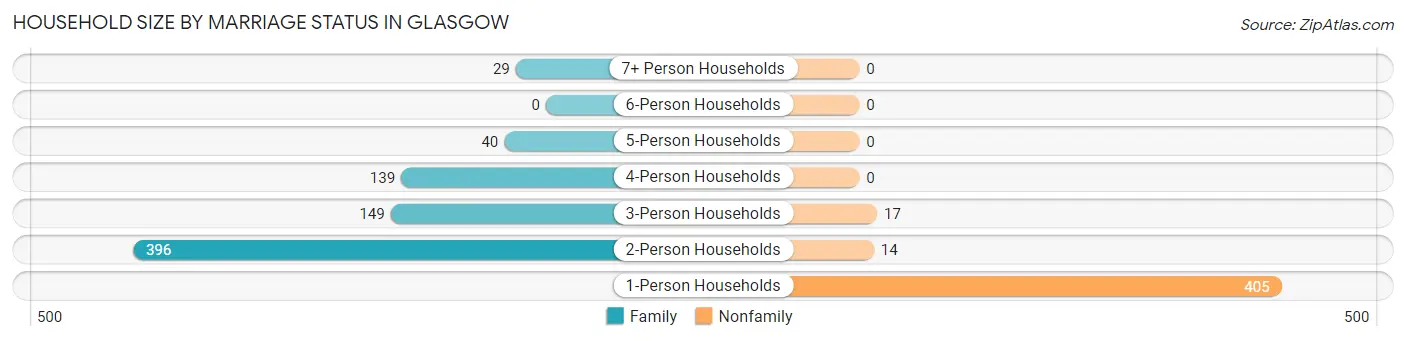
| Household Size | Family Households | Nonfamily Households |
| 1-Person Households | - | 405 (34.1%) |
| 2-Person Households | 396 (33.3%) | 14 (1.2%) |
| 3-Person Households | 149 (12.5%) | 17 (1.4%) |
| 4-Person Households | 139 (11.7%) | 0 (0.0%) |
| 5-Person Households | 40 (3.4%) | 0 (0.0%) |
| 6-Person Households | 0 (0.0%) | 0 (0.0%) |
| 7+ Person Households | 29 (2.4%) | 0 (0.0%) |
| Total | 753 (63.3%) | 436 (36.7%) |
Female Fertility in Glasgow
Fertility by Age in Glasgow
Average fertility rate in Glasgow is 53.0 births per 1,000 women. Women in the age bracket of 20 to 34 years have the highest fertility rate with 126.0 births per 1,000 women. Women in the age bracket of 20 to 34 years acount for 100.0% of all women with births.
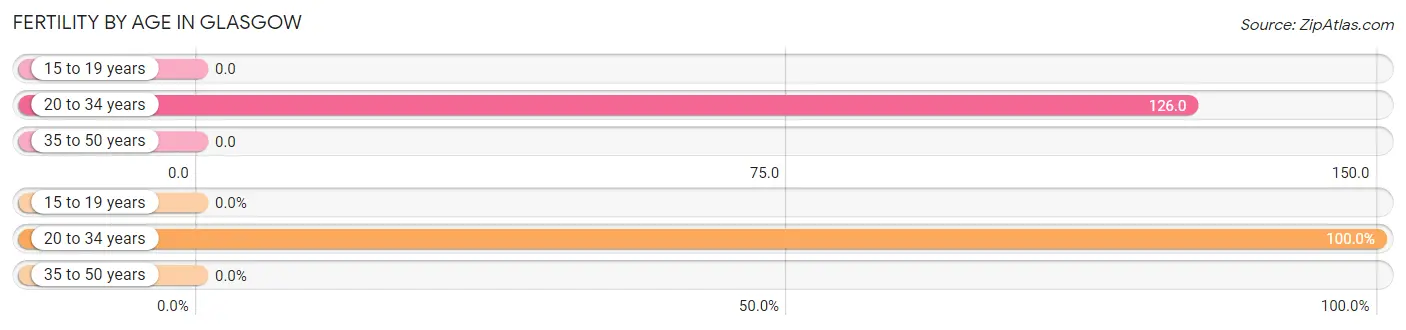
| Age Bracket | Women with Births | Births / 1,000 Women |
| 15 to 19 years | 0 (0.0%) | 0.0 |
| 20 to 34 years | 33 (100.0%) | 126.0 |
| 35 to 50 years | 0 (0.0%) | 0.0 |
| Total | 33 (100.0%) | 53.0 |
Fertility by Age by Marriage Status in Glasgow
48.5% of women with births (33) in Glasgow are married. The highest percentage of unmarried women with births falls into 20 to 34 years age bracket with 51.5% of them unmarried at the time of birth, while the lowest percentage of unmarried women with births belong to 20 to 34 years age bracket with 51.5% of them unmarried.
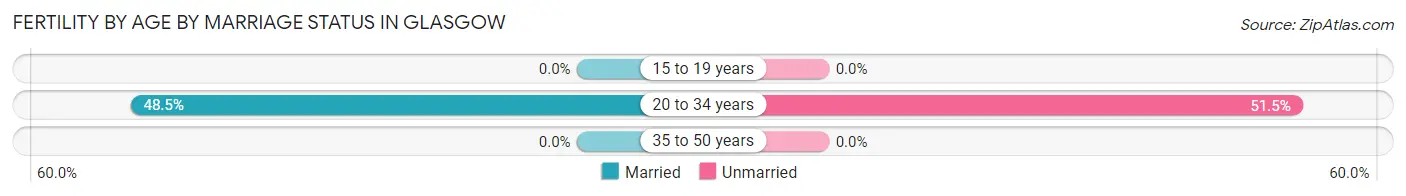
| Age Bracket | Married | Unmarried |
| 15 to 19 years | 0 (0.0%) | 0 (0.0%) |
| 20 to 34 years | 16 (48.5%) | 17 (51.5%) |
| 35 to 50 years | 0 (0.0%) | 0 (0.0%) |
| Total | 16 (48.5%) | 17 (51.5%) |
Fertility by Education in Glasgow
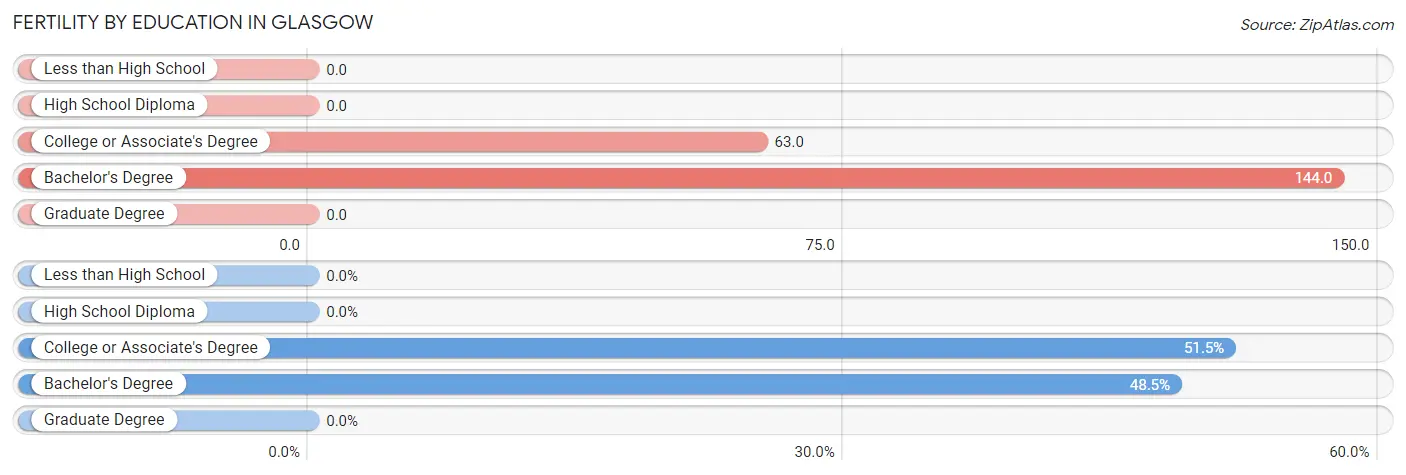
| Educational Attainment | Women with Births | Births / 1,000 Women |
| Less than High School | 0 (0.0%) | 0.0 |
| High School Diploma | 0 (0.0%) | 0.0 |
| College or Associate's Degree | 17 (51.5%) | 63.0 |
| Bachelor's Degree | 16 (48.5%) | 144.0 |
| Graduate Degree | 0 (0.0%) | 0.0 |
| Total | 33 (100.0%) | 53.0 |
Fertility by Education by Marriage Status in Glasgow
51.5% of women with births in Glasgow are unmarried. Women with the educational attainment of bachelor's degree are most likely to be married with 100.0% of them married at childbirth, while women with the educational attainment of college or associate's degree are least likely to be married with 100.0% of them unmarried at childbirth.
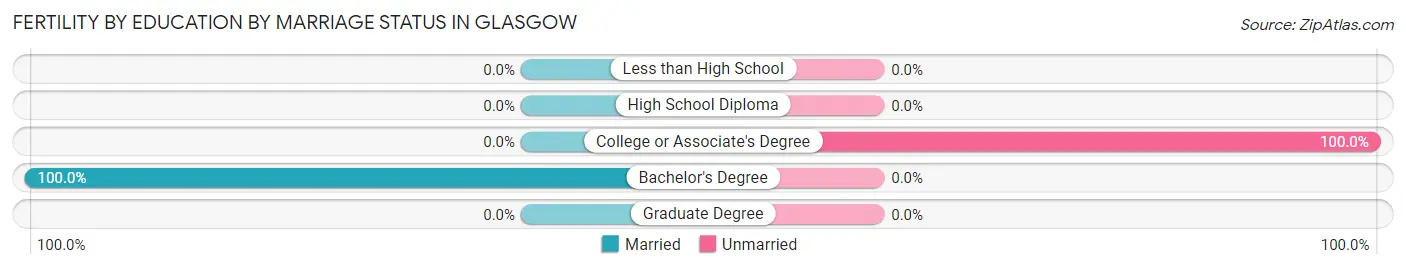
| Educational Attainment | Married | Unmarried |
| Less than High School | 0 (0.0%) | 0 (0.0%) |
| High School Diploma | 0 (0.0%) | 0 (0.0%) |
| College or Associate's Degree | 0 (0.0%) | 17 (100.0%) |
| Bachelor's Degree | 16 (100.0%) | 0 (0.0%) |
| Graduate Degree | 0 (0.0%) | 0 (0.0%) |
| Total | 16 (48.5%) | 17 (51.5%) |
Employment Characteristics in Glasgow
Employment by Class of Employer in Glasgow
Among the 1,589 employed individuals in Glasgow, private company employees (956 | 60.2%), not-for-profit organizations (263 | 16.6%), and federal government employees (165 | 10.4%) make up the most common classes of employment.
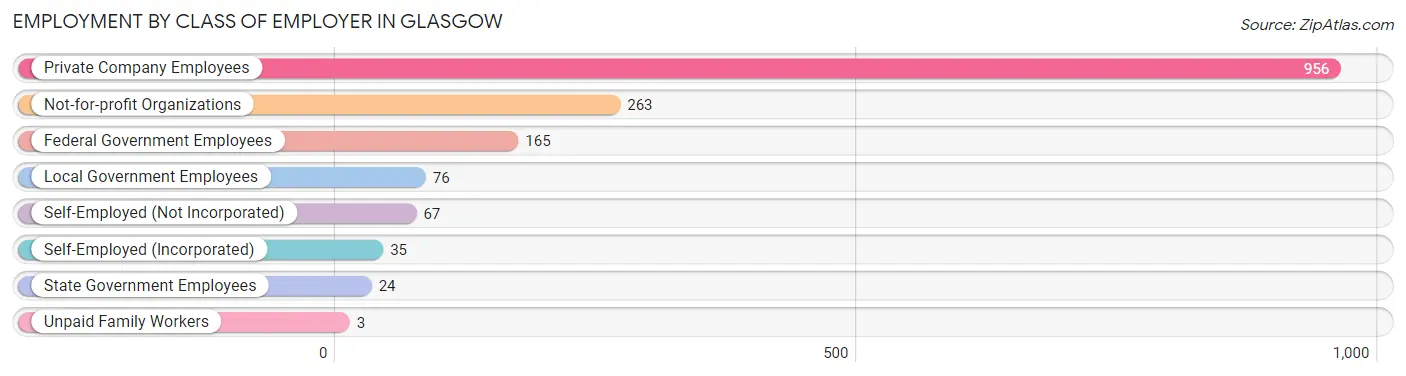
| Employer Class | # Employees | % Employees |
| Private Company Employees | 956 | 60.2% |
| Self-Employed (Incorporated) | 35 | 2.2% |
| Self-Employed (Not Incorporated) | 67 | 4.2% |
| Not-for-profit Organizations | 263 | 16.6% |
| Local Government Employees | 76 | 4.8% |
| State Government Employees | 24 | 1.5% |
| Federal Government Employees | 165 | 10.4% |
| Unpaid Family Workers | 3 | 0.2% |
| Total | 1,589 | 100.0% |
Employment Status by Age in Glasgow
According to the labor force statistics for Glasgow, out of the total population over 16 years of age (2,407), 68.6% or 1,651 individuals are in the labor force, with 0.8% or 13 of them unemployed. The age group with the highest labor force participation rate is 20 to 24 years, with 100.0% or 86 individuals in the labor force. Within the labor force, the 65 to 74 years age range has the highest percentage of unemployed individuals, with 7.9% or 8 of them being unemployed.
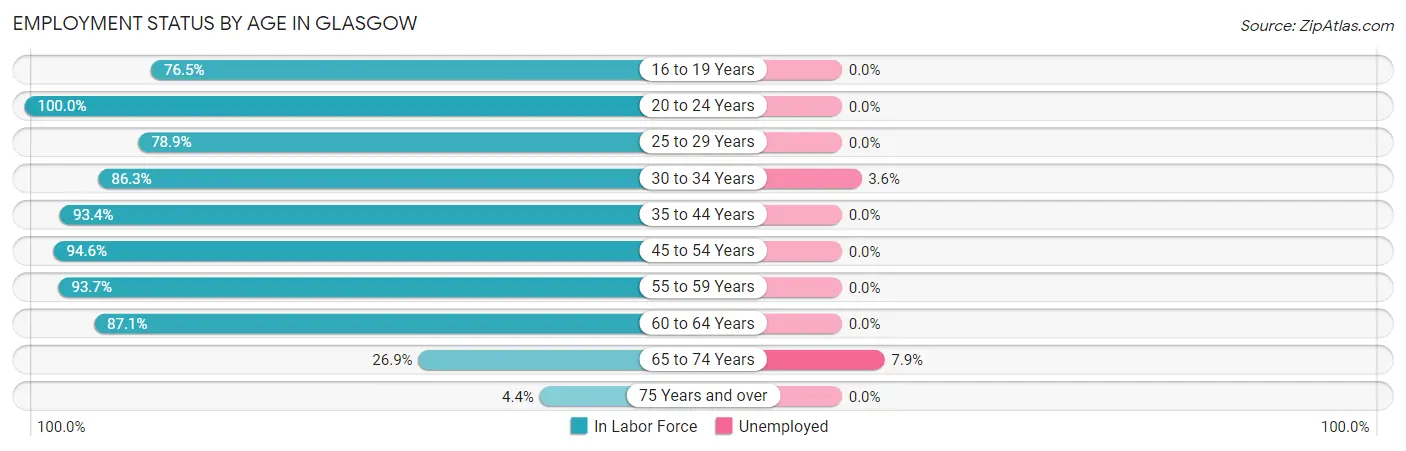
| Age Bracket | In Labor Force | Unemployed |
| 16 to 19 Years | 101 (76.5%) | 0 (0.0%) |
| 20 to 24 Years | 86 (100.0%) | 0 (0.0%) |
| 25 to 29 Years | 142 (78.9%) | 0 (0.0%) |
| 30 to 34 Years | 139 (86.3%) | 5 (3.6%) |
| 35 to 44 Years | 324 (93.4%) | 0 (0.0%) |
| 45 to 54 Years | 353 (94.6%) | 0 (0.0%) |
| 55 to 59 Years | 148 (93.7%) | 0 (0.0%) |
| 60 to 64 Years | 243 (87.1%) | 0 (0.0%) |
| 65 to 74 Years | 101 (26.9%) | 8 (7.9%) |
| 75 Years and over | 14 (4.4%) | 0 (0.0%) |
| Total | 1,651 (68.6%) | 13 (0.8%) |
Employment Status by Educational Attainment in Glasgow
According to labor force statistics for Glasgow, 90.1% of individuals (1,350) out of the total population between 25 and 64 years of age (1,498) are in the labor force, with 0.4% or 5 of them being unemployed. The group with the highest labor force participation rate are those with the educational attainment of college / associate degree, with 94.2% or 590 individuals in the labor force. Within the labor force, individuals with high school diploma education have the highest percentage of unemployment, with 1.2% or 5 of them being unemployed.
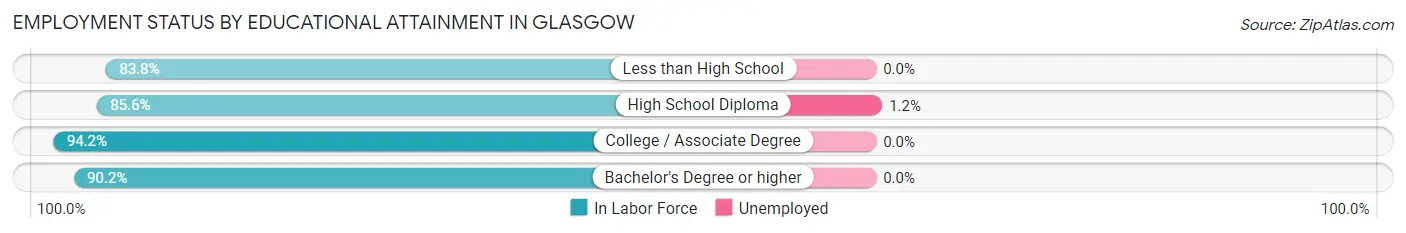
| Educational Attainment | In Labor Force | Unemployed |
| Less than High School | 67 (83.8%) | 0 (0.0%) |
| High School Diploma | 416 (85.6%) | 6 (1.2%) |
| College / Associate Degree | 590 (94.2%) | 0 (0.0%) |
| Bachelor's Degree or higher | 276 (90.2%) | 0 (0.0%) |
| Total | 1,350 (90.1%) | 6 (0.4%) |
Employment Occupations by Sex in Glasgow
Management, Business, Science and Arts Occupations
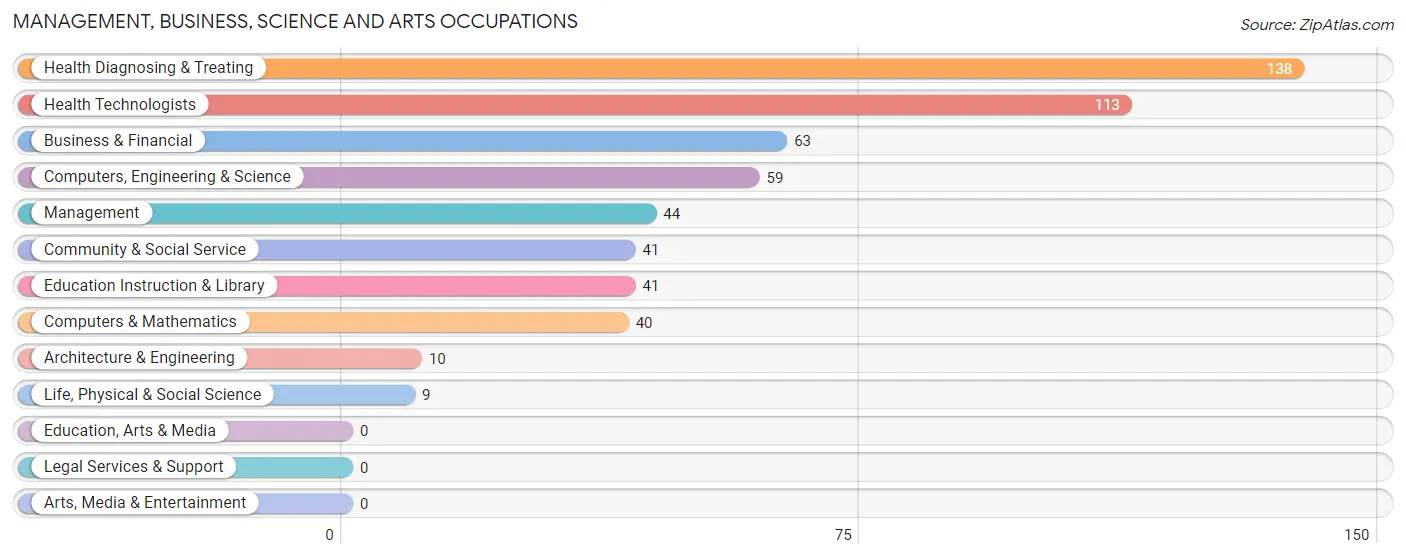
The most common Management, Business, Science and Arts occupations in Glasgow are Health Diagnosing & Treating (138 | 8.4%), Health Technologists (113 | 6.9%), Business & Financial (63 | 3.8%), Computers, Engineering & Science (59 | 3.6%), and Management (44 | 2.7%).
Management, Business, Science and Arts Occupations by Sex
Within the Management, Business, Science and Arts occupations in Glasgow, the most male-oriented occupations are Computers & Mathematics (100.0%), Architecture & Engineering (100.0%), and Computers, Engineering & Science (84.8%), while the most female-oriented occupations are Life, Physical & Social Science (100.0%), Health Technologists (81.4%), and Health Diagnosing & Treating (76.8%).
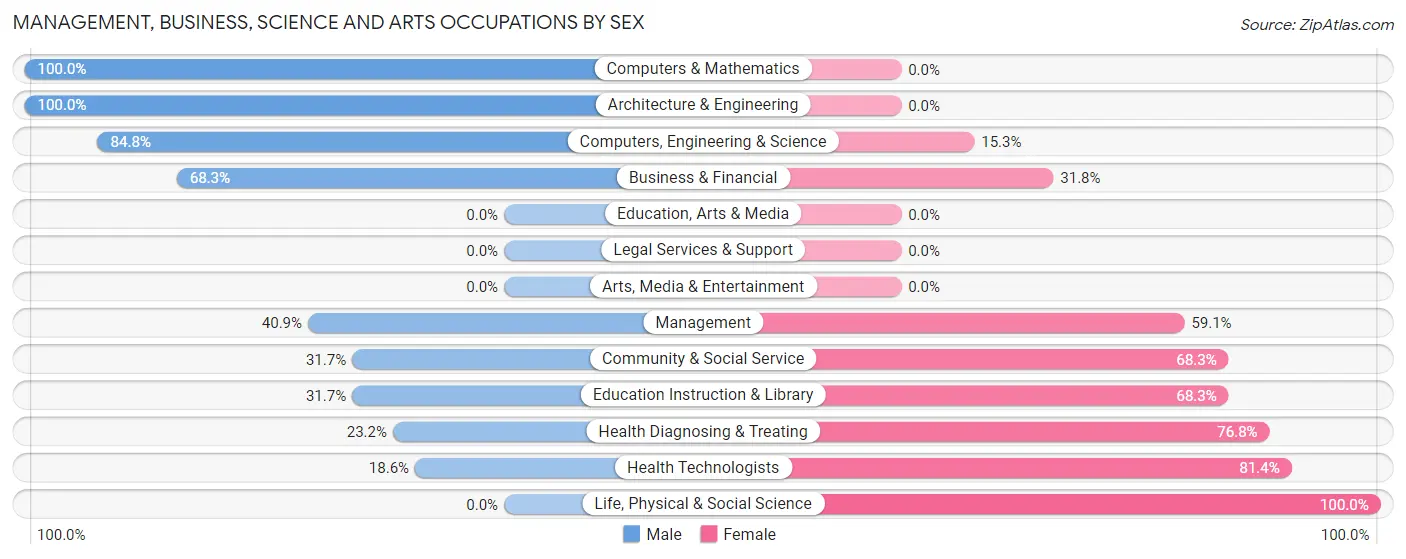
| Occupation | Male | Female |
| Management | 18 (40.9%) | 26 (59.1%) |
| Business & Financial | 43 (68.2%) | 20 (31.8%) |
| Computers, Engineering & Science | 50 (84.8%) | 9 (15.2%) |
| Computers & Mathematics | 40 (100.0%) | 0 (0.0%) |
| Architecture & Engineering | 10 (100.0%) | 0 (0.0%) |
| Life, Physical & Social Science | 0 (0.0%) | 9 (100.0%) |
| Community & Social Service | 13 (31.7%) | 28 (68.3%) |
| Education, Arts & Media | 0 (0.0%) | 0 (0.0%) |
| Legal Services & Support | 0 (0.0%) | 0 (0.0%) |
| Education Instruction & Library | 13 (31.7%) | 28 (68.3%) |
| Arts, Media & Entertainment | 0 (0.0%) | 0 (0.0%) |
| Health Diagnosing & Treating | 32 (23.2%) | 106 (76.8%) |
| Health Technologists | 21 (18.6%) | 92 (81.4%) |
| Total (Category) | 156 (45.2%) | 189 (54.8%) |
| Total (Overall) | 804 (49.1%) | 834 (50.9%) |
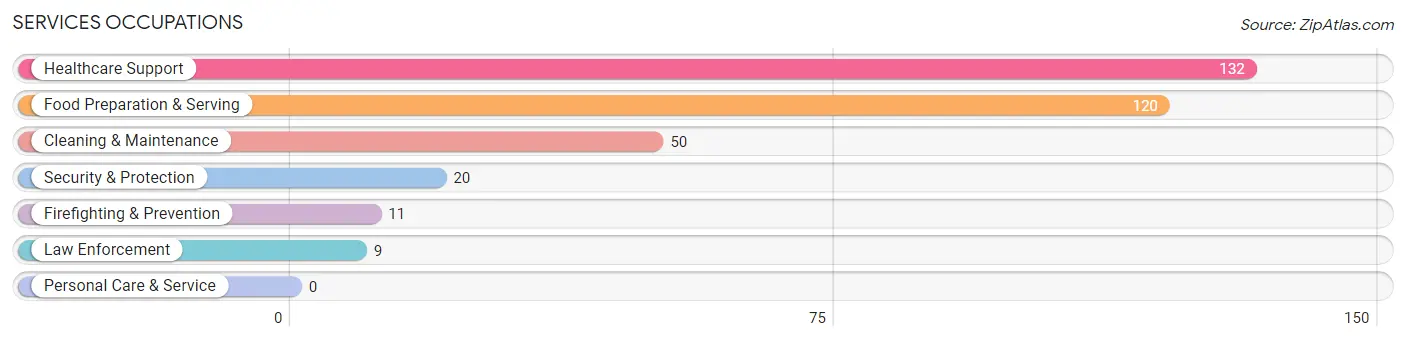
Services Occupations
The most common Services occupations in Glasgow are Healthcare Support (132 | 8.1%), Food Preparation & Serving (120 | 7.3%), Cleaning & Maintenance (50 | 3.0%), Security & Protection (20 | 1.2%), and Firefighting & Prevention (11 | 0.7%).
Services Occupations by Sex
Within the Services occupations in Glasgow, the most male-oriented occupations are Security & Protection (100.0%), Firefighting & Prevention (100.0%), and Law Enforcement (100.0%), while the most female-oriented occupations are Cleaning & Maintenance (74.0%), Food Preparation & Serving (73.3%), and Healthcare Support (62.9%).
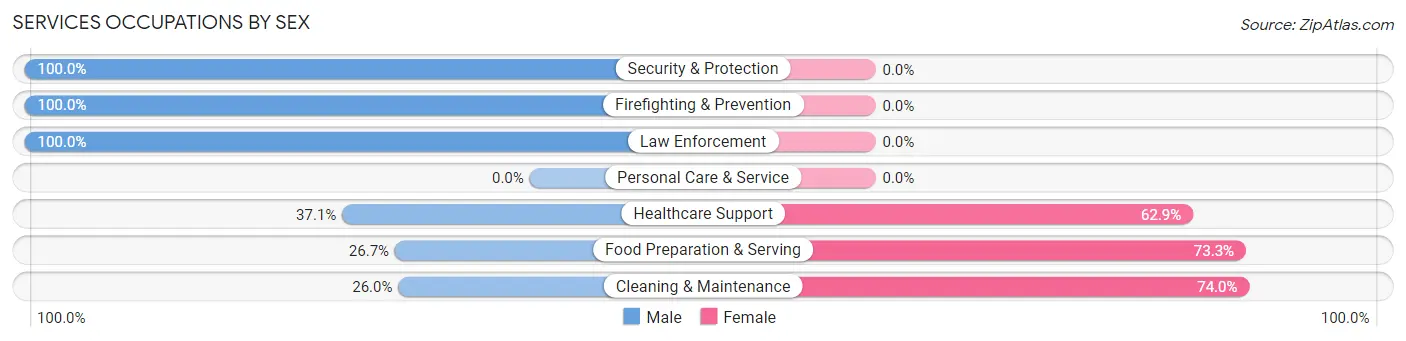
| Occupation | Male | Female |
| Healthcare Support | 49 (37.1%) | 83 (62.9%) |
| Security & Protection | 20 (100.0%) | 0 (0.0%) |
| Firefighting & Prevention | 11 (100.0%) | 0 (0.0%) |
| Law Enforcement | 9 (100.0%) | 0 (0.0%) |
| Food Preparation & Serving | 32 (26.7%) | 88 (73.3%) |
| Cleaning & Maintenance | 13 (26.0%) | 37 (74.0%) |
| Personal Care & Service | 0 (0.0%) | 0 (0.0%) |
| Total (Category) | 114 (35.4%) | 208 (64.6%) |
| Total (Overall) | 804 (49.1%) | 834 (50.9%) |
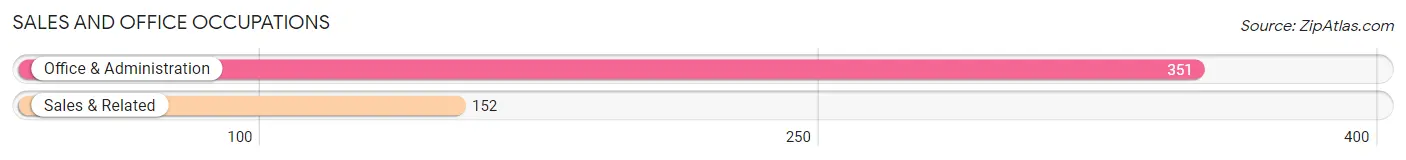
Sales and Office Occupations
The most common Sales and Office occupations in Glasgow are Office & Administration (351 | 21.4%), and Sales & Related (152 | 9.3%).
Sales and Office Occupations by Sex
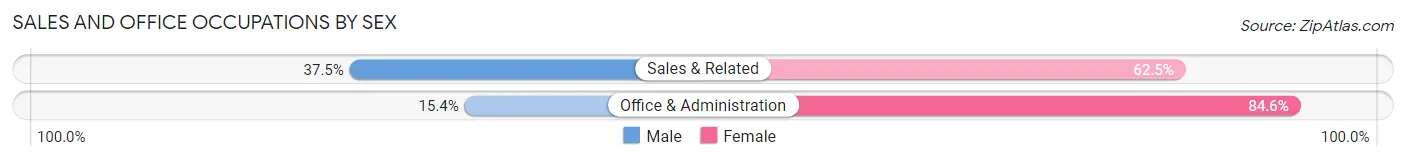
| Occupation | Male | Female |
| Sales & Related | 57 (37.5%) | 95 (62.5%) |
| Office & Administration | 54 (15.4%) | 297 (84.6%) |
| Total (Category) | 111 (22.1%) | 392 (77.9%) |
| Total (Overall) | 804 (49.1%) | 834 (50.9%) |
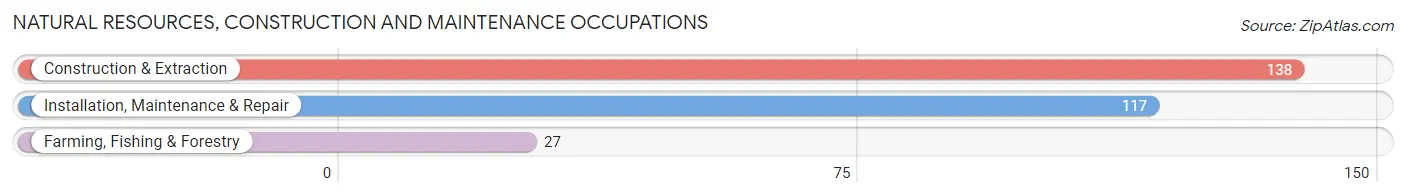
Natural Resources, Construction and Maintenance Occupations
The most common Natural Resources, Construction and Maintenance occupations in Glasgow are Construction & Extraction (138 | 8.4%), Installation, Maintenance & Repair (117 | 7.1%), and Farming, Fishing & Forestry (27 | 1.7%).
Natural Resources, Construction and Maintenance Occupations by Sex
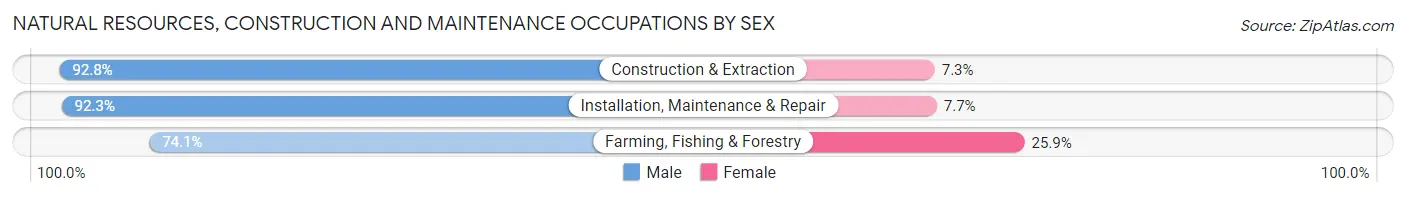
| Occupation | Male | Female |
| Farming, Fishing & Forestry | 20 (74.1%) | 7 (25.9%) |
| Construction & Extraction | 128 (92.7%) | 10 (7.2%) |
| Installation, Maintenance & Repair | 108 (92.3%) | 9 (7.7%) |
| Total (Category) | 256 (90.8%) | 26 (9.2%) |
| Total (Overall) | 804 (49.1%) | 834 (50.9%) |
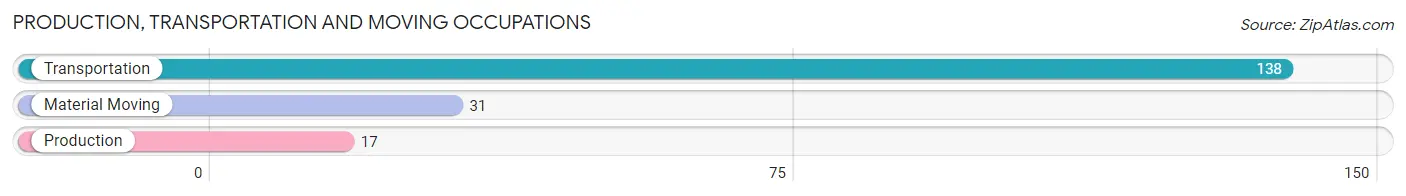
Production, Transportation and Moving Occupations
The most common Production, Transportation and Moving occupations in Glasgow are Transportation (138 | 8.4%), Material Moving (31 | 1.9%), and Production (17 | 1.0%).
Production, Transportation and Moving Occupations by Sex
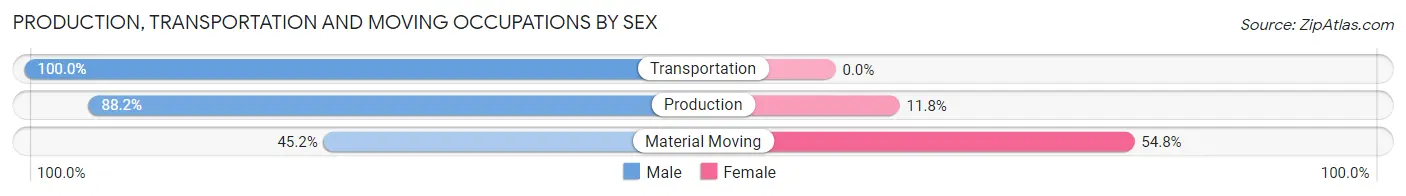
| Occupation | Male | Female |
| Production | 15 (88.2%) | 2 (11.8%) |
| Transportation | 138 (100.0%) | 0 (0.0%) |
| Material Moving | 14 (45.2%) | 17 (54.8%) |
| Total (Category) | 167 (89.8%) | 19 (10.2%) |
| Total (Overall) | 804 (49.1%) | 834 (50.9%) |
Employment Industries by Sex in Glasgow
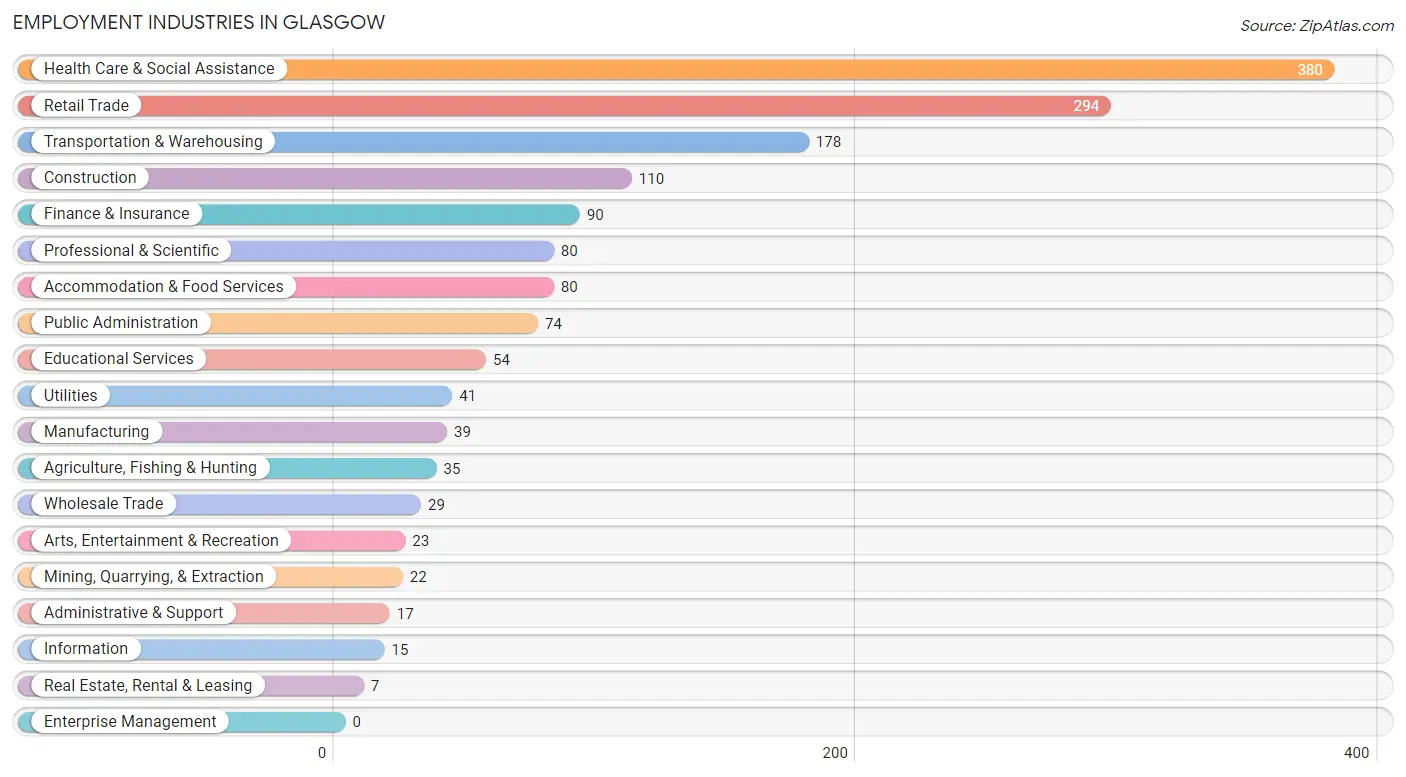
Employment Industries in Glasgow
The major employment industries in Glasgow include Health Care & Social Assistance (380 | 23.2%), Retail Trade (294 | 17.9%), Transportation & Warehousing (178 | 10.9%), Construction (110 | 6.7%), and Finance & Insurance (90 | 5.5%).
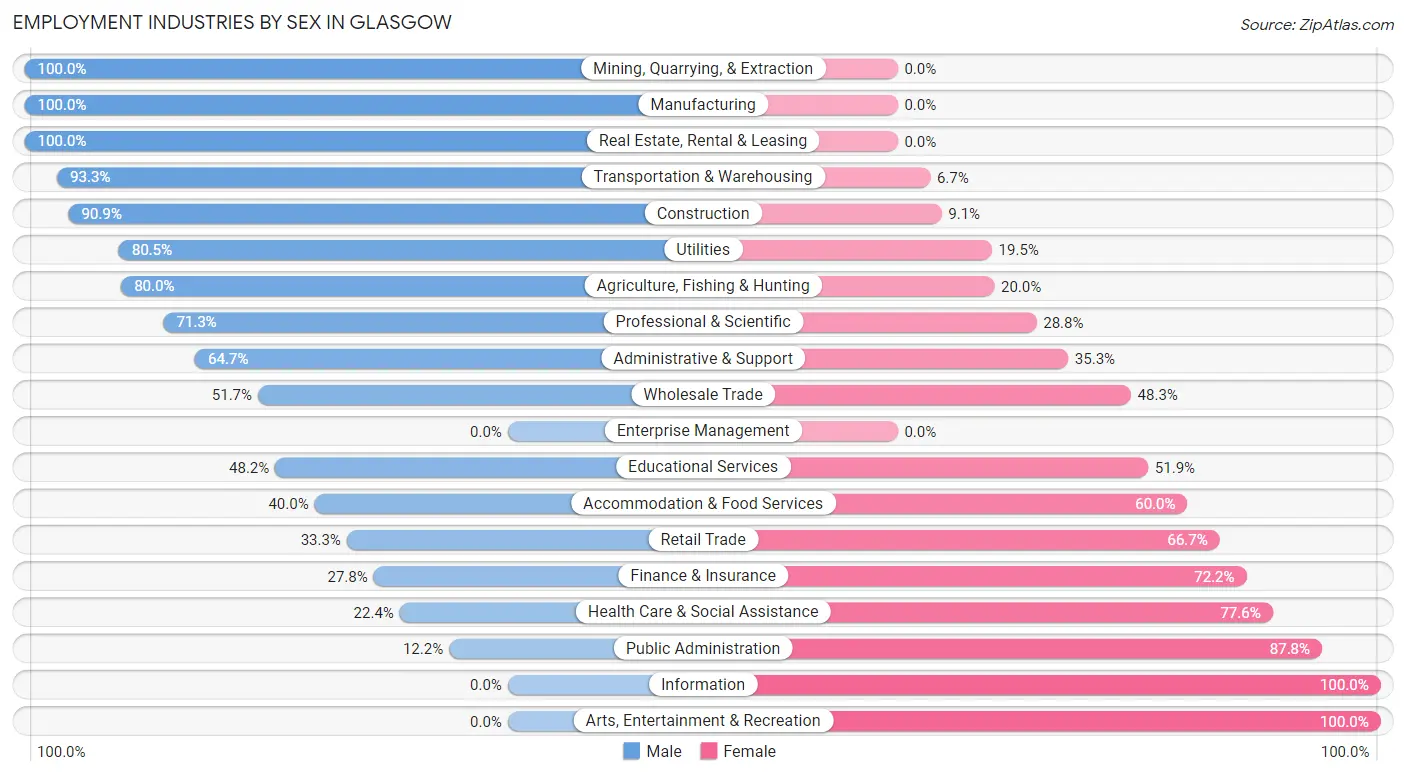
Employment Industries by Sex in Glasgow
The Glasgow industries that see more men than women are Mining, Quarrying, & Extraction (100.0%), Manufacturing (100.0%), and Real Estate, Rental & Leasing (100.0%), whereas the industries that tend to have a higher number of women are Information (100.0%), Arts, Entertainment & Recreation (100.0%), and Public Administration (87.8%).
| Industry | Male | Female |
| Agriculture, Fishing & Hunting | 28 (80.0%) | 7 (20.0%) |
| Mining, Quarrying, & Extraction | 22 (100.0%) | 0 (0.0%) |
| Construction | 100 (90.9%) | 10 (9.1%) |
| Manufacturing | 39 (100.0%) | 0 (0.0%) |
| Wholesale Trade | 15 (51.7%) | 14 (48.3%) |
| Retail Trade | 98 (33.3%) | 196 (66.7%) |
| Transportation & Warehousing | 166 (93.3%) | 12 (6.7%) |
| Utilities | 33 (80.5%) | 8 (19.5%) |
| Information | 0 (0.0%) | 15 (100.0%) |
| Finance & Insurance | 25 (27.8%) | 65 (72.2%) |
| Real Estate, Rental & Leasing | 7 (100.0%) | 0 (0.0%) |
| Professional & Scientific | 57 (71.3%) | 23 (28.7%) |
| Enterprise Management | 0 (0.0%) | 0 (0.0%) |
| Administrative & Support | 11 (64.7%) | 6 (35.3%) |
| Educational Services | 26 (48.1%) | 28 (51.8%) |
| Health Care & Social Assistance | 85 (22.4%) | 295 (77.6%) |
| Arts, Entertainment & Recreation | 0 (0.0%) | 23 (100.0%) |
| Accommodation & Food Services | 32 (40.0%) | 48 (60.0%) |
| Public Administration | 9 (12.2%) | 65 (87.8%) |
| Total | 804 (49.1%) | 834 (50.9%) |
Education in Glasgow
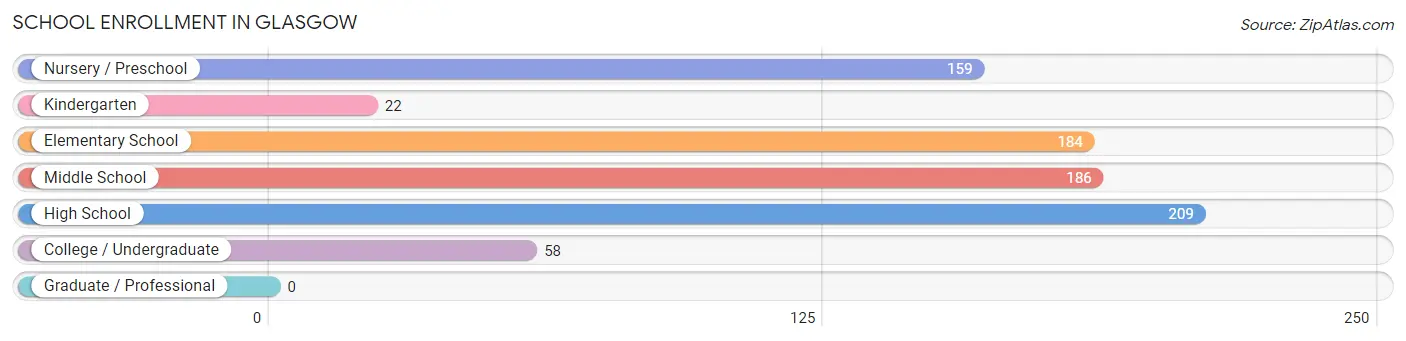
School Enrollment in Glasgow
The most common levels of schooling among the 818 students in Glasgow are high school (209 | 25.6%), middle school (186 | 22.7%), and elementary school (184 | 22.5%).
| School Level | # Students | % Students |
| Nursery / Preschool | 159 | 19.4% |
| Kindergarten | 22 | 2.7% |
| Elementary School | 184 | 22.5% |
| Middle School | 186 | 22.7% |
| High School | 209 | 25.6% |
| College / Undergraduate | 58 | 7.1% |
| Graduate / Professional | 0 | 0.0% |
| Total | 818 | 100.0% |
School Enrollment by Age by Funding Source in Glasgow
Out of a total of 818 students who are enrolled in schools in Glasgow, 95 (11.6%) attend a private institution, while the remaining 723 (88.4%) are enrolled in public schools. The age group of 3 to 4 year olds has the highest likelihood of being enrolled in private schools, with 12 (37.5% in the age bracket) enrolled. Conversely, the age group of 10 to 14 year olds has the lowest likelihood of being enrolled in a private school, with 218 (100.0% in the age bracket) attending a public institution.
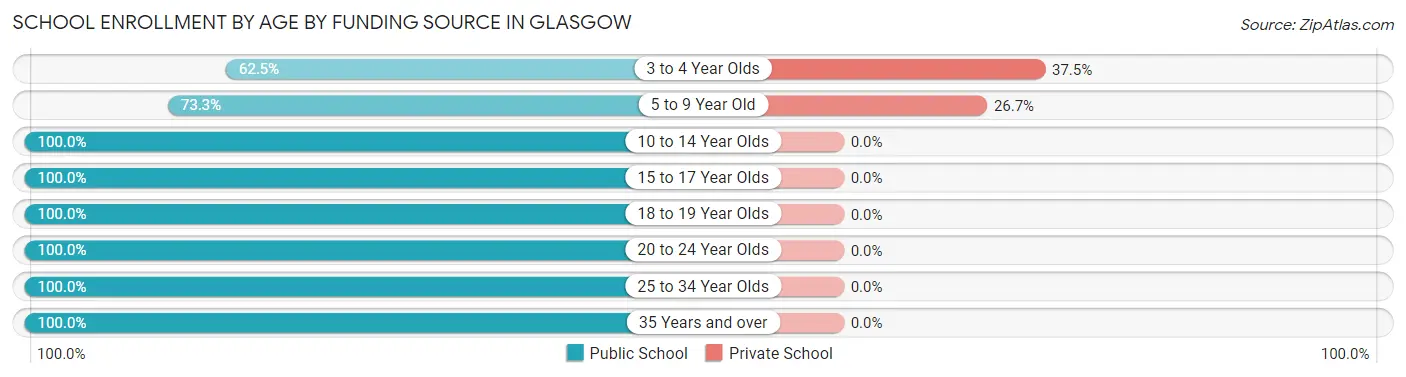
| Age Bracket | Public School | Private School |
| 3 to 4 Year Olds | 20 (62.5%) | 12 (37.5%) |
| 5 to 9 Year Old | 228 (73.3%) | 83 (26.7%) |
| 10 to 14 Year Olds | 218 (100.0%) | 0 (0.0%) |
| 15 to 17 Year Olds | 172 (100.0%) | 0 (0.0%) |
| 18 to 19 Year Olds | 27 (100.0%) | 0 (0.0%) |
| 20 to 24 Year Olds | 36 (100.0%) | 0 (0.0%) |
| 25 to 34 Year Olds | 3 (100.0%) | 0 (0.0%) |
| 35 Years and over | 19 (100.0%) | 0 (0.0%) |
| Total | 723 (88.4%) | 95 (11.6%) |
Educational Attainment by Field of Study in Glasgow
Business (222 | 48.9%), education (101 | 22.3%), arts & humanities (33 | 7.3%), social sciences (32 | 7.0%), and bio, nature & agricultural (18 | 4.0%) are the most common fields of study among 454 individuals in Glasgow who have obtained a bachelor's degree or higher.
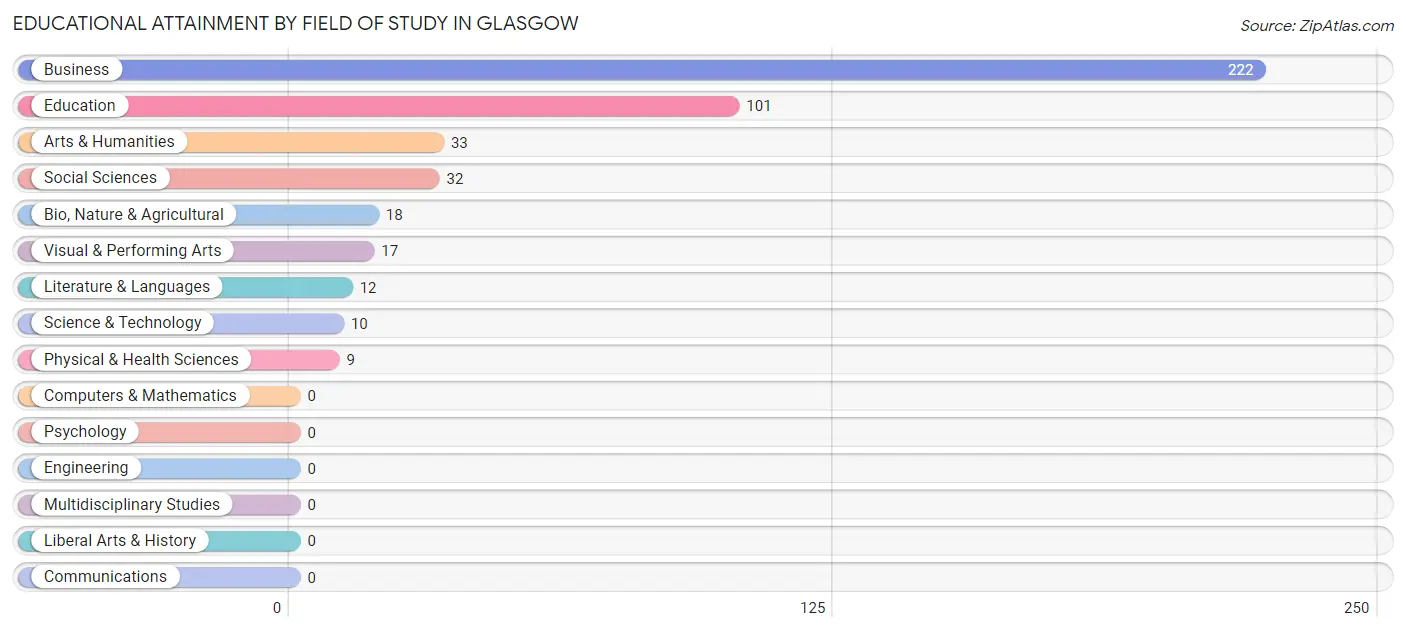
| Field of Study | # Graduates | % Graduates |
| Computers & Mathematics | 0 | 0.0% |
| Bio, Nature & Agricultural | 18 | 4.0% |
| Physical & Health Sciences | 9 | 2.0% |
| Psychology | 0 | 0.0% |
| Social Sciences | 32 | 7.0% |
| Engineering | 0 | 0.0% |
| Multidisciplinary Studies | 0 | 0.0% |
| Science & Technology | 10 | 2.2% |
| Business | 222 | 48.9% |
| Education | 101 | 22.3% |
| Literature & Languages | 12 | 2.6% |
| Liberal Arts & History | 0 | 0.0% |
| Visual & Performing Arts | 17 | 3.7% |
| Communications | 0 | 0.0% |
| Arts & Humanities | 33 | 7.3% |
| Total | 454 | 100.0% |
Transportation & Commute in Glasgow
Vehicle Availability by Sex in Glasgow
The most prevalent vehicle ownership categories in Glasgow are males with 3 vehicles (265, accounting for 35.1%) and females with 3 vehicles (332, making up 32.8%).
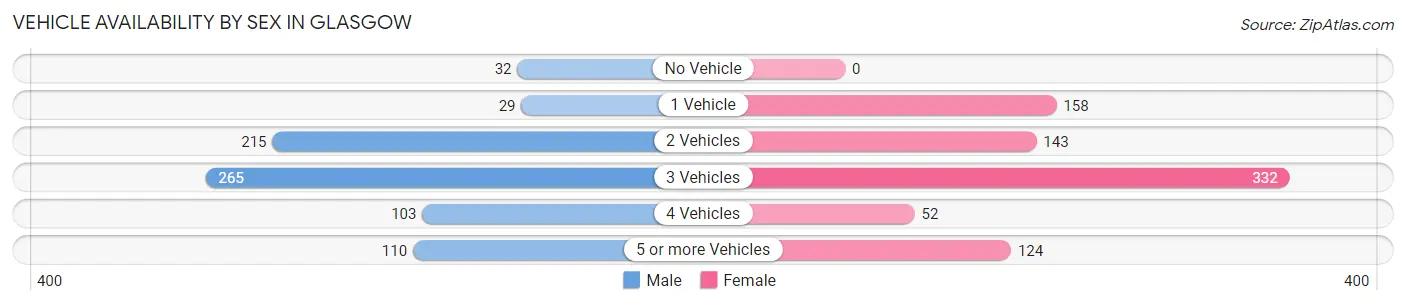
| Vehicles Available | Male | Female |
| No Vehicle | 32 (4.2%) | 0 (0.0%) |
| 1 Vehicle | 29 (3.8%) | 158 (19.5%) |
| 2 Vehicles | 215 (28.5%) | 143 (17.7%) |
| 3 Vehicles | 265 (35.1%) | 332 (41.0%) |
| 4 Vehicles | 103 (13.7%) | 52 (6.4%) |
| 5 or more Vehicles | 110 (14.6%) | 124 (15.3%) |
| Total | 754 (100.0%) | 809 (100.0%) |
Commute Time in Glasgow
The most frequently occuring commute durations in Glasgow are 5 to 9 minutes (705 commuters, 47.5%), less than 5 minutes (304 commuters, 20.5%), and 10 to 14 minutes (251 commuters, 16.9%).
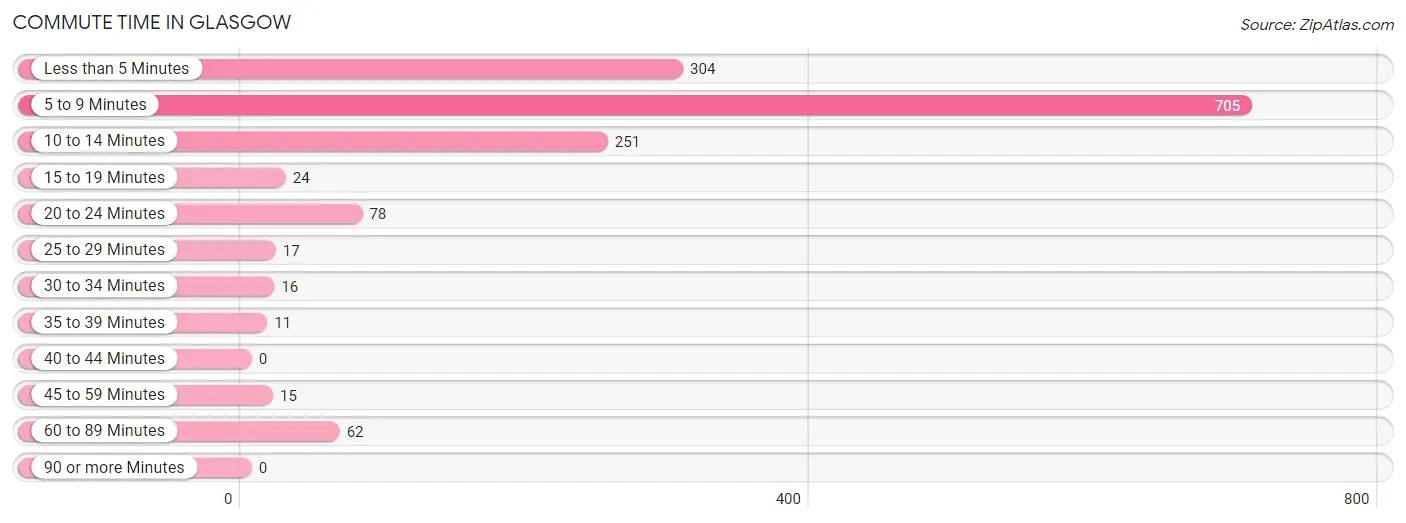
| Commute Time | # Commuters | % Commuters |
| Less than 5 Minutes | 304 | 20.5% |
| 5 to 9 Minutes | 705 | 47.5% |
| 10 to 14 Minutes | 251 | 16.9% |
| 15 to 19 Minutes | 24 | 1.6% |
| 20 to 24 Minutes | 78 | 5.3% |
| 25 to 29 Minutes | 17 | 1.1% |
| 30 to 34 Minutes | 16 | 1.1% |
| 35 to 39 Minutes | 11 | 0.7% |
| 40 to 44 Minutes | 0 | 0.0% |
| 45 to 59 Minutes | 15 | 1.0% |
| 60 to 89 Minutes | 62 | 4.2% |
| 90 or more Minutes | 0 | 0.0% |
Commute Time by Sex in Glasgow
The most common commute times in Glasgow are 5 to 9 minutes (286 commuters, 40.6%) for males and 5 to 9 minutes (419 commuters, 53.9%) for females.
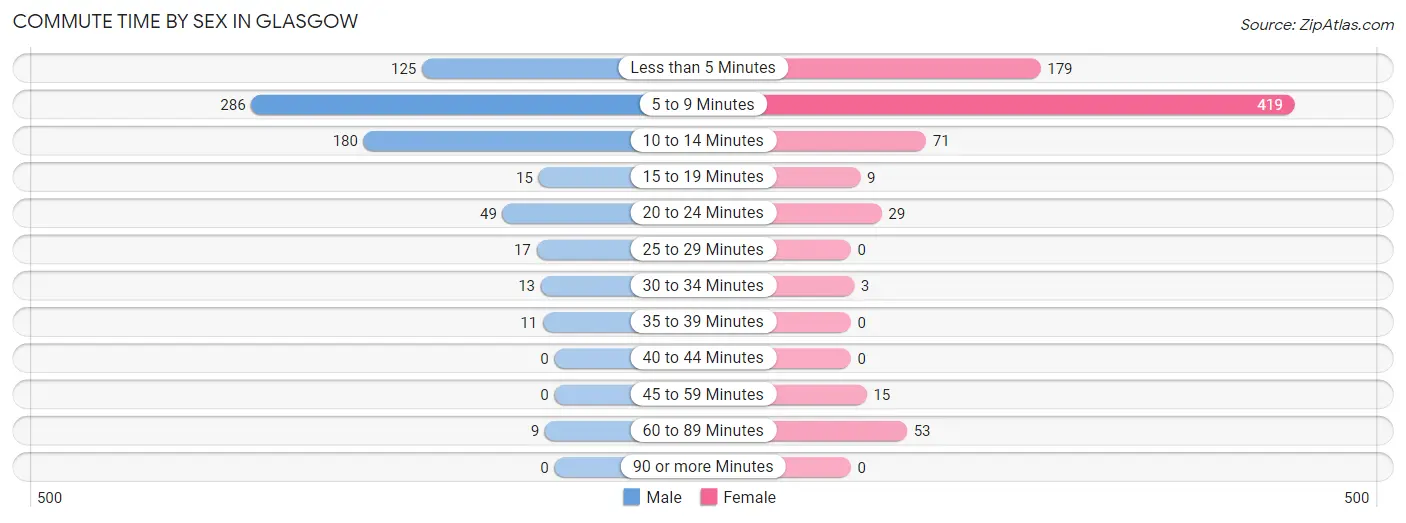
| Commute Time | Male | Female |
| Less than 5 Minutes | 125 (17.7%) | 179 (23.0%) |
| 5 to 9 Minutes | 286 (40.6%) | 419 (53.9%) |
| 10 to 14 Minutes | 180 (25.5%) | 71 (9.1%) |
| 15 to 19 Minutes | 15 (2.1%) | 9 (1.2%) |
| 20 to 24 Minutes | 49 (7.0%) | 29 (3.7%) |
| 25 to 29 Minutes | 17 (2.4%) | 0 (0.0%) |
| 30 to 34 Minutes | 13 (1.8%) | 3 (0.4%) |
| 35 to 39 Minutes | 11 (1.6%) | 0 (0.0%) |
| 40 to 44 Minutes | 0 (0.0%) | 0 (0.0%) |
| 45 to 59 Minutes | 0 (0.0%) | 15 (1.9%) |
| 60 to 89 Minutes | 9 (1.3%) | 53 (6.8%) |
| 90 or more Minutes | 0 (0.0%) | 0 (0.0%) |
Time of Departure to Work by Sex in Glasgow
The most frequent times of departure to work in Glasgow are 6:30 AM to 6:59 AM (156, 22.1%) for males and 6:30 AM to 6:59 AM (107, 13.8%) for females.
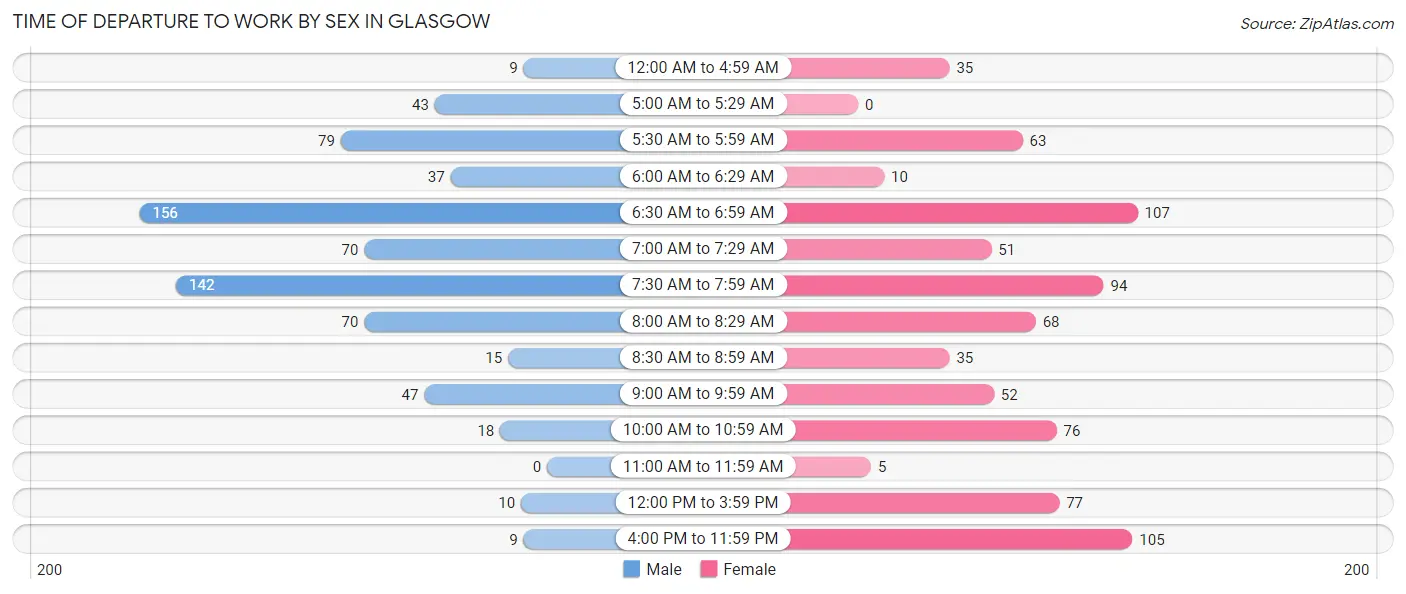
| Time of Departure | Male | Female |
| 12:00 AM to 4:59 AM | 9 (1.3%) | 35 (4.5%) |
| 5:00 AM to 5:29 AM | 43 (6.1%) | 0 (0.0%) |
| 5:30 AM to 5:59 AM | 79 (11.2%) | 63 (8.1%) |
| 6:00 AM to 6:29 AM | 37 (5.2%) | 10 (1.3%) |
| 6:30 AM to 6:59 AM | 156 (22.1%) | 107 (13.8%) |
| 7:00 AM to 7:29 AM | 70 (9.9%) | 51 (6.6%) |
| 7:30 AM to 7:59 AM | 142 (20.1%) | 94 (12.1%) |
| 8:00 AM to 8:29 AM | 70 (9.9%) | 68 (8.7%) |
| 8:30 AM to 8:59 AM | 15 (2.1%) | 35 (4.5%) |
| 9:00 AM to 9:59 AM | 47 (6.7%) | 52 (6.7%) |
| 10:00 AM to 10:59 AM | 18 (2.5%) | 76 (9.8%) |
| 11:00 AM to 11:59 AM | 0 (0.0%) | 5 (0.6%) |
| 12:00 PM to 3:59 PM | 10 (1.4%) | 77 (9.9%) |
| 4:00 PM to 11:59 PM | 9 (1.3%) | 105 (13.5%) |
| Total | 705 (100.0%) | 778 (100.0%) |
Housing Occupancy in Glasgow
Occupancy by Ownership in Glasgow
Of the total 1,189 dwellings in Glasgow, owner-occupied units account for 796 (66.9%), while renter-occupied units make up 393 (33.1%).
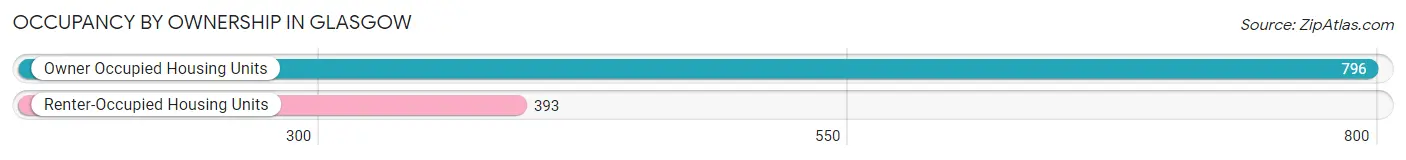
| Occupancy | # Housing Units | % Housing Units |
| Owner Occupied Housing Units | 796 | 66.9% |
| Renter-Occupied Housing Units | 393 | 33.1% |
| Total Occupied Housing Units | 1,189 | 100.0% |
Occupancy by Household Size in Glasgow
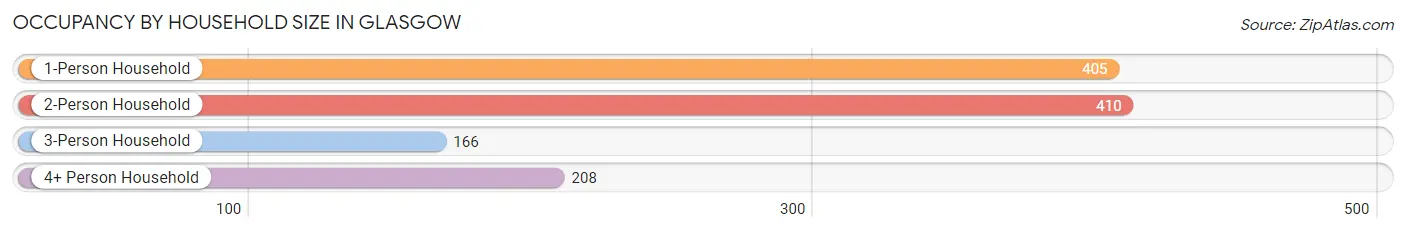
| Household Size | # Housing Units | % Housing Units |
| 1-Person Household | 405 | 34.1% |
| 2-Person Household | 410 | 34.5% |
| 3-Person Household | 166 | 14.0% |
| 4+ Person Household | 208 | 17.5% |
| Total Housing Units | 1,189 | 100.0% |
Occupancy by Ownership by Household Size in Glasgow
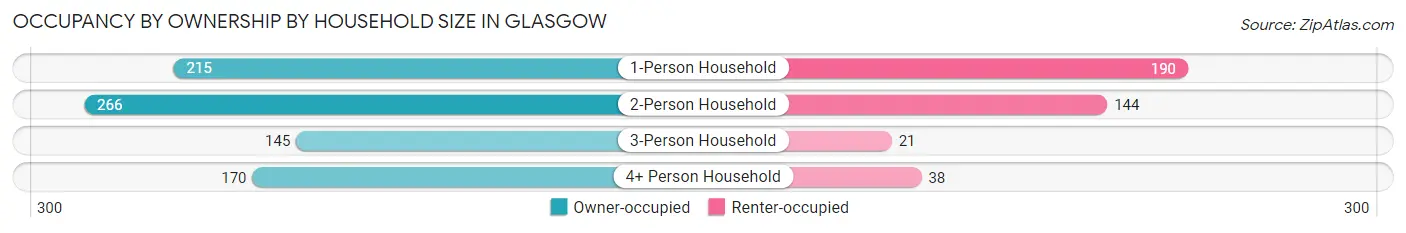
| Household Size | Owner-occupied | Renter-occupied |
| 1-Person Household | 215 (53.1%) | 190 (46.9%) |
| 2-Person Household | 266 (64.9%) | 144 (35.1%) |
| 3-Person Household | 145 (87.4%) | 21 (12.7%) |
| 4+ Person Household | 170 (81.7%) | 38 (18.3%) |
| Total Housing Units | 796 (66.9%) | 393 (33.1%) |
Occupancy by Educational Attainment in Glasgow
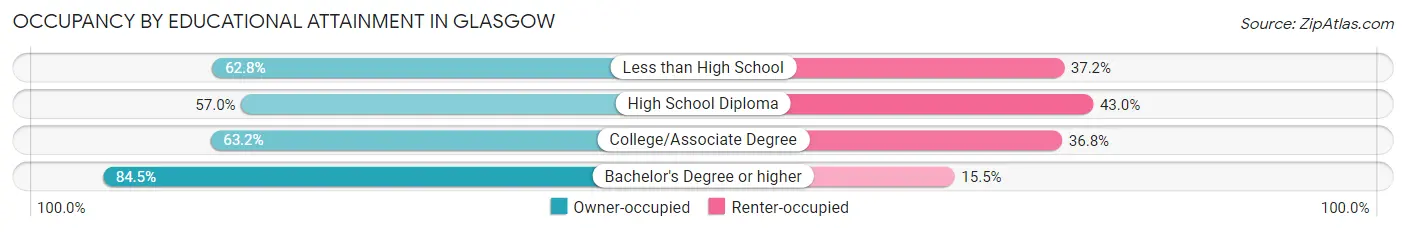
| Household Size | Owner-occupied | Renter-occupied |
| Less than High School | 54 (62.8%) | 32 (37.2%) |
| High School Diploma | 179 (57.0%) | 135 (43.0%) |
| College/Associate Degree | 307 (63.2%) | 179 (36.8%) |
| Bachelor's Degree or higher | 256 (84.5%) | 47 (15.5%) |
Occupancy by Age of Householder in Glasgow
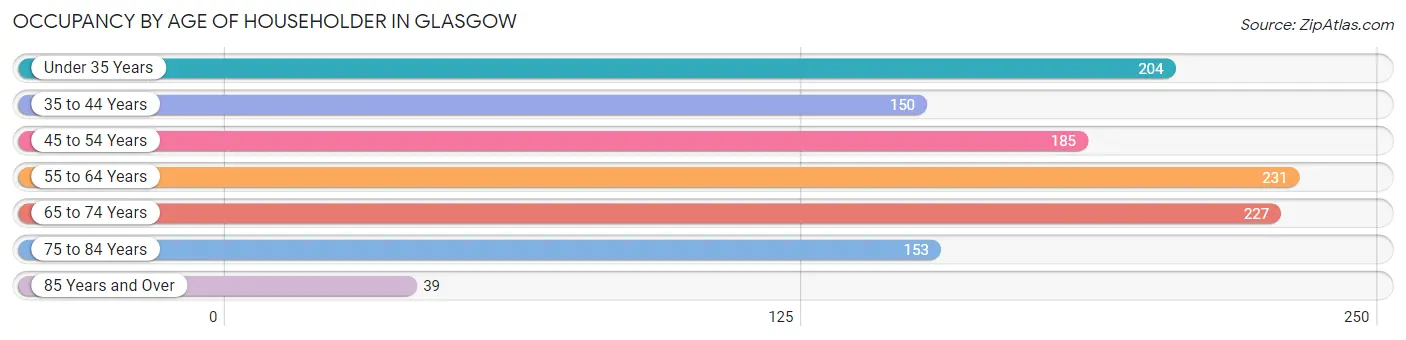
| Age Bracket | # Households | % Households |
| Under 35 Years | 204 | 17.2% |
| 35 to 44 Years | 150 | 12.6% |
| 45 to 54 Years | 185 | 15.6% |
| 55 to 64 Years | 231 | 19.4% |
| 65 to 74 Years | 227 | 19.1% |
| 75 to 84 Years | 153 | 12.9% |
| 85 Years and Over | 39 | 3.3% |
| Total | 1,189 | 100.0% |
Housing Finances in Glasgow
Median Income by Occupancy in Glasgow
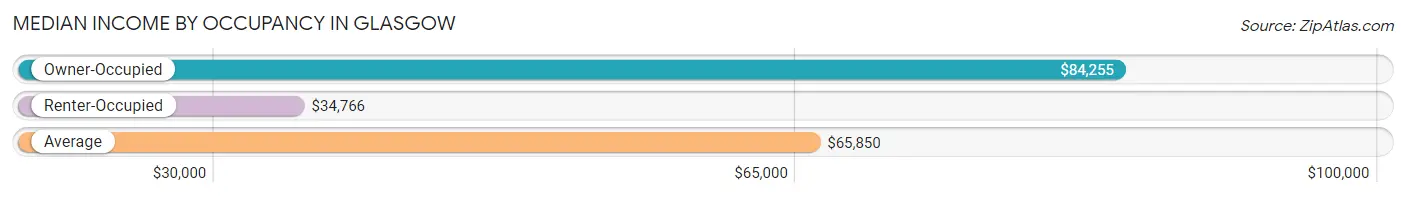
| Occupancy Type | # Households | Median Income |
| Owner-Occupied | 796 (66.9%) | $84,255 |
| Renter-Occupied | 393 (33.1%) | $34,766 |
| Average | 1,189 (100.0%) | $65,850 |
Occupancy by Householder Income Bracket in Glasgow
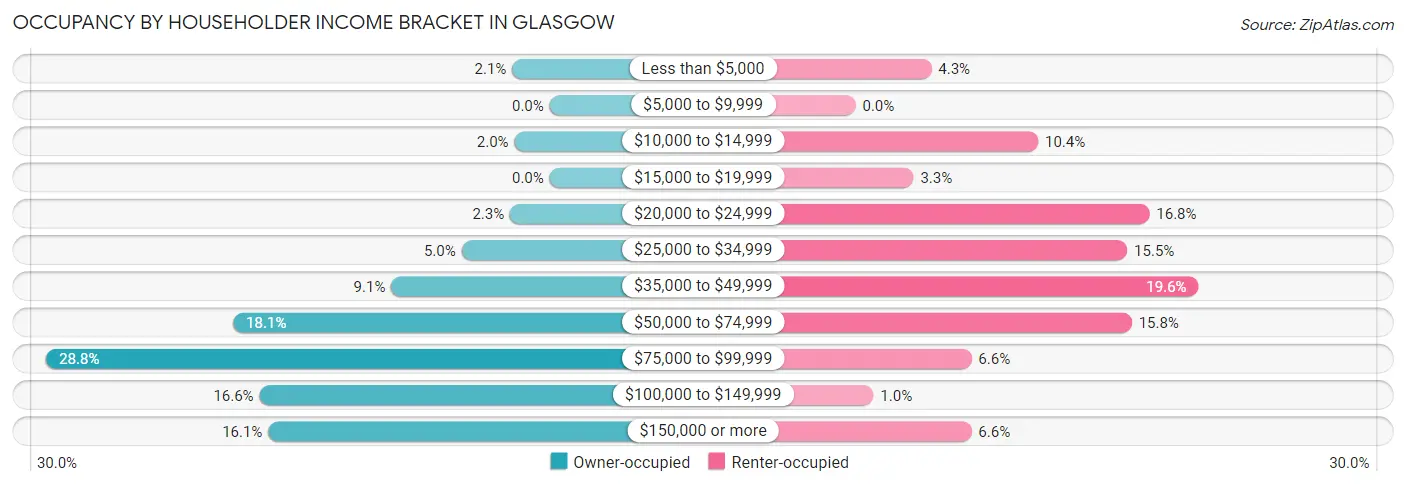
| Income Bracket | Owner-occupied | Renter-occupied |
| Less than $5,000 | 17 (2.1%) | 17 (4.3%) |
| $5,000 to $9,999 | 0 (0.0%) | 0 (0.0%) |
| $10,000 to $14,999 | 16 (2.0%) | 41 (10.4%) |
| $15,000 to $19,999 | 0 (0.0%) | 13 (3.3%) |
| $20,000 to $24,999 | 18 (2.3%) | 66 (16.8%) |
| $25,000 to $34,999 | 40 (5.0%) | 61 (15.5%) |
| $35,000 to $49,999 | 72 (9.0%) | 77 (19.6%) |
| $50,000 to $74,999 | 144 (18.1%) | 62 (15.8%) |
| $75,000 to $99,999 | 229 (28.8%) | 26 (6.6%) |
| $100,000 to $149,999 | 132 (16.6%) | 4 (1.0%) |
| $150,000 or more | 128 (16.1%) | 26 (6.6%) |
| Total | 796 (100.0%) | 393 (100.0%) |
Monthly Housing Cost Tiers in Glasgow
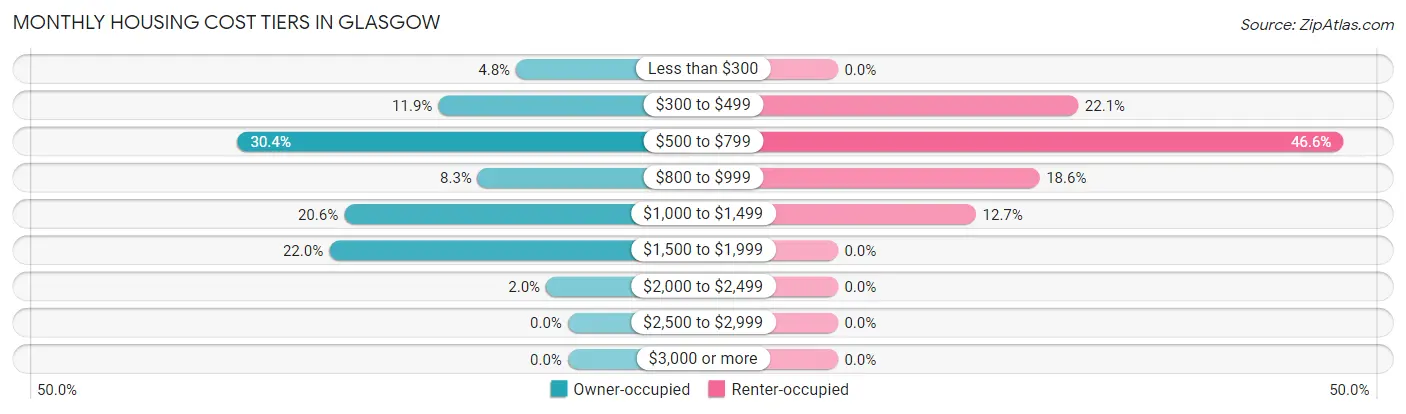
| Monthly Cost | Owner-occupied | Renter-occupied |
| Less than $300 | 38 (4.8%) | 0 (0.0%) |
| $300 to $499 | 95 (11.9%) | 87 (22.1%) |
| $500 to $799 | 242 (30.4%) | 183 (46.6%) |
| $800 to $999 | 66 (8.3%) | 73 (18.6%) |
| $1,000 to $1,499 | 164 (20.6%) | 50 (12.7%) |
| $1,500 to $1,999 | 175 (22.0%) | 0 (0.0%) |
| $2,000 to $2,499 | 16 (2.0%) | 0 (0.0%) |
| $2,500 to $2,999 | 0 (0.0%) | 0 (0.0%) |
| $3,000 or more | 0 (0.0%) | 0 (0.0%) |
| Total | 796 (100.0%) | 393 (100.0%) |
Physical Housing Characteristics in Glasgow
Housing Structures in Glasgow
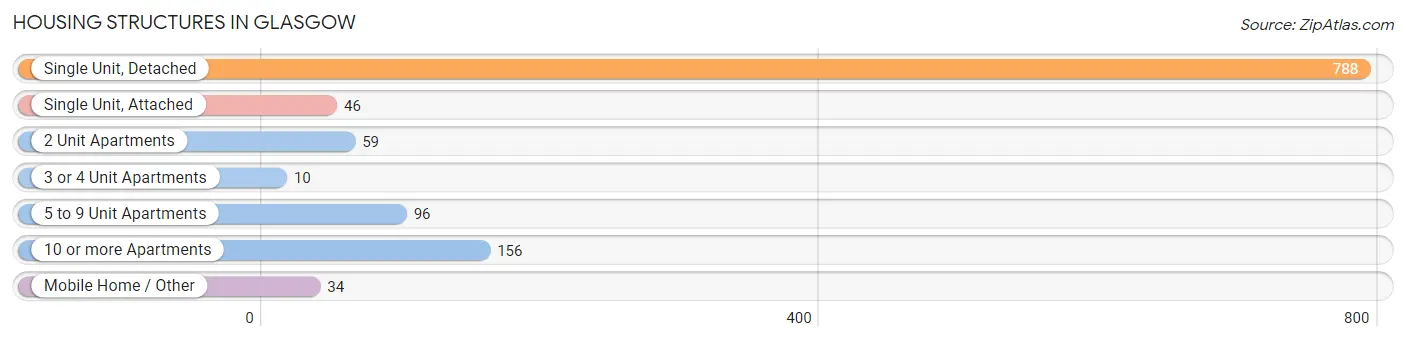
| Structure Type | # Housing Units | % Housing Units |
| Single Unit, Detached | 788 | 66.3% |
| Single Unit, Attached | 46 | 3.9% |
| 2 Unit Apartments | 59 | 5.0% |
| 3 or 4 Unit Apartments | 10 | 0.8% |
| 5 to 9 Unit Apartments | 96 | 8.1% |
| 10 or more Apartments | 156 | 13.1% |
| Mobile Home / Other | 34 | 2.9% |
| Total | 1,189 | 100.0% |
Housing Structures by Occupancy in Glasgow
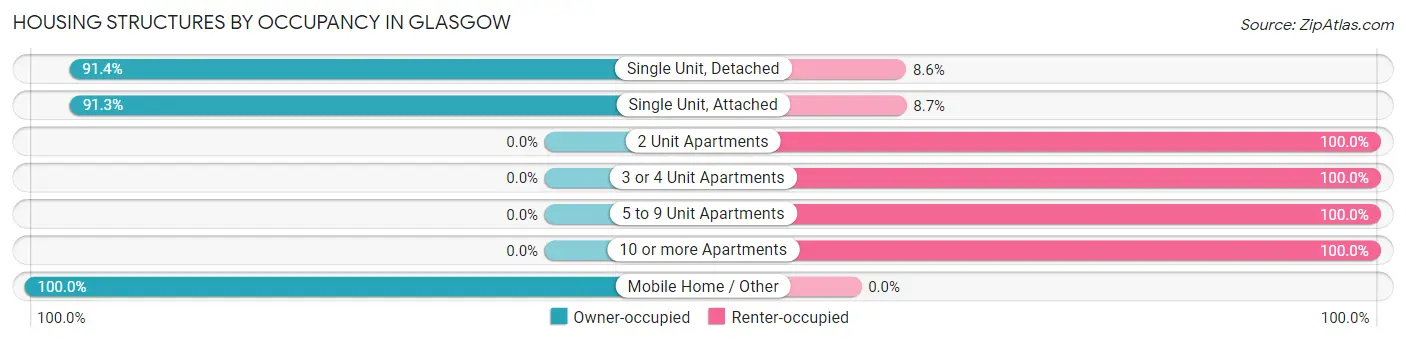
| Structure Type | Owner-occupied | Renter-occupied |
| Single Unit, Detached | 720 (91.4%) | 68 (8.6%) |
| Single Unit, Attached | 42 (91.3%) | 4 (8.7%) |
| 2 Unit Apartments | 0 (0.0%) | 59 (100.0%) |
| 3 or 4 Unit Apartments | 0 (0.0%) | 10 (100.0%) |
| 5 to 9 Unit Apartments | 0 (0.0%) | 96 (100.0%) |
| 10 or more Apartments | 0 (0.0%) | 156 (100.0%) |
| Mobile Home / Other | 34 (100.0%) | 0 (0.0%) |
| Total | 796 (66.9%) | 393 (33.1%) |
Housing Structures by Number of Rooms in Glasgow
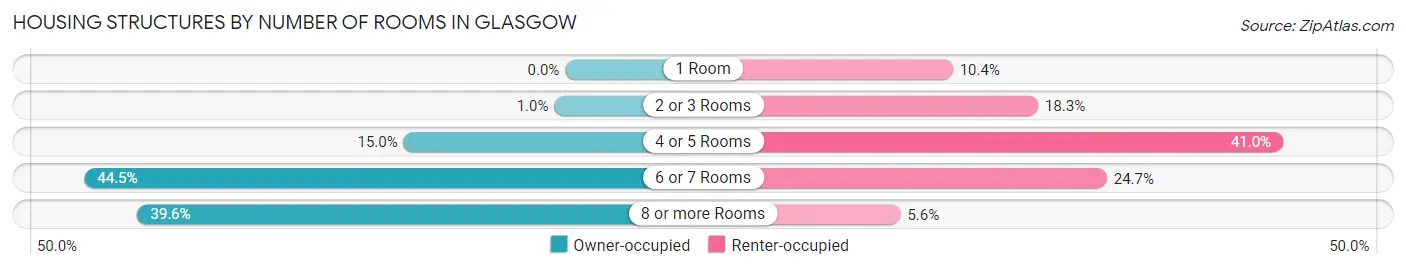
| Number of Rooms | Owner-occupied | Renter-occupied |
| 1 Room | 0 (0.0%) | 41 (10.4%) |
| 2 or 3 Rooms | 8 (1.0%) | 72 (18.3%) |
| 4 or 5 Rooms | 119 (14.9%) | 161 (41.0%) |
| 6 or 7 Rooms | 354 (44.5%) | 97 (24.7%) |
| 8 or more Rooms | 315 (39.6%) | 22 (5.6%) |
| Total | 796 (100.0%) | 393 (100.0%) |
Housing Structure by Heating Type in Glasgow
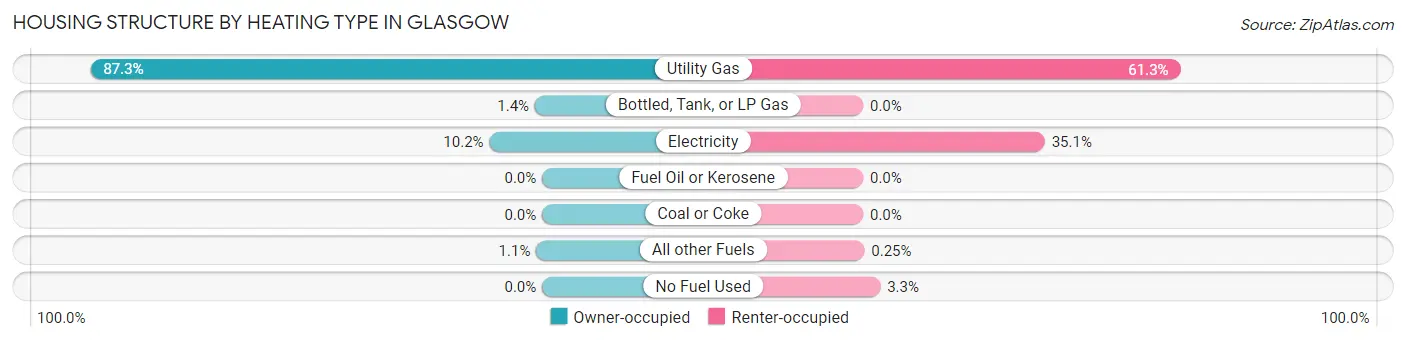
| Heating Type | Owner-occupied | Renter-occupied |
| Utility Gas | 695 (87.3%) | 241 (61.3%) |
| Bottled, Tank, or LP Gas | 11 (1.4%) | 0 (0.0%) |
| Electricity | 81 (10.2%) | 138 (35.1%) |
| Fuel Oil or Kerosene | 0 (0.0%) | 0 (0.0%) |
| Coal or Coke | 0 (0.0%) | 0 (0.0%) |
| All other Fuels | 9 (1.1%) | 1 (0.3%) |
| No Fuel Used | 0 (0.0%) | 13 (3.3%) |
| Total | 796 (100.0%) | 393 (100.0%) |
Household Vehicle Usage in Glasgow
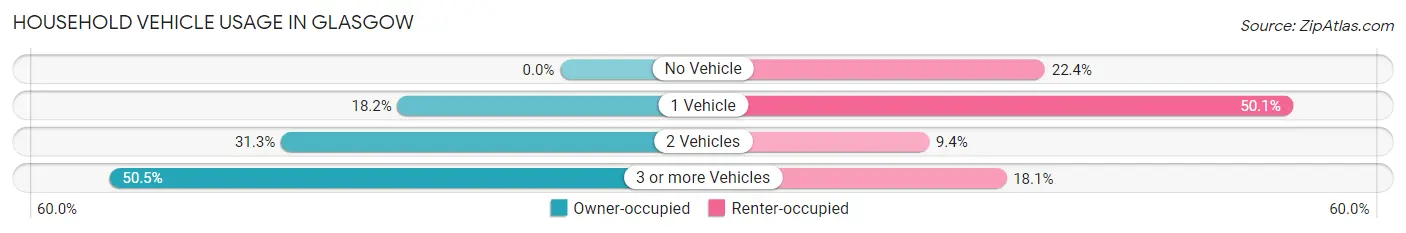
| Vehicles per Household | Owner-occupied | Renter-occupied |
| No Vehicle | 0 (0.0%) | 88 (22.4%) |
| 1 Vehicle | 145 (18.2%) | 197 (50.1%) |
| 2 Vehicles | 249 (31.3%) | 37 (9.4%) |
| 3 or more Vehicles | 402 (50.5%) | 71 (18.1%) |
| Total | 796 (100.0%) | 393 (100.0%) |
Real Estate & Mortgages in Glasgow
Real Estate and Mortgage Overview in Glasgow
| Characteristic | Without Mortgage | With Mortgage |
| Housing Units | 383 | 413 |
| Median Property Value | $188,800 | $190,200 |
| Median Household Income | $64,861 | $101 |
| Monthly Housing Costs | $539 | $0 |
| Real Estate Taxes | $2,460 | $0 |
Property Value by Mortgage Status in Glasgow
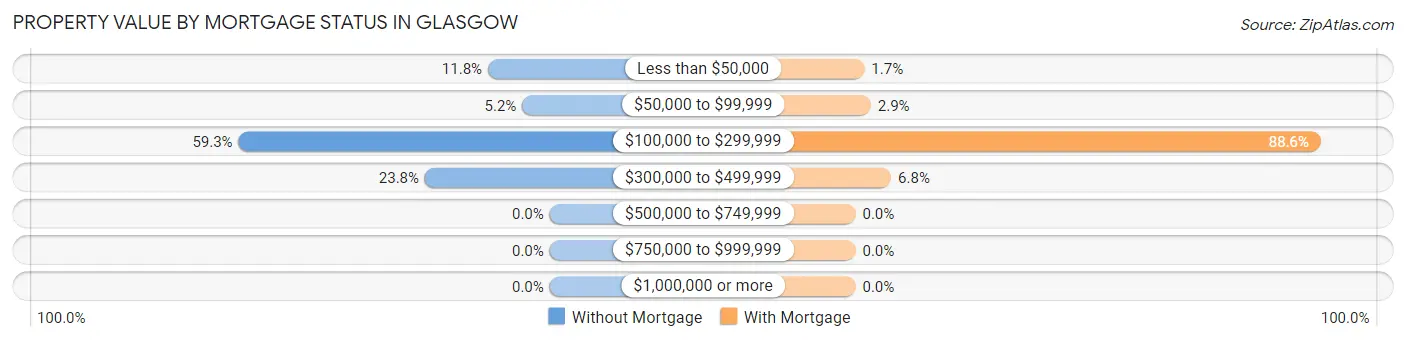
| Property Value | Without Mortgage | With Mortgage |
| Less than $50,000 | 45 (11.7%) | 7 (1.7%) |
| $50,000 to $99,999 | 20 (5.2%) | 12 (2.9%) |
| $100,000 to $299,999 | 227 (59.3%) | 366 (88.6%) |
| $300,000 to $499,999 | 91 (23.8%) | 28 (6.8%) |
| $500,000 to $749,999 | 0 (0.0%) | 0 (0.0%) |
| $750,000 to $999,999 | 0 (0.0%) | 0 (0.0%) |
| $1,000,000 or more | 0 (0.0%) | 0 (0.0%) |
| Total | 383 (100.0%) | 413 (100.0%) |
Household Income by Mortgage Status in Glasgow
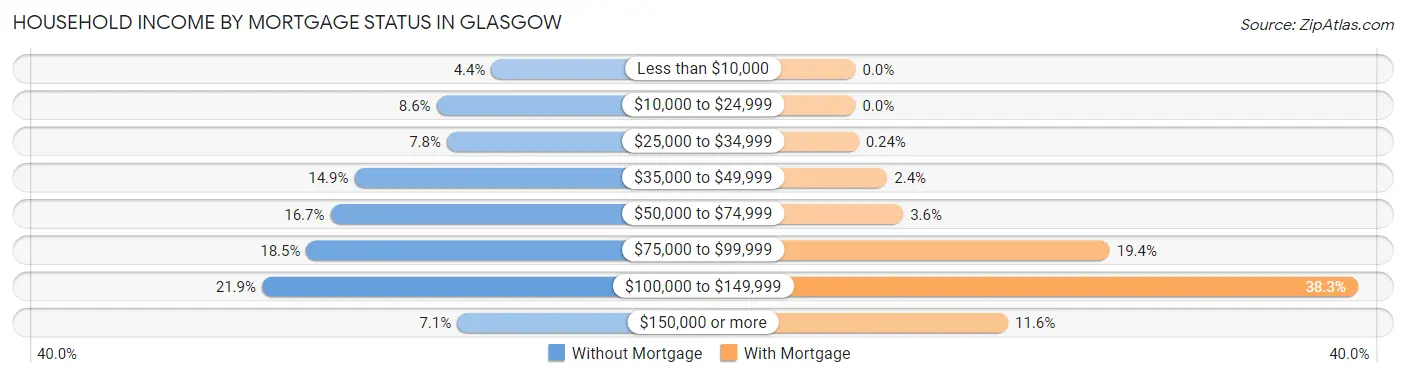
| Household Income | Without Mortgage | With Mortgage |
| Less than $10,000 | 17 (4.4%) | 0 (0.0%) |
| $10,000 to $24,999 | 33 (8.6%) | 0 (0.0%) |
| $25,000 to $34,999 | 30 (7.8%) | 1 (0.2%) |
| $35,000 to $49,999 | 57 (14.9%) | 10 (2.4%) |
| $50,000 to $74,999 | 64 (16.7%) | 15 (3.6%) |
| $75,000 to $99,999 | 71 (18.5%) | 80 (19.4%) |
| $100,000 to $149,999 | 84 (21.9%) | 158 (38.3%) |
| $150,000 or more | 27 (7.0%) | 48 (11.6%) |
| Total | 383 (100.0%) | 413 (100.0%) |
Property Value to Household Income Ratio in Glasgow
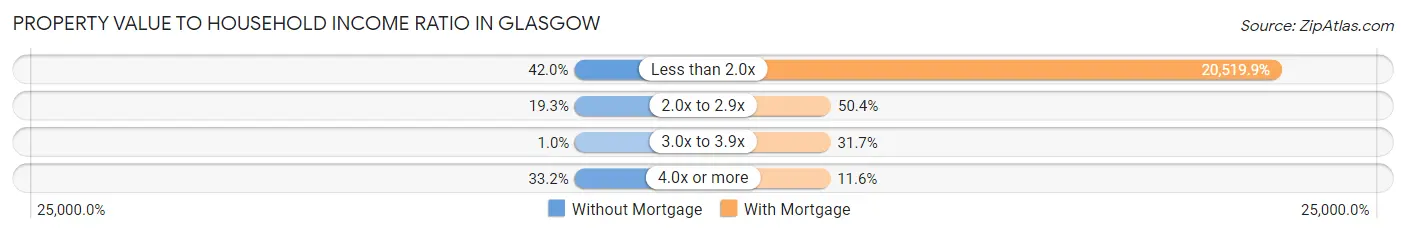
| Value-to-Income Ratio | Without Mortgage | With Mortgage |
| Less than 2.0x | 161 (42.0%) | 84,747 (20,519.8%) |
| 2.0x to 2.9x | 74 (19.3%) | 208 (50.4%) |
| 3.0x to 3.9x | 4 (1.0%) | 131 (31.7%) |
| 4.0x or more | 127 (33.2%) | 48 (11.6%) |
| Total | 383 (100.0%) | 413 (100.0%) |
Real Estate Taxes by Mortgage Status in Glasgow
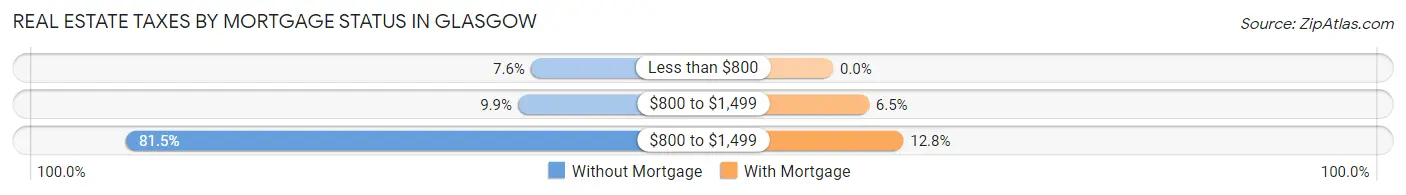
| Property Taxes | Without Mortgage | With Mortgage |
| Less than $800 | 29 (7.6%) | 0 (0.0%) |
| $800 to $1,499 | 38 (9.9%) | 27 (6.5%) |
| $800 to $1,499 | 312 (81.5%) | 53 (12.8%) |
| Total | 383 (100.0%) | 413 (100.0%) |
Health & Disability in Glasgow
Health Insurance Coverage by Age in Glasgow
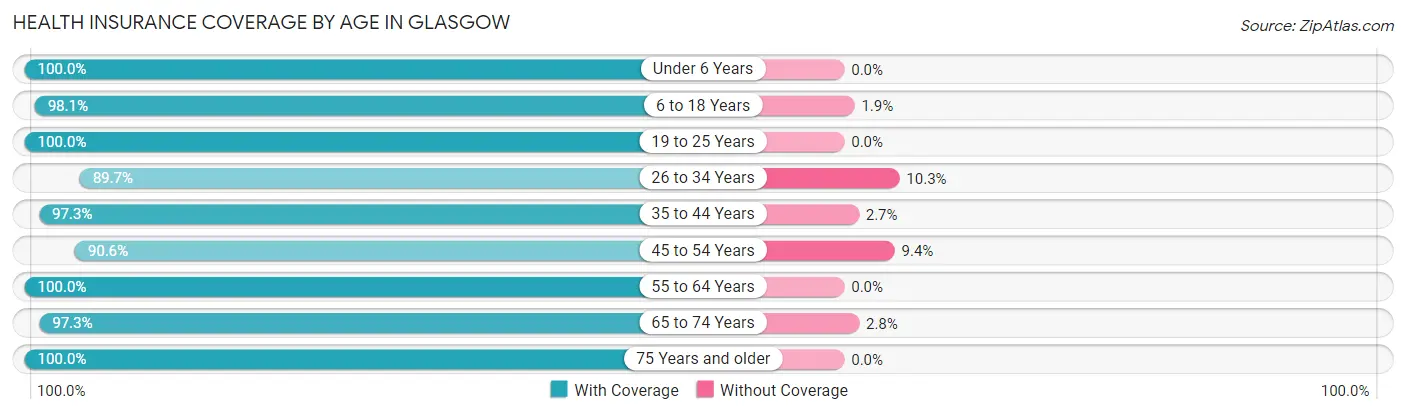
| Age Bracket | With Coverage | Without Coverage |
| Under 6 Years | 349 (100.0%) | 0 (0.0%) |
| 6 to 18 Years | 568 (98.1%) | 11 (1.9%) |
| 19 to 25 Years | 144 (100.0%) | 0 (0.0%) |
| 26 to 34 Years | 253 (89.7%) | 29 (10.3%) |
| 35 to 44 Years | 324 (97.3%) | 9 (2.7%) |
| 45 to 54 Years | 338 (90.6%) | 35 (9.4%) |
| 55 to 64 Years | 433 (100.0%) | 0 (0.0%) |
| 65 to 74 Years | 354 (97.3%) | 10 (2.8%) |
| 75 Years and older | 254 (100.0%) | 0 (0.0%) |
| Total | 3,017 (97.0%) | 94 (3.0%) |
Health Insurance Coverage by Citizenship Status in Glasgow
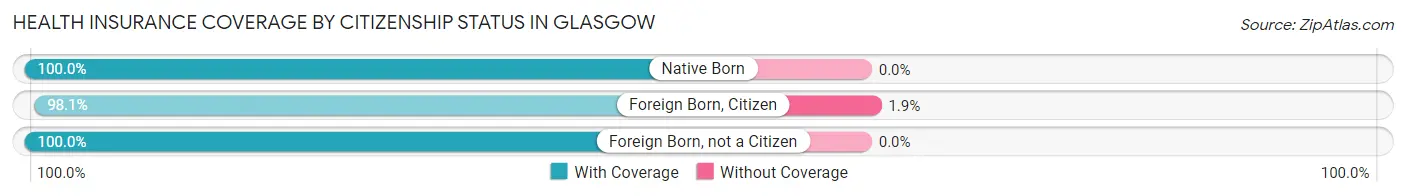
| Citizenship Status | With Coverage | Without Coverage |
| Native Born | 349 (100.0%) | 0 (0.0%) |
| Foreign Born, Citizen | 568 (98.1%) | 11 (1.9%) |
| Foreign Born, not a Citizen | 144 (100.0%) | 0 (0.0%) |
Health Insurance Coverage by Household Income in Glasgow
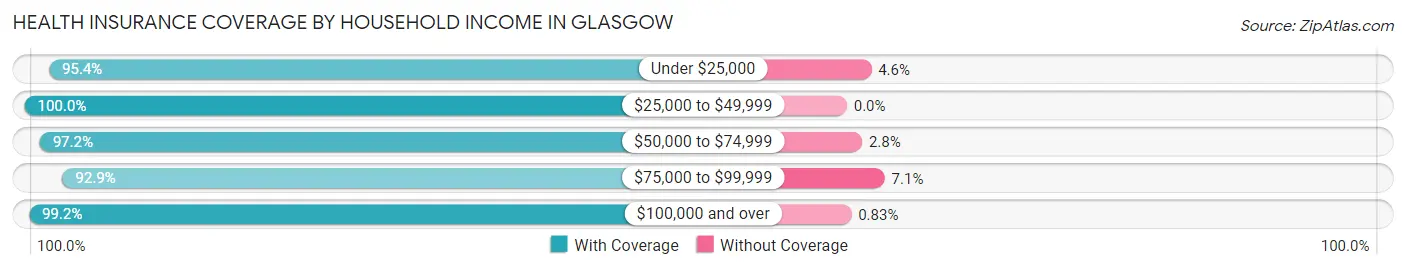
| Household Income | With Coverage | Without Coverage |
| Under $25,000 | 209 (95.4%) | 10 (4.6%) |
| $25,000 to $49,999 | 445 (100.0%) | 0 (0.0%) |
| $50,000 to $74,999 | 411 (97.2%) | 12 (2.8%) |
| $75,000 to $99,999 | 826 (92.9%) | 63 (7.1%) |
| $100,000 and over | 1,079 (99.2%) | 9 (0.8%) |
Public vs Private Health Insurance Coverage by Age in Glasgow
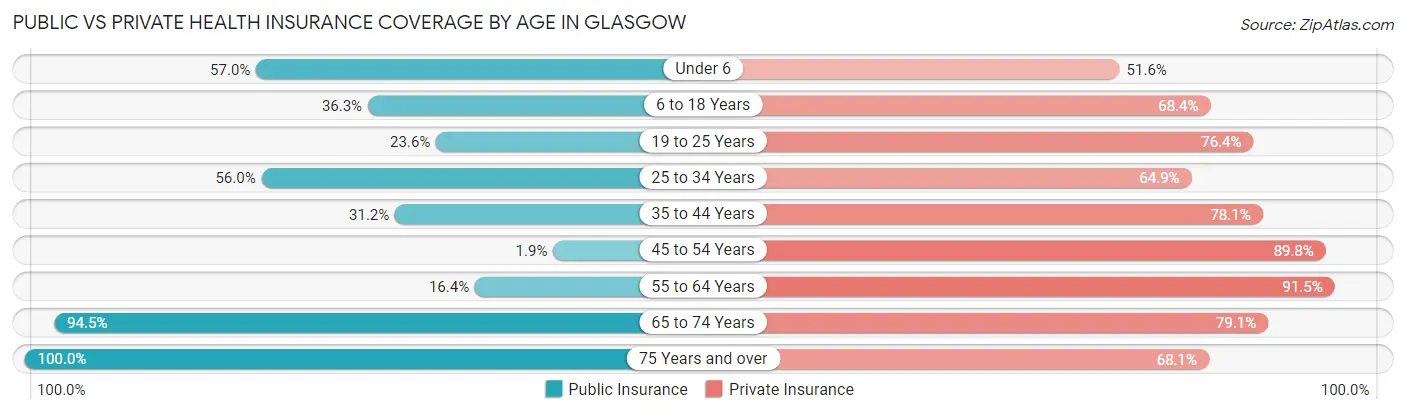
| Age Bracket | Public Insurance | Private Insurance |
| Under 6 | 199 (57.0%) | 180 (51.6%) |
| 6 to 18 Years | 210 (36.3%) | 396 (68.4%) |
| 19 to 25 Years | 34 (23.6%) | 110 (76.4%) |
| 25 to 34 Years | 158 (56.0%) | 183 (64.9%) |
| 35 to 44 Years | 104 (31.2%) | 260 (78.1%) |
| 45 to 54 Years | 7 (1.9%) | 335 (89.8%) |
| 55 to 64 Years | 71 (16.4%) | 396 (91.4%) |
| 65 to 74 Years | 344 (94.5%) | 288 (79.1%) |
| 75 Years and over | 254 (100.0%) | 173 (68.1%) |
| Total | 1,381 (44.4%) | 2,321 (74.6%) |
Disability Status by Sex by Age in Glasgow
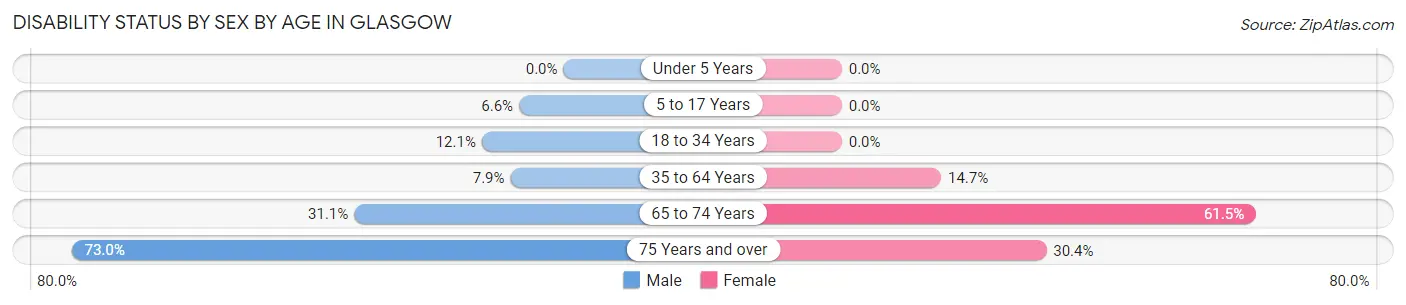
| Age Bracket | Male | Female |
| Under 5 Years | 0 (0.0%) | 0 (0.0%) |
| 5 to 17 Years | 22 (6.6%) | 0 (0.0%) |
| 18 to 34 Years | 20 (12.1%) | 0 (0.0%) |
| 35 to 64 Years | 48 (7.9%) | 78 (14.7%) |
| 65 to 74 Years | 55 (31.1%) | 115 (61.5%) |
| 75 Years and over | 46 (73.0%) | 58 (30.4%) |
Disability Class by Sex by Age in Glasgow
Disability Class: Hearing Difficulty
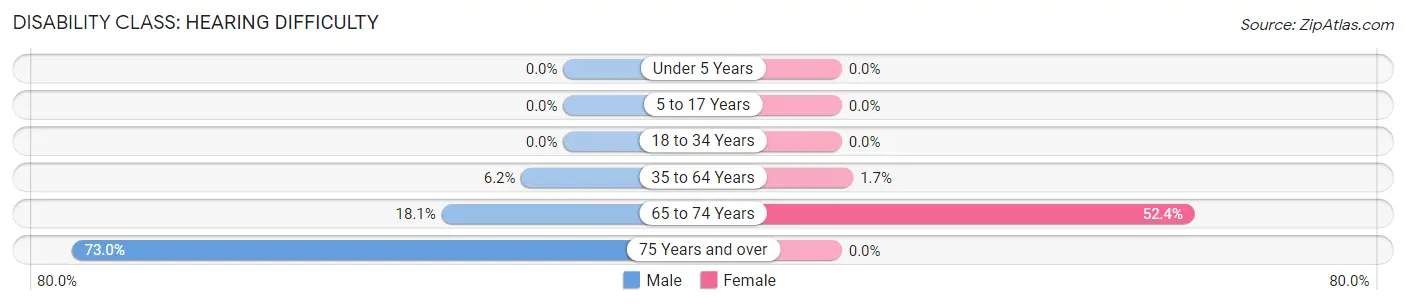
| Age Bracket | Male | Female |
| Under 5 Years | 0 (0.0%) | 0 (0.0%) |
| 5 to 17 Years | 0 (0.0%) | 0 (0.0%) |
| 18 to 34 Years | 0 (0.0%) | 0 (0.0%) |
| 35 to 64 Years | 38 (6.2%) | 9 (1.7%) |
| 65 to 74 Years | 32 (18.1%) | 98 (52.4%) |
| 75 Years and over | 46 (73.0%) | 0 (0.0%) |
Disability Class: Vision Difficulty
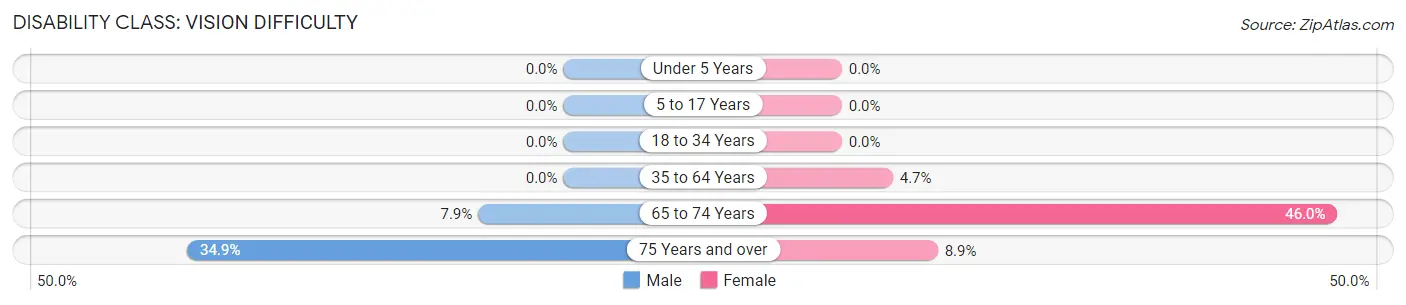
| Age Bracket | Male | Female |
| Under 5 Years | 0 (0.0%) | 0 (0.0%) |
| 5 to 17 Years | 0 (0.0%) | 0 (0.0%) |
| 18 to 34 Years | 0 (0.0%) | 0 (0.0%) |
| 35 to 64 Years | 0 (0.0%) | 25 (4.7%) |
| 65 to 74 Years | 14 (7.9%) | 86 (46.0%) |
| 75 Years and over | 22 (34.9%) | 17 (8.9%) |
Disability Class: Cognitive Difficulty
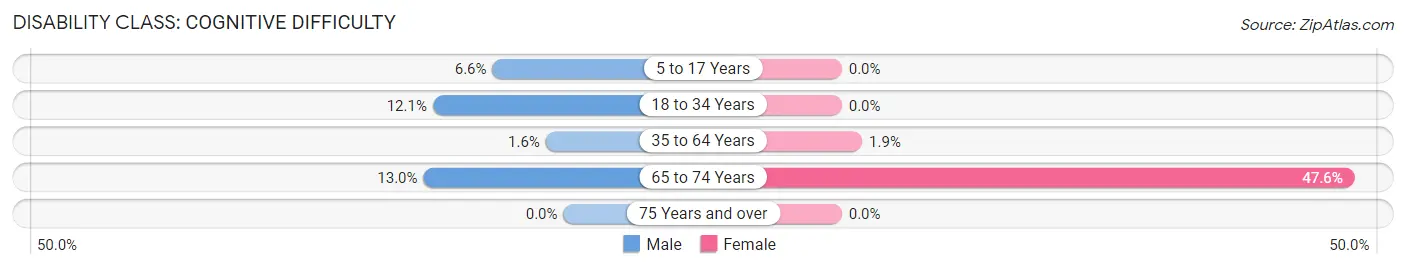
| Age Bracket | Male | Female |
| 5 to 17 Years | 22 (6.6%) | 0 (0.0%) |
| 18 to 34 Years | 20 (12.1%) | 0 (0.0%) |
| 35 to 64 Years | 10 (1.6%) | 10 (1.9%) |
| 65 to 74 Years | 23 (13.0%) | 89 (47.6%) |
| 75 Years and over | 0 (0.0%) | 0 (0.0%) |
Disability Class: Ambulatory Difficulty
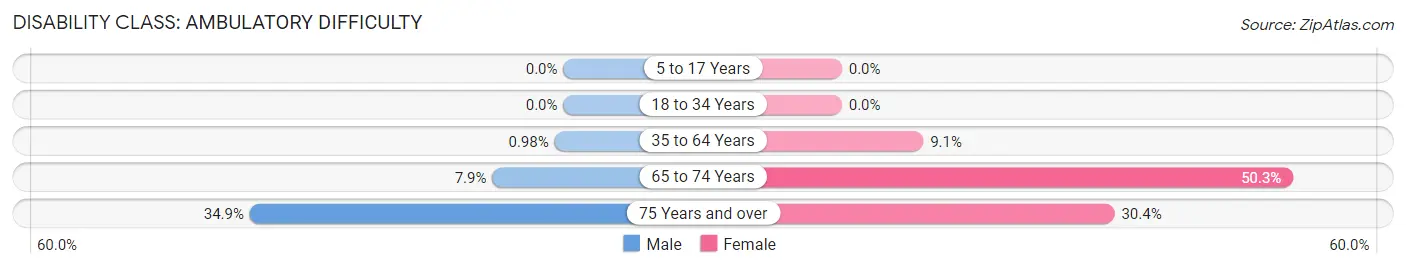
| Age Bracket | Male | Female |
| 5 to 17 Years | 0 (0.0%) | 0 (0.0%) |
| 18 to 34 Years | 0 (0.0%) | 0 (0.0%) |
| 35 to 64 Years | 6 (1.0%) | 48 (9.1%) |
| 65 to 74 Years | 14 (7.9%) | 94 (50.3%) |
| 75 Years and over | 22 (34.9%) | 58 (30.4%) |
Disability Class: Self-Care Difficulty
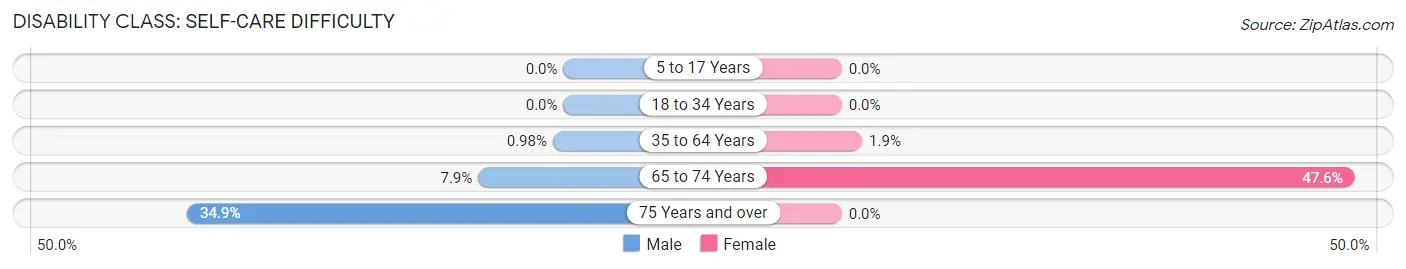
| Age Bracket | Male | Female |
| 5 to 17 Years | 0 (0.0%) | 0 (0.0%) |
| 18 to 34 Years | 0 (0.0%) | 0 (0.0%) |
| 35 to 64 Years | 6 (1.0%) | 10 (1.9%) |
| 65 to 74 Years | 14 (7.9%) | 89 (47.6%) |
| 75 Years and over | 22 (34.9%) | 0 (0.0%) |
Technology Access in Glasgow
Computing Device Access in Glasgow
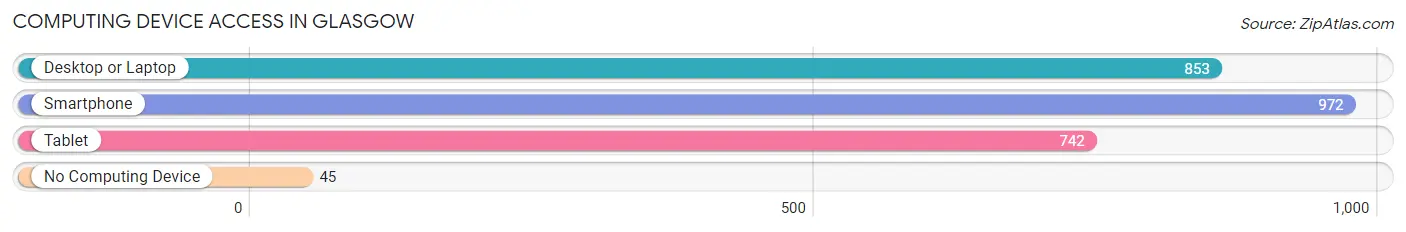
| Device Type | # Households | % Households |
| Desktop or Laptop | 853 | 71.7% |
| Smartphone | 972 | 81.8% |
| Tablet | 742 | 62.4% |
| No Computing Device | 45 | 3.8% |
| Total | 1,189 | 100.0% |
Internet Access in Glasgow
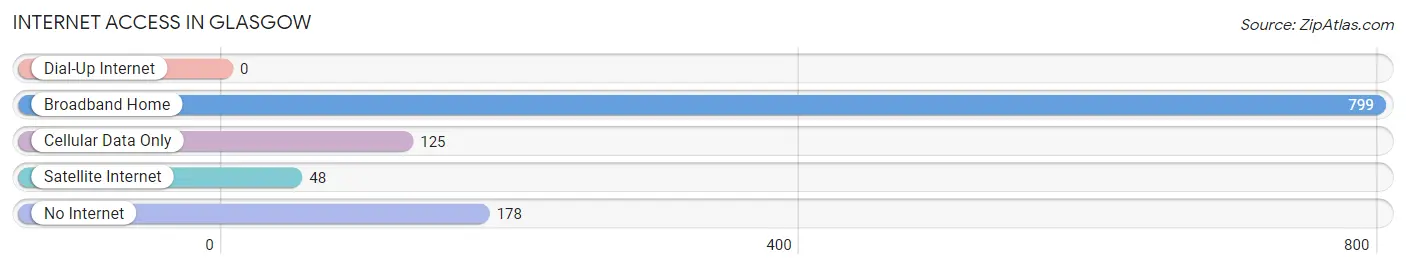
| Internet Type | # Households | % Households |
| Dial-Up Internet | 0 | 0.0% |
| Broadband Home | 799 | 67.2% |
| Cellular Data Only | 125 | 10.5% |
| Satellite Internet | 48 | 4.0% |
| No Internet | 178 | 15.0% |
| Total | 1,189 | 100.0% |
Glasgow Summary
Glasgow, Montana is a small city located in Valley County, in the northeastern part of the state. It is situated on the banks of the Milk River, and is the county seat of Valley County. The city has a population of 3,521, according to the 2010 census.
History
The area that is now Glasgow was first inhabited by the Assiniboine and Sioux Native American tribes. The first white settlers arrived in the area in the late 1800s, and the town was officially founded in 1887. The town was named after Glasgow, Scotland, and was originally intended to be a trading post for the local Native American tribes.
In the early 1900s, Glasgow experienced a period of rapid growth, due to the arrival of the Great Northern Railway. This allowed the town to become a major hub for the region, and it soon became a center for commerce and industry. The town also became a popular destination for tourists, due to its proximity to the Missouri River and the nearby Fort Peck Dam.
Geography
Glasgow is located in Valley County, in the northeastern part of Montana. It is situated on the banks of the Milk River, and is the county seat of Valley County. The city has a total area of 4.2 square miles, all of which is land.
The city is located in a semi-arid climate, with hot summers and cold winters. The average temperature in the summer is around 80 degrees Fahrenheit, while the average temperature in the winter is around 20 degrees Fahrenheit. The city receives an average of 16 inches of precipitation per year.
Economy
The economy of Glasgow is largely based on agriculture and tourism. The city is home to several large farms, which produce a variety of crops, including wheat, barley, oats, and hay. The city is also home to several large ranches, which raise cattle, sheep, and horses.
The city is also a popular tourist destination, due to its proximity to the Missouri River and the nearby Fort Peck Dam. The city is home to several museums, galleries, and other attractions, which attract visitors from all over the region.
Demographics
As of the 2010 census, the population of Glasgow was 3,521. The racial makeup of the city was 94.3% White, 0.3% African American, 0.7% Native American, 0.2% Asian, 0.1% Pacific Islander, and 4.4% from other races. The median household income in the city was $35,938, and the median family income was $45,938. The per capita income in the city was $19,938.
Conclusion
Glasgow, Montana is a small city located in Valley County, in the northeastern part of the state. It is situated on the banks of the Milk River, and is the county seat of Valley County. The city has a population of 3,521, according to the 2010 census. The economy of Glasgow is largely based on agriculture and tourism, and the city is a popular tourist destination due to its proximity to the Missouri River and the nearby Fort Peck Dam. The racial makeup of the city is 94.3% White, 0.3% African American, 0.7% Native American, 0.2% Asian, 0.1% Pacific Islander, and 4.4% from other races. The median household income in the city was $35,938, and the median family income was $45,938.
Common Questions
What is Per Capita Income in Glasgow?
Per Capita income in Glasgow is $32,294.
What is the Median Family Income in Glasgow?
Median Family Income in Glasgow is $83,976.
What is the Median Household income in Glasgow?
Median Household Income in Glasgow is $65,850.
What is Income or Wage Gap in Glasgow?
Income or Wage Gap in Glasgow is 44.8%.
Women in Glasgow earn 55.2 cents for every dollar earned by a man.
What is Inequality or Gini Index in Glasgow?
Inequality or Gini Index in Glasgow is 0.39.
What is the Total Population of Glasgow?
Total Population of Glasgow is 3,208.
What is the Total Male Population of Glasgow?
Total Male Population of Glasgow is 1,533.
What is the Total Female Population of Glasgow?
Total Female Population of Glasgow is 1,675.
What is the Ratio of Males per 100 Females in Glasgow?
There are 91.52 Males per 100 Females in Glasgow.
What is the Ratio of Females per 100 Males in Glasgow?
There are 109.26 Females per 100 Males in Glasgow.
What is the Median Population Age in Glasgow?
Median Population Age in Glasgow is 40.6 Years.
What is the Average Family Size in Glasgow
Average Family Size in Glasgow is 3.3 People.
What is the Average Household Size in Glasgow
Average Household Size in Glasgow is 2.6 People.
How Large is the Labor Force in Glasgow?
There are 1,651 People in the Labor Forcein in Glasgow.
What is the Percentage of People in the Labor Force in Glasgow?
68.6% of People are in the Labor Force in Glasgow.
What is the Unemployment Rate in Glasgow?
Unemployment Rate in Glasgow is 0.8%.