Havre, MT Map & Demographics
Havre Map
Havre Overview
$30,449
PER CAPITA INCOME
$81,986
AVG FAMILY INCOME
$63,143
AVG HOUSEHOLD INCOME
33.9%
WAGE / INCOME GAP [ % ]
66.1¢/ $1
WAGE / INCOME GAP [ $ ]
$9,719
FAMILY INCOME DEFICIT
0.41
INEQUALITY / GINI INDEX
9,332
TOTAL POPULATION
4,527
MALE POPULATION
4,805
FEMALE POPULATION
94.21
MALES / 100 FEMALES
106.14
FEMALES / 100 MALES
31.3
MEDIAN AGE
3.0
AVG FAMILY SIZE
2.4
AVG HOUSEHOLD SIZE
4,799
LABOR FORCE [ PEOPLE ]
68.3%
PERCENT IN LABOR FORCE
3.2%
UNEMPLOYMENT RATE
Havre Zip Codes
Havre Area Codes
Income in Havre
Income Overview in Havre
Per Capita Income in Havre is $30,449, while median incomes of families and households are $81,986 and $63,143 respectively.
| Characteristic | Number | Measure |
| Per Capita Income | 9,332 | $30,449 |
| Median Family Income | 2,307 | $81,986 |
| Mean Family Income | 2,307 | $92,277 |
| Median Household Income | 3,772 | $63,143 |
| Mean Household Income | 3,772 | $74,715 |
| Income Deficit | 2,307 | $9,719 |
| Wage / Income Gap (%) | 9,332 | 33.91% |
| Wage / Income Gap ($) | 9,332 | 66.09¢ per $1 |
| Gini / Inequality Index | 9,332 | 0.41 |
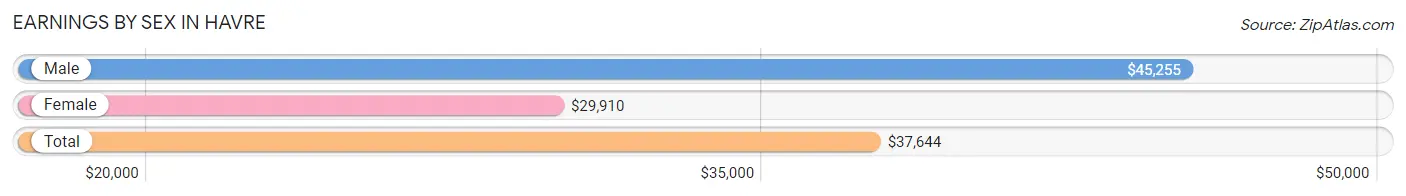
Earnings by Sex in Havre
Average Earnings in Havre are $37,644, $45,255 for men and $29,910 for women, a difference of 33.9%.
| Sex | Number | Average Earnings |
| Male | 2,609 (52.3%) | $45,255 |
| Female | 2,380 (47.7%) | $29,910 |
| Total | 4,989 (100.0%) | $37,644 |
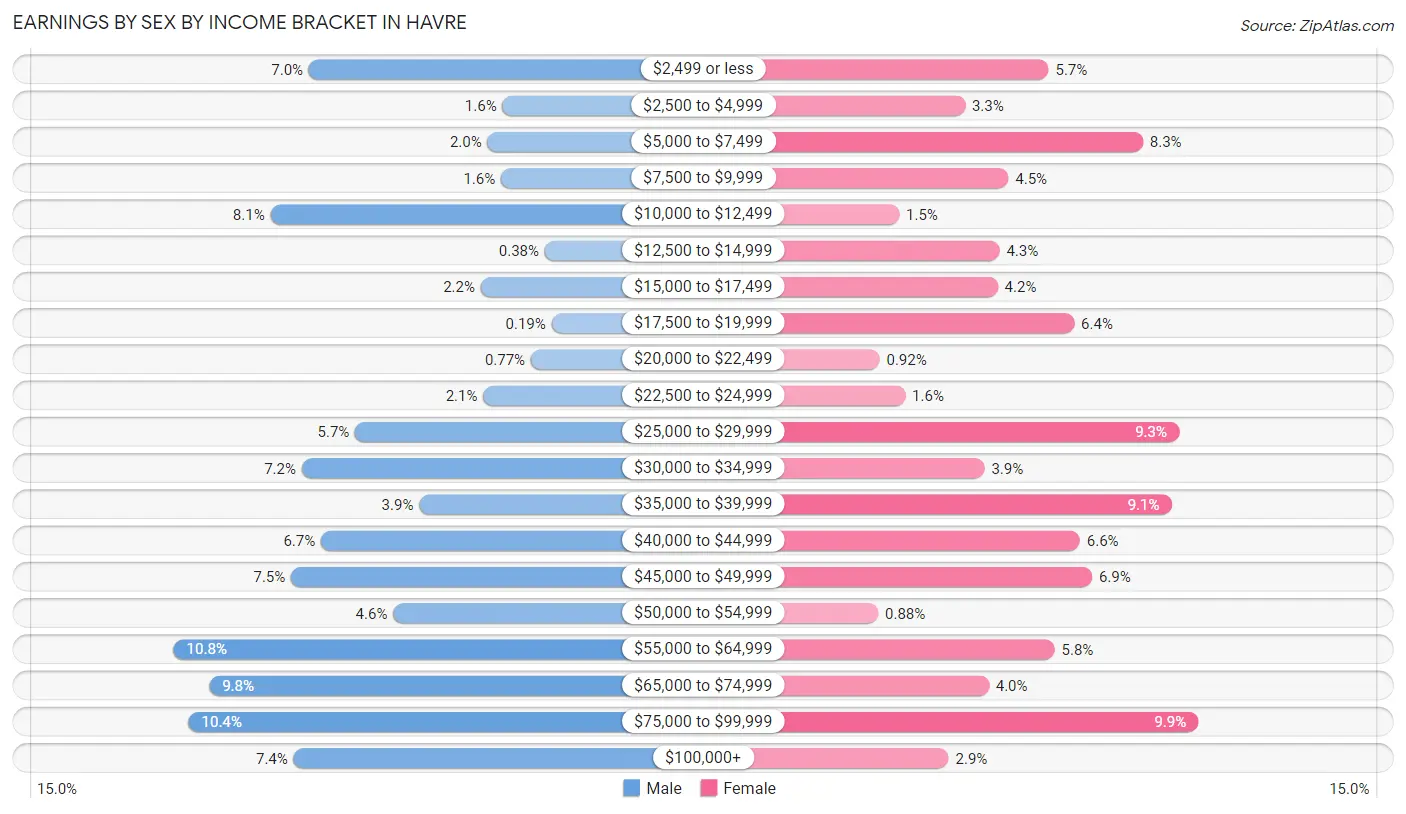
Earnings by Sex by Income Bracket in Havre
The most common earnings brackets in Havre are $55,000 to $64,999 for men (282 | 10.8%) and $75,000 to $99,999 for women (235 | 9.9%).
| Income | Male | Female |
| $2,499 or less | 183 (7.0%) | 135 (5.7%) |
| $2,500 to $4,999 | 41 (1.6%) | 79 (3.3%) |
| $5,000 to $7,499 | 52 (2.0%) | 198 (8.3%) |
| $7,500 to $9,999 | 42 (1.6%) | 108 (4.5%) |
| $10,000 to $12,499 | 211 (8.1%) | 35 (1.5%) |
| $12,500 to $14,999 | 10 (0.4%) | 102 (4.3%) |
| $15,000 to $17,499 | 57 (2.2%) | 101 (4.2%) |
| $17,500 to $19,999 | 5 (0.2%) | 152 (6.4%) |
| $20,000 to $22,499 | 20 (0.8%) | 22 (0.9%) |
| $22,500 to $24,999 | 55 (2.1%) | 39 (1.6%) |
| $25,000 to $29,999 | 149 (5.7%) | 222 (9.3%) |
| $30,000 to $34,999 | 188 (7.2%) | 92 (3.9%) |
| $35,000 to $39,999 | 102 (3.9%) | 217 (9.1%) |
| $40,000 to $44,999 | 174 (6.7%) | 156 (6.6%) |
| $45,000 to $49,999 | 196 (7.5%) | 164 (6.9%) |
| $50,000 to $54,999 | 121 (4.6%) | 21 (0.9%) |
| $55,000 to $64,999 | 282 (10.8%) | 139 (5.8%) |
| $65,000 to $74,999 | 256 (9.8%) | 95 (4.0%) |
| $75,000 to $99,999 | 271 (10.4%) | 235 (9.9%) |
| $100,000+ | 194 (7.4%) | 68 (2.9%) |
| Total | 2,609 (100.0%) | 2,380 (100.0%) |
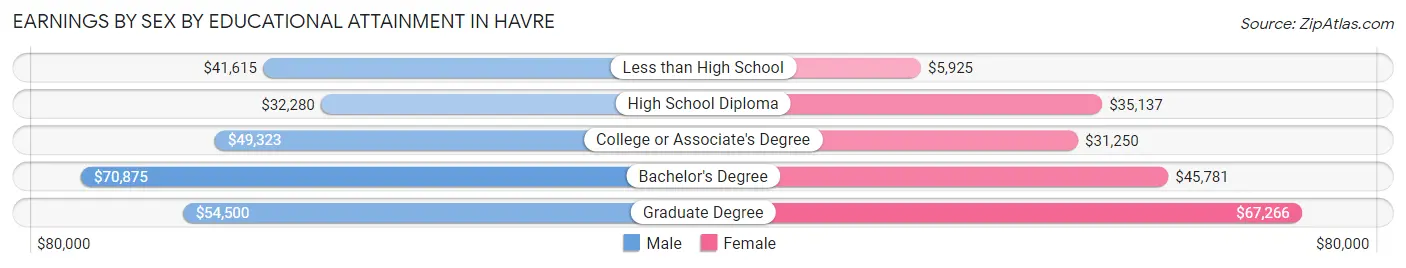
Earnings by Sex by Educational Attainment in Havre
Average earnings in Havre are $50,861 for men and $36,904 for women, a difference of 27.4%. Men with an educational attainment of bachelor's degree enjoy the highest average annual earnings of $70,875, while those with high school diploma education earn the least with $32,280. Women with an educational attainment of graduate degree earn the most with the average annual earnings of $67,266, while those with less than high school education have the smallest earnings of $5,925.
| Educational Attainment | Male Income | Female Income |
| Less than High School | $41,615 | $5,925 |
| High School Diploma | $32,280 | $35,137 |
| College or Associate's Degree | $49,323 | $31,250 |
| Bachelor's Degree | $70,875 | $45,781 |
| Graduate Degree | $54,500 | $67,266 |
| Total | $50,861 | $36,904 |
Family Income in Havre
Family Income Brackets in Havre
According to the Havre family income data, there are 554 families falling into the $100,000 to $149,999 income range, which is the most common income bracket and makes up 24.0% of all families. Conversely, the $10,000 to $14,999 income bracket is the least frequent group with only 42 families (1.8%) belonging to this category.
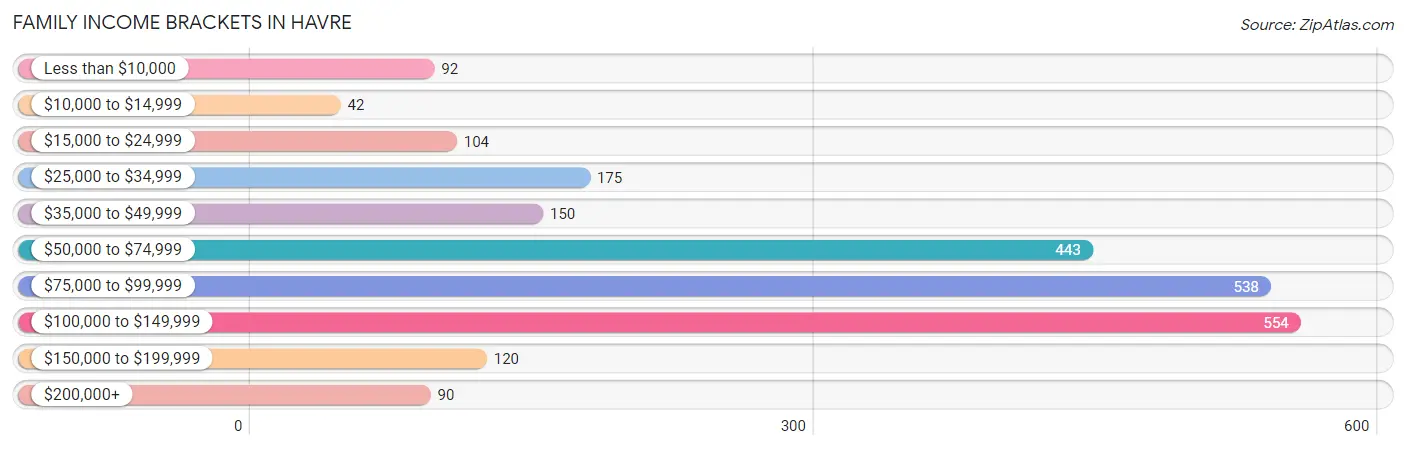
| Income Bracket | # Families | % Families |
| Less than $10,000 | 92 | 4.0% |
| $10,000 to $14,999 | 42 | 1.8% |
| $15,000 to $24,999 | 104 | 4.5% |
| $25,000 to $34,999 | 175 | 7.6% |
| $35,000 to $49,999 | 150 | 6.5% |
| $50,000 to $74,999 | 443 | 19.2% |
| $75,000 to $99,999 | 538 | 23.3% |
| $100,000 to $149,999 | 554 | 24.0% |
| $150,000 to $199,999 | 120 | 5.2% |
| $200,000+ | 90 | 3.9% |
Family Income by Famaliy Size in Havre
5-person families (126 | 5.5%) account for the highest median family income in Havre with $113,771 per family, while 2-person families (1,181 | 51.2%) have the highest median income of $37,715 per family member.
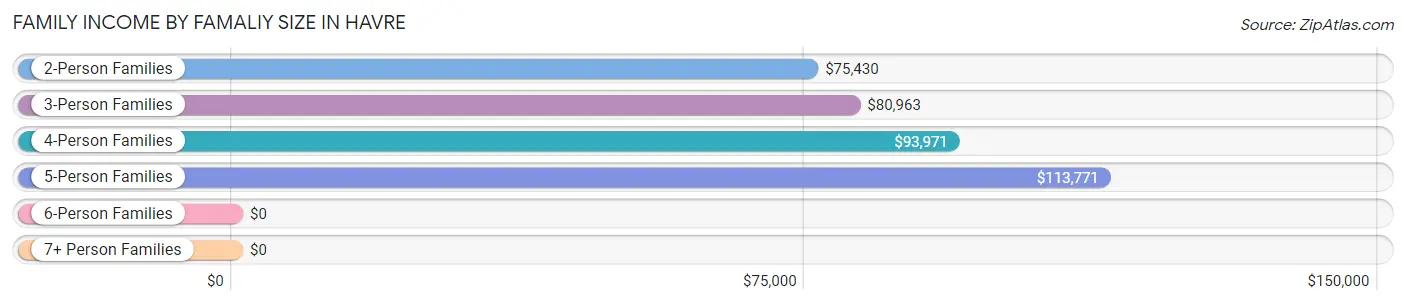
| Income Bracket | # Families | Median Income |
| 2-Person Families | 1,181 (51.2%) | $75,430 |
| 3-Person Families | 513 (22.2%) | $80,963 |
| 4-Person Families | 454 (19.7%) | $93,971 |
| 5-Person Families | 126 (5.5%) | $113,771 |
| 6-Person Families | 19 (0.8%) | $0 |
| 7+ Person Families | 14 (0.6%) | $0 |
| Total | 2,307 (100.0%) | $81,986 |
Family Income by Number of Earners in Havre
The median family income in Havre is $81,986, with families comprising 3+ earners (211) having the highest median family income of $113,411, while families with no earners (302) have the lowest median family income of $61,000, accounting for 9.1% and 13.1% of families, respectively.
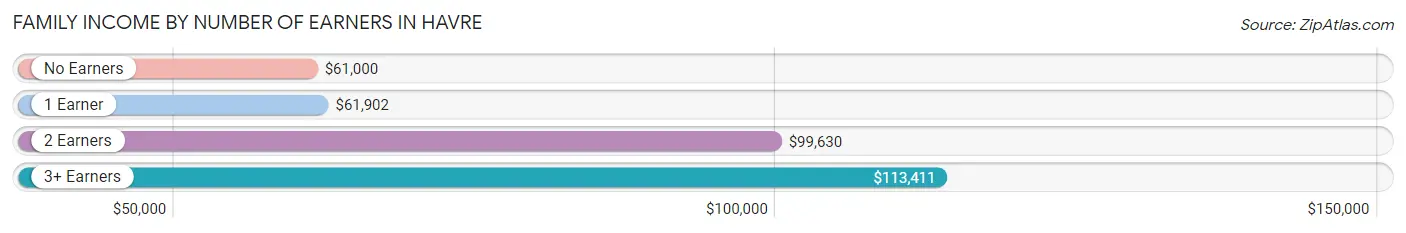
| Number of Earners | # Families | Median Income |
| No Earners | 302 (13.1%) | $61,000 |
| 1 Earner | 870 (37.7%) | $61,902 |
| 2 Earners | 924 (40.1%) | $99,630 |
| 3+ Earners | 211 (9.1%) | $113,411 |
| Total | 2,307 (100.0%) | $81,986 |
Household Income in Havre
Household Income Brackets in Havre
With 687 households falling in the category, the $50,000 to $74,999 income range is the most frequent in Havre, accounting for 18.2% of all households. In contrast, only 102 households (2.7%) fall into the $200,000+ income bracket, making it the least populous group.
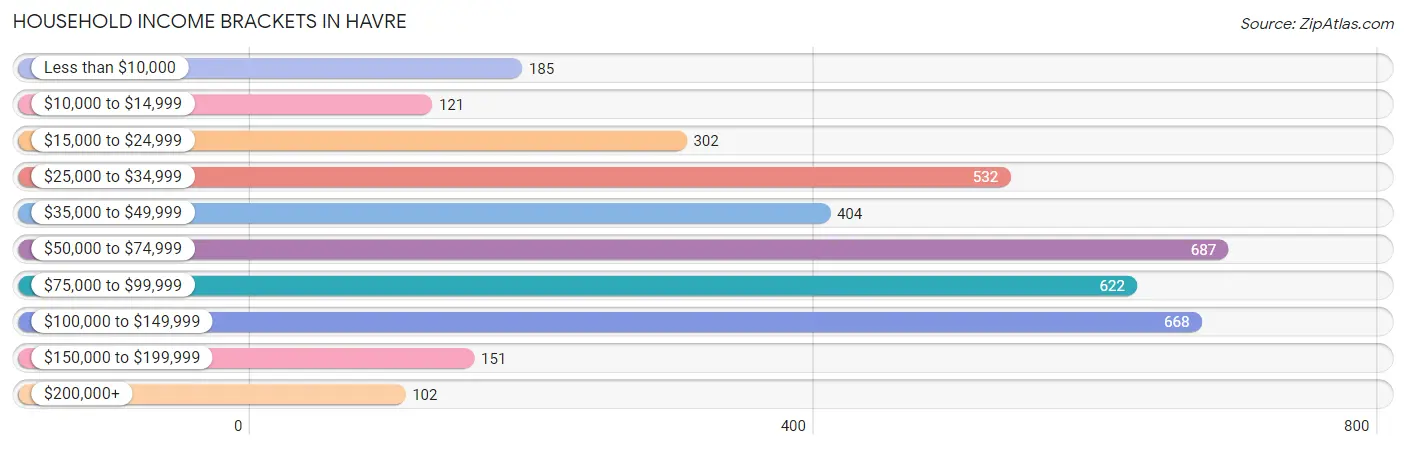
| Income Bracket | # Households | % Households |
| Less than $10,000 | 185 | 4.9% |
| $10,000 to $14,999 | 121 | 3.2% |
| $15,000 to $24,999 | 302 | 8.0% |
| $25,000 to $34,999 | 532 | 14.1% |
| $35,000 to $49,999 | 404 | 10.7% |
| $50,000 to $74,999 | 687 | 18.2% |
| $75,000 to $99,999 | 622 | 16.5% |
| $100,000 to $149,999 | 668 | 17.7% |
| $150,000 to $199,999 | 151 | 4.0% |
| $200,000+ | 102 | 2.7% |
Household Income by Householder Age in Havre
The median household income in Havre is $63,143, with the highest median household income of $82,283 found in the 25 to 44 years age bracket for the primary householder. A total of 1,353 households (35.9%) fall into this category. Meanwhile, the 15 to 24 years age bracket for the primary householder has the lowest median household income of $27,750, with 295 households (7.8%) in this group.
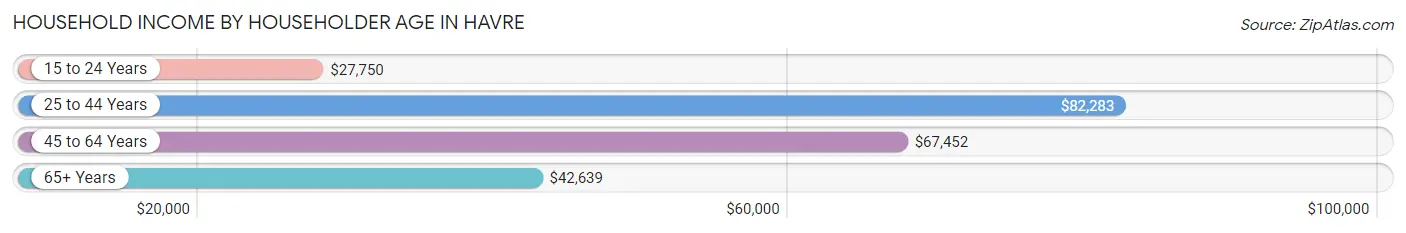
| Income Bracket | # Households | Median Income |
| 15 to 24 Years | 295 (7.8%) | $27,750 |
| 25 to 44 Years | 1,353 (35.9%) | $82,283 |
| 45 to 64 Years | 1,097 (29.1%) | $67,452 |
| 65+ Years | 1,027 (27.2%) | $42,639 |
| Total | 3,772 (100.0%) | $63,143 |
Poverty in Havre
Income Below Poverty by Sex and Age in Havre
With 15.4% poverty level for males and 14.8% for females among the residents of Havre, 12 to 14 year old males and 5 year old females are the most vulnerable to poverty, with 31 males (47.7%) and 38 females (48.1%) in their respective age groups living below the poverty level.
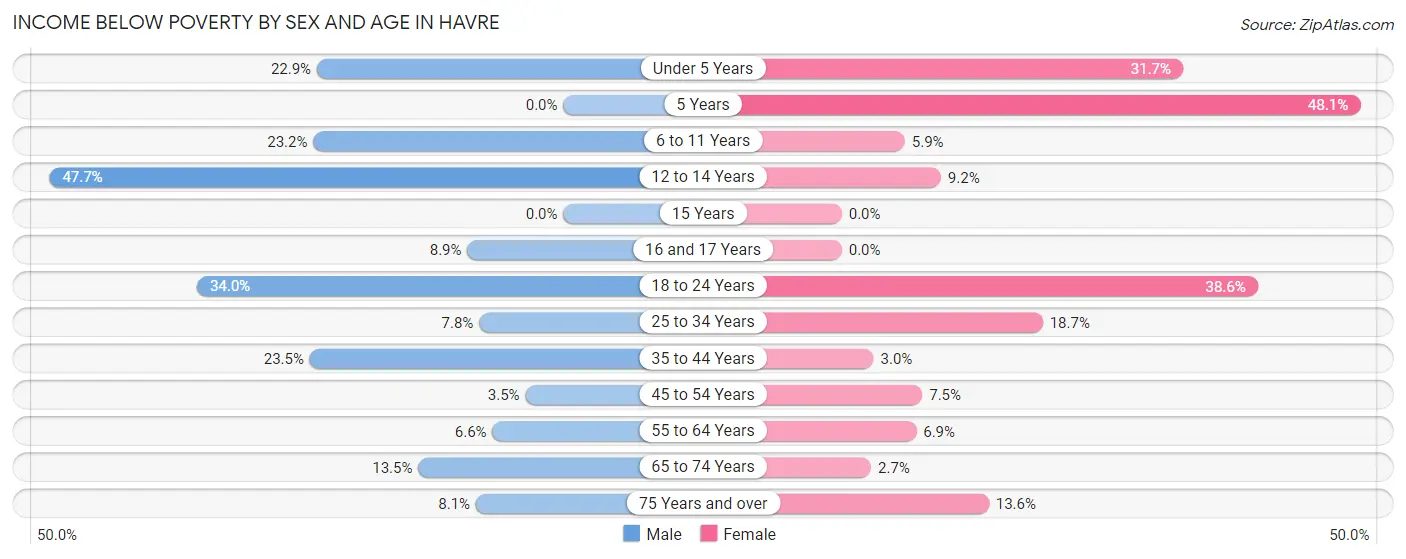
| Age Bracket | Male | Female |
| Under 5 Years | 94 (22.9%) | 163 (31.7%) |
| 5 Years | 0 (0.0%) | 38 (48.1%) |
| 6 to 11 Years | 107 (23.2%) | 29 (5.9%) |
| 12 to 14 Years | 31 (47.7%) | 16 (9.2%) |
| 15 Years | 0 (0.0%) | 0 (0.0%) |
| 16 and 17 Years | 9 (8.9%) | 0 (0.0%) |
| 18 to 24 Years | 119 (34.0%) | 191 (38.6%) |
| 25 to 34 Years | 67 (7.8%) | 122 (18.6%) |
| 35 to 44 Years | 116 (23.5%) | 16 (2.9%) |
| 45 to 54 Years | 13 (3.5%) | 28 (7.5%) |
| 55 to 64 Years | 31 (6.6%) | 30 (6.9%) |
| 65 to 74 Years | 63 (13.5%) | 12 (2.7%) |
| 75 Years and over | 18 (8.1%) | 48 (13.6%) |
| Total | 668 (15.4%) | 693 (14.8%) |
Income Above Poverty by Sex and Age in Havre
According to the poverty statistics in Havre, males aged 5 years and females aged 15 years are the age groups that are most secure financially, with 100.0% of males and 100.0% of females in these age groups living above the poverty line.
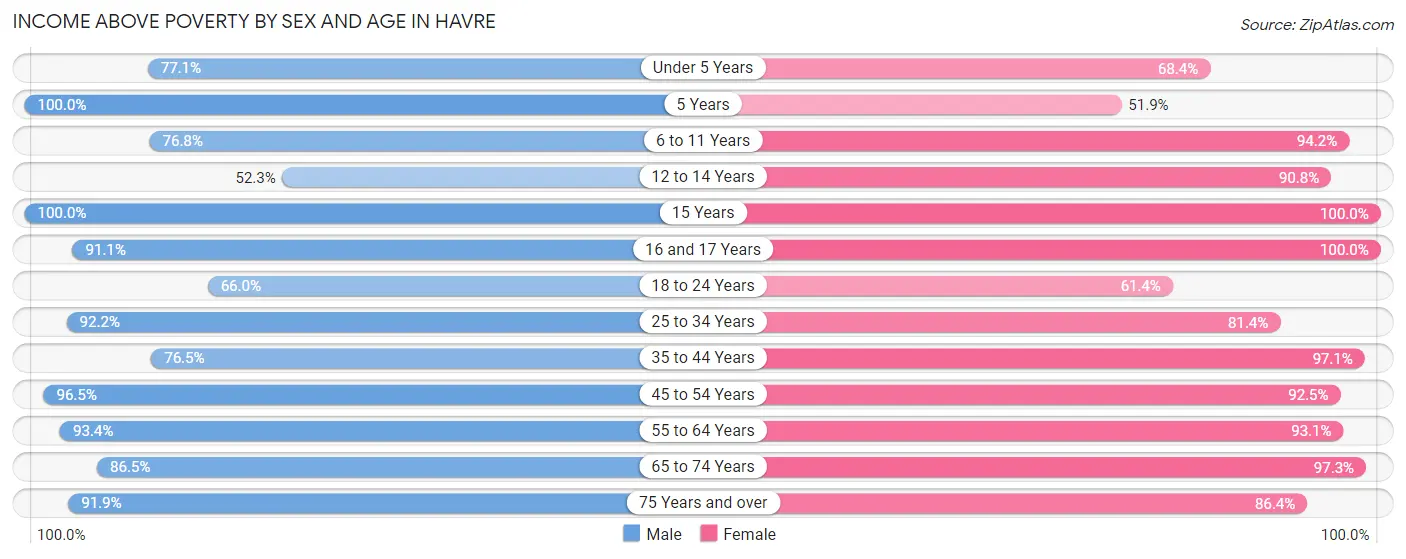
| Age Bracket | Male | Female |
| Under 5 Years | 317 (77.1%) | 352 (68.3%) |
| 5 Years | 42 (100.0%) | 41 (51.9%) |
| 6 to 11 Years | 354 (76.8%) | 467 (94.2%) |
| 12 to 14 Years | 34 (52.3%) | 158 (90.8%) |
| 15 Years | 15 (100.0%) | 48 (100.0%) |
| 16 and 17 Years | 92 (91.1%) | 71 (100.0%) |
| 18 to 24 Years | 231 (66.0%) | 304 (61.4%) |
| 25 to 34 Years | 791 (92.2%) | 532 (81.4%) |
| 35 to 44 Years | 377 (76.5%) | 527 (97.1%) |
| 45 to 54 Years | 356 (96.5%) | 347 (92.5%) |
| 55 to 64 Years | 440 (93.4%) | 404 (93.1%) |
| 65 to 74 Years | 405 (86.5%) | 429 (97.3%) |
| 75 Years and over | 204 (91.9%) | 304 (86.4%) |
| Total | 3,658 (84.6%) | 3,984 (85.2%) |
Income Below Poverty Among Married-Couple Families in Havre
The poverty statistics for married-couple families in Havre show that 3.0% or 48 of the total 1,606 families live below the poverty line. Families with no children have the highest poverty rate of 3.5%, comprising of 33 families. On the other hand, families with 3 or 4 children have the lowest poverty rate of 0.0%, which includes 0 families.
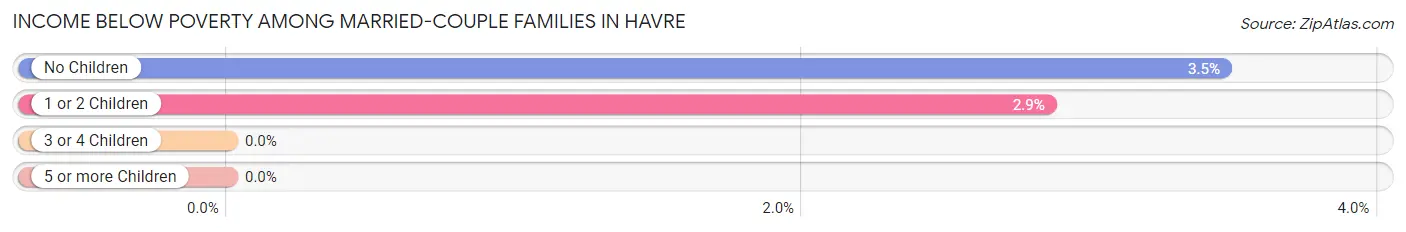
| Children | Above Poverty | Below Poverty |
| No Children | 922 (96.5%) | 33 (3.5%) |
| 1 or 2 Children | 512 (97.2%) | 15 (2.9%) |
| 3 or 4 Children | 124 (100.0%) | 0 (0.0%) |
| 5 or more Children | 0 (0.0%) | 0 (0.0%) |
| Total | 1,558 (97.0%) | 48 (3.0%) |
Income Below Poverty Among Single-Parent Households in Havre
According to the poverty data in Havre, 22.8% or 85 single-father households and 31.7% or 104 single-mother households are living below the poverty line. Among single-father households, those with 3 or 4 children have the highest poverty rate, with 22 households (100.0%) experiencing poverty. Likewise, among single-mother households, those with 5 or more children have the highest poverty rate, with 14 households (100.0%) falling below the poverty line.
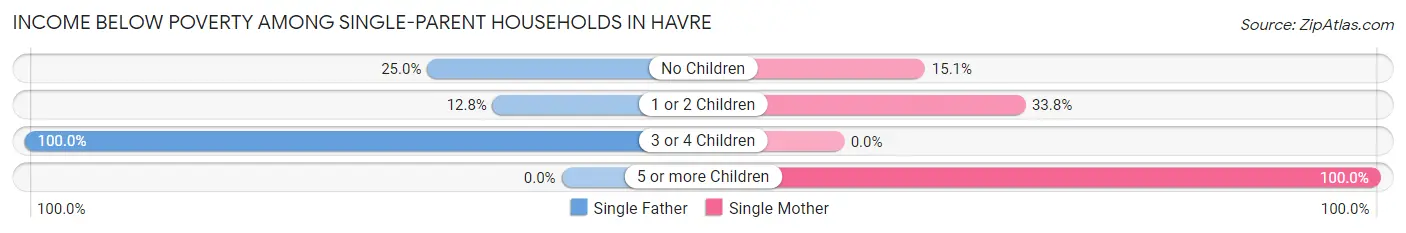
| Children | Single Father | Single Mother |
| No Children | 37 (25.0%) | 13 (15.1%) |
| 1 or 2 Children | 26 (12.8%) | 77 (33.8%) |
| 3 or 4 Children | 22 (100.0%) | 0 (0.0%) |
| 5 or more Children | 0 (0.0%) | 14 (100.0%) |
| Total | 85 (22.8%) | 104 (31.7%) |
Income Below Poverty Among Married-Couple vs Single-Parent Households in Havre
The poverty data for Havre shows that 48 of the married-couple family households (3.0%) and 189 of the single-parent households (27.0%) are living below the poverty level. Within the married-couple family households, those with no children have the highest poverty rate, with 33 households (3.5%) falling below the poverty line. Among the single-parent households, those with 3 or 4 children have the highest poverty rate, with 22 household (100.0%) living below poverty.
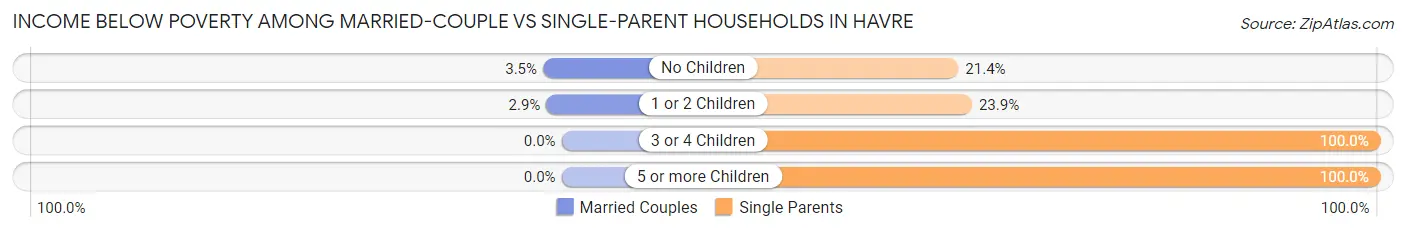
| Children | Married-Couple Families | Single-Parent Households |
| No Children | 33 (3.5%) | 50 (21.4%) |
| 1 or 2 Children | 15 (2.9%) | 103 (23.9%) |
| 3 or 4 Children | 0 (0.0%) | 22 (100.0%) |
| 5 or more Children | 0 (0.0%) | 14 (100.0%) |
| Total | 48 (3.0%) | 189 (27.0%) |
Race in Havre
The most populous races in Havre are White / Caucasian (7,421 | 79.5%), Native / Alaskan (1,167 | 12.5%), and Two or more Races (605 | 6.5%).
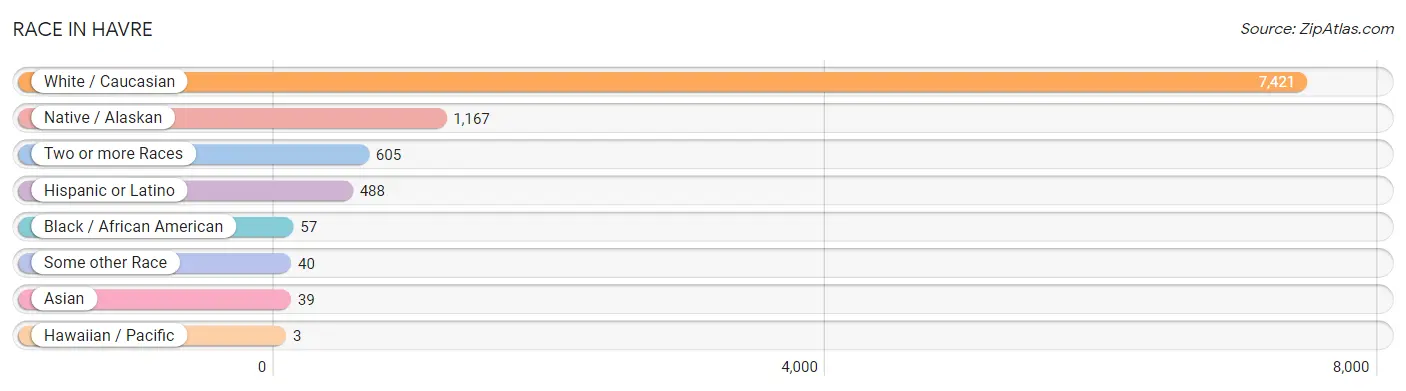
| Race | # Population | % Population |
| Asian | 39 | 0.4% |
| Black / African American | 57 | 0.6% |
| Hawaiian / Pacific | 3 | 0.0% |
| Hispanic or Latino | 488 | 5.2% |
| Native / Alaskan | 1,167 | 12.5% |
| White / Caucasian | 7,421 | 79.5% |
| Two or more Races | 605 | 6.5% |
| Some other Race | 40 | 0.4% |
| Total | 9,332 | 100.0% |
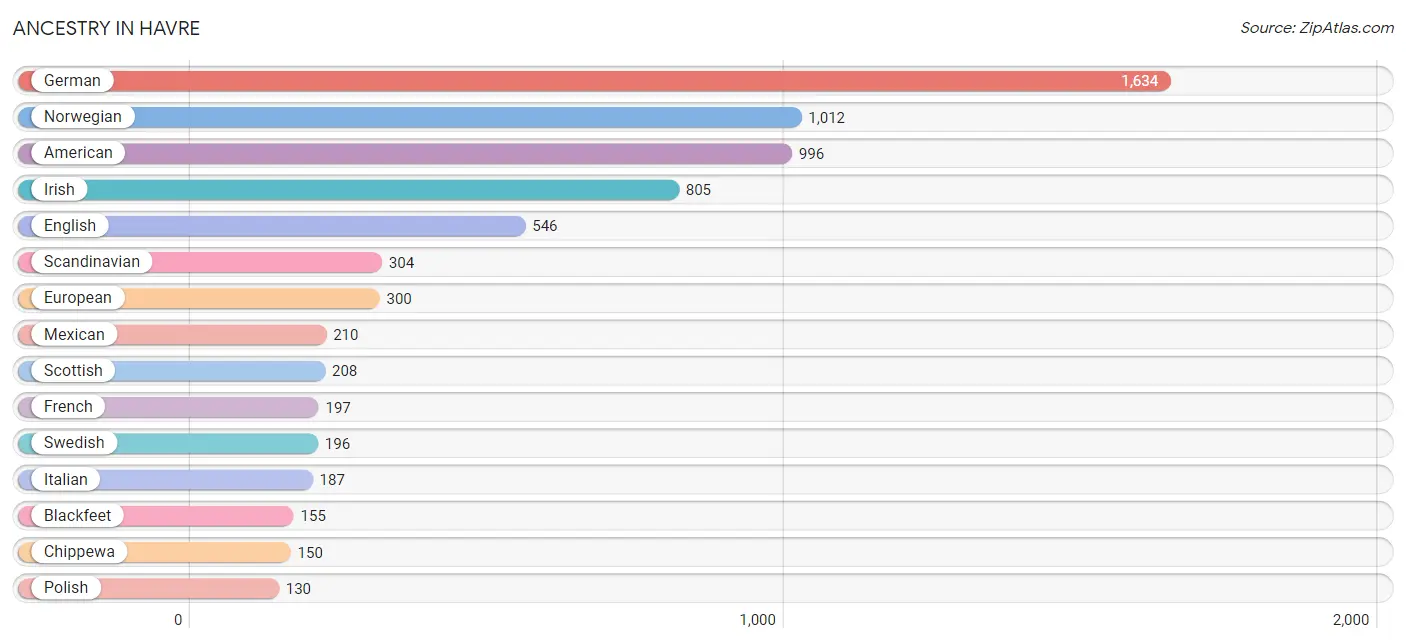
Ancestry in Havre
The most populous ancestries reported in Havre are German (1,634 | 17.5%), Norwegian (1,012 | 10.8%), American (996 | 10.7%), Irish (805 | 8.6%), and English (546 | 5.9%), together accounting for 53.5% of all Havre residents.
| Ancestry | # Population | % Population |
| American | 996 | 10.7% |
| Austrian | 10 | 0.1% |
| Belgian | 6 | 0.1% |
| Blackfeet | 155 | 1.7% |
| British | 27 | 0.3% |
| Central American | 74 | 0.8% |
| Cherokee | 43 | 0.5% |
| Chippewa | 150 | 1.6% |
| Choctaw | 14 | 0.2% |
| Colombian | 15 | 0.2% |
| Cree | 18 | 0.2% |
| Czech | 42 | 0.4% |
| Czechoslovakian | 47 | 0.5% |
| Danish | 100 | 1.1% |
| Dutch | 67 | 0.7% |
| Dutch West Indian | 54 | 0.6% |
| English | 546 | 5.9% |
| European | 300 | 3.2% |
| Filipino | 15 | 0.2% |
| Finnish | 26 | 0.3% |
| French | 197 | 2.1% |
| French Canadian | 128 | 1.4% |
| German | 1,634 | 17.5% |
| Guatemalan | 61 | 0.6% |
| Hungarian | 11 | 0.1% |
| Indian (Asian) | 67 | 0.7% |
| Irish | 805 | 8.6% |
| Italian | 187 | 2.0% |
| Korean | 9 | 0.1% |
| Mexican | 210 | 2.2% |
| Mexican American Indian | 67 | 0.7% |
| Native Hawaiian | 3 | 0.0% |
| Nigerian | 3 | 0.0% |
| Northern European | 55 | 0.6% |
| Norwegian | 1,012 | 10.8% |
| Polish | 130 | 1.4% |
| Puerto Rican | 28 | 0.3% |
| Romanian | 53 | 0.6% |
| Russian | 44 | 0.5% |
| Salvadoran | 13 | 0.1% |
| Scandinavian | 304 | 3.3% |
| Scotch-Irish | 17 | 0.2% |
| Scottish | 208 | 2.2% |
| Slavic | 24 | 0.3% |
| South American | 15 | 0.2% |
| Spaniard | 116 | 1.2% |
| Spanish | 45 | 0.5% |
| Sri Lankan | 39 | 0.4% |
| Subsaharan African | 3 | 0.0% |
| Swedish | 196 | 2.1% |
| Swiss | 71 | 0.8% |
| Ukrainian | 50 | 0.5% |
| Welsh | 55 | 0.6% |
| Yugoslavian | 9 | 0.1% | View All 54 Rows |
Immigrants in Havre
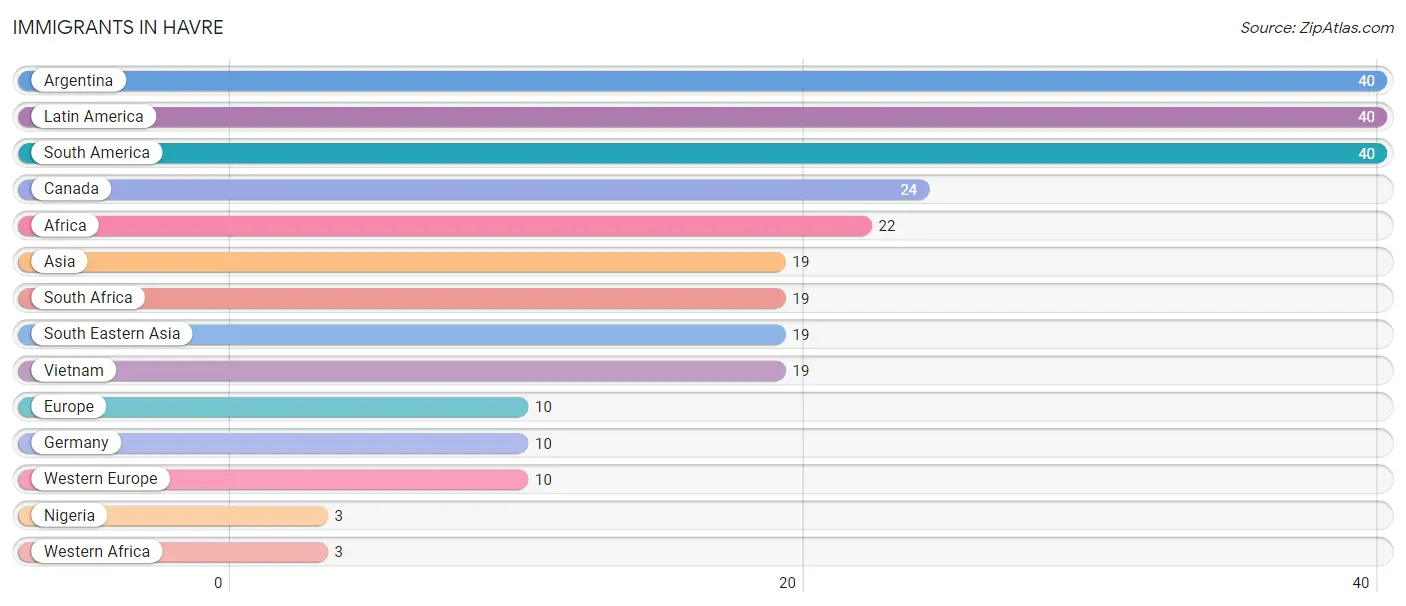
The most numerous immigrant groups reported in Havre came from Argentina (40 | 0.4%), Latin America (40 | 0.4%), South America (40 | 0.4%), Canada (24 | 0.3%), and Africa (22 | 0.2%), together accounting for 1.8% of all Havre residents.
| Immigration Origin | # Population | % Population |
| Africa | 22 | 0.2% |
| Argentina | 40 | 0.4% |
| Asia | 19 | 0.2% |
| Canada | 24 | 0.3% |
| Europe | 10 | 0.1% |
| Germany | 10 | 0.1% |
| Latin America | 40 | 0.4% |
| Nigeria | 3 | 0.0% |
| South Africa | 19 | 0.2% |
| South America | 40 | 0.4% |
| South Eastern Asia | 19 | 0.2% |
| Vietnam | 19 | 0.2% |
| Western Africa | 3 | 0.0% |
| Western Europe | 10 | 0.1% | View All 14 Rows |
Sex and Age in Havre
Sex and Age in Havre
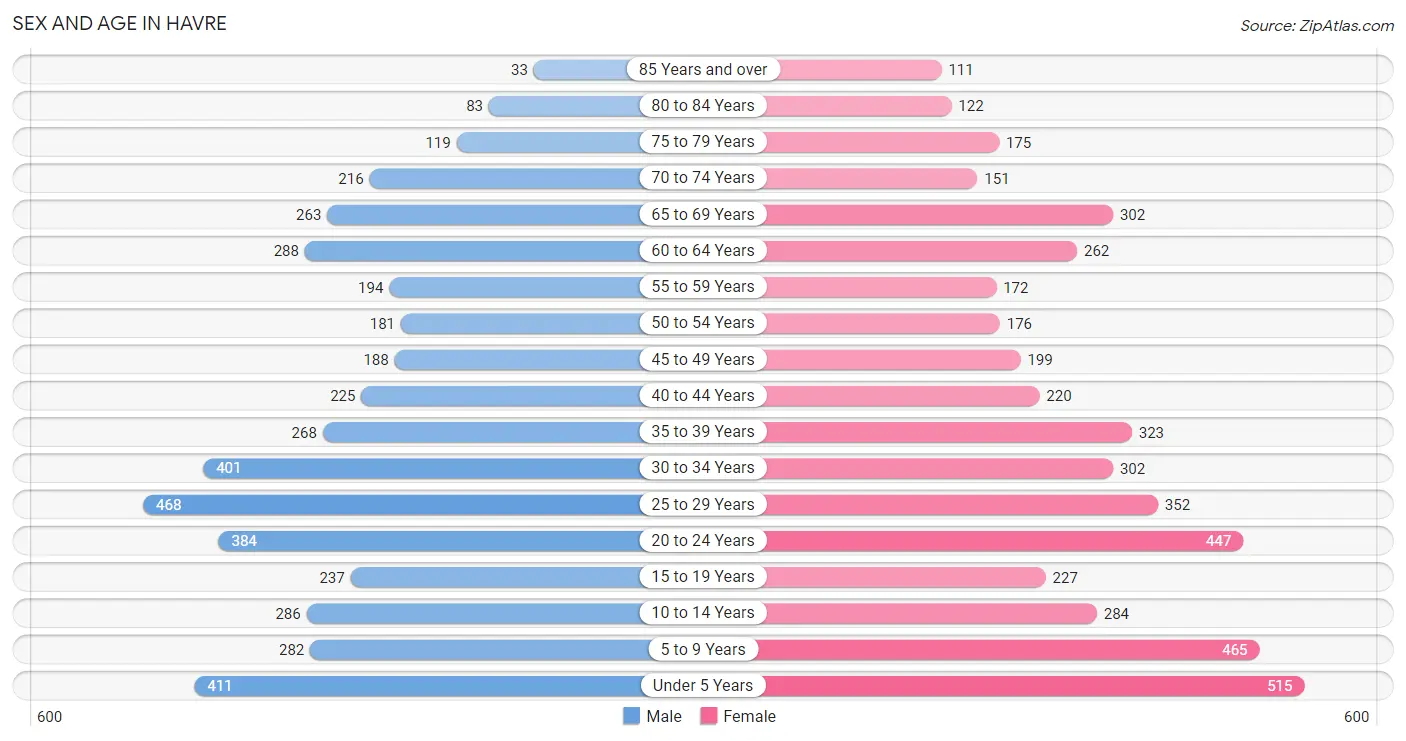
The most populous age groups in Havre are 25 to 29 Years (468 | 10.3%) for men and Under 5 Years (515 | 10.7%) for women.
| Age Bracket | Male | Female |
| Under 5 Years | 411 (9.1%) | 515 (10.7%) |
| 5 to 9 Years | 282 (6.2%) | 465 (9.7%) |
| 10 to 14 Years | 286 (6.3%) | 284 (5.9%) |
| 15 to 19 Years | 237 (5.2%) | 227 (4.7%) |
| 20 to 24 Years | 384 (8.5%) | 447 (9.3%) |
| 25 to 29 Years | 468 (10.3%) | 352 (7.3%) |
| 30 to 34 Years | 401 (8.9%) | 302 (6.3%) |
| 35 to 39 Years | 268 (5.9%) | 323 (6.7%) |
| 40 to 44 Years | 225 (5.0%) | 220 (4.6%) |
| 45 to 49 Years | 188 (4.2%) | 199 (4.1%) |
| 50 to 54 Years | 181 (4.0%) | 176 (3.7%) |
| 55 to 59 Years | 194 (4.3%) | 172 (3.6%) |
| 60 to 64 Years | 288 (6.4%) | 262 (5.4%) |
| 65 to 69 Years | 263 (5.8%) | 302 (6.3%) |
| 70 to 74 Years | 216 (4.8%) | 151 (3.1%) |
| 75 to 79 Years | 119 (2.6%) | 175 (3.6%) |
| 80 to 84 Years | 83 (1.8%) | 122 (2.5%) |
| 85 Years and over | 33 (0.7%) | 111 (2.3%) |
| Total | 4,527 (100.0%) | 4,805 (100.0%) |
Families and Households in Havre
Median Family Size in Havre
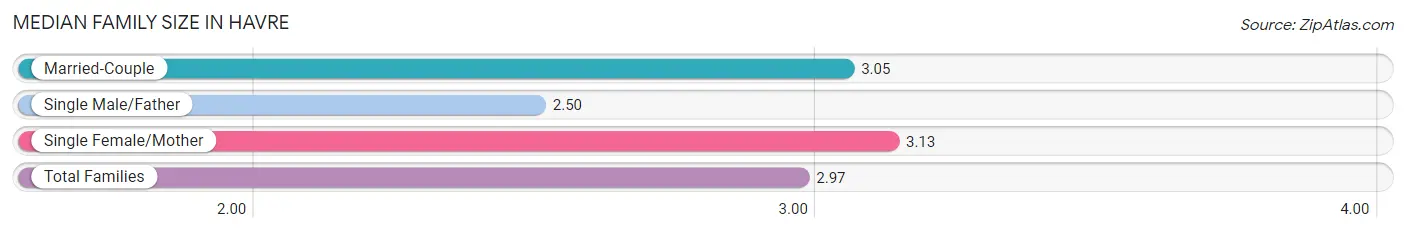
The median family size in Havre is 2.97 persons per family, with single female/mother families (328 | 14.2%) accounting for the largest median family size of 3.13 persons per family. On the other hand, single male/father families (373 | 16.2%) represent the smallest median family size with 2.50 persons per family.
| Family Type | # Families | Family Size |
| Married-Couple | 1,606 (69.6%) | 3.05 |
| Single Male/Father | 373 (16.2%) | 2.50 |
| Single Female/Mother | 328 (14.2%) | 3.13 |
| Total Families | 2,307 (100.0%) | 2.97 |
Median Household Size in Havre
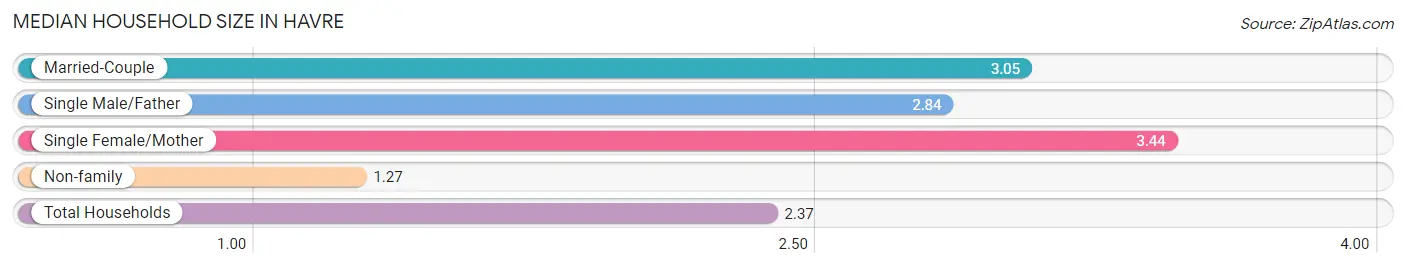
The median household size in Havre is 2.37 persons per household, with single female/mother households (328 | 8.7%) accounting for the largest median household size of 3.44 persons per household. non-family households (1,465 | 38.8%) represent the smallest median household size with 1.27 persons per household.
| Household Type | # Households | Household Size |
| Married-Couple | 1,606 (42.6%) | 3.05 |
| Single Male/Father | 373 (9.9%) | 2.84 |
| Single Female/Mother | 328 (8.7%) | 3.44 |
| Non-family | 1,465 (38.8%) | 1.27 |
| Total Households | 3,772 (100.0%) | 2.37 |
Household Size by Marriage Status in Havre
Out of a total of 3,772 households in Havre, 2,307 (61.2%) are family households, while 1,465 (38.8%) are nonfamily households. The most numerous type of family households are 2-person households, comprising 1,050, and the most common type of nonfamily households are 1-person households, comprising 1,204.
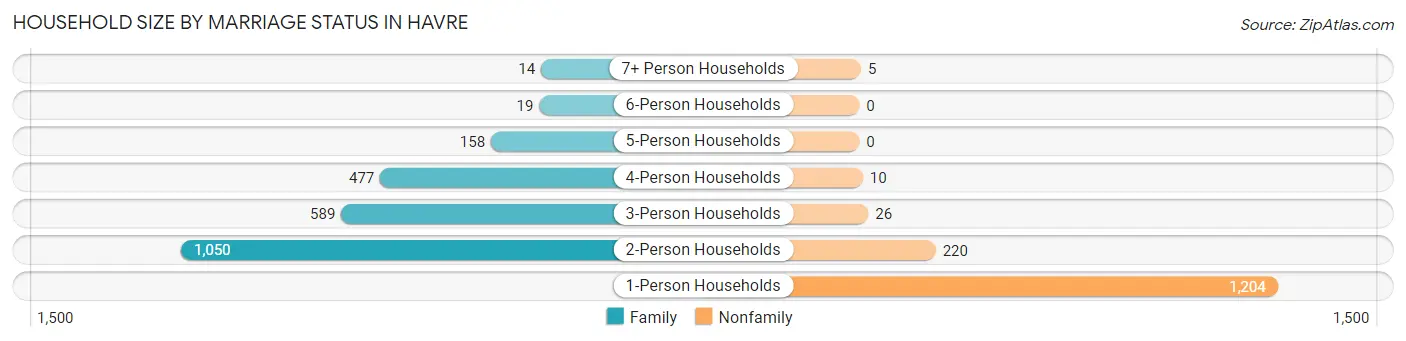
| Household Size | Family Households | Nonfamily Households |
| 1-Person Households | - | 1,204 (31.9%) |
| 2-Person Households | 1,050 (27.8%) | 220 (5.8%) |
| 3-Person Households | 589 (15.6%) | 26 (0.7%) |
| 4-Person Households | 477 (12.7%) | 10 (0.3%) |
| 5-Person Households | 158 (4.2%) | 0 (0.0%) |
| 6-Person Households | 19 (0.5%) | 0 (0.0%) |
| 7+ Person Households | 14 (0.4%) | 5 (0.1%) |
| Total | 2,307 (61.2%) | 1,465 (38.8%) |
Female Fertility in Havre
Fertility by Age in Havre
Average fertility rate in Havre is 63.0 births per 1,000 women. Women in the age bracket of 20 to 34 years have the highest fertility rate with 121.0 births per 1,000 women. Women in the age bracket of 20 to 34 years acount for 100.0% of all women with births.
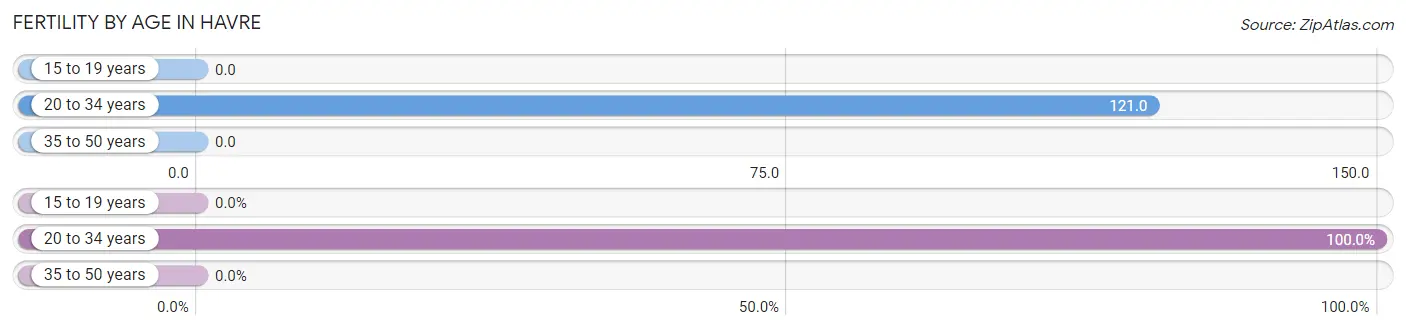
| Age Bracket | Women with Births | Births / 1,000 Women |
| 15 to 19 years | 0 (0.0%) | 0.0 |
| 20 to 34 years | 133 (100.0%) | 121.0 |
| 35 to 50 years | 0 (0.0%) | 0.0 |
| Total | 133 (100.0%) | 63.0 |
Fertility by Age by Marriage Status in Havre
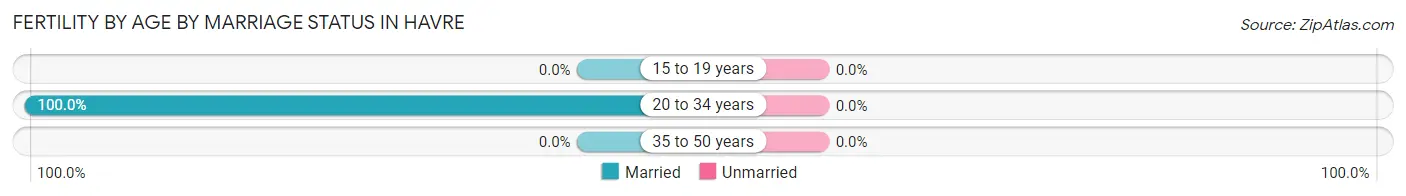
| Age Bracket | Married | Unmarried |
| 15 to 19 years | 0 (0.0%) | 0 (0.0%) |
| 20 to 34 years | 133 (100.0%) | 0 (0.0%) |
| 35 to 50 years | 0 (0.0%) | 0 (0.0%) |
| Total | 133 (100.0%) | 0 (0.0%) |
Fertility by Education in Havre
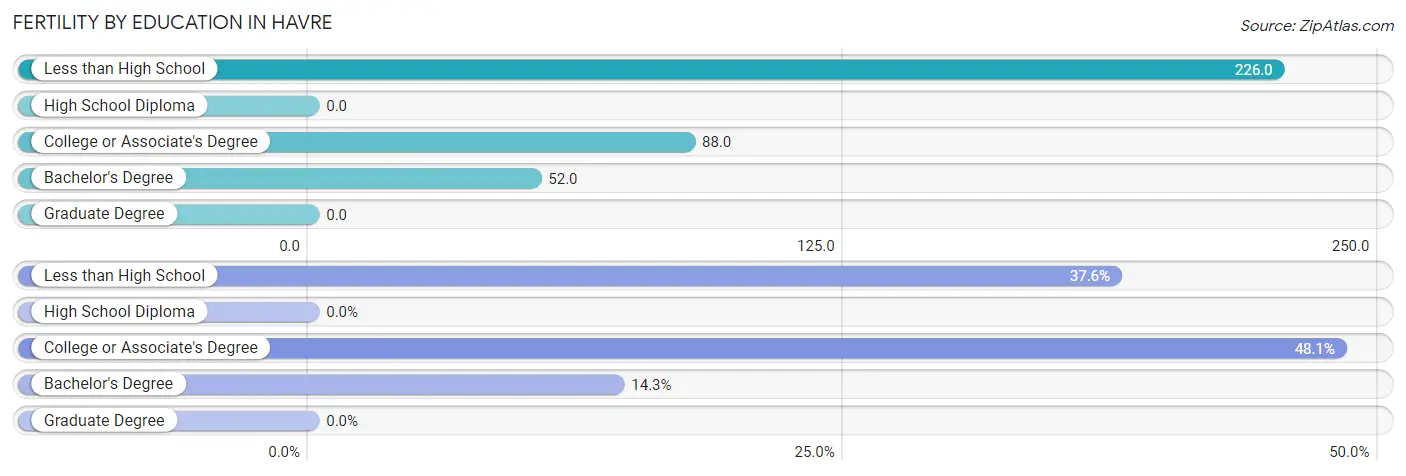
| Educational Attainment | Women with Births | Births / 1,000 Women |
| Less than High School | 50 (37.6%) | 226.0 |
| High School Diploma | 0 (0.0%) | 0.0 |
| College or Associate's Degree | 64 (48.1%) | 88.0 |
| Bachelor's Degree | 19 (14.3%) | 52.0 |
| Graduate Degree | 0 (0.0%) | 0.0 |
| Total | 133 (100.0%) | 63.0 |
Fertility by Education by Marriage Status in Havre
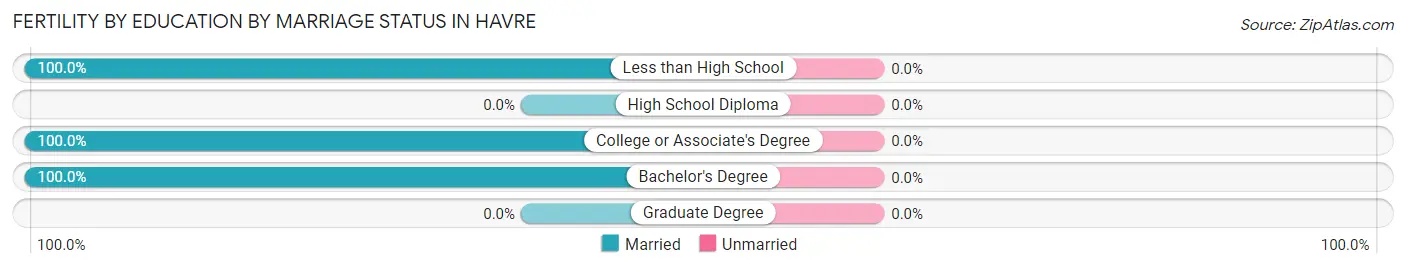
| Educational Attainment | Married | Unmarried |
| Less than High School | 50 (100.0%) | 0 (0.0%) |
| High School Diploma | 0 (0.0%) | 0 (0.0%) |
| College or Associate's Degree | 64 (100.0%) | 0 (0.0%) |
| Bachelor's Degree | 19 (100.0%) | 0 (0.0%) |
| Graduate Degree | 0 (0.0%) | 0 (0.0%) |
| Total | 133 (100.0%) | 0 (0.0%) |
Employment Characteristics in Havre
Employment by Class of Employer in Havre
Among the 4,605 employed individuals in Havre, private company employees (2,808 | 61.0%), local government employees (400 | 8.7%), and not-for-profit organizations (392 | 8.5%) make up the most common classes of employment.
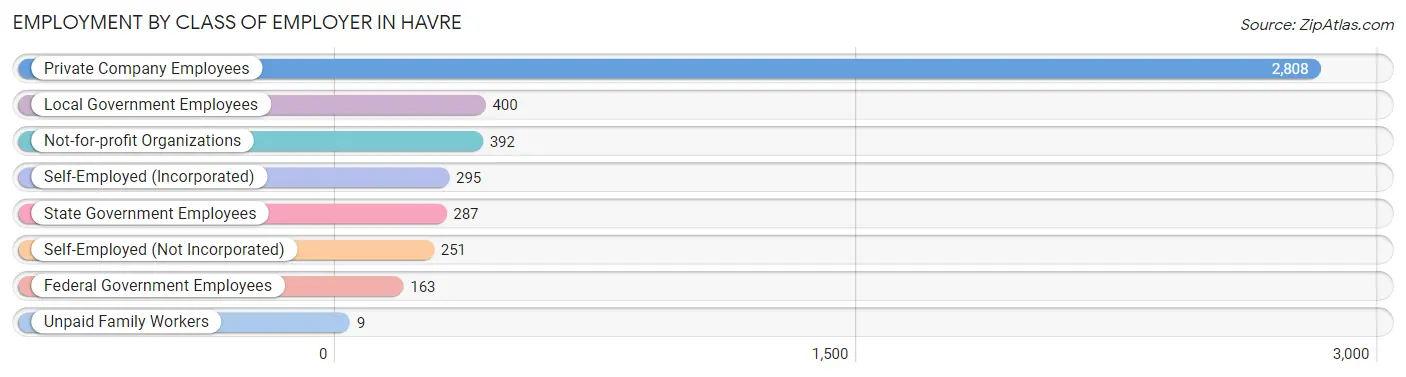
| Employer Class | # Employees | % Employees |
| Private Company Employees | 2,808 | 61.0% |
| Self-Employed (Incorporated) | 295 | 6.4% |
| Self-Employed (Not Incorporated) | 251 | 5.4% |
| Not-for-profit Organizations | 392 | 8.5% |
| Local Government Employees | 400 | 8.7% |
| State Government Employees | 287 | 6.2% |
| Federal Government Employees | 163 | 3.5% |
| Unpaid Family Workers | 9 | 0.2% |
| Total | 4,605 | 100.0% |
Employment Status by Age in Havre
According to the labor force statistics for Havre, out of the total population over 16 years of age (7,026), 68.3% or 4,799 individuals are in the labor force, with 3.2% or 154 of them unemployed. The age group with the highest labor force participation rate is 25 to 29 years, with 92.1% or 755 individuals in the labor force. Within the labor force, the 20 to 24 years age range has the highest percentage of unemployed individuals, with 7.5% or 51 of them being unemployed.
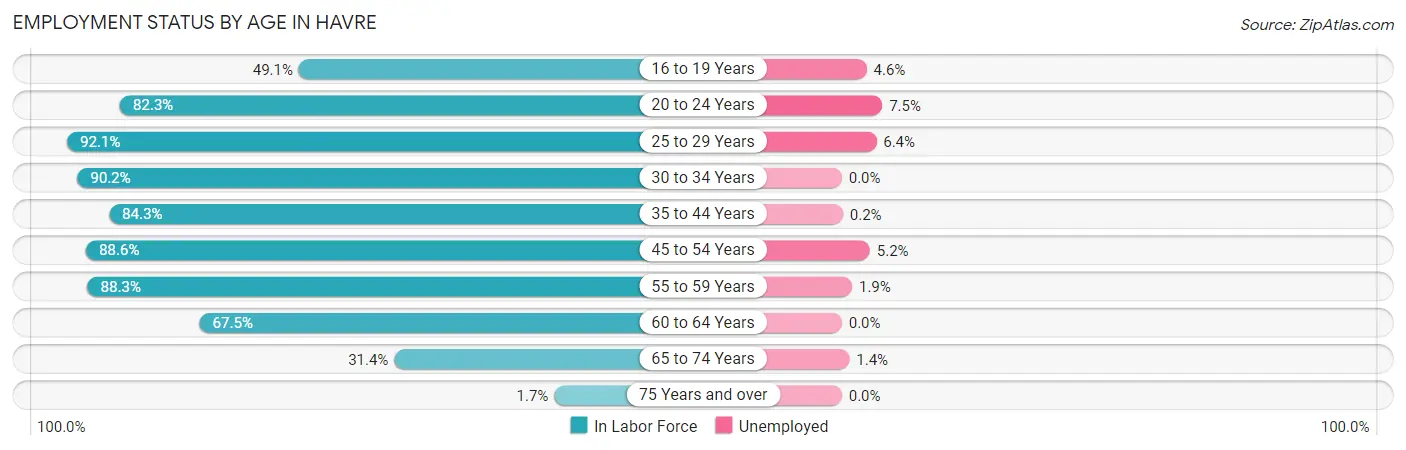
| Age Bracket | In Labor Force | Unemployed |
| 16 to 19 Years | 197 (49.1%) | 9 (4.6%) |
| 20 to 24 Years | 684 (82.3%) | 51 (7.5%) |
| 25 to 29 Years | 755 (92.1%) | 48 (6.4%) |
| 30 to 34 Years | 634 (90.2%) | 0 (0.0%) |
| 35 to 44 Years | 873 (84.3%) | 2 (0.2%) |
| 45 to 54 Years | 659 (88.6%) | 34 (5.2%) |
| 55 to 59 Years | 323 (88.3%) | 6 (1.9%) |
| 60 to 64 Years | 371 (67.5%) | 0 (0.0%) |
| 65 to 74 Years | 293 (31.4%) | 4 (1.4%) |
| 75 Years and over | 11 (1.7%) | 0 (0.0%) |
| Total | 4,799 (68.3%) | 154 (3.2%) |
Employment Status by Educational Attainment in Havre
According to labor force statistics for Havre, 85.7% of individuals (3,616) out of the total population between 25 and 64 years of age (4,219) are in the labor force, with 2.5% or 90 of them being unemployed. The group with the highest labor force participation rate are those with the educational attainment of bachelor's degree or higher, with 94.3% or 1,143 individuals in the labor force. Within the labor force, individuals with college / associate degree education have the highest percentage of unemployment, with 6.6% or 78 of them being unemployed.
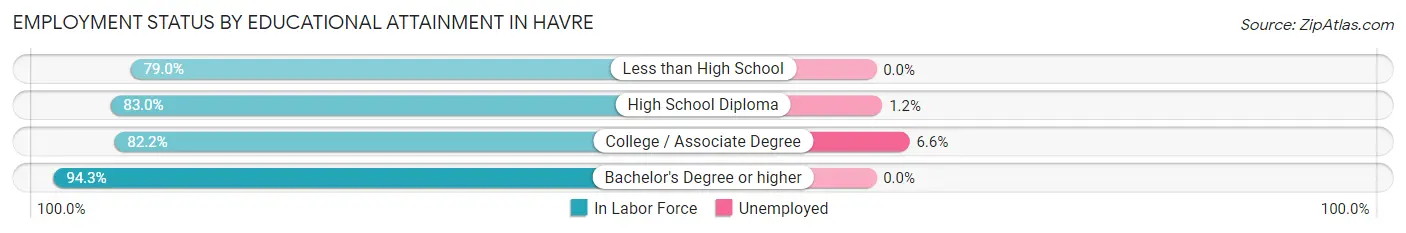
| Educational Attainment | In Labor Force | Unemployed |
| Less than High School | 244 (79.0%) | 0 (0.0%) |
| High School Diploma | 1,043 (83.0%) | 15 (1.2%) |
| College / Associate Degree | 1,185 (82.2%) | 95 (6.6%) |
| Bachelor's Degree or higher | 1,143 (94.3%) | 0 (0.0%) |
| Total | 3,616 (85.7%) | 105 (2.5%) |
Employment Occupations by Sex in Havre
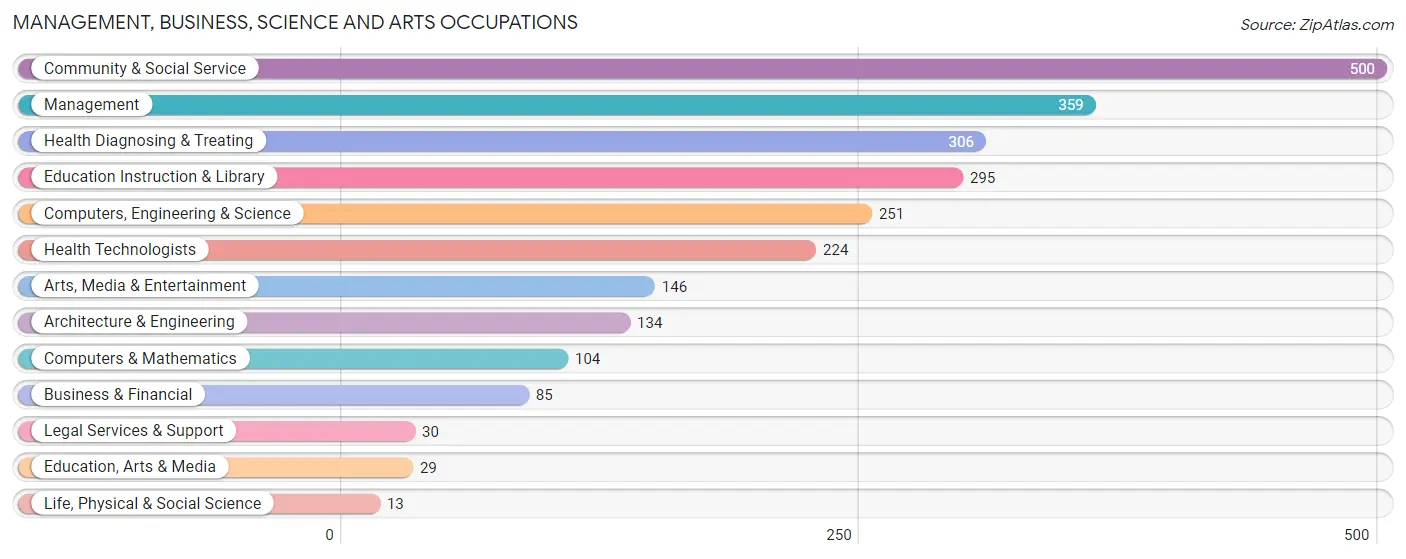
Management, Business, Science and Arts Occupations
The most common Management, Business, Science and Arts occupations in Havre are Community & Social Service (500 | 10.8%), Management (359 | 7.7%), Health Diagnosing & Treating (306 | 6.6%), Education Instruction & Library (295 | 6.4%), and Computers, Engineering & Science (251 | 5.4%).
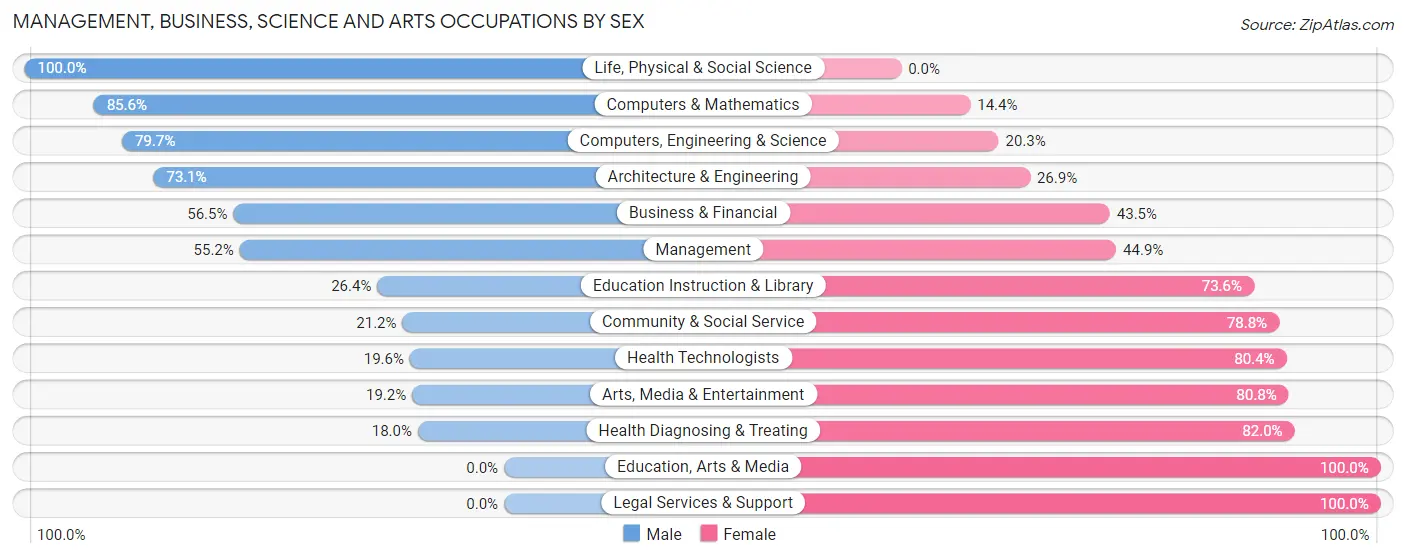
Management, Business, Science and Arts Occupations by Sex
Within the Management, Business, Science and Arts occupations in Havre, the most male-oriented occupations are Life, Physical & Social Science (100.0%), Computers & Mathematics (85.6%), and Computers, Engineering & Science (79.7%), while the most female-oriented occupations are Education, Arts & Media (100.0%), Legal Services & Support (100.0%), and Health Diagnosing & Treating (82.0%).
| Occupation | Male | Female |
| Management | 198 (55.1%) | 161 (44.9%) |
| Business & Financial | 48 (56.5%) | 37 (43.5%) |
| Computers, Engineering & Science | 200 (79.7%) | 51 (20.3%) |
| Computers & Mathematics | 89 (85.6%) | 15 (14.4%) |
| Architecture & Engineering | 98 (73.1%) | 36 (26.9%) |
| Life, Physical & Social Science | 13 (100.0%) | 0 (0.0%) |
| Community & Social Service | 106 (21.2%) | 394 (78.8%) |
| Education, Arts & Media | 0 (0.0%) | 29 (100.0%) |
| Legal Services & Support | 0 (0.0%) | 30 (100.0%) |
| Education Instruction & Library | 78 (26.4%) | 217 (73.6%) |
| Arts, Media & Entertainment | 28 (19.2%) | 118 (80.8%) |
| Health Diagnosing & Treating | 55 (18.0%) | 251 (82.0%) |
| Health Technologists | 44 (19.6%) | 180 (80.4%) |
| Total (Category) | 607 (40.4%) | 894 (59.6%) |
| Total (Overall) | 2,383 (51.3%) | 2,263 (48.7%) |
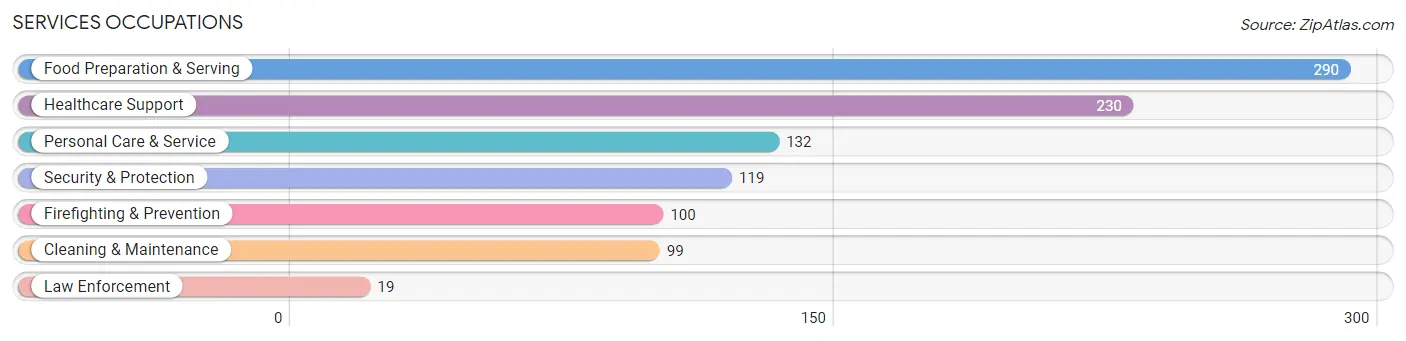
Services Occupations
The most common Services occupations in Havre are Food Preparation & Serving (290 | 6.2%), Healthcare Support (230 | 5.0%), Personal Care & Service (132 | 2.8%), Security & Protection (119 | 2.6%), and Firefighting & Prevention (100 | 2.1%).
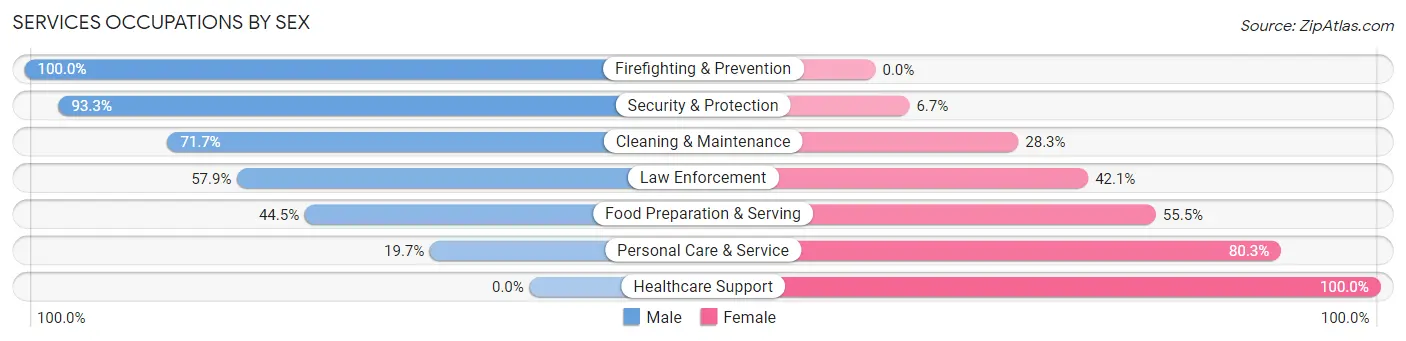
Services Occupations by Sex
Within the Services occupations in Havre, the most male-oriented occupations are Firefighting & Prevention (100.0%), Security & Protection (93.3%), and Cleaning & Maintenance (71.7%), while the most female-oriented occupations are Healthcare Support (100.0%), Personal Care & Service (80.3%), and Food Preparation & Serving (55.5%).
| Occupation | Male | Female |
| Healthcare Support | 0 (0.0%) | 230 (100.0%) |
| Security & Protection | 111 (93.3%) | 8 (6.7%) |
| Firefighting & Prevention | 100 (100.0%) | 0 (0.0%) |
| Law Enforcement | 11 (57.9%) | 8 (42.1%) |
| Food Preparation & Serving | 129 (44.5%) | 161 (55.5%) |
| Cleaning & Maintenance | 71 (71.7%) | 28 (28.3%) |
| Personal Care & Service | 26 (19.7%) | 106 (80.3%) |
| Total (Category) | 337 (38.7%) | 533 (61.3%) |
| Total (Overall) | 2,383 (51.3%) | 2,263 (48.7%) |
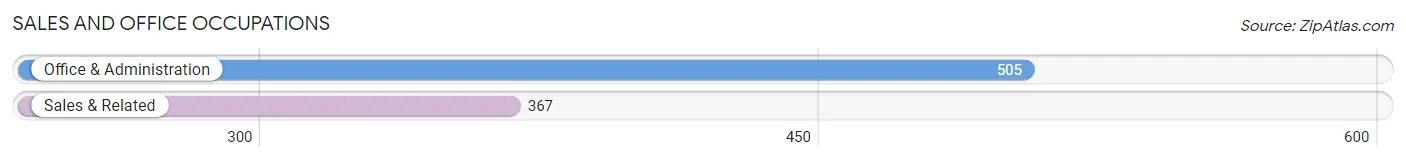
Sales and Office Occupations
The most common Sales and Office occupations in Havre are Office & Administration (505 | 10.9%), and Sales & Related (367 | 7.9%).
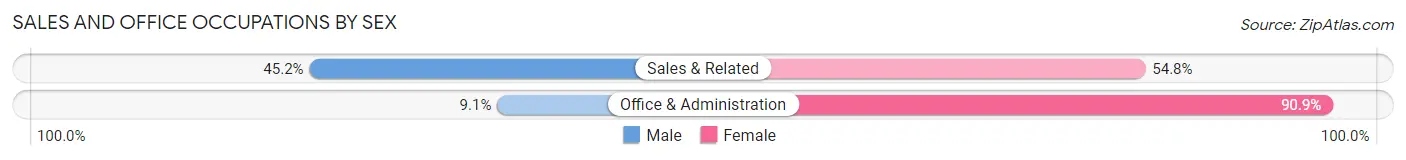
Sales and Office Occupations by Sex
| Occupation | Male | Female |
| Sales & Related | 166 (45.2%) | 201 (54.8%) |
| Office & Administration | 46 (9.1%) | 459 (90.9%) |
| Total (Category) | 212 (24.3%) | 660 (75.7%) |
| Total (Overall) | 2,383 (51.3%) | 2,263 (48.7%) |
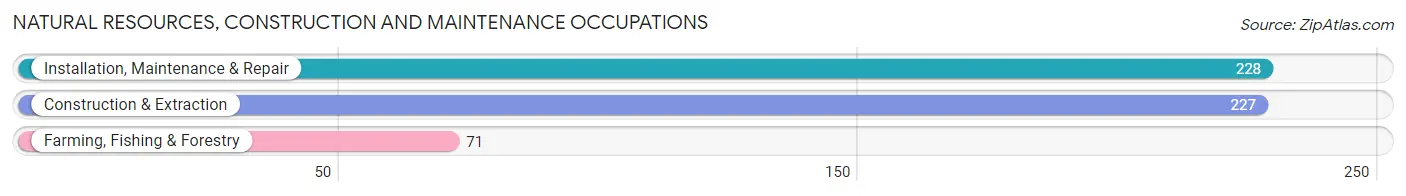
Natural Resources, Construction and Maintenance Occupations
The most common Natural Resources, Construction and Maintenance occupations in Havre are Installation, Maintenance & Repair (228 | 4.9%), Construction & Extraction (227 | 4.9%), and Farming, Fishing & Forestry (71 | 1.5%).
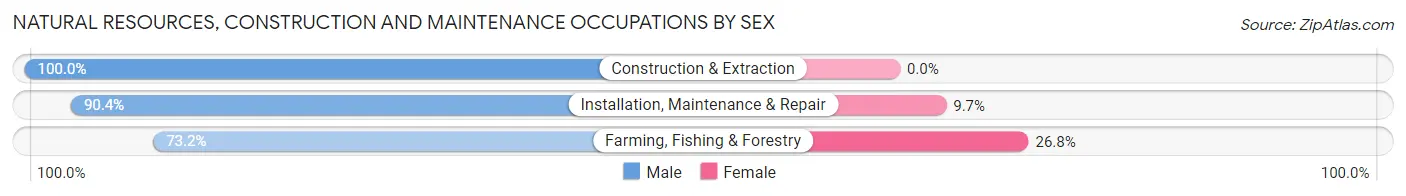
Natural Resources, Construction and Maintenance Occupations by Sex
| Occupation | Male | Female |
| Farming, Fishing & Forestry | 52 (73.2%) | 19 (26.8%) |
| Construction & Extraction | 227 (100.0%) | 0 (0.0%) |
| Installation, Maintenance & Repair | 206 (90.3%) | 22 (9.7%) |
| Total (Category) | 485 (92.2%) | 41 (7.8%) |
| Total (Overall) | 2,383 (51.3%) | 2,263 (48.7%) |
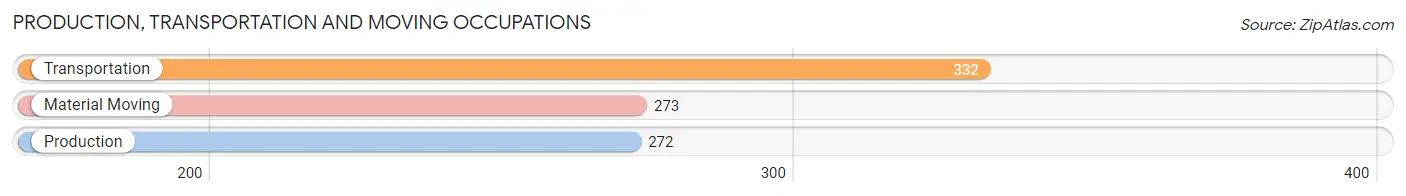
Production, Transportation and Moving Occupations
The most common Production, Transportation and Moving occupations in Havre are Transportation (332 | 7.1%), Material Moving (273 | 5.9%), and Production (272 | 5.9%).
Production, Transportation and Moving Occupations by Sex
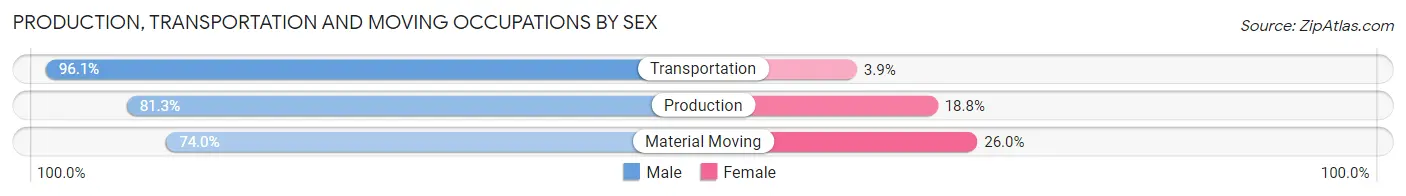
| Occupation | Male | Female |
| Production | 221 (81.2%) | 51 (18.8%) |
| Transportation | 319 (96.1%) | 13 (3.9%) |
| Material Moving | 202 (74.0%) | 71 (26.0%) |
| Total (Category) | 742 (84.6%) | 135 (15.4%) |
| Total (Overall) | 2,383 (51.3%) | 2,263 (48.7%) |
Employment Industries by Sex in Havre
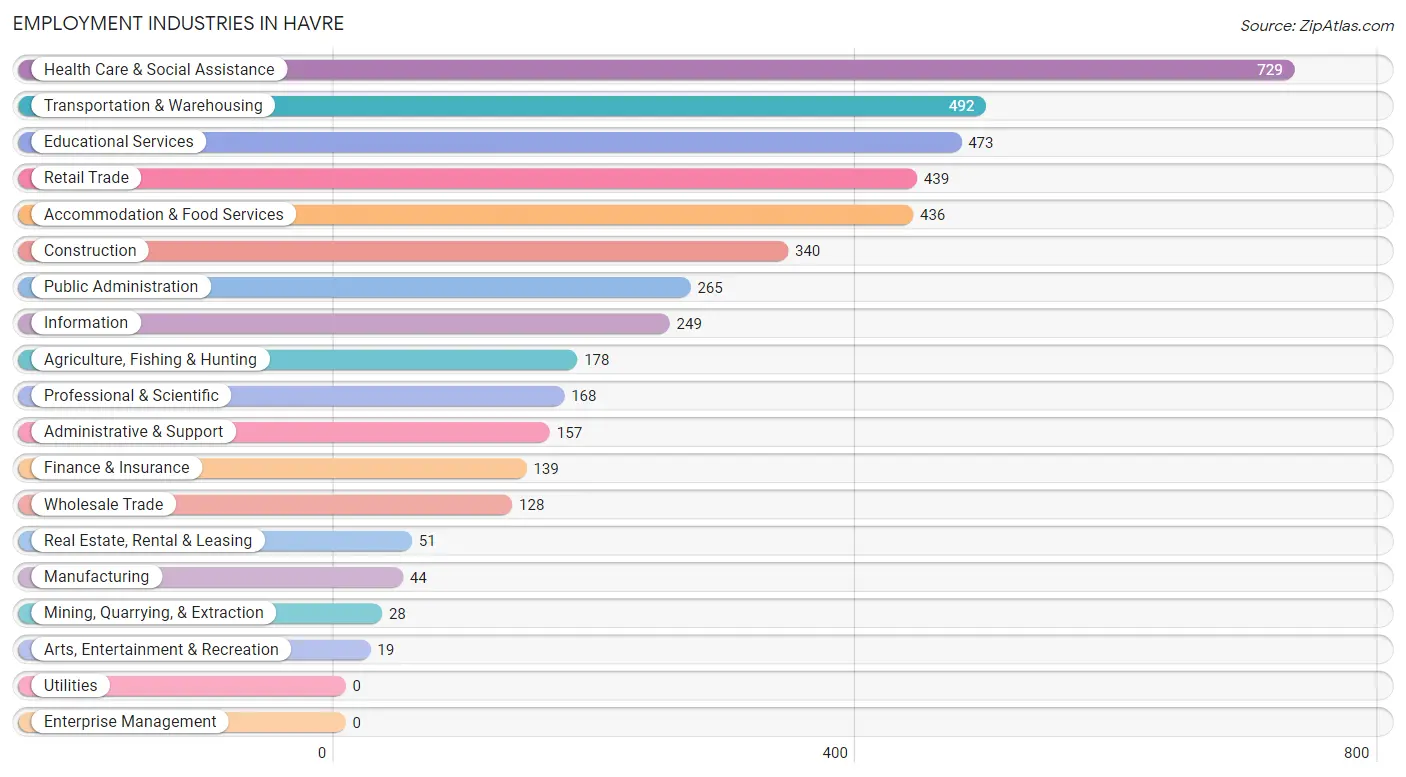
Employment Industries in Havre
The major employment industries in Havre include Health Care & Social Assistance (729 | 15.7%), Transportation & Warehousing (492 | 10.6%), Educational Services (473 | 10.2%), Retail Trade (439 | 9.5%), and Accommodation & Food Services (436 | 9.4%).
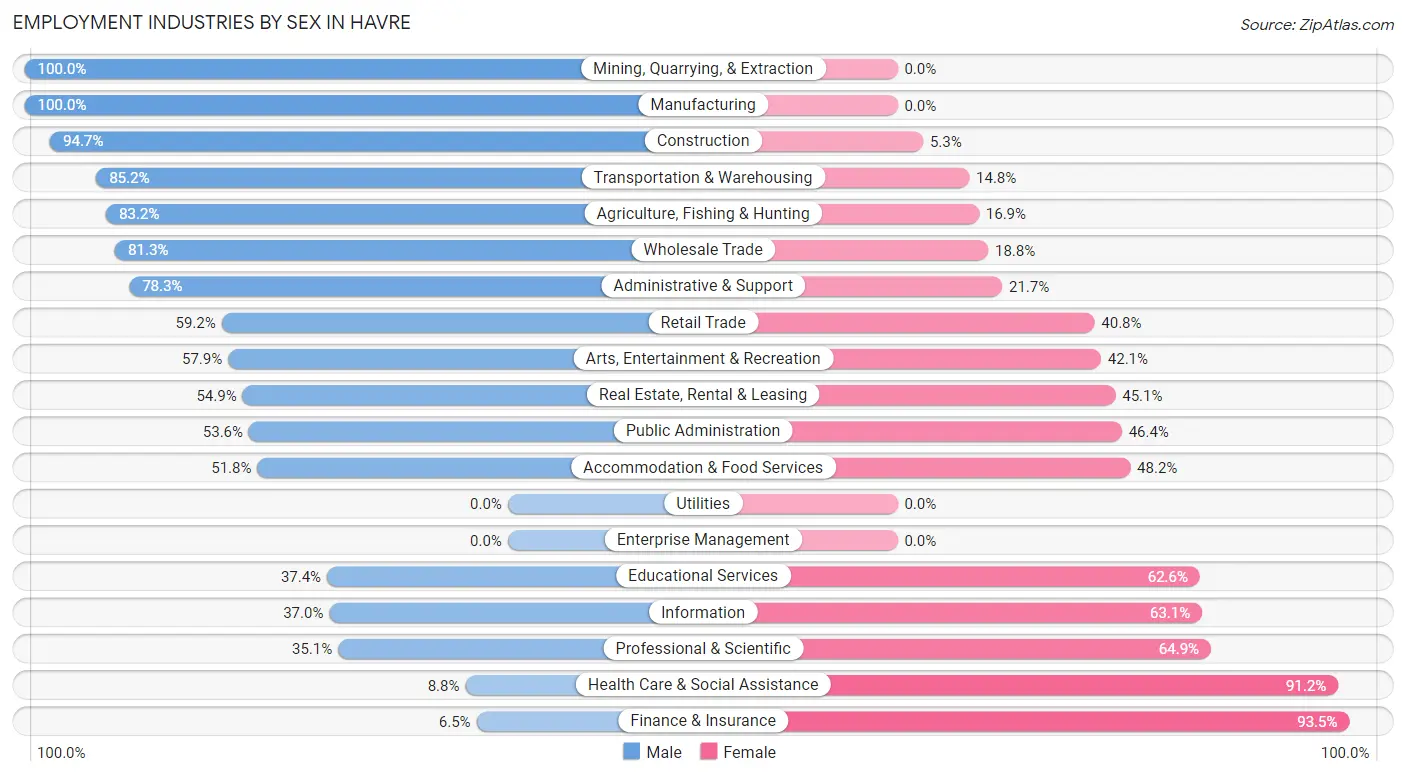
Employment Industries by Sex in Havre
The Havre industries that see more men than women are Mining, Quarrying, & Extraction (100.0%), Manufacturing (100.0%), and Construction (94.7%), whereas the industries that tend to have a higher number of women are Finance & Insurance (93.5%), Health Care & Social Assistance (91.2%), and Professional & Scientific (64.9%).
| Industry | Male | Female |
| Agriculture, Fishing & Hunting | 148 (83.2%) | 30 (16.9%) |
| Mining, Quarrying, & Extraction | 28 (100.0%) | 0 (0.0%) |
| Construction | 322 (94.7%) | 18 (5.3%) |
| Manufacturing | 44 (100.0%) | 0 (0.0%) |
| Wholesale Trade | 104 (81.2%) | 24 (18.8%) |
| Retail Trade | 260 (59.2%) | 179 (40.8%) |
| Transportation & Warehousing | 419 (85.2%) | 73 (14.8%) |
| Utilities | 0 (0.0%) | 0 (0.0%) |
| Information | 92 (36.9%) | 157 (63.0%) |
| Finance & Insurance | 9 (6.5%) | 130 (93.5%) |
| Real Estate, Rental & Leasing | 28 (54.9%) | 23 (45.1%) |
| Professional & Scientific | 59 (35.1%) | 109 (64.9%) |
| Enterprise Management | 0 (0.0%) | 0 (0.0%) |
| Administrative & Support | 123 (78.3%) | 34 (21.7%) |
| Educational Services | 177 (37.4%) | 296 (62.6%) |
| Health Care & Social Assistance | 64 (8.8%) | 665 (91.2%) |
| Arts, Entertainment & Recreation | 11 (57.9%) | 8 (42.1%) |
| Accommodation & Food Services | 226 (51.8%) | 210 (48.2%) |
| Public Administration | 142 (53.6%) | 123 (46.4%) |
| Total | 2,383 (51.3%) | 2,263 (48.7%) |
Education in Havre
School Enrollment in Havre
The most common levels of schooling among the 2,408 students in Havre are college / undergraduate (700 | 29.1%), elementary school (605 | 25.1%), and middle school (493 | 20.5%).
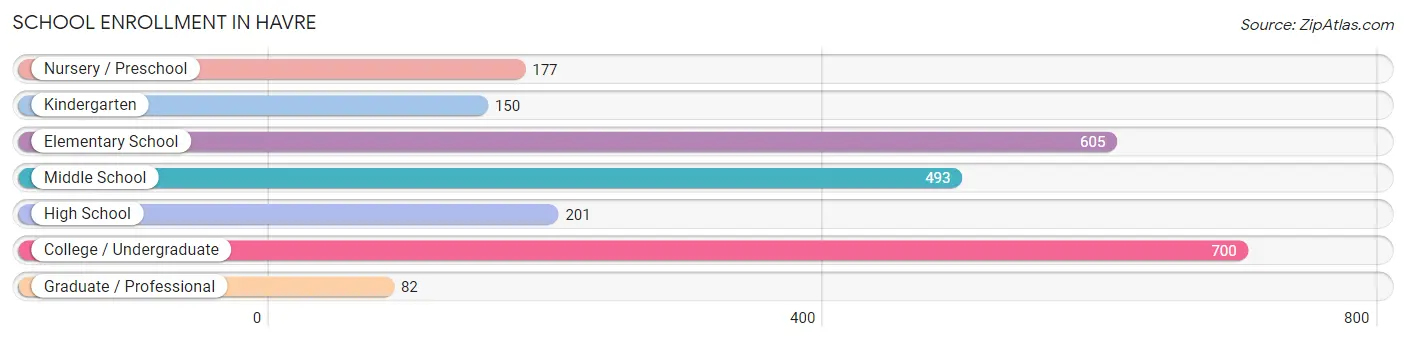
| School Level | # Students | % Students |
| Nursery / Preschool | 177 | 7.3% |
| Kindergarten | 150 | 6.2% |
| Elementary School | 605 | 25.1% |
| Middle School | 493 | 20.5% |
| High School | 201 | 8.4% |
| College / Undergraduate | 700 | 29.1% |
| Graduate / Professional | 82 | 3.4% |
| Total | 2,408 | 100.0% |
School Enrollment by Age by Funding Source in Havre
Out of a total of 2,408 students who are enrolled in schools in Havre, 159 (6.6%) attend a private institution, while the remaining 2,249 (93.4%) are enrolled in public schools. The age group of 35 years and over has the highest likelihood of being enrolled in private schools, with 41 (24.1% in the age bracket) enrolled. Conversely, the age group of 15 to 17 year olds has the lowest likelihood of being enrolled in a private school, with 188 (100.0% in the age bracket) attending a public institution.
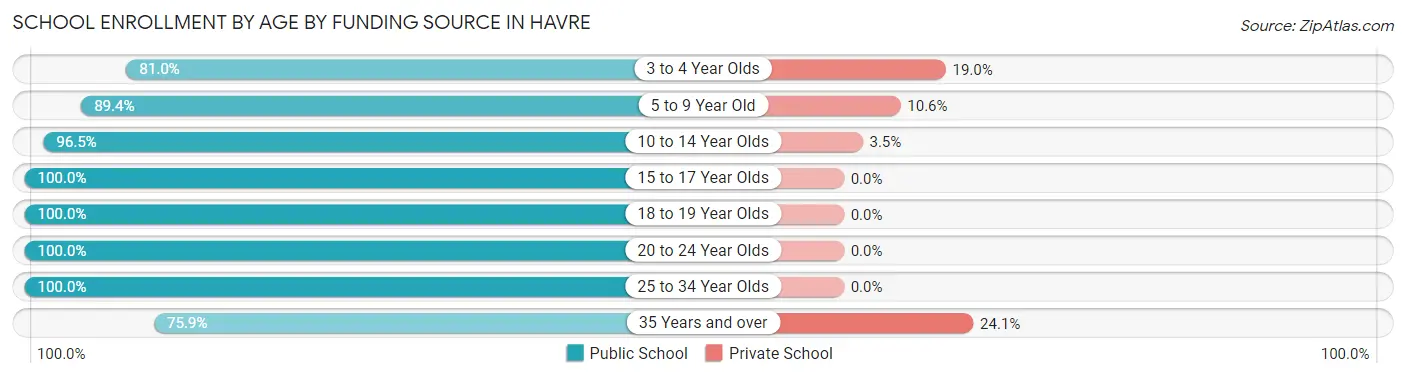
| Age Bracket | Public School | Private School |
| 3 to 4 Year Olds | 94 (81.0%) | 22 (19.0%) |
| 5 to 9 Year Old | 652 (89.4%) | 77 (10.6%) |
| 10 to 14 Year Olds | 550 (96.5%) | 20 (3.5%) |
| 15 to 17 Year Olds | 188 (100.0%) | 0 (0.0%) |
| 18 to 19 Year Olds | 216 (100.0%) | 0 (0.0%) |
| 20 to 24 Year Olds | 341 (100.0%) | 0 (0.0%) |
| 25 to 34 Year Olds | 78 (100.0%) | 0 (0.0%) |
| 35 Years and over | 129 (75.9%) | 41 (24.1%) |
| Total | 2,249 (93.4%) | 159 (6.6%) |
Educational Attainment by Field of Study in Havre
Education (363 | 21.5%), science & technology (305 | 18.1%), business (257 | 15.2%), psychology (132 | 7.8%), and physical & health sciences (129 | 7.7%) are the most common fields of study among 1,685 individuals in Havre who have obtained a bachelor's degree or higher.
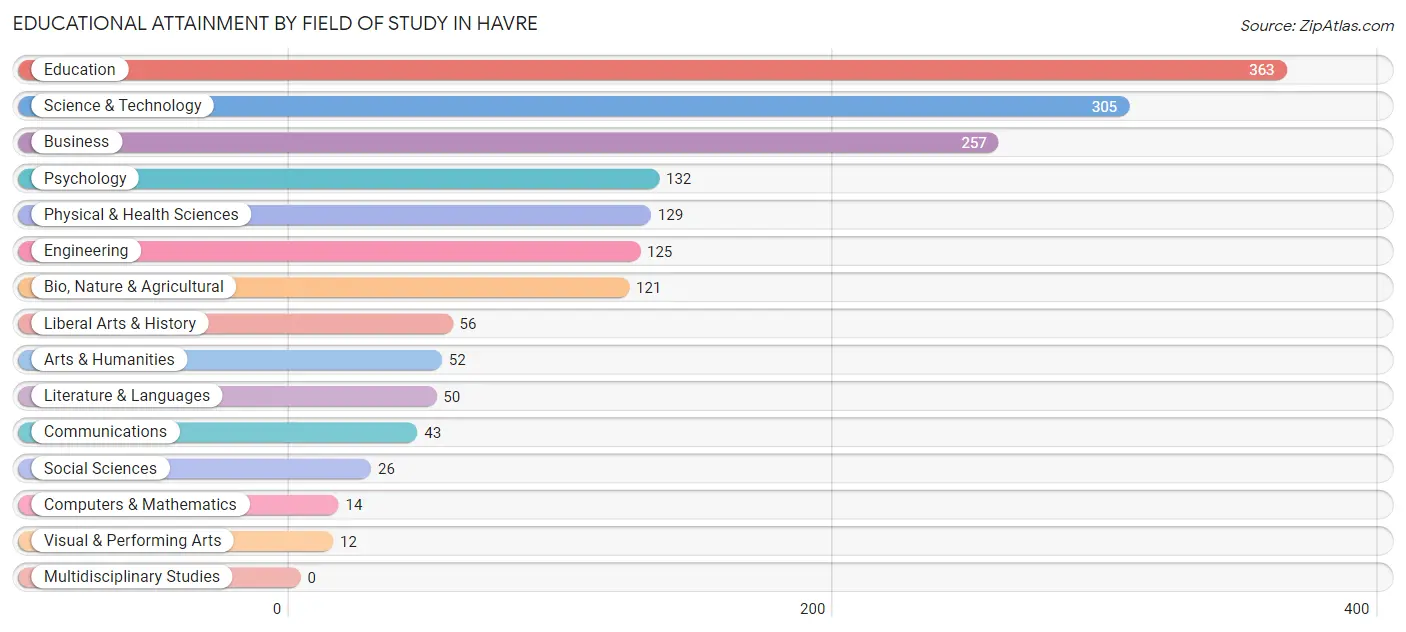
| Field of Study | # Graduates | % Graduates |
| Computers & Mathematics | 14 | 0.8% |
| Bio, Nature & Agricultural | 121 | 7.2% |
| Physical & Health Sciences | 129 | 7.7% |
| Psychology | 132 | 7.8% |
| Social Sciences | 26 | 1.5% |
| Engineering | 125 | 7.4% |
| Multidisciplinary Studies | 0 | 0.0% |
| Science & Technology | 305 | 18.1% |
| Business | 257 | 15.2% |
| Education | 363 | 21.5% |
| Literature & Languages | 50 | 3.0% |
| Liberal Arts & History | 56 | 3.3% |
| Visual & Performing Arts | 12 | 0.7% |
| Communications | 43 | 2.5% |
| Arts & Humanities | 52 | 3.1% |
| Total | 1,685 | 100.0% |
Transportation & Commute in Havre
Vehicle Availability by Sex in Havre
The most prevalent vehicle ownership categories in Havre are males with 2 vehicles (1,012, accounting for 43.7%) and females with 2 vehicles (793, making up 46.4%).
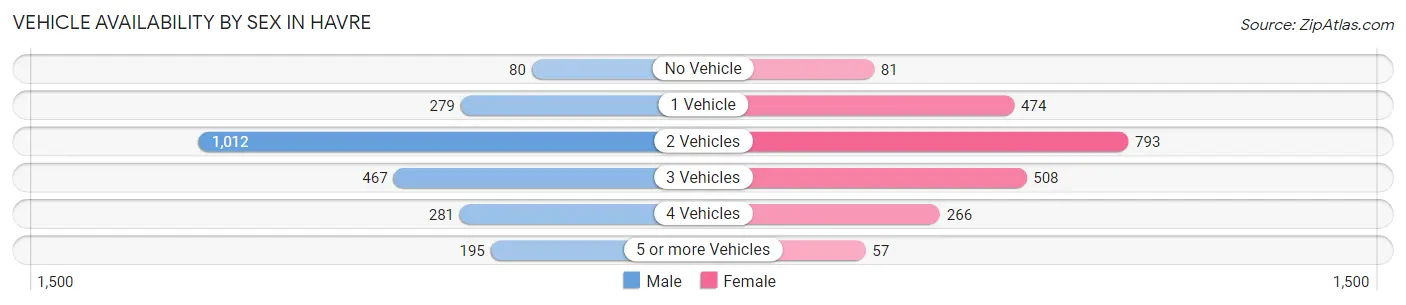
| Vehicles Available | Male | Female |
| No Vehicle | 80 (3.5%) | 81 (3.7%) |
| 1 Vehicle | 279 (12.1%) | 474 (21.7%) |
| 2 Vehicles | 1,012 (43.7%) | 793 (36.4%) |
| 3 Vehicles | 467 (20.2%) | 508 (23.3%) |
| 4 Vehicles | 281 (12.1%) | 266 (12.2%) |
| 5 or more Vehicles | 195 (8.4%) | 57 (2.6%) |
| Total | 2,314 (100.0%) | 2,179 (100.0%) |
Commute Time in Havre
The most frequently occuring commute durations in Havre are 5 to 9 minutes (1,745 commuters, 39.0%), 10 to 14 minutes (1,102 commuters, 24.6%), and 15 to 19 minutes (695 commuters, 15.5%).
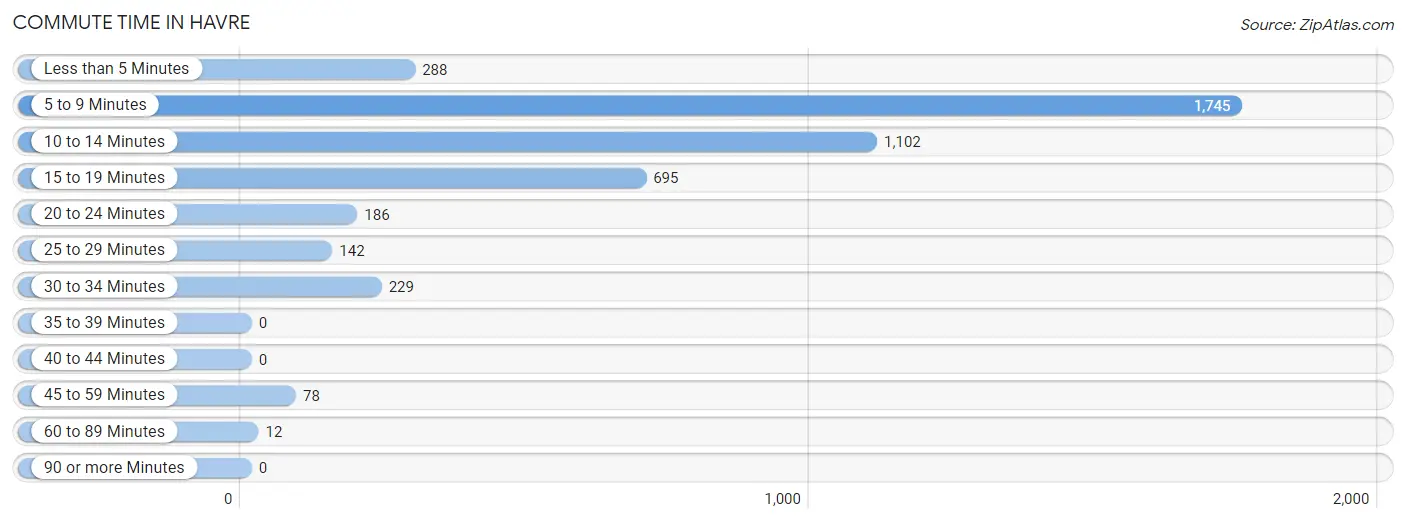
| Commute Time | # Commuters | % Commuters |
| Less than 5 Minutes | 288 | 6.4% |
| 5 to 9 Minutes | 1,745 | 39.0% |
| 10 to 14 Minutes | 1,102 | 24.6% |
| 15 to 19 Minutes | 695 | 15.5% |
| 20 to 24 Minutes | 186 | 4.2% |
| 25 to 29 Minutes | 142 | 3.2% |
| 30 to 34 Minutes | 229 | 5.1% |
| 35 to 39 Minutes | 0 | 0.0% |
| 40 to 44 Minutes | 0 | 0.0% |
| 45 to 59 Minutes | 78 | 1.7% |
| 60 to 89 Minutes | 12 | 0.3% |
| 90 or more Minutes | 0 | 0.0% |
Commute Time by Sex in Havre
The most common commute times in Havre are 5 to 9 minutes (859 commuters, 36.5%) for males and 5 to 9 minutes (886 commuters, 41.7%) for females.
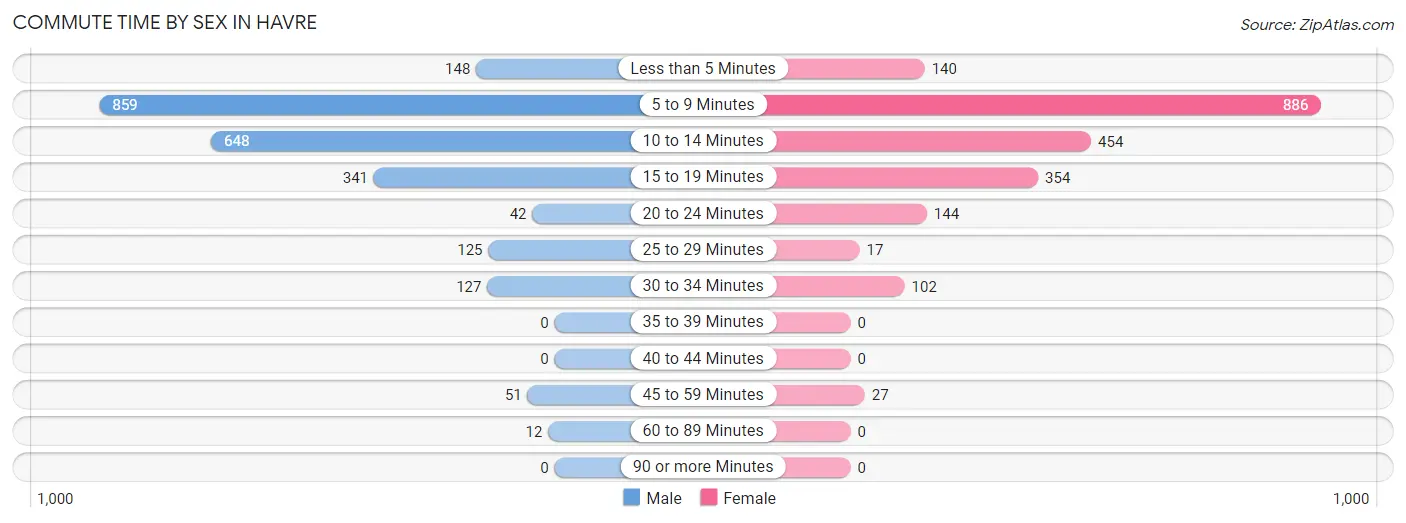
| Commute Time | Male | Female |
| Less than 5 Minutes | 148 (6.3%) | 140 (6.6%) |
| 5 to 9 Minutes | 859 (36.5%) | 886 (41.7%) |
| 10 to 14 Minutes | 648 (27.5%) | 454 (21.4%) |
| 15 to 19 Minutes | 341 (14.5%) | 354 (16.7%) |
| 20 to 24 Minutes | 42 (1.8%) | 144 (6.8%) |
| 25 to 29 Minutes | 125 (5.3%) | 17 (0.8%) |
| 30 to 34 Minutes | 127 (5.4%) | 102 (4.8%) |
| 35 to 39 Minutes | 0 (0.0%) | 0 (0.0%) |
| 40 to 44 Minutes | 0 (0.0%) | 0 (0.0%) |
| 45 to 59 Minutes | 51 (2.2%) | 27 (1.3%) |
| 60 to 89 Minutes | 12 (0.5%) | 0 (0.0%) |
| 90 or more Minutes | 0 (0.0%) | 0 (0.0%) |
Time of Departure to Work by Sex in Havre
The most frequent times of departure to work in Havre are 7:30 AM to 7:59 AM (521, 22.1%) for males and 7:30 AM to 7:59 AM (582, 27.4%) for females.
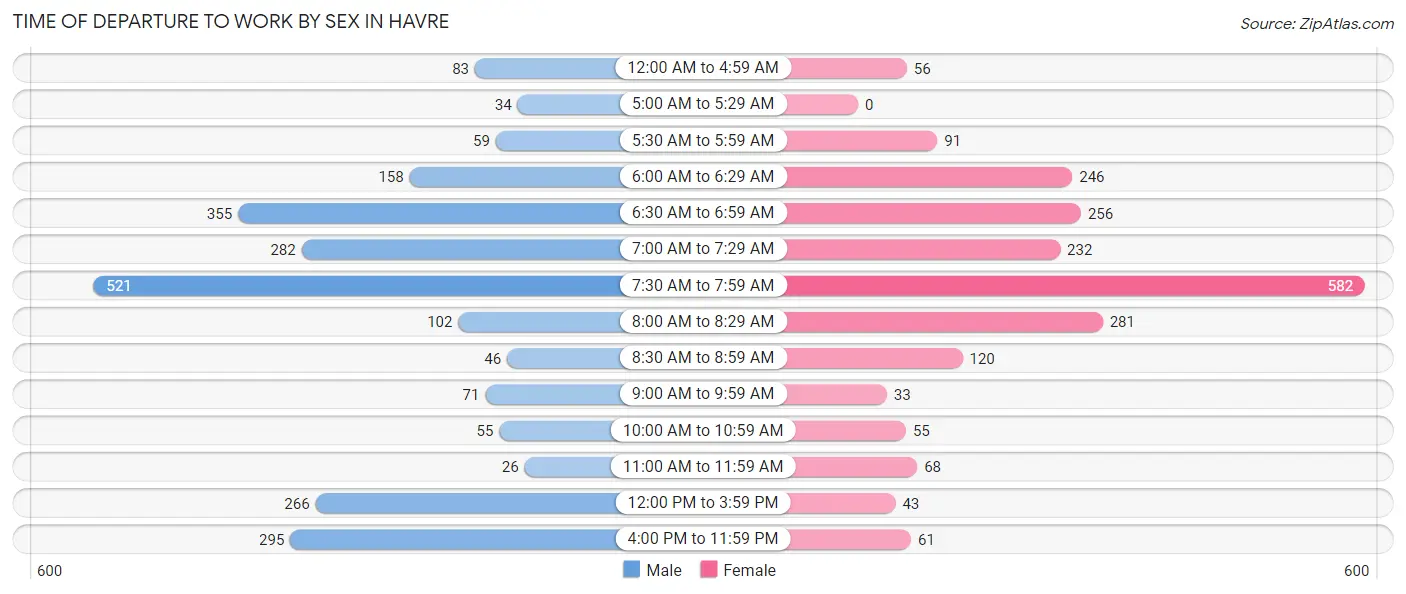
| Time of Departure | Male | Female |
| 12:00 AM to 4:59 AM | 83 (3.5%) | 56 (2.6%) |
| 5:00 AM to 5:29 AM | 34 (1.4%) | 0 (0.0%) |
| 5:30 AM to 5:59 AM | 59 (2.5%) | 91 (4.3%) |
| 6:00 AM to 6:29 AM | 158 (6.7%) | 246 (11.6%) |
| 6:30 AM to 6:59 AM | 355 (15.1%) | 256 (12.0%) |
| 7:00 AM to 7:29 AM | 282 (12.0%) | 232 (10.9%) |
| 7:30 AM to 7:59 AM | 521 (22.1%) | 582 (27.4%) |
| 8:00 AM to 8:29 AM | 102 (4.3%) | 281 (13.2%) |
| 8:30 AM to 8:59 AM | 46 (1.9%) | 120 (5.7%) |
| 9:00 AM to 9:59 AM | 71 (3.0%) | 33 (1.5%) |
| 10:00 AM to 10:59 AM | 55 (2.3%) | 55 (2.6%) |
| 11:00 AM to 11:59 AM | 26 (1.1%) | 68 (3.2%) |
| 12:00 PM to 3:59 PM | 266 (11.3%) | 43 (2.0%) |
| 4:00 PM to 11:59 PM | 295 (12.5%) | 61 (2.9%) |
| Total | 2,353 (100.0%) | 2,124 (100.0%) |
Housing Occupancy in Havre
Occupancy by Ownership in Havre
Of the total 3,772 dwellings in Havre, owner-occupied units account for 2,516 (66.7%), while renter-occupied units make up 1,256 (33.3%).
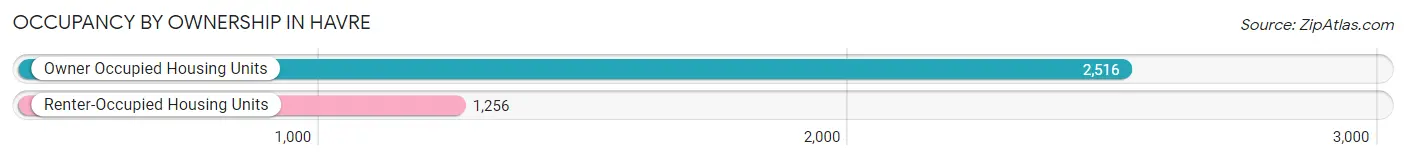
| Occupancy | # Housing Units | % Housing Units |
| Owner Occupied Housing Units | 2,516 | 66.7% |
| Renter-Occupied Housing Units | 1,256 | 33.3% |
| Total Occupied Housing Units | 3,772 | 100.0% |
Occupancy by Household Size in Havre
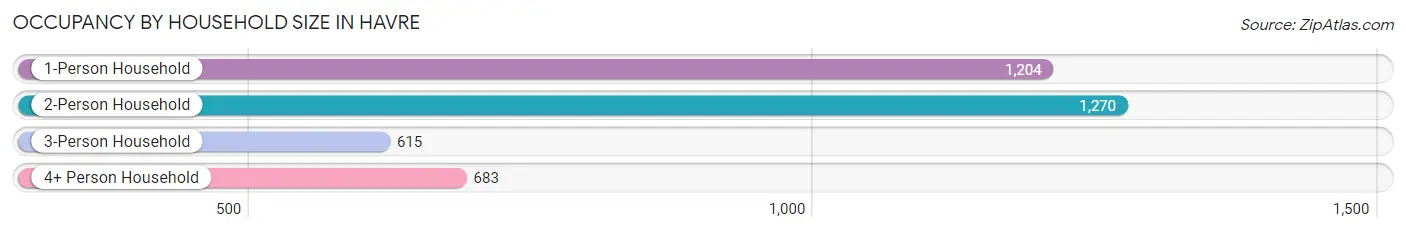
| Household Size | # Housing Units | % Housing Units |
| 1-Person Household | 1,204 | 31.9% |
| 2-Person Household | 1,270 | 33.7% |
| 3-Person Household | 615 | 16.3% |
| 4+ Person Household | 683 | 18.1% |
| Total Housing Units | 3,772 | 100.0% |
Occupancy by Ownership by Household Size in Havre
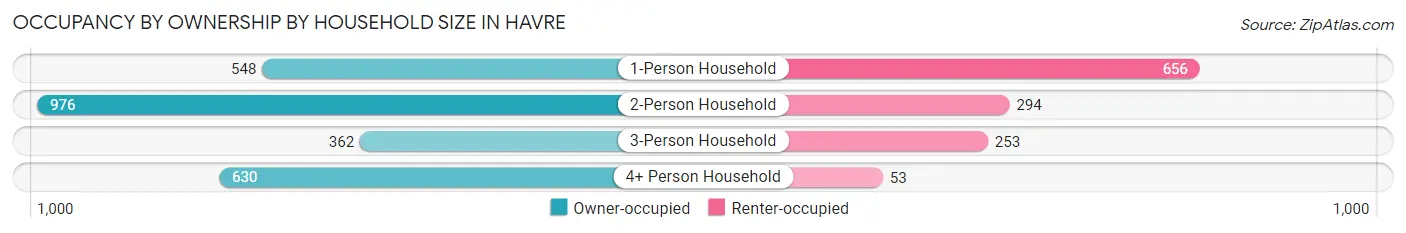
| Household Size | Owner-occupied | Renter-occupied |
| 1-Person Household | 548 (45.5%) | 656 (54.5%) |
| 2-Person Household | 976 (76.8%) | 294 (23.2%) |
| 3-Person Household | 362 (58.9%) | 253 (41.1%) |
| 4+ Person Household | 630 (92.2%) | 53 (7.8%) |
| Total Housing Units | 2,516 (66.7%) | 1,256 (33.3%) |
Occupancy by Educational Attainment in Havre
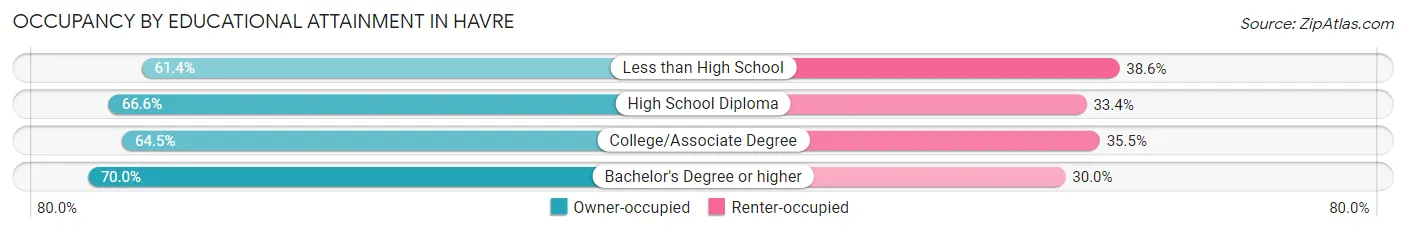
| Household Size | Owner-occupied | Renter-occupied |
| Less than High School | 145 (61.4%) | 91 (38.6%) |
| High School Diploma | 807 (66.6%) | 404 (33.4%) |
| College/Associate Degree | 750 (64.5%) | 412 (35.5%) |
| Bachelor's Degree or higher | 814 (70.0%) | 349 (30.0%) |
Occupancy by Age of Householder in Havre
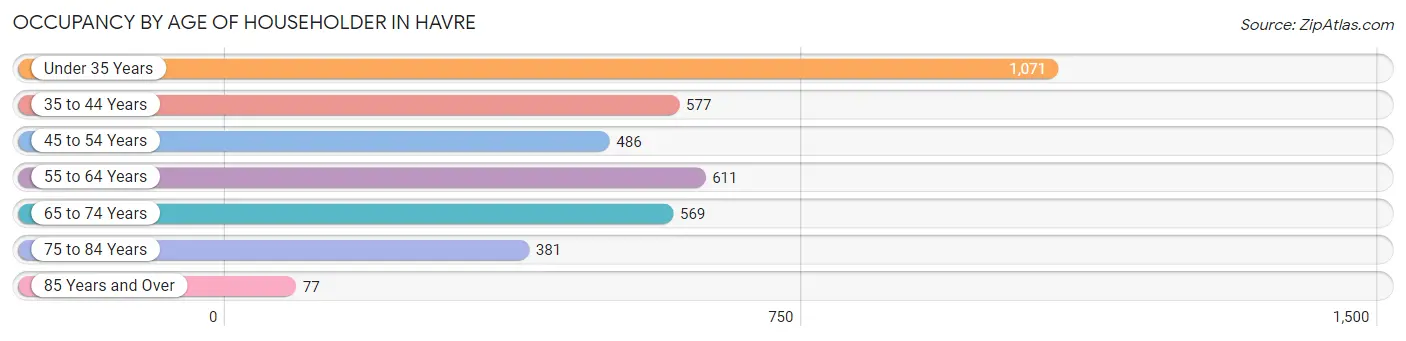
| Age Bracket | # Households | % Households |
| Under 35 Years | 1,071 | 28.4% |
| 35 to 44 Years | 577 | 15.3% |
| 45 to 54 Years | 486 | 12.9% |
| 55 to 64 Years | 611 | 16.2% |
| 65 to 74 Years | 569 | 15.1% |
| 75 to 84 Years | 381 | 10.1% |
| 85 Years and Over | 77 | 2.0% |
| Total | 3,772 | 100.0% |
Housing Finances in Havre
Median Income by Occupancy in Havre
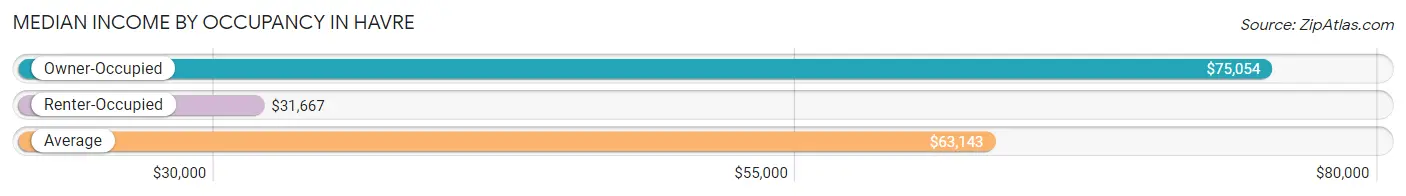
| Occupancy Type | # Households | Median Income |
| Owner-Occupied | 2,516 (66.7%) | $75,054 |
| Renter-Occupied | 1,256 (33.3%) | $31,667 |
| Average | 3,772 (100.0%) | $63,143 |
Occupancy by Householder Income Bracket in Havre
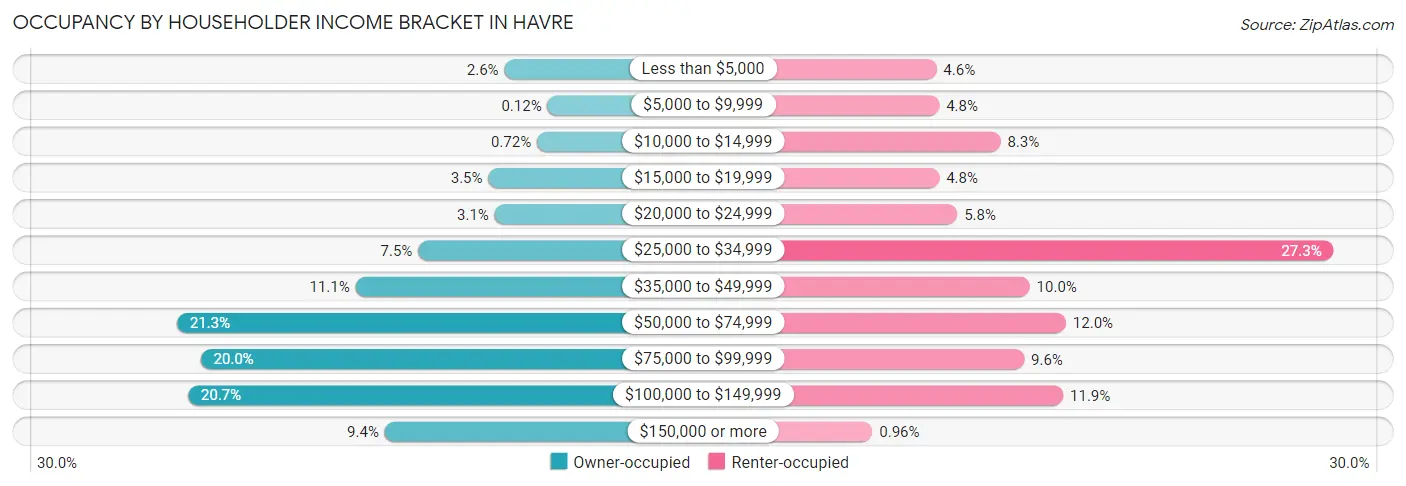
| Income Bracket | Owner-occupied | Renter-occupied |
| Less than $5,000 | 65 (2.6%) | 58 (4.6%) |
| $5,000 to $9,999 | 3 (0.1%) | 60 (4.8%) |
| $10,000 to $14,999 | 18 (0.7%) | 104 (8.3%) |
| $15,000 to $19,999 | 88 (3.5%) | 60 (4.8%) |
| $20,000 to $24,999 | 79 (3.1%) | 73 (5.8%) |
| $25,000 to $34,999 | 189 (7.5%) | 343 (27.3%) |
| $35,000 to $49,999 | 279 (11.1%) | 125 (10.0%) |
| $50,000 to $74,999 | 536 (21.3%) | 151 (12.0%) |
| $75,000 to $99,999 | 502 (20.0%) | 121 (9.6%) |
| $100,000 to $149,999 | 520 (20.7%) | 149 (11.9%) |
| $150,000 or more | 237 (9.4%) | 12 (1.0%) |
| Total | 2,516 (100.0%) | 1,256 (100.0%) |
Monthly Housing Cost Tiers in Havre
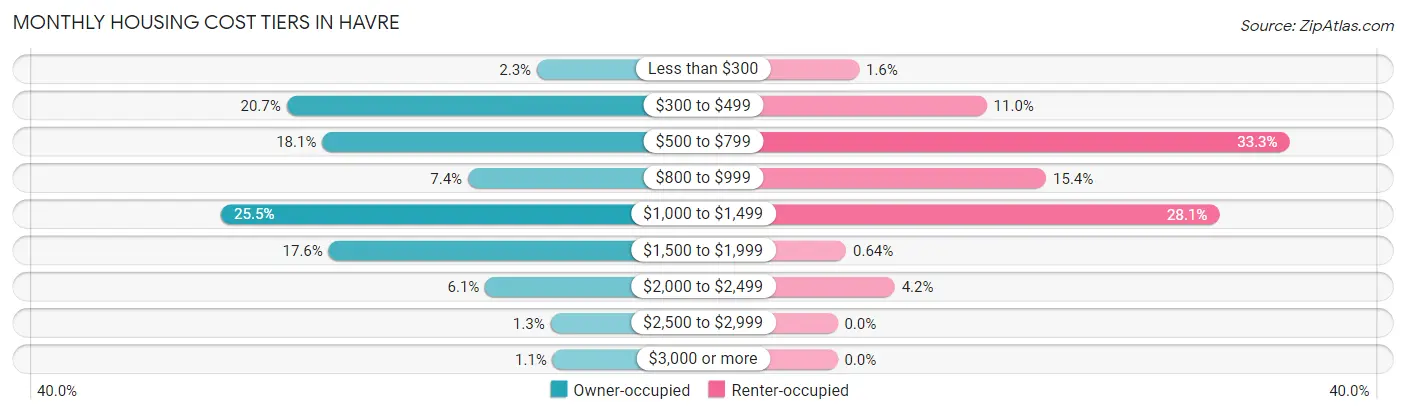
| Monthly Cost | Owner-occupied | Renter-occupied |
| Less than $300 | 57 (2.3%) | 20 (1.6%) |
| $300 to $499 | 521 (20.7%) | 138 (11.0%) |
| $500 to $799 | 455 (18.1%) | 418 (33.3%) |
| $800 to $999 | 185 (7.3%) | 193 (15.4%) |
| $1,000 to $1,499 | 642 (25.5%) | 353 (28.1%) |
| $1,500 to $1,999 | 443 (17.6%) | 8 (0.6%) |
| $2,000 to $2,499 | 153 (6.1%) | 53 (4.2%) |
| $2,500 to $2,999 | 32 (1.3%) | 0 (0.0%) |
| $3,000 or more | 28 (1.1%) | 0 (0.0%) |
| Total | 2,516 (100.0%) | 1,256 (100.0%) |
Physical Housing Characteristics in Havre
Housing Structures in Havre
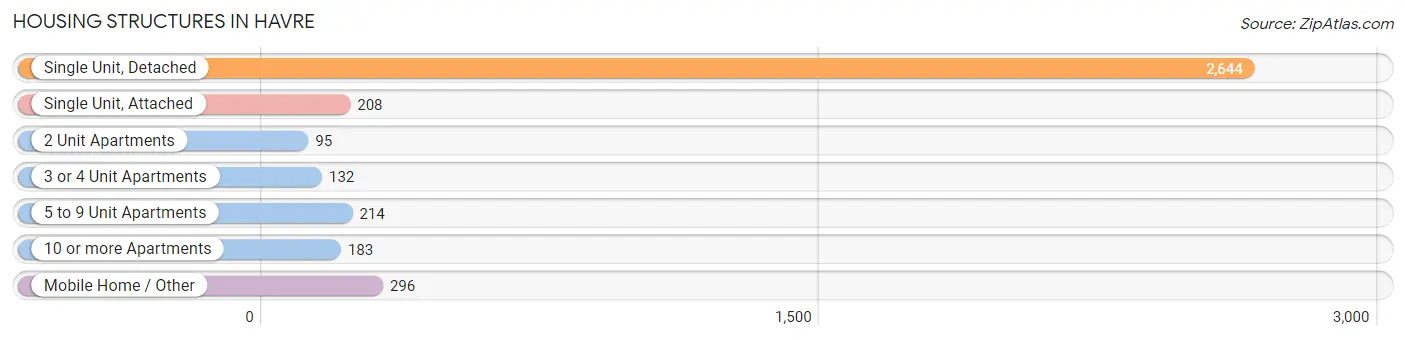
| Structure Type | # Housing Units | % Housing Units |
| Single Unit, Detached | 2,644 | 70.1% |
| Single Unit, Attached | 208 | 5.5% |
| 2 Unit Apartments | 95 | 2.5% |
| 3 or 4 Unit Apartments | 132 | 3.5% |
| 5 to 9 Unit Apartments | 214 | 5.7% |
| 10 or more Apartments | 183 | 4.9% |
| Mobile Home / Other | 296 | 7.9% |
| Total | 3,772 | 100.0% |
Housing Structures by Occupancy in Havre
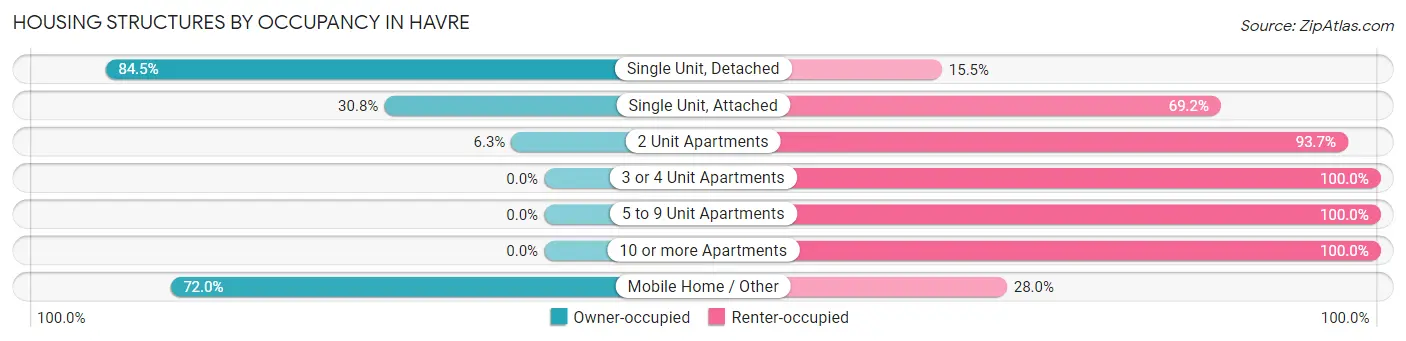
| Structure Type | Owner-occupied | Renter-occupied |
| Single Unit, Detached | 2,233 (84.5%) | 411 (15.5%) |
| Single Unit, Attached | 64 (30.8%) | 144 (69.2%) |
| 2 Unit Apartments | 6 (6.3%) | 89 (93.7%) |
| 3 or 4 Unit Apartments | 0 (0.0%) | 132 (100.0%) |
| 5 to 9 Unit Apartments | 0 (0.0%) | 214 (100.0%) |
| 10 or more Apartments | 0 (0.0%) | 183 (100.0%) |
| Mobile Home / Other | 213 (72.0%) | 83 (28.0%) |
| Total | 2,516 (66.7%) | 1,256 (33.3%) |
Housing Structures by Number of Rooms in Havre
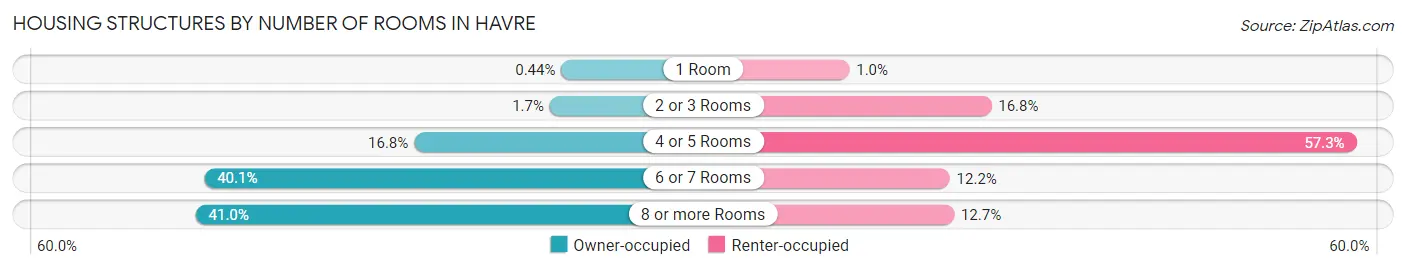
| Number of Rooms | Owner-occupied | Renter-occupied |
| 1 Room | 11 (0.4%) | 13 (1.0%) |
| 2 or 3 Rooms | 43 (1.7%) | 211 (16.8%) |
| 4 or 5 Rooms | 422 (16.8%) | 720 (57.3%) |
| 6 or 7 Rooms | 1,008 (40.1%) | 153 (12.2%) |
| 8 or more Rooms | 1,032 (41.0%) | 159 (12.7%) |
| Total | 2,516 (100.0%) | 1,256 (100.0%) |
Housing Structure by Heating Type in Havre
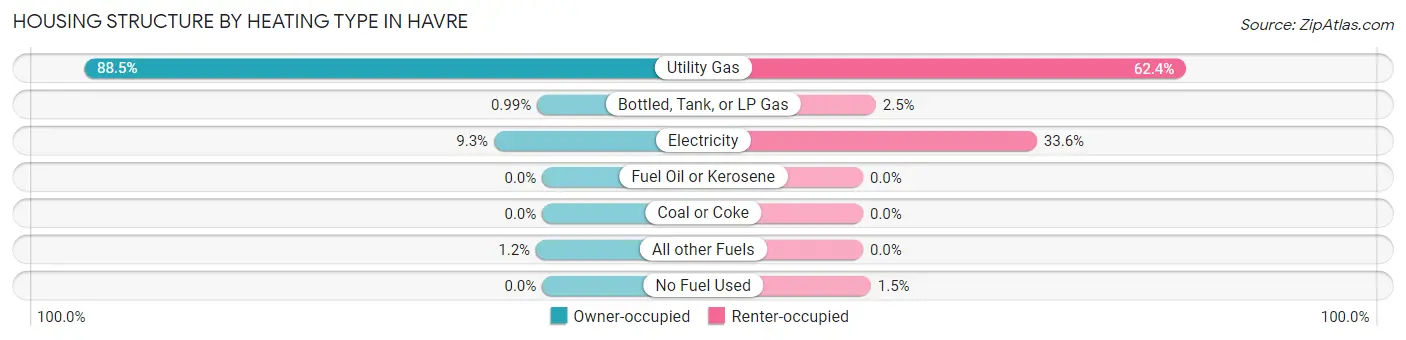
| Heating Type | Owner-occupied | Renter-occupied |
| Utility Gas | 2,227 (88.5%) | 784 (62.4%) |
| Bottled, Tank, or LP Gas | 25 (1.0%) | 31 (2.5%) |
| Electricity | 234 (9.3%) | 422 (33.6%) |
| Fuel Oil or Kerosene | 0 (0.0%) | 0 (0.0%) |
| Coal or Coke | 0 (0.0%) | 0 (0.0%) |
| All other Fuels | 30 (1.2%) | 0 (0.0%) |
| No Fuel Used | 0 (0.0%) | 19 (1.5%) |
| Total | 2,516 (100.0%) | 1,256 (100.0%) |
Household Vehicle Usage in Havre
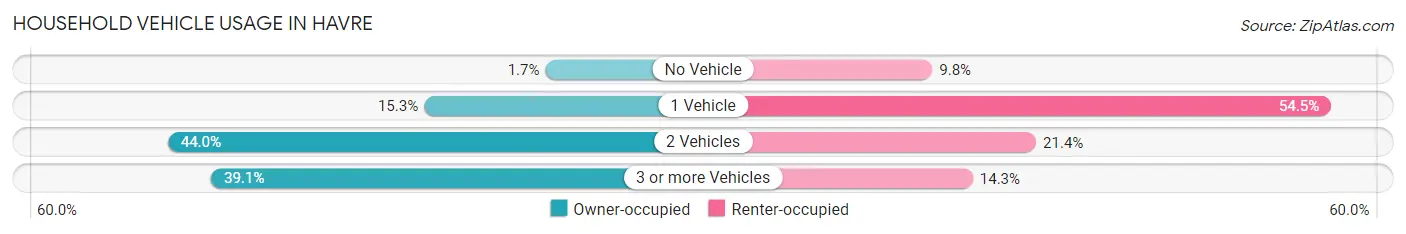
| Vehicles per Household | Owner-occupied | Renter-occupied |
| No Vehicle | 42 (1.7%) | 123 (9.8%) |
| 1 Vehicle | 384 (15.3%) | 684 (54.5%) |
| 2 Vehicles | 1,106 (44.0%) | 269 (21.4%) |
| 3 or more Vehicles | 984 (39.1%) | 180 (14.3%) |
| Total | 2,516 (100.0%) | 1,256 (100.0%) |
Real Estate & Mortgages in Havre
Real Estate and Mortgage Overview in Havre
| Characteristic | Without Mortgage | With Mortgage |
| Housing Units | 1,014 | 1,502 |
| Median Property Value | $172,300 | $197,900 |
| Median Household Income | $57,560 | $150 |
| Monthly Housing Costs | $471 | $28 |
| Real Estate Taxes | $2,257 | $49 |
Property Value by Mortgage Status in Havre
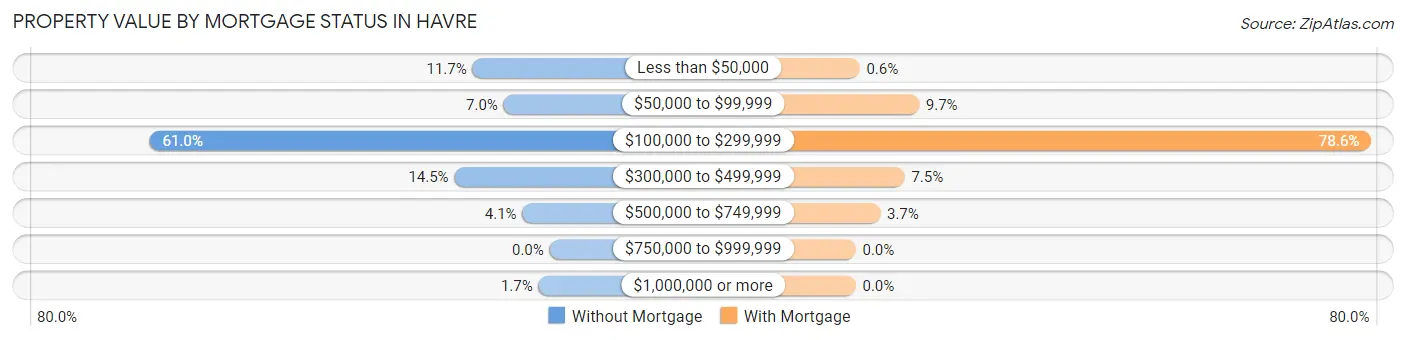
| Property Value | Without Mortgage | With Mortgage |
| Less than $50,000 | 119 (11.7%) | 9 (0.6%) |
| $50,000 to $99,999 | 71 (7.0%) | 145 (9.7%) |
| $100,000 to $299,999 | 618 (61.0%) | 1,180 (78.6%) |
| $300,000 to $499,999 | 147 (14.5%) | 112 (7.5%) |
| $500,000 to $749,999 | 42 (4.1%) | 56 (3.7%) |
| $750,000 to $999,999 | 0 (0.0%) | 0 (0.0%) |
| $1,000,000 or more | 17 (1.7%) | 0 (0.0%) |
| Total | 1,014 (100.0%) | 1,502 (100.0%) |
Household Income by Mortgage Status in Havre
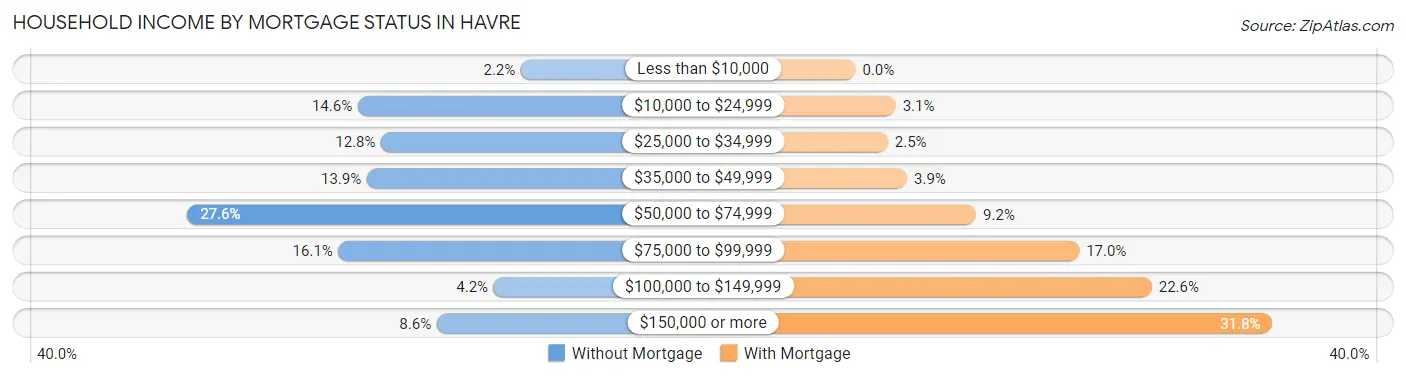
| Household Income | Without Mortgage | With Mortgage |
| Less than $10,000 | 22 (2.2%) | 0 (0.0%) |
| $10,000 to $24,999 | 148 (14.6%) | 46 (3.1%) |
| $25,000 to $34,999 | 130 (12.8%) | 37 (2.5%) |
| $35,000 to $49,999 | 141 (13.9%) | 59 (3.9%) |
| $50,000 to $74,999 | 280 (27.6%) | 138 (9.2%) |
| $75,000 to $99,999 | 163 (16.1%) | 256 (17.0%) |
| $100,000 to $149,999 | 43 (4.2%) | 339 (22.6%) |
| $150,000 or more | 87 (8.6%) | 477 (31.8%) |
| Total | 1,014 (100.0%) | 1,502 (100.0%) |
Property Value to Household Income Ratio in Havre
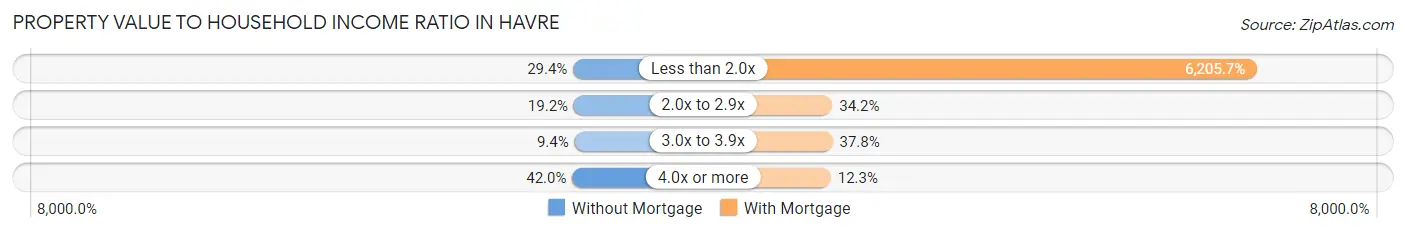
| Value-to-Income Ratio | Without Mortgage | With Mortgage |
| Less than 2.0x | 298 (29.4%) | 93,209 (6,205.7%) |
| 2.0x to 2.9x | 195 (19.2%) | 514 (34.2%) |
| 3.0x to 3.9x | 95 (9.4%) | 567 (37.8%) |
| 4.0x or more | 426 (42.0%) | 184 (12.2%) |
| Total | 1,014 (100.0%) | 1,502 (100.0%) |
Real Estate Taxes by Mortgage Status in Havre
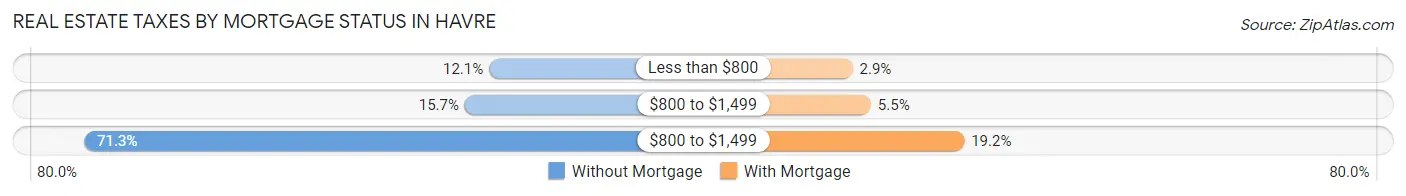
| Property Taxes | Without Mortgage | With Mortgage |
| Less than $800 | 123 (12.1%) | 43 (2.9%) |
| $800 to $1,499 | 159 (15.7%) | 83 (5.5%) |
| $800 to $1,499 | 723 (71.3%) | 288 (19.2%) |
| Total | 1,014 (100.0%) | 1,502 (100.0%) |
Health & Disability in Havre
Health Insurance Coverage by Age in Havre
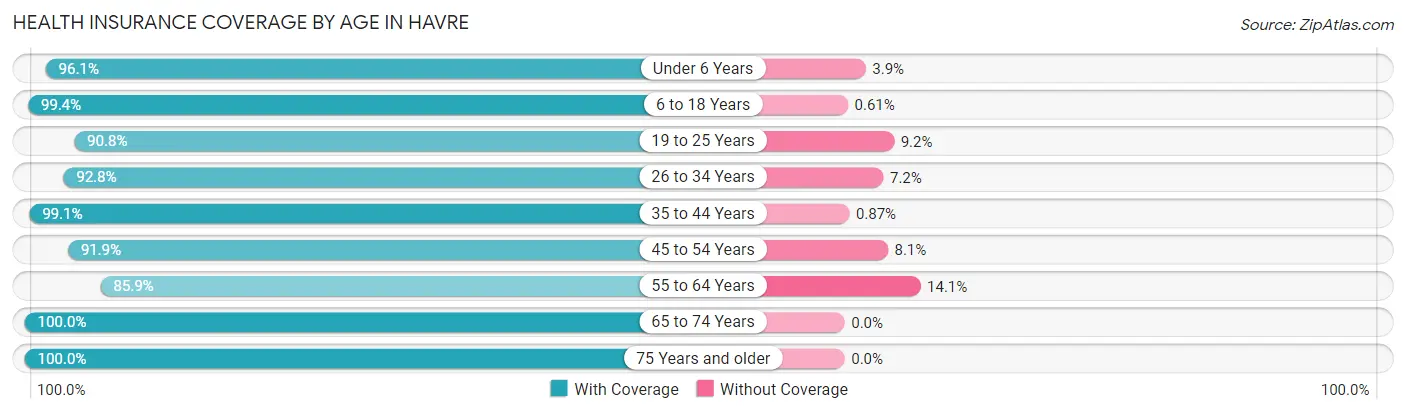
| Age Bracket | With Coverage | Without Coverage |
| Under 6 Years | 1,006 (96.1%) | 41 (3.9%) |
| 6 to 18 Years | 1,471 (99.4%) | 9 (0.6%) |
| 19 to 25 Years | 1,181 (90.8%) | 120 (9.2%) |
| 26 to 34 Years | 1,144 (92.8%) | 89 (7.2%) |
| 35 to 44 Years | 1,027 (99.1%) | 9 (0.9%) |
| 45 to 54 Years | 684 (91.9%) | 60 (8.1%) |
| 55 to 64 Years | 777 (85.9%) | 128 (14.1%) |
| 65 to 74 Years | 909 (100.0%) | 0 (0.0%) |
| 75 Years and older | 574 (100.0%) | 0 (0.0%) |
| Total | 8,773 (95.1%) | 456 (4.9%) |
Health Insurance Coverage by Citizenship Status in Havre
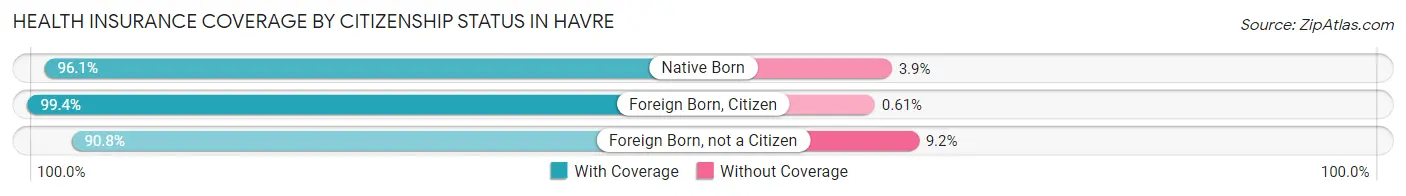
| Citizenship Status | With Coverage | Without Coverage |
| Native Born | 1,006 (96.1%) | 41 (3.9%) |
| Foreign Born, Citizen | 1,471 (99.4%) | 9 (0.6%) |
| Foreign Born, not a Citizen | 1,181 (90.8%) | 120 (9.2%) |
Health Insurance Coverage by Household Income in Havre
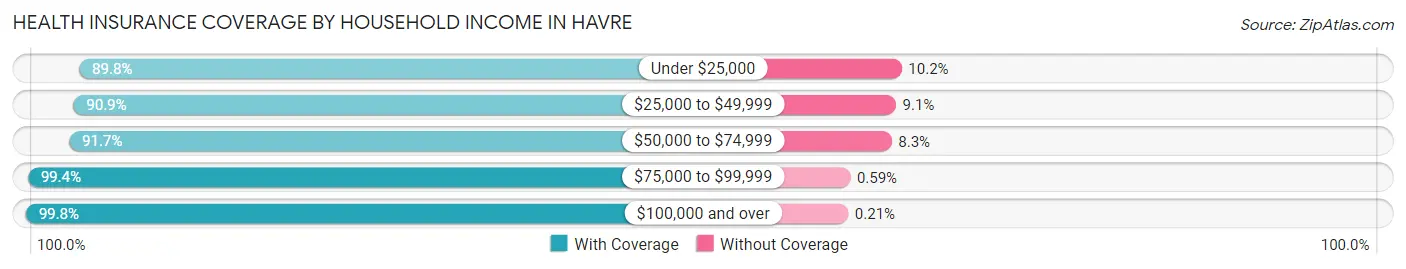
| Household Income | With Coverage | Without Coverage |
| Under $25,000 | 834 (89.8%) | 95 (10.2%) |
| $25,000 to $49,999 | 1,860 (90.9%) | 187 (9.1%) |
| $50,000 to $74,999 | 1,472 (91.7%) | 134 (8.3%) |
| $75,000 to $99,999 | 1,527 (99.4%) | 9 (0.6%) |
| $100,000 and over | 2,825 (99.8%) | 6 (0.2%) |
Public vs Private Health Insurance Coverage by Age in Havre
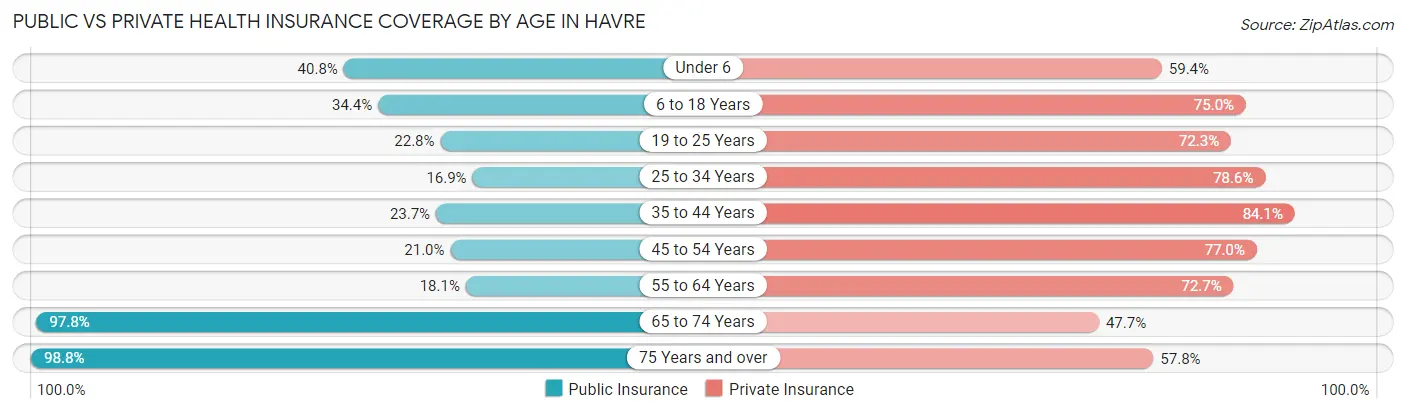
| Age Bracket | Public Insurance | Private Insurance |
| Under 6 | 427 (40.8%) | 622 (59.4%) |
| 6 to 18 Years | 509 (34.4%) | 1,110 (75.0%) |
| 19 to 25 Years | 297 (22.8%) | 940 (72.3%) |
| 25 to 34 Years | 208 (16.9%) | 969 (78.6%) |
| 35 to 44 Years | 245 (23.6%) | 871 (84.1%) |
| 45 to 54 Years | 156 (21.0%) | 573 (77.0%) |
| 55 to 64 Years | 164 (18.1%) | 658 (72.7%) |
| 65 to 74 Years | 889 (97.8%) | 434 (47.7%) |
| 75 Years and over | 567 (98.8%) | 332 (57.8%) |
| Total | 3,462 (37.5%) | 6,509 (70.5%) |
Disability Status by Sex by Age in Havre
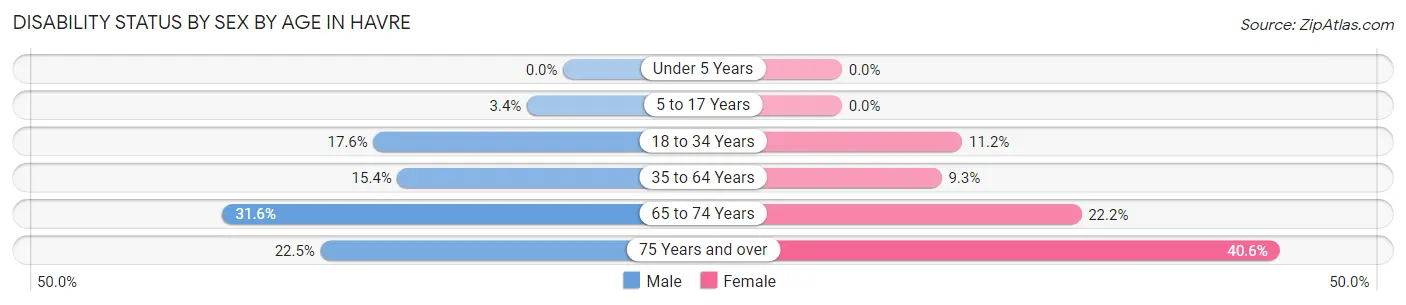
| Age Bracket | Male | Female |
| Under 5 Years | 0 (0.0%) | 0 (0.0%) |
| 5 to 17 Years | 23 (3.4%) | 0 (0.0%) |
| 18 to 34 Years | 242 (17.6%) | 135 (11.2%) |
| 35 to 64 Years | 205 (15.4%) | 125 (9.2%) |
| 65 to 74 Years | 148 (31.6%) | 98 (22.2%) |
| 75 Years and over | 50 (22.5%) | 143 (40.6%) |
Disability Class by Sex by Age in Havre
Disability Class: Hearing Difficulty
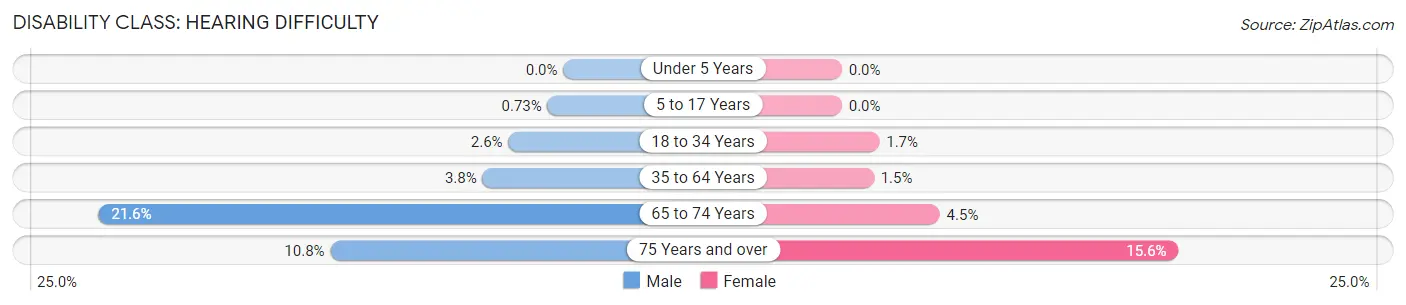
| Age Bracket | Male | Female |
| Under 5 Years | 0 (0.0%) | 0 (0.0%) |
| 5 to 17 Years | 5 (0.7%) | 0 (0.0%) |
| 18 to 34 Years | 35 (2.5%) | 21 (1.7%) |
| 35 to 64 Years | 50 (3.7%) | 20 (1.5%) |
| 65 to 74 Years | 101 (21.6%) | 20 (4.5%) |
| 75 Years and over | 24 (10.8%) | 55 (15.6%) |
Disability Class: Vision Difficulty
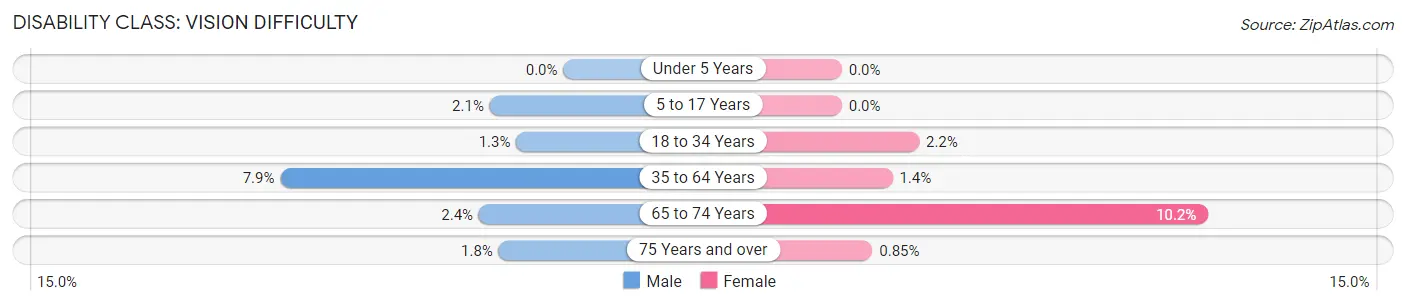
| Age Bracket | Male | Female |
| Under 5 Years | 0 (0.0%) | 0 (0.0%) |
| 5 to 17 Years | 14 (2.1%) | 0 (0.0%) |
| 18 to 34 Years | 18 (1.3%) | 26 (2.1%) |
| 35 to 64 Years | 105 (7.9%) | 19 (1.4%) |
| 65 to 74 Years | 11 (2.4%) | 45 (10.2%) |
| 75 Years and over | 4 (1.8%) | 3 (0.9%) |
Disability Class: Cognitive Difficulty
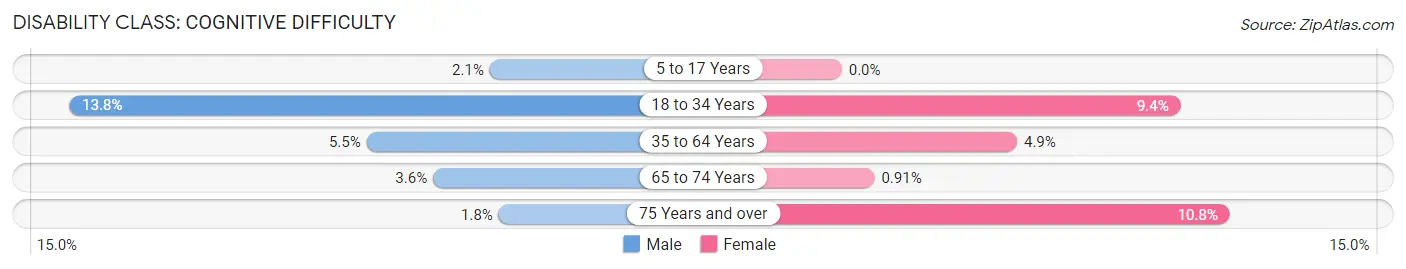
| Age Bracket | Male | Female |
| 5 to 17 Years | 14 (2.1%) | 0 (0.0%) |
| 18 to 34 Years | 189 (13.8%) | 114 (9.4%) |
| 35 to 64 Years | 73 (5.5%) | 66 (4.9%) |
| 65 to 74 Years | 17 (3.6%) | 4 (0.9%) |
| 75 Years and over | 4 (1.8%) | 38 (10.8%) |
Disability Class: Ambulatory Difficulty
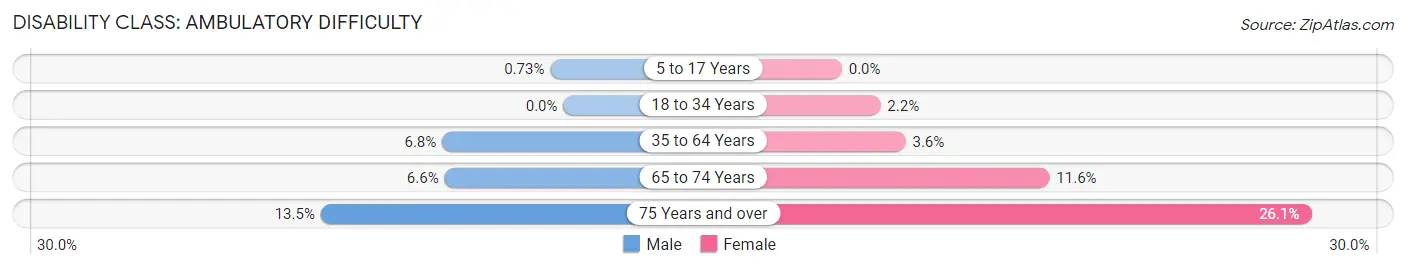
| Age Bracket | Male | Female |
| 5 to 17 Years | 5 (0.7%) | 0 (0.0%) |
| 18 to 34 Years | 0 (0.0%) | 26 (2.1%) |
| 35 to 64 Years | 90 (6.8%) | 48 (3.5%) |
| 65 to 74 Years | 31 (6.6%) | 51 (11.6%) |
| 75 Years and over | 30 (13.5%) | 92 (26.1%) |
Disability Class: Self-Care Difficulty
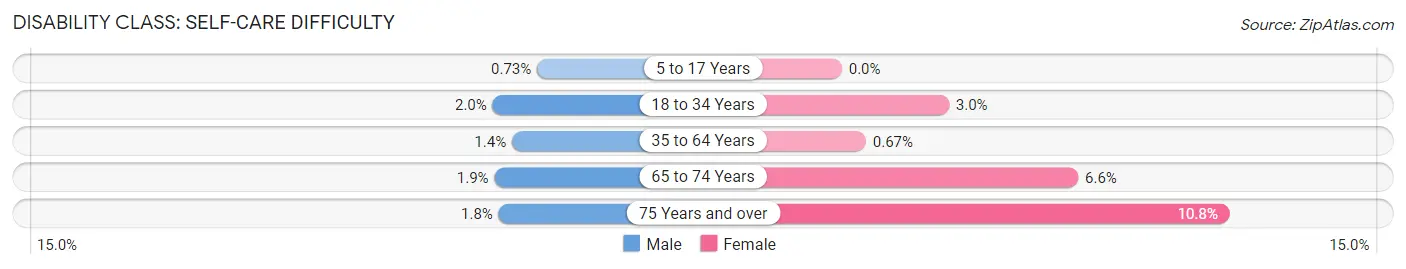
| Age Bracket | Male | Female |
| 5 to 17 Years | 5 (0.7%) | 0 (0.0%) |
| 18 to 34 Years | 27 (2.0%) | 36 (3.0%) |
| 35 to 64 Years | 19 (1.4%) | 9 (0.7%) |
| 65 to 74 Years | 9 (1.9%) | 29 (6.6%) |
| 75 Years and over | 4 (1.8%) | 38 (10.8%) |
Technology Access in Havre
Computing Device Access in Havre
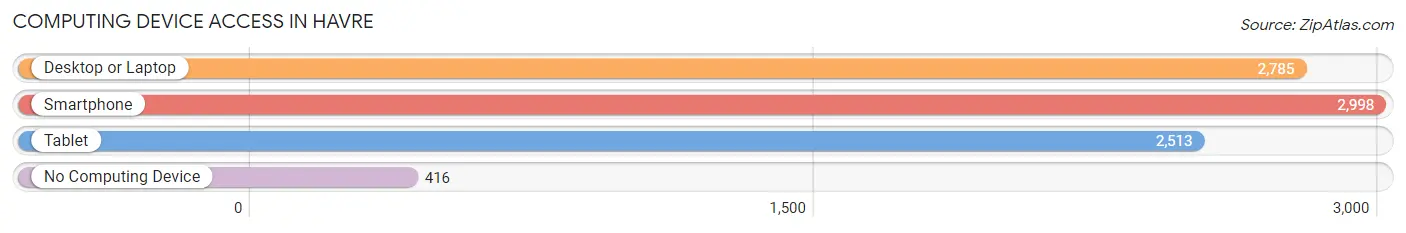
| Device Type | # Households | % Households |
| Desktop or Laptop | 2,785 | 73.8% |
| Smartphone | 2,998 | 79.5% |
| Tablet | 2,513 | 66.6% |
| No Computing Device | 416 | 11.0% |
| Total | 3,772 | 100.0% |
Internet Access in Havre
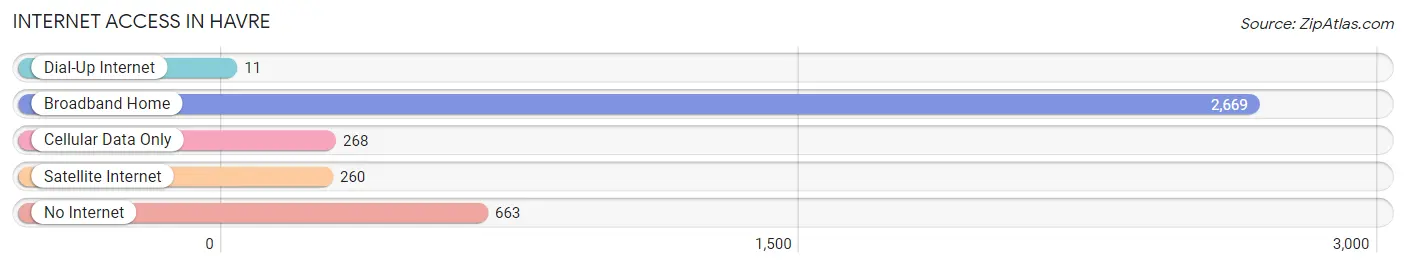
| Internet Type | # Households | % Households |
| Dial-Up Internet | 11 | 0.3% |
| Broadband Home | 2,669 | 70.8% |
| Cellular Data Only | 268 | 7.1% |
| Satellite Internet | 260 | 6.9% |
| No Internet | 663 | 17.6% |
| Total | 3,772 | 100.0% |
Havre Summary
Havre, Montana is a city located in the north-central part of the state, in Hill County. It is the county seat and the largest city in Hill County, with a population of 9,310 as of the 2010 census. The city is situated on the banks of the Milk River, and is the largest city in the Hi-Line region of Montana.
History
Havre was founded in 1887 by the Great Northern Railway, and was named after the French city of Le Havre. The city was originally intended to be a major rail hub, and the Great Northern Railway built a large roundhouse and repair facility in the city. The city quickly grew, and by the turn of the century, it had become a major commercial center for the region.
In the early 1900s, Havre was a major center for the agricultural industry, and the city was home to several large grain elevators and flour mills. The city also had a large lumber industry, and several sawmills were located in the city.
In the 1920s, the city experienced a period of rapid growth, and the population increased from 4,000 to over 10,000. The city was also home to several large businesses, including a brewery, a creamery, and a cannery.
Geography
Havre is located in the north-central part of Montana, in Hill County. The city is situated on the banks of the Milk River, and is the largest city in the Hi-Line region of Montana. The city is located at an elevation of 2,717 feet (828 m).
The city has a total area of 5.2 square miles (13.4 km2), of which 5.1 square miles (13.2 km2) is land and 0.1 square miles (0.2 km2) is water.
Economy
Havre is the economic center of the Hi-Line region of Montana. The city is home to several large businesses, including a brewery, a creamery, and a cannery. The city is also home to several large grain elevators and flour mills.
The city is also home to several large retail stores, including Walmart, Kmart, and Target. The city is also home to several large manufacturing companies, including a paper mill, a furniture factory, and a plastics factory.
The city is also home to several large agricultural businesses, including a cattle feedlot, a dairy, and a sugar beet processing plant.
Demographics
As of the 2010 census, the population of Havre was 9,310. The racial makeup of the city was 87.3% White, 0.7% African American, 6.2% Native American, 0.7% Asian, 0.1% Pacific Islander, 1.3% from other races, and 3.9% from two or more races. Hispanic or Latino of any race were 4.2% of the population.
The median income for a household in the city was $35,938, and the median income for a family was $45,938. The per capita income for the city was $18,938. About 17.3% of families and 21.2% of the population were below the poverty line, including 28.3% of those under age 18 and 11.2% of those age 65 or over.
Common Questions
What is Per Capita Income in Havre?
Per Capita income in Havre is $30,449.
What is the Median Family Income in Havre?
Median Family Income in Havre is $81,986.
What is the Median Household income in Havre?
Median Household Income in Havre is $63,143.
What is Income or Wage Gap in Havre?
Income or Wage Gap in Havre is 33.9%.
Women in Havre earn 66.1 cents for every dollar earned by a man.
What is Family Income Deficit in Havre?
Family Income Deficit in Havre is $9,719.
Families that are below poverty line in Havre earn $9,719 less on average than the poverty threshold level.
What is Inequality or Gini Index in Havre?
Inequality or Gini Index in Havre is 0.41.
What is the Total Population of Havre?
Total Population of Havre is 9,332.
What is the Total Male Population of Havre?
Total Male Population of Havre is 4,527.
What is the Total Female Population of Havre?
Total Female Population of Havre is 4,805.
What is the Ratio of Males per 100 Females in Havre?
There are 94.21 Males per 100 Females in Havre.
What is the Ratio of Females per 100 Males in Havre?
There are 106.14 Females per 100 Males in Havre.
What is the Median Population Age in Havre?
Median Population Age in Havre is 31.3 Years.
What is the Average Family Size in Havre
Average Family Size in Havre is 3.0 People.
What is the Average Household Size in Havre
Average Household Size in Havre is 2.4 People.
How Large is the Labor Force in Havre?
There are 4,799 People in the Labor Forcein in Havre.
What is the Percentage of People in the Labor Force in Havre?
68.3% of People are in the Labor Force in Havre.
What is the Unemployment Rate in Havre?
Unemployment Rate in Havre is 3.2%.