Stevensville, MT Map & Demographics
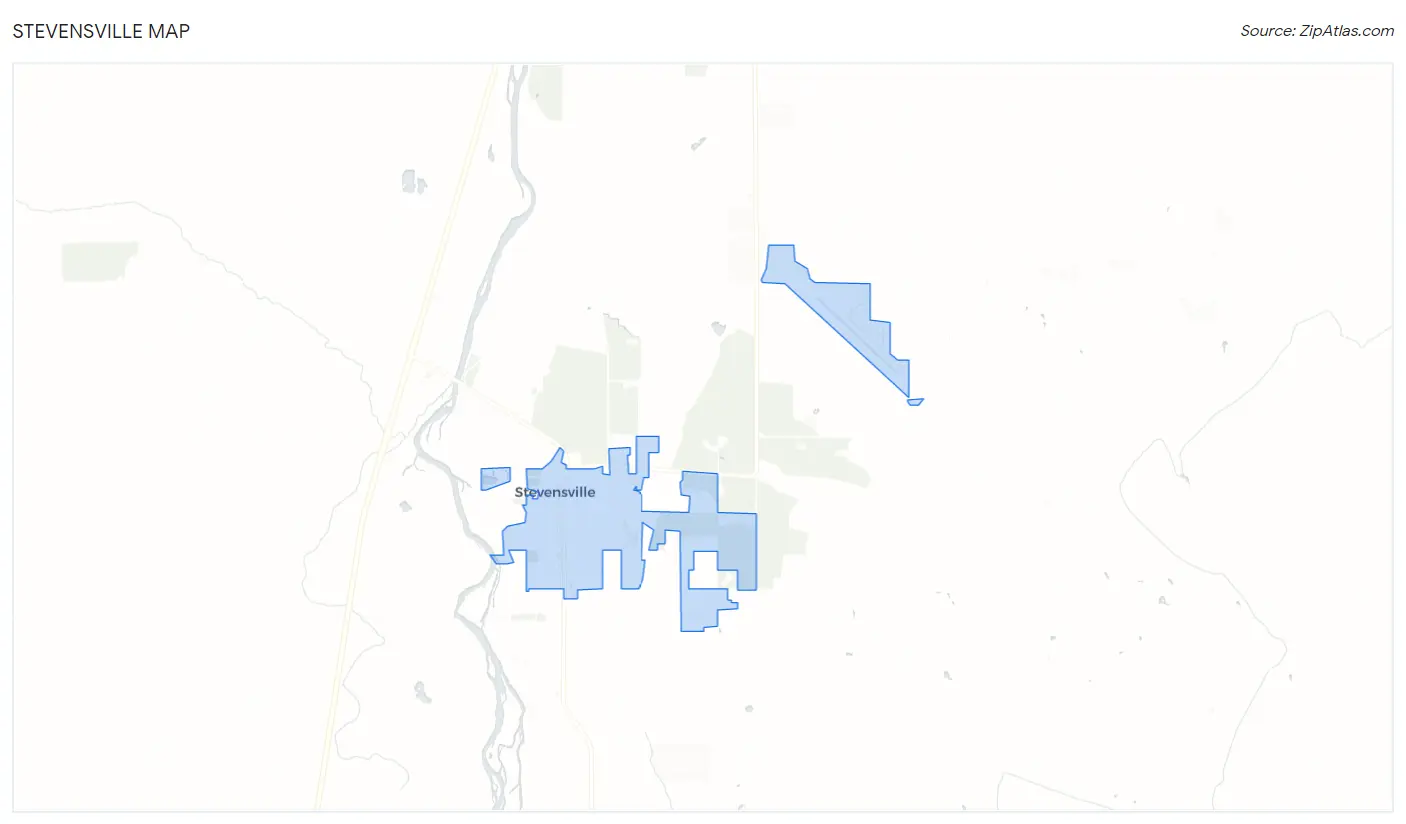
Stevensville Map
Stevensville Overview
$28,642
PER CAPITA INCOME
$61,250
AVG FAMILY INCOME
$39,836
AVG HOUSEHOLD INCOME
51.1%
WAGE / INCOME GAP [ % ]
48.9¢/ $1
WAGE / INCOME GAP [ $ ]
$12,098
FAMILY INCOME DEFICIT
0.49
INEQUALITY / GINI INDEX
2,038
TOTAL POPULATION
936
MALE POPULATION
1,102
FEMALE POPULATION
84.94
MALES / 100 FEMALES
117.74
FEMALES / 100 MALES
38.9
MEDIAN AGE
3.1
AVG FAMILY SIZE
2.2
AVG HOUSEHOLD SIZE
963
LABOR FORCE [ PEOPLE ]
60.2%
PERCENT IN LABOR FORCE
4.9%
UNEMPLOYMENT RATE
Stevensville Zip Codes
Stevensville Area Codes
Income in Stevensville
Income Overview in Stevensville
Per Capita Income in Stevensville is $28,642, while median incomes of families and households are $61,250 and $39,836 respectively.
| Characteristic | Number | Measure |
| Per Capita Income | 2,038 | $28,642 |
| Median Family Income | 436 | $61,250 |
| Mean Family Income | 436 | $86,922 |
| Median Household Income | 911 | $39,836 |
| Mean Household Income | 911 | $61,582 |
| Income Deficit | 436 | $12,098 |
| Wage / Income Gap (%) | 2,038 | 51.09% |
| Wage / Income Gap ($) | 2,038 | 48.91¢ per $1 |
| Gini / Inequality Index | 2,038 | 0.49 |
Earnings by Sex in Stevensville
Average Earnings in Stevensville are $26,815, $33,810 for men and $16,538 for women, a difference of 51.1%.
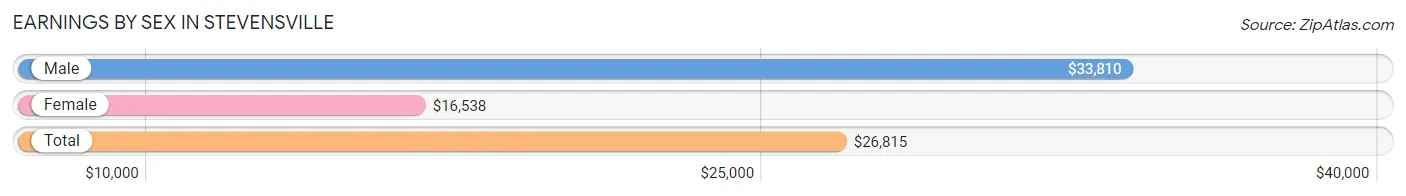
| Sex | Number | Average Earnings |
| Male | 510 (47.0%) | $33,810 |
| Female | 574 (52.9%) | $16,538 |
| Total | 1,084 (100.0%) | $26,815 |
Earnings by Sex by Income Bracket in Stevensville
The most common earnings brackets in Stevensville are $25,000 to $29,999 for men (98 | 19.2%) and $5,000 to $7,499 for women (90 | 15.7%).
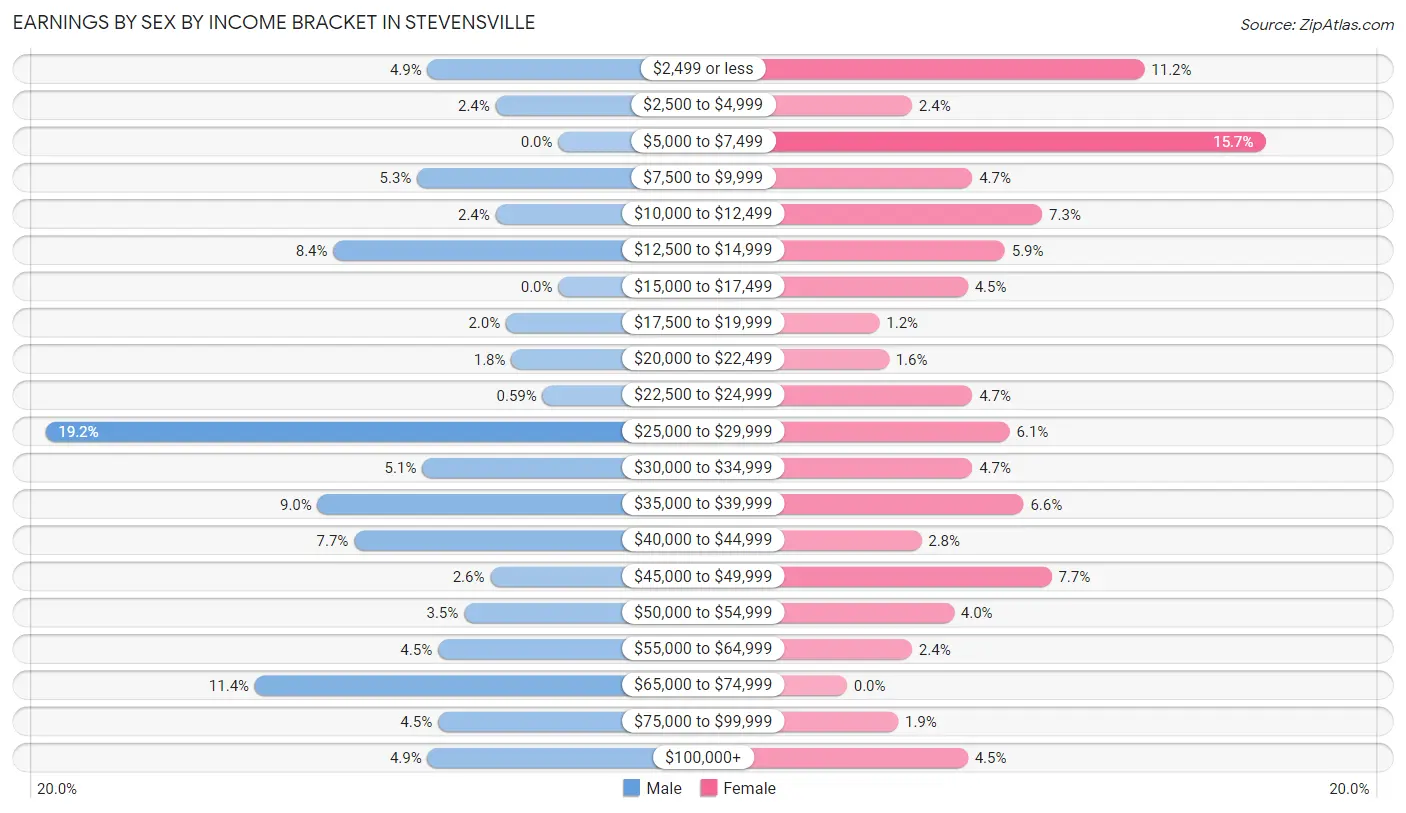
| Income | Male | Female |
| $2,499 or less | 25 (4.9%) | 64 (11.2%) |
| $2,500 to $4,999 | 12 (2.4%) | 14 (2.4%) |
| $5,000 to $7,499 | 0 (0.0%) | 90 (15.7%) |
| $7,500 to $9,999 | 27 (5.3%) | 27 (4.7%) |
| $10,000 to $12,499 | 12 (2.4%) | 42 (7.3%) |
| $12,500 to $14,999 | 43 (8.4%) | 34 (5.9%) |
| $15,000 to $17,499 | 0 (0.0%) | 26 (4.5%) |
| $17,500 to $19,999 | 10 (2.0%) | 7 (1.2%) |
| $20,000 to $22,499 | 9 (1.8%) | 9 (1.6%) |
| $22,500 to $24,999 | 3 (0.6%) | 27 (4.7%) |
| $25,000 to $29,999 | 98 (19.2%) | 35 (6.1%) |
| $30,000 to $34,999 | 26 (5.1%) | 27 (4.7%) |
| $35,000 to $39,999 | 46 (9.0%) | 38 (6.6%) |
| $40,000 to $44,999 | 39 (7.6%) | 16 (2.8%) |
| $45,000 to $49,999 | 13 (2.5%) | 44 (7.7%) |
| $50,000 to $54,999 | 18 (3.5%) | 23 (4.0%) |
| $55,000 to $64,999 | 23 (4.5%) | 14 (2.4%) |
| $65,000 to $74,999 | 58 (11.4%) | 0 (0.0%) |
| $75,000 to $99,999 | 23 (4.5%) | 11 (1.9%) |
| $100,000+ | 25 (4.9%) | 26 (4.5%) |
| Total | 510 (100.0%) | 574 (100.0%) |
Earnings by Sex by Educational Attainment in Stevensville
Average earnings in Stevensville are $33,500 for men and $17,356 for women, a difference of 48.2%. Men with an educational attainment of bachelor's degree enjoy the highest average annual earnings of $72,604, while those with less than high school education earn the least with $13,000. Women with an educational attainment of graduate degree earn the most with the average annual earnings of $81,000, while those with high school diploma education have the smallest earnings of $17,273.
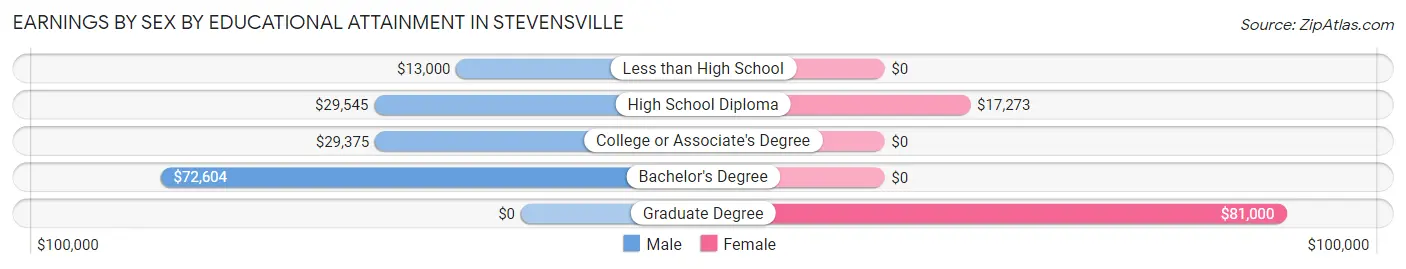
| Educational Attainment | Male Income | Female Income |
| Less than High School | $13,000 | $0 |
| High School Diploma | $29,545 | $17,273 |
| College or Associate's Degree | $29,375 | $0 |
| Bachelor's Degree | $72,604 | $0 |
| Graduate Degree | - | - |
| Total | $33,500 | $17,356 |
Family Income in Stevensville
Family Income Brackets in Stevensville
According to the Stevensville family income data, there are 71 families falling into the $100,000 to $149,999 income range, which is the most common income bracket and makes up 16.3% of all families.
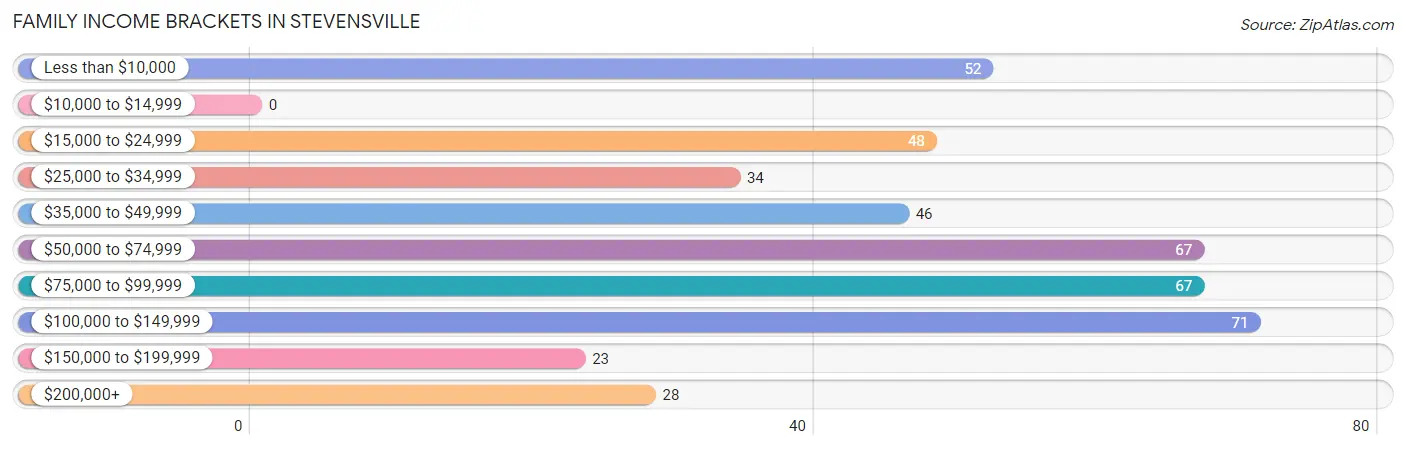
| Income Bracket | # Families | % Families |
| Less than $10,000 | 52 | 11.9% |
| $10,000 to $14,999 | 0 | 0.0% |
| $15,000 to $24,999 | 48 | 11.0% |
| $25,000 to $34,999 | 34 | 7.8% |
| $35,000 to $49,999 | 46 | 10.6% |
| $50,000 to $74,999 | 67 | 15.4% |
| $75,000 to $99,999 | 67 | 15.4% |
| $100,000 to $149,999 | 71 | 16.3% |
| $150,000 to $199,999 | 23 | 5.3% |
| $200,000+ | 28 | 6.4% |
Family Income by Famaliy Size in Stevensville
4-person families (65 | 14.9%) account for the highest median family income in Stevensville with $99,145 per family, while 2-person families (197 | 45.2%) have the highest median income of $26,562 per family member.
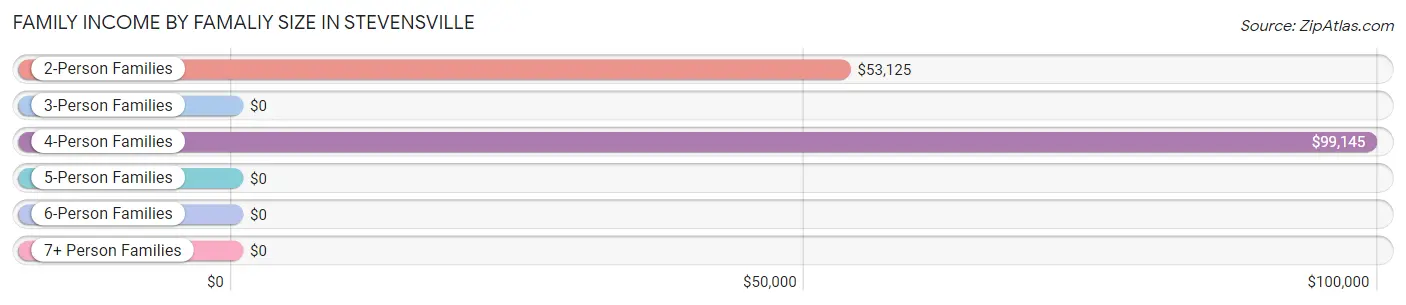
| Income Bracket | # Families | Median Income |
| 2-Person Families | 197 (45.2%) | $53,125 |
| 3-Person Families | 111 (25.5%) | $0 |
| 4-Person Families | 65 (14.9%) | $99,145 |
| 5-Person Families | 53 (12.2%) | $0 |
| 6-Person Families | 10 (2.3%) | $0 |
| 7+ Person Families | 0 (0.0%) | $0 |
| Total | 436 (100.0%) | $61,250 |
Family Income by Number of Earners in Stevensville
The median family income in Stevensville is $61,250, with families comprising 3+ earners (32) having the highest median family income of $107,500, while families with 1 earner (143) have the lowest median family income of $21,926, accounting for 7.3% and 32.8% of families, respectively.
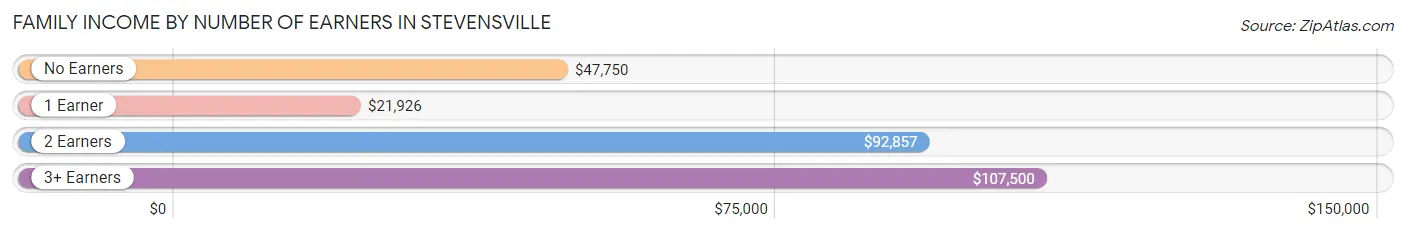
| Number of Earners | # Families | Median Income |
| No Earners | 65 (14.9%) | $47,750 |
| 1 Earner | 143 (32.8%) | $21,926 |
| 2 Earners | 196 (45.0%) | $92,857 |
| 3+ Earners | 32 (7.3%) | $107,500 |
| Total | 436 (100.0%) | $61,250 |
Household Income in Stevensville
Household Income Brackets in Stevensville
With 167 households falling in the category, the $35,000 to $49,999 income range is the most frequent in Stevensville, accounting for 18.3% of all households. In contrast, only 23 households (2.5%) fall into the $150,000 to $199,999 income bracket, making it the least populous group.
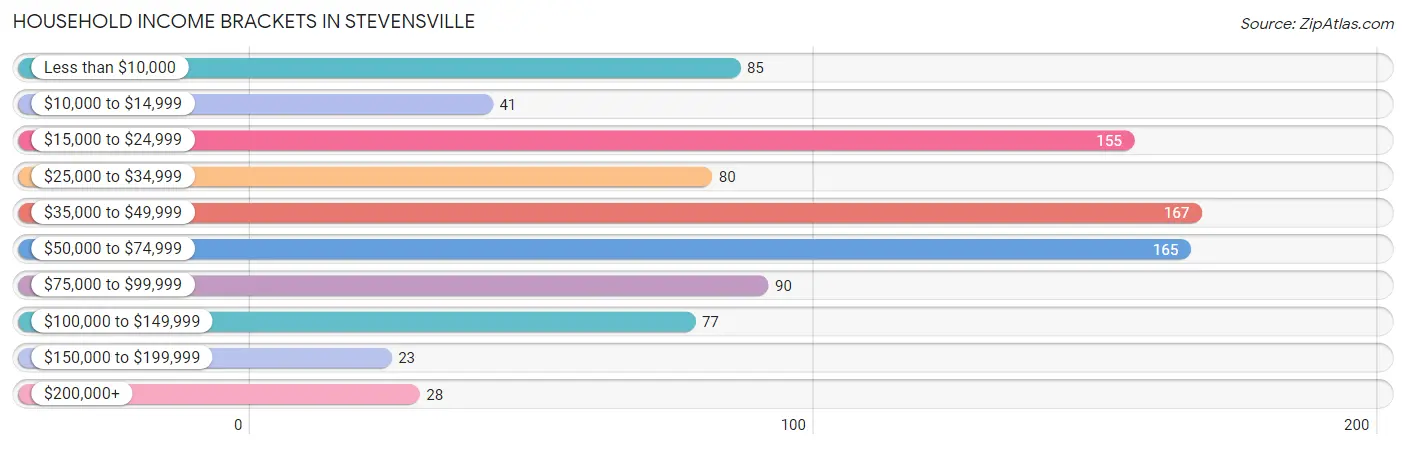
| Income Bracket | # Households | % Households |
| Less than $10,000 | 85 | 9.3% |
| $10,000 to $14,999 | 41 | 4.5% |
| $15,000 to $24,999 | 155 | 17.0% |
| $25,000 to $34,999 | 80 | 8.8% |
| $35,000 to $49,999 | 167 | 18.3% |
| $50,000 to $74,999 | 165 | 18.1% |
| $75,000 to $99,999 | 90 | 9.9% |
| $100,000 to $149,999 | 77 | 8.5% |
| $150,000 to $199,999 | 23 | 2.5% |
| $200,000+ | 28 | 3.1% |
Household Income by Householder Age in Stevensville
The median household income in Stevensville is $39,836, with the highest median household income of $53,194 found in the 25 to 44 years age bracket for the primary householder. A total of 300 households (32.9%) fall into this category. Meanwhile, the 65+ years age bracket for the primary householder has the lowest median household income of $24,816, with 309 households (33.9%) in this group.
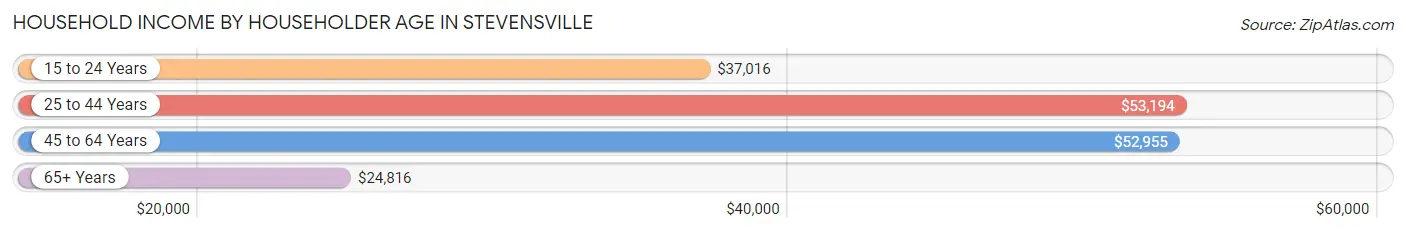
| Income Bracket | # Households | Median Income |
| 15 to 24 Years | 50 (5.5%) | $37,016 |
| 25 to 44 Years | 300 (32.9%) | $53,194 |
| 45 to 64 Years | 252 (27.7%) | $52,955 |
| 65+ Years | 309 (33.9%) | $24,816 |
| Total | 911 (100.0%) | $39,836 |
Poverty in Stevensville
Income Below Poverty by Sex and Age in Stevensville
With 18.0% poverty level for males and 29.4% for females among the residents of Stevensville, 12 to 14 year old males and 12 to 14 year old females are the most vulnerable to poverty, with 35 males (89.7%) and 35 females (100.0%) in their respective age groups living below the poverty level.
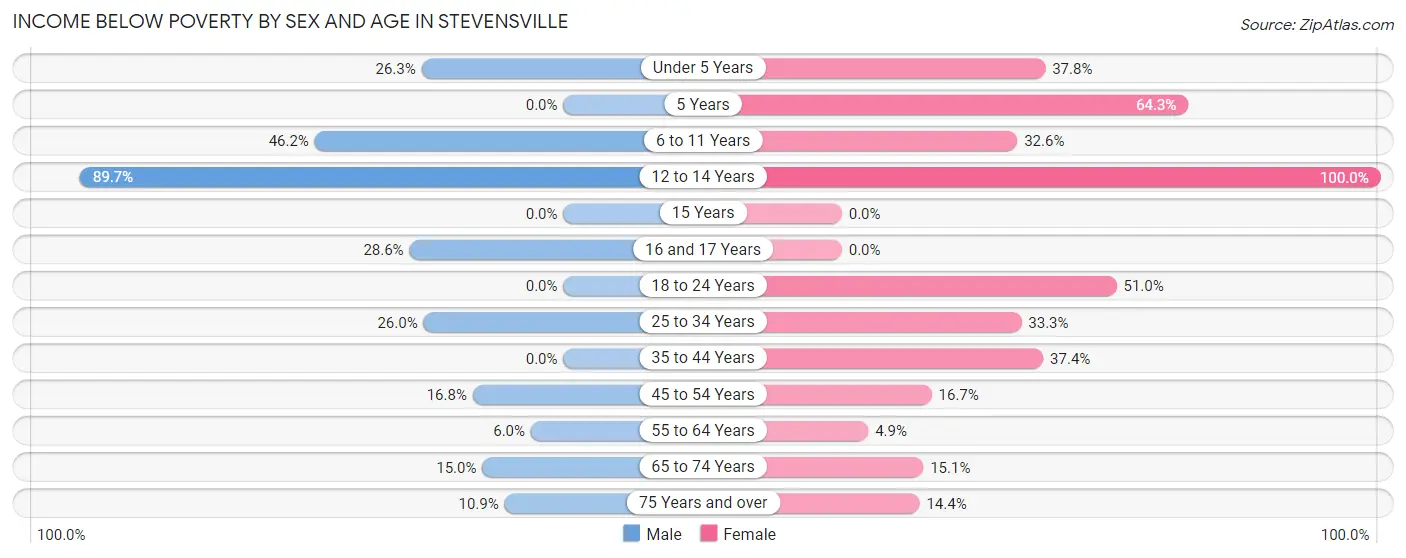
| Age Bracket | Male | Female |
| Under 5 Years | 10 (26.3%) | 37 (37.8%) |
| 5 Years | 0 (0.0%) | 9 (64.3%) |
| 6 to 11 Years | 36 (46.2%) | 28 (32.6%) |
| 12 to 14 Years | 35 (89.7%) | 35 (100.0%) |
| 15 Years | 0 (0.0%) | 0 (0.0%) |
| 16 and 17 Years | 6 (28.6%) | 0 (0.0%) |
| 18 to 24 Years | 0 (0.0%) | 51 (51.0%) |
| 25 to 34 Years | 27 (26.0%) | 27 (33.3%) |
| 35 to 44 Years | 0 (0.0%) | 77 (37.4%) |
| 45 to 54 Years | 18 (16.8%) | 14 (16.7%) |
| 55 to 64 Years | 7 (6.0%) | 7 (4.9%) |
| 65 to 74 Years | 20 (15.0%) | 13 (15.1%) |
| 75 Years and over | 6 (10.9%) | 15 (14.4%) |
| Total | 165 (18.0%) | 313 (29.4%) |
Income Above Poverty by Sex and Age in Stevensville
According to the poverty statistics in Stevensville, males aged 5 years and females aged 15 years are the age groups that are most secure financially, with 100.0% of males and 100.0% of females in these age groups living above the poverty line.
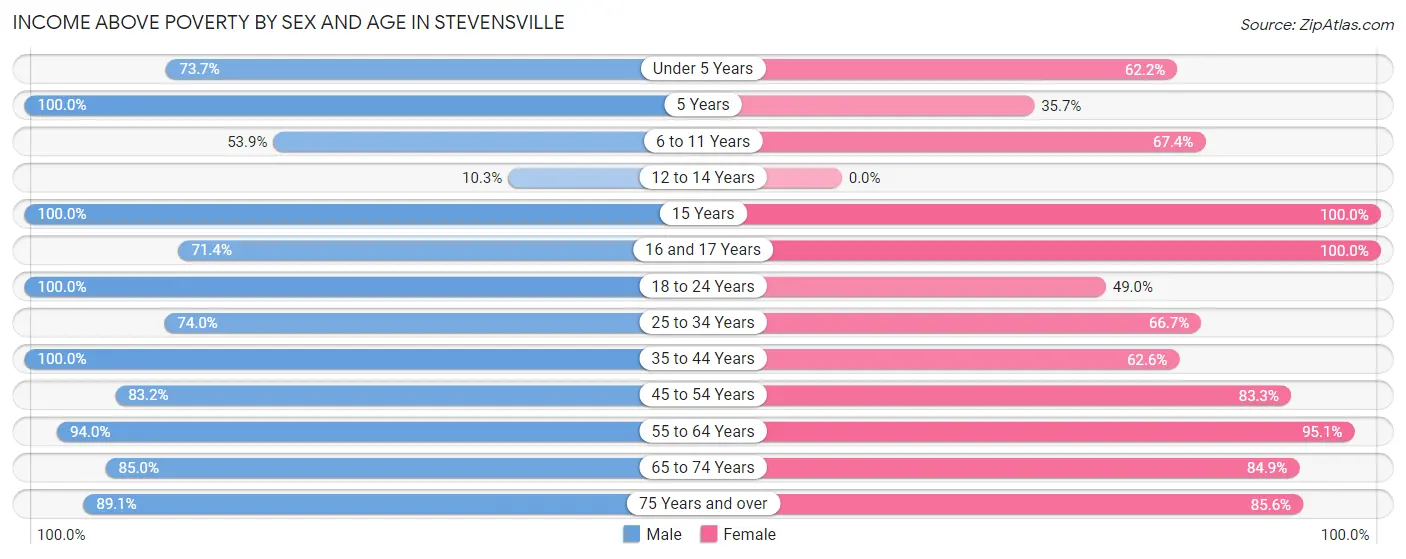
| Age Bracket | Male | Female |
| Under 5 Years | 28 (73.7%) | 61 (62.2%) |
| 5 Years | 27 (100.0%) | 5 (35.7%) |
| 6 to 11 Years | 42 (53.8%) | 58 (67.4%) |
| 12 to 14 Years | 4 (10.3%) | 0 (0.0%) |
| 15 Years | 6 (100.0%) | 6 (100.0%) |
| 16 and 17 Years | 15 (71.4%) | 20 (100.0%) |
| 18 to 24 Years | 66 (100.0%) | 49 (49.0%) |
| 25 to 34 Years | 77 (74.0%) | 54 (66.7%) |
| 35 to 44 Years | 127 (100.0%) | 129 (62.6%) |
| 45 to 54 Years | 89 (83.2%) | 70 (83.3%) |
| 55 to 64 Years | 109 (94.0%) | 136 (95.1%) |
| 65 to 74 Years | 113 (85.0%) | 73 (84.9%) |
| 75 Years and over | 49 (89.1%) | 89 (85.6%) |
| Total | 752 (82.0%) | 750 (70.6%) |
Income Below Poverty Among Married-Couple Families in Stevensville
The poverty statistics for married-couple families in Stevensville show that 8.9% or 25 of the total 281 families live below the poverty line. Families with 3 or 4 children have the highest poverty rate of 14.7%, comprising of 5 families. On the other hand, families with 1 or 2 children have the lowest poverty rate of 4.9%, which includes 4 families.
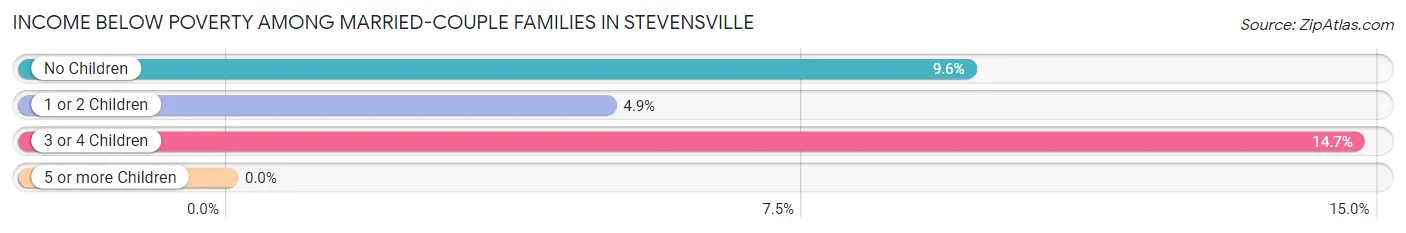
| Children | Above Poverty | Below Poverty |
| No Children | 150 (90.4%) | 16 (9.6%) |
| 1 or 2 Children | 77 (95.1%) | 4 (4.9%) |
| 3 or 4 Children | 29 (85.3%) | 5 (14.7%) |
| 5 or more Children | 0 (0.0%) | 0 (0.0%) |
| Total | 256 (91.1%) | 25 (8.9%) |
Income Below Poverty Among Single-Parent Households in Stevensville
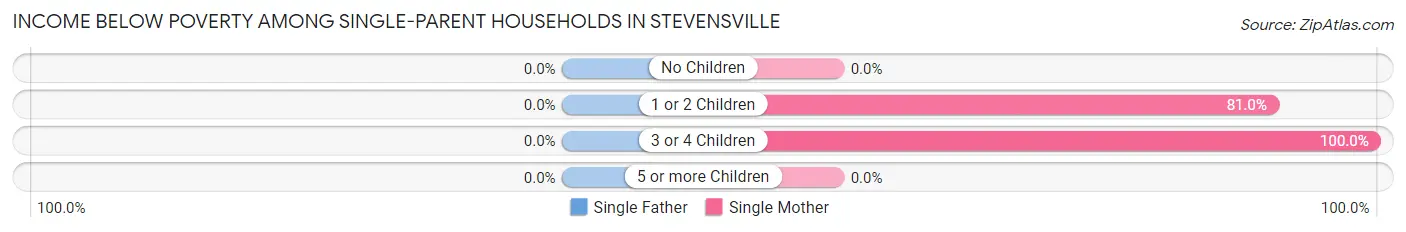
| Children | Single Father | Single Mother |
| No Children | 0 (0.0%) | 0 (0.0%) |
| 1 or 2 Children | 0 (0.0%) | 47 (81.0%) |
| 3 or 4 Children | 0 (0.0%) | 17 (100.0%) |
| 5 or more Children | 0 (0.0%) | 0 (0.0%) |
| Total | 0 (0.0%) | 64 (59.3%) |
Income Below Poverty Among Married-Couple vs Single-Parent Households in Stevensville
The poverty data for Stevensville shows that 25 of the married-couple family households (8.9%) and 64 of the single-parent households (41.3%) are living below the poverty level. Within the married-couple family households, those with 3 or 4 children have the highest poverty rate, with 5 households (14.7%) falling below the poverty line. Among the single-parent households, those with 3 or 4 children have the highest poverty rate, with 17 household (100.0%) living below poverty.
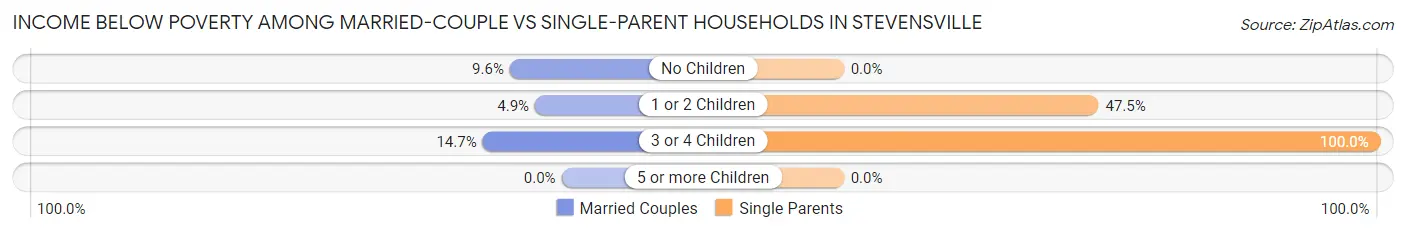
| Children | Married-Couple Families | Single-Parent Households |
| No Children | 16 (9.6%) | 0 (0.0%) |
| 1 or 2 Children | 4 (4.9%) | 47 (47.5%) |
| 3 or 4 Children | 5 (14.7%) | 17 (100.0%) |
| 5 or more Children | 0 (0.0%) | 0 (0.0%) |
| Total | 25 (8.9%) | 64 (41.3%) |
Race in Stevensville
The most populous races in Stevensville are White / Caucasian (1,904 | 93.4%), Two or more Races (107 | 5.2%), and Hispanic or Latino (40 | 2.0%).
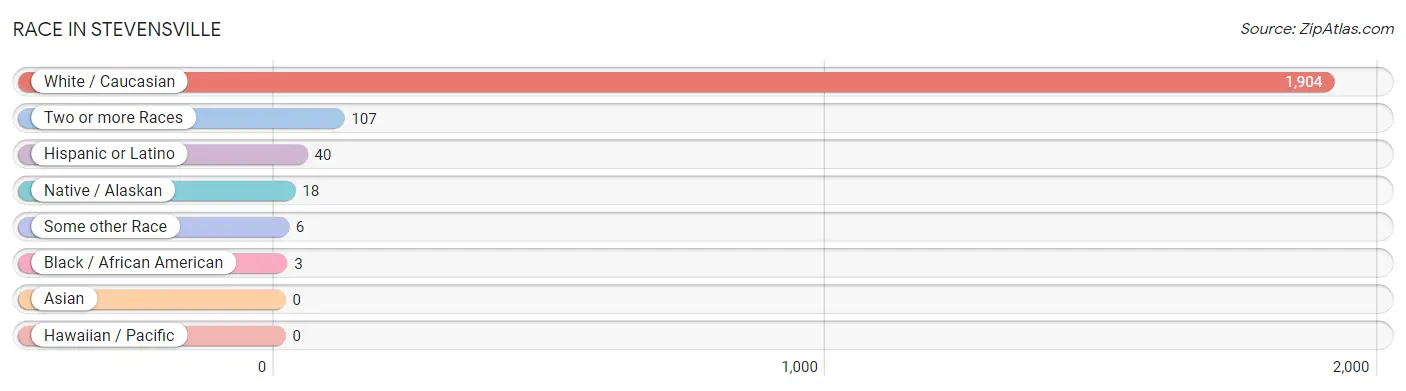
| Race | # Population | % Population |
| Asian | 0 | 0.0% |
| Black / African American | 3 | 0.2% |
| Hawaiian / Pacific | 0 | 0.0% |
| Hispanic or Latino | 40 | 2.0% |
| Native / Alaskan | 18 | 0.9% |
| White / Caucasian | 1,904 | 93.4% |
| Two or more Races | 107 | 5.2% |
| Some other Race | 6 | 0.3% |
| Total | 2,038 | 100.0% |
Ancestry in Stevensville
The most populous ancestries reported in Stevensville are German (517 | 25.4%), Irish (369 | 18.1%), Italian (202 | 9.9%), English (187 | 9.2%), and Norwegian (85 | 4.2%), together accounting for 66.7% of all Stevensville residents.
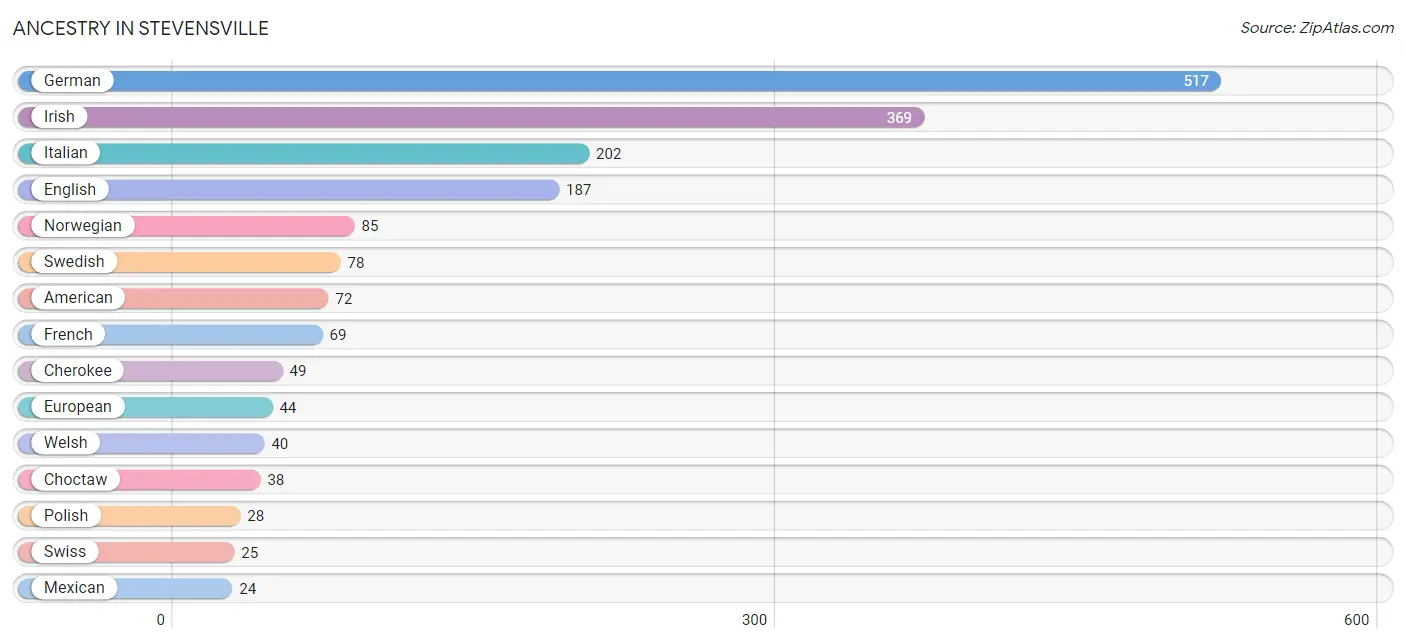
| Ancestry | # Population | % Population |
| American | 72 | 3.5% |
| Blackfeet | 18 | 0.9% |
| British | 5 | 0.3% |
| Bulgarian | 12 | 0.6% |
| Cherokee | 49 | 2.4% |
| Choctaw | 38 | 1.9% |
| Danish | 14 | 0.7% |
| Dutch | 20 | 1.0% |
| English | 187 | 9.2% |
| European | 44 | 2.2% |
| Finnish | 11 | 0.5% |
| French | 69 | 3.4% |
| French Canadian | 10 | 0.5% |
| German | 517 | 25.4% |
| German Russian | 5 | 0.3% |
| Hungarian | 1 | 0.1% |
| Indian (Asian) | 13 | 0.6% |
| Irish | 369 | 18.1% |
| Italian | 202 | 9.9% |
| Korean | 10 | 0.5% |
| Mexican | 24 | 1.2% |
| Native Hawaiian | 13 | 0.6% |
| Norwegian | 85 | 4.2% |
| Polish | 28 | 1.4% |
| Puerto Rican | 4 | 0.2% |
| Romanian | 5 | 0.3% |
| Russian | 17 | 0.8% |
| Scandinavian | 5 | 0.3% |
| Scotch-Irish | 21 | 1.0% |
| Scottish | 23 | 1.1% |
| Slovene | 6 | 0.3% |
| Spaniard | 3 | 0.2% |
| Spanish | 9 | 0.4% |
| Swedish | 78 | 3.8% |
| Swiss | 25 | 1.2% |
| Welsh | 40 | 2.0% | View All 36 Rows |
Immigrants in Stevensville
The most numerous immigrant groups reported in Stevensville came from Eastern Europe (18 | 0.9%), Europe (18 | 0.9%), Bulgaria (12 | 0.6%), Hungary (6 | 0.3%), and Canada (5 | 0.3%), together accounting for 2.9% of all Stevensville residents.
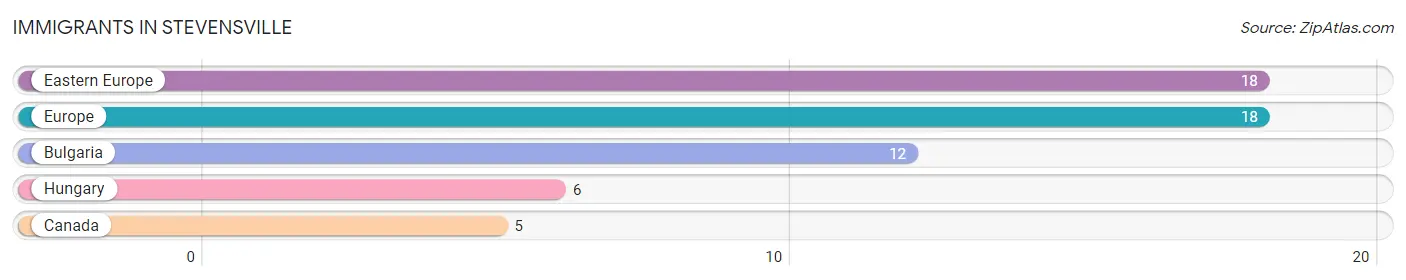
| Immigration Origin | # Population | % Population |
| Bulgaria | 12 | 0.6% |
| Canada | 5 | 0.3% |
| Eastern Europe | 18 | 0.9% |
| Europe | 18 | 0.9% |
| Hungary | 6 | 0.3% | View All 5 Rows |
Sex and Age in Stevensville
Sex and Age in Stevensville
The most populous age groups in Stevensville are 5 to 9 Years (111 | 11.9%) for men and 35 to 39 Years (144 | 13.1%) for women.
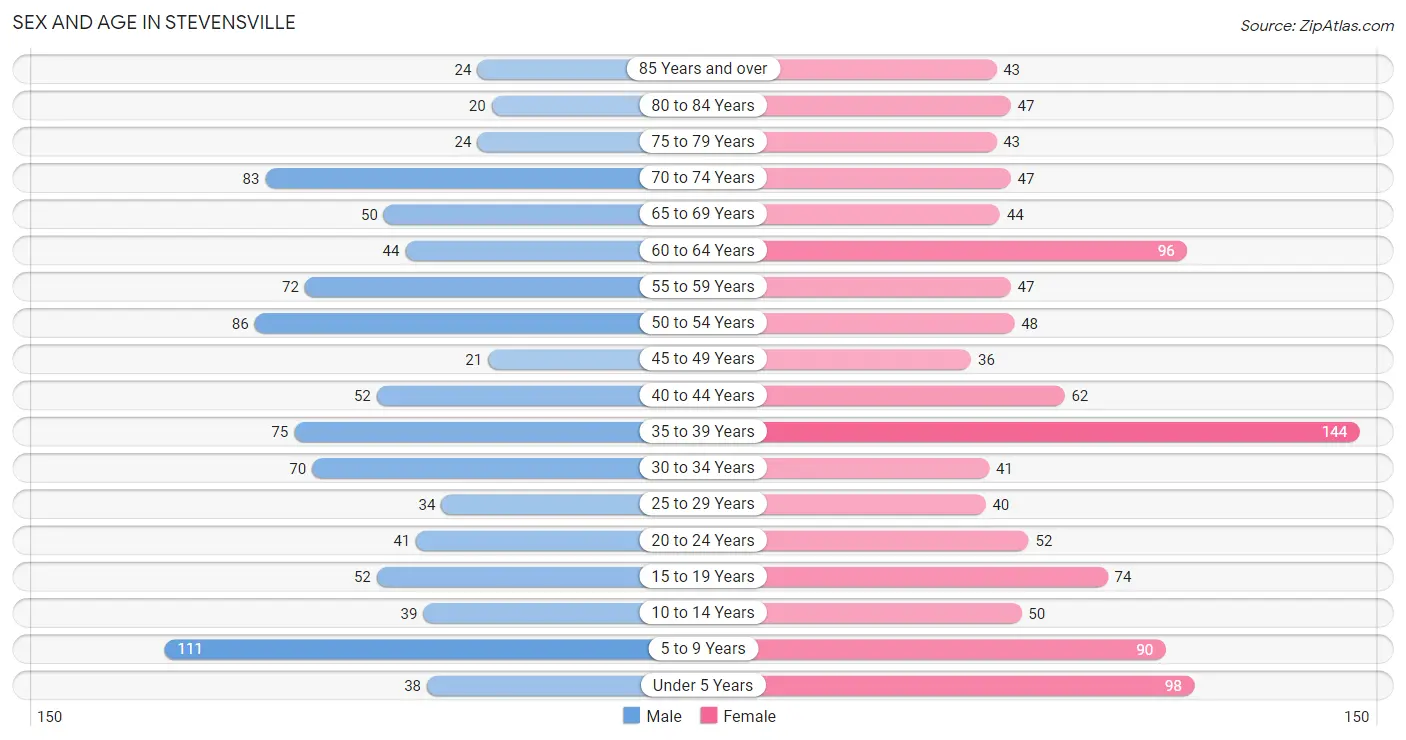
| Age Bracket | Male | Female |
| Under 5 Years | 38 (4.1%) | 98 (8.9%) |
| 5 to 9 Years | 111 (11.9%) | 90 (8.2%) |
| 10 to 14 Years | 39 (4.2%) | 50 (4.5%) |
| 15 to 19 Years | 52 (5.6%) | 74 (6.7%) |
| 20 to 24 Years | 41 (4.4%) | 52 (4.7%) |
| 25 to 29 Years | 34 (3.6%) | 40 (3.6%) |
| 30 to 34 Years | 70 (7.5%) | 41 (3.7%) |
| 35 to 39 Years | 75 (8.0%) | 144 (13.1%) |
| 40 to 44 Years | 52 (5.6%) | 62 (5.6%) |
| 45 to 49 Years | 21 (2.2%) | 36 (3.3%) |
| 50 to 54 Years | 86 (9.2%) | 48 (4.4%) |
| 55 to 59 Years | 72 (7.7%) | 47 (4.3%) |
| 60 to 64 Years | 44 (4.7%) | 96 (8.7%) |
| 65 to 69 Years | 50 (5.3%) | 44 (4.0%) |
| 70 to 74 Years | 83 (8.9%) | 47 (4.3%) |
| 75 to 79 Years | 24 (2.6%) | 43 (3.9%) |
| 80 to 84 Years | 20 (2.1%) | 47 (4.3%) |
| 85 Years and over | 24 (2.6%) | 43 (3.9%) |
| Total | 936 (100.0%) | 1,102 (100.0%) |
Families and Households in Stevensville
Median Family Size in Stevensville
The median family size in Stevensville is 3.12 persons per family, with single female/mother families (108 | 24.8%) accounting for the largest median family size of 3.2 persons per family. On the other hand, married-couple families (281 | 64.4%) represent the smallest median family size with 3.09 persons per family.
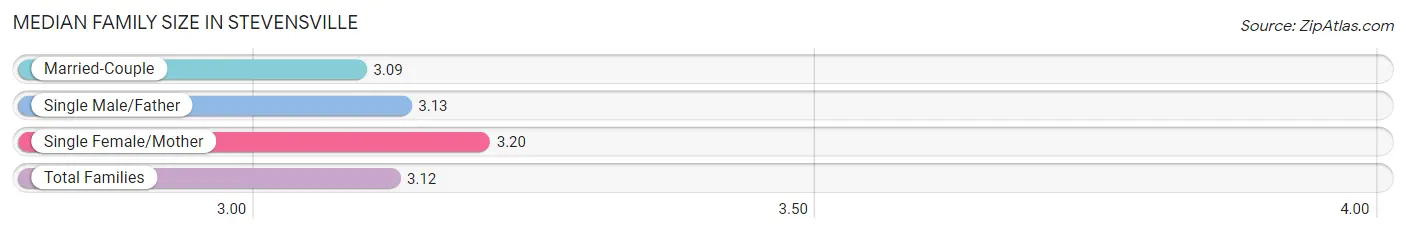
| Family Type | # Families | Family Size |
| Married-Couple | 281 (64.4%) | 3.09 |
| Single Male/Father | 47 (10.8%) | 3.13 |
| Single Female/Mother | 108 (24.8%) | 3.20 |
| Total Families | 436 (100.0%) | 3.12 |
Median Household Size in Stevensville
The median household size in Stevensville is 2.17 persons per household, with single male/father households (47 | 5.2%) accounting for the largest median household size of 3.34 persons per household. non-family households (475 | 52.1%) represent the smallest median household size with 1.26 persons per household.
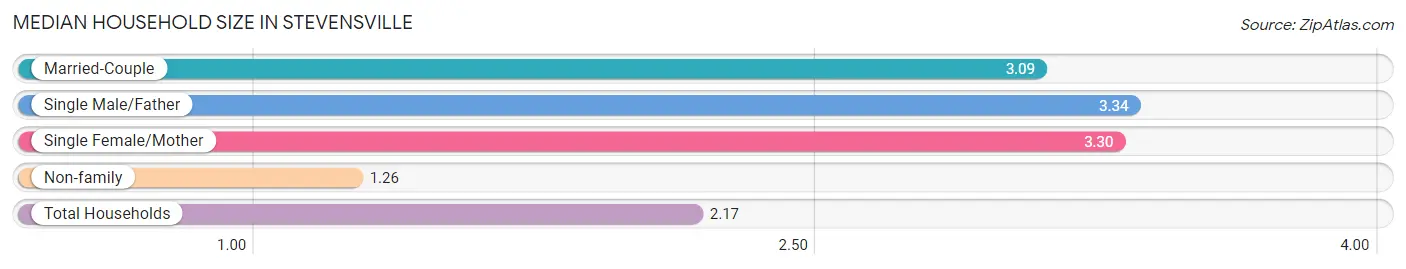
| Household Type | # Households | Household Size |
| Married-Couple | 281 (30.8%) | 3.09 |
| Single Male/Father | 47 (5.2%) | 3.34 |
| Single Female/Mother | 108 (11.9%) | 3.30 |
| Non-family | 475 (52.1%) | 1.26 |
| Total Households | 911 (100.0%) | 2.17 |
Household Size by Marriage Status in Stevensville
Out of a total of 911 households in Stevensville, 436 (47.9%) are family households, while 475 (52.1%) are nonfamily households. The most numerous type of family households are 2-person households, comprising 197, and the most common type of nonfamily households are 1-person households, comprising 389.
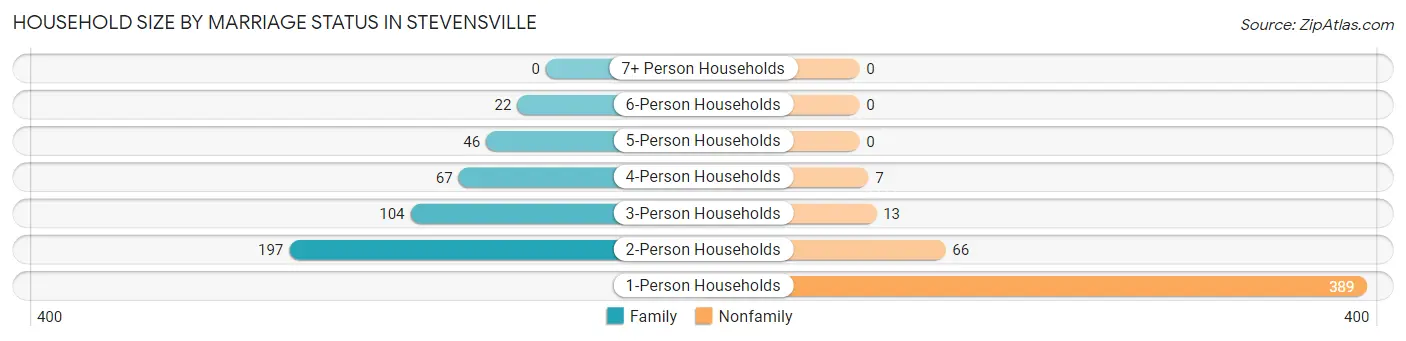
| Household Size | Family Households | Nonfamily Households |
| 1-Person Households | - | 389 (42.7%) |
| 2-Person Households | 197 (21.6%) | 66 (7.2%) |
| 3-Person Households | 104 (11.4%) | 13 (1.4%) |
| 4-Person Households | 67 (7.3%) | 7 (0.8%) |
| 5-Person Households | 46 (5.1%) | 0 (0.0%) |
| 6-Person Households | 22 (2.4%) | 0 (0.0%) |
| 7+ Person Households | 0 (0.0%) | 0 (0.0%) |
| Total | 436 (47.9%) | 475 (52.1%) |
Female Fertility in Stevensville
Fertility by Age in Stevensville
Average fertility rate in Stevensville is 85.0 births per 1,000 women. Women in the age bracket of 15 to 19 years have the highest fertility rate with 135.0 births per 1,000 women. Women in the age bracket of 35 to 50 years acount for 56.4% of all women with births.
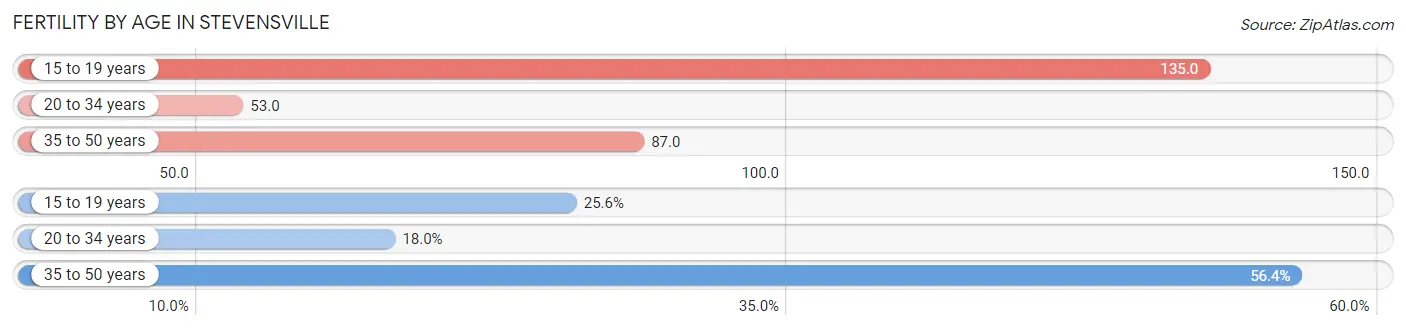
| Age Bracket | Women with Births | Births / 1,000 Women |
| 15 to 19 years | 10 (25.6%) | 135.0 |
| 20 to 34 years | 7 (17.9%) | 53.0 |
| 35 to 50 years | 22 (56.4%) | 87.0 |
| Total | 39 (100.0%) | 85.0 |
Fertility by Age by Marriage Status in Stevensville
74.4% of women with births (39) in Stevensville are married. The highest percentage of unmarried women with births falls into 15 to 19 years age bracket with 100.0% of them unmarried at the time of birth, while the lowest percentage of unmarried women with births belong to 20 to 34 years age bracket with 0.0% of them unmarried.
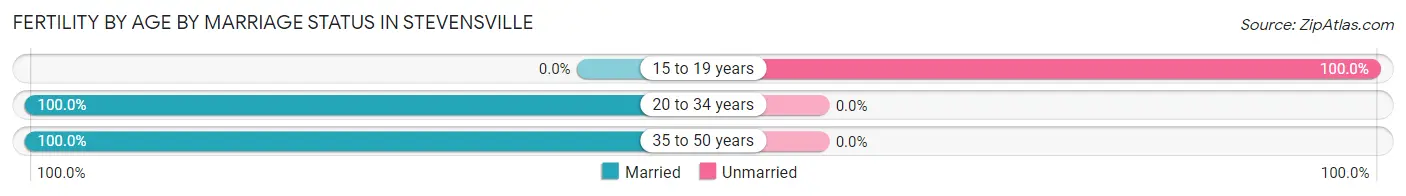
| Age Bracket | Married | Unmarried |
| 15 to 19 years | 0 (0.0%) | 10 (100.0%) |
| 20 to 34 years | 7 (100.0%) | 0 (0.0%) |
| 35 to 50 years | 22 (100.0%) | 0 (0.0%) |
| Total | 29 (74.4%) | 10 (25.6%) |
Fertility by Education in Stevensville
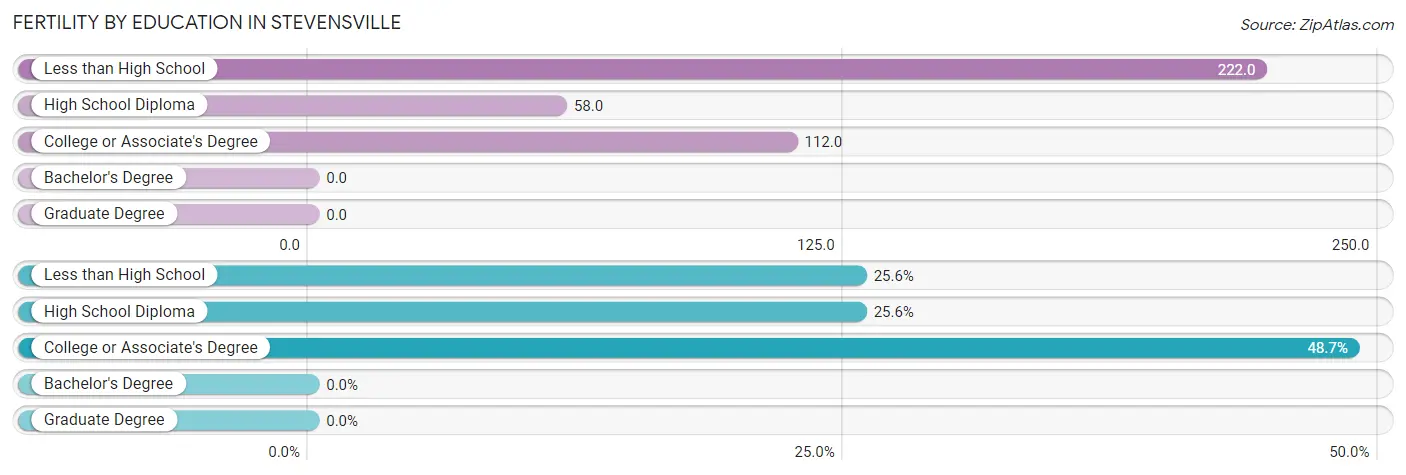
| Educational Attainment | Women with Births | Births / 1,000 Women |
| Less than High School | 10 (25.6%) | 222.0 |
| High School Diploma | 10 (25.6%) | 58.0 |
| College or Associate's Degree | 19 (48.7%) | 112.0 |
| Bachelor's Degree | 0 (0.0%) | 0.0 |
| Graduate Degree | 0 (0.0%) | 0.0 |
| Total | 39 (100.0%) | 85.0 |
Fertility by Education by Marriage Status in Stevensville
25.6% of women with births in Stevensville are unmarried. Women with the educational attainment of high school diploma are most likely to be married with 100.0% of them married at childbirth, while women with the educational attainment of less than high school are least likely to be married with 100.0% of them unmarried at childbirth.
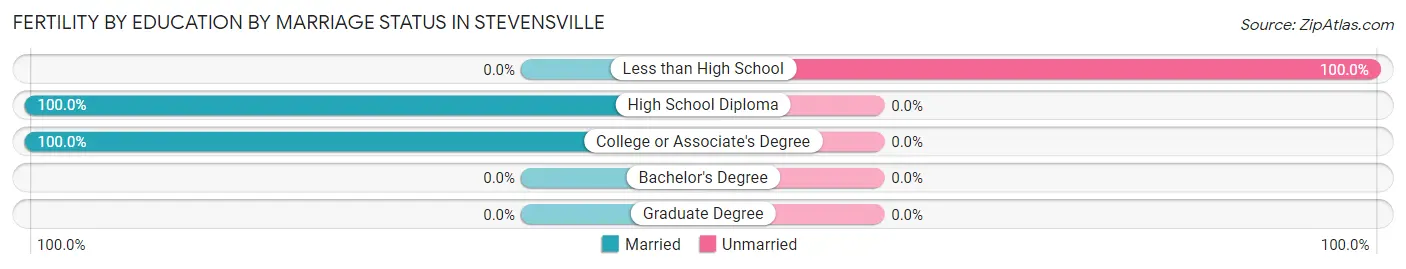
| Educational Attainment | Married | Unmarried |
| Less than High School | 0 (0.0%) | 10 (100.0%) |
| High School Diploma | 10 (100.0%) | 0 (0.0%) |
| College or Associate's Degree | 19 (100.0%) | 0 (0.0%) |
| Bachelor's Degree | 0 (0.0%) | 0 (0.0%) |
| Graduate Degree | 0 (0.0%) | 0 (0.0%) |
| Total | 29 (74.4%) | 10 (25.6%) |
Employment Characteristics in Stevensville
Employment by Class of Employer in Stevensville
Among the 845 employed individuals in Stevensville, private company employees (621 | 73.5%), local government employees (81 | 9.6%), and self-employed (not incorporated) (64 | 7.6%) make up the most common classes of employment.
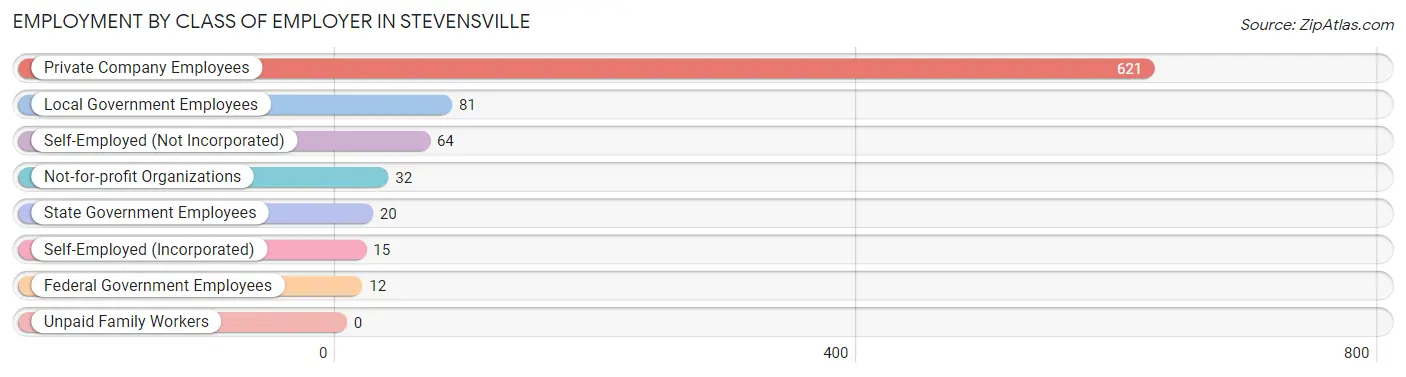
| Employer Class | # Employees | % Employees |
| Private Company Employees | 621 | 73.5% |
| Self-Employed (Incorporated) | 15 | 1.8% |
| Self-Employed (Not Incorporated) | 64 | 7.6% |
| Not-for-profit Organizations | 32 | 3.8% |
| Local Government Employees | 81 | 9.6% |
| State Government Employees | 20 | 2.4% |
| Federal Government Employees | 12 | 1.4% |
| Unpaid Family Workers | 0 | 0.0% |
| Total | 845 | 100.0% |
Employment Status by Age in Stevensville
According to the labor force statistics for Stevensville, out of the total population over 16 years of age (1,600), 60.2% or 963 individuals are in the labor force, with 4.9% or 47 of them unemployed. The age group with the highest labor force participation rate is 20 to 24 years, with 90.3% or 84 individuals in the labor force. Within the labor force, the 45 to 54 years age range has the highest percentage of unemployed individuals, with 16.0% or 26 of them being unemployed.
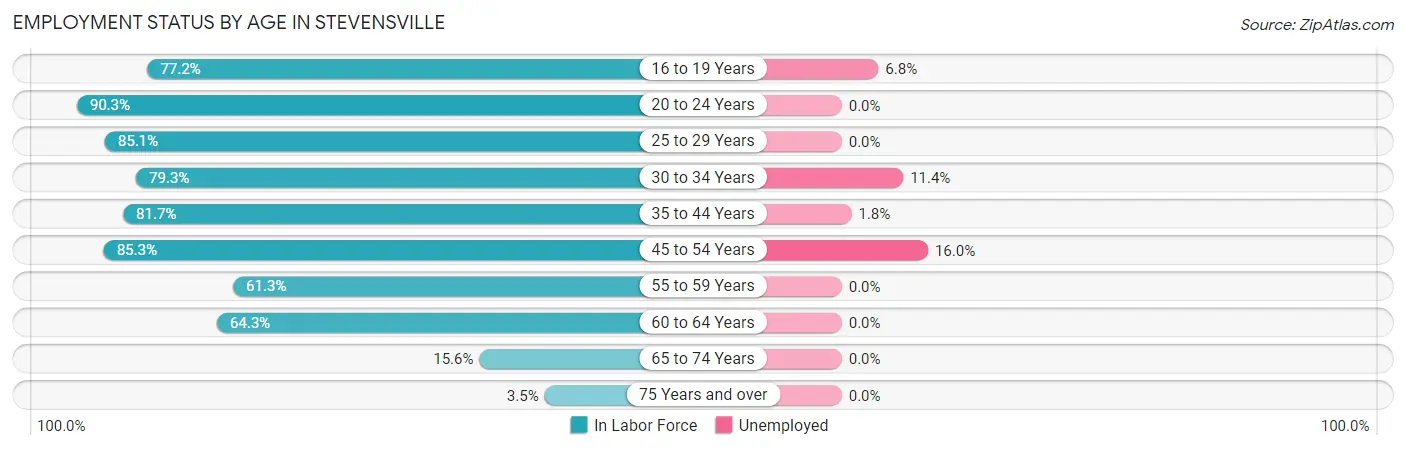
| Age Bracket | In Labor Force | Unemployed |
| 16 to 19 Years | 88 (77.2%) | 6 (6.8%) |
| 20 to 24 Years | 84 (90.3%) | 0 (0.0%) |
| 25 to 29 Years | 63 (85.1%) | 0 (0.0%) |
| 30 to 34 Years | 88 (79.3%) | 10 (11.4%) |
| 35 to 44 Years | 272 (81.7%) | 5 (1.8%) |
| 45 to 54 Years | 163 (85.3%) | 26 (16.0%) |
| 55 to 59 Years | 73 (61.3%) | 0 (0.0%) |
| 60 to 64 Years | 90 (64.3%) | 0 (0.0%) |
| 65 to 74 Years | 35 (15.6%) | 0 (0.0%) |
| 75 Years and over | 7 (3.5%) | 0 (0.0%) |
| Total | 963 (60.2%) | 47 (4.9%) |
Employment Status by Educational Attainment in Stevensville
According to labor force statistics for Stevensville, 77.4% of individuals (749) out of the total population between 25 and 64 years of age (968) are in the labor force, with 5.5% or 41 of them being unemployed. The group with the highest labor force participation rate are those with the educational attainment of bachelor's degree or higher, with 88.2% or 202 individuals in the labor force. Within the labor force, individuals with less than high school education have the highest percentage of unemployment, with 46.8% or 22 of them being unemployed.
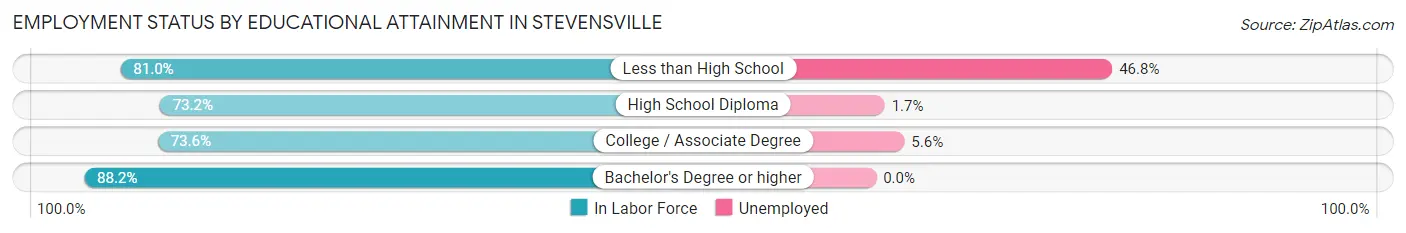
| Educational Attainment | In Labor Force | Unemployed |
| Less than High School | 47 (81.0%) | 27 (46.8%) |
| High School Diploma | 230 (73.2%) | 5 (1.7%) |
| College / Associate Degree | 270 (73.6%) | 21 (5.6%) |
| Bachelor's Degree or higher | 202 (88.2%) | 0 (0.0%) |
| Total | 749 (77.4%) | 53 (5.5%) |
Employment Occupations by Sex in Stevensville
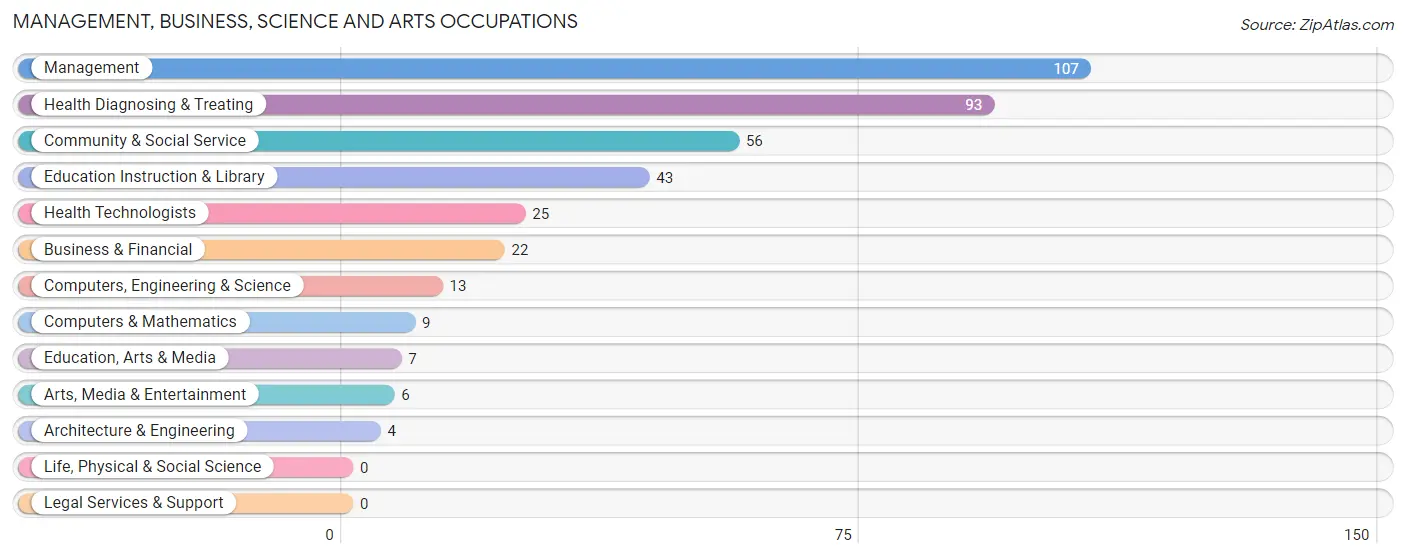
Management, Business, Science and Arts Occupations
The most common Management, Business, Science and Arts occupations in Stevensville are Management (107 | 11.7%), Health Diagnosing & Treating (93 | 10.2%), Community & Social Service (56 | 6.1%), Education Instruction & Library (43 | 4.7%), and Health Technologists (25 | 2.7%).
Management, Business, Science and Arts Occupations by Sex
Within the Management, Business, Science and Arts occupations in Stevensville, the most male-oriented occupations are Architecture & Engineering (100.0%), Education, Arts & Media (100.0%), and Arts, Media & Entertainment (83.3%), while the most female-oriented occupations are Education Instruction & Library (100.0%), Community & Social Service (78.6%), and Health Diagnosing & Treating (74.2%).
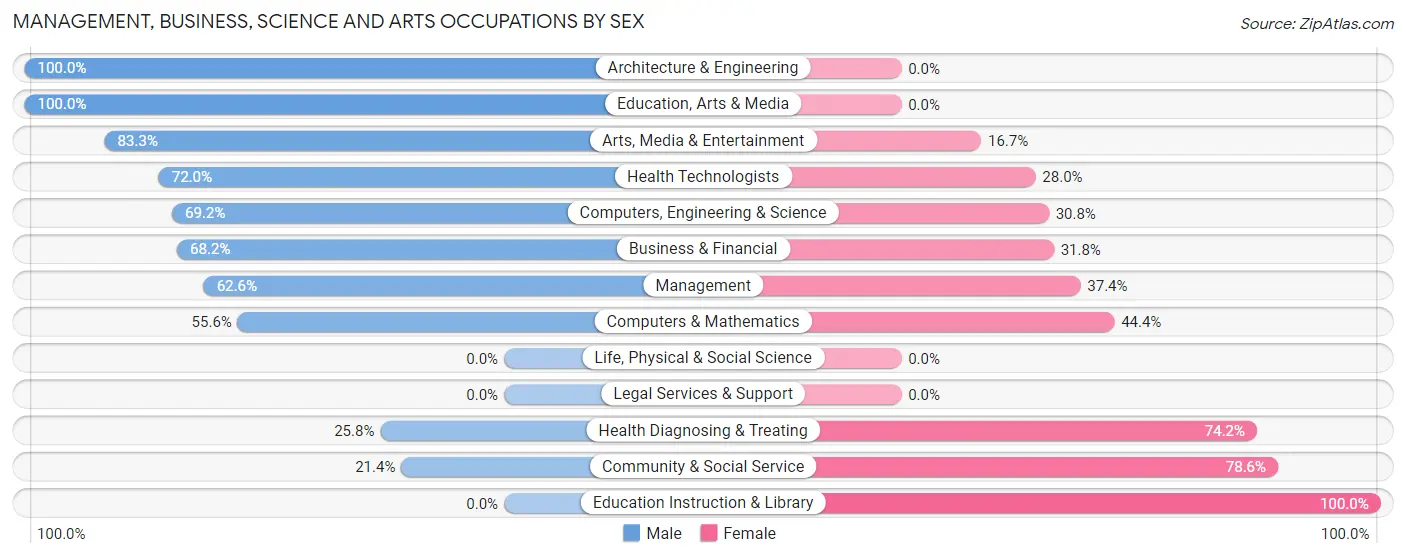
| Occupation | Male | Female |
| Management | 67 (62.6%) | 40 (37.4%) |
| Business & Financial | 15 (68.2%) | 7 (31.8%) |
| Computers, Engineering & Science | 9 (69.2%) | 4 (30.8%) |
| Computers & Mathematics | 5 (55.6%) | 4 (44.4%) |
| Architecture & Engineering | 4 (100.0%) | 0 (0.0%) |
| Life, Physical & Social Science | 0 (0.0%) | 0 (0.0%) |
| Community & Social Service | 12 (21.4%) | 44 (78.6%) |
| Education, Arts & Media | 7 (100.0%) | 0 (0.0%) |
| Legal Services & Support | 0 (0.0%) | 0 (0.0%) |
| Education Instruction & Library | 0 (0.0%) | 43 (100.0%) |
| Arts, Media & Entertainment | 5 (83.3%) | 1 (16.7%) |
| Health Diagnosing & Treating | 24 (25.8%) | 69 (74.2%) |
| Health Technologists | 18 (72.0%) | 7 (28.0%) |
| Total (Category) | 127 (43.6%) | 164 (56.4%) |
| Total (Overall) | 436 (47.6%) | 480 (52.4%) |
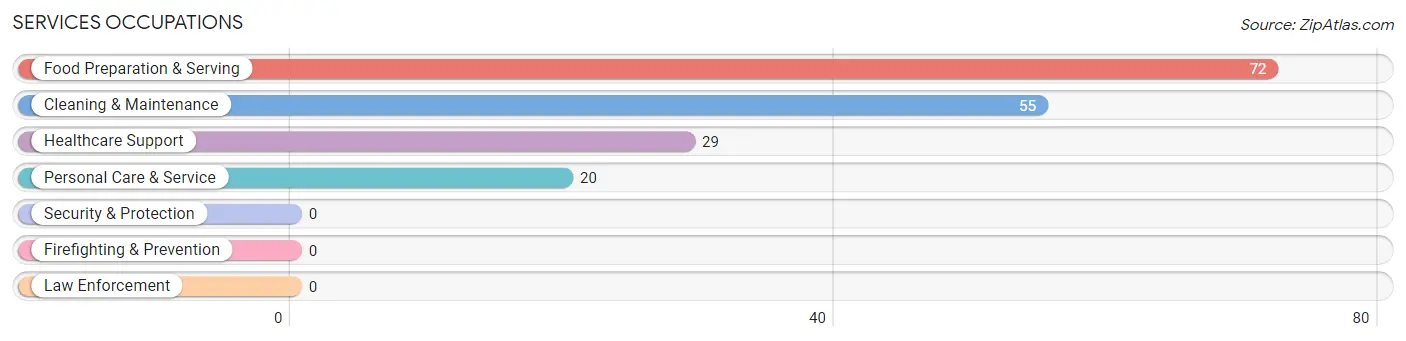
Services Occupations
The most common Services occupations in Stevensville are Food Preparation & Serving (72 | 7.9%), Cleaning & Maintenance (55 | 6.0%), Healthcare Support (29 | 3.2%), and Personal Care & Service (20 | 2.2%).
Services Occupations by Sex
Within the Services occupations in Stevensville, the most male-oriented occupations are Cleaning & Maintenance (30.9%), and Food Preparation & Serving (25.0%), while the most female-oriented occupations are Healthcare Support (100.0%), Personal Care & Service (100.0%), and Food Preparation & Serving (75.0%).
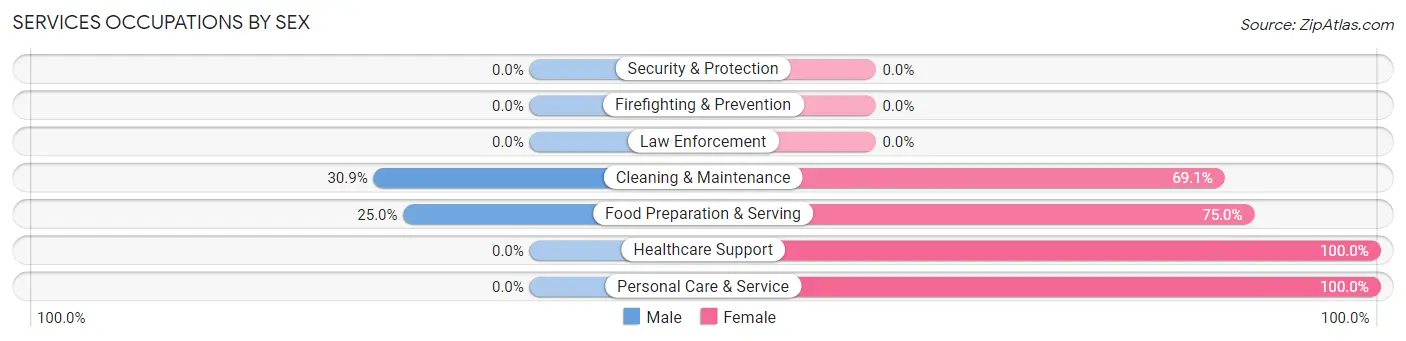
| Occupation | Male | Female |
| Healthcare Support | 0 (0.0%) | 29 (100.0%) |
| Security & Protection | 0 (0.0%) | 0 (0.0%) |
| Firefighting & Prevention | 0 (0.0%) | 0 (0.0%) |
| Law Enforcement | 0 (0.0%) | 0 (0.0%) |
| Food Preparation & Serving | 18 (25.0%) | 54 (75.0%) |
| Cleaning & Maintenance | 17 (30.9%) | 38 (69.1%) |
| Personal Care & Service | 0 (0.0%) | 20 (100.0%) |
| Total (Category) | 35 (19.9%) | 141 (80.1%) |
| Total (Overall) | 436 (47.6%) | 480 (52.4%) |
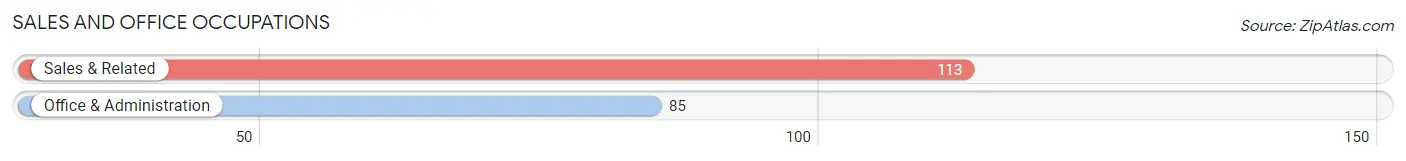
Sales and Office Occupations
The most common Sales and Office occupations in Stevensville are Sales & Related (113 | 12.3%), and Office & Administration (85 | 9.3%).
Sales and Office Occupations by Sex
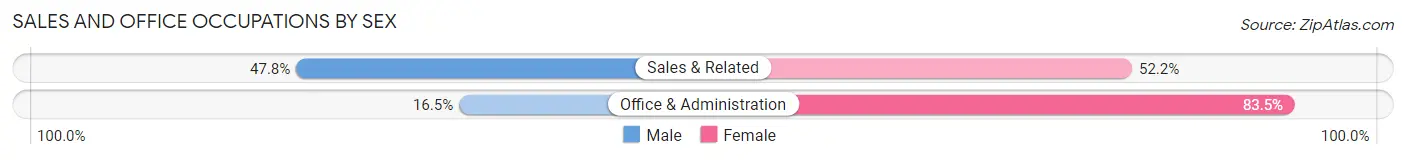
| Occupation | Male | Female |
| Sales & Related | 54 (47.8%) | 59 (52.2%) |
| Office & Administration | 14 (16.5%) | 71 (83.5%) |
| Total (Category) | 68 (34.3%) | 130 (65.7%) |
| Total (Overall) | 436 (47.6%) | 480 (52.4%) |
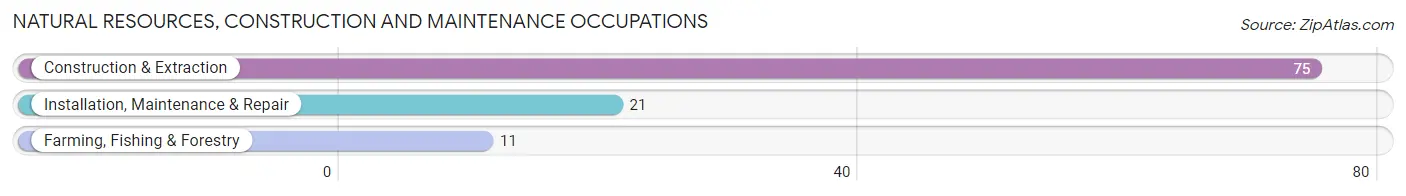
Natural Resources, Construction and Maintenance Occupations
The most common Natural Resources, Construction and Maintenance occupations in Stevensville are Construction & Extraction (75 | 8.2%), Installation, Maintenance & Repair (21 | 2.3%), and Farming, Fishing & Forestry (11 | 1.2%).
Natural Resources, Construction and Maintenance Occupations by Sex
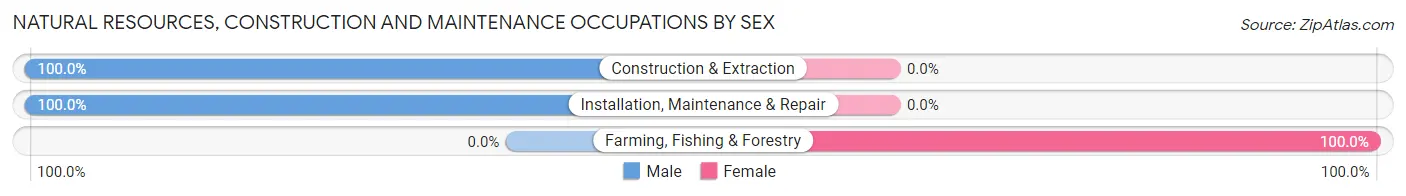
| Occupation | Male | Female |
| Farming, Fishing & Forestry | 0 (0.0%) | 11 (100.0%) |
| Construction & Extraction | 75 (100.0%) | 0 (0.0%) |
| Installation, Maintenance & Repair | 21 (100.0%) | 0 (0.0%) |
| Total (Category) | 96 (89.7%) | 11 (10.3%) |
| Total (Overall) | 436 (47.6%) | 480 (52.4%) |
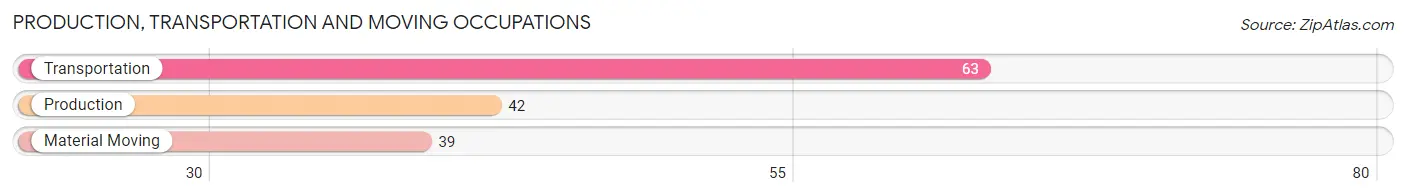
Production, Transportation and Moving Occupations
The most common Production, Transportation and Moving occupations in Stevensville are Transportation (63 | 6.9%), Production (42 | 4.6%), and Material Moving (39 | 4.3%).
Production, Transportation and Moving Occupations by Sex
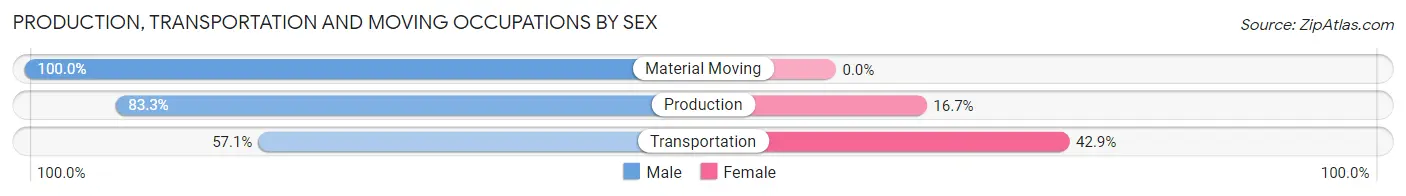
| Occupation | Male | Female |
| Production | 35 (83.3%) | 7 (16.7%) |
| Transportation | 36 (57.1%) | 27 (42.9%) |
| Material Moving | 39 (100.0%) | 0 (0.0%) |
| Total (Category) | 110 (76.4%) | 34 (23.6%) |
| Total (Overall) | 436 (47.6%) | 480 (52.4%) |
Employment Industries by Sex in Stevensville
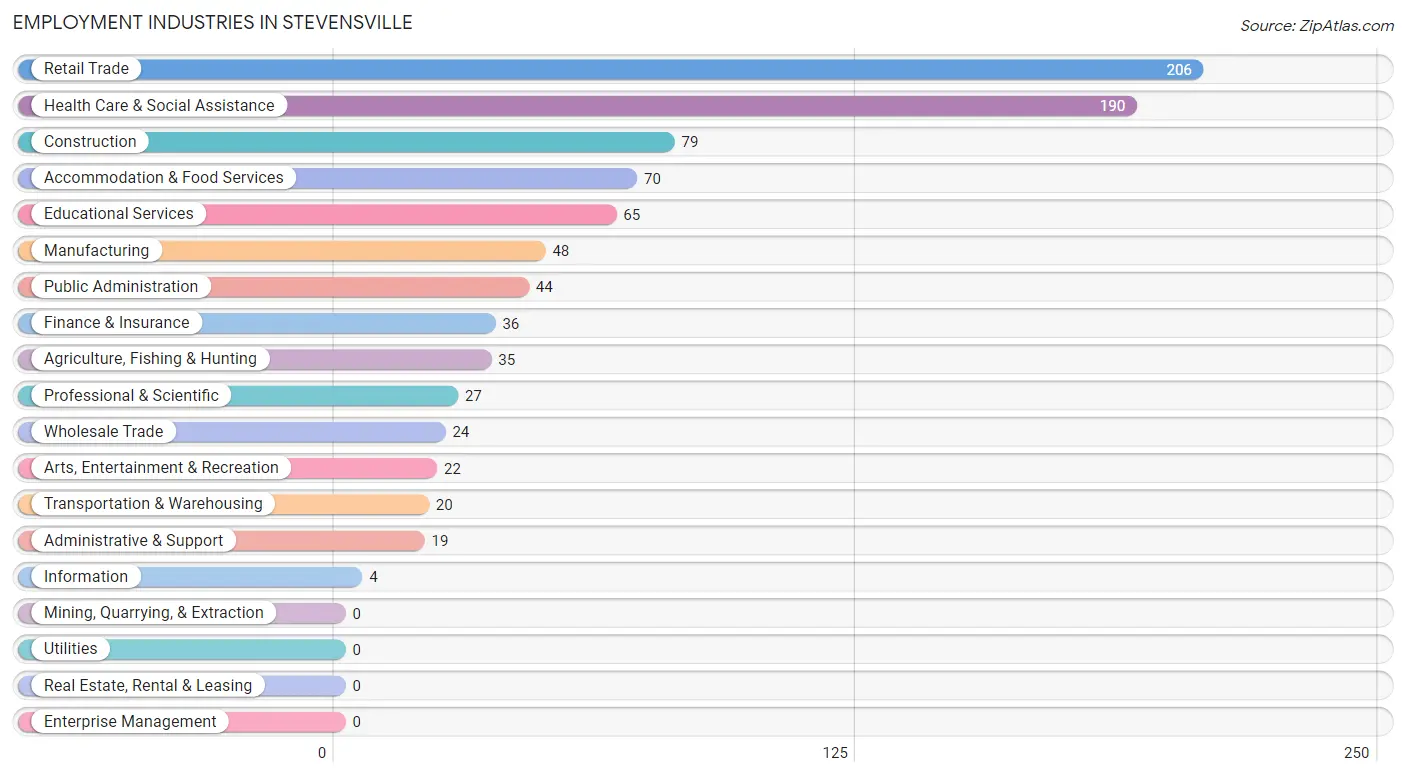
Employment Industries in Stevensville
The major employment industries in Stevensville include Retail Trade (206 | 22.5%), Health Care & Social Assistance (190 | 20.7%), Construction (79 | 8.6%), Accommodation & Food Services (70 | 7.6%), and Educational Services (65 | 7.1%).
Employment Industries by Sex in Stevensville
The Stevensville industries that see more men than women are Construction (100.0%), Manufacturing (100.0%), and Transportation & Warehousing (100.0%), whereas the industries that tend to have a higher number of women are Arts, Entertainment & Recreation (100.0%), Educational Services (92.3%), and Health Care & Social Assistance (86.3%).
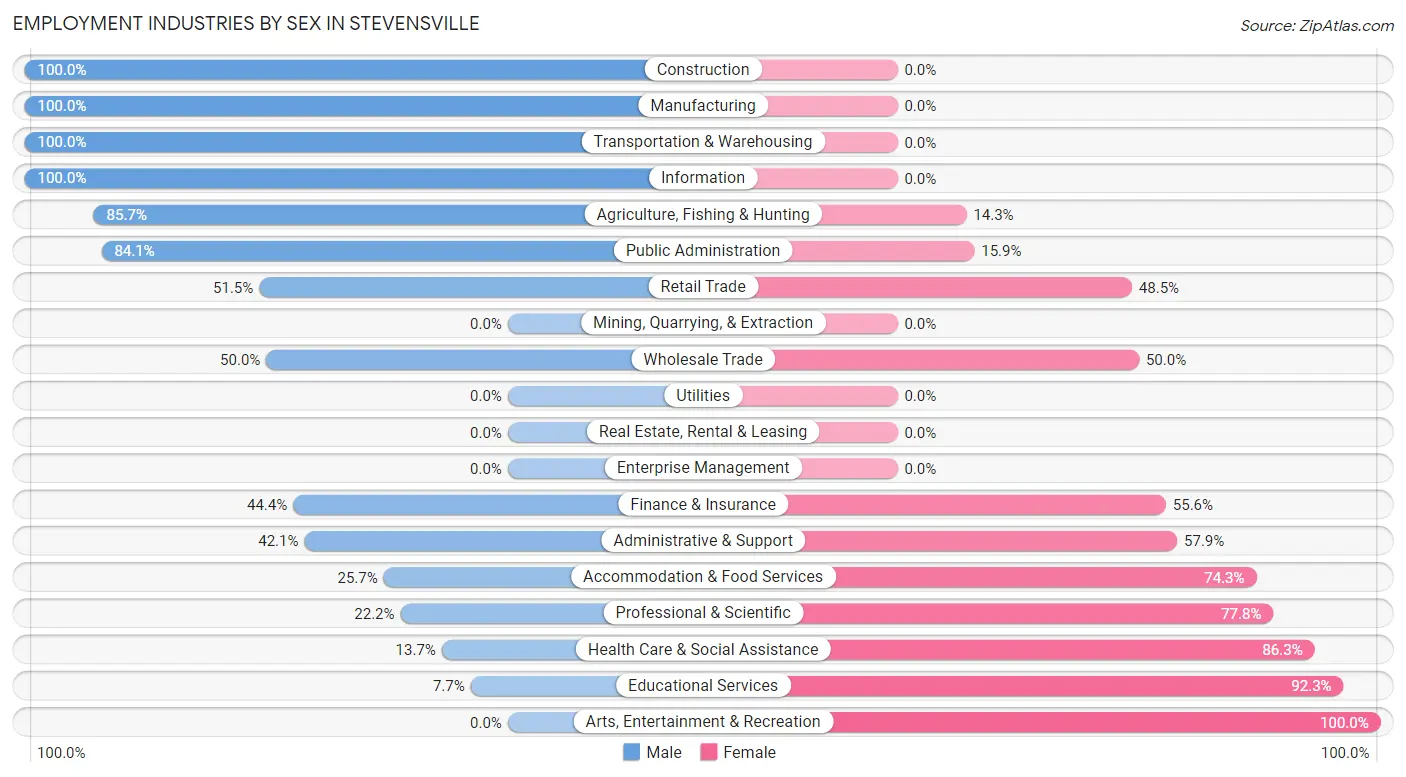
| Industry | Male | Female |
| Agriculture, Fishing & Hunting | 30 (85.7%) | 5 (14.3%) |
| Mining, Quarrying, & Extraction | 0 (0.0%) | 0 (0.0%) |
| Construction | 79 (100.0%) | 0 (0.0%) |
| Manufacturing | 48 (100.0%) | 0 (0.0%) |
| Wholesale Trade | 12 (50.0%) | 12 (50.0%) |
| Retail Trade | 106 (51.5%) | 100 (48.5%) |
| Transportation & Warehousing | 20 (100.0%) | 0 (0.0%) |
| Utilities | 0 (0.0%) | 0 (0.0%) |
| Information | 4 (100.0%) | 0 (0.0%) |
| Finance & Insurance | 16 (44.4%) | 20 (55.6%) |
| Real Estate, Rental & Leasing | 0 (0.0%) | 0 (0.0%) |
| Professional & Scientific | 6 (22.2%) | 21 (77.8%) |
| Enterprise Management | 0 (0.0%) | 0 (0.0%) |
| Administrative & Support | 8 (42.1%) | 11 (57.9%) |
| Educational Services | 5 (7.7%) | 60 (92.3%) |
| Health Care & Social Assistance | 26 (13.7%) | 164 (86.3%) |
| Arts, Entertainment & Recreation | 0 (0.0%) | 22 (100.0%) |
| Accommodation & Food Services | 18 (25.7%) | 52 (74.3%) |
| Public Administration | 37 (84.1%) | 7 (15.9%) |
| Total | 436 (47.6%) | 480 (52.4%) |
Education in Stevensville
School Enrollment in Stevensville
The most common levels of schooling among the 424 students in Stevensville are elementary school (131 | 30.9%), middle school (89 | 21.0%), and high school (58 | 13.7%).
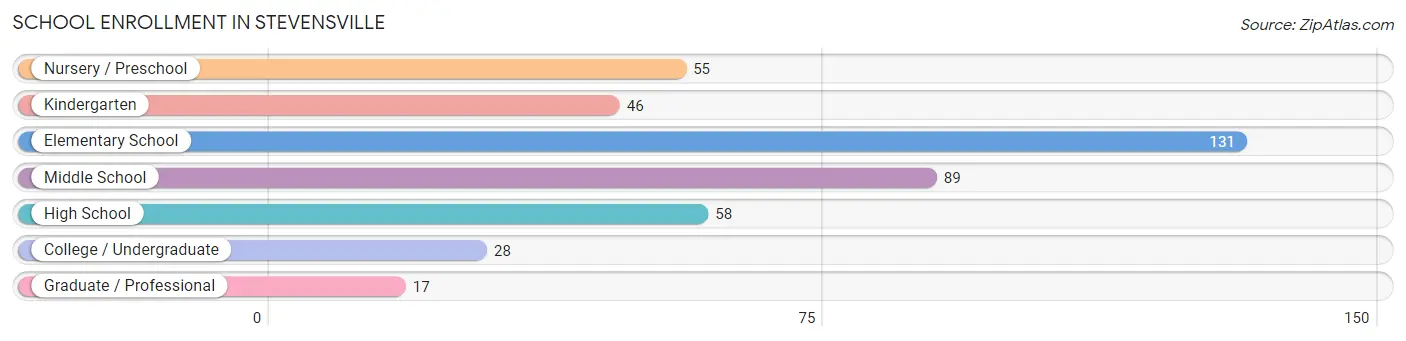
| School Level | # Students | % Students |
| Nursery / Preschool | 55 | 13.0% |
| Kindergarten | 46 | 10.8% |
| Elementary School | 131 | 30.9% |
| Middle School | 89 | 21.0% |
| High School | 58 | 13.7% |
| College / Undergraduate | 28 | 6.6% |
| Graduate / Professional | 17 | 4.0% |
| Total | 424 | 100.0% |
School Enrollment by Age by Funding Source in Stevensville
Out of a total of 424 students who are enrolled in schools in Stevensville, 12 (2.8%) attend a private institution, while the remaining 412 (97.2%) are enrolled in public schools. The age group of 10 to 14 year olds has the highest likelihood of being enrolled in private schools, with 6 (6.7% in the age bracket) enrolled. Conversely, the age group of 3 to 4 year olds has the lowest likelihood of being enrolled in a private school, with 36 (100.0% in the age bracket) attending a public institution.
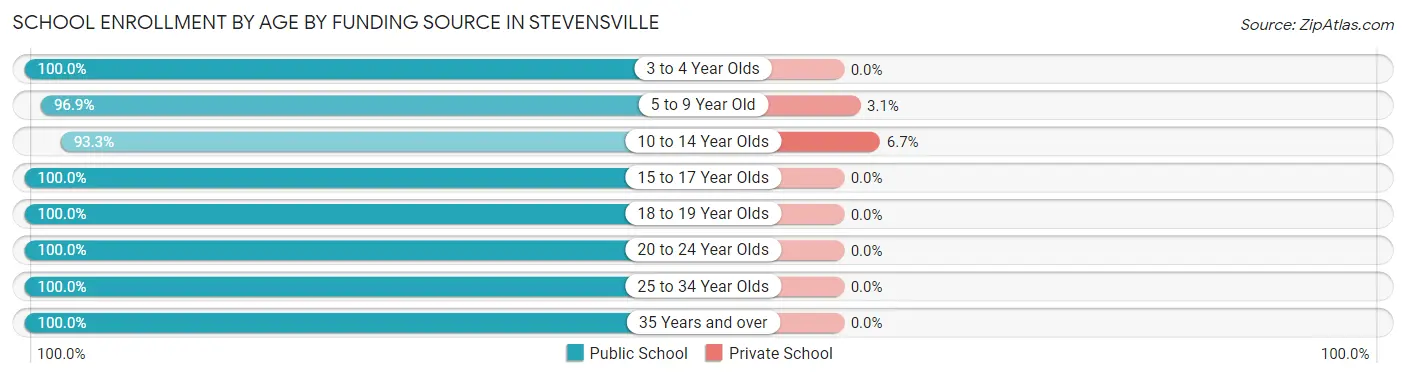
| Age Bracket | Public School | Private School |
| 3 to 4 Year Olds | 36 (100.0%) | 0 (0.0%) |
| 5 to 9 Year Old | 190 (96.9%) | 6 (3.1%) |
| 10 to 14 Year Olds | 83 (93.3%) | 6 (6.7%) |
| 15 to 17 Year Olds | 53 (100.0%) | 0 (0.0%) |
| 18 to 19 Year Olds | 5 (100.0%) | 0 (0.0%) |
| 20 to 24 Year Olds | 28 (100.0%) | 0 (0.0%) |
| 25 to 34 Year Olds | 12 (100.0%) | 0 (0.0%) |
| 35 Years and over | 5 (100.0%) | 0 (0.0%) |
| Total | 412 (97.2%) | 12 (2.8%) |
Educational Attainment by Field of Study in Stevensville
Business (81 | 20.6%), bio, nature & agricultural (79 | 20.1%), education (73 | 18.5%), social sciences (24 | 6.1%), and science & technology (23 | 5.8%) are the most common fields of study among 394 individuals in Stevensville who have obtained a bachelor's degree or higher.
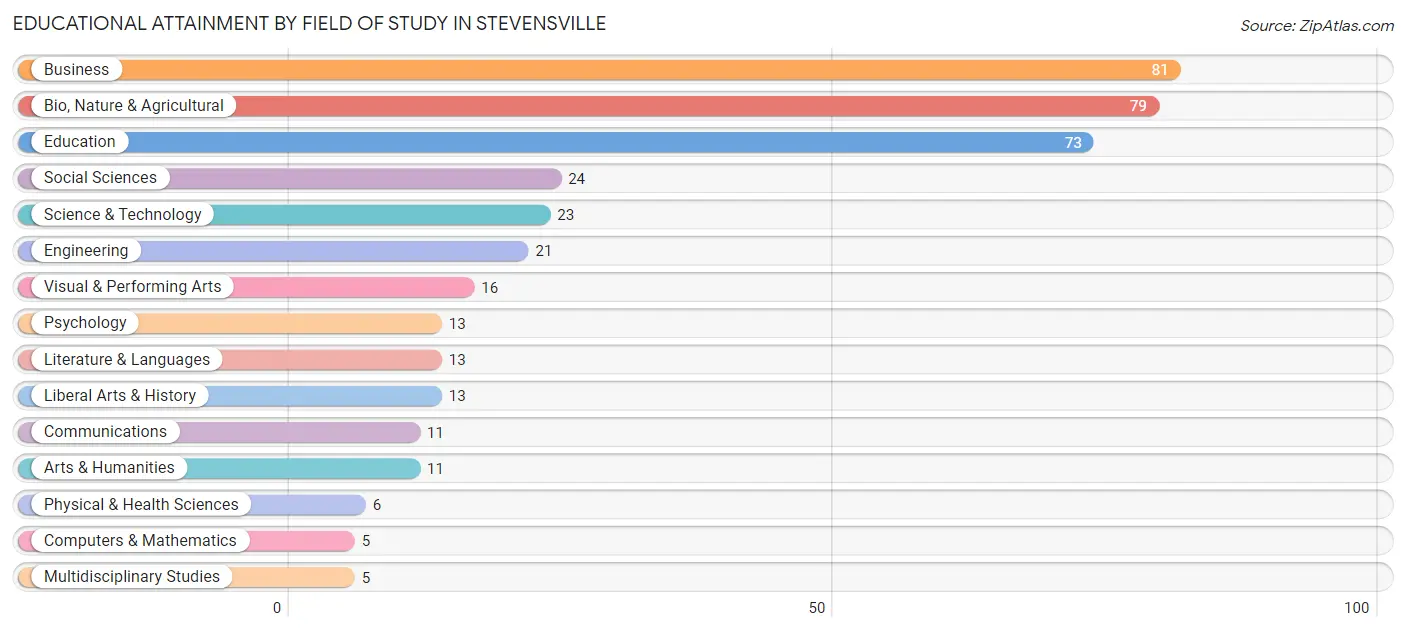
| Field of Study | # Graduates | % Graduates |
| Computers & Mathematics | 5 | 1.3% |
| Bio, Nature & Agricultural | 79 | 20.1% |
| Physical & Health Sciences | 6 | 1.5% |
| Psychology | 13 | 3.3% |
| Social Sciences | 24 | 6.1% |
| Engineering | 21 | 5.3% |
| Multidisciplinary Studies | 5 | 1.3% |
| Science & Technology | 23 | 5.8% |
| Business | 81 | 20.6% |
| Education | 73 | 18.5% |
| Literature & Languages | 13 | 3.3% |
| Liberal Arts & History | 13 | 3.3% |
| Visual & Performing Arts | 16 | 4.1% |
| Communications | 11 | 2.8% |
| Arts & Humanities | 11 | 2.8% |
| Total | 394 | 100.0% |
Transportation & Commute in Stevensville
Vehicle Availability by Sex in Stevensville
The most prevalent vehicle ownership categories in Stevensville are males with 2 vehicles (145, accounting for 35.8%) and females with 2 vehicles (249, making up 33.3%).
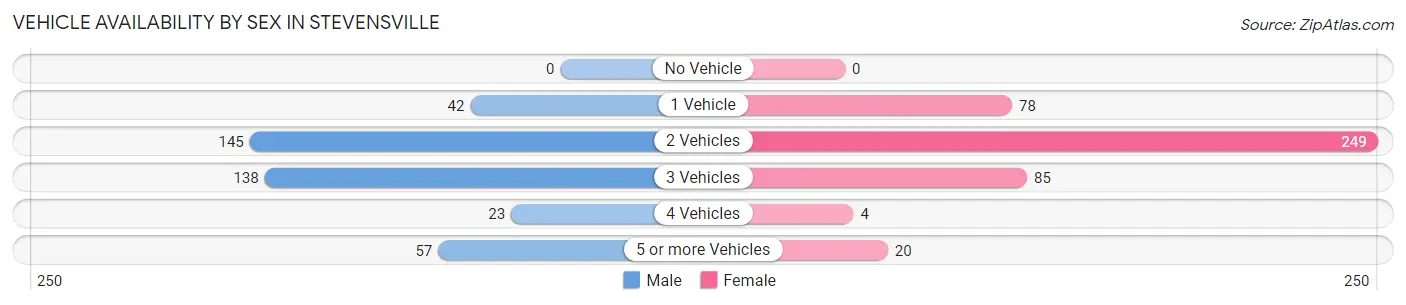
| Vehicles Available | Male | Female |
| No Vehicle | 0 (0.0%) | 0 (0.0%) |
| 1 Vehicle | 42 (10.4%) | 78 (17.9%) |
| 2 Vehicles | 145 (35.8%) | 249 (57.1%) |
| 3 Vehicles | 138 (34.1%) | 85 (19.5%) |
| 4 Vehicles | 23 (5.7%) | 4 (0.9%) |
| 5 or more Vehicles | 57 (14.1%) | 20 (4.6%) |
| Total | 405 (100.0%) | 436 (100.0%) |
Commute Time in Stevensville
The most frequently occuring commute durations in Stevensville are 5 to 9 minutes (179 commuters, 22.2%), 30 to 34 minutes (136 commuters, 16.9%), and 10 to 14 minutes (94 commuters, 11.7%).
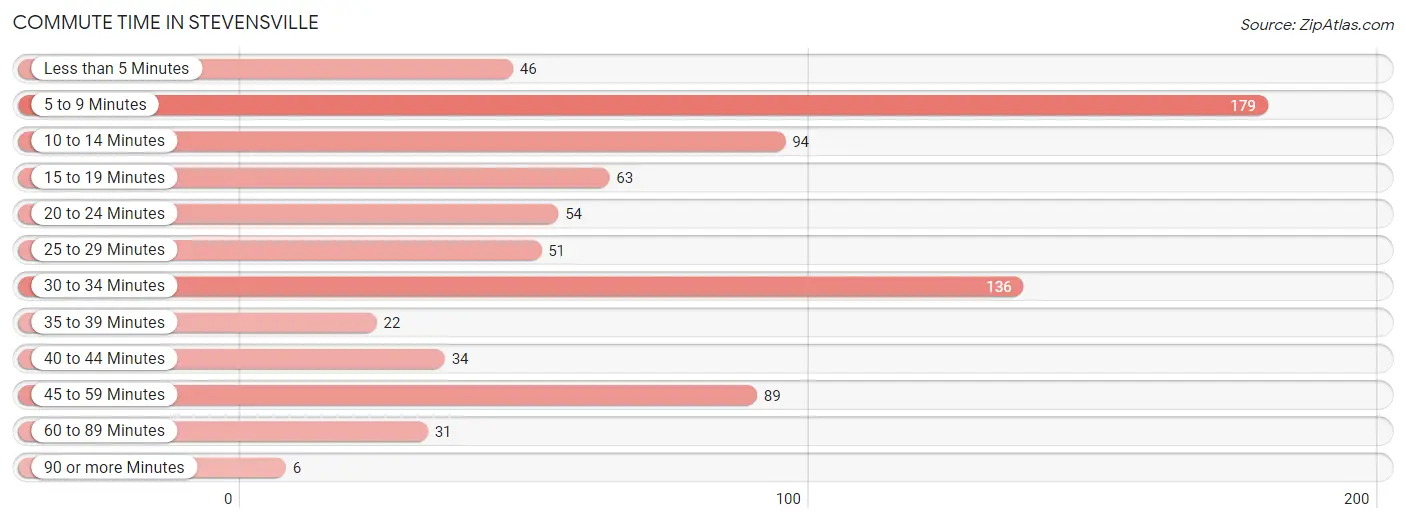
| Commute Time | # Commuters | % Commuters |
| Less than 5 Minutes | 46 | 5.7% |
| 5 to 9 Minutes | 179 | 22.2% |
| 10 to 14 Minutes | 94 | 11.7% |
| 15 to 19 Minutes | 63 | 7.8% |
| 20 to 24 Minutes | 54 | 6.7% |
| 25 to 29 Minutes | 51 | 6.3% |
| 30 to 34 Minutes | 136 | 16.9% |
| 35 to 39 Minutes | 22 | 2.7% |
| 40 to 44 Minutes | 34 | 4.2% |
| 45 to 59 Minutes | 89 | 11.1% |
| 60 to 89 Minutes | 31 | 3.8% |
| 90 or more Minutes | 6 | 0.7% |
Commute Time by Sex in Stevensville
The most common commute times in Stevensville are 30 to 34 minutes (109 commuters, 27.7%) for males and 5 to 9 minutes (140 commuters, 34.0%) for females.
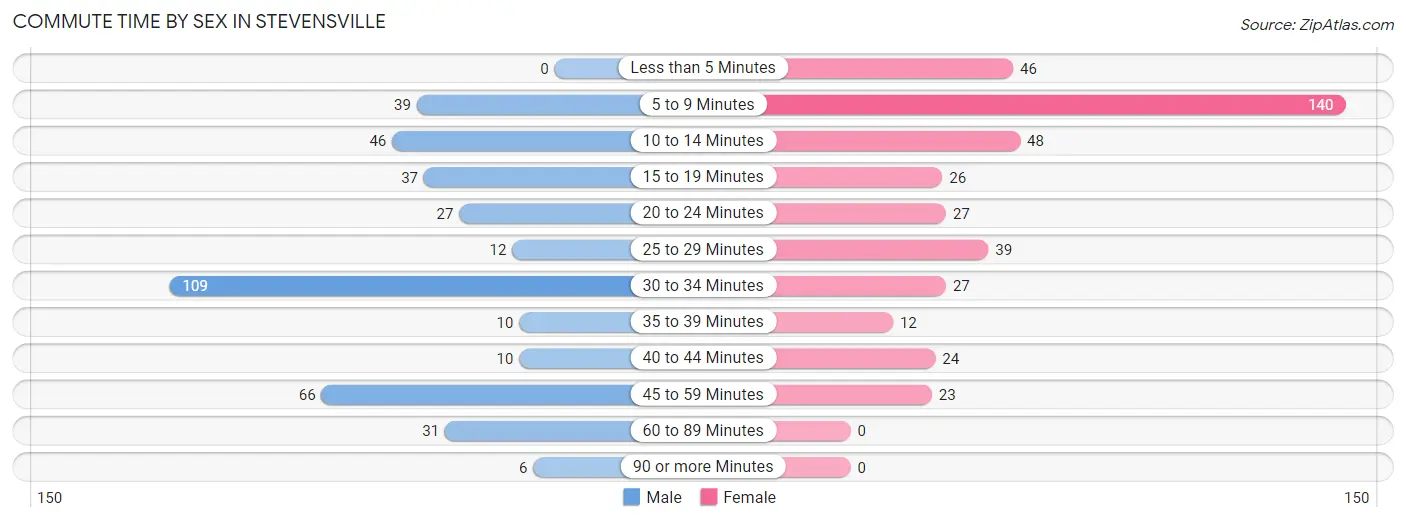
| Commute Time | Male | Female |
| Less than 5 Minutes | 0 (0.0%) | 46 (11.2%) |
| 5 to 9 Minutes | 39 (9.9%) | 140 (34.0%) |
| 10 to 14 Minutes | 46 (11.7%) | 48 (11.7%) |
| 15 to 19 Minutes | 37 (9.4%) | 26 (6.3%) |
| 20 to 24 Minutes | 27 (6.9%) | 27 (6.6%) |
| 25 to 29 Minutes | 12 (3.0%) | 39 (9.5%) |
| 30 to 34 Minutes | 109 (27.7%) | 27 (6.6%) |
| 35 to 39 Minutes | 10 (2.5%) | 12 (2.9%) |
| 40 to 44 Minutes | 10 (2.5%) | 24 (5.8%) |
| 45 to 59 Minutes | 66 (16.8%) | 23 (5.6%) |
| 60 to 89 Minutes | 31 (7.9%) | 0 (0.0%) |
| 90 or more Minutes | 6 (1.5%) | 0 (0.0%) |
Time of Departure to Work by Sex in Stevensville
The most frequent times of departure to work in Stevensville are 7:30 AM to 7:59 AM (115, 29.3%) for males and 7:30 AM to 7:59 AM (75, 18.2%) for females.
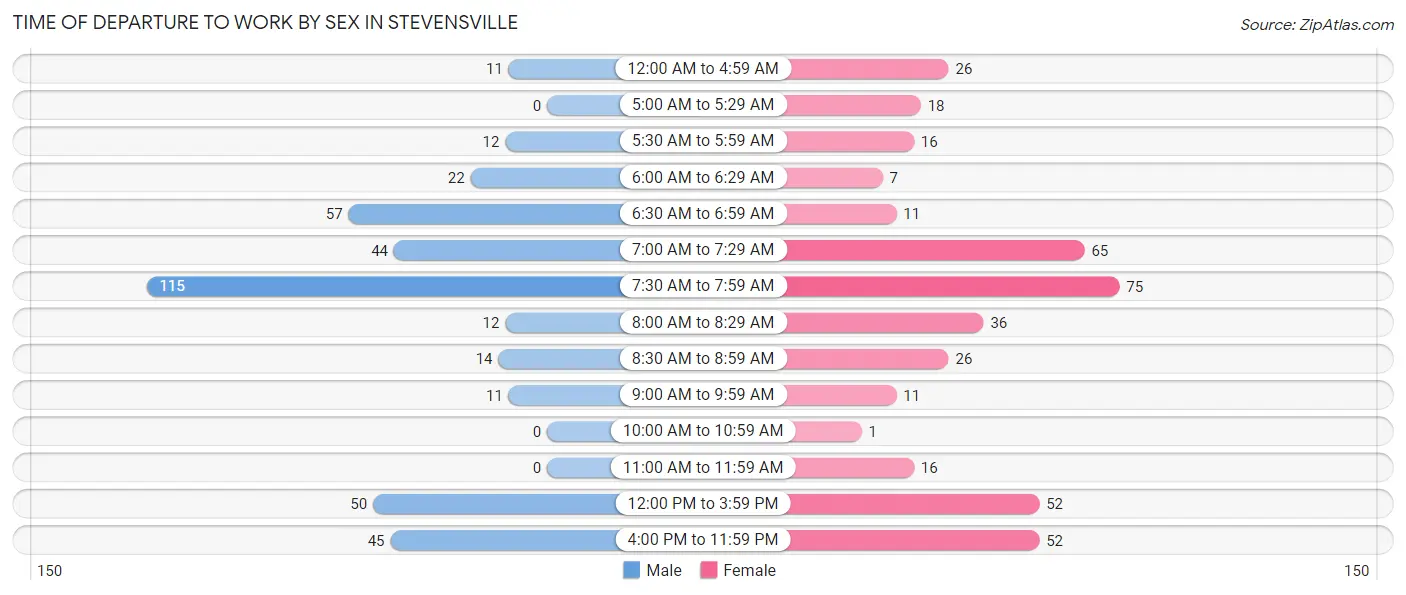
| Time of Departure | Male | Female |
| 12:00 AM to 4:59 AM | 11 (2.8%) | 26 (6.3%) |
| 5:00 AM to 5:29 AM | 0 (0.0%) | 18 (4.4%) |
| 5:30 AM to 5:59 AM | 12 (3.0%) | 16 (3.9%) |
| 6:00 AM to 6:29 AM | 22 (5.6%) | 7 (1.7%) |
| 6:30 AM to 6:59 AM | 57 (14.5%) | 11 (2.7%) |
| 7:00 AM to 7:29 AM | 44 (11.2%) | 65 (15.8%) |
| 7:30 AM to 7:59 AM | 115 (29.3%) | 75 (18.2%) |
| 8:00 AM to 8:29 AM | 12 (3.0%) | 36 (8.7%) |
| 8:30 AM to 8:59 AM | 14 (3.6%) | 26 (6.3%) |
| 9:00 AM to 9:59 AM | 11 (2.8%) | 11 (2.7%) |
| 10:00 AM to 10:59 AM | 0 (0.0%) | 1 (0.2%) |
| 11:00 AM to 11:59 AM | 0 (0.0%) | 16 (3.9%) |
| 12:00 PM to 3:59 PM | 50 (12.7%) | 52 (12.6%) |
| 4:00 PM to 11:59 PM | 45 (11.5%) | 52 (12.6%) |
| Total | 393 (100.0%) | 412 (100.0%) |
Housing Occupancy in Stevensville
Occupancy by Ownership in Stevensville
Of the total 911 dwellings in Stevensville, owner-occupied units account for 485 (53.2%), while renter-occupied units make up 426 (46.8%).
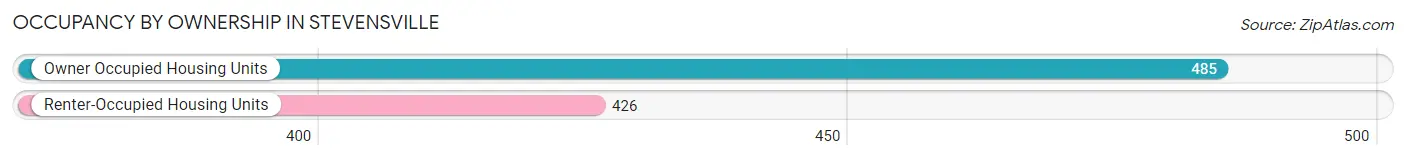
| Occupancy | # Housing Units | % Housing Units |
| Owner Occupied Housing Units | 485 | 53.2% |
| Renter-Occupied Housing Units | 426 | 46.8% |
| Total Occupied Housing Units | 911 | 100.0% |
Occupancy by Household Size in Stevensville
| Household Size | # Housing Units | % Housing Units |
| 1-Person Household | 389 | 42.7% |
| 2-Person Household | 263 | 28.9% |
| 3-Person Household | 117 | 12.8% |
| 4+ Person Household | 142 | 15.6% |
| Total Housing Units | 911 | 100.0% |
Occupancy by Ownership by Household Size in Stevensville
| Household Size | Owner-occupied | Renter-occupied |
| 1-Person Household | 206 (53.0%) | 183 (47.0%) |
| 2-Person Household | 143 (54.4%) | 120 (45.6%) |
| 3-Person Household | 53 (45.3%) | 64 (54.7%) |
| 4+ Person Household | 83 (58.5%) | 59 (41.5%) |
| Total Housing Units | 485 (53.2%) | 426 (46.8%) |
Occupancy by Educational Attainment in Stevensville
| Household Size | Owner-occupied | Renter-occupied |
| Less than High School | 35 (59.3%) | 24 (40.7%) |
| High School Diploma | 137 (44.3%) | 172 (55.7%) |
| College/Associate Degree | 170 (55.0%) | 139 (45.0%) |
| Bachelor's Degree or higher | 143 (61.1%) | 91 (38.9%) |
Occupancy by Age of Householder in Stevensville
| Age Bracket | # Households | % Households |
| Under 35 Years | 119 | 13.1% |
| 35 to 44 Years | 231 | 25.4% |
| 45 to 54 Years | 97 | 10.6% |
| 55 to 64 Years | 155 | 17.0% |
| 65 to 74 Years | 168 | 18.4% |
| 75 to 84 Years | 107 | 11.7% |
| 85 Years and Over | 34 | 3.7% |
| Total | 911 | 100.0% |
Housing Finances in Stevensville
Median Income by Occupancy in Stevensville
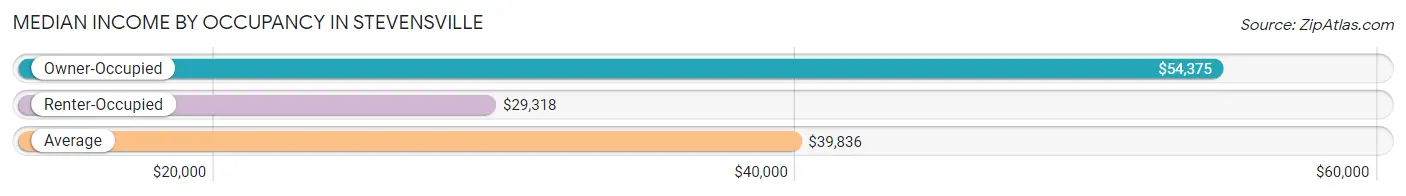
| Occupancy Type | # Households | Median Income |
| Owner-Occupied | 485 (53.2%) | $54,375 |
| Renter-Occupied | 426 (46.8%) | $29,318 |
| Average | 911 (100.0%) | $39,836 |
Occupancy by Householder Income Bracket in Stevensville
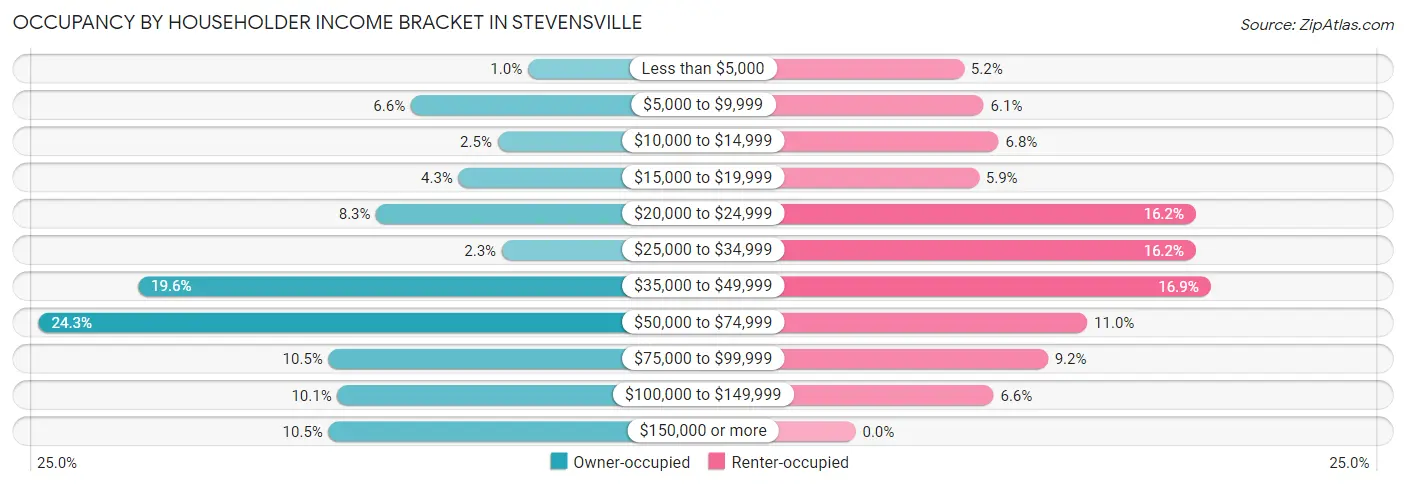
| Income Bracket | Owner-occupied | Renter-occupied |
| Less than $5,000 | 5 (1.0%) | 22 (5.2%) |
| $5,000 to $9,999 | 32 (6.6%) | 26 (6.1%) |
| $10,000 to $14,999 | 12 (2.5%) | 29 (6.8%) |
| $15,000 to $19,999 | 21 (4.3%) | 25 (5.9%) |
| $20,000 to $24,999 | 40 (8.3%) | 69 (16.2%) |
| $25,000 to $34,999 | 11 (2.3%) | 69 (16.2%) |
| $35,000 to $49,999 | 95 (19.6%) | 72 (16.9%) |
| $50,000 to $74,999 | 118 (24.3%) | 47 (11.0%) |
| $75,000 to $99,999 | 51 (10.5%) | 39 (9.1%) |
| $100,000 to $149,999 | 49 (10.1%) | 28 (6.6%) |
| $150,000 or more | 51 (10.5%) | 0 (0.0%) |
| Total | 485 (100.0%) | 426 (100.0%) |
Monthly Housing Cost Tiers in Stevensville
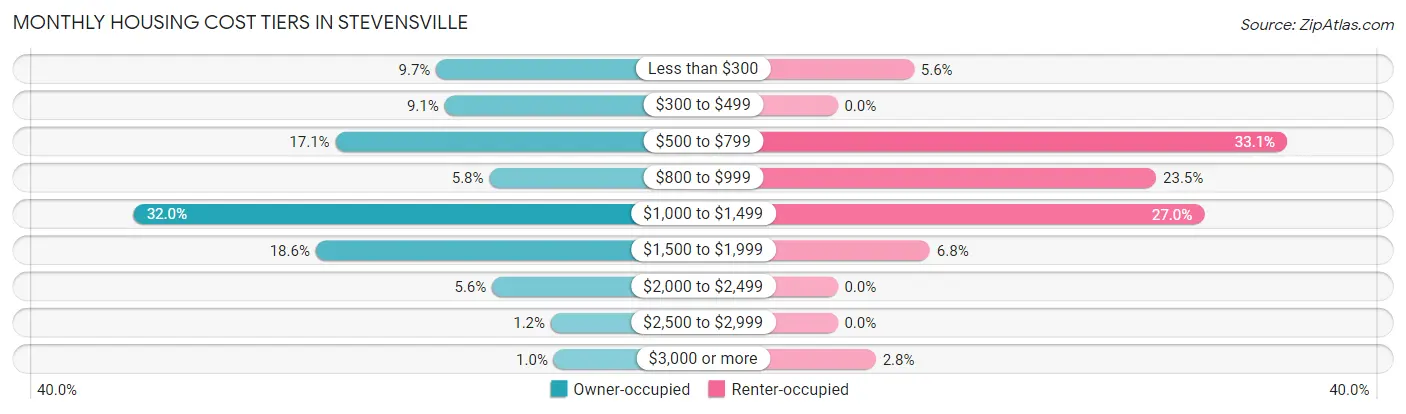
| Monthly Cost | Owner-occupied | Renter-occupied |
| Less than $300 | 47 (9.7%) | 24 (5.6%) |
| $300 to $499 | 44 (9.1%) | 0 (0.0%) |
| $500 to $799 | 83 (17.1%) | 141 (33.1%) |
| $800 to $999 | 28 (5.8%) | 100 (23.5%) |
| $1,000 to $1,499 | 155 (32.0%) | 115 (27.0%) |
| $1,500 to $1,999 | 90 (18.6%) | 29 (6.8%) |
| $2,000 to $2,499 | 27 (5.6%) | 0 (0.0%) |
| $2,500 to $2,999 | 6 (1.2%) | 0 (0.0%) |
| $3,000 or more | 5 (1.0%) | 12 (2.8%) |
| Total | 485 (100.0%) | 426 (100.0%) |
Physical Housing Characteristics in Stevensville
Housing Structures in Stevensville
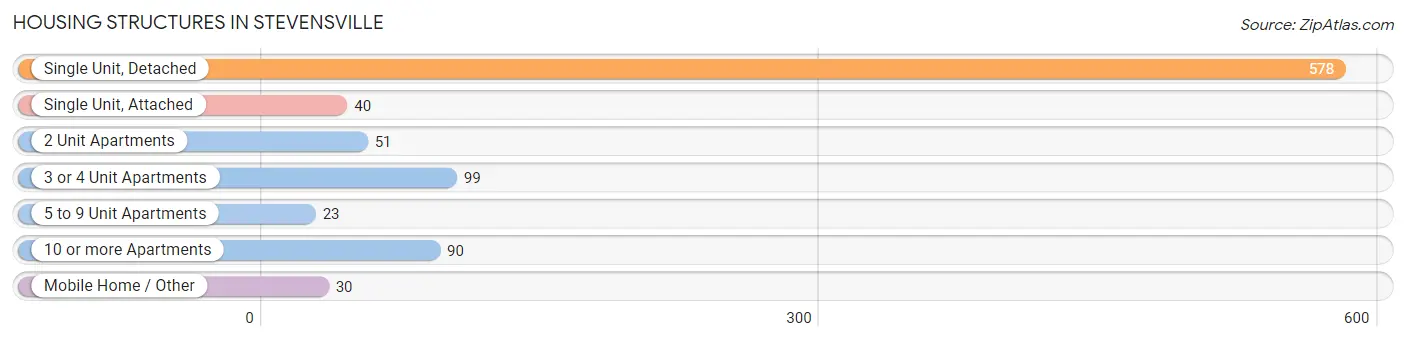
| Structure Type | # Housing Units | % Housing Units |
| Single Unit, Detached | 578 | 63.4% |
| Single Unit, Attached | 40 | 4.4% |
| 2 Unit Apartments | 51 | 5.6% |
| 3 or 4 Unit Apartments | 99 | 10.9% |
| 5 to 9 Unit Apartments | 23 | 2.5% |
| 10 or more Apartments | 90 | 9.9% |
| Mobile Home / Other | 30 | 3.3% |
| Total | 911 | 100.0% |
Housing Structures by Occupancy in Stevensville
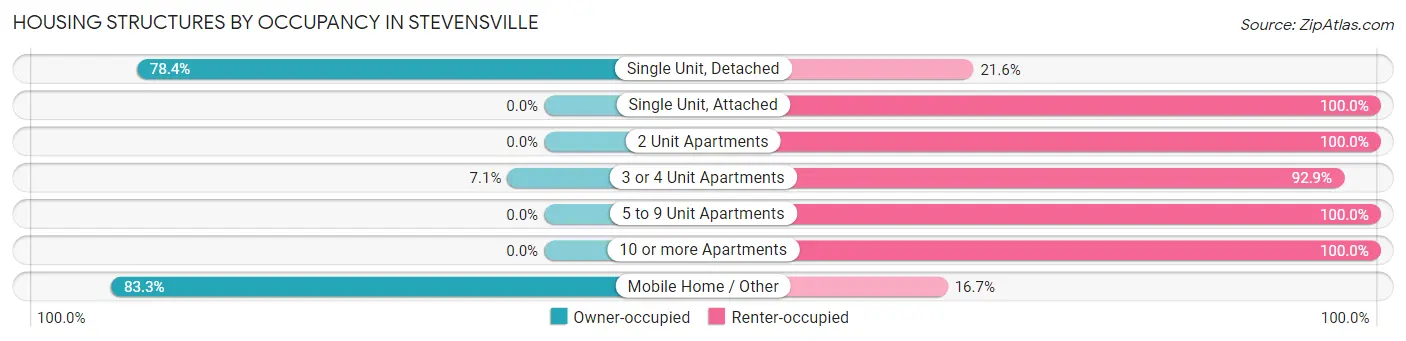
| Structure Type | Owner-occupied | Renter-occupied |
| Single Unit, Detached | 453 (78.4%) | 125 (21.6%) |
| Single Unit, Attached | 0 (0.0%) | 40 (100.0%) |
| 2 Unit Apartments | 0 (0.0%) | 51 (100.0%) |
| 3 or 4 Unit Apartments | 7 (7.1%) | 92 (92.9%) |
| 5 to 9 Unit Apartments | 0 (0.0%) | 23 (100.0%) |
| 10 or more Apartments | 0 (0.0%) | 90 (100.0%) |
| Mobile Home / Other | 25 (83.3%) | 5 (16.7%) |
| Total | 485 (53.2%) | 426 (46.8%) |
Housing Structures by Number of Rooms in Stevensville
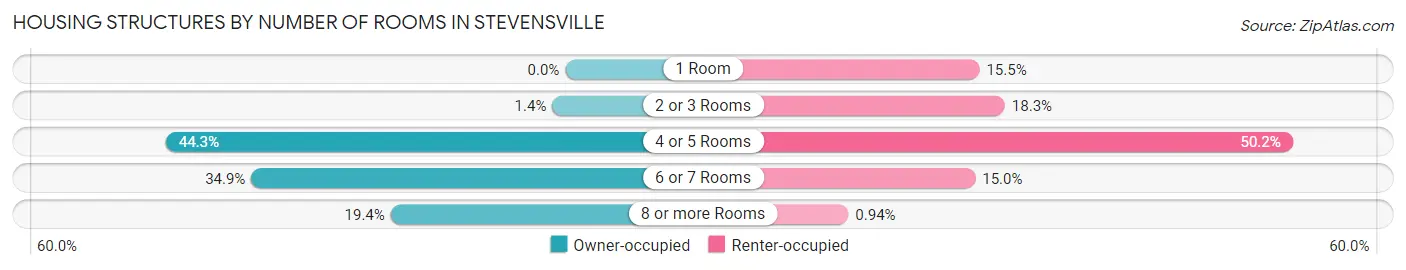
| Number of Rooms | Owner-occupied | Renter-occupied |
| 1 Room | 0 (0.0%) | 66 (15.5%) |
| 2 or 3 Rooms | 7 (1.4%) | 78 (18.3%) |
| 4 or 5 Rooms | 215 (44.3%) | 214 (50.2%) |
| 6 or 7 Rooms | 169 (34.8%) | 64 (15.0%) |
| 8 or more Rooms | 94 (19.4%) | 4 (0.9%) |
| Total | 485 (100.0%) | 426 (100.0%) |
Housing Structure by Heating Type in Stevensville
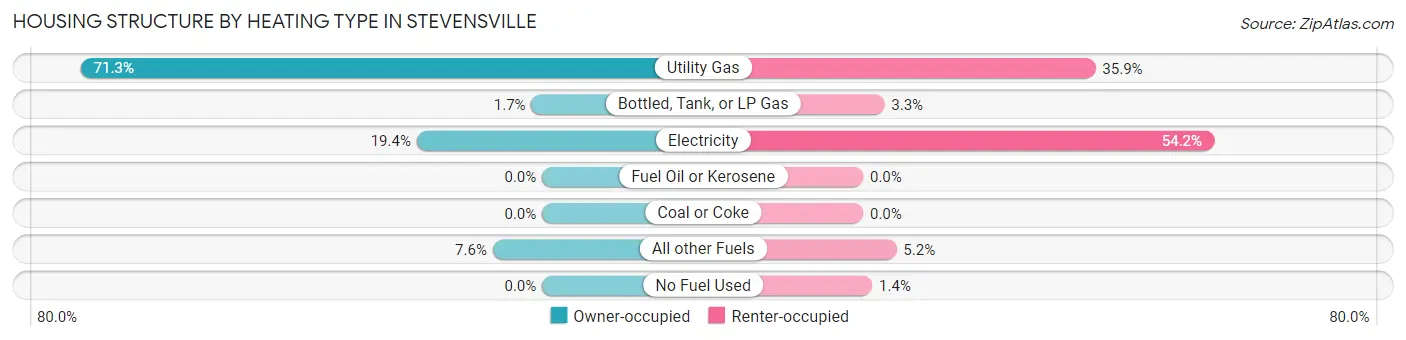
| Heating Type | Owner-occupied | Renter-occupied |
| Utility Gas | 346 (71.3%) | 153 (35.9%) |
| Bottled, Tank, or LP Gas | 8 (1.7%) | 14 (3.3%) |
| Electricity | 94 (19.4%) | 231 (54.2%) |
| Fuel Oil or Kerosene | 0 (0.0%) | 0 (0.0%) |
| Coal or Coke | 0 (0.0%) | 0 (0.0%) |
| All other Fuels | 37 (7.6%) | 22 (5.2%) |
| No Fuel Used | 0 (0.0%) | 6 (1.4%) |
| Total | 485 (100.0%) | 426 (100.0%) |
Household Vehicle Usage in Stevensville
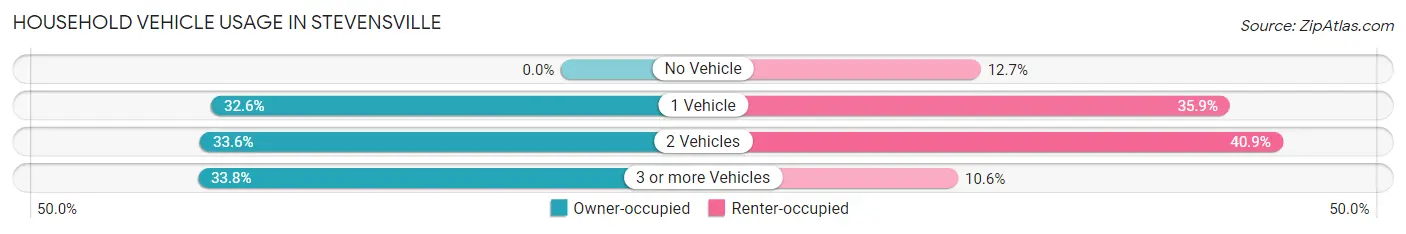
| Vehicles per Household | Owner-occupied | Renter-occupied |
| No Vehicle | 0 (0.0%) | 54 (12.7%) |
| 1 Vehicle | 158 (32.6%) | 153 (35.9%) |
| 2 Vehicles | 163 (33.6%) | 174 (40.8%) |
| 3 or more Vehicles | 164 (33.8%) | 45 (10.6%) |
| Total | 485 (100.0%) | 426 (100.0%) |
Real Estate & Mortgages in Stevensville
Real Estate and Mortgage Overview in Stevensville
| Characteristic | Without Mortgage | With Mortgage |
| Housing Units | 174 | 311 |
| Median Property Value | $319,400 | $290,500 |
| Median Household Income | $45,625 | $7 |
| Monthly Housing Costs | $488 | $5 |
| Real Estate Taxes | $1,803 | $0 |
Property Value by Mortgage Status in Stevensville
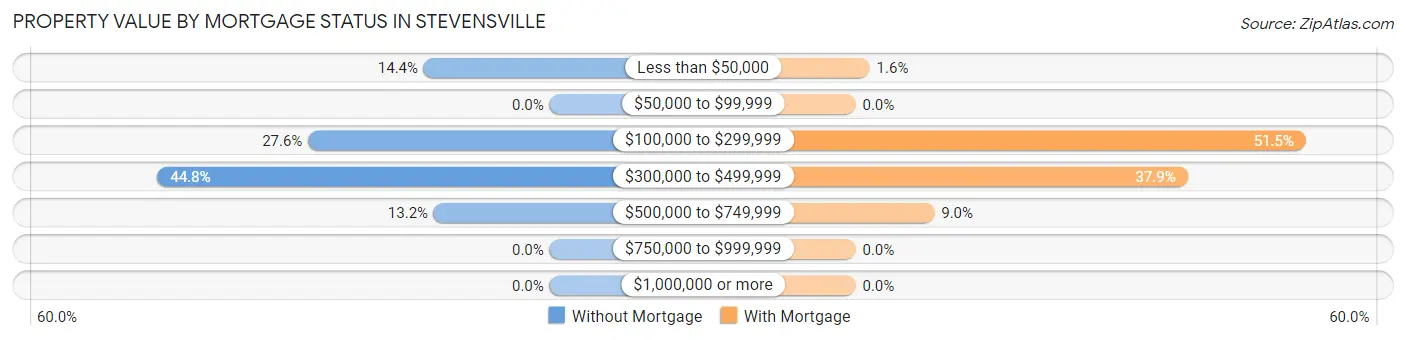
| Property Value | Without Mortgage | With Mortgage |
| Less than $50,000 | 25 (14.4%) | 5 (1.6%) |
| $50,000 to $99,999 | 0 (0.0%) | 0 (0.0%) |
| $100,000 to $299,999 | 48 (27.6%) | 160 (51.4%) |
| $300,000 to $499,999 | 78 (44.8%) | 118 (37.9%) |
| $500,000 to $749,999 | 23 (13.2%) | 28 (9.0%) |
| $750,000 to $999,999 | 0 (0.0%) | 0 (0.0%) |
| $1,000,000 or more | 0 (0.0%) | 0 (0.0%) |
| Total | 174 (100.0%) | 311 (100.0%) |
Household Income by Mortgage Status in Stevensville
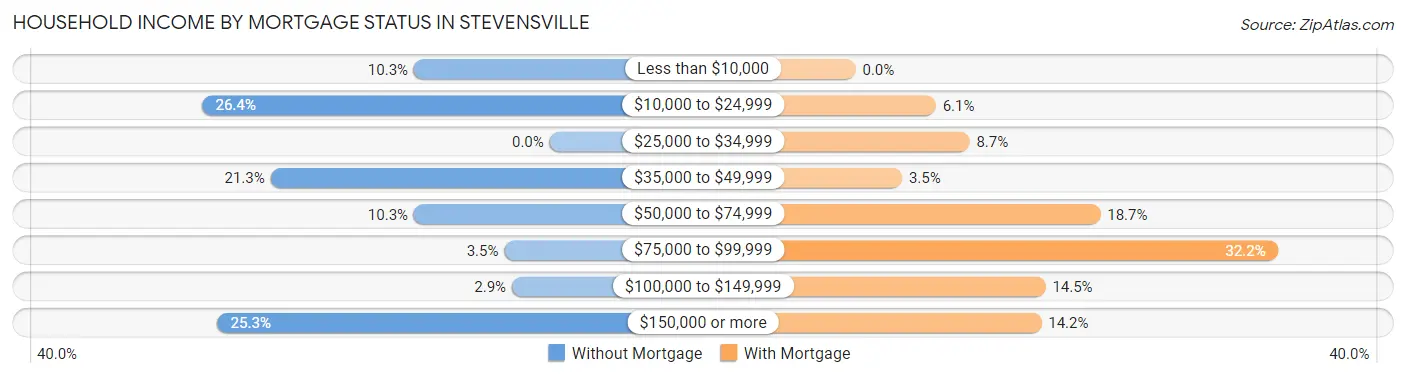
| Household Income | Without Mortgage | With Mortgage |
| Less than $10,000 | 18 (10.3%) | 0 (0.0%) |
| $10,000 to $24,999 | 46 (26.4%) | 19 (6.1%) |
| $25,000 to $34,999 | 0 (0.0%) | 27 (8.7%) |
| $35,000 to $49,999 | 37 (21.3%) | 11 (3.5%) |
| $50,000 to $74,999 | 18 (10.3%) | 58 (18.6%) |
| $75,000 to $99,999 | 6 (3.5%) | 100 (32.2%) |
| $100,000 to $149,999 | 5 (2.9%) | 45 (14.5%) |
| $150,000 or more | 44 (25.3%) | 44 (14.1%) |
| Total | 174 (100.0%) | 311 (100.0%) |
Property Value to Household Income Ratio in Stevensville
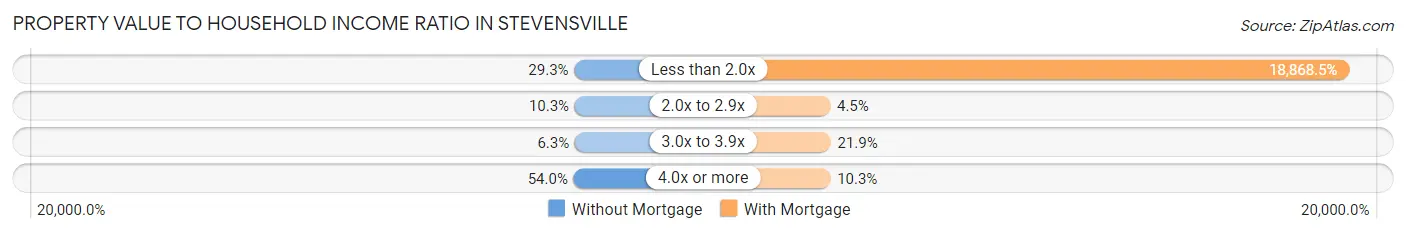
| Value-to-Income Ratio | Without Mortgage | With Mortgage |
| Less than 2.0x | 51 (29.3%) | 58,681 (18,868.5%) |
| 2.0x to 2.9x | 18 (10.3%) | 14 (4.5%) |
| 3.0x to 3.9x | 11 (6.3%) | 68 (21.9%) |
| 4.0x or more | 94 (54.0%) | 32 (10.3%) |
| Total | 174 (100.0%) | 311 (100.0%) |
Real Estate Taxes by Mortgage Status in Stevensville
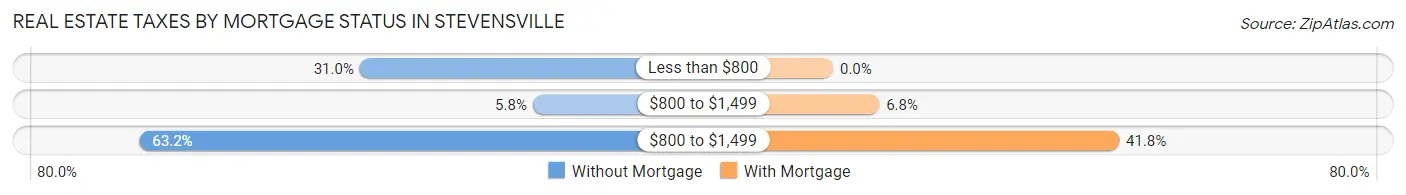
| Property Taxes | Without Mortgage | With Mortgage |
| Less than $800 | 54 (31.0%) | 0 (0.0%) |
| $800 to $1,499 | 10 (5.8%) | 21 (6.8%) |
| $800 to $1,499 | 110 (63.2%) | 130 (41.8%) |
| Total | 174 (100.0%) | 311 (100.0%) |
Health & Disability in Stevensville
Health Insurance Coverage by Age in Stevensville
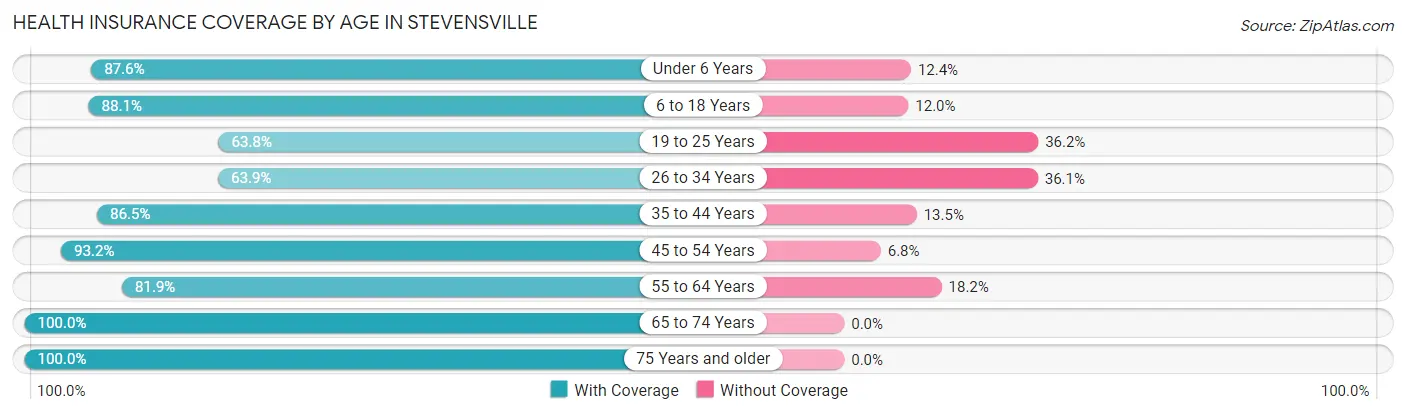
| Age Bracket | With Coverage | Without Coverage |
| Under 6 Years | 155 (87.6%) | 22 (12.4%) |
| 6 to 18 Years | 280 (88.0%) | 38 (11.9%) |
| 19 to 25 Years | 113 (63.8%) | 64 (36.2%) |
| 26 to 34 Years | 101 (63.9%) | 57 (36.1%) |
| 35 to 44 Years | 288 (86.5%) | 45 (13.5%) |
| 45 to 54 Years | 178 (93.2%) | 13 (6.8%) |
| 55 to 64 Years | 212 (81.9%) | 47 (18.1%) |
| 65 to 74 Years | 219 (100.0%) | 0 (0.0%) |
| 75 Years and older | 159 (100.0%) | 0 (0.0%) |
| Total | 1,705 (85.6%) | 286 (14.4%) |
Health Insurance Coverage by Citizenship Status in Stevensville
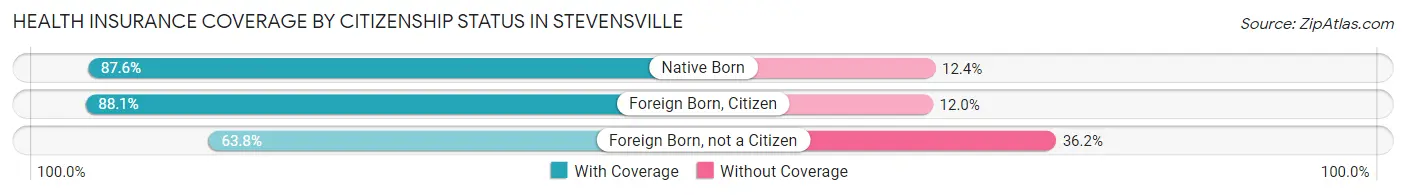
| Citizenship Status | With Coverage | Without Coverage |
| Native Born | 155 (87.6%) | 22 (12.4%) |
| Foreign Born, Citizen | 280 (88.0%) | 38 (11.9%) |
| Foreign Born, not a Citizen | 113 (63.8%) | 64 (36.2%) |
Health Insurance Coverage by Household Income in Stevensville
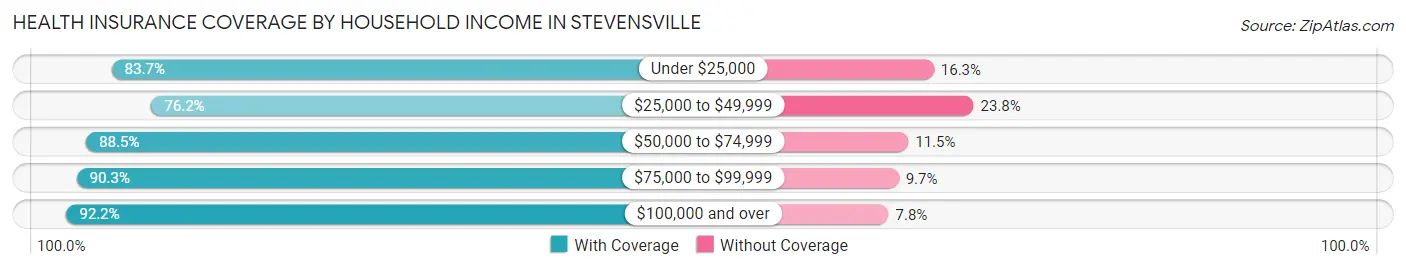
| Household Income | With Coverage | Without Coverage |
| Under $25,000 | 390 (83.7%) | 76 (16.3%) |
| $25,000 to $49,999 | 353 (76.2%) | 110 (23.8%) |
| $50,000 to $74,999 | 307 (88.5%) | 40 (11.5%) |
| $75,000 to $99,999 | 232 (90.3%) | 25 (9.7%) |
| $100,000 and over | 412 (92.2%) | 35 (7.8%) |
Public vs Private Health Insurance Coverage by Age in Stevensville
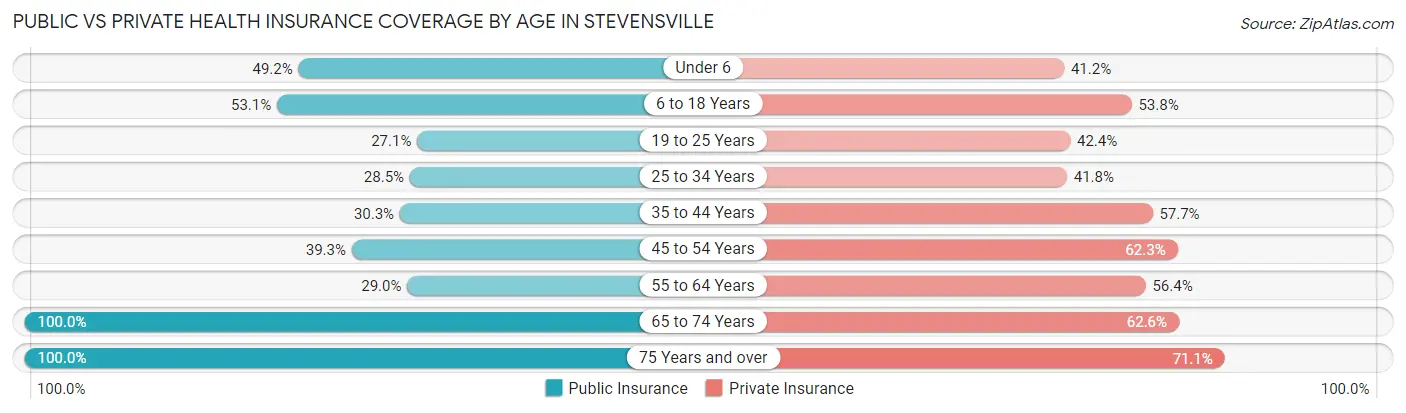
| Age Bracket | Public Insurance | Private Insurance |
| Under 6 | 87 (49.1%) | 73 (41.2%) |
| 6 to 18 Years | 169 (53.1%) | 171 (53.8%) |
| 19 to 25 Years | 48 (27.1%) | 75 (42.4%) |
| 25 to 34 Years | 45 (28.5%) | 66 (41.8%) |
| 35 to 44 Years | 101 (30.3%) | 192 (57.7%) |
| 45 to 54 Years | 75 (39.3%) | 119 (62.3%) |
| 55 to 64 Years | 75 (29.0%) | 146 (56.4%) |
| 65 to 74 Years | 219 (100.0%) | 137 (62.6%) |
| 75 Years and over | 159 (100.0%) | 113 (71.1%) |
| Total | 978 (49.1%) | 1,092 (54.8%) |
Disability Status by Sex by Age in Stevensville
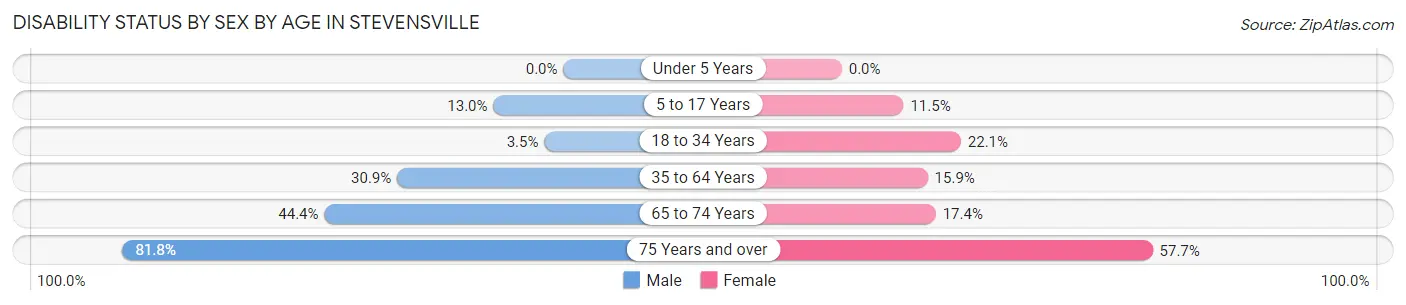
| Age Bracket | Male | Female |
| Under 5 Years | 0 (0.0%) | 0 (0.0%) |
| 5 to 17 Years | 23 (13.0%) | 19 (11.5%) |
| 18 to 34 Years | 6 (3.5%) | 40 (22.1%) |
| 35 to 64 Years | 108 (30.9%) | 69 (15.9%) |
| 65 to 74 Years | 59 (44.4%) | 15 (17.4%) |
| 75 Years and over | 45 (81.8%) | 60 (57.7%) |
Disability Class by Sex by Age in Stevensville
Disability Class: Hearing Difficulty
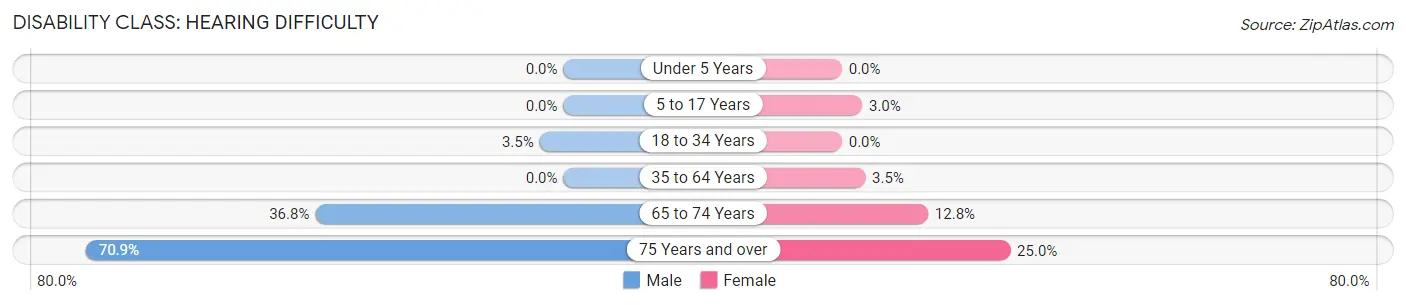
| Age Bracket | Male | Female |
| Under 5 Years | 0 (0.0%) | 0 (0.0%) |
| 5 to 17 Years | 0 (0.0%) | 5 (3.0%) |
| 18 to 34 Years | 6 (3.5%) | 0 (0.0%) |
| 35 to 64 Years | 0 (0.0%) | 15 (3.5%) |
| 65 to 74 Years | 49 (36.8%) | 11 (12.8%) |
| 75 Years and over | 39 (70.9%) | 26 (25.0%) |
Disability Class: Vision Difficulty
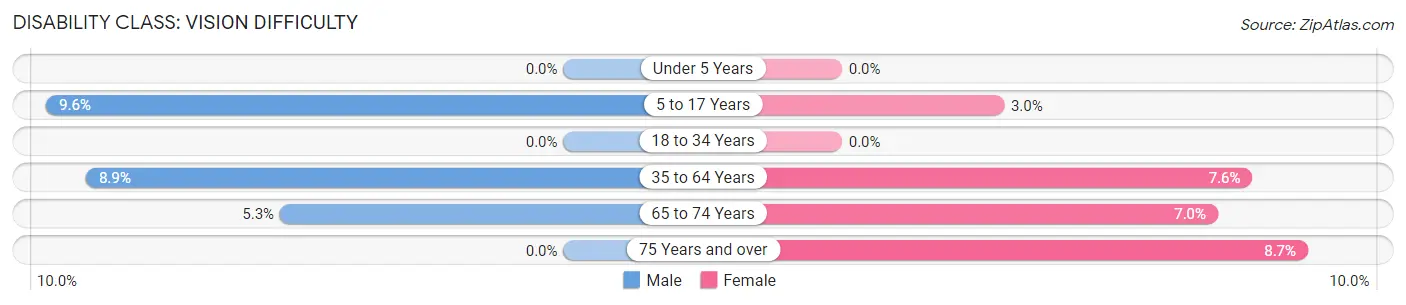
| Age Bracket | Male | Female |
| Under 5 Years | 0 (0.0%) | 0 (0.0%) |
| 5 to 17 Years | 17 (9.6%) | 5 (3.0%) |
| 18 to 34 Years | 0 (0.0%) | 0 (0.0%) |
| 35 to 64 Years | 31 (8.9%) | 33 (7.6%) |
| 65 to 74 Years | 7 (5.3%) | 6 (7.0%) |
| 75 Years and over | 0 (0.0%) | 9 (8.6%) |
Disability Class: Cognitive Difficulty
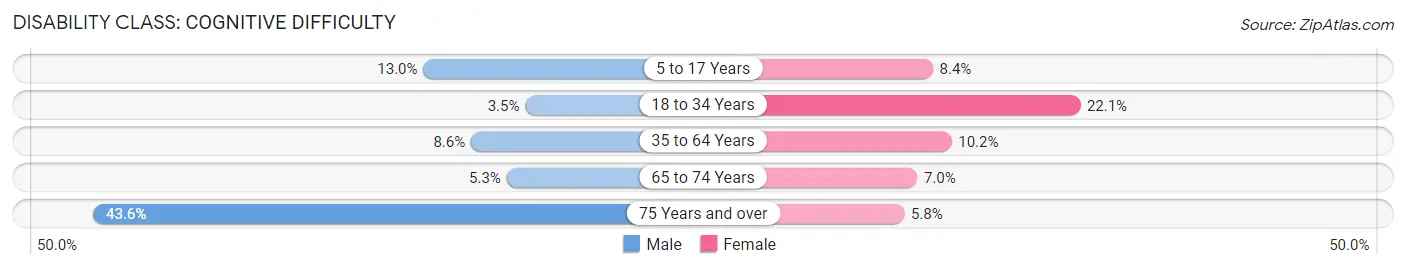
| Age Bracket | Male | Female |
| 5 to 17 Years | 23 (13.0%) | 14 (8.4%) |
| 18 to 34 Years | 6 (3.5%) | 40 (22.1%) |
| 35 to 64 Years | 30 (8.6%) | 44 (10.2%) |
| 65 to 74 Years | 7 (5.3%) | 6 (7.0%) |
| 75 Years and over | 24 (43.6%) | 6 (5.8%) |
Disability Class: Ambulatory Difficulty
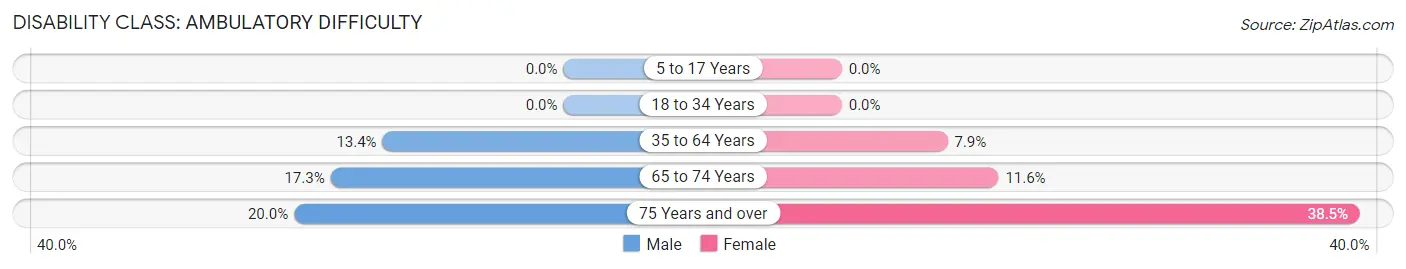
| Age Bracket | Male | Female |
| 5 to 17 Years | 0 (0.0%) | 0 (0.0%) |
| 18 to 34 Years | 0 (0.0%) | 0 (0.0%) |
| 35 to 64 Years | 47 (13.4%) | 34 (7.9%) |
| 65 to 74 Years | 23 (17.3%) | 10 (11.6%) |
| 75 Years and over | 11 (20.0%) | 40 (38.5%) |
Disability Class: Self-Care Difficulty
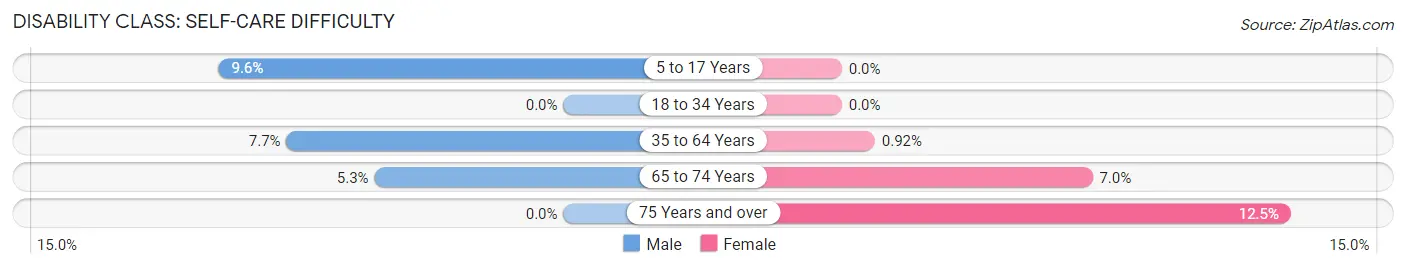
| Age Bracket | Male | Female |
| 5 to 17 Years | 17 (9.6%) | 0 (0.0%) |
| 18 to 34 Years | 0 (0.0%) | 0 (0.0%) |
| 35 to 64 Years | 27 (7.7%) | 4 (0.9%) |
| 65 to 74 Years | 7 (5.3%) | 6 (7.0%) |
| 75 Years and over | 0 (0.0%) | 13 (12.5%) |
Technology Access in Stevensville
Computing Device Access in Stevensville
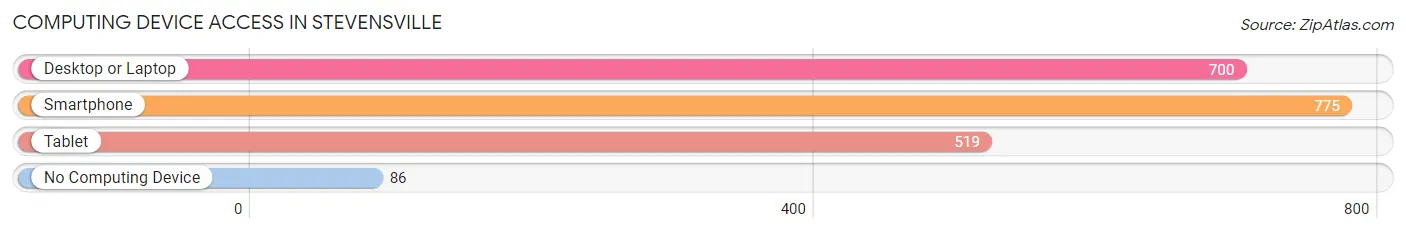
| Device Type | # Households | % Households |
| Desktop or Laptop | 700 | 76.8% |
| Smartphone | 775 | 85.1% |
| Tablet | 519 | 57.0% |
| No Computing Device | 86 | 9.4% |
| Total | 911 | 100.0% |
Internet Access in Stevensville
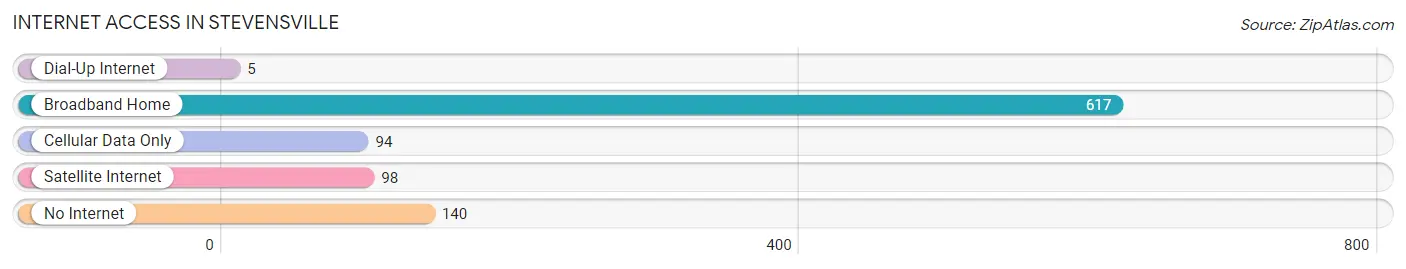
| Internet Type | # Households | % Households |
| Dial-Up Internet | 5 | 0.5% |
| Broadband Home | 617 | 67.7% |
| Cellular Data Only | 94 | 10.3% |
| Satellite Internet | 98 | 10.8% |
| No Internet | 140 | 15.4% |
| Total | 911 | 100.0% |
Stevensville Summary
Stevensville, Montana is a small town located in the Bitterroot Valley of western Montana. It is the oldest town in the state, having been founded in 1841 by Jesuit missionaries. The town is situated along the Bitterroot River, and is surrounded by the Bitterroot Mountains. The town has a population of 1,809 as of the 2010 census, and is the county seat of Ravalli County.
History
Stevensville was founded in 1841 by Jesuit missionaries, who named it St. Mary’s Mission. The mission was established to serve the Salish and Pend d’Oreille tribes, who had been living in the area for centuries. The mission was the first permanent white settlement in Montana, and was the first Catholic mission in the Pacific Northwest.
In 1855, the mission was renamed Stevensville, after Isaac Stevens, the first governor of Washington Territory. The town was incorporated in 1885, and was the first incorporated town in Montana.
Geography
Stevensville is located in the Bitterroot Valley of western Montana. The town is situated along the Bitterroot River, and is surrounded by the Bitterroot Mountains. The town has a total area of 1.3 square miles, all of which is land.
The climate in Stevensville is semi-arid, with hot summers and cold winters. The average annual temperature is 44.3°F, and the average annual precipitation is 16.3 inches.
Economy
The economy of Stevensville is largely based on agriculture and tourism. The town is home to several farms and ranches, which produce hay, wheat, barley, and other crops. The town is also home to several wineries, which produce a variety of wines.
Tourism is also an important part of the local economy. The town is home to several attractions, including the St. Mary’s Mission, the Stevensville Historic District, and the Bitterroot Valley Museum.
Demographics
As of the 2010 census, Stevensville had a population of 1,809. The racial makeup of the town was 94.3% White, 0.7% Native American, 0.3% Asian, 0.2% African American, 0.1% Pacific Islander, and 4.4% from other races. The median household income was $37,917, and the median family income was $45,938.
The town is home to several churches, including the St. Mary’s Mission, which is the oldest church in Montana. The town is also home to several schools, including Stevensville High School, Stevensville Middle School, and Stevensville Elementary School.
Common Questions
What is Per Capita Income in Stevensville?
Per Capita income in Stevensville is $28,642.
What is the Median Family Income in Stevensville?
Median Family Income in Stevensville is $61,250.
What is the Median Household income in Stevensville?
Median Household Income in Stevensville is $39,836.
What is Income or Wage Gap in Stevensville?
Income or Wage Gap in Stevensville is 51.1%.
Women in Stevensville earn 48.9 cents for every dollar earned by a man.
What is Family Income Deficit in Stevensville?
Family Income Deficit in Stevensville is $12,098.
Families that are below poverty line in Stevensville earn $12,098 less on average than the poverty threshold level.
What is Inequality or Gini Index in Stevensville?
Inequality or Gini Index in Stevensville is 0.49.
What is the Total Population of Stevensville?
Total Population of Stevensville is 2,038.
What is the Total Male Population of Stevensville?
Total Male Population of Stevensville is 936.
What is the Total Female Population of Stevensville?
Total Female Population of Stevensville is 1,102.
What is the Ratio of Males per 100 Females in Stevensville?
There are 84.94 Males per 100 Females in Stevensville.
What is the Ratio of Females per 100 Males in Stevensville?
There are 117.74 Females per 100 Males in Stevensville.
What is the Median Population Age in Stevensville?
Median Population Age in Stevensville is 38.9 Years.
What is the Average Family Size in Stevensville
Average Family Size in Stevensville is 3.1 People.
What is the Average Household Size in Stevensville
Average Household Size in Stevensville is 2.2 People.
How Large is the Labor Force in Stevensville?
There are 963 People in the Labor Forcein in Stevensville.
What is the Percentage of People in the Labor Force in Stevensville?
60.2% of People are in the Labor Force in Stevensville.
What is the Unemployment Rate in Stevensville?
Unemployment Rate in Stevensville is 4.9%.