Libby, MT Map & Demographics
Libby Map
Libby Overview
$25,685
PER CAPITA INCOME
$44,593
AVG FAMILY INCOME
$36,373
AVG HOUSEHOLD INCOME
54.4%
WAGE / INCOME GAP [ % ]
45.6¢/ $1
WAGE / INCOME GAP [ $ ]
0.48
INEQUALITY / GINI INDEX
2,857
TOTAL POPULATION
1,400
MALE POPULATION
1,457
FEMALE POPULATION
96.09
MALES / 100 FEMALES
104.07
FEMALES / 100 MALES
49.9
MEDIAN AGE
2.6
AVG FAMILY SIZE
1.8
AVG HOUSEHOLD SIZE
1,153
LABOR FORCE [ PEOPLE ]
47.0%
PERCENT IN LABOR FORCE
2.1%
UNEMPLOYMENT RATE
Libby Zip Codes
Libby Area Codes
Income in Libby
Income Overview in Libby
Per Capita Income in Libby is $25,685, while median incomes of families and households are $44,593 and $36,373 respectively.
| Characteristic | Number | Measure |
| Per Capita Income | 2,857 | $25,685 |
| Median Family Income | 705 | $44,593 |
| Mean Family Income | 705 | $65,821 |
| Median Household Income | 1,480 | $36,373 |
| Mean Household Income | 1,480 | $49,385 |
| Income Deficit | 705 | $0 |
| Wage / Income Gap (%) | 2,857 | 54.36% |
| Wage / Income Gap ($) | 2,857 | 45.64¢ per $1 |
| Gini / Inequality Index | 2,857 | 0.48 |
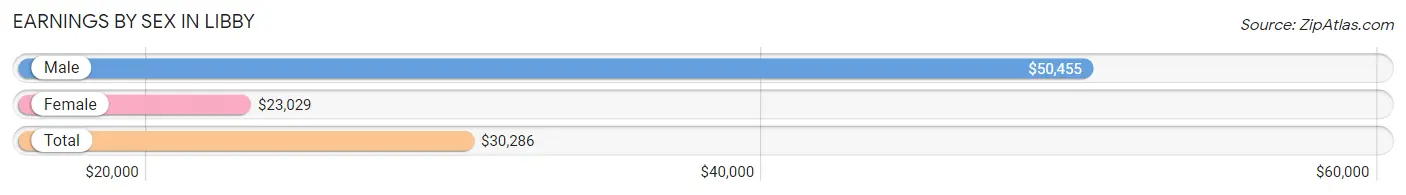
Earnings by Sex in Libby
Average Earnings in Libby are $30,286, $50,455 for men and $23,029 for women, a difference of 54.4%.
| Sex | Number | Average Earnings |
| Male | 542 (44.7%) | $50,455 |
| Female | 671 (55.3%) | $23,029 |
| Total | 1,213 (100.0%) | $30,286 |
Earnings by Sex by Income Bracket in Libby
The most common earnings brackets in Libby are $55,000 to $64,999 for men (90 | 16.6%) and $12,500 to $14,999 for women (99 | 14.7%).
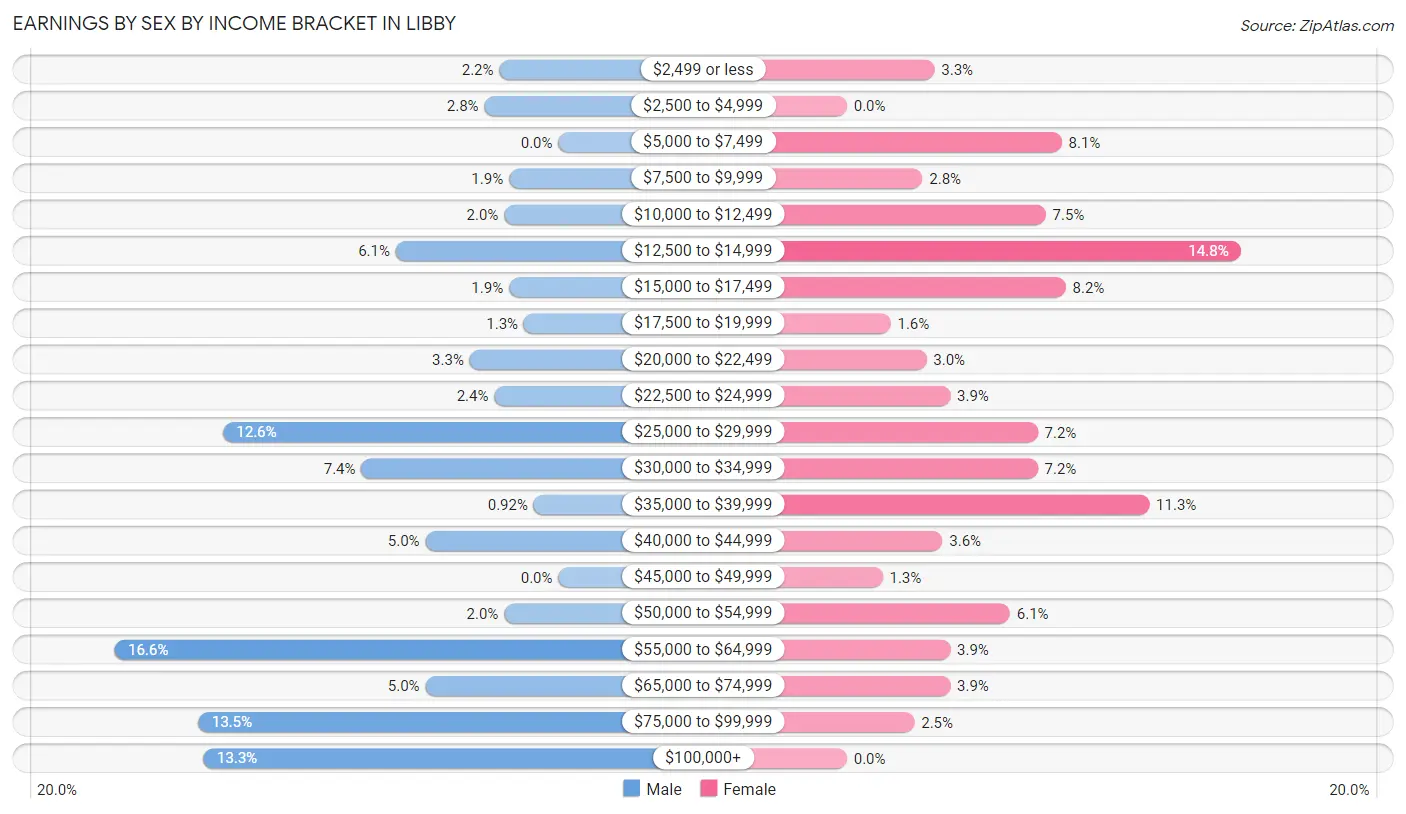
| Income | Male | Female |
| $2,499 or less | 12 (2.2%) | 22 (3.3%) |
| $2,500 to $4,999 | 15 (2.8%) | 0 (0.0%) |
| $5,000 to $7,499 | 0 (0.0%) | 54 (8.1%) |
| $7,500 to $9,999 | 10 (1.8%) | 19 (2.8%) |
| $10,000 to $12,499 | 11 (2.0%) | 50 (7.4%) |
| $12,500 to $14,999 | 33 (6.1%) | 99 (14.7%) |
| $15,000 to $17,499 | 10 (1.8%) | 55 (8.2%) |
| $17,500 to $19,999 | 7 (1.3%) | 11 (1.6%) |
| $20,000 to $22,499 | 18 (3.3%) | 20 (3.0%) |
| $22,500 to $24,999 | 13 (2.4%) | 26 (3.9%) |
| $25,000 to $29,999 | 68 (12.6%) | 48 (7.1%) |
| $30,000 to $34,999 | 40 (7.4%) | 48 (7.1%) |
| $35,000 to $39,999 | 5 (0.9%) | 76 (11.3%) |
| $40,000 to $44,999 | 27 (5.0%) | 24 (3.6%) |
| $45,000 to $49,999 | 0 (0.0%) | 9 (1.3%) |
| $50,000 to $54,999 | 11 (2.0%) | 41 (6.1%) |
| $55,000 to $64,999 | 90 (16.6%) | 26 (3.9%) |
| $65,000 to $74,999 | 27 (5.0%) | 26 (3.9%) |
| $75,000 to $99,999 | 73 (13.5%) | 17 (2.5%) |
| $100,000+ | 72 (13.3%) | 0 (0.0%) |
| Total | 542 (100.0%) | 671 (100.0%) |
Earnings by Sex by Educational Attainment in Libby
Average earnings in Libby are $51,136 for men and $28,411 for women, a difference of 44.4%. Men with an educational attainment of graduate degree enjoy the highest average annual earnings of $101,058, while those with high school diploma education earn the least with $29,683. Women with an educational attainment of college or associate's degree earn the most with the average annual earnings of $29,505, while those with high school diploma education have the smallest earnings of $14,390.
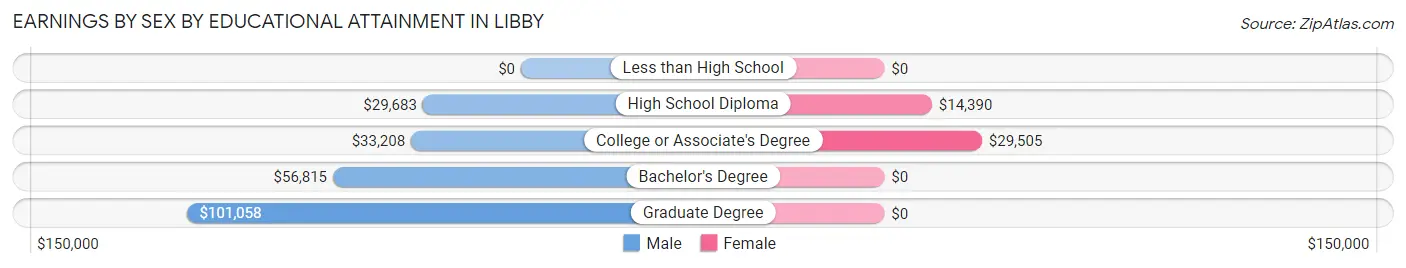
| Educational Attainment | Male Income | Female Income |
| Less than High School | - | - |
| High School Diploma | $29,683 | $14,390 |
| College or Associate's Degree | $33,208 | $29,505 |
| Bachelor's Degree | $56,815 | $0 |
| Graduate Degree | $101,058 | $0 |
| Total | $51,136 | $28,411 |
Family Income in Libby
Family Income Brackets in Libby
According to the Libby family income data, there are 143 families falling into the $100,000 to $149,999 income range, which is the most common income bracket and makes up 20.3% of all families. Conversely, the $150,000 to $199,999 income bracket is the least frequent group with only 17 families (2.4%) belonging to this category.
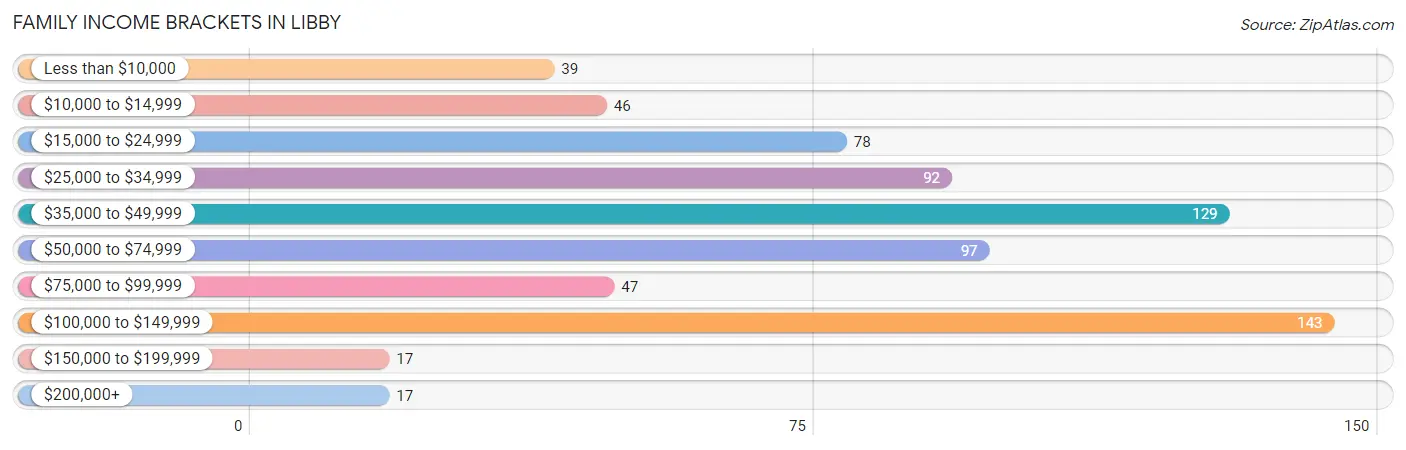
| Income Bracket | # Families | % Families |
| Less than $10,000 | 39 | 5.5% |
| $10,000 to $14,999 | 46 | 6.5% |
| $15,000 to $24,999 | 78 | 11.1% |
| $25,000 to $34,999 | 92 | 13.0% |
| $35,000 to $49,999 | 129 | 18.3% |
| $50,000 to $74,999 | 97 | 13.8% |
| $75,000 to $99,999 | 47 | 6.7% |
| $100,000 to $149,999 | 143 | 20.3% |
| $150,000 to $199,999 | 17 | 2.4% |
| $200,000+ | 17 | 2.4% |
Family Income by Famaliy Size in Libby
2-person families (434 | 61.6%) account for the highest median family income in Libby with $43,718 per family, while 2-person families (434 | 61.6%) have the highest median income of $21,859 per family member.
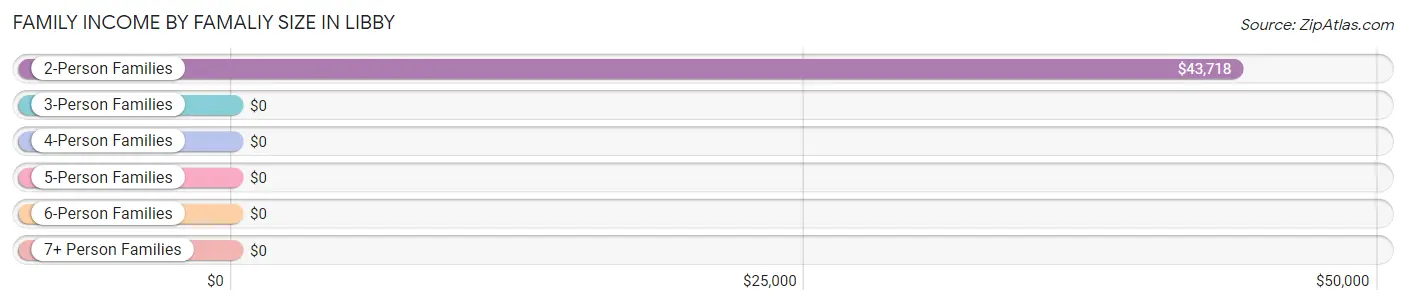
| Income Bracket | # Families | Median Income |
| 2-Person Families | 434 (61.6%) | $43,718 |
| 3-Person Families | 113 (16.0%) | $0 |
| 4-Person Families | 121 (17.2%) | $0 |
| 5-Person Families | 37 (5.2%) | $0 |
| 6-Person Families | 0 (0.0%) | $0 |
| 7+ Person Families | 0 (0.0%) | $0 |
| Total | 705 (100.0%) | $44,593 |
Family Income by Number of Earners in Libby
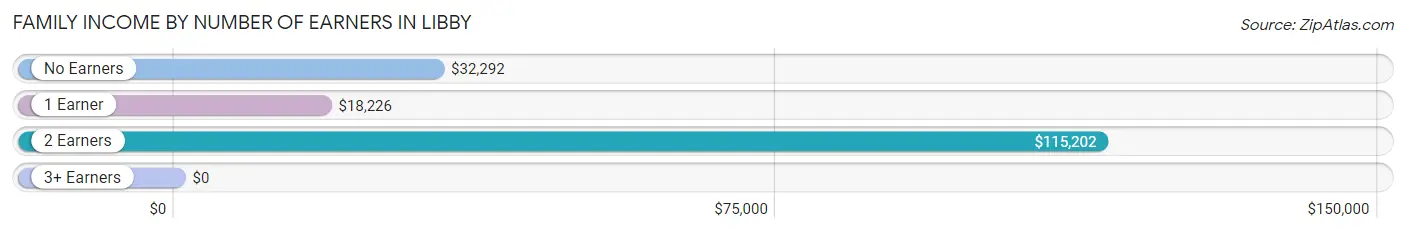
| Number of Earners | # Families | Median Income |
| No Earners | 232 (32.9%) | $32,292 |
| 1 Earner | 184 (26.1%) | $18,226 |
| 2 Earners | 253 (35.9%) | $115,202 |
| 3+ Earners | 36 (5.1%) | $0 |
| Total | 705 (100.0%) | $44,593 |
Household Income in Libby
Household Income Brackets in Libby
With 275 households falling in the category, the $35,000 to $49,999 income range is the most frequent in Libby, accounting for 18.6% of all households. In contrast, only 16 households (1.1%) fall into the $200,000+ income bracket, making it the least populous group.
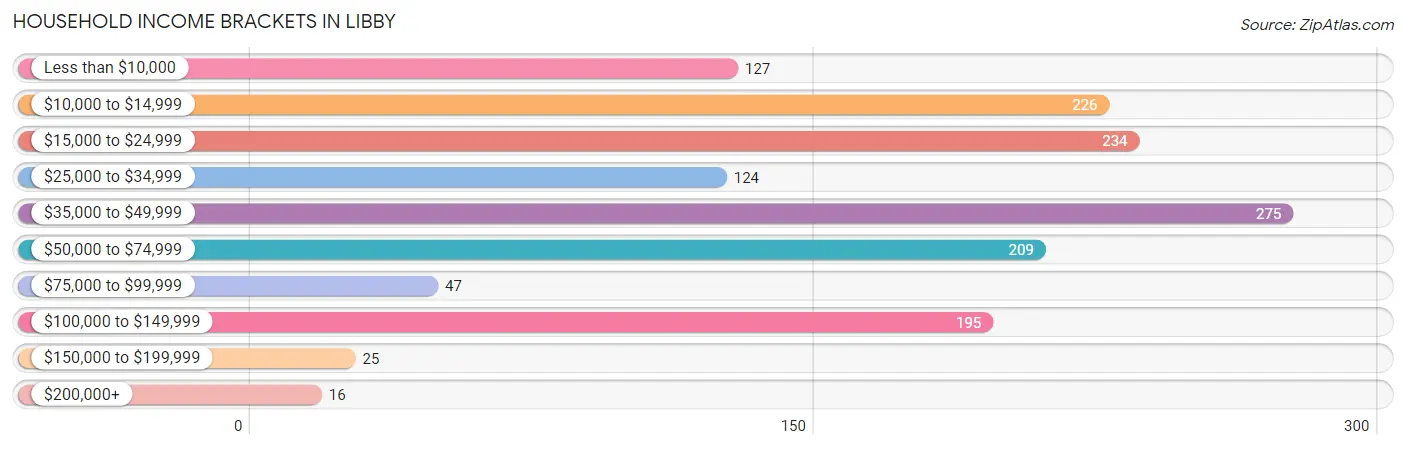
| Income Bracket | # Households | % Households |
| Less than $10,000 | 127 | 8.6% |
| $10,000 to $14,999 | 226 | 15.3% |
| $15,000 to $24,999 | 234 | 15.8% |
| $25,000 to $34,999 | 124 | 8.4% |
| $35,000 to $49,999 | 275 | 18.6% |
| $50,000 to $74,999 | 209 | 14.1% |
| $75,000 to $99,999 | 47 | 3.2% |
| $100,000 to $149,999 | 195 | 13.2% |
| $150,000 to $199,999 | 25 | 1.7% |
| $200,000+ | 16 | 1.1% |
Household Income by Householder Age in Libby
The median household income in Libby is $36,373, with the highest median household income of $55,587 found in the 25 to 44 years age bracket for the primary householder. A total of 355 households (24.0%) fall into this category. Meanwhile, the 45 to 64 years age bracket for the primary householder has the lowest median household income of $23,292, with 633 households (42.8%) in this group.
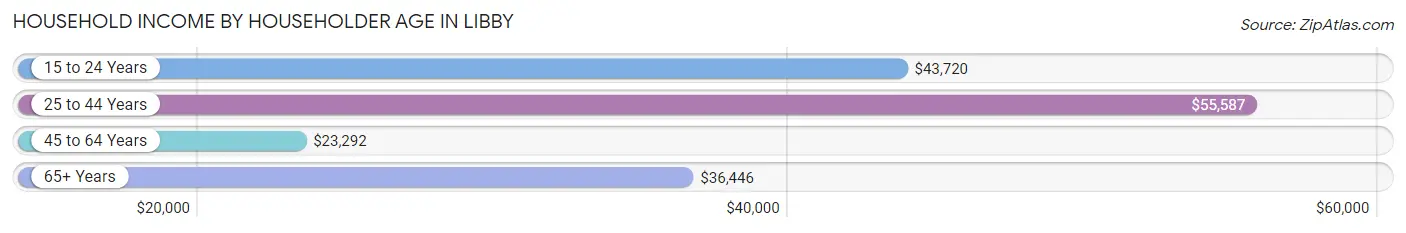
| Income Bracket | # Households | Median Income |
| 15 to 24 Years | 55 (3.7%) | $43,720 |
| 25 to 44 Years | 355 (24.0%) | $55,587 |
| 45 to 64 Years | 633 (42.8%) | $23,292 |
| 65+ Years | 437 (29.5%) | $36,446 |
| Total | 1,480 (100.0%) | $36,373 |
Poverty in Libby
Income Below Poverty by Sex and Age in Libby
With 30.9% poverty level for males and 27.5% for females among the residents of Libby, 12 to 14 year old males and 12 to 14 year old females are the most vulnerable to poverty, with 44 males (80.0%) and 31 females (100.0%) in their respective age groups living below the poverty level.
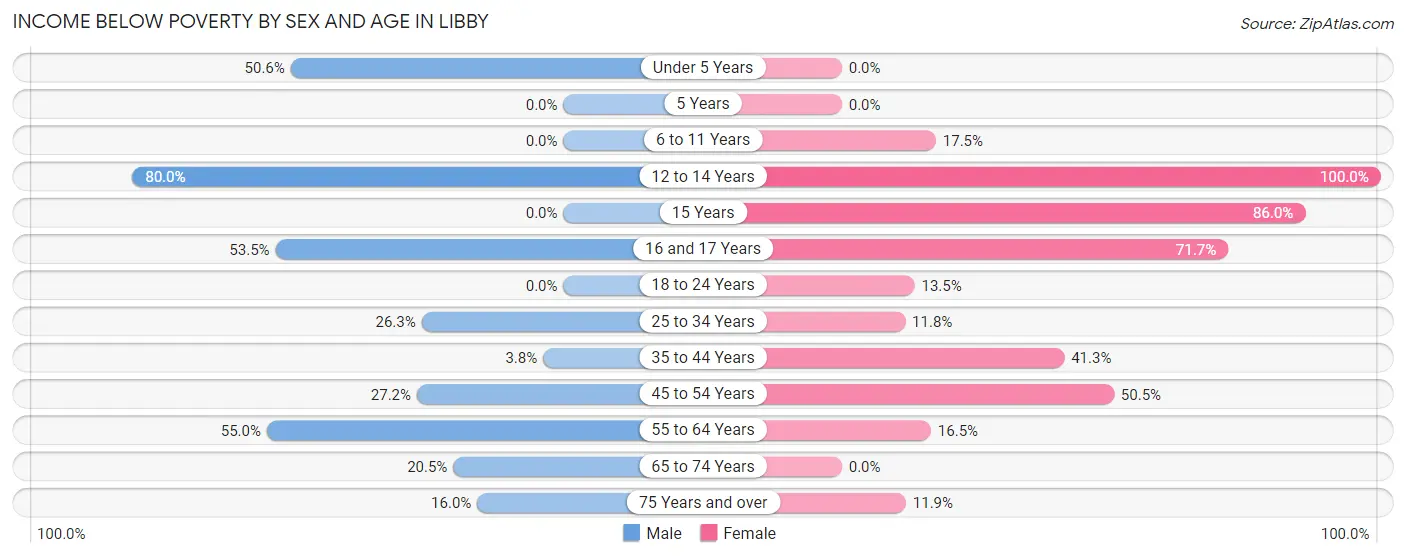
| Age Bracket | Male | Female |
| Under 5 Years | 40 (50.6%) | 0 (0.0%) |
| 5 Years | 0 (0.0%) | 0 (0.0%) |
| 6 to 11 Years | 0 (0.0%) | 11 (17.5%) |
| 12 to 14 Years | 44 (80.0%) | 31 (100.0%) |
| 15 Years | 0 (0.0%) | 43 (86.0%) |
| 16 and 17 Years | 31 (53.4%) | 38 (71.7%) |
| 18 to 24 Years | 0 (0.0%) | 22 (13.5%) |
| 25 to 34 Years | 50 (26.3%) | 12 (11.8%) |
| 35 to 44 Years | 4 (3.8%) | 64 (41.3%) |
| 45 to 54 Years | 31 (27.2%) | 100 (50.5%) |
| 55 to 64 Years | 142 (55.0%) | 43 (16.5%) |
| 65 to 74 Years | 36 (20.4%) | 0 (0.0%) |
| 75 Years and over | 36 (16.0%) | 17 (11.9%) |
| Total | 414 (30.9%) | 381 (27.5%) |
Income Above Poverty by Sex and Age in Libby
According to the poverty statistics in Libby, males aged 6 to 11 years and females aged under 5 years are the age groups that are most secure financially, with 100.0% of males and 100.0% of females in these age groups living above the poverty line.
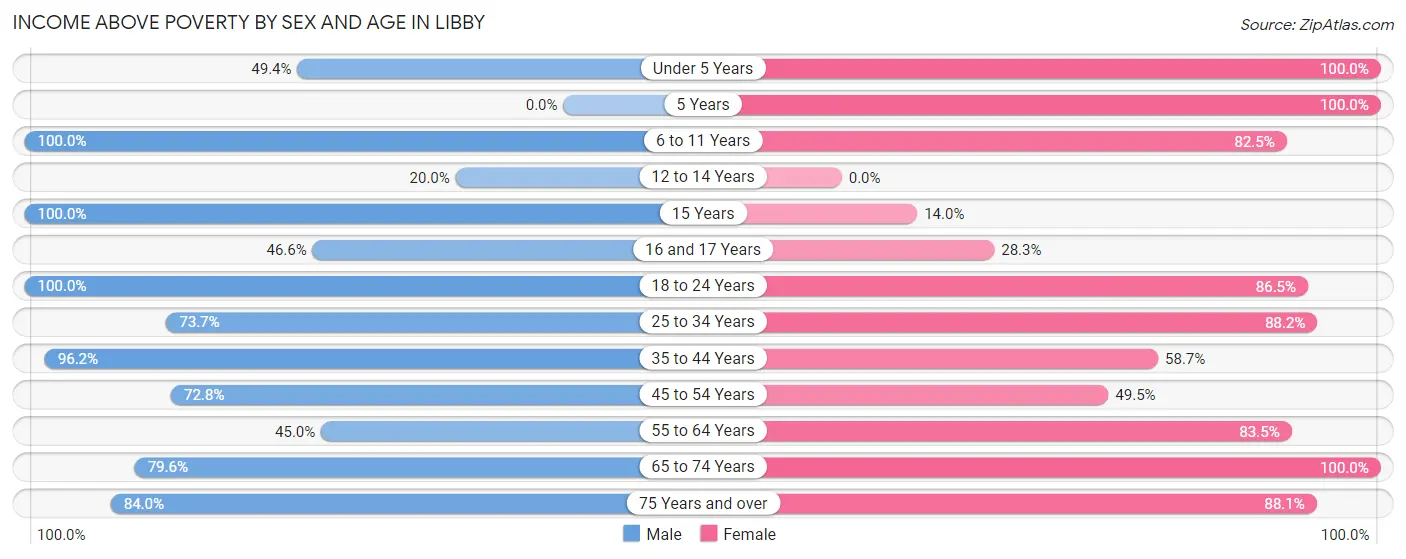
| Age Bracket | Male | Female |
| Under 5 Years | 39 (49.4%) | 35 (100.0%) |
| 5 Years | 0 (0.0%) | 19 (100.0%) |
| 6 to 11 Years | 61 (100.0%) | 52 (82.5%) |
| 12 to 14 Years | 11 (20.0%) | 0 (0.0%) |
| 15 Years | 11 (100.0%) | 7 (14.0%) |
| 16 and 17 Years | 27 (46.6%) | 15 (28.3%) |
| 18 to 24 Years | 6 (100.0%) | 141 (86.5%) |
| 25 to 34 Years | 140 (73.7%) | 90 (88.2%) |
| 35 to 44 Years | 102 (96.2%) | 91 (58.7%) |
| 45 to 54 Years | 83 (72.8%) | 98 (49.5%) |
| 55 to 64 Years | 116 (45.0%) | 217 (83.5%) |
| 65 to 74 Years | 140 (79.5%) | 116 (100.0%) |
| 75 Years and over | 189 (84.0%) | 126 (88.1%) |
| Total | 925 (69.1%) | 1,007 (72.6%) |
Income Below Poverty Among Married-Couple Families in Libby
The poverty statistics for married-couple families in Libby show that 2.8% or 15 of the total 545 families live below the poverty line. Families with no children have the highest poverty rate of 3.9%, comprising of 15 families. On the other hand, families with 1 or 2 children have the lowest poverty rate of 0.0%, which includes 0 families.
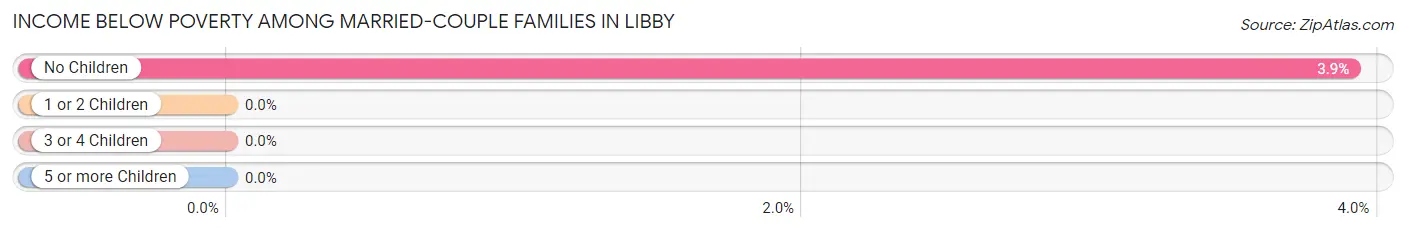
| Children | Above Poverty | Below Poverty |
| No Children | 369 (96.1%) | 15 (3.9%) |
| 1 or 2 Children | 124 (100.0%) | 0 (0.0%) |
| 3 or 4 Children | 37 (100.0%) | 0 (0.0%) |
| 5 or more Children | 0 (0.0%) | 0 (0.0%) |
| Total | 530 (97.3%) | 15 (2.8%) |
Income Below Poverty Among Single-Parent Households in Libby
According to the poverty data in Libby, 47.4% or 9 single-father households and 82.3% or 116 single-mother households are living below the poverty line. Among single-father households, those with 1 or 2 children have the highest poverty rate, with 9 households (47.4%) experiencing poverty. Likewise, among single-mother households, those with 3 or 4 children have the highest poverty rate, with 61 households (100.0%) falling below the poverty line.
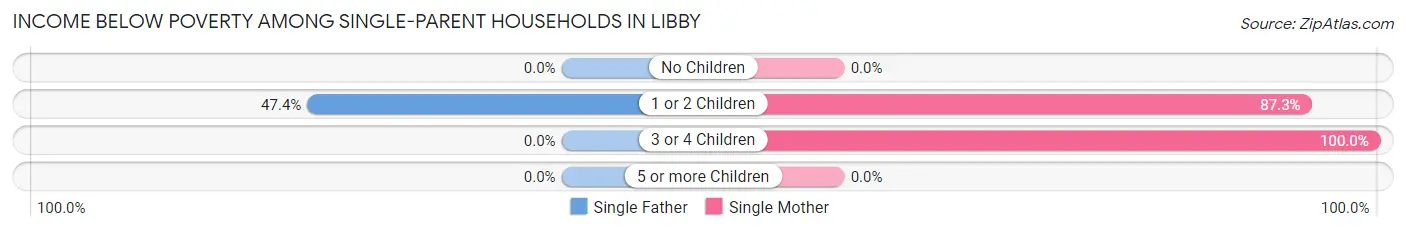
| Children | Single Father | Single Mother |
| No Children | 0 (0.0%) | 0 (0.0%) |
| 1 or 2 Children | 9 (47.4%) | 55 (87.3%) |
| 3 or 4 Children | 0 (0.0%) | 61 (100.0%) |
| 5 or more Children | 0 (0.0%) | 0 (0.0%) |
| Total | 9 (47.4%) | 116 (82.3%) |
Income Below Poverty Among Married-Couple vs Single-Parent Households in Libby
The poverty data for Libby shows that 15 of the married-couple family households (2.8%) and 125 of the single-parent households (78.1%) are living below the poverty level. Within the married-couple family households, those with no children have the highest poverty rate, with 15 households (3.9%) falling below the poverty line. Among the single-parent households, those with 3 or 4 children have the highest poverty rate, with 61 household (100.0%) living below poverty.
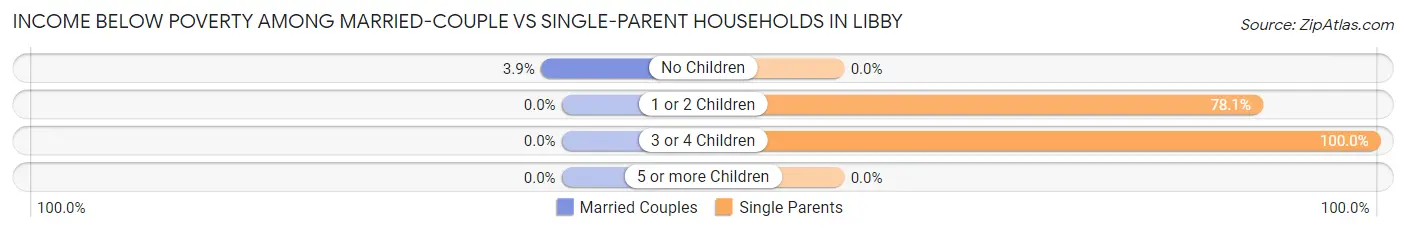
| Children | Married-Couple Families | Single-Parent Households |
| No Children | 15 (3.9%) | 0 (0.0%) |
| 1 or 2 Children | 0 (0.0%) | 64 (78.0%) |
| 3 or 4 Children | 0 (0.0%) | 61 (100.0%) |
| 5 or more Children | 0 (0.0%) | 0 (0.0%) |
| Total | 15 (2.8%) | 125 (78.1%) |
Race in Libby
The most populous races in Libby are White / Caucasian (2,516 | 88.1%), Two or more Races (166 | 5.8%), and Native / Alaskan (157 | 5.5%).
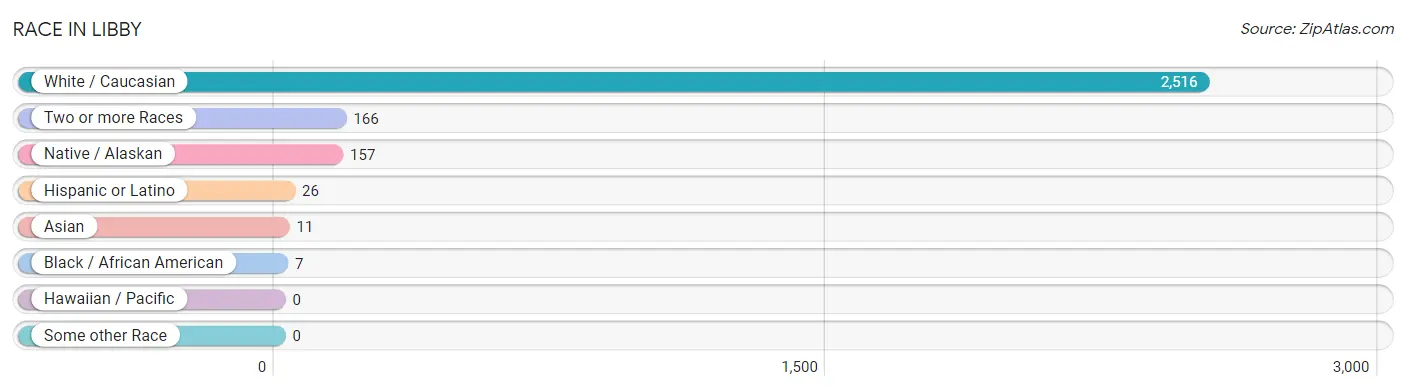
| Race | # Population | % Population |
| Asian | 11 | 0.4% |
| Black / African American | 7 | 0.3% |
| Hawaiian / Pacific | 0 | 0.0% |
| Hispanic or Latino | 26 | 0.9% |
| Native / Alaskan | 157 | 5.5% |
| White / Caucasian | 2,516 | 88.1% |
| Two or more Races | 166 | 5.8% |
| Some other Race | 0 | 0.0% |
| Total | 2,857 | 100.0% |
Ancestry in Libby
The most populous ancestries reported in Libby are German (633 | 22.2%), English (436 | 15.3%), Norwegian (272 | 9.5%), Irish (206 | 7.2%), and French (185 | 6.5%), together accounting for 60.6% of all Libby residents.
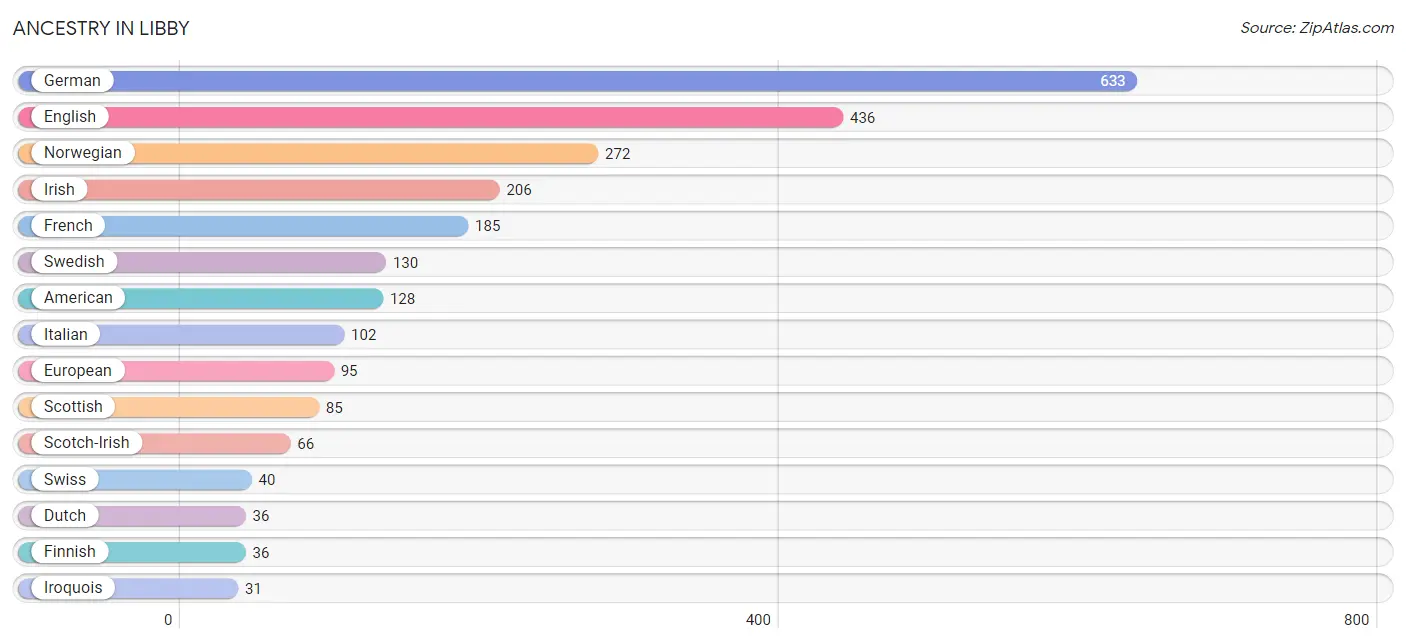
| Ancestry | # Population | % Population |
| African | 7 | 0.3% |
| American | 128 | 4.5% |
| Bhutanese | 8 | 0.3% |
| Blackfeet | 13 | 0.5% |
| Cree | 9 | 0.3% |
| Czechoslovakian | 11 | 0.4% |
| Danish | 15 | 0.5% |
| Dutch | 36 | 1.3% |
| English | 436 | 15.3% |
| European | 95 | 3.3% |
| Finnish | 36 | 1.3% |
| French | 185 | 6.5% |
| French Canadian | 16 | 0.6% |
| German | 633 | 22.2% |
| Inupiat | 20 | 0.7% |
| Irish | 206 | 7.2% |
| Iroquois | 31 | 1.1% |
| Italian | 102 | 3.6% |
| Korean | 15 | 0.5% |
| Mexican | 26 | 0.9% |
| Norwegian | 272 | 9.5% |
| Polish | 21 | 0.7% |
| Scandinavian | 22 | 0.8% |
| Scotch-Irish | 66 | 2.3% |
| Scottish | 85 | 3.0% |
| Subsaharan African | 7 | 0.3% |
| Swedish | 130 | 4.5% |
| Swiss | 40 | 1.4% |
| Ukrainian | 10 | 0.4% | View All 29 Rows |
Immigrants in Libby
The most numerous immigrant groups reported in Libby came from Central America (21 | 0.7%), Latin America (21 | 0.7%), Mexico (21 | 0.7%), Europe (12 | 0.4%), and Asia (10 | 0.4%), together accounting for 3.0% of all Libby residents.
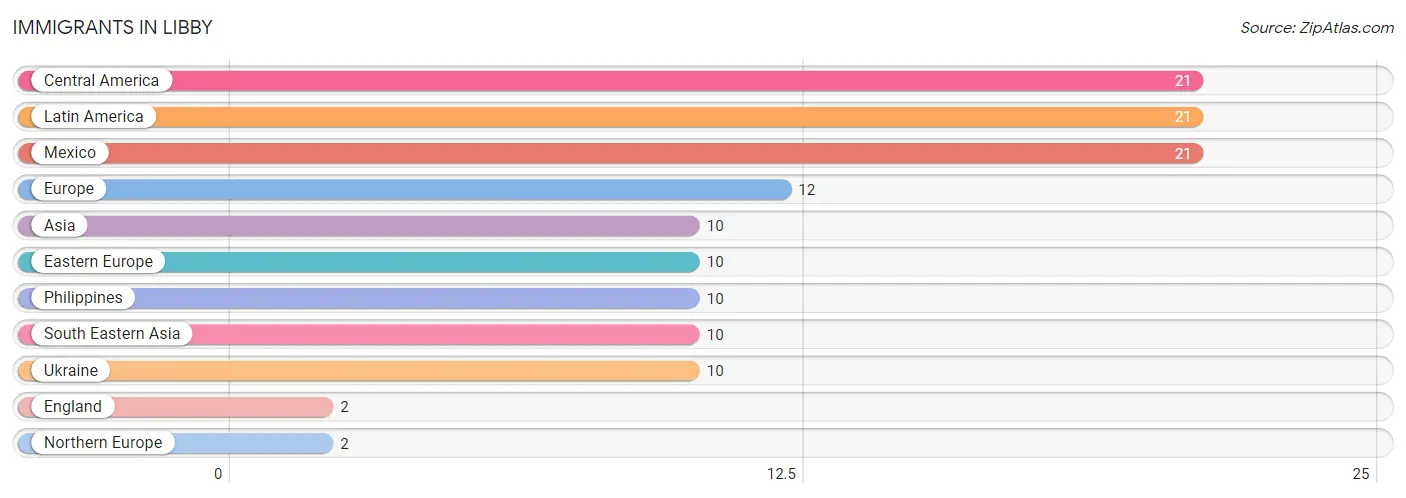
| Immigration Origin | # Population | % Population |
| Asia | 10 | 0.4% |
| Central America | 21 | 0.7% |
| Eastern Europe | 10 | 0.4% |
| England | 2 | 0.1% |
| Europe | 12 | 0.4% |
| Latin America | 21 | 0.7% |
| Mexico | 21 | 0.7% |
| Northern Europe | 2 | 0.1% |
| Philippines | 10 | 0.4% |
| South Eastern Asia | 10 | 0.4% |
| Ukraine | 10 | 0.4% | View All 11 Rows |
Sex and Age in Libby
Sex and Age in Libby
The most populous age groups in Libby are 60 to 64 Years (166 | 11.9%) for men and 15 to 19 Years (172 | 11.8%) for women.
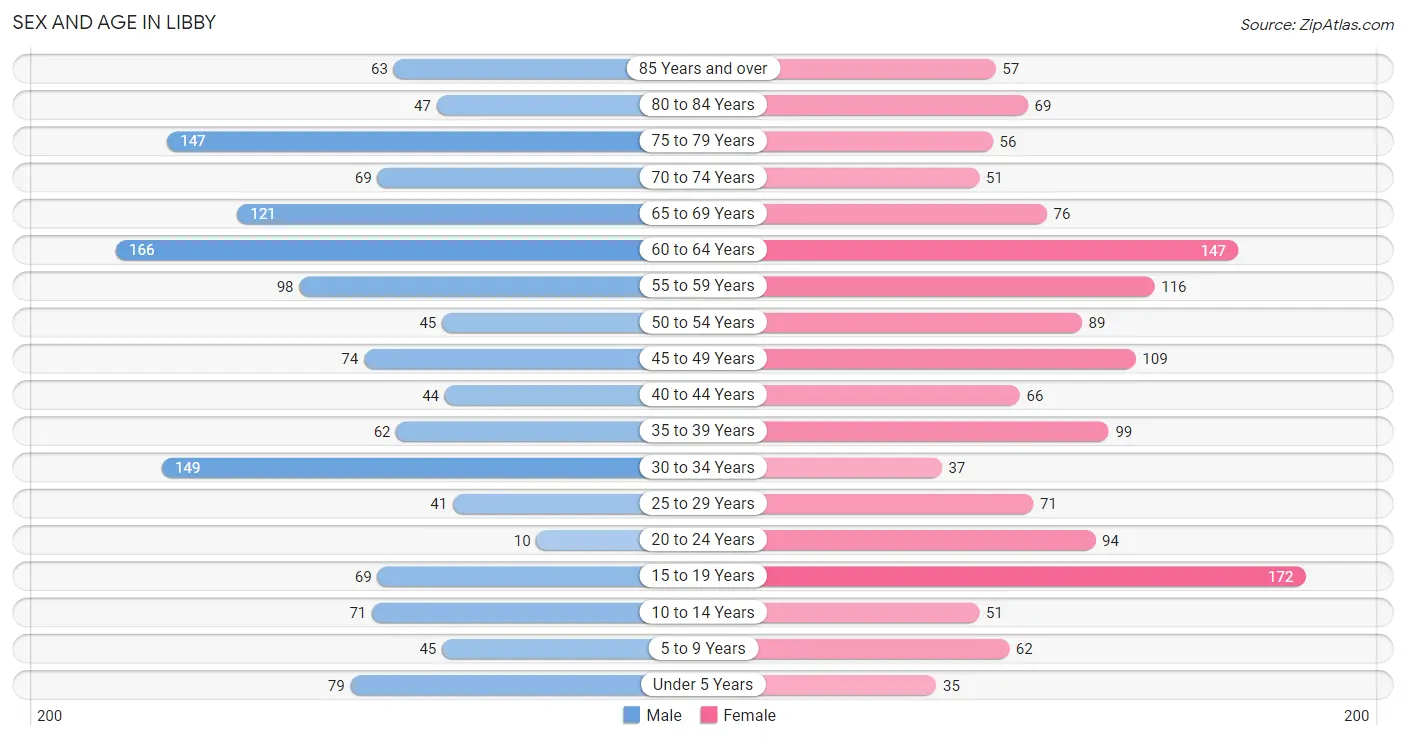
| Age Bracket | Male | Female |
| Under 5 Years | 79 (5.6%) | 35 (2.4%) |
| 5 to 9 Years | 45 (3.2%) | 62 (4.3%) |
| 10 to 14 Years | 71 (5.1%) | 51 (3.5%) |
| 15 to 19 Years | 69 (4.9%) | 172 (11.8%) |
| 20 to 24 Years | 10 (0.7%) | 94 (6.5%) |
| 25 to 29 Years | 41 (2.9%) | 71 (4.9%) |
| 30 to 34 Years | 149 (10.6%) | 37 (2.5%) |
| 35 to 39 Years | 62 (4.4%) | 99 (6.8%) |
| 40 to 44 Years | 44 (3.1%) | 66 (4.5%) |
| 45 to 49 Years | 74 (5.3%) | 109 (7.5%) |
| 50 to 54 Years | 45 (3.2%) | 89 (6.1%) |
| 55 to 59 Years | 98 (7.0%) | 116 (8.0%) |
| 60 to 64 Years | 166 (11.9%) | 147 (10.1%) |
| 65 to 69 Years | 121 (8.6%) | 76 (5.2%) |
| 70 to 74 Years | 69 (4.9%) | 51 (3.5%) |
| 75 to 79 Years | 147 (10.5%) | 56 (3.8%) |
| 80 to 84 Years | 47 (3.4%) | 69 (4.7%) |
| 85 Years and over | 63 (4.5%) | 57 (3.9%) |
| Total | 1,400 (100.0%) | 1,457 (100.0%) |
Families and Households in Libby
Median Family Size in Libby
The median family size in Libby is 2.56 persons per family, with single male/father families (19 | 2.7%) accounting for the largest median family size of 3.26 persons per family. On the other hand, married-couple families (545 | 77.3%) represent the smallest median family size with 2.50 persons per family.
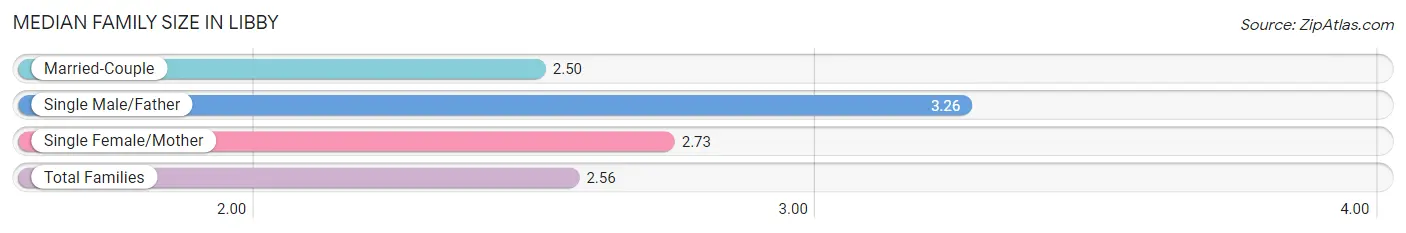
| Family Type | # Families | Family Size |
| Married-Couple | 545 (77.3%) | 2.50 |
| Single Male/Father | 19 (2.7%) | 3.26 |
| Single Female/Mother | 141 (20.0%) | 2.73 |
| Total Families | 705 (100.0%) | 2.56 |
Median Household Size in Libby
The median household size in Libby is 1.82 persons per household, with single male/father households (19 | 1.3%) accounting for the largest median household size of 3.79 persons per household. non-family households (775 | 52.4%) represent the smallest median household size with 1.09 persons per household.
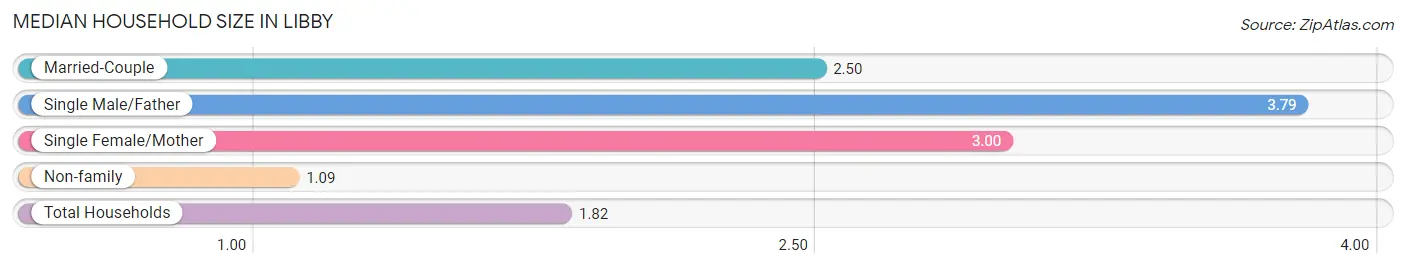
| Household Type | # Households | Household Size |
| Married-Couple | 545 (36.8%) | 2.50 |
| Single Male/Father | 19 (1.3%) | 3.79 |
| Single Female/Mother | 141 (9.5%) | 3.00 |
| Non-family | 775 (52.4%) | 1.09 |
| Total Households | 1,480 (100.0%) | 1.82 |
Household Size by Marriage Status in Libby
Out of a total of 1,480 households in Libby, 705 (47.6%) are family households, while 775 (52.4%) are nonfamily households. The most numerous type of family households are 2-person households, comprising 410, and the most common type of nonfamily households are 1-person households, comprising 702.
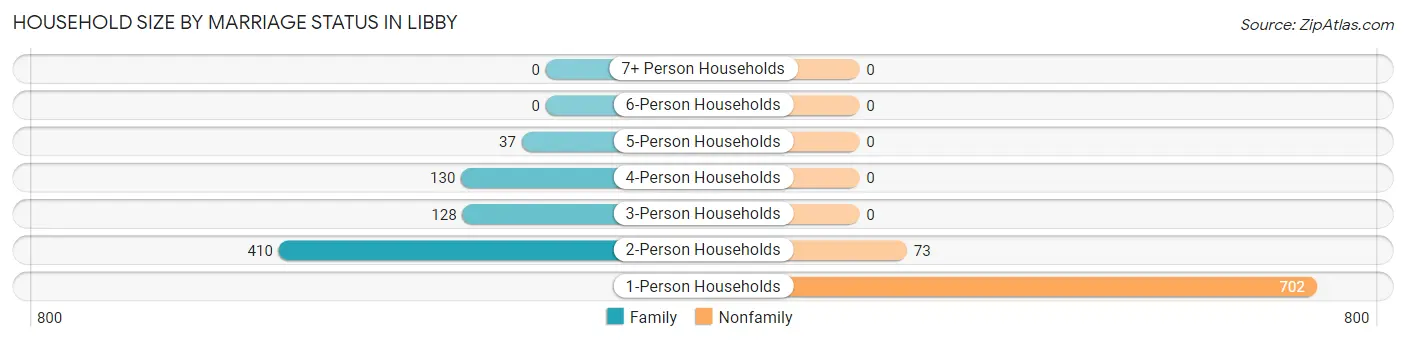
| Household Size | Family Households | Nonfamily Households |
| 1-Person Households | - | 702 (47.4%) |
| 2-Person Households | 410 (27.7%) | 73 (4.9%) |
| 3-Person Households | 128 (8.6%) | 0 (0.0%) |
| 4-Person Households | 130 (8.8%) | 0 (0.0%) |
| 5-Person Households | 37 (2.5%) | 0 (0.0%) |
| 6-Person Households | 0 (0.0%) | 0 (0.0%) |
| 7+ Person Households | 0 (0.0%) | 0 (0.0%) |
| Total | 705 (47.6%) | 775 (52.4%) |
Female Fertility in Libby
Fertility by Age in Libby
Average fertility rate in Libby is 109.0 births per 1,000 women. Women in the age bracket of 20 to 34 years have the highest fertility rate with 287.0 births per 1,000 women. Women in the age bracket of 20 to 34 years acount for 79.4% of all women with births.
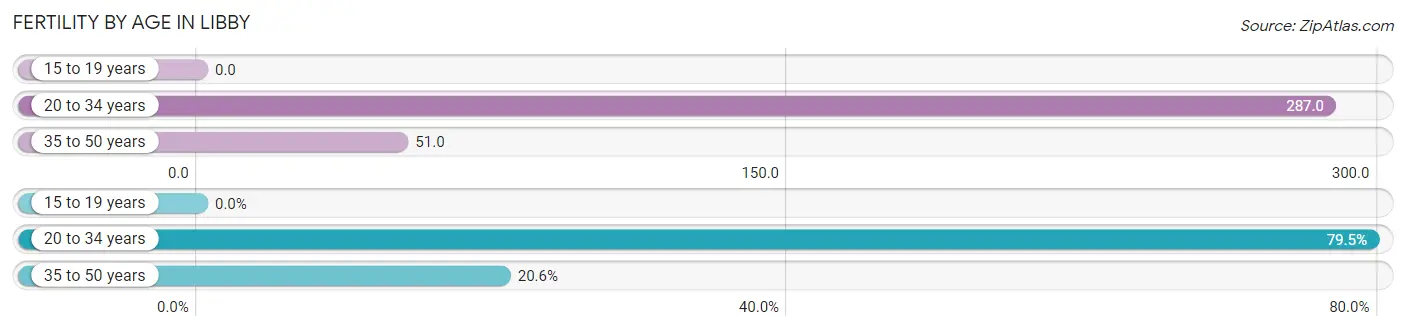
| Age Bracket | Women with Births | Births / 1,000 Women |
| 15 to 19 years | 0 (0.0%) | 0.0 |
| 20 to 34 years | 58 (79.4%) | 287.0 |
| 35 to 50 years | 15 (20.5%) | 51.0 |
| Total | 73 (100.0%) | 109.0 |
Fertility by Age by Marriage Status in Libby
79.5% of women with births (73) in Libby are married. The highest percentage of unmarried women with births falls into 35 to 50 years age bracket with 100.0% of them unmarried at the time of birth, while the lowest percentage of unmarried women with births belong to 20 to 34 years age bracket with 0.0% of them unmarried.
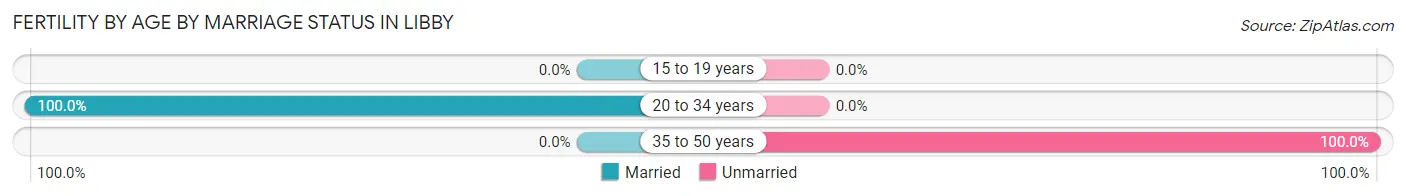
| Age Bracket | Married | Unmarried |
| 15 to 19 years | 0 (0.0%) | 0 (0.0%) |
| 20 to 34 years | 58 (100.0%) | 0 (0.0%) |
| 35 to 50 years | 0 (0.0%) | 15 (100.0%) |
| Total | 58 (79.4%) | 15 (20.5%) |
Fertility by Education in Libby
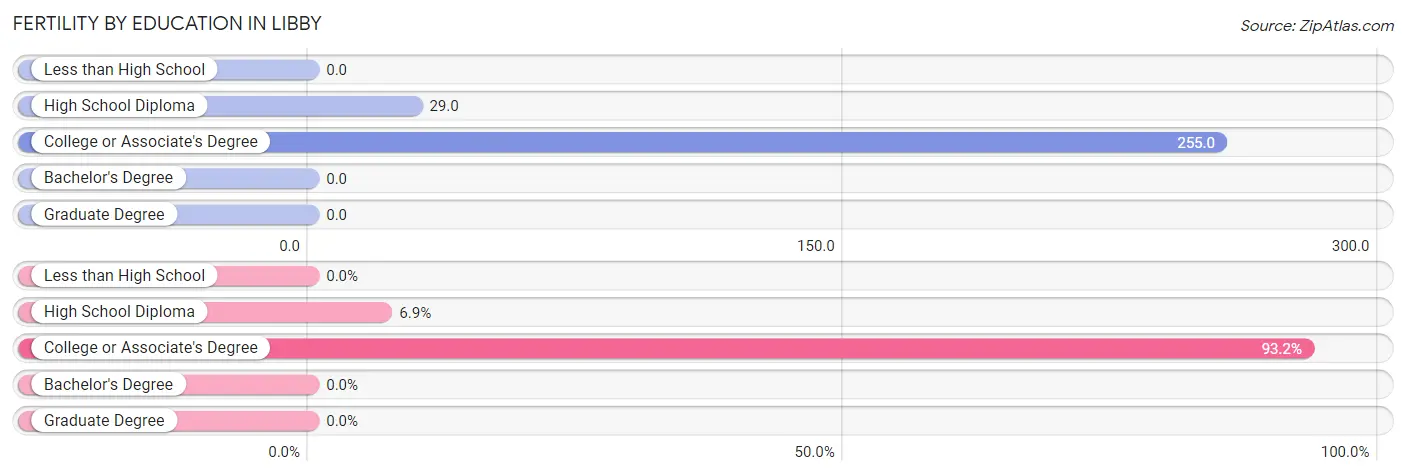
| Educational Attainment | Women with Births | Births / 1,000 Women |
| Less than High School | 0 (0.0%) | 0.0 |
| High School Diploma | 5 (6.9%) | 29.0 |
| College or Associate's Degree | 68 (93.1%) | 255.0 |
| Bachelor's Degree | 0 (0.0%) | 0.0 |
| Graduate Degree | 0 (0.0%) | 0.0 |
| Total | 73 (100.0%) | 109.0 |
Fertility by Education by Marriage Status in Libby
20.5% of women with births in Libby are unmarried. Women with the educational attainment of high school diploma are most likely to be married with 100.0% of them married at childbirth, while women with the educational attainment of college or associate's degree are least likely to be married with 22.1% of them unmarried at childbirth.
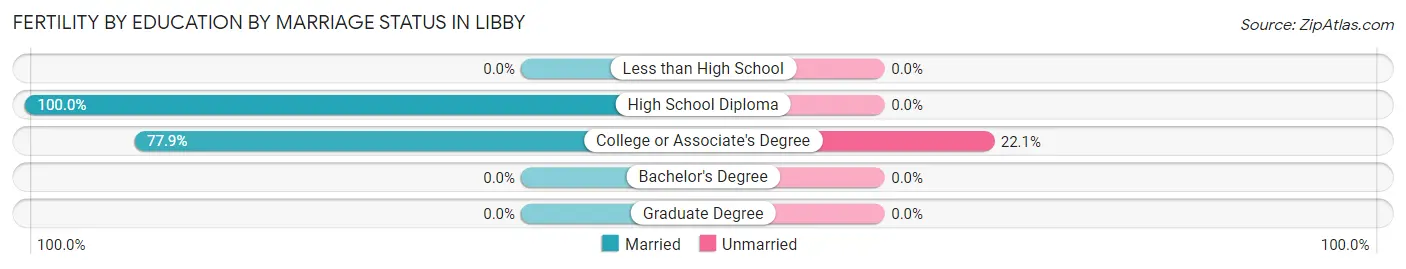
| Educational Attainment | Married | Unmarried |
| Less than High School | 0 (0.0%) | 0 (0.0%) |
| High School Diploma | 5 (100.0%) | 0 (0.0%) |
| College or Associate's Degree | 53 (77.9%) | 15 (22.1%) |
| Bachelor's Degree | 0 (0.0%) | 0 (0.0%) |
| Graduate Degree | 0 (0.0%) | 0 (0.0%) |
| Total | 58 (79.4%) | 15 (20.5%) |
Employment Characteristics in Libby
Employment by Class of Employer in Libby
Among the 1,128 employed individuals in Libby, private company employees (568 | 50.3%), federal government employees (183 | 16.2%), and not-for-profit organizations (121 | 10.7%) make up the most common classes of employment.
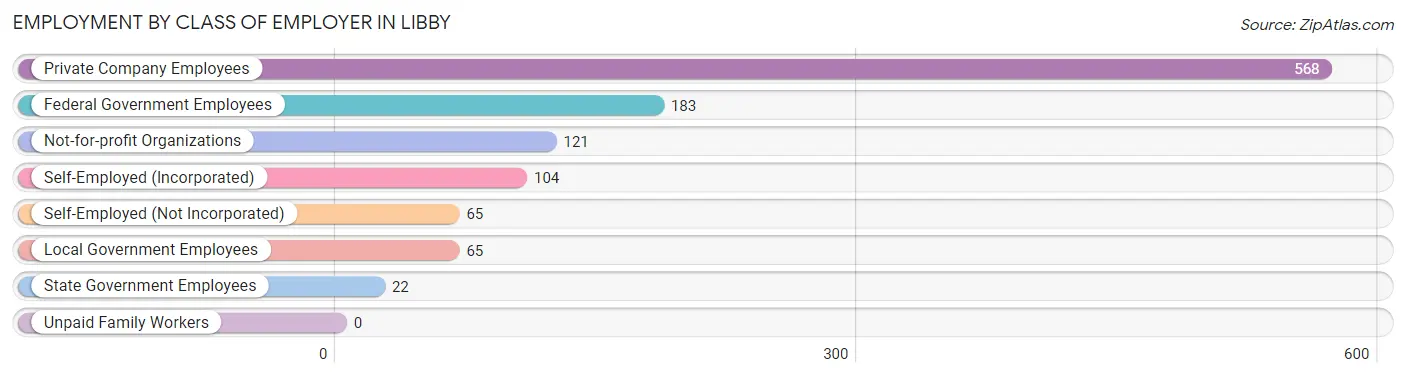
| Employer Class | # Employees | % Employees |
| Private Company Employees | 568 | 50.3% |
| Self-Employed (Incorporated) | 104 | 9.2% |
| Self-Employed (Not Incorporated) | 65 | 5.8% |
| Not-for-profit Organizations | 121 | 10.7% |
| Local Government Employees | 65 | 5.8% |
| State Government Employees | 22 | 1.9% |
| Federal Government Employees | 183 | 16.2% |
| Unpaid Family Workers | 0 | 0.0% |
| Total | 1,128 | 100.0% |
Employment Status by Age in Libby
According to the labor force statistics for Libby, out of the total population over 16 years of age (2,453), 47.0% or 1,153 individuals are in the labor force, with 2.1% or 24 of them unemployed. The age group with the highest labor force participation rate is 30 to 34 years, with 90.3% or 168 individuals in the labor force. Within the labor force, the 16 to 19 years age range has the highest percentage of unemployed individuals, with 40.5% or 15 of them being unemployed.
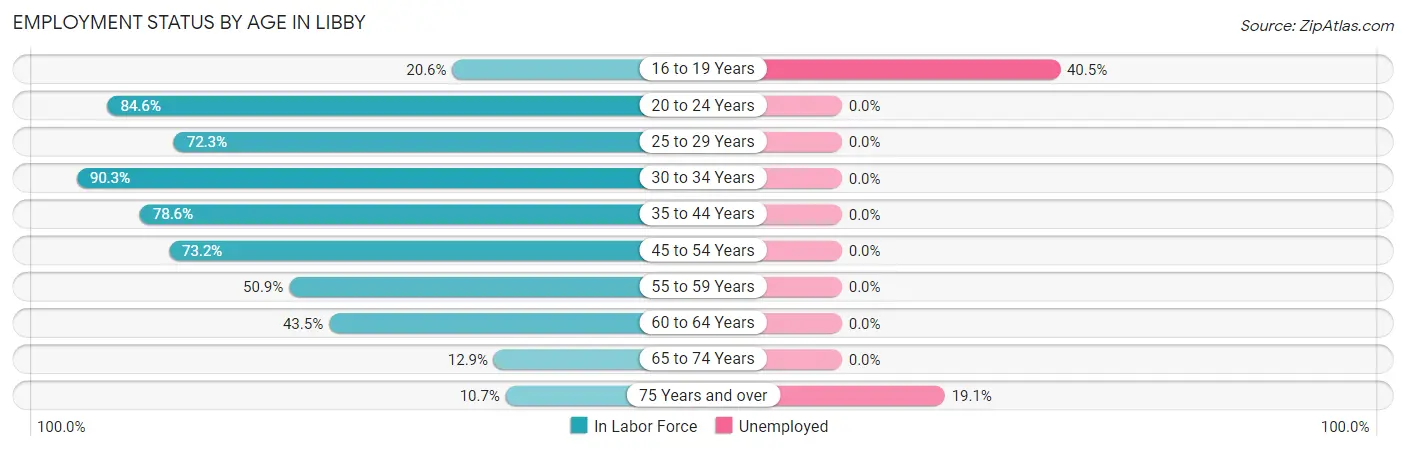
| Age Bracket | In Labor Force | Unemployed |
| 16 to 19 Years | 37 (20.6%) | 15 (40.5%) |
| 20 to 24 Years | 88 (84.6%) | 0 (0.0%) |
| 25 to 29 Years | 81 (72.3%) | 0 (0.0%) |
| 30 to 34 Years | 168 (90.3%) | 0 (0.0%) |
| 35 to 44 Years | 213 (78.6%) | 0 (0.0%) |
| 45 to 54 Years | 232 (73.2%) | 0 (0.0%) |
| 55 to 59 Years | 109 (50.9%) | 0 (0.0%) |
| 60 to 64 Years | 136 (43.5%) | 0 (0.0%) |
| 65 to 74 Years | 41 (12.9%) | 0 (0.0%) |
| 75 Years and over | 47 (10.7%) | 9 (19.1%) |
| Total | 1,153 (47.0%) | 24 (2.1%) |
Employment Status by Educational Attainment in Libby
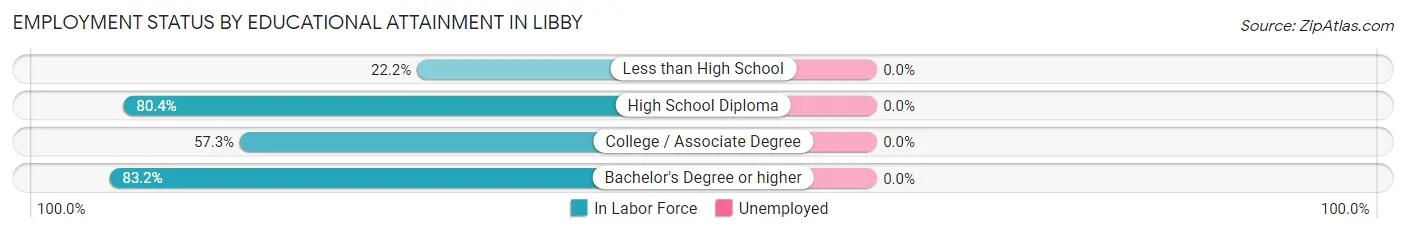
| Educational Attainment | In Labor Force | Unemployed |
| Less than High School | 24 (22.2%) | 0 (0.0%) |
| High School Diploma | 394 (80.4%) | 0 (0.0%) |
| College / Associate Degree | 348 (57.3%) | 0 (0.0%) |
| Bachelor's Degree or higher | 173 (83.2%) | 0 (0.0%) |
| Total | 940 (66.5%) | 0 (0.0%) |
Employment Occupations by Sex in Libby
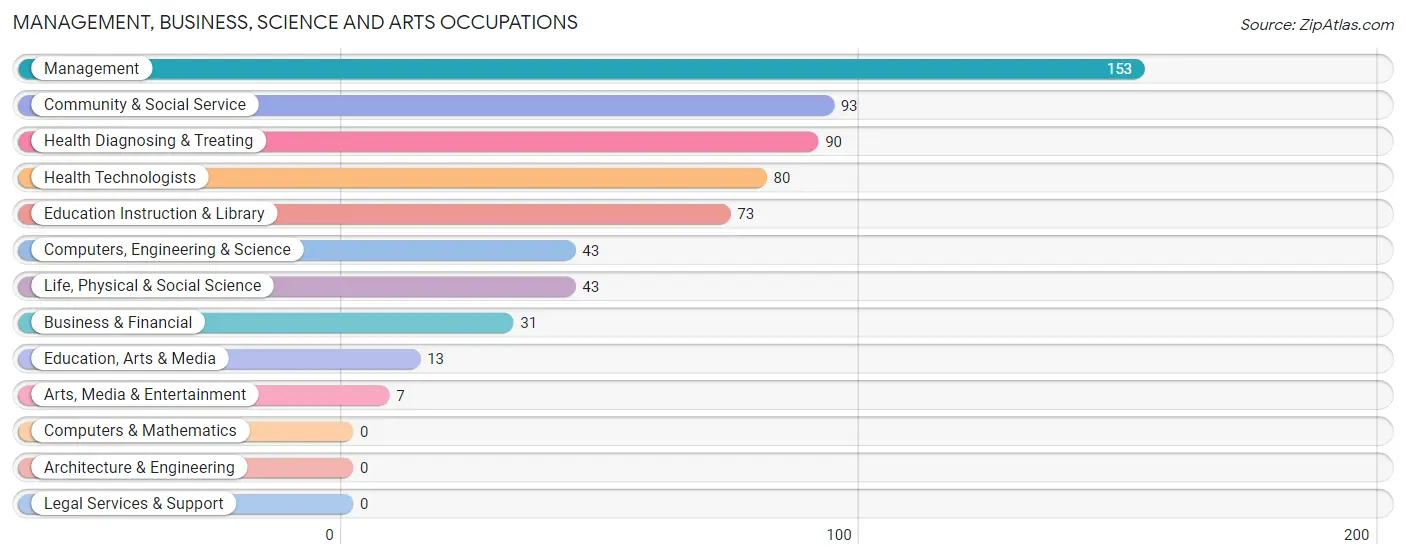
Management, Business, Science and Arts Occupations
The most common Management, Business, Science and Arts occupations in Libby are Management (153 | 13.6%), Community & Social Service (93 | 8.2%), Health Diagnosing & Treating (90 | 8.0%), Health Technologists (80 | 7.1%), and Education Instruction & Library (73 | 6.5%).
Management, Business, Science and Arts Occupations by Sex
Within the Management, Business, Science and Arts occupations in Libby, the most male-oriented occupations are Computers, Engineering & Science (100.0%), Life, Physical & Social Science (100.0%), and Education, Arts & Media (100.0%), while the most female-oriented occupations are Education Instruction & Library (100.0%), Arts, Media & Entertainment (100.0%), and Community & Social Service (86.0%).
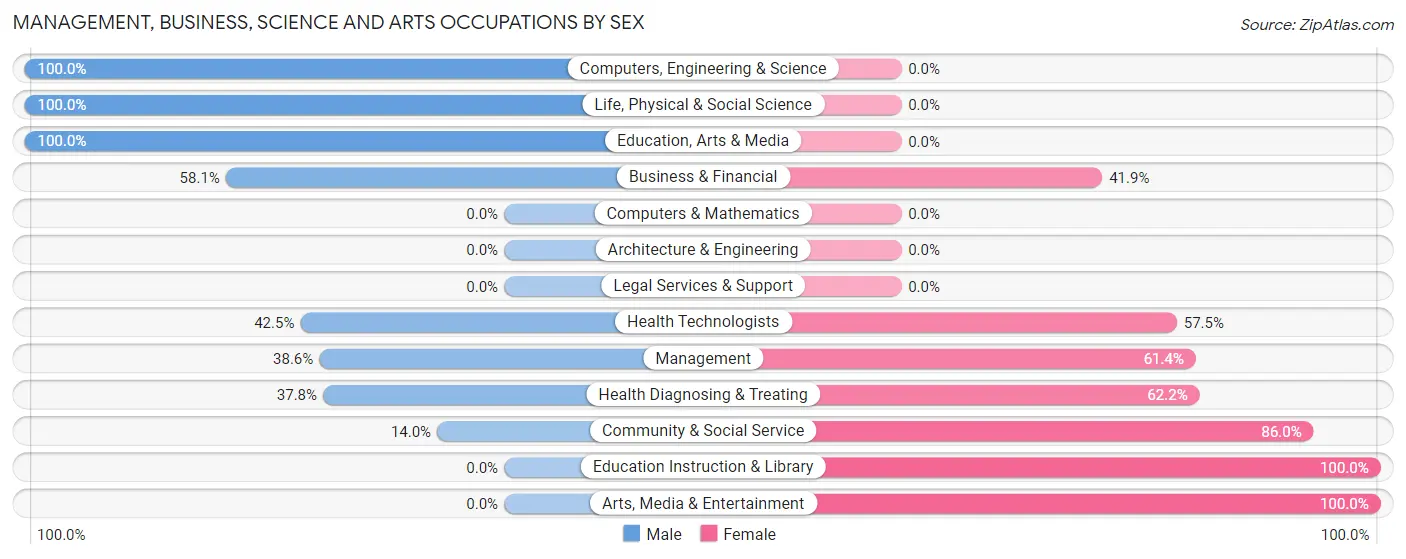
| Occupation | Male | Female |
| Management | 59 (38.6%) | 94 (61.4%) |
| Business & Financial | 18 (58.1%) | 13 (41.9%) |
| Computers, Engineering & Science | 43 (100.0%) | 0 (0.0%) |
| Computers & Mathematics | 0 (0.0%) | 0 (0.0%) |
| Architecture & Engineering | 0 (0.0%) | 0 (0.0%) |
| Life, Physical & Social Science | 43 (100.0%) | 0 (0.0%) |
| Community & Social Service | 13 (14.0%) | 80 (86.0%) |
| Education, Arts & Media | 13 (100.0%) | 0 (0.0%) |
| Legal Services & Support | 0 (0.0%) | 0 (0.0%) |
| Education Instruction & Library | 0 (0.0%) | 73 (100.0%) |
| Arts, Media & Entertainment | 0 (0.0%) | 7 (100.0%) |
| Health Diagnosing & Treating | 34 (37.8%) | 56 (62.2%) |
| Health Technologists | 34 (42.5%) | 46 (57.5%) |
| Total (Category) | 167 (40.7%) | 243 (59.3%) |
| Total (Overall) | 512 (45.4%) | 616 (54.6%) |
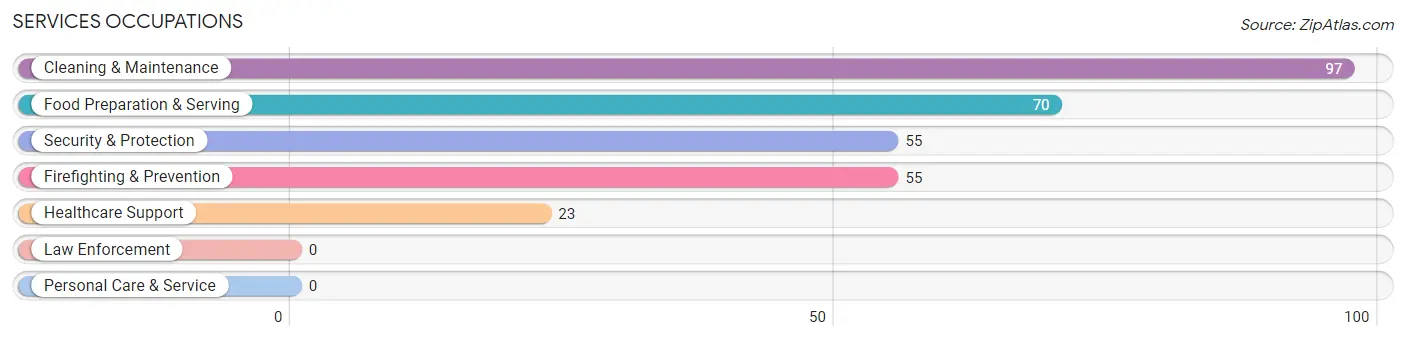
Services Occupations
The most common Services occupations in Libby are Cleaning & Maintenance (97 | 8.6%), Food Preparation & Serving (70 | 6.2%), Security & Protection (55 | 4.9%), Firefighting & Prevention (55 | 4.9%), and Healthcare Support (23 | 2.0%).
Services Occupations by Sex
Within the Services occupations in Libby, the most male-oriented occupations are Security & Protection (54.5%), Firefighting & Prevention (54.5%), and Cleaning & Maintenance (53.6%), while the most female-oriented occupations are Healthcare Support (100.0%), Food Preparation & Serving (87.1%), and Cleaning & Maintenance (46.4%).
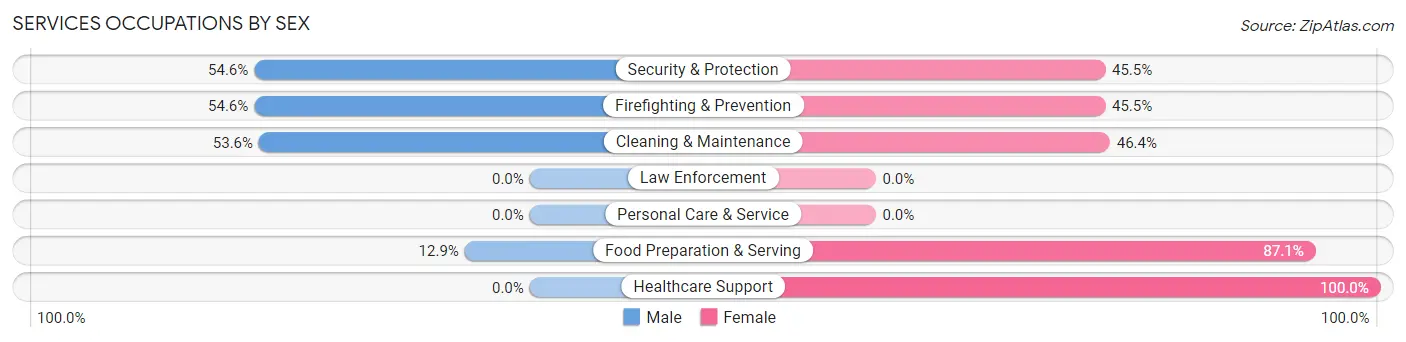
| Occupation | Male | Female |
| Healthcare Support | 0 (0.0%) | 23 (100.0%) |
| Security & Protection | 30 (54.5%) | 25 (45.5%) |
| Firefighting & Prevention | 30 (54.5%) | 25 (45.5%) |
| Law Enforcement | 0 (0.0%) | 0 (0.0%) |
| Food Preparation & Serving | 9 (12.9%) | 61 (87.1%) |
| Cleaning & Maintenance | 52 (53.6%) | 45 (46.4%) |
| Personal Care & Service | 0 (0.0%) | 0 (0.0%) |
| Total (Category) | 91 (37.1%) | 154 (62.9%) |
| Total (Overall) | 512 (45.4%) | 616 (54.6%) |
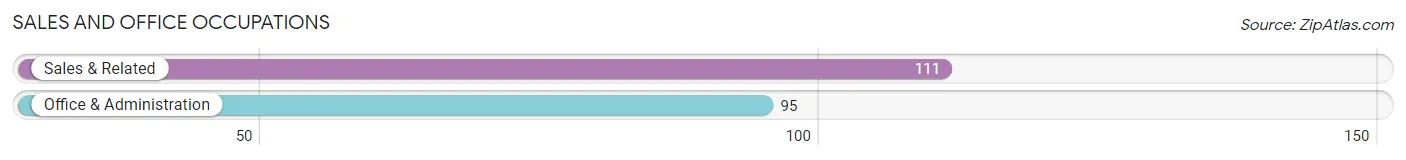
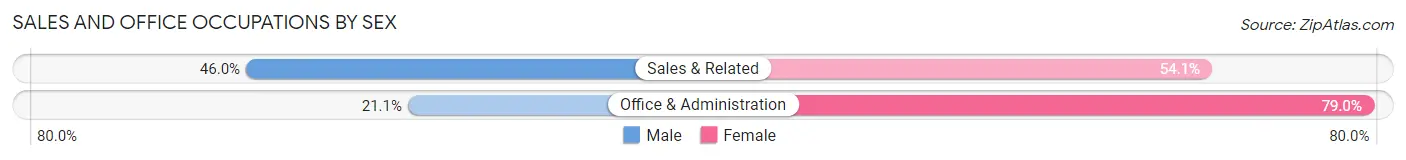
Sales and Office Occupations
The most common Sales and Office occupations in Libby are Sales & Related (111 | 9.8%), and Office & Administration (95 | 8.4%).
Sales and Office Occupations by Sex
| Occupation | Male | Female |
| Sales & Related | 51 (46.0%) | 60 (54.0%) |
| Office & Administration | 20 (21.0%) | 75 (78.9%) |
| Total (Category) | 71 (34.5%) | 135 (65.5%) |
| Total (Overall) | 512 (45.4%) | 616 (54.6%) |
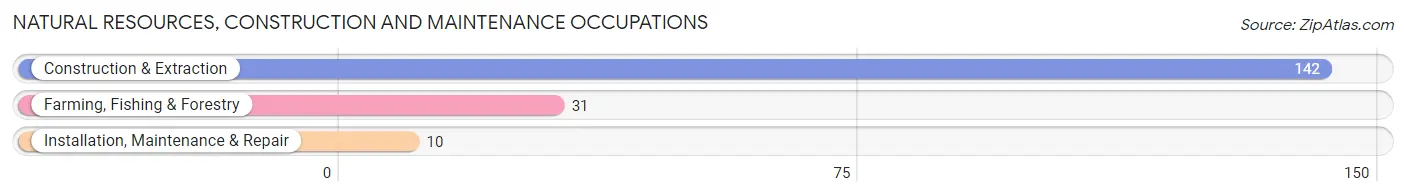
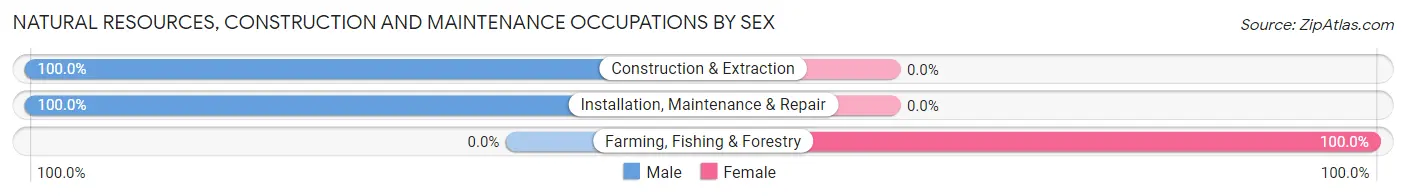
Natural Resources, Construction and Maintenance Occupations
The most common Natural Resources, Construction and Maintenance occupations in Libby are Construction & Extraction (142 | 12.6%), Farming, Fishing & Forestry (31 | 2.8%), and Installation, Maintenance & Repair (10 | 0.9%).
Natural Resources, Construction and Maintenance Occupations by Sex
| Occupation | Male | Female |
| Farming, Fishing & Forestry | 0 (0.0%) | 31 (100.0%) |
| Construction & Extraction | 142 (100.0%) | 0 (0.0%) |
| Installation, Maintenance & Repair | 10 (100.0%) | 0 (0.0%) |
| Total (Category) | 152 (83.1%) | 31 (16.9%) |
| Total (Overall) | 512 (45.4%) | 616 (54.6%) |
Production, Transportation and Moving Occupations
The most common Production, Transportation and Moving occupations in Libby are Transportation (42 | 3.7%), Material Moving (32 | 2.8%), and Production (10 | 0.9%).
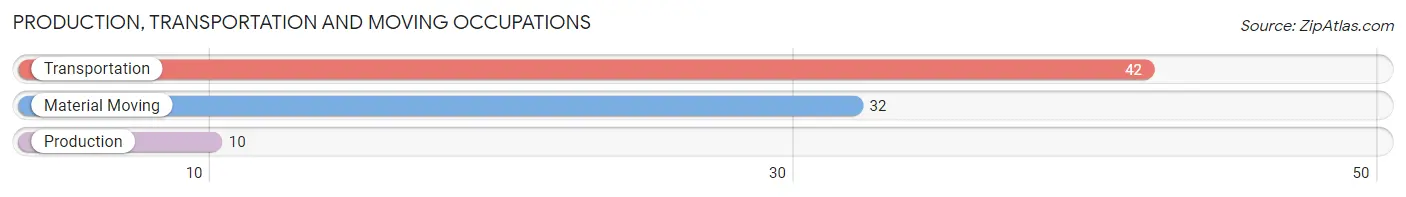
Production, Transportation and Moving Occupations by Sex
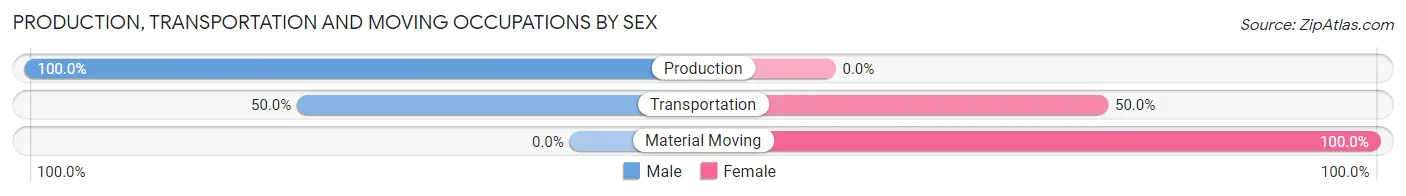
| Occupation | Male | Female |
| Production | 10 (100.0%) | 0 (0.0%) |
| Transportation | 21 (50.0%) | 21 (50.0%) |
| Material Moving | 0 (0.0%) | 32 (100.0%) |
| Total (Category) | 31 (36.9%) | 53 (63.1%) |
| Total (Overall) | 512 (45.4%) | 616 (54.6%) |
Employment Industries by Sex in Libby
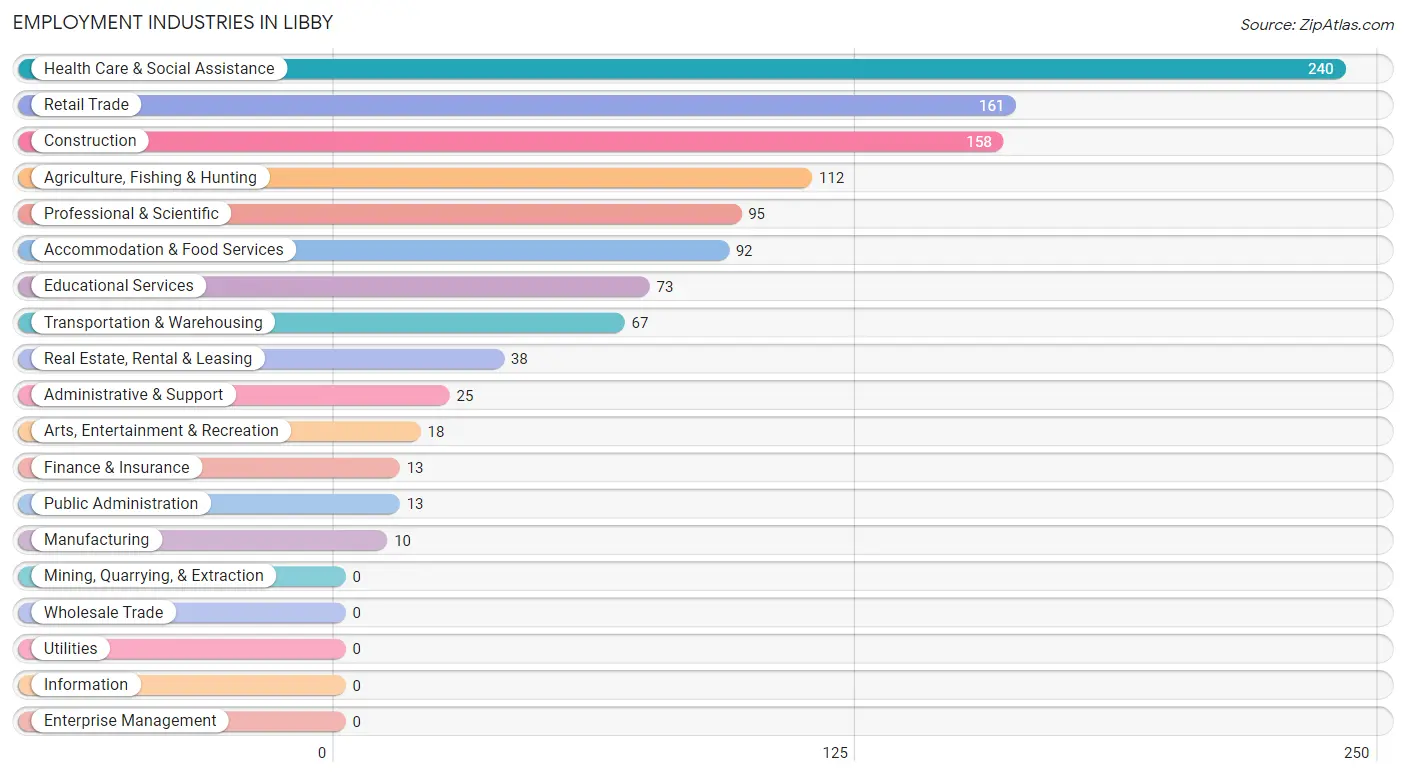
Employment Industries in Libby
The major employment industries in Libby include Health Care & Social Assistance (240 | 21.3%), Retail Trade (161 | 14.3%), Construction (158 | 14.0%), Agriculture, Fishing & Hunting (112 | 9.9%), and Professional & Scientific (95 | 8.4%).
Employment Industries by Sex in Libby
The Libby industries that see more men than women are Manufacturing (100.0%), Administrative & Support (100.0%), and Construction (89.9%), whereas the industries that tend to have a higher number of women are Finance & Insurance (100.0%), Real Estate, Rental & Leasing (100.0%), and Public Administration (100.0%).
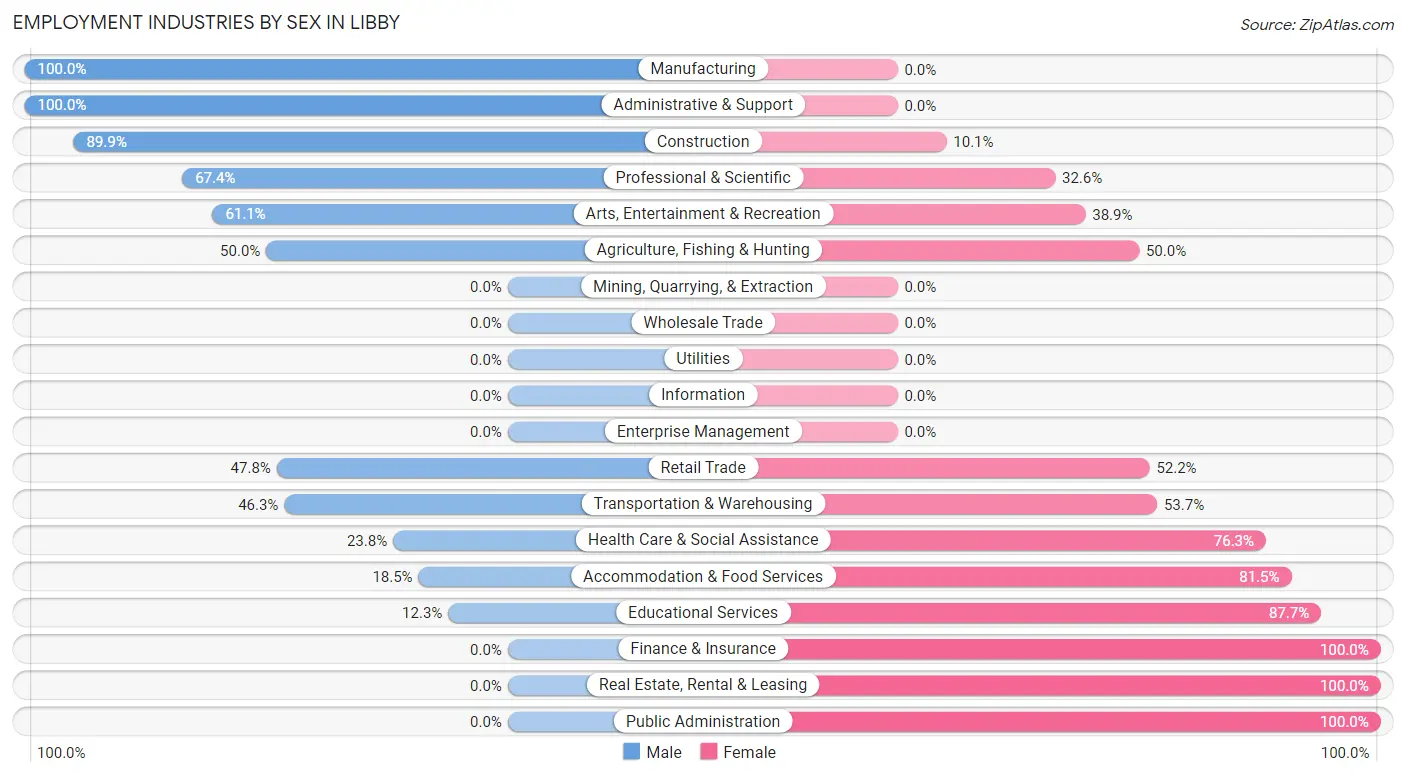
| Industry | Male | Female |
| Agriculture, Fishing & Hunting | 56 (50.0%) | 56 (50.0%) |
| Mining, Quarrying, & Extraction | 0 (0.0%) | 0 (0.0%) |
| Construction | 142 (89.9%) | 16 (10.1%) |
| Manufacturing | 10 (100.0%) | 0 (0.0%) |
| Wholesale Trade | 0 (0.0%) | 0 (0.0%) |
| Retail Trade | 77 (47.8%) | 84 (52.2%) |
| Transportation & Warehousing | 31 (46.3%) | 36 (53.7%) |
| Utilities | 0 (0.0%) | 0 (0.0%) |
| Information | 0 (0.0%) | 0 (0.0%) |
| Finance & Insurance | 0 (0.0%) | 13 (100.0%) |
| Real Estate, Rental & Leasing | 0 (0.0%) | 38 (100.0%) |
| Professional & Scientific | 64 (67.4%) | 31 (32.6%) |
| Enterprise Management | 0 (0.0%) | 0 (0.0%) |
| Administrative & Support | 25 (100.0%) | 0 (0.0%) |
| Educational Services | 9 (12.3%) | 64 (87.7%) |
| Health Care & Social Assistance | 57 (23.7%) | 183 (76.2%) |
| Arts, Entertainment & Recreation | 11 (61.1%) | 7 (38.9%) |
| Accommodation & Food Services | 17 (18.5%) | 75 (81.5%) |
| Public Administration | 0 (0.0%) | 13 (100.0%) |
| Total | 512 (45.4%) | 616 (54.6%) |
Education in Libby
School Enrollment in Libby
The most common levels of schooling among the 589 students in Libby are high school (228 | 38.7%), college / undergraduate (120 | 20.4%), and middle school (84 | 14.3%).
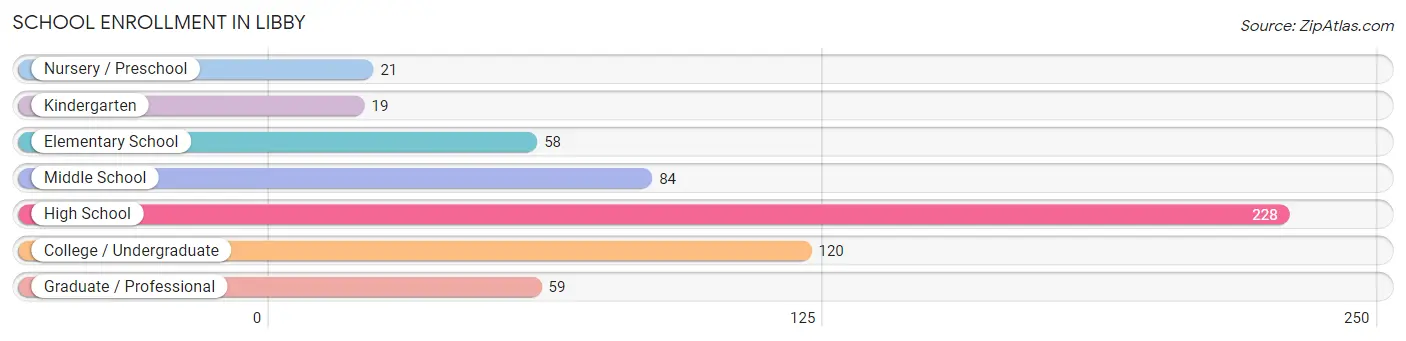
| School Level | # Students | % Students |
| Nursery / Preschool | 21 | 3.6% |
| Kindergarten | 19 | 3.2% |
| Elementary School | 58 | 9.9% |
| Middle School | 84 | 14.3% |
| High School | 228 | 38.7% |
| College / Undergraduate | 120 | 20.4% |
| Graduate / Professional | 59 | 10.0% |
| Total | 589 | 100.0% |
School Enrollment by Age by Funding Source in Libby
Out of a total of 589 students who are enrolled in schools in Libby, 99 (16.8%) attend a private institution, while the remaining 490 (83.2%) are enrolled in public schools. The age group of 20 to 24 year olds has the highest likelihood of being enrolled in private schools, with 42 (100.0% in the age bracket) enrolled. Conversely, the age group of 3 to 4 year olds has the lowest likelihood of being enrolled in a private school, with 21 (100.0% in the age bracket) attending a public institution.
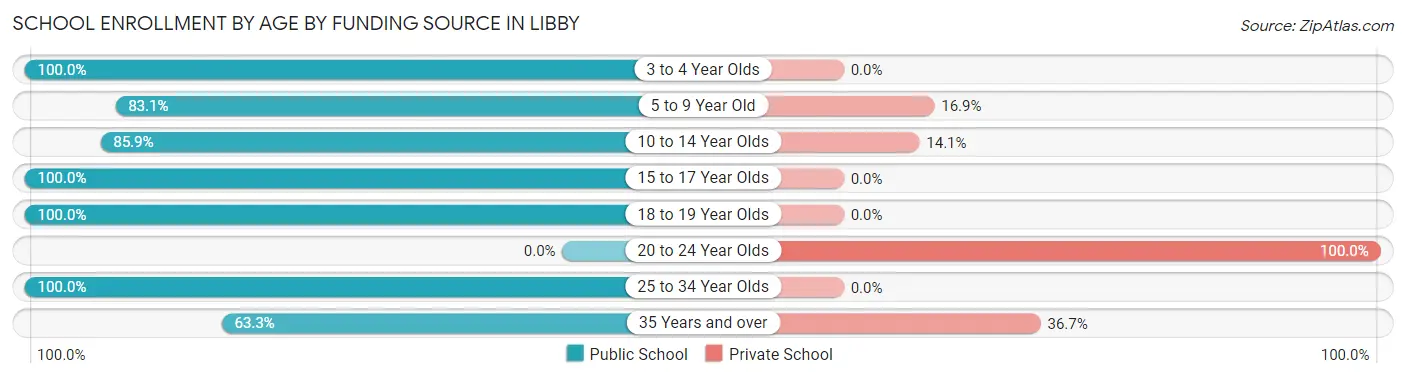
| Age Bracket | Public School | Private School |
| 3 to 4 Year Olds | 21 (100.0%) | 0 (0.0%) |
| 5 to 9 Year Old | 64 (83.1%) | 13 (16.9%) |
| 10 to 14 Year Olds | 67 (85.9%) | 11 (14.1%) |
| 15 to 17 Year Olds | 172 (100.0%) | 0 (0.0%) |
| 18 to 19 Year Olds | 69 (100.0%) | 0 (0.0%) |
| 20 to 24 Year Olds | 0 (0.0%) | 42 (100.0%) |
| 25 to 34 Year Olds | 40 (100.0%) | 0 (0.0%) |
| 35 Years and over | 57 (63.3%) | 33 (36.7%) |
| Total | 490 (83.2%) | 99 (16.8%) |
Educational Attainment by Field of Study in Libby
Business (74 | 19.4%), bio, nature & agricultural (51 | 13.4%), arts & humanities (50 | 13.1%), psychology (46 | 12.1%), and engineering (40 | 10.5%) are the most common fields of study among 381 individuals in Libby who have obtained a bachelor's degree or higher.
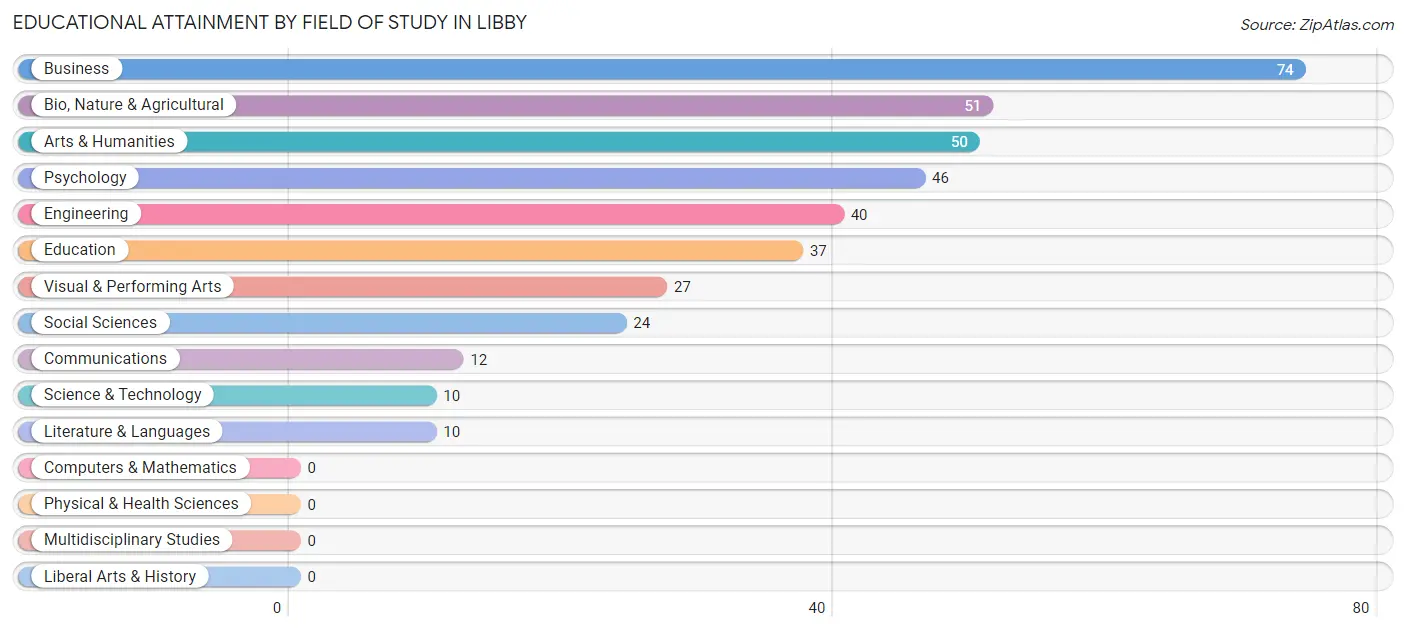
| Field of Study | # Graduates | % Graduates |
| Computers & Mathematics | 0 | 0.0% |
| Bio, Nature & Agricultural | 51 | 13.4% |
| Physical & Health Sciences | 0 | 0.0% |
| Psychology | 46 | 12.1% |
| Social Sciences | 24 | 6.3% |
| Engineering | 40 | 10.5% |
| Multidisciplinary Studies | 0 | 0.0% |
| Science & Technology | 10 | 2.6% |
| Business | 74 | 19.4% |
| Education | 37 | 9.7% |
| Literature & Languages | 10 | 2.6% |
| Liberal Arts & History | 0 | 0.0% |
| Visual & Performing Arts | 27 | 7.1% |
| Communications | 12 | 3.2% |
| Arts & Humanities | 50 | 13.1% |
| Total | 381 | 100.0% |
Transportation & Commute in Libby
Vehicle Availability by Sex in Libby
The most prevalent vehicle ownership categories in Libby are males with 1 vehicle (171, accounting for 34.1%) and females with 1 vehicle (132, making up 27.8%).
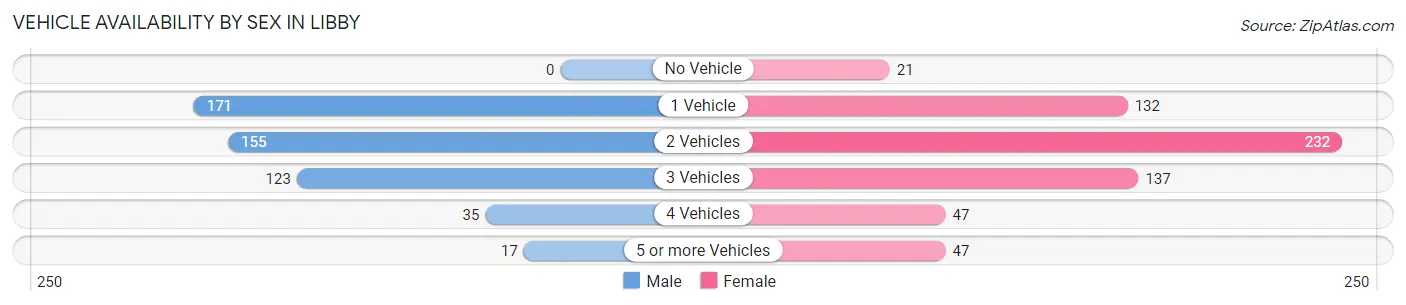
| Vehicles Available | Male | Female |
| No Vehicle | 0 (0.0%) | 21 (3.4%) |
| 1 Vehicle | 171 (34.1%) | 132 (21.4%) |
| 2 Vehicles | 155 (30.9%) | 232 (37.7%) |
| 3 Vehicles | 123 (24.5%) | 137 (22.2%) |
| 4 Vehicles | 35 (7.0%) | 47 (7.6%) |
| 5 or more Vehicles | 17 (3.4%) | 47 (7.6%) |
| Total | 501 (100.0%) | 616 (100.0%) |
Commute Time in Libby
The most frequently occuring commute durations in Libby are 5 to 9 minutes (421 commuters, 39.1%), less than 5 minutes (212 commuters, 19.7%), and 10 to 14 minutes (164 commuters, 15.2%).
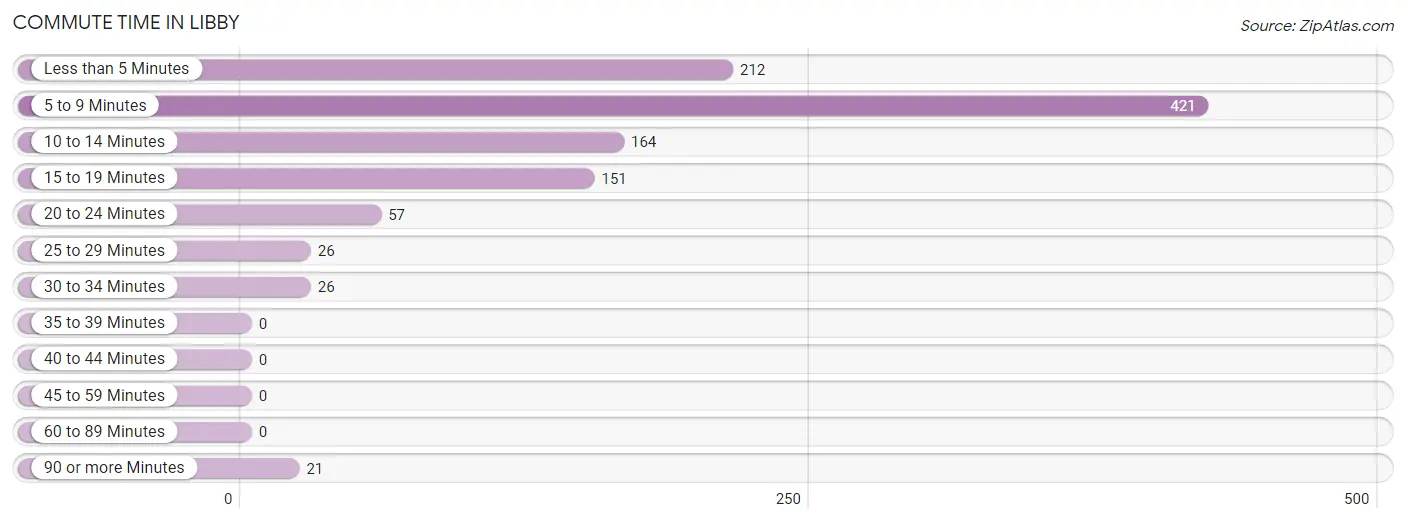
| Commute Time | # Commuters | % Commuters |
| Less than 5 Minutes | 212 | 19.7% |
| 5 to 9 Minutes | 421 | 39.1% |
| 10 to 14 Minutes | 164 | 15.2% |
| 15 to 19 Minutes | 151 | 14.0% |
| 20 to 24 Minutes | 57 | 5.3% |
| 25 to 29 Minutes | 26 | 2.4% |
| 30 to 34 Minutes | 26 | 2.4% |
| 35 to 39 Minutes | 0 | 0.0% |
| 40 to 44 Minutes | 0 | 0.0% |
| 45 to 59 Minutes | 0 | 0.0% |
| 60 to 89 Minutes | 0 | 0.0% |
| 90 or more Minutes | 21 | 1.9% |
Commute Time by Sex in Libby
The most common commute times in Libby are 5 to 9 minutes (177 commuters, 36.9%) for males and 5 to 9 minutes (244 commuters, 40.7%) for females.
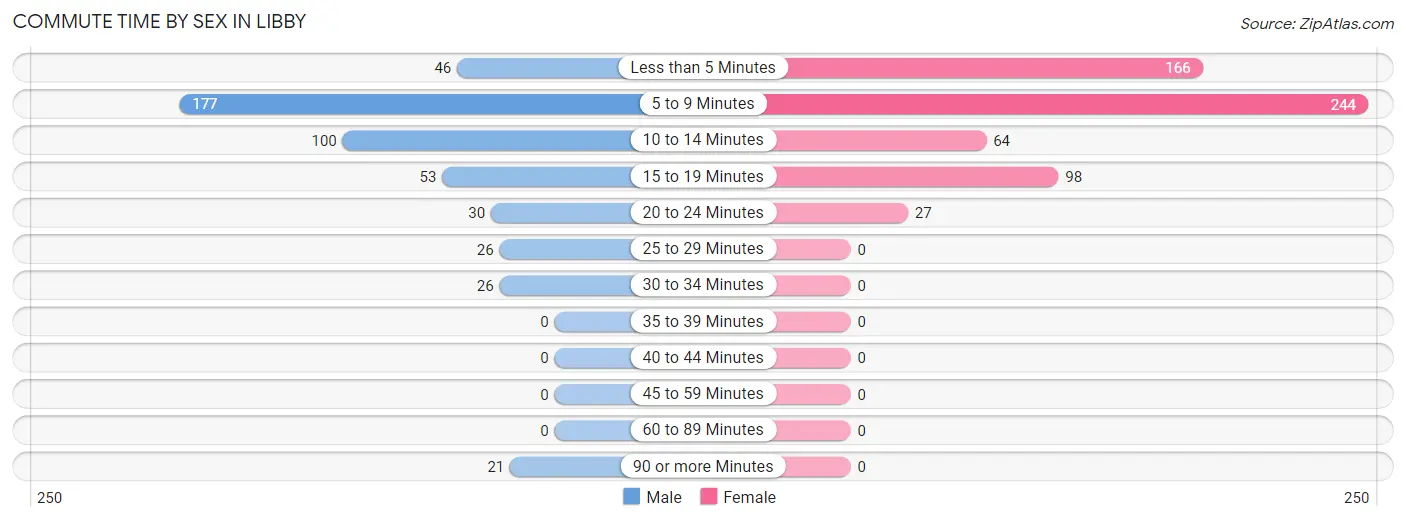
| Commute Time | Male | Female |
| Less than 5 Minutes | 46 (9.6%) | 166 (27.7%) |
| 5 to 9 Minutes | 177 (36.9%) | 244 (40.7%) |
| 10 to 14 Minutes | 100 (20.9%) | 64 (10.7%) |
| 15 to 19 Minutes | 53 (11.1%) | 98 (16.4%) |
| 20 to 24 Minutes | 30 (6.3%) | 27 (4.5%) |
| 25 to 29 Minutes | 26 (5.4%) | 0 (0.0%) |
| 30 to 34 Minutes | 26 (5.4%) | 0 (0.0%) |
| 35 to 39 Minutes | 0 (0.0%) | 0 (0.0%) |
| 40 to 44 Minutes | 0 (0.0%) | 0 (0.0%) |
| 45 to 59 Minutes | 0 (0.0%) | 0 (0.0%) |
| 60 to 89 Minutes | 0 (0.0%) | 0 (0.0%) |
| 90 or more Minutes | 21 (4.4%) | 0 (0.0%) |
Time of Departure to Work by Sex in Libby
The most frequent times of departure to work in Libby are 6:30 AM to 6:59 AM (97, 20.3%) for males and 7:30 AM to 7:59 AM (133, 22.2%) for females.
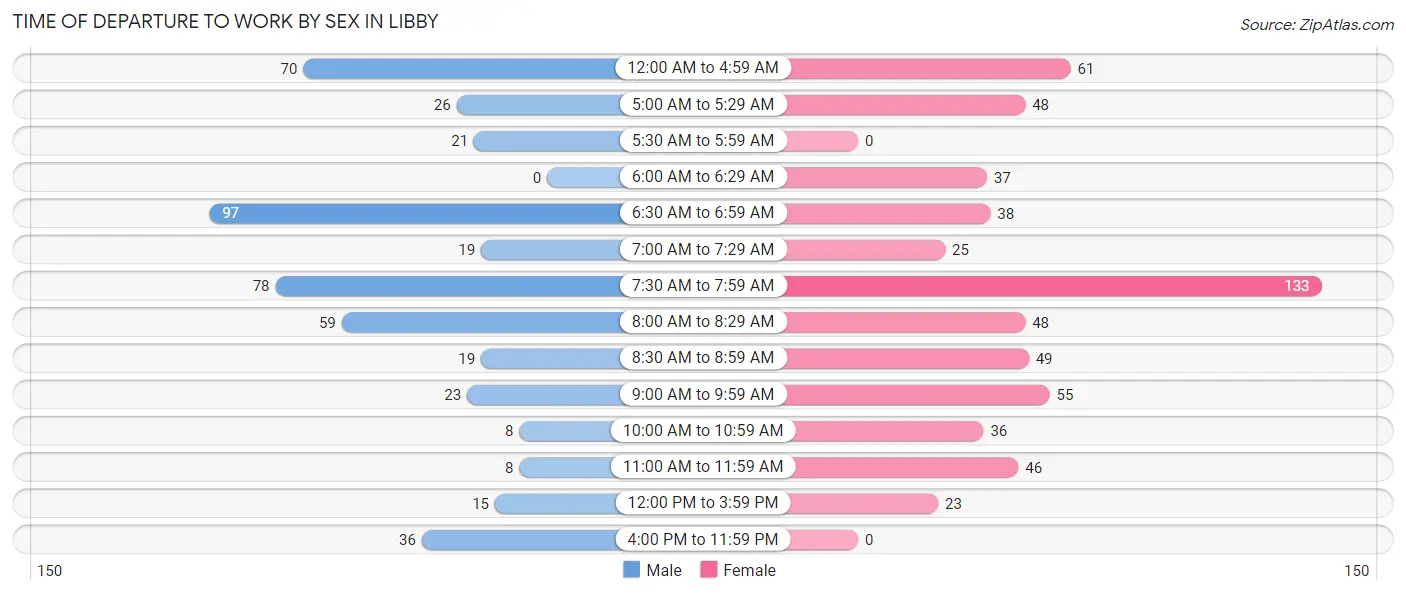
| Time of Departure | Male | Female |
| 12:00 AM to 4:59 AM | 70 (14.6%) | 61 (10.2%) |
| 5:00 AM to 5:29 AM | 26 (5.4%) | 48 (8.0%) |
| 5:30 AM to 5:59 AM | 21 (4.4%) | 0 (0.0%) |
| 6:00 AM to 6:29 AM | 0 (0.0%) | 37 (6.2%) |
| 6:30 AM to 6:59 AM | 97 (20.3%) | 38 (6.3%) |
| 7:00 AM to 7:29 AM | 19 (4.0%) | 25 (4.2%) |
| 7:30 AM to 7:59 AM | 78 (16.3%) | 133 (22.2%) |
| 8:00 AM to 8:29 AM | 59 (12.3%) | 48 (8.0%) |
| 8:30 AM to 8:59 AM | 19 (4.0%) | 49 (8.2%) |
| 9:00 AM to 9:59 AM | 23 (4.8%) | 55 (9.2%) |
| 10:00 AM to 10:59 AM | 8 (1.7%) | 36 (6.0%) |
| 11:00 AM to 11:59 AM | 8 (1.7%) | 46 (7.7%) |
| 12:00 PM to 3:59 PM | 15 (3.1%) | 23 (3.8%) |
| 4:00 PM to 11:59 PM | 36 (7.5%) | 0 (0.0%) |
| Total | 479 (100.0%) | 599 (100.0%) |
Housing Occupancy in Libby
Occupancy by Ownership in Libby
Of the total 1,480 dwellings in Libby, owner-occupied units account for 887 (59.9%), while renter-occupied units make up 593 (40.1%).
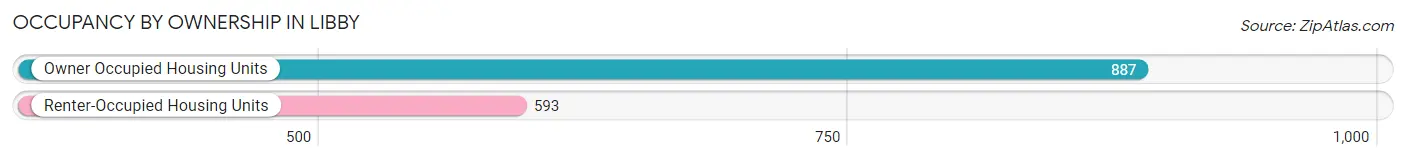
| Occupancy | # Housing Units | % Housing Units |
| Owner Occupied Housing Units | 887 | 59.9% |
| Renter-Occupied Housing Units | 593 | 40.1% |
| Total Occupied Housing Units | 1,480 | 100.0% |
Occupancy by Household Size in Libby
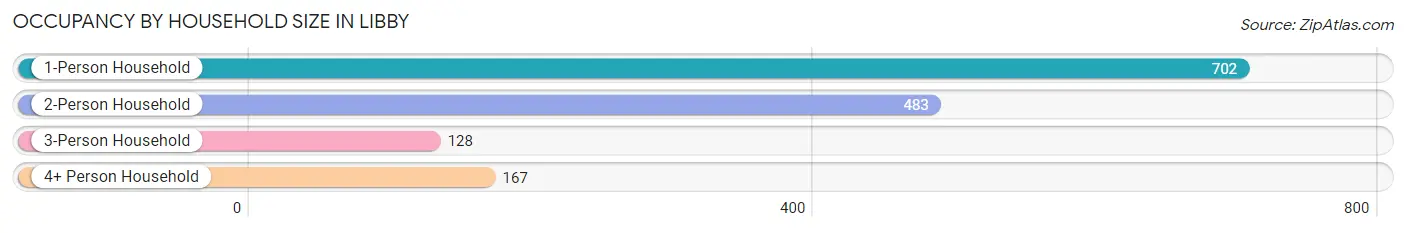
| Household Size | # Housing Units | % Housing Units |
| 1-Person Household | 702 | 47.4% |
| 2-Person Household | 483 | 32.6% |
| 3-Person Household | 128 | 8.6% |
| 4+ Person Household | 167 | 11.3% |
| Total Housing Units | 1,480 | 100.0% |
Occupancy by Ownership by Household Size in Libby
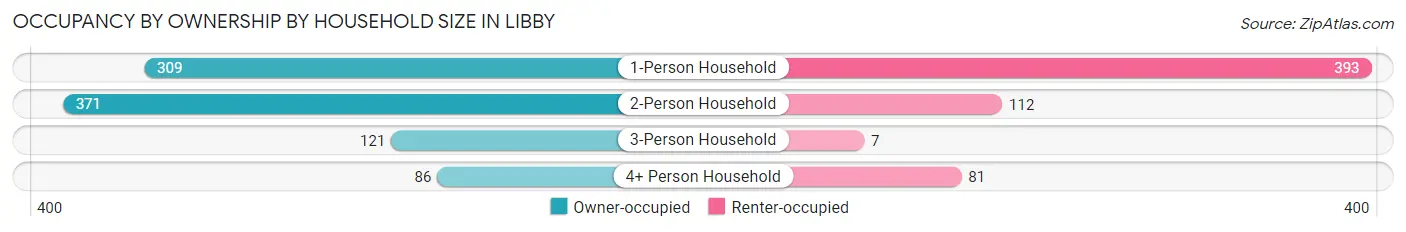
| Household Size | Owner-occupied | Renter-occupied |
| 1-Person Household | 309 (44.0%) | 393 (56.0%) |
| 2-Person Household | 371 (76.8%) | 112 (23.2%) |
| 3-Person Household | 121 (94.5%) | 7 (5.5%) |
| 4+ Person Household | 86 (51.5%) | 81 (48.5%) |
| Total Housing Units | 887 (59.9%) | 593 (40.1%) |
Occupancy by Educational Attainment in Libby
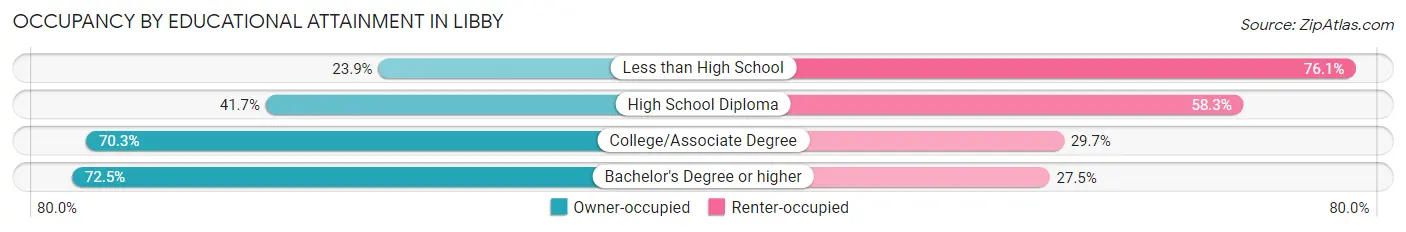
| Household Size | Owner-occupied | Renter-occupied |
| Less than High School | 16 (23.9%) | 51 (76.1%) |
| High School Diploma | 187 (41.7%) | 261 (58.3%) |
| College/Associate Degree | 489 (70.3%) | 207 (29.7%) |
| Bachelor's Degree or higher | 195 (72.5%) | 74 (27.5%) |
Occupancy by Age of Householder in Libby
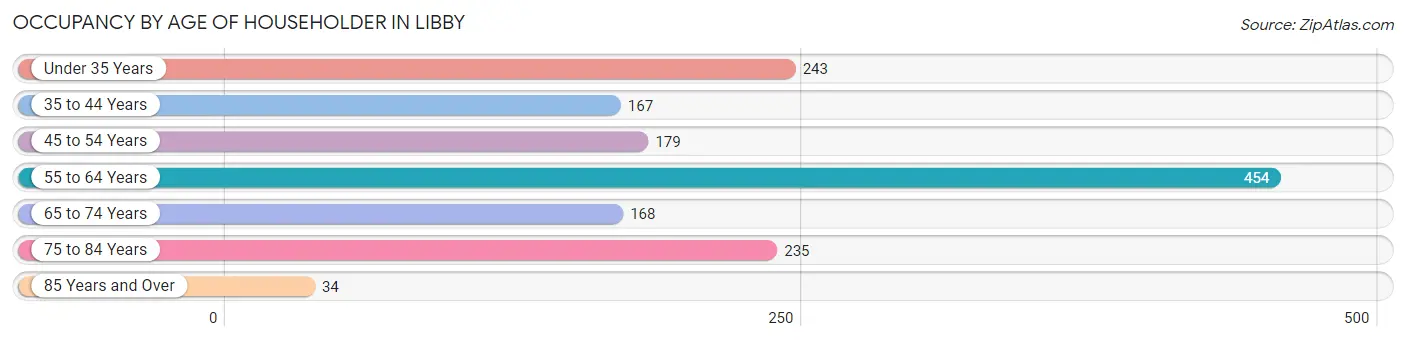
| Age Bracket | # Households | % Households |
| Under 35 Years | 243 | 16.4% |
| 35 to 44 Years | 167 | 11.3% |
| 45 to 54 Years | 179 | 12.1% |
| 55 to 64 Years | 454 | 30.7% |
| 65 to 74 Years | 168 | 11.4% |
| 75 to 84 Years | 235 | 15.9% |
| 85 Years and Over | 34 | 2.3% |
| Total | 1,480 | 100.0% |
Housing Finances in Libby
Median Income by Occupancy in Libby
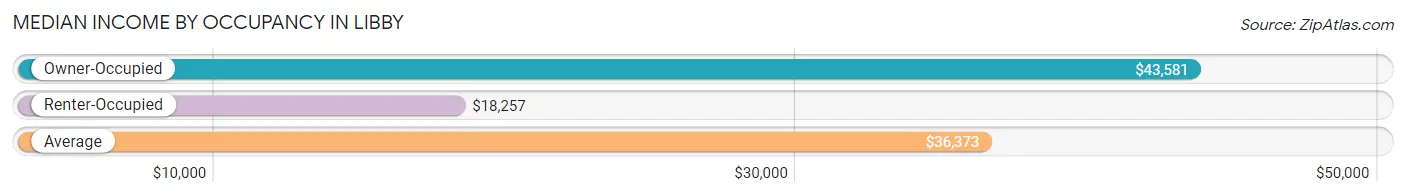
| Occupancy Type | # Households | Median Income |
| Owner-Occupied | 887 (59.9%) | $43,581 |
| Renter-Occupied | 593 (40.1%) | $18,257 |
| Average | 1,480 (100.0%) | $36,373 |
Occupancy by Householder Income Bracket in Libby
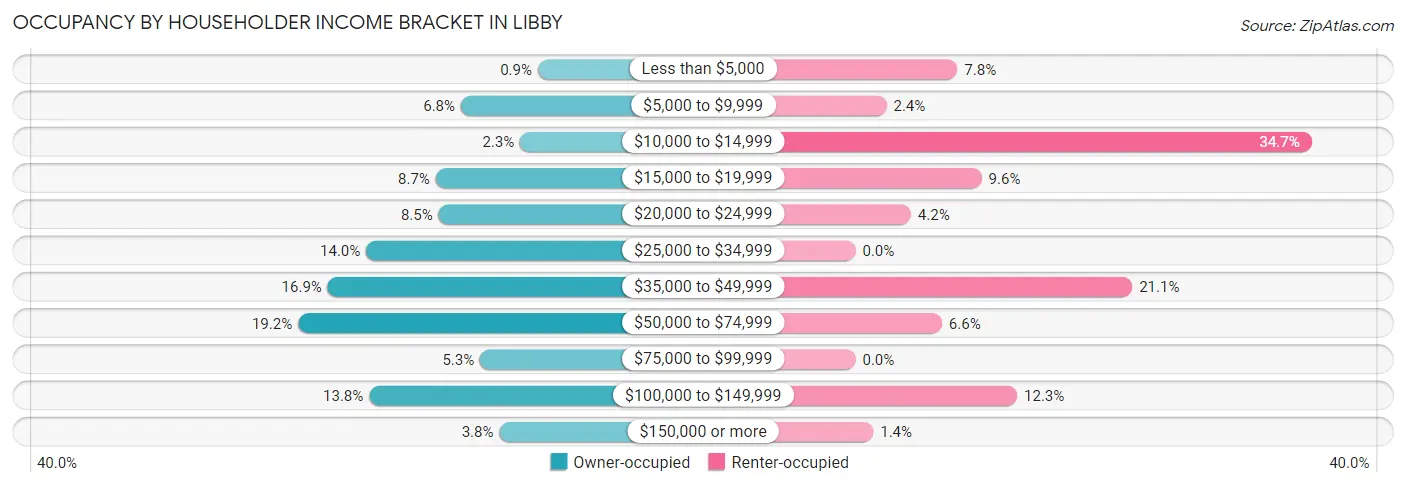
| Income Bracket | Owner-occupied | Renter-occupied |
| Less than $5,000 | 8 (0.9%) | 46 (7.8%) |
| $5,000 to $9,999 | 60 (6.8%) | 14 (2.4%) |
| $10,000 to $14,999 | 20 (2.2%) | 206 (34.7%) |
| $15,000 to $19,999 | 77 (8.7%) | 57 (9.6%) |
| $20,000 to $24,999 | 75 (8.5%) | 25 (4.2%) |
| $25,000 to $34,999 | 124 (14.0%) | 0 (0.0%) |
| $35,000 to $49,999 | 150 (16.9%) | 125 (21.1%) |
| $50,000 to $74,999 | 170 (19.2%) | 39 (6.6%) |
| $75,000 to $99,999 | 47 (5.3%) | 0 (0.0%) |
| $100,000 to $149,999 | 122 (13.8%) | 73 (12.3%) |
| $150,000 or more | 34 (3.8%) | 8 (1.3%) |
| Total | 887 (100.0%) | 593 (100.0%) |
Monthly Housing Cost Tiers in Libby
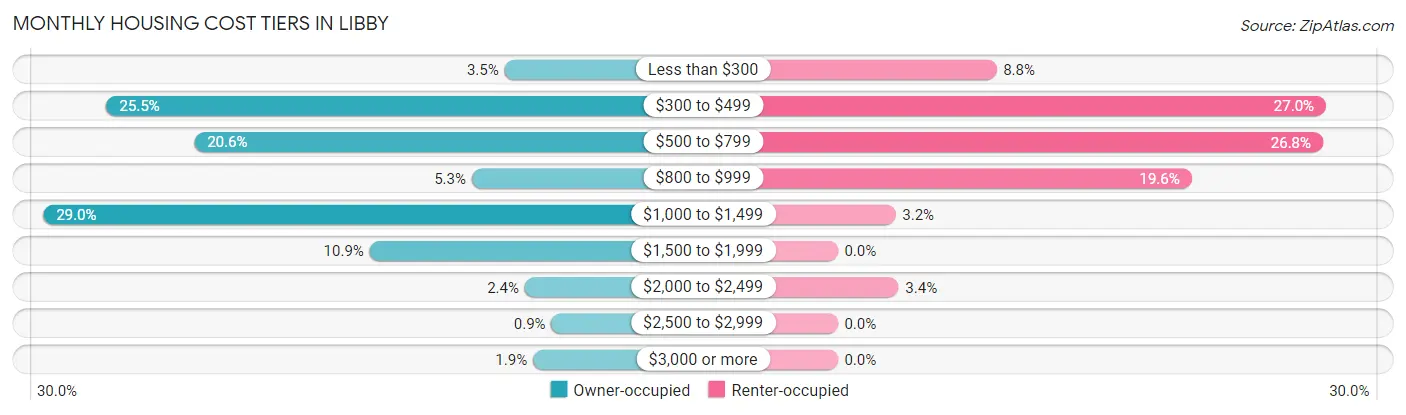
| Monthly Cost | Owner-occupied | Renter-occupied |
| Less than $300 | 31 (3.5%) | 52 (8.8%) |
| $300 to $499 | 226 (25.5%) | 160 (27.0%) |
| $500 to $799 | 183 (20.6%) | 159 (26.8%) |
| $800 to $999 | 47 (5.3%) | 116 (19.6%) |
| $1,000 to $1,499 | 257 (29.0%) | 19 (3.2%) |
| $1,500 to $1,999 | 97 (10.9%) | 0 (0.0%) |
| $2,000 to $2,499 | 21 (2.4%) | 20 (3.4%) |
| $2,500 to $2,999 | 8 (0.9%) | 0 (0.0%) |
| $3,000 or more | 17 (1.9%) | 0 (0.0%) |
| Total | 887 (100.0%) | 593 (100.0%) |
Physical Housing Characteristics in Libby
Housing Structures in Libby
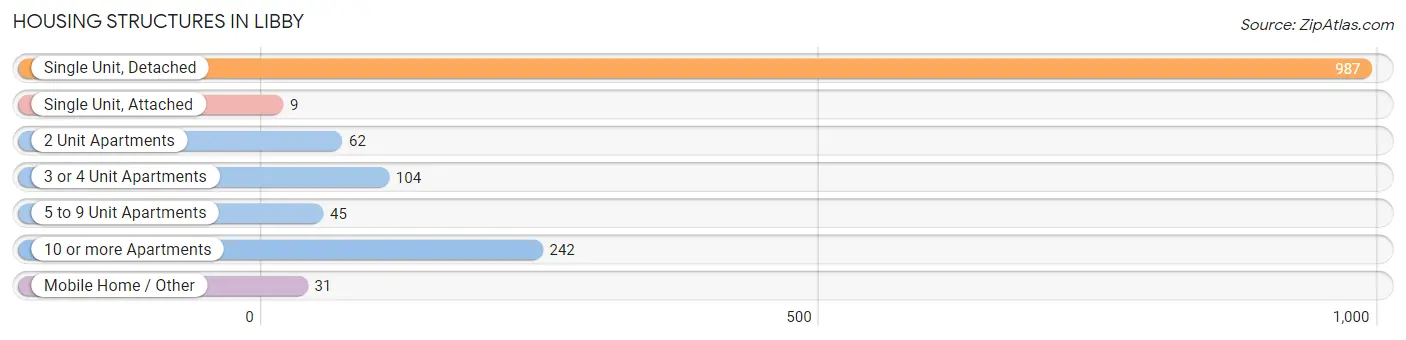
| Structure Type | # Housing Units | % Housing Units |
| Single Unit, Detached | 987 | 66.7% |
| Single Unit, Attached | 9 | 0.6% |
| 2 Unit Apartments | 62 | 4.2% |
| 3 or 4 Unit Apartments | 104 | 7.0% |
| 5 to 9 Unit Apartments | 45 | 3.0% |
| 10 or more Apartments | 242 | 16.4% |
| Mobile Home / Other | 31 | 2.1% |
| Total | 1,480 | 100.0% |
Housing Structures by Occupancy in Libby
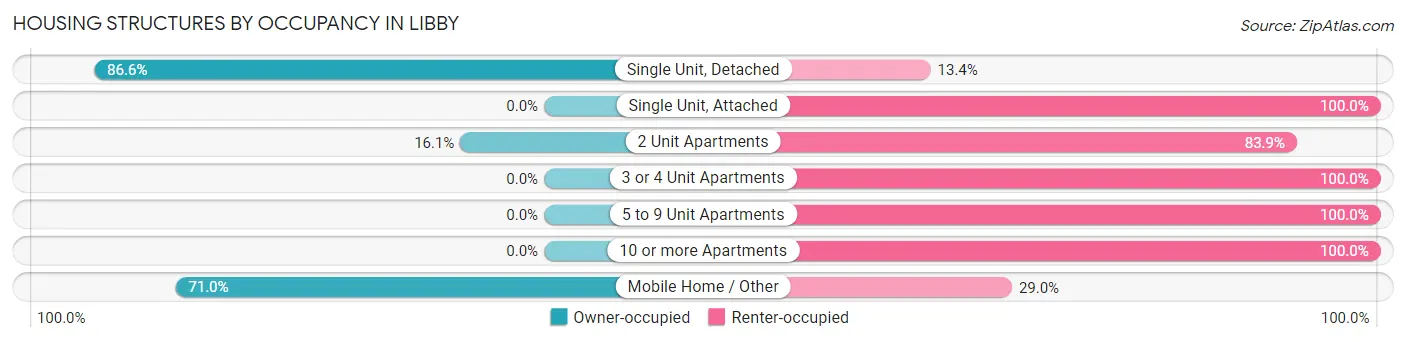
| Structure Type | Owner-occupied | Renter-occupied |
| Single Unit, Detached | 855 (86.6%) | 132 (13.4%) |
| Single Unit, Attached | 0 (0.0%) | 9 (100.0%) |
| 2 Unit Apartments | 10 (16.1%) | 52 (83.9%) |
| 3 or 4 Unit Apartments | 0 (0.0%) | 104 (100.0%) |
| 5 to 9 Unit Apartments | 0 (0.0%) | 45 (100.0%) |
| 10 or more Apartments | 0 (0.0%) | 242 (100.0%) |
| Mobile Home / Other | 22 (71.0%) | 9 (29.0%) |
| Total | 887 (59.9%) | 593 (40.1%) |
Housing Structures by Number of Rooms in Libby
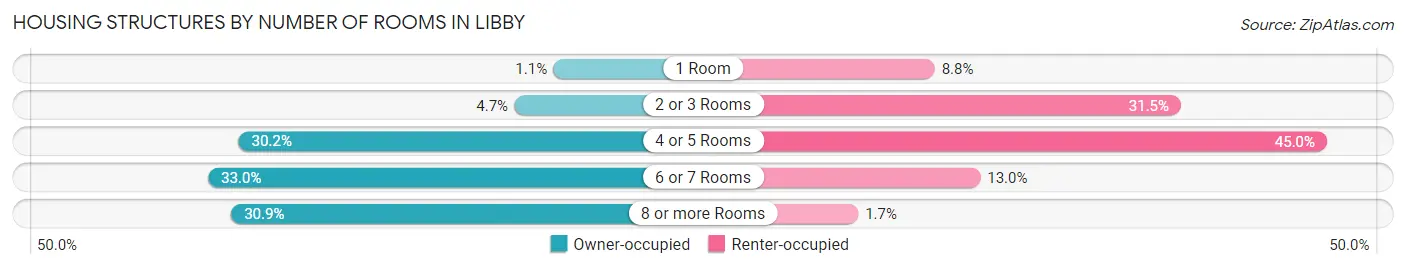
| Number of Rooms | Owner-occupied | Renter-occupied |
| 1 Room | 10 (1.1%) | 52 (8.8%) |
| 2 or 3 Rooms | 42 (4.7%) | 187 (31.5%) |
| 4 or 5 Rooms | 268 (30.2%) | 267 (45.0%) |
| 6 or 7 Rooms | 293 (33.0%) | 77 (13.0%) |
| 8 or more Rooms | 274 (30.9%) | 10 (1.7%) |
| Total | 887 (100.0%) | 593 (100.0%) |
Housing Structure by Heating Type in Libby
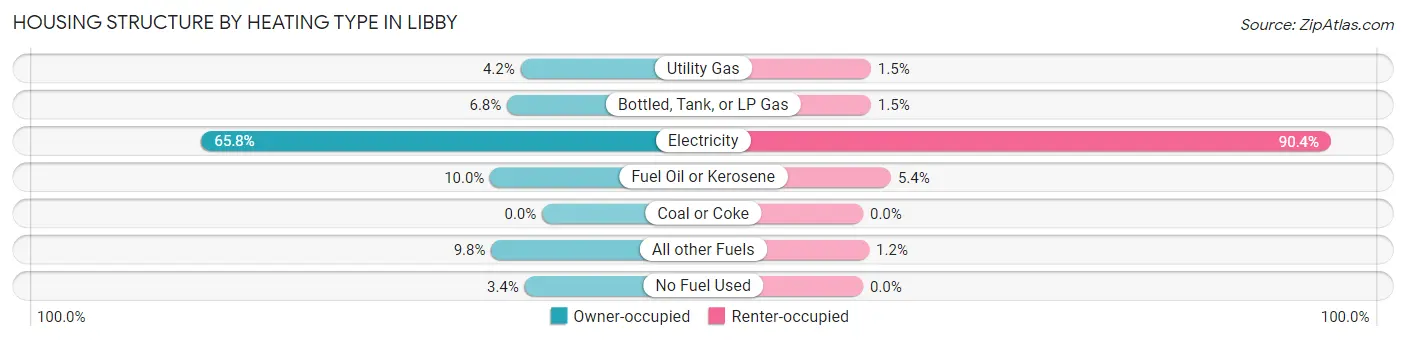
| Heating Type | Owner-occupied | Renter-occupied |
| Utility Gas | 37 (4.2%) | 9 (1.5%) |
| Bottled, Tank, or LP Gas | 60 (6.8%) | 9 (1.5%) |
| Electricity | 584 (65.8%) | 536 (90.4%) |
| Fuel Oil or Kerosene | 89 (10.0%) | 32 (5.4%) |
| Coal or Coke | 0 (0.0%) | 0 (0.0%) |
| All other Fuels | 87 (9.8%) | 7 (1.2%) |
| No Fuel Used | 30 (3.4%) | 0 (0.0%) |
| Total | 887 (100.0%) | 593 (100.0%) |
Household Vehicle Usage in Libby
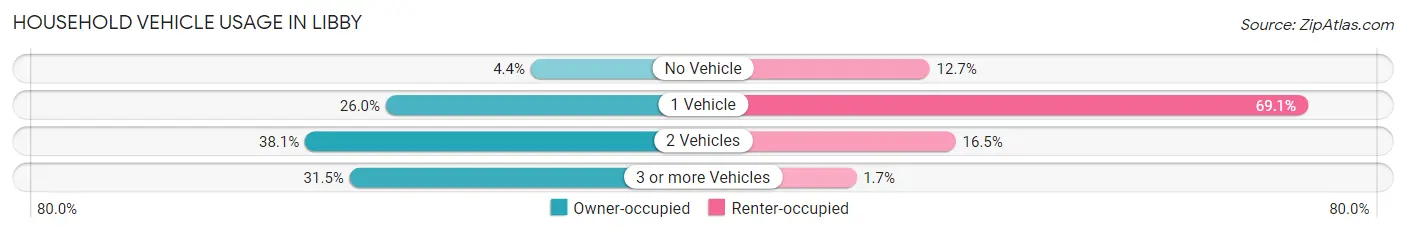
| Vehicles per Household | Owner-occupied | Renter-occupied |
| No Vehicle | 39 (4.4%) | 75 (12.7%) |
| 1 Vehicle | 231 (26.0%) | 410 (69.1%) |
| 2 Vehicles | 338 (38.1%) | 98 (16.5%) |
| 3 or more Vehicles | 279 (31.5%) | 10 (1.7%) |
| Total | 887 (100.0%) | 593 (100.0%) |
Real Estate & Mortgages in Libby
Real Estate and Mortgage Overview in Libby
| Characteristic | Without Mortgage | With Mortgage |
| Housing Units | 388 | 499 |
| Median Property Value | $168,500 | $200,300 |
| Median Household Income | $40,938 | $34 |
| Monthly Housing Costs | $444 | $17 |
| Real Estate Taxes | $1,171 | $0 |
Property Value by Mortgage Status in Libby
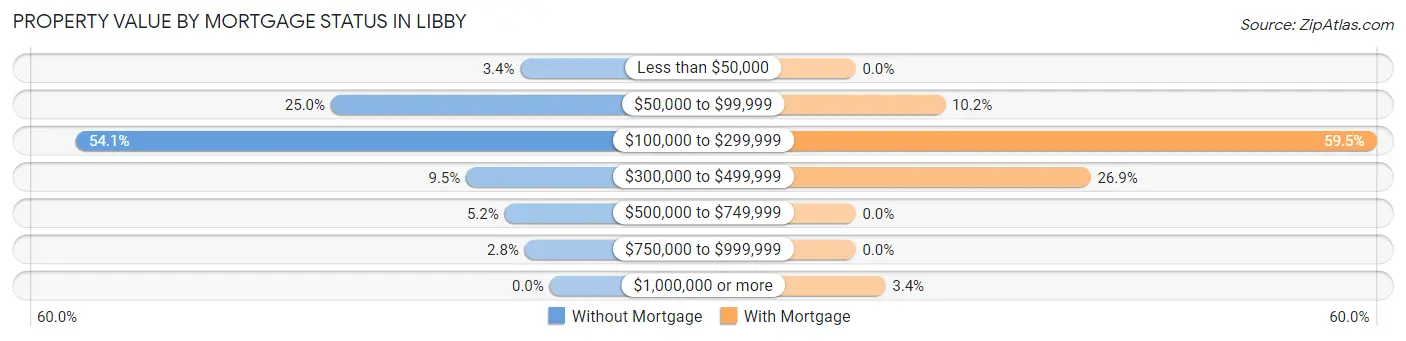
| Property Value | Without Mortgage | With Mortgage |
| Less than $50,000 | 13 (3.4%) | 0 (0.0%) |
| $50,000 to $99,999 | 97 (25.0%) | 51 (10.2%) |
| $100,000 to $299,999 | 210 (54.1%) | 297 (59.5%) |
| $300,000 to $499,999 | 37 (9.5%) | 134 (26.9%) |
| $500,000 to $749,999 | 20 (5.1%) | 0 (0.0%) |
| $750,000 to $999,999 | 11 (2.8%) | 0 (0.0%) |
| $1,000,000 or more | 0 (0.0%) | 17 (3.4%) |
| Total | 388 (100.0%) | 499 (100.0%) |
Household Income by Mortgage Status in Libby
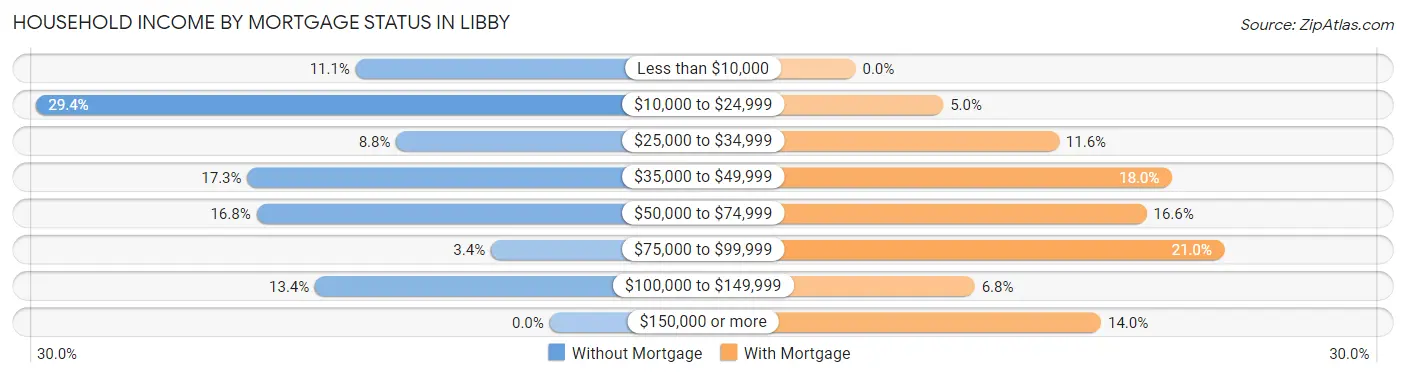
| Household Income | Without Mortgage | With Mortgage |
| Less than $10,000 | 43 (11.1%) | 0 (0.0%) |
| $10,000 to $24,999 | 114 (29.4%) | 25 (5.0%) |
| $25,000 to $34,999 | 34 (8.8%) | 58 (11.6%) |
| $35,000 to $49,999 | 67 (17.3%) | 90 (18.0%) |
| $50,000 to $74,999 | 65 (16.8%) | 83 (16.6%) |
| $75,000 to $99,999 | 13 (3.4%) | 105 (21.0%) |
| $100,000 to $149,999 | 52 (13.4%) | 34 (6.8%) |
| $150,000 or more | 0 (0.0%) | 70 (14.0%) |
| Total | 388 (100.0%) | 499 (100.0%) |
Property Value to Household Income Ratio in Libby
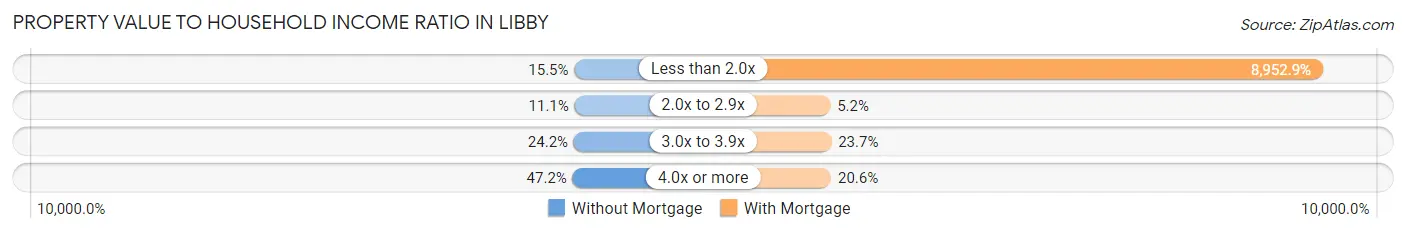
| Value-to-Income Ratio | Without Mortgage | With Mortgage |
| Less than 2.0x | 60 (15.5%) | 44,675 (8,952.9%) |
| 2.0x to 2.9x | 43 (11.1%) | 26 (5.2%) |
| 3.0x to 3.9x | 94 (24.2%) | 118 (23.6%) |
| 4.0x or more | 183 (47.2%) | 103 (20.6%) |
| Total | 388 (100.0%) | 499 (100.0%) |
Real Estate Taxes by Mortgage Status in Libby
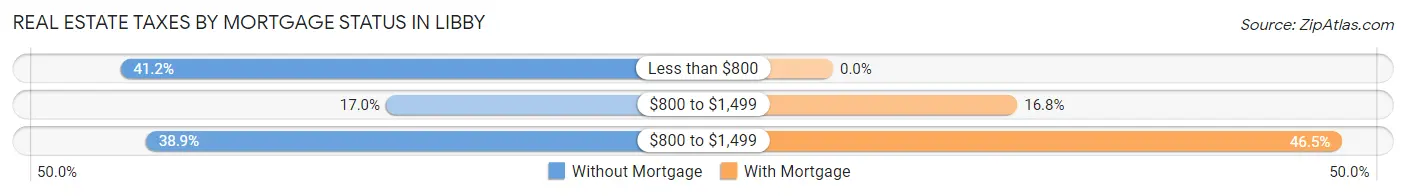
| Property Taxes | Without Mortgage | With Mortgage |
| Less than $800 | 160 (41.2%) | 0 (0.0%) |
| $800 to $1,499 | 66 (17.0%) | 84 (16.8%) |
| $800 to $1,499 | 151 (38.9%) | 232 (46.5%) |
| Total | 388 (100.0%) | 499 (100.0%) |
Health & Disability in Libby
Health Insurance Coverage by Age in Libby
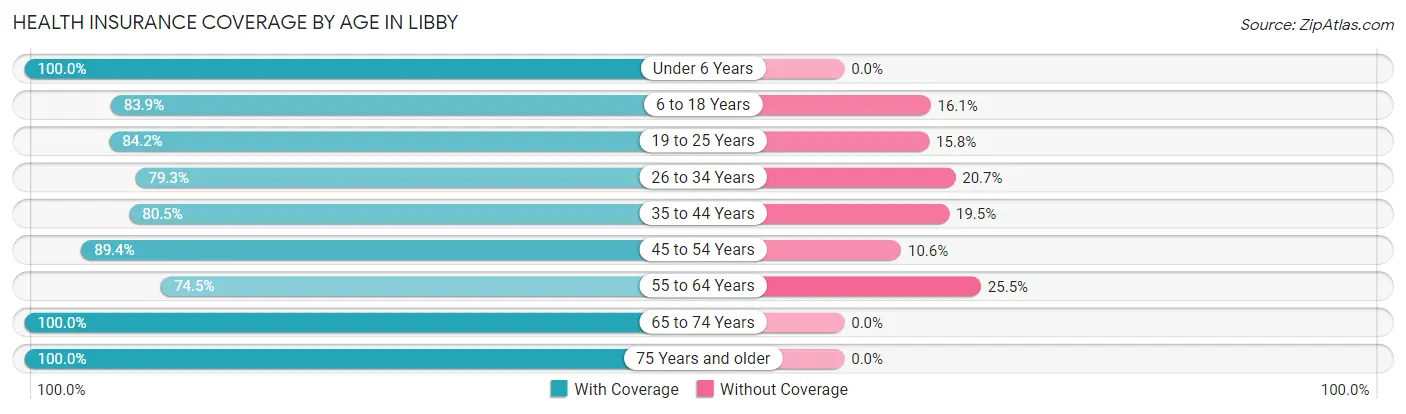
| Age Bracket | With Coverage | Without Coverage |
| Under 6 Years | 133 (100.0%) | 0 (0.0%) |
| 6 to 18 Years | 360 (83.9%) | 69 (16.1%) |
| 19 to 25 Years | 133 (84.2%) | 25 (15.8%) |
| 26 to 34 Years | 203 (79.3%) | 53 (20.7%) |
| 35 to 44 Years | 210 (80.5%) | 51 (19.5%) |
| 45 to 54 Years | 279 (89.4%) | 33 (10.6%) |
| 55 to 64 Years | 386 (74.5%) | 132 (25.5%) |
| 65 to 74 Years | 292 (100.0%) | 0 (0.0%) |
| 75 Years and older | 368 (100.0%) | 0 (0.0%) |
| Total | 2,364 (86.7%) | 363 (13.3%) |
Health Insurance Coverage by Citizenship Status in Libby
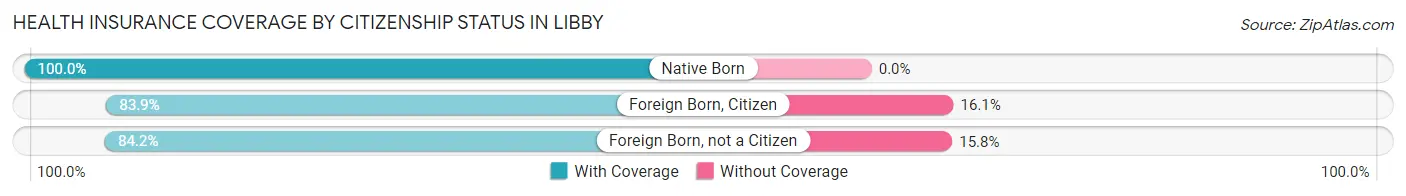
| Citizenship Status | With Coverage | Without Coverage |
| Native Born | 133 (100.0%) | 0 (0.0%) |
| Foreign Born, Citizen | 360 (83.9%) | 69 (16.1%) |
| Foreign Born, not a Citizen | 133 (84.2%) | 25 (15.8%) |
Health Insurance Coverage by Household Income in Libby
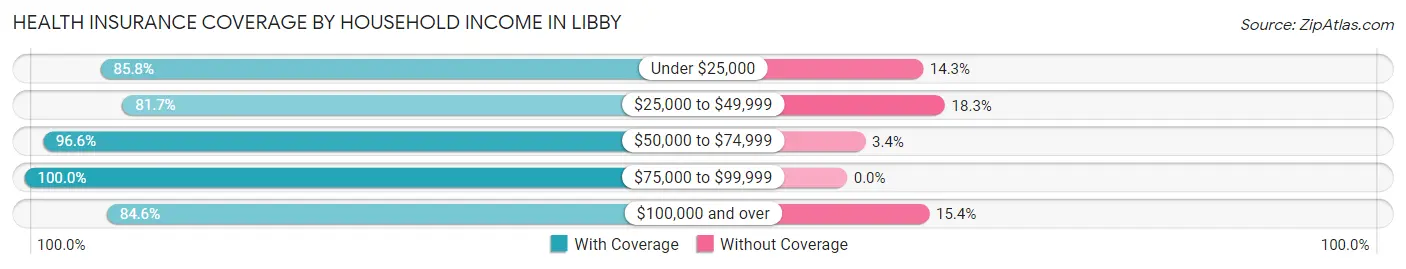
| Household Income | With Coverage | Without Coverage |
| Under $25,000 | 782 (85.8%) | 130 (14.2%) |
| $25,000 to $49,999 | 548 (81.7%) | 123 (18.3%) |
| $50,000 to $74,999 | 338 (96.6%) | 12 (3.4%) |
| $75,000 to $99,999 | 131 (100.0%) | 0 (0.0%) |
| $100,000 and over | 538 (84.6%) | 98 (15.4%) |
Public vs Private Health Insurance Coverage by Age in Libby
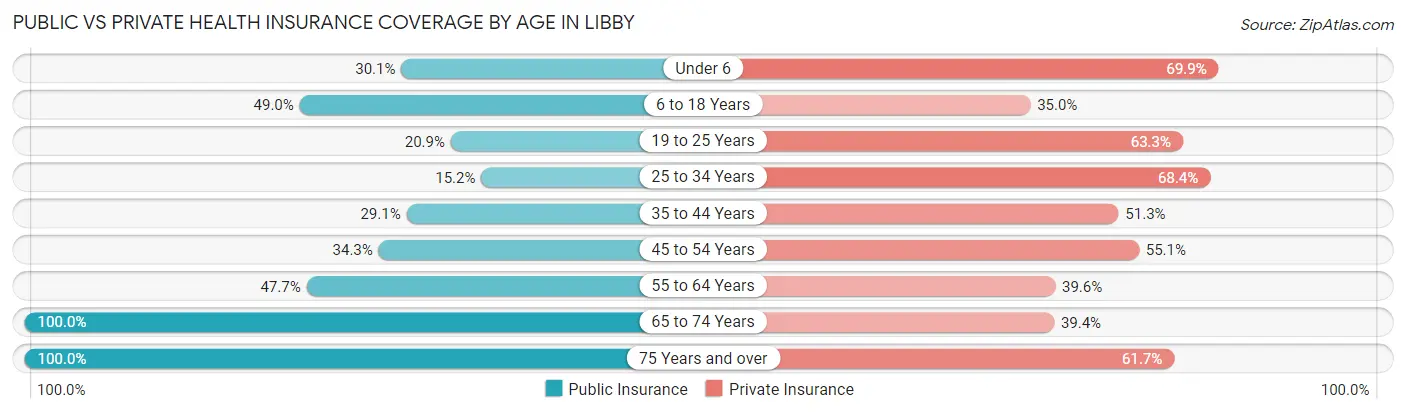
| Age Bracket | Public Insurance | Private Insurance |
| Under 6 | 40 (30.1%) | 93 (69.9%) |
| 6 to 18 Years | 210 (48.9%) | 150 (35.0%) |
| 19 to 25 Years | 33 (20.9%) | 100 (63.3%) |
| 25 to 34 Years | 39 (15.2%) | 175 (68.4%) |
| 35 to 44 Years | 76 (29.1%) | 134 (51.3%) |
| 45 to 54 Years | 107 (34.3%) | 172 (55.1%) |
| 55 to 64 Years | 247 (47.7%) | 205 (39.6%) |
| 65 to 74 Years | 292 (100.0%) | 115 (39.4%) |
| 75 Years and over | 368 (100.0%) | 227 (61.7%) |
| Total | 1,412 (51.8%) | 1,371 (50.3%) |
Disability Status by Sex by Age in Libby
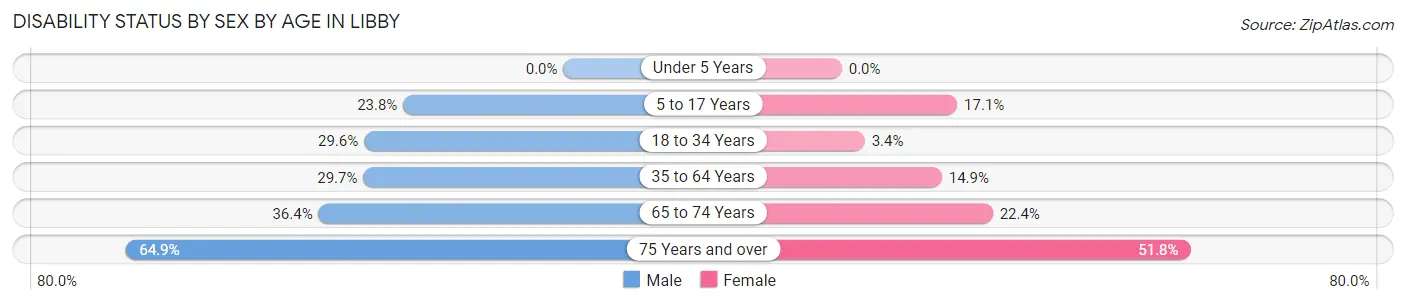
| Age Bracket | Male | Female |
| Under 5 Years | 0 (0.0%) | 0 (0.0%) |
| 5 to 17 Years | 44 (23.8%) | 37 (17.1%) |
| 18 to 34 Years | 58 (29.6%) | 9 (3.4%) |
| 35 to 64 Years | 142 (29.7%) | 91 (14.8%) |
| 65 to 74 Years | 64 (36.4%) | 26 (22.4%) |
| 75 Years and over | 146 (64.9%) | 74 (51.7%) |
Disability Class by Sex by Age in Libby
Disability Class: Hearing Difficulty
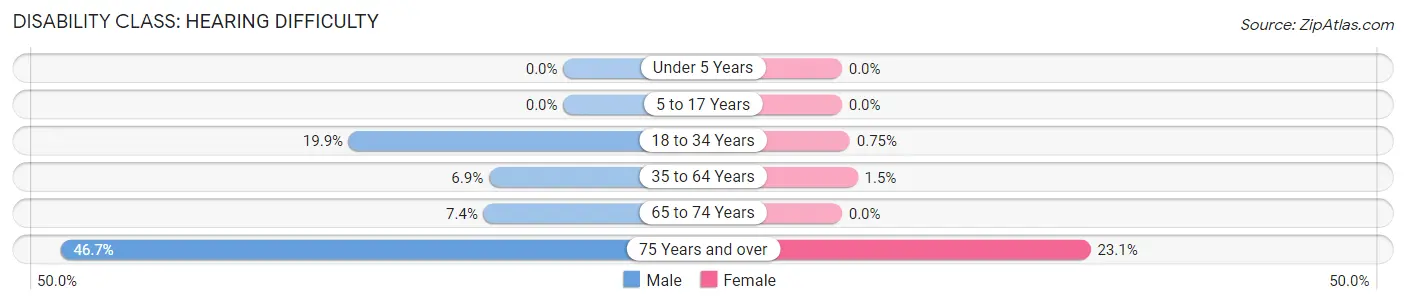
| Age Bracket | Male | Female |
| Under 5 Years | 0 (0.0%) | 0 (0.0%) |
| 5 to 17 Years | 0 (0.0%) | 0 (0.0%) |
| 18 to 34 Years | 39 (19.9%) | 2 (0.7%) |
| 35 to 64 Years | 33 (6.9%) | 9 (1.5%) |
| 65 to 74 Years | 13 (7.4%) | 0 (0.0%) |
| 75 Years and over | 105 (46.7%) | 33 (23.1%) |
Disability Class: Vision Difficulty
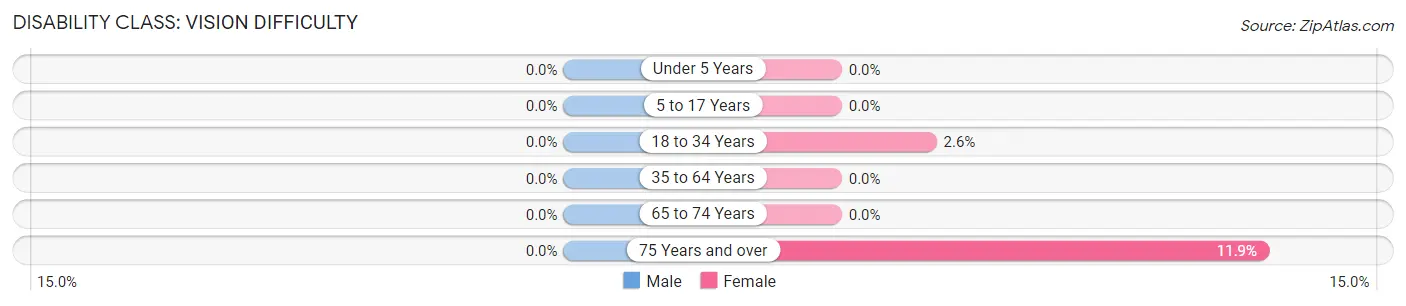
| Age Bracket | Male | Female |
| Under 5 Years | 0 (0.0%) | 0 (0.0%) |
| 5 to 17 Years | 0 (0.0%) | 0 (0.0%) |
| 18 to 34 Years | 0 (0.0%) | 7 (2.6%) |
| 35 to 64 Years | 0 (0.0%) | 0 (0.0%) |
| 65 to 74 Years | 0 (0.0%) | 0 (0.0%) |
| 75 Years and over | 0 (0.0%) | 17 (11.9%) |
Disability Class: Cognitive Difficulty
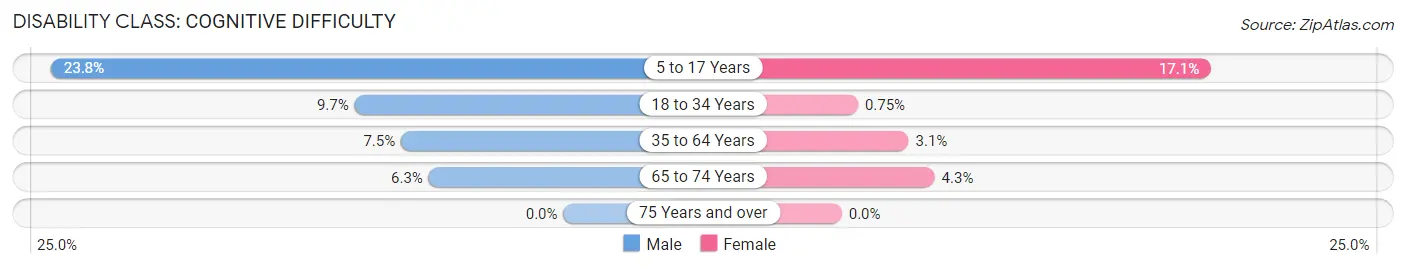
| Age Bracket | Male | Female |
| 5 to 17 Years | 44 (23.8%) | 37 (17.1%) |
| 18 to 34 Years | 19 (9.7%) | 2 (0.7%) |
| 35 to 64 Years | 36 (7.5%) | 19 (3.1%) |
| 65 to 74 Years | 11 (6.2%) | 5 (4.3%) |
| 75 Years and over | 0 (0.0%) | 0 (0.0%) |
Disability Class: Ambulatory Difficulty
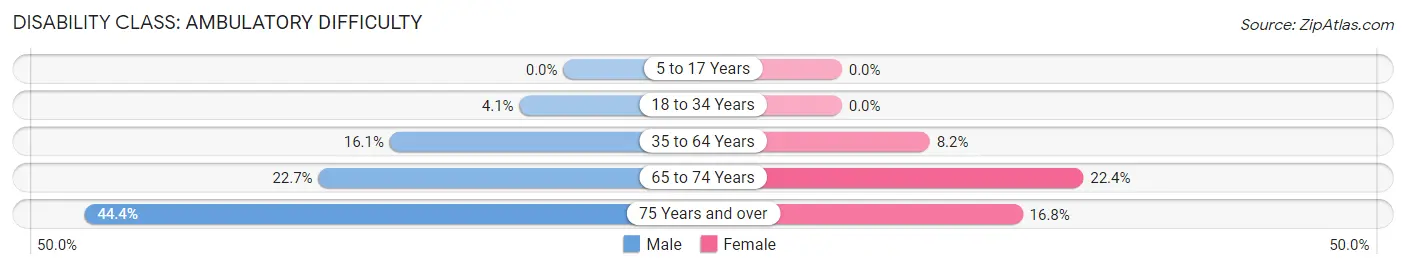
| Age Bracket | Male | Female |
| 5 to 17 Years | 0 (0.0%) | 0 (0.0%) |
| 18 to 34 Years | 8 (4.1%) | 0 (0.0%) |
| 35 to 64 Years | 77 (16.1%) | 50 (8.2%) |
| 65 to 74 Years | 40 (22.7%) | 26 (22.4%) |
| 75 Years and over | 100 (44.4%) | 24 (16.8%) |
Disability Class: Self-Care Difficulty
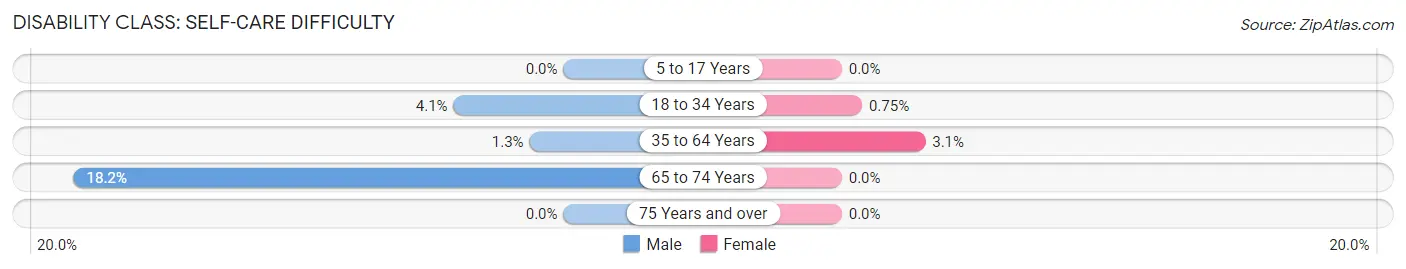
| Age Bracket | Male | Female |
| 5 to 17 Years | 0 (0.0%) | 0 (0.0%) |
| 18 to 34 Years | 8 (4.1%) | 2 (0.7%) |
| 35 to 64 Years | 6 (1.3%) | 19 (3.1%) |
| 65 to 74 Years | 32 (18.2%) | 0 (0.0%) |
| 75 Years and over | 0 (0.0%) | 0 (0.0%) |
Technology Access in Libby
Computing Device Access in Libby
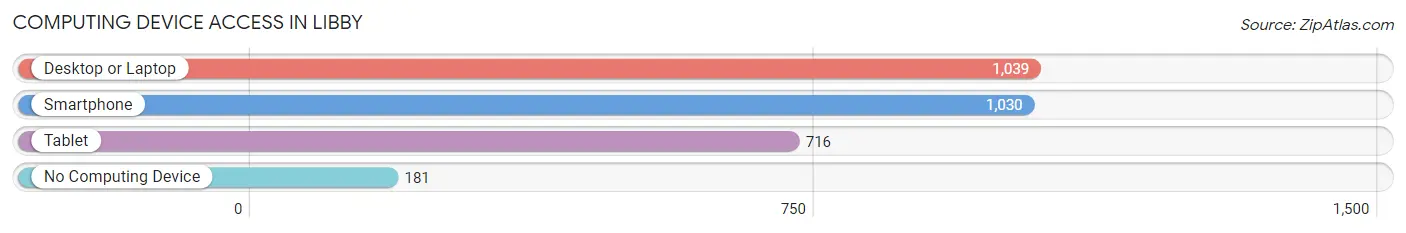
| Device Type | # Households | % Households |
| Desktop or Laptop | 1,039 | 70.2% |
| Smartphone | 1,030 | 69.6% |
| Tablet | 716 | 48.4% |
| No Computing Device | 181 | 12.2% |
| Total | 1,480 | 100.0% |
Internet Access in Libby
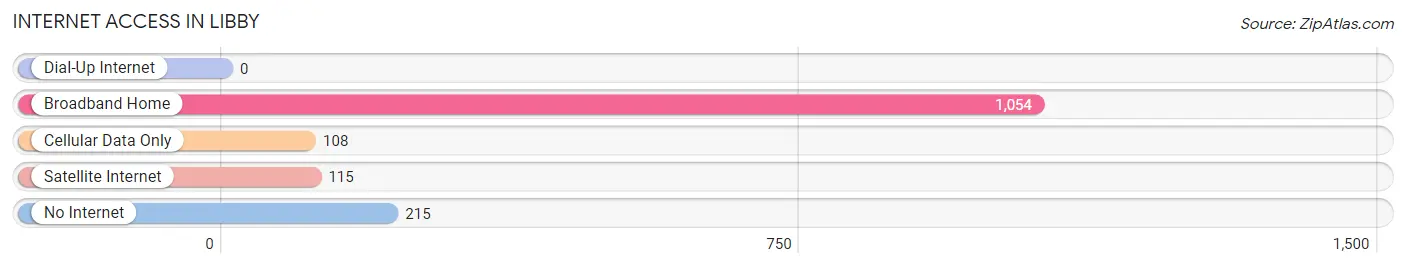
| Internet Type | # Households | % Households |
| Dial-Up Internet | 0 | 0.0% |
| Broadband Home | 1,054 | 71.2% |
| Cellular Data Only | 108 | 7.3% |
| Satellite Internet | 115 | 7.8% |
| No Internet | 215 | 14.5% |
| Total | 1,480 | 100.0% |
Libby Summary
Libby, Montana is a small town located in the northwest corner of the state, nestled in the Kootenai National Forest. It is the county seat of Lincoln County and is home to a population of 2,628 people as of the 2010 census. The town was founded in 1892 and was named after Libby, Maine, the hometown of one of the original settlers.
Geography
Libby is located in the northwest corner of Montana, near the Idaho border. It is situated in the Kootenai National Forest, which is part of the Rocky Mountain Range. The town is surrounded by mountains, rivers, and lakes, making it a popular destination for outdoor recreation. The Kootenai River runs through the town, and the nearby Cabinet Mountains provide a stunning backdrop. The climate in Libby is generally mild, with cold winters and warm summers.
Economy
Libby’s economy is largely based on timber and tourism. The town is home to several sawmills and lumber companies, which provide jobs for many of the town’s residents. Tourism is also an important part of the local economy, as Libby is a popular destination for outdoor recreation. The nearby Kootenai National Forest offers camping, fishing, hiking, and other activities.
Demographics
As of the 2010 census, Libby had a population of 2,628 people. The racial makeup of the town was 95.3% White, 0.3% African American, 0.7% Native American, 0.3% Asian, 0.1% Pacific Islander, 1.2% from other races, and 2.2% from two or more races. The median household income was $30,938, and the median family income was $37,813. The per capita income was $17,845.
Conclusion
Libby, Montana is a small town located in the northwest corner of the state, nestled in the Kootenai National Forest. It is the county seat of Lincoln County and is home to a population of 2,628 people as of the 2010 census. The town’s economy is largely based on timber and tourism, and the nearby Kootenai National Forest offers camping, fishing, hiking, and other activities. The racial makeup of the town is mostly White, with a small percentage of African American, Native American, Asian, and Pacific Islander residents. The median household income is $30,938, and the median family income is $37,813. Libby is a great place to live and work, and it offers a variety of activities for residents and visitors alike.
Common Questions
What is Per Capita Income in Libby?
Per Capita income in Libby is $25,685.
What is the Median Family Income in Libby?
Median Family Income in Libby is $44,593.
What is the Median Household income in Libby?
Median Household Income in Libby is $36,373.
What is Income or Wage Gap in Libby?
Income or Wage Gap in Libby is 54.4%.
Women in Libby earn 45.6 cents for every dollar earned by a man.
What is Inequality or Gini Index in Libby?
Inequality or Gini Index in Libby is 0.48.
What is the Total Population of Libby?
Total Population of Libby is 2,857.
What is the Total Male Population of Libby?
Total Male Population of Libby is 1,400.
What is the Total Female Population of Libby?
Total Female Population of Libby is 1,457.
What is the Ratio of Males per 100 Females in Libby?
There are 96.09 Males per 100 Females in Libby.
What is the Ratio of Females per 100 Males in Libby?
There are 104.07 Females per 100 Males in Libby.
What is the Median Population Age in Libby?
Median Population Age in Libby is 49.9 Years.
What is the Average Family Size in Libby
Average Family Size in Libby is 2.6 People.
What is the Average Household Size in Libby
Average Household Size in Libby is 1.8 People.
How Large is the Labor Force in Libby?
There are 1,153 People in the Labor Forcein in Libby.
What is the Percentage of People in the Labor Force in Libby?
47.0% of People are in the Labor Force in Libby.
What is the Unemployment Rate in Libby?
Unemployment Rate in Libby is 2.1%.