Marion, MT Map & Demographics
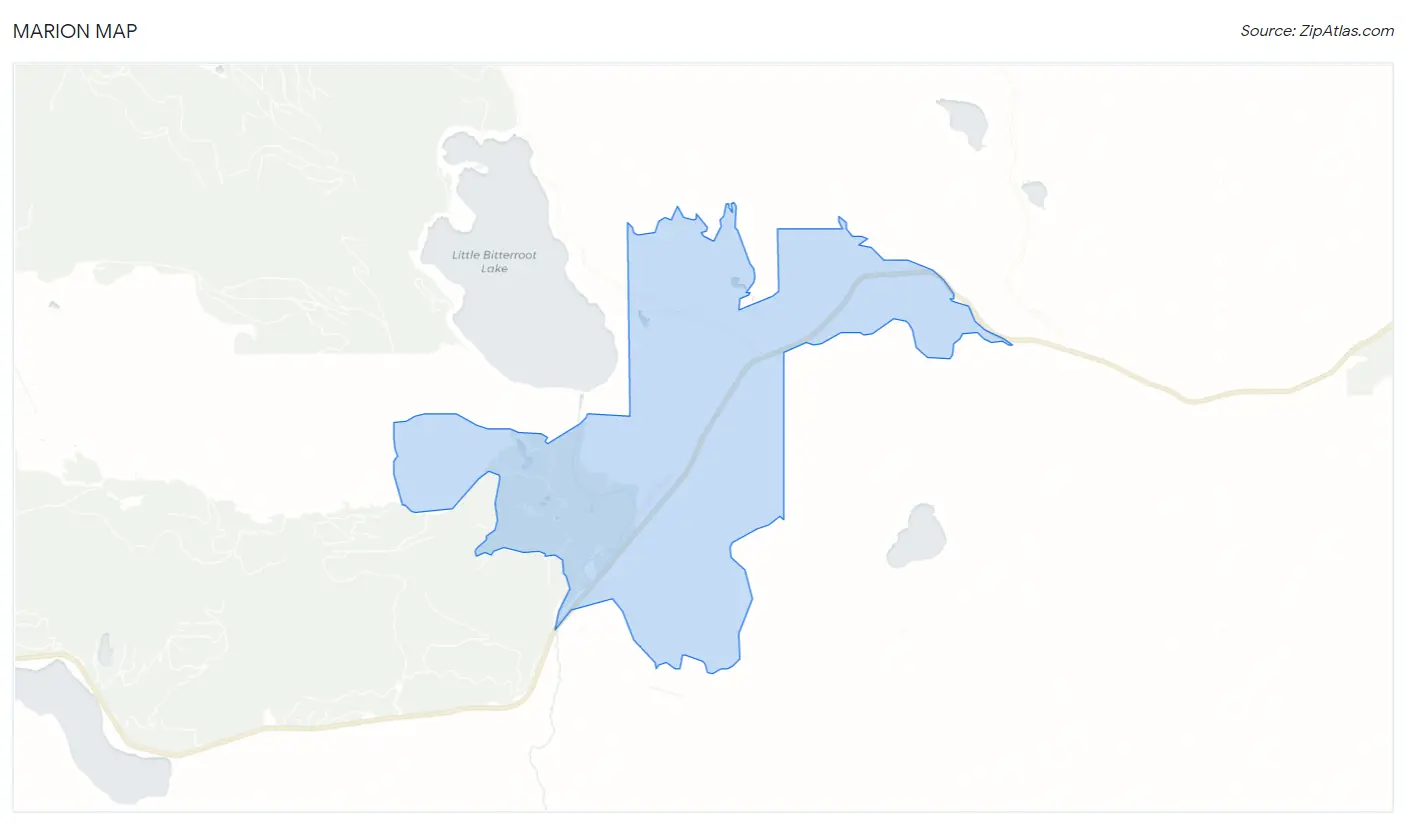
Marion Map
Marion Overview
$27,211
PER CAPITA INCOME
$83,681
AVG FAMILY INCOME
$58,704
AVG HOUSEHOLD INCOME
37.7%
WAGE / INCOME GAP [ % ]
62.3¢/ $1
WAGE / INCOME GAP [ $ ]
0.43
INEQUALITY / GINI INDEX
1,219
TOTAL POPULATION
672
MALE POPULATION
547
FEMALE POPULATION
122.85
MALES / 100 FEMALES
81.40
FEMALES / 100 MALES
41.8
MEDIAN AGE
3.2
AVG FAMILY SIZE
3.0
AVG HOUSEHOLD SIZE
627
LABOR FORCE [ PEOPLE ]
67.3%
PERCENT IN LABOR FORCE
11.2%
UNEMPLOYMENT RATE
Marion Zip Codes
Marion Area Codes
Income in Marion
Income Overview in Marion
Per Capita Income in Marion is $27,211, while median incomes of families and households are $83,681 and $58,704 respectively.
| Characteristic | Number | Measure |
| Per Capita Income | 1,219 | $27,211 |
| Median Family Income | 325 | $83,681 |
| Mean Family Income | 325 | $87,825 |
| Median Household Income | 406 | $58,704 |
| Mean Household Income | 406 | $80,581 |
| Income Deficit | 325 | $0 |
| Wage / Income Gap (%) | 1,219 | 37.73% |
| Wage / Income Gap ($) | 1,219 | 62.27¢ per $1 |
| Gini / Inequality Index | 1,219 | 0.43 |
Earnings by Sex in Marion
Average Earnings in Marion are $31,053, $40,147 for men and $25,000 for women, a difference of 37.7%.
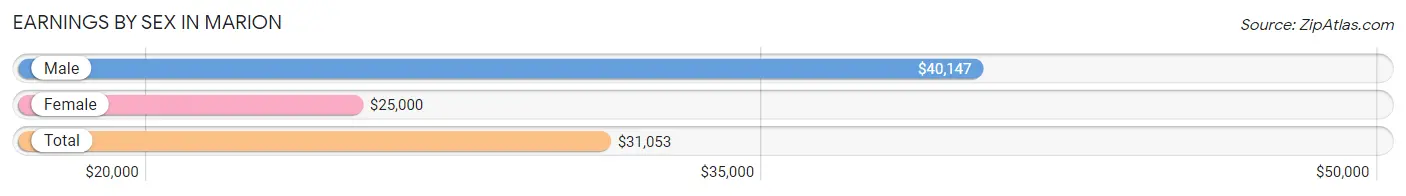
| Sex | Number | Average Earnings |
| Male | 364 (57.8%) | $40,147 |
| Female | 266 (42.2%) | $25,000 |
| Total | 630 (100.0%) | $31,053 |
Earnings by Sex by Income Bracket in Marion
The most common earnings brackets in Marion are $65,000 to $74,999 for men (58 | 15.9%) and $75,000 to $99,999 for women (36 | 13.5%).
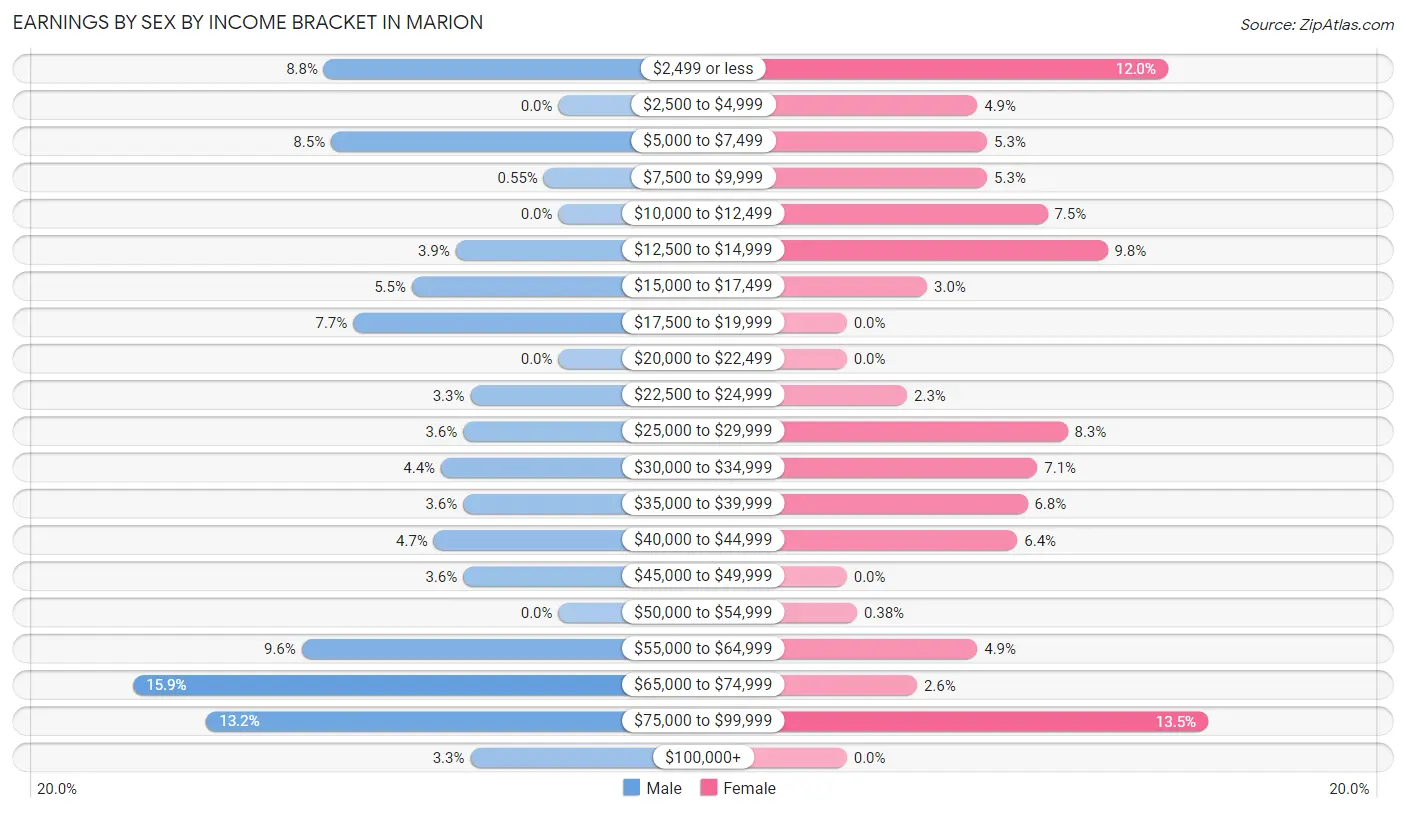
| Income | Male | Female |
| $2,499 or less | 32 (8.8%) | 32 (12.0%) |
| $2,500 to $4,999 | 0 (0.0%) | 13 (4.9%) |
| $5,000 to $7,499 | 31 (8.5%) | 14 (5.3%) |
| $7,500 to $9,999 | 2 (0.5%) | 14 (5.3%) |
| $10,000 to $12,499 | 0 (0.0%) | 20 (7.5%) |
| $12,500 to $14,999 | 14 (3.8%) | 26 (9.8%) |
| $15,000 to $17,499 | 20 (5.5%) | 8 (3.0%) |
| $17,500 to $19,999 | 28 (7.7%) | 0 (0.0%) |
| $20,000 to $22,499 | 0 (0.0%) | 0 (0.0%) |
| $22,500 to $24,999 | 12 (3.3%) | 6 (2.3%) |
| $25,000 to $29,999 | 13 (3.6%) | 22 (8.3%) |
| $30,000 to $34,999 | 16 (4.4%) | 19 (7.1%) |
| $35,000 to $39,999 | 13 (3.6%) | 18 (6.8%) |
| $40,000 to $44,999 | 17 (4.7%) | 17 (6.4%) |
| $45,000 to $49,999 | 13 (3.6%) | 0 (0.0%) |
| $50,000 to $54,999 | 0 (0.0%) | 1 (0.4%) |
| $55,000 to $64,999 | 35 (9.6%) | 13 (4.9%) |
| $65,000 to $74,999 | 58 (15.9%) | 7 (2.6%) |
| $75,000 to $99,999 | 48 (13.2%) | 36 (13.5%) |
| $100,000+ | 12 (3.3%) | 0 (0.0%) |
| Total | 364 (100.0%) | 266 (100.0%) |
Earnings by Sex by Educational Attainment in Marion
Average earnings in Marion are $52,500 for men and $30,197 for women, a difference of 42.5%. Men with an educational attainment of graduate degree enjoy the highest average annual earnings of $70,833, while those with college or associate's degree education earn the least with $33,359. Women with an educational attainment of college or associate's degree earn the most with the average annual earnings of $30,865, while those with high school diploma education have the smallest earnings of $30,417.
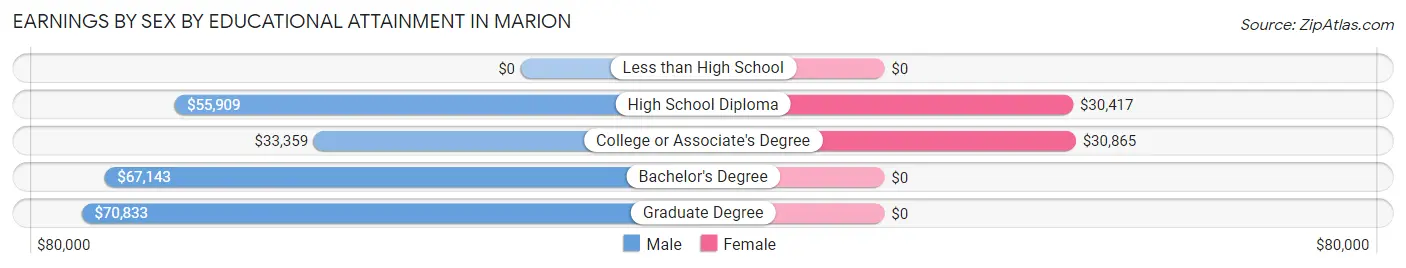
| Educational Attainment | Male Income | Female Income |
| Less than High School | - | - |
| High School Diploma | $55,909 | $30,417 |
| College or Associate's Degree | $33,359 | $30,865 |
| Bachelor's Degree | $67,143 | $0 |
| Graduate Degree | $70,833 | $0 |
| Total | $52,500 | $30,197 |
Family Income in Marion
Family Income Brackets in Marion
According to the Marion family income data, there are 67 families falling into the $50,000 to $74,999 income range, which is the most common income bracket and makes up 20.6% of all families.
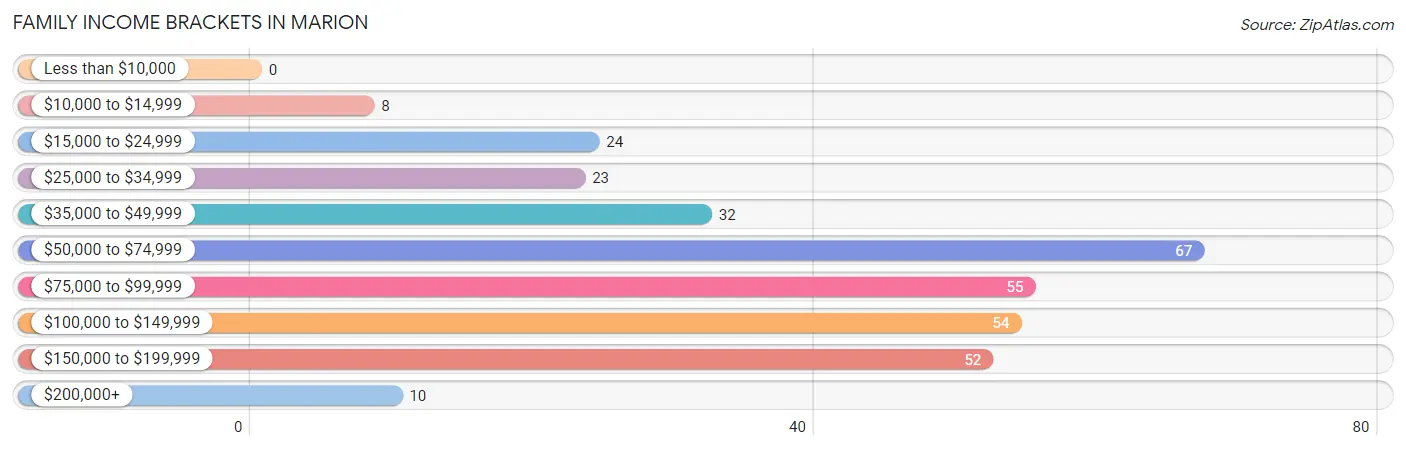
| Income Bracket | # Families | % Families |
| Less than $10,000 | 0 | 0.0% |
| $10,000 to $14,999 | 8 | 2.5% |
| $15,000 to $24,999 | 24 | 7.4% |
| $25,000 to $34,999 | 23 | 7.1% |
| $35,000 to $49,999 | 32 | 9.8% |
| $50,000 to $74,999 | 67 | 20.6% |
| $75,000 to $99,999 | 55 | 16.9% |
| $100,000 to $149,999 | 54 | 16.6% |
| $150,000 to $199,999 | 52 | 16.0% |
| $200,000+ | 10 | 3.1% |
Family Income by Famaliy Size in Marion
5-person families (11 | 3.4%) account for the highest median family income in Marion with $175,208 per family, while 5-person families (11 | 3.4%) have the highest median income of $35,042 per family member.
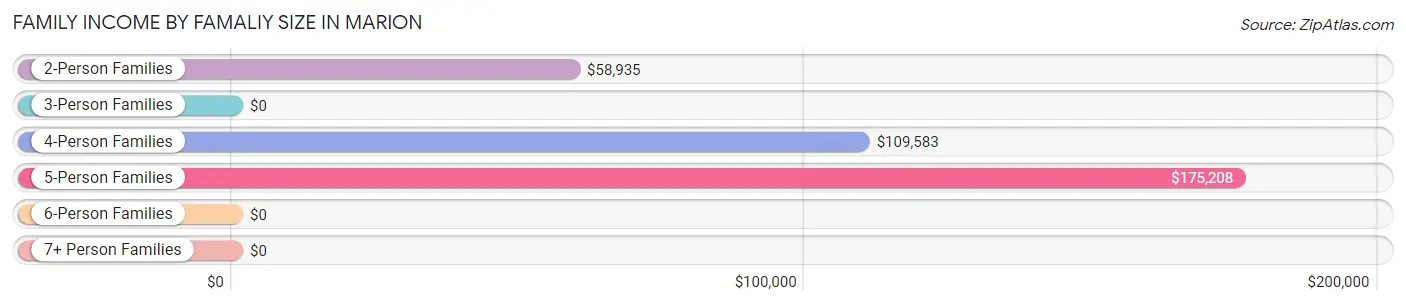
| Income Bracket | # Families | Median Income |
| 2-Person Families | 191 (58.8%) | $58,935 |
| 3-Person Families | 48 (14.8%) | $0 |
| 4-Person Families | 44 (13.5%) | $109,583 |
| 5-Person Families | 11 (3.4%) | $175,208 |
| 6-Person Families | 18 (5.5%) | $0 |
| 7+ Person Families | 13 (4.0%) | $0 |
| Total | 325 (100.0%) | $83,681 |
Family Income by Number of Earners in Marion
The median family income in Marion is $83,681, with families comprising 3+ earners (60) having the highest median family income of $120,208, while families with 1 earner (67) have the lowest median family income of $50,688, accounting for 18.5% and 20.6% of families, respectively.
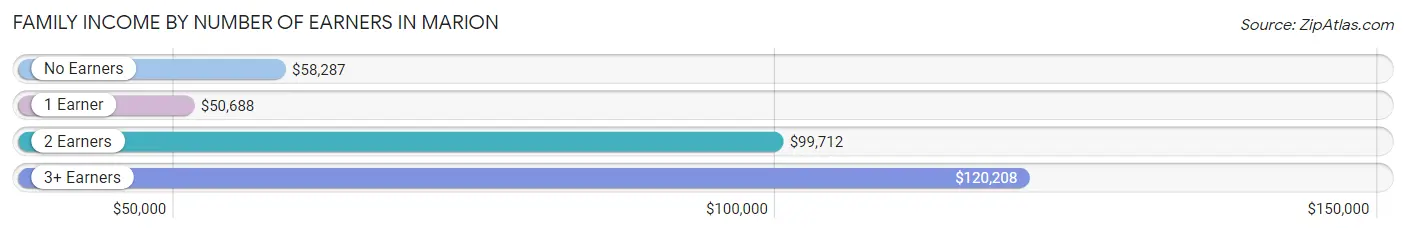
| Number of Earners | # Families | Median Income |
| No Earners | 63 (19.4%) | $58,287 |
| 1 Earner | 67 (20.6%) | $50,688 |
| 2 Earners | 135 (41.5%) | $99,712 |
| 3+ Earners | 60 (18.5%) | $120,208 |
| Total | 325 (100.0%) | $83,681 |
Household Income in Marion
Household Income Brackets in Marion
With 68 households falling in the category, the $50,000 to $74,999 income range is the most frequent in Marion, accounting for 16.8% of all households. In contrast, only 8 households (2.0%) fall into the $10,000 to $14,999 income bracket, making it the least populous group.
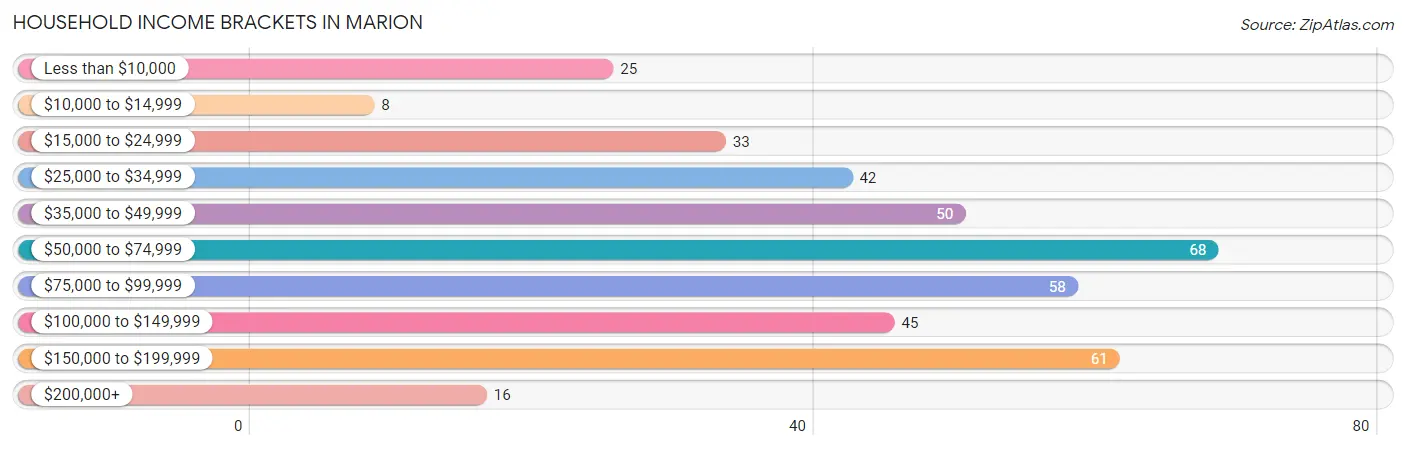
| Income Bracket | # Households | % Households |
| Less than $10,000 | 25 | 6.2% |
| $10,000 to $14,999 | 8 | 2.0% |
| $15,000 to $24,999 | 33 | 8.1% |
| $25,000 to $34,999 | 42 | 10.3% |
| $35,000 to $49,999 | 50 | 12.3% |
| $50,000 to $74,999 | 68 | 16.7% |
| $75,000 to $99,999 | 58 | 14.3% |
| $100,000 to $149,999 | 45 | 11.1% |
| $150,000 to $199,999 | 61 | 15.0% |
| $200,000+ | 16 | 3.9% |
Household Income by Householder Age in Marion
The median household income in Marion is $58,704, with the highest median household income of $83,750 found in the 25 to 44 years age bracket for the primary householder. A total of 106 households (26.1%) fall into this category.
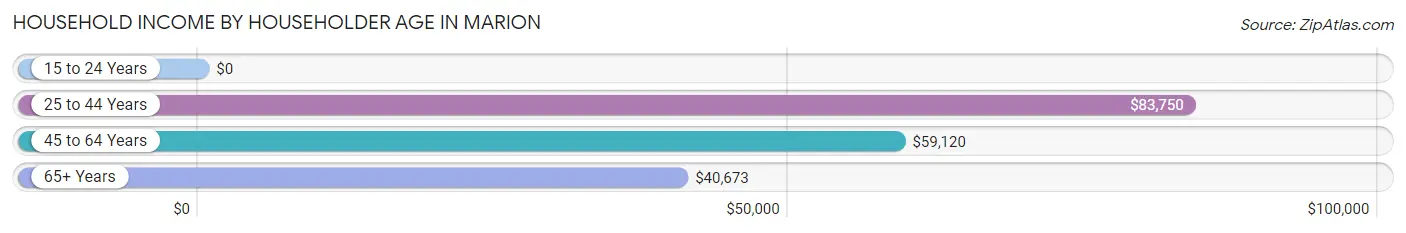
| Income Bracket | # Households | Median Income |
| 15 to 24 Years | 0 (0.0%) | $0 |
| 25 to 44 Years | 106 (26.1%) | $83,750 |
| 45 to 64 Years | 235 (57.9%) | $59,120 |
| 65+ Years | 65 (16.0%) | $40,673 |
| Total | 406 (100.0%) | $58,704 |
Poverty in Marion
Income Below Poverty by Sex and Age in Marion
With 7.5% poverty level for males and 17.1% for females among the residents of Marion, 75 year old and over males and 5 year old females are the most vulnerable to poverty, with 5 males (45.5%) and 15 females (100.0%) in their respective age groups living below the poverty level.
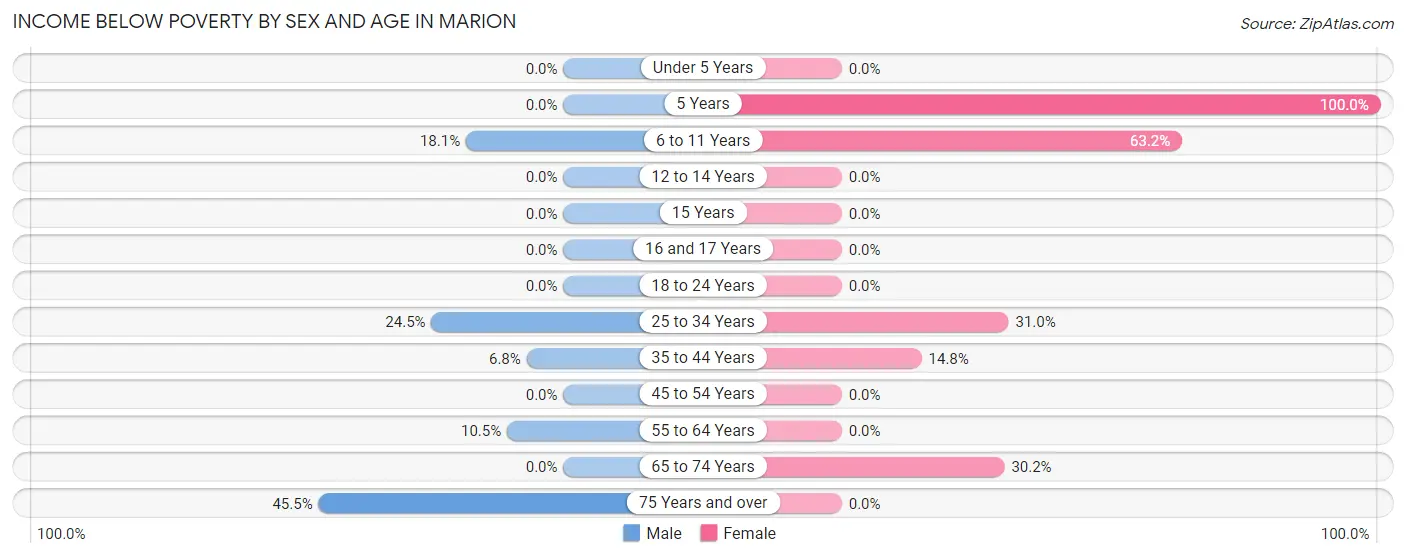
| Age Bracket | Male | Female |
| Under 5 Years | 0 (0.0%) | 0 (0.0%) |
| 5 Years | 0 (0.0%) | 15 (100.0%) |
| 6 to 11 Years | 15 (18.1%) | 36 (63.2%) |
| 12 to 14 Years | 0 (0.0%) | 0 (0.0%) |
| 15 Years | 0 (0.0%) | 0 (0.0%) |
| 16 and 17 Years | 0 (0.0%) | 0 (0.0%) |
| 18 to 24 Years | 0 (0.0%) | 0 (0.0%) |
| 25 to 34 Years | 12 (24.5%) | 13 (30.9%) |
| 35 to 44 Years | 3 (6.8%) | 12 (14.8%) |
| 45 to 54 Years | 0 (0.0%) | 0 (0.0%) |
| 55 to 64 Years | 14 (10.4%) | 0 (0.0%) |
| 65 to 74 Years | 0 (0.0%) | 16 (30.2%) |
| 75 Years and over | 5 (45.5%) | 0 (0.0%) |
| Total | 49 (7.5%) | 92 (17.1%) |
Income Above Poverty by Sex and Age in Marion
According to the poverty statistics in Marion, males aged under 5 years and females aged under 5 years are the age groups that are most secure financially, with 100.0% of males and 100.0% of females in these age groups living above the poverty line.
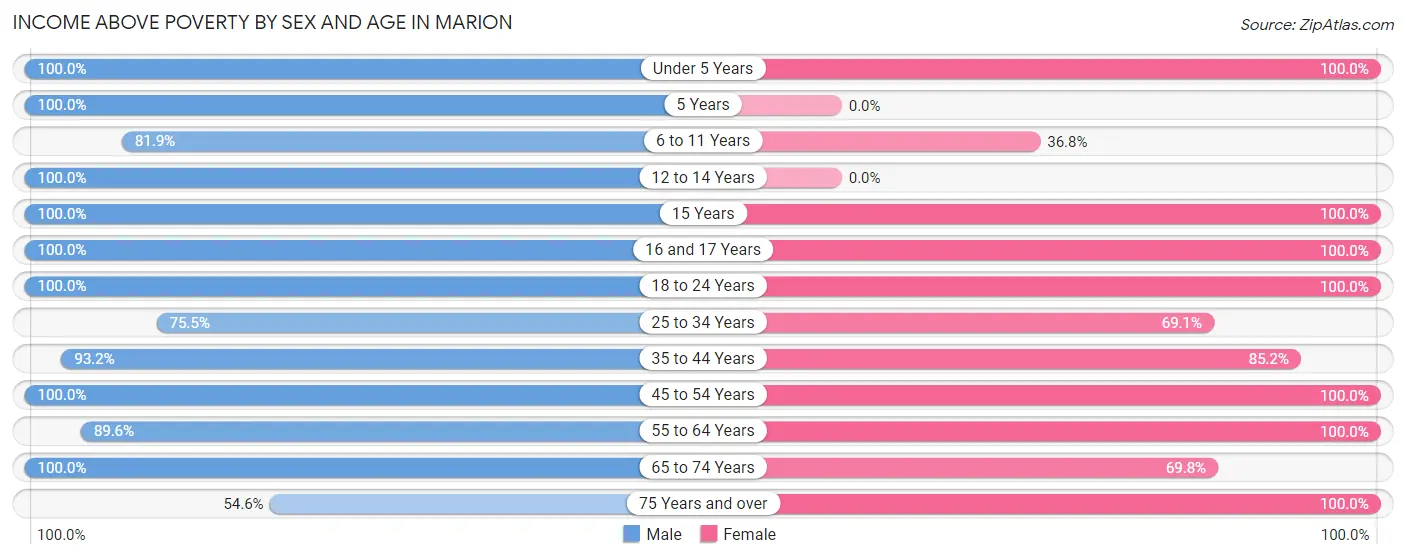
| Age Bracket | Male | Female |
| Under 5 Years | 17 (100.0%) | 23 (100.0%) |
| 5 Years | 10 (100.0%) | 0 (0.0%) |
| 6 to 11 Years | 68 (81.9%) | 21 (36.8%) |
| 12 to 14 Years | 33 (100.0%) | 0 (0.0%) |
| 15 Years | 7 (100.0%) | 19 (100.0%) |
| 16 and 17 Years | 63 (100.0%) | 38 (100.0%) |
| 18 to 24 Years | 40 (100.0%) | 13 (100.0%) |
| 25 to 34 Years | 37 (75.5%) | 29 (69.1%) |
| 35 to 44 Years | 41 (93.2%) | 69 (85.2%) |
| 45 to 54 Years | 123 (100.0%) | 81 (100.0%) |
| 55 to 64 Years | 120 (89.5%) | 111 (100.0%) |
| 65 to 74 Years | 42 (100.0%) | 37 (69.8%) |
| 75 Years and over | 6 (54.5%) | 6 (100.0%) |
| Total | 607 (92.5%) | 447 (82.9%) |
Income Below Poverty Among Married-Couple Families in Marion
The poverty statistics for married-couple families in Marion show that 7.7% or 21 of the total 272 families live below the poverty line. Families with 3 or 4 children have the highest poverty rate of 57.1%, comprising of 12 families. On the other hand, families with 1 or 2 children have the lowest poverty rate of 0.0%, which includes 0 families.
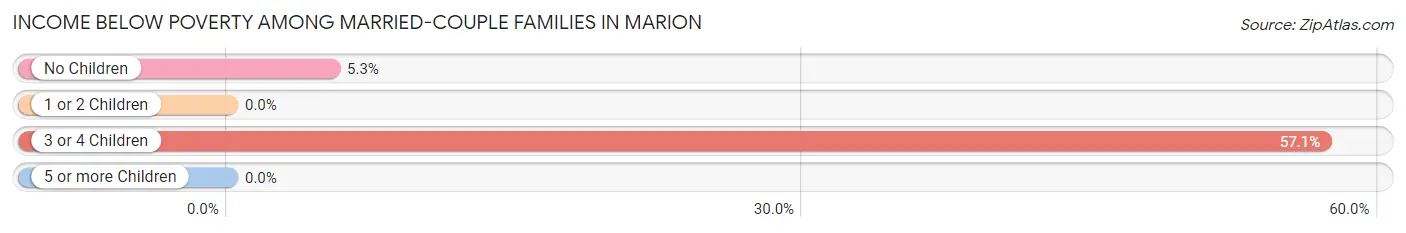
| Children | Above Poverty | Below Poverty |
| No Children | 160 (94.7%) | 9 (5.3%) |
| 1 or 2 Children | 69 (100.0%) | 0 (0.0%) |
| 3 or 4 Children | 9 (42.9%) | 12 (57.1%) |
| 5 or more Children | 13 (100.0%) | 0 (0.0%) |
| Total | 251 (92.3%) | 21 (7.7%) |
Income Below Poverty Among Single-Parent Households in Marion
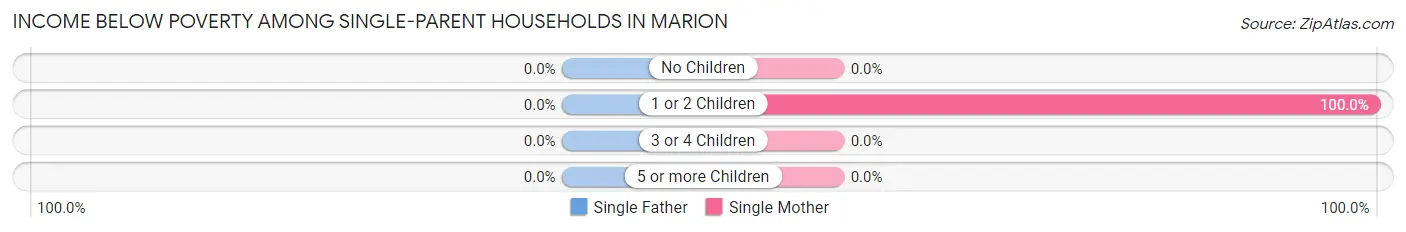
| Children | Single Father | Single Mother |
| No Children | 0 (0.0%) | 0 (0.0%) |
| 1 or 2 Children | 0 (0.0%) | 8 (100.0%) |
| 3 or 4 Children | 0 (0.0%) | 0 (0.0%) |
| 5 or more Children | 0 (0.0%) | 0 (0.0%) |
| Total | 0 (0.0%) | 8 (24.2%) |
Income Below Poverty Among Married-Couple vs Single-Parent Households in Marion
The poverty data for Marion shows that 21 of the married-couple family households (7.7%) and 8 of the single-parent households (15.1%) are living below the poverty level. Within the married-couple family households, those with 3 or 4 children have the highest poverty rate, with 12 households (57.1%) falling below the poverty line. Among the single-parent households, those with 1 or 2 children have the highest poverty rate, with 8 household (28.6%) living below poverty.
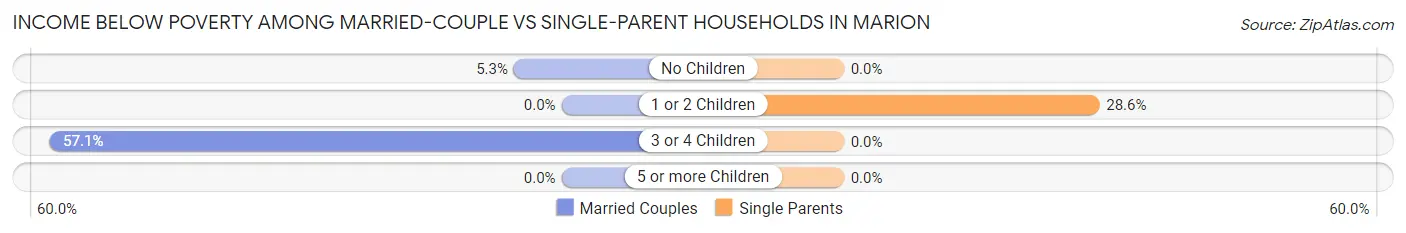
| Children | Married-Couple Families | Single-Parent Households |
| No Children | 9 (5.3%) | 0 (0.0%) |
| 1 or 2 Children | 0 (0.0%) | 8 (28.6%) |
| 3 or 4 Children | 12 (57.1%) | 0 (0.0%) |
| 5 or more Children | 0 (0.0%) | 0 (0.0%) |
| Total | 21 (7.7%) | 8 (15.1%) |
Race in Marion
The most populous races in Marion are White / Caucasian (1,132 | 92.9%), Two or more Races (69 | 5.7%), and Hispanic or Latino (25 | 2.1%).
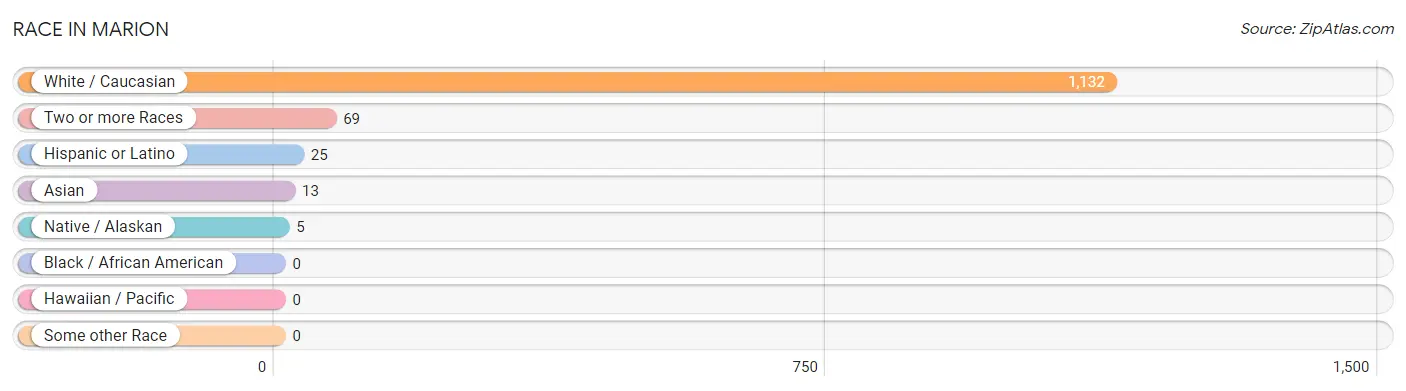
| Race | # Population | % Population |
| Asian | 13 | 1.1% |
| Black / African American | 0 | 0.0% |
| Hawaiian / Pacific | 0 | 0.0% |
| Hispanic or Latino | 25 | 2.1% |
| Native / Alaskan | 5 | 0.4% |
| White / Caucasian | 1,132 | 92.9% |
| Two or more Races | 69 | 5.7% |
| Some other Race | 0 | 0.0% |
| Total | 1,219 | 100.0% |
Ancestry in Marion
The most populous ancestries reported in Marion are German (241 | 19.8%), English (138 | 11.3%), Italian (102 | 8.4%), Norwegian (50 | 4.1%), and Scottish (50 | 4.1%), together accounting for 47.7% of all Marion residents.
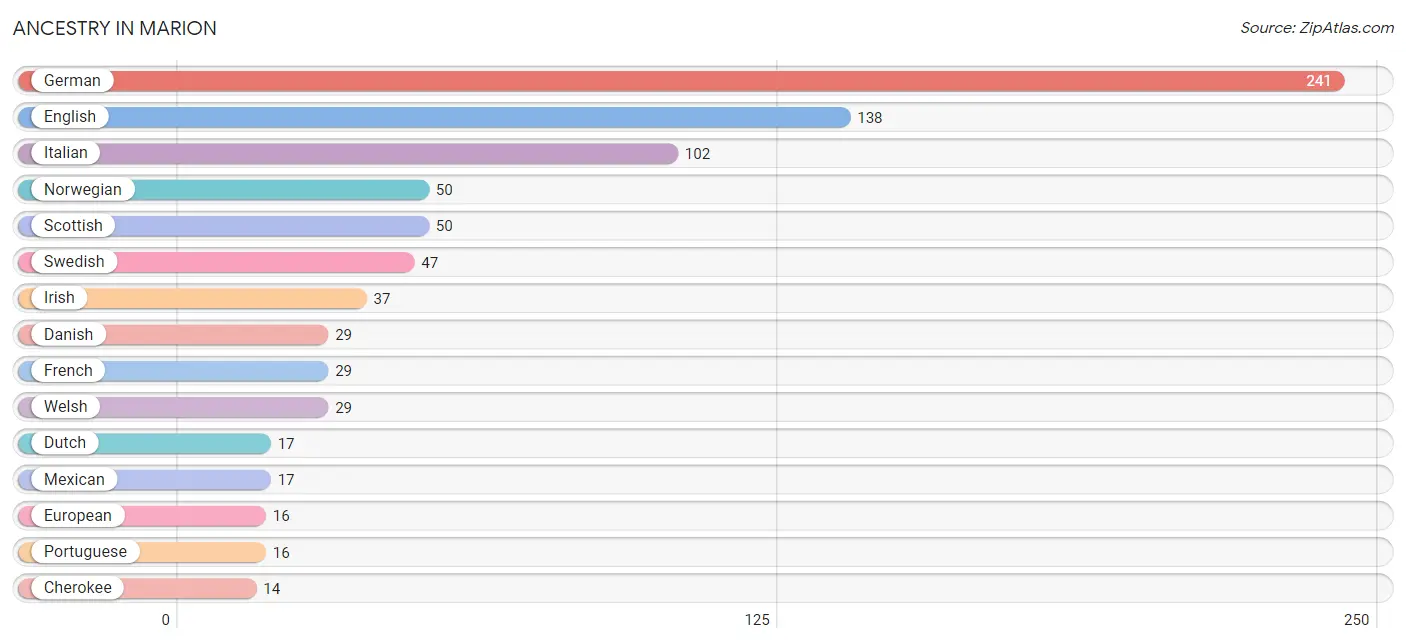
| Ancestry | # Population | % Population |
| American | 13 | 1.1% |
| Basque | 3 | 0.3% |
| British | 6 | 0.5% |
| Cajun | 2 | 0.2% |
| Canadian | 4 | 0.3% |
| Cherokee | 14 | 1.1% |
| Czech | 7 | 0.6% |
| Czechoslovakian | 3 | 0.3% |
| Danish | 29 | 2.4% |
| Dutch | 17 | 1.4% |
| Eastern European | 4 | 0.3% |
| English | 138 | 11.3% |
| European | 16 | 1.3% |
| Finnish | 9 | 0.7% |
| French | 29 | 2.4% |
| German | 241 | 19.8% |
| Irish | 37 | 3.0% |
| Italian | 102 | 8.4% |
| Korean | 13 | 1.1% |
| Mexican | 17 | 1.4% |
| Northern European | 9 | 0.7% |
| Norwegian | 50 | 4.1% |
| Polish | 13 | 1.1% |
| Portuguese | 16 | 1.3% |
| Scandinavian | 2 | 0.2% |
| Scotch-Irish | 4 | 0.3% |
| Scottish | 50 | 4.1% |
| Sioux | 5 | 0.4% |
| Spaniard | 8 | 0.7% |
| Swedish | 47 | 3.9% |
| Welsh | 29 | 2.4% |
| Yugoslavian | 3 | 0.3% | View All 32 Rows |
Immigrants in Marion
The most numerous immigrant groups reported in Marion came from Eastern Europe (18 | 1.5%), Europe (18 | 1.5%), Asia (13 | 1.1%), Philippines (13 | 1.1%), and South Eastern Asia (13 | 1.1%), together accounting for 6.2% of all Marion residents.
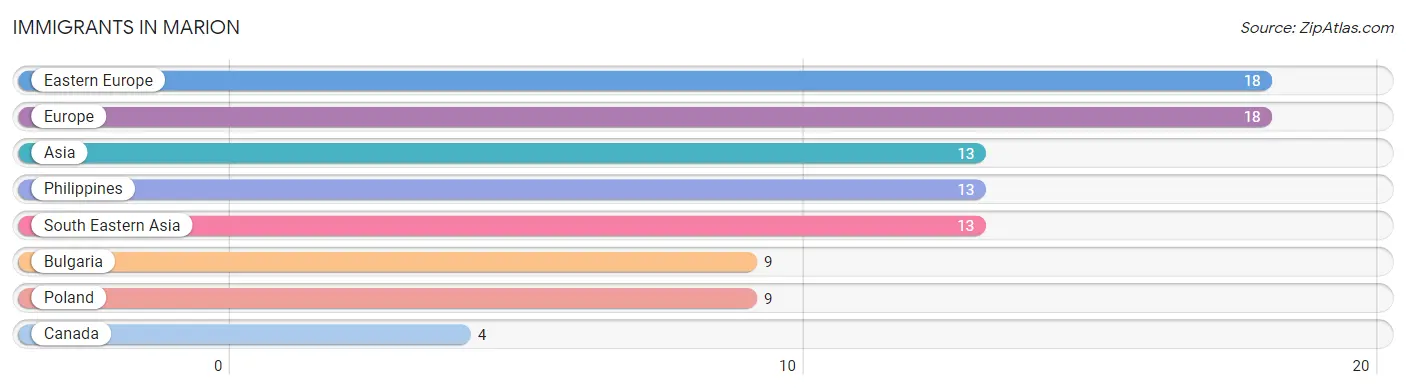
| Immigration Origin | # Population | % Population |
| Asia | 13 | 1.1% |
| Bulgaria | 9 | 0.7% |
| Canada | 4 | 0.3% |
| Eastern Europe | 18 | 1.5% |
| Europe | 18 | 1.5% |
| Philippines | 13 | 1.1% |
| Poland | 9 | 0.7% |
| South Eastern Asia | 13 | 1.1% | View All 8 Rows |
Sex and Age in Marion
Sex and Age in Marion
The most populous age groups in Marion are 15 to 19 Years (102 | 15.2%) for men and 60 to 64 Years (73 | 13.4%) for women.
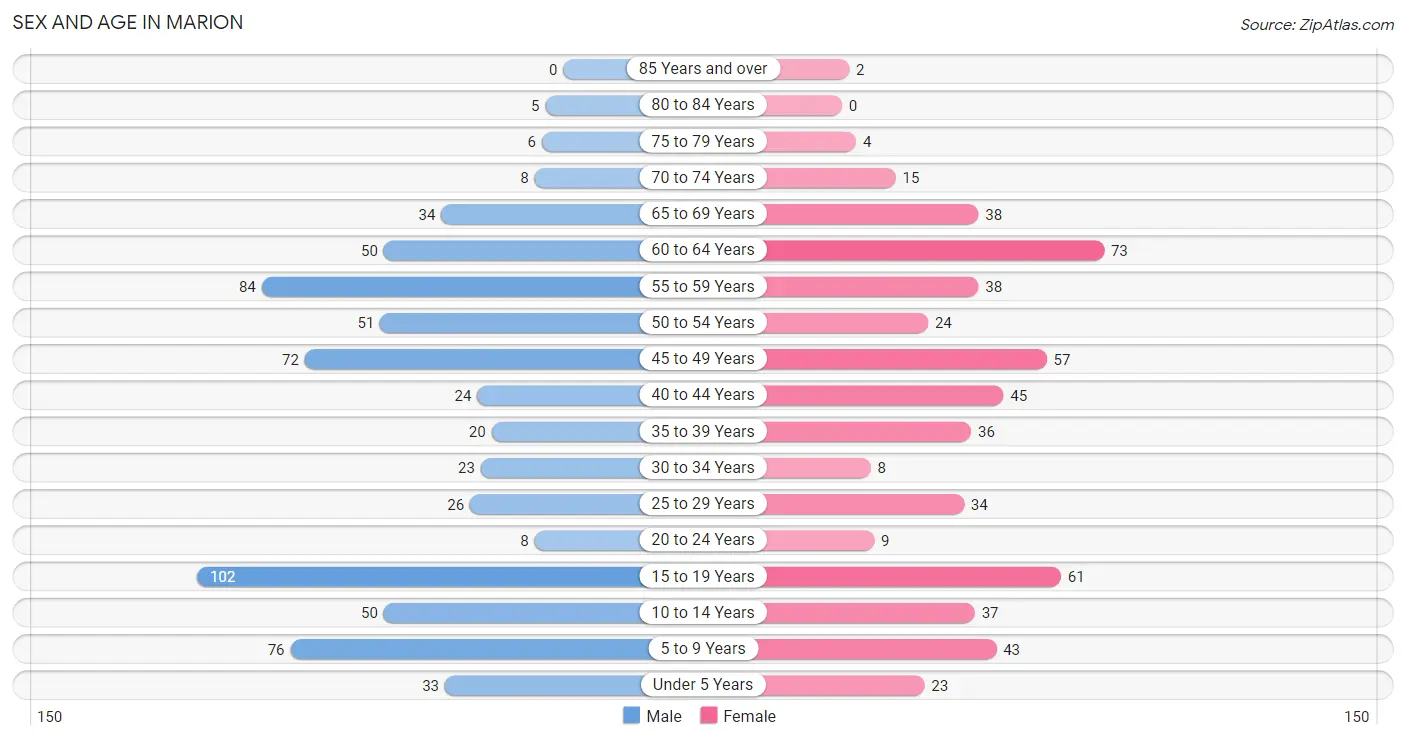
| Age Bracket | Male | Female |
| Under 5 Years | 33 (4.9%) | 23 (4.2%) |
| 5 to 9 Years | 76 (11.3%) | 43 (7.9%) |
| 10 to 14 Years | 50 (7.4%) | 37 (6.8%) |
| 15 to 19 Years | 102 (15.2%) | 61 (11.2%) |
| 20 to 24 Years | 8 (1.2%) | 9 (1.7%) |
| 25 to 29 Years | 26 (3.9%) | 34 (6.2%) |
| 30 to 34 Years | 23 (3.4%) | 8 (1.5%) |
| 35 to 39 Years | 20 (3.0%) | 36 (6.6%) |
| 40 to 44 Years | 24 (3.6%) | 45 (8.2%) |
| 45 to 49 Years | 72 (10.7%) | 57 (10.4%) |
| 50 to 54 Years | 51 (7.6%) | 24 (4.4%) |
| 55 to 59 Years | 84 (12.5%) | 38 (7.0%) |
| 60 to 64 Years | 50 (7.4%) | 73 (13.4%) |
| 65 to 69 Years | 34 (5.1%) | 38 (7.0%) |
| 70 to 74 Years | 8 (1.2%) | 15 (2.7%) |
| 75 to 79 Years | 6 (0.9%) | 4 (0.7%) |
| 80 to 84 Years | 5 (0.7%) | 0 (0.0%) |
| 85 Years and over | 0 (0.0%) | 2 (0.4%) |
| Total | 672 (100.0%) | 547 (100.0%) |
Families and Households in Marion
Median Family Size in Marion
The median family size in Marion is 3.21 persons per family, with single female/mother families (33 | 10.2%) accounting for the largest median family size of 3.36 persons per family. On the other hand, single male/father families (20 | 6.1%) represent the smallest median family size with 1.45 persons per family.
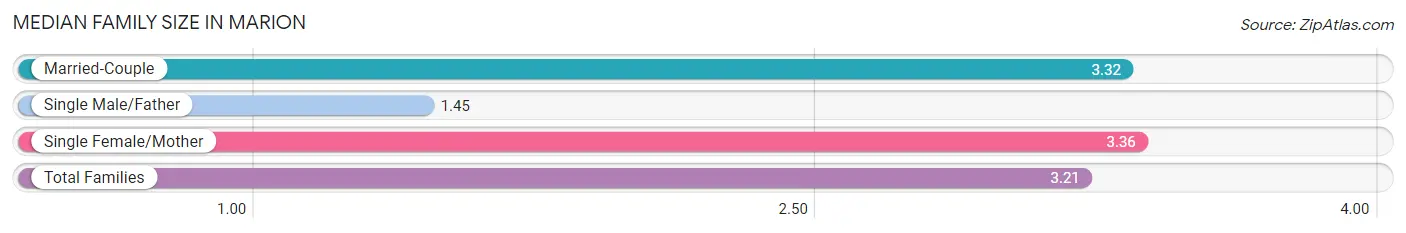
| Family Type | # Families | Family Size |
| Married-Couple | 272 (83.7%) | 3.32 |
| Single Male/Father | 20 (6.1%) | 1.45 |
| Single Female/Mother | 33 (10.2%) | 3.36 |
| Total Families | 325 (100.0%) | 3.21 |
Median Household Size in Marion
The median household size in Marion is 3.00 persons per household, with single female/mother households (33 | 8.1%) accounting for the largest median household size of 4.97 persons per household. non-family households (81 | 20.0%) represent the smallest median household size with 1.12 persons per household.
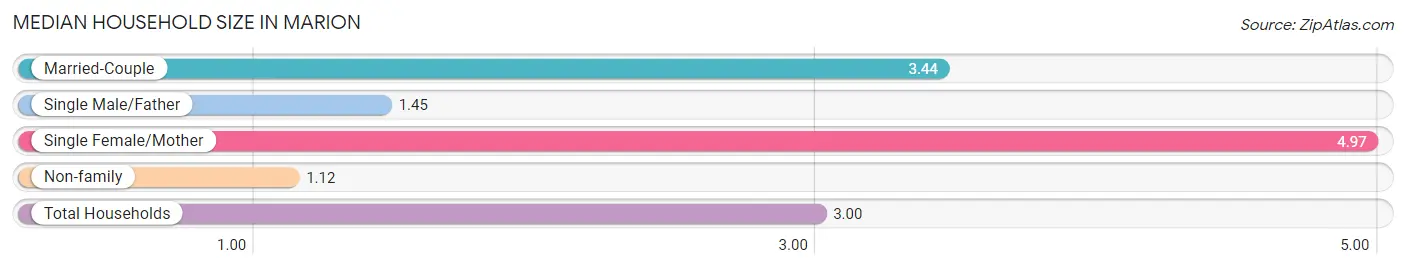
| Household Type | # Households | Household Size |
| Married-Couple | 272 (67.0%) | 3.44 |
| Single Male/Father | 20 (4.9%) | 1.45 |
| Single Female/Mother | 33 (8.1%) | 4.97 |
| Non-family | 81 (20.0%) | 1.12 |
| Total Households | 406 (100.0%) | 3.00 |
Household Size by Marriage Status in Marion
Out of a total of 406 households in Marion, 325 (80.0%) are family households, while 81 (20.0%) are nonfamily households. The most numerous type of family households are 2-person households, comprising 190, and the most common type of nonfamily households are 1-person households, comprising 68.
| Household Size | Family Households | Nonfamily Households |
| 1-Person Households | - | 68 (16.8%) |
| 2-Person Households | 190 (46.8%) | 13 (3.2%) |
| 3-Person Households | 49 (12.1%) | 0 (0.0%) |
| 4-Person Households | 27 (6.7%) | 0 (0.0%) |
| 5-Person Households | 20 (4.9%) | 0 (0.0%) |
| 6-Person Households | 20 (4.9%) | 0 (0.0%) |
| 7+ Person Households | 19 (4.7%) | 0 (0.0%) |
| Total | 325 (80.0%) | 81 (20.0%) |
Female Fertility in Marion
Fertility by Age in Marion
| Age Bracket | Women with Births | Births / 1,000 Women |
| 15 to 19 years | 0 (0.0%) | 0.0 |
| 20 to 34 years | 0 (0.0%) | 0.0 |
| 35 to 50 years | 0 (0.0%) | 0.0 |
| Total | 0 (0.0%) | 0.0 |
Fertility by Age by Marriage Status in Marion
| Age Bracket | Married | Unmarried |
| 15 to 19 years | 0 (0.0%) | 0 (0.0%) |
| 20 to 34 years | 0 (0.0%) | 0 (0.0%) |
| 35 to 50 years | 0 (0.0%) | 0 (0.0%) |
| Total | 0 (0.0%) | 0 (0.0%) |
Fertility by Education in Marion
| Educational Attainment | Women with Births | Births / 1,000 Women |
| Less than High School | 0 (0.0%) | 0.0 |
| High School Diploma | 0 (0.0%) | 0.0 |
| College or Associate's Degree | 0 (0.0%) | 0.0 |
| Bachelor's Degree | 0 (0.0%) | 0.0 |
| Graduate Degree | 0 (0.0%) | 0.0 |
| Total | 0 (0.0%) | 0.0 |
Fertility by Education by Marriage Status in Marion
| Educational Attainment | Married | Unmarried |
| Less than High School | 0 (0.0%) | 0 (0.0%) |
| High School Diploma | 0 (0.0%) | 0 (0.0%) |
| College or Associate's Degree | 0 (0.0%) | 0 (0.0%) |
| Bachelor's Degree | 0 (0.0%) | 0 (0.0%) |
| Graduate Degree | 0 (0.0%) | 0 (0.0%) |
| Total | 0 (0.0%) | 0 (0.0%) |
Employment Characteristics in Marion
Employment by Class of Employer in Marion
Among the 494 employed individuals in Marion, private company employees (263 | 53.2%), self-employed (not incorporated) (101 | 20.4%), and federal government employees (58 | 11.7%) make up the most common classes of employment.
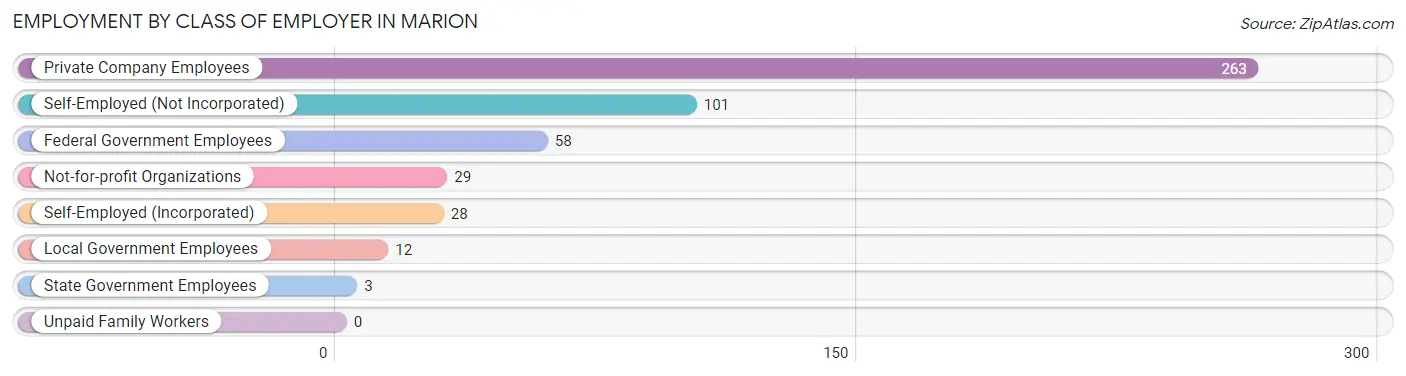
| Employer Class | # Employees | % Employees |
| Private Company Employees | 263 | 53.2% |
| Self-Employed (Incorporated) | 28 | 5.7% |
| Self-Employed (Not Incorporated) | 101 | 20.4% |
| Not-for-profit Organizations | 29 | 5.9% |
| Local Government Employees | 12 | 2.4% |
| State Government Employees | 3 | 0.6% |
| Federal Government Employees | 58 | 11.7% |
| Unpaid Family Workers | 0 | 0.0% |
| Total | 494 | 100.0% |
Employment Status by Age in Marion
According to the labor force statistics for Marion, out of the total population over 16 years of age (931), 67.3% or 627 individuals are in the labor force, with 11.2% or 70 of them unemployed. The age group with the highest labor force participation rate is 20 to 24 years, with 100.0% or 17 individuals in the labor force. Within the labor force, the 16 to 19 years age range has the highest percentage of unemployed individuals, with 52.4% or 55 of them being unemployed.
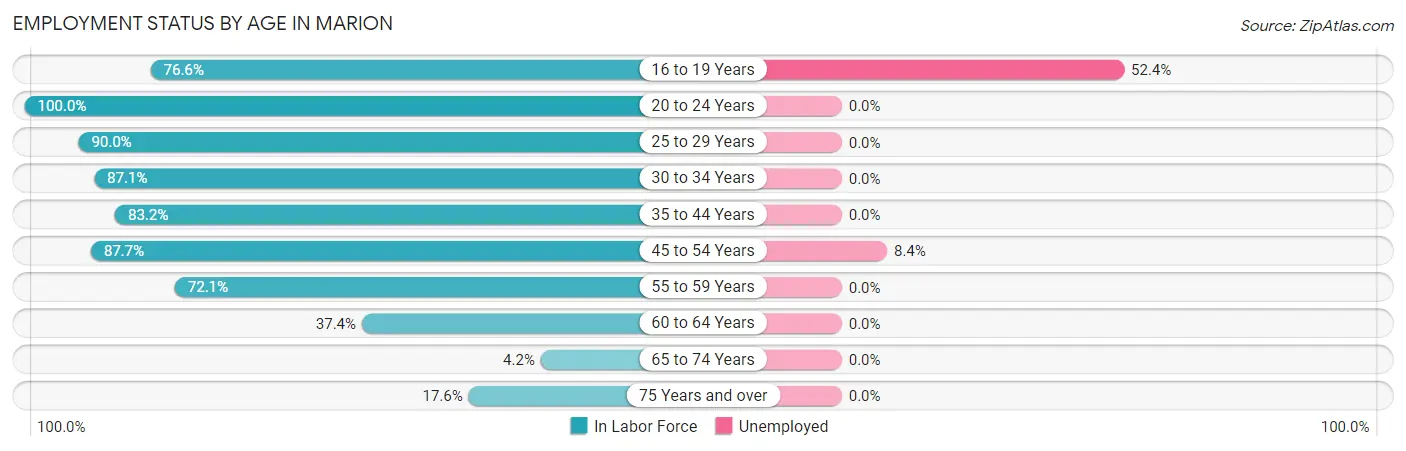
| Age Bracket | In Labor Force | Unemployed |
| 16 to 19 Years | 105 (76.6%) | 55 (52.4%) |
| 20 to 24 Years | 17 (100.0%) | 0 (0.0%) |
| 25 to 29 Years | 54 (90.0%) | 0 (0.0%) |
| 30 to 34 Years | 27 (87.1%) | 0 (0.0%) |
| 35 to 44 Years | 104 (83.2%) | 0 (0.0%) |
| 45 to 54 Years | 179 (87.7%) | 15 (8.4%) |
| 55 to 59 Years | 88 (72.1%) | 0 (0.0%) |
| 60 to 64 Years | 46 (37.4%) | 0 (0.0%) |
| 65 to 74 Years | 4 (4.2%) | 0 (0.0%) |
| 75 Years and over | 3 (17.6%) | 0 (0.0%) |
| Total | 627 (67.3%) | 70 (11.2%) |
Employment Status by Educational Attainment in Marion
According to labor force statistics for Marion, 74.9% of individuals (498) out of the total population between 25 and 64 years of age (665) are in the labor force, with 3.0% or 15 of them being unemployed. The group with the highest labor force participation rate are those with the educational attainment of bachelor's degree or higher, with 86.1% or 62 individuals in the labor force. Within the labor force, individuals with bachelor's degree or higher education have the highest percentage of unemployment, with 6.5% or 4 of them being unemployed.
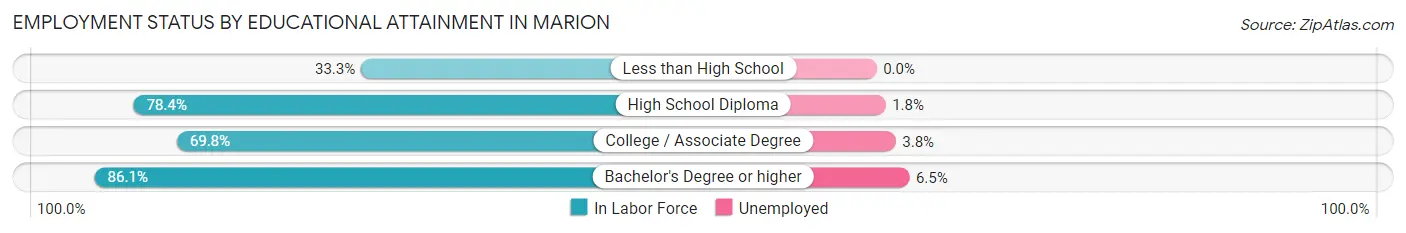
| Educational Attainment | In Labor Force | Unemployed |
| Less than High School | 7 (33.3%) | 0 (0.0%) |
| High School Diploma | 272 (78.4%) | 6 (1.8%) |
| College / Associate Degree | 157 (69.8%) | 9 (3.8%) |
| Bachelor's Degree or higher | 62 (86.1%) | 5 (6.5%) |
| Total | 498 (74.9%) | 20 (3.0%) |
Employment Occupations by Sex in Marion
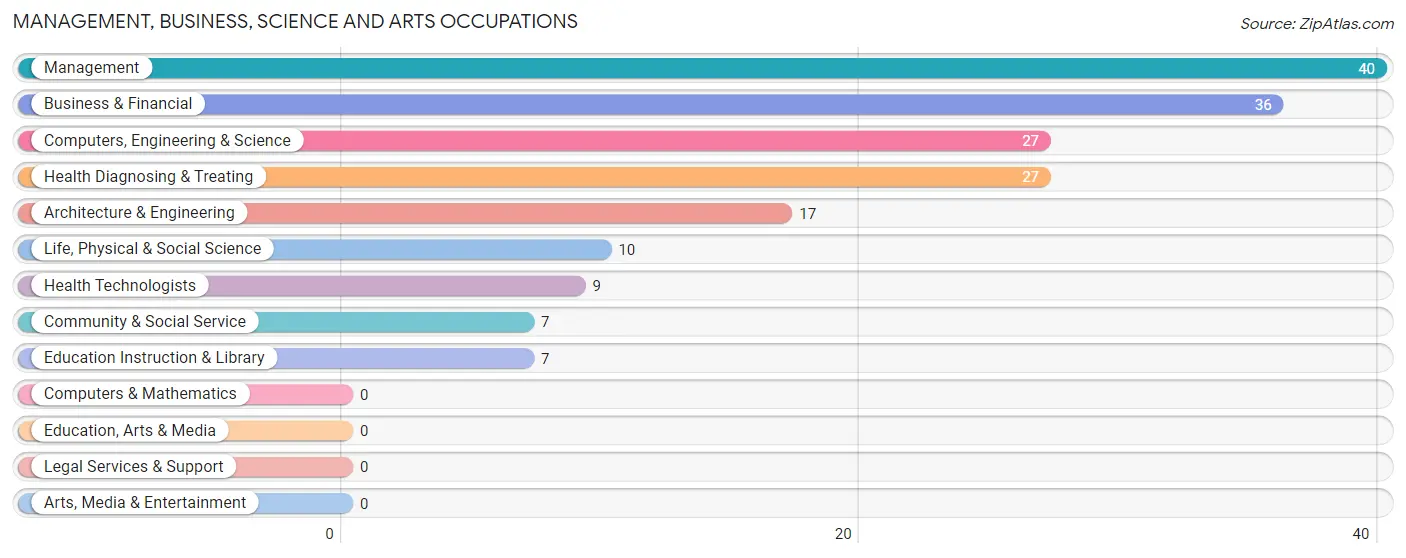
Management, Business, Science and Arts Occupations
The most common Management, Business, Science and Arts occupations in Marion are Management (40 | 7.2%), Business & Financial (36 | 6.5%), Computers, Engineering & Science (27 | 4.9%), Health Diagnosing & Treating (27 | 4.9%), and Architecture & Engineering (17 | 3.0%).
Management, Business, Science and Arts Occupations by Sex
Within the Management, Business, Science and Arts occupations in Marion, the most male-oriented occupations are Computers, Engineering & Science (100.0%), Architecture & Engineering (100.0%), and Life, Physical & Social Science (100.0%), while the most female-oriented occupations are Business & Financial (83.3%), Health Technologists (66.7%), and Management (65.0%).
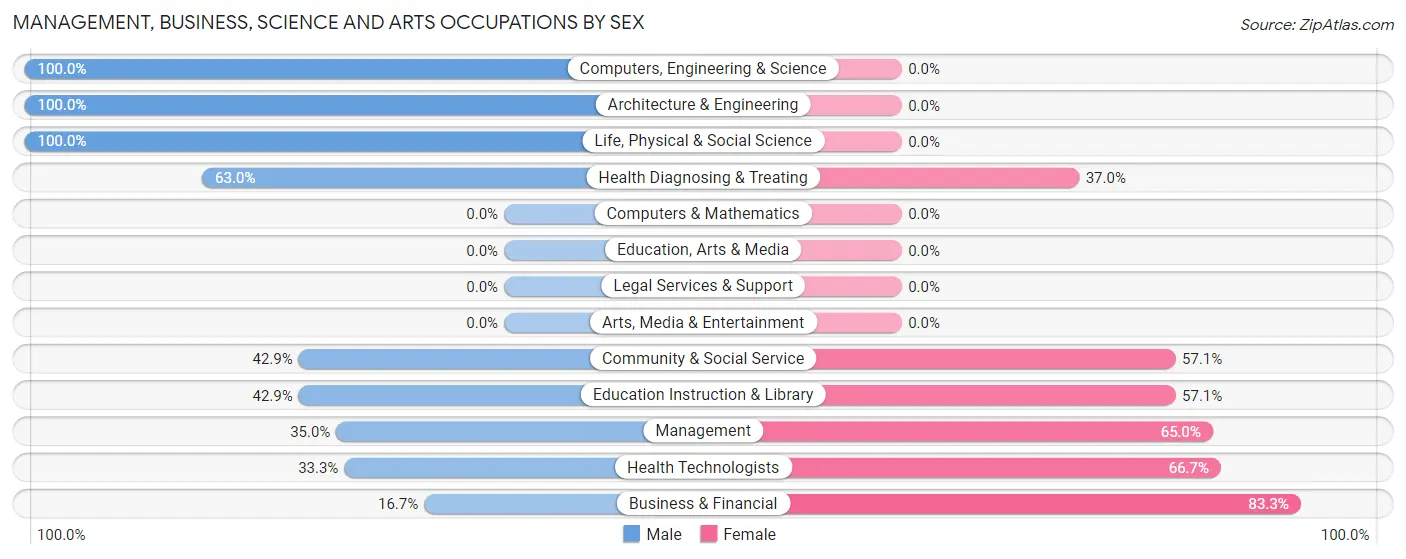
| Occupation | Male | Female |
| Management | 14 (35.0%) | 26 (65.0%) |
| Business & Financial | 6 (16.7%) | 30 (83.3%) |
| Computers, Engineering & Science | 27 (100.0%) | 0 (0.0%) |
| Computers & Mathematics | 0 (0.0%) | 0 (0.0%) |
| Architecture & Engineering | 17 (100.0%) | 0 (0.0%) |
| Life, Physical & Social Science | 10 (100.0%) | 0 (0.0%) |
| Community & Social Service | 3 (42.9%) | 4 (57.1%) |
| Education, Arts & Media | 0 (0.0%) | 0 (0.0%) |
| Legal Services & Support | 0 (0.0%) | 0 (0.0%) |
| Education Instruction & Library | 3 (42.9%) | 4 (57.1%) |
| Arts, Media & Entertainment | 0 (0.0%) | 0 (0.0%) |
| Health Diagnosing & Treating | 17 (63.0%) | 10 (37.0%) |
| Health Technologists | 3 (33.3%) | 6 (66.7%) |
| Total (Category) | 67 (48.9%) | 70 (51.1%) |
| Total (Overall) | 321 (57.6%) | 236 (42.4%) |
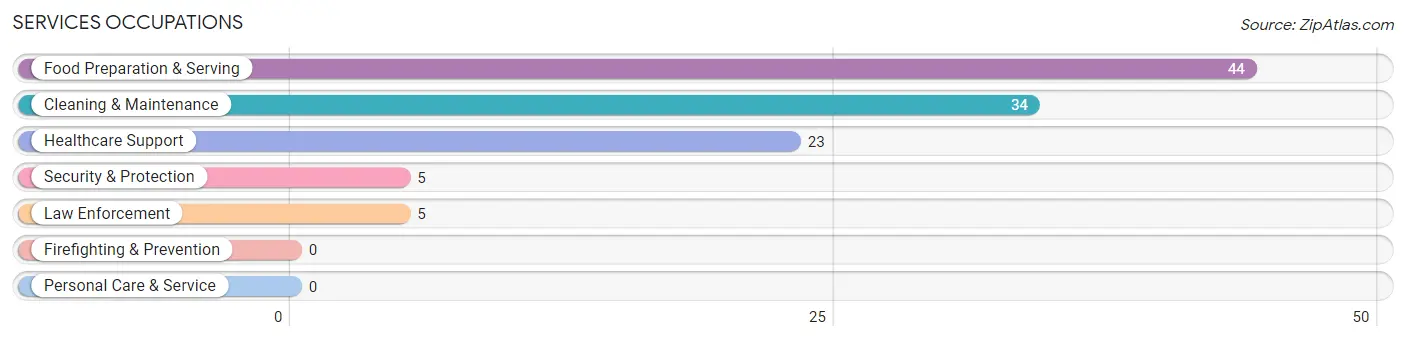
Services Occupations
The most common Services occupations in Marion are Food Preparation & Serving (44 | 7.9%), Cleaning & Maintenance (34 | 6.1%), Healthcare Support (23 | 4.1%), Security & Protection (5 | 0.9%), and Law Enforcement (5 | 0.9%).
Services Occupations by Sex
Within the Services occupations in Marion, the most male-oriented occupations are Cleaning & Maintenance (76.5%), Security & Protection (40.0%), and Law Enforcement (40.0%), while the most female-oriented occupations are Healthcare Support (100.0%), Food Preparation & Serving (79.5%), and Security & Protection (60.0%).
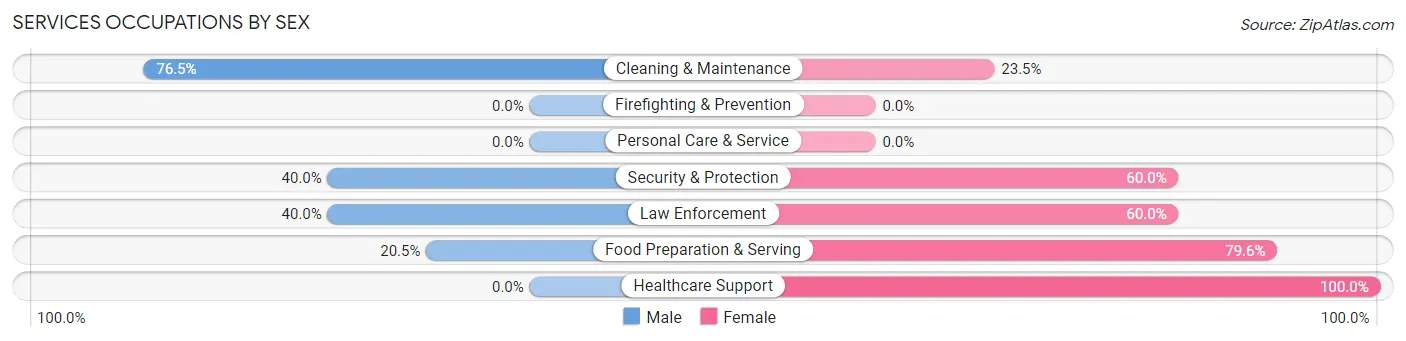
| Occupation | Male | Female |
| Healthcare Support | 0 (0.0%) | 23 (100.0%) |
| Security & Protection | 2 (40.0%) | 3 (60.0%) |
| Firefighting & Prevention | 0 (0.0%) | 0 (0.0%) |
| Law Enforcement | 2 (40.0%) | 3 (60.0%) |
| Food Preparation & Serving | 9 (20.4%) | 35 (79.5%) |
| Cleaning & Maintenance | 26 (76.5%) | 8 (23.5%) |
| Personal Care & Service | 0 (0.0%) | 0 (0.0%) |
| Total (Category) | 37 (34.9%) | 69 (65.1%) |
| Total (Overall) | 321 (57.6%) | 236 (42.4%) |
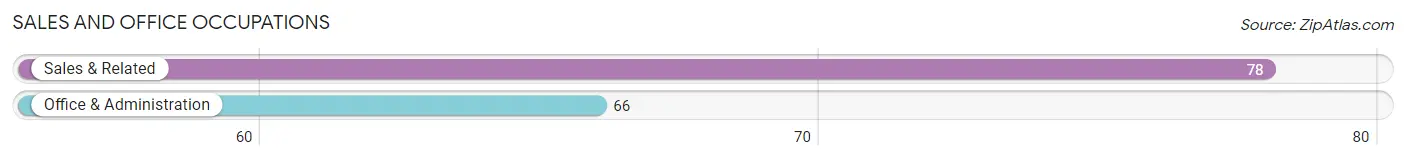
Sales and Office Occupations
The most common Sales and Office occupations in Marion are Sales & Related (78 | 14.0%), and Office & Administration (66 | 11.8%).
Sales and Office Occupations by Sex
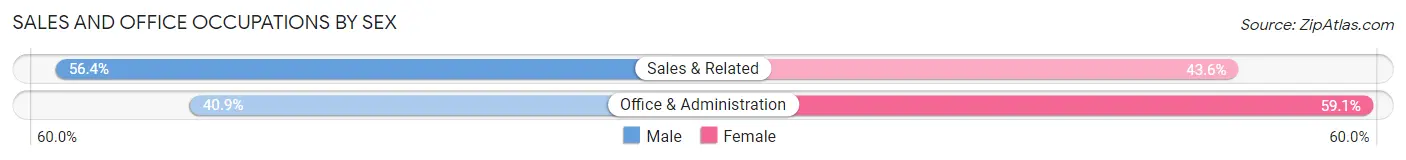
| Occupation | Male | Female |
| Sales & Related | 44 (56.4%) | 34 (43.6%) |
| Office & Administration | 27 (40.9%) | 39 (59.1%) |
| Total (Category) | 71 (49.3%) | 73 (50.7%) |
| Total (Overall) | 321 (57.6%) | 236 (42.4%) |
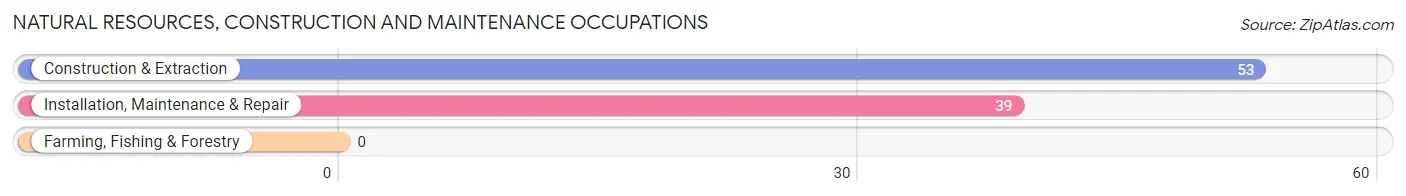
Natural Resources, Construction and Maintenance Occupations
The most common Natural Resources, Construction and Maintenance occupations in Marion are Construction & Extraction (53 | 9.5%), and Installation, Maintenance & Repair (39 | 7.0%).
Natural Resources, Construction and Maintenance Occupations by Sex
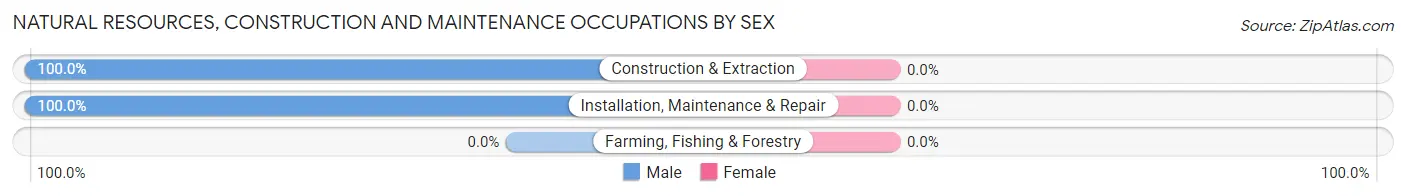
| Occupation | Male | Female |
| Farming, Fishing & Forestry | 0 (0.0%) | 0 (0.0%) |
| Construction & Extraction | 53 (100.0%) | 0 (0.0%) |
| Installation, Maintenance & Repair | 39 (100.0%) | 0 (0.0%) |
| Total (Category) | 92 (100.0%) | 0 (0.0%) |
| Total (Overall) | 321 (57.6%) | 236 (42.4%) |
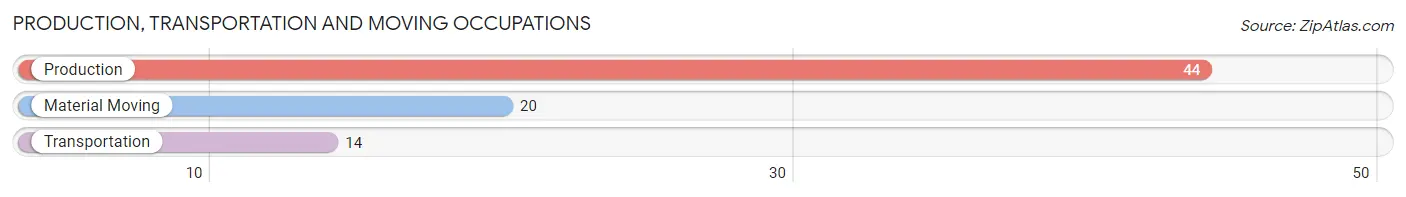
Production, Transportation and Moving Occupations
The most common Production, Transportation and Moving occupations in Marion are Production (44 | 7.9%), Material Moving (20 | 3.6%), and Transportation (14 | 2.5%).
Production, Transportation and Moving Occupations by Sex
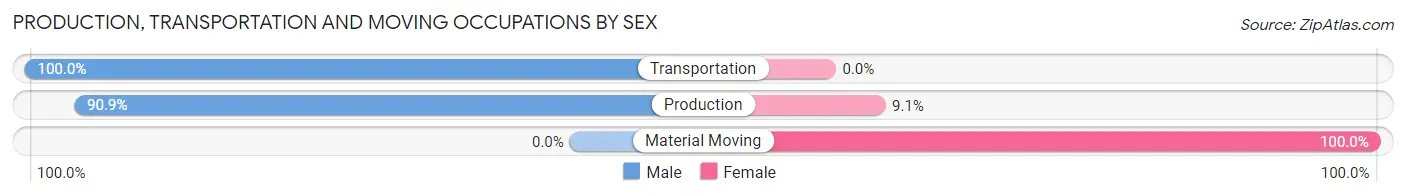
| Occupation | Male | Female |
| Production | 40 (90.9%) | 4 (9.1%) |
| Transportation | 14 (100.0%) | 0 (0.0%) |
| Material Moving | 0 (0.0%) | 20 (100.0%) |
| Total (Category) | 54 (69.2%) | 24 (30.8%) |
| Total (Overall) | 321 (57.6%) | 236 (42.4%) |
Employment Industries by Sex in Marion
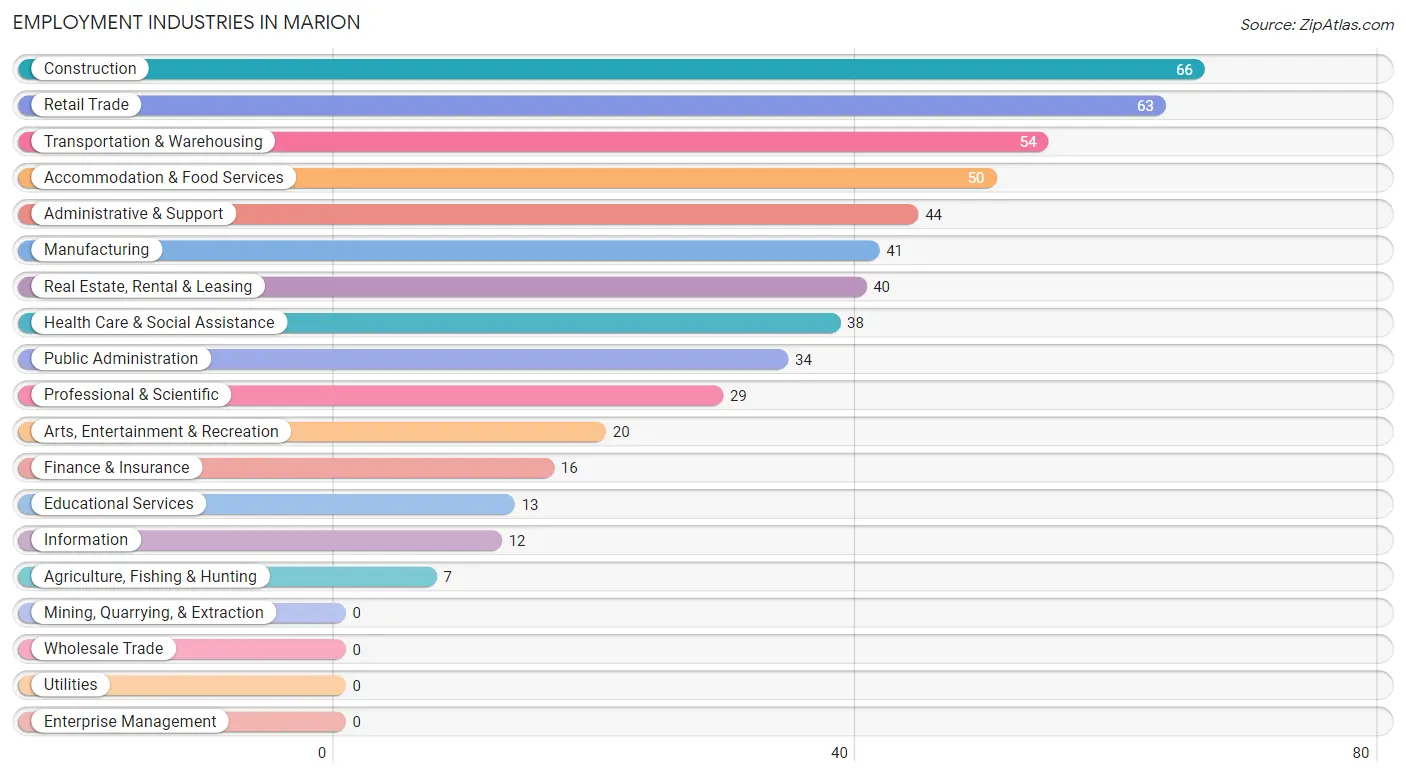
Employment Industries in Marion
The major employment industries in Marion include Construction (66 | 11.8%), Retail Trade (63 | 11.3%), Transportation & Warehousing (54 | 9.7%), Accommodation & Food Services (50 | 9.0%), and Administrative & Support (44 | 7.9%).
Employment Industries by Sex in Marion
The Marion industries that see more men than women are Agriculture, Fishing & Hunting (100.0%), Construction (100.0%), and Real Estate, Rental & Leasing (97.5%), whereas the industries that tend to have a higher number of women are Arts, Entertainment & Recreation (100.0%), Public Administration (94.1%), and Accommodation & Food Services (82.0%).
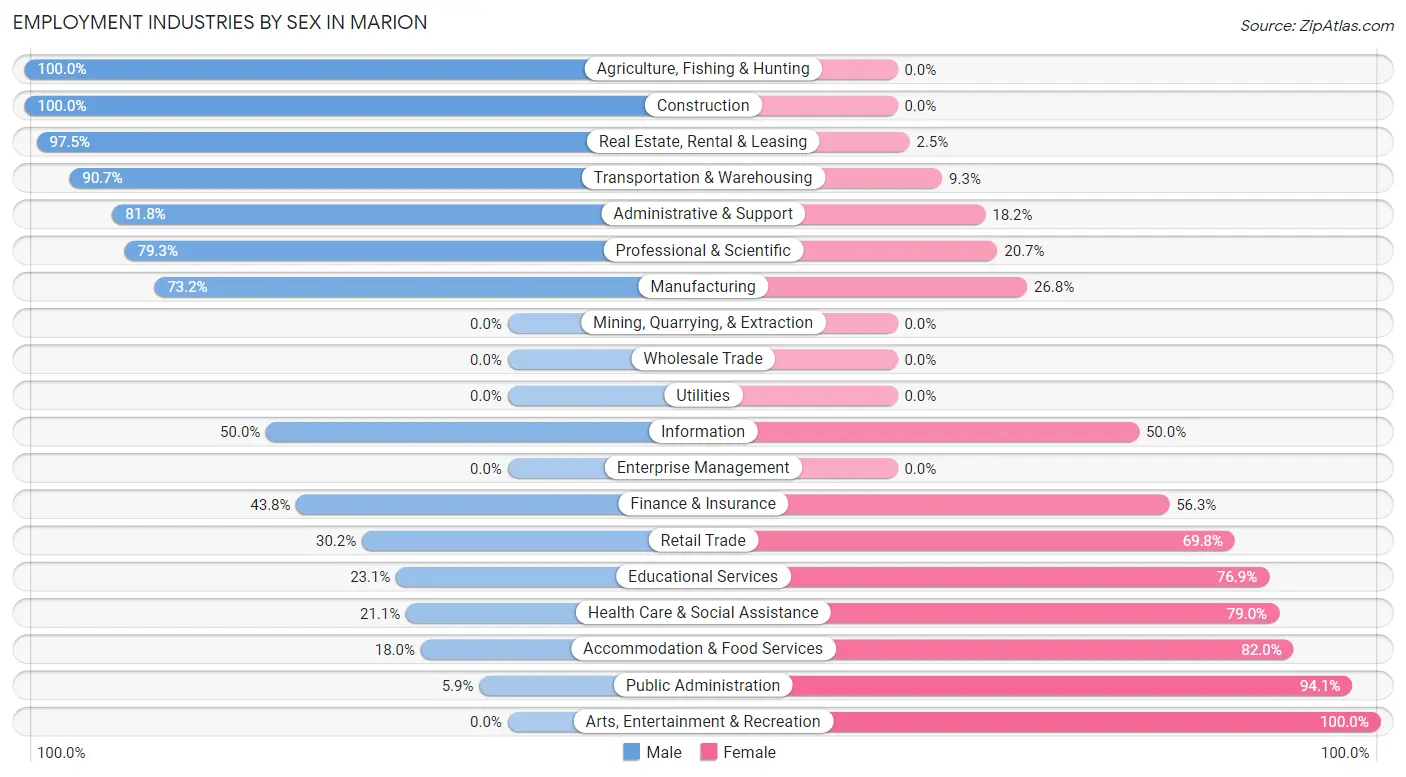
| Industry | Male | Female |
| Agriculture, Fishing & Hunting | 7 (100.0%) | 0 (0.0%) |
| Mining, Quarrying, & Extraction | 0 (0.0%) | 0 (0.0%) |
| Construction | 66 (100.0%) | 0 (0.0%) |
| Manufacturing | 30 (73.2%) | 11 (26.8%) |
| Wholesale Trade | 0 (0.0%) | 0 (0.0%) |
| Retail Trade | 19 (30.2%) | 44 (69.8%) |
| Transportation & Warehousing | 49 (90.7%) | 5 (9.3%) |
| Utilities | 0 (0.0%) | 0 (0.0%) |
| Information | 6 (50.0%) | 6 (50.0%) |
| Finance & Insurance | 7 (43.8%) | 9 (56.2%) |
| Real Estate, Rental & Leasing | 39 (97.5%) | 1 (2.5%) |
| Professional & Scientific | 23 (79.3%) | 6 (20.7%) |
| Enterprise Management | 0 (0.0%) | 0 (0.0%) |
| Administrative & Support | 36 (81.8%) | 8 (18.2%) |
| Educational Services | 3 (23.1%) | 10 (76.9%) |
| Health Care & Social Assistance | 8 (21.0%) | 30 (78.9%) |
| Arts, Entertainment & Recreation | 0 (0.0%) | 20 (100.0%) |
| Accommodation & Food Services | 9 (18.0%) | 41 (82.0%) |
| Public Administration | 2 (5.9%) | 32 (94.1%) |
| Total | 321 (57.6%) | 236 (42.4%) |
Education in Marion
School Enrollment in Marion
The most common levels of schooling among the 329 students in Marion are high school (101 | 30.7%), middle school (92 | 28.0%), and elementary school (86 | 26.1%).
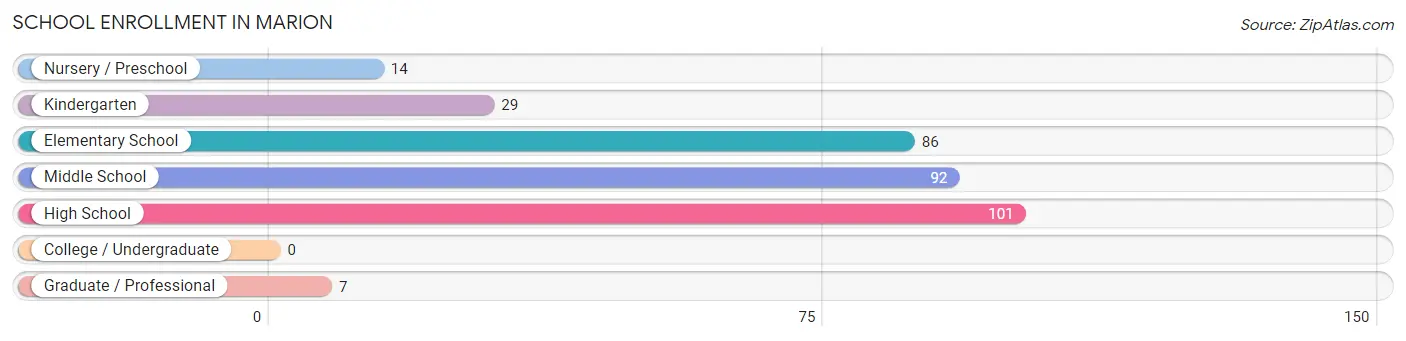
| School Level | # Students | % Students |
| Nursery / Preschool | 14 | 4.3% |
| Kindergarten | 29 | 8.8% |
| Elementary School | 86 | 26.1% |
| Middle School | 92 | 28.0% |
| High School | 101 | 30.7% |
| College / Undergraduate | 0 | 0.0% |
| Graduate / Professional | 7 | 2.1% |
| Total | 329 | 100.0% |
School Enrollment by Age by Funding Source in Marion
Out of a total of 329 students who are enrolled in schools in Marion, 59 (17.9%) attend a private institution, while the remaining 270 (82.1%) are enrolled in public schools. The age group of 3 to 4 year olds has the highest likelihood of being enrolled in private schools, with 25 (100.0% in the age bracket) enrolled. Conversely, the age group of 15 to 17 year olds has the lowest likelihood of being enrolled in a private school, with 102 (100.0% in the age bracket) attending a public institution.
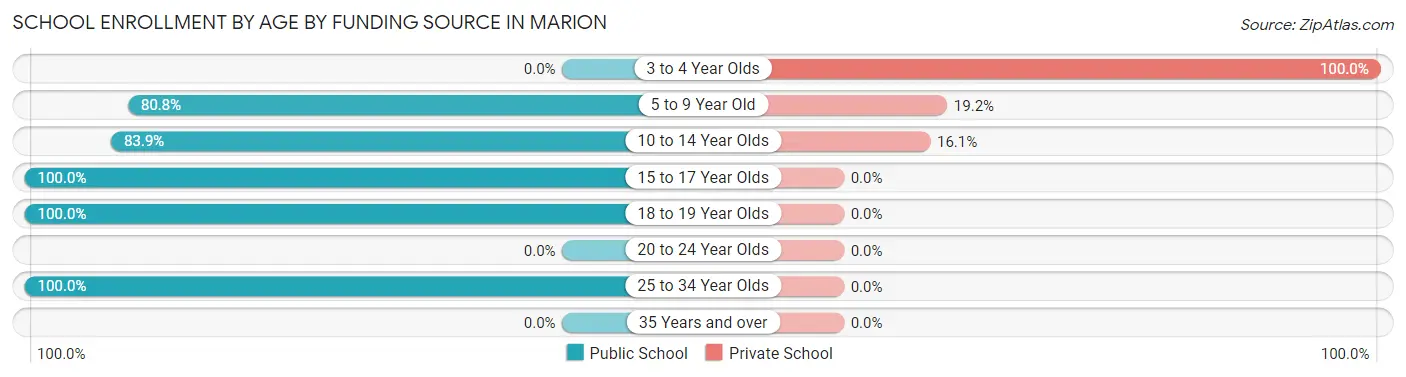
| Age Bracket | Public School | Private School |
| 3 to 4 Year Olds | 0 (0.0%) | 25 (100.0%) |
| 5 to 9 Year Old | 84 (80.8%) | 20 (19.2%) |
| 10 to 14 Year Olds | 73 (83.9%) | 14 (16.1%) |
| 15 to 17 Year Olds | 102 (100.0%) | 0 (0.0%) |
| 18 to 19 Year Olds | 4 (100.0%) | 0 (0.0%) |
| 20 to 24 Year Olds | 0 (0.0%) | 0 (0.0%) |
| 25 to 34 Year Olds | 7 (100.0%) | 0 (0.0%) |
| 35 Years and over | 0 (0.0%) | 0 (0.0%) |
| Total | 270 (82.1%) | 59 (17.9%) |
Educational Attainment by Field of Study in Marion
Communications (18 | 15.5%), business (17 | 14.7%), computers & mathematics (14 | 12.1%), engineering (13 | 11.2%), and literature & languages (13 | 11.2%) are the most common fields of study among 116 individuals in Marion who have obtained a bachelor's degree or higher.
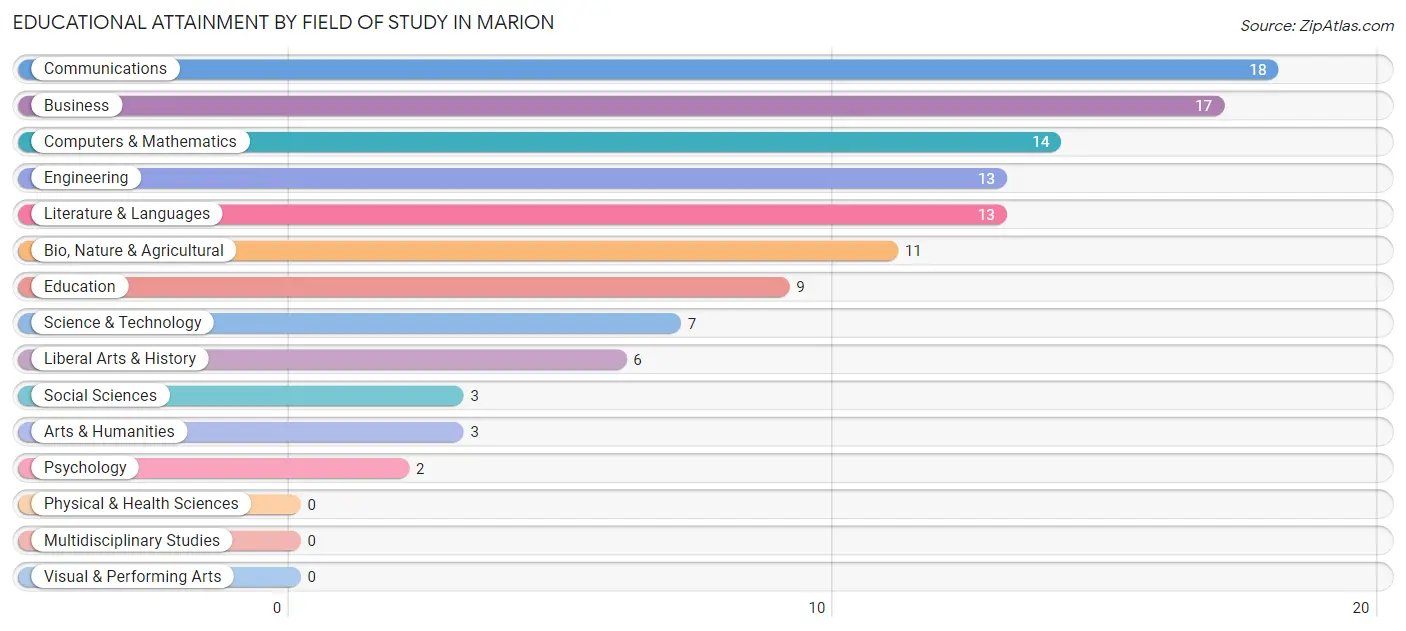
| Field of Study | # Graduates | % Graduates |
| Computers & Mathematics | 14 | 12.1% |
| Bio, Nature & Agricultural | 11 | 9.5% |
| Physical & Health Sciences | 0 | 0.0% |
| Psychology | 2 | 1.7% |
| Social Sciences | 3 | 2.6% |
| Engineering | 13 | 11.2% |
| Multidisciplinary Studies | 0 | 0.0% |
| Science & Technology | 7 | 6.0% |
| Business | 17 | 14.7% |
| Education | 9 | 7.8% |
| Literature & Languages | 13 | 11.2% |
| Liberal Arts & History | 6 | 5.2% |
| Visual & Performing Arts | 0 | 0.0% |
| Communications | 18 | 15.5% |
| Arts & Humanities | 3 | 2.6% |
| Total | 116 | 100.0% |
Transportation & Commute in Marion
Vehicle Availability by Sex in Marion
The most prevalent vehicle ownership categories in Marion are males with 2 vehicles (156, accounting for 54.0%) and females with 2 vehicles (120, making up 76.1%).
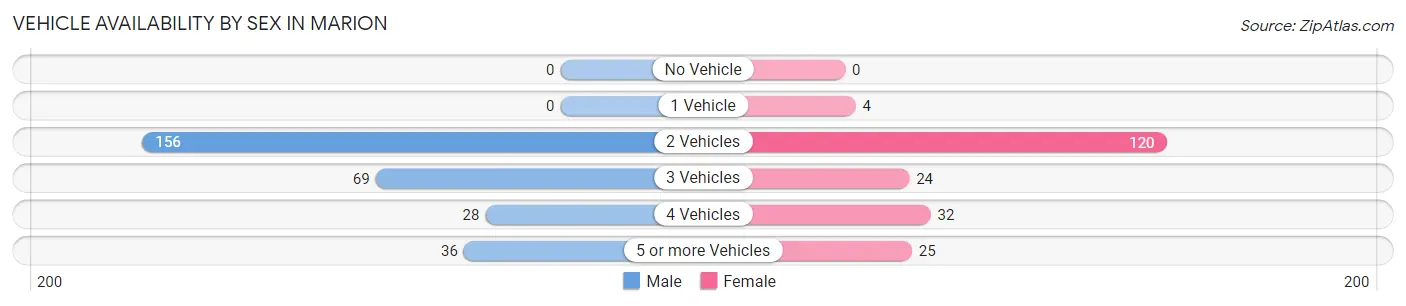
| Vehicles Available | Male | Female |
| No Vehicle | 0 (0.0%) | 0 (0.0%) |
| 1 Vehicle | 0 (0.0%) | 4 (1.9%) |
| 2 Vehicles | 156 (54.0%) | 120 (58.5%) |
| 3 Vehicles | 69 (23.9%) | 24 (11.7%) |
| 4 Vehicles | 28 (9.7%) | 32 (15.6%) |
| 5 or more Vehicles | 36 (12.5%) | 25 (12.2%) |
| Total | 289 (100.0%) | 205 (100.0%) |
Commute Time in Marion
The most frequently occuring commute durations in Marion are 45 to 59 minutes (130 commuters, 33.9%), 30 to 34 minutes (119 commuters, 31.0%), and 40 to 44 minutes (37 commuters, 9.6%).
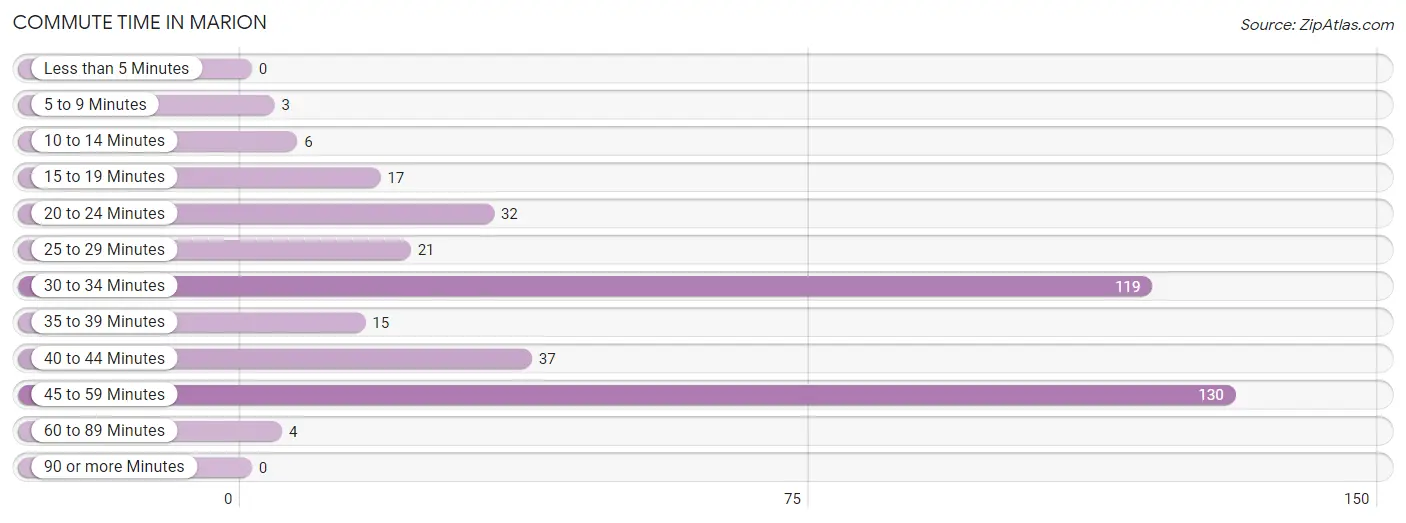
| Commute Time | # Commuters | % Commuters |
| Less than 5 Minutes | 0 | 0.0% |
| 5 to 9 Minutes | 3 | 0.8% |
| 10 to 14 Minutes | 6 | 1.6% |
| 15 to 19 Minutes | 17 | 4.4% |
| 20 to 24 Minutes | 32 | 8.3% |
| 25 to 29 Minutes | 21 | 5.5% |
| 30 to 34 Minutes | 119 | 31.0% |
| 35 to 39 Minutes | 15 | 3.9% |
| 40 to 44 Minutes | 37 | 9.6% |
| 45 to 59 Minutes | 130 | 33.9% |
| 60 to 89 Minutes | 4 | 1.0% |
| 90 or more Minutes | 0 | 0.0% |
Commute Time by Sex in Marion
The most common commute times in Marion are 30 to 34 minutes (75 commuters, 35.9%) for males and 45 to 59 minutes (55 commuters, 31.4%) for females.
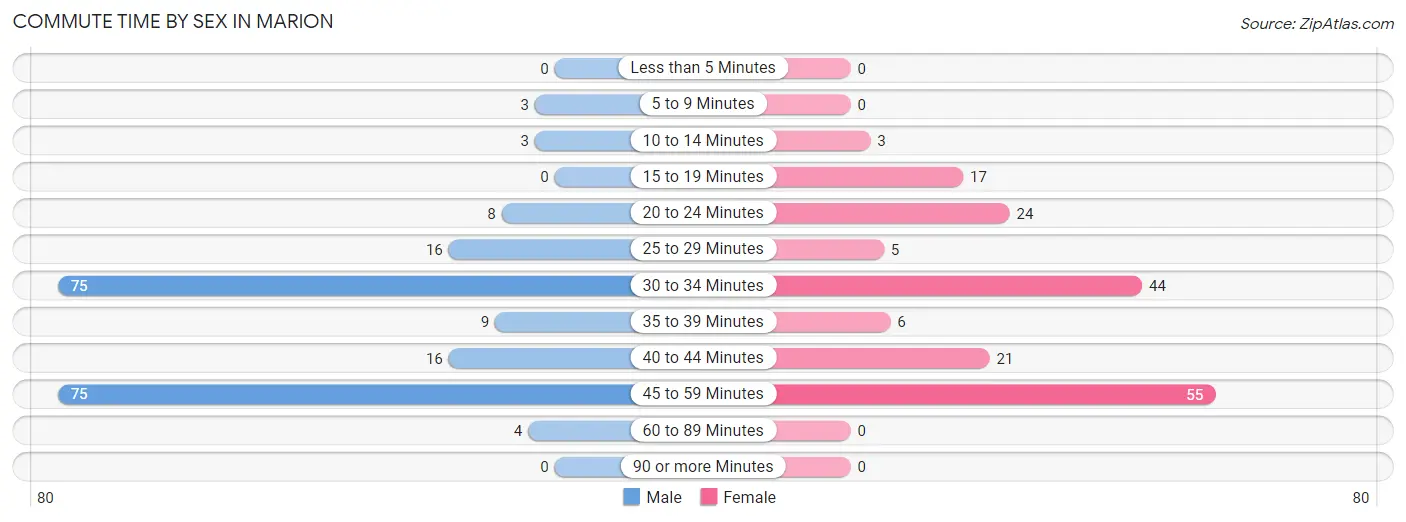
| Commute Time | Male | Female |
| Less than 5 Minutes | 0 (0.0%) | 0 (0.0%) |
| 5 to 9 Minutes | 3 (1.4%) | 0 (0.0%) |
| 10 to 14 Minutes | 3 (1.4%) | 3 (1.7%) |
| 15 to 19 Minutes | 0 (0.0%) | 17 (9.7%) |
| 20 to 24 Minutes | 8 (3.8%) | 24 (13.7%) |
| 25 to 29 Minutes | 16 (7.7%) | 5 (2.9%) |
| 30 to 34 Minutes | 75 (35.9%) | 44 (25.1%) |
| 35 to 39 Minutes | 9 (4.3%) | 6 (3.4%) |
| 40 to 44 Minutes | 16 (7.7%) | 21 (12.0%) |
| 45 to 59 Minutes | 75 (35.9%) | 55 (31.4%) |
| 60 to 89 Minutes | 4 (1.9%) | 0 (0.0%) |
| 90 or more Minutes | 0 (0.0%) | 0 (0.0%) |
Time of Departure to Work by Sex in Marion
The most frequent times of departure to work in Marion are 12:00 PM to 3:59 PM (51, 24.4%) for males and 7:00 AM to 7:29 AM (48, 27.4%) for females.
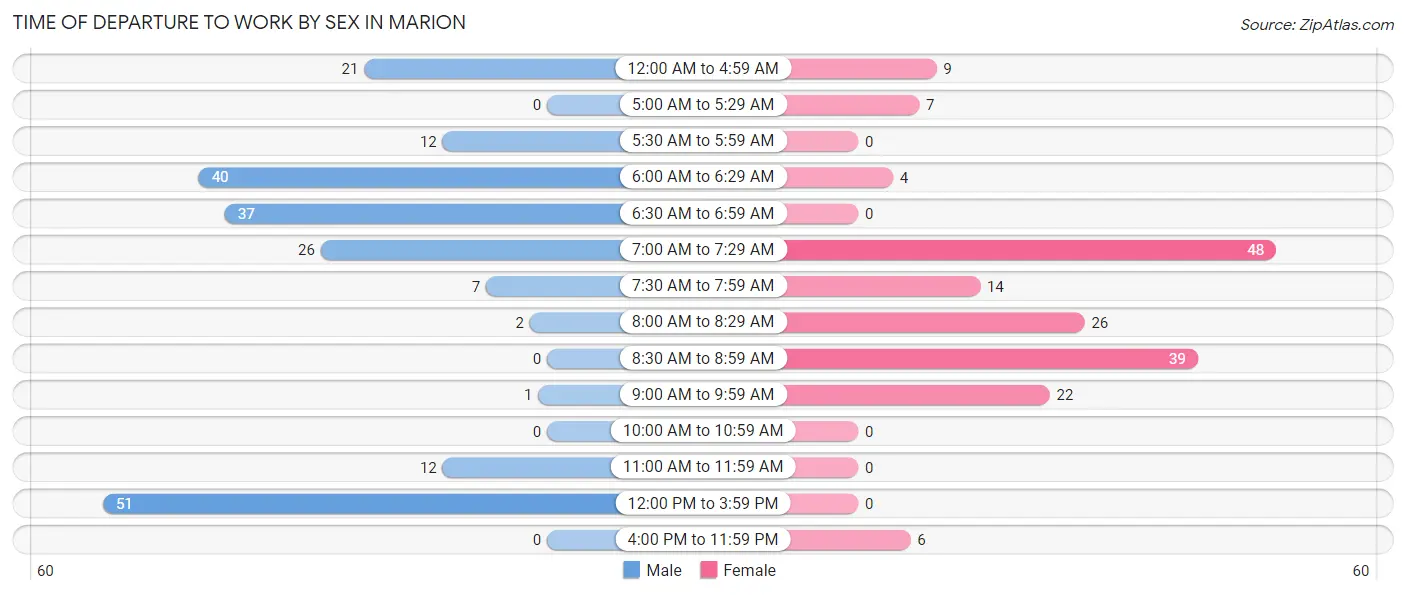
| Time of Departure | Male | Female |
| 12:00 AM to 4:59 AM | 21 (10.1%) | 9 (5.1%) |
| 5:00 AM to 5:29 AM | 0 (0.0%) | 7 (4.0%) |
| 5:30 AM to 5:59 AM | 12 (5.7%) | 0 (0.0%) |
| 6:00 AM to 6:29 AM | 40 (19.1%) | 4 (2.3%) |
| 6:30 AM to 6:59 AM | 37 (17.7%) | 0 (0.0%) |
| 7:00 AM to 7:29 AM | 26 (12.4%) | 48 (27.4%) |
| 7:30 AM to 7:59 AM | 7 (3.4%) | 14 (8.0%) |
| 8:00 AM to 8:29 AM | 2 (1.0%) | 26 (14.9%) |
| 8:30 AM to 8:59 AM | 0 (0.0%) | 39 (22.3%) |
| 9:00 AM to 9:59 AM | 1 (0.5%) | 22 (12.6%) |
| 10:00 AM to 10:59 AM | 0 (0.0%) | 0 (0.0%) |
| 11:00 AM to 11:59 AM | 12 (5.7%) | 0 (0.0%) |
| 12:00 PM to 3:59 PM | 51 (24.4%) | 0 (0.0%) |
| 4:00 PM to 11:59 PM | 0 (0.0%) | 6 (3.4%) |
| Total | 209 (100.0%) | 175 (100.0%) |
Housing Occupancy in Marion
Occupancy by Ownership in Marion
Of the total 406 dwellings in Marion, owner-occupied units account for 380 (93.6%), while renter-occupied units make up 26 (6.4%).
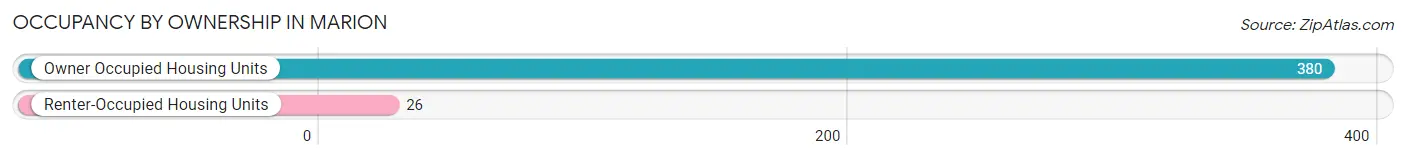
| Occupancy | # Housing Units | % Housing Units |
| Owner Occupied Housing Units | 380 | 93.6% |
| Renter-Occupied Housing Units | 26 | 6.4% |
| Total Occupied Housing Units | 406 | 100.0% |
Occupancy by Household Size in Marion
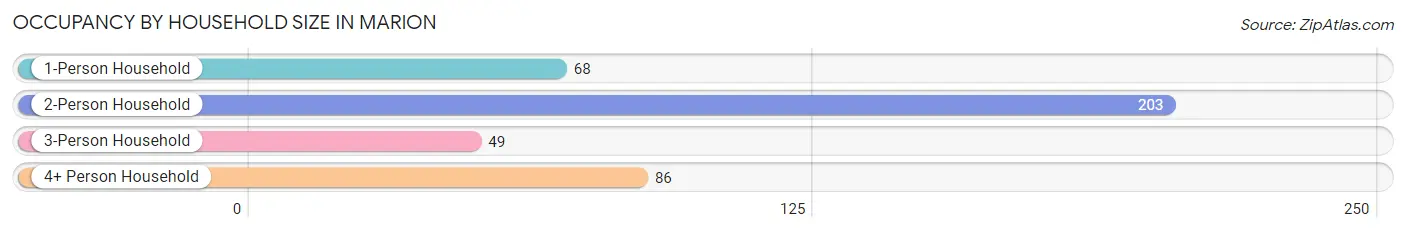
| Household Size | # Housing Units | % Housing Units |
| 1-Person Household | 68 | 16.8% |
| 2-Person Household | 203 | 50.0% |
| 3-Person Household | 49 | 12.1% |
| 4+ Person Household | 86 | 21.2% |
| Total Housing Units | 406 | 100.0% |
Occupancy by Ownership by Household Size in Marion
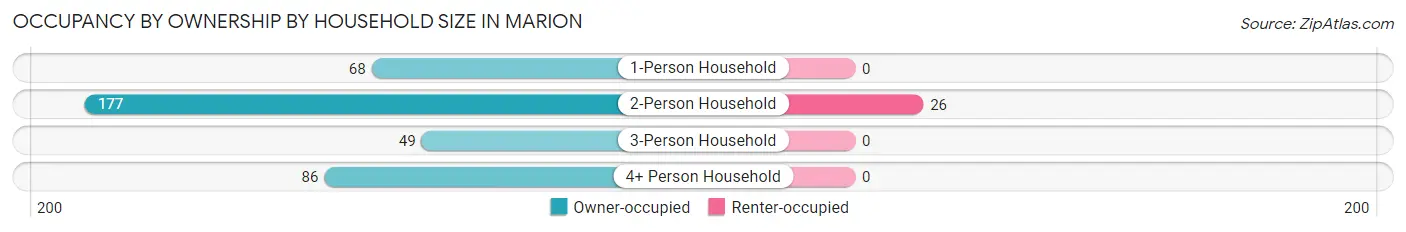
| Household Size | Owner-occupied | Renter-occupied |
| 1-Person Household | 68 (100.0%) | 0 (0.0%) |
| 2-Person Household | 177 (87.2%) | 26 (12.8%) |
| 3-Person Household | 49 (100.0%) | 0 (0.0%) |
| 4+ Person Household | 86 (100.0%) | 0 (0.0%) |
| Total Housing Units | 380 (93.6%) | 26 (6.4%) |
Occupancy by Educational Attainment in Marion
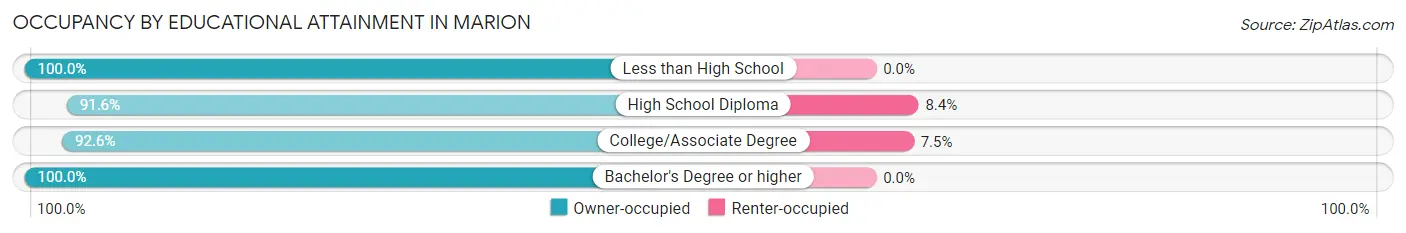
| Household Size | Owner-occupied | Renter-occupied |
| Less than High School | 18 (100.0%) | 0 (0.0%) |
| High School Diploma | 131 (91.6%) | 12 (8.4%) |
| College/Associate Degree | 174 (92.5%) | 14 (7.4%) |
| Bachelor's Degree or higher | 57 (100.0%) | 0 (0.0%) |
Occupancy by Age of Householder in Marion
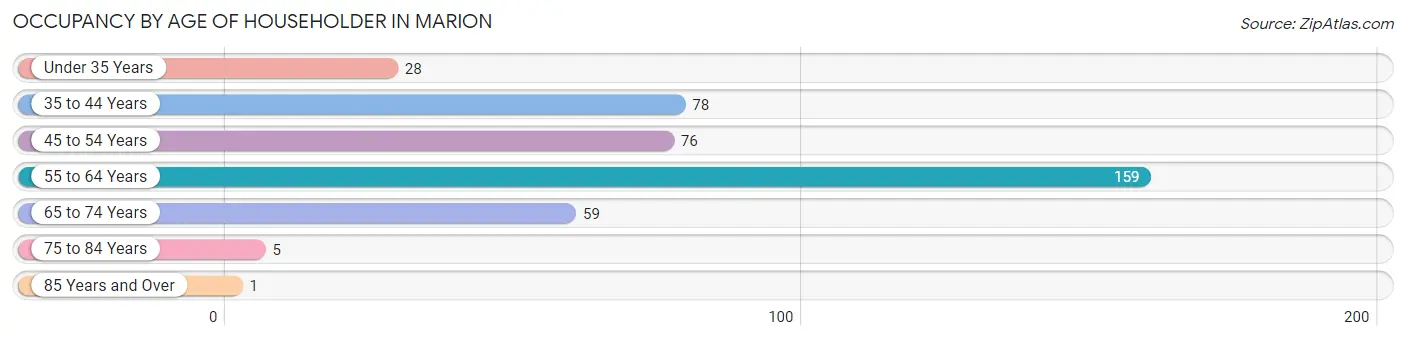
| Age Bracket | # Households | % Households |
| Under 35 Years | 28 | 6.9% |
| 35 to 44 Years | 78 | 19.2% |
| 45 to 54 Years | 76 | 18.7% |
| 55 to 64 Years | 159 | 39.2% |
| 65 to 74 Years | 59 | 14.5% |
| 75 to 84 Years | 5 | 1.2% |
| 85 Years and Over | 1 | 0.3% |
| Total | 406 | 100.0% |
Housing Finances in Marion
Median Income by Occupancy in Marion
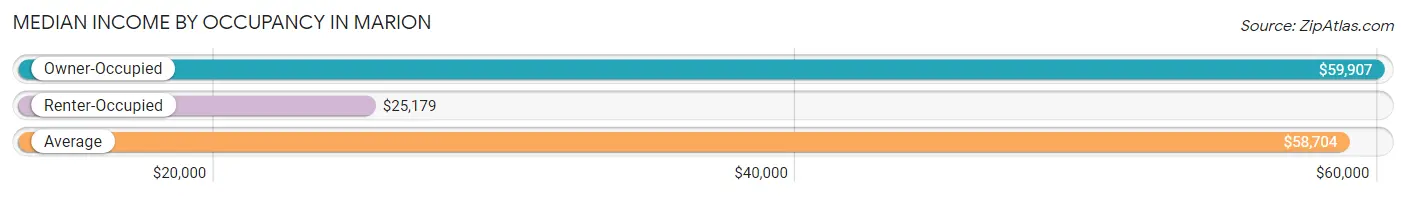
| Occupancy Type | # Households | Median Income |
| Owner-Occupied | 380 (93.6%) | $59,907 |
| Renter-Occupied | 26 (6.4%) | $25,179 |
| Average | 406 (100.0%) | $58,704 |
Occupancy by Householder Income Bracket in Marion
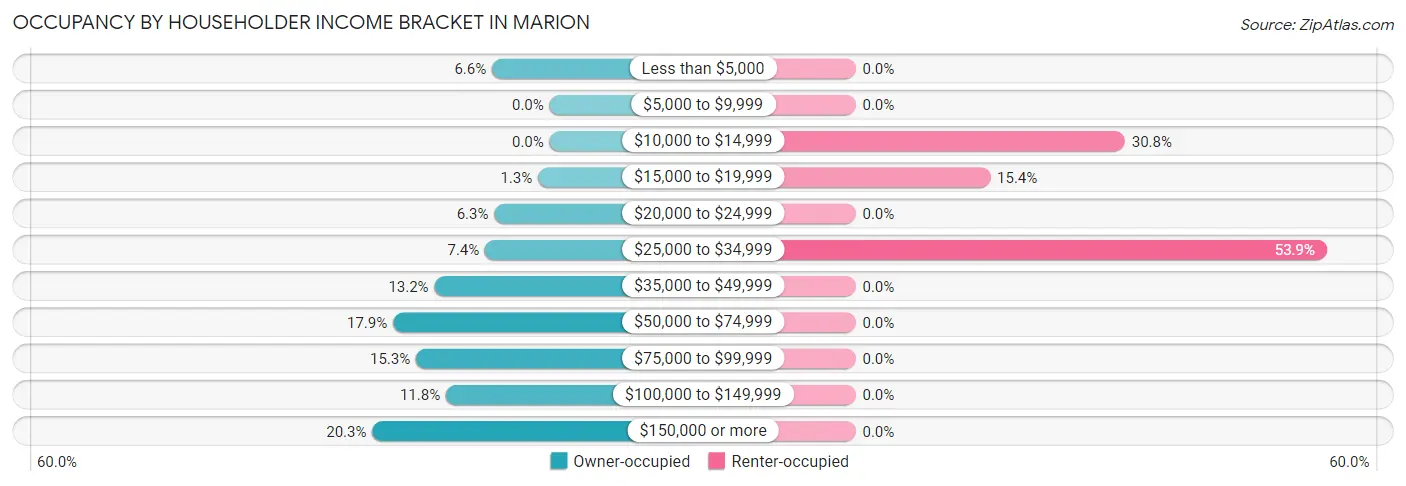
| Income Bracket | Owner-occupied | Renter-occupied |
| Less than $5,000 | 25 (6.6%) | 0 (0.0%) |
| $5,000 to $9,999 | 0 (0.0%) | 0 (0.0%) |
| $10,000 to $14,999 | 0 (0.0%) | 8 (30.8%) |
| $15,000 to $19,999 | 5 (1.3%) | 4 (15.4%) |
| $20,000 to $24,999 | 24 (6.3%) | 0 (0.0%) |
| $25,000 to $34,999 | 28 (7.4%) | 14 (53.8%) |
| $35,000 to $49,999 | 50 (13.2%) | 0 (0.0%) |
| $50,000 to $74,999 | 68 (17.9%) | 0 (0.0%) |
| $75,000 to $99,999 | 58 (15.3%) | 0 (0.0%) |
| $100,000 to $149,999 | 45 (11.8%) | 0 (0.0%) |
| $150,000 or more | 77 (20.3%) | 0 (0.0%) |
| Total | 380 (100.0%) | 26 (100.0%) |
Monthly Housing Cost Tiers in Marion
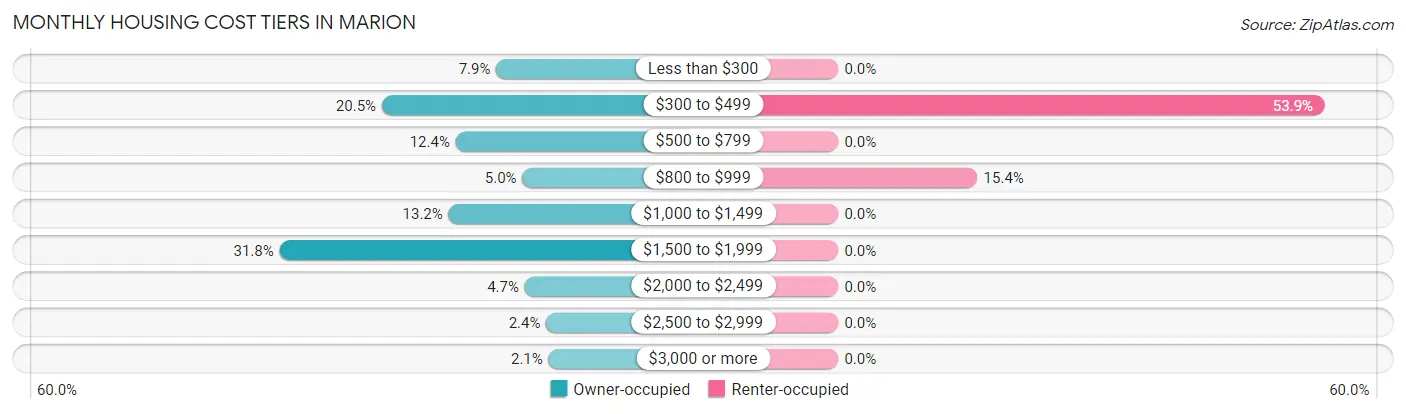
| Monthly Cost | Owner-occupied | Renter-occupied |
| Less than $300 | 30 (7.9%) | 0 (0.0%) |
| $300 to $499 | 78 (20.5%) | 14 (53.8%) |
| $500 to $799 | 47 (12.4%) | 0 (0.0%) |
| $800 to $999 | 19 (5.0%) | 4 (15.4%) |
| $1,000 to $1,499 | 50 (13.2%) | 0 (0.0%) |
| $1,500 to $1,999 | 121 (31.8%) | 0 (0.0%) |
| $2,000 to $2,499 | 18 (4.7%) | 0 (0.0%) |
| $2,500 to $2,999 | 9 (2.4%) | 0 (0.0%) |
| $3,000 or more | 8 (2.1%) | 0 (0.0%) |
| Total | 380 (100.0%) | 26 (100.0%) |
Physical Housing Characteristics in Marion
Housing Structures in Marion
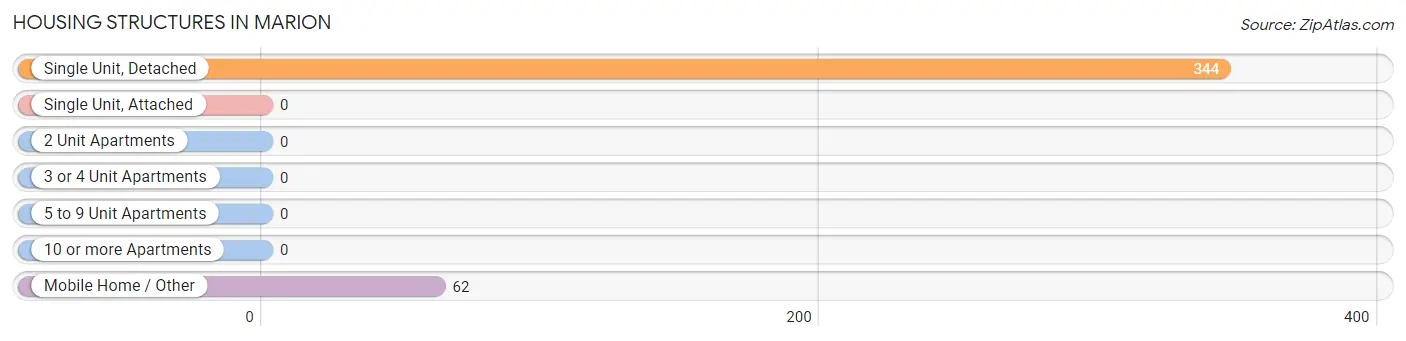
| Structure Type | # Housing Units | % Housing Units |
| Single Unit, Detached | 344 | 84.7% |
| Single Unit, Attached | 0 | 0.0% |
| 2 Unit Apartments | 0 | 0.0% |
| 3 or 4 Unit Apartments | 0 | 0.0% |
| 5 to 9 Unit Apartments | 0 | 0.0% |
| 10 or more Apartments | 0 | 0.0% |
| Mobile Home / Other | 62 | 15.3% |
| Total | 406 | 100.0% |
Housing Structures by Occupancy in Marion
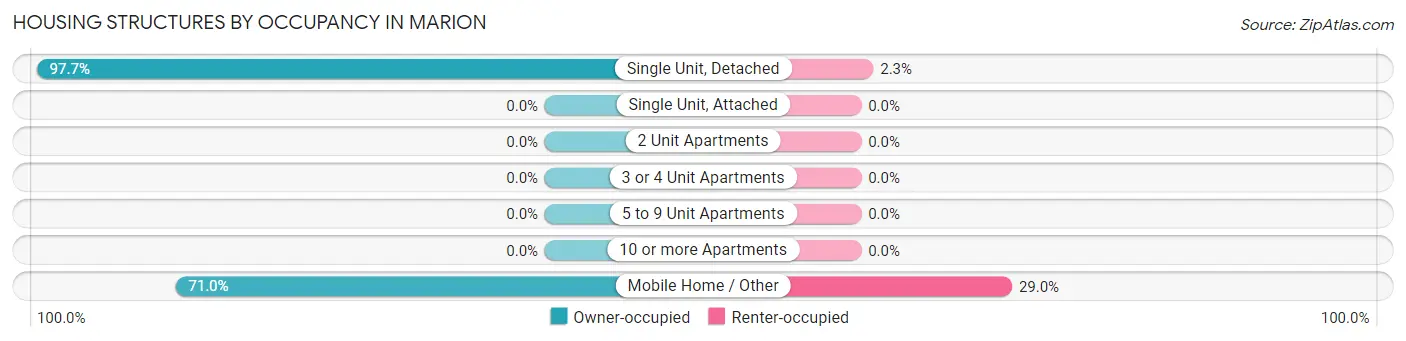
| Structure Type | Owner-occupied | Renter-occupied |
| Single Unit, Detached | 336 (97.7%) | 8 (2.3%) |
| Single Unit, Attached | 0 (0.0%) | 0 (0.0%) |
| 2 Unit Apartments | 0 (0.0%) | 0 (0.0%) |
| 3 or 4 Unit Apartments | 0 (0.0%) | 0 (0.0%) |
| 5 to 9 Unit Apartments | 0 (0.0%) | 0 (0.0%) |
| 10 or more Apartments | 0 (0.0%) | 0 (0.0%) |
| Mobile Home / Other | 44 (71.0%) | 18 (29.0%) |
| Total | 380 (93.6%) | 26 (6.4%) |
Housing Structures by Number of Rooms in Marion
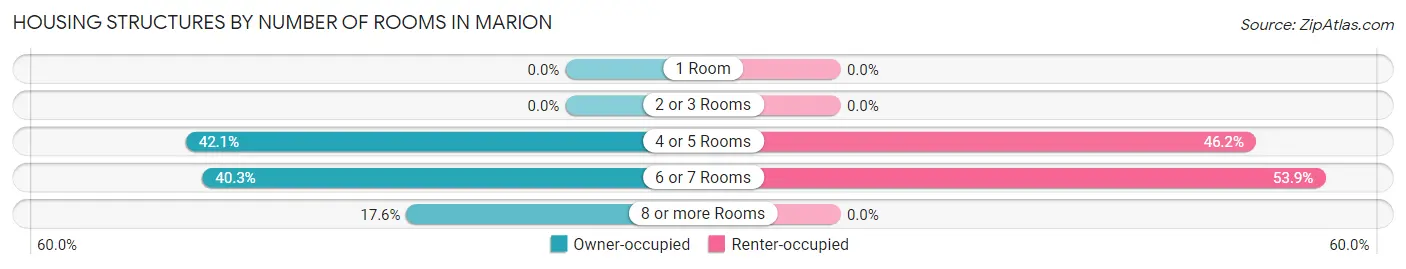
| Number of Rooms | Owner-occupied | Renter-occupied |
| 1 Room | 0 (0.0%) | 0 (0.0%) |
| 2 or 3 Rooms | 0 (0.0%) | 0 (0.0%) |
| 4 or 5 Rooms | 160 (42.1%) | 12 (46.2%) |
| 6 or 7 Rooms | 153 (40.3%) | 14 (53.8%) |
| 8 or more Rooms | 67 (17.6%) | 0 (0.0%) |
| Total | 380 (100.0%) | 26 (100.0%) |
Housing Structure by Heating Type in Marion
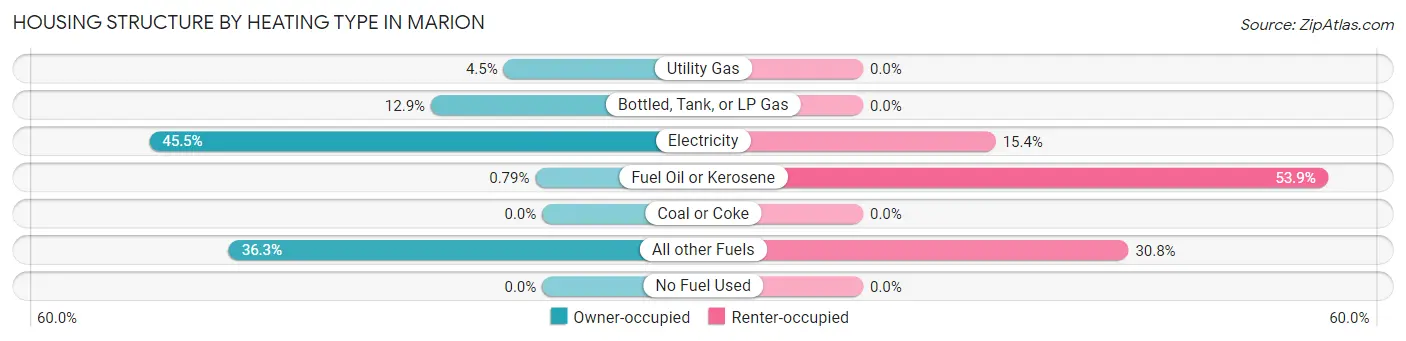
| Heating Type | Owner-occupied | Renter-occupied |
| Utility Gas | 17 (4.5%) | 0 (0.0%) |
| Bottled, Tank, or LP Gas | 49 (12.9%) | 0 (0.0%) |
| Electricity | 173 (45.5%) | 4 (15.4%) |
| Fuel Oil or Kerosene | 3 (0.8%) | 14 (53.8%) |
| Coal or Coke | 0 (0.0%) | 0 (0.0%) |
| All other Fuels | 138 (36.3%) | 8 (30.8%) |
| No Fuel Used | 0 (0.0%) | 0 (0.0%) |
| Total | 380 (100.0%) | 26 (100.0%) |
Household Vehicle Usage in Marion
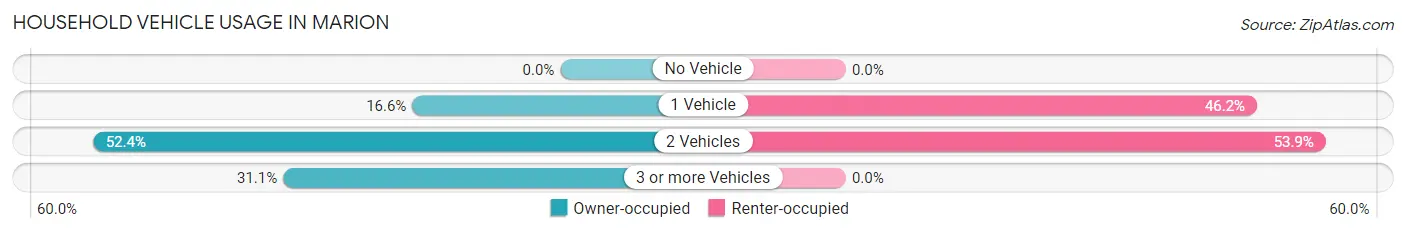
| Vehicles per Household | Owner-occupied | Renter-occupied |
| No Vehicle | 0 (0.0%) | 0 (0.0%) |
| 1 Vehicle | 63 (16.6%) | 12 (46.2%) |
| 2 Vehicles | 199 (52.4%) | 14 (53.8%) |
| 3 or more Vehicles | 118 (31.0%) | 0 (0.0%) |
| Total | 380 (100.0%) | 26 (100.0%) |
Real Estate & Mortgages in Marion
Real Estate and Mortgage Overview in Marion
| Characteristic | Without Mortgage | With Mortgage |
| Housing Units | 137 | 243 |
| Median Property Value | $342,500 | $333,900 |
| Median Household Income | $50,438 | $75 |
| Monthly Housing Costs | $412 | $8 |
| Real Estate Taxes | $2,490 | $0 |
Property Value by Mortgage Status in Marion
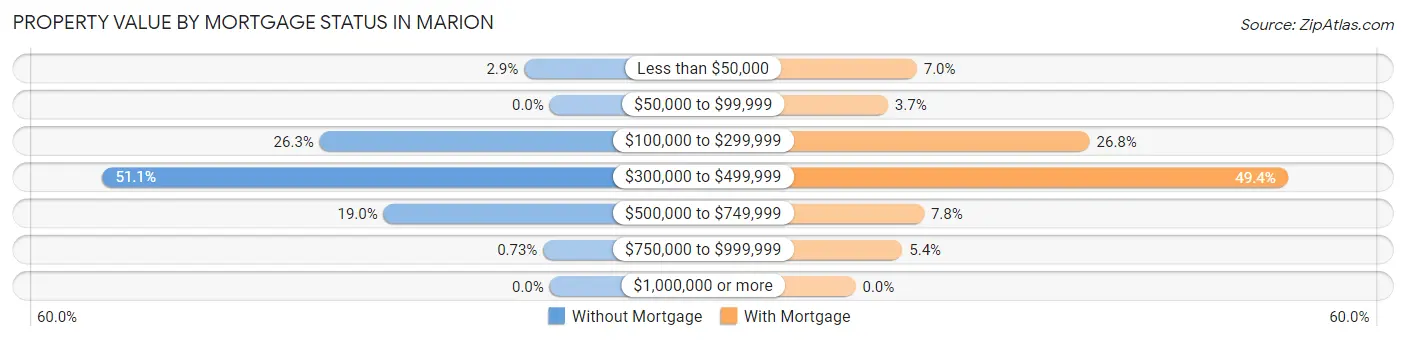
| Property Value | Without Mortgage | With Mortgage |
| Less than $50,000 | 4 (2.9%) | 17 (7.0%) |
| $50,000 to $99,999 | 0 (0.0%) | 9 (3.7%) |
| $100,000 to $299,999 | 36 (26.3%) | 65 (26.8%) |
| $300,000 to $499,999 | 70 (51.1%) | 120 (49.4%) |
| $500,000 to $749,999 | 26 (19.0%) | 19 (7.8%) |
| $750,000 to $999,999 | 1 (0.7%) | 13 (5.3%) |
| $1,000,000 or more | 0 (0.0%) | 0 (0.0%) |
| Total | 137 (100.0%) | 243 (100.0%) |
Household Income by Mortgage Status in Marion
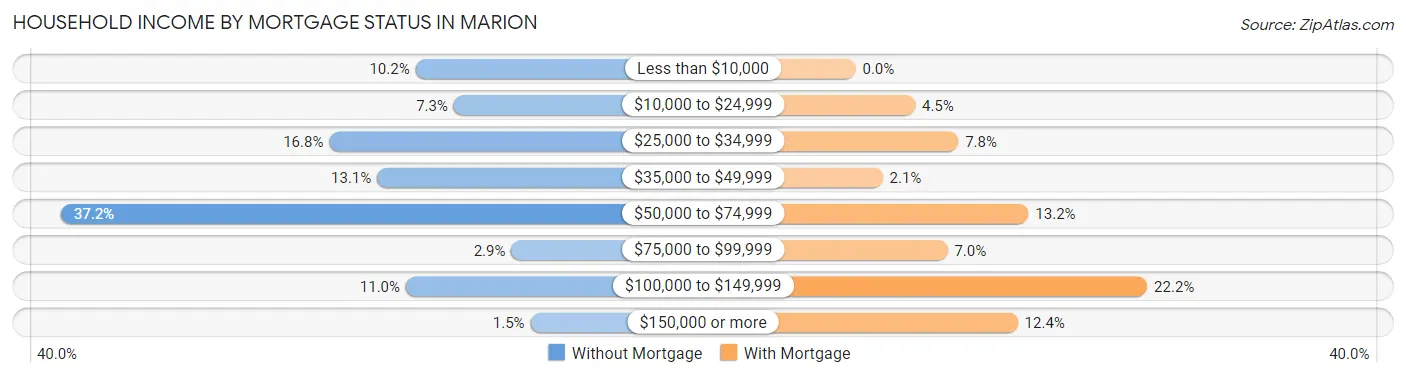
| Household Income | Without Mortgage | With Mortgage |
| Less than $10,000 | 14 (10.2%) | 0 (0.0%) |
| $10,000 to $24,999 | 10 (7.3%) | 11 (4.5%) |
| $25,000 to $34,999 | 23 (16.8%) | 19 (7.8%) |
| $35,000 to $49,999 | 18 (13.1%) | 5 (2.1%) |
| $50,000 to $74,999 | 51 (37.2%) | 32 (13.2%) |
| $75,000 to $99,999 | 4 (2.9%) | 17 (7.0%) |
| $100,000 to $149,999 | 15 (11.0%) | 54 (22.2%) |
| $150,000 or more | 2 (1.5%) | 30 (12.3%) |
| Total | 137 (100.0%) | 243 (100.0%) |
Property Value to Household Income Ratio in Marion
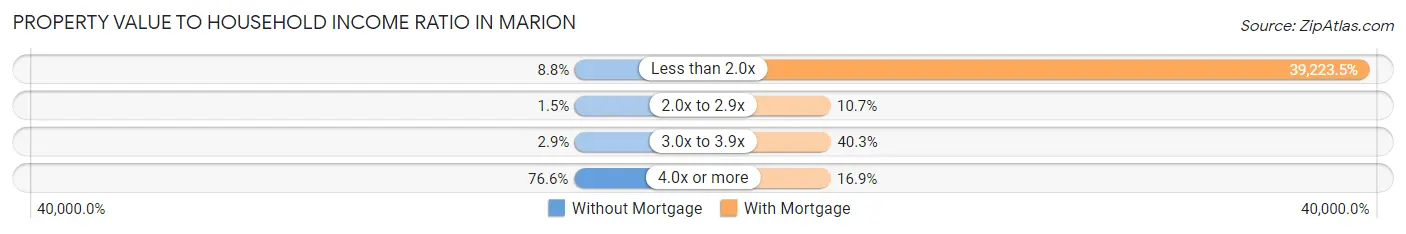
| Value-to-Income Ratio | Without Mortgage | With Mortgage |
| Less than 2.0x | 12 (8.8%) | 95,313 (39,223.5%) |
| 2.0x to 2.9x | 2 (1.5%) | 26 (10.7%) |
| 3.0x to 3.9x | 4 (2.9%) | 98 (40.3%) |
| 4.0x or more | 105 (76.6%) | 41 (16.9%) |
| Total | 137 (100.0%) | 243 (100.0%) |
Real Estate Taxes by Mortgage Status in Marion
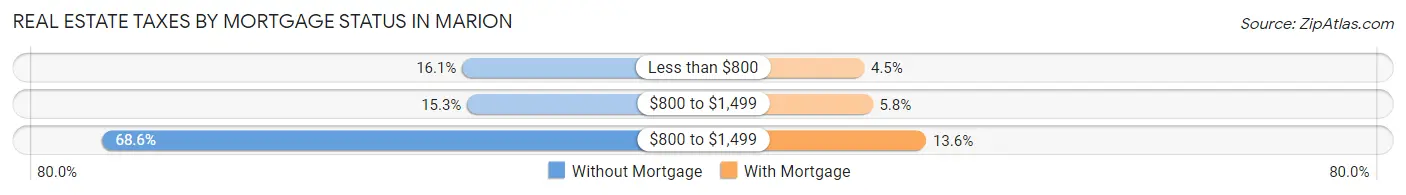
| Property Taxes | Without Mortgage | With Mortgage |
| Less than $800 | 22 (16.1%) | 11 (4.5%) |
| $800 to $1,499 | 21 (15.3%) | 14 (5.8%) |
| $800 to $1,499 | 94 (68.6%) | 33 (13.6%) |
| Total | 137 (100.0%) | 243 (100.0%) |
Health & Disability in Marion
Health Insurance Coverage by Age in Marion
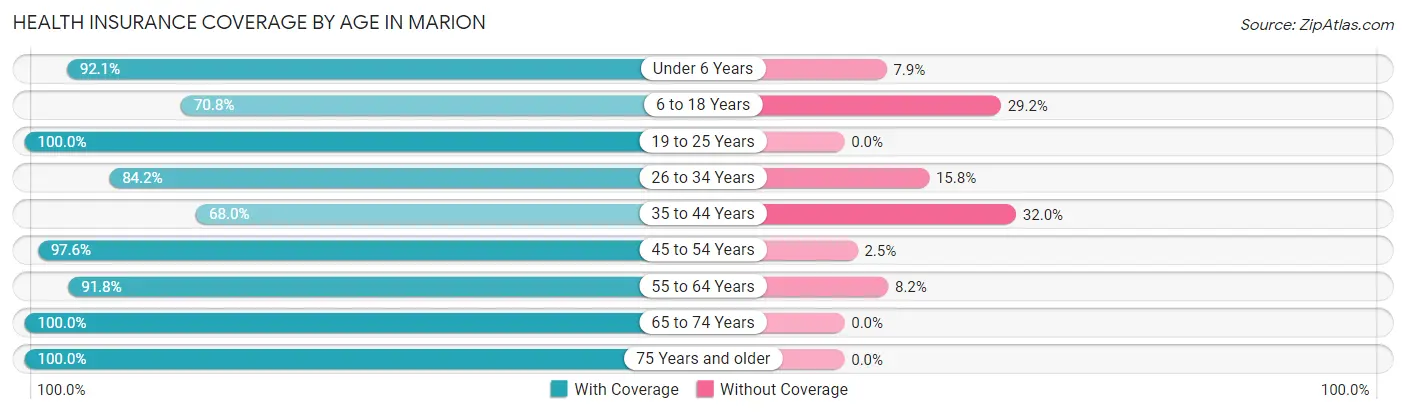
| Age Bracket | With Coverage | Without Coverage |
| Under 6 Years | 82 (92.1%) | 7 (7.9%) |
| 6 to 18 Years | 238 (70.8%) | 98 (29.2%) |
| 19 to 25 Years | 32 (100.0%) | 0 (0.0%) |
| 26 to 34 Years | 64 (84.2%) | 12 (15.8%) |
| 35 to 44 Years | 85 (68.0%) | 40 (32.0%) |
| 45 to 54 Years | 199 (97.6%) | 5 (2.5%) |
| 55 to 64 Years | 225 (91.8%) | 20 (8.2%) |
| 65 to 74 Years | 95 (100.0%) | 0 (0.0%) |
| 75 Years and older | 17 (100.0%) | 0 (0.0%) |
| Total | 1,037 (85.1%) | 182 (14.9%) |
Health Insurance Coverage by Citizenship Status in Marion
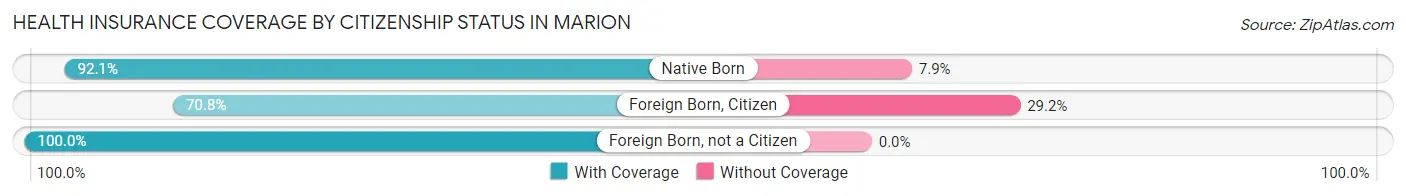
| Citizenship Status | With Coverage | Without Coverage |
| Native Born | 82 (92.1%) | 7 (7.9%) |
| Foreign Born, Citizen | 238 (70.8%) | 98 (29.2%) |
| Foreign Born, not a Citizen | 32 (100.0%) | 0 (0.0%) |
Health Insurance Coverage by Household Income in Marion
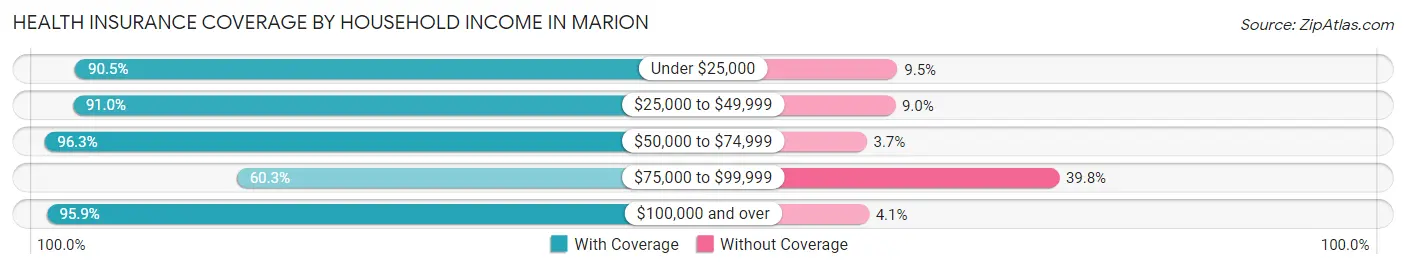
| Household Income | With Coverage | Without Coverage |
| Under $25,000 | 86 (90.5%) | 9 (9.5%) |
| $25,000 to $49,999 | 232 (91.0%) | 23 (9.0%) |
| $50,000 to $74,999 | 104 (96.3%) | 4 (3.7%) |
| $75,000 to $99,999 | 194 (60.3%) | 128 (39.8%) |
| $100,000 and over | 421 (95.9%) | 18 (4.1%) |
Public vs Private Health Insurance Coverage by Age in Marion
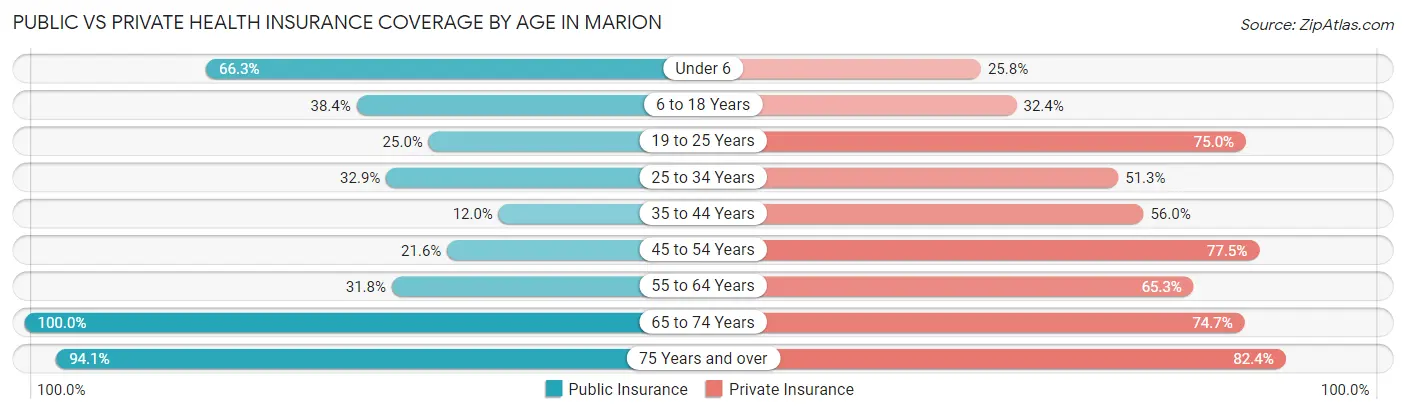
| Age Bracket | Public Insurance | Private Insurance |
| Under 6 | 59 (66.3%) | 23 (25.8%) |
| 6 to 18 Years | 129 (38.4%) | 109 (32.4%) |
| 19 to 25 Years | 8 (25.0%) | 24 (75.0%) |
| 25 to 34 Years | 25 (32.9%) | 39 (51.3%) |
| 35 to 44 Years | 15 (12.0%) | 70 (56.0%) |
| 45 to 54 Years | 44 (21.6%) | 158 (77.4%) |
| 55 to 64 Years | 78 (31.8%) | 160 (65.3%) |
| 65 to 74 Years | 95 (100.0%) | 71 (74.7%) |
| 75 Years and over | 16 (94.1%) | 14 (82.4%) |
| Total | 469 (38.5%) | 668 (54.8%) |
Disability Status by Sex by Age in Marion
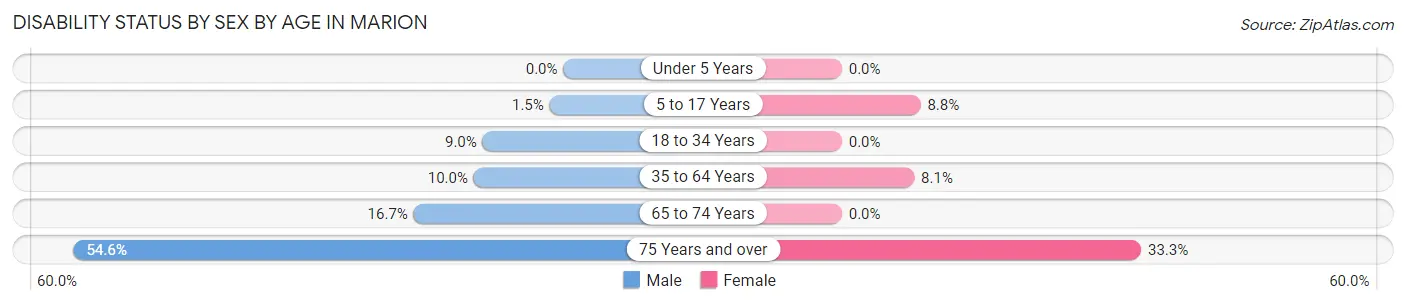
| Age Bracket | Male | Female |
| Under 5 Years | 0 (0.0%) | 0 (0.0%) |
| 5 to 17 Years | 3 (1.5%) | 12 (8.8%) |
| 18 to 34 Years | 8 (9.0%) | 0 (0.0%) |
| 35 to 64 Years | 30 (10.0%) | 22 (8.1%) |
| 65 to 74 Years | 7 (16.7%) | 0 (0.0%) |
| 75 Years and over | 6 (54.5%) | 2 (33.3%) |
Disability Class by Sex by Age in Marion
Disability Class: Hearing Difficulty
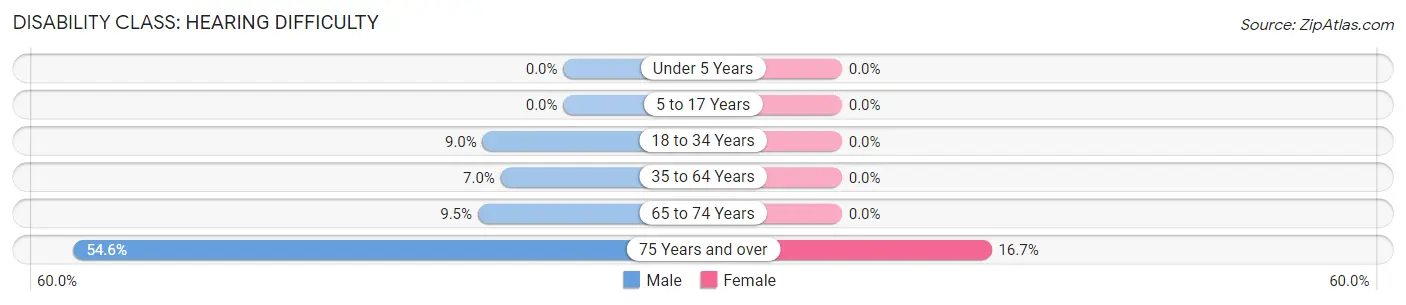
| Age Bracket | Male | Female |
| Under 5 Years | 0 (0.0%) | 0 (0.0%) |
| 5 to 17 Years | 0 (0.0%) | 0 (0.0%) |
| 18 to 34 Years | 8 (9.0%) | 0 (0.0%) |
| 35 to 64 Years | 21 (7.0%) | 0 (0.0%) |
| 65 to 74 Years | 4 (9.5%) | 0 (0.0%) |
| 75 Years and over | 6 (54.5%) | 1 (16.7%) |
Disability Class: Vision Difficulty
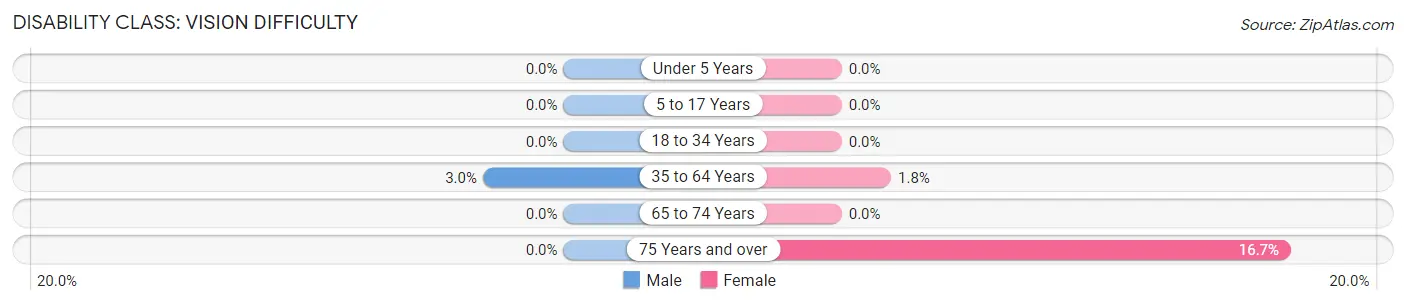
| Age Bracket | Male | Female |
| Under 5 Years | 0 (0.0%) | 0 (0.0%) |
| 5 to 17 Years | 0 (0.0%) | 0 (0.0%) |
| 18 to 34 Years | 0 (0.0%) | 0 (0.0%) |
| 35 to 64 Years | 9 (3.0%) | 5 (1.8%) |
| 65 to 74 Years | 0 (0.0%) | 0 (0.0%) |
| 75 Years and over | 0 (0.0%) | 1 (16.7%) |
Disability Class: Cognitive Difficulty
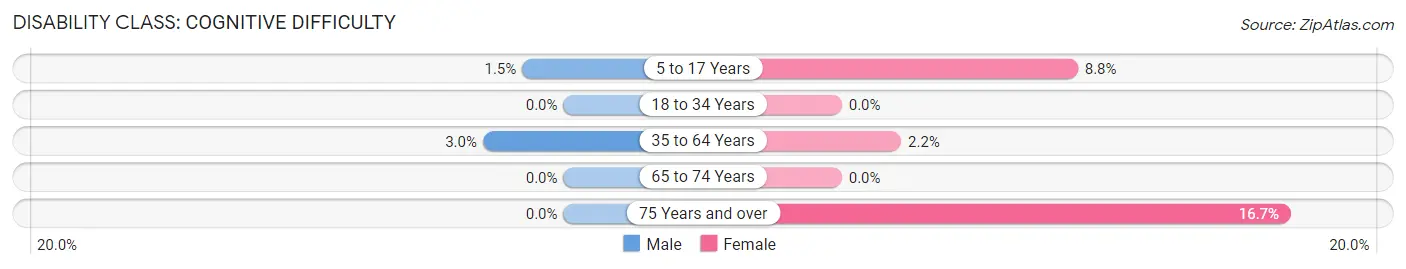
| Age Bracket | Male | Female |
| 5 to 17 Years | 3 (1.5%) | 12 (8.8%) |
| 18 to 34 Years | 0 (0.0%) | 0 (0.0%) |
| 35 to 64 Years | 9 (3.0%) | 6 (2.2%) |
| 65 to 74 Years | 0 (0.0%) | 0 (0.0%) |
| 75 Years and over | 0 (0.0%) | 1 (16.7%) |
Disability Class: Ambulatory Difficulty
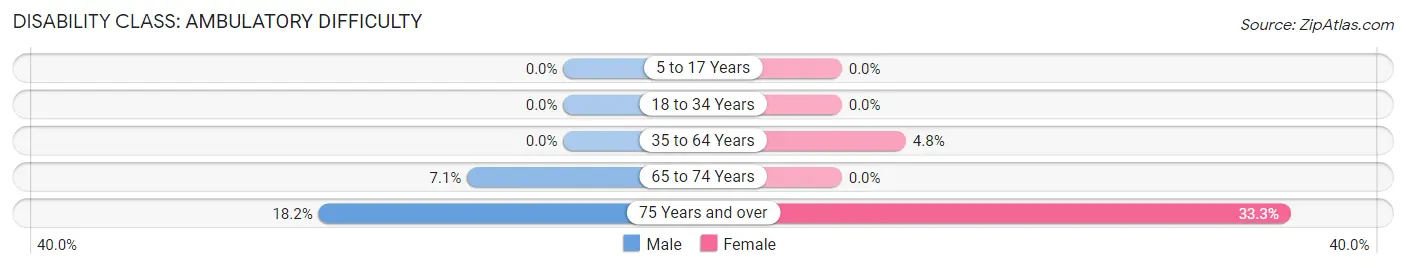
| Age Bracket | Male | Female |
| 5 to 17 Years | 0 (0.0%) | 0 (0.0%) |
| 18 to 34 Years | 0 (0.0%) | 0 (0.0%) |
| 35 to 64 Years | 0 (0.0%) | 13 (4.8%) |
| 65 to 74 Years | 3 (7.1%) | 0 (0.0%) |
| 75 Years and over | 2 (18.2%) | 2 (33.3%) |
Disability Class: Self-Care Difficulty
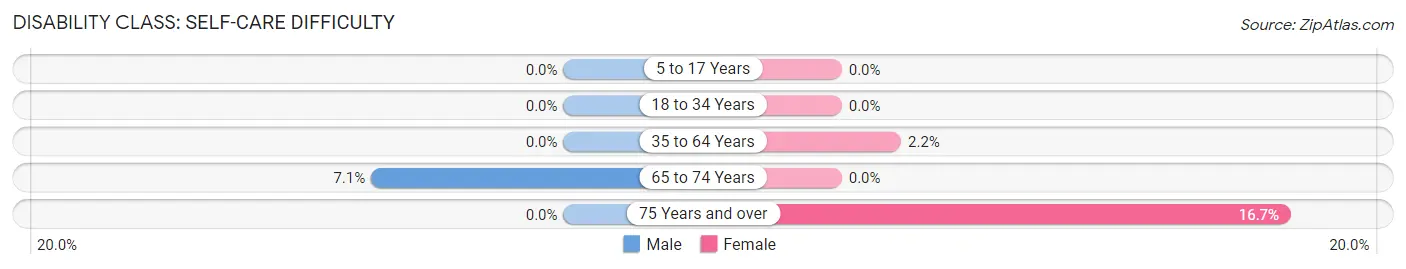
| Age Bracket | Male | Female |
| 5 to 17 Years | 0 (0.0%) | 0 (0.0%) |
| 18 to 34 Years | 0 (0.0%) | 0 (0.0%) |
| 35 to 64 Years | 0 (0.0%) | 6 (2.2%) |
| 65 to 74 Years | 3 (7.1%) | 0 (0.0%) |
| 75 Years and over | 0 (0.0%) | 1 (16.7%) |
Technology Access in Marion
Computing Device Access in Marion
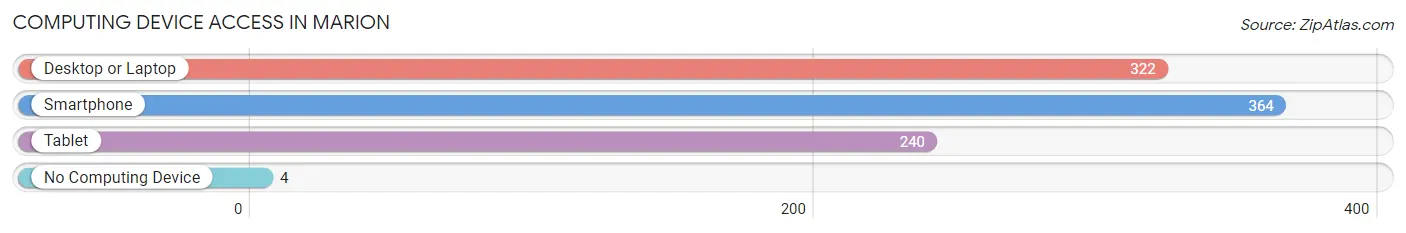
| Device Type | # Households | % Households |
| Desktop or Laptop | 322 | 79.3% |
| Smartphone | 364 | 89.7% |
| Tablet | 240 | 59.1% |
| No Computing Device | 4 | 1.0% |
| Total | 406 | 100.0% |
Internet Access in Marion
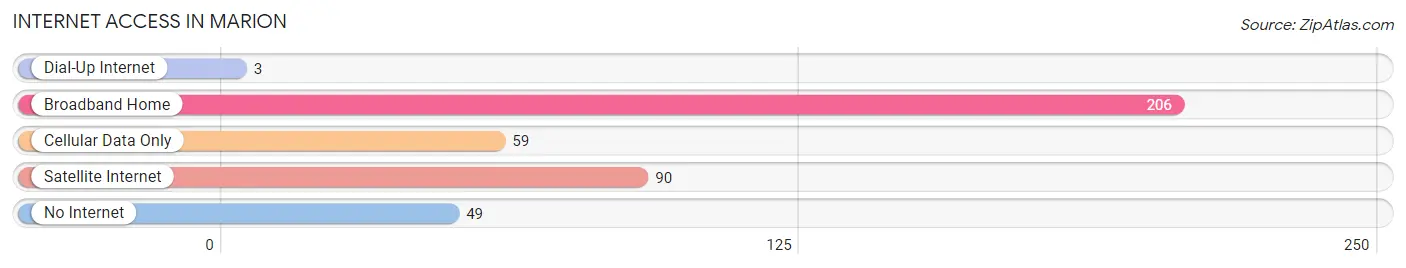
| Internet Type | # Households | % Households |
| Dial-Up Internet | 3 | 0.7% |
| Broadband Home | 206 | 50.7% |
| Cellular Data Only | 59 | 14.5% |
| Satellite Internet | 90 | 22.2% |
| No Internet | 49 | 12.1% |
| Total | 406 | 100.0% |
Marion Summary
Marion, Montana is a small town located in Ravalli County, in the western part of the state. It is situated in the Bitterroot Valley, between the Bitterroot and Sapphire Mountains. The town was founded in 1881 and has a population of approximately 1,000 people.
Marion is a rural community with a strong agricultural base. The town is surrounded by rolling hills and open fields, and is home to a variety of crops, including wheat, barley, hay, and alfalfa. The area is also known for its cattle and sheep ranches.
The economy of Marion is largely based on agriculture and tourism. The town is home to several small businesses, including a grocery store, a hardware store, and a few restaurants. There are also several small manufacturing companies in the area.
The geography of Marion is characterized by its mountainous terrain and its proximity to the Bitterroot River. The town is located at an elevation of 4,000 feet, and is surrounded by the Bitterroot Mountains to the east and the Sapphire Mountains to the west. The town is also located near the Bitterroot National Forest, which provides a variety of recreational activities.
The demographics of Marion are largely white, with a small percentage of Native American and Hispanic residents. The median household income is approximately $35,000, and the median age is around 40 years old. The town is home to a variety of religious denominations, including Catholic, Protestant, and Mormon.
Marion is a small town with a rich history and a strong sense of community. The town is home to a variety of cultural and recreational activities, including a farmers market, a rodeo, and a variety of festivals. The town is also home to a number of historic sites, including the old Marion Hotel, the Marion County Courthouse, and the Marion County Museum.
Marion is a great place to live and work, and is a great place to visit. The town is home to a variety of attractions, including the Bitterroot National Forest, the Bitterroot River, and the Sapphire Mountains. The town is also home to a variety of outdoor activities, including fishing, hunting, and camping. Marion is a great place to experience the beauty of Montana and the western United States.
Common Questions
What is Per Capita Income in Marion?
Per Capita income in Marion is $27,211.
What is the Median Family Income in Marion?
Median Family Income in Marion is $83,681.
What is the Median Household income in Marion?
Median Household Income in Marion is $58,704.
What is Income or Wage Gap in Marion?
Income or Wage Gap in Marion is 37.7%.
Women in Marion earn 62.3 cents for every dollar earned by a man.
What is Inequality or Gini Index in Marion?
Inequality or Gini Index in Marion is 0.43.
What is the Total Population of Marion?
Total Population of Marion is 1,219.
What is the Total Male Population of Marion?
Total Male Population of Marion is 672.
What is the Total Female Population of Marion?
Total Female Population of Marion is 547.
What is the Ratio of Males per 100 Females in Marion?
There are 122.85 Males per 100 Females in Marion.
What is the Ratio of Females per 100 Males in Marion?
There are 81.40 Females per 100 Males in Marion.
What is the Median Population Age in Marion?
Median Population Age in Marion is 41.8 Years.
What is the Average Family Size in Marion
Average Family Size in Marion is 3.2 People.
What is the Average Household Size in Marion
Average Household Size in Marion is 3.0 People.
How Large is the Labor Force in Marion?
There are 627 People in the Labor Forcein in Marion.
What is the Percentage of People in the Labor Force in Marion?
67.3% of People are in the Labor Force in Marion.
What is the Unemployment Rate in Marion?
Unemployment Rate in Marion is 11.2%.