Deer Lodge, MT Map & Demographics
Deer Lodge Map
Deer Lodge Overview
$30,814
PER CAPITA INCOME
$62,356
AVG FAMILY INCOME
$52,813
AVG HOUSEHOLD INCOME
47.4%
WAGE / INCOME GAP [ % ]
52.6¢/ $1
WAGE / INCOME GAP [ $ ]
0.41
INEQUALITY / GINI INDEX
3,030
TOTAL POPULATION
1,632
MALE POPULATION
1,398
FEMALE POPULATION
116.74
MALES / 100 FEMALES
85.66
FEMALES / 100 MALES
49.9
MEDIAN AGE
2.3
AVG FAMILY SIZE
2.0
AVG HOUSEHOLD SIZE
1,370
LABOR FORCE [ PEOPLE ]
54.2%
PERCENT IN LABOR FORCE
3.4%
UNEMPLOYMENT RATE
Deer Lodge Zip Codes
Deer Lodge Area Codes
Income in Deer Lodge
Income Overview in Deer Lodge
Per Capita Income in Deer Lodge is $30,814, while median incomes of families and households are $62,356 and $52,813 respectively.
| Characteristic | Number | Measure |
| Per Capita Income | 3,030 | $30,814 |
| Median Family Income | 899 | $62,356 |
| Mean Family Income | 899 | $74,554 |
| Median Household Income | 1,448 | $52,813 |
| Mean Household Income | 1,448 | $65,267 |
| Income Deficit | 899 | $0 |
| Wage / Income Gap (%) | 3,030 | 47.41% |
| Wage / Income Gap ($) | 3,030 | 52.59¢ per $1 |
| Gini / Inequality Index | 3,030 | 0.41 |
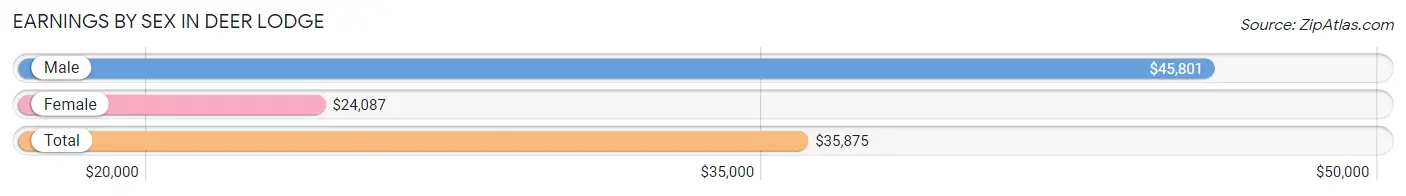
Earnings by Sex in Deer Lodge
Average Earnings in Deer Lodge are $35,875, $45,801 for men and $24,087 for women, a difference of 47.4%.
| Sex | Number | Average Earnings |
| Male | 831 (57.6%) | $45,801 |
| Female | 612 (42.4%) | $24,087 |
| Total | 1,443 (100.0%) | $35,875 |
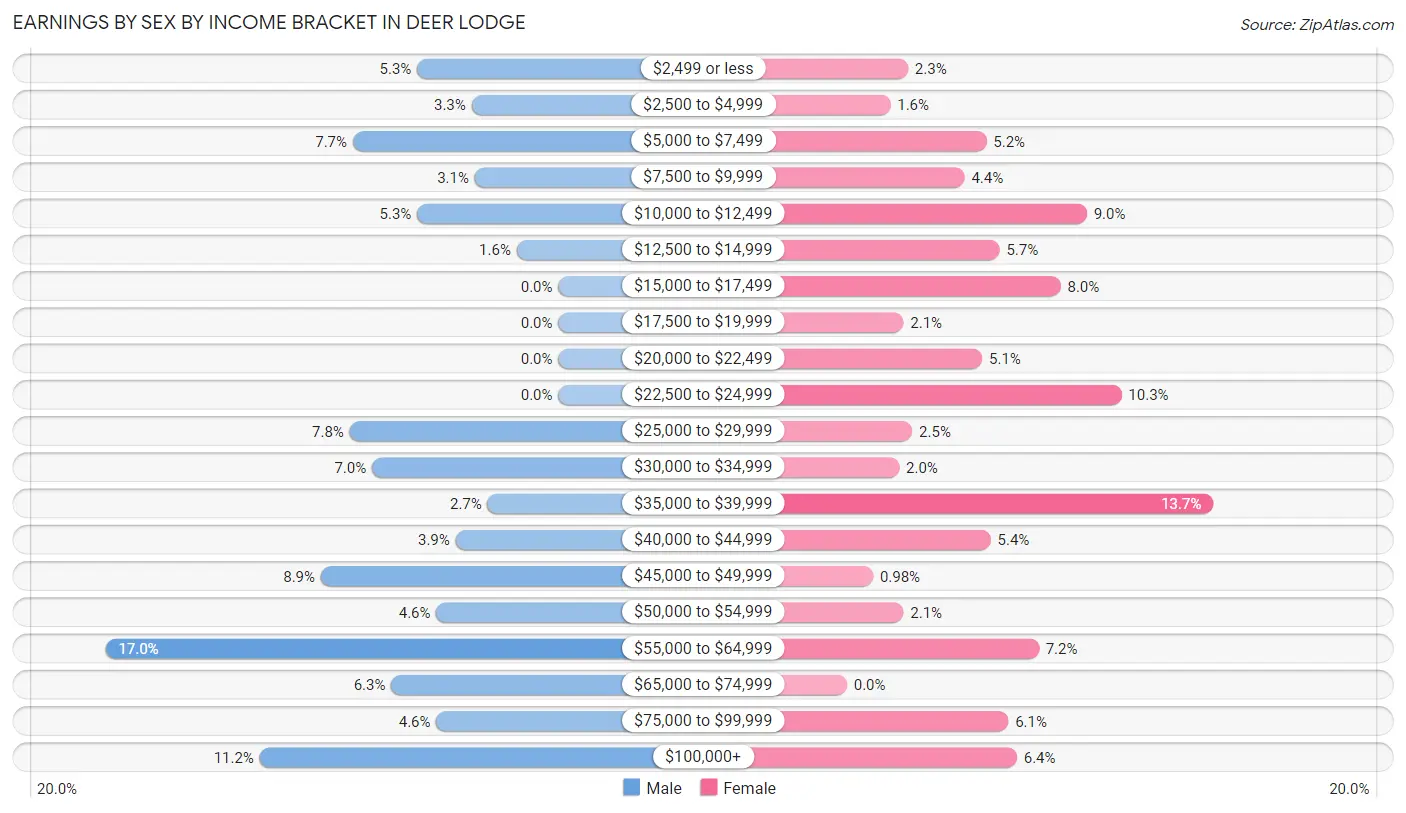
Earnings by Sex by Income Bracket in Deer Lodge
The most common earnings brackets in Deer Lodge are $55,000 to $64,999 for men (141 | 17.0%) and $35,000 to $39,999 for women (84 | 13.7%).
| Income | Male | Female |
| $2,499 or less | 44 (5.3%) | 14 (2.3%) |
| $2,500 to $4,999 | 27 (3.3%) | 10 (1.6%) |
| $5,000 to $7,499 | 64 (7.7%) | 32 (5.2%) |
| $7,500 to $9,999 | 26 (3.1%) | 27 (4.4%) |
| $10,000 to $12,499 | 44 (5.3%) | 55 (9.0%) |
| $12,500 to $14,999 | 13 (1.6%) | 35 (5.7%) |
| $15,000 to $17,499 | 0 (0.0%) | 49 (8.0%) |
| $17,500 to $19,999 | 0 (0.0%) | 13 (2.1%) |
| $20,000 to $22,499 | 0 (0.0%) | 31 (5.1%) |
| $22,500 to $24,999 | 0 (0.0%) | 63 (10.3%) |
| $25,000 to $29,999 | 65 (7.8%) | 15 (2.5%) |
| $30,000 to $34,999 | 58 (7.0%) | 12 (2.0%) |
| $35,000 to $39,999 | 22 (2.6%) | 84 (13.7%) |
| $40,000 to $44,999 | 32 (3.8%) | 33 (5.4%) |
| $45,000 to $49,999 | 74 (8.9%) | 6 (1.0%) |
| $50,000 to $54,999 | 38 (4.6%) | 13 (2.1%) |
| $55,000 to $64,999 | 141 (17.0%) | 44 (7.2%) |
| $65,000 to $74,999 | 52 (6.3%) | 0 (0.0%) |
| $75,000 to $99,999 | 38 (4.6%) | 37 (6.0%) |
| $100,000+ | 93 (11.2%) | 39 (6.4%) |
| Total | 831 (100.0%) | 612 (100.0%) |
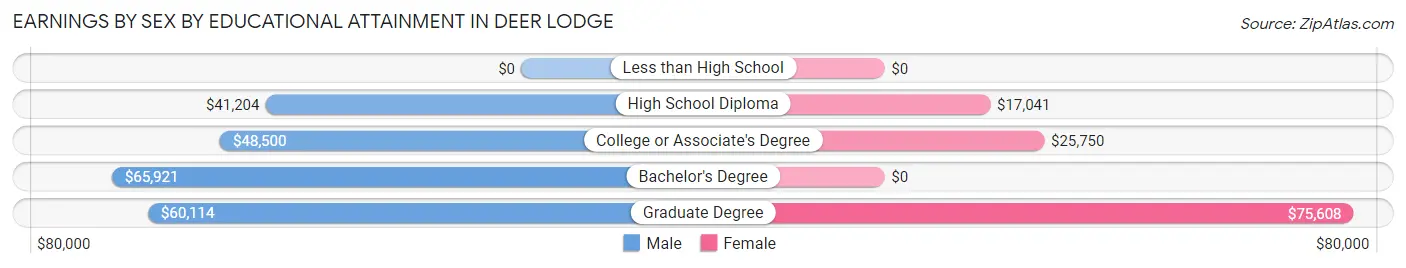
Earnings by Sex by Educational Attainment in Deer Lodge
Average earnings in Deer Lodge are $46,641 for men and $24,484 for women, a difference of 47.5%. Men with an educational attainment of bachelor's degree enjoy the highest average annual earnings of $65,921, while those with high school diploma education earn the least with $41,204. Women with an educational attainment of graduate degree earn the most with the average annual earnings of $75,608, while those with high school diploma education have the smallest earnings of $17,041.
| Educational Attainment | Male Income | Female Income |
| Less than High School | - | - |
| High School Diploma | $41,204 | $17,041 |
| College or Associate's Degree | $48,500 | $25,750 |
| Bachelor's Degree | $65,921 | $0 |
| Graduate Degree | $60,114 | $75,608 |
| Total | $46,641 | $24,484 |
Family Income in Deer Lodge
Family Income Brackets in Deer Lodge
According to the Deer Lodge family income data, there are 237 families falling into the $25,000 to $34,999 income range, which is the most common income bracket and makes up 26.4% of all families.
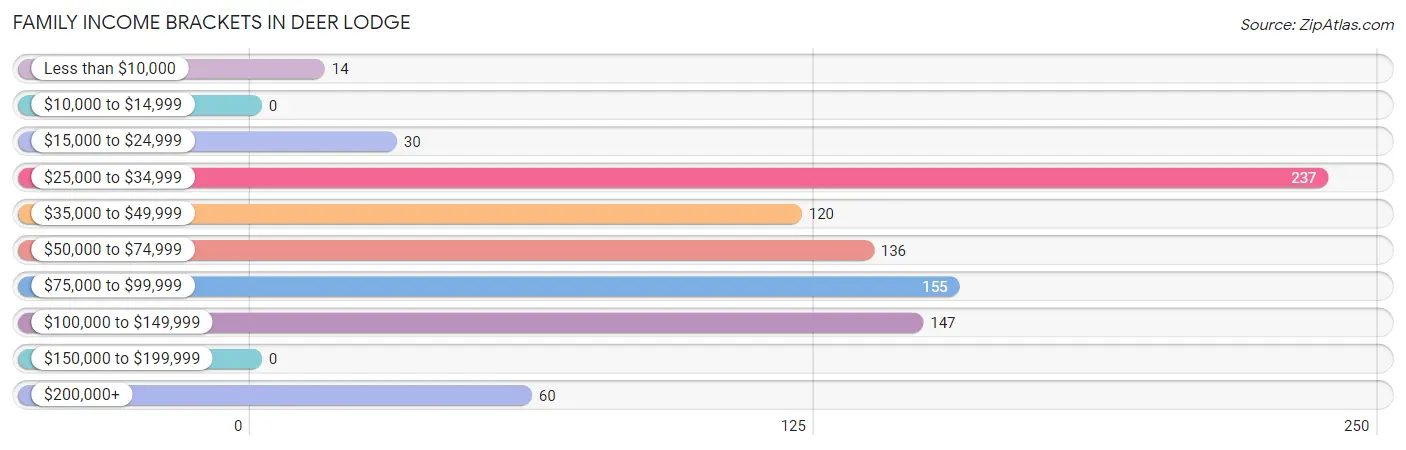
| Income Bracket | # Families | % Families |
| Less than $10,000 | 14 | 1.6% |
| $10,000 to $14,999 | 0 | 0.0% |
| $15,000 to $24,999 | 30 | 3.3% |
| $25,000 to $34,999 | 237 | 26.4% |
| $35,000 to $49,999 | 120 | 13.3% |
| $50,000 to $74,999 | 136 | 15.1% |
| $75,000 to $99,999 | 155 | 17.2% |
| $100,000 to $149,999 | 147 | 16.4% |
| $150,000 to $199,999 | 0 | 0.0% |
| $200,000+ | 60 | 6.7% |
Family Income by Famaliy Size in Deer Lodge
3-person families (98 | 10.9%) account for the highest median family income in Deer Lodge with $110,758 per family, while 3-person families (98 | 10.9%) have the highest median income of $36,919 per family member.
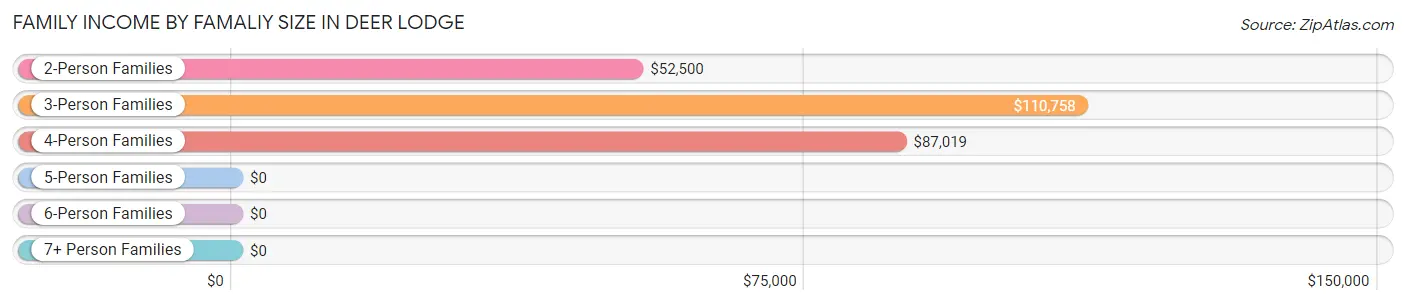
| Income Bracket | # Families | Median Income |
| 2-Person Families | 676 (75.2%) | $52,500 |
| 3-Person Families | 98 (10.9%) | $110,758 |
| 4-Person Families | 119 (13.2%) | $87,019 |
| 5-Person Families | 6 (0.7%) | $0 |
| 6-Person Families | 0 (0.0%) | $0 |
| 7+ Person Families | 0 (0.0%) | $0 |
| Total | 899 (100.0%) | $62,356 |
Family Income by Number of Earners in Deer Lodge
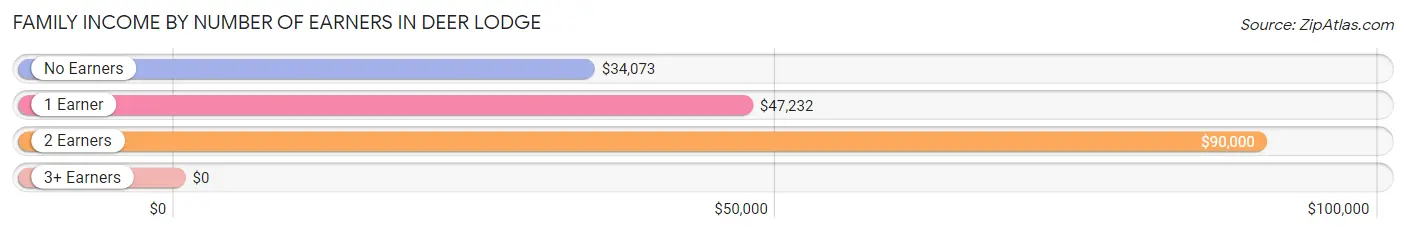
| Number of Earners | # Families | Median Income |
| No Earners | 188 (20.9%) | $34,073 |
| 1 Earner | 317 (35.3%) | $47,232 |
| 2 Earners | 388 (43.2%) | $90,000 |
| 3+ Earners | 6 (0.7%) | $0 |
| Total | 899 (100.0%) | $62,356 |
Household Income in Deer Lodge
Household Income Brackets in Deer Lodge
With 295 households falling in the category, the $25,000 to $34,999 income range is the most frequent in Deer Lodge, accounting for 20.4% of all households. In contrast, only 12 households (0.8%) fall into the $150,000 to $199,999 income bracket, making it the least populous group.
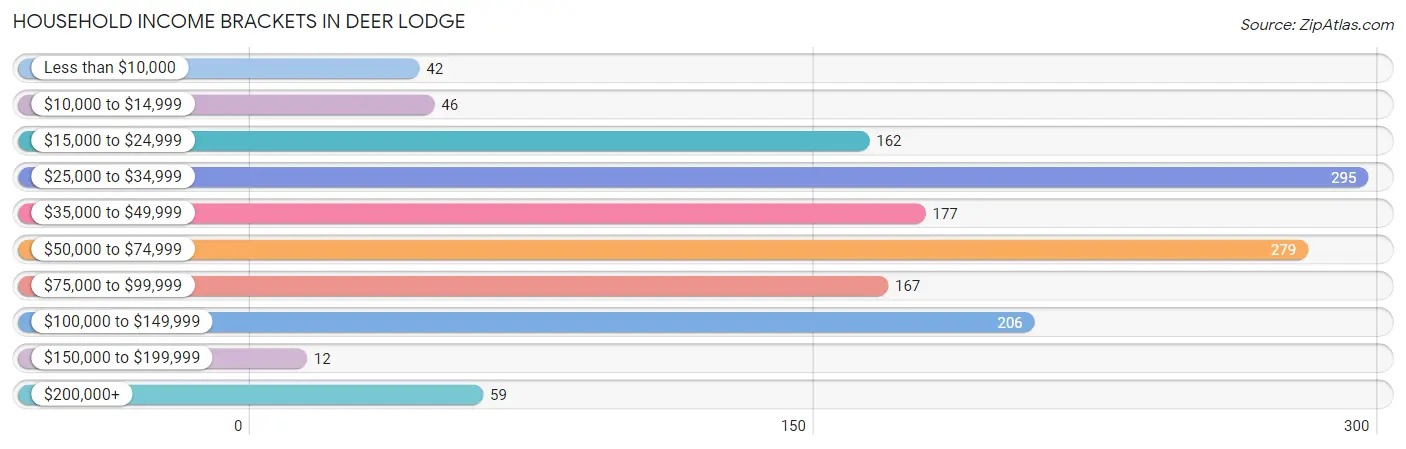
| Income Bracket | # Households | % Households |
| Less than $10,000 | 42 | 2.9% |
| $10,000 to $14,999 | 46 | 3.2% |
| $15,000 to $24,999 | 162 | 11.2% |
| $25,000 to $34,999 | 295 | 20.4% |
| $35,000 to $49,999 | 177 | 12.2% |
| $50,000 to $74,999 | 279 | 19.3% |
| $75,000 to $99,999 | 167 | 11.5% |
| $100,000 to $149,999 | 206 | 14.2% |
| $150,000 to $199,999 | 12 | 0.8% |
| $200,000+ | 59 | 4.1% |
Household Income by Householder Age in Deer Lodge
The median household income in Deer Lodge is $52,813, with the highest median household income of $67,336 found in the 45 to 64 years age bracket for the primary householder. A total of 541 households (37.4%) fall into this category. Meanwhile, the 15 to 24 years age bracket for the primary householder has the lowest median household income of $0, with 46 households (3.2%) in this group.
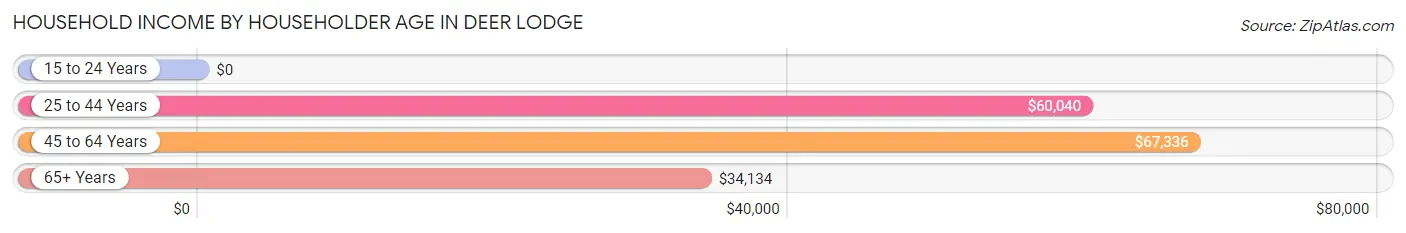
| Income Bracket | # Households | Median Income |
| 15 to 24 Years | 46 (3.2%) | $0 |
| 25 to 44 Years | 373 (25.8%) | $60,040 |
| 45 to 64 Years | 541 (37.4%) | $67,336 |
| 65+ Years | 488 (33.7%) | $34,134 |
| Total | 1,448 (100.0%) | $52,813 |
Poverty in Deer Lodge
Income Below Poverty by Sex and Age in Deer Lodge
With 7.7% poverty level for males and 4.8% for females among the residents of Deer Lodge, 18 to 24 year old males and 6 to 11 year old females are the most vulnerable to poverty, with 26 males (66.7%) and 12 females (13.5%) in their respective age groups living below the poverty level.
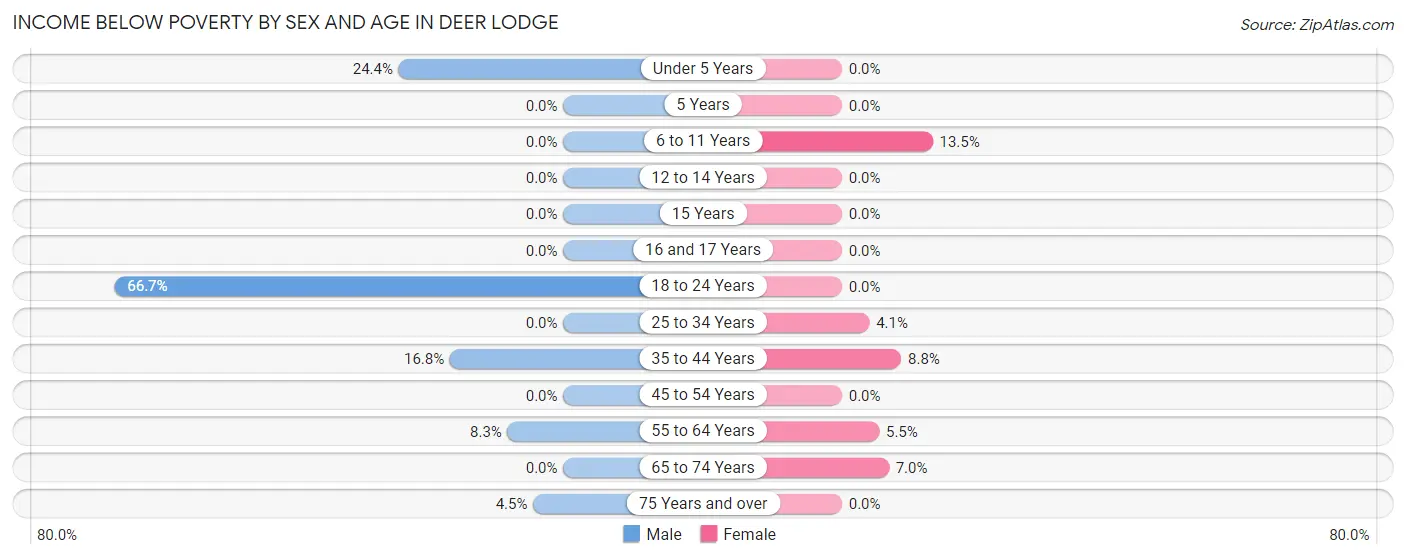
| Age Bracket | Male | Female |
| Under 5 Years | 22 (24.4%) | 0 (0.0%) |
| 5 Years | 0 (0.0%) | 0 (0.0%) |
| 6 to 11 Years | 0 (0.0%) | 12 (13.5%) |
| 12 to 14 Years | 0 (0.0%) | 0 (0.0%) |
| 15 Years | 0 (0.0%) | 0 (0.0%) |
| 16 and 17 Years | 0 (0.0%) | 0 (0.0%) |
| 18 to 24 Years | 26 (66.7%) | 0 (0.0%) |
| 25 to 34 Years | 0 (0.0%) | 5 (4.1%) |
| 35 to 44 Years | 37 (16.8%) | 14 (8.8%) |
| 45 to 54 Years | 0 (0.0%) | 0 (0.0%) |
| 55 to 64 Years | 23 (8.3%) | 14 (5.5%) |
| 65 to 74 Years | 0 (0.0%) | 17 (7.0%) |
| 75 Years and over | 7 (4.5%) | 0 (0.0%) |
| Total | 115 (7.7%) | 62 (4.8%) |
Income Above Poverty by Sex and Age in Deer Lodge
According to the poverty statistics in Deer Lodge, males aged 6 to 11 years and females aged under 5 years are the age groups that are most secure financially, with 100.0% of males and 100.0% of females in these age groups living above the poverty line.
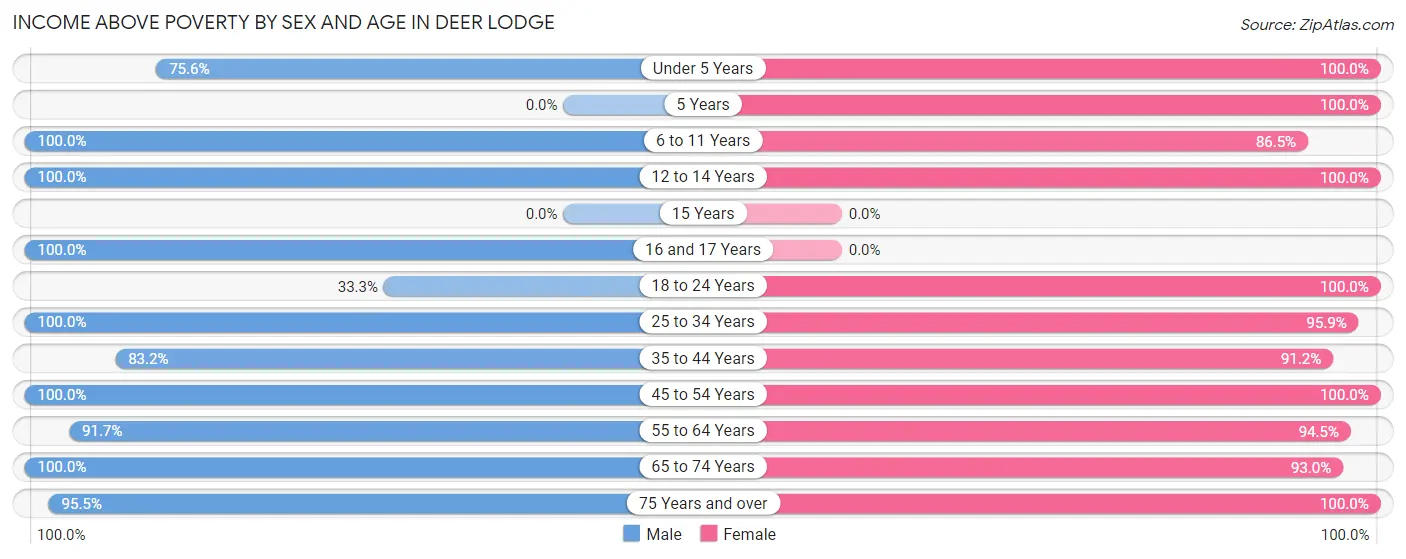
| Age Bracket | Male | Female |
| Under 5 Years | 68 (75.6%) | 80 (100.0%) |
| 5 Years | 0 (0.0%) | 7 (100.0%) |
| 6 to 11 Years | 32 (100.0%) | 77 (86.5%) |
| 12 to 14 Years | 58 (100.0%) | 12 (100.0%) |
| 15 Years | 0 (0.0%) | 0 (0.0%) |
| 16 and 17 Years | 4 (100.0%) | 0 (0.0%) |
| 18 to 24 Years | 13 (33.3%) | 34 (100.0%) |
| 25 to 34 Years | 130 (100.0%) | 118 (95.9%) |
| 35 to 44 Years | 183 (83.2%) | 145 (91.2%) |
| 45 to 54 Years | 245 (100.0%) | 150 (100.0%) |
| 55 to 64 Years | 255 (91.7%) | 239 (94.5%) |
| 65 to 74 Years | 230 (100.0%) | 227 (93.0%) |
| 75 Years and over | 150 (95.5%) | 134 (100.0%) |
| Total | 1,368 (92.2%) | 1,223 (95.2%) |
Income Below Poverty Among Married-Couple Families in Deer Lodge
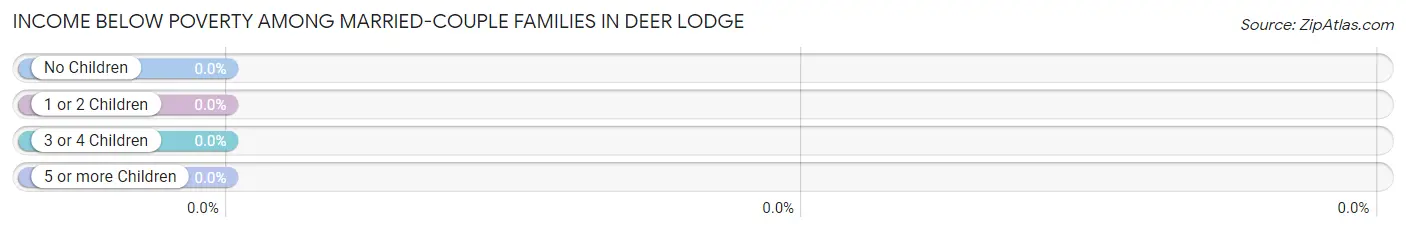
| Children | Above Poverty | Below Poverty |
| No Children | 517 (100.0%) | 0 (0.0%) |
| 1 or 2 Children | 137 (100.0%) | 0 (0.0%) |
| 3 or 4 Children | 6 (100.0%) | 0 (0.0%) |
| 5 or more Children | 0 (0.0%) | 0 (0.0%) |
| Total | 660 (100.0%) | 0 (0.0%) |
Income Below Poverty Among Single-Parent Households in Deer Lodge
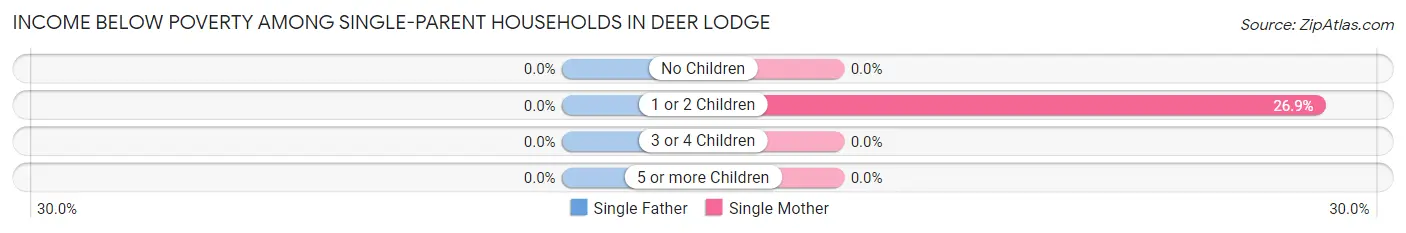
| Children | Single Father | Single Mother |
| No Children | 0 (0.0%) | 0 (0.0%) |
| 1 or 2 Children | 0 (0.0%) | 14 (26.9%) |
| 3 or 4 Children | 0 (0.0%) | 0 (0.0%) |
| 5 or more Children | 0 (0.0%) | 0 (0.0%) |
| Total | 0 (0.0%) | 14 (9.8%) |
Income Below Poverty Among Married-Couple vs Single-Parent Households in Deer Lodge
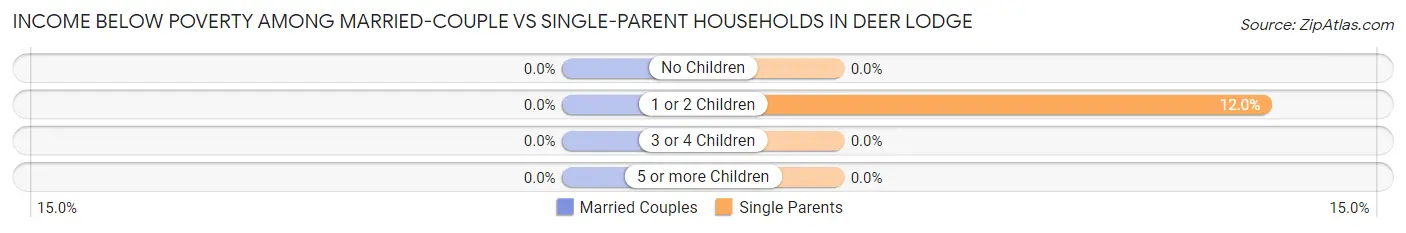
| Children | Married-Couple Families | Single-Parent Households |
| No Children | 0 (0.0%) | 0 (0.0%) |
| 1 or 2 Children | 0 (0.0%) | 14 (12.0%) |
| 3 or 4 Children | 0 (0.0%) | 0 (0.0%) |
| 5 or more Children | 0 (0.0%) | 0 (0.0%) |
| Total | 0 (0.0%) | 14 (5.9%) |
Race in Deer Lodge
The most populous races in Deer Lodge are White / Caucasian (2,874 | 94.9%), Two or more Races (98 | 3.2%), and Asian (55 | 1.8%).
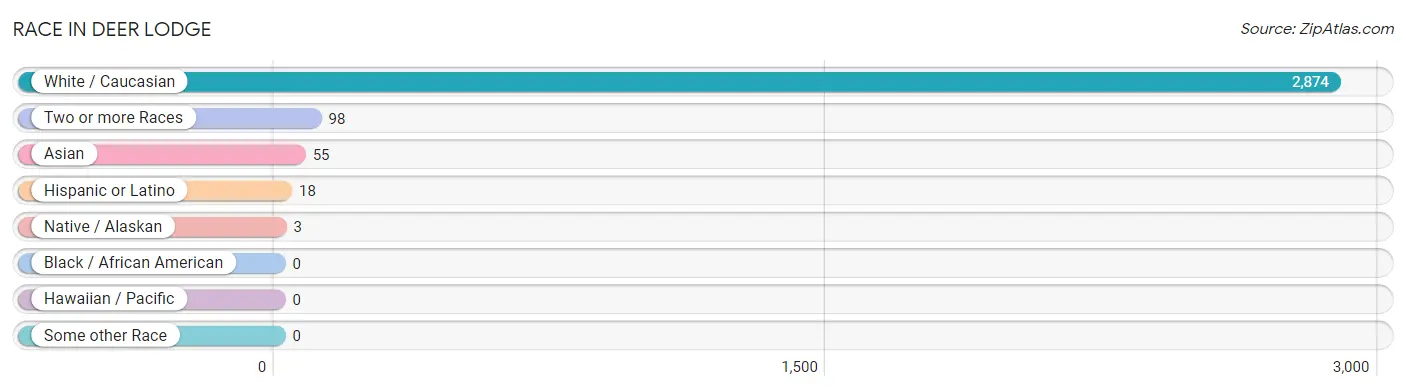
| Race | # Population | % Population |
| Asian | 55 | 1.8% |
| Black / African American | 0 | 0.0% |
| Hawaiian / Pacific | 0 | 0.0% |
| Hispanic or Latino | 18 | 0.6% |
| Native / Alaskan | 3 | 0.1% |
| White / Caucasian | 2,874 | 94.9% |
| Two or more Races | 98 | 3.2% |
| Some other Race | 0 | 0.0% |
| Total | 3,030 | 100.0% |
Ancestry in Deer Lodge
The most populous ancestries reported in Deer Lodge are German (846 | 27.9%), Irish (532 | 17.6%), English (282 | 9.3%), American (248 | 8.2%), and Norwegian (122 | 4.0%), together accounting for 67.0% of all Deer Lodge residents.
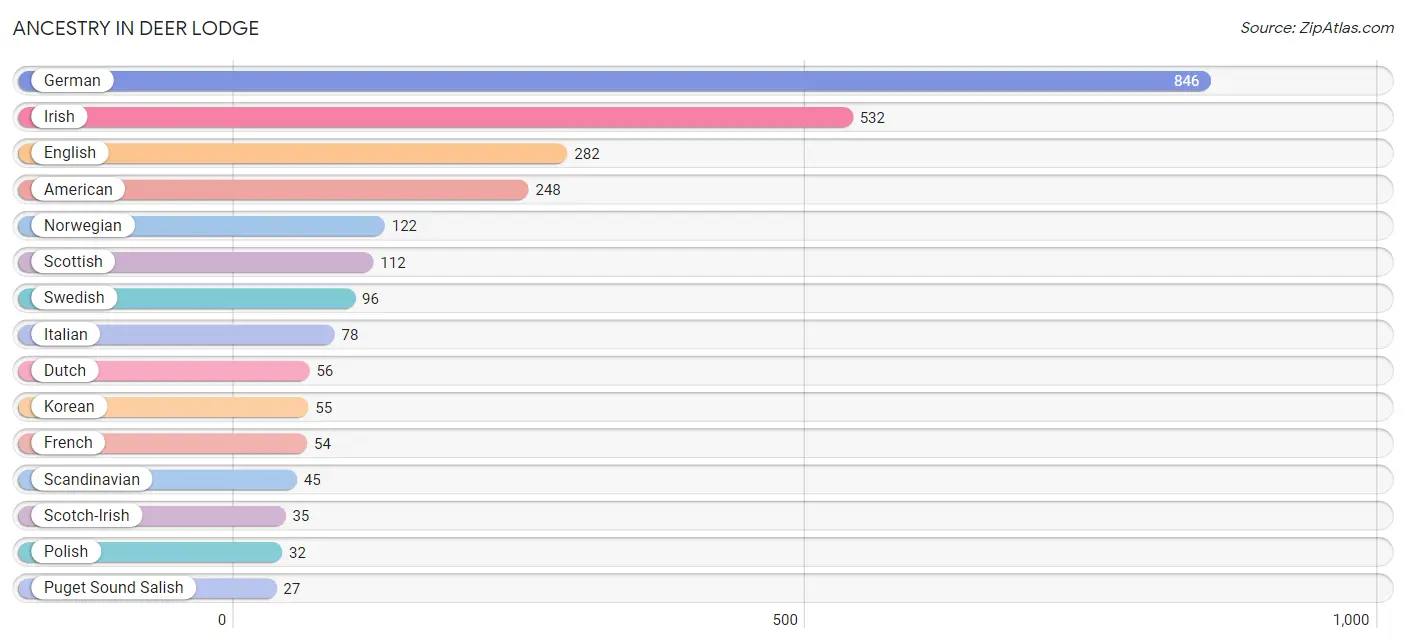
| Ancestry | # Population | % Population |
| American | 248 | 8.2% |
| Austrian | 8 | 0.3% |
| Belgian | 7 | 0.2% |
| Blackfeet | 19 | 0.6% |
| British | 10 | 0.3% |
| Colombian | 3 | 0.1% |
| Danish | 13 | 0.4% |
| Dutch | 56 | 1.8% |
| English | 282 | 9.3% |
| European | 21 | 0.7% |
| French | 54 | 1.8% |
| French Canadian | 21 | 0.7% |
| German | 846 | 27.9% |
| Irish | 532 | 17.6% |
| Italian | 78 | 2.6% |
| Korean | 55 | 1.8% |
| Mexican | 15 | 0.5% |
| Norwegian | 122 | 4.0% |
| Polish | 32 | 1.1% |
| Puget Sound Salish | 27 | 0.9% |
| Scandinavian | 45 | 1.5% |
| Scotch-Irish | 35 | 1.2% |
| Scottish | 112 | 3.7% |
| Serbian | 22 | 0.7% |
| Slovak | 11 | 0.4% |
| South American | 3 | 0.1% |
| Swedish | 96 | 3.2% |
| Swiss | 11 | 0.4% |
| Ukrainian | 13 | 0.4% |
| Welsh | 15 | 0.5% | View All 30 Rows |
Immigrants in Deer Lodge
The most numerous immigrant groups reported in Deer Lodge came from Asia (55 | 1.8%), Philippines (55 | 1.8%), South Eastern Asia (55 | 1.8%), Europe (10 | 0.3%), and Northern Europe (10 | 0.3%), together accounting for 6.1% of all Deer Lodge residents.
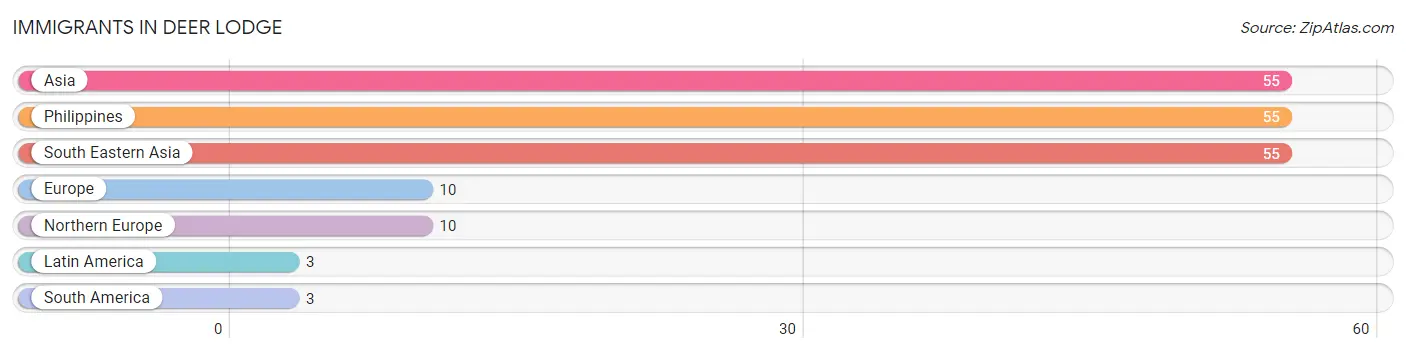
| Immigration Origin | # Population | % Population |
| Asia | 55 | 1.8% |
| Europe | 10 | 0.3% |
| Latin America | 3 | 0.1% |
| Northern Europe | 10 | 0.3% |
| Philippines | 55 | 1.8% |
| South America | 3 | 0.1% |
| South Eastern Asia | 55 | 1.8% | View All 7 Rows |
Sex and Age in Deer Lodge
Sex and Age in Deer Lodge
The most populous age groups in Deer Lodge are 45 to 49 Years (180 | 11.0%) for men and 70 to 74 Years (157 | 11.2%) for women.
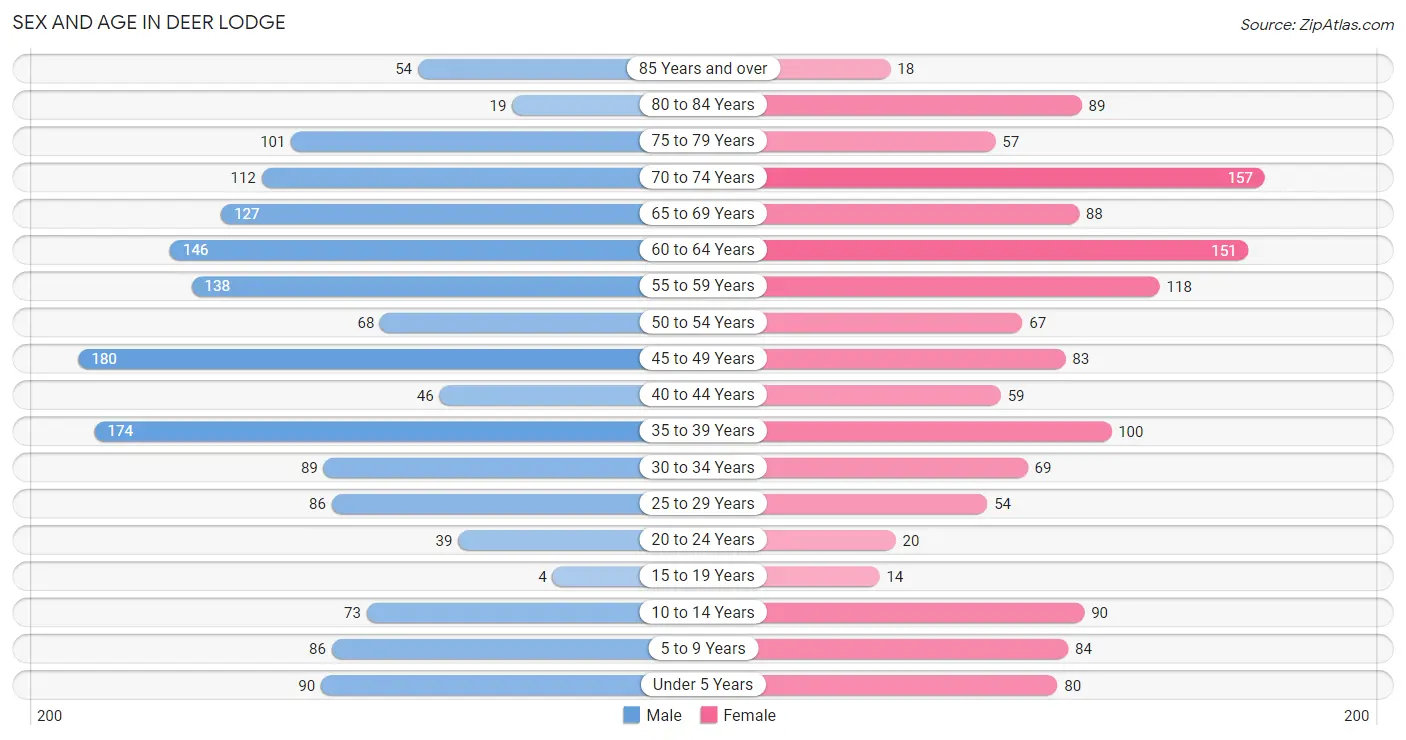
| Age Bracket | Male | Female |
| Under 5 Years | 90 (5.5%) | 80 (5.7%) |
| 5 to 9 Years | 86 (5.3%) | 84 (6.0%) |
| 10 to 14 Years | 73 (4.5%) | 90 (6.4%) |
| 15 to 19 Years | 4 (0.3%) | 14 (1.0%) |
| 20 to 24 Years | 39 (2.4%) | 20 (1.4%) |
| 25 to 29 Years | 86 (5.3%) | 54 (3.9%) |
| 30 to 34 Years | 89 (5.4%) | 69 (4.9%) |
| 35 to 39 Years | 174 (10.7%) | 100 (7.1%) |
| 40 to 44 Years | 46 (2.8%) | 59 (4.2%) |
| 45 to 49 Years | 180 (11.0%) | 83 (5.9%) |
| 50 to 54 Years | 68 (4.2%) | 67 (4.8%) |
| 55 to 59 Years | 138 (8.5%) | 118 (8.4%) |
| 60 to 64 Years | 146 (8.9%) | 151 (10.8%) |
| 65 to 69 Years | 127 (7.8%) | 88 (6.3%) |
| 70 to 74 Years | 112 (6.9%) | 157 (11.2%) |
| 75 to 79 Years | 101 (6.2%) | 57 (4.1%) |
| 80 to 84 Years | 19 (1.2%) | 89 (6.4%) |
| 85 Years and over | 54 (3.3%) | 18 (1.3%) |
| Total | 1,632 (100.0%) | 1,398 (100.0%) |
Families and Households in Deer Lodge
Median Family Size in Deer Lodge
The median family size in Deer Lodge is 2.34 persons per family, with married-couple families (660 | 73.4%) accounting for the largest median family size of 2.41 persons per family. On the other hand, single male/father families (96 | 10.7%) represent the smallest median family size with 1.85 persons per family.
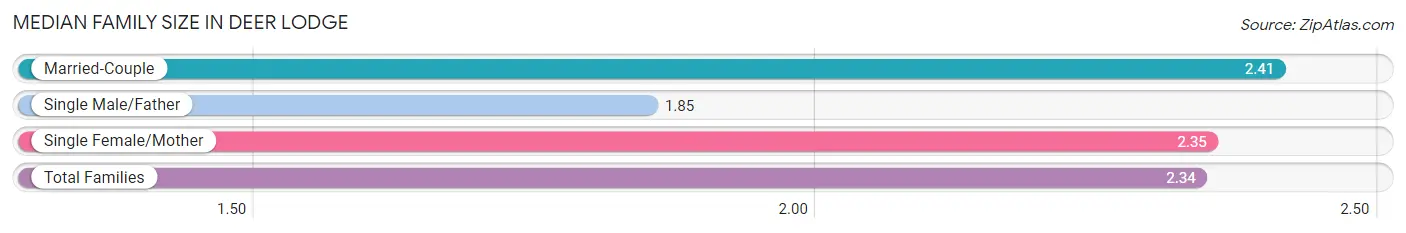
| Family Type | # Families | Family Size |
| Married-Couple | 660 (73.4%) | 2.41 |
| Single Male/Father | 96 (10.7%) | 1.85 |
| Single Female/Mother | 143 (15.9%) | 2.35 |
| Total Families | 899 (100.0%) | 2.34 |
Median Household Size in Deer Lodge
The median household size in Deer Lodge is 2.00 persons per household, with single male/father households (96 | 6.6%) accounting for the largest median household size of 3.67 persons per household. non-family households (549 | 37.9%) represent the smallest median household size with 1.12 persons per household.
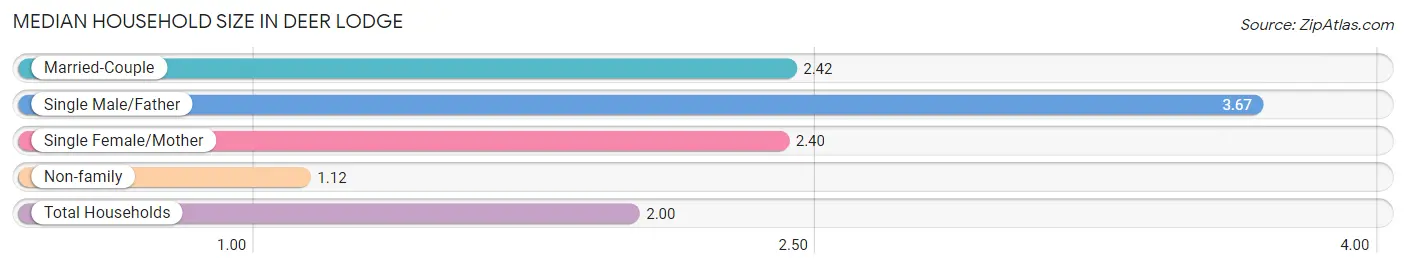
| Household Type | # Households | Household Size |
| Married-Couple | 660 (45.6%) | 2.42 |
| Single Male/Father | 96 (6.6%) | 3.67 |
| Single Female/Mother | 143 (9.9%) | 2.40 |
| Non-family | 549 (37.9%) | 1.12 |
| Total Households | 1,448 (100.0%) | 2.00 |
Household Size by Marriage Status in Deer Lodge
Out of a total of 1,448 households in Deer Lodge, 899 (62.1%) are family households, while 549 (37.9%) are nonfamily households. The most numerous type of family households are 2-person households, comprising 606, and the most common type of nonfamily households are 1-person households, comprising 478.
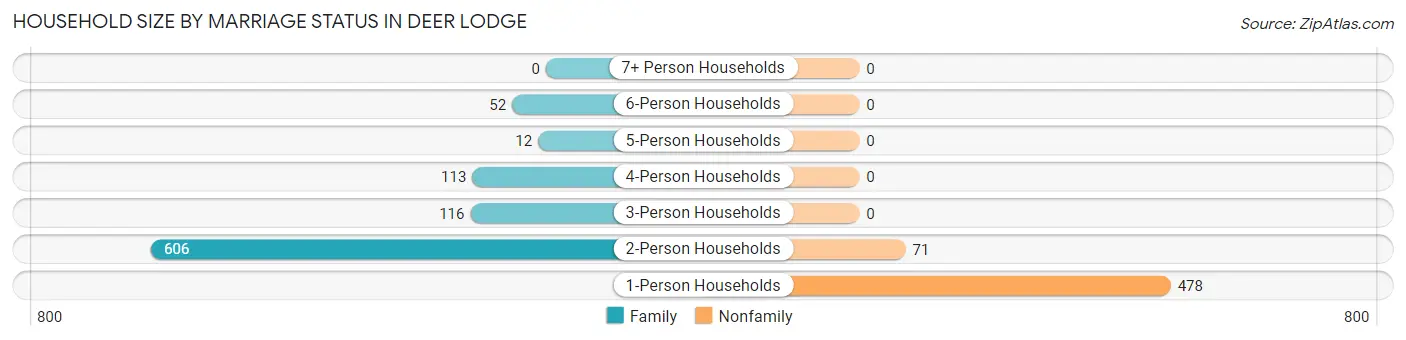
| Household Size | Family Households | Nonfamily Households |
| 1-Person Households | - | 478 (33.0%) |
| 2-Person Households | 606 (41.8%) | 71 (4.9%) |
| 3-Person Households | 116 (8.0%) | 0 (0.0%) |
| 4-Person Households | 113 (7.8%) | 0 (0.0%) |
| 5-Person Households | 12 (0.8%) | 0 (0.0%) |
| 6-Person Households | 52 (3.6%) | 0 (0.0%) |
| 7+ Person Households | 0 (0.0%) | 0 (0.0%) |
| Total | 899 (62.1%) | 549 (37.9%) |
Female Fertility in Deer Lodge
Fertility by Age in Deer Lodge
Average fertility rate in Deer Lodge is 38.0 births per 1,000 women. Women in the age bracket of 35 to 50 years have the highest fertility rate with 41.0 births per 1,000 women. Women in the age bracket of 35 to 50 years acount for 66.7% of all women with births.
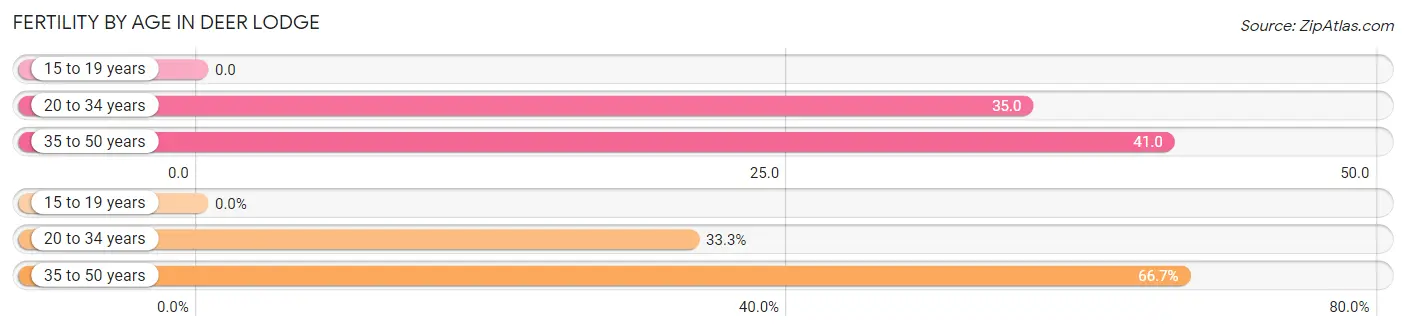
| Age Bracket | Women with Births | Births / 1,000 Women |
| 15 to 19 years | 0 (0.0%) | 0.0 |
| 20 to 34 years | 5 (33.3%) | 35.0 |
| 35 to 50 years | 10 (66.7%) | 41.0 |
| Total | 15 (100.0%) | 38.0 |
Fertility by Age by Marriage Status in Deer Lodge
66.7% of women with births (15) in Deer Lodge are married. The highest percentage of unmarried women with births falls into 20 to 34 years age bracket with 100.0% of them unmarried at the time of birth, while the lowest percentage of unmarried women with births belong to 35 to 50 years age bracket with 0.0% of them unmarried.
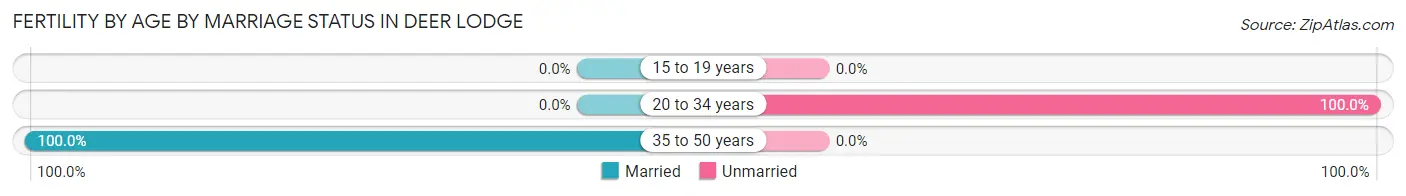
| Age Bracket | Married | Unmarried |
| 15 to 19 years | 0 (0.0%) | 0 (0.0%) |
| 20 to 34 years | 0 (0.0%) | 5 (100.0%) |
| 35 to 50 years | 10 (100.0%) | 0 (0.0%) |
| Total | 10 (66.7%) | 5 (33.3%) |
Fertility by Education in Deer Lodge
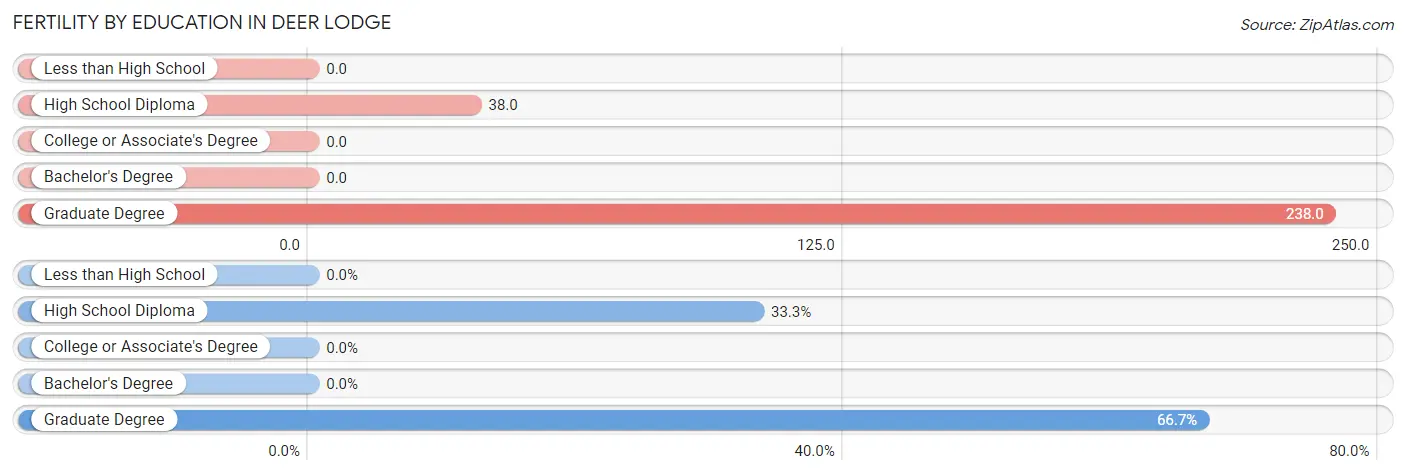
| Educational Attainment | Women with Births | Births / 1,000 Women |
| Less than High School | 0 (0.0%) | 0.0 |
| High School Diploma | 5 (33.3%) | 38.0 |
| College or Associate's Degree | 0 (0.0%) | 0.0 |
| Bachelor's Degree | 0 (0.0%) | 0.0 |
| Graduate Degree | 10 (66.7%) | 238.0 |
| Total | 15 (100.0%) | 38.0 |
Fertility by Education by Marriage Status in Deer Lodge
33.3% of women with births in Deer Lodge are unmarried. Women with the educational attainment of graduate degree are most likely to be married with 100.0% of them married at childbirth, while women with the educational attainment of high school diploma are least likely to be married with 100.0% of them unmarried at childbirth.
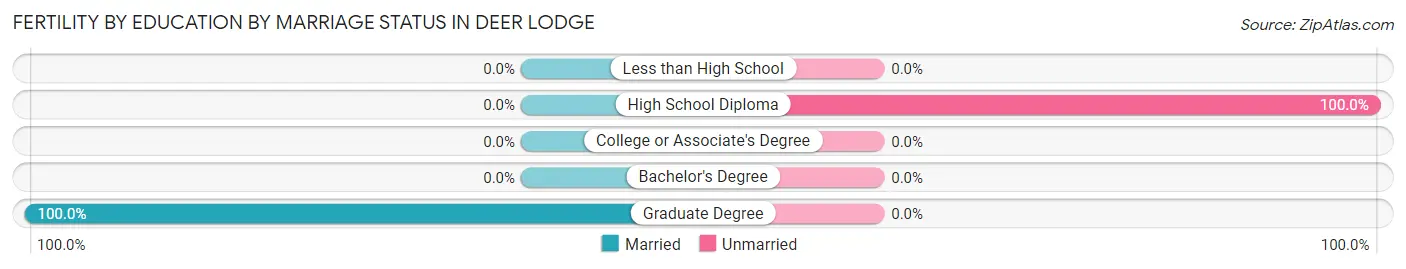
| Educational Attainment | Married | Unmarried |
| Less than High School | 0 (0.0%) | 0 (0.0%) |
| High School Diploma | 0 (0.0%) | 5 (100.0%) |
| College or Associate's Degree | 0 (0.0%) | 0 (0.0%) |
| Bachelor's Degree | 0 (0.0%) | 0 (0.0%) |
| Graduate Degree | 10 (100.0%) | 0 (0.0%) |
| Total | 10 (66.7%) | 5 (33.3%) |
Employment Characteristics in Deer Lodge
Employment by Class of Employer in Deer Lodge
Among the 1,212 employed individuals in Deer Lodge, private company employees (647 | 53.4%), state government employees (162 | 13.4%), and local government employees (110 | 9.1%) make up the most common classes of employment.
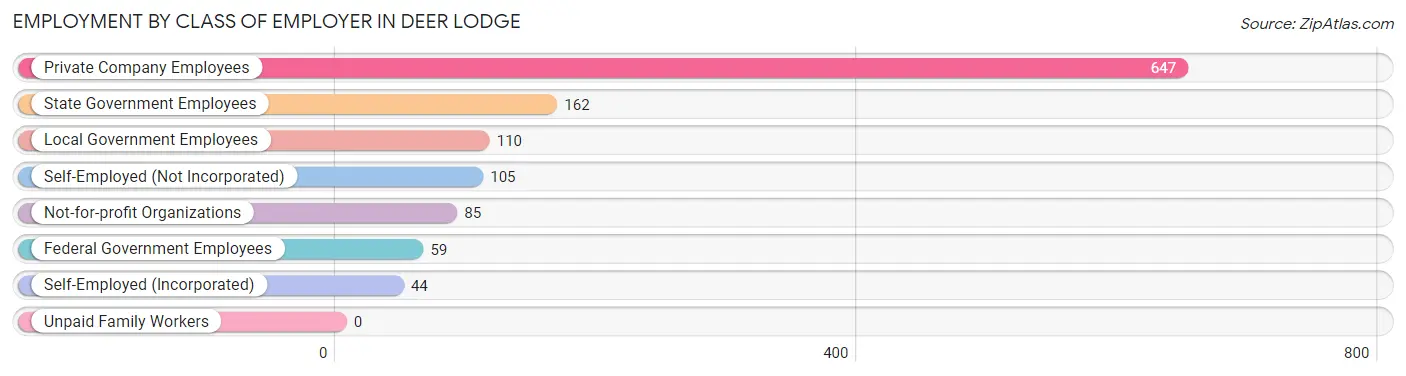
| Employer Class | # Employees | % Employees |
| Private Company Employees | 647 | 53.4% |
| Self-Employed (Incorporated) | 44 | 3.6% |
| Self-Employed (Not Incorporated) | 105 | 8.7% |
| Not-for-profit Organizations | 85 | 7.0% |
| Local Government Employees | 110 | 9.1% |
| State Government Employees | 162 | 13.4% |
| Federal Government Employees | 59 | 4.9% |
| Unpaid Family Workers | 0 | 0.0% |
| Total | 1,212 | 100.0% |
Employment Status by Age in Deer Lodge
According to the labor force statistics for Deer Lodge, out of the total population over 16 years of age (2,527), 54.2% or 1,370 individuals are in the labor force, with 3.4% or 47 of them unemployed. The age group with the highest labor force participation rate is 20 to 24 years, with 100.0% or 59 individuals in the labor force. Within the labor force, the 25 to 29 years age range has the highest percentage of unemployed individuals, with 28.6% or 40 of them being unemployed.
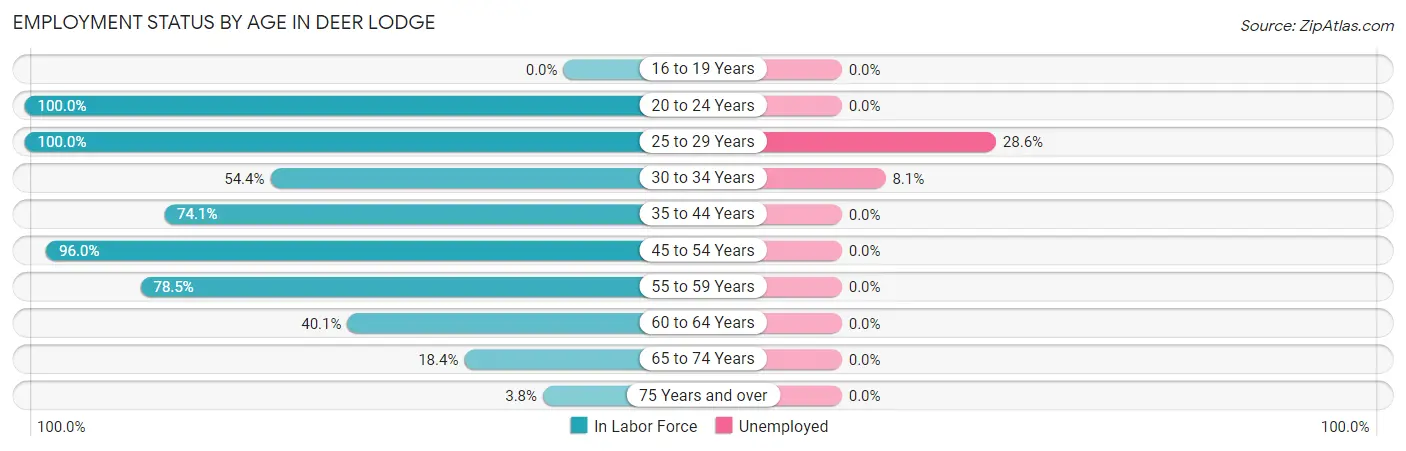
| Age Bracket | In Labor Force | Unemployed |
| 16 to 19 Years | 0 (0.0%) | 0 (0.0%) |
| 20 to 24 Years | 59 (100.0%) | 0 (0.0%) |
| 25 to 29 Years | 140 (100.0%) | 40 (28.6%) |
| 30 to 34 Years | 86 (54.4%) | 7 (8.1%) |
| 35 to 44 Years | 281 (74.1%) | 0 (0.0%) |
| 45 to 54 Years | 382 (96.0%) | 0 (0.0%) |
| 55 to 59 Years | 201 (78.5%) | 0 (0.0%) |
| 60 to 64 Years | 119 (40.1%) | 0 (0.0%) |
| 65 to 74 Years | 89 (18.4%) | 0 (0.0%) |
| 75 Years and over | 13 (3.8%) | 0 (0.0%) |
| Total | 1,370 (54.2%) | 47 (3.4%) |
Employment Status by Educational Attainment in Deer Lodge
According to labor force statistics for Deer Lodge, 74.3% of individuals (1,210) out of the total population between 25 and 64 years of age (1,628) are in the labor force, with 3.9% or 47 of them being unemployed. The group with the highest labor force participation rate are those with the educational attainment of bachelor's degree or higher, with 91.5% or 376 individuals in the labor force. Within the labor force, individuals with high school diploma education have the highest percentage of unemployment, with 10.6% or 47 of them being unemployed.
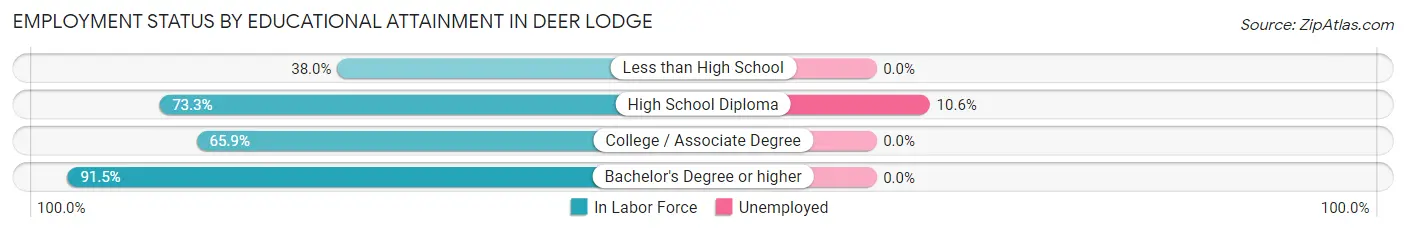
| Educational Attainment | In Labor Force | Unemployed |
| Less than High School | 19 (38.0%) | 0 (0.0%) |
| High School Diploma | 443 (73.3%) | 64 (10.6%) |
| College / Associate Degree | 371 (65.9%) | 0 (0.0%) |
| Bachelor's Degree or higher | 376 (91.5%) | 0 (0.0%) |
| Total | 1,210 (74.3%) | 63 (3.9%) |
Employment Occupations by Sex in Deer Lodge
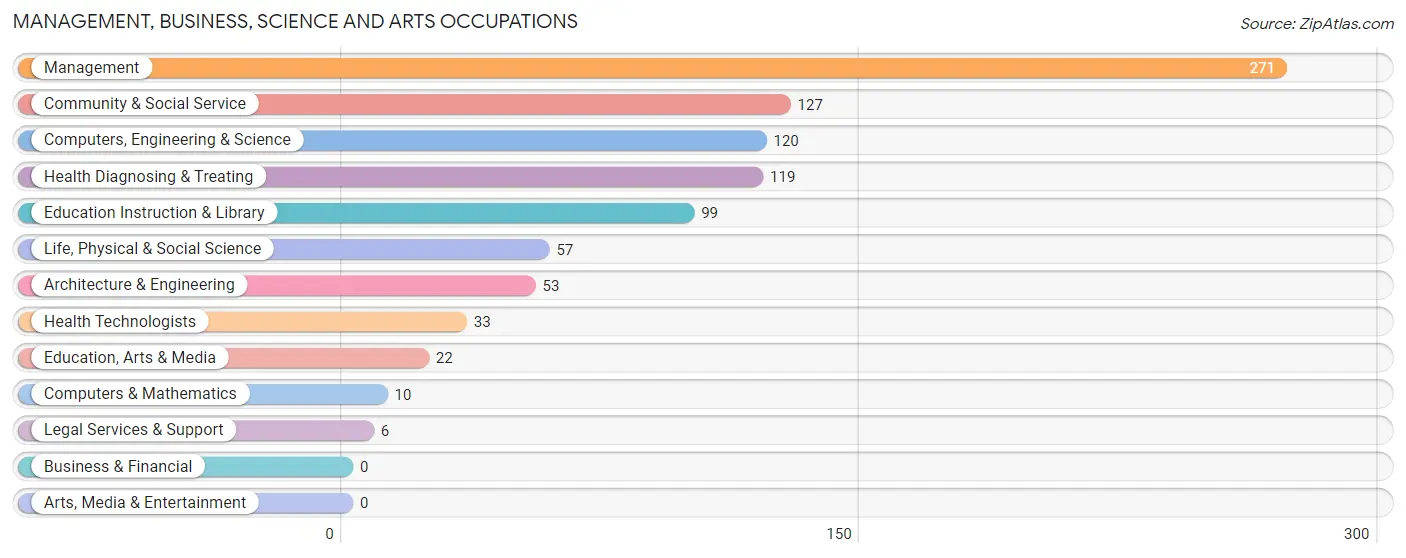
Management, Business, Science and Arts Occupations
The most common Management, Business, Science and Arts occupations in Deer Lodge are Management (271 | 20.5%), Community & Social Service (127 | 9.6%), Computers, Engineering & Science (120 | 9.1%), Health Diagnosing & Treating (119 | 9.0%), and Education Instruction & Library (99 | 7.5%).
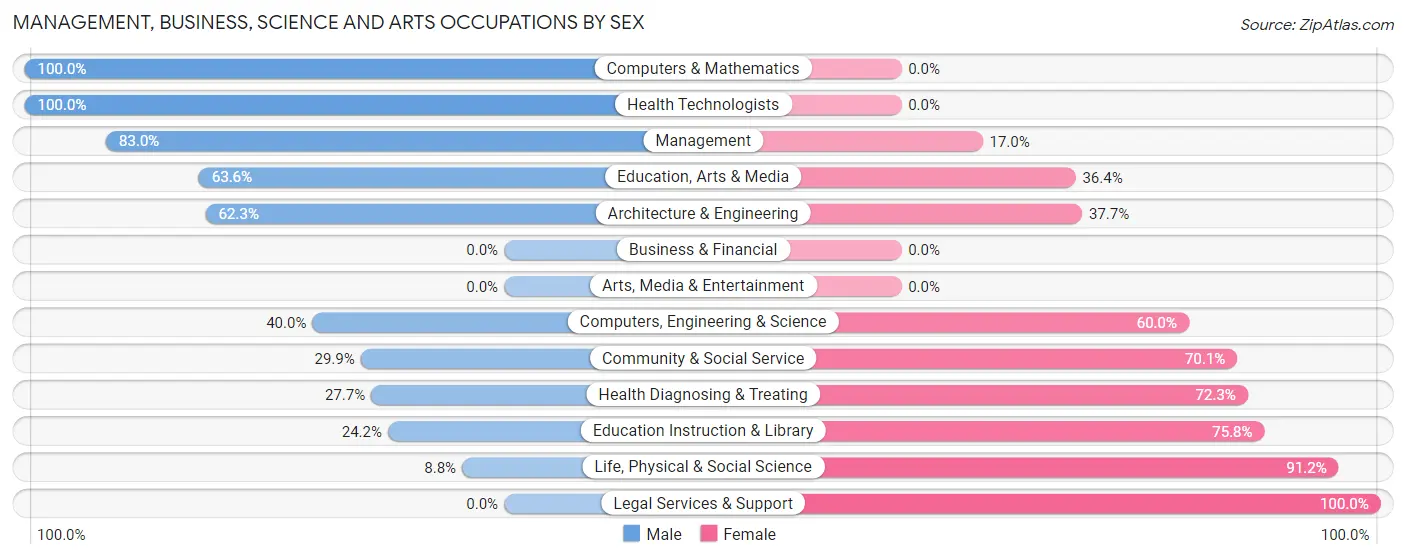
Management, Business, Science and Arts Occupations by Sex
Within the Management, Business, Science and Arts occupations in Deer Lodge, the most male-oriented occupations are Computers & Mathematics (100.0%), Health Technologists (100.0%), and Management (83.0%), while the most female-oriented occupations are Legal Services & Support (100.0%), Life, Physical & Social Science (91.2%), and Education Instruction & Library (75.8%).
| Occupation | Male | Female |
| Management | 225 (83.0%) | 46 (17.0%) |
| Business & Financial | 0 (0.0%) | 0 (0.0%) |
| Computers, Engineering & Science | 48 (40.0%) | 72 (60.0%) |
| Computers & Mathematics | 10 (100.0%) | 0 (0.0%) |
| Architecture & Engineering | 33 (62.3%) | 20 (37.7%) |
| Life, Physical & Social Science | 5 (8.8%) | 52 (91.2%) |
| Community & Social Service | 38 (29.9%) | 89 (70.1%) |
| Education, Arts & Media | 14 (63.6%) | 8 (36.4%) |
| Legal Services & Support | 0 (0.0%) | 6 (100.0%) |
| Education Instruction & Library | 24 (24.2%) | 75 (75.8%) |
| Arts, Media & Entertainment | 0 (0.0%) | 0 (0.0%) |
| Health Diagnosing & Treating | 33 (27.7%) | 86 (72.3%) |
| Health Technologists | 33 (100.0%) | 0 (0.0%) |
| Total (Category) | 344 (54.0%) | 293 (46.0%) |
| Total (Overall) | 743 (56.2%) | 580 (43.8%) |
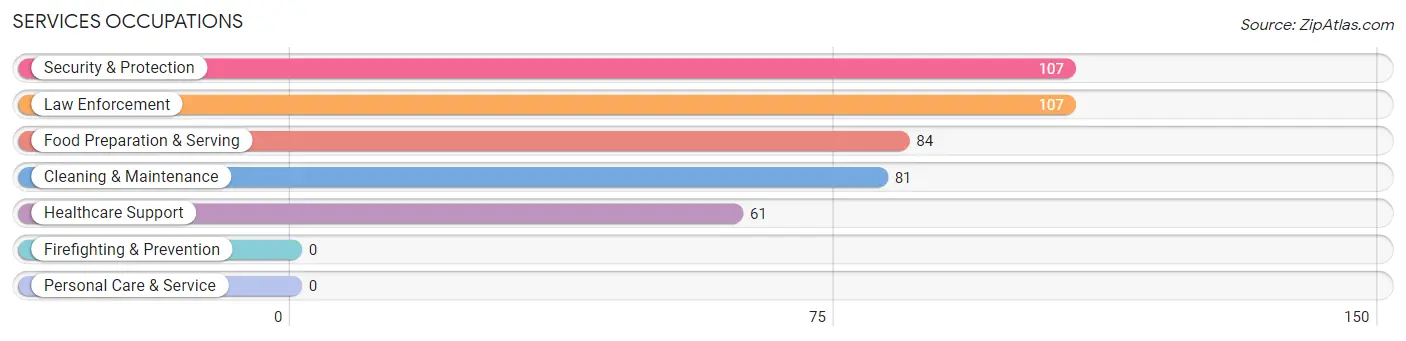
Services Occupations
The most common Services occupations in Deer Lodge are Security & Protection (107 | 8.1%), Law Enforcement (107 | 8.1%), Food Preparation & Serving (84 | 6.4%), Cleaning & Maintenance (81 | 6.1%), and Healthcare Support (61 | 4.6%).
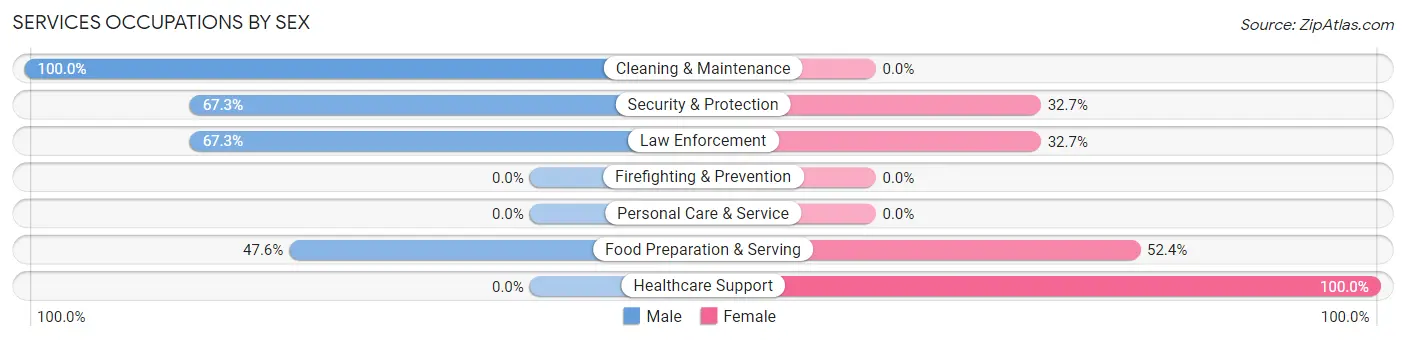
Services Occupations by Sex
Within the Services occupations in Deer Lodge, the most male-oriented occupations are Cleaning & Maintenance (100.0%), Security & Protection (67.3%), and Law Enforcement (67.3%), while the most female-oriented occupations are Healthcare Support (100.0%), Food Preparation & Serving (52.4%), and Security & Protection (32.7%).
| Occupation | Male | Female |
| Healthcare Support | 0 (0.0%) | 61 (100.0%) |
| Security & Protection | 72 (67.3%) | 35 (32.7%) |
| Firefighting & Prevention | 0 (0.0%) | 0 (0.0%) |
| Law Enforcement | 72 (67.3%) | 35 (32.7%) |
| Food Preparation & Serving | 40 (47.6%) | 44 (52.4%) |
| Cleaning & Maintenance | 81 (100.0%) | 0 (0.0%) |
| Personal Care & Service | 0 (0.0%) | 0 (0.0%) |
| Total (Category) | 193 (58.0%) | 140 (42.0%) |
| Total (Overall) | 743 (56.2%) | 580 (43.8%) |
Sales and Office Occupations
The most common Sales and Office occupations in Deer Lodge are Sales & Related (122 | 9.2%), and Office & Administration (70 | 5.3%).
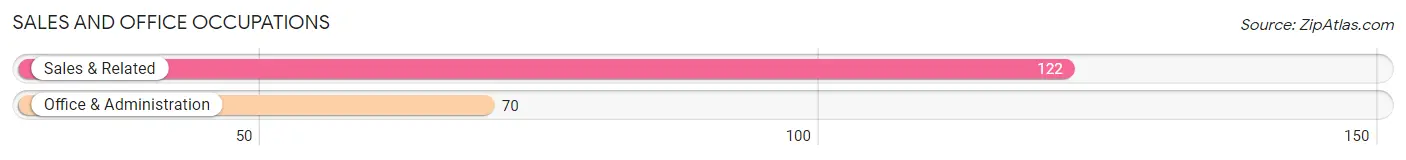
Sales and Office Occupations by Sex
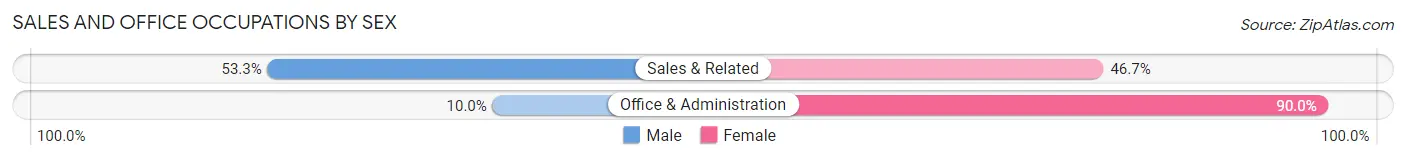
| Occupation | Male | Female |
| Sales & Related | 65 (53.3%) | 57 (46.7%) |
| Office & Administration | 7 (10.0%) | 63 (90.0%) |
| Total (Category) | 72 (37.5%) | 120 (62.5%) |
| Total (Overall) | 743 (56.2%) | 580 (43.8%) |
Natural Resources, Construction and Maintenance Occupations
The most common Natural Resources, Construction and Maintenance occupations in Deer Lodge are Farming, Fishing & Forestry (18 | 1.4%), and Construction & Extraction (8 | 0.6%).
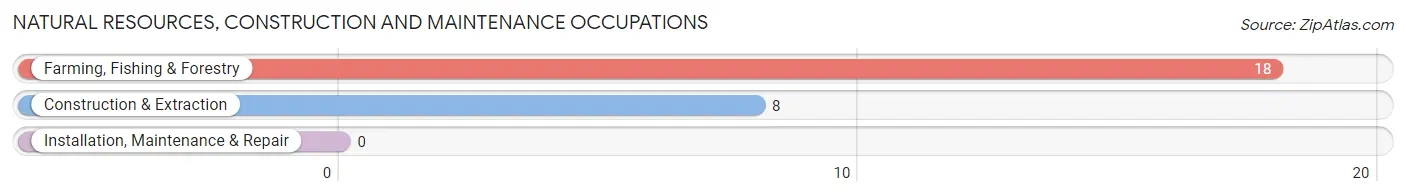
Natural Resources, Construction and Maintenance Occupations by Sex
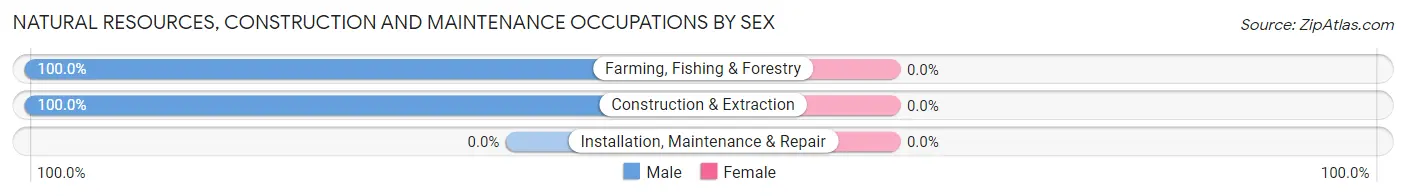
| Occupation | Male | Female |
| Farming, Fishing & Forestry | 18 (100.0%) | 0 (0.0%) |
| Construction & Extraction | 8 (100.0%) | 0 (0.0%) |
| Installation, Maintenance & Repair | 0 (0.0%) | 0 (0.0%) |
| Total (Category) | 26 (100.0%) | 0 (0.0%) |
| Total (Overall) | 743 (56.2%) | 580 (43.8%) |
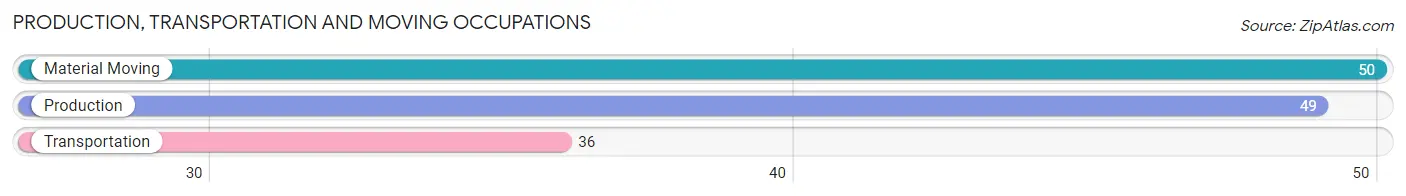
Production, Transportation and Moving Occupations
The most common Production, Transportation and Moving occupations in Deer Lodge are Material Moving (50 | 3.8%), Production (49 | 3.7%), and Transportation (36 | 2.7%).
Production, Transportation and Moving Occupations by Sex
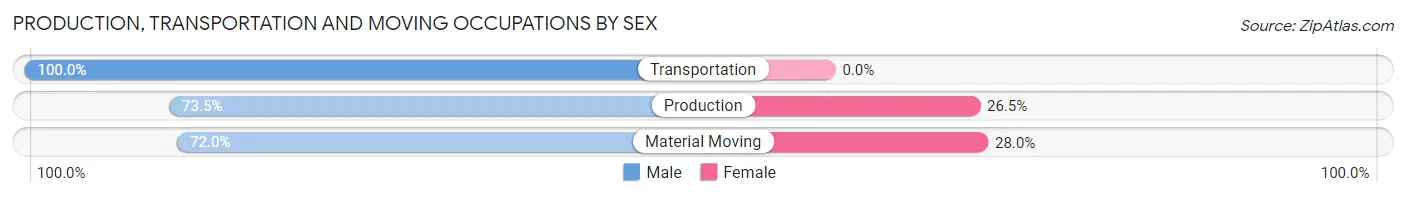
| Occupation | Male | Female |
| Production | 36 (73.5%) | 13 (26.5%) |
| Transportation | 36 (100.0%) | 0 (0.0%) |
| Material Moving | 36 (72.0%) | 14 (28.0%) |
| Total (Category) | 108 (80.0%) | 27 (20.0%) |
| Total (Overall) | 743 (56.2%) | 580 (43.8%) |
Employment Industries by Sex in Deer Lodge
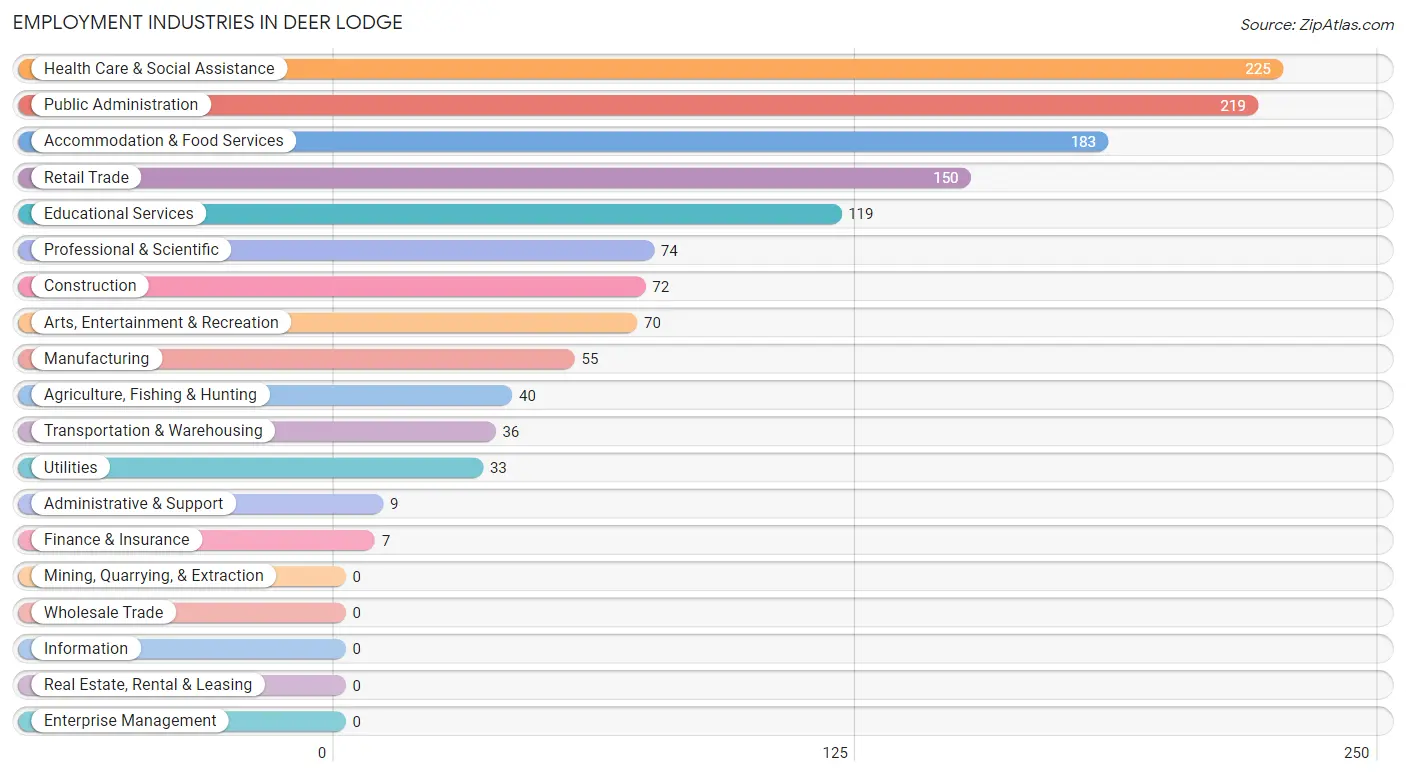
Employment Industries in Deer Lodge
The major employment industries in Deer Lodge include Health Care & Social Assistance (225 | 17.0%), Public Administration (219 | 16.6%), Accommodation & Food Services (183 | 13.8%), Retail Trade (150 | 11.3%), and Educational Services (119 | 9.0%).
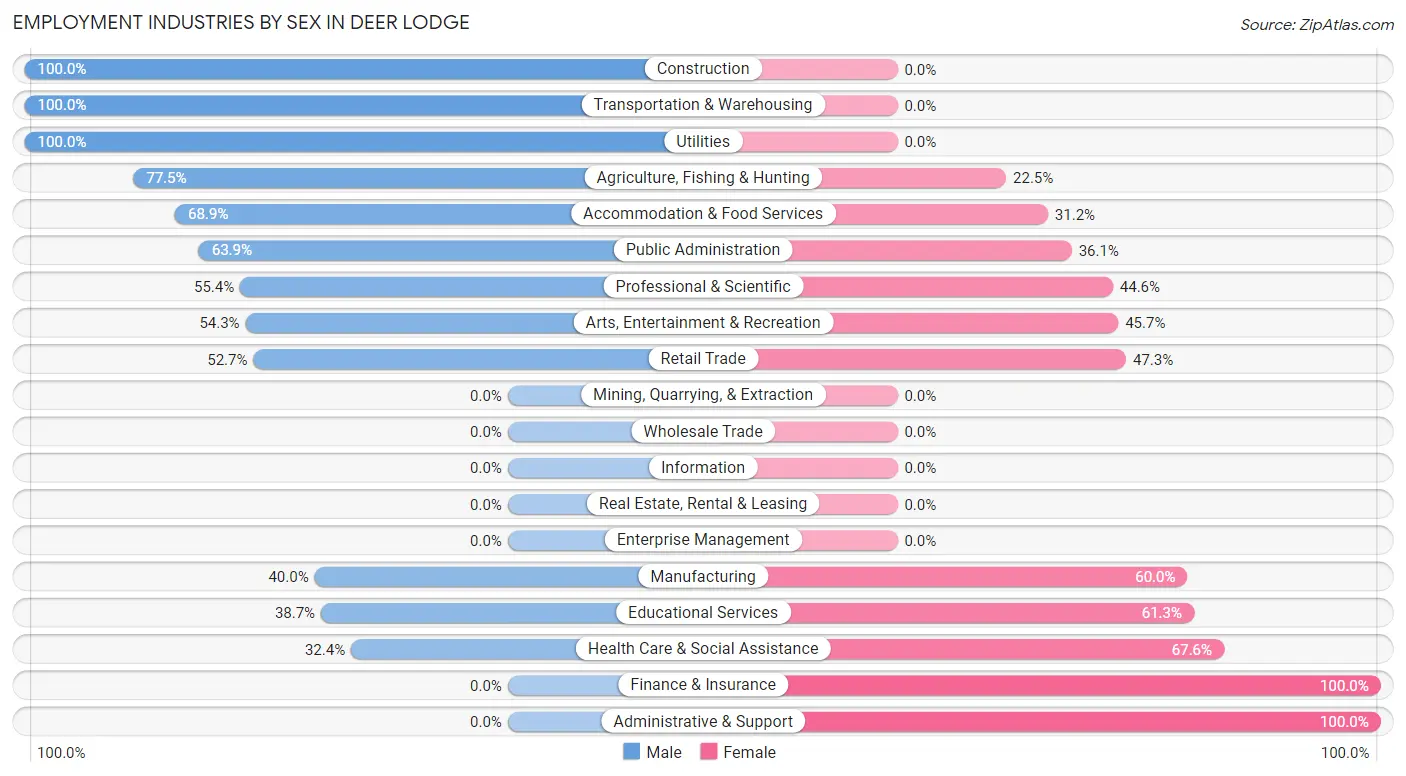
Employment Industries by Sex in Deer Lodge
The Deer Lodge industries that see more men than women are Construction (100.0%), Transportation & Warehousing (100.0%), and Utilities (100.0%), whereas the industries that tend to have a higher number of women are Finance & Insurance (100.0%), Administrative & Support (100.0%), and Health Care & Social Assistance (67.6%).
| Industry | Male | Female |
| Agriculture, Fishing & Hunting | 31 (77.5%) | 9 (22.5%) |
| Mining, Quarrying, & Extraction | 0 (0.0%) | 0 (0.0%) |
| Construction | 72 (100.0%) | 0 (0.0%) |
| Manufacturing | 22 (40.0%) | 33 (60.0%) |
| Wholesale Trade | 0 (0.0%) | 0 (0.0%) |
| Retail Trade | 79 (52.7%) | 71 (47.3%) |
| Transportation & Warehousing | 36 (100.0%) | 0 (0.0%) |
| Utilities | 33 (100.0%) | 0 (0.0%) |
| Information | 0 (0.0%) | 0 (0.0%) |
| Finance & Insurance | 0 (0.0%) | 7 (100.0%) |
| Real Estate, Rental & Leasing | 0 (0.0%) | 0 (0.0%) |
| Professional & Scientific | 41 (55.4%) | 33 (44.6%) |
| Enterprise Management | 0 (0.0%) | 0 (0.0%) |
| Administrative & Support | 0 (0.0%) | 9 (100.0%) |
| Educational Services | 46 (38.7%) | 73 (61.3%) |
| Health Care & Social Assistance | 73 (32.4%) | 152 (67.6%) |
| Arts, Entertainment & Recreation | 38 (54.3%) | 32 (45.7%) |
| Accommodation & Food Services | 126 (68.9%) | 57 (31.1%) |
| Public Administration | 140 (63.9%) | 79 (36.1%) |
| Total | 743 (56.2%) | 580 (43.8%) |
Education in Deer Lodge
School Enrollment in Deer Lodge
The most common levels of schooling among the 233 students in Deer Lodge are middle school (85 | 36.5%), elementary school (73 | 31.3%), and graduate / professional (29 | 12.4%).
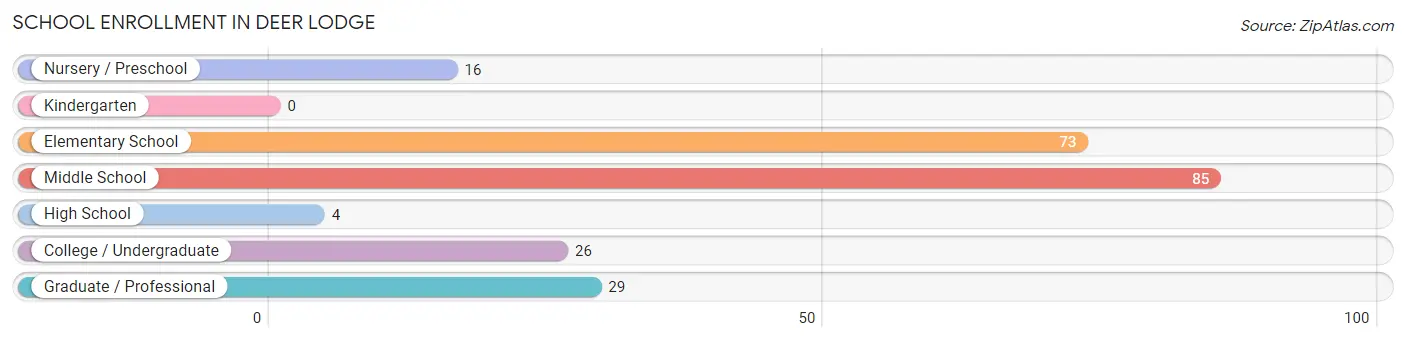
| School Level | # Students | % Students |
| Nursery / Preschool | 16 | 6.9% |
| Kindergarten | 0 | 0.0% |
| Elementary School | 73 | 31.3% |
| Middle School | 85 | 36.5% |
| High School | 4 | 1.7% |
| College / Undergraduate | 26 | 11.2% |
| Graduate / Professional | 29 | 12.4% |
| Total | 233 | 100.0% |
School Enrollment by Age by Funding Source in Deer Lodge
Out of a total of 233 students who are enrolled in schools in Deer Lodge, 42 (18.0%) attend a private institution, while the remaining 191 (82.0%) are enrolled in public schools. The age group of 3 to 4 year olds has the highest likelihood of being enrolled in private schools, with 9 (100.0% in the age bracket) enrolled. Conversely, the age group of 15 to 17 year olds has the lowest likelihood of being enrolled in a private school, with 4 (100.0% in the age bracket) attending a public institution.
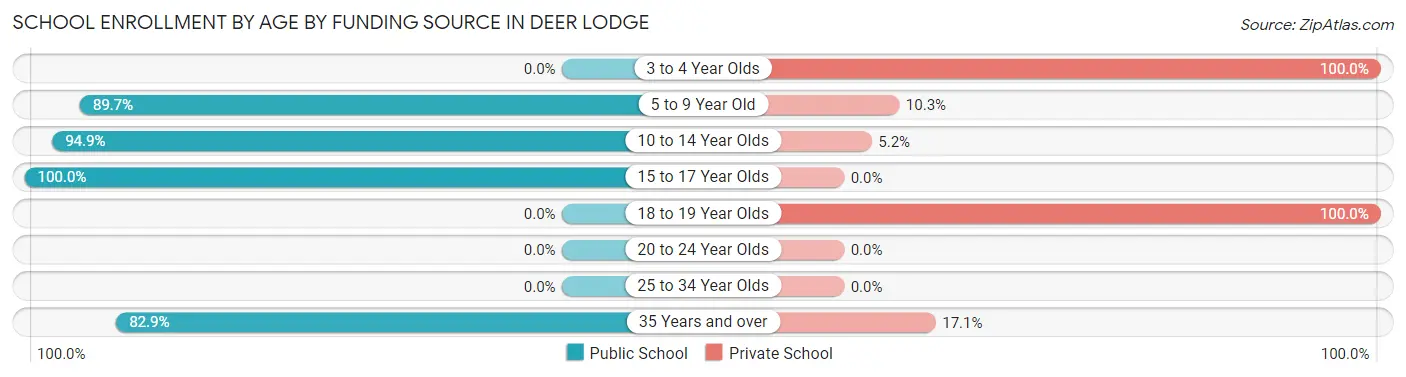
| Age Bracket | Public School | Private School |
| 3 to 4 Year Olds | 0 (0.0%) | 9 (100.0%) |
| 5 to 9 Year Old | 61 (89.7%) | 7 (10.3%) |
| 10 to 14 Year Olds | 92 (94.9%) | 5 (5.1%) |
| 15 to 17 Year Olds | 4 (100.0%) | 0 (0.0%) |
| 18 to 19 Year Olds | 0 (0.0%) | 14 (100.0%) |
| 20 to 24 Year Olds | 0 (0.0%) | 0 (0.0%) |
| 25 to 34 Year Olds | 0 (0.0%) | 0 (0.0%) |
| 35 Years and over | 34 (82.9%) | 7 (17.1%) |
| Total | 191 (82.0%) | 42 (18.0%) |
Educational Attainment by Field of Study in Deer Lodge
Science & technology (157 | 28.6%), education (127 | 23.2%), bio, nature & agricultural (57 | 10.4%), liberal arts & history (53 | 9.7%), and engineering (46 | 8.4%) are the most common fields of study among 548 individuals in Deer Lodge who have obtained a bachelor's degree or higher.
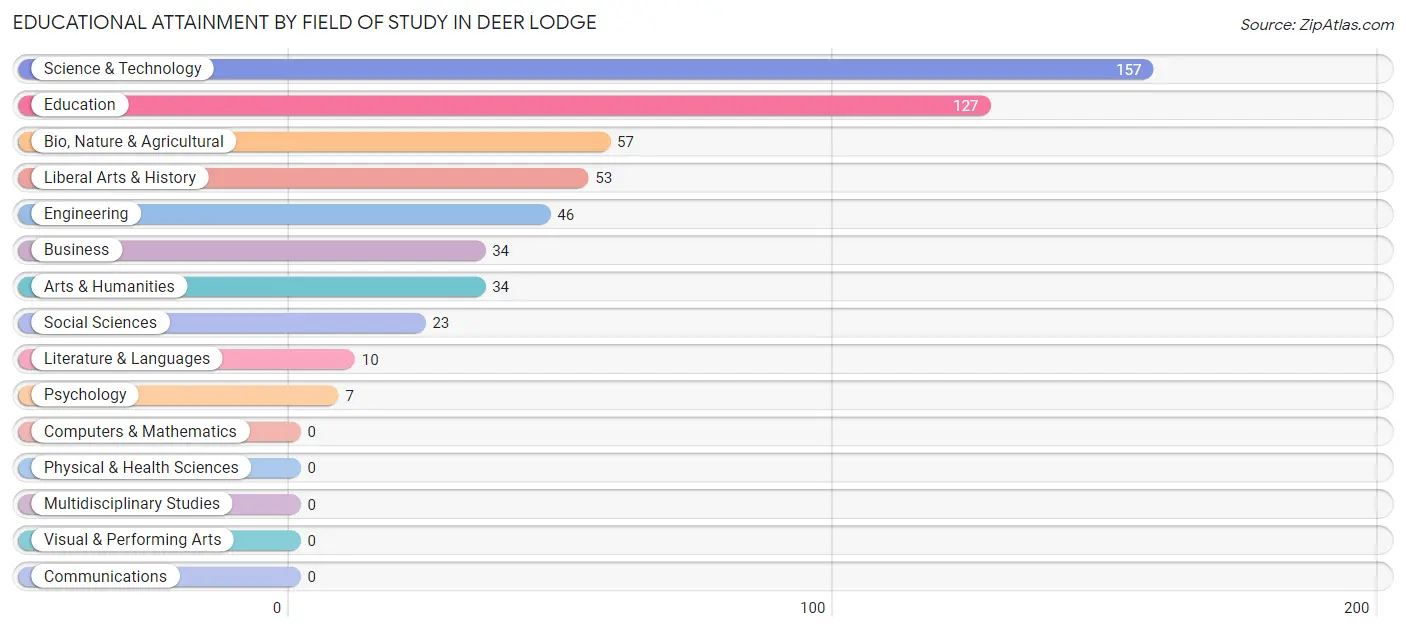
| Field of Study | # Graduates | % Graduates |
| Computers & Mathematics | 0 | 0.0% |
| Bio, Nature & Agricultural | 57 | 10.4% |
| Physical & Health Sciences | 0 | 0.0% |
| Psychology | 7 | 1.3% |
| Social Sciences | 23 | 4.2% |
| Engineering | 46 | 8.4% |
| Multidisciplinary Studies | 0 | 0.0% |
| Science & Technology | 157 | 28.6% |
| Business | 34 | 6.2% |
| Education | 127 | 23.2% |
| Literature & Languages | 10 | 1.8% |
| Liberal Arts & History | 53 | 9.7% |
| Visual & Performing Arts | 0 | 0.0% |
| Communications | 0 | 0.0% |
| Arts & Humanities | 34 | 6.2% |
| Total | 548 | 100.0% |
Transportation & Commute in Deer Lodge
Vehicle Availability by Sex in Deer Lodge
The most prevalent vehicle ownership categories in Deer Lodge are males with 2 vehicles (342, accounting for 54.1%) and females with 2 vehicles (328, making up 59.0%).
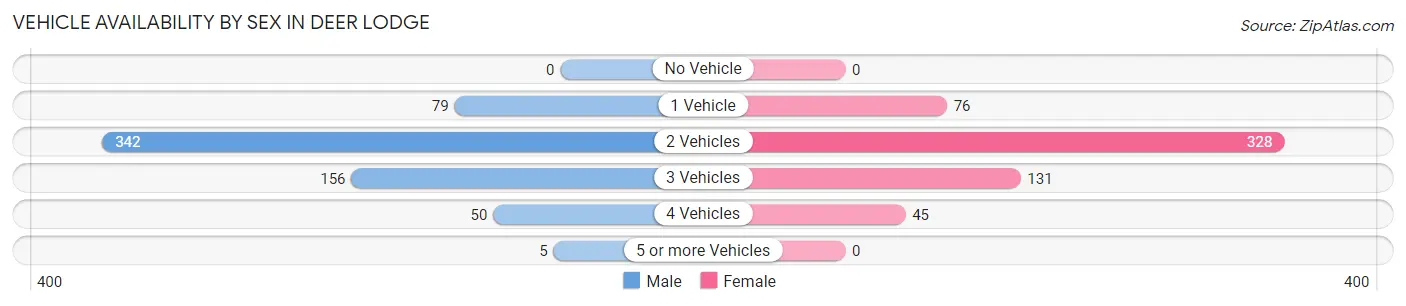
| Vehicles Available | Male | Female |
| No Vehicle | 0 (0.0%) | 0 (0.0%) |
| 1 Vehicle | 79 (12.5%) | 76 (13.1%) |
| 2 Vehicles | 342 (54.1%) | 328 (56.6%) |
| 3 Vehicles | 156 (24.7%) | 131 (22.6%) |
| 4 Vehicles | 50 (7.9%) | 45 (7.8%) |
| 5 or more Vehicles | 5 (0.8%) | 0 (0.0%) |
| Total | 632 (100.0%) | 580 (100.0%) |
Commute Time in Deer Lodge
The most frequently occuring commute durations in Deer Lodge are 10 to 14 minutes (434 commuters, 37.6%), 5 to 9 minutes (391 commuters, 33.9%), and 30 to 34 minutes (106 commuters, 9.2%).
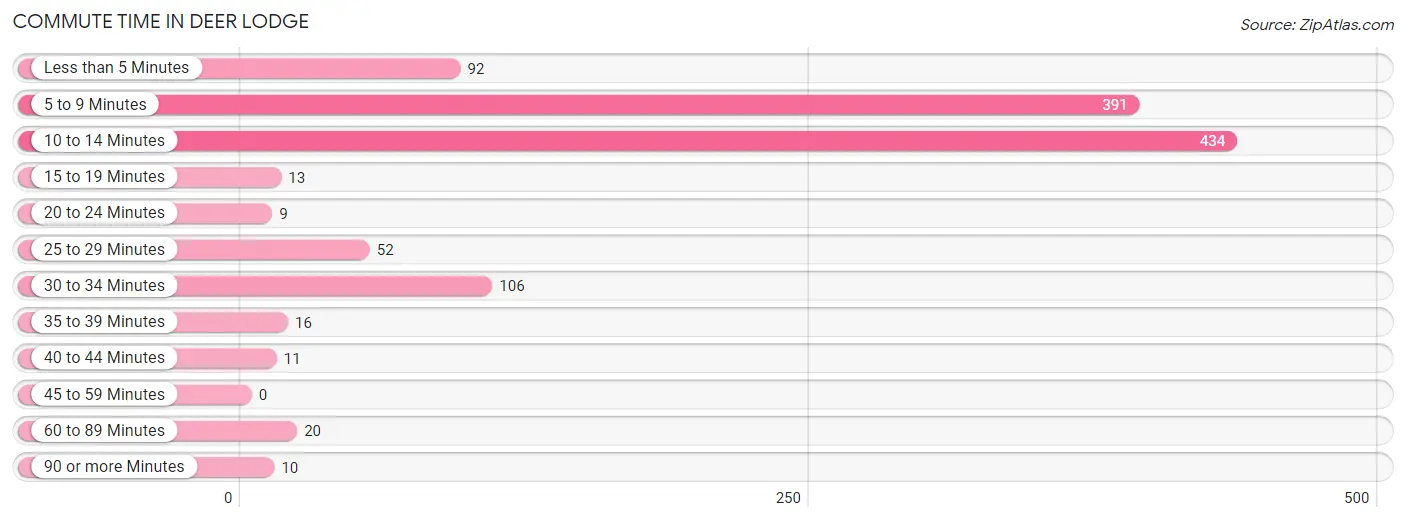
| Commute Time | # Commuters | % Commuters |
| Less than 5 Minutes | 92 | 8.0% |
| 5 to 9 Minutes | 391 | 33.9% |
| 10 to 14 Minutes | 434 | 37.6% |
| 15 to 19 Minutes | 13 | 1.1% |
| 20 to 24 Minutes | 9 | 0.8% |
| 25 to 29 Minutes | 52 | 4.5% |
| 30 to 34 Minutes | 106 | 9.2% |
| 35 to 39 Minutes | 16 | 1.4% |
| 40 to 44 Minutes | 11 | 0.9% |
| 45 to 59 Minutes | 0 | 0.0% |
| 60 to 89 Minutes | 20 | 1.7% |
| 90 or more Minutes | 10 | 0.9% |
Commute Time by Sex in Deer Lodge
The most common commute times in Deer Lodge are 10 to 14 minutes (233 commuters, 39.1%) for males and 5 to 9 minutes (212 commuters, 38.0%) for females.
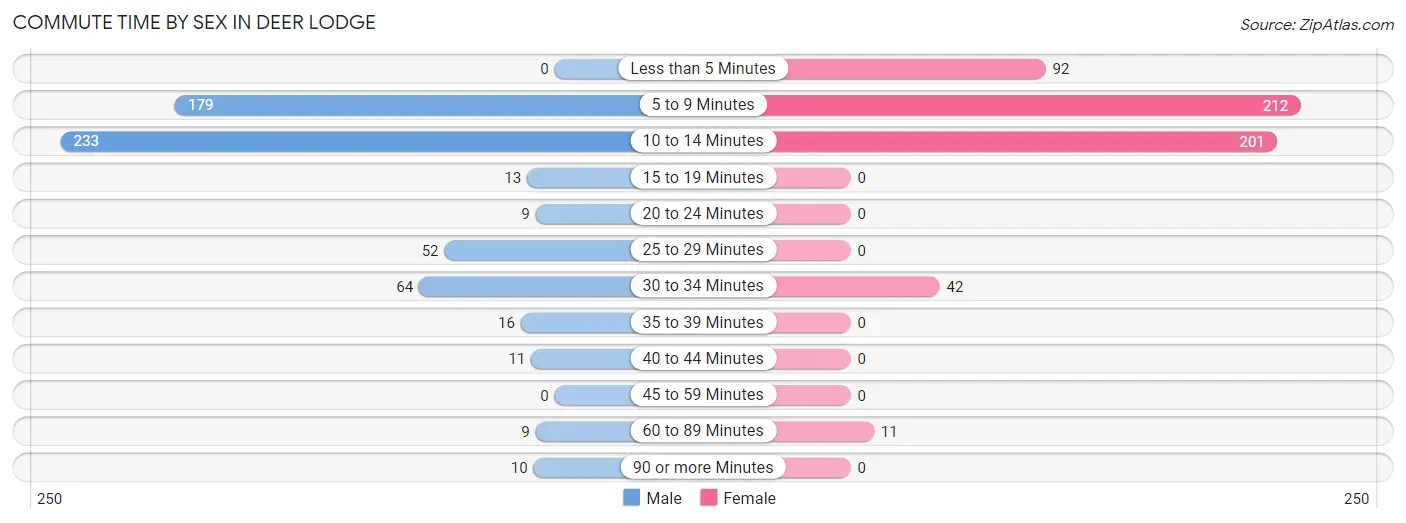
| Commute Time | Male | Female |
| Less than 5 Minutes | 0 (0.0%) | 92 (16.5%) |
| 5 to 9 Minutes | 179 (30.0%) | 212 (38.0%) |
| 10 to 14 Minutes | 233 (39.1%) | 201 (36.0%) |
| 15 to 19 Minutes | 13 (2.2%) | 0 (0.0%) |
| 20 to 24 Minutes | 9 (1.5%) | 0 (0.0%) |
| 25 to 29 Minutes | 52 (8.7%) | 0 (0.0%) |
| 30 to 34 Minutes | 64 (10.7%) | 42 (7.5%) |
| 35 to 39 Minutes | 16 (2.7%) | 0 (0.0%) |
| 40 to 44 Minutes | 11 (1.8%) | 0 (0.0%) |
| 45 to 59 Minutes | 0 (0.0%) | 0 (0.0%) |
| 60 to 89 Minutes | 9 (1.5%) | 11 (2.0%) |
| 90 or more Minutes | 10 (1.7%) | 0 (0.0%) |
Time of Departure to Work by Sex in Deer Lodge
The most frequent times of departure to work in Deer Lodge are 4:00 PM to 11:59 PM (155, 26.0%) for males and 7:30 AM to 7:59 AM (130, 23.3%) for females.
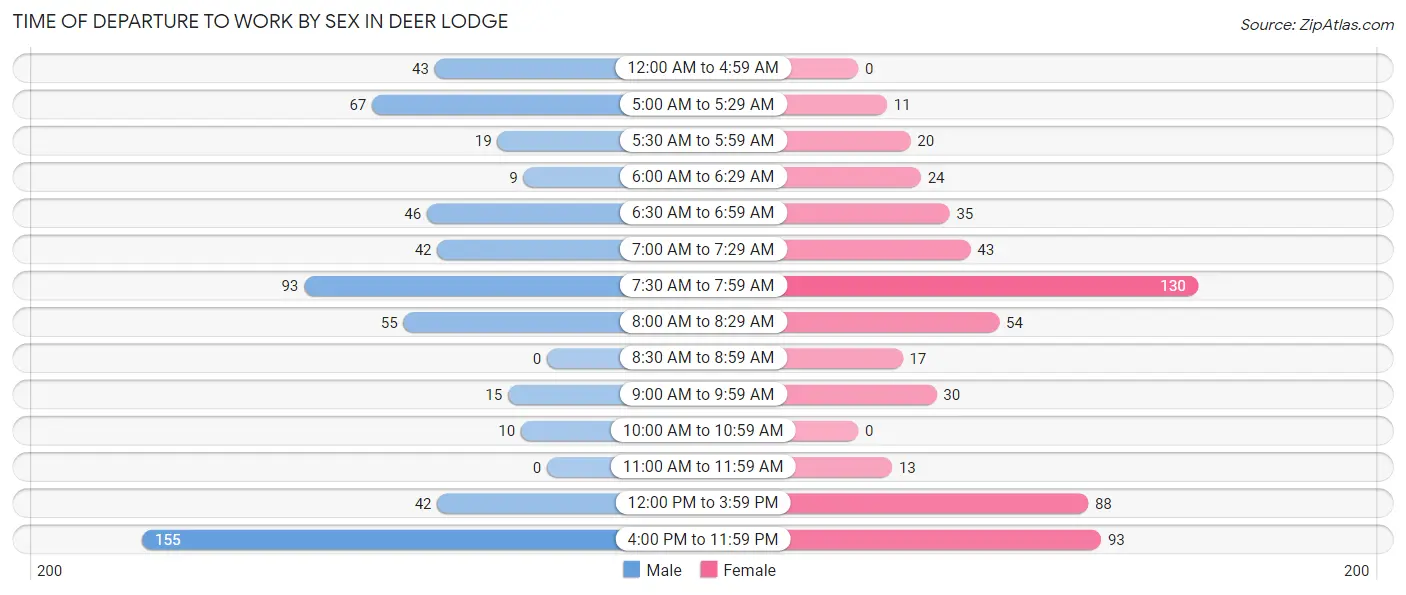
| Time of Departure | Male | Female |
| 12:00 AM to 4:59 AM | 43 (7.2%) | 0 (0.0%) |
| 5:00 AM to 5:29 AM | 67 (11.2%) | 11 (2.0%) |
| 5:30 AM to 5:59 AM | 19 (3.2%) | 20 (3.6%) |
| 6:00 AM to 6:29 AM | 9 (1.5%) | 24 (4.3%) |
| 6:30 AM to 6:59 AM | 46 (7.7%) | 35 (6.3%) |
| 7:00 AM to 7:29 AM | 42 (7.0%) | 43 (7.7%) |
| 7:30 AM to 7:59 AM | 93 (15.6%) | 130 (23.3%) |
| 8:00 AM to 8:29 AM | 55 (9.2%) | 54 (9.7%) |
| 8:30 AM to 8:59 AM | 0 (0.0%) | 17 (3.0%) |
| 9:00 AM to 9:59 AM | 15 (2.5%) | 30 (5.4%) |
| 10:00 AM to 10:59 AM | 10 (1.7%) | 0 (0.0%) |
| 11:00 AM to 11:59 AM | 0 (0.0%) | 13 (2.3%) |
| 12:00 PM to 3:59 PM | 42 (7.0%) | 88 (15.8%) |
| 4:00 PM to 11:59 PM | 155 (26.0%) | 93 (16.7%) |
| Total | 596 (100.0%) | 558 (100.0%) |
Housing Occupancy in Deer Lodge
Occupancy by Ownership in Deer Lodge
Of the total 1,448 dwellings in Deer Lodge, owner-occupied units account for 959 (66.2%), while renter-occupied units make up 489 (33.8%).
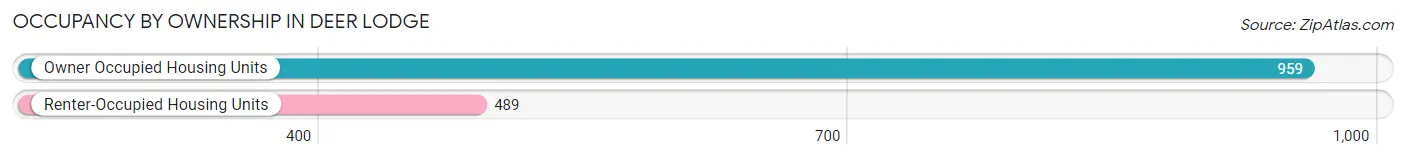
| Occupancy | # Housing Units | % Housing Units |
| Owner Occupied Housing Units | 959 | 66.2% |
| Renter-Occupied Housing Units | 489 | 33.8% |
| Total Occupied Housing Units | 1,448 | 100.0% |
Occupancy by Household Size in Deer Lodge
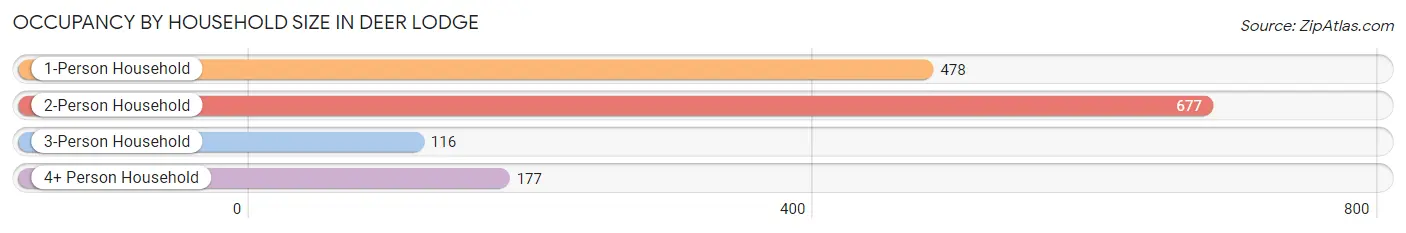
| Household Size | # Housing Units | % Housing Units |
| 1-Person Household | 478 | 33.0% |
| 2-Person Household | 677 | 46.8% |
| 3-Person Household | 116 | 8.0% |
| 4+ Person Household | 177 | 12.2% |
| Total Housing Units | 1,448 | 100.0% |
Occupancy by Ownership by Household Size in Deer Lodge
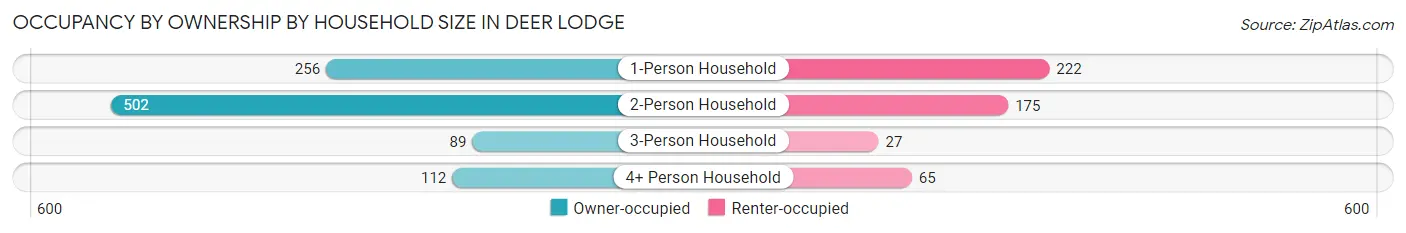
| Household Size | Owner-occupied | Renter-occupied |
| 1-Person Household | 256 (53.6%) | 222 (46.4%) |
| 2-Person Household | 502 (74.2%) | 175 (25.9%) |
| 3-Person Household | 89 (76.7%) | 27 (23.3%) |
| 4+ Person Household | 112 (63.3%) | 65 (36.7%) |
| Total Housing Units | 959 (66.2%) | 489 (33.8%) |
Occupancy by Educational Attainment in Deer Lodge
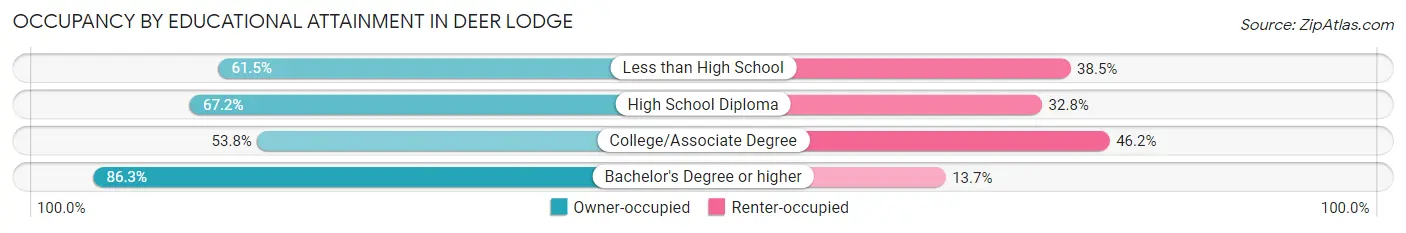
| Household Size | Owner-occupied | Renter-occupied |
| Less than High School | 24 (61.5%) | 15 (38.5%) |
| High School Diploma | 340 (67.2%) | 166 (32.8%) |
| College/Associate Degree | 305 (53.8%) | 262 (46.2%) |
| Bachelor's Degree or higher | 290 (86.3%) | 46 (13.7%) |
Occupancy by Age of Householder in Deer Lodge
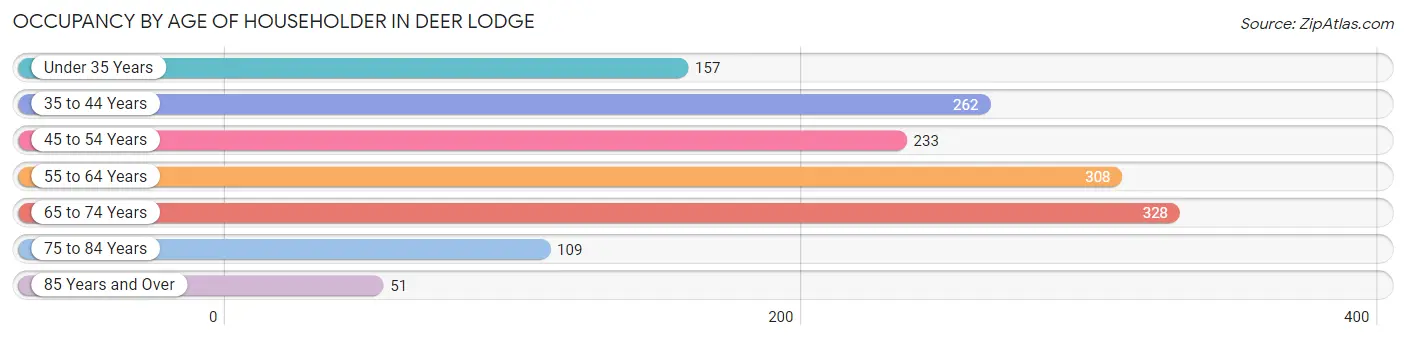
| Age Bracket | # Households | % Households |
| Under 35 Years | 157 | 10.8% |
| 35 to 44 Years | 262 | 18.1% |
| 45 to 54 Years | 233 | 16.1% |
| 55 to 64 Years | 308 | 21.3% |
| 65 to 74 Years | 328 | 22.7% |
| 75 to 84 Years | 109 | 7.5% |
| 85 Years and Over | 51 | 3.5% |
| Total | 1,448 | 100.0% |
Housing Finances in Deer Lodge
Median Income by Occupancy in Deer Lodge
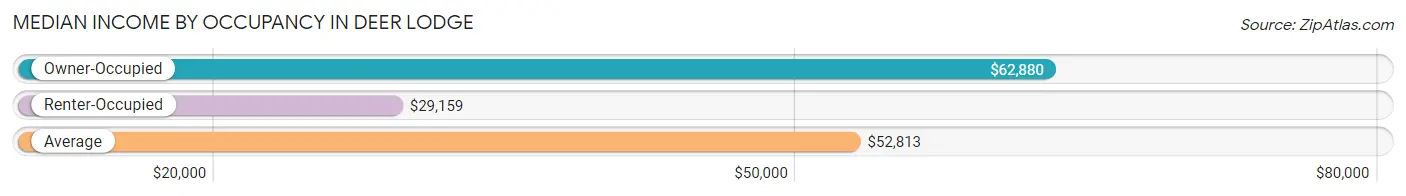
| Occupancy Type | # Households | Median Income |
| Owner-Occupied | 959 (66.2%) | $62,880 |
| Renter-Occupied | 489 (33.8%) | $29,159 |
| Average | 1,448 (100.0%) | $52,813 |
Occupancy by Householder Income Bracket in Deer Lodge
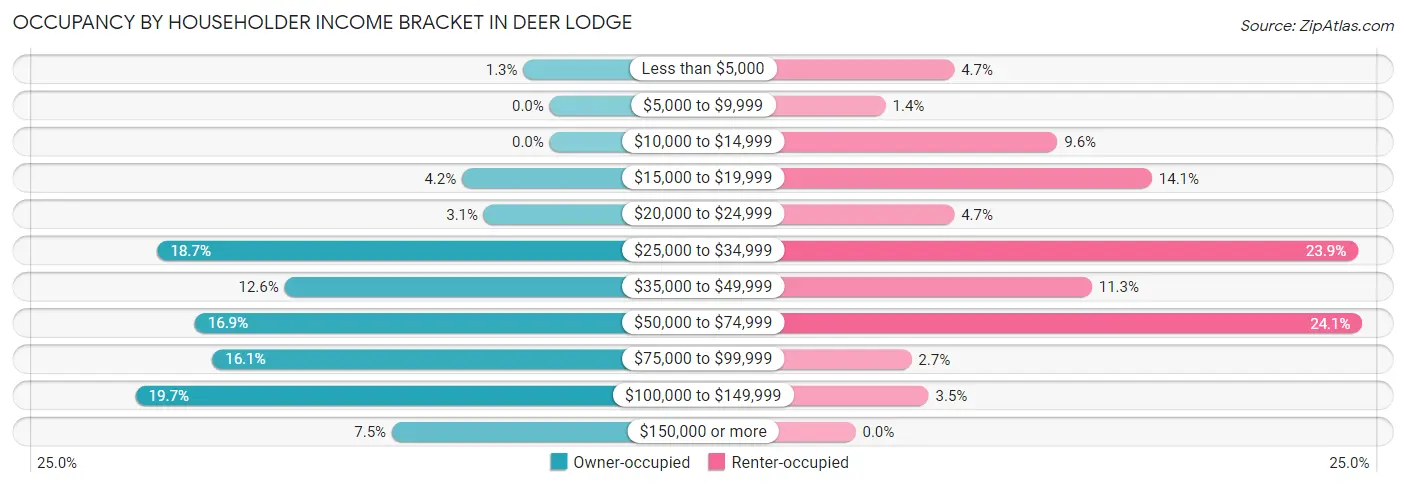
| Income Bracket | Owner-occupied | Renter-occupied |
| Less than $5,000 | 12 (1.3%) | 23 (4.7%) |
| $5,000 to $9,999 | 0 (0.0%) | 7 (1.4%) |
| $10,000 to $14,999 | 0 (0.0%) | 47 (9.6%) |
| $15,000 to $19,999 | 40 (4.2%) | 69 (14.1%) |
| $20,000 to $24,999 | 30 (3.1%) | 23 (4.7%) |
| $25,000 to $34,999 | 179 (18.7%) | 117 (23.9%) |
| $35,000 to $49,999 | 121 (12.6%) | 55 (11.3%) |
| $50,000 to $74,999 | 162 (16.9%) | 118 (24.1%) |
| $75,000 to $99,999 | 154 (16.1%) | 13 (2.7%) |
| $100,000 to $149,999 | 189 (19.7%) | 17 (3.5%) |
| $150,000 or more | 72 (7.5%) | 0 (0.0%) |
| Total | 959 (100.0%) | 489 (100.0%) |
Monthly Housing Cost Tiers in Deer Lodge
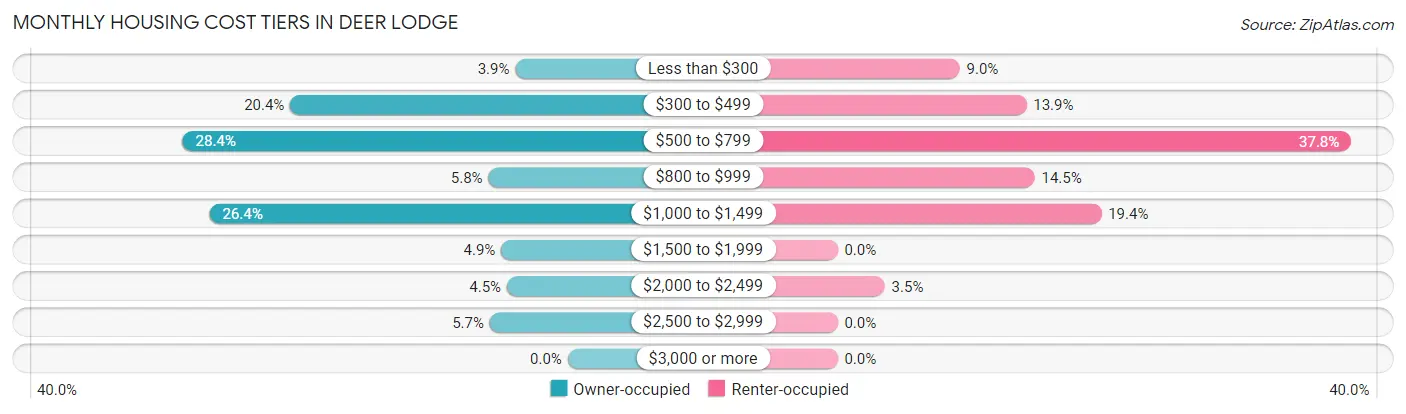
| Monthly Cost | Owner-occupied | Renter-occupied |
| Less than $300 | 37 (3.9%) | 44 (9.0%) |
| $300 to $499 | 196 (20.4%) | 68 (13.9%) |
| $500 to $799 | 272 (28.4%) | 185 (37.8%) |
| $800 to $999 | 56 (5.8%) | 71 (14.5%) |
| $1,000 to $1,499 | 253 (26.4%) | 95 (19.4%) |
| $1,500 to $1,999 | 47 (4.9%) | 0 (0.0%) |
| $2,000 to $2,499 | 43 (4.5%) | 17 (3.5%) |
| $2,500 to $2,999 | 55 (5.7%) | 0 (0.0%) |
| $3,000 or more | 0 (0.0%) | 0 (0.0%) |
| Total | 959 (100.0%) | 489 (100.0%) |
Physical Housing Characteristics in Deer Lodge
Housing Structures in Deer Lodge
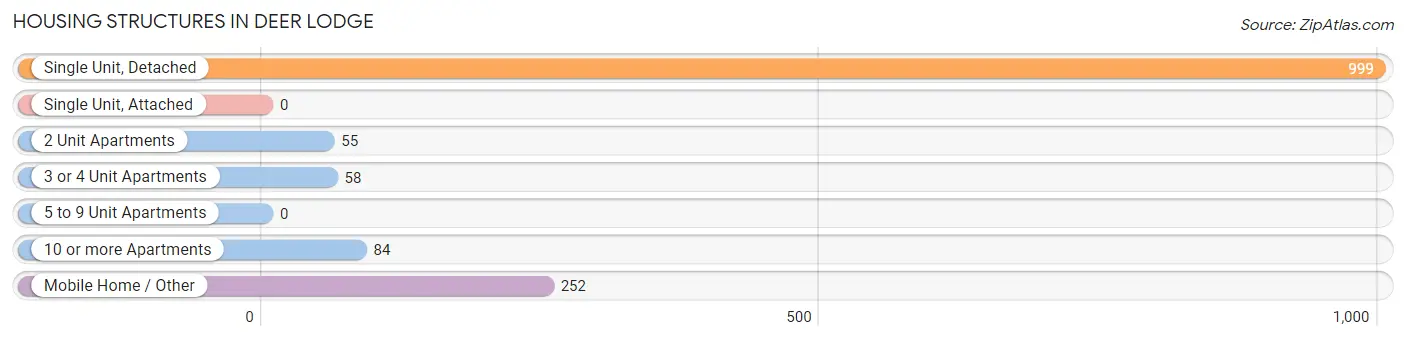
| Structure Type | # Housing Units | % Housing Units |
| Single Unit, Detached | 999 | 69.0% |
| Single Unit, Attached | 0 | 0.0% |
| 2 Unit Apartments | 55 | 3.8% |
| 3 or 4 Unit Apartments | 58 | 4.0% |
| 5 to 9 Unit Apartments | 0 | 0.0% |
| 10 or more Apartments | 84 | 5.8% |
| Mobile Home / Other | 252 | 17.4% |
| Total | 1,448 | 100.0% |
Housing Structures by Occupancy in Deer Lodge
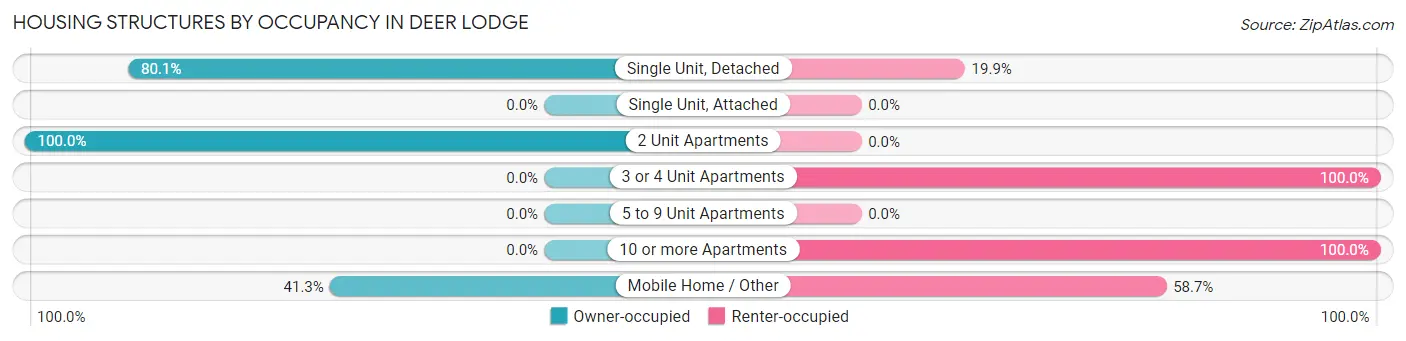
| Structure Type | Owner-occupied | Renter-occupied |
| Single Unit, Detached | 800 (80.1%) | 199 (19.9%) |
| Single Unit, Attached | 0 (0.0%) | 0 (0.0%) |
| 2 Unit Apartments | 55 (100.0%) | 0 (0.0%) |
| 3 or 4 Unit Apartments | 0 (0.0%) | 58 (100.0%) |
| 5 to 9 Unit Apartments | 0 (0.0%) | 0 (0.0%) |
| 10 or more Apartments | 0 (0.0%) | 84 (100.0%) |
| Mobile Home / Other | 104 (41.3%) | 148 (58.7%) |
| Total | 959 (66.2%) | 489 (33.8%) |
Housing Structures by Number of Rooms in Deer Lodge
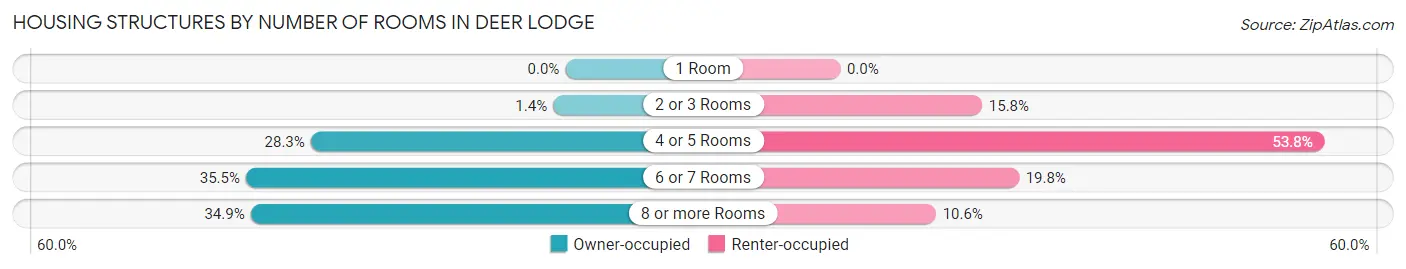
| Number of Rooms | Owner-occupied | Renter-occupied |
| 1 Room | 0 (0.0%) | 0 (0.0%) |
| 2 or 3 Rooms | 13 (1.4%) | 77 (15.8%) |
| 4 or 5 Rooms | 271 (28.3%) | 263 (53.8%) |
| 6 or 7 Rooms | 340 (35.4%) | 97 (19.8%) |
| 8 or more Rooms | 335 (34.9%) | 52 (10.6%) |
| Total | 959 (100.0%) | 489 (100.0%) |
Housing Structure by Heating Type in Deer Lodge
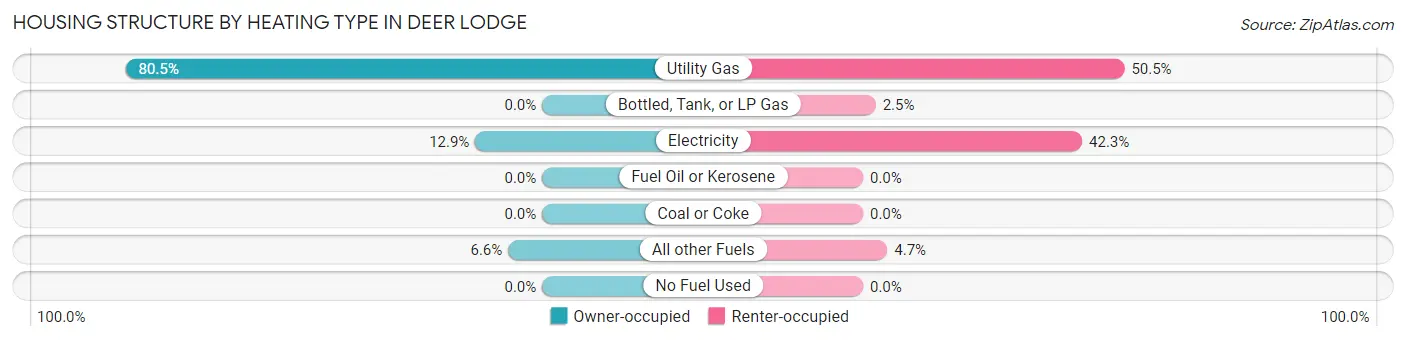
| Heating Type | Owner-occupied | Renter-occupied |
| Utility Gas | 772 (80.5%) | 247 (50.5%) |
| Bottled, Tank, or LP Gas | 0 (0.0%) | 12 (2.5%) |
| Electricity | 124 (12.9%) | 207 (42.3%) |
| Fuel Oil or Kerosene | 0 (0.0%) | 0 (0.0%) |
| Coal or Coke | 0 (0.0%) | 0 (0.0%) |
| All other Fuels | 63 (6.6%) | 23 (4.7%) |
| No Fuel Used | 0 (0.0%) | 0 (0.0%) |
| Total | 959 (100.0%) | 489 (100.0%) |
Household Vehicle Usage in Deer Lodge
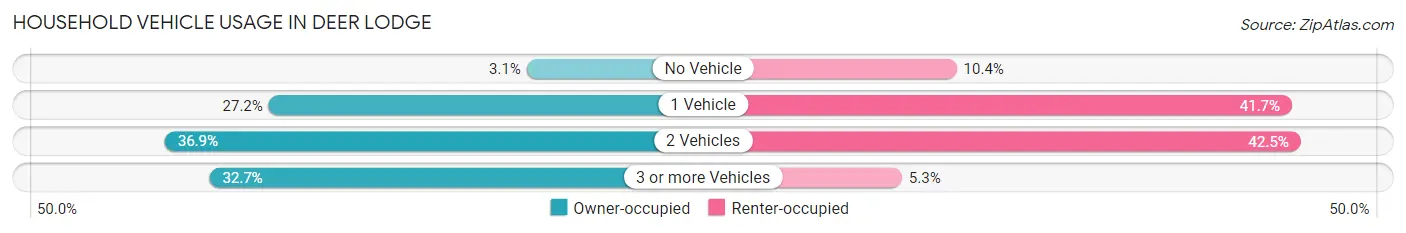
| Vehicles per Household | Owner-occupied | Renter-occupied |
| No Vehicle | 30 (3.1%) | 51 (10.4%) |
| 1 Vehicle | 261 (27.2%) | 204 (41.7%) |
| 2 Vehicles | 354 (36.9%) | 208 (42.5%) |
| 3 or more Vehicles | 314 (32.7%) | 26 (5.3%) |
| Total | 959 (100.0%) | 489 (100.0%) |
Real Estate & Mortgages in Deer Lodge
Real Estate and Mortgage Overview in Deer Lodge
| Characteristic | Without Mortgage | With Mortgage |
| Housing Units | 472 | 487 |
| Median Property Value | $139,900 | $223,700 |
| Median Household Income | $35,877 | $38 |
| Monthly Housing Costs | $507 | $0 |
| Real Estate Taxes | $1,524 | $0 |
Property Value by Mortgage Status in Deer Lodge
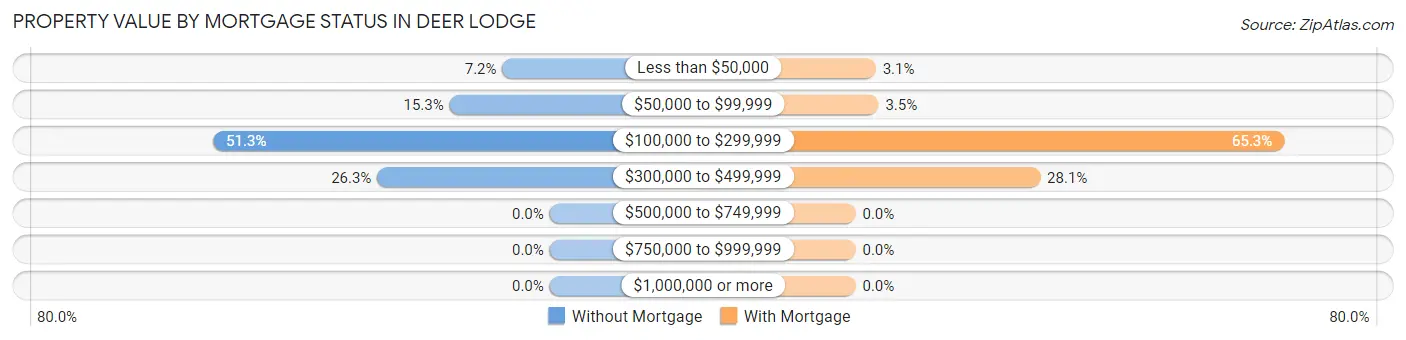
| Property Value | Without Mortgage | With Mortgage |
| Less than $50,000 | 34 (7.2%) | 15 (3.1%) |
| $50,000 to $99,999 | 72 (15.2%) | 17 (3.5%) |
| $100,000 to $299,999 | 242 (51.3%) | 318 (65.3%) |
| $300,000 to $499,999 | 124 (26.3%) | 137 (28.1%) |
| $500,000 to $749,999 | 0 (0.0%) | 0 (0.0%) |
| $750,000 to $999,999 | 0 (0.0%) | 0 (0.0%) |
| $1,000,000 or more | 0 (0.0%) | 0 (0.0%) |
| Total | 472 (100.0%) | 487 (100.0%) |
Household Income by Mortgage Status in Deer Lodge
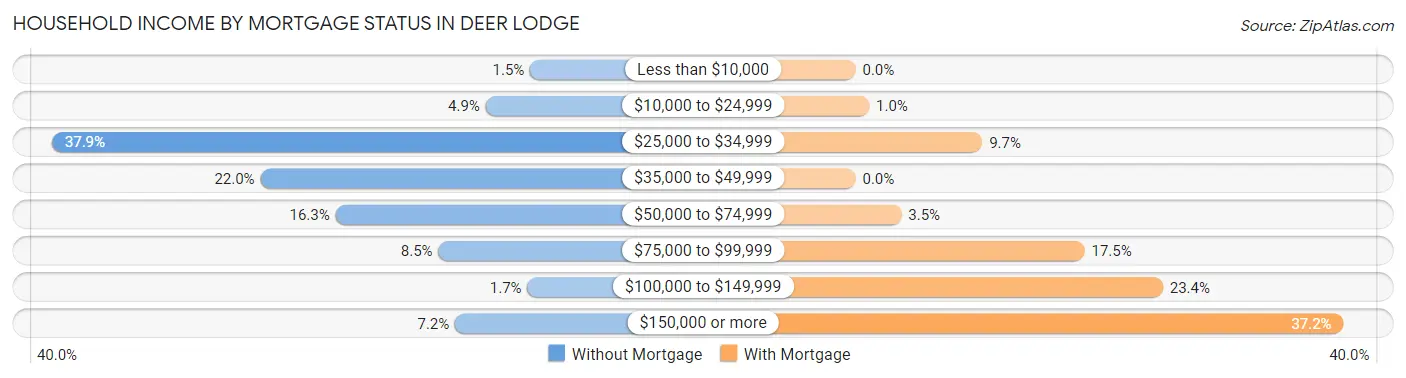
| Household Income | Without Mortgage | With Mortgage |
| Less than $10,000 | 7 (1.5%) | 0 (0.0%) |
| $10,000 to $24,999 | 23 (4.9%) | 5 (1.0%) |
| $25,000 to $34,999 | 179 (37.9%) | 47 (9.7%) |
| $35,000 to $49,999 | 104 (22.0%) | 0 (0.0%) |
| $50,000 to $74,999 | 77 (16.3%) | 17 (3.5%) |
| $75,000 to $99,999 | 40 (8.5%) | 85 (17.4%) |
| $100,000 to $149,999 | 8 (1.7%) | 114 (23.4%) |
| $150,000 or more | 34 (7.2%) | 181 (37.2%) |
| Total | 472 (100.0%) | 487 (100.0%) |
Property Value to Household Income Ratio in Deer Lodge
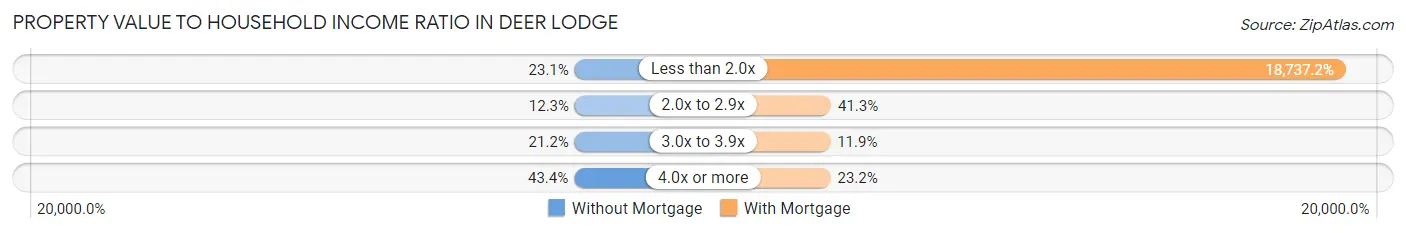
| Value-to-Income Ratio | Without Mortgage | With Mortgage |
| Less than 2.0x | 109 (23.1%) | 91,250 (18,737.2%) |
| 2.0x to 2.9x | 58 (12.3%) | 201 (41.3%) |
| 3.0x to 3.9x | 100 (21.2%) | 58 (11.9%) |
| 4.0x or more | 205 (43.4%) | 113 (23.2%) |
| Total | 472 (100.0%) | 487 (100.0%) |
Real Estate Taxes by Mortgage Status in Deer Lodge
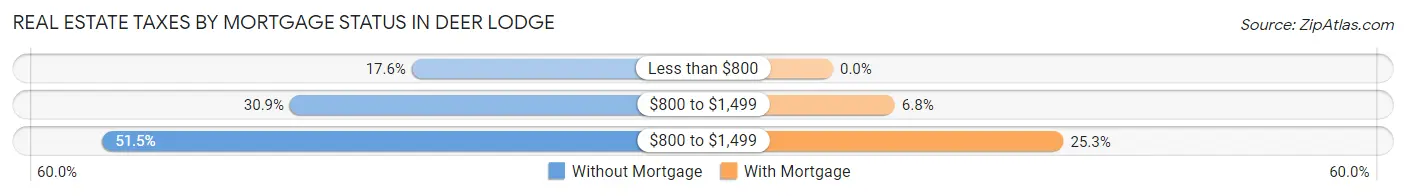
| Property Taxes | Without Mortgage | With Mortgage |
| Less than $800 | 83 (17.6%) | 0 (0.0%) |
| $800 to $1,499 | 146 (30.9%) | 33 (6.8%) |
| $800 to $1,499 | 243 (51.5%) | 123 (25.3%) |
| Total | 472 (100.0%) | 487 (100.0%) |
Health & Disability in Deer Lodge
Health Insurance Coverage by Age in Deer Lodge
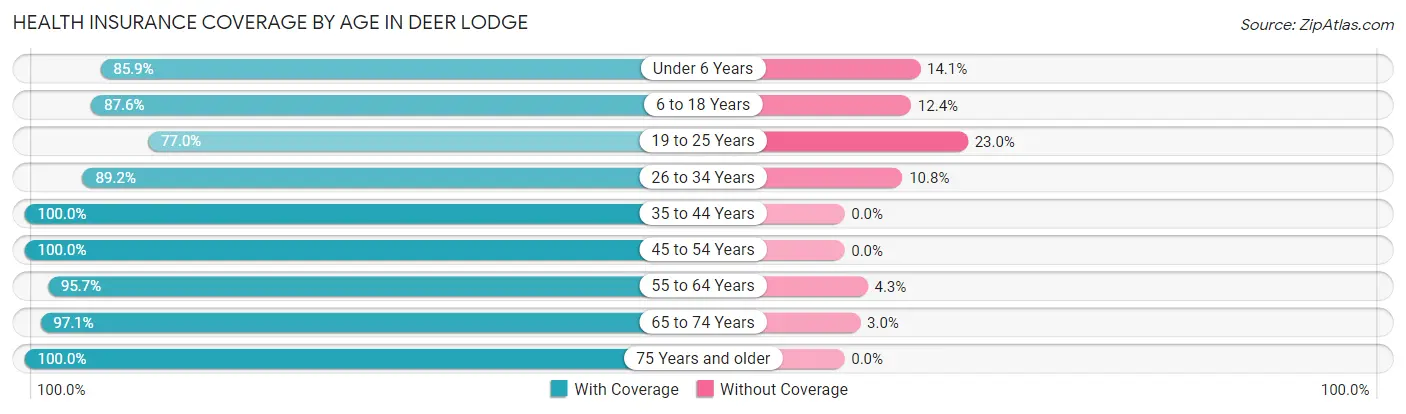
| Age Bracket | With Coverage | Without Coverage |
| Under 6 Years | 152 (85.9%) | 25 (14.1%) |
| 6 to 18 Years | 289 (87.6%) | 41 (12.4%) |
| 19 to 25 Years | 87 (77.0%) | 26 (23.0%) |
| 26 to 34 Years | 190 (89.2%) | 23 (10.8%) |
| 35 to 44 Years | 379 (100.0%) | 0 (0.0%) |
| 45 to 54 Years | 395 (100.0%) | 0 (0.0%) |
| 55 to 64 Years | 508 (95.7%) | 23 (4.3%) |
| 65 to 74 Years | 460 (97.1%) | 14 (2.9%) |
| 75 Years and older | 291 (100.0%) | 0 (0.0%) |
| Total | 2,751 (94.8%) | 152 (5.2%) |
Health Insurance Coverage by Citizenship Status in Deer Lodge
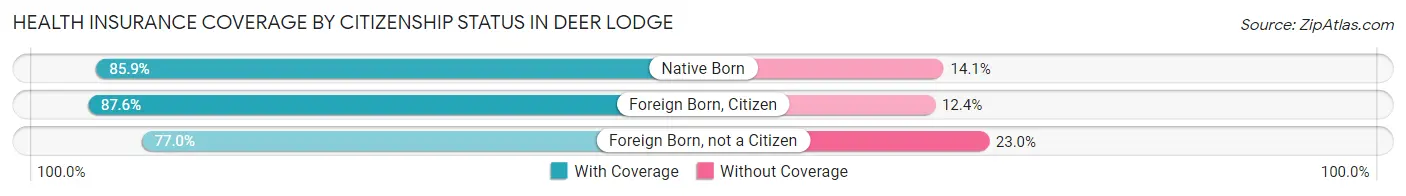
| Citizenship Status | With Coverage | Without Coverage |
| Native Born | 152 (85.9%) | 25 (14.1%) |
| Foreign Born, Citizen | 289 (87.6%) | 41 (12.4%) |
| Foreign Born, not a Citizen | 87 (77.0%) | 26 (23.0%) |
Health Insurance Coverage by Household Income in Deer Lodge
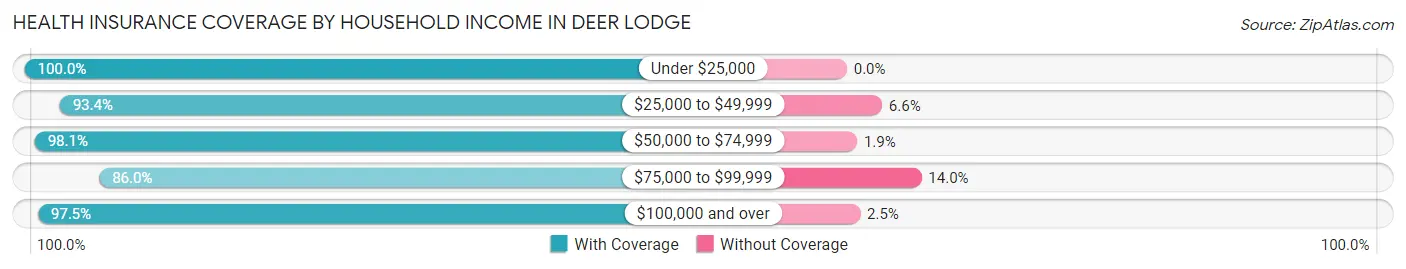
| Household Income | With Coverage | Without Coverage |
| Under $25,000 | 334 (100.0%) | 0 (0.0%) |
| $25,000 to $49,999 | 753 (93.4%) | 53 (6.6%) |
| $50,000 to $74,999 | 673 (98.1%) | 13 (1.9%) |
| $75,000 to $99,999 | 443 (86.0%) | 72 (14.0%) |
| $100,000 and over | 548 (97.5%) | 14 (2.5%) |
Public vs Private Health Insurance Coverage by Age in Deer Lodge
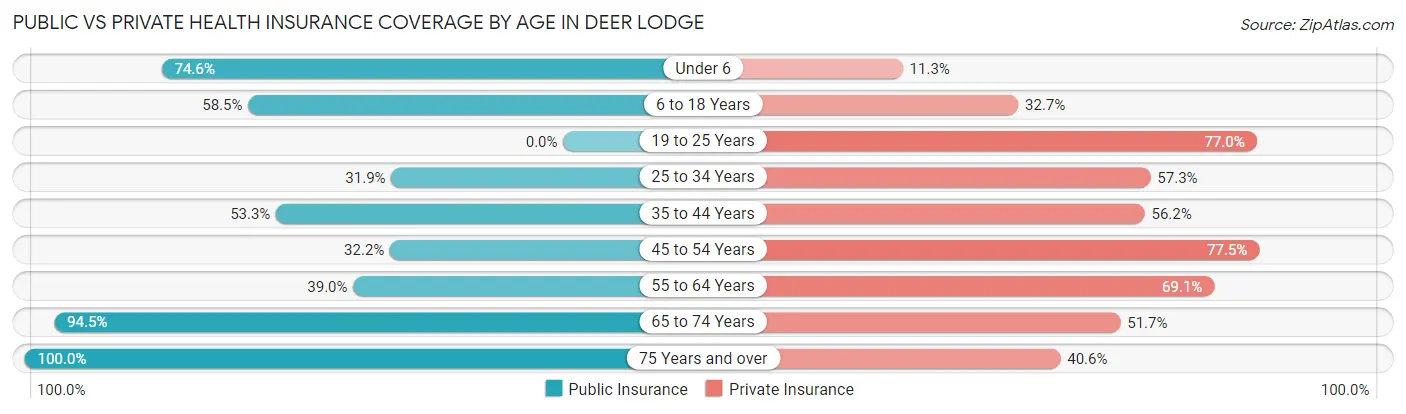
| Age Bracket | Public Insurance | Private Insurance |
| Under 6 | 132 (74.6%) | 20 (11.3%) |
| 6 to 18 Years | 193 (58.5%) | 108 (32.7%) |
| 19 to 25 Years | 0 (0.0%) | 87 (77.0%) |
| 25 to 34 Years | 68 (31.9%) | 122 (57.3%) |
| 35 to 44 Years | 202 (53.3%) | 213 (56.2%) |
| 45 to 54 Years | 127 (32.2%) | 306 (77.5%) |
| 55 to 64 Years | 207 (39.0%) | 367 (69.1%) |
| 65 to 74 Years | 448 (94.5%) | 245 (51.7%) |
| 75 Years and over | 291 (100.0%) | 118 (40.6%) |
| Total | 1,668 (57.5%) | 1,586 (54.6%) |
Disability Status by Sex by Age in Deer Lodge
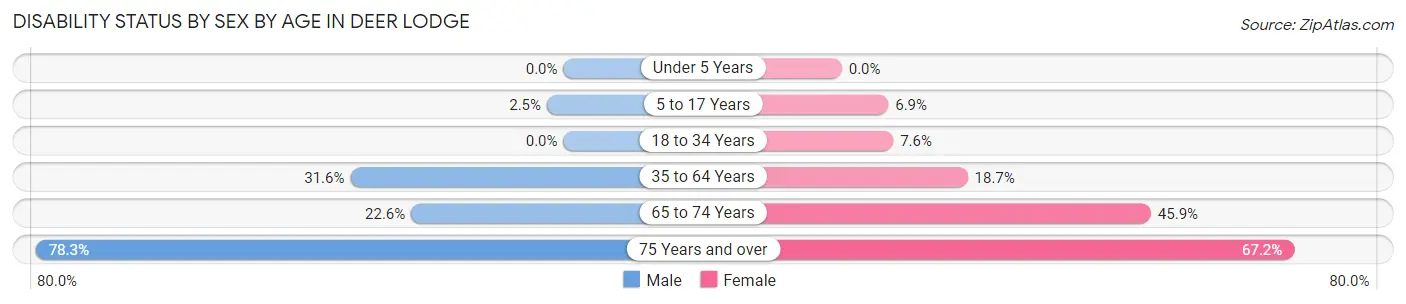
| Age Bracket | Male | Female |
| Under 5 Years | 0 (0.0%) | 0 (0.0%) |
| 5 to 17 Years | 4 (2.5%) | 12 (6.9%) |
| 18 to 34 Years | 0 (0.0%) | 12 (7.6%) |
| 35 to 64 Years | 235 (31.6%) | 105 (18.7%) |
| 65 to 74 Years | 52 (22.6%) | 112 (45.9%) |
| 75 Years and over | 123 (78.3%) | 90 (67.2%) |
Disability Class by Sex by Age in Deer Lodge
Disability Class: Hearing Difficulty
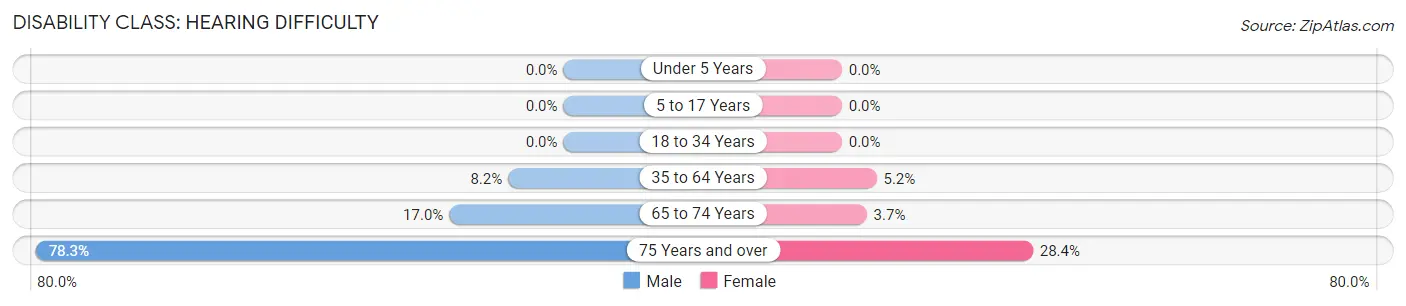
| Age Bracket | Male | Female |
| Under 5 Years | 0 (0.0%) | 0 (0.0%) |
| 5 to 17 Years | 0 (0.0%) | 0 (0.0%) |
| 18 to 34 Years | 0 (0.0%) | 0 (0.0%) |
| 35 to 64 Years | 61 (8.2%) | 29 (5.2%) |
| 65 to 74 Years | 39 (17.0%) | 9 (3.7%) |
| 75 Years and over | 123 (78.3%) | 38 (28.4%) |
Disability Class: Vision Difficulty
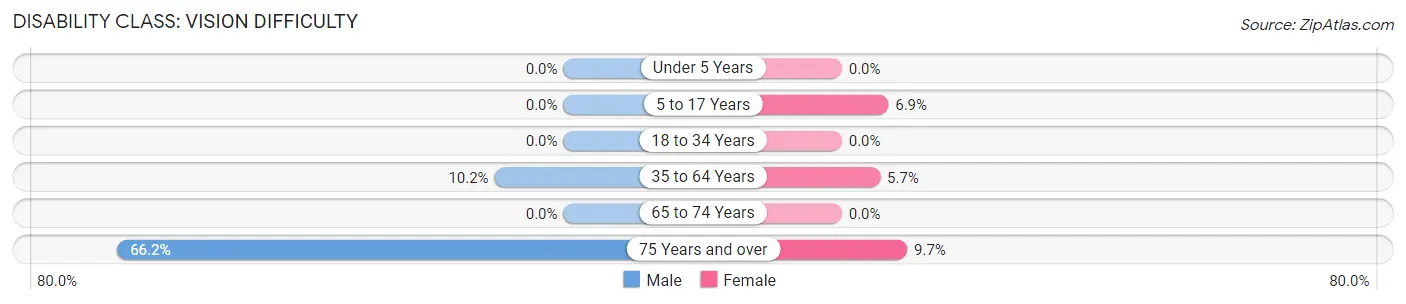
| Age Bracket | Male | Female |
| Under 5 Years | 0 (0.0%) | 0 (0.0%) |
| 5 to 17 Years | 0 (0.0%) | 12 (6.9%) |
| 18 to 34 Years | 0 (0.0%) | 0 (0.0%) |
| 35 to 64 Years | 76 (10.2%) | 32 (5.7%) |
| 65 to 74 Years | 0 (0.0%) | 0 (0.0%) |
| 75 Years and over | 104 (66.2%) | 13 (9.7%) |
Disability Class: Cognitive Difficulty
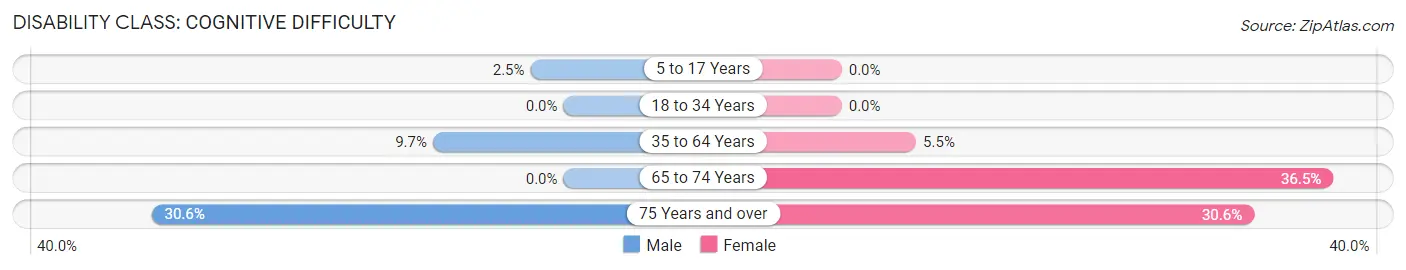
| Age Bracket | Male | Female |
| 5 to 17 Years | 4 (2.5%) | 0 (0.0%) |
| 18 to 34 Years | 0 (0.0%) | 0 (0.0%) |
| 35 to 64 Years | 72 (9.7%) | 31 (5.5%) |
| 65 to 74 Years | 0 (0.0%) | 89 (36.5%) |
| 75 Years and over | 48 (30.6%) | 41 (30.6%) |
Disability Class: Ambulatory Difficulty
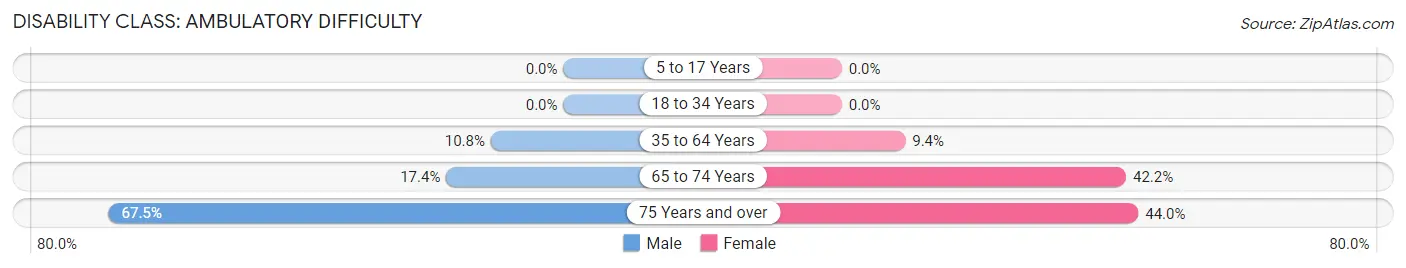
| Age Bracket | Male | Female |
| 5 to 17 Years | 0 (0.0%) | 0 (0.0%) |
| 18 to 34 Years | 0 (0.0%) | 0 (0.0%) |
| 35 to 64 Years | 80 (10.8%) | 53 (9.4%) |
| 65 to 74 Years | 40 (17.4%) | 103 (42.2%) |
| 75 Years and over | 106 (67.5%) | 59 (44.0%) |
Disability Class: Self-Care Difficulty
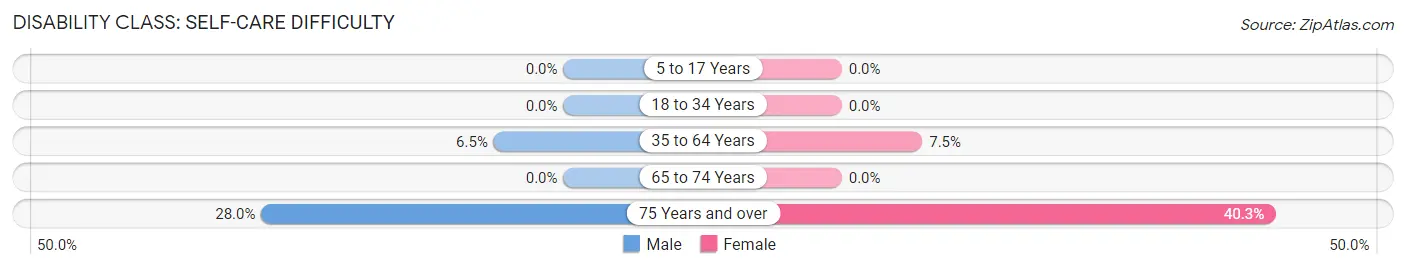
| Age Bracket | Male | Female |
| 5 to 17 Years | 0 (0.0%) | 0 (0.0%) |
| 18 to 34 Years | 0 (0.0%) | 0 (0.0%) |
| 35 to 64 Years | 48 (6.5%) | 42 (7.5%) |
| 65 to 74 Years | 0 (0.0%) | 0 (0.0%) |
| 75 Years and over | 44 (28.0%) | 54 (40.3%) |
Technology Access in Deer Lodge
Computing Device Access in Deer Lodge
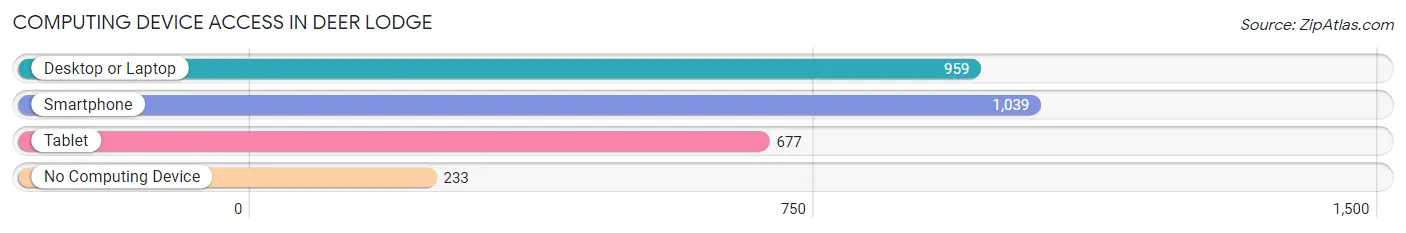
| Device Type | # Households | % Households |
| Desktop or Laptop | 959 | 66.2% |
| Smartphone | 1,039 | 71.8% |
| Tablet | 677 | 46.8% |
| No Computing Device | 233 | 16.1% |
| Total | 1,448 | 100.0% |
Internet Access in Deer Lodge

| Internet Type | # Households | % Households |
| Dial-Up Internet | 32 | 2.2% |
| Broadband Home | 822 | 56.8% |
| Cellular Data Only | 181 | 12.5% |
| Satellite Internet | 142 | 9.8% |
| No Internet | 271 | 18.7% |
| Total | 1,448 | 100.0% |
Deer Lodge Summary
Deer Lodge, Montana is a small city located in the western part of the state, about 30 miles west of the state capital of Helena. It is the county seat of Powell County and has a population of about 3,000 people. The city is situated in a valley surrounded by mountains and is known for its outdoor recreation opportunities.
History
Deer Lodge was first settled in the 1860s by miners and ranchers. The city was officially incorporated in 1887 and was named after a nearby mountain range. The city was an important stop on the stagecoach route between Helena and Butte. In the late 19th century, the city was home to a number of saloons, gambling halls, and brothels.
In the early 20th century, Deer Lodge became an important railroad hub. The city was home to a number of large sawmills and lumber companies, as well as a number of other industries. The city was also home to a number of prisons, including the Montana State Prison, which was the state’s only maximum-security prison until it closed in 1979.
Geography
Deer Lodge is located in the western part of Montana, about 30 miles west of the state capital of Helena. The city is situated in a valley surrounded by mountains, including the Deer Lodge Mountains to the north and the Big Belt Mountains to the south. The city is located at an elevation of 4,400 feet and has a total area of 4.2 square miles.
The climate in Deer Lodge is semi-arid, with hot summers and cold winters. The average high temperature in July is 85 degrees Fahrenheit, and the average low temperature in January is 11 degrees Fahrenheit. The city receives an average of 16 inches of precipitation per year.
Economy
Deer Lodge’s economy is largely based on tourism and outdoor recreation. The city is home to a number of ski resorts, including the Big Sky Resort, which is the largest ski resort in the state. The city is also home to a number of other outdoor recreation opportunities, including fishing, hunting, and camping.
The city is also home to a number of manufacturing companies, including a number of wood products companies. The city is also home to a number of government offices, including the Montana State Prison, which closed in 1979.
Demographics
As of the 2010 census, the population of Deer Lodge was 3,111. The racial makeup of the city was 94.3% White, 0.7% African American, 0.7% Native American, 0.3% Asian, 0.1% Pacific Islander, and 3.9% from other races. The median household income in the city was $35,938, and the median family income was $41,944. The per capita income in the city was $17,945.
Conclusion
Deer Lodge, Montana is a small city located in the western part of the state, about 30 miles west of the state capital of Helena. The city is known for its outdoor recreation opportunities and is home to a number of ski resorts, manufacturing companies, and government offices. The population of Deer Lodge is 3,111, and the median household income is $35,938.
Common Questions
What is Per Capita Income in Deer Lodge?
Per Capita income in Deer Lodge is $30,814.
What is the Median Family Income in Deer Lodge?
Median Family Income in Deer Lodge is $62,356.
What is the Median Household income in Deer Lodge?
Median Household Income in Deer Lodge is $52,813.
What is Income or Wage Gap in Deer Lodge?
Income or Wage Gap in Deer Lodge is 47.4%.
Women in Deer Lodge earn 52.6 cents for every dollar earned by a man.
What is Inequality or Gini Index in Deer Lodge?
Inequality or Gini Index in Deer Lodge is 0.41.
What is the Total Population of Deer Lodge?
Total Population of Deer Lodge is 3,030.
What is the Total Male Population of Deer Lodge?
Total Male Population of Deer Lodge is 1,632.
What is the Total Female Population of Deer Lodge?
Total Female Population of Deer Lodge is 1,398.
What is the Ratio of Males per 100 Females in Deer Lodge?
There are 116.74 Males per 100 Females in Deer Lodge.
What is the Ratio of Females per 100 Males in Deer Lodge?
There are 85.66 Females per 100 Males in Deer Lodge.
What is the Median Population Age in Deer Lodge?
Median Population Age in Deer Lodge is 49.9 Years.
What is the Average Family Size in Deer Lodge
Average Family Size in Deer Lodge is 2.3 People.
What is the Average Household Size in Deer Lodge
Average Household Size in Deer Lodge is 2.0 People.
How Large is the Labor Force in Deer Lodge?
There are 1,370 People in the Labor Forcein in Deer Lodge.
What is the Percentage of People in the Labor Force in Deer Lodge?
54.2% of People are in the Labor Force in Deer Lodge.
What is the Unemployment Rate in Deer Lodge?
Unemployment Rate in Deer Lodge is 3.4%.