Clinton, MT Map & Demographics
Clinton Map
Clinton Overview
$33,340
PER CAPITA INCOME
$90,278
AVG FAMILY INCOME
$84,792
AVG HOUSEHOLD INCOME
0.24
INEQUALITY / GINI INDEX
745
TOTAL POPULATION
423
MALE POPULATION
322
FEMALE POPULATION
131.37
MALES / 100 FEMALES
76.12
FEMALES / 100 MALES
39.6
MEDIAN AGE
3.1
AVG FAMILY SIZE
2.9
AVG HOUSEHOLD SIZE
382
LABOR FORCE [ PEOPLE ]
64.4%
PERCENT IN LABOR FORCE
1.3%
UNEMPLOYMENT RATE
Clinton Zip Codes
Clinton Area Codes
Income in Clinton
Income Overview in Clinton
Per Capita Income in Clinton is $33,340, while median incomes of families and households are $90,278 and $84,792 respectively.
| Characteristic | Number | Measure |
| Per Capita Income | 745 | $33,340 |
| Median Family Income | 206 | $90,278 |
| Mean Family Income | 206 | $94,810 |
| Median Household Income | 253 | $84,792 |
| Mean Household Income | 253 | $91,766 |
| Income Deficit | 206 | $0 |
| Wage / Income Gap (%) | 745 | 0.00% |
| Wage / Income Gap ($) | 745 | 100.00¢ per $1 |
| Gini / Inequality Index | 745 | 0.24 |
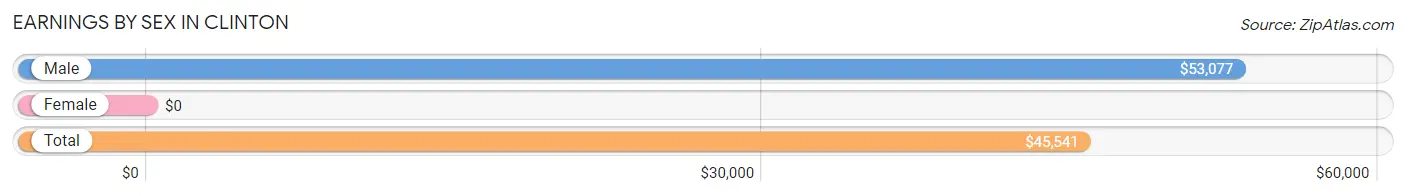
Earnings by Sex in Clinton
| Sex | Number | Average Earnings |
| Male | 232 (58.0%) | $53,077 |
| Female | 168 (42.0%) | $0 |
| Total | 400 (100.0%) | $45,541 |
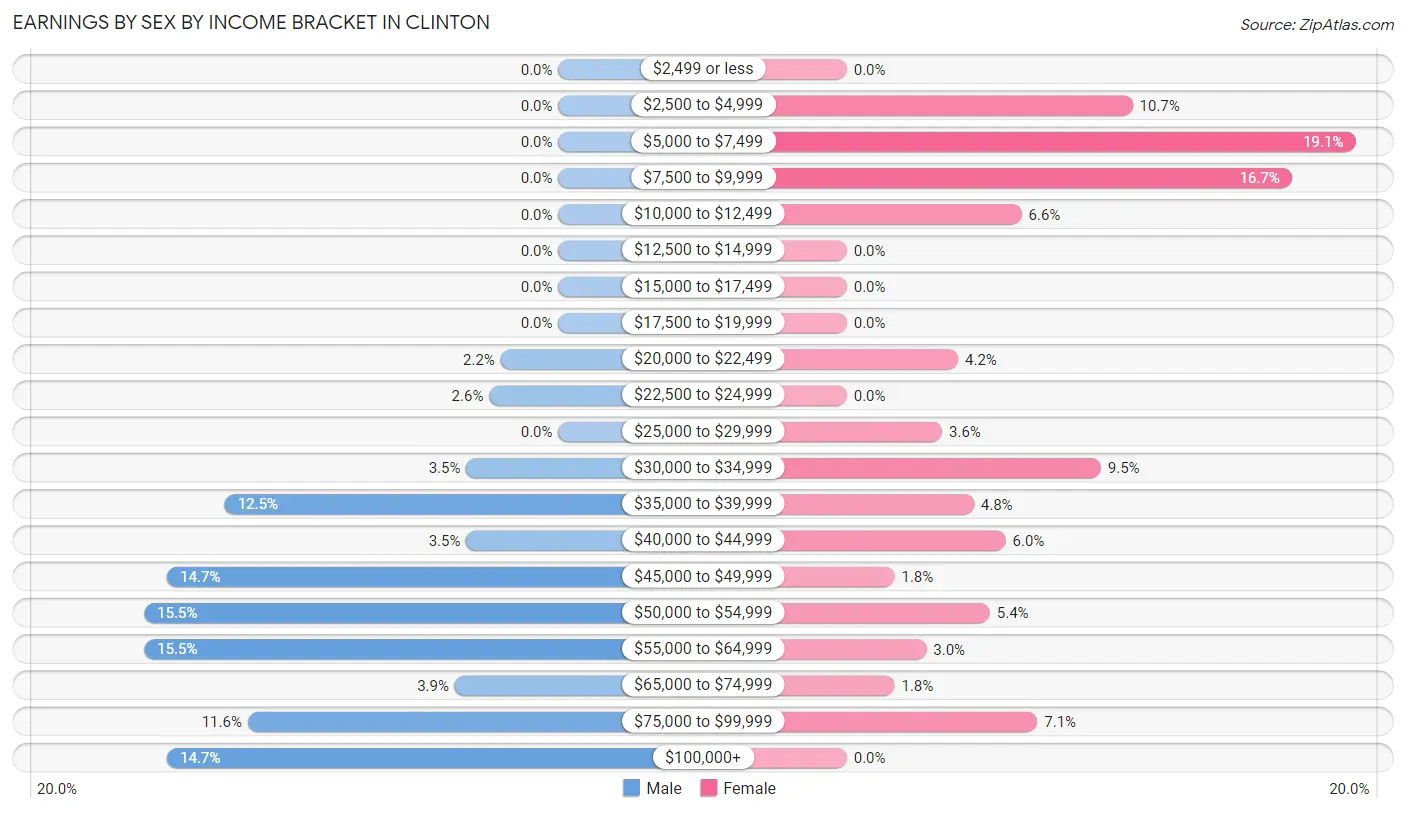
Earnings by Sex by Income Bracket in Clinton
The most common earnings brackets in Clinton are $50,000 to $54,999 for men (36 | 15.5%) and $5,000 to $7,499 for women (32 | 19.1%).
| Income | Male | Female |
| $2,499 or less | 0 (0.0%) | 0 (0.0%) |
| $2,500 to $4,999 | 0 (0.0%) | 18 (10.7%) |
| $5,000 to $7,499 | 0 (0.0%) | 32 (19.1%) |
| $7,500 to $9,999 | 0 (0.0%) | 28 (16.7%) |
| $10,000 to $12,499 | 0 (0.0%) | 11 (6.6%) |
| $12,500 to $14,999 | 0 (0.0%) | 0 (0.0%) |
| $15,000 to $17,499 | 0 (0.0%) | 0 (0.0%) |
| $17,500 to $19,999 | 0 (0.0%) | 0 (0.0%) |
| $20,000 to $22,499 | 5 (2.2%) | 7 (4.2%) |
| $22,500 to $24,999 | 6 (2.6%) | 0 (0.0%) |
| $25,000 to $29,999 | 0 (0.0%) | 6 (3.6%) |
| $30,000 to $34,999 | 8 (3.5%) | 16 (9.5%) |
| $35,000 to $39,999 | 29 (12.5%) | 8 (4.8%) |
| $40,000 to $44,999 | 8 (3.5%) | 10 (5.9%) |
| $45,000 to $49,999 | 34 (14.7%) | 3 (1.8%) |
| $50,000 to $54,999 | 36 (15.5%) | 9 (5.4%) |
| $55,000 to $64,999 | 36 (15.5%) | 5 (3.0%) |
| $65,000 to $74,999 | 9 (3.9%) | 3 (1.8%) |
| $75,000 to $99,999 | 27 (11.6%) | 12 (7.1%) |
| $100,000+ | 34 (14.7%) | 0 (0.0%) |
| Total | 232 (100.0%) | 168 (100.0%) |
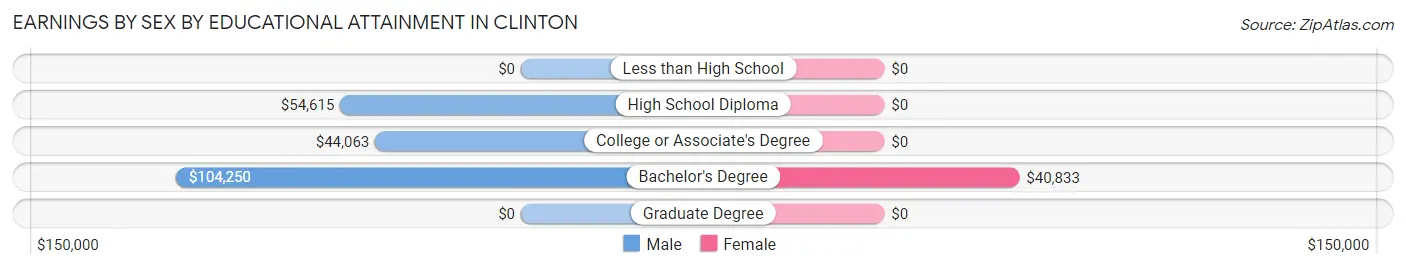
Earnings by Sex by Educational Attainment in Clinton
| Educational Attainment | Male Income | Female Income |
| Less than High School | - | - |
| High School Diploma | $54,615 | $0 |
| College or Associate's Degree | $44,063 | $0 |
| Bachelor's Degree | $104,250 | $40,833 |
| Graduate Degree | - | - |
| Total | $53,654 | $0 |
Family Income in Clinton
Family Income Brackets in Clinton
According to the Clinton family income data, there are 73 families falling into the $100,000 to $149,999 income range, which is the most common income bracket and makes up 35.4% of all families.
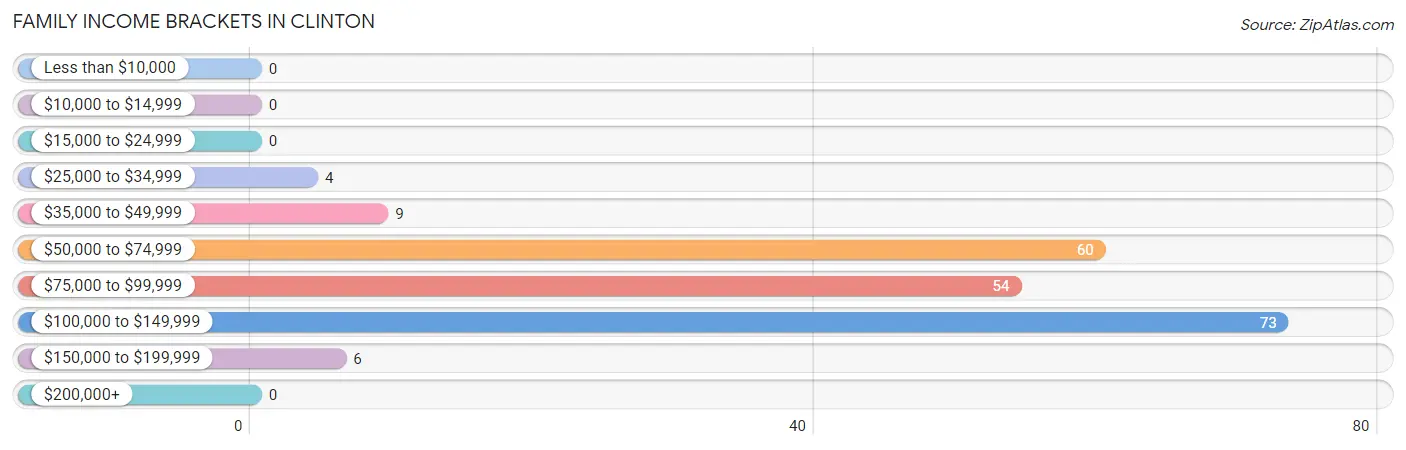
| Income Bracket | # Families | % Families |
| Less than $10,000 | 0 | 0.0% |
| $10,000 to $14,999 | 0 | 0.0% |
| $15,000 to $24,999 | 0 | 0.0% |
| $25,000 to $34,999 | 4 | 1.9% |
| $35,000 to $49,999 | 9 | 4.4% |
| $50,000 to $74,999 | 60 | 29.1% |
| $75,000 to $99,999 | 54 | 26.2% |
| $100,000 to $149,999 | 73 | 35.4% |
| $150,000 to $199,999 | 6 | 2.9% |
| $200,000+ | 0 | 0.0% |
Family Income by Famaliy Size in Clinton
3-person families (85 | 41.3%) account for the highest median family income in Clinton with $105,809 per family, while 2-person families (83 | 40.3%) have the highest median income of $45,394 per family member.
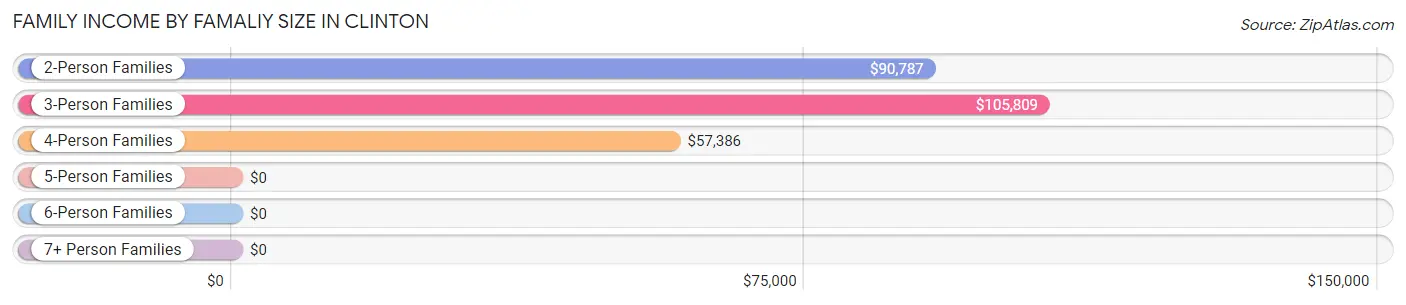
| Income Bracket | # Families | Median Income |
| 2-Person Families | 83 (40.3%) | $90,787 |
| 3-Person Families | 85 (41.3%) | $105,809 |
| 4-Person Families | 21 (10.2%) | $57,386 |
| 5-Person Families | 12 (5.8%) | $0 |
| 6-Person Families | 0 (0.0%) | $0 |
| 7+ Person Families | 5 (2.4%) | $0 |
| Total | 206 (100.0%) | $90,278 |
Family Income by Number of Earners in Clinton
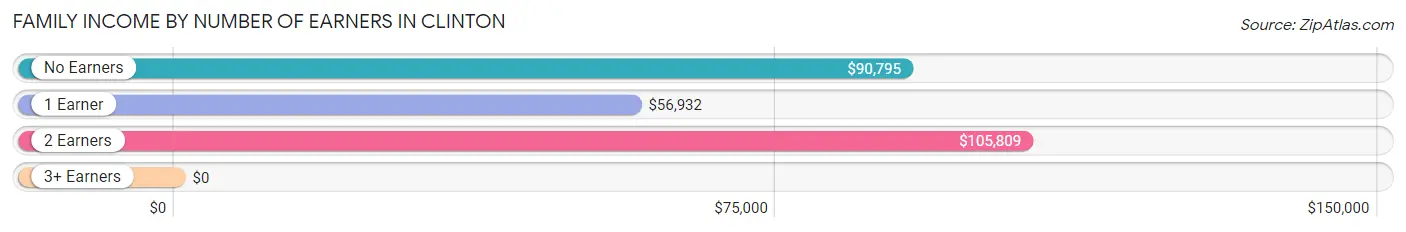
| Number of Earners | # Families | Median Income |
| No Earners | 38 (18.4%) | $90,795 |
| 1 Earner | 49 (23.8%) | $56,932 |
| 2 Earners | 119 (57.8%) | $105,809 |
| 3+ Earners | 0 (0.0%) | $0 |
| Total | 206 (100.0%) | $90,278 |
Household Income in Clinton
Household Income Brackets in Clinton
With 78 households falling in the category, the $100,000 to $149,999 income range is the most frequent in Clinton, accounting for 30.8% of all households.
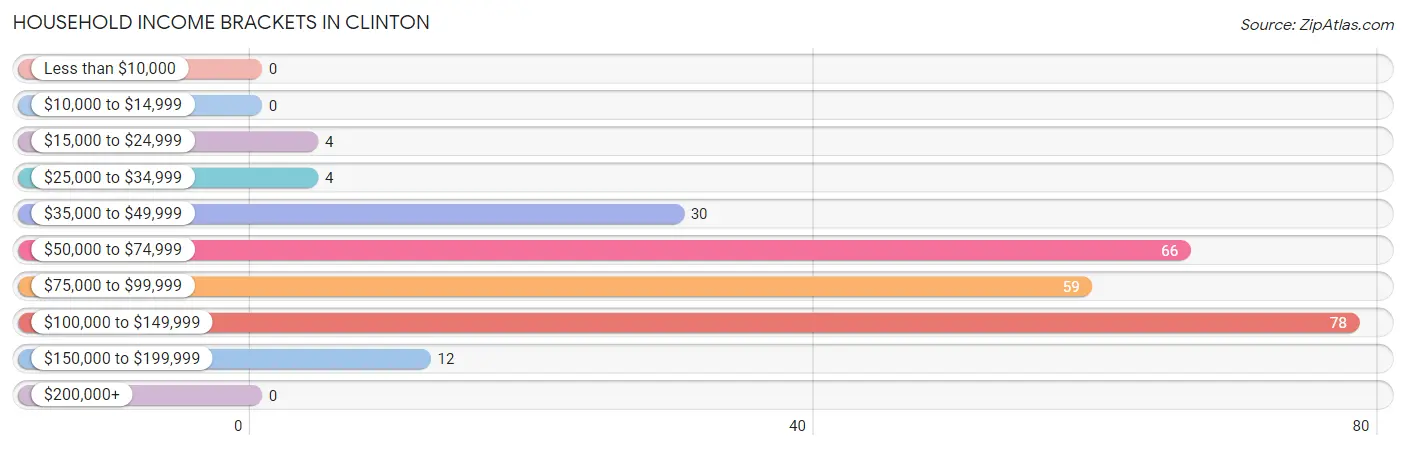
| Income Bracket | # Households | % Households |
| Less than $10,000 | 0 | 0.0% |
| $10,000 to $14,999 | 0 | 0.0% |
| $15,000 to $24,999 | 4 | 1.6% |
| $25,000 to $34,999 | 4 | 1.6% |
| $35,000 to $49,999 | 30 | 11.9% |
| $50,000 to $74,999 | 66 | 26.1% |
| $75,000 to $99,999 | 59 | 23.3% |
| $100,000 to $149,999 | 78 | 30.8% |
| $150,000 to $199,999 | 12 | 4.7% |
| $200,000+ | 0 | 0.0% |
Household Income by Householder Age in Clinton
The median household income in Clinton is $84,792, with the highest median household income of $124,000 found in the 45 to 64 years age bracket for the primary householder. A total of 100 households (39.5%) fall into this category.
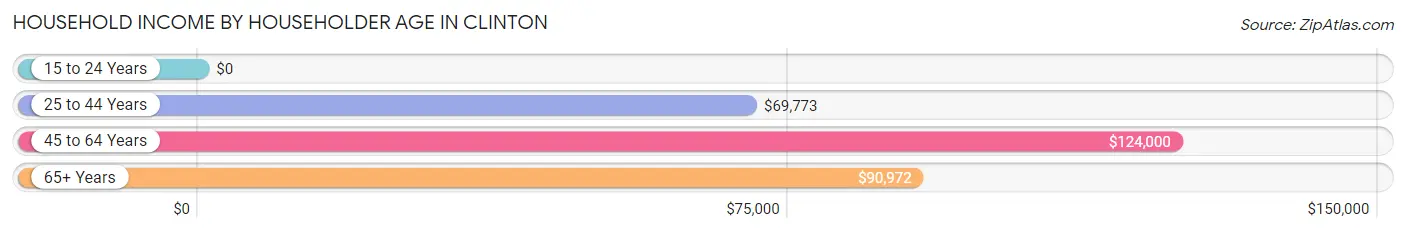
| Income Bracket | # Households | Median Income |
| 15 to 24 Years | 0 (0.0%) | $0 |
| 25 to 44 Years | 98 (38.7%) | $69,773 |
| 45 to 64 Years | 100 (39.5%) | $124,000 |
| 65+ Years | 55 (21.7%) | $90,972 |
| Total | 253 (100.0%) | $84,792 |
Poverty in Clinton
Income Below Poverty by Sex and Age in Clinton
With 2.8% poverty level for males and 17.1% for females among the residents of Clinton, 12 to 14 year old males and 16 and 17 year old females are the most vulnerable to poverty, with 4 males (25.0%) and 6 females (100.0%) in their respective age groups living below the poverty level.
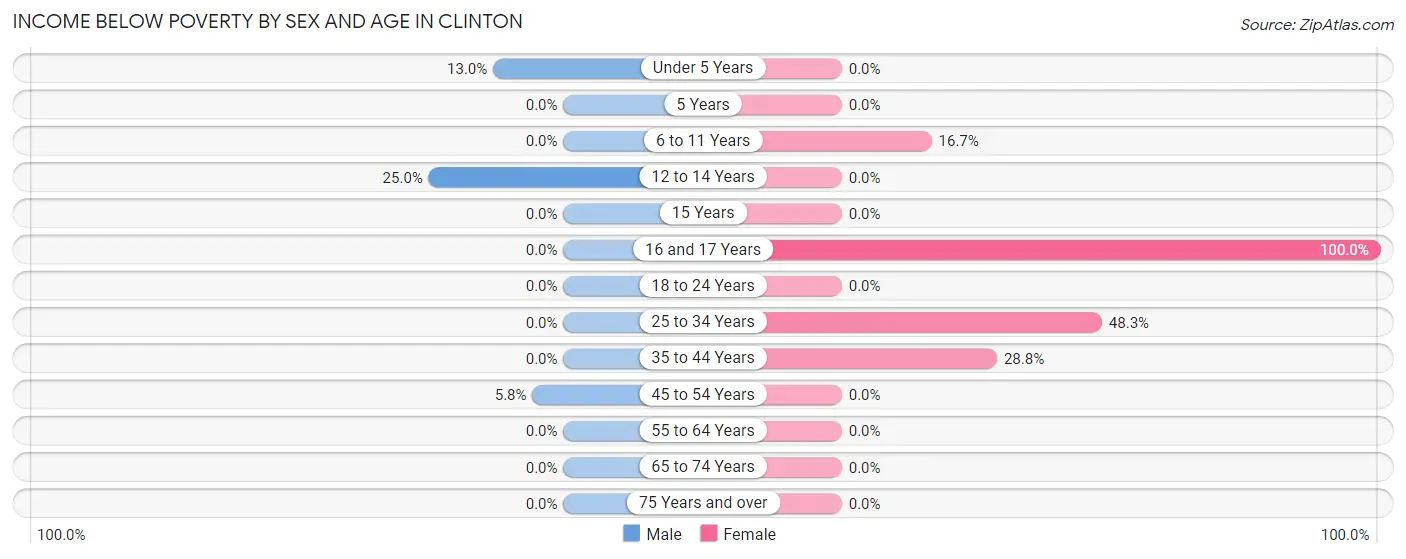
| Age Bracket | Male | Female |
| Under 5 Years | 3 (13.0%) | 0 (0.0%) |
| 5 Years | 0 (0.0%) | 0 (0.0%) |
| 6 to 11 Years | 0 (0.0%) | 4 (16.7%) |
| 12 to 14 Years | 4 (25.0%) | 0 (0.0%) |
| 15 Years | 0 (0.0%) | 0 (0.0%) |
| 16 and 17 Years | 0 (0.0%) | 6 (100.0%) |
| 18 to 24 Years | 0 (0.0%) | 0 (0.0%) |
| 25 to 34 Years | 0 (0.0%) | 28 (48.3%) |
| 35 to 44 Years | 0 (0.0%) | 17 (28.8%) |
| 45 to 54 Years | 5 (5.8%) | 0 (0.0%) |
| 55 to 64 Years | 0 (0.0%) | 0 (0.0%) |
| 65 to 74 Years | 0 (0.0%) | 0 (0.0%) |
| 75 Years and over | 0 (0.0%) | 0 (0.0%) |
| Total | 12 (2.8%) | 55 (17.1%) |
Income Above Poverty by Sex and Age in Clinton
According to the poverty statistics in Clinton, males aged 6 to 11 years and females aged under 5 years are the age groups that are most secure financially, with 100.0% of males and 100.0% of females in these age groups living above the poverty line.
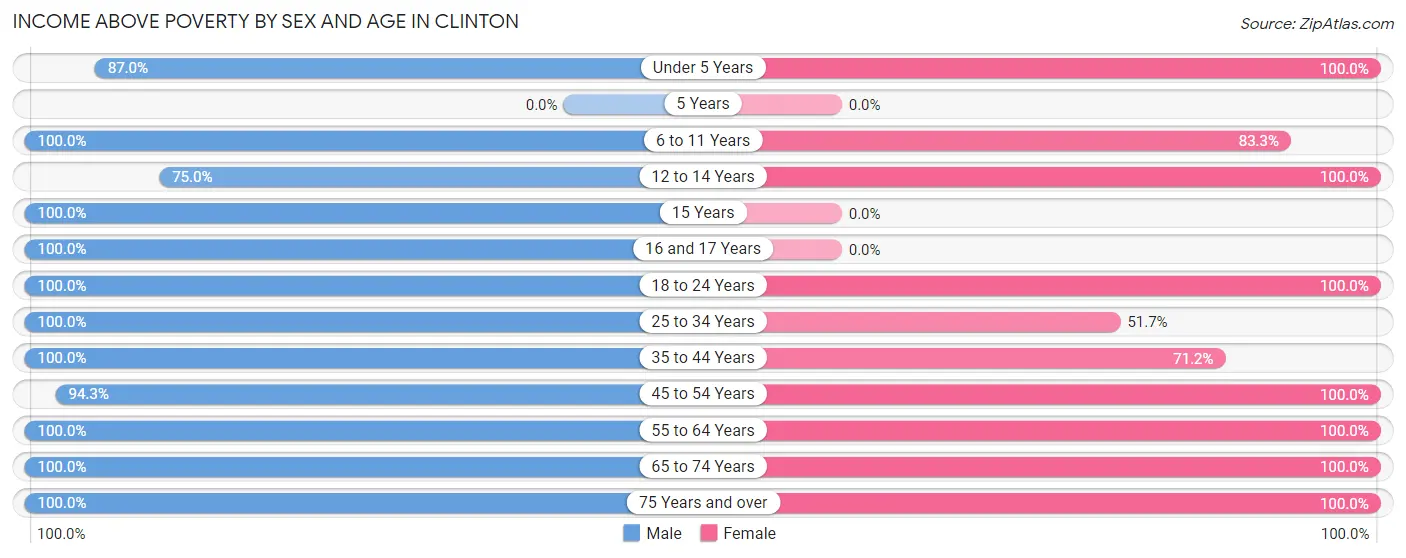
| Age Bracket | Male | Female |
| Under 5 Years | 20 (87.0%) | 27 (100.0%) |
| 5 Years | 0 (0.0%) | 0 (0.0%) |
| 6 to 11 Years | 29 (100.0%) | 20 (83.3%) |
| 12 to 14 Years | 12 (75.0%) | 17 (100.0%) |
| 15 Years | 16 (100.0%) | 0 (0.0%) |
| 16 and 17 Years | 51 (100.0%) | 0 (0.0%) |
| 18 to 24 Years | 6 (100.0%) | 28 (100.0%) |
| 25 to 34 Years | 26 (100.0%) | 30 (51.7%) |
| 35 to 44 Years | 97 (100.0%) | 42 (71.2%) |
| 45 to 54 Years | 82 (94.3%) | 13 (100.0%) |
| 55 to 64 Years | 24 (100.0%) | 49 (100.0%) |
| 65 to 74 Years | 41 (100.0%) | 31 (100.0%) |
| 75 Years and over | 7 (100.0%) | 10 (100.0%) |
| Total | 411 (97.2%) | 267 (82.9%) |
Income Below Poverty Among Married-Couple Families in Clinton
The poverty statistics for married-couple families in Clinton show that 2.8% or 4 of the total 141 families live below the poverty line. Families with 3 or 4 children have the highest poverty rate of 33.3%, comprising of 4 families. On the other hand, families with no children have the lowest poverty rate of 0.0%, which includes 0 families.
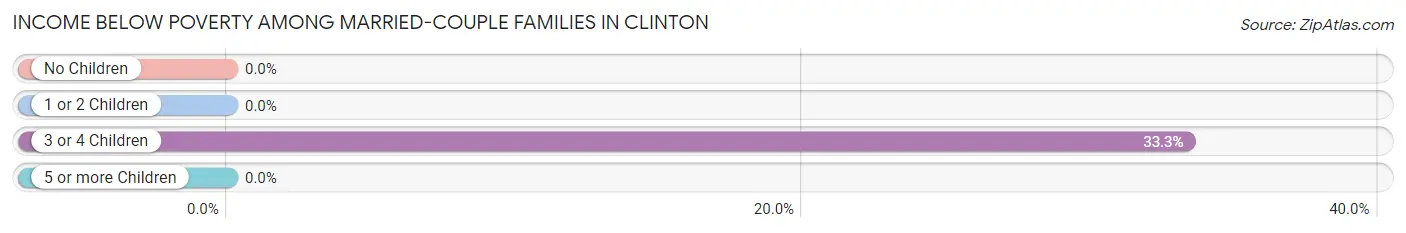
| Children | Above Poverty | Below Poverty |
| No Children | 80 (100.0%) | 0 (0.0%) |
| 1 or 2 Children | 44 (100.0%) | 0 (0.0%) |
| 3 or 4 Children | 8 (66.7%) | 4 (33.3%) |
| 5 or more Children | 5 (100.0%) | 0 (0.0%) |
| Total | 137 (97.2%) | 4 (2.8%) |
Income Below Poverty Among Single-Parent Households in Clinton
| Children | Single Father | Single Mother |
| No Children | 0 (0.0%) | 0 (0.0%) |
| 1 or 2 Children | 0 (0.0%) | 0 (0.0%) |
| 3 or 4 Children | 0 (0.0%) | 0 (0.0%) |
| 5 or more Children | 0 (0.0%) | 0 (0.0%) |
| Total | 0 (0.0%) | 0 (0.0%) |
Income Below Poverty Among Married-Couple vs Single-Parent Households in Clinton
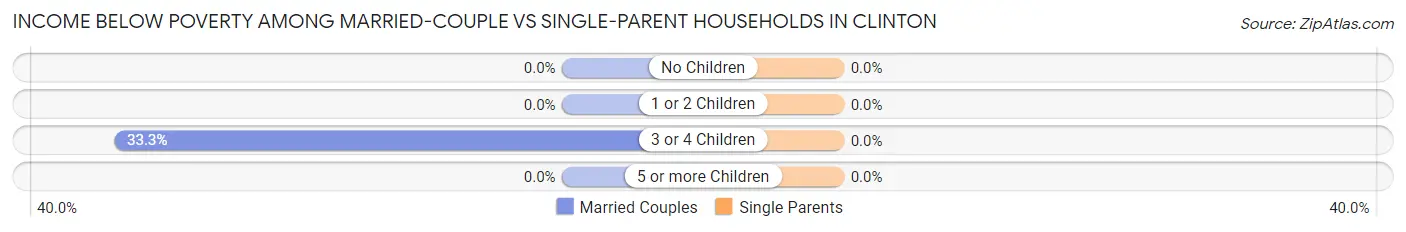
| Children | Married-Couple Families | Single-Parent Households |
| No Children | 0 (0.0%) | 0 (0.0%) |
| 1 or 2 Children | 0 (0.0%) | 0 (0.0%) |
| 3 or 4 Children | 4 (33.3%) | 0 (0.0%) |
| 5 or more Children | 0 (0.0%) | 0 (0.0%) |
| Total | 4 (2.8%) | 0 (0.0%) |
Race in Clinton
The most populous races in Clinton are White / Caucasian (654 | 87.8%), Two or more Races (60 | 8.1%), and Asian (28 | 3.8%).
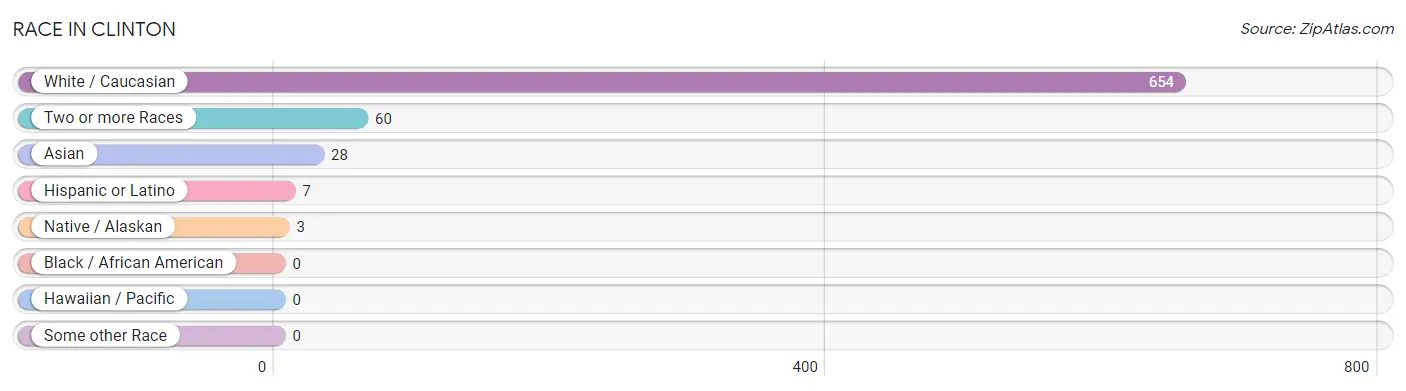
| Race | # Population | % Population |
| Asian | 28 | 3.8% |
| Black / African American | 0 | 0.0% |
| Hawaiian / Pacific | 0 | 0.0% |
| Hispanic or Latino | 7 | 0.9% |
| Native / Alaskan | 3 | 0.4% |
| White / Caucasian | 654 | 87.8% |
| Two or more Races | 60 | 8.1% |
| Some other Race | 0 | 0.0% |
| Total | 745 | 100.0% |
Ancestry in Clinton
The most populous ancestries reported in Clinton are German (86 | 11.5%), Irish (86 | 11.5%), Italian (78 | 10.5%), English (51 | 6.9%), and Korean (39 | 5.2%), together accounting for 45.6% of all Clinton residents.
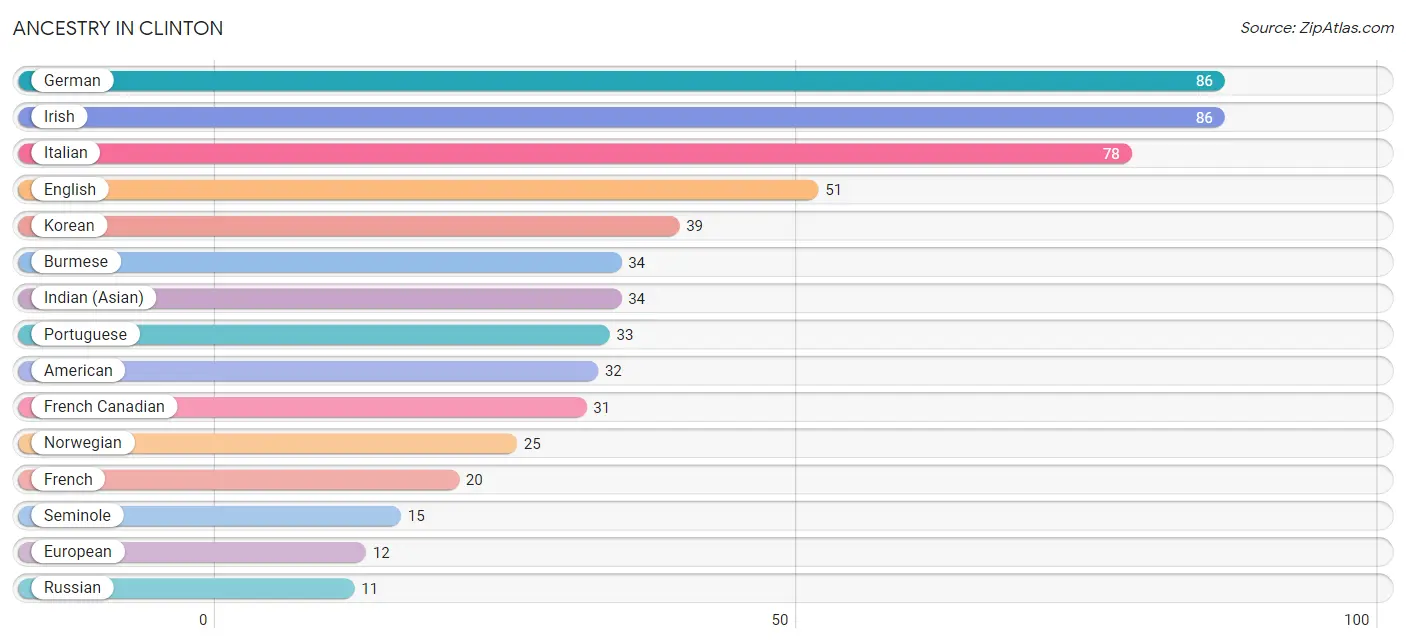
| Ancestry | # Population | % Population |
| American | 32 | 4.3% |
| Blackfeet | 3 | 0.4% |
| Burmese | 34 | 4.6% |
| Croatian | 10 | 1.3% |
| Czech | 1 | 0.1% |
| Czechoslovakian | 4 | 0.5% |
| Danish | 5 | 0.7% |
| English | 51 | 6.9% |
| European | 12 | 1.6% |
| French | 20 | 2.7% |
| French Canadian | 31 | 4.2% |
| German | 86 | 11.5% |
| Hungarian | 3 | 0.4% |
| Indian (Asian) | 34 | 4.6% |
| Irish | 86 | 11.5% |
| Italian | 78 | 10.5% |
| Korean | 39 | 5.2% |
| Norwegian | 25 | 3.4% |
| Portuguese | 33 | 4.4% |
| Russian | 11 | 1.5% |
| Seminole | 15 | 2.0% |
| Slovak | 9 | 1.2% |
| Spaniard | 7 | 0.9% |
| Swedish | 9 | 1.2% |
| Welsh | 5 | 0.7% | View All 25 Rows |
Immigrants in Clinton

| Immigration Origin | # Population | % Population | View All 0 Rows |
Sex and Age in Clinton
Sex and Age in Clinton
The most populous age groups in Clinton are 40 to 44 Years (74 | 17.5%) for men and 25 to 29 Years (38 | 11.8%) for women.
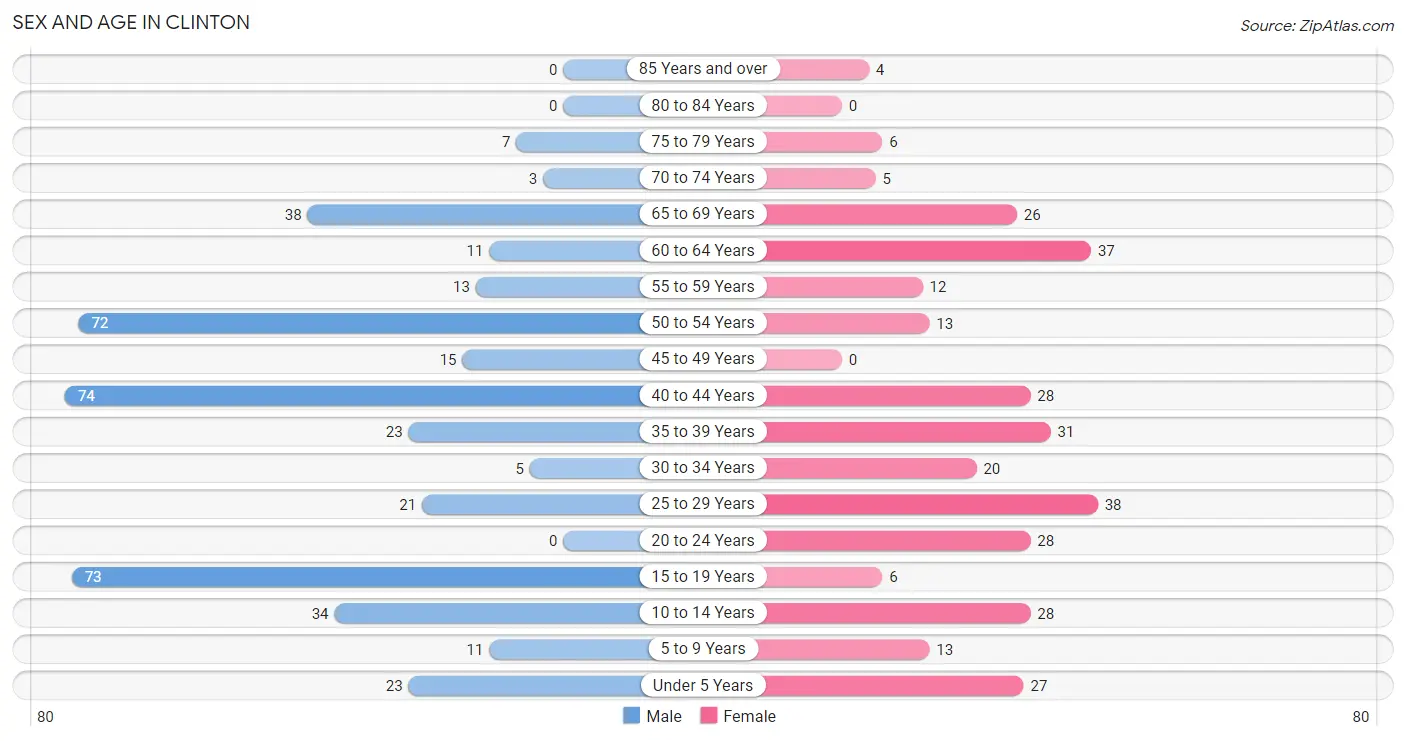
| Age Bracket | Male | Female |
| Under 5 Years | 23 (5.4%) | 27 (8.4%) |
| 5 to 9 Years | 11 (2.6%) | 13 (4.0%) |
| 10 to 14 Years | 34 (8.0%) | 28 (8.7%) |
| 15 to 19 Years | 73 (17.3%) | 6 (1.9%) |
| 20 to 24 Years | 0 (0.0%) | 28 (8.7%) |
| 25 to 29 Years | 21 (5.0%) | 38 (11.8%) |
| 30 to 34 Years | 5 (1.2%) | 20 (6.2%) |
| 35 to 39 Years | 23 (5.4%) | 31 (9.6%) |
| 40 to 44 Years | 74 (17.5%) | 28 (8.7%) |
| 45 to 49 Years | 15 (3.5%) | 0 (0.0%) |
| 50 to 54 Years | 72 (17.0%) | 13 (4.0%) |
| 55 to 59 Years | 13 (3.1%) | 12 (3.7%) |
| 60 to 64 Years | 11 (2.6%) | 37 (11.5%) |
| 65 to 69 Years | 38 (9.0%) | 26 (8.1%) |
| 70 to 74 Years | 3 (0.7%) | 5 (1.5%) |
| 75 to 79 Years | 7 (1.7%) | 6 (1.9%) |
| 80 to 84 Years | 0 (0.0%) | 0 (0.0%) |
| 85 Years and over | 0 (0.0%) | 4 (1.2%) |
| Total | 423 (100.0%) | 322 (100.0%) |
Families and Households in Clinton
Median Family Size in Clinton
The median family size in Clinton is 3.09 persons per family, with single female/mother families (21 | 10.2%) accounting for the largest median family size of 4.1 persons per family. On the other hand, married-couple families (141 | 68.4%) represent the smallest median family size with 2.91 persons per family.
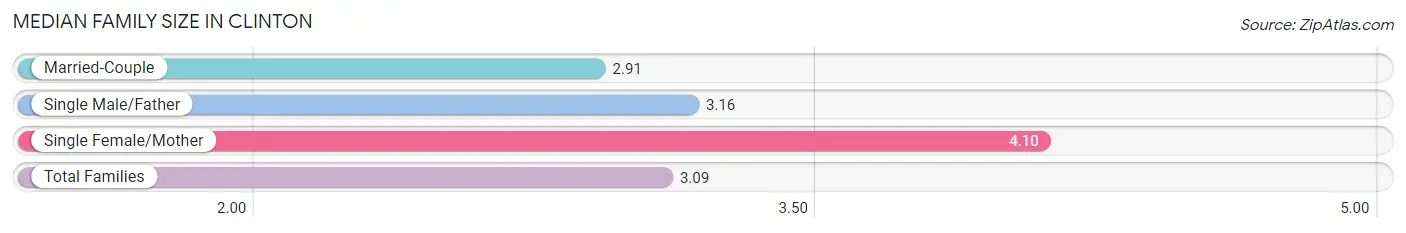
| Family Type | # Families | Family Size |
| Married-Couple | 141 (68.4%) | 2.91 |
| Single Male/Father | 44 (21.4%) | 3.16 |
| Single Female/Mother | 21 (10.2%) | 4.10 |
| Total Families | 206 (100.0%) | 3.09 |
Median Household Size in Clinton
The median household size in Clinton is 2.94 persons per household, with single female/mother households (21 | 8.3%) accounting for the largest median household size of 4.1 persons per household. non-family households (47 | 18.6%) represent the smallest median household size with 1.45 persons per household.
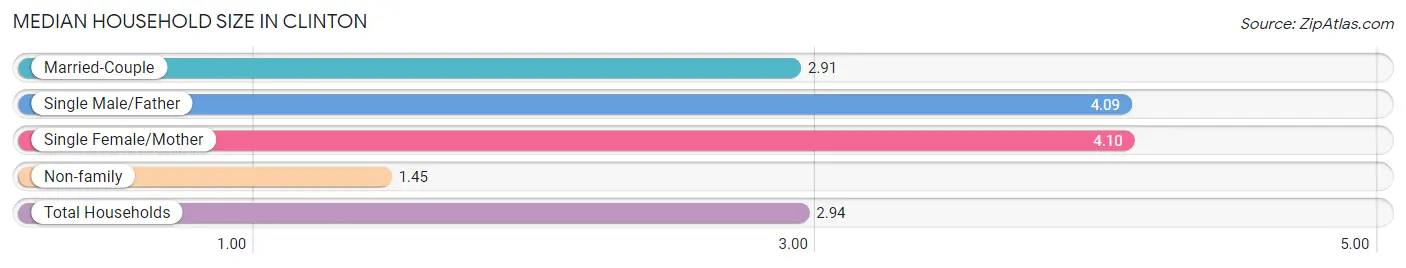
| Household Type | # Households | Household Size |
| Married-Couple | 141 (55.7%) | 2.91 |
| Single Male/Father | 44 (17.4%) | 4.09 |
| Single Female/Mother | 21 (8.3%) | 4.10 |
| Non-family | 47 (18.6%) | 1.45 |
| Total Households | 253 (100.0%) | 2.94 |
Household Size by Marriage Status in Clinton
Out of a total of 253 households in Clinton, 206 (81.4%) are family households, while 47 (18.6%) are nonfamily households. The most numerous type of family households are 2-person households, comprising 83, and the most common type of nonfamily households are 1-person households, comprising 37.
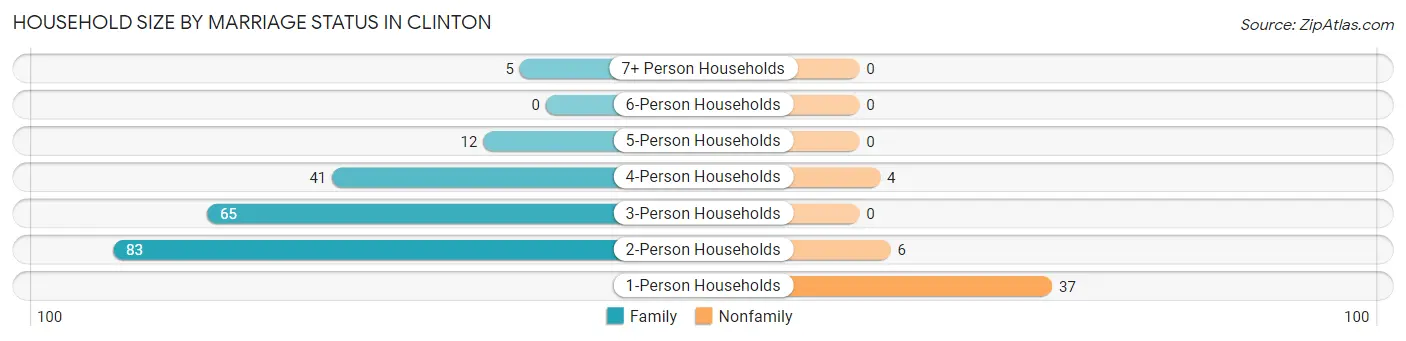
| Household Size | Family Households | Nonfamily Households |
| 1-Person Households | - | 37 (14.6%) |
| 2-Person Households | 83 (32.8%) | 6 (2.4%) |
| 3-Person Households | 65 (25.7%) | 0 (0.0%) |
| 4-Person Households | 41 (16.2%) | 4 (1.6%) |
| 5-Person Households | 12 (4.7%) | 0 (0.0%) |
| 6-Person Households | 0 (0.0%) | 0 (0.0%) |
| 7+ Person Households | 5 (2.0%) | 0 (0.0%) |
| Total | 206 (81.4%) | 47 (18.6%) |
Female Fertility in Clinton
Fertility by Age in Clinton
| Age Bracket | Women with Births | Births / 1,000 Women |
| 15 to 19 years | 0 (0.0%) | 0.0 |
| 20 to 34 years | 0 (0.0%) | 0.0 |
| 35 to 50 years | 0 (0.0%) | 0.0 |
| Total | 0 (0.0%) | 0.0 |
Fertility by Age by Marriage Status in Clinton
| Age Bracket | Married | Unmarried |
| 15 to 19 years | 0 (0.0%) | 0 (0.0%) |
| 20 to 34 years | 0 (0.0%) | 0 (0.0%) |
| 35 to 50 years | 0 (0.0%) | 0 (0.0%) |
| Total | 0 (0.0%) | 0 (0.0%) |
Fertility by Education in Clinton
| Educational Attainment | Women with Births | Births / 1,000 Women |
| Less than High School | 0 (0.0%) | 0.0 |
| High School Diploma | 0 (0.0%) | 0.0 |
| College or Associate's Degree | 0 (0.0%) | 0.0 |
| Bachelor's Degree | 0 (0.0%) | 0.0 |
| Graduate Degree | 0 (0.0%) | 0.0 |
| Total | 0 (0.0%) | 0.0 |
Fertility by Education by Marriage Status in Clinton
| Educational Attainment | Married | Unmarried |
| Less than High School | 0 (0.0%) | 0 (0.0%) |
| High School Diploma | 0 (0.0%) | 0 (0.0%) |
| College or Associate's Degree | 0 (0.0%) | 0 (0.0%) |
| Bachelor's Degree | 0 (0.0%) | 0 (0.0%) |
| Graduate Degree | 0 (0.0%) | 0 (0.0%) |
| Total | 0 (0.0%) | 0 (0.0%) |
Employment Characteristics in Clinton
Employment by Class of Employer in Clinton
Among the 367 employed individuals in Clinton, private company employees (218 | 59.4%), local government employees (59 | 16.1%), and self-employed (incorporated) (36 | 9.8%) make up the most common classes of employment.
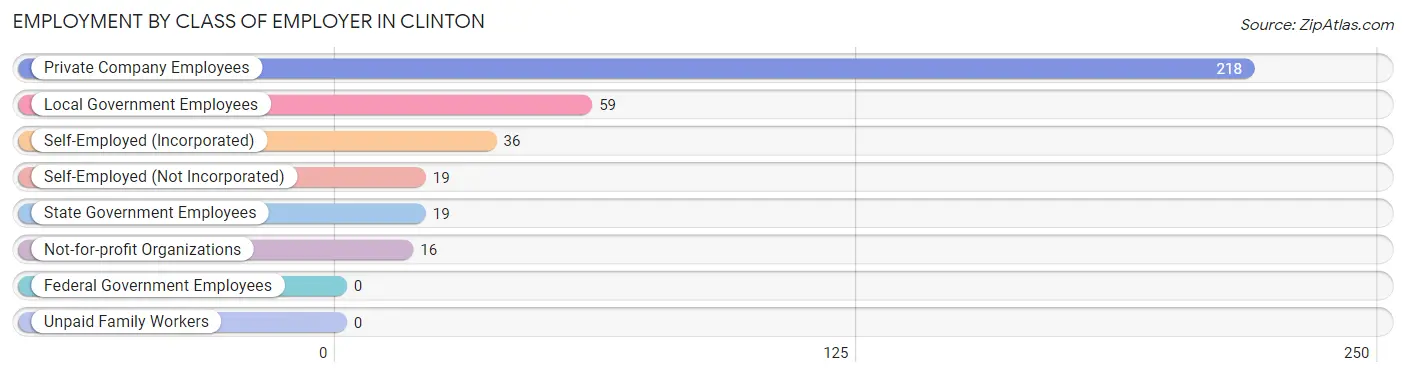
| Employer Class | # Employees | % Employees |
| Private Company Employees | 218 | 59.4% |
| Self-Employed (Incorporated) | 36 | 9.8% |
| Self-Employed (Not Incorporated) | 19 | 5.2% |
| Not-for-profit Organizations | 16 | 4.4% |
| Local Government Employees | 59 | 16.1% |
| State Government Employees | 19 | 5.2% |
| Federal Government Employees | 0 | 0.0% |
| Unpaid Family Workers | 0 | 0.0% |
| Total | 367 | 100.0% |
Employment Status by Age in Clinton
According to the labor force statistics for Clinton, out of the total population over 16 years of age (593), 64.4% or 382 individuals are in the labor force, with 1.3% or 5 of them unemployed. The age group with the highest labor force participation rate is 20 to 24 years, with 100.0% or 28 individuals in the labor force. Within the labor force, the 35 to 44 years age range has the highest percentage of unemployed individuals, with 3.6% or 5 of them being unemployed.
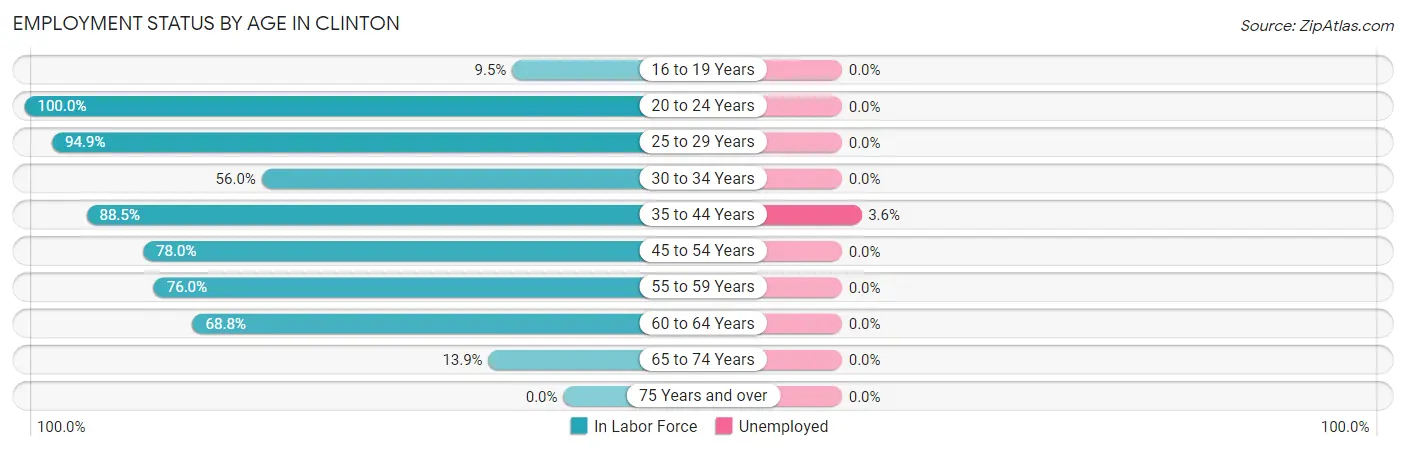
| Age Bracket | In Labor Force | Unemployed |
| 16 to 19 Years | 6 (9.5%) | 0 (0.0%) |
| 20 to 24 Years | 28 (100.0%) | 0 (0.0%) |
| 25 to 29 Years | 56 (94.9%) | 0 (0.0%) |
| 30 to 34 Years | 14 (56.0%) | 0 (0.0%) |
| 35 to 44 Years | 138 (88.5%) | 5 (3.6%) |
| 45 to 54 Years | 78 (78.0%) | 0 (0.0%) |
| 55 to 59 Years | 19 (76.0%) | 0 (0.0%) |
| 60 to 64 Years | 33 (68.8%) | 0 (0.0%) |
| 65 to 74 Years | 10 (13.9%) | 0 (0.0%) |
| 75 Years and over | 0 (0.0%) | 0 (0.0%) |
| Total | 382 (64.4%) | 5 (1.3%) |
Employment Status by Educational Attainment in Clinton
According to labor force statistics for Clinton, 81.8% of individuals (338) out of the total population between 25 and 64 years of age (413) are in the labor force, with 1.5% or 5 of them being unemployed. The group with the highest labor force participation rate are those with the educational attainment of less than high school, with 100.0% or 7 individuals in the labor force. Within the labor force, individuals with high school diploma education have the highest percentage of unemployment, with 4.7% or 5 of them being unemployed.
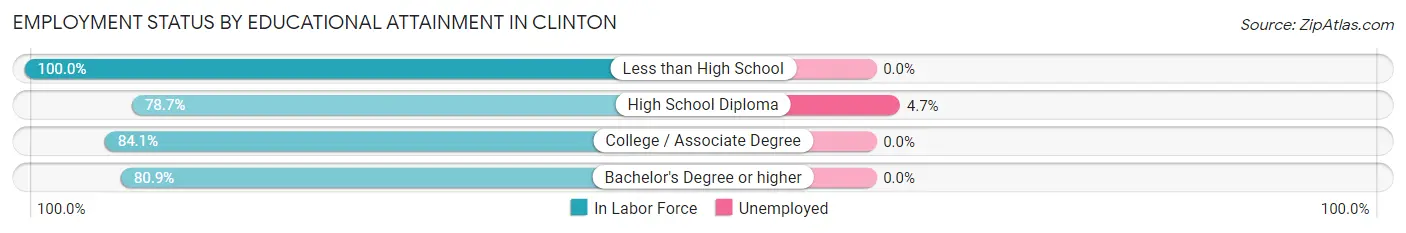
| Educational Attainment | In Labor Force | Unemployed |
| Less than High School | 7 (100.0%) | 0 (0.0%) |
| High School Diploma | 107 (78.7%) | 6 (4.7%) |
| College / Associate Degree | 148 (84.1%) | 0 (0.0%) |
| Bachelor's Degree or higher | 76 (80.9%) | 0 (0.0%) |
| Total | 338 (81.8%) | 6 (1.5%) |
Employment Occupations by Sex in Clinton
Management, Business, Science and Arts Occupations
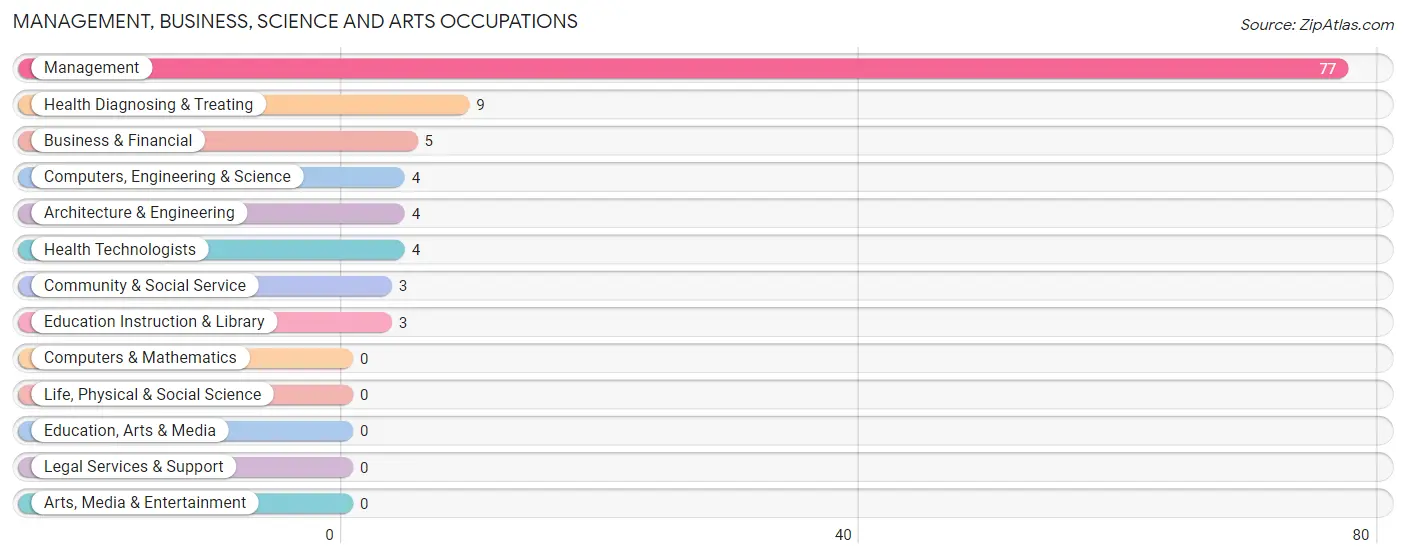
The most common Management, Business, Science and Arts occupations in Clinton are Management (77 | 20.4%), Health Diagnosing & Treating (9 | 2.4%), Business & Financial (5 | 1.3%), Computers, Engineering & Science (4 | 1.1%), and Architecture & Engineering (4 | 1.1%).
Management, Business, Science and Arts Occupations by Sex
Within the Management, Business, Science and Arts occupations in Clinton, the most male-oriented occupations are Business & Financial (100.0%), and Management (66.2%), while the most female-oriented occupations are Computers, Engineering & Science (100.0%), Architecture & Engineering (100.0%), and Community & Social Service (100.0%).
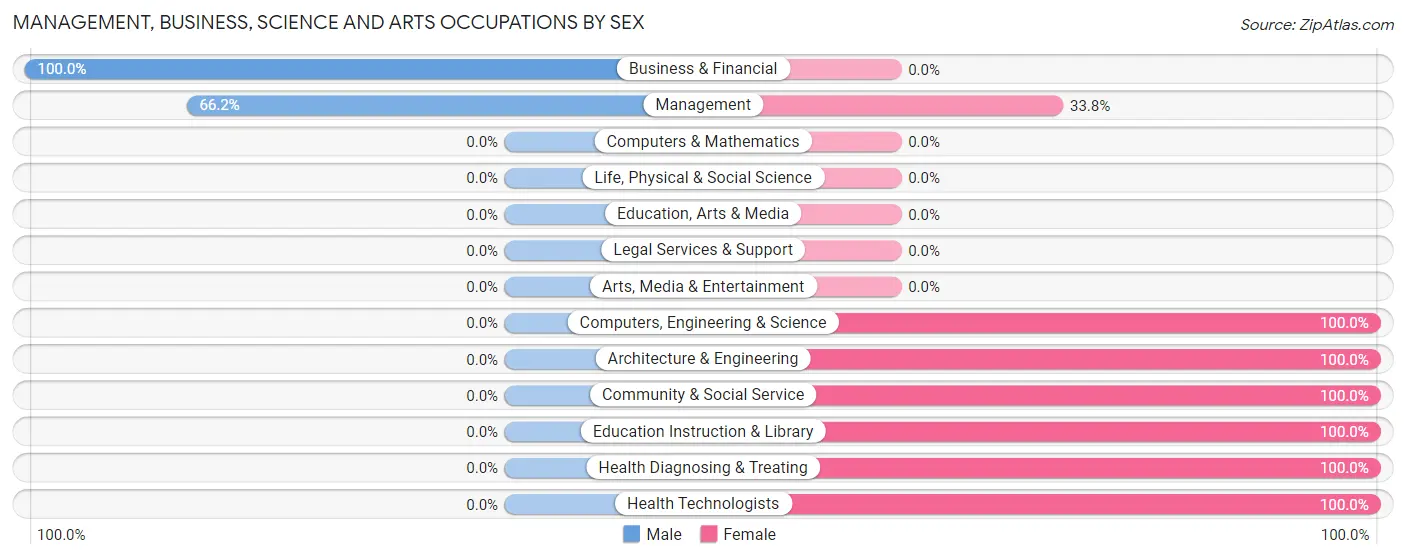
| Occupation | Male | Female |
| Management | 51 (66.2%) | 26 (33.8%) |
| Business & Financial | 5 (100.0%) | 0 (0.0%) |
| Computers, Engineering & Science | 0 (0.0%) | 4 (100.0%) |
| Computers & Mathematics | 0 (0.0%) | 0 (0.0%) |
| Architecture & Engineering | 0 (0.0%) | 4 (100.0%) |
| Life, Physical & Social Science | 0 (0.0%) | 0 (0.0%) |
| Community & Social Service | 0 (0.0%) | 3 (100.0%) |
| Education, Arts & Media | 0 (0.0%) | 0 (0.0%) |
| Legal Services & Support | 0 (0.0%) | 0 (0.0%) |
| Education Instruction & Library | 0 (0.0%) | 3 (100.0%) |
| Arts, Media & Entertainment | 0 (0.0%) | 0 (0.0%) |
| Health Diagnosing & Treating | 0 (0.0%) | 9 (100.0%) |
| Health Technologists | 0 (0.0%) | 4 (100.0%) |
| Total (Category) | 56 (57.1%) | 42 (42.9%) |
| Total (Overall) | 219 (58.1%) | 158 (41.9%) |
Services Occupations
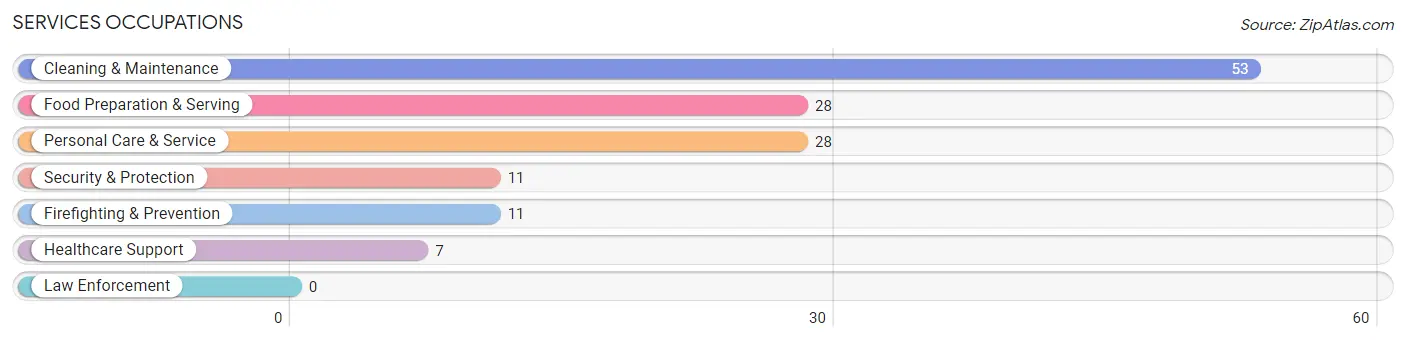
The most common Services occupations in Clinton are Cleaning & Maintenance (53 | 14.1%), Food Preparation & Serving (28 | 7.4%), Personal Care & Service (28 | 7.4%), Security & Protection (11 | 2.9%), and Firefighting & Prevention (11 | 2.9%).
Services Occupations by Sex
Within the Services occupations in Clinton, the most male-oriented occupations are Security & Protection (100.0%), Firefighting & Prevention (100.0%), and Cleaning & Maintenance (81.1%), while the most female-oriented occupations are Healthcare Support (100.0%), Food Preparation & Serving (100.0%), and Personal Care & Service (100.0%).
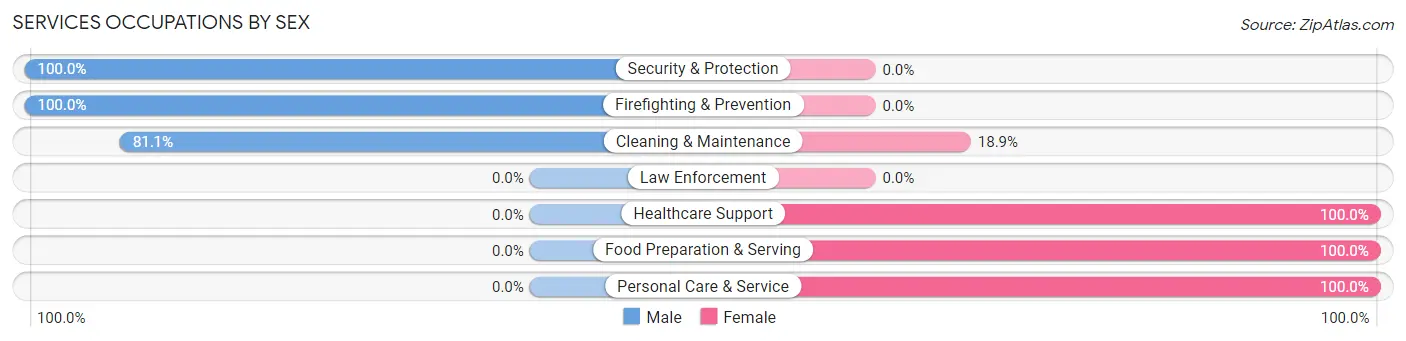
| Occupation | Male | Female |
| Healthcare Support | 0 (0.0%) | 7 (100.0%) |
| Security & Protection | 11 (100.0%) | 0 (0.0%) |
| Firefighting & Prevention | 11 (100.0%) | 0 (0.0%) |
| Law Enforcement | 0 (0.0%) | 0 (0.0%) |
| Food Preparation & Serving | 0 (0.0%) | 28 (100.0%) |
| Cleaning & Maintenance | 43 (81.1%) | 10 (18.9%) |
| Personal Care & Service | 0 (0.0%) | 28 (100.0%) |
| Total (Category) | 54 (42.5%) | 73 (57.5%) |
| Total (Overall) | 219 (58.1%) | 158 (41.9%) |
Sales and Office Occupations
The most common Sales and Office occupations in Clinton are Office & Administration (36 | 9.6%), and Sales & Related (14 | 3.7%).
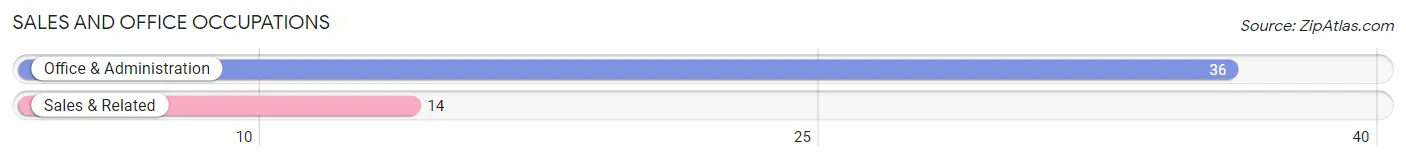
Sales and Office Occupations by Sex
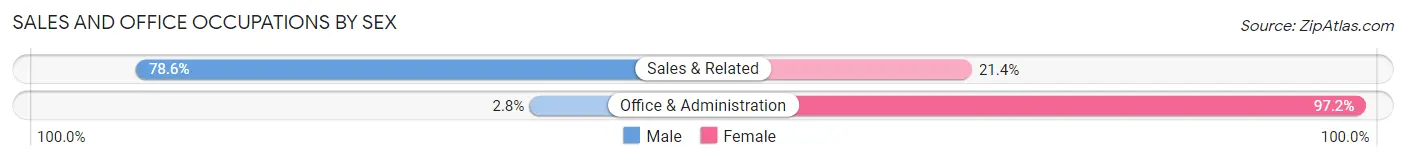
| Occupation | Male | Female |
| Sales & Related | 11 (78.6%) | 3 (21.4%) |
| Office & Administration | 1 (2.8%) | 35 (97.2%) |
| Total (Category) | 12 (24.0%) | 38 (76.0%) |
| Total (Overall) | 219 (58.1%) | 158 (41.9%) |
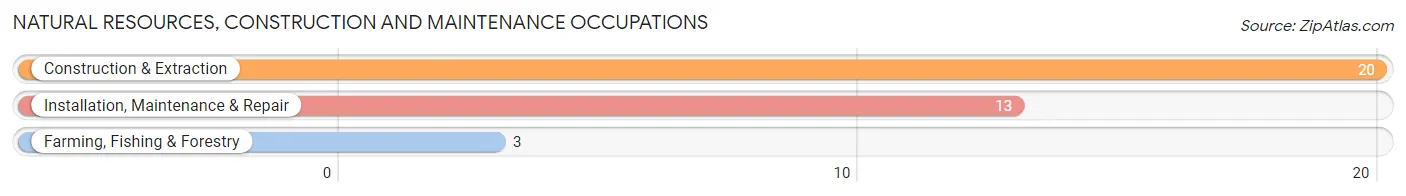
Natural Resources, Construction and Maintenance Occupations
The most common Natural Resources, Construction and Maintenance occupations in Clinton are Construction & Extraction (20 | 5.3%), Installation, Maintenance & Repair (13 | 3.5%), and Farming, Fishing & Forestry (3 | 0.8%).
Natural Resources, Construction and Maintenance Occupations by Sex
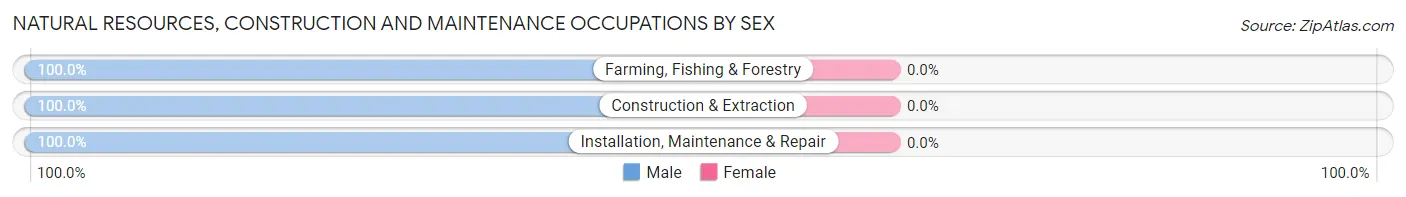
| Occupation | Male | Female |
| Farming, Fishing & Forestry | 3 (100.0%) | 0 (0.0%) |
| Construction & Extraction | 20 (100.0%) | 0 (0.0%) |
| Installation, Maintenance & Repair | 13 (100.0%) | 0 (0.0%) |
| Total (Category) | 36 (100.0%) | 0 (0.0%) |
| Total (Overall) | 219 (58.1%) | 158 (41.9%) |
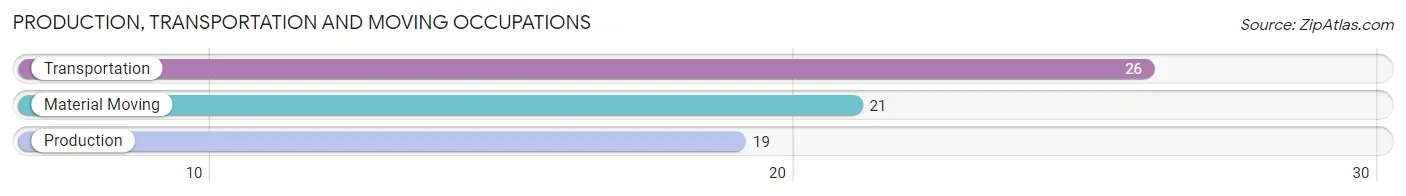
Production, Transportation and Moving Occupations
The most common Production, Transportation and Moving occupations in Clinton are Transportation (26 | 6.9%), Material Moving (21 | 5.6%), and Production (19 | 5.0%).
Production, Transportation and Moving Occupations by Sex
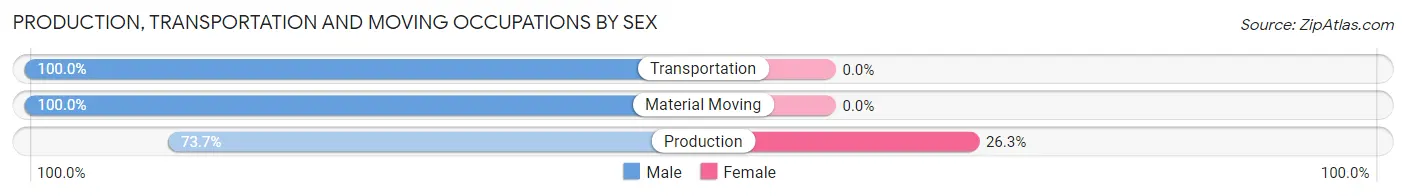
| Occupation | Male | Female |
| Production | 14 (73.7%) | 5 (26.3%) |
| Transportation | 26 (100.0%) | 0 (0.0%) |
| Material Moving | 21 (100.0%) | 0 (0.0%) |
| Total (Category) | 61 (92.4%) | 5 (7.6%) |
| Total (Overall) | 219 (58.1%) | 158 (41.9%) |
Employment Industries by Sex in Clinton
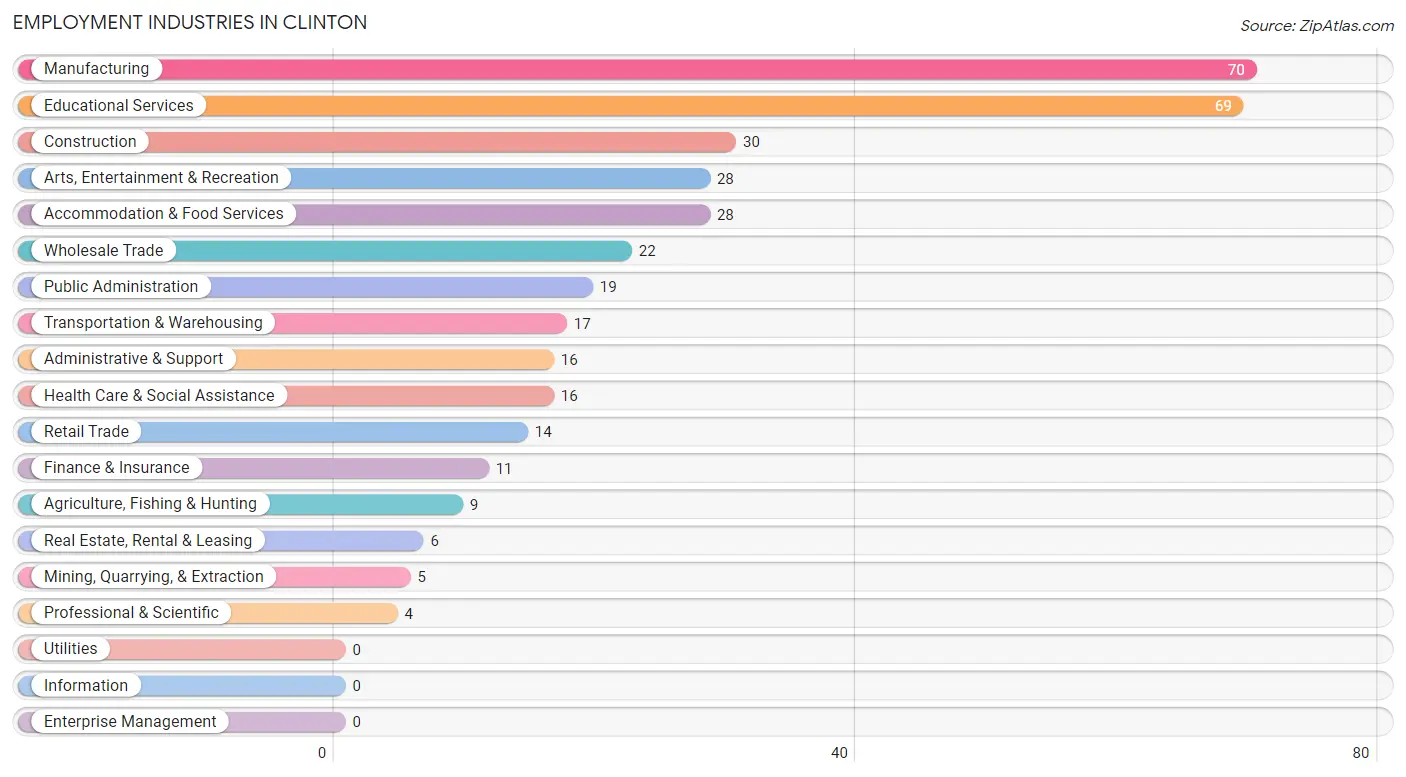
Employment Industries in Clinton
The major employment industries in Clinton include Manufacturing (70 | 18.6%), Educational Services (69 | 18.3%), Construction (30 | 8.0%), Arts, Entertainment & Recreation (28 | 7.4%), and Accommodation & Food Services (28 | 7.4%).
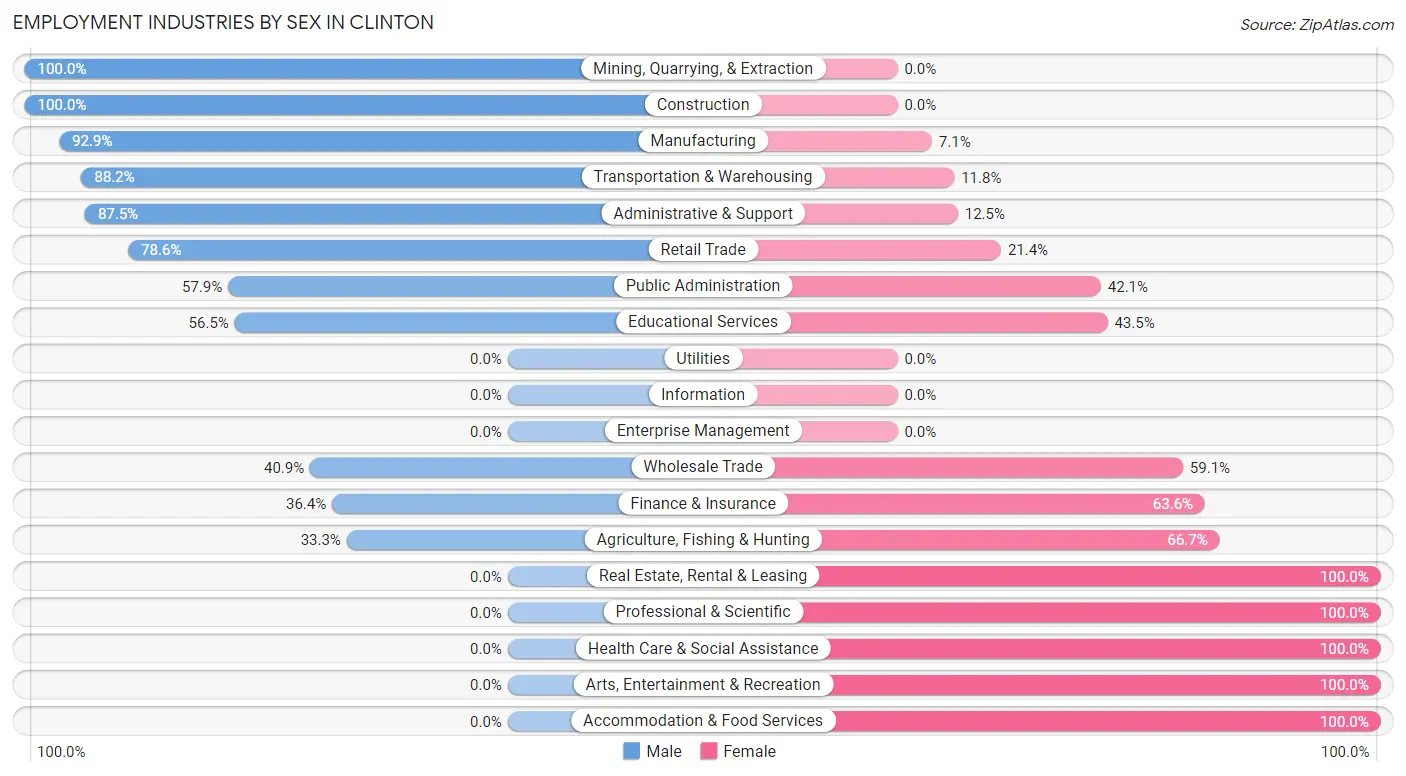
Employment Industries by Sex in Clinton
The Clinton industries that see more men than women are Mining, Quarrying, & Extraction (100.0%), Construction (100.0%), and Manufacturing (92.9%), whereas the industries that tend to have a higher number of women are Real Estate, Rental & Leasing (100.0%), Professional & Scientific (100.0%), and Health Care & Social Assistance (100.0%).
| Industry | Male | Female |
| Agriculture, Fishing & Hunting | 3 (33.3%) | 6 (66.7%) |
| Mining, Quarrying, & Extraction | 5 (100.0%) | 0 (0.0%) |
| Construction | 30 (100.0%) | 0 (0.0%) |
| Manufacturing | 65 (92.9%) | 5 (7.1%) |
| Wholesale Trade | 9 (40.9%) | 13 (59.1%) |
| Retail Trade | 11 (78.6%) | 3 (21.4%) |
| Transportation & Warehousing | 15 (88.2%) | 2 (11.8%) |
| Utilities | 0 (0.0%) | 0 (0.0%) |
| Information | 0 (0.0%) | 0 (0.0%) |
| Finance & Insurance | 4 (36.4%) | 7 (63.6%) |
| Real Estate, Rental & Leasing | 0 (0.0%) | 6 (100.0%) |
| Professional & Scientific | 0 (0.0%) | 4 (100.0%) |
| Enterprise Management | 0 (0.0%) | 0 (0.0%) |
| Administrative & Support | 14 (87.5%) | 2 (12.5%) |
| Educational Services | 39 (56.5%) | 30 (43.5%) |
| Health Care & Social Assistance | 0 (0.0%) | 16 (100.0%) |
| Arts, Entertainment & Recreation | 0 (0.0%) | 28 (100.0%) |
| Accommodation & Food Services | 0 (0.0%) | 28 (100.0%) |
| Public Administration | 11 (57.9%) | 8 (42.1%) |
| Total | 219 (58.1%) | 158 (41.9%) |
Education in Clinton
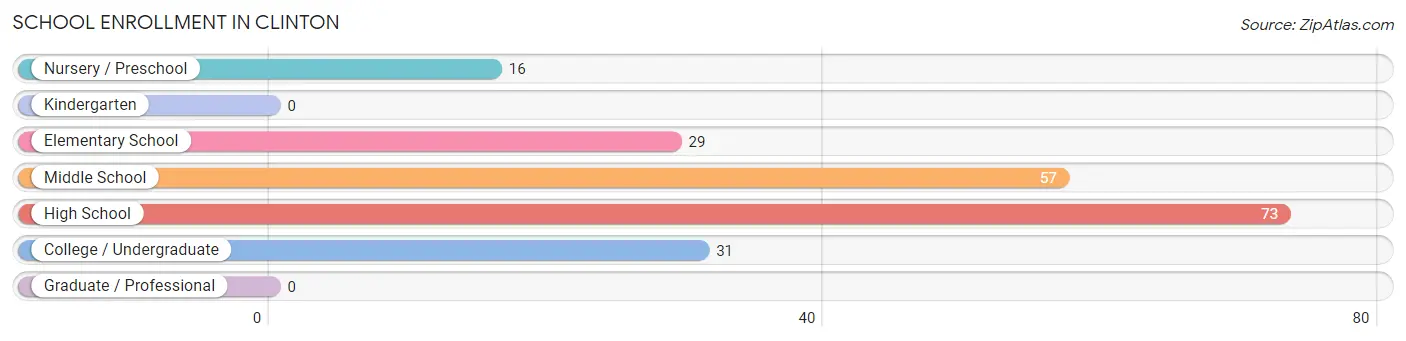
School Enrollment in Clinton
The most common levels of schooling among the 206 students in Clinton are high school (73 | 35.4%), middle school (57 | 27.7%), and college / undergraduate (31 | 15.0%).
| School Level | # Students | % Students |
| Nursery / Preschool | 16 | 7.8% |
| Kindergarten | 0 | 0.0% |
| Elementary School | 29 | 14.1% |
| Middle School | 57 | 27.7% |
| High School | 73 | 35.4% |
| College / Undergraduate | 31 | 15.0% |
| Graduate / Professional | 0 | 0.0% |
| Total | 206 | 100.0% |
School Enrollment by Age by Funding Source in Clinton
Out of a total of 206 students who are enrolled in schools in Clinton, 49 (23.8%) attend a private institution, while the remaining 157 (76.2%) are enrolled in public schools. The age group of 5 to 9 year old has the highest likelihood of being enrolled in private schools, with 11 (45.8% in the age bracket) enrolled. Conversely, the age group of 3 to 4 year olds has the lowest likelihood of being enrolled in a private school, with 16 (100.0% in the age bracket) attending a public institution.
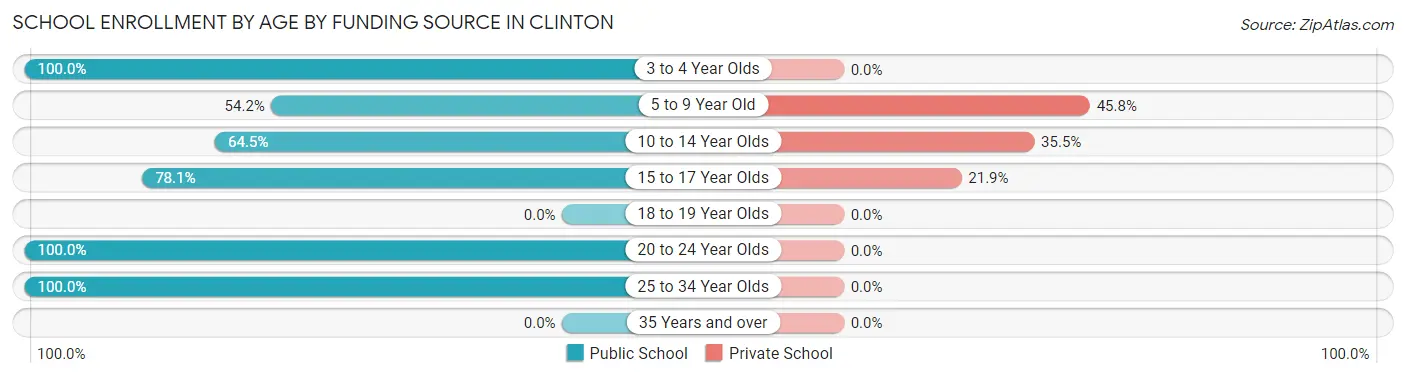
| Age Bracket | Public School | Private School |
| 3 to 4 Year Olds | 16 (100.0%) | 0 (0.0%) |
| 5 to 9 Year Old | 13 (54.2%) | 11 (45.8%) |
| 10 to 14 Year Olds | 40 (64.5%) | 22 (35.5%) |
| 15 to 17 Year Olds | 57 (78.1%) | 16 (21.9%) |
| 18 to 19 Year Olds | 0 (0.0%) | 0 (0.0%) |
| 20 to 24 Year Olds | 28 (100.0%) | 0 (0.0%) |
| 25 to 34 Year Olds | 3 (100.0%) | 0 (0.0%) |
| 35 Years and over | 0 (0.0%) | 0 (0.0%) |
| Total | 157 (76.2%) | 49 (23.8%) |
Educational Attainment by Field of Study in Clinton
Education (37 | 26.2%), bio, nature & agricultural (36 | 25.5%), physical & health sciences (19 | 13.5%), science & technology (16 | 11.4%), and computers & mathematics (12 | 8.5%) are the most common fields of study among 141 individuals in Clinton who have obtained a bachelor's degree or higher.
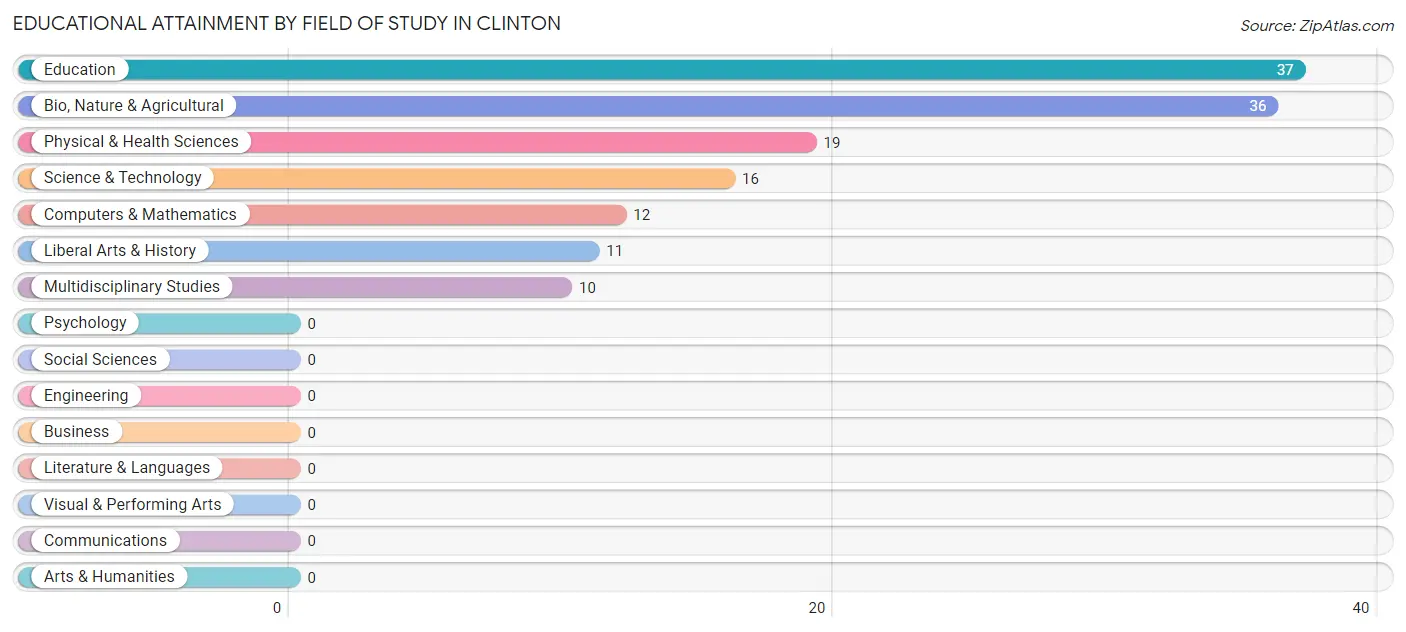
| Field of Study | # Graduates | % Graduates |
| Computers & Mathematics | 12 | 8.5% |
| Bio, Nature & Agricultural | 36 | 25.5% |
| Physical & Health Sciences | 19 | 13.5% |
| Psychology | 0 | 0.0% |
| Social Sciences | 0 | 0.0% |
| Engineering | 0 | 0.0% |
| Multidisciplinary Studies | 10 | 7.1% |
| Science & Technology | 16 | 11.4% |
| Business | 0 | 0.0% |
| Education | 37 | 26.2% |
| Literature & Languages | 0 | 0.0% |
| Liberal Arts & History | 11 | 7.8% |
| Visual & Performing Arts | 0 | 0.0% |
| Communications | 0 | 0.0% |
| Arts & Humanities | 0 | 0.0% |
| Total | 141 | 100.0% |
Transportation & Commute in Clinton
Vehicle Availability by Sex in Clinton
The most prevalent vehicle ownership categories in Clinton are males with 2 vehicles (69, accounting for 33.0%) and females with 2 vehicles (44, making up 43.7%).
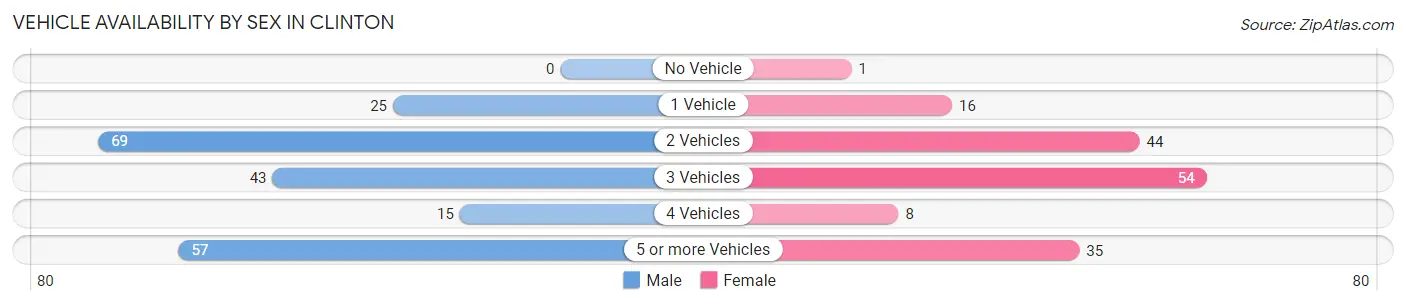
| Vehicles Available | Male | Female |
| No Vehicle | 0 (0.0%) | 1 (0.6%) |
| 1 Vehicle | 25 (12.0%) | 16 (10.1%) |
| 2 Vehicles | 69 (33.0%) | 44 (27.9%) |
| 3 Vehicles | 43 (20.6%) | 54 (34.2%) |
| 4 Vehicles | 15 (7.2%) | 8 (5.1%) |
| 5 or more Vehicles | 57 (27.3%) | 35 (22.2%) |
| Total | 209 (100.0%) | 158 (100.0%) |
Commute Time in Clinton
The most frequently occuring commute durations in Clinton are 20 to 24 minutes (129 commuters, 35.7%), 30 to 34 minutes (91 commuters, 25.2%), and 35 to 39 minutes (44 commuters, 12.2%).
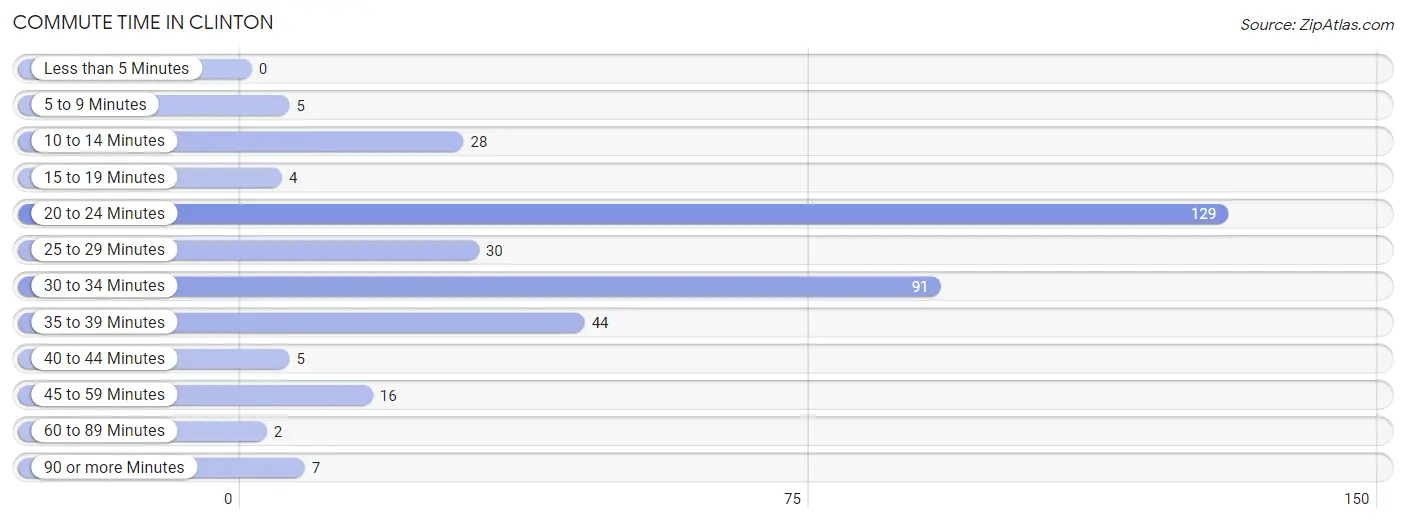
| Commute Time | # Commuters | % Commuters |
| Less than 5 Minutes | 0 | 0.0% |
| 5 to 9 Minutes | 5 | 1.4% |
| 10 to 14 Minutes | 28 | 7.8% |
| 15 to 19 Minutes | 4 | 1.1% |
| 20 to 24 Minutes | 129 | 35.7% |
| 25 to 29 Minutes | 30 | 8.3% |
| 30 to 34 Minutes | 91 | 25.2% |
| 35 to 39 Minutes | 44 | 12.2% |
| 40 to 44 Minutes | 5 | 1.4% |
| 45 to 59 Minutes | 16 | 4.4% |
| 60 to 89 Minutes | 2 | 0.5% |
| 90 or more Minutes | 7 | 1.9% |
Commute Time by Sex in Clinton
The most common commute times in Clinton are 20 to 24 minutes (86 commuters, 41.1%) for males and 30 to 34 minutes (53 commuters, 34.9%) for females.
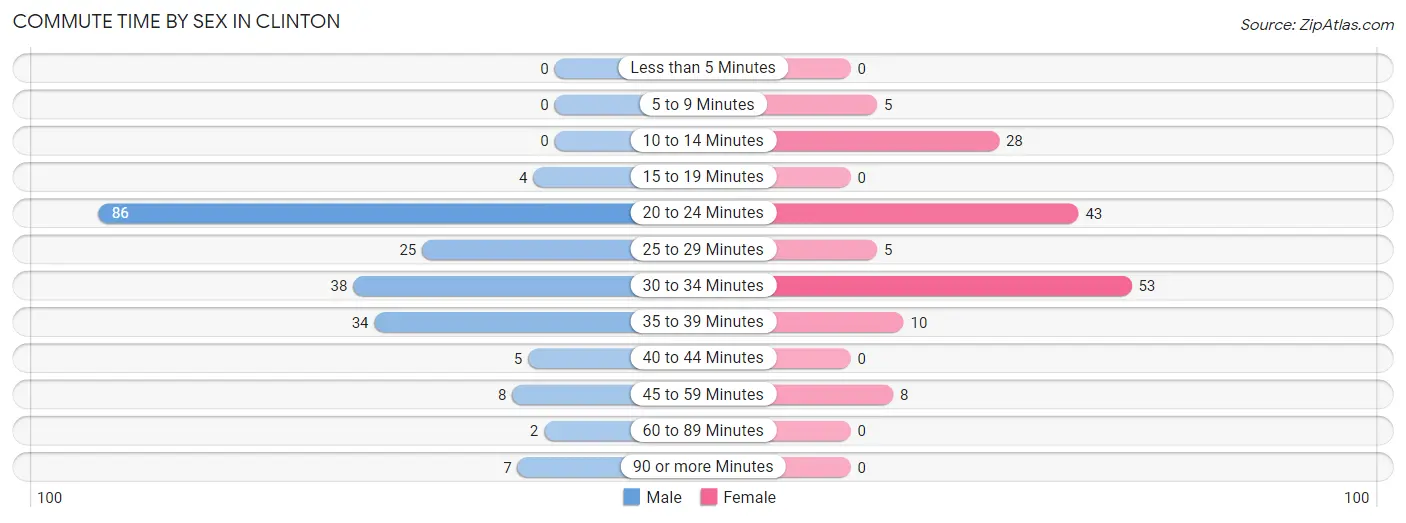
| Commute Time | Male | Female |
| Less than 5 Minutes | 0 (0.0%) | 0 (0.0%) |
| 5 to 9 Minutes | 0 (0.0%) | 5 (3.3%) |
| 10 to 14 Minutes | 0 (0.0%) | 28 (18.4%) |
| 15 to 19 Minutes | 4 (1.9%) | 0 (0.0%) |
| 20 to 24 Minutes | 86 (41.1%) | 43 (28.3%) |
| 25 to 29 Minutes | 25 (12.0%) | 5 (3.3%) |
| 30 to 34 Minutes | 38 (18.2%) | 53 (34.9%) |
| 35 to 39 Minutes | 34 (16.3%) | 10 (6.6%) |
| 40 to 44 Minutes | 5 (2.4%) | 0 (0.0%) |
| 45 to 59 Minutes | 8 (3.8%) | 8 (5.3%) |
| 60 to 89 Minutes | 2 (1.0%) | 0 (0.0%) |
| 90 or more Minutes | 7 (3.4%) | 0 (0.0%) |
Time of Departure to Work by Sex in Clinton
The most frequent times of departure to work in Clinton are 6:00 AM to 6:29 AM (61, 29.2%) for males and 12:00 PM to 3:59 PM (56, 36.8%) for females.
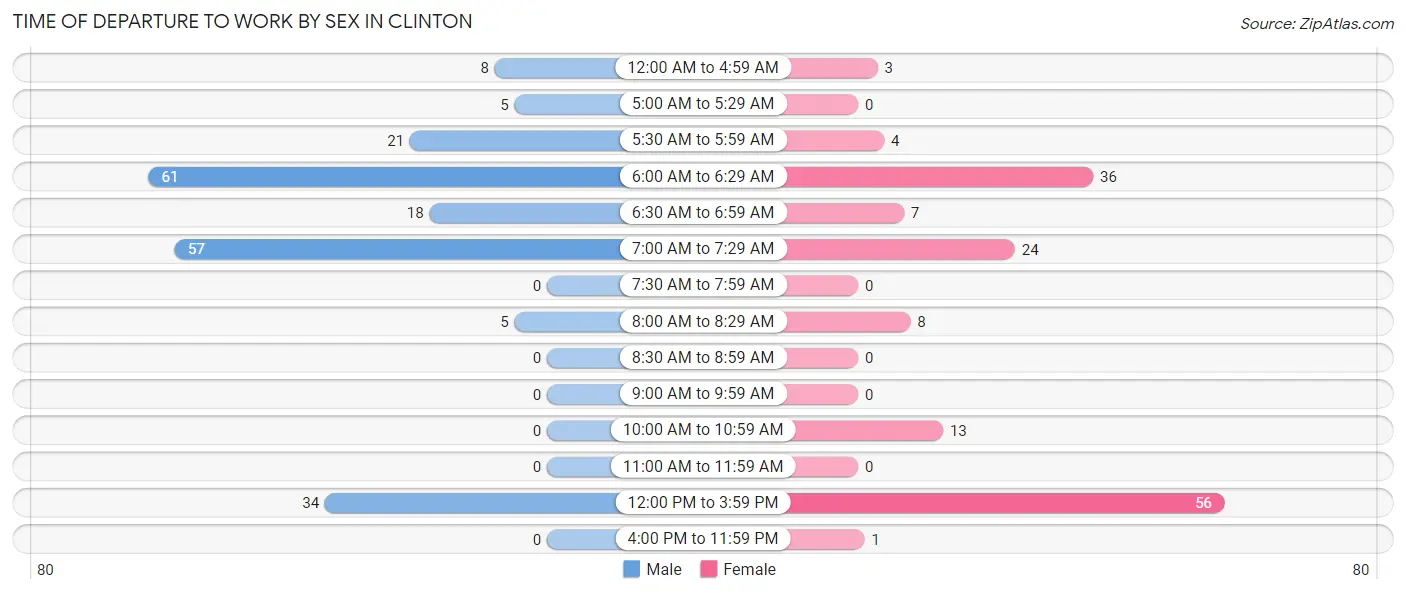
| Time of Departure | Male | Female |
| 12:00 AM to 4:59 AM | 8 (3.8%) | 3 (2.0%) |
| 5:00 AM to 5:29 AM | 5 (2.4%) | 0 (0.0%) |
| 5:30 AM to 5:59 AM | 21 (10.1%) | 4 (2.6%) |
| 6:00 AM to 6:29 AM | 61 (29.2%) | 36 (23.7%) |
| 6:30 AM to 6:59 AM | 18 (8.6%) | 7 (4.6%) |
| 7:00 AM to 7:29 AM | 57 (27.3%) | 24 (15.8%) |
| 7:30 AM to 7:59 AM | 0 (0.0%) | 0 (0.0%) |
| 8:00 AM to 8:29 AM | 5 (2.4%) | 8 (5.3%) |
| 8:30 AM to 8:59 AM | 0 (0.0%) | 0 (0.0%) |
| 9:00 AM to 9:59 AM | 0 (0.0%) | 0 (0.0%) |
| 10:00 AM to 10:59 AM | 0 (0.0%) | 13 (8.6%) |
| 11:00 AM to 11:59 AM | 0 (0.0%) | 0 (0.0%) |
| 12:00 PM to 3:59 PM | 34 (16.3%) | 56 (36.8%) |
| 4:00 PM to 11:59 PM | 0 (0.0%) | 1 (0.7%) |
| Total | 209 (100.0%) | 152 (100.0%) |
Housing Occupancy in Clinton
Occupancy by Ownership in Clinton
Of the total 253 dwellings in Clinton, owner-occupied units account for 220 (87.0%), while renter-occupied units make up 33 (13.0%).
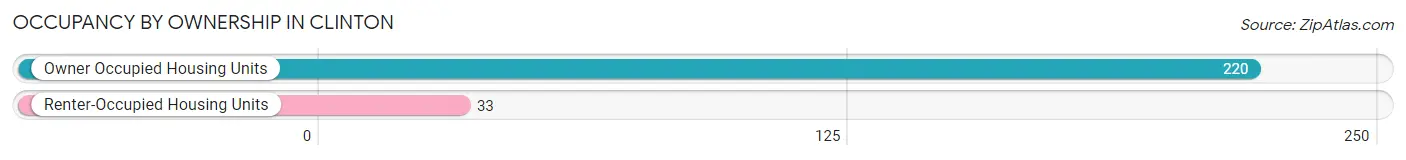
| Occupancy | # Housing Units | % Housing Units |
| Owner Occupied Housing Units | 220 | 87.0% |
| Renter-Occupied Housing Units | 33 | 13.0% |
| Total Occupied Housing Units | 253 | 100.0% |
Occupancy by Household Size in Clinton
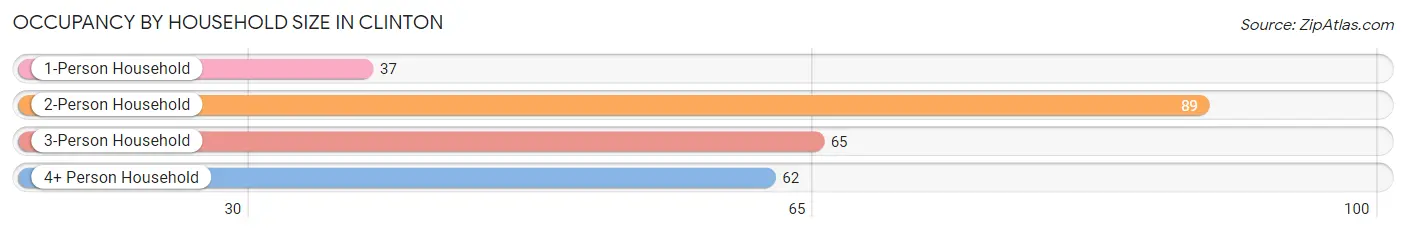
| Household Size | # Housing Units | % Housing Units |
| 1-Person Household | 37 | 14.6% |
| 2-Person Household | 89 | 35.2% |
| 3-Person Household | 65 | 25.7% |
| 4+ Person Household | 62 | 24.5% |
| Total Housing Units | 253 | 100.0% |
Occupancy by Ownership by Household Size in Clinton
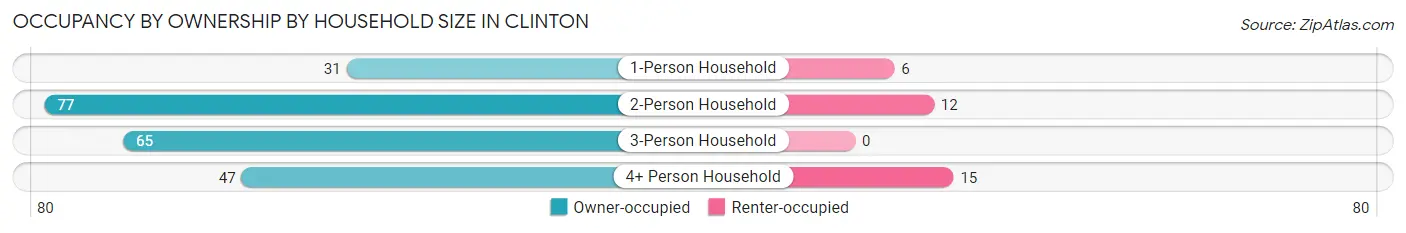
| Household Size | Owner-occupied | Renter-occupied |
| 1-Person Household | 31 (83.8%) | 6 (16.2%) |
| 2-Person Household | 77 (86.5%) | 12 (13.5%) |
| 3-Person Household | 65 (100.0%) | 0 (0.0%) |
| 4+ Person Household | 47 (75.8%) | 15 (24.2%) |
| Total Housing Units | 220 (87.0%) | 33 (13.0%) |
Occupancy by Educational Attainment in Clinton
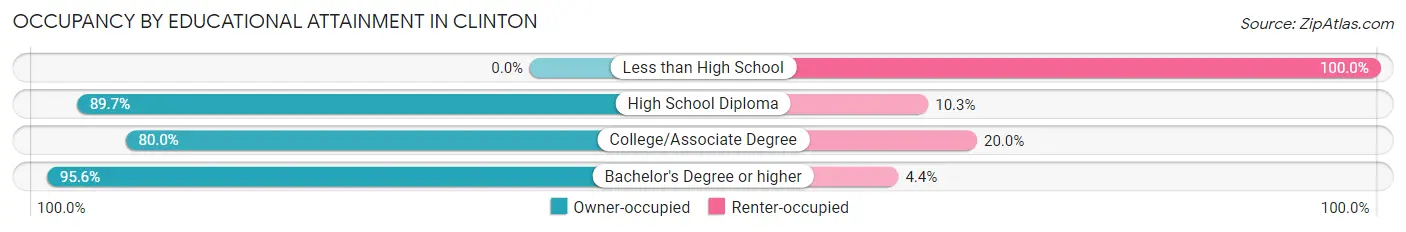
| Household Size | Owner-occupied | Renter-occupied |
| Less than High School | 0 (0.0%) | 7 (100.0%) |
| High School Diploma | 52 (89.7%) | 6 (10.3%) |
| College/Associate Degree | 60 (80.0%) | 15 (20.0%) |
| Bachelor's Degree or higher | 108 (95.6%) | 5 (4.4%) |
Occupancy by Age of Householder in Clinton
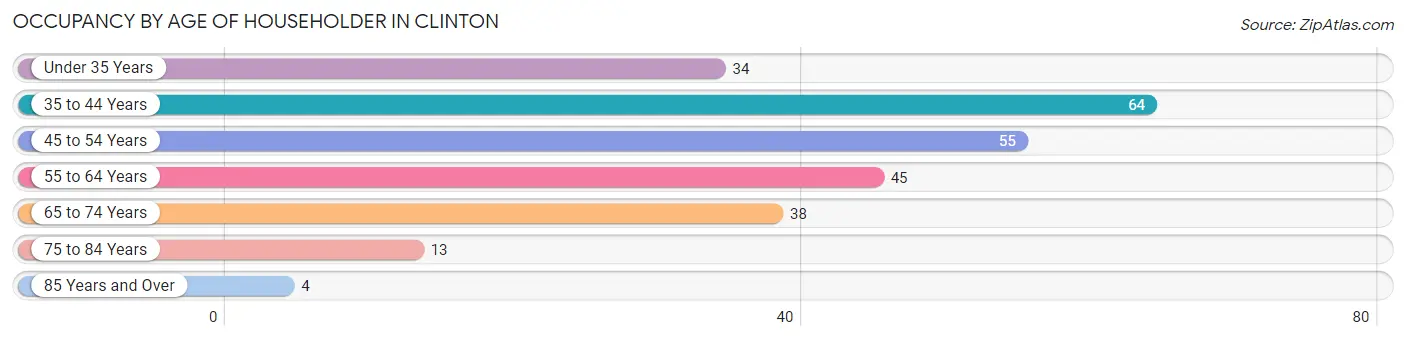
| Age Bracket | # Households | % Households |
| Under 35 Years | 34 | 13.4% |
| 35 to 44 Years | 64 | 25.3% |
| 45 to 54 Years | 55 | 21.7% |
| 55 to 64 Years | 45 | 17.8% |
| 65 to 74 Years | 38 | 15.0% |
| 75 to 84 Years | 13 | 5.1% |
| 85 Years and Over | 4 | 1.6% |
| Total | 253 | 100.0% |
Housing Finances in Clinton
Median Income by Occupancy in Clinton
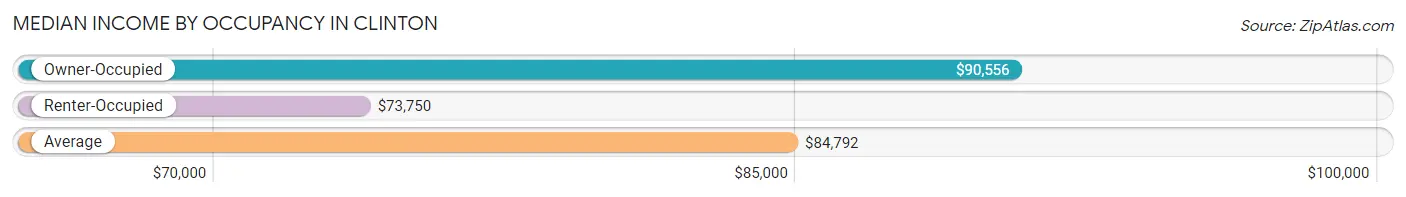
| Occupancy Type | # Households | Median Income |
| Owner-Occupied | 220 (87.0%) | $90,556 |
| Renter-Occupied | 33 (13.0%) | $73,750 |
| Average | 253 (100.0%) | $84,792 |
Occupancy by Householder Income Bracket in Clinton
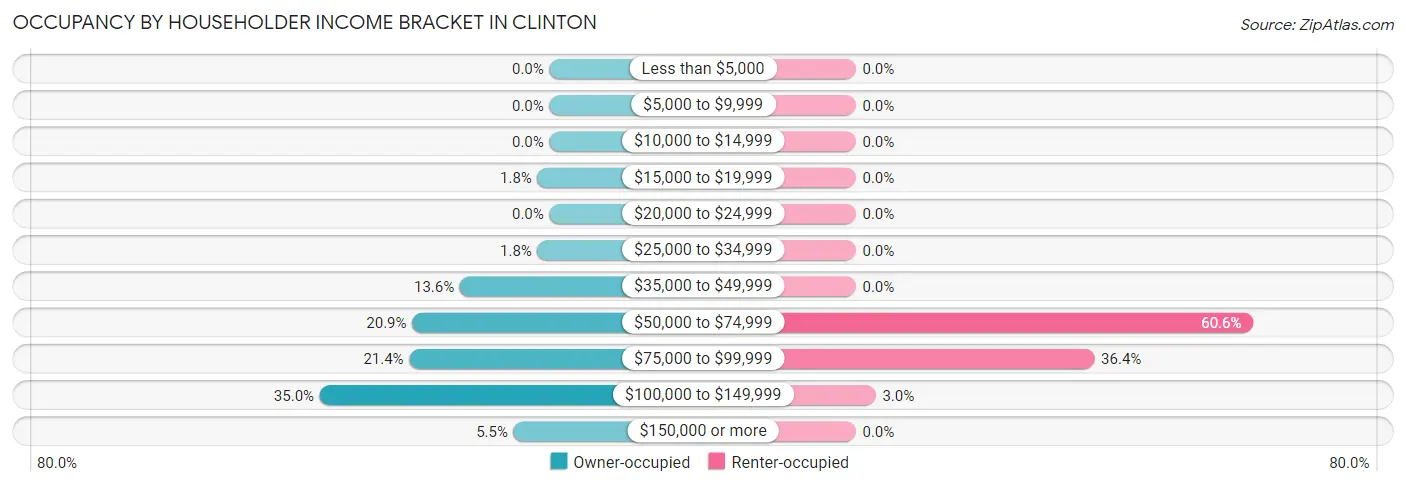
| Income Bracket | Owner-occupied | Renter-occupied |
| Less than $5,000 | 0 (0.0%) | 0 (0.0%) |
| $5,000 to $9,999 | 0 (0.0%) | 0 (0.0%) |
| $10,000 to $14,999 | 0 (0.0%) | 0 (0.0%) |
| $15,000 to $19,999 | 4 (1.8%) | 0 (0.0%) |
| $20,000 to $24,999 | 0 (0.0%) | 0 (0.0%) |
| $25,000 to $34,999 | 4 (1.8%) | 0 (0.0%) |
| $35,000 to $49,999 | 30 (13.6%) | 0 (0.0%) |
| $50,000 to $74,999 | 46 (20.9%) | 20 (60.6%) |
| $75,000 to $99,999 | 47 (21.4%) | 12 (36.4%) |
| $100,000 to $149,999 | 77 (35.0%) | 1 (3.0%) |
| $150,000 or more | 12 (5.4%) | 0 (0.0%) |
| Total | 220 (100.0%) | 33 (100.0%) |
Monthly Housing Cost Tiers in Clinton
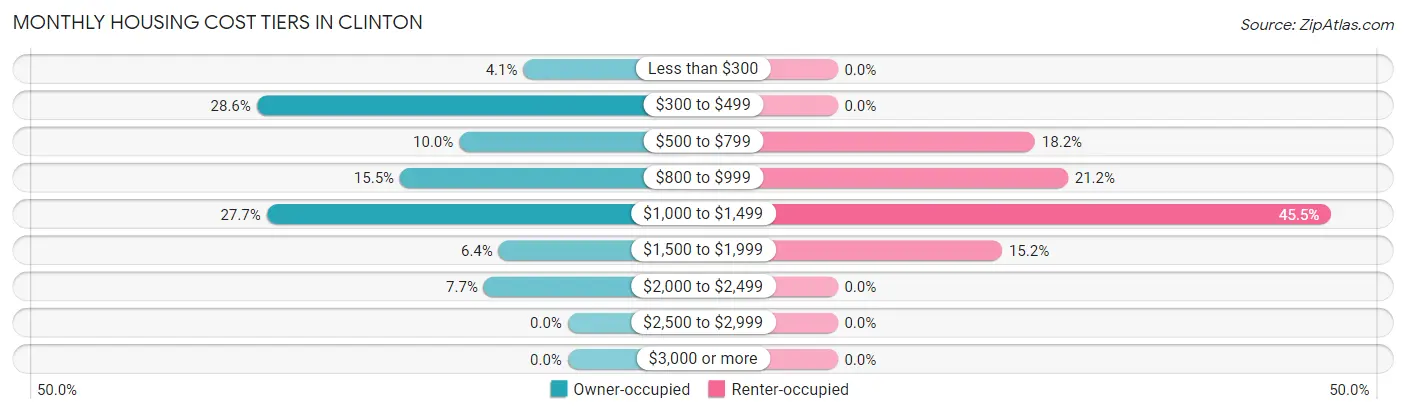
| Monthly Cost | Owner-occupied | Renter-occupied |
| Less than $300 | 9 (4.1%) | 0 (0.0%) |
| $300 to $499 | 63 (28.6%) | 0 (0.0%) |
| $500 to $799 | 22 (10.0%) | 6 (18.2%) |
| $800 to $999 | 34 (15.4%) | 7 (21.2%) |
| $1,000 to $1,499 | 61 (27.7%) | 15 (45.5%) |
| $1,500 to $1,999 | 14 (6.4%) | 5 (15.1%) |
| $2,000 to $2,499 | 17 (7.7%) | 0 (0.0%) |
| $2,500 to $2,999 | 0 (0.0%) | 0 (0.0%) |
| $3,000 or more | 0 (0.0%) | 0 (0.0%) |
| Total | 220 (100.0%) | 33 (100.0%) |
Physical Housing Characteristics in Clinton
Housing Structures in Clinton
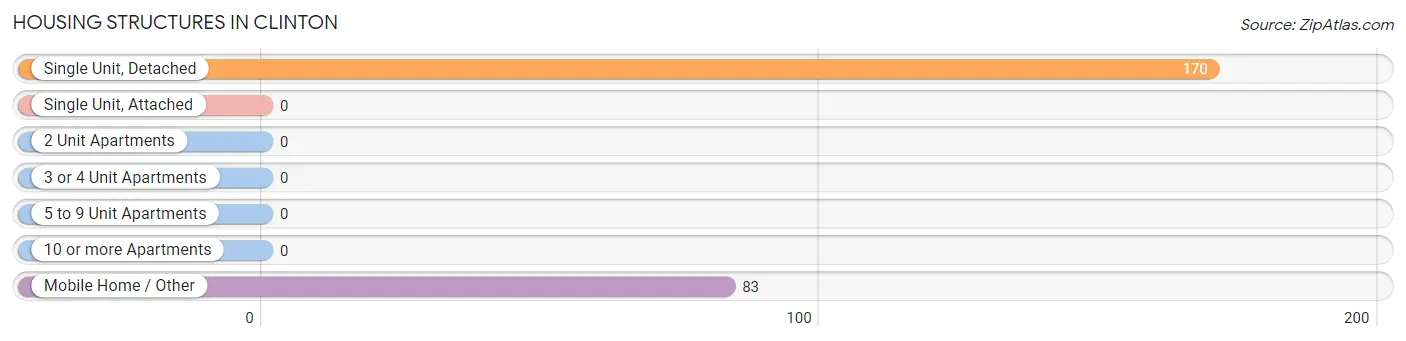
| Structure Type | # Housing Units | % Housing Units |
| Single Unit, Detached | 170 | 67.2% |
| Single Unit, Attached | 0 | 0.0% |
| 2 Unit Apartments | 0 | 0.0% |
| 3 or 4 Unit Apartments | 0 | 0.0% |
| 5 to 9 Unit Apartments | 0 | 0.0% |
| 10 or more Apartments | 0 | 0.0% |
| Mobile Home / Other | 83 | 32.8% |
| Total | 253 | 100.0% |
Housing Structures by Occupancy in Clinton
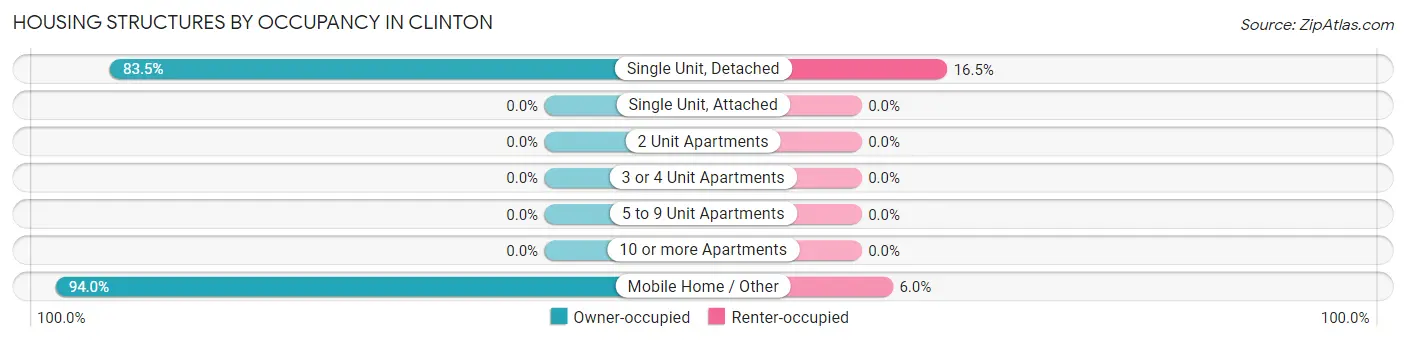
| Structure Type | Owner-occupied | Renter-occupied |
| Single Unit, Detached | 142 (83.5%) | 28 (16.5%) |
| Single Unit, Attached | 0 (0.0%) | 0 (0.0%) |
| 2 Unit Apartments | 0 (0.0%) | 0 (0.0%) |
| 3 or 4 Unit Apartments | 0 (0.0%) | 0 (0.0%) |
| 5 to 9 Unit Apartments | 0 (0.0%) | 0 (0.0%) |
| 10 or more Apartments | 0 (0.0%) | 0 (0.0%) |
| Mobile Home / Other | 78 (94.0%) | 5 (6.0%) |
| Total | 220 (87.0%) | 33 (13.0%) |
Housing Structures by Number of Rooms in Clinton
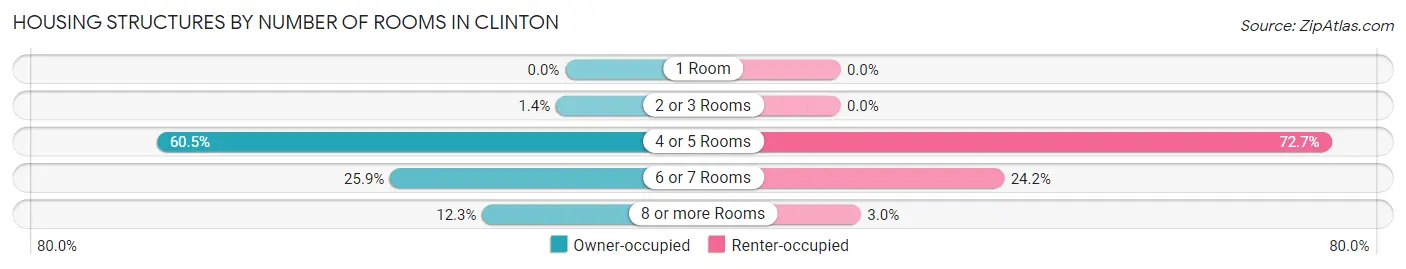
| Number of Rooms | Owner-occupied | Renter-occupied |
| 1 Room | 0 (0.0%) | 0 (0.0%) |
| 2 or 3 Rooms | 3 (1.4%) | 0 (0.0%) |
| 4 or 5 Rooms | 133 (60.5%) | 24 (72.7%) |
| 6 or 7 Rooms | 57 (25.9%) | 8 (24.2%) |
| 8 or more Rooms | 27 (12.3%) | 1 (3.0%) |
| Total | 220 (100.0%) | 33 (100.0%) |
Housing Structure by Heating Type in Clinton
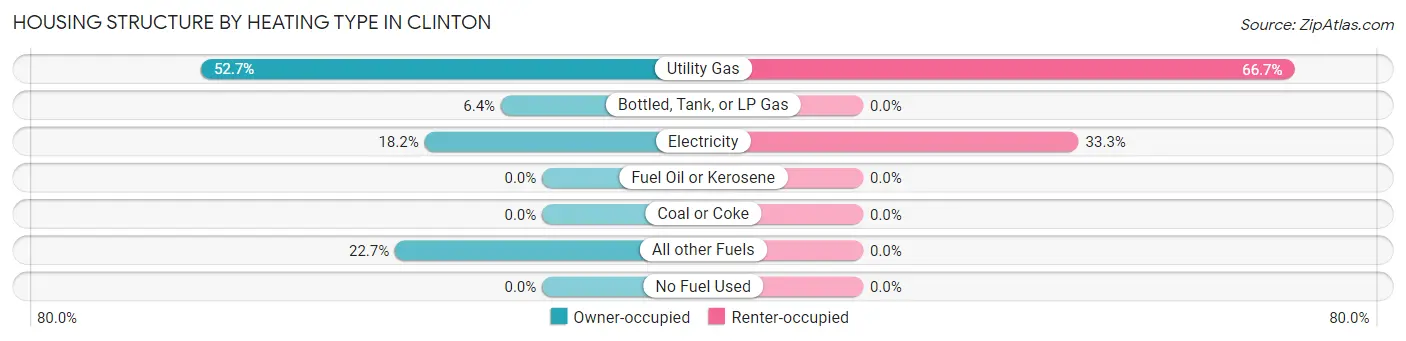
| Heating Type | Owner-occupied | Renter-occupied |
| Utility Gas | 116 (52.7%) | 22 (66.7%) |
| Bottled, Tank, or LP Gas | 14 (6.4%) | 0 (0.0%) |
| Electricity | 40 (18.2%) | 11 (33.3%) |
| Fuel Oil or Kerosene | 0 (0.0%) | 0 (0.0%) |
| Coal or Coke | 0 (0.0%) | 0 (0.0%) |
| All other Fuels | 50 (22.7%) | 0 (0.0%) |
| No Fuel Used | 0 (0.0%) | 0 (0.0%) |
| Total | 220 (100.0%) | 33 (100.0%) |
Household Vehicle Usage in Clinton
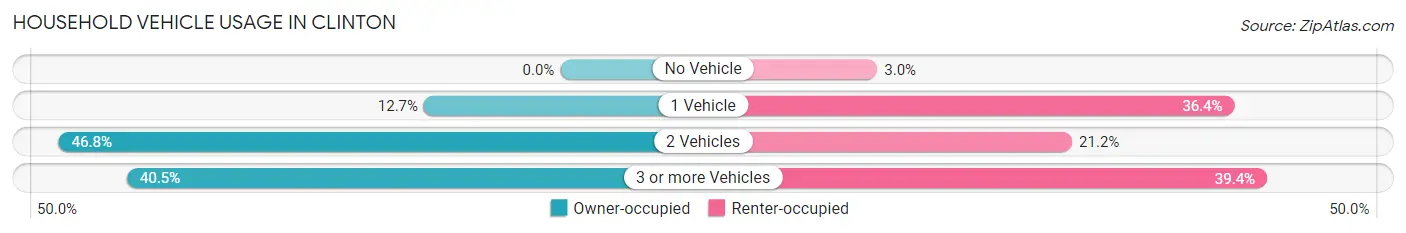
| Vehicles per Household | Owner-occupied | Renter-occupied |
| No Vehicle | 0 (0.0%) | 1 (3.0%) |
| 1 Vehicle | 28 (12.7%) | 12 (36.4%) |
| 2 Vehicles | 103 (46.8%) | 7 (21.2%) |
| 3 or more Vehicles | 89 (40.5%) | 13 (39.4%) |
| Total | 220 (100.0%) | 33 (100.0%) |
Real Estate & Mortgages in Clinton
Real Estate and Mortgage Overview in Clinton
| Characteristic | Without Mortgage | With Mortgage |
| Housing Units | 94 | 126 |
| Median Property Value | $200,000 | $313,300 |
| Median Household Income | $107,206 | $2 |
| Monthly Housing Costs | $411 | $0 |
| Real Estate Taxes | $1,823 | $0 |
Property Value by Mortgage Status in Clinton
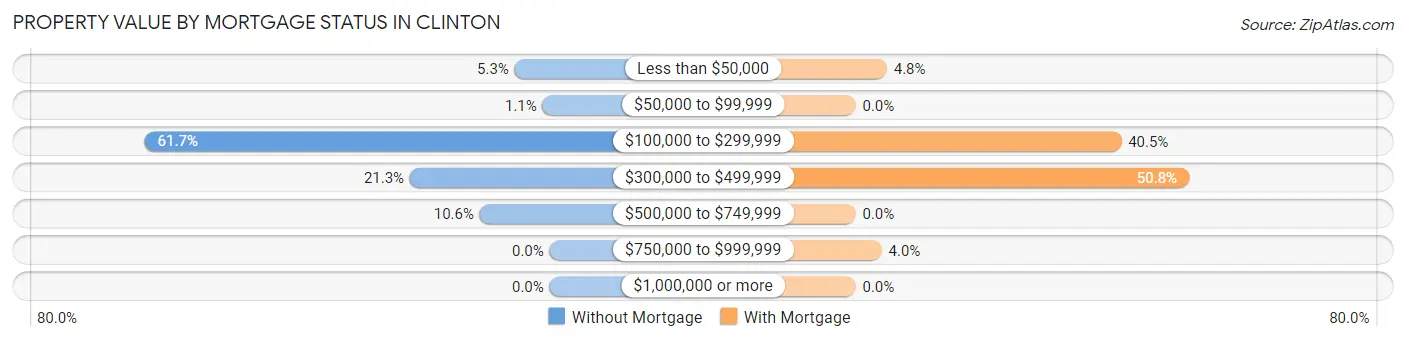
| Property Value | Without Mortgage | With Mortgage |
| Less than $50,000 | 5 (5.3%) | 6 (4.8%) |
| $50,000 to $99,999 | 1 (1.1%) | 0 (0.0%) |
| $100,000 to $299,999 | 58 (61.7%) | 51 (40.5%) |
| $300,000 to $499,999 | 20 (21.3%) | 64 (50.8%) |
| $500,000 to $749,999 | 10 (10.6%) | 0 (0.0%) |
| $750,000 to $999,999 | 0 (0.0%) | 5 (4.0%) |
| $1,000,000 or more | 0 (0.0%) | 0 (0.0%) |
| Total | 94 (100.0%) | 126 (100.0%) |
Household Income by Mortgage Status in Clinton
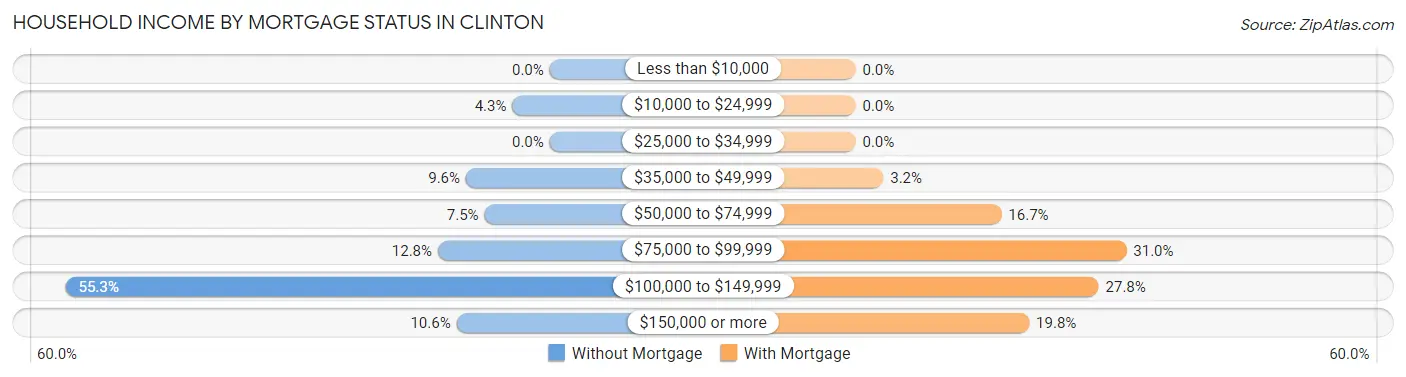
| Household Income | Without Mortgage | With Mortgage |
| Less than $10,000 | 0 (0.0%) | 0 (0.0%) |
| $10,000 to $24,999 | 4 (4.3%) | 0 (0.0%) |
| $25,000 to $34,999 | 0 (0.0%) | 0 (0.0%) |
| $35,000 to $49,999 | 9 (9.6%) | 4 (3.2%) |
| $50,000 to $74,999 | 7 (7.4%) | 21 (16.7%) |
| $75,000 to $99,999 | 12 (12.8%) | 39 (30.9%) |
| $100,000 to $149,999 | 52 (55.3%) | 35 (27.8%) |
| $150,000 or more | 10 (10.6%) | 25 (19.8%) |
| Total | 94 (100.0%) | 126 (100.0%) |
Property Value to Household Income Ratio in Clinton
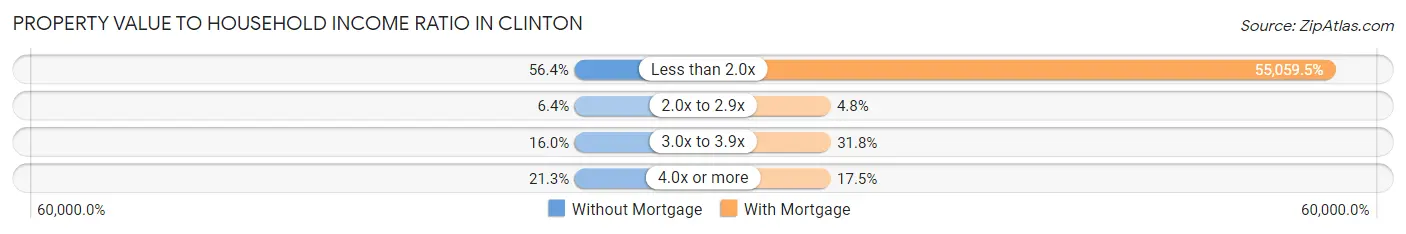
| Value-to-Income Ratio | Without Mortgage | With Mortgage |
| Less than 2.0x | 53 (56.4%) | 69,375 (55,059.5%) |
| 2.0x to 2.9x | 6 (6.4%) | 6 (4.8%) |
| 3.0x to 3.9x | 15 (16.0%) | 40 (31.8%) |
| 4.0x or more | 20 (21.3%) | 22 (17.5%) |
| Total | 94 (100.0%) | 126 (100.0%) |
Real Estate Taxes by Mortgage Status in Clinton
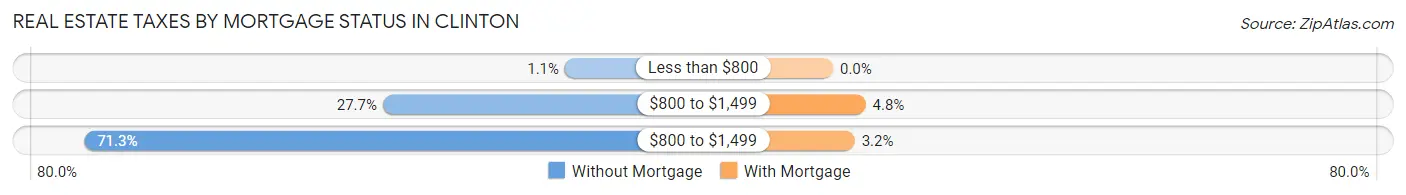
| Property Taxes | Without Mortgage | With Mortgage |
| Less than $800 | 1 (1.1%) | 0 (0.0%) |
| $800 to $1,499 | 26 (27.7%) | 6 (4.8%) |
| $800 to $1,499 | 67 (71.3%) | 4 (3.2%) |
| Total | 94 (100.0%) | 126 (100.0%) |
Health & Disability in Clinton
Health Insurance Coverage by Age in Clinton
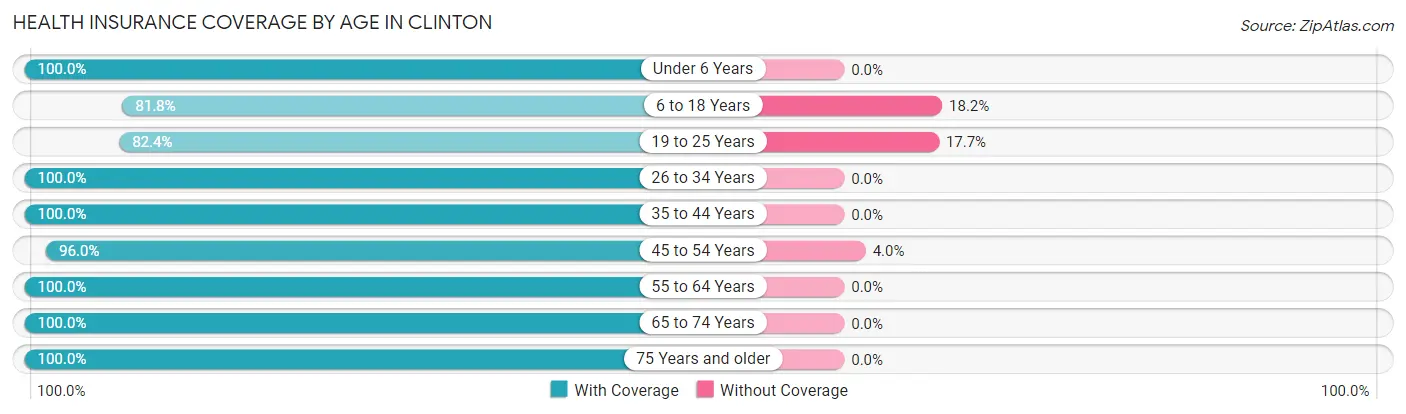
| Age Bracket | With Coverage | Without Coverage |
| Under 6 Years | 50 (100.0%) | 0 (0.0%) |
| 6 to 18 Years | 130 (81.8%) | 29 (18.2%) |
| 19 to 25 Years | 28 (82.4%) | 6 (17.6%) |
| 26 to 34 Years | 84 (100.0%) | 0 (0.0%) |
| 35 to 44 Years | 156 (100.0%) | 0 (0.0%) |
| 45 to 54 Years | 96 (96.0%) | 4 (4.0%) |
| 55 to 64 Years | 73 (100.0%) | 0 (0.0%) |
| 65 to 74 Years | 72 (100.0%) | 0 (0.0%) |
| 75 Years and older | 17 (100.0%) | 0 (0.0%) |
| Total | 706 (94.8%) | 39 (5.2%) |
Health Insurance Coverage by Citizenship Status in Clinton
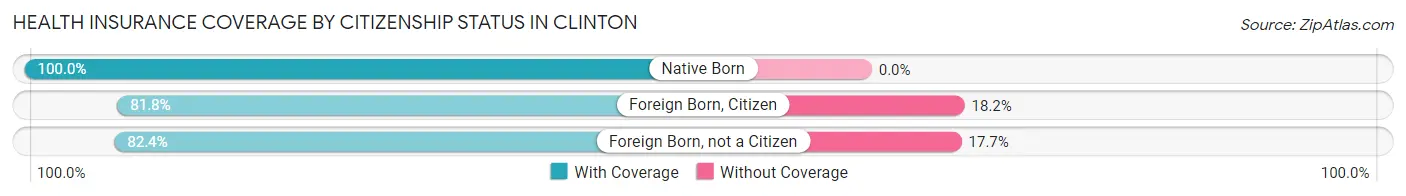
| Citizenship Status | With Coverage | Without Coverage |
| Native Born | 50 (100.0%) | 0 (0.0%) |
| Foreign Born, Citizen | 130 (81.8%) | 29 (18.2%) |
| Foreign Born, not a Citizen | 28 (82.4%) | 6 (17.6%) |
Health Insurance Coverage by Household Income in Clinton
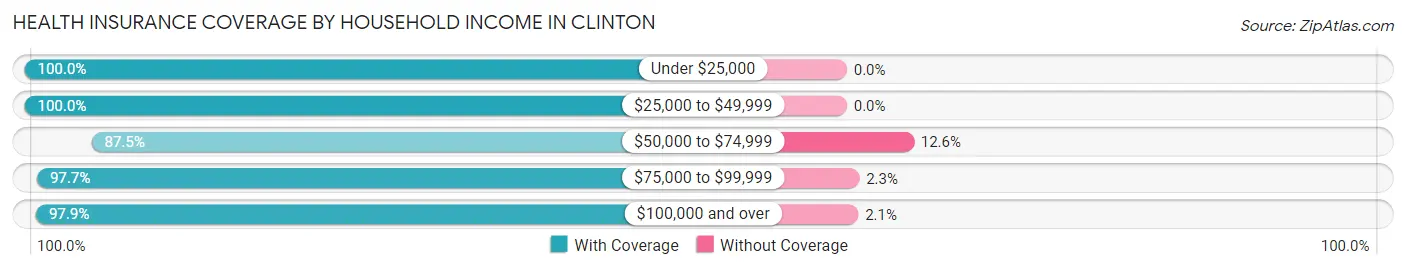
| Household Income | With Coverage | Without Coverage |
| Under $25,000 | 4 (100.0%) | 0 (0.0%) |
| $25,000 to $49,999 | 58 (100.0%) | 0 (0.0%) |
| $50,000 to $74,999 | 202 (87.5%) | 29 (12.6%) |
| $75,000 to $99,999 | 168 (97.7%) | 4 (2.3%) |
| $100,000 and over | 274 (97.9%) | 6 (2.1%) |
Public vs Private Health Insurance Coverage by Age in Clinton
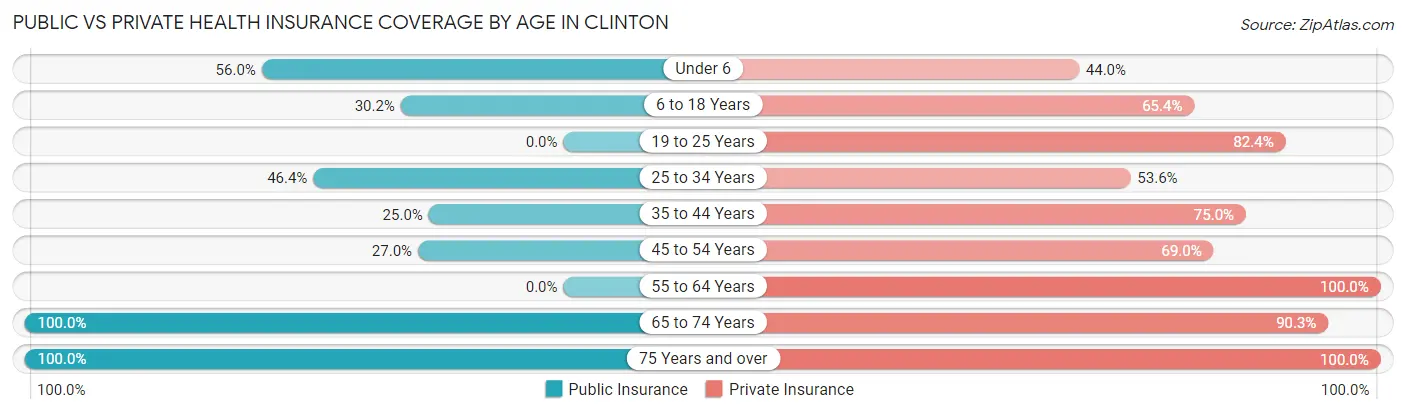
| Age Bracket | Public Insurance | Private Insurance |
| Under 6 | 28 (56.0%) | 22 (44.0%) |
| 6 to 18 Years | 48 (30.2%) | 104 (65.4%) |
| 19 to 25 Years | 0 (0.0%) | 28 (82.4%) |
| 25 to 34 Years | 39 (46.4%) | 45 (53.6%) |
| 35 to 44 Years | 39 (25.0%) | 117 (75.0%) |
| 45 to 54 Years | 27 (27.0%) | 69 (69.0%) |
| 55 to 64 Years | 0 (0.0%) | 73 (100.0%) |
| 65 to 74 Years | 72 (100.0%) | 65 (90.3%) |
| 75 Years and over | 17 (100.0%) | 17 (100.0%) |
| Total | 270 (36.2%) | 540 (72.5%) |
Disability Status by Sex by Age in Clinton
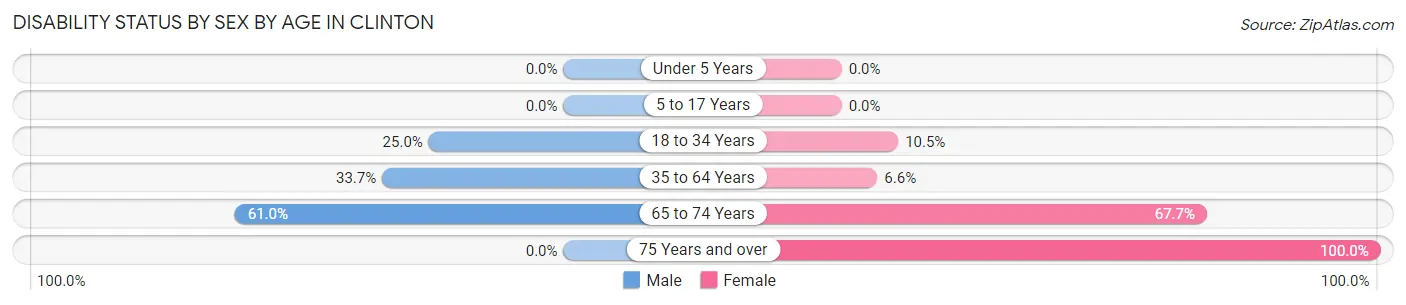
| Age Bracket | Male | Female |
| Under 5 Years | 0 (0.0%) | 0 (0.0%) |
| 5 to 17 Years | 0 (0.0%) | 0 (0.0%) |
| 18 to 34 Years | 8 (25.0%) | 9 (10.5%) |
| 35 to 64 Years | 70 (33.7%) | 8 (6.6%) |
| 65 to 74 Years | 25 (61.0%) | 21 (67.7%) |
| 75 Years and over | 0 (0.0%) | 10 (100.0%) |
Disability Class by Sex by Age in Clinton
Disability Class: Hearing Difficulty
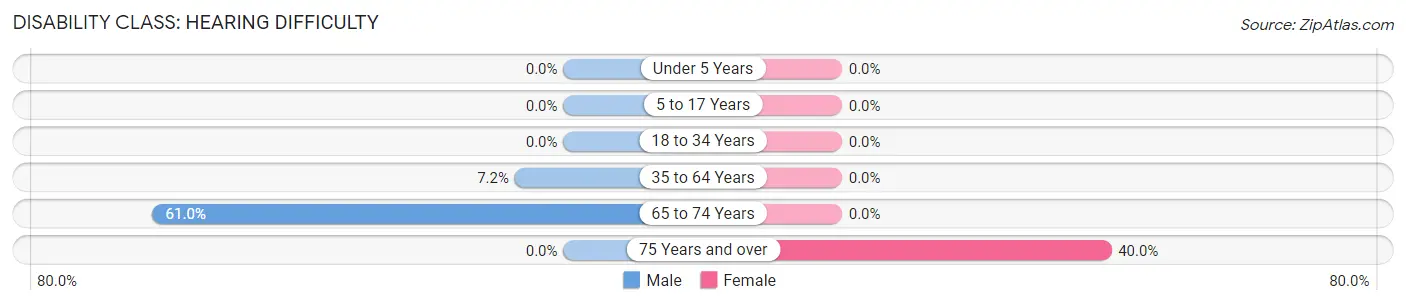
| Age Bracket | Male | Female |
| Under 5 Years | 0 (0.0%) | 0 (0.0%) |
| 5 to 17 Years | 0 (0.0%) | 0 (0.0%) |
| 18 to 34 Years | 0 (0.0%) | 0 (0.0%) |
| 35 to 64 Years | 15 (7.2%) | 0 (0.0%) |
| 65 to 74 Years | 25 (61.0%) | 0 (0.0%) |
| 75 Years and over | 0 (0.0%) | 4 (40.0%) |
Disability Class: Vision Difficulty
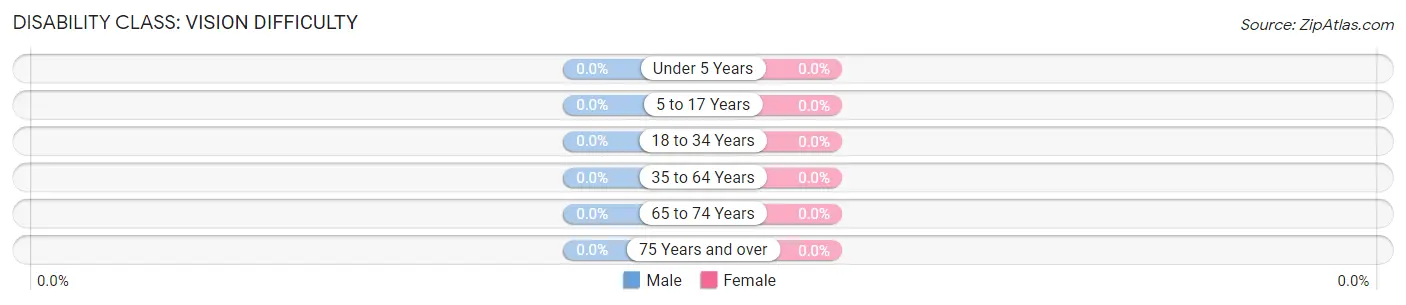
| Age Bracket | Male | Female |
| Under 5 Years | 0 (0.0%) | 0 (0.0%) |
| 5 to 17 Years | 0 (0.0%) | 0 (0.0%) |
| 18 to 34 Years | 0 (0.0%) | 0 (0.0%) |
| 35 to 64 Years | 0 (0.0%) | 0 (0.0%) |
| 65 to 74 Years | 0 (0.0%) | 0 (0.0%) |
| 75 Years and over | 0 (0.0%) | 0 (0.0%) |
Disability Class: Cognitive Difficulty
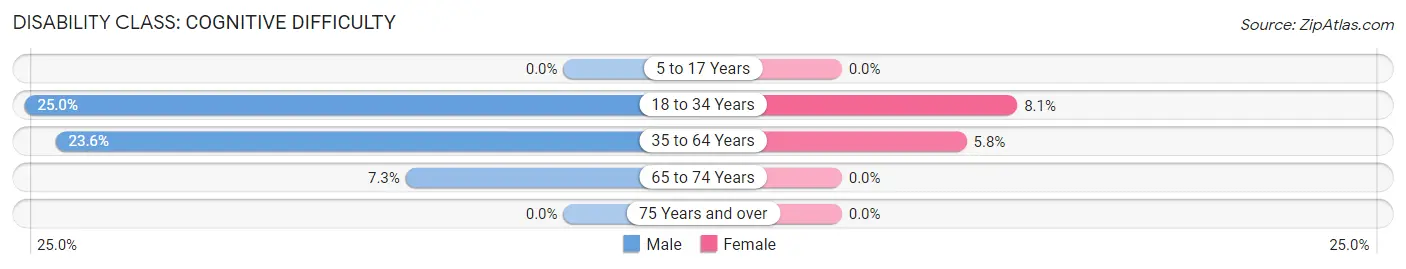
| Age Bracket | Male | Female |
| 5 to 17 Years | 0 (0.0%) | 0 (0.0%) |
| 18 to 34 Years | 8 (25.0%) | 7 (8.1%) |
| 35 to 64 Years | 49 (23.6%) | 7 (5.8%) |
| 65 to 74 Years | 3 (7.3%) | 0 (0.0%) |
| 75 Years and over | 0 (0.0%) | 0 (0.0%) |
Disability Class: Ambulatory Difficulty
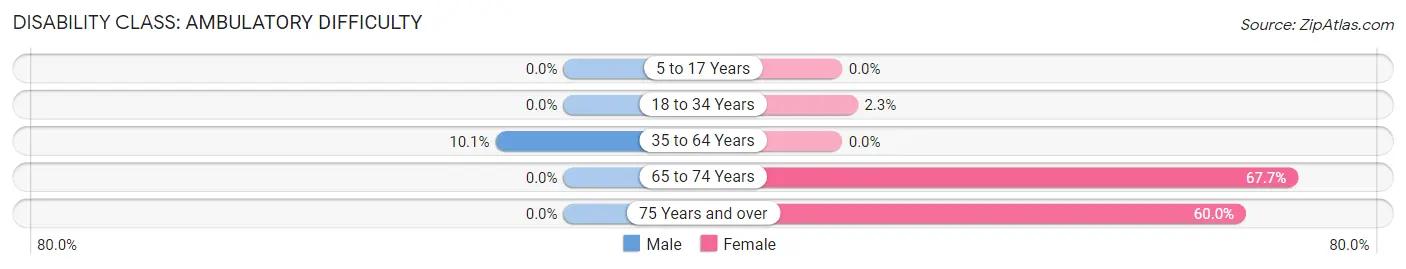
| Age Bracket | Male | Female |
| 5 to 17 Years | 0 (0.0%) | 0 (0.0%) |
| 18 to 34 Years | 0 (0.0%) | 2 (2.3%) |
| 35 to 64 Years | 21 (10.1%) | 0 (0.0%) |
| 65 to 74 Years | 0 (0.0%) | 21 (67.7%) |
| 75 Years and over | 0 (0.0%) | 6 (60.0%) |
Disability Class: Self-Care Difficulty
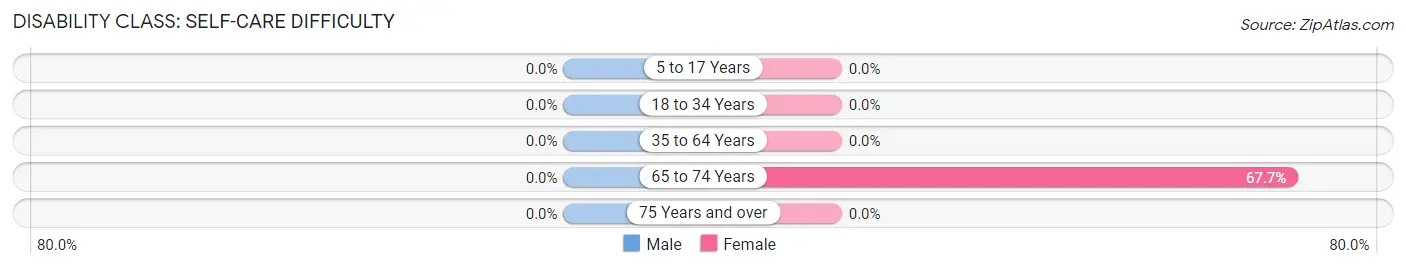
| Age Bracket | Male | Female |
| 5 to 17 Years | 0 (0.0%) | 0 (0.0%) |
| 18 to 34 Years | 0 (0.0%) | 0 (0.0%) |
| 35 to 64 Years | 0 (0.0%) | 0 (0.0%) |
| 65 to 74 Years | 0 (0.0%) | 21 (67.7%) |
| 75 Years and over | 0 (0.0%) | 0 (0.0%) |
Technology Access in Clinton
Computing Device Access in Clinton
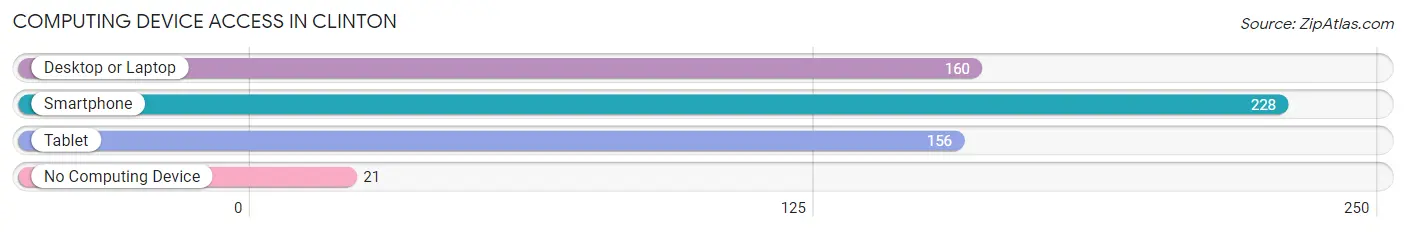
| Device Type | # Households | % Households |
| Desktop or Laptop | 160 | 63.2% |
| Smartphone | 228 | 90.1% |
| Tablet | 156 | 61.7% |
| No Computing Device | 21 | 8.3% |
| Total | 253 | 100.0% |
Internet Access in Clinton
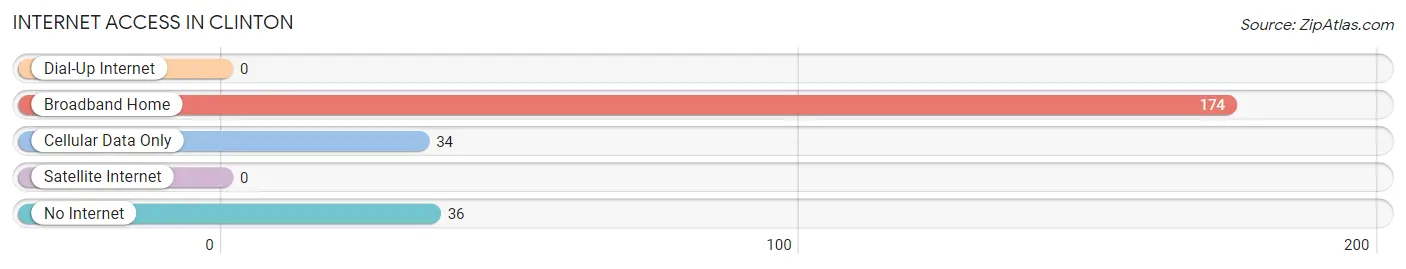
| Internet Type | # Households | % Households |
| Dial-Up Internet | 0 | 0.0% |
| Broadband Home | 174 | 68.8% |
| Cellular Data Only | 34 | 13.4% |
| Satellite Internet | 0 | 0.0% |
| No Internet | 36 | 14.2% |
| Total | 253 | 100.0% |
Clinton Summary
Clinton, Montana is a small town located in the western part of the state, approximately 20 miles south of Missoula. It is situated in the Bitterroot Valley, which is part of the larger Rocky Mountain region. The town is surrounded by mountains and is home to a population of just over 1,000 people.
History
The area that is now Clinton was first settled in the late 1800s by homesteaders. The town was officially founded in 1891 and was named after the nearby Clinton Creek. The town was originally a farming and ranching community, but it soon became a popular stop for travelers on the Northern Pacific Railroad. In the early 1900s, the town was home to a number of businesses, including a hotel, a general store, a blacksmith shop, and a saloon.
In the 1920s, the town began to experience a decline in population as many of the homesteaders moved away. However, the town was revitalized in the 1940s when the nearby military base, Fort Missoula, was established. The base brought new jobs and economic opportunities to the area, and the population began to grow again.
Geography
Clinton is located in the western part of Montana, in the Bitterroot Valley. The town is situated at an elevation of 3,400 feet and is surrounded by mountains. The nearby Bitterroot Mountains are part of the larger Rocky Mountain range. The town is located approximately 20 miles south of Missoula and is accessible via Highway 93.
Economy
The economy of Clinton is largely based on agriculture and tourism. The town is home to a number of farms and ranches, which produce a variety of crops and livestock. The nearby military base, Fort Missoula, is also a major employer in the area. In addition, the town is a popular destination for tourists, who come to enjoy the nearby mountains and outdoor activities.
Demographics
As of the 2010 census, the population of Clinton was 1,072. The town is predominantly white, with a small Hispanic population. The median household income is $41,250, and the median home value is $179,000. The town has a low unemployment rate of 3.7%.
Conclusion
Clinton, Montana is a small town located in the western part of the state. It is situated in the Bitterroot Valley and is surrounded by mountains. The town has a population of just over 1,000 people and is largely supported by agriculture and tourism. The town is predominantly white, with a small Hispanic population, and has a median household income of $41,250. Clinton is a popular destination for tourists and is home to a number of businesses and the nearby military base, Fort Missoula.
Common Questions
What is Per Capita Income in Clinton?
Per Capita income in Clinton is $33,340.
What is the Median Family Income in Clinton?
Median Family Income in Clinton is $90,278.
What is the Median Household income in Clinton?
Median Household Income in Clinton is $84,792.
What is Inequality or Gini Index in Clinton?
Inequality or Gini Index in Clinton is 0.24.
What is the Total Population of Clinton?
Total Population of Clinton is 745.
What is the Total Male Population of Clinton?
Total Male Population of Clinton is 423.
What is the Total Female Population of Clinton?
Total Female Population of Clinton is 322.
What is the Ratio of Males per 100 Females in Clinton?
There are 131.37 Males per 100 Females in Clinton.
What is the Ratio of Females per 100 Males in Clinton?
There are 76.12 Females per 100 Males in Clinton.
What is the Median Population Age in Clinton?
Median Population Age in Clinton is 39.6 Years.
What is the Average Family Size in Clinton
Average Family Size in Clinton is 3.1 People.
What is the Average Household Size in Clinton
Average Household Size in Clinton is 2.9 People.
How Large is the Labor Force in Clinton?
There are 382 People in the Labor Forcein in Clinton.
What is the Percentage of People in the Labor Force in Clinton?
64.4% of People are in the Labor Force in Clinton.
What is the Unemployment Rate in Clinton?
Unemployment Rate in Clinton is 1.3%.