Savage, MT Map & Demographics
Savage Map
Savage Overview
$46,177
PER CAPITA INCOME
$105,096
AVG FAMILY INCOME
$78,750
AVG HOUSEHOLD INCOME
70.5%
WAGE / INCOME GAP [ % ]
29.5¢/ $1
WAGE / INCOME GAP [ $ ]
0.40
INEQUALITY / GINI INDEX
294
TOTAL POPULATION
121
MALE POPULATION
173
FEMALE POPULATION
69.94
MALES / 100 FEMALES
142.98
FEMALES / 100 MALES
31.1
MEDIAN AGE
2.2
AVG FAMILY SIZE
1.7
AVG HOUSEHOLD SIZE
206
LABOR FORCE [ PEOPLE ]
80.2%
PERCENT IN LABOR FORCE
4.4%
UNEMPLOYMENT RATE
Savage Zip Codes
Savage Area Codes
Income in Savage
Income Overview in Savage
Per Capita Income in Savage is $46,177, while median incomes of families and households are $105,096 and $78,750 respectively.
| Characteristic | Number | Measure |
| Per Capita Income | 294 | $46,177 |
| Median Family Income | 75 | $105,096 |
| Mean Family Income | 75 | $114,141 |
| Median Household Income | 170 | $78,750 |
| Mean Household Income | 170 | $78,184 |
| Income Deficit | 75 | $0 |
| Wage / Income Gap (%) | 294 | 70.50% |
| Wage / Income Gap ($) | 294 | 29.50¢ per $1 |
| Gini / Inequality Index | 294 | 0.40 |
Earnings by Sex in Savage
Average Earnings in Savage are $44,250, $73,523 for men and $21,688 for women, a difference of 70.5%.
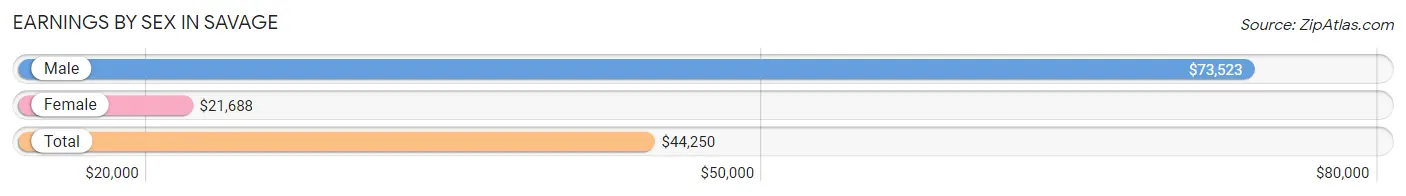
| Sex | Number | Average Earnings |
| Male | 101 (48.1%) | $73,523 |
| Female | 109 (51.9%) | $21,688 |
| Total | 210 (100.0%) | $44,250 |
Earnings by Sex by Income Bracket in Savage
The most common earnings brackets in Savage are $100,000+ for men (25 | 24.7%) and $20,000 to $22,499 for women (20 | 18.3%).
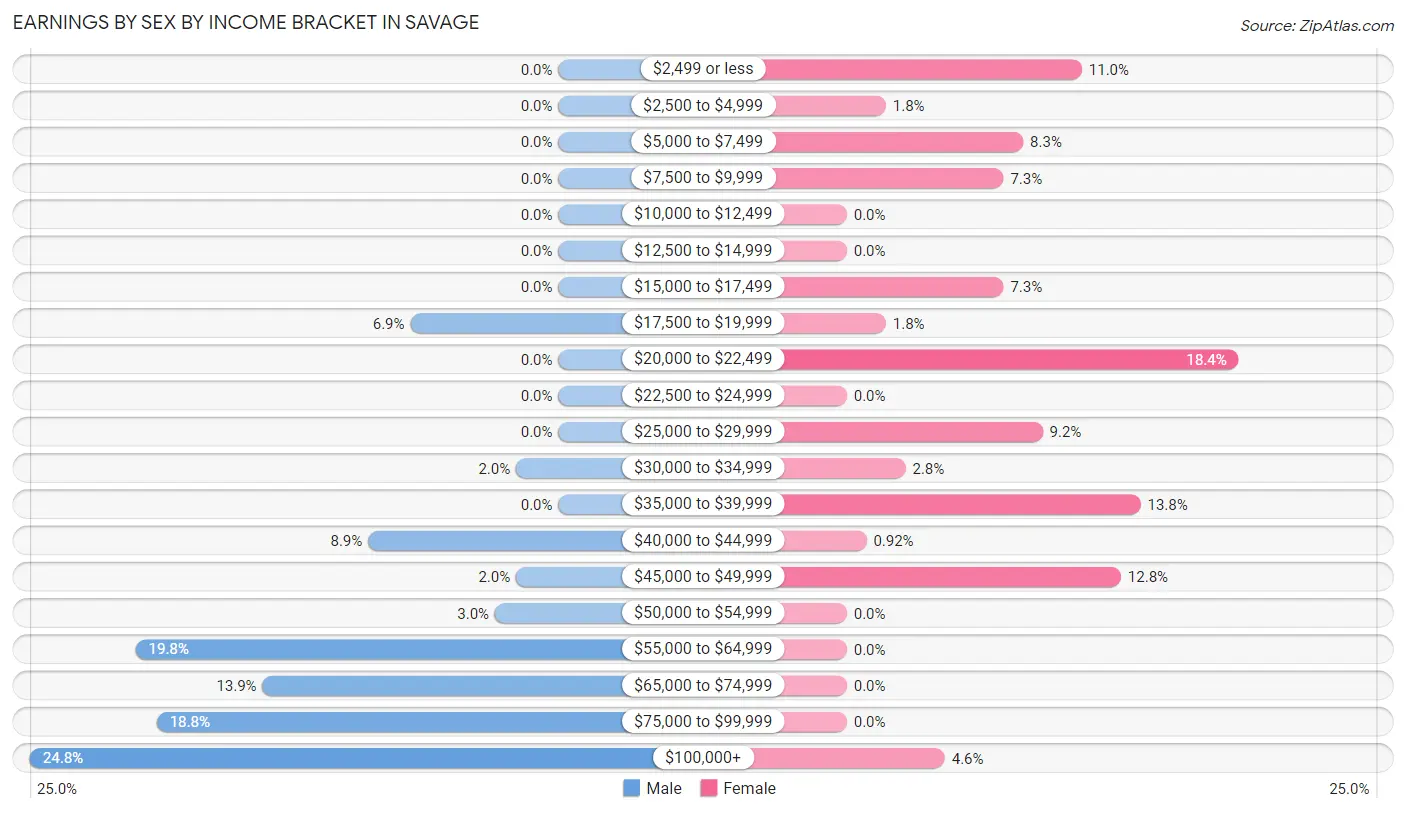
| Income | Male | Female |
| $2,499 or less | 0 (0.0%) | 12 (11.0%) |
| $2,500 to $4,999 | 0 (0.0%) | 2 (1.8%) |
| $5,000 to $7,499 | 0 (0.0%) | 9 (8.3%) |
| $7,500 to $9,999 | 0 (0.0%) | 8 (7.3%) |
| $10,000 to $12,499 | 0 (0.0%) | 0 (0.0%) |
| $12,500 to $14,999 | 0 (0.0%) | 0 (0.0%) |
| $15,000 to $17,499 | 0 (0.0%) | 8 (7.3%) |
| $17,500 to $19,999 | 7 (6.9%) | 2 (1.8%) |
| $20,000 to $22,499 | 0 (0.0%) | 20 (18.3%) |
| $22,500 to $24,999 | 0 (0.0%) | 0 (0.0%) |
| $25,000 to $29,999 | 0 (0.0%) | 10 (9.2%) |
| $30,000 to $34,999 | 2 (2.0%) | 3 (2.8%) |
| $35,000 to $39,999 | 0 (0.0%) | 15 (13.8%) |
| $40,000 to $44,999 | 9 (8.9%) | 1 (0.9%) |
| $45,000 to $49,999 | 2 (2.0%) | 14 (12.8%) |
| $50,000 to $54,999 | 3 (3.0%) | 0 (0.0%) |
| $55,000 to $64,999 | 20 (19.8%) | 0 (0.0%) |
| $65,000 to $74,999 | 14 (13.9%) | 0 (0.0%) |
| $75,000 to $99,999 | 19 (18.8%) | 0 (0.0%) |
| $100,000+ | 25 (24.7%) | 5 (4.6%) |
| Total | 101 (100.0%) | 109 (100.0%) |
Earnings by Sex by Educational Attainment in Savage
Average earnings in Savage are $74,091 for men and $32,917 for women, a difference of 55.6%. Men with an educational attainment of college or associate's degree enjoy the highest average annual earnings of $86,250, while those with high school diploma education earn the least with $81,058. Women with an educational attainment of college or associate's degree earn the most with the average annual earnings of $46,429, while those with high school diploma education have the smallest earnings of $2,499.
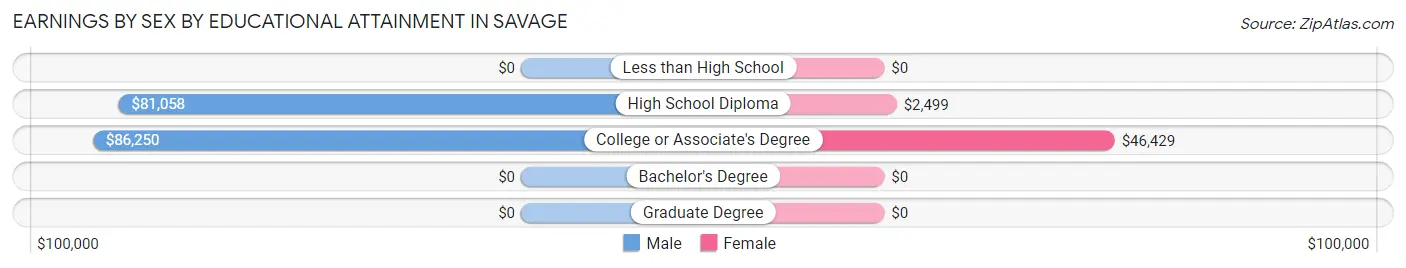
| Educational Attainment | Male Income | Female Income |
| Less than High School | - | - |
| High School Diploma | $81,058 | $2,499 |
| College or Associate's Degree | $86,250 | $46,429 |
| Bachelor's Degree | - | - |
| Graduate Degree | - | - |
| Total | $74,091 | $32,917 |
Family Income in Savage
Family Income Brackets in Savage
According to the Savage family income data, there are 28 families falling into the $75,000 to $99,999 income range, which is the most common income bracket and makes up 37.3% of all families.
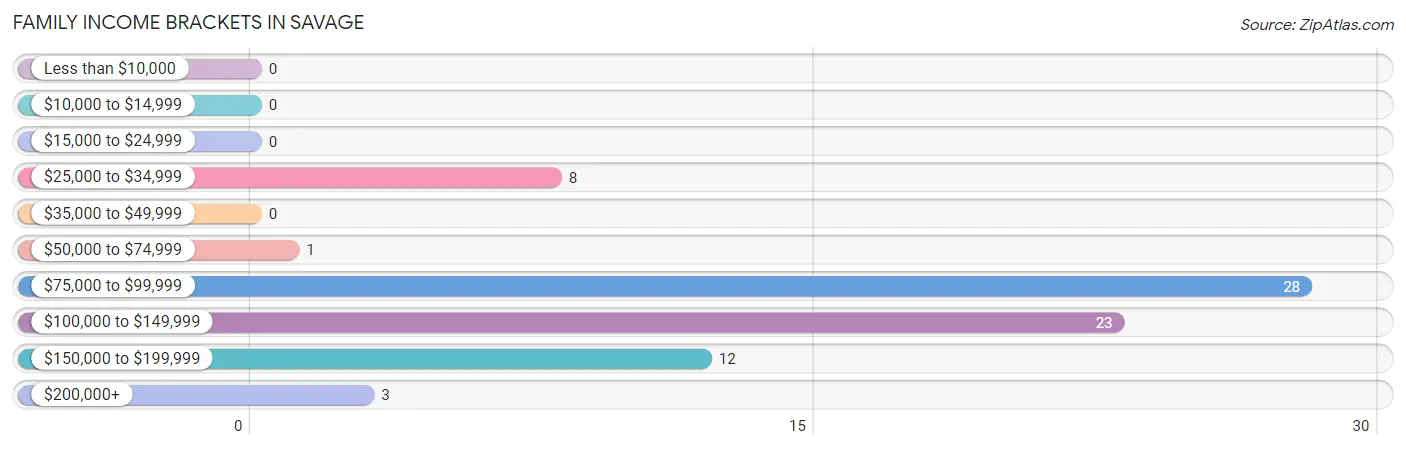
| Income Bracket | # Families | % Families |
| Less than $10,000 | 0 | 0.0% |
| $10,000 to $14,999 | 0 | 0.0% |
| $15,000 to $24,999 | 0 | 0.0% |
| $25,000 to $34,999 | 8 | 10.7% |
| $35,000 to $49,999 | 0 | 0.0% |
| $50,000 to $74,999 | 1 | 1.3% |
| $75,000 to $99,999 | 28 | 37.3% |
| $100,000 to $149,999 | 23 | 30.7% |
| $150,000 to $199,999 | 12 | 16.0% |
| $200,000+ | 3 | 4.0% |
Family Income by Famaliy Size in Savage
2-person families (61 | 81.3%) account for the highest median family income in Savage with $88,750 per family, while 2-person families (61 | 81.3%) have the highest median income of $44,375 per family member.
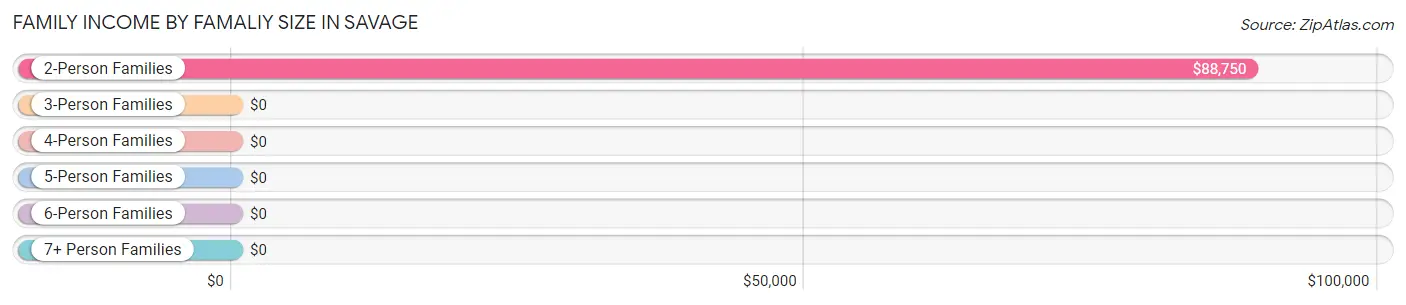
| Income Bracket | # Families | Median Income |
| 2-Person Families | 61 (81.3%) | $88,750 |
| 3-Person Families | 6 (8.0%) | $0 |
| 4-Person Families | 8 (10.7%) | $0 |
| 5-Person Families | 0 (0.0%) | $0 |
| 6-Person Families | 0 (0.0%) | $0 |
| 7+ Person Families | 0 (0.0%) | $0 |
| Total | 75 (100.0%) | $105,096 |
Family Income by Number of Earners in Savage
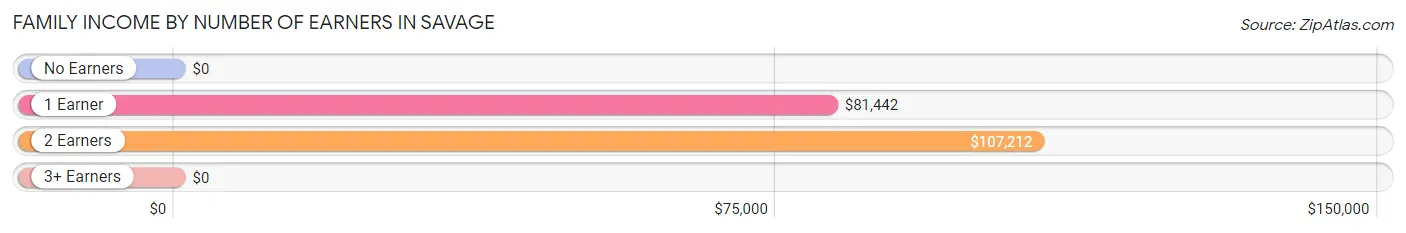
| Number of Earners | # Families | Median Income |
| No Earners | 0 (0.0%) | $0 |
| 1 Earner | 37 (49.3%) | $81,442 |
| 2 Earners | 35 (46.7%) | $107,212 |
| 3+ Earners | 3 (4.0%) | $0 |
| Total | 75 (100.0%) | $105,096 |
Household Income in Savage
Household Income Brackets in Savage
With 42 households falling in the category, the $100,000 to $149,999 income range is the most frequent in Savage, accounting for 24.7% of all households. In contrast, only 2 households (1.2%) fall into the $35,000 to $49,999 income bracket, making it the least populous group.
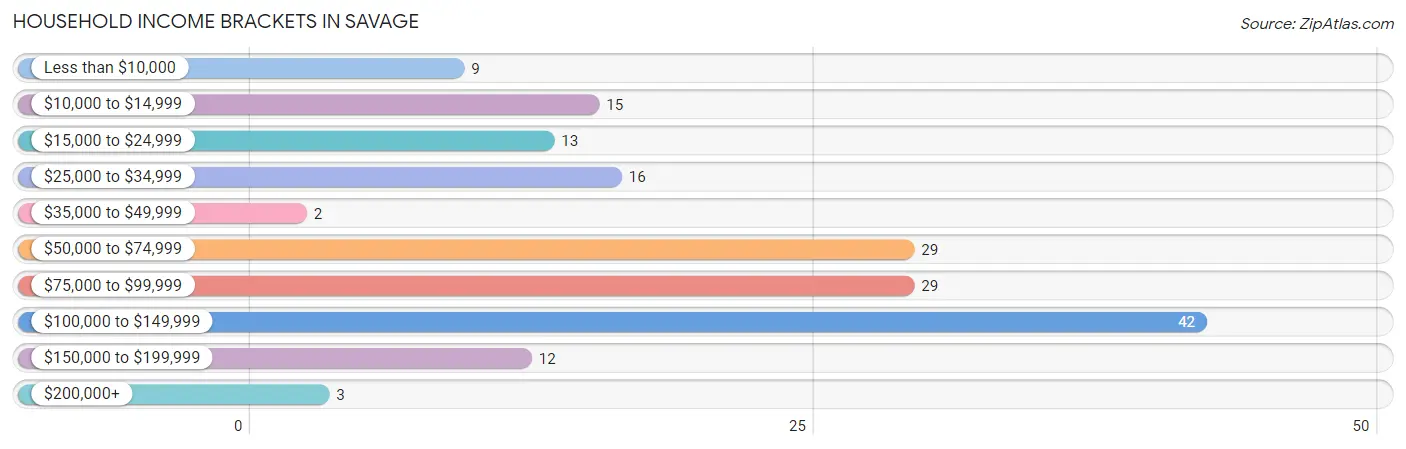
| Income Bracket | # Households | % Households |
| Less than $10,000 | 9 | 5.3% |
| $10,000 to $14,999 | 15 | 8.8% |
| $15,000 to $24,999 | 13 | 7.6% |
| $25,000 to $34,999 | 16 | 9.4% |
| $35,000 to $49,999 | 2 | 1.2% |
| $50,000 to $74,999 | 29 | 17.1% |
| $75,000 to $99,999 | 29 | 17.1% |
| $100,000 to $149,999 | 42 | 24.7% |
| $150,000 to $199,999 | 12 | 7.1% |
| $200,000+ | 3 | 1.8% |
Household Income by Householder Age in Savage
The median household income in Savage is $78,750, with the highest median household income of $136,250 found in the 45 to 64 years age bracket for the primary householder. A total of 32 households (18.8%) fall into this category. Meanwhile, the 15 to 24 years age bracket for the primary householder has the lowest median household income of $0, with 38 households (22.4%) in this group.
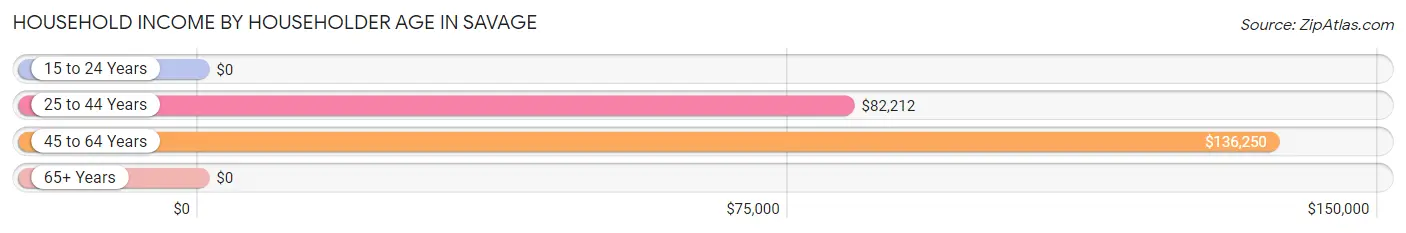
| Income Bracket | # Households | Median Income |
| 15 to 24 Years | 38 (22.4%) | $0 |
| 25 to 44 Years | 63 (37.1%) | $82,212 |
| 45 to 64 Years | 32 (18.8%) | $136,250 |
| 65+ Years | 37 (21.8%) | $0 |
| Total | 170 (100.0%) | $78,750 |
Poverty in Savage
Income Below Poverty by Sex and Age in Savage
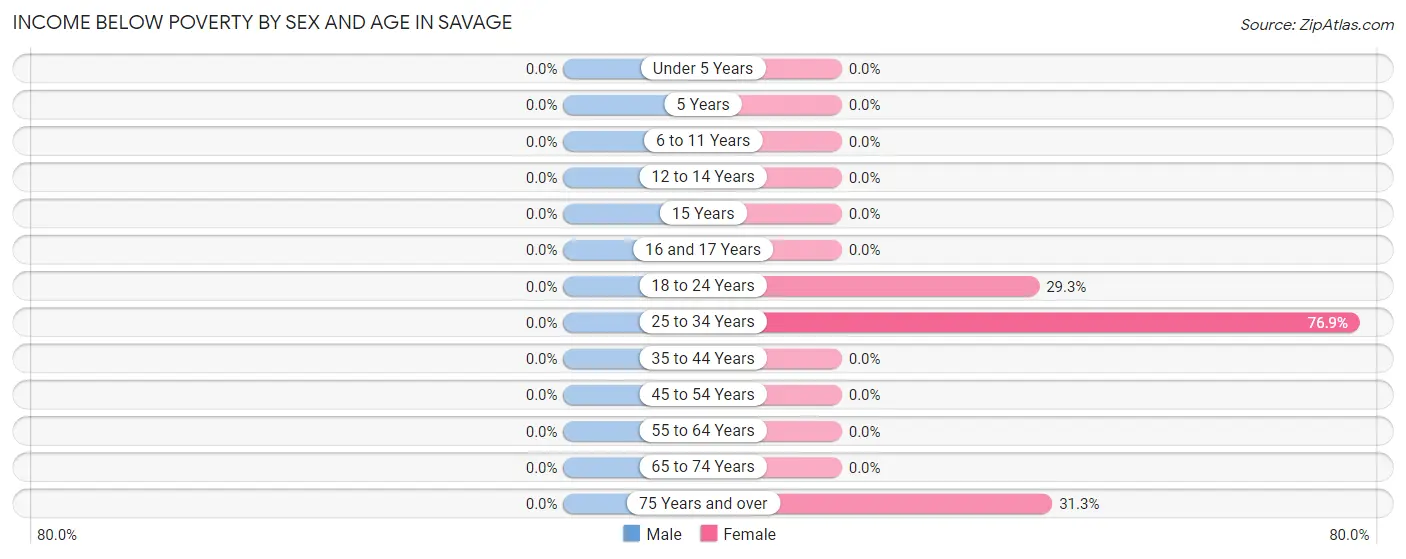
| Age Bracket | Male | Female |
| Under 5 Years | 0 (0.0%) | 0 (0.0%) |
| 5 Years | 0 (0.0%) | 0 (0.0%) |
| 6 to 11 Years | 0 (0.0%) | 0 (0.0%) |
| 12 to 14 Years | 0 (0.0%) | 0 (0.0%) |
| 15 Years | 0 (0.0%) | 0 (0.0%) |
| 16 and 17 Years | 0 (0.0%) | 0 (0.0%) |
| 18 to 24 Years | 0 (0.0%) | 17 (29.3%) |
| 25 to 34 Years | 0 (0.0%) | 10 (76.9%) |
| 35 to 44 Years | 0 (0.0%) | 0 (0.0%) |
| 45 to 54 Years | 0 (0.0%) | 0 (0.0%) |
| 55 to 64 Years | 0 (0.0%) | 0 (0.0%) |
| 65 to 74 Years | 0 (0.0%) | 0 (0.0%) |
| 75 Years and over | 0 (0.0%) | 5 (31.2%) |
| Total | 0 (0.0%) | 32 (18.5%) |
Income Above Poverty by Sex and Age in Savage
According to the poverty statistics in Savage, males aged 6 to 11 years and females aged under 5 years are the age groups that are most secure financially, with 100.0% of males and 100.0% of females in these age groups living above the poverty line.
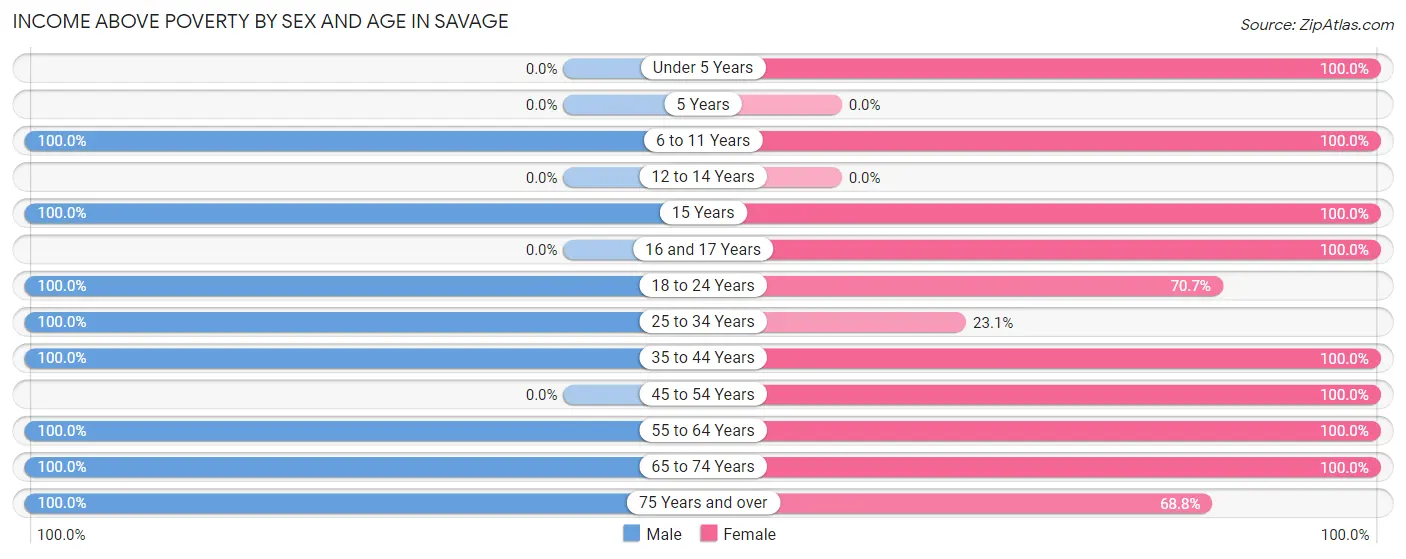
| Age Bracket | Male | Female |
| Under 5 Years | 0 (0.0%) | 12 (100.0%) |
| 5 Years | 0 (0.0%) | 0 (0.0%) |
| 6 to 11 Years | 7 (100.0%) | 10 (100.0%) |
| 12 to 14 Years | 0 (0.0%) | 0 (0.0%) |
| 15 Years | 5 (100.0%) | 3 (100.0%) |
| 16 and 17 Years | 0 (0.0%) | 2 (100.0%) |
| 18 to 24 Years | 5 (100.0%) | 41 (70.7%) |
| 25 to 34 Years | 50 (100.0%) | 3 (23.1%) |
| 35 to 44 Years | 13 (100.0%) | 12 (100.0%) |
| 45 to 54 Years | 0 (0.0%) | 4 (100.0%) |
| 55 to 64 Years | 31 (100.0%) | 20 (100.0%) |
| 65 to 74 Years | 8 (100.0%) | 23 (100.0%) |
| 75 Years and over | 2 (100.0%) | 11 (68.8%) |
| Total | 121 (100.0%) | 141 (81.5%) |
Income Below Poverty Among Married-Couple Families in Savage
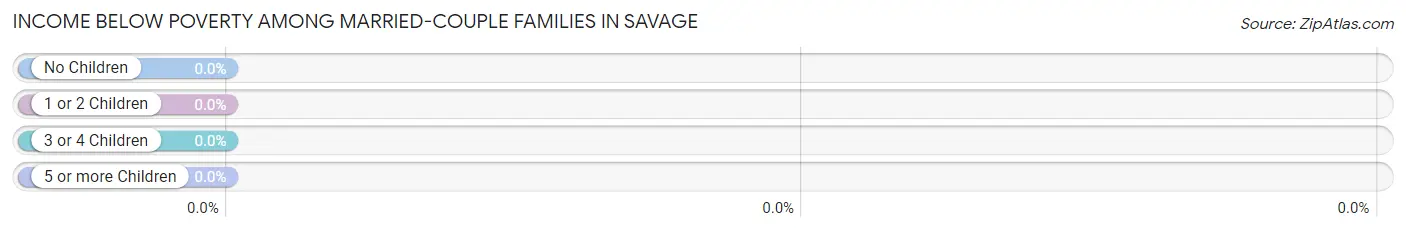
| Children | Above Poverty | Below Poverty |
| No Children | 39 (100.0%) | 0 (0.0%) |
| 1 or 2 Children | 13 (100.0%) | 0 (0.0%) |
| 3 or 4 Children | 0 (0.0%) | 0 (0.0%) |
| 5 or more Children | 0 (0.0%) | 0 (0.0%) |
| Total | 52 (100.0%) | 0 (0.0%) |
Income Below Poverty Among Single-Parent Households in Savage
| Children | Single Father | Single Mother |
| No Children | 0 (0.0%) | 0 (0.0%) |
| 1 or 2 Children | 0 (0.0%) | 0 (0.0%) |
| 3 or 4 Children | 0 (0.0%) | 0 (0.0%) |
| 5 or more Children | 0 (0.0%) | 0 (0.0%) |
| Total | 0 (0.0%) | 0 (0.0%) |
Income Below Poverty Among Married-Couple vs Single-Parent Households in Savage
| Children | Married-Couple Families | Single-Parent Households |
| No Children | 0 (0.0%) | 0 (0.0%) |
| 1 or 2 Children | 0 (0.0%) | 0 (0.0%) |
| 3 or 4 Children | 0 (0.0%) | 0 (0.0%) |
| 5 or more Children | 0 (0.0%) | 0 (0.0%) |
| Total | 0 (0.0%) | 0 (0.0%) |
Race in Savage
The most populous races in Savage are White / Caucasian (292 | 99.3%), Hispanic or Latino (4 | 1.4%), and Asian (2 | 0.7%).
| Race | # Population | % Population |
| Asian | 2 | 0.7% |
| Black / African American | 0 | 0.0% |
| Hawaiian / Pacific | 0 | 0.0% |
| Hispanic or Latino | 4 | 1.4% |
| Native / Alaskan | 0 | 0.0% |
| White / Caucasian | 292 | 99.3% |
| Two or more Races | 0 | 0.0% |
| Some other Race | 0 | 0.0% |
| Total | 294 | 100.0% |
Ancestry in Savage
The most populous ancestries reported in Savage are German (88 | 29.9%), Norwegian (49 | 16.7%), Irish (39 | 13.3%), English (22 | 7.5%), and American (20 | 6.8%), together accounting for 74.2% of all Savage residents.
| Ancestry | # Population | % Population |
| American | 20 | 6.8% |
| Canadian | 1 | 0.3% |
| Czechoslovakian | 9 | 3.1% |
| Danish | 7 | 2.4% |
| English | 22 | 7.5% |
| European | 18 | 6.1% |
| French | 9 | 3.1% |
| French Canadian | 2 | 0.7% |
| German | 88 | 29.9% |
| Irish | 39 | 13.3% |
| Italian | 1 | 0.3% |
| Korean | 2 | 0.7% |
| Mexican | 4 | 1.4% |
| Norwegian | 49 | 16.7% |
| Pennsylvania German | 2 | 0.7% |
| Polish | 8 | 2.7% |
| Russian | 7 | 2.4% |
| Scandinavian | 1 | 0.3% |
| Swedish | 6 | 2.0% | View All 19 Rows |
Immigrants in Savage
The most numerous immigrant groups reported in Savage came from Latin America (4 | 1.4%), South America (4 | 1.4%), Venezuela (4 | 1.4%), Asia (2 | 0.7%), and Philippines (2 | 0.7%), together accounting for 5.4% of all Savage residents.
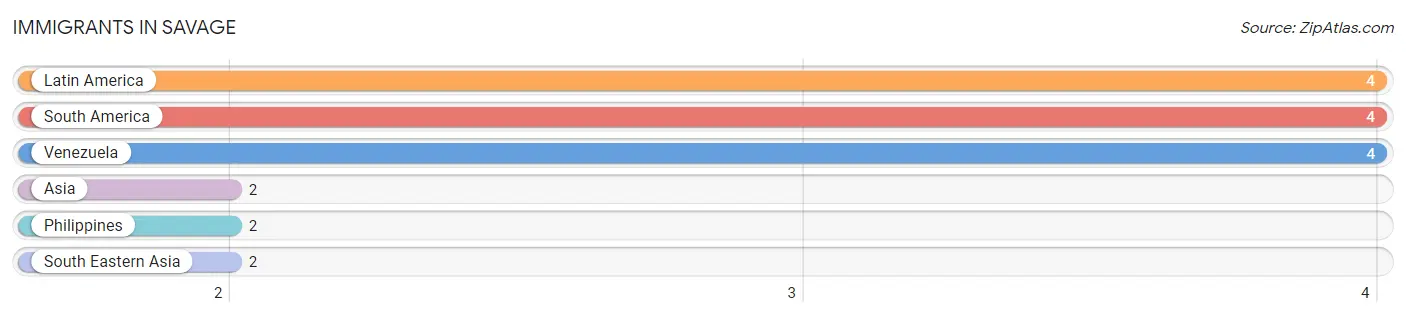
| Immigration Origin | # Population | % Population |
| Asia | 2 | 0.7% |
| Latin America | 4 | 1.4% |
| Philippines | 2 | 0.7% |
| South America | 4 | 1.4% |
| South Eastern Asia | 2 | 0.7% |
| Venezuela | 4 | 1.4% | View All 6 Rows |
Sex and Age in Savage
Sex and Age in Savage
The most populous age groups in Savage are 25 to 29 Years (33 | 27.3%) for men and 20 to 24 Years (58 | 33.5%) for women.
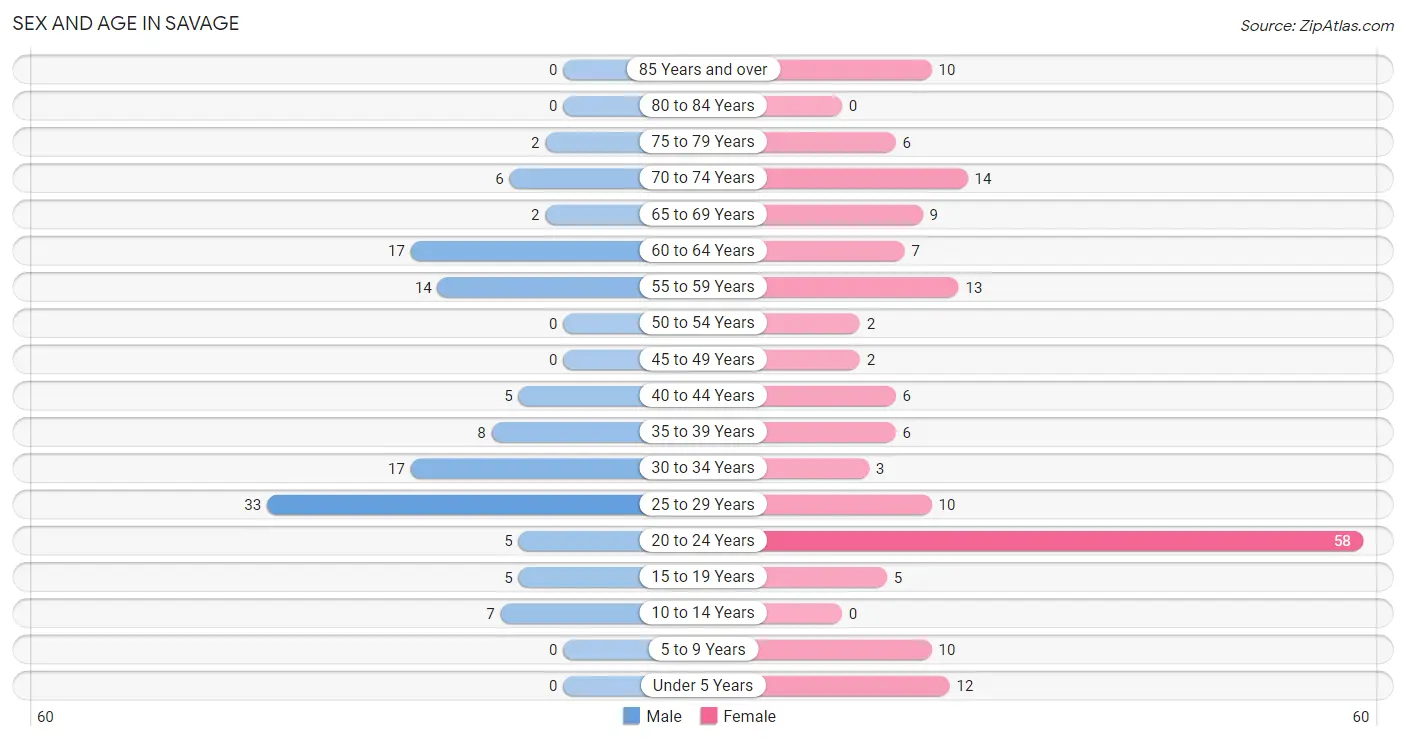
| Age Bracket | Male | Female |
| Under 5 Years | 0 (0.0%) | 12 (6.9%) |
| 5 to 9 Years | 0 (0.0%) | 10 (5.8%) |
| 10 to 14 Years | 7 (5.8%) | 0 (0.0%) |
| 15 to 19 Years | 5 (4.1%) | 5 (2.9%) |
| 20 to 24 Years | 5 (4.1%) | 58 (33.5%) |
| 25 to 29 Years | 33 (27.3%) | 10 (5.8%) |
| 30 to 34 Years | 17 (14.1%) | 3 (1.7%) |
| 35 to 39 Years | 8 (6.6%) | 6 (3.5%) |
| 40 to 44 Years | 5 (4.1%) | 6 (3.5%) |
| 45 to 49 Years | 0 (0.0%) | 2 (1.2%) |
| 50 to 54 Years | 0 (0.0%) | 2 (1.2%) |
| 55 to 59 Years | 14 (11.6%) | 13 (7.5%) |
| 60 to 64 Years | 17 (14.1%) | 7 (4.1%) |
| 65 to 69 Years | 2 (1.7%) | 9 (5.2%) |
| 70 to 74 Years | 6 (5.0%) | 14 (8.1%) |
| 75 to 79 Years | 2 (1.7%) | 6 (3.5%) |
| 80 to 84 Years | 0 (0.0%) | 0 (0.0%) |
| 85 Years and over | 0 (0.0%) | 10 (5.8%) |
| Total | 121 (100.0%) | 173 (100.0%) |
Families and Households in Savage
Median Family Size in Savage
The median family size in Savage is 2.25 persons per family, with married-couple families (52 | 69.3%) accounting for the largest median family size of 2.46 persons per family. On the other hand, single male/father families (13 | 17.3%) represent the smallest median family size with 1.77 persons per family.
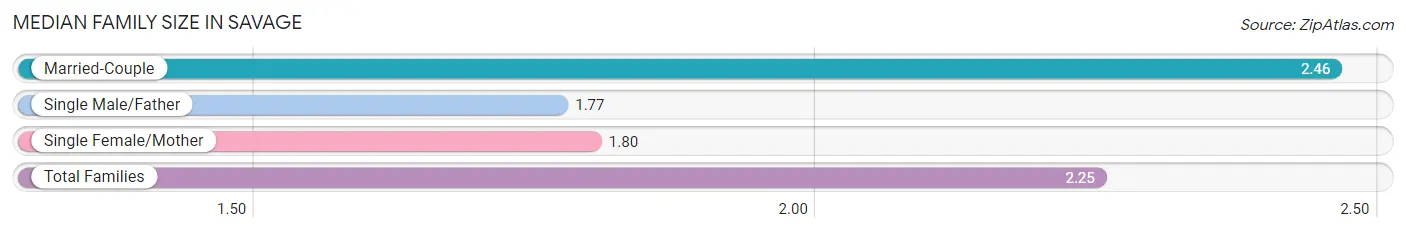
| Family Type | # Families | Family Size |
| Married-Couple | 52 (69.3%) | 2.46 |
| Single Male/Father | 13 (17.3%) | 1.77 |
| Single Female/Mother | 10 (13.3%) | 1.80 |
| Total Families | 75 (100.0%) | 2.25 |
Median Household Size in Savage
The median household size in Savage is 1.73 persons per household, with single male/father households (13 | 7.6%) accounting for the largest median household size of 2.54 persons per household. non-family households (95 | 55.9%) represent the smallest median household size with 1.21 persons per household.
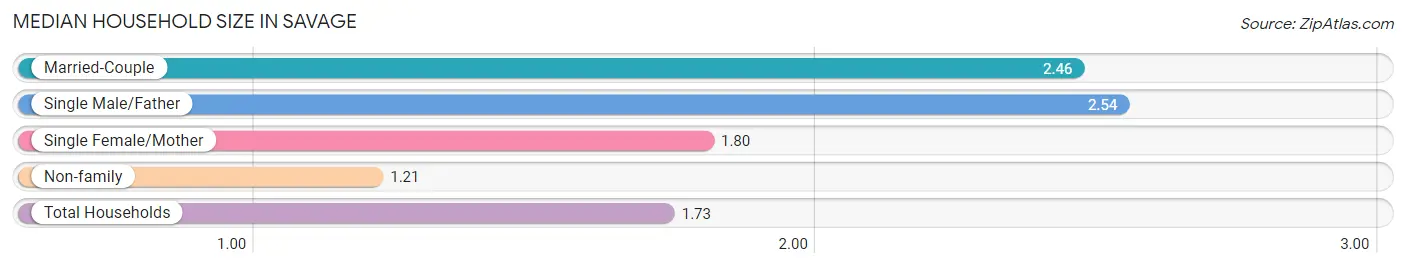
| Household Type | # Households | Household Size |
| Married-Couple | 52 (30.6%) | 2.46 |
| Single Male/Father | 13 (7.6%) | 2.54 |
| Single Female/Mother | 10 (5.9%) | 1.80 |
| Non-family | 95 (55.9%) | 1.21 |
| Total Households | 170 (100.0%) | 1.73 |
Household Size by Marriage Status in Savage
Out of a total of 170 households in Savage, 75 (44.1%) are family households, while 95 (55.9%) are nonfamily households. The most numerous type of family households are 2-person households, comprising 48, and the most common type of nonfamily households are 1-person households, comprising 87.
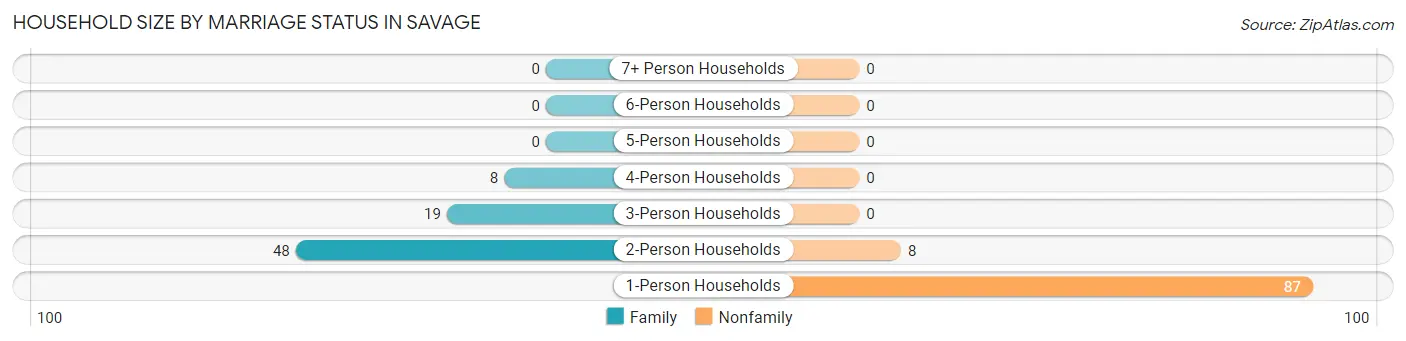
| Household Size | Family Households | Nonfamily Households |
| 1-Person Households | - | 87 (51.2%) |
| 2-Person Households | 48 (28.2%) | 8 (4.7%) |
| 3-Person Households | 19 (11.2%) | 0 (0.0%) |
| 4-Person Households | 8 (4.7%) | 0 (0.0%) |
| 5-Person Households | 0 (0.0%) | 0 (0.0%) |
| 6-Person Households | 0 (0.0%) | 0 (0.0%) |
| 7+ Person Households | 0 (0.0%) | 0 (0.0%) |
| Total | 75 (44.1%) | 95 (55.9%) |
Female Fertility in Savage
Fertility by Age in Savage
| Age Bracket | Women with Births | Births / 1,000 Women |
| 15 to 19 years | 0 (0.0%) | 0.0 |
| 20 to 34 years | 0 (0.0%) | 0.0 |
| 35 to 50 years | 0 (0.0%) | 0.0 |
| Total | 0 (0.0%) | 0.0 |
Fertility by Age by Marriage Status in Savage
| Age Bracket | Married | Unmarried |
| 15 to 19 years | 0 (0.0%) | 0 (0.0%) |
| 20 to 34 years | 0 (0.0%) | 0 (0.0%) |
| 35 to 50 years | 0 (0.0%) | 0 (0.0%) |
| Total | 0 (0.0%) | 0 (0.0%) |
Fertility by Education in Savage
| Educational Attainment | Women with Births | Births / 1,000 Women |
| Less than High School | 0 (0.0%) | 0.0 |
| High School Diploma | 0 (0.0%) | 0.0 |
| College or Associate's Degree | 0 (0.0%) | 0.0 |
| Bachelor's Degree | 0 (0.0%) | 0.0 |
| Graduate Degree | 0 (0.0%) | 0.0 |
| Total | 0 (0.0%) | 0.0 |
Fertility by Education by Marriage Status in Savage
| Educational Attainment | Married | Unmarried |
| Less than High School | 0 (0.0%) | 0 (0.0%) |
| High School Diploma | 0 (0.0%) | 0 (0.0%) |
| College or Associate's Degree | 0 (0.0%) | 0 (0.0%) |
| Bachelor's Degree | 0 (0.0%) | 0 (0.0%) |
| Graduate Degree | 0 (0.0%) | 0 (0.0%) |
| Total | 0 (0.0%) | 0 (0.0%) |
Employment Characteristics in Savage
Employment by Class of Employer in Savage
Among the 197 employed individuals in Savage, private company employees (116 | 58.9%), local government employees (42 | 21.3%), and state government employees (20 | 10.2%) make up the most common classes of employment.
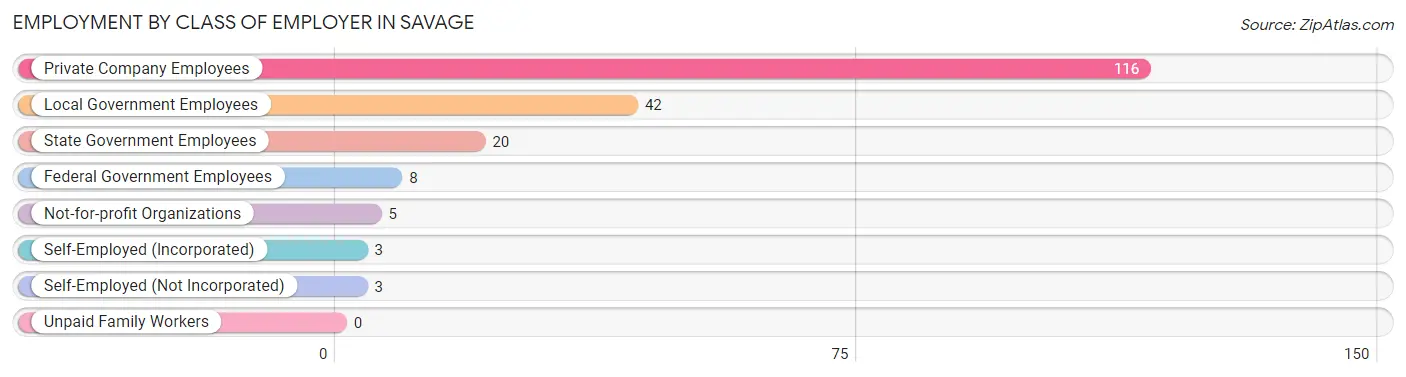
| Employer Class | # Employees | % Employees |
| Private Company Employees | 116 | 58.9% |
| Self-Employed (Incorporated) | 3 | 1.5% |
| Self-Employed (Not Incorporated) | 3 | 1.5% |
| Not-for-profit Organizations | 5 | 2.5% |
| Local Government Employees | 42 | 21.3% |
| State Government Employees | 20 | 10.2% |
| Federal Government Employees | 8 | 4.1% |
| Unpaid Family Workers | 0 | 0.0% |
| Total | 197 | 100.0% |
Employment Status by Age in Savage
According to the labor force statistics for Savage, out of the total population over 16 years of age (257), 80.2% or 206 individuals are in the labor force, with 4.4% or 9 of them unemployed. The age group with the highest labor force participation rate is 16 to 19 years, with 100.0% or 2 individuals in the labor force. Within the labor force, the 55 to 59 years age range has the highest percentage of unemployed individuals, with 34.6% or 9 of them being unemployed.
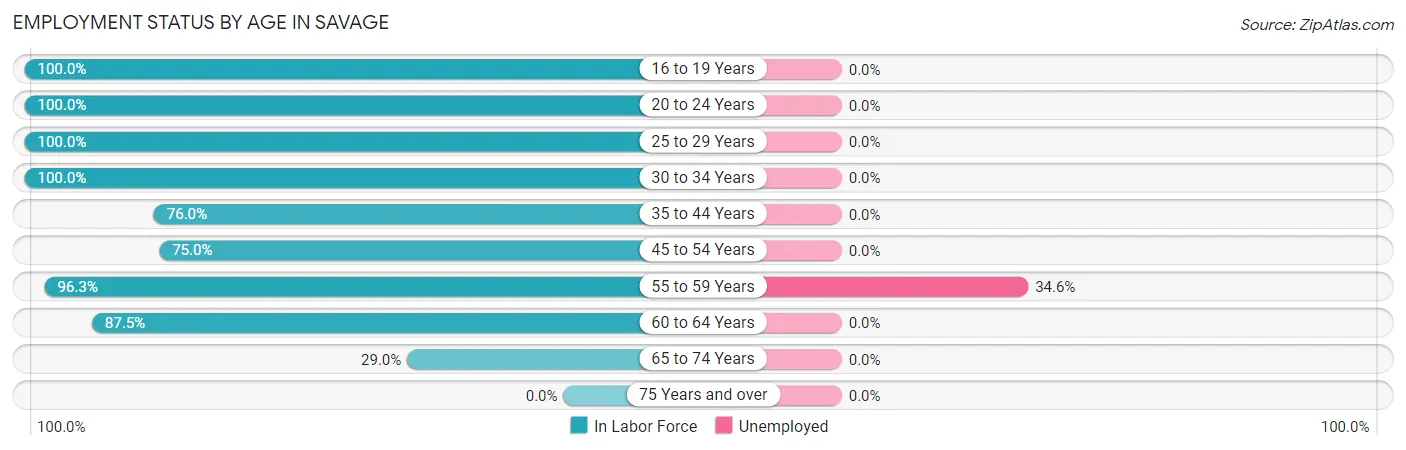
| Age Bracket | In Labor Force | Unemployed |
| 16 to 19 Years | 2 (100.0%) | 0 (0.0%) |
| 20 to 24 Years | 63 (100.0%) | 0 (0.0%) |
| 25 to 29 Years | 43 (100.0%) | 0 (0.0%) |
| 30 to 34 Years | 20 (100.0%) | 0 (0.0%) |
| 35 to 44 Years | 19 (76.0%) | 0 (0.0%) |
| 45 to 54 Years | 3 (75.0%) | 0 (0.0%) |
| 55 to 59 Years | 26 (96.3%) | 9 (34.6%) |
| 60 to 64 Years | 21 (87.5%) | 0 (0.0%) |
| 65 to 74 Years | 9 (29.0%) | 0 (0.0%) |
| 75 Years and over | 0 (0.0%) | 0 (0.0%) |
| Total | 206 (80.2%) | 9 (4.4%) |
Employment Status by Educational Attainment in Savage
According to labor force statistics for Savage, 92.3% of individuals (132) out of the total population between 25 and 64 years of age (143) are in the labor force, with 6.8% or 9 of them being unemployed. The group with the highest labor force participation rate are those with the educational attainment of college / associate degree, with 100.0% or 20 individuals in the labor force. Within the labor force, individuals with high school diploma education have the highest percentage of unemployment, with 11.5% or 9 of them being unemployed.
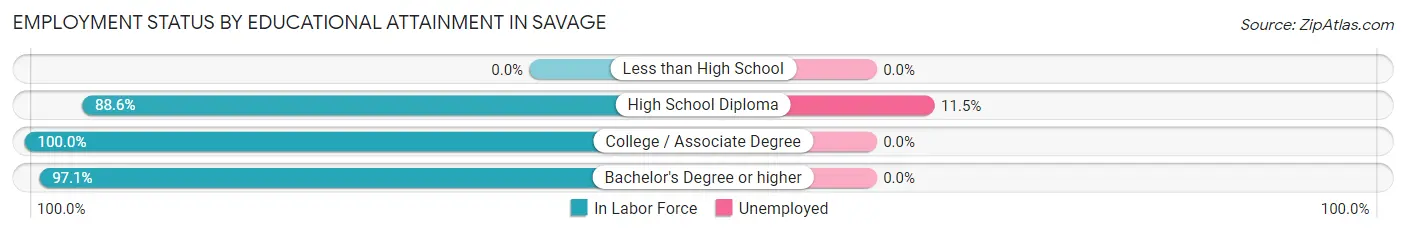
| Educational Attainment | In Labor Force | Unemployed |
| Less than High School | 0 (0.0%) | 0 (0.0%) |
| High School Diploma | 78 (88.6%) | 10 (11.5%) |
| College / Associate Degree | 20 (100.0%) | 0 (0.0%) |
| Bachelor's Degree or higher | 34 (97.1%) | 0 (0.0%) |
| Total | 132 (92.3%) | 10 (6.8%) |
Employment Occupations by Sex in Savage
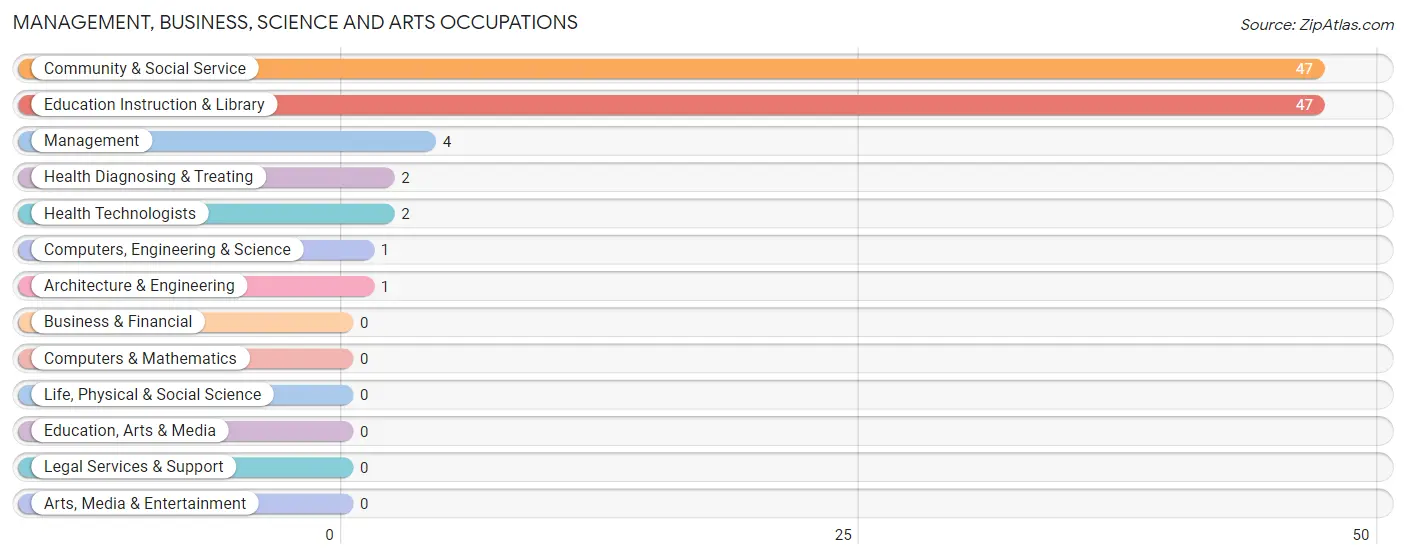
Management, Business, Science and Arts Occupations
The most common Management, Business, Science and Arts occupations in Savage are Community & Social Service (47 | 23.9%), Education Instruction & Library (47 | 23.9%), Management (4 | 2.0%), Health Diagnosing & Treating (2 | 1.0%), and Health Technologists (2 | 1.0%).
Management, Business, Science and Arts Occupations by Sex
Within the Management, Business, Science and Arts occupations in Savage, the most male-oriented occupations are Computers, Engineering & Science (100.0%), Architecture & Engineering (100.0%), and Community & Social Service (59.6%), while the most female-oriented occupations are Health Diagnosing & Treating (100.0%), Health Technologists (100.0%), and Management (50.0%).
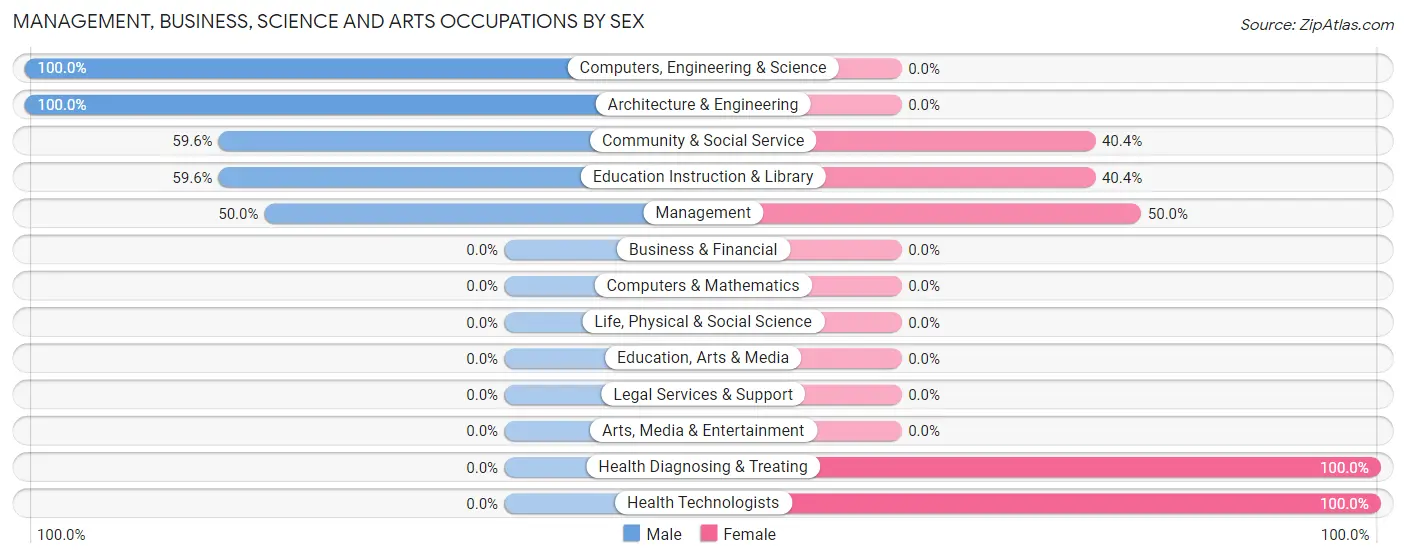
| Occupation | Male | Female |
| Management | 2 (50.0%) | 2 (50.0%) |
| Business & Financial | 0 (0.0%) | 0 (0.0%) |
| Computers, Engineering & Science | 1 (100.0%) | 0 (0.0%) |
| Computers & Mathematics | 0 (0.0%) | 0 (0.0%) |
| Architecture & Engineering | 1 (100.0%) | 0 (0.0%) |
| Life, Physical & Social Science | 0 (0.0%) | 0 (0.0%) |
| Community & Social Service | 28 (59.6%) | 19 (40.4%) |
| Education, Arts & Media | 0 (0.0%) | 0 (0.0%) |
| Legal Services & Support | 0 (0.0%) | 0 (0.0%) |
| Education Instruction & Library | 28 (59.6%) | 19 (40.4%) |
| Arts, Media & Entertainment | 0 (0.0%) | 0 (0.0%) |
| Health Diagnosing & Treating | 0 (0.0%) | 2 (100.0%) |
| Health Technologists | 0 (0.0%) | 2 (100.0%) |
| Total (Category) | 31 (57.4%) | 23 (42.6%) |
| Total (Overall) | 90 (45.7%) | 107 (54.3%) |
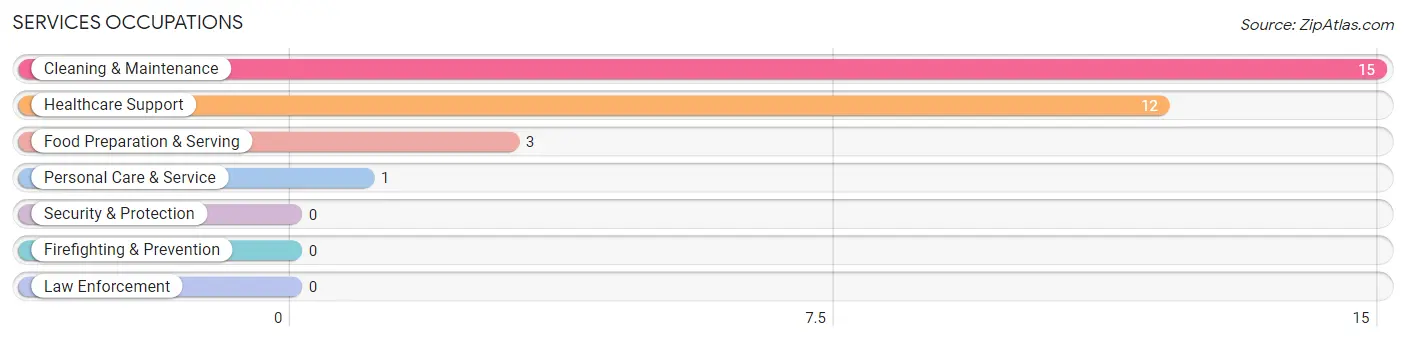
Services Occupations
The most common Services occupations in Savage are Cleaning & Maintenance (15 | 7.6%), Healthcare Support (12 | 6.1%), Food Preparation & Serving (3 | 1.5%), and Personal Care & Service (1 | 0.5%).
Services Occupations by Sex
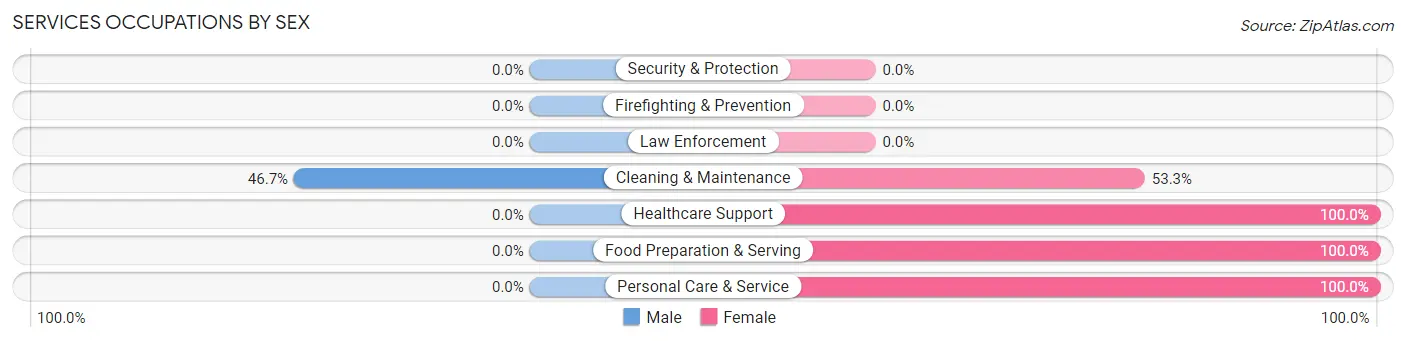
| Occupation | Male | Female |
| Healthcare Support | 0 (0.0%) | 12 (100.0%) |
| Security & Protection | 0 (0.0%) | 0 (0.0%) |
| Firefighting & Prevention | 0 (0.0%) | 0 (0.0%) |
| Law Enforcement | 0 (0.0%) | 0 (0.0%) |
| Food Preparation & Serving | 0 (0.0%) | 3 (100.0%) |
| Cleaning & Maintenance | 7 (46.7%) | 8 (53.3%) |
| Personal Care & Service | 0 (0.0%) | 1 (100.0%) |
| Total (Category) | 7 (22.6%) | 24 (77.4%) |
| Total (Overall) | 90 (45.7%) | 107 (54.3%) |
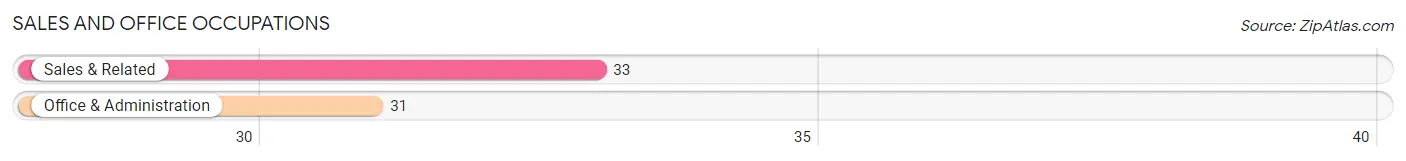
Sales and Office Occupations
The most common Sales and Office occupations in Savage are Sales & Related (33 | 16.8%), and Office & Administration (31 | 15.7%).
Sales and Office Occupations by Sex
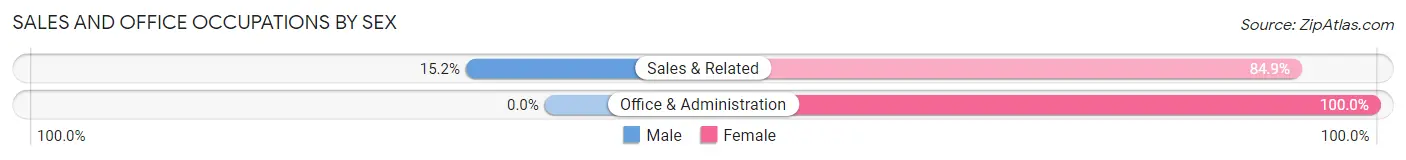
| Occupation | Male | Female |
| Sales & Related | 5 (15.1%) | 28 (84.9%) |
| Office & Administration | 0 (0.0%) | 31 (100.0%) |
| Total (Category) | 5 (7.8%) | 59 (92.2%) |
| Total (Overall) | 90 (45.7%) | 107 (54.3%) |
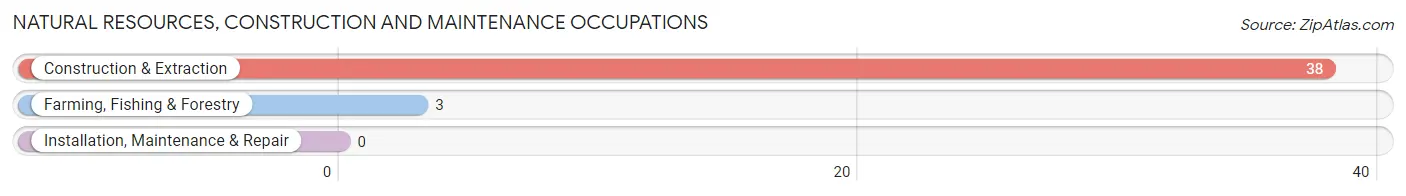
Natural Resources, Construction and Maintenance Occupations
The most common Natural Resources, Construction and Maintenance occupations in Savage are Construction & Extraction (38 | 19.3%), and Farming, Fishing & Forestry (3 | 1.5%).
Natural Resources, Construction and Maintenance Occupations by Sex
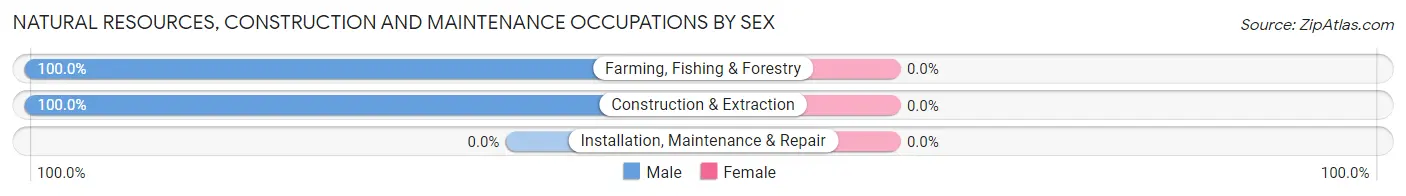
| Occupation | Male | Female |
| Farming, Fishing & Forestry | 3 (100.0%) | 0 (0.0%) |
| Construction & Extraction | 38 (100.0%) | 0 (0.0%) |
| Installation, Maintenance & Repair | 0 (0.0%) | 0 (0.0%) |
| Total (Category) | 41 (100.0%) | 0 (0.0%) |
| Total (Overall) | 90 (45.7%) | 107 (54.3%) |
Production, Transportation and Moving Occupations
The most common Production, Transportation and Moving occupations in Savage are , and Production (7 | 3.5%).
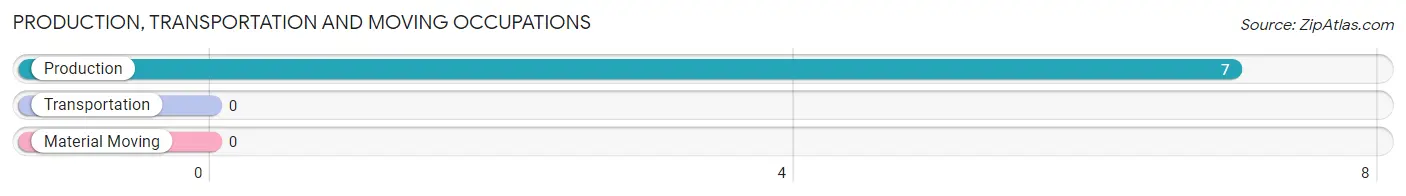
Production, Transportation and Moving Occupations by Sex
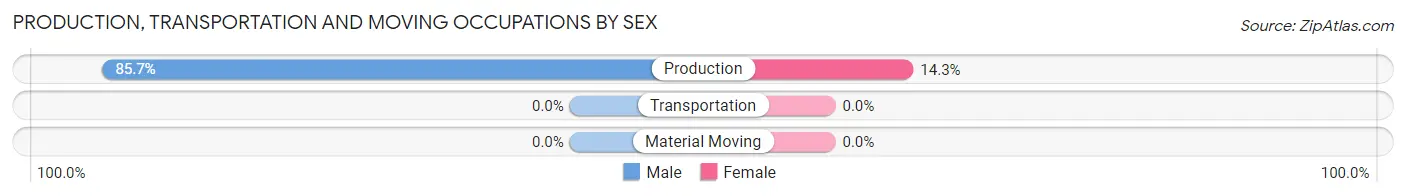
| Occupation | Male | Female |
| Production | 6 (85.7%) | 1 (14.3%) |
| Transportation | 0 (0.0%) | 0 (0.0%) |
| Material Moving | 0 (0.0%) | 0 (0.0%) |
| Total (Category) | 6 (85.7%) | 1 (14.3%) |
| Total (Overall) | 90 (45.7%) | 107 (54.3%) |
Employment Industries by Sex in Savage
Employment Industries in Savage
The major employment industries in Savage include Educational Services (64 | 32.5%), Retail Trade (43 | 21.8%), Mining, Quarrying, & Extraction (25 | 12.7%), Construction (20 | 10.2%), and Health Care & Social Assistance (18 | 9.1%).
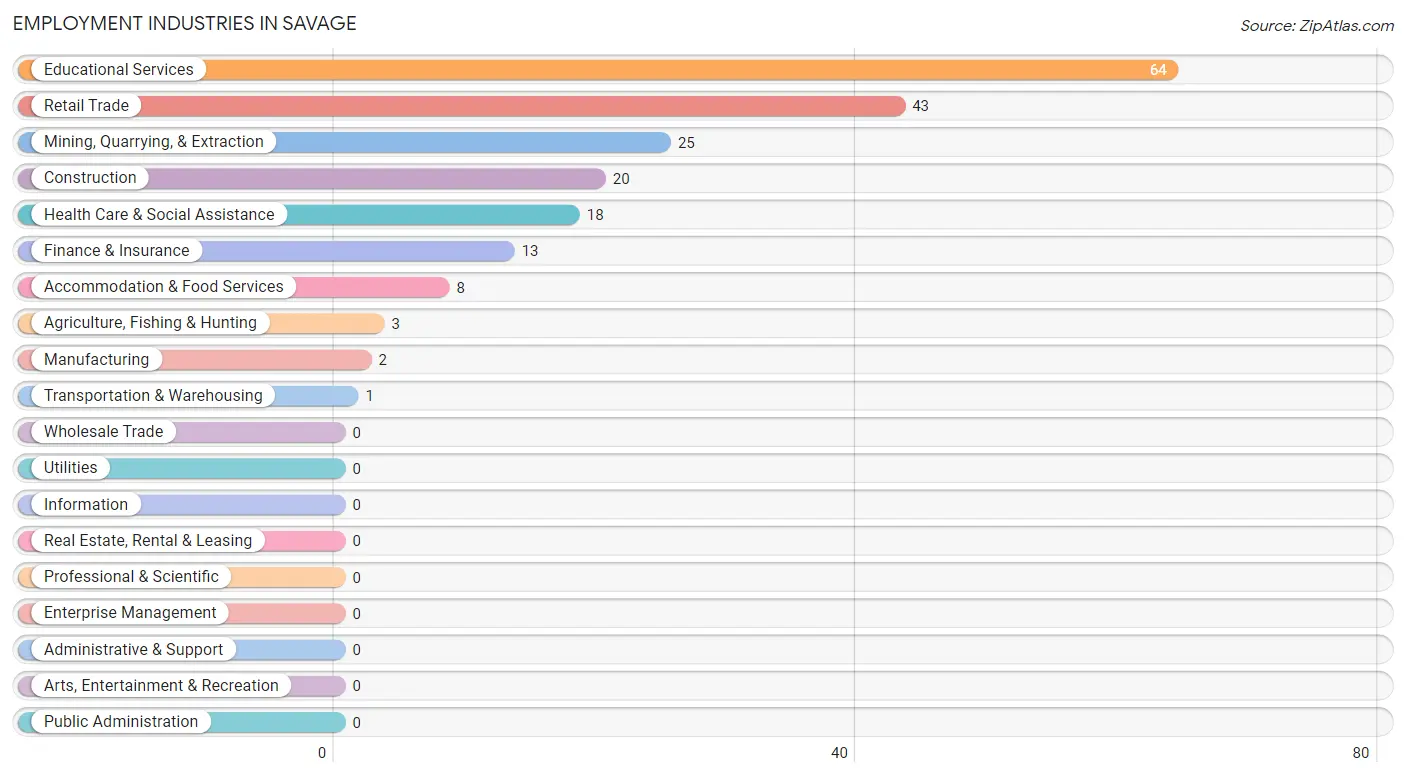
Employment Industries by Sex in Savage
The Savage industries that see more men than women are Agriculture, Fishing & Hunting (100.0%), Mining, Quarrying, & Extraction (100.0%), and Construction (100.0%), whereas the industries that tend to have a higher number of women are Finance & Insurance (100.0%), Health Care & Social Assistance (100.0%), and Accommodation & Food Services (100.0%).
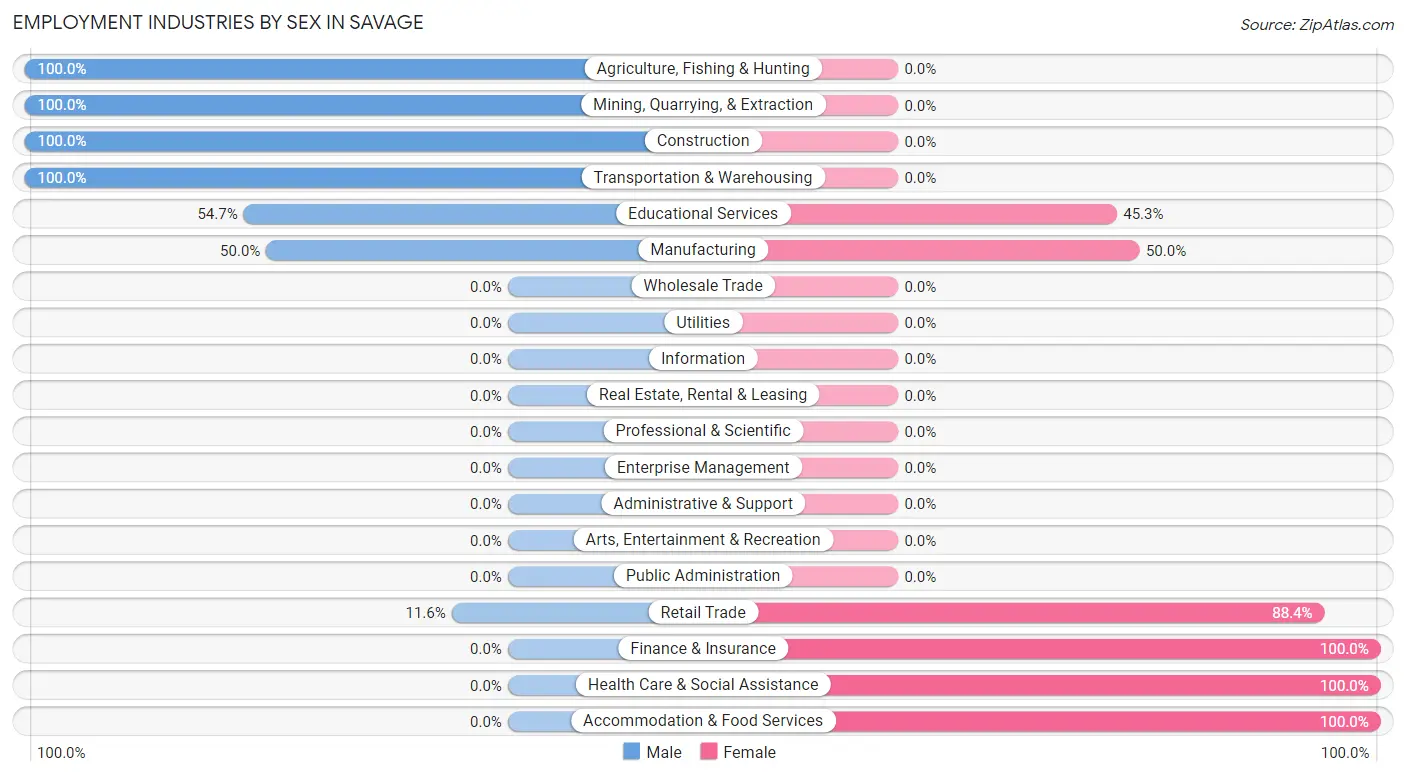
| Industry | Male | Female |
| Agriculture, Fishing & Hunting | 3 (100.0%) | 0 (0.0%) |
| Mining, Quarrying, & Extraction | 25 (100.0%) | 0 (0.0%) |
| Construction | 20 (100.0%) | 0 (0.0%) |
| Manufacturing | 1 (50.0%) | 1 (50.0%) |
| Wholesale Trade | 0 (0.0%) | 0 (0.0%) |
| Retail Trade | 5 (11.6%) | 38 (88.4%) |
| Transportation & Warehousing | 1 (100.0%) | 0 (0.0%) |
| Utilities | 0 (0.0%) | 0 (0.0%) |
| Information | 0 (0.0%) | 0 (0.0%) |
| Finance & Insurance | 0 (0.0%) | 13 (100.0%) |
| Real Estate, Rental & Leasing | 0 (0.0%) | 0 (0.0%) |
| Professional & Scientific | 0 (0.0%) | 0 (0.0%) |
| Enterprise Management | 0 (0.0%) | 0 (0.0%) |
| Administrative & Support | 0 (0.0%) | 0 (0.0%) |
| Educational Services | 35 (54.7%) | 29 (45.3%) |
| Health Care & Social Assistance | 0 (0.0%) | 18 (100.0%) |
| Arts, Entertainment & Recreation | 0 (0.0%) | 0 (0.0%) |
| Accommodation & Food Services | 0 (0.0%) | 8 (100.0%) |
| Public Administration | 0 (0.0%) | 0 (0.0%) |
| Total | 90 (45.7%) | 107 (54.3%) |
Education in Savage
School Enrollment in Savage
The most common levels of schooling among the 27 students in Savage are elementary school (10 | 37.0%), high school (10 | 37.0%), and middle school (7 | 25.9%).
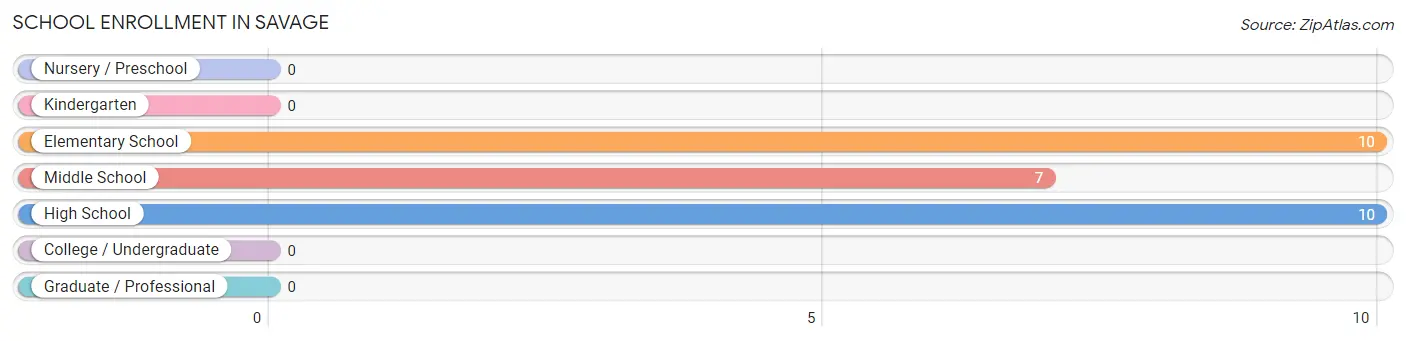
| School Level | # Students | % Students |
| Nursery / Preschool | 0 | 0.0% |
| Kindergarten | 0 | 0.0% |
| Elementary School | 10 | 37.0% |
| Middle School | 7 | 25.9% |
| High School | 10 | 37.0% |
| College / Undergraduate | 0 | 0.0% |
| Graduate / Professional | 0 | 0.0% |
| Total | 27 | 100.0% |
School Enrollment by Age by Funding Source in Savage
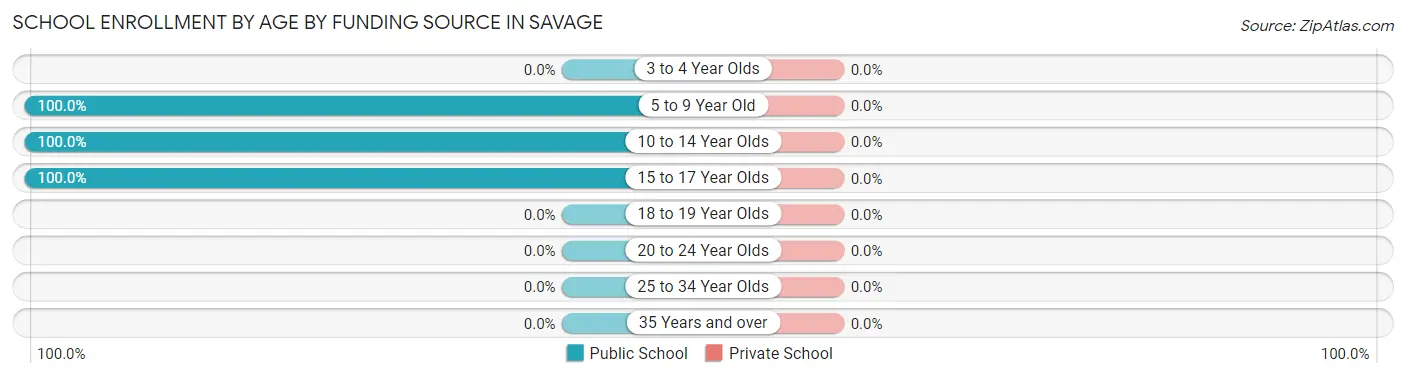
| Age Bracket | Public School | Private School |
| 3 to 4 Year Olds | 0 (0.0%) | 0 (0.0%) |
| 5 to 9 Year Old | 10 (100.0%) | 0 (0.0%) |
| 10 to 14 Year Olds | 7 (100.0%) | 0 (0.0%) |
| 15 to 17 Year Olds | 10 (100.0%) | 0 (0.0%) |
| 18 to 19 Year Olds | 0 (0.0%) | 0 (0.0%) |
| 20 to 24 Year Olds | 0 (0.0%) | 0 (0.0%) |
| 25 to 34 Year Olds | 0 (0.0%) | 0 (0.0%) |
| 35 Years and over | 0 (0.0%) | 0 (0.0%) |
| Total | 27 (100.0%) | 0 (0.0%) |
Educational Attainment by Field of Study in Savage
Education (31 | 58.5%), bio, nature & agricultural (6 | 11.3%), literature & languages (6 | 11.3%), communications (6 | 11.3%), and psychology (4 | 7.5%) are the most common fields of study among 53 individuals in Savage who have obtained a bachelor's degree or higher.
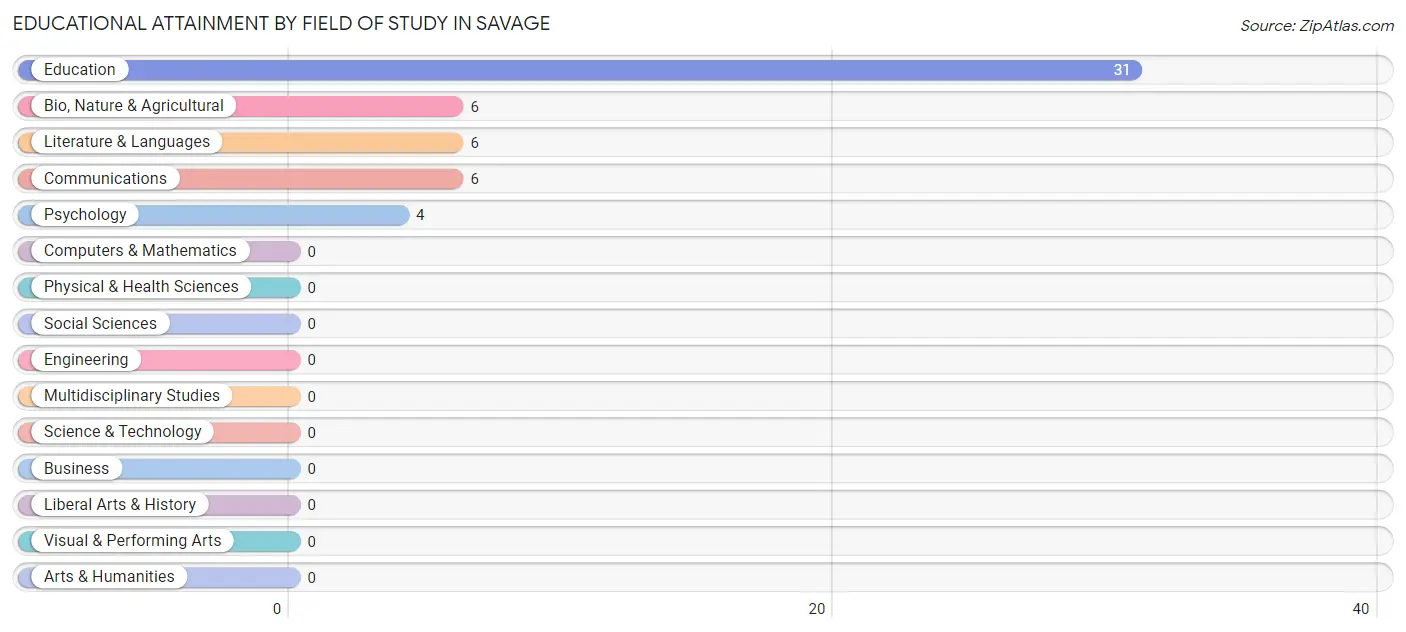
| Field of Study | # Graduates | % Graduates |
| Computers & Mathematics | 0 | 0.0% |
| Bio, Nature & Agricultural | 6 | 11.3% |
| Physical & Health Sciences | 0 | 0.0% |
| Psychology | 4 | 7.5% |
| Social Sciences | 0 | 0.0% |
| Engineering | 0 | 0.0% |
| Multidisciplinary Studies | 0 | 0.0% |
| Science & Technology | 0 | 0.0% |
| Business | 0 | 0.0% |
| Education | 31 | 58.5% |
| Literature & Languages | 6 | 11.3% |
| Liberal Arts & History | 0 | 0.0% |
| Visual & Performing Arts | 0 | 0.0% |
| Communications | 6 | 11.3% |
| Arts & Humanities | 0 | 0.0% |
| Total | 53 | 100.0% |
Transportation & Commute in Savage
Vehicle Availability by Sex in Savage
The most prevalent vehicle ownership categories in Savage are males with 1 vehicle (46, accounting for 51.1%) and females with 1 vehicle (38, making up 43.0%).
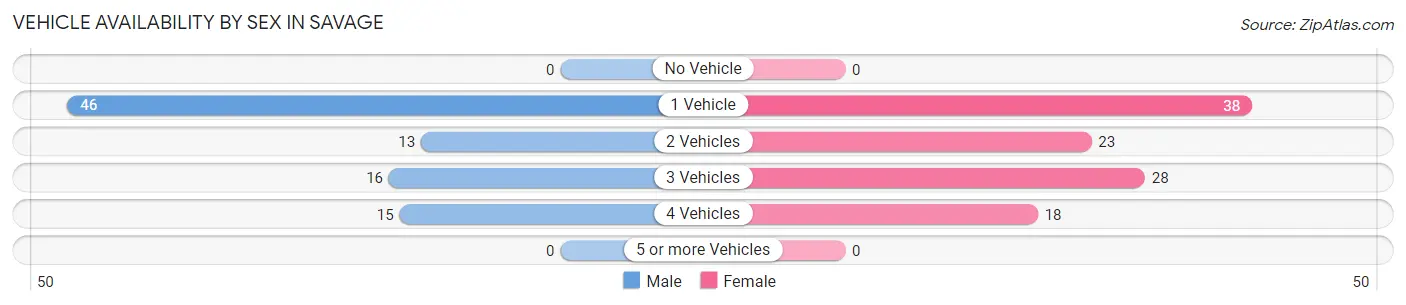
| Vehicles Available | Male | Female |
| No Vehicle | 0 (0.0%) | 0 (0.0%) |
| 1 Vehicle | 46 (51.1%) | 38 (35.5%) |
| 2 Vehicles | 13 (14.4%) | 23 (21.5%) |
| 3 Vehicles | 16 (17.8%) | 28 (26.2%) |
| 4 Vehicles | 15 (16.7%) | 18 (16.8%) |
| 5 or more Vehicles | 0 (0.0%) | 0 (0.0%) |
| Total | 90 (100.0%) | 107 (100.0%) |
Commute Time in Savage
The most frequently occuring commute durations in Savage are less than 5 minutes (55 commuters, 28.1%), 5 to 9 minutes (39 commuters, 19.9%), and 10 to 14 minutes (22 commuters, 11.2%).
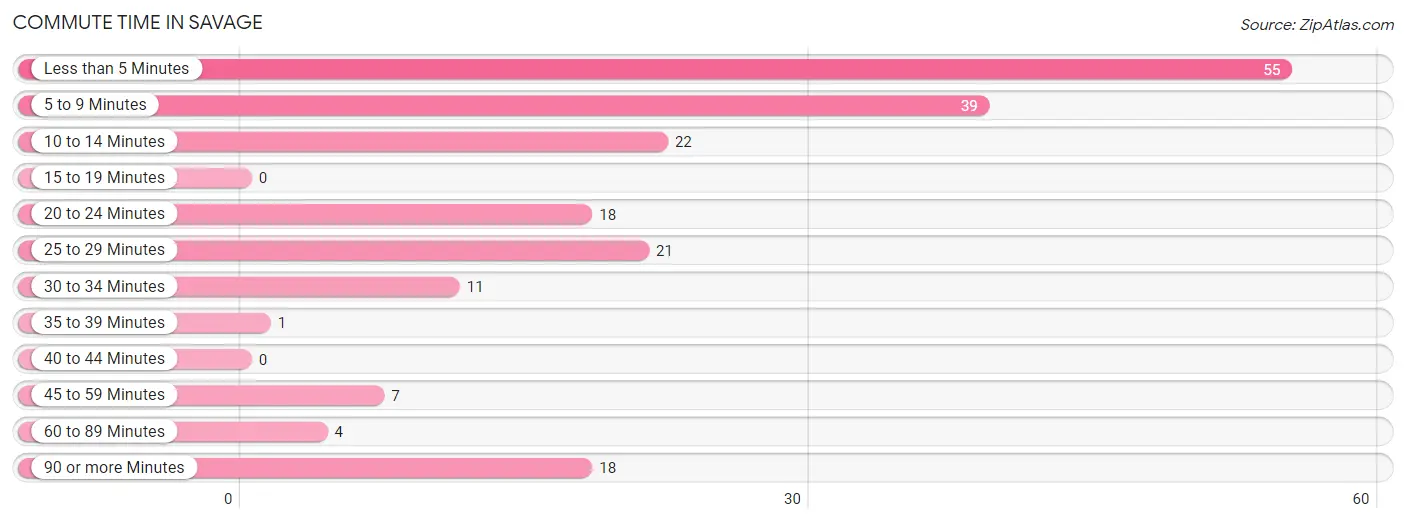
| Commute Time | # Commuters | % Commuters |
| Less than 5 Minutes | 55 | 28.1% |
| 5 to 9 Minutes | 39 | 19.9% |
| 10 to 14 Minutes | 22 | 11.2% |
| 15 to 19 Minutes | 0 | 0.0% |
| 20 to 24 Minutes | 18 | 9.2% |
| 25 to 29 Minutes | 21 | 10.7% |
| 30 to 34 Minutes | 11 | 5.6% |
| 35 to 39 Minutes | 1 | 0.5% |
| 40 to 44 Minutes | 0 | 0.0% |
| 45 to 59 Minutes | 7 | 3.6% |
| 60 to 89 Minutes | 4 | 2.0% |
| 90 or more Minutes | 18 | 9.2% |
Commute Time by Sex in Savage
The most common commute times in Savage are 5 to 9 minutes (36 commuters, 40.0%) for males and less than 5 minutes (36 commuters, 34.0%) for females.
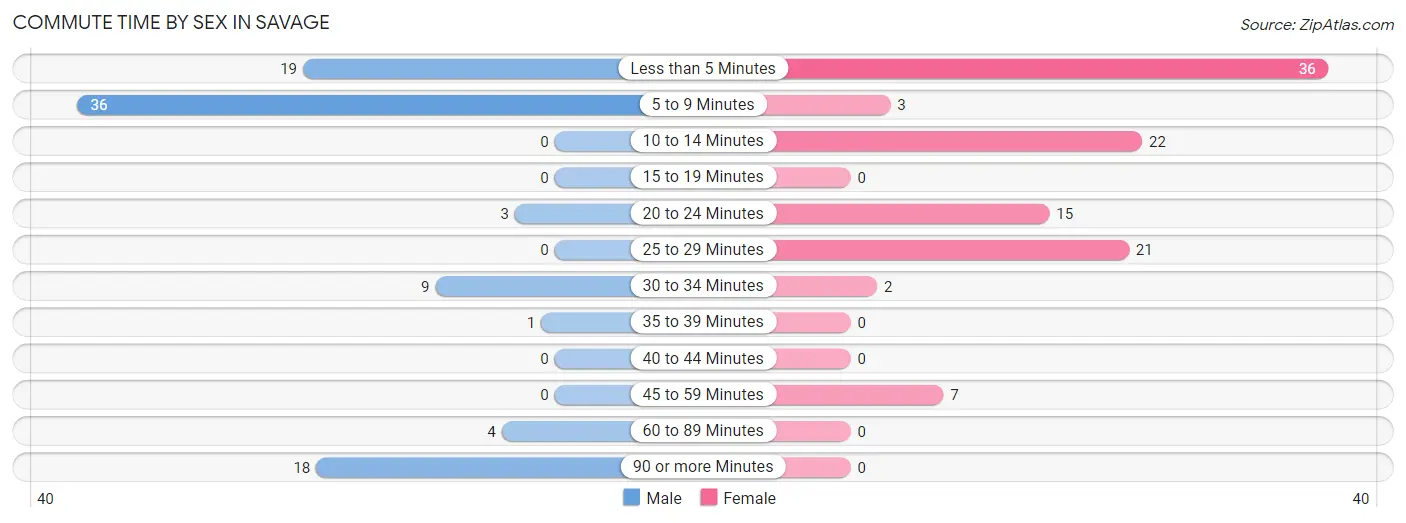
| Commute Time | Male | Female |
| Less than 5 Minutes | 19 (21.1%) | 36 (34.0%) |
| 5 to 9 Minutes | 36 (40.0%) | 3 (2.8%) |
| 10 to 14 Minutes | 0 (0.0%) | 22 (20.7%) |
| 15 to 19 Minutes | 0 (0.0%) | 0 (0.0%) |
| 20 to 24 Minutes | 3 (3.3%) | 15 (14.1%) |
| 25 to 29 Minutes | 0 (0.0%) | 21 (19.8%) |
| 30 to 34 Minutes | 9 (10.0%) | 2 (1.9%) |
| 35 to 39 Minutes | 1 (1.1%) | 0 (0.0%) |
| 40 to 44 Minutes | 0 (0.0%) | 0 (0.0%) |
| 45 to 59 Minutes | 0 (0.0%) | 7 (6.6%) |
| 60 to 89 Minutes | 4 (4.4%) | 0 (0.0%) |
| 90 or more Minutes | 18 (20.0%) | 0 (0.0%) |
Time of Departure to Work by Sex in Savage
The most frequent times of departure to work in Savage are 7:30 AM to 7:59 AM (26, 28.9%) for males and 12:00 PM to 3:59 PM (22, 20.7%) for females.
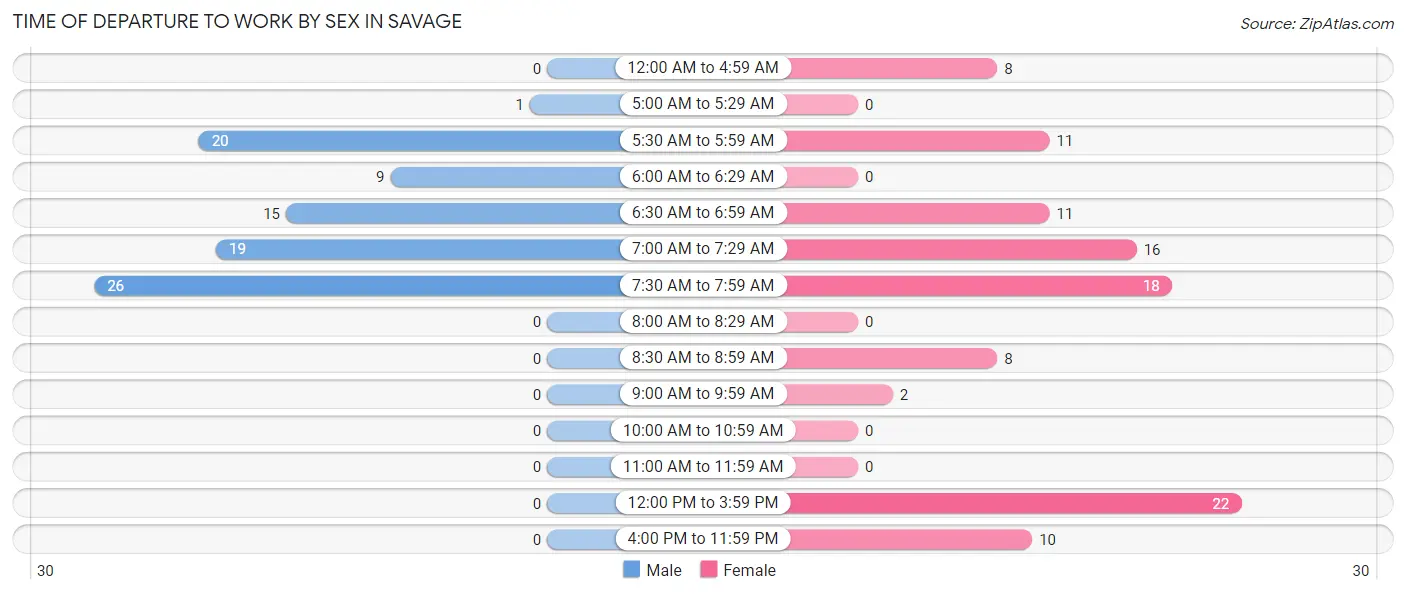
| Time of Departure | Male | Female |
| 12:00 AM to 4:59 AM | 0 (0.0%) | 8 (7.5%) |
| 5:00 AM to 5:29 AM | 1 (1.1%) | 0 (0.0%) |
| 5:30 AM to 5:59 AM | 20 (22.2%) | 11 (10.4%) |
| 6:00 AM to 6:29 AM | 9 (10.0%) | 0 (0.0%) |
| 6:30 AM to 6:59 AM | 15 (16.7%) | 11 (10.4%) |
| 7:00 AM to 7:29 AM | 19 (21.1%) | 16 (15.1%) |
| 7:30 AM to 7:59 AM | 26 (28.9%) | 18 (17.0%) |
| 8:00 AM to 8:29 AM | 0 (0.0%) | 0 (0.0%) |
| 8:30 AM to 8:59 AM | 0 (0.0%) | 8 (7.5%) |
| 9:00 AM to 9:59 AM | 0 (0.0%) | 2 (1.9%) |
| 10:00 AM to 10:59 AM | 0 (0.0%) | 0 (0.0%) |
| 11:00 AM to 11:59 AM | 0 (0.0%) | 0 (0.0%) |
| 12:00 PM to 3:59 PM | 0 (0.0%) | 22 (20.7%) |
| 4:00 PM to 11:59 PM | 0 (0.0%) | 10 (9.4%) |
| Total | 90 (100.0%) | 106 (100.0%) |
Housing Occupancy in Savage
Occupancy by Ownership in Savage
Of the total 170 dwellings in Savage, owner-occupied units account for 81 (47.6%), while renter-occupied units make up 89 (52.3%).
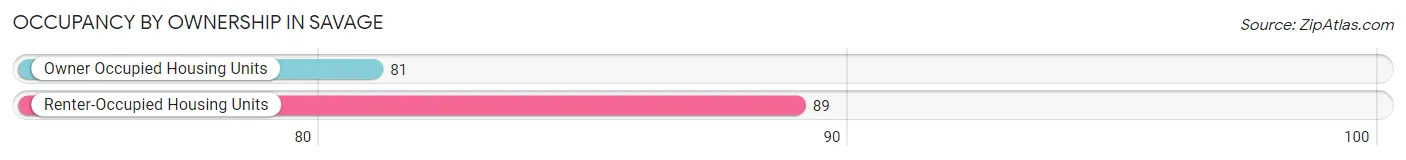
| Occupancy | # Housing Units | % Housing Units |
| Owner Occupied Housing Units | 81 | 47.6% |
| Renter-Occupied Housing Units | 89 | 52.3% |
| Total Occupied Housing Units | 170 | 100.0% |
Occupancy by Household Size in Savage
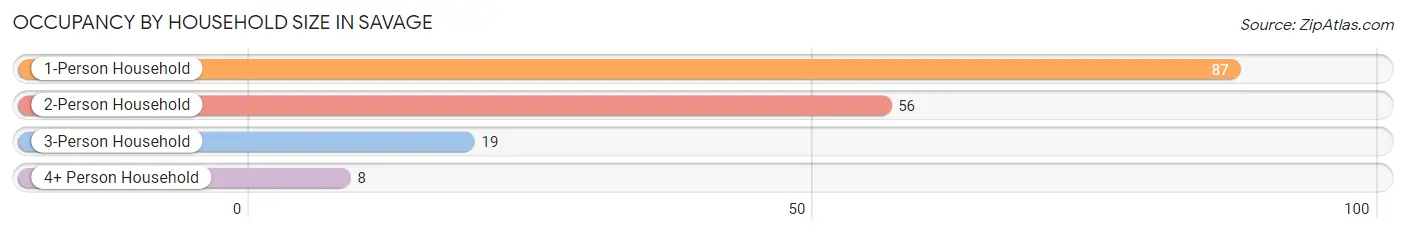
| Household Size | # Housing Units | % Housing Units |
| 1-Person Household | 87 | 51.2% |
| 2-Person Household | 56 | 32.9% |
| 3-Person Household | 19 | 11.2% |
| 4+ Person Household | 8 | 4.7% |
| Total Housing Units | 170 | 100.0% |
Occupancy by Ownership by Household Size in Savage
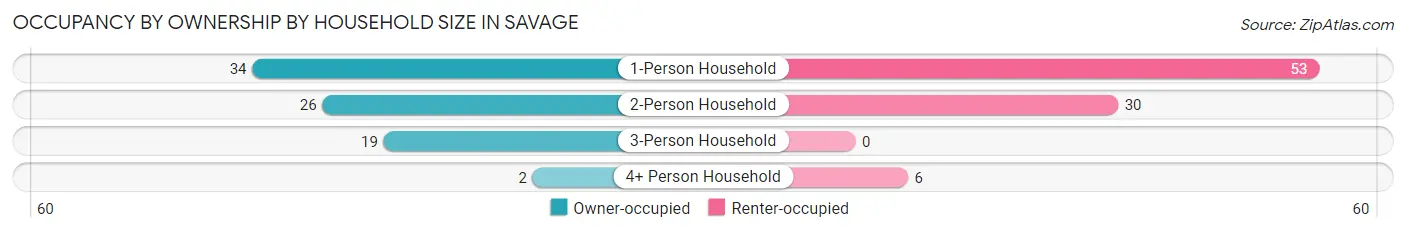
| Household Size | Owner-occupied | Renter-occupied |
| 1-Person Household | 34 (39.1%) | 53 (60.9%) |
| 2-Person Household | 26 (46.4%) | 30 (53.6%) |
| 3-Person Household | 19 (100.0%) | 0 (0.0%) |
| 4+ Person Household | 2 (25.0%) | 6 (75.0%) |
| Total Housing Units | 81 (47.6%) | 89 (52.3%) |
Occupancy by Educational Attainment in Savage
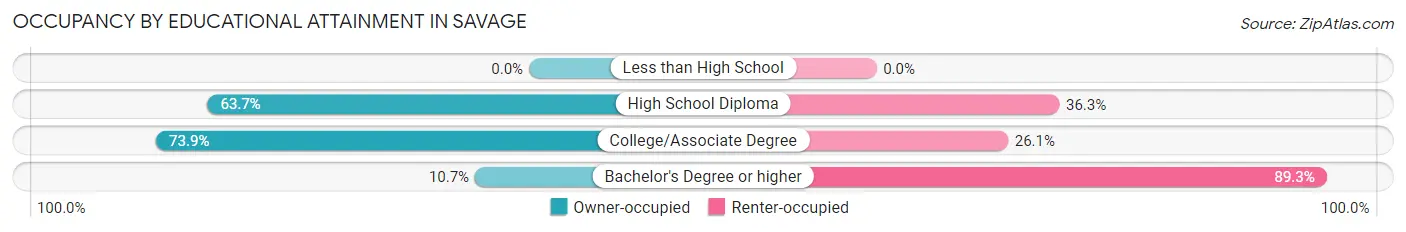
| Household Size | Owner-occupied | Renter-occupied |
| Less than High School | 0 (0.0%) | 0 (0.0%) |
| High School Diploma | 58 (63.7%) | 33 (36.3%) |
| College/Associate Degree | 17 (73.9%) | 6 (26.1%) |
| Bachelor's Degree or higher | 6 (10.7%) | 50 (89.3%) |
Occupancy by Age of Householder in Savage
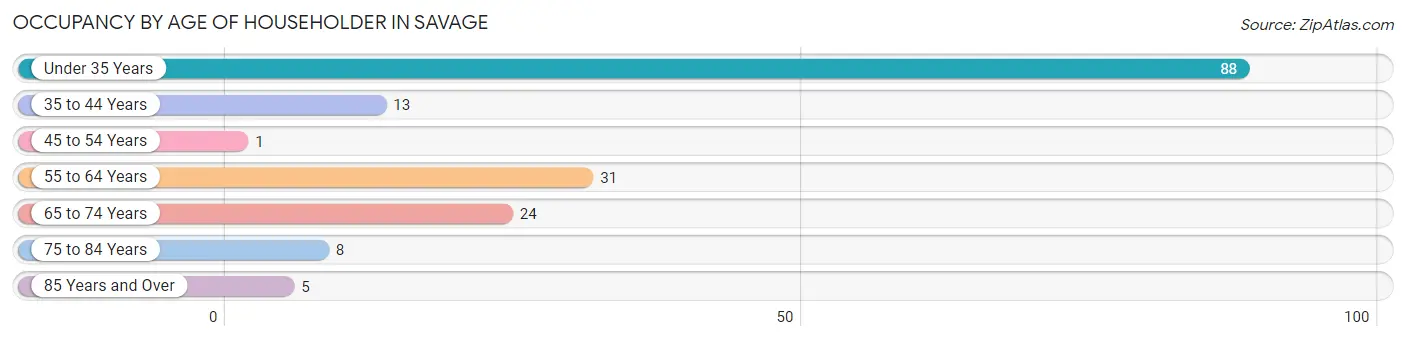
| Age Bracket | # Households | % Households |
| Under 35 Years | 88 | 51.8% |
| 35 to 44 Years | 13 | 7.6% |
| 45 to 54 Years | 1 | 0.6% |
| 55 to 64 Years | 31 | 18.2% |
| 65 to 74 Years | 24 | 14.1% |
| 75 to 84 Years | 8 | 4.7% |
| 85 Years and Over | 5 | 2.9% |
| Total | 170 | 100.0% |
Housing Finances in Savage
Median Income by Occupancy in Savage
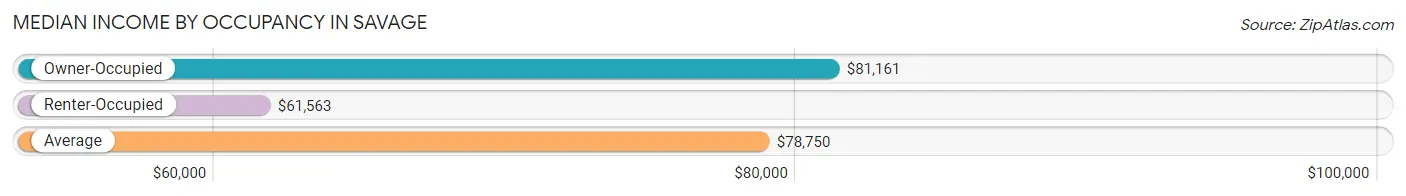
| Occupancy Type | # Households | Median Income |
| Owner-Occupied | 81 (47.6%) | $81,161 |
| Renter-Occupied | 89 (52.3%) | $61,563 |
| Average | 170 (100.0%) | $78,750 |
Occupancy by Householder Income Bracket in Savage
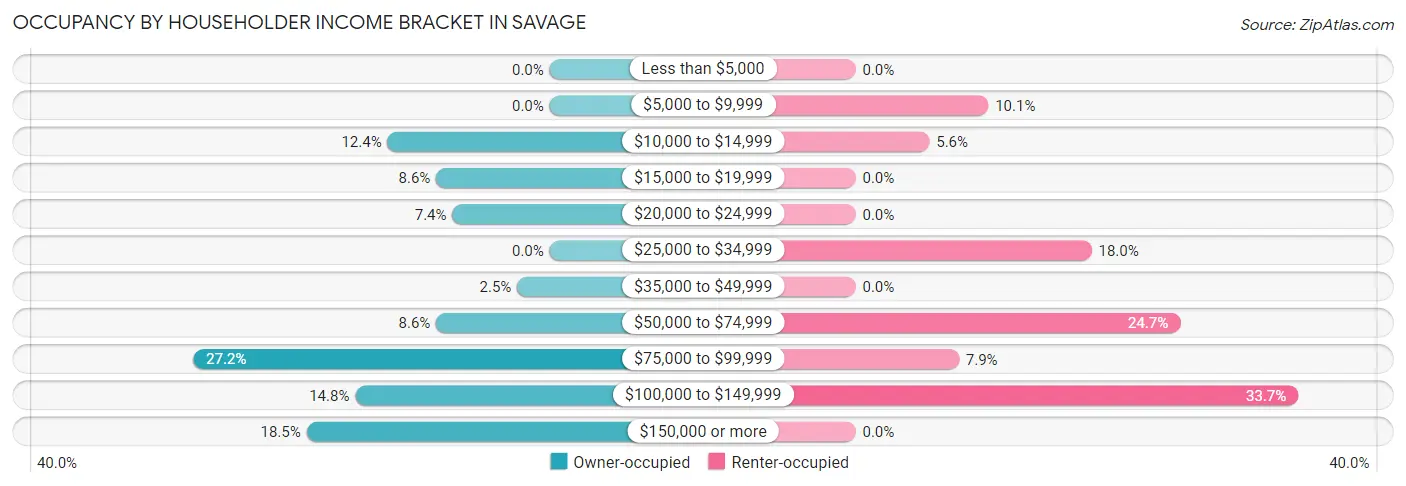
| Income Bracket | Owner-occupied | Renter-occupied |
| Less than $5,000 | 0 (0.0%) | 0 (0.0%) |
| $5,000 to $9,999 | 0 (0.0%) | 9 (10.1%) |
| $10,000 to $14,999 | 10 (12.3%) | 5 (5.6%) |
| $15,000 to $19,999 | 7 (8.6%) | 0 (0.0%) |
| $20,000 to $24,999 | 6 (7.4%) | 0 (0.0%) |
| $25,000 to $34,999 | 0 (0.0%) | 16 (18.0%) |
| $35,000 to $49,999 | 2 (2.5%) | 0 (0.0%) |
| $50,000 to $74,999 | 7 (8.6%) | 22 (24.7%) |
| $75,000 to $99,999 | 22 (27.2%) | 7 (7.9%) |
| $100,000 to $149,999 | 12 (14.8%) | 30 (33.7%) |
| $150,000 or more | 15 (18.5%) | 0 (0.0%) |
| Total | 81 (100.0%) | 89 (100.0%) |
Monthly Housing Cost Tiers in Savage
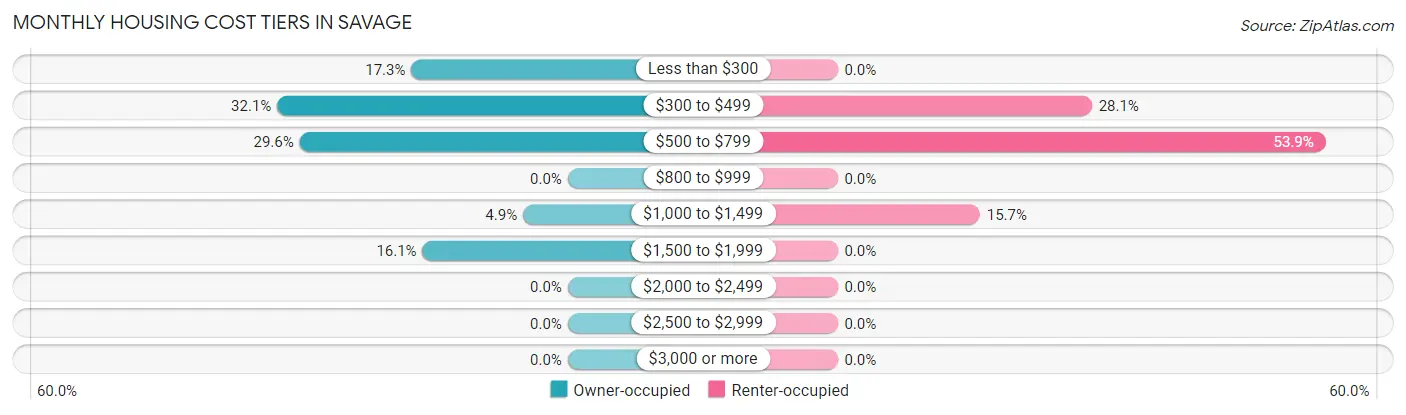
| Monthly Cost | Owner-occupied | Renter-occupied |
| Less than $300 | 14 (17.3%) | 0 (0.0%) |
| $300 to $499 | 26 (32.1%) | 25 (28.1%) |
| $500 to $799 | 24 (29.6%) | 48 (53.9%) |
| $800 to $999 | 0 (0.0%) | 0 (0.0%) |
| $1,000 to $1,499 | 4 (4.9%) | 14 (15.7%) |
| $1,500 to $1,999 | 13 (16.1%) | 0 (0.0%) |
| $2,000 to $2,499 | 0 (0.0%) | 0 (0.0%) |
| $2,500 to $2,999 | 0 (0.0%) | 0 (0.0%) |
| $3,000 or more | 0 (0.0%) | 0 (0.0%) |
| Total | 81 (100.0%) | 89 (100.0%) |
Physical Housing Characteristics in Savage
Housing Structures in Savage
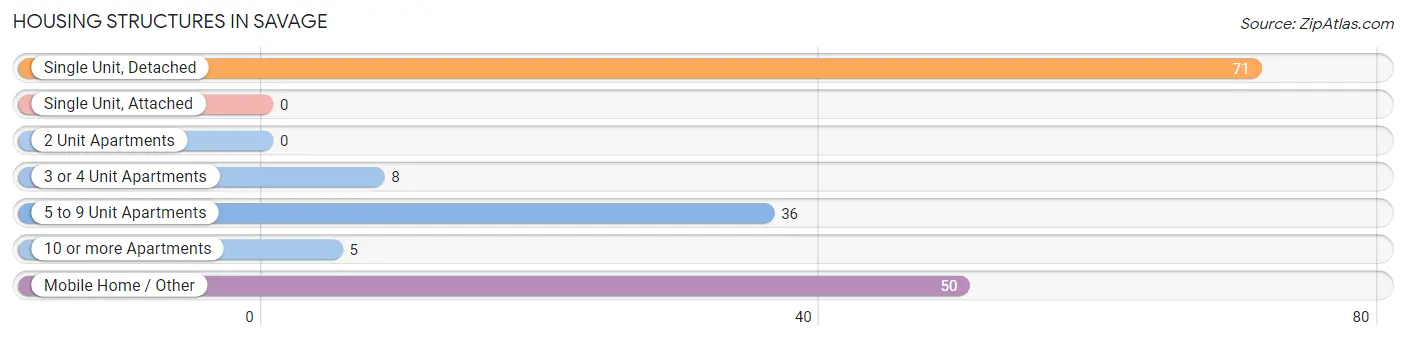
| Structure Type | # Housing Units | % Housing Units |
| Single Unit, Detached | 71 | 41.8% |
| Single Unit, Attached | 0 | 0.0% |
| 2 Unit Apartments | 0 | 0.0% |
| 3 or 4 Unit Apartments | 8 | 4.7% |
| 5 to 9 Unit Apartments | 36 | 21.2% |
| 10 or more Apartments | 5 | 2.9% |
| Mobile Home / Other | 50 | 29.4% |
| Total | 170 | 100.0% |
Housing Structures by Occupancy in Savage
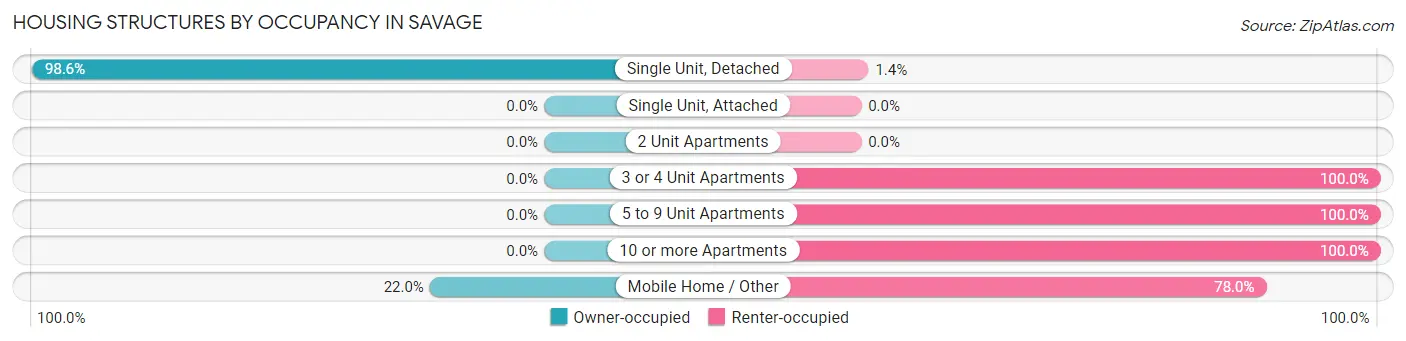
| Structure Type | Owner-occupied | Renter-occupied |
| Single Unit, Detached | 70 (98.6%) | 1 (1.4%) |
| Single Unit, Attached | 0 (0.0%) | 0 (0.0%) |
| 2 Unit Apartments | 0 (0.0%) | 0 (0.0%) |
| 3 or 4 Unit Apartments | 0 (0.0%) | 8 (100.0%) |
| 5 to 9 Unit Apartments | 0 (0.0%) | 36 (100.0%) |
| 10 or more Apartments | 0 (0.0%) | 5 (100.0%) |
| Mobile Home / Other | 11 (22.0%) | 39 (78.0%) |
| Total | 81 (47.6%) | 89 (52.3%) |
Housing Structures by Number of Rooms in Savage
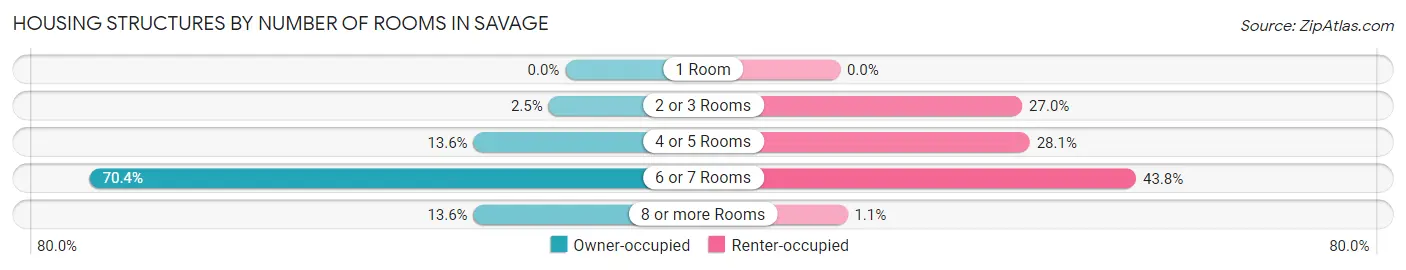
| Number of Rooms | Owner-occupied | Renter-occupied |
| 1 Room | 0 (0.0%) | 0 (0.0%) |
| 2 or 3 Rooms | 2 (2.5%) | 24 (27.0%) |
| 4 or 5 Rooms | 11 (13.6%) | 25 (28.1%) |
| 6 or 7 Rooms | 57 (70.4%) | 39 (43.8%) |
| 8 or more Rooms | 11 (13.6%) | 1 (1.1%) |
| Total | 81 (100.0%) | 89 (100.0%) |
Housing Structure by Heating Type in Savage
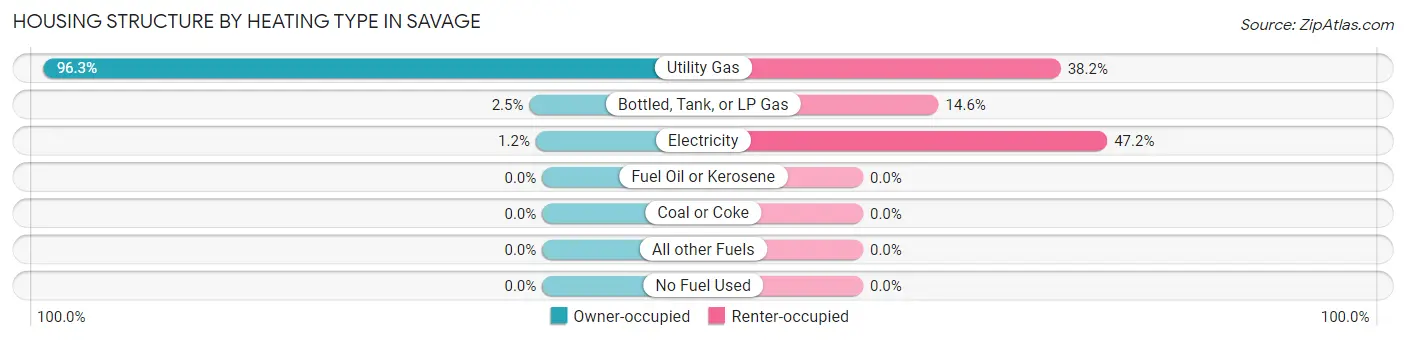
| Heating Type | Owner-occupied | Renter-occupied |
| Utility Gas | 78 (96.3%) | 34 (38.2%) |
| Bottled, Tank, or LP Gas | 2 (2.5%) | 13 (14.6%) |
| Electricity | 1 (1.2%) | 42 (47.2%) |
| Fuel Oil or Kerosene | 0 (0.0%) | 0 (0.0%) |
| Coal or Coke | 0 (0.0%) | 0 (0.0%) |
| All other Fuels | 0 (0.0%) | 0 (0.0%) |
| No Fuel Used | 0 (0.0%) | 0 (0.0%) |
| Total | 81 (100.0%) | 89 (100.0%) |
Household Vehicle Usage in Savage
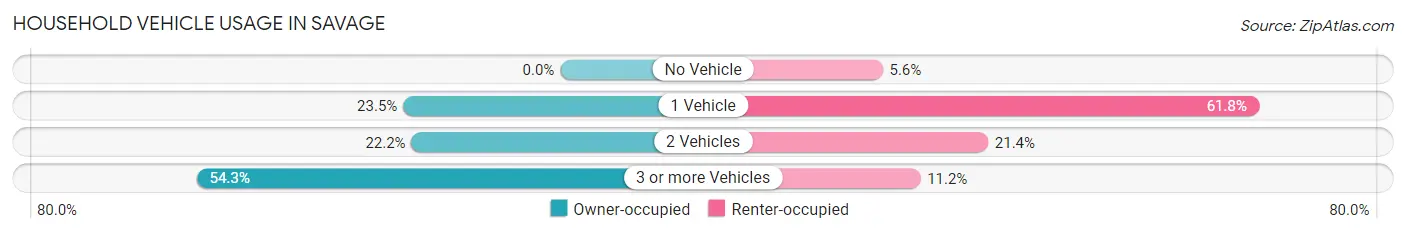
| Vehicles per Household | Owner-occupied | Renter-occupied |
| No Vehicle | 0 (0.0%) | 5 (5.6%) |
| 1 Vehicle | 19 (23.5%) | 55 (61.8%) |
| 2 Vehicles | 18 (22.2%) | 19 (21.3%) |
| 3 or more Vehicles | 44 (54.3%) | 10 (11.2%) |
| Total | 81 (100.0%) | 89 (100.0%) |
Real Estate & Mortgages in Savage
Real Estate and Mortgage Overview in Savage
| Characteristic | Without Mortgage | With Mortgage |
| Housing Units | 56 | 25 |
| Median Property Value | - | - |
| Median Household Income | $70,833 | $3 |
| Monthly Housing Costs | $375 | $0 |
| Real Estate Taxes | $1,042 | $0 |
Property Value by Mortgage Status in Savage
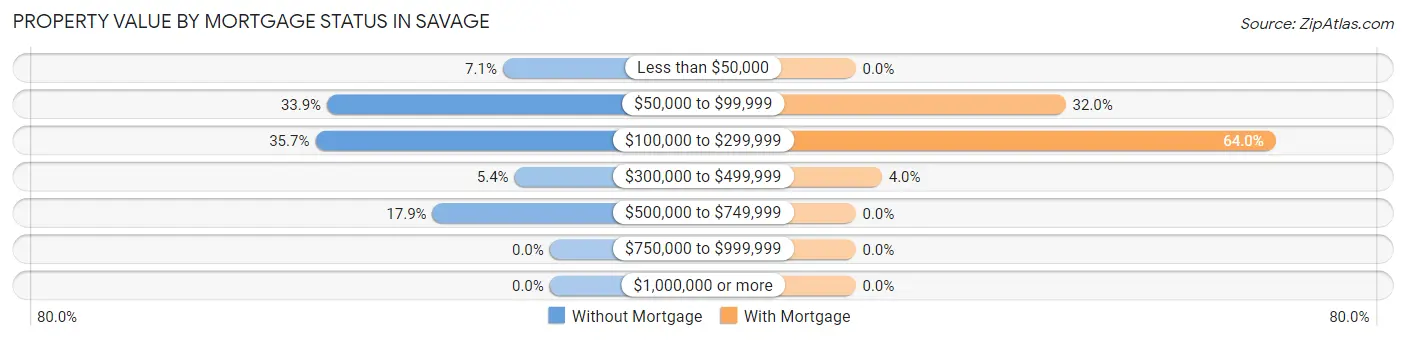
| Property Value | Without Mortgage | With Mortgage |
| Less than $50,000 | 4 (7.1%) | 0 (0.0%) |
| $50,000 to $99,999 | 19 (33.9%) | 8 (32.0%) |
| $100,000 to $299,999 | 20 (35.7%) | 16 (64.0%) |
| $300,000 to $499,999 | 3 (5.4%) | 1 (4.0%) |
| $500,000 to $749,999 | 10 (17.9%) | 0 (0.0%) |
| $750,000 to $999,999 | 0 (0.0%) | 0 (0.0%) |
| $1,000,000 or more | 0 (0.0%) | 0 (0.0%) |
| Total | 56 (100.0%) | 25 (100.0%) |
Household Income by Mortgage Status in Savage
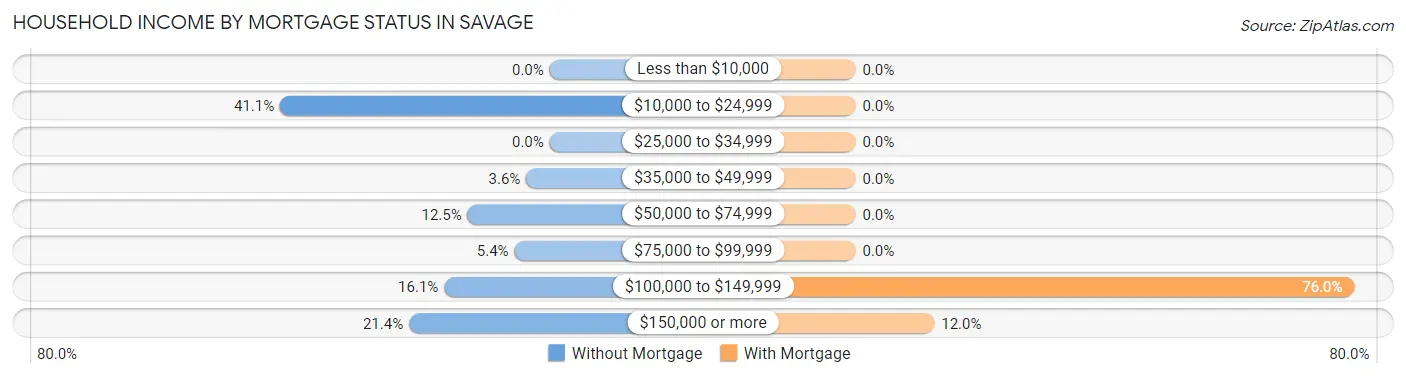
| Household Income | Without Mortgage | With Mortgage |
| Less than $10,000 | 0 (0.0%) | 0 (0.0%) |
| $10,000 to $24,999 | 23 (41.1%) | 0 (0.0%) |
| $25,000 to $34,999 | 0 (0.0%) | 0 (0.0%) |
| $35,000 to $49,999 | 2 (3.6%) | 0 (0.0%) |
| $50,000 to $74,999 | 7 (12.5%) | 0 (0.0%) |
| $75,000 to $99,999 | 3 (5.4%) | 0 (0.0%) |
| $100,000 to $149,999 | 9 (16.1%) | 19 (76.0%) |
| $150,000 or more | 12 (21.4%) | 3 (12.0%) |
| Total | 56 (100.0%) | 25 (100.0%) |
Property Value to Household Income Ratio in Savage
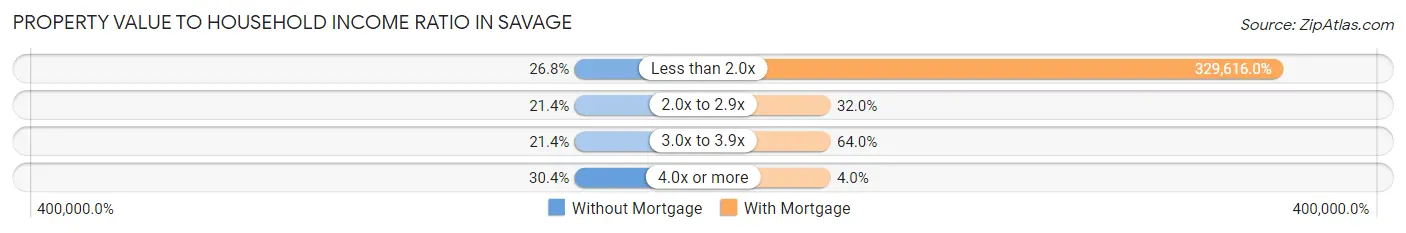
| Value-to-Income Ratio | Without Mortgage | With Mortgage |
| Less than 2.0x | 15 (26.8%) | 82,404 (329,616.0%) |
| 2.0x to 2.9x | 12 (21.4%) | 8 (32.0%) |
| 3.0x to 3.9x | 12 (21.4%) | 16 (64.0%) |
| 4.0x or more | 17 (30.4%) | 1 (4.0%) |
| Total | 56 (100.0%) | 25 (100.0%) |
Real Estate Taxes by Mortgage Status in Savage
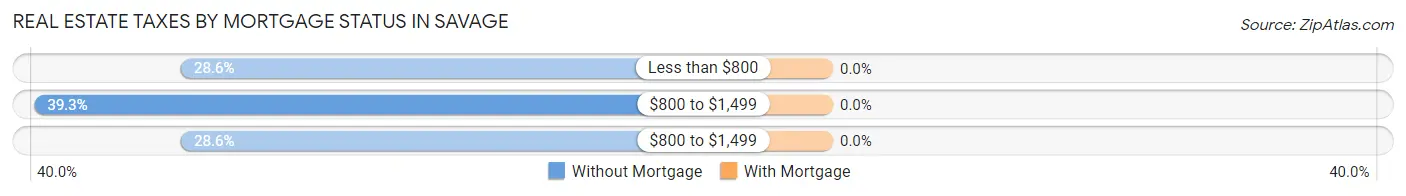
| Property Taxes | Without Mortgage | With Mortgage |
| Less than $800 | 16 (28.6%) | 0 (0.0%) |
| $800 to $1,499 | 22 (39.3%) | 0 (0.0%) |
| $800 to $1,499 | 16 (28.6%) | 0 (0.0%) |
| Total | 56 (100.0%) | 25 (100.0%) |
Health & Disability in Savage
Health Insurance Coverage by Age in Savage
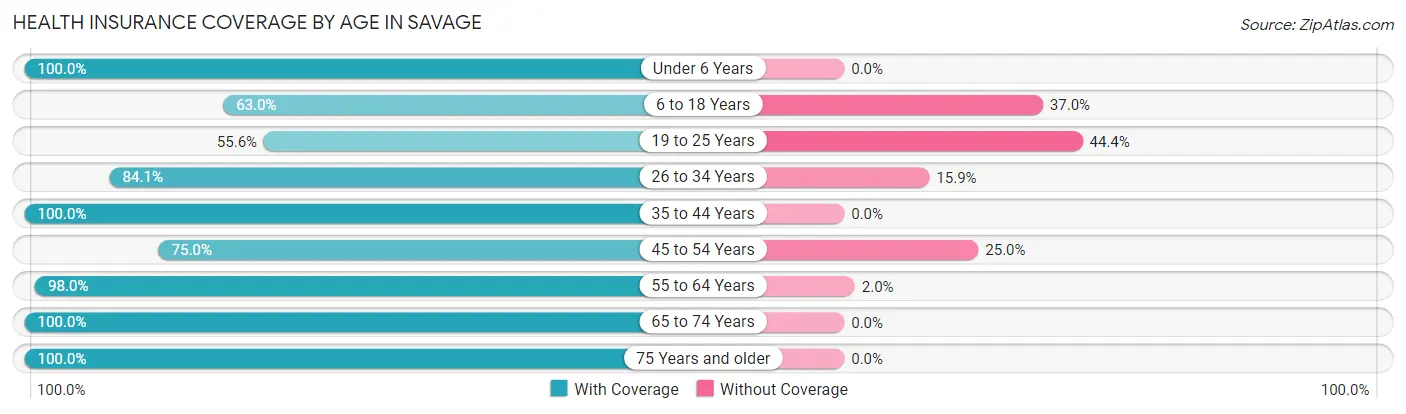
| Age Bracket | With Coverage | Without Coverage |
| Under 6 Years | 12 (100.0%) | 0 (0.0%) |
| 6 to 18 Years | 17 (63.0%) | 10 (37.0%) |
| 19 to 25 Years | 35 (55.6%) | 28 (44.4%) |
| 26 to 34 Years | 53 (84.1%) | 10 (15.9%) |
| 35 to 44 Years | 25 (100.0%) | 0 (0.0%) |
| 45 to 54 Years | 3 (75.0%) | 1 (25.0%) |
| 55 to 64 Years | 50 (98.0%) | 1 (2.0%) |
| 65 to 74 Years | 31 (100.0%) | 0 (0.0%) |
| 75 Years and older | 18 (100.0%) | 0 (0.0%) |
| Total | 244 (83.0%) | 50 (17.0%) |
Health Insurance Coverage by Citizenship Status in Savage
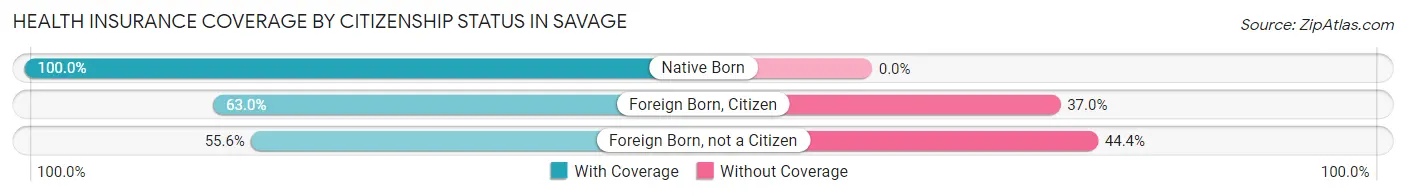
| Citizenship Status | With Coverage | Without Coverage |
| Native Born | 12 (100.0%) | 0 (0.0%) |
| Foreign Born, Citizen | 17 (63.0%) | 10 (37.0%) |
| Foreign Born, not a Citizen | 35 (55.6%) | 28 (44.4%) |
Health Insurance Coverage by Household Income in Savage
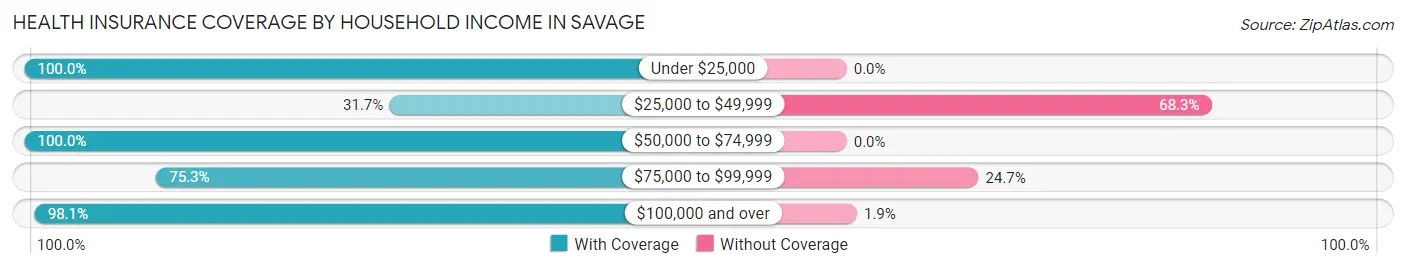
| Household Income | With Coverage | Without Coverage |
| Under $25,000 | 37 (100.0%) | 0 (0.0%) |
| $25,000 to $49,999 | 13 (31.7%) | 28 (68.3%) |
| $50,000 to $74,999 | 31 (100.0%) | 0 (0.0%) |
| $75,000 to $99,999 | 61 (75.3%) | 20 (24.7%) |
| $100,000 and over | 102 (98.1%) | 2 (1.9%) |
Public vs Private Health Insurance Coverage by Age in Savage
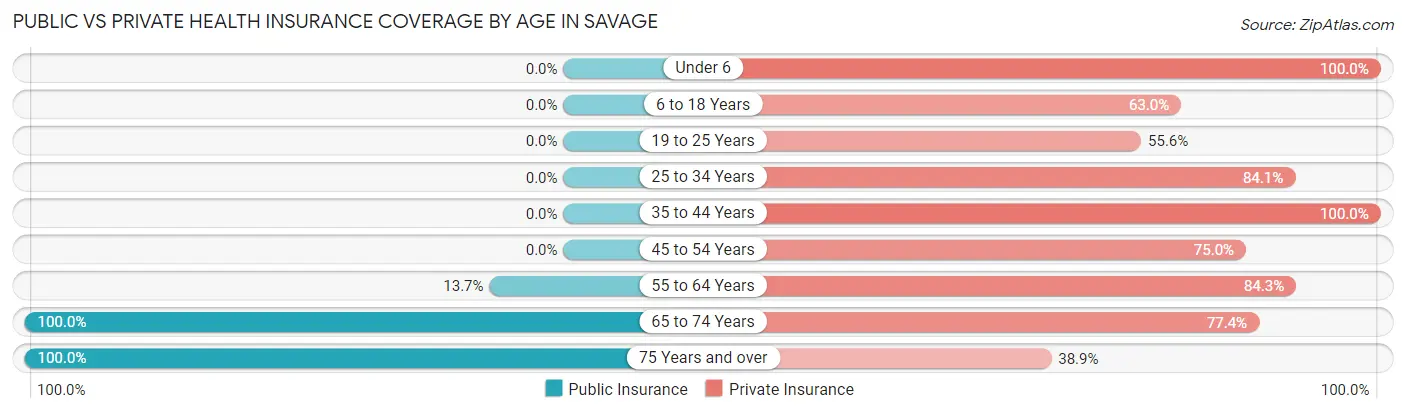
| Age Bracket | Public Insurance | Private Insurance |
| Under 6 | 0 (0.0%) | 12 (100.0%) |
| 6 to 18 Years | 0 (0.0%) | 17 (63.0%) |
| 19 to 25 Years | 0 (0.0%) | 35 (55.6%) |
| 25 to 34 Years | 0 (0.0%) | 53 (84.1%) |
| 35 to 44 Years | 0 (0.0%) | 25 (100.0%) |
| 45 to 54 Years | 0 (0.0%) | 3 (75.0%) |
| 55 to 64 Years | 7 (13.7%) | 43 (84.3%) |
| 65 to 74 Years | 31 (100.0%) | 24 (77.4%) |
| 75 Years and over | 18 (100.0%) | 7 (38.9%) |
| Total | 56 (19.1%) | 219 (74.5%) |
Disability Status by Sex by Age in Savage
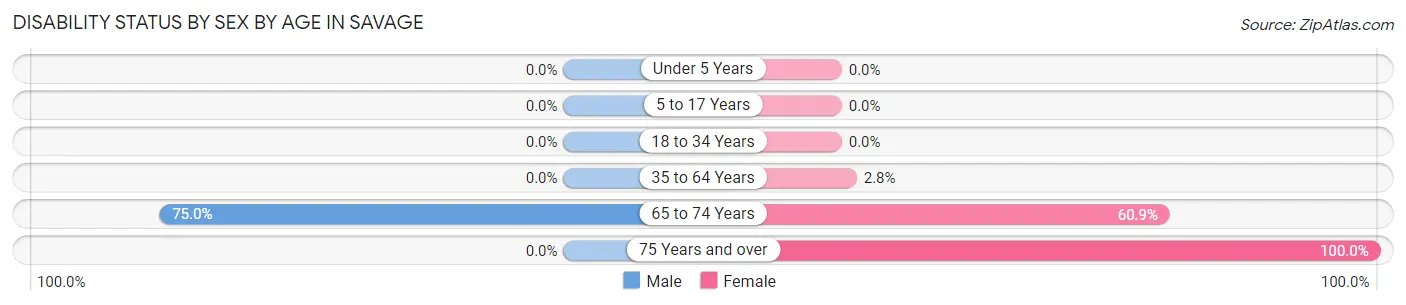
| Age Bracket | Male | Female |
| Under 5 Years | 0 (0.0%) | 0 (0.0%) |
| 5 to 17 Years | 0 (0.0%) | 0 (0.0%) |
| 18 to 34 Years | 0 (0.0%) | 0 (0.0%) |
| 35 to 64 Years | 0 (0.0%) | 1 (2.8%) |
| 65 to 74 Years | 6 (75.0%) | 14 (60.9%) |
| 75 Years and over | 0 (0.0%) | 16 (100.0%) |
Disability Class by Sex by Age in Savage
Disability Class: Hearing Difficulty
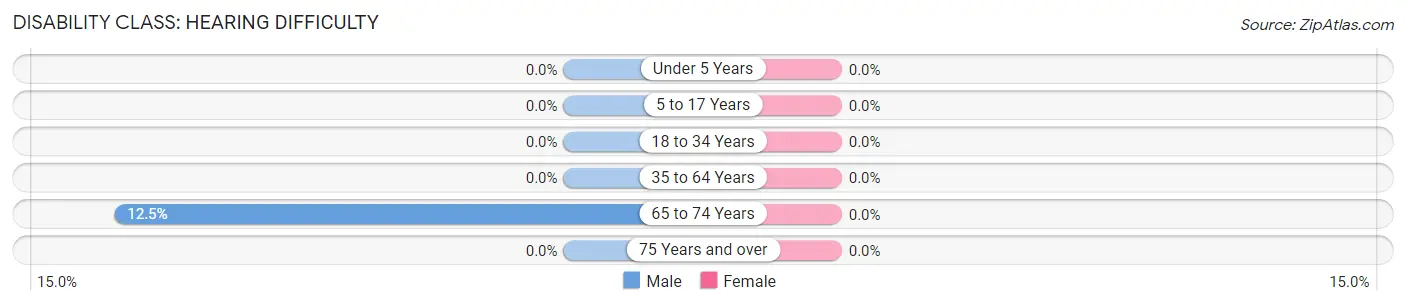
| Age Bracket | Male | Female |
| Under 5 Years | 0 (0.0%) | 0 (0.0%) |
| 5 to 17 Years | 0 (0.0%) | 0 (0.0%) |
| 18 to 34 Years | 0 (0.0%) | 0 (0.0%) |
| 35 to 64 Years | 0 (0.0%) | 0 (0.0%) |
| 65 to 74 Years | 1 (12.5%) | 0 (0.0%) |
| 75 Years and over | 0 (0.0%) | 0 (0.0%) |
Disability Class: Vision Difficulty
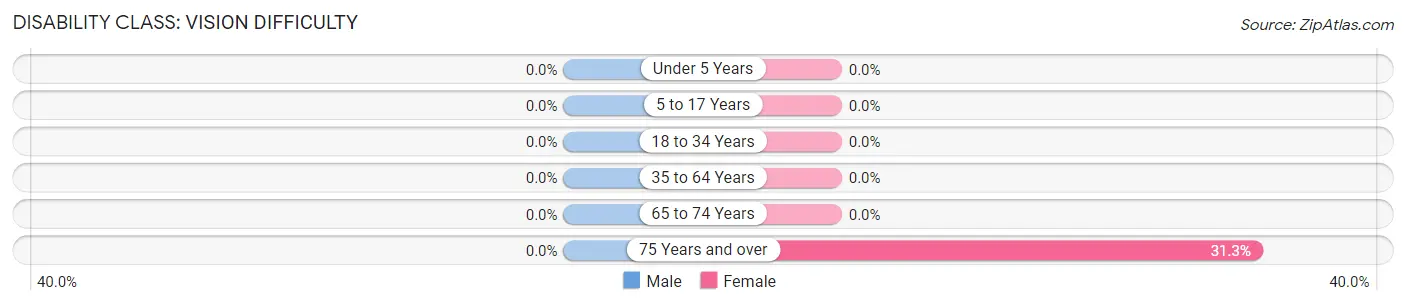
| Age Bracket | Male | Female |
| Under 5 Years | 0 (0.0%) | 0 (0.0%) |
| 5 to 17 Years | 0 (0.0%) | 0 (0.0%) |
| 18 to 34 Years | 0 (0.0%) | 0 (0.0%) |
| 35 to 64 Years | 0 (0.0%) | 0 (0.0%) |
| 65 to 74 Years | 0 (0.0%) | 0 (0.0%) |
| 75 Years and over | 0 (0.0%) | 5 (31.2%) |
Disability Class: Cognitive Difficulty
| Age Bracket | Male | Female |
| 5 to 17 Years | 0 (0.0%) | 0 (0.0%) |
| 18 to 34 Years | 0 (0.0%) | 0 (0.0%) |
| 35 to 64 Years | 0 (0.0%) | 0 (0.0%) |
| 65 to 74 Years | 0 (0.0%) | 0 (0.0%) |
| 75 Years and over | 0 (0.0%) | 0 (0.0%) |
Disability Class: Ambulatory Difficulty
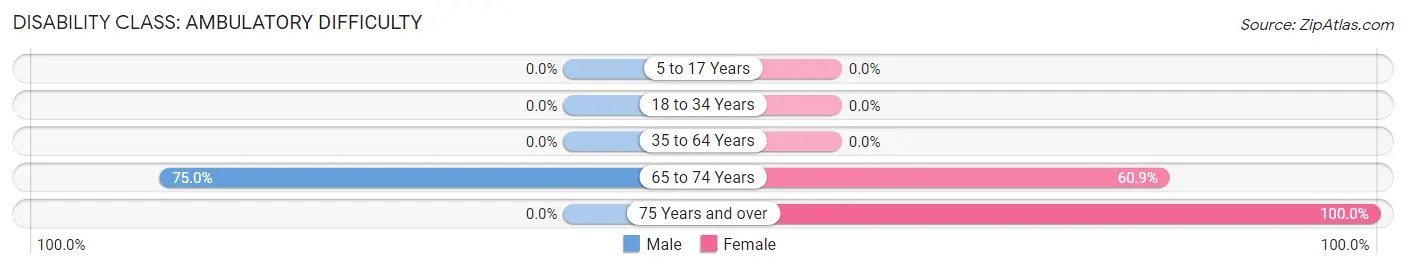
| Age Bracket | Male | Female |
| 5 to 17 Years | 0 (0.0%) | 0 (0.0%) |
| 18 to 34 Years | 0 (0.0%) | 0 (0.0%) |
| 35 to 64 Years | 0 (0.0%) | 0 (0.0%) |
| 65 to 74 Years | 6 (75.0%) | 14 (60.9%) |
| 75 Years and over | 0 (0.0%) | 16 (100.0%) |
Disability Class: Self-Care Difficulty
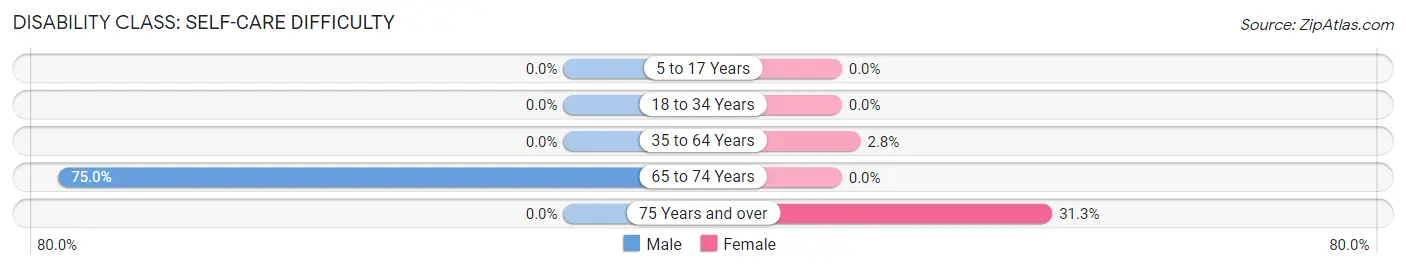
| Age Bracket | Male | Female |
| 5 to 17 Years | 0 (0.0%) | 0 (0.0%) |
| 18 to 34 Years | 0 (0.0%) | 0 (0.0%) |
| 35 to 64 Years | 0 (0.0%) | 1 (2.8%) |
| 65 to 74 Years | 6 (75.0%) | 0 (0.0%) |
| 75 Years and over | 0 (0.0%) | 5 (31.2%) |
Technology Access in Savage
Computing Device Access in Savage
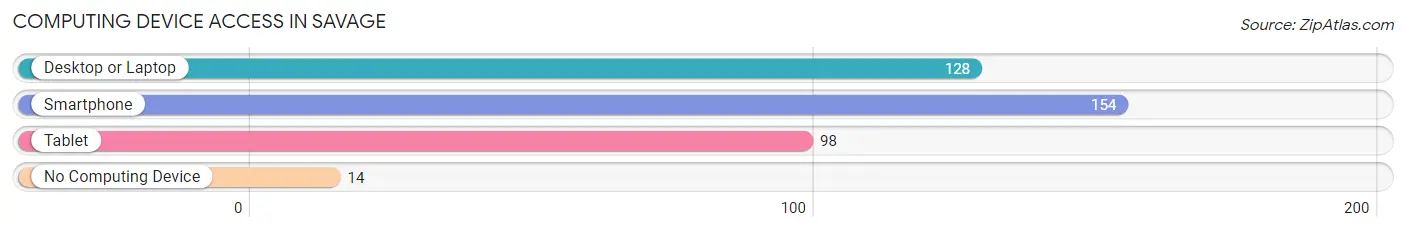
| Device Type | # Households | % Households |
| Desktop or Laptop | 128 | 75.3% |
| Smartphone | 154 | 90.6% |
| Tablet | 98 | 57.7% |
| No Computing Device | 14 | 8.2% |
| Total | 170 | 100.0% |
Internet Access in Savage
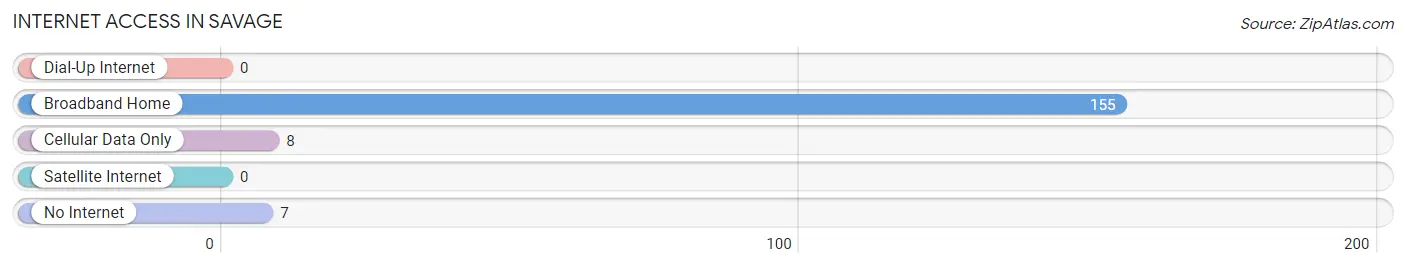
| Internet Type | # Households | % Households |
| Dial-Up Internet | 0 | 0.0% |
| Broadband Home | 155 | 91.2% |
| Cellular Data Only | 8 | 4.7% |
| Satellite Internet | 0 | 0.0% |
| No Internet | 7 | 4.1% |
| Total | 170 | 100.0% |
Savage Summary
Savage, Montana is a small town located in the western part of the state, near the border of Idaho. It is situated in the Flathead Valley, a region of the Rocky Mountains known for its stunning scenery and outdoor recreation opportunities. The town has a population of just over 1,000 people and is the county seat of Mineral County.
History
Savage was founded in 1883 by a group of miners who were looking for gold in the area. The town was named after a prospector named John Savage, who was one of the first to settle in the area. The town quickly grew and by the early 1900s, it had become a bustling center of commerce and industry. The town was home to several businesses, including a sawmill, a flour mill, a hotel, and a general store.
In the early 1900s, the town was also home to a large Chinese population. The Chinese immigrants had come to the area to work in the mines and on the railroads. They established a Chinatown in the town and built several businesses, including a laundry, a restaurant, and a grocery store.
Geography
Savage is located in the western part of Montana, near the border of Idaho. It is situated in the Flathead Valley, a region of the Rocky Mountains known for its stunning scenery and outdoor recreation opportunities. The town is surrounded by mountains and is located near several lakes, including Flathead Lake, which is the largest natural freshwater lake in the western United States.
The town is located at an elevation of 4,000 feet and has a semi-arid climate. Summers are warm and dry, while winters are cold and snowy. The average annual temperature is around 45 degrees Fahrenheit.
Economy
Savage’s economy is largely based on tourism and outdoor recreation. The town is home to several businesses, including restaurants, hotels, and retail stores. The town is also home to several outdoor recreation companies, which offer guided tours and activities such as fishing, hunting, and hiking.
The town is also home to several mining operations, which are responsible for much of the town’s economic activity. The mines produce copper, gold, and silver, which are then shipped to other parts of the country.
Demographics
As of the 2010 census, the population of Savage was 1,072. The town is predominantly white, with a small minority population. The median household income is $37,000, and the median age is 44. The town is home to several churches, including the Church of Jesus Christ of Latter-day Saints, the Catholic Church, and the United Methodist Church.
Common Questions
What is Per Capita Income in Savage?
Per Capita income in Savage is $46,177.
What is the Median Family Income in Savage?
Median Family Income in Savage is $105,096.
What is the Median Household income in Savage?
Median Household Income in Savage is $78,750.
What is Income or Wage Gap in Savage?
Income or Wage Gap in Savage is 70.5%.
Women in Savage earn 29.5 cents for every dollar earned by a man.
What is Inequality or Gini Index in Savage?
Inequality or Gini Index in Savage is 0.40.
What is the Total Population of Savage?
Total Population of Savage is 294.
What is the Total Male Population of Savage?
Total Male Population of Savage is 121.
What is the Total Female Population of Savage?
Total Female Population of Savage is 173.
What is the Ratio of Males per 100 Females in Savage?
There are 69.94 Males per 100 Females in Savage.
What is the Ratio of Females per 100 Males in Savage?
There are 142.98 Females per 100 Males in Savage.
What is the Median Population Age in Savage?
Median Population Age in Savage is 31.1 Years.
What is the Average Family Size in Savage
Average Family Size in Savage is 2.2 People.
What is the Average Household Size in Savage
Average Household Size in Savage is 1.7 People.
How Large is the Labor Force in Savage?
There are 206 People in the Labor Forcein in Savage.
What is the Percentage of People in the Labor Force in Savage?
80.2% of People are in the Labor Force in Savage.
What is the Unemployment Rate in Savage?
Unemployment Rate in Savage is 4.4%.