Hysham, MT Map & Demographics
Hysham Map
Hysham Overview
$34,720
PER CAPITA INCOME
$66,250
AVG FAMILY INCOME
$43,906
AVG HOUSEHOLD INCOME
0.47
INEQUALITY / GINI INDEX
232
TOTAL POPULATION
120
MALE POPULATION
112
FEMALE POPULATION
107.14
MALES / 100 FEMALES
93.33
FEMALES / 100 MALES
54.8
MEDIAN AGE
2.3
AVG FAMILY SIZE
2.0
AVG HOUSEHOLD SIZE
107
LABOR FORCE [ PEOPLE ]
55.4%
PERCENT IN LABOR FORCE
3.7%
UNEMPLOYMENT RATE
Hysham Zip Codes
Hysham Area Codes
Income in Hysham
Income Overview in Hysham
Per Capita Income in Hysham is $34,720, while median incomes of families and households are $66,250 and $43,906 respectively.
| Characteristic | Number | Measure |
| Per Capita Income | 232 | $34,720 |
| Median Family Income | 80 | $66,250 |
| Mean Family Income | 80 | $71,029 |
| Median Household Income | 117 | $43,906 |
| Mean Household Income | 117 | $71,599 |
| Income Deficit | 80 | $0 |
| Wage / Income Gap (%) | 232 | 0.00% |
| Wage / Income Gap ($) | 232 | 100.00¢ per $1 |
| Gini / Inequality Index | 232 | 0.47 |
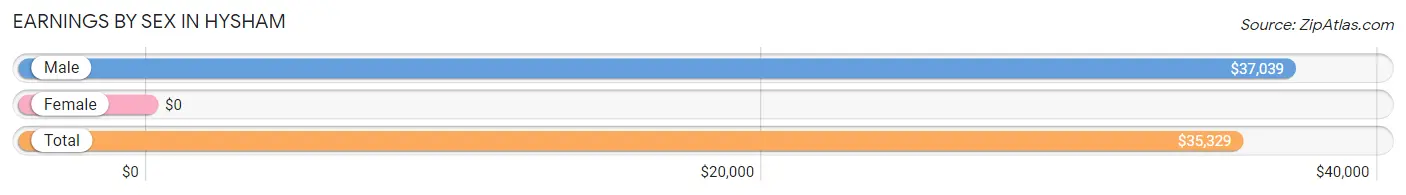
Earnings by Sex in Hysham
| Sex | Number | Average Earnings |
| Male | 85 (66.9%) | $37,039 |
| Female | 42 (33.1%) | $0 |
| Total | 127 (100.0%) | $35,329 |
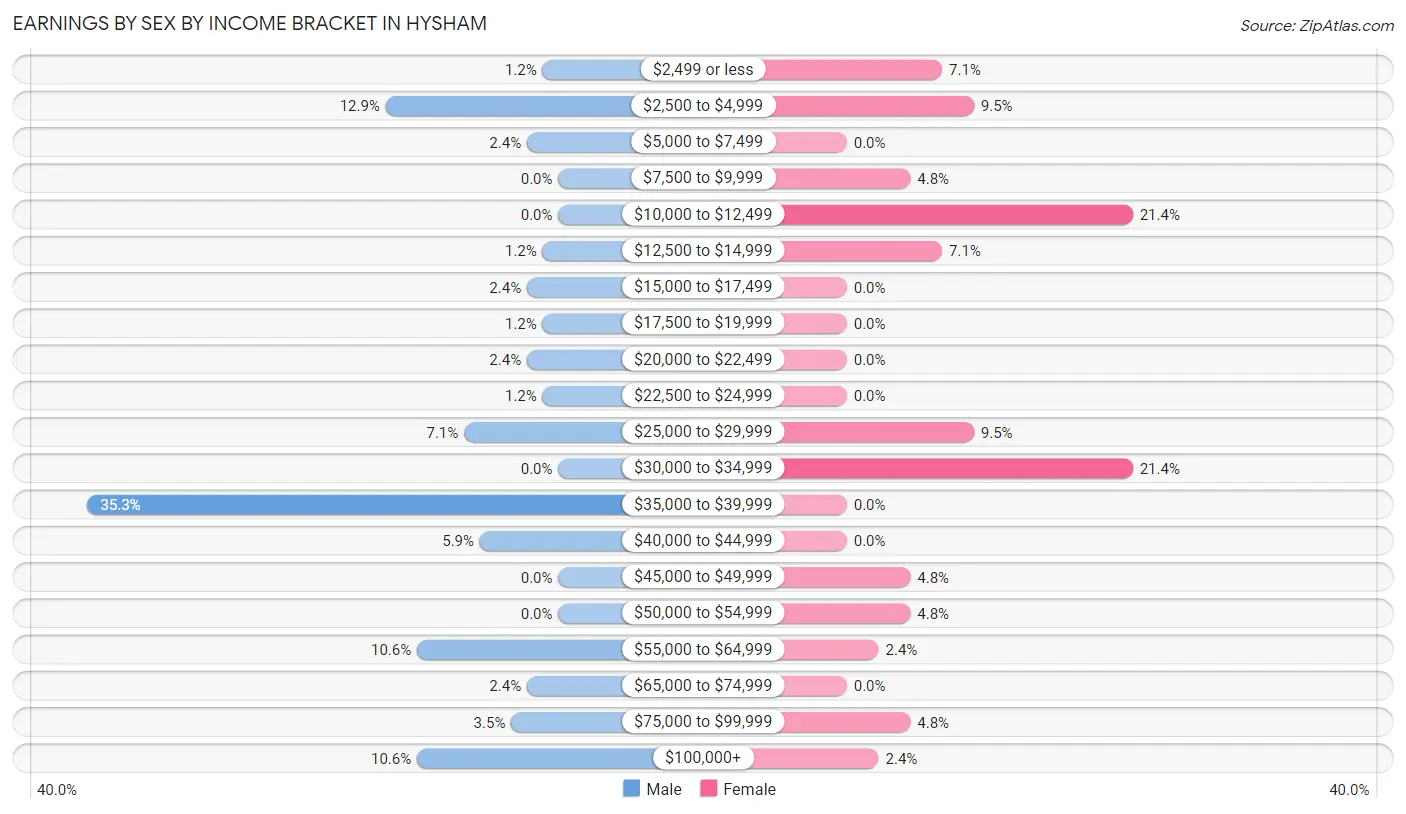
Earnings by Sex by Income Bracket in Hysham
The most common earnings brackets in Hysham are $35,000 to $39,999 for men (30 | 35.3%) and $10,000 to $12,499 for women (9 | 21.4%).
| Income | Male | Female |
| $2,499 or less | 1 (1.2%) | 3 (7.1%) |
| $2,500 to $4,999 | 11 (12.9%) | 4 (9.5%) |
| $5,000 to $7,499 | 2 (2.4%) | 0 (0.0%) |
| $7,500 to $9,999 | 0 (0.0%) | 2 (4.8%) |
| $10,000 to $12,499 | 0 (0.0%) | 9 (21.4%) |
| $12,500 to $14,999 | 1 (1.2%) | 3 (7.1%) |
| $15,000 to $17,499 | 2 (2.4%) | 0 (0.0%) |
| $17,500 to $19,999 | 1 (1.2%) | 0 (0.0%) |
| $20,000 to $22,499 | 2 (2.4%) | 0 (0.0%) |
| $22,500 to $24,999 | 1 (1.2%) | 0 (0.0%) |
| $25,000 to $29,999 | 6 (7.1%) | 4 (9.5%) |
| $30,000 to $34,999 | 0 (0.0%) | 9 (21.4%) |
| $35,000 to $39,999 | 30 (35.3%) | 0 (0.0%) |
| $40,000 to $44,999 | 5 (5.9%) | 0 (0.0%) |
| $45,000 to $49,999 | 0 (0.0%) | 2 (4.8%) |
| $50,000 to $54,999 | 0 (0.0%) | 2 (4.8%) |
| $55,000 to $64,999 | 9 (10.6%) | 1 (2.4%) |
| $65,000 to $74,999 | 2 (2.4%) | 0 (0.0%) |
| $75,000 to $99,999 | 3 (3.5%) | 2 (4.8%) |
| $100,000+ | 9 (10.6%) | 1 (2.4%) |
| Total | 85 (100.0%) | 42 (100.0%) |
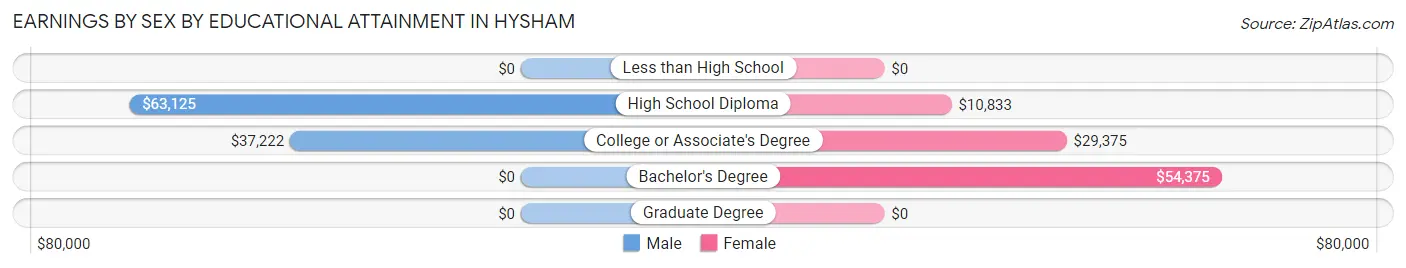
Earnings by Sex by Educational Attainment in Hysham
Average earnings in Hysham are $37,955 for men and $28,750 for women, a difference of 24.2%. Men with an educational attainment of high school diploma enjoy the highest average annual earnings of $63,125, while those with college or associate's degree education earn the least with $37,222. Women with an educational attainment of bachelor's degree earn the most with the average annual earnings of $54,375, while those with high school diploma education have the smallest earnings of $10,833.
| Educational Attainment | Male Income | Female Income |
| Less than High School | - | - |
| High School Diploma | $63,125 | $10,833 |
| College or Associate's Degree | $37,222 | $29,375 |
| Bachelor's Degree | - | - |
| Graduate Degree | - | - |
| Total | $37,955 | $28,750 |
Family Income in Hysham
Family Income Brackets in Hysham
According to the Hysham family income data, there are 23 families falling into the $75,000 to $99,999 income range, which is the most common income bracket and makes up 28.7% of all families.
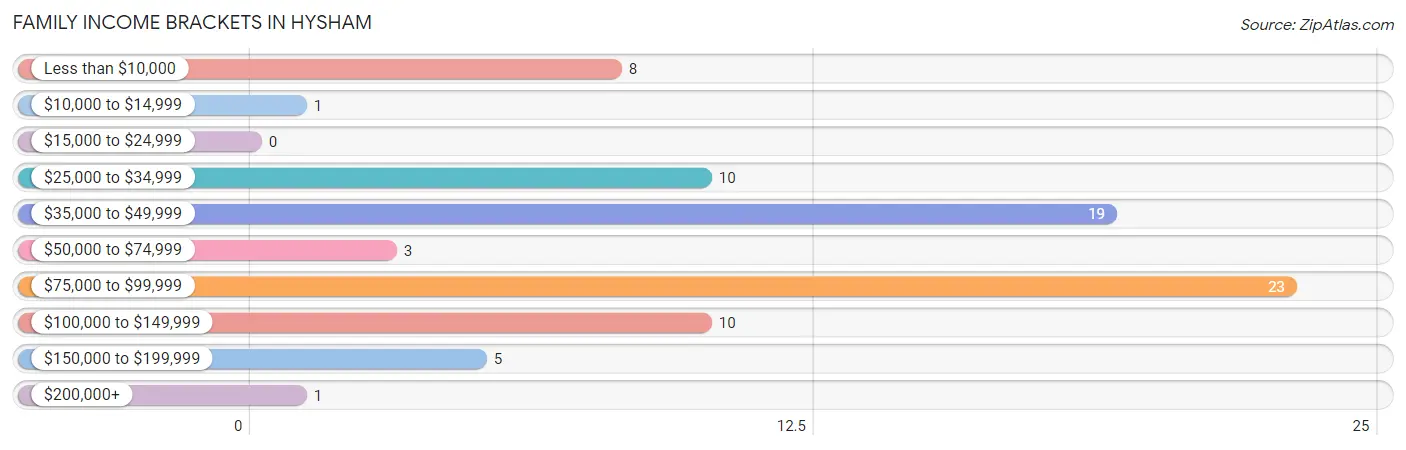
| Income Bracket | # Families | % Families |
| Less than $10,000 | 8 | 10.0% |
| $10,000 to $14,999 | 1 | 1.3% |
| $15,000 to $24,999 | 0 | 0.0% |
| $25,000 to $34,999 | 10 | 12.5% |
| $35,000 to $49,999 | 19 | 23.8% |
| $50,000 to $74,999 | 3 | 3.8% |
| $75,000 to $99,999 | 23 | 28.8% |
| $100,000 to $149,999 | 10 | 12.5% |
| $150,000 to $199,999 | 5 | 6.3% |
| $200,000+ | 1 | 1.3% |
Family Income by Famaliy Size in Hysham
2-person families (48 | 60.0%) account for the highest median family income in Hysham with $79,167 per family, while 2-person families (48 | 60.0%) have the highest median income of $39,584 per family member.
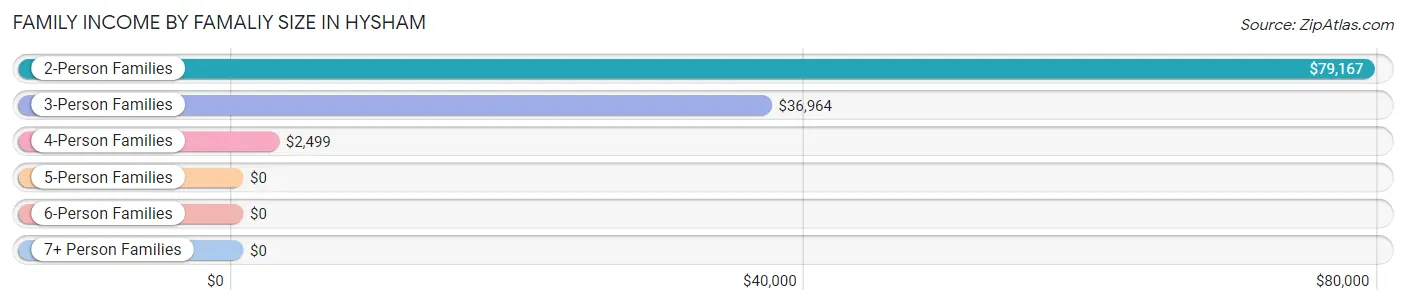
| Income Bracket | # Families | Median Income |
| 2-Person Families | 48 (60.0%) | $79,167 |
| 3-Person Families | 11 (13.8%) | $36,964 |
| 4-Person Families | 10 (12.5%) | $2,499 |
| 5-Person Families | 1 (1.3%) | $0 |
| 6-Person Families | 10 (12.5%) | $0 |
| 7+ Person Families | 0 (0.0%) | $0 |
| Total | 80 (100.0%) | $66,250 |
Family Income by Number of Earners in Hysham
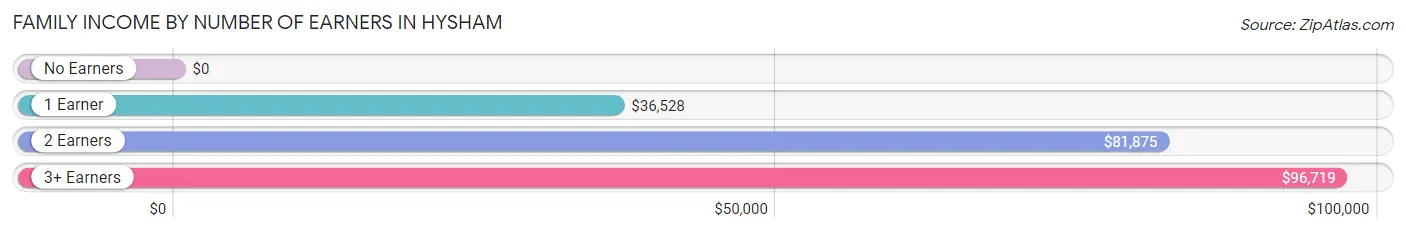
| Number of Earners | # Families | Median Income |
| No Earners | 17 (21.2%) | $0 |
| 1 Earner | 19 (23.7%) | $36,528 |
| 2 Earners | 33 (41.2%) | $81,875 |
| 3+ Earners | 11 (13.8%) | $96,719 |
| Total | 80 (100.0%) | $66,250 |
Household Income in Hysham
Household Income Brackets in Hysham
With 33 households falling in the category, the $35,000 to $49,999 income range is the most frequent in Hysham, accounting for 28.2% of all households.
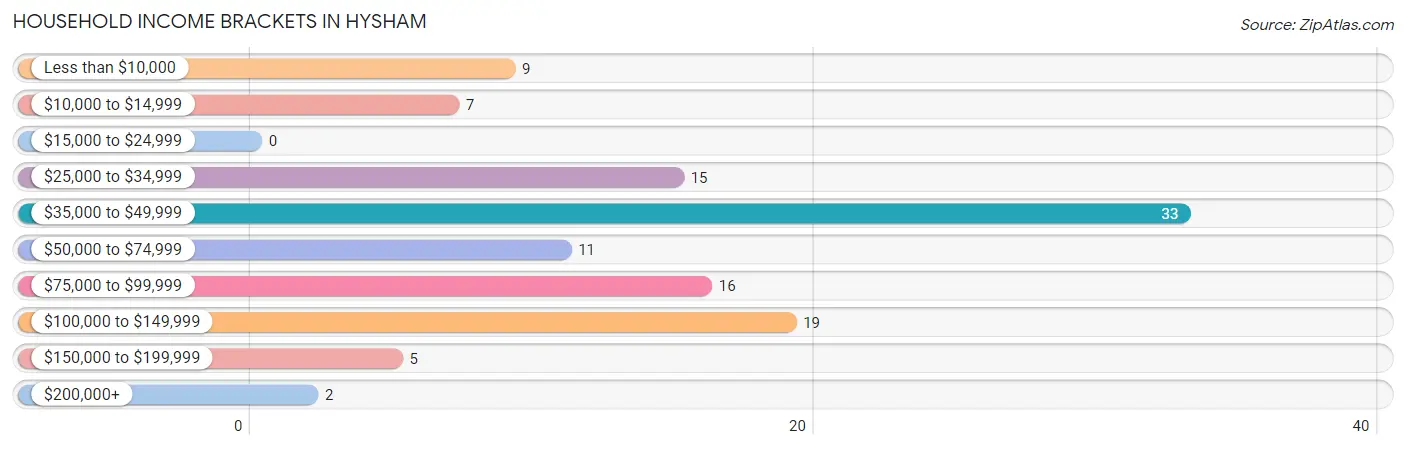
| Income Bracket | # Households | % Households |
| Less than $10,000 | 9 | 7.7% |
| $10,000 to $14,999 | 7 | 6.0% |
| $15,000 to $24,999 | 0 | 0.0% |
| $25,000 to $34,999 | 15 | 12.8% |
| $35,000 to $49,999 | 33 | 28.2% |
| $50,000 to $74,999 | 11 | 9.4% |
| $75,000 to $99,999 | 16 | 13.7% |
| $100,000 to $149,999 | 19 | 16.2% |
| $150,000 to $199,999 | 5 | 4.3% |
| $200,000+ | 2 | 1.7% |
Household Income by Householder Age in Hysham
The median household income in Hysham is $43,906, with the highest median household income of $88,750 found in the 45 to 64 years age bracket for the primary householder. A total of 46 households (39.3%) fall into this category. Meanwhile, the 15 to 24 years age bracket for the primary householder has the lowest median household income of $0, with 4 households (3.4%) in this group.
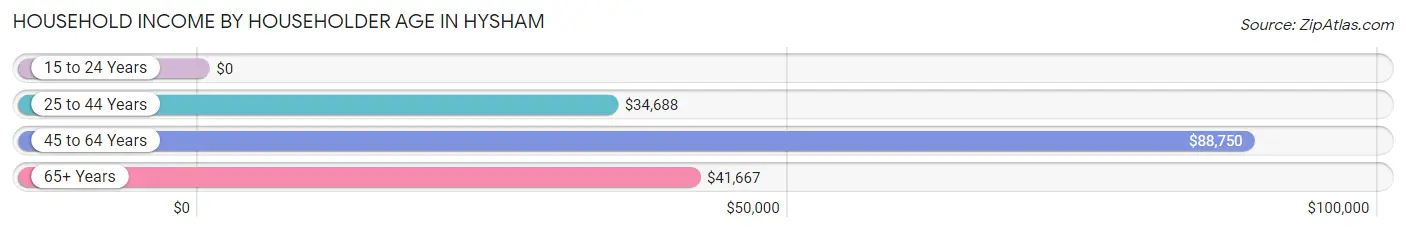
| Income Bracket | # Households | Median Income |
| 15 to 24 Years | 4 (3.4%) | $0 |
| 25 to 44 Years | 27 (23.1%) | $34,688 |
| 45 to 64 Years | 46 (39.3%) | $88,750 |
| 65+ Years | 40 (34.2%) | $41,667 |
| Total | 117 (100.0%) | $43,906 |
Poverty in Hysham
Income Below Poverty by Sex and Age in Hysham
With 10.8% poverty level for males and 25.9% for females among the residents of Hysham, 35 to 44 year old males and 35 to 44 year old females are the most vulnerable to poverty, with 2 males (66.7%) and 9 females (90.0%) in their respective age groups living below the poverty level.
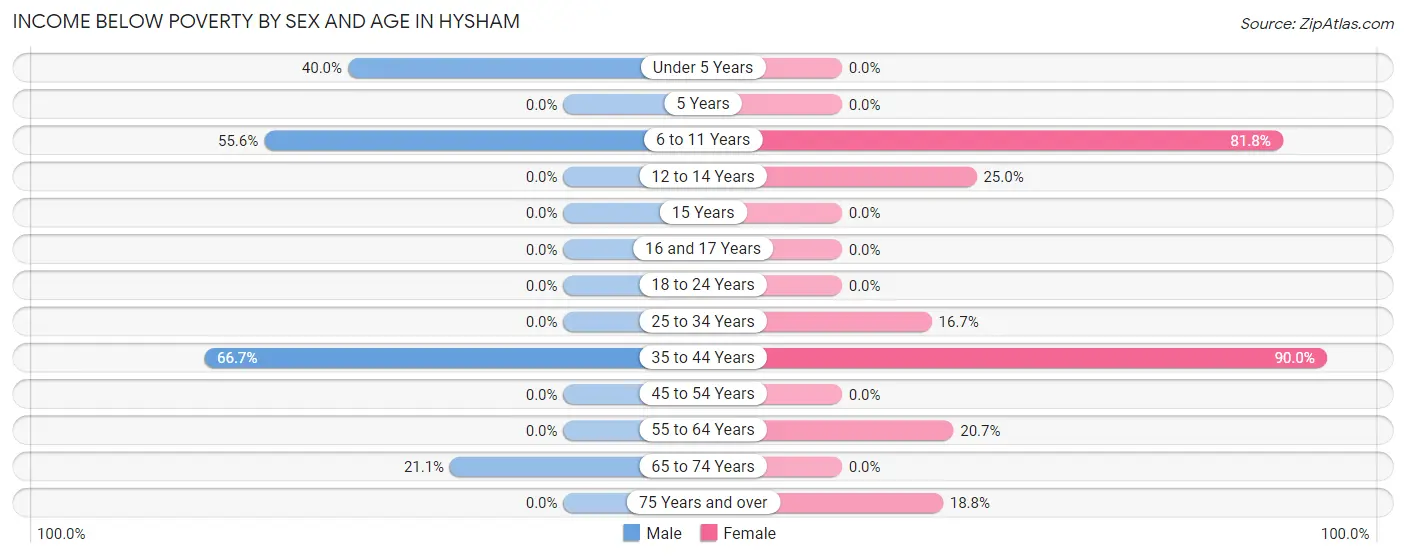
| Age Bracket | Male | Female |
| Under 5 Years | 2 (40.0%) | 0 (0.0%) |
| 5 Years | 0 (0.0%) | 0 (0.0%) |
| 6 to 11 Years | 5 (55.6%) | 9 (81.8%) |
| 12 to 14 Years | 0 (0.0%) | 1 (25.0%) |
| 15 Years | 0 (0.0%) | 0 (0.0%) |
| 16 and 17 Years | 0 (0.0%) | 0 (0.0%) |
| 18 to 24 Years | 0 (0.0%) | 0 (0.0%) |
| 25 to 34 Years | 0 (0.0%) | 1 (16.7%) |
| 35 to 44 Years | 2 (66.7%) | 9 (90.0%) |
| 45 to 54 Years | 0 (0.0%) | 0 (0.0%) |
| 55 to 64 Years | 0 (0.0%) | 6 (20.7%) |
| 65 to 74 Years | 4 (21.0%) | 0 (0.0%) |
| 75 Years and over | 0 (0.0%) | 3 (18.8%) |
| Total | 13 (10.8%) | 29 (25.9%) |
Income Above Poverty by Sex and Age in Hysham
According to the poverty statistics in Hysham, males aged 18 to 24 years and females aged under 5 years are the age groups that are most secure financially, with 100.0% of males and 100.0% of females in these age groups living above the poverty line.
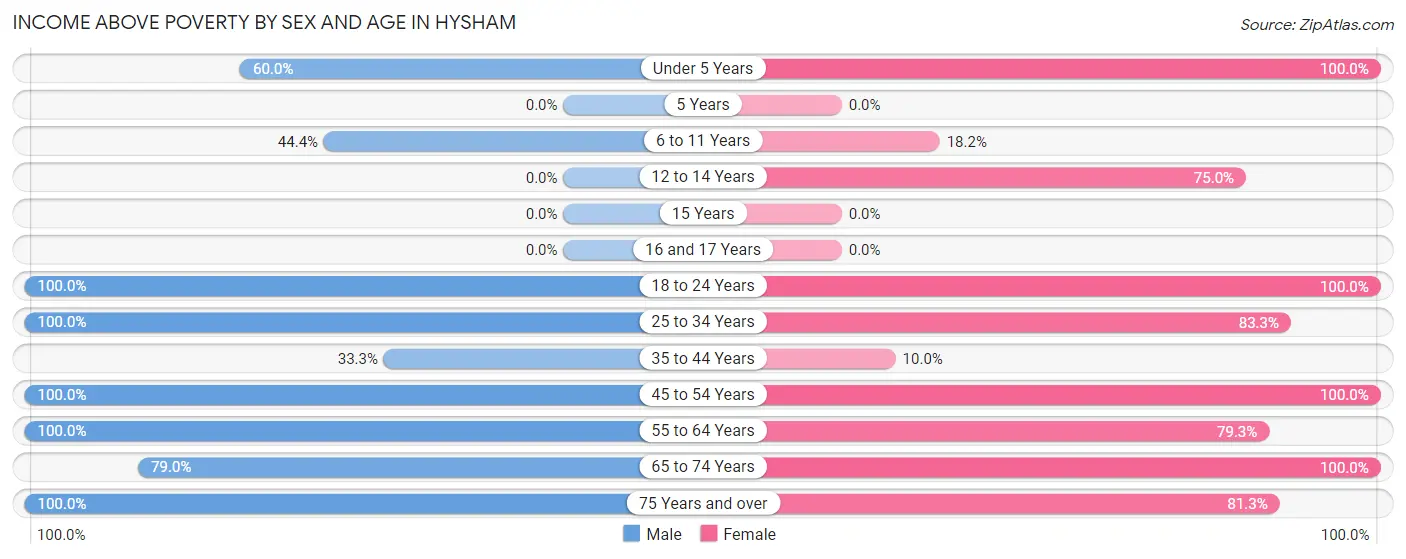
| Age Bracket | Male | Female |
| Under 5 Years | 3 (60.0%) | 10 (100.0%) |
| 5 Years | 0 (0.0%) | 0 (0.0%) |
| 6 to 11 Years | 4 (44.4%) | 2 (18.2%) |
| 12 to 14 Years | 0 (0.0%) | 3 (75.0%) |
| 15 Years | 0 (0.0%) | 0 (0.0%) |
| 16 and 17 Years | 0 (0.0%) | 0 (0.0%) |
| 18 to 24 Years | 13 (100.0%) | 4 (100.0%) |
| 25 to 34 Years | 16 (100.0%) | 5 (83.3%) |
| 35 to 44 Years | 1 (33.3%) | 1 (10.0%) |
| 45 to 54 Years | 20 (100.0%) | 7 (100.0%) |
| 55 to 64 Years | 21 (100.0%) | 23 (79.3%) |
| 65 to 74 Years | 15 (78.9%) | 15 (100.0%) |
| 75 Years and over | 14 (100.0%) | 13 (81.2%) |
| Total | 107 (89.2%) | 83 (74.1%) |
Income Below Poverty Among Married-Couple Families in Hysham
The poverty statistics for married-couple families in Hysham show that 1.9% or 1 of the total 52 families live below the poverty line. Families with 3 or 4 children have the highest poverty rate of 100.0%, comprising of 1 families. On the other hand, families with no children have the lowest poverty rate of 0.0%, which includes 0 families.
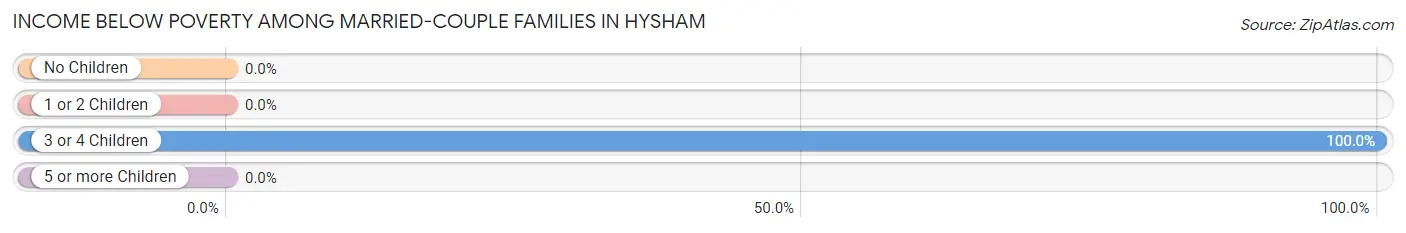
| Children | Above Poverty | Below Poverty |
| No Children | 48 (100.0%) | 0 (0.0%) |
| 1 or 2 Children | 3 (100.0%) | 0 (0.0%) |
| 3 or 4 Children | 0 (0.0%) | 1 (100.0%) |
| 5 or more Children | 0 (0.0%) | 0 (0.0%) |
| Total | 51 (98.1%) | 1 (1.9%) |
Income Below Poverty Among Single-Parent Households in Hysham
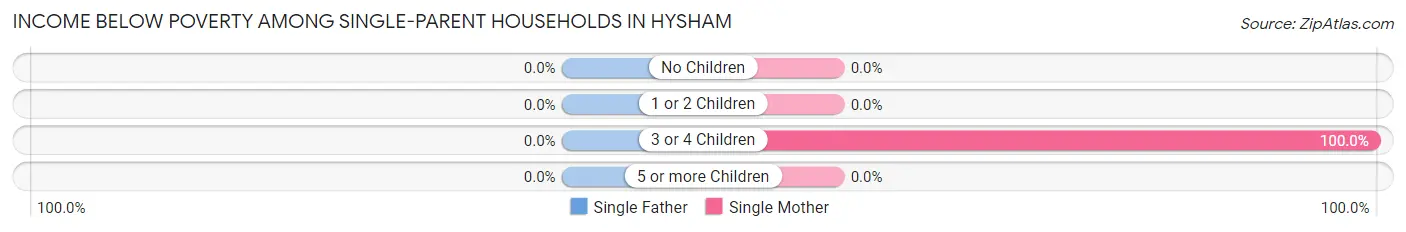
| Children | Single Father | Single Mother |
| No Children | 0 (0.0%) | 0 (0.0%) |
| 1 or 2 Children | 0 (0.0%) | 0 (0.0%) |
| 3 or 4 Children | 0 (0.0%) | 9 (100.0%) |
| 5 or more Children | 0 (0.0%) | 0 (0.0%) |
| Total | 0 (0.0%) | 9 (69.2%) |
Income Below Poverty Among Married-Couple vs Single-Parent Households in Hysham
The poverty data for Hysham shows that 1 of the married-couple family households (1.9%) and 9 of the single-parent households (32.1%) are living below the poverty level. Within the married-couple family households, those with 3 or 4 children have the highest poverty rate, with 1 households (100.0%) falling below the poverty line. Among the single-parent households, those with 3 or 4 children have the highest poverty rate, with 9 household (47.4%) living below poverty.
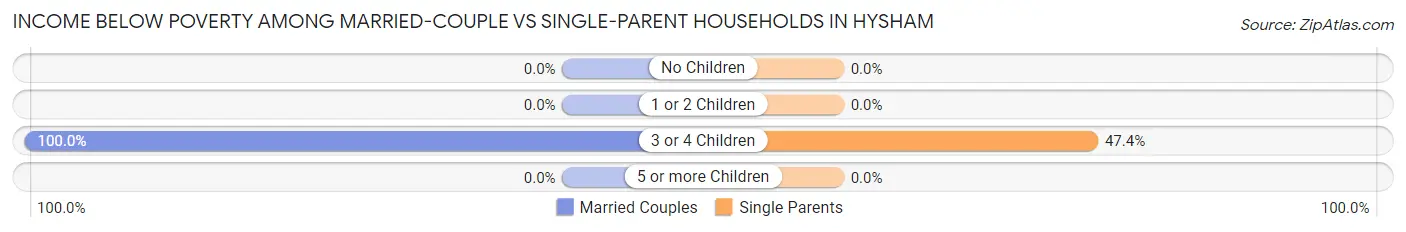
| Children | Married-Couple Families | Single-Parent Households |
| No Children | 0 (0.0%) | 0 (0.0%) |
| 1 or 2 Children | 0 (0.0%) | 0 (0.0%) |
| 3 or 4 Children | 1 (100.0%) | 9 (47.4%) |
| 5 or more Children | 0 (0.0%) | 0 (0.0%) |
| Total | 1 (1.9%) | 9 (32.1%) |
Race in Hysham
The most populous races in Hysham are White / Caucasian (207 | 89.2%), Hispanic or Latino (19 | 8.2%), and Two or more Races (11 | 4.7%).
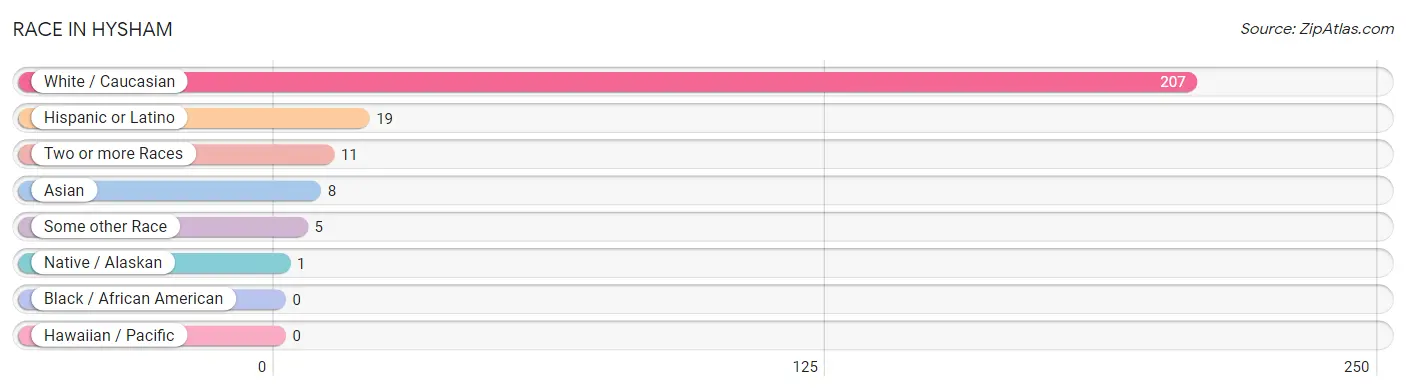
| Race | # Population | % Population |
| Asian | 8 | 3.5% |
| Black / African American | 0 | 0.0% |
| Hawaiian / Pacific | 0 | 0.0% |
| Hispanic or Latino | 19 | 8.2% |
| Native / Alaskan | 1 | 0.4% |
| White / Caucasian | 207 | 89.2% |
| Two or more Races | 11 | 4.7% |
| Some other Race | 5 | 2.2% |
| Total | 232 | 100.0% |
Ancestry in Hysham
The most populous ancestries reported in Hysham are German (77 | 33.2%), Norwegian (36 | 15.5%), Irish (31 | 13.4%), English (22 | 9.5%), and Korean (19 | 8.2%), together accounting for 79.7% of all Hysham residents.
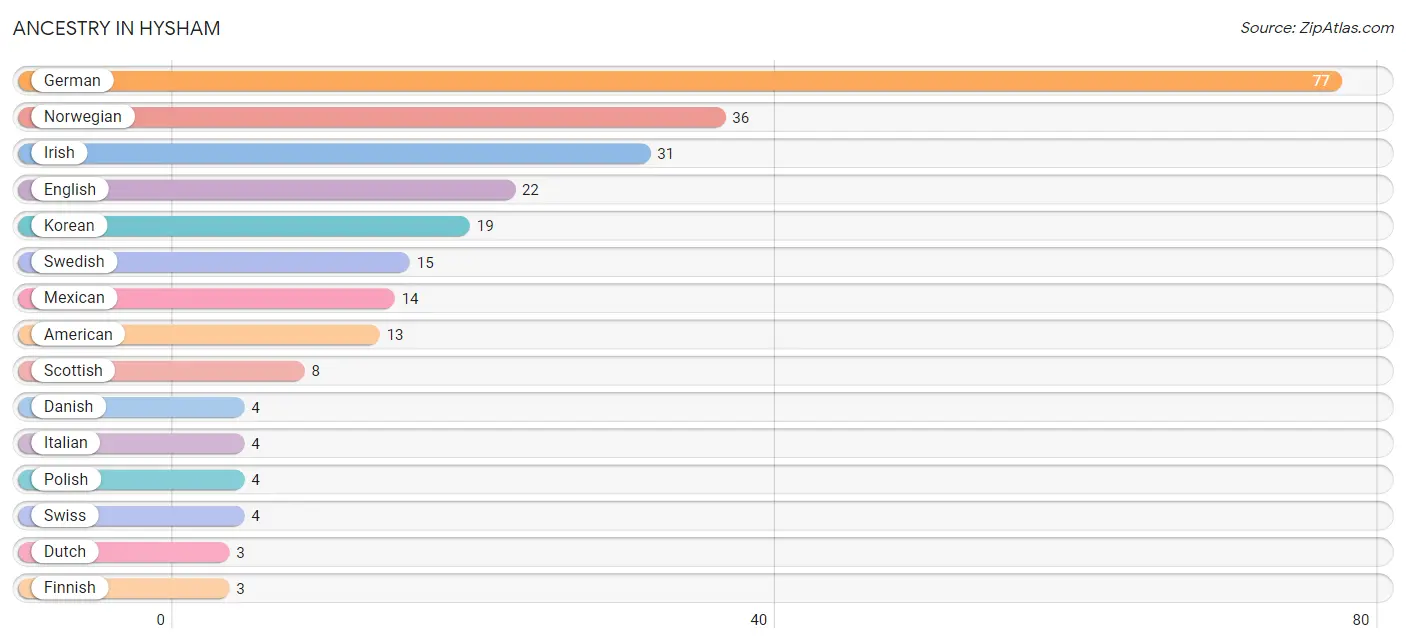
| Ancestry | # Population | % Population |
| American | 13 | 5.6% |
| Belgian | 2 | 0.9% |
| Danish | 4 | 1.7% |
| Dutch | 3 | 1.3% |
| English | 22 | 9.5% |
| Finnish | 3 | 1.3% |
| French | 3 | 1.3% |
| German | 77 | 33.2% |
| Irish | 31 | 13.4% |
| Italian | 4 | 1.7% |
| Korean | 19 | 8.2% |
| Mexican | 14 | 6.0% |
| Norwegian | 36 | 15.5% |
| Polish | 4 | 1.7% |
| Russian | 1 | 0.4% |
| Scotch-Irish | 1 | 0.4% |
| Scottish | 8 | 3.5% |
| Swedish | 15 | 6.5% |
| Swiss | 4 | 1.7% | View All 19 Rows |
Immigrants in Hysham
The most numerous immigrant groups reported in Hysham came from Asia (8 | 3.5%), Philippines (8 | 3.5%), and South Eastern Asia (8 | 3.5%), together accounting for 10.4% of all Hysham residents.
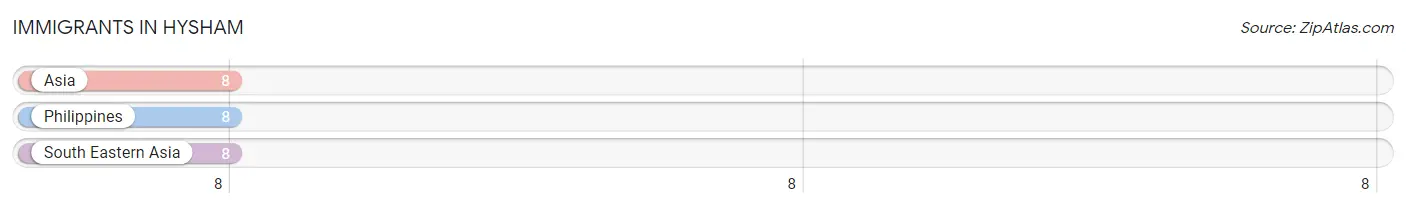
| Immigration Origin | # Population | % Population |
| Asia | 8 | 3.5% |
| Philippines | 8 | 3.5% |
| South Eastern Asia | 8 | 3.5% | View All 3 Rows |
Sex and Age in Hysham
Sex and Age in Hysham
The most populous age groups in Hysham are 50 to 54 Years (19 | 15.8%) for men and 60 to 64 Years (25 | 22.3%) for women.
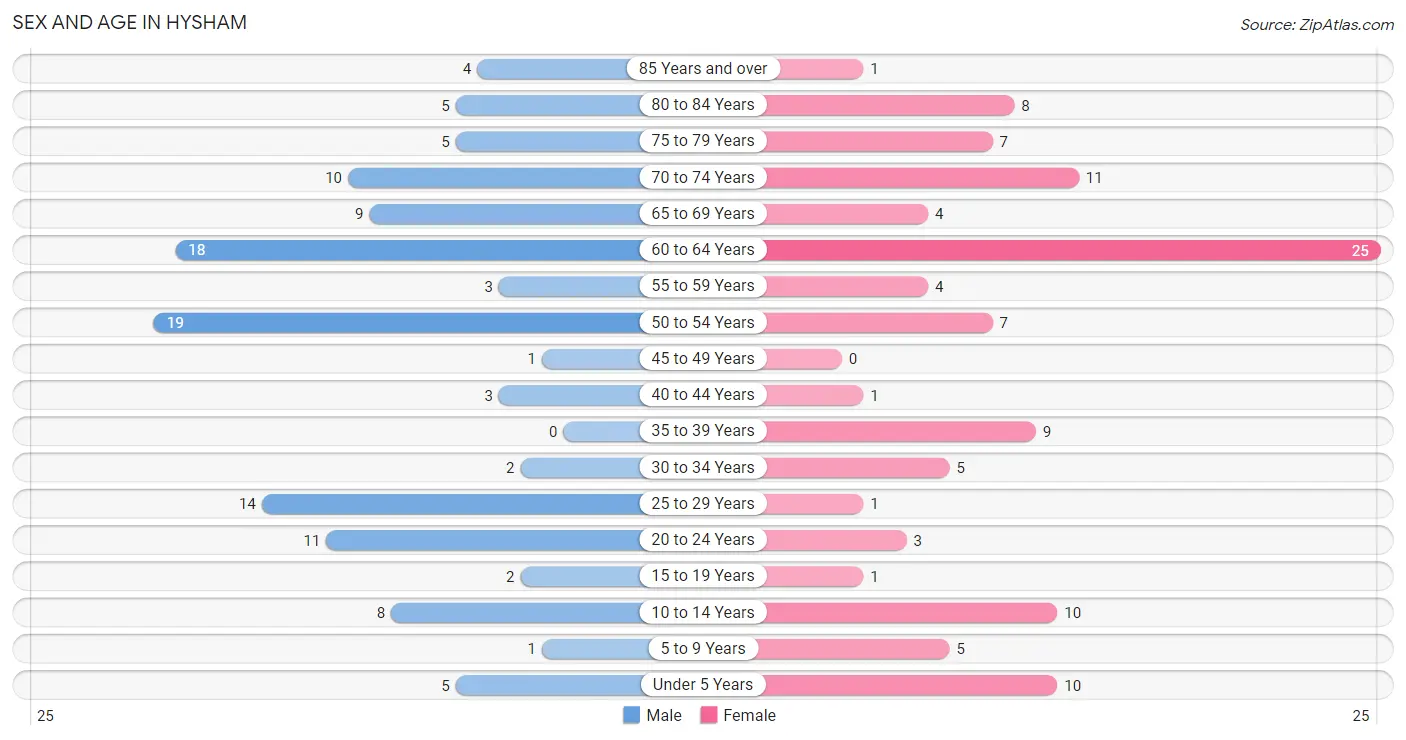
| Age Bracket | Male | Female |
| Under 5 Years | 5 (4.2%) | 10 (8.9%) |
| 5 to 9 Years | 1 (0.8%) | 5 (4.5%) |
| 10 to 14 Years | 8 (6.7%) | 10 (8.9%) |
| 15 to 19 Years | 2 (1.7%) | 1 (0.9%) |
| 20 to 24 Years | 11 (9.2%) | 3 (2.7%) |
| 25 to 29 Years | 14 (11.7%) | 1 (0.9%) |
| 30 to 34 Years | 2 (1.7%) | 5 (4.5%) |
| 35 to 39 Years | 0 (0.0%) | 9 (8.0%) |
| 40 to 44 Years | 3 (2.5%) | 1 (0.9%) |
| 45 to 49 Years | 1 (0.8%) | 0 (0.0%) |
| 50 to 54 Years | 19 (15.8%) | 7 (6.2%) |
| 55 to 59 Years | 3 (2.5%) | 4 (3.6%) |
| 60 to 64 Years | 18 (15.0%) | 25 (22.3%) |
| 65 to 69 Years | 9 (7.5%) | 4 (3.6%) |
| 70 to 74 Years | 10 (8.3%) | 11 (9.8%) |
| 75 to 79 Years | 5 (4.2%) | 7 (6.2%) |
| 80 to 84 Years | 5 (4.2%) | 8 (7.1%) |
| 85 Years and over | 4 (3.3%) | 1 (0.9%) |
| Total | 120 (100.0%) | 112 (100.0%) |
Families and Households in Hysham
Median Family Size in Hysham
The median family size in Hysham is 2.34 persons per family, with single male/father families (15 | 18.8%) accounting for the largest median family size of 2.73 persons per family. On the other hand, married-couple families (52 | 65.0%) represent the smallest median family size with 2.21 persons per family.
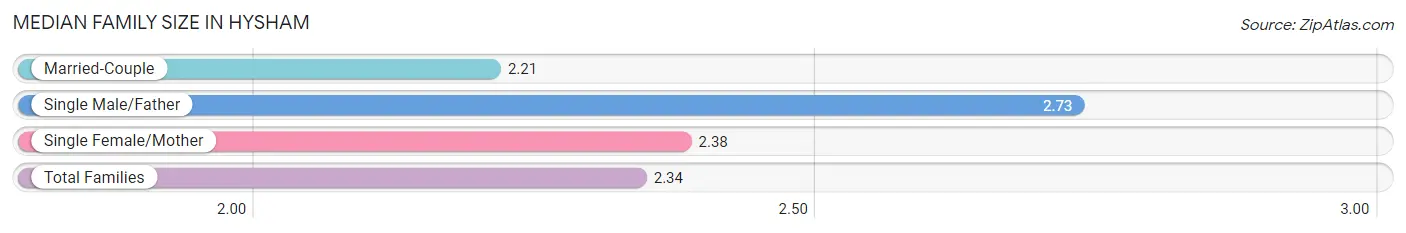
| Family Type | # Families | Family Size |
| Married-Couple | 52 (65.0%) | 2.21 |
| Single Male/Father | 15 (18.8%) | 2.73 |
| Single Female/Mother | 13 (16.3%) | 2.38 |
| Total Families | 80 (100.0%) | 2.34 |
Median Household Size in Hysham
The median household size in Hysham is 1.98 persons per household, with single male/father households (15 | 12.8%) accounting for the largest median household size of 3.13 persons per household. non-family households (37 | 31.6%) represent the smallest median household size with 1.05 persons per household.
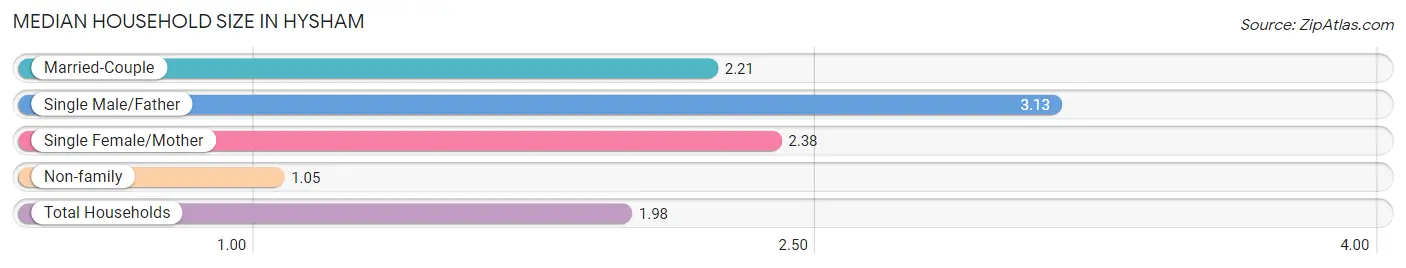
| Household Type | # Households | Household Size |
| Married-Couple | 52 (44.4%) | 2.21 |
| Single Male/Father | 15 (12.8%) | 3.13 |
| Single Female/Mother | 13 (11.1%) | 2.38 |
| Non-family | 37 (31.6%) | 1.05 |
| Total Households | 117 (100.0%) | 1.98 |
Household Size by Marriage Status in Hysham
Out of a total of 117 households in Hysham, 80 (68.4%) are family households, while 37 (31.6%) are nonfamily households. The most numerous type of family households are 2-person households, comprising 48, and the most common type of nonfamily households are 1-person households, comprising 35.
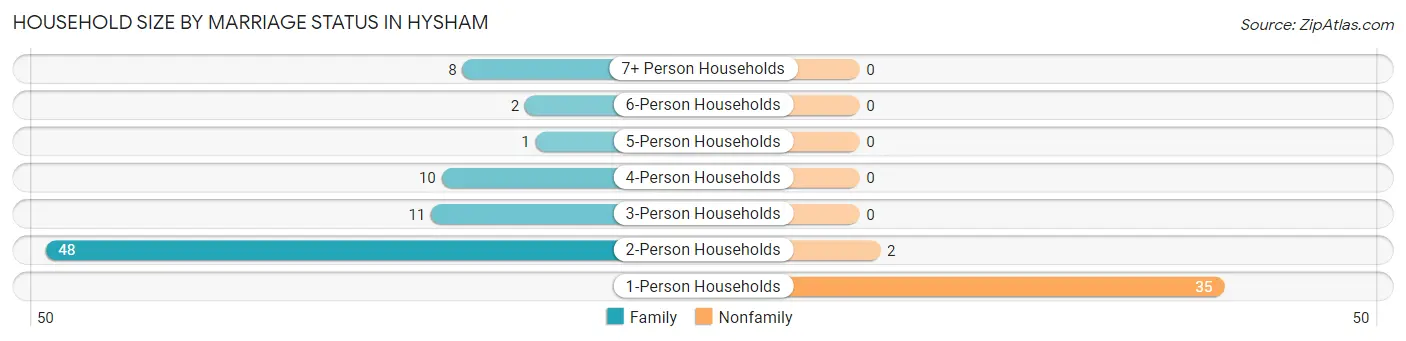
| Household Size | Family Households | Nonfamily Households |
| 1-Person Households | - | 35 (29.9%) |
| 2-Person Households | 48 (41.0%) | 2 (1.7%) |
| 3-Person Households | 11 (9.4%) | 0 (0.0%) |
| 4-Person Households | 10 (8.6%) | 0 (0.0%) |
| 5-Person Households | 1 (0.9%) | 0 (0.0%) |
| 6-Person Households | 2 (1.7%) | 0 (0.0%) |
| 7+ Person Households | 8 (6.8%) | 0 (0.0%) |
| Total | 80 (68.4%) | 37 (31.6%) |
Female Fertility in Hysham
Fertility by Age in Hysham
Average fertility rate in Hysham is 43.0 births per 1,000 women. Women in the age bracket of 15 to 19 years have the highest fertility rate with 1,000.0 births per 1,000 women. Women in the age bracket of 15 to 19 years acount for 100.0% of all women with births.
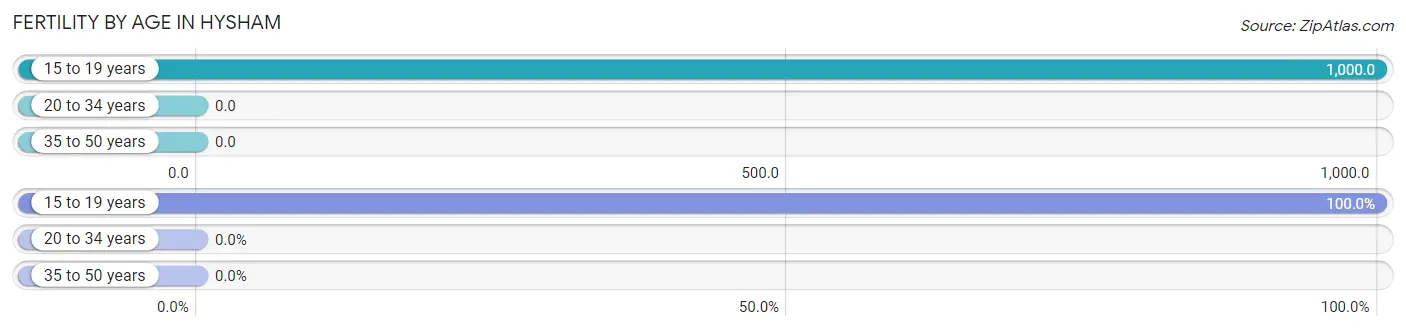
| Age Bracket | Women with Births | Births / 1,000 Women |
| 15 to 19 years | 1 (100.0%) | 1,000.0 |
| 20 to 34 years | 0 (0.0%) | 0.0 |
| 35 to 50 years | 0 (0.0%) | 0.0 |
| Total | 1 (100.0%) | 43.0 |
Fertility by Age by Marriage Status in Hysham
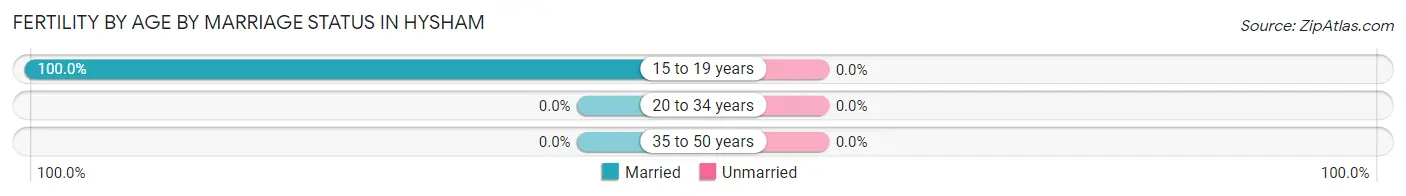
| Age Bracket | Married | Unmarried |
| 15 to 19 years | 1 (100.0%) | 0 (0.0%) |
| 20 to 34 years | 0 (0.0%) | 0 (0.0%) |
| 35 to 50 years | 0 (0.0%) | 0 (0.0%) |
| Total | 1 (100.0%) | 0 (0.0%) |
Fertility by Education in Hysham
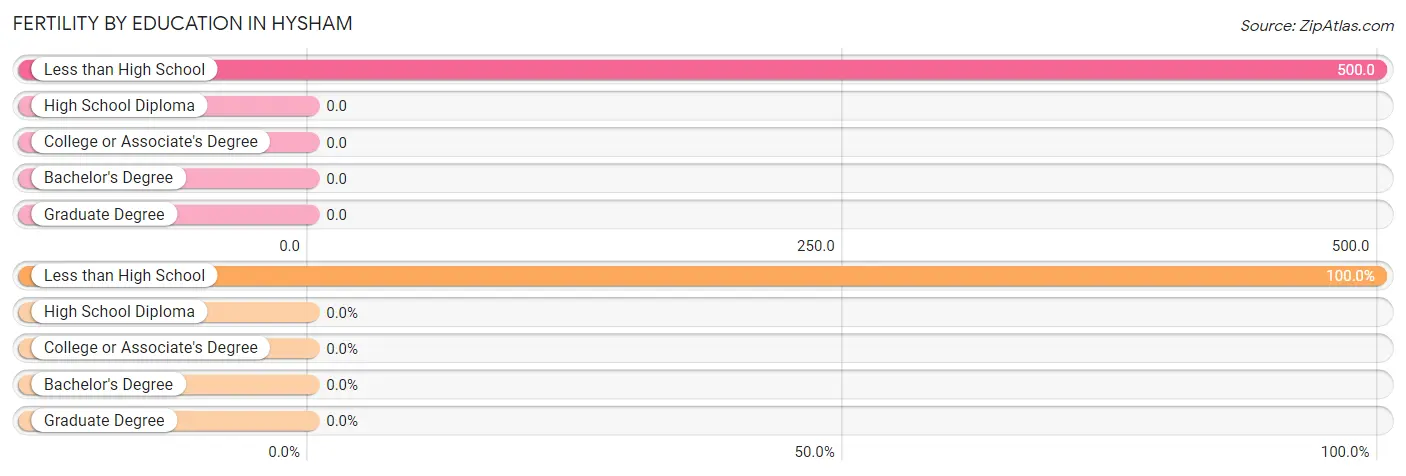
| Educational Attainment | Women with Births | Births / 1,000 Women |
| Less than High School | 1 (100.0%) | 500.0 |
| High School Diploma | 0 (0.0%) | 0.0 |
| College or Associate's Degree | 0 (0.0%) | 0.0 |
| Bachelor's Degree | 0 (0.0%) | 0.0 |
| Graduate Degree | 0 (0.0%) | 0.0 |
| Total | 1 (100.0%) | 43.0 |
Fertility by Education by Marriage Status in Hysham
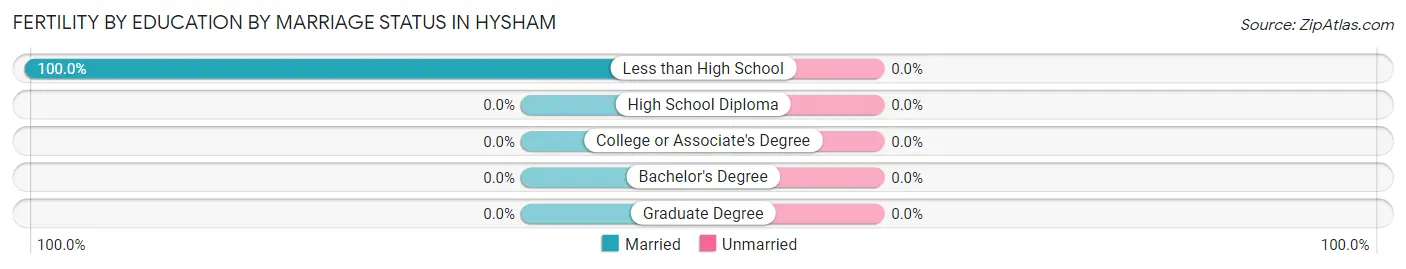
| Educational Attainment | Married | Unmarried |
| Less than High School | 1 (100.0%) | 0 (0.0%) |
| High School Diploma | 0 (0.0%) | 0 (0.0%) |
| College or Associate's Degree | 0 (0.0%) | 0 (0.0%) |
| Bachelor's Degree | 0 (0.0%) | 0 (0.0%) |
| Graduate Degree | 0 (0.0%) | 0 (0.0%) |
| Total | 1 (100.0%) | 0 (0.0%) |
Employment Characteristics in Hysham
Employment by Class of Employer in Hysham
Among the 100 employed individuals in Hysham, private company employees (63 | 63.0%), not-for-profit organizations (18 | 18.0%), and self-employed (incorporated) (9 | 9.0%) make up the most common classes of employment.
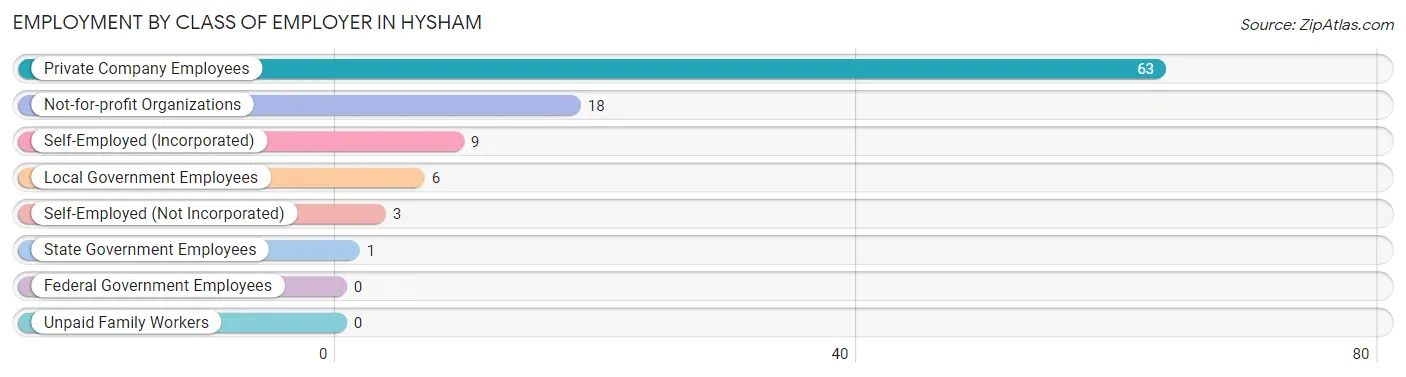
| Employer Class | # Employees | % Employees |
| Private Company Employees | 63 | 63.0% |
| Self-Employed (Incorporated) | 9 | 9.0% |
| Self-Employed (Not Incorporated) | 3 | 3.0% |
| Not-for-profit Organizations | 18 | 18.0% |
| Local Government Employees | 6 | 6.0% |
| State Government Employees | 1 | 1.0% |
| Federal Government Employees | 0 | 0.0% |
| Unpaid Family Workers | 0 | 0.0% |
| Total | 100 | 100.0% |
Employment Status by Age in Hysham
According to the labor force statistics for Hysham, out of the total population over 16 years of age (193), 55.4% or 107 individuals are in the labor force, with 3.7% or 4 of them unemployed. The age group with the highest labor force participation rate is 16 to 19 years, with 100.0% or 3 individuals in the labor force. Within the labor force, the 16 to 19 years age range has the highest percentage of unemployed individuals, with 100.0% or 3 of them being unemployed.
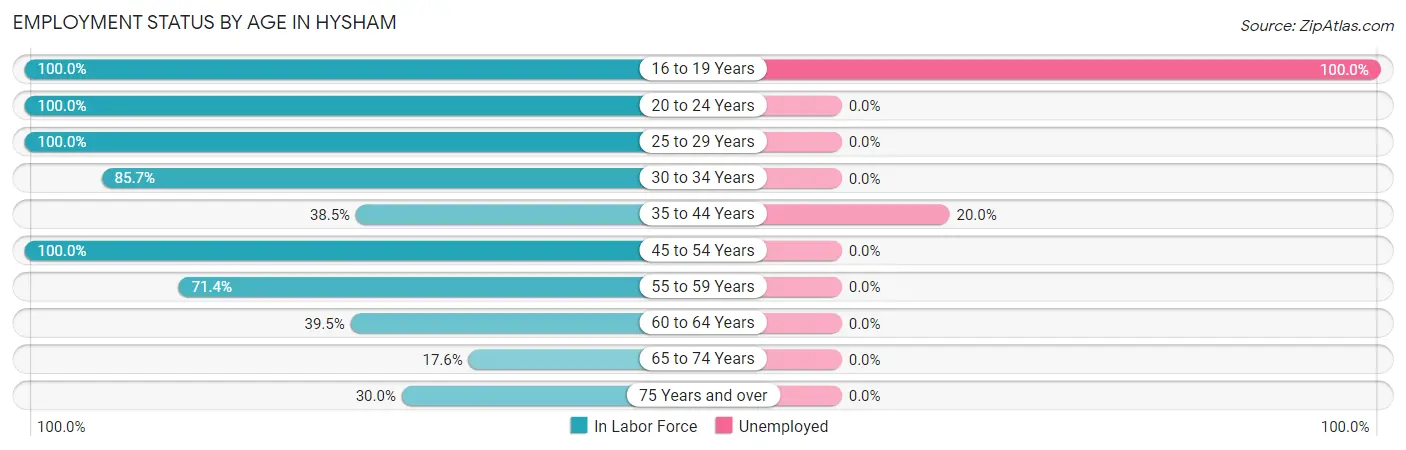
| Age Bracket | In Labor Force | Unemployed |
| 16 to 19 Years | 3 (100.0%) | 3 (100.0%) |
| 20 to 24 Years | 14 (100.0%) | 0 (0.0%) |
| 25 to 29 Years | 15 (100.0%) | 0 (0.0%) |
| 30 to 34 Years | 6 (85.7%) | 0 (0.0%) |
| 35 to 44 Years | 5 (38.5%) | 1 (20.0%) |
| 45 to 54 Years | 27 (100.0%) | 0 (0.0%) |
| 55 to 59 Years | 5 (71.4%) | 0 (0.0%) |
| 60 to 64 Years | 17 (39.5%) | 0 (0.0%) |
| 65 to 74 Years | 6 (17.6%) | 0 (0.0%) |
| 75 Years and over | 9 (30.0%) | 0 (0.0%) |
| Total | 107 (55.4%) | 4 (3.7%) |
Employment Status by Educational Attainment in Hysham
According to labor force statistics for Hysham, 67.0% of individuals (75) out of the total population between 25 and 64 years of age (112) are in the labor force, with 1.3% or 1 of them being unemployed. The group with the highest labor force participation rate are those with the educational attainment of less than high school, with 100.0% or 8 individuals in the labor force. Within the labor force, individuals with bachelor's degree or higher education have the highest percentage of unemployment, with 10.0% or 1 of them being unemployed.
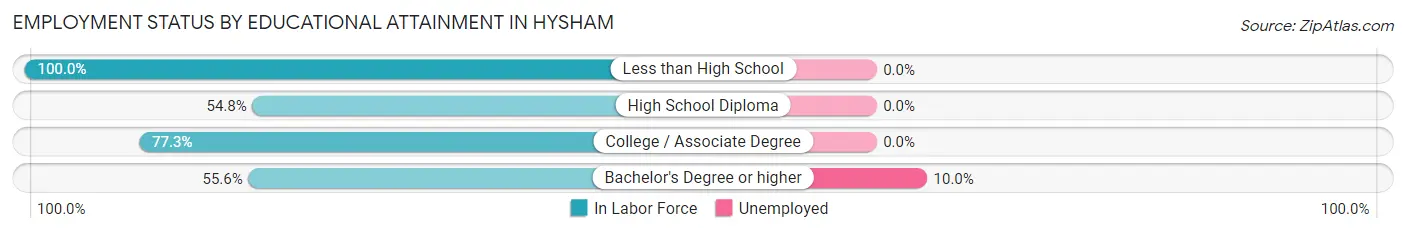
| Educational Attainment | In Labor Force | Unemployed |
| Less than High School | 8 (100.0%) | 0 (0.0%) |
| High School Diploma | 23 (54.8%) | 0 (0.0%) |
| College / Associate Degree | 34 (77.3%) | 0 (0.0%) |
| Bachelor's Degree or higher | 10 (55.6%) | 2 (10.0%) |
| Total | 75 (67.0%) | 1 (1.3%) |
Employment Occupations by Sex in Hysham
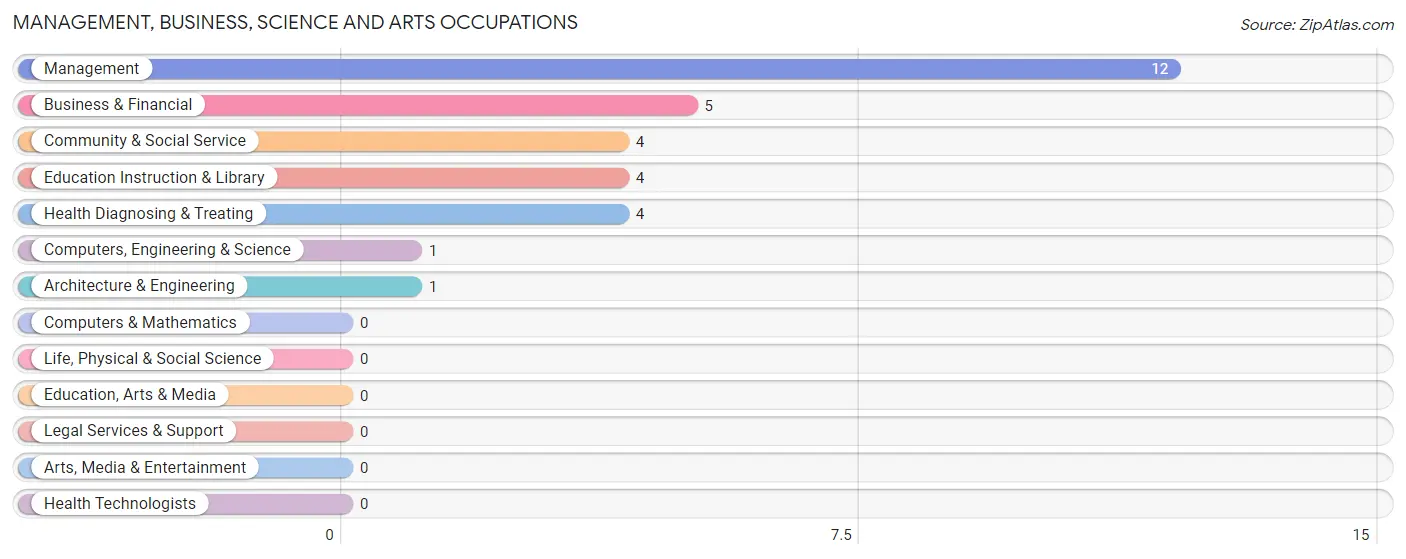
Management, Business, Science and Arts Occupations
The most common Management, Business, Science and Arts occupations in Hysham are Management (12 | 11.7%), Business & Financial (5 | 4.9%), Community & Social Service (4 | 3.9%), Education Instruction & Library (4 | 3.9%), and Health Diagnosing & Treating (4 | 3.9%).
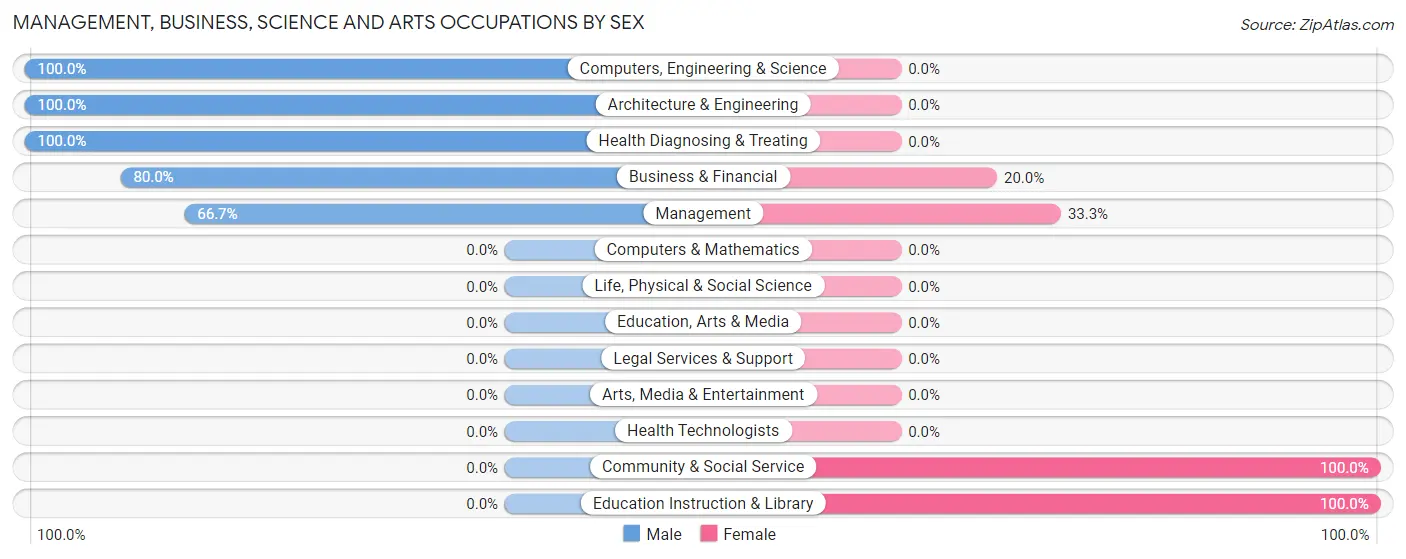
Management, Business, Science and Arts Occupations by Sex
Within the Management, Business, Science and Arts occupations in Hysham, the most male-oriented occupations are Computers, Engineering & Science (100.0%), Architecture & Engineering (100.0%), and Health Diagnosing & Treating (100.0%), while the most female-oriented occupations are Community & Social Service (100.0%), Education Instruction & Library (100.0%), and Management (33.3%).
| Occupation | Male | Female |
| Management | 8 (66.7%) | 4 (33.3%) |
| Business & Financial | 4 (80.0%) | 1 (20.0%) |
| Computers, Engineering & Science | 1 (100.0%) | 0 (0.0%) |
| Computers & Mathematics | 0 (0.0%) | 0 (0.0%) |
| Architecture & Engineering | 1 (100.0%) | 0 (0.0%) |
| Life, Physical & Social Science | 0 (0.0%) | 0 (0.0%) |
| Community & Social Service | 0 (0.0%) | 4 (100.0%) |
| Education, Arts & Media | 0 (0.0%) | 0 (0.0%) |
| Legal Services & Support | 0 (0.0%) | 0 (0.0%) |
| Education Instruction & Library | 0 (0.0%) | 4 (100.0%) |
| Arts, Media & Entertainment | 0 (0.0%) | 0 (0.0%) |
| Health Diagnosing & Treating | 4 (100.0%) | 0 (0.0%) |
| Health Technologists | 0 (0.0%) | 0 (0.0%) |
| Total (Category) | 17 (65.4%) | 9 (34.6%) |
| Total (Overall) | 73 (70.9%) | 30 (29.1%) |
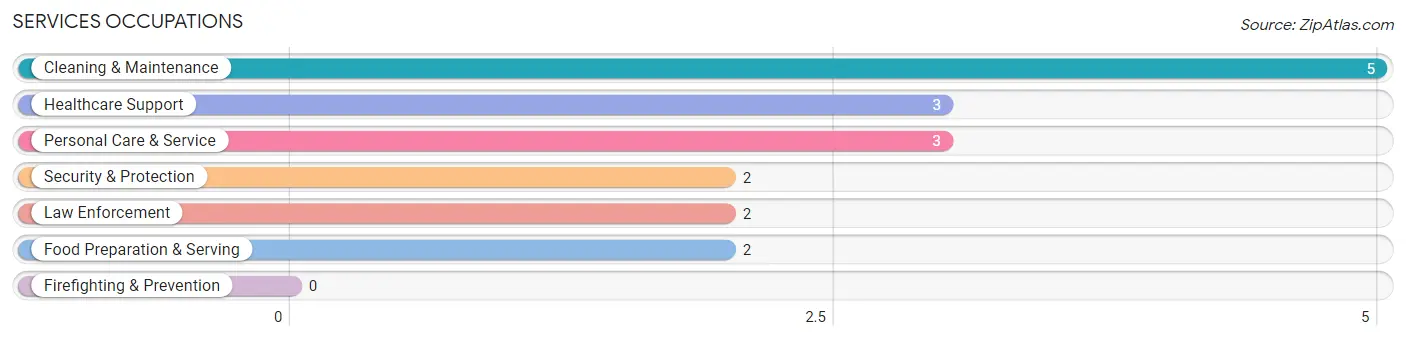
Services Occupations
The most common Services occupations in Hysham are Cleaning & Maintenance (5 | 4.9%), Healthcare Support (3 | 2.9%), Personal Care & Service (3 | 2.9%), Security & Protection (2 | 1.9%), and Law Enforcement (2 | 1.9%).
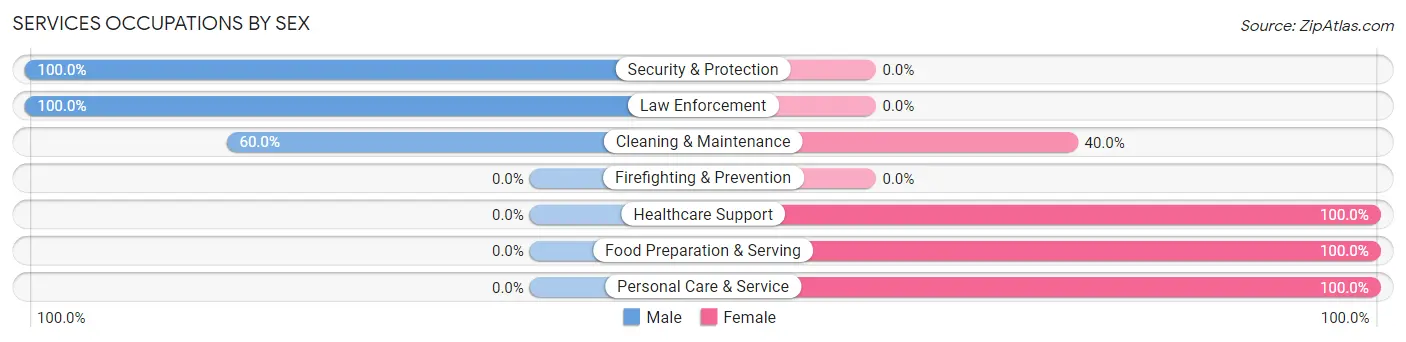
Services Occupations by Sex
Within the Services occupations in Hysham, the most male-oriented occupations are Security & Protection (100.0%), Law Enforcement (100.0%), and Cleaning & Maintenance (60.0%), while the most female-oriented occupations are Healthcare Support (100.0%), Food Preparation & Serving (100.0%), and Personal Care & Service (100.0%).
| Occupation | Male | Female |
| Healthcare Support | 0 (0.0%) | 3 (100.0%) |
| Security & Protection | 2 (100.0%) | 0 (0.0%) |
| Firefighting & Prevention | 0 (0.0%) | 0 (0.0%) |
| Law Enforcement | 2 (100.0%) | 0 (0.0%) |
| Food Preparation & Serving | 0 (0.0%) | 2 (100.0%) |
| Cleaning & Maintenance | 3 (60.0%) | 2 (40.0%) |
| Personal Care & Service | 0 (0.0%) | 3 (100.0%) |
| Total (Category) | 5 (33.3%) | 10 (66.7%) |
| Total (Overall) | 73 (70.9%) | 30 (29.1%) |
Sales and Office Occupations
The most common Sales and Office occupations in Hysham are Office & Administration (10 | 9.7%), and Sales & Related (1 | 1.0%).
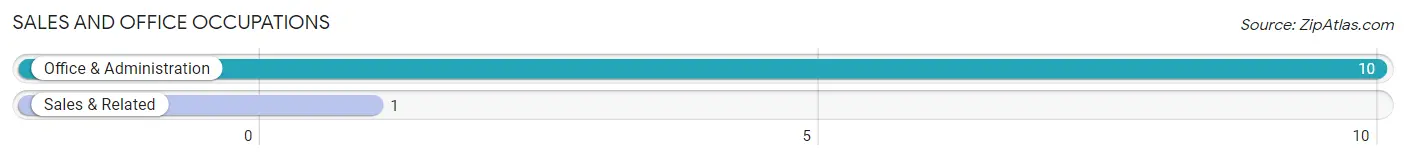
Sales and Office Occupations by Sex
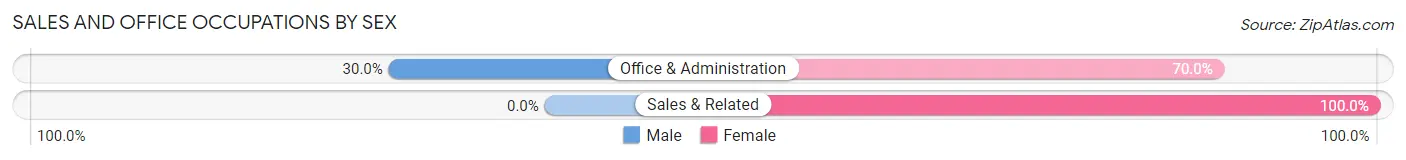
| Occupation | Male | Female |
| Sales & Related | 0 (0.0%) | 1 (100.0%) |
| Office & Administration | 3 (30.0%) | 7 (70.0%) |
| Total (Category) | 3 (27.3%) | 8 (72.7%) |
| Total (Overall) | 73 (70.9%) | 30 (29.1%) |
Natural Resources, Construction and Maintenance Occupations
The most common Natural Resources, Construction and Maintenance occupations in Hysham are Farming, Fishing & Forestry (14 | 13.6%), Installation, Maintenance & Repair (11 | 10.7%), and Construction & Extraction (6 | 5.8%).
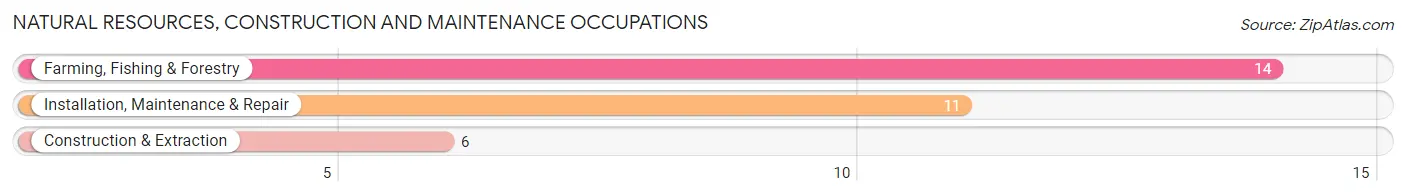
Natural Resources, Construction and Maintenance Occupations by Sex
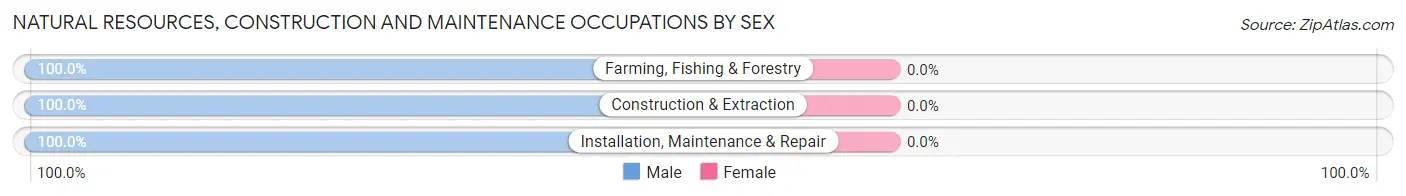
| Occupation | Male | Female |
| Farming, Fishing & Forestry | 14 (100.0%) | 0 (0.0%) |
| Construction & Extraction | 6 (100.0%) | 0 (0.0%) |
| Installation, Maintenance & Repair | 11 (100.0%) | 0 (0.0%) |
| Total (Category) | 31 (100.0%) | 0 (0.0%) |
| Total (Overall) | 73 (70.9%) | 30 (29.1%) |
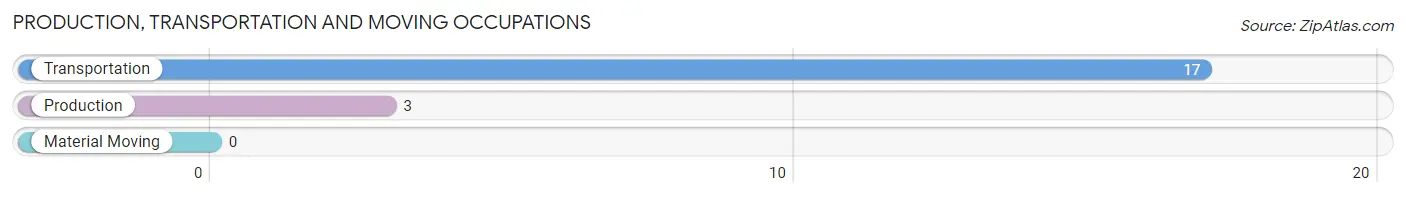
Production, Transportation and Moving Occupations
The most common Production, Transportation and Moving occupations in Hysham are Transportation (17 | 16.5%), and Production (3 | 2.9%).
Production, Transportation and Moving Occupations by Sex
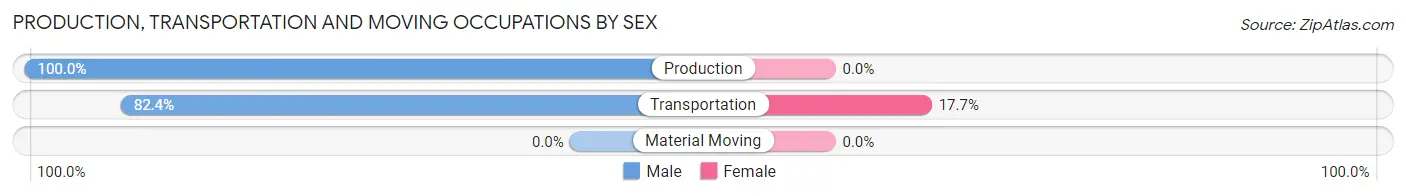
| Occupation | Male | Female |
| Production | 3 (100.0%) | 0 (0.0%) |
| Transportation | 14 (82.4%) | 3 (17.6%) |
| Material Moving | 0 (0.0%) | 0 (0.0%) |
| Total (Category) | 17 (85.0%) | 3 (15.0%) |
| Total (Overall) | 73 (70.9%) | 30 (29.1%) |
Employment Industries by Sex in Hysham
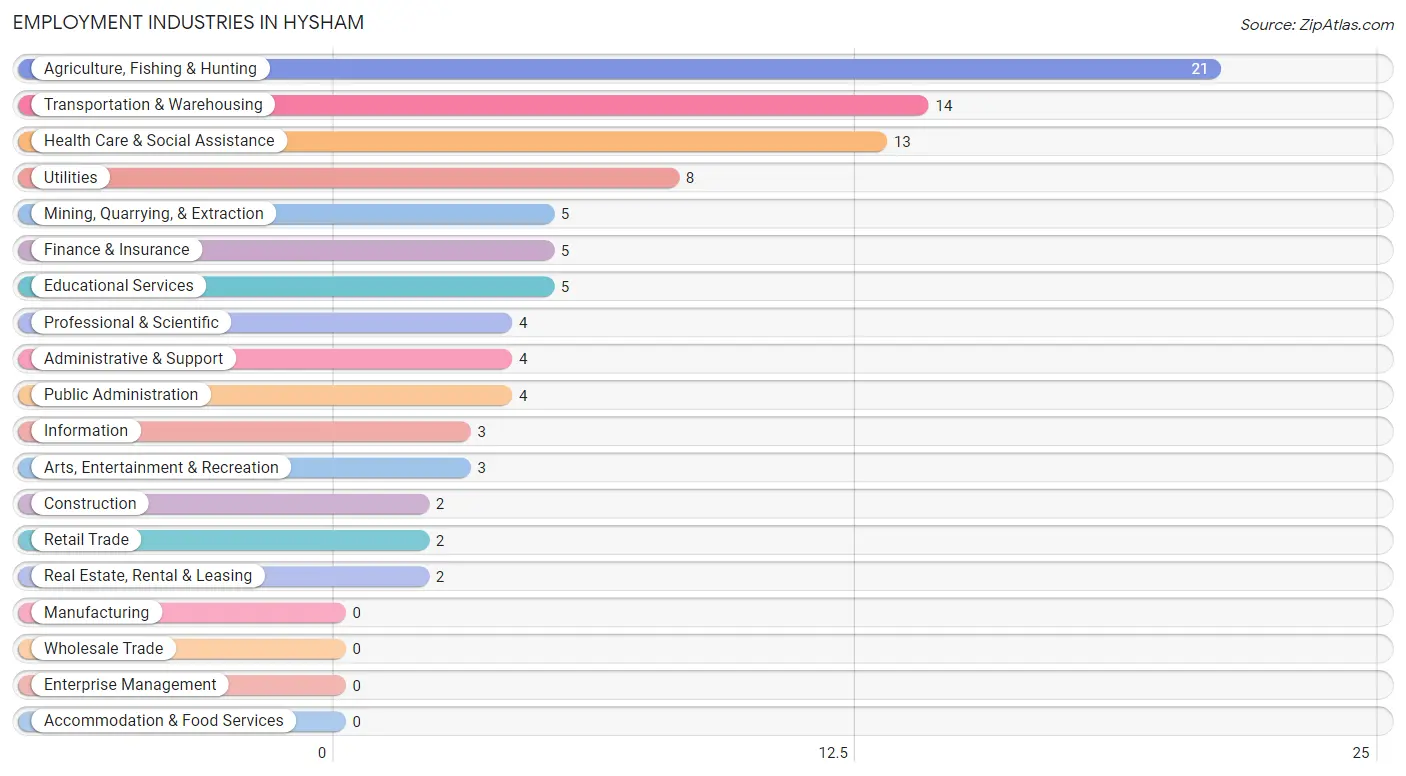
Employment Industries in Hysham
The major employment industries in Hysham include Agriculture, Fishing & Hunting (21 | 20.4%), Transportation & Warehousing (14 | 13.6%), Health Care & Social Assistance (13 | 12.6%), Utilities (8 | 7.8%), and Mining, Quarrying, & Extraction (5 | 4.9%).
Employment Industries by Sex in Hysham
The Hysham industries that see more men than women are Agriculture, Fishing & Hunting (100.0%), Mining, Quarrying, & Extraction (100.0%), and Construction (100.0%), whereas the industries that tend to have a higher number of women are Retail Trade (100.0%), Finance & Insurance (100.0%), and Arts, Entertainment & Recreation (100.0%).
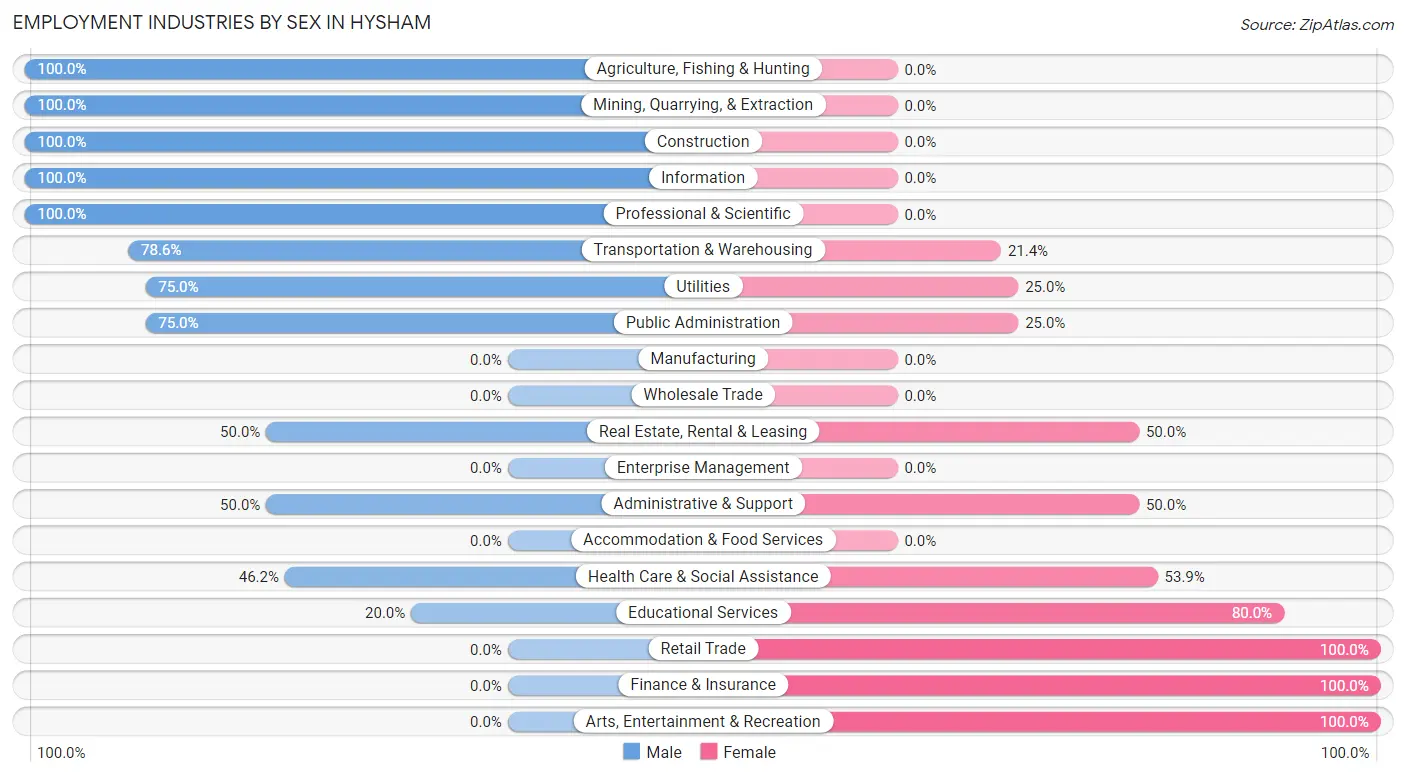
| Industry | Male | Female |
| Agriculture, Fishing & Hunting | 21 (100.0%) | 0 (0.0%) |
| Mining, Quarrying, & Extraction | 5 (100.0%) | 0 (0.0%) |
| Construction | 2 (100.0%) | 0 (0.0%) |
| Manufacturing | 0 (0.0%) | 0 (0.0%) |
| Wholesale Trade | 0 (0.0%) | 0 (0.0%) |
| Retail Trade | 0 (0.0%) | 2 (100.0%) |
| Transportation & Warehousing | 11 (78.6%) | 3 (21.4%) |
| Utilities | 6 (75.0%) | 2 (25.0%) |
| Information | 3 (100.0%) | 0 (0.0%) |
| Finance & Insurance | 0 (0.0%) | 5 (100.0%) |
| Real Estate, Rental & Leasing | 1 (50.0%) | 1 (50.0%) |
| Professional & Scientific | 4 (100.0%) | 0 (0.0%) |
| Enterprise Management | 0 (0.0%) | 0 (0.0%) |
| Administrative & Support | 2 (50.0%) | 2 (50.0%) |
| Educational Services | 1 (20.0%) | 4 (80.0%) |
| Health Care & Social Assistance | 6 (46.2%) | 7 (53.8%) |
| Arts, Entertainment & Recreation | 0 (0.0%) | 3 (100.0%) |
| Accommodation & Food Services | 0 (0.0%) | 0 (0.0%) |
| Public Administration | 3 (75.0%) | 1 (25.0%) |
| Total | 73 (70.9%) | 30 (29.1%) |
Education in Hysham
School Enrollment in Hysham
The most common levels of schooling among the 33 students in Hysham are elementary school (13 | 39.4%), middle school (10 | 30.3%), and college / undergraduate (7 | 21.2%).
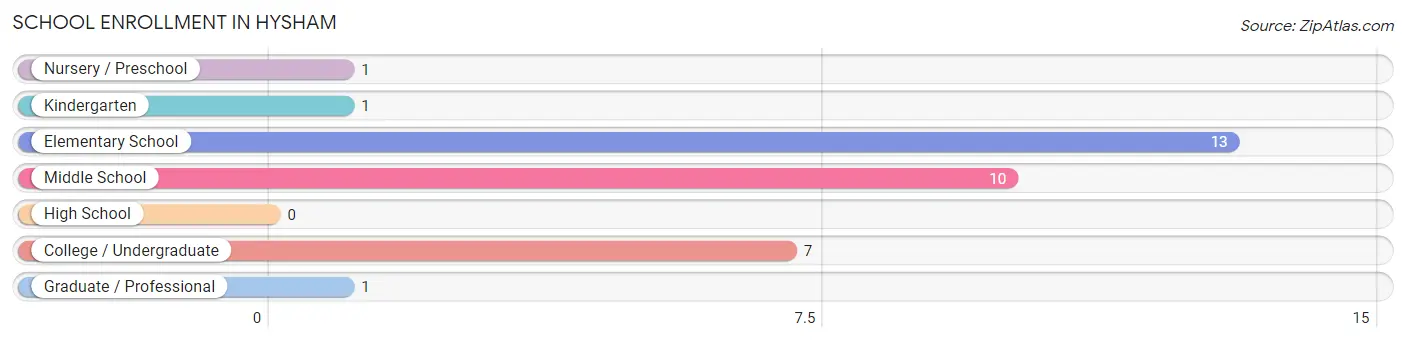
| School Level | # Students | % Students |
| Nursery / Preschool | 1 | 3.0% |
| Kindergarten | 1 | 3.0% |
| Elementary School | 13 | 39.4% |
| Middle School | 10 | 30.3% |
| High School | 0 | 0.0% |
| College / Undergraduate | 7 | 21.2% |
| Graduate / Professional | 1 | 3.0% |
| Total | 33 | 100.0% |
School Enrollment by Age by Funding Source in Hysham
Out of a total of 33 students who are enrolled in schools in Hysham, 7 (21.2%) attend a private institution, while the remaining 26 (78.8%) are enrolled in public schools. The age group of 10 to 14 year olds has the highest likelihood of being enrolled in private schools, with 6 (33.3% in the age bracket) enrolled. Conversely, the age group of 3 to 4 year olds has the lowest likelihood of being enrolled in a private school, with 1 (100.0% in the age bracket) attending a public institution.
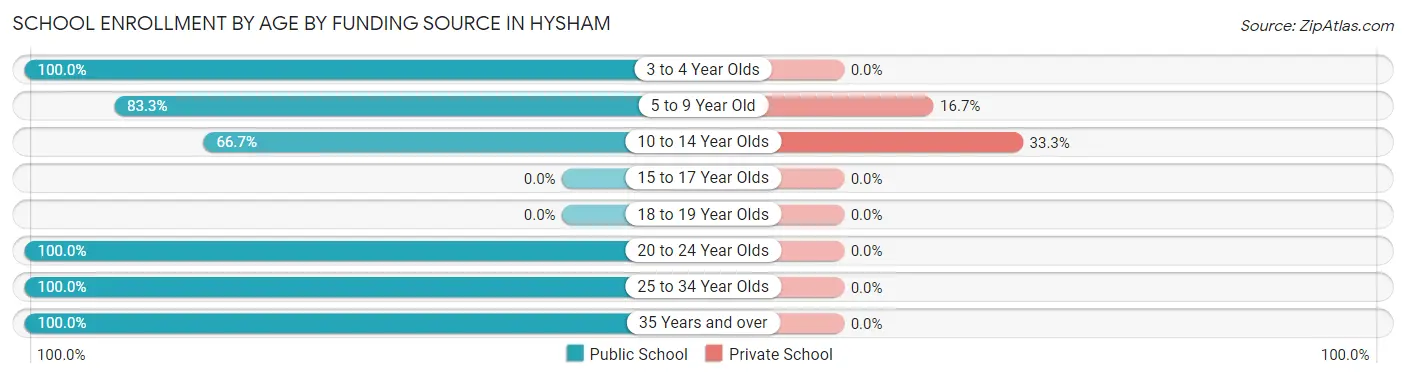
| Age Bracket | Public School | Private School |
| 3 to 4 Year Olds | 1 (100.0%) | 0 (0.0%) |
| 5 to 9 Year Old | 5 (83.3%) | 1 (16.7%) |
| 10 to 14 Year Olds | 12 (66.7%) | 6 (33.3%) |
| 15 to 17 Year Olds | 0 (0.0%) | 0 (0.0%) |
| 18 to 19 Year Olds | 0 (0.0%) | 0 (0.0%) |
| 20 to 24 Year Olds | 3 (100.0%) | 0 (0.0%) |
| 25 to 34 Year Olds | 4 (100.0%) | 0 (0.0%) |
| 35 Years and over | 1 (100.0%) | 0 (0.0%) |
| Total | 26 (78.8%) | 7 (21.2%) |
Educational Attainment by Field of Study in Hysham
Education (11 | 35.5%), engineering (7 | 22.6%), computers & mathematics (4 | 12.9%), business (4 | 12.9%), and bio, nature & agricultural (3 | 9.7%) are the most common fields of study among 31 individuals in Hysham who have obtained a bachelor's degree or higher.
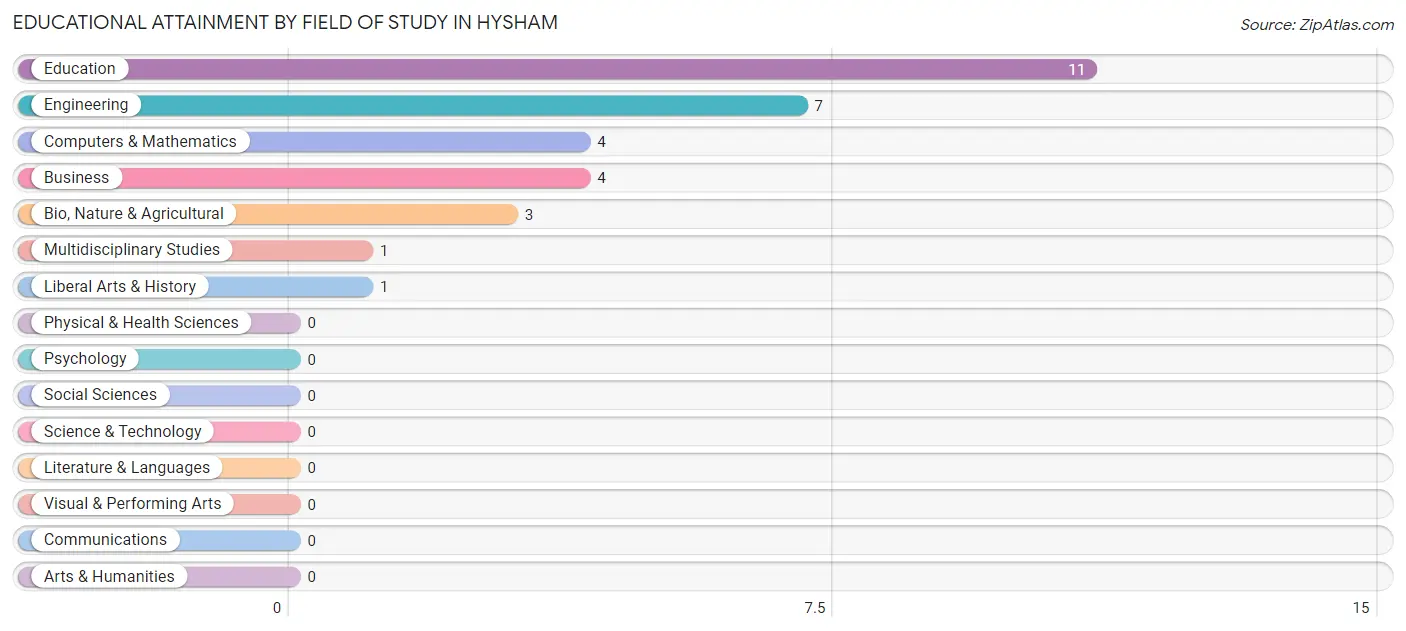
| Field of Study | # Graduates | % Graduates |
| Computers & Mathematics | 4 | 12.9% |
| Bio, Nature & Agricultural | 3 | 9.7% |
| Physical & Health Sciences | 0 | 0.0% |
| Psychology | 0 | 0.0% |
| Social Sciences | 0 | 0.0% |
| Engineering | 7 | 22.6% |
| Multidisciplinary Studies | 1 | 3.2% |
| Science & Technology | 0 | 0.0% |
| Business | 4 | 12.9% |
| Education | 11 | 35.5% |
| Literature & Languages | 0 | 0.0% |
| Liberal Arts & History | 1 | 3.2% |
| Visual & Performing Arts | 0 | 0.0% |
| Communications | 0 | 0.0% |
| Arts & Humanities | 0 | 0.0% |
| Total | 31 | 100.0% |
Transportation & Commute in Hysham
Vehicle Availability by Sex in Hysham
The most prevalent vehicle ownership categories in Hysham are males with 2 vehicles (27, accounting for 38.0%) and females with 2 vehicles (1, making up 93.1%).
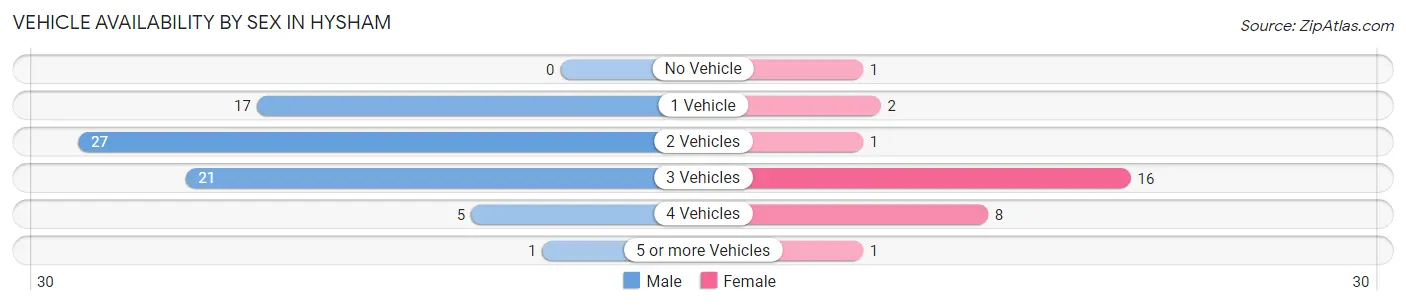
| Vehicles Available | Male | Female |
| No Vehicle | 0 (0.0%) | 1 (3.5%) |
| 1 Vehicle | 17 (23.9%) | 2 (6.9%) |
| 2 Vehicles | 27 (38.0%) | 1 (3.5%) |
| 3 Vehicles | 21 (29.6%) | 16 (55.2%) |
| 4 Vehicles | 5 (7.0%) | 8 (27.6%) |
| 5 or more Vehicles | 1 (1.4%) | 1 (3.5%) |
| Total | 71 (100.0%) | 29 (100.0%) |
Commute Time in Hysham
The most frequently occuring commute durations in Hysham are 5 to 9 minutes (23 commuters, 25.8%), 15 to 19 minutes (22 commuters, 24.7%), and less than 5 minutes (18 commuters, 20.2%).
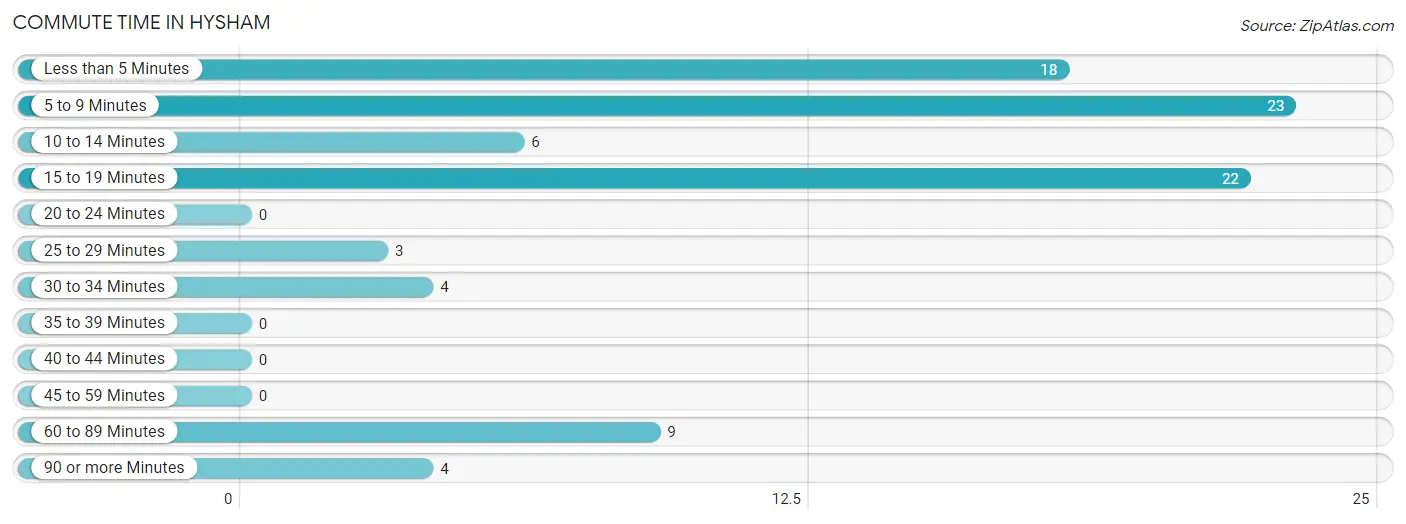
| Commute Time | # Commuters | % Commuters |
| Less than 5 Minutes | 18 | 20.2% |
| 5 to 9 Minutes | 23 | 25.8% |
| 10 to 14 Minutes | 6 | 6.7% |
| 15 to 19 Minutes | 22 | 24.7% |
| 20 to 24 Minutes | 0 | 0.0% |
| 25 to 29 Minutes | 3 | 3.4% |
| 30 to 34 Minutes | 4 | 4.5% |
| 35 to 39 Minutes | 0 | 0.0% |
| 40 to 44 Minutes | 0 | 0.0% |
| 45 to 59 Minutes | 0 | 0.0% |
| 60 to 89 Minutes | 9 | 10.1% |
| 90 or more Minutes | 4 | 4.5% |
Commute Time by Sex in Hysham
The most common commute times in Hysham are 15 to 19 minutes (18 commuters, 29.5%) for males and 5 to 9 minutes (10 commuters, 35.7%) for females.
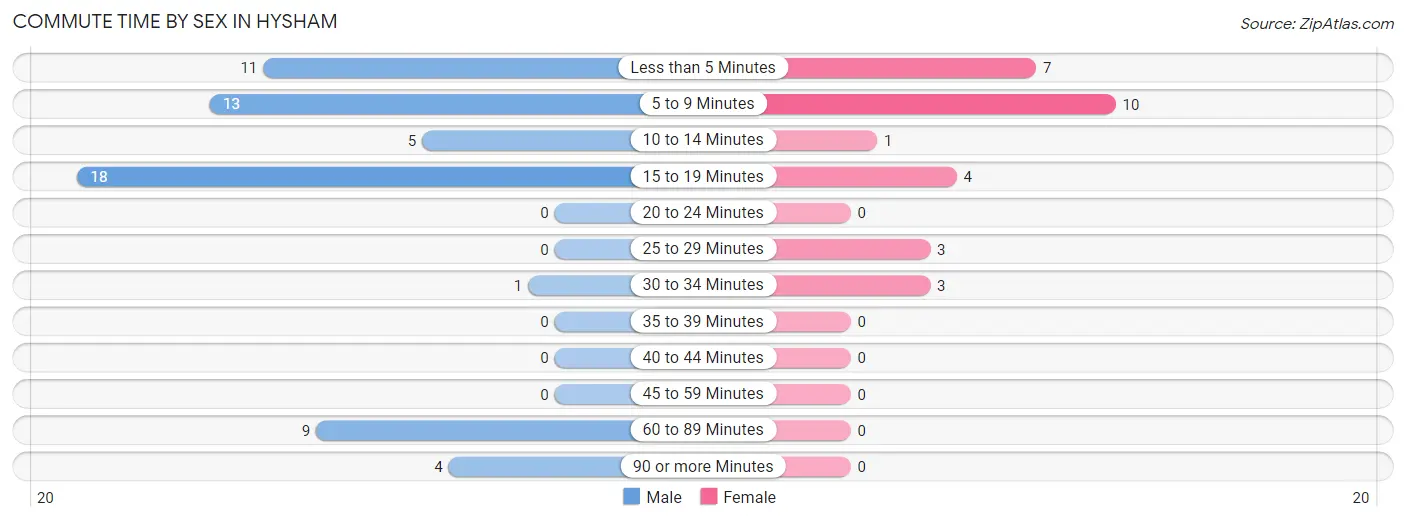
| Commute Time | Male | Female |
| Less than 5 Minutes | 11 (18.0%) | 7 (25.0%) |
| 5 to 9 Minutes | 13 (21.3%) | 10 (35.7%) |
| 10 to 14 Minutes | 5 (8.2%) | 1 (3.6%) |
| 15 to 19 Minutes | 18 (29.5%) | 4 (14.3%) |
| 20 to 24 Minutes | 0 (0.0%) | 0 (0.0%) |
| 25 to 29 Minutes | 0 (0.0%) | 3 (10.7%) |
| 30 to 34 Minutes | 1 (1.6%) | 3 (10.7%) |
| 35 to 39 Minutes | 0 (0.0%) | 0 (0.0%) |
| 40 to 44 Minutes | 0 (0.0%) | 0 (0.0%) |
| 45 to 59 Minutes | 0 (0.0%) | 0 (0.0%) |
| 60 to 89 Minutes | 9 (14.7%) | 0 (0.0%) |
| 90 or more Minutes | 4 (6.6%) | 0 (0.0%) |
Time of Departure to Work by Sex in Hysham
The most frequent times of departure to work in Hysham are 6:30 AM to 6:59 AM (32, 52.5%) for males and 7:30 AM to 7:59 AM (7, 25.0%) for females.
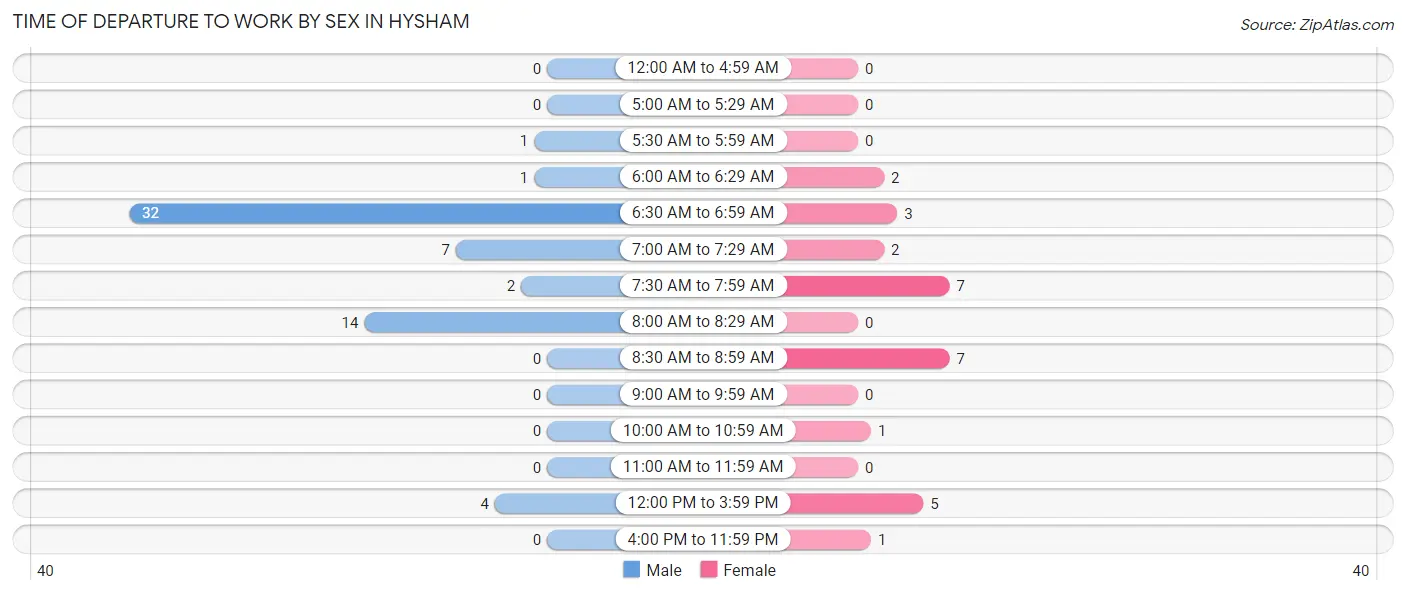
| Time of Departure | Male | Female |
| 12:00 AM to 4:59 AM | 0 (0.0%) | 0 (0.0%) |
| 5:00 AM to 5:29 AM | 0 (0.0%) | 0 (0.0%) |
| 5:30 AM to 5:59 AM | 1 (1.6%) | 0 (0.0%) |
| 6:00 AM to 6:29 AM | 1 (1.6%) | 2 (7.1%) |
| 6:30 AM to 6:59 AM | 32 (52.5%) | 3 (10.7%) |
| 7:00 AM to 7:29 AM | 7 (11.5%) | 2 (7.1%) |
| 7:30 AM to 7:59 AM | 2 (3.3%) | 7 (25.0%) |
| 8:00 AM to 8:29 AM | 14 (23.0%) | 0 (0.0%) |
| 8:30 AM to 8:59 AM | 0 (0.0%) | 7 (25.0%) |
| 9:00 AM to 9:59 AM | 0 (0.0%) | 0 (0.0%) |
| 10:00 AM to 10:59 AM | 0 (0.0%) | 1 (3.6%) |
| 11:00 AM to 11:59 AM | 0 (0.0%) | 0 (0.0%) |
| 12:00 PM to 3:59 PM | 4 (6.6%) | 5 (17.9%) |
| 4:00 PM to 11:59 PM | 0 (0.0%) | 1 (3.6%) |
| Total | 61 (100.0%) | 28 (100.0%) |
Housing Occupancy in Hysham
Occupancy by Ownership in Hysham
Of the total 117 dwellings in Hysham, owner-occupied units account for 86 (73.5%), while renter-occupied units make up 31 (26.5%).
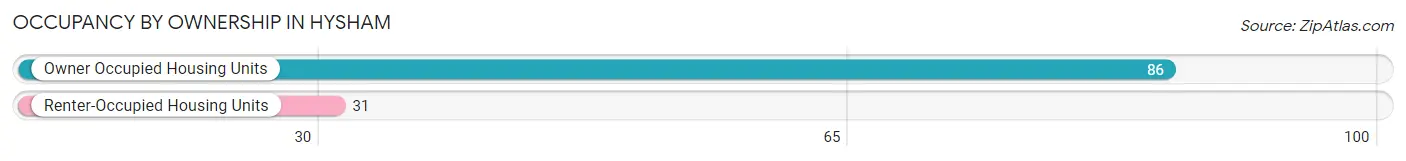
| Occupancy | # Housing Units | % Housing Units |
| Owner Occupied Housing Units | 86 | 73.5% |
| Renter-Occupied Housing Units | 31 | 26.5% |
| Total Occupied Housing Units | 117 | 100.0% |
Occupancy by Household Size in Hysham
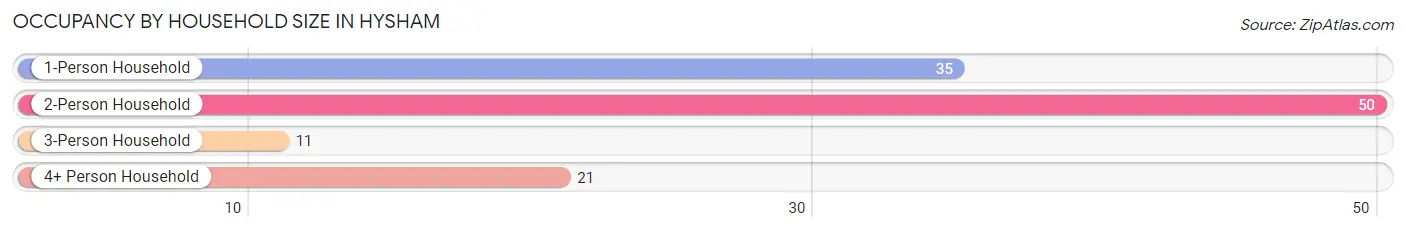
| Household Size | # Housing Units | % Housing Units |
| 1-Person Household | 35 | 29.9% |
| 2-Person Household | 50 | 42.7% |
| 3-Person Household | 11 | 9.4% |
| 4+ Person Household | 21 | 17.9% |
| Total Housing Units | 117 | 100.0% |
Occupancy by Ownership by Household Size in Hysham
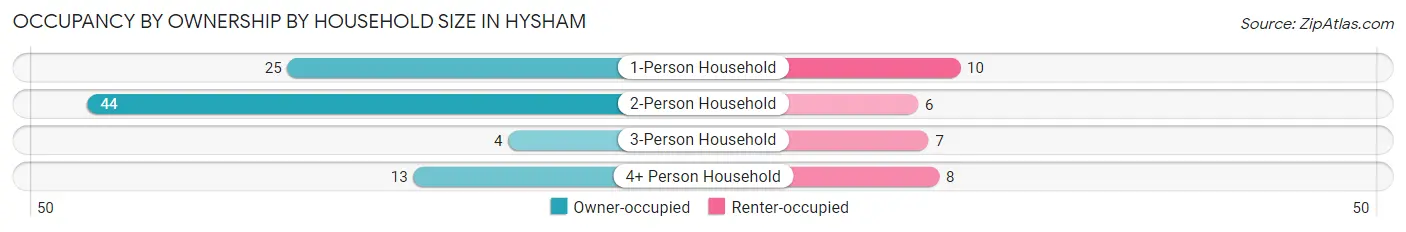
| Household Size | Owner-occupied | Renter-occupied |
| 1-Person Household | 25 (71.4%) | 10 (28.6%) |
| 2-Person Household | 44 (88.0%) | 6 (12.0%) |
| 3-Person Household | 4 (36.4%) | 7 (63.6%) |
| 4+ Person Household | 13 (61.9%) | 8 (38.1%) |
| Total Housing Units | 86 (73.5%) | 31 (26.5%) |
Occupancy by Educational Attainment in Hysham
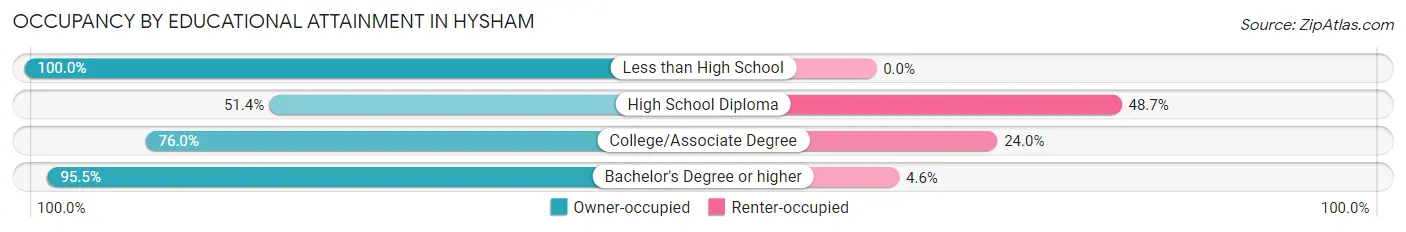
| Household Size | Owner-occupied | Renter-occupied |
| Less than High School | 8 (100.0%) | 0 (0.0%) |
| High School Diploma | 19 (51.3%) | 18 (48.6%) |
| College/Associate Degree | 38 (76.0%) | 12 (24.0%) |
| Bachelor's Degree or higher | 21 (95.5%) | 1 (4.5%) |
Occupancy by Age of Householder in Hysham
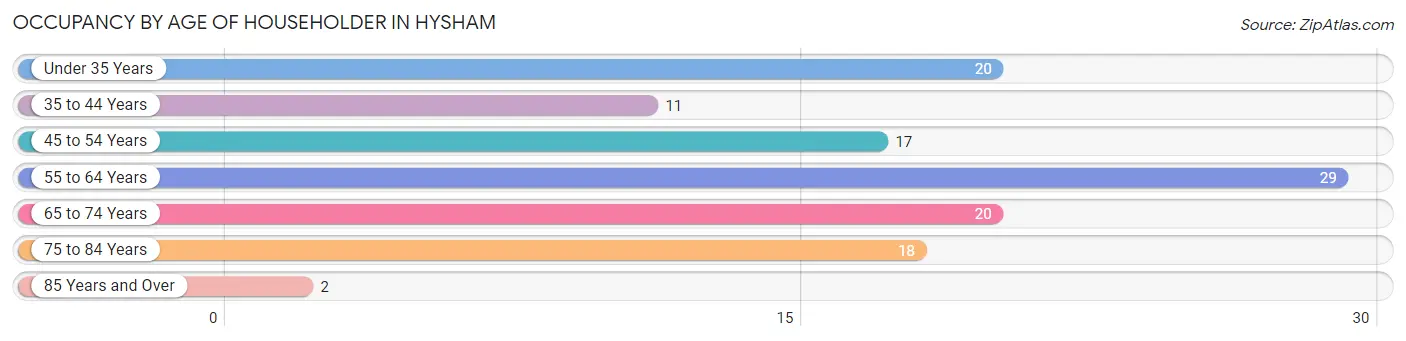
| Age Bracket | # Households | % Households |
| Under 35 Years | 20 | 17.1% |
| 35 to 44 Years | 11 | 9.4% |
| 45 to 54 Years | 17 | 14.5% |
| 55 to 64 Years | 29 | 24.8% |
| 65 to 74 Years | 20 | 17.1% |
| 75 to 84 Years | 18 | 15.4% |
| 85 Years and Over | 2 | 1.7% |
| Total | 117 | 100.0% |
Housing Finances in Hysham
Median Income by Occupancy in Hysham
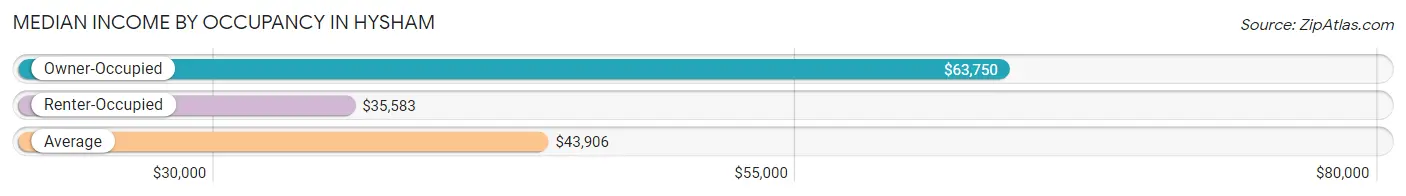
| Occupancy Type | # Households | Median Income |
| Owner-Occupied | 86 (73.5%) | $63,750 |
| Renter-Occupied | 31 (26.5%) | $35,583 |
| Average | 117 (100.0%) | $43,906 |
Occupancy by Householder Income Bracket in Hysham
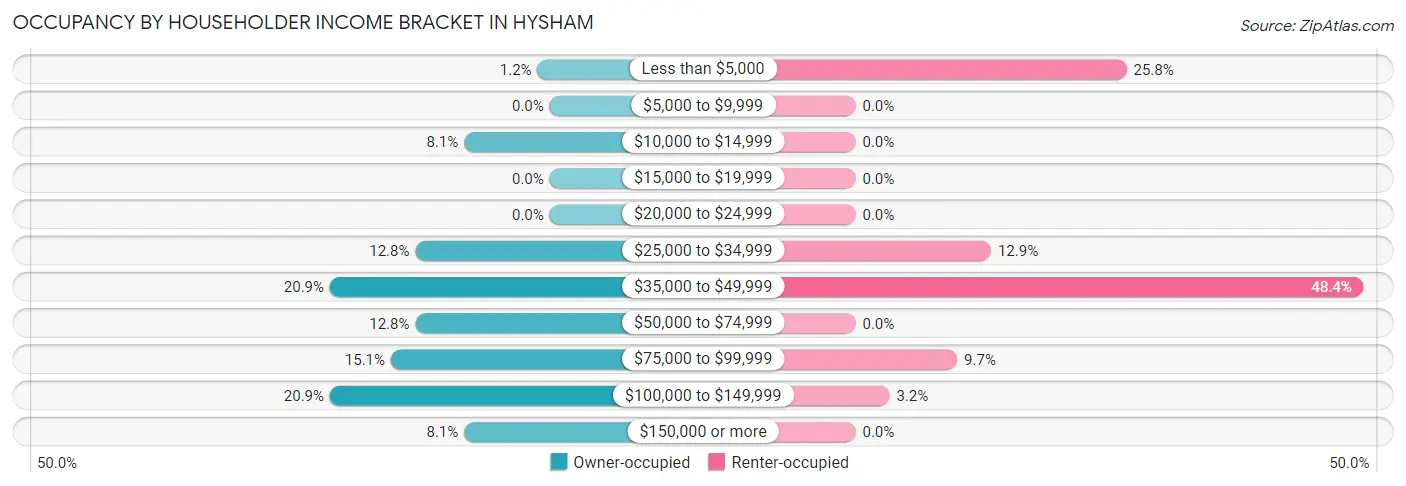
| Income Bracket | Owner-occupied | Renter-occupied |
| Less than $5,000 | 1 (1.2%) | 8 (25.8%) |
| $5,000 to $9,999 | 0 (0.0%) | 0 (0.0%) |
| $10,000 to $14,999 | 7 (8.1%) | 0 (0.0%) |
| $15,000 to $19,999 | 0 (0.0%) | 0 (0.0%) |
| $20,000 to $24,999 | 0 (0.0%) | 0 (0.0%) |
| $25,000 to $34,999 | 11 (12.8%) | 4 (12.9%) |
| $35,000 to $49,999 | 18 (20.9%) | 15 (48.4%) |
| $50,000 to $74,999 | 11 (12.8%) | 0 (0.0%) |
| $75,000 to $99,999 | 13 (15.1%) | 3 (9.7%) |
| $100,000 to $149,999 | 18 (20.9%) | 1 (3.2%) |
| $150,000 or more | 7 (8.1%) | 0 (0.0%) |
| Total | 86 (100.0%) | 31 (100.0%) |
Monthly Housing Cost Tiers in Hysham
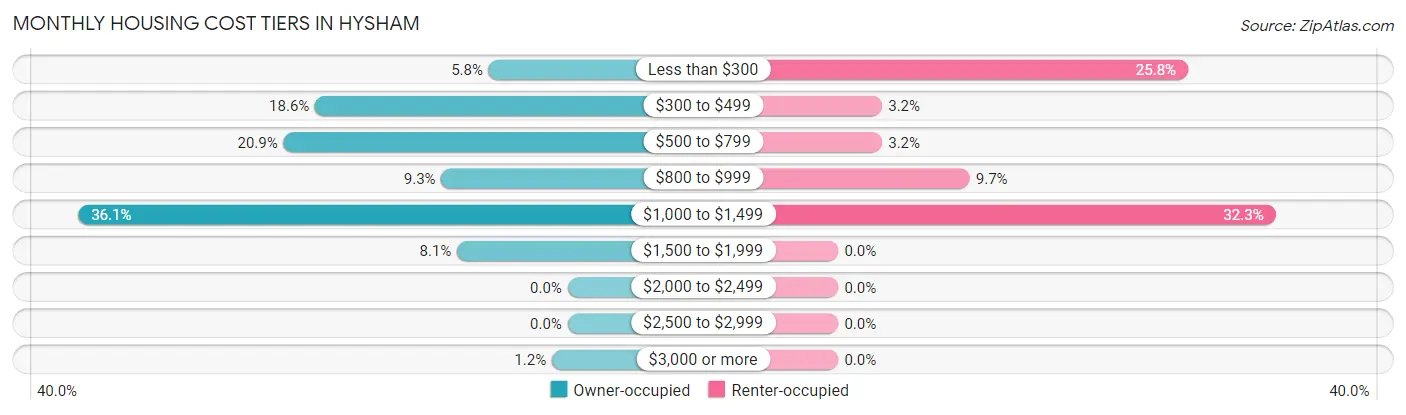
| Monthly Cost | Owner-occupied | Renter-occupied |
| Less than $300 | 5 (5.8%) | 8 (25.8%) |
| $300 to $499 | 16 (18.6%) | 1 (3.2%) |
| $500 to $799 | 18 (20.9%) | 1 (3.2%) |
| $800 to $999 | 8 (9.3%) | 3 (9.7%) |
| $1,000 to $1,499 | 31 (36.0%) | 10 (32.3%) |
| $1,500 to $1,999 | 7 (8.1%) | 0 (0.0%) |
| $2,000 to $2,499 | 0 (0.0%) | 0 (0.0%) |
| $2,500 to $2,999 | 0 (0.0%) | 0 (0.0%) |
| $3,000 or more | 1 (1.2%) | 0 (0.0%) |
| Total | 86 (100.0%) | 31 (100.0%) |
Physical Housing Characteristics in Hysham
Housing Structures in Hysham
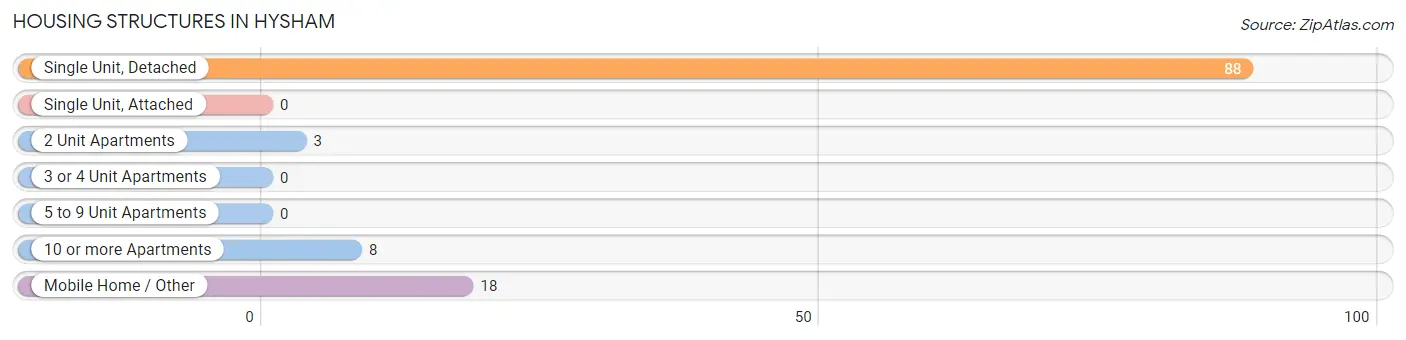
| Structure Type | # Housing Units | % Housing Units |
| Single Unit, Detached | 88 | 75.2% |
| Single Unit, Attached | 0 | 0.0% |
| 2 Unit Apartments | 3 | 2.6% |
| 3 or 4 Unit Apartments | 0 | 0.0% |
| 5 to 9 Unit Apartments | 0 | 0.0% |
| 10 or more Apartments | 8 | 6.8% |
| Mobile Home / Other | 18 | 15.4% |
| Total | 117 | 100.0% |
Housing Structures by Occupancy in Hysham
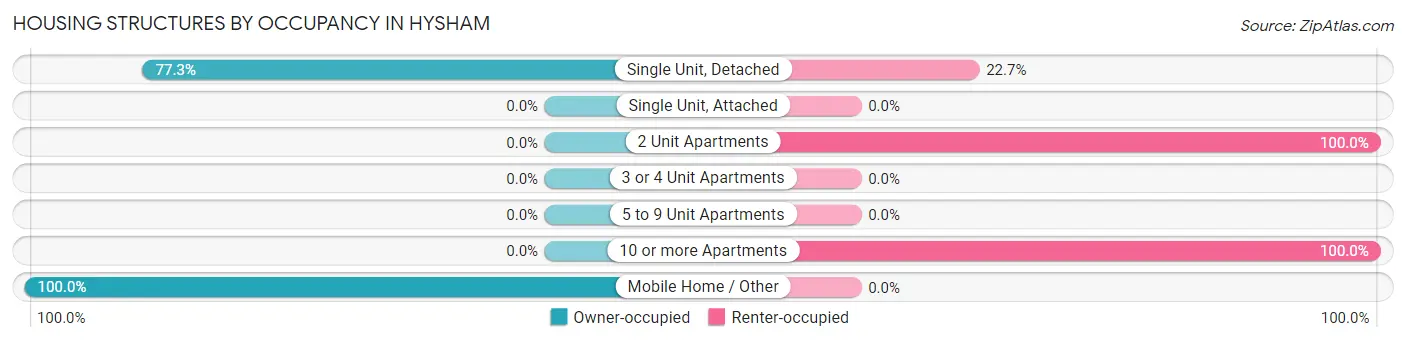
| Structure Type | Owner-occupied | Renter-occupied |
| Single Unit, Detached | 68 (77.3%) | 20 (22.7%) |
| Single Unit, Attached | 0 (0.0%) | 0 (0.0%) |
| 2 Unit Apartments | 0 (0.0%) | 3 (100.0%) |
| 3 or 4 Unit Apartments | 0 (0.0%) | 0 (0.0%) |
| 5 to 9 Unit Apartments | 0 (0.0%) | 0 (0.0%) |
| 10 or more Apartments | 0 (0.0%) | 8 (100.0%) |
| Mobile Home / Other | 18 (100.0%) | 0 (0.0%) |
| Total | 86 (73.5%) | 31 (26.5%) |
Housing Structures by Number of Rooms in Hysham
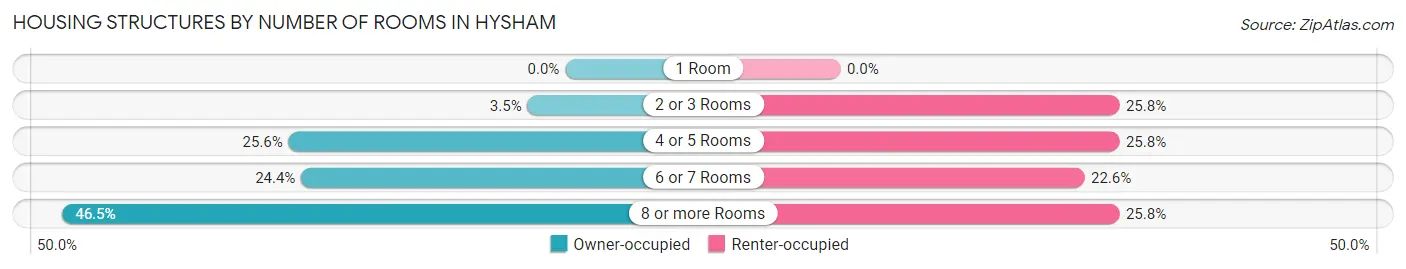
| Number of Rooms | Owner-occupied | Renter-occupied |
| 1 Room | 0 (0.0%) | 0 (0.0%) |
| 2 or 3 Rooms | 3 (3.5%) | 8 (25.8%) |
| 4 or 5 Rooms | 22 (25.6%) | 8 (25.8%) |
| 6 or 7 Rooms | 21 (24.4%) | 7 (22.6%) |
| 8 or more Rooms | 40 (46.5%) | 8 (25.8%) |
| Total | 86 (100.0%) | 31 (100.0%) |
Housing Structure by Heating Type in Hysham
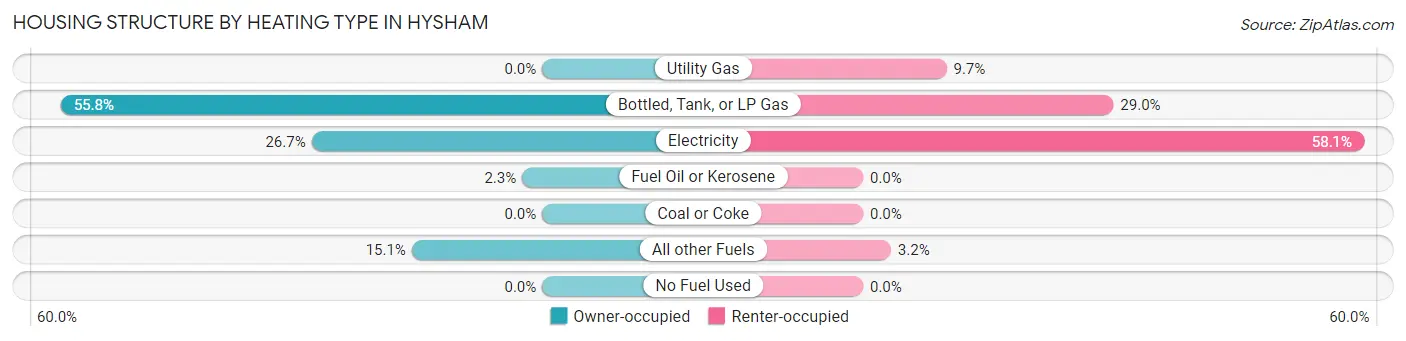
| Heating Type | Owner-occupied | Renter-occupied |
| Utility Gas | 0 (0.0%) | 3 (9.7%) |
| Bottled, Tank, or LP Gas | 48 (55.8%) | 9 (29.0%) |
| Electricity | 23 (26.7%) | 18 (58.1%) |
| Fuel Oil or Kerosene | 2 (2.3%) | 0 (0.0%) |
| Coal or Coke | 0 (0.0%) | 0 (0.0%) |
| All other Fuels | 13 (15.1%) | 1 (3.2%) |
| No Fuel Used | 0 (0.0%) | 0 (0.0%) |
| Total | 86 (100.0%) | 31 (100.0%) |
Household Vehicle Usage in Hysham
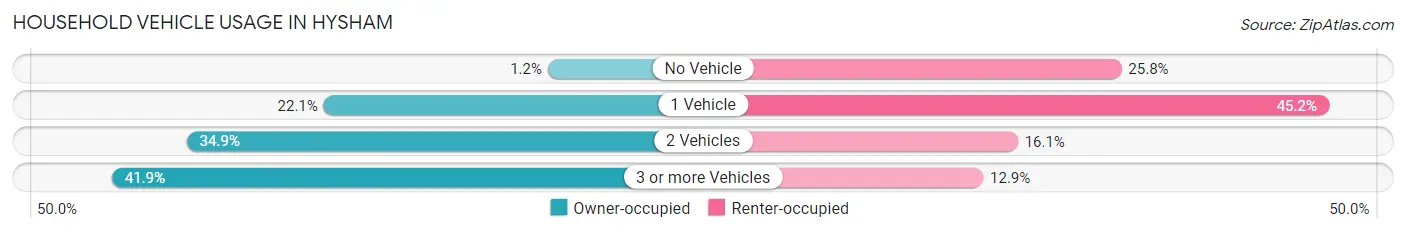
| Vehicles per Household | Owner-occupied | Renter-occupied |
| No Vehicle | 1 (1.2%) | 8 (25.8%) |
| 1 Vehicle | 19 (22.1%) | 14 (45.2%) |
| 2 Vehicles | 30 (34.9%) | 5 (16.1%) |
| 3 or more Vehicles | 36 (41.9%) | 4 (12.9%) |
| Total | 86 (100.0%) | 31 (100.0%) |
Real Estate & Mortgages in Hysham
Real Estate and Mortgage Overview in Hysham
| Characteristic | Without Mortgage | With Mortgage |
| Housing Units | 49 | 37 |
| Median Property Value | $85,000 | $154,500 |
| Median Household Income | $68,750 | $5 |
| Monthly Housing Costs | $558 | $0 |
| Real Estate Taxes | $983 | $4 |
Property Value by Mortgage Status in Hysham
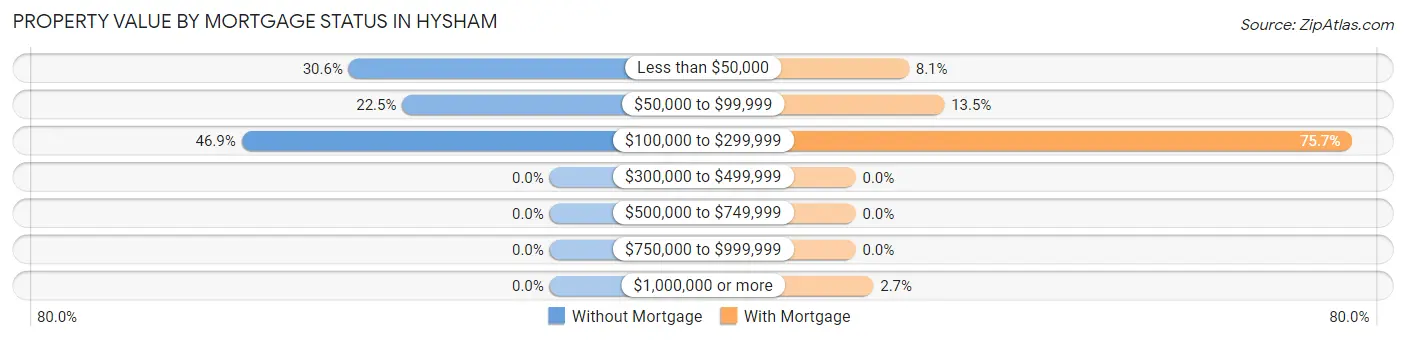
| Property Value | Without Mortgage | With Mortgage |
| Less than $50,000 | 15 (30.6%) | 3 (8.1%) |
| $50,000 to $99,999 | 11 (22.5%) | 5 (13.5%) |
| $100,000 to $299,999 | 23 (46.9%) | 28 (75.7%) |
| $300,000 to $499,999 | 0 (0.0%) | 0 (0.0%) |
| $500,000 to $749,999 | 0 (0.0%) | 0 (0.0%) |
| $750,000 to $999,999 | 0 (0.0%) | 0 (0.0%) |
| $1,000,000 or more | 0 (0.0%) | 1 (2.7%) |
| Total | 49 (100.0%) | 37 (100.0%) |
Household Income by Mortgage Status in Hysham
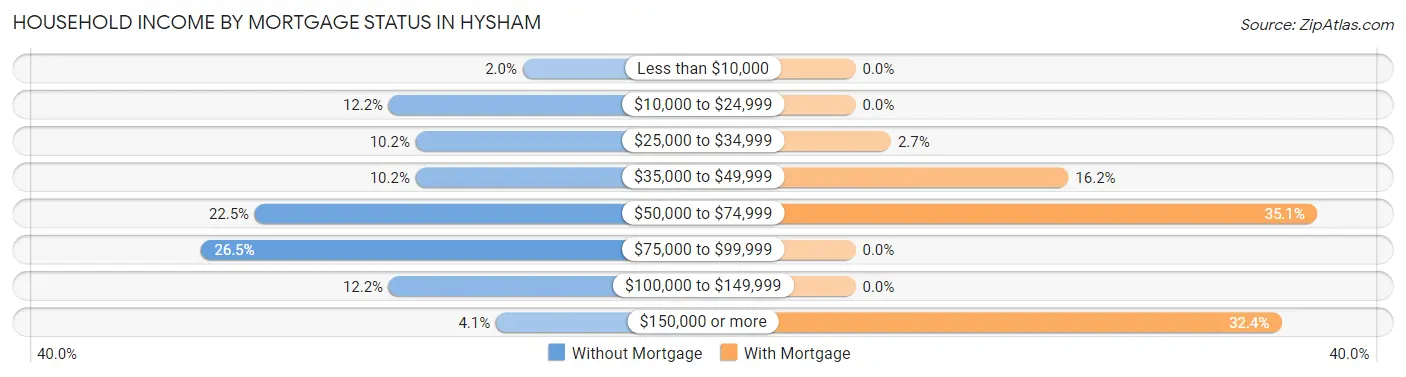
| Household Income | Without Mortgage | With Mortgage |
| Less than $10,000 | 1 (2.0%) | 0 (0.0%) |
| $10,000 to $24,999 | 6 (12.2%) | 0 (0.0%) |
| $25,000 to $34,999 | 5 (10.2%) | 1 (2.7%) |
| $35,000 to $49,999 | 5 (10.2%) | 6 (16.2%) |
| $50,000 to $74,999 | 11 (22.5%) | 13 (35.1%) |
| $75,000 to $99,999 | 13 (26.5%) | 0 (0.0%) |
| $100,000 to $149,999 | 6 (12.2%) | 0 (0.0%) |
| $150,000 or more | 2 (4.1%) | 12 (32.4%) |
| Total | 49 (100.0%) | 37 (100.0%) |
Property Value to Household Income Ratio in Hysham
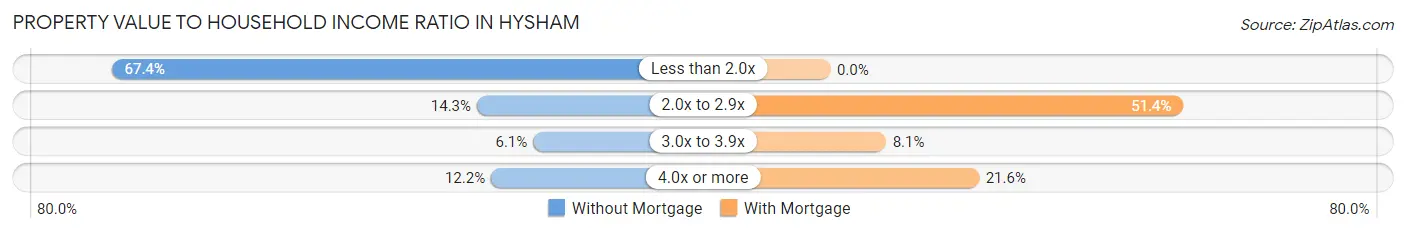
| Value-to-Income Ratio | Without Mortgage | With Mortgage |
| Less than 2.0x | 33 (67.3%) | 0 (0.0%) |
| 2.0x to 2.9x | 7 (14.3%) | 19 (51.3%) |
| 3.0x to 3.9x | 3 (6.1%) | 3 (8.1%) |
| 4.0x or more | 6 (12.2%) | 8 (21.6%) |
| Total | 49 (100.0%) | 37 (100.0%) |
Real Estate Taxes by Mortgage Status in Hysham
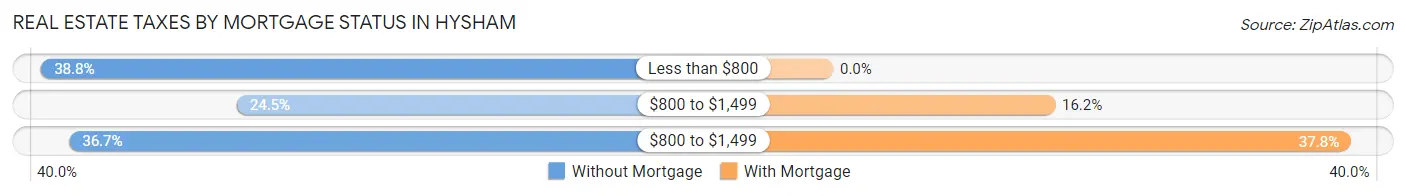
| Property Taxes | Without Mortgage | With Mortgage |
| Less than $800 | 19 (38.8%) | 0 (0.0%) |
| $800 to $1,499 | 12 (24.5%) | 6 (16.2%) |
| $800 to $1,499 | 18 (36.7%) | 14 (37.8%) |
| Total | 49 (100.0%) | 37 (100.0%) |
Health & Disability in Hysham
Health Insurance Coverage by Age in Hysham
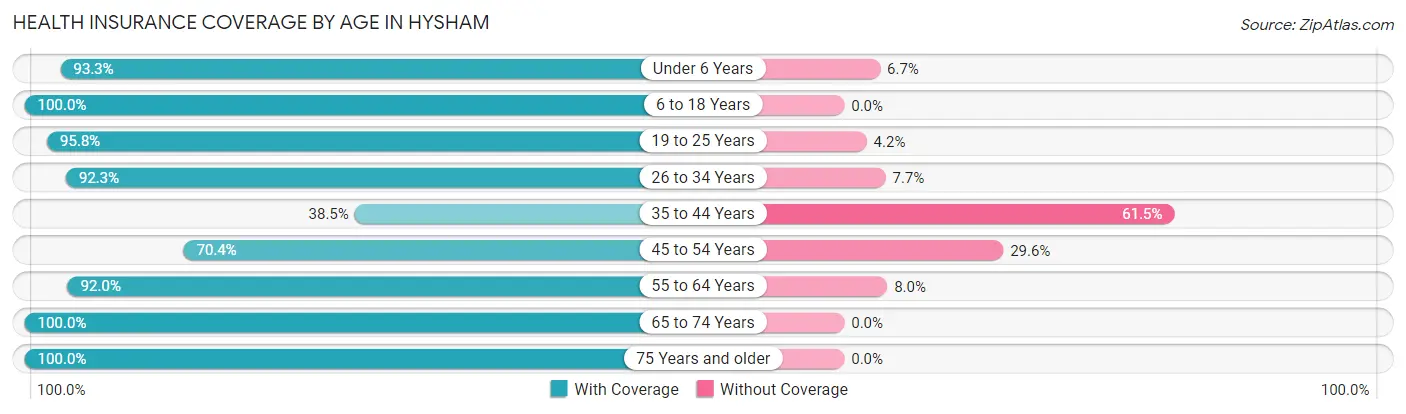
| Age Bracket | With Coverage | Without Coverage |
| Under 6 Years | 14 (93.3%) | 1 (6.7%) |
| 6 to 18 Years | 26 (100.0%) | 0 (0.0%) |
| 19 to 25 Years | 23 (95.8%) | 1 (4.2%) |
| 26 to 34 Years | 12 (92.3%) | 1 (7.7%) |
| 35 to 44 Years | 5 (38.5%) | 8 (61.5%) |
| 45 to 54 Years | 19 (70.4%) | 8 (29.6%) |
| 55 to 64 Years | 46 (92.0%) | 4 (8.0%) |
| 65 to 74 Years | 34 (100.0%) | 0 (0.0%) |
| 75 Years and older | 30 (100.0%) | 0 (0.0%) |
| Total | 209 (90.1%) | 23 (9.9%) |
Health Insurance Coverage by Citizenship Status in Hysham
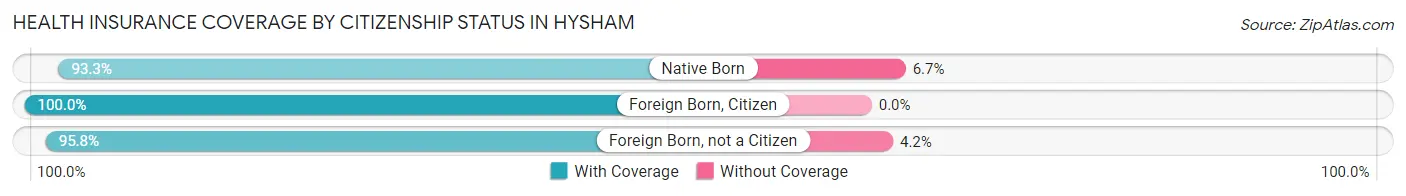
| Citizenship Status | With Coverage | Without Coverage |
| Native Born | 14 (93.3%) | 1 (6.7%) |
| Foreign Born, Citizen | 26 (100.0%) | 0 (0.0%) |
| Foreign Born, not a Citizen | 23 (95.8%) | 1 (4.2%) |
Health Insurance Coverage by Household Income in Hysham
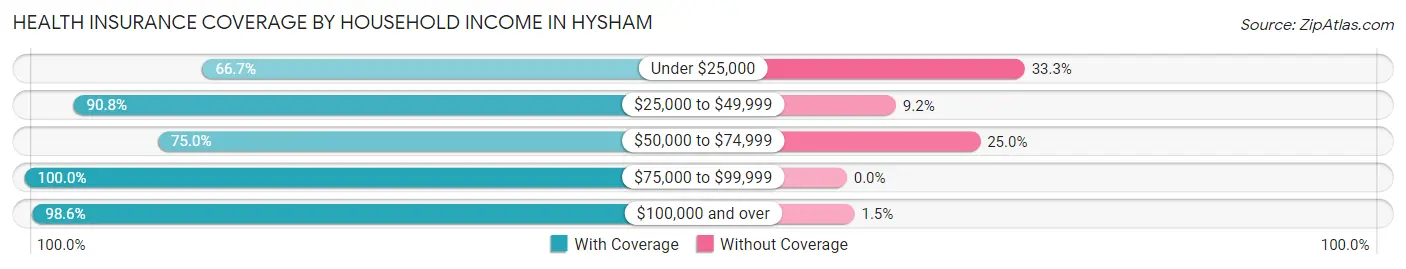
| Household Income | With Coverage | Without Coverage |
| Under $25,000 | 20 (66.7%) | 10 (33.3%) |
| $25,000 to $49,999 | 79 (90.8%) | 8 (9.2%) |
| $50,000 to $74,999 | 12 (75.0%) | 4 (25.0%) |
| $75,000 to $99,999 | 30 (100.0%) | 0 (0.0%) |
| $100,000 and over | 68 (98.6%) | 1 (1.5%) |
Public vs Private Health Insurance Coverage by Age in Hysham
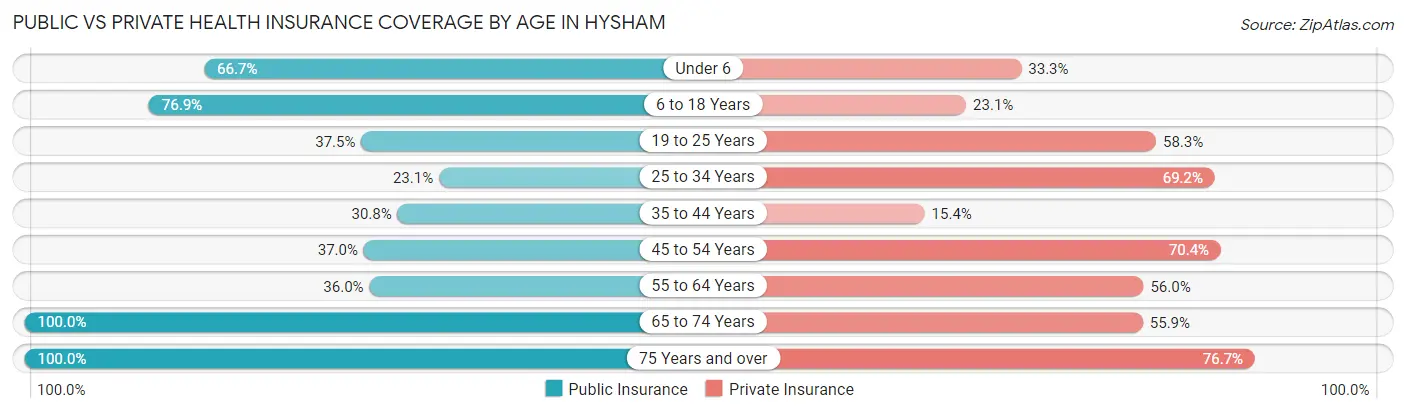
| Age Bracket | Public Insurance | Private Insurance |
| Under 6 | 10 (66.7%) | 5 (33.3%) |
| 6 to 18 Years | 20 (76.9%) | 6 (23.1%) |
| 19 to 25 Years | 9 (37.5%) | 14 (58.3%) |
| 25 to 34 Years | 3 (23.1%) | 9 (69.2%) |
| 35 to 44 Years | 4 (30.8%) | 2 (15.4%) |
| 45 to 54 Years | 10 (37.0%) | 19 (70.4%) |
| 55 to 64 Years | 18 (36.0%) | 28 (56.0%) |
| 65 to 74 Years | 34 (100.0%) | 19 (55.9%) |
| 75 Years and over | 30 (100.0%) | 23 (76.7%) |
| Total | 138 (59.5%) | 125 (53.9%) |
Disability Status by Sex by Age in Hysham
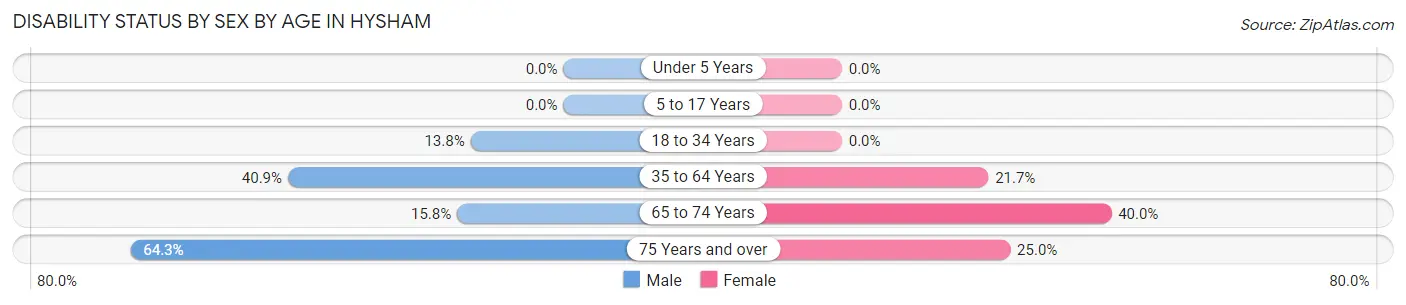
| Age Bracket | Male | Female |
| Under 5 Years | 0 (0.0%) | 0 (0.0%) |
| 5 to 17 Years | 0 (0.0%) | 0 (0.0%) |
| 18 to 34 Years | 4 (13.8%) | 0 (0.0%) |
| 35 to 64 Years | 18 (40.9%) | 10 (21.7%) |
| 65 to 74 Years | 3 (15.8%) | 6 (40.0%) |
| 75 Years and over | 9 (64.3%) | 4 (25.0%) |
Disability Class by Sex by Age in Hysham
Disability Class: Hearing Difficulty
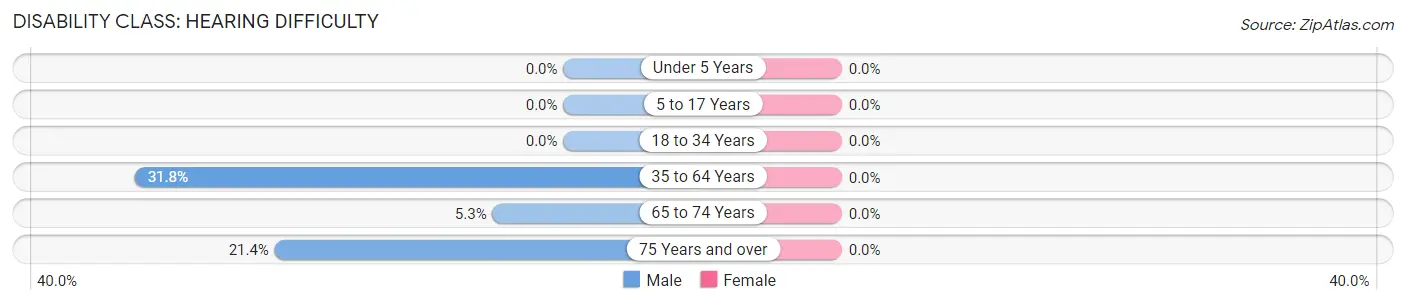
| Age Bracket | Male | Female |
| Under 5 Years | 0 (0.0%) | 0 (0.0%) |
| 5 to 17 Years | 0 (0.0%) | 0 (0.0%) |
| 18 to 34 Years | 0 (0.0%) | 0 (0.0%) |
| 35 to 64 Years | 14 (31.8%) | 0 (0.0%) |
| 65 to 74 Years | 1 (5.3%) | 0 (0.0%) |
| 75 Years and over | 3 (21.4%) | 0 (0.0%) |
Disability Class: Vision Difficulty
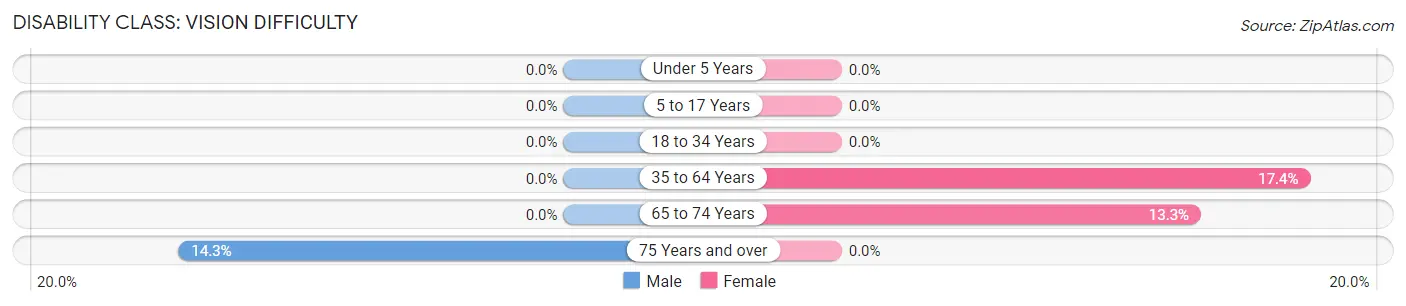
| Age Bracket | Male | Female |
| Under 5 Years | 0 (0.0%) | 0 (0.0%) |
| 5 to 17 Years | 0 (0.0%) | 0 (0.0%) |
| 18 to 34 Years | 0 (0.0%) | 0 (0.0%) |
| 35 to 64 Years | 0 (0.0%) | 8 (17.4%) |
| 65 to 74 Years | 0 (0.0%) | 2 (13.3%) |
| 75 Years and over | 2 (14.3%) | 0 (0.0%) |
Disability Class: Cognitive Difficulty
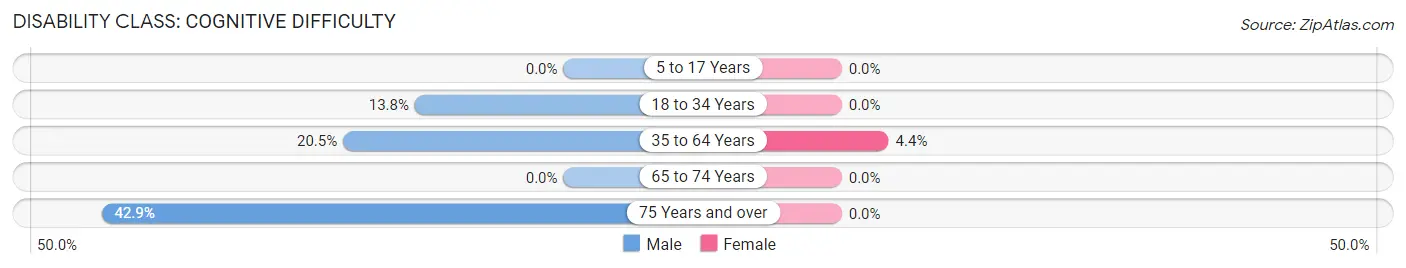
| Age Bracket | Male | Female |
| 5 to 17 Years | 0 (0.0%) | 0 (0.0%) |
| 18 to 34 Years | 4 (13.8%) | 0 (0.0%) |
| 35 to 64 Years | 9 (20.4%) | 2 (4.3%) |
| 65 to 74 Years | 0 (0.0%) | 0 (0.0%) |
| 75 Years and over | 6 (42.9%) | 0 (0.0%) |
Disability Class: Ambulatory Difficulty
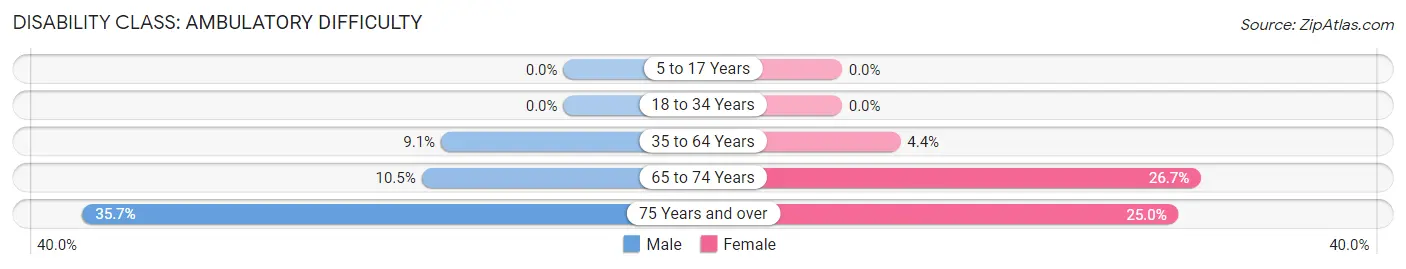
| Age Bracket | Male | Female |
| 5 to 17 Years | 0 (0.0%) | 0 (0.0%) |
| 18 to 34 Years | 0 (0.0%) | 0 (0.0%) |
| 35 to 64 Years | 4 (9.1%) | 2 (4.3%) |
| 65 to 74 Years | 2 (10.5%) | 4 (26.7%) |
| 75 Years and over | 5 (35.7%) | 4 (25.0%) |
Disability Class: Self-Care Difficulty
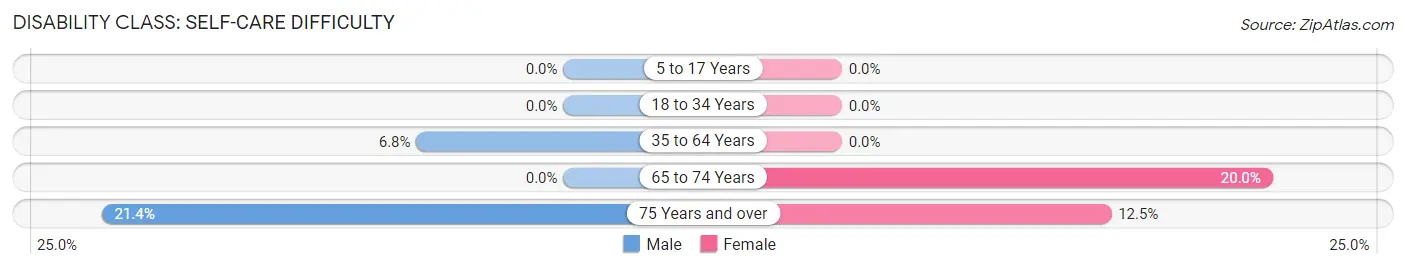
| Age Bracket | Male | Female |
| 5 to 17 Years | 0 (0.0%) | 0 (0.0%) |
| 18 to 34 Years | 0 (0.0%) | 0 (0.0%) |
| 35 to 64 Years | 3 (6.8%) | 0 (0.0%) |
| 65 to 74 Years | 0 (0.0%) | 3 (20.0%) |
| 75 Years and over | 3 (21.4%) | 2 (12.5%) |
Technology Access in Hysham
Computing Device Access in Hysham
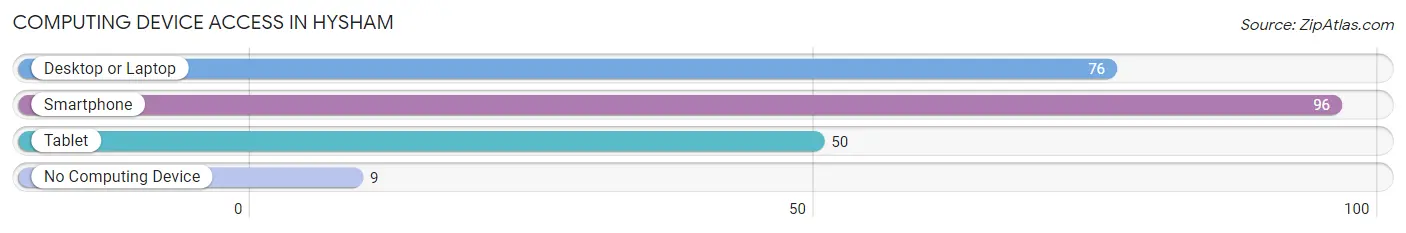
| Device Type | # Households | % Households |
| Desktop or Laptop | 76 | 65.0% |
| Smartphone | 96 | 82.1% |
| Tablet | 50 | 42.7% |
| No Computing Device | 9 | 7.7% |
| Total | 117 | 100.0% |
Internet Access in Hysham
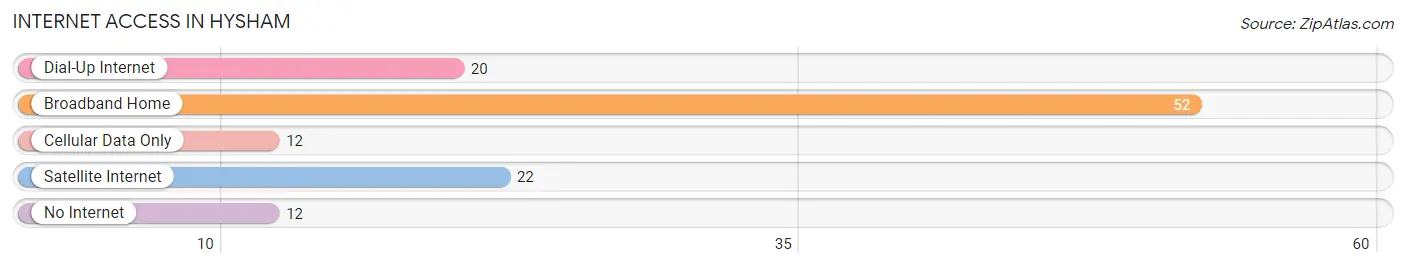
| Internet Type | # Households | % Households |
| Dial-Up Internet | 20 | 17.1% |
| Broadband Home | 52 | 44.4% |
| Cellular Data Only | 12 | 10.3% |
| Satellite Internet | 22 | 18.8% |
| No Internet | 12 | 10.3% |
| Total | 117 | 100.0% |
Hysham Summary
Hysham is a small town located in Treasure County, Montana, United States. It is situated along the Yellowstone River, approximately 20 miles east of Billings. The town was founded in 1882 and has a population of approximately 500 people.
Geography
Hysham is located in the Yellowstone Valley, which is part of the Great Plains region of the United States. The town is situated at an elevation of 3,000 feet above sea level. The climate in Hysham is semi-arid, with hot summers and cold winters. The average annual precipitation is approximately 12 inches.
The town is surrounded by rolling hills and prairies, with the Yellowstone River running through the center of town. The area is known for its abundance of wildlife, including deer, antelope, and elk.
Economy
The economy of Hysham is largely based on agriculture and ranching. The town is home to several large ranches, which produce beef, sheep, and hay. The town also has a small manufacturing sector, which produces a variety of products, including furniture, clothing, and leather goods.
The town is also home to several small businesses, including restaurants, grocery stores, and gas stations. The town also has a small airport, which serves as a hub for private and commercial flights.
Demographics
As of the 2010 census, the population of Hysham was 498 people. The racial makeup of the town was 97.2% White, 0.2% African American, 0.4% Native American, 0.2% Asian, 0.2% from other races, and 1.9% from two or more races. Hispanic or Latino of any race were 1.2% of the population.
The median income for a household in Hysham was $37,500, and the median income for a family was $41,250. The per capita income for the town was $17,845. About 11.2% of families and 13.2% of the population were below the poverty line, including 16.7% of those under age 18 and 8.3% of those age 65 or over.
Conclusion
Hysham is a small town located in Treasure County, Montana, United States. It is situated along the Yellowstone River, approximately 20 miles east of Billings. The town was founded in 1882 and has a population of approximately 500 people. The economy of Hysham is largely based on agriculture and ranching, and the town is also home to several small businesses. The racial makeup of the town is predominantly White, with a small percentage of African American, Native American, and Asian residents. The median income for a household in Hysham is $37,500, and the per capita income for the town is $17,845.
Common Questions
What is Per Capita Income in Hysham?
Per Capita income in Hysham is $34,720.
What is the Median Family Income in Hysham?
Median Family Income in Hysham is $66,250.
What is the Median Household income in Hysham?
Median Household Income in Hysham is $43,906.
What is Inequality or Gini Index in Hysham?
Inequality or Gini Index in Hysham is 0.47.
What is the Total Population of Hysham?
Total Population of Hysham is 232.
What is the Total Male Population of Hysham?
Total Male Population of Hysham is 120.
What is the Total Female Population of Hysham?
Total Female Population of Hysham is 112.
What is the Ratio of Males per 100 Females in Hysham?
There are 107.14 Males per 100 Females in Hysham.
What is the Ratio of Females per 100 Males in Hysham?
There are 93.33 Females per 100 Males in Hysham.
What is the Median Population Age in Hysham?
Median Population Age in Hysham is 54.8 Years.
What is the Average Family Size in Hysham
Average Family Size in Hysham is 2.3 People.
What is the Average Household Size in Hysham
Average Household Size in Hysham is 2.0 People.
How Large is the Labor Force in Hysham?
There are 107 People in the Labor Forcein in Hysham.
What is the Percentage of People in the Labor Force in Hysham?
55.4% of People are in the Labor Force in Hysham.
What is the Unemployment Rate in Hysham?
Unemployment Rate in Hysham is 3.7%.