International Falls, MN Map & Demographics
International Falls Map
International Falls Overview
$32,425
PER CAPITA INCOME
$73,426
AVG FAMILY INCOME
$54,680
AVG HOUSEHOLD INCOME
36.5%
WAGE / INCOME GAP [ % ]
63.5¢/ $1
WAGE / INCOME GAP [ $ ]
0.38
INEQUALITY / GINI INDEX
5,795
TOTAL POPULATION
2,951
MALE POPULATION
2,844
FEMALE POPULATION
103.76
MALES / 100 FEMALES
96.37
FEMALES / 100 MALES
47.7
MEDIAN AGE
2.8
AVG FAMILY SIZE
1.9
AVG HOUSEHOLD SIZE
2,807
LABOR FORCE [ PEOPLE ]
58.1%
PERCENT IN LABOR FORCE
6.9%
UNEMPLOYMENT RATE
International Falls Zip Codes
International Falls Area Codes
Income in International Falls
Income Overview in International Falls
Per Capita Income in International Falls is $32,425, while median incomes of families and households are $73,426 and $54,680 respectively.
| Characteristic | Number | Measure |
| Per Capita Income | 5,795 | $32,425 |
| Median Family Income | 1,312 | $73,426 |
| Mean Family Income | 1,312 | $81,931 |
| Median Household Income | 2,835 | $54,680 |
| Mean Household Income | 2,835 | $65,130 |
| Income Deficit | 1,312 | $0 |
| Wage / Income Gap (%) | 5,795 | 36.48% |
| Wage / Income Gap ($) | 5,795 | 63.52¢ per $1 |
| Gini / Inequality Index | 5,795 | 0.38 |
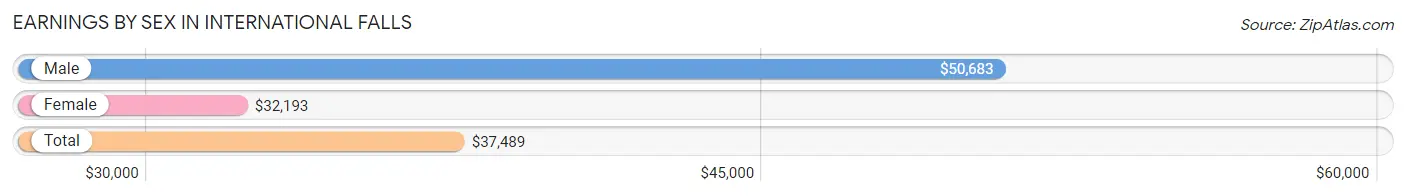
Earnings by Sex in International Falls
Average Earnings in International Falls are $37,489, $50,683 for men and $32,193 for women, a difference of 36.5%.
| Sex | Number | Average Earnings |
| Male | 1,458 (50.4%) | $50,683 |
| Female | 1,437 (49.6%) | $32,193 |
| Total | 2,895 (100.0%) | $37,489 |
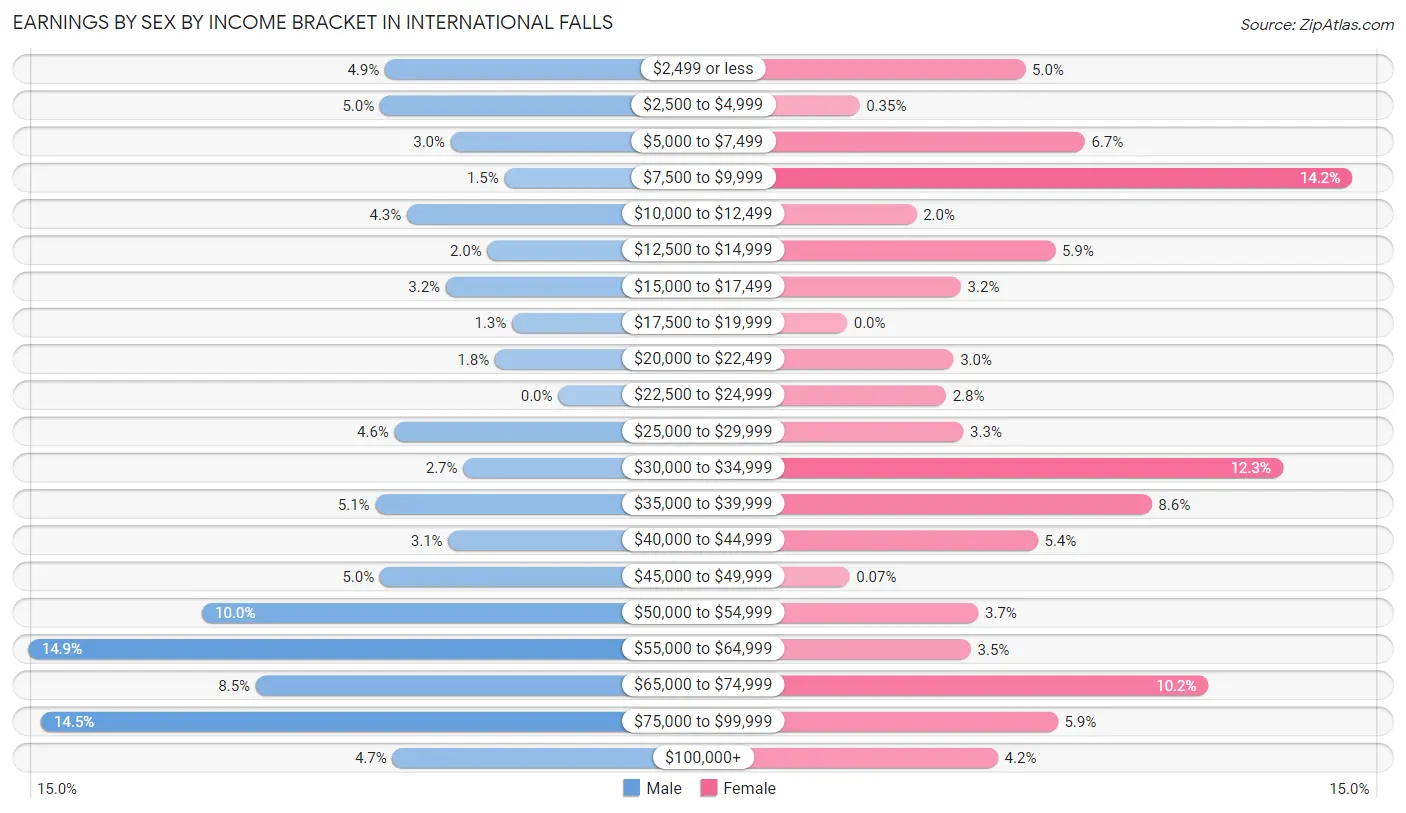
Earnings by Sex by Income Bracket in International Falls
The most common earnings brackets in International Falls are $55,000 to $64,999 for men (217 | 14.9%) and $7,500 to $9,999 for women (204 | 14.2%).
| Income | Male | Female |
| $2,499 or less | 71 (4.9%) | 72 (5.0%) |
| $2,500 to $4,999 | 73 (5.0%) | 5 (0.4%) |
| $5,000 to $7,499 | 44 (3.0%) | 96 (6.7%) |
| $7,500 to $9,999 | 22 (1.5%) | 204 (14.2%) |
| $10,000 to $12,499 | 62 (4.3%) | 28 (1.9%) |
| $12,500 to $14,999 | 29 (2.0%) | 84 (5.9%) |
| $15,000 to $17,499 | 46 (3.2%) | 46 (3.2%) |
| $17,500 to $19,999 | 19 (1.3%) | 0 (0.0%) |
| $20,000 to $22,499 | 26 (1.8%) | 43 (3.0%) |
| $22,500 to $24,999 | 0 (0.0%) | 40 (2.8%) |
| $25,000 to $29,999 | 67 (4.6%) | 47 (3.3%) |
| $30,000 to $34,999 | 39 (2.7%) | 176 (12.2%) |
| $35,000 to $39,999 | 75 (5.1%) | 123 (8.6%) |
| $40,000 to $44,999 | 45 (3.1%) | 77 (5.4%) |
| $45,000 to $49,999 | 73 (5.0%) | 1 (0.1%) |
| $50,000 to $54,999 | 146 (10.0%) | 53 (3.7%) |
| $55,000 to $64,999 | 217 (14.9%) | 50 (3.5%) |
| $65,000 to $74,999 | 124 (8.5%) | 146 (10.2%) |
| $75,000 to $99,999 | 212 (14.5%) | 85 (5.9%) |
| $100,000+ | 68 (4.7%) | 61 (4.2%) |
| Total | 1,458 (100.0%) | 1,437 (100.0%) |
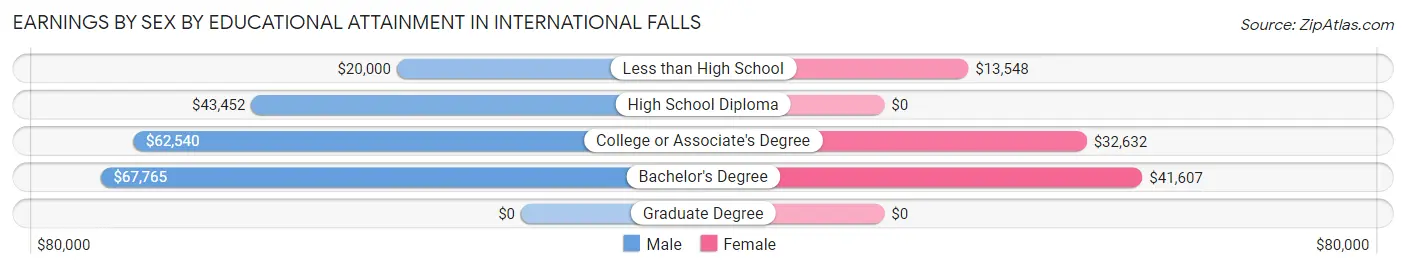
Earnings by Sex by Educational Attainment in International Falls
Average earnings in International Falls are $55,510 for men and $31,496 for women, a difference of 43.3%. Men with an educational attainment of bachelor's degree enjoy the highest average annual earnings of $67,765, while those with less than high school education earn the least with $20,000. Women with an educational attainment of bachelor's degree earn the most with the average annual earnings of $41,607, while those with less than high school education have the smallest earnings of $13,548.
| Educational Attainment | Male Income | Female Income |
| Less than High School | $20,000 | $13,548 |
| High School Diploma | $43,452 | $0 |
| College or Associate's Degree | $62,540 | $32,632 |
| Bachelor's Degree | $67,765 | $41,607 |
| Graduate Degree | - | - |
| Total | $55,510 | $31,496 |
Family Income in International Falls
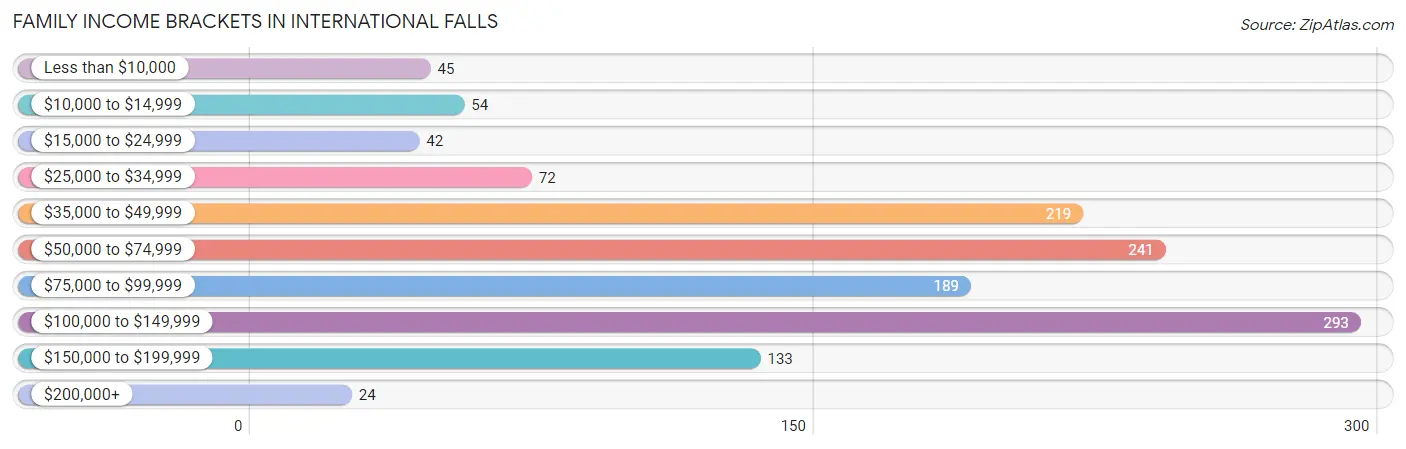
Family Income Brackets in International Falls
According to the International Falls family income data, there are 293 families falling into the $100,000 to $149,999 income range, which is the most common income bracket and makes up 22.3% of all families. Conversely, the $200,000+ income bracket is the least frequent group with only 24 families (1.8%) belonging to this category.
| Income Bracket | # Families | % Families |
| Less than $10,000 | 45 | 3.4% |
| $10,000 to $14,999 | 54 | 4.1% |
| $15,000 to $24,999 | 42 | 3.2% |
| $25,000 to $34,999 | 72 | 5.5% |
| $35,000 to $49,999 | 219 | 16.7% |
| $50,000 to $74,999 | 241 | 18.4% |
| $75,000 to $99,999 | 189 | 14.4% |
| $100,000 to $149,999 | 293 | 22.3% |
| $150,000 to $199,999 | 133 | 10.1% |
| $200,000+ | 24 | 1.8% |
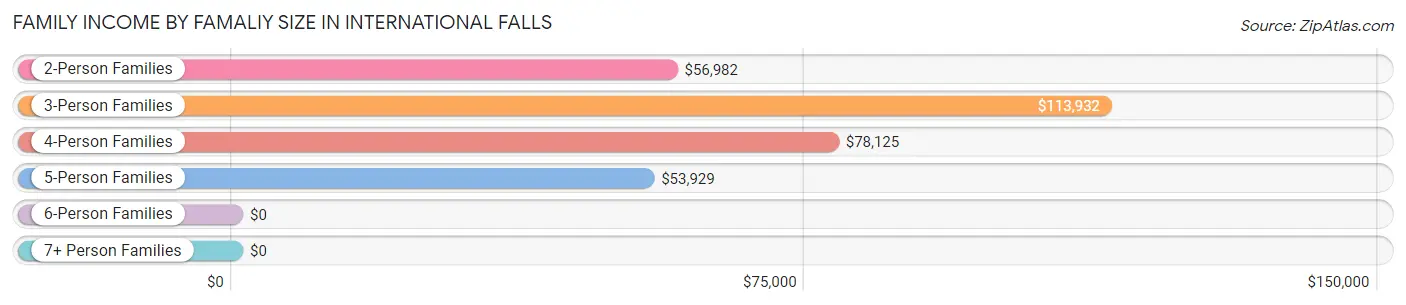
Family Income by Famaliy Size in International Falls
3-person families (283 | 21.6%) account for the highest median family income in International Falls with $113,932 per family, while 3-person families (283 | 21.6%) have the highest median income of $37,977 per family member.
| Income Bracket | # Families | Median Income |
| 2-Person Families | 685 (52.2%) | $56,982 |
| 3-Person Families | 283 (21.6%) | $113,932 |
| 4-Person Families | 276 (21.0%) | $78,125 |
| 5-Person Families | 68 (5.2%) | $53,929 |
| 6-Person Families | 0 (0.0%) | $0 |
| 7+ Person Families | 0 (0.0%) | $0 |
| Total | 1,312 (100.0%) | $73,426 |
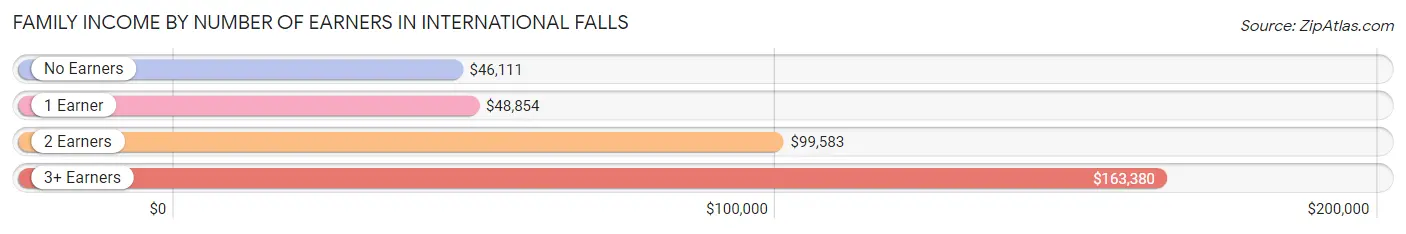
Family Income by Number of Earners in International Falls
The median family income in International Falls is $73,426, with families comprising 3+ earners (111) having the highest median family income of $163,380, while families with no earners (210) have the lowest median family income of $46,111, accounting for 8.5% and 16.0% of families, respectively.
| Number of Earners | # Families | Median Income |
| No Earners | 210 (16.0%) | $46,111 |
| 1 Earner | 449 (34.2%) | $48,854 |
| 2 Earners | 542 (41.3%) | $99,583 |
| 3+ Earners | 111 (8.5%) | $163,380 |
| Total | 1,312 (100.0%) | $73,426 |
Household Income in International Falls
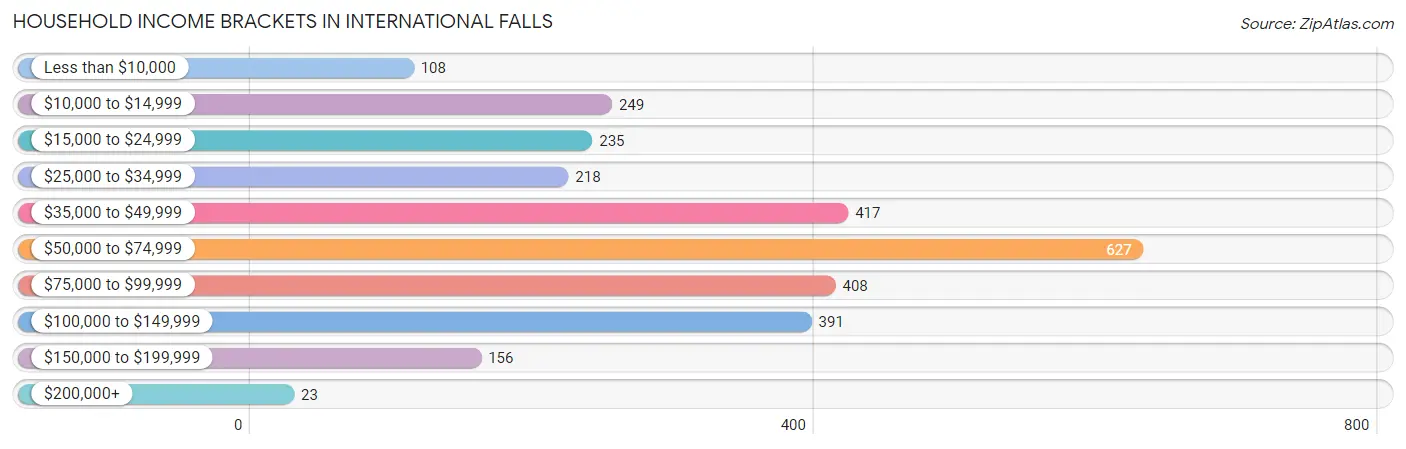
Household Income Brackets in International Falls
With 627 households falling in the category, the $50,000 to $74,999 income range is the most frequent in International Falls, accounting for 22.1% of all households. In contrast, only 23 households (0.8%) fall into the $200,000+ income bracket, making it the least populous group.
| Income Bracket | # Households | % Households |
| Less than $10,000 | 108 | 3.8% |
| $10,000 to $14,999 | 249 | 8.8% |
| $15,000 to $24,999 | 235 | 8.3% |
| $25,000 to $34,999 | 218 | 7.7% |
| $35,000 to $49,999 | 417 | 14.7% |
| $50,000 to $74,999 | 627 | 22.1% |
| $75,000 to $99,999 | 408 | 14.4% |
| $100,000 to $149,999 | 391 | 13.8% |
| $150,000 to $199,999 | 156 | 5.5% |
| $200,000+ | 23 | 0.8% |
Household Income by Householder Age in International Falls
The median household income in International Falls is $54,680, with the highest median household income of $86,394 found in the 15 to 24 years age bracket for the primary householder. A total of 197 households (7.0%) fall into this category. Meanwhile, the 65+ years age bracket for the primary householder has the lowest median household income of $47,708, with 983 households (34.7%) in this group.
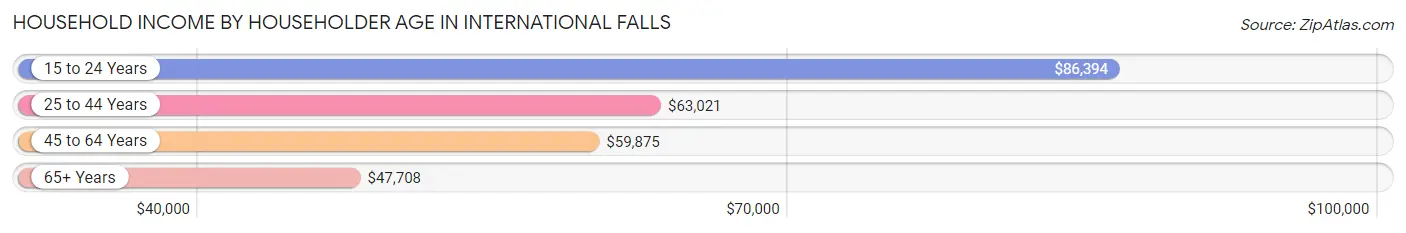
| Income Bracket | # Households | Median Income |
| 15 to 24 Years | 197 (7.0%) | $86,394 |
| 25 to 44 Years | 595 (21.0%) | $63,021 |
| 45 to 64 Years | 1,060 (37.4%) | $59,875 |
| 65+ Years | 983 (34.7%) | $47,708 |
| Total | 2,835 (100.0%) | $54,680 |
Poverty in International Falls
Income Below Poverty by Sex and Age in International Falls
With 13.1% poverty level for males and 17.0% for females among the residents of International Falls, 15 year old males and 16 and 17 year old females are the most vulnerable to poverty, with 53 males (62.4%) and 8 females (40.0%) in their respective age groups living below the poverty level.
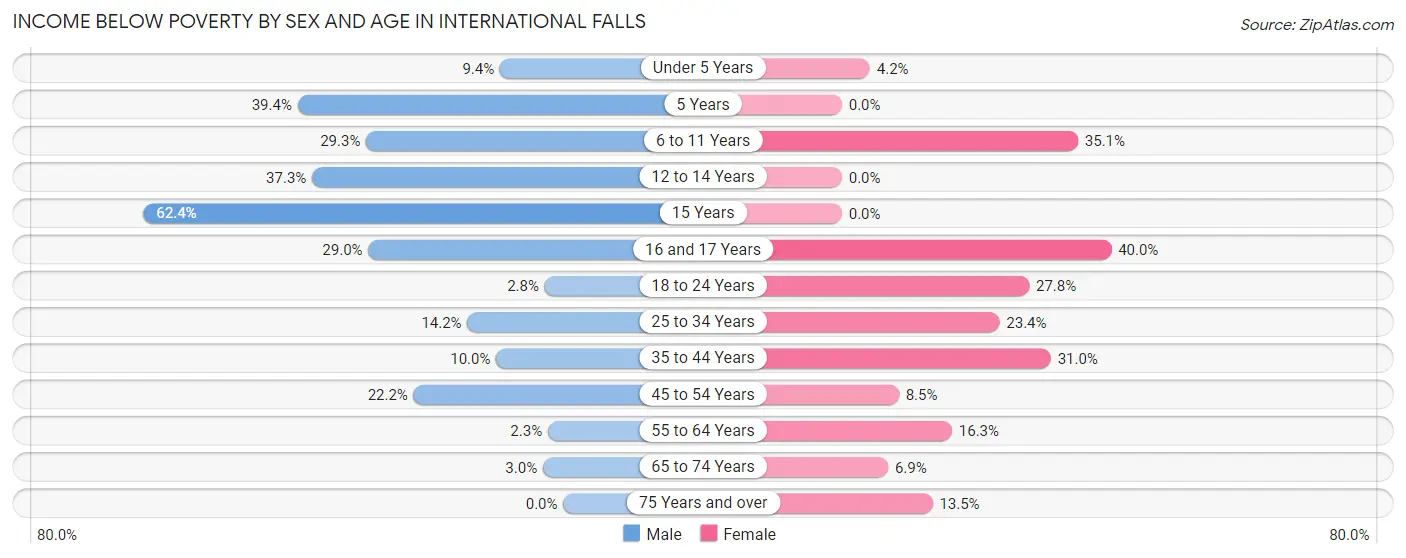
| Age Bracket | Male | Female |
| Under 5 Years | 11 (9.4%) | 4 (4.2%) |
| 5 Years | 28 (39.4%) | 0 (0.0%) |
| 6 to 11 Years | 48 (29.3%) | 68 (35.0%) |
| 12 to 14 Years | 47 (37.3%) | 0 (0.0%) |
| 15 Years | 53 (62.4%) | 0 (0.0%) |
| 16 and 17 Years | 22 (28.9%) | 8 (40.0%) |
| 18 to 24 Years | 6 (2.8%) | 57 (27.8%) |
| 25 to 34 Years | 45 (14.2%) | 84 (23.4%) |
| 35 to 44 Years | 26 (10.0%) | 58 (31.0%) |
| 45 to 54 Years | 66 (22.2%) | 31 (8.5%) |
| 55 to 64 Years | 11 (2.3%) | 83 (16.3%) |
| 65 to 74 Years | 13 (3.0%) | 28 (6.9%) |
| 75 Years and over | 0 (0.0%) | 35 (13.5%) |
| Total | 376 (13.1%) | 456 (17.0%) |
Income Above Poverty by Sex and Age in International Falls
According to the poverty statistics in International Falls, males aged 75 years and over and females aged 5 years are the age groups that are most secure financially, with 100.0% of males and 100.0% of females in these age groups living above the poverty line.
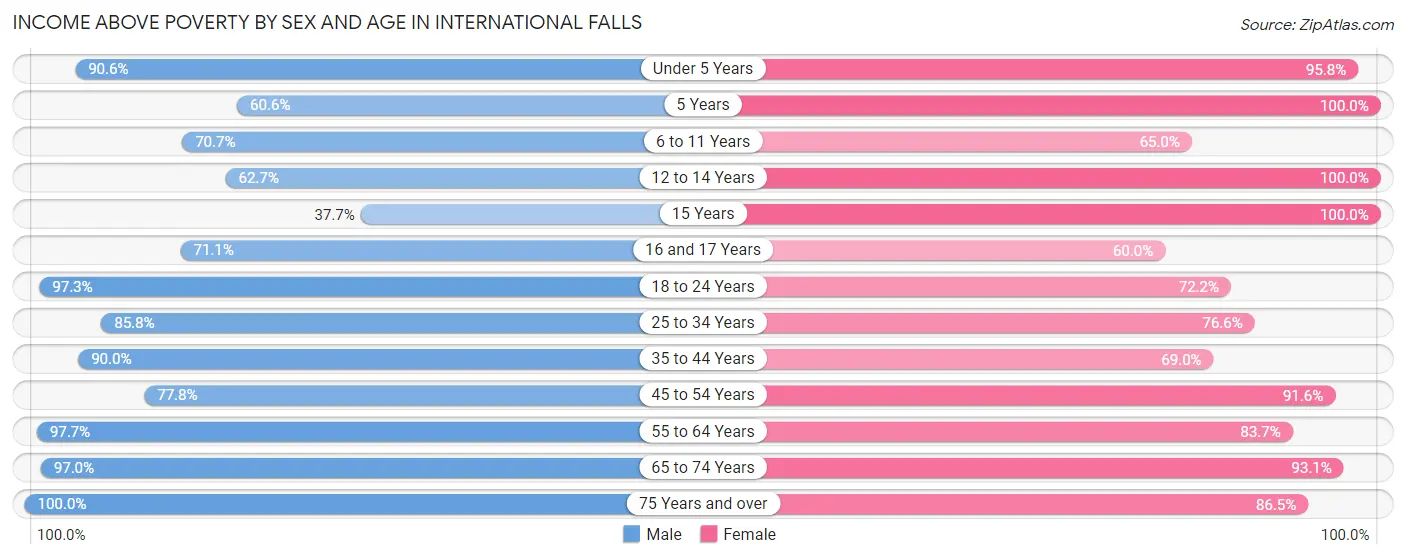
| Age Bracket | Male | Female |
| Under 5 Years | 106 (90.6%) | 92 (95.8%) |
| 5 Years | 43 (60.6%) | 3 (100.0%) |
| 6 to 11 Years | 116 (70.7%) | 126 (64.9%) |
| 12 to 14 Years | 79 (62.7%) | 43 (100.0%) |
| 15 Years | 32 (37.7%) | 39 (100.0%) |
| 16 and 17 Years | 54 (71.1%) | 12 (60.0%) |
| 18 to 24 Years | 212 (97.3%) | 148 (72.2%) |
| 25 to 34 Years | 271 (85.8%) | 275 (76.6%) |
| 35 to 44 Years | 235 (90.0%) | 129 (69.0%) |
| 45 to 54 Years | 231 (77.8%) | 336 (91.5%) |
| 55 to 64 Years | 472 (97.7%) | 425 (83.7%) |
| 65 to 74 Years | 418 (97.0%) | 380 (93.1%) |
| 75 Years and over | 223 (100.0%) | 225 (86.5%) |
| Total | 2,492 (86.9%) | 2,233 (83.0%) |
Income Below Poverty Among Married-Couple Families in International Falls
The poverty statistics for married-couple families in International Falls show that 3.2% or 28 of the total 879 families live below the poverty line. Families with 1 or 2 children have the highest poverty rate of 10.5%, comprising of 25 families. On the other hand, families with 3 or 4 children have the lowest poverty rate of 0.0%, which includes 0 families.
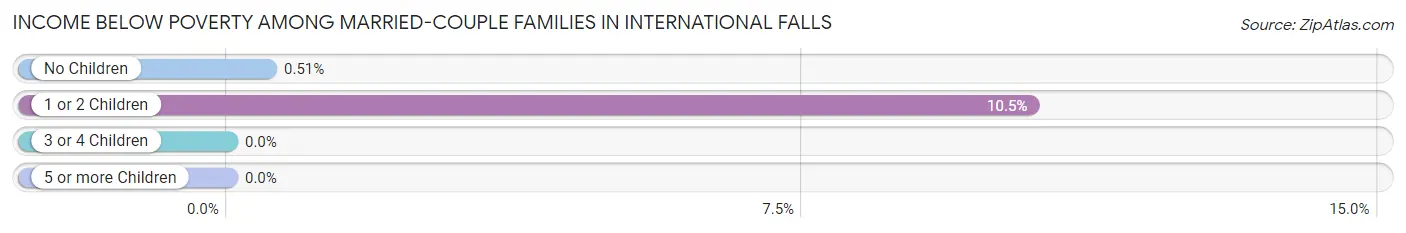
| Children | Above Poverty | Below Poverty |
| No Children | 591 (99.5%) | 3 (0.5%) |
| 1 or 2 Children | 214 (89.5%) | 25 (10.5%) |
| 3 or 4 Children | 46 (100.0%) | 0 (0.0%) |
| 5 or more Children | 0 (0.0%) | 0 (0.0%) |
| Total | 851 (96.8%) | 28 (3.2%) |
Income Below Poverty Among Single-Parent Households in International Falls
According to the poverty data in International Falls, 4.5% or 5 single-father households and 32.3% or 104 single-mother households are living below the poverty line. Among single-father households, those with 1 or 2 children have the highest poverty rate, with 5 households (7.8%) experiencing poverty. Likewise, among single-mother households, those with 3 or 4 children have the highest poverty rate, with 53 households (76.8%) falling below the poverty line.
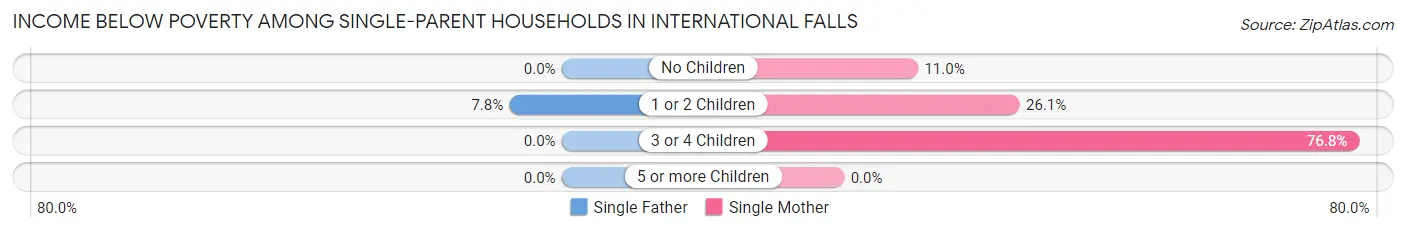
| Children | Single Father | Single Mother |
| No Children | 0 (0.0%) | 11 (11.0%) |
| 1 or 2 Children | 5 (7.8%) | 40 (26.1%) |
| 3 or 4 Children | 0 (0.0%) | 53 (76.8%) |
| 5 or more Children | 0 (0.0%) | 0 (0.0%) |
| Total | 5 (4.5%) | 104 (32.3%) |
Income Below Poverty Among Married-Couple vs Single-Parent Households in International Falls
The poverty data for International Falls shows that 28 of the married-couple family households (3.2%) and 109 of the single-parent households (25.2%) are living below the poverty level. Within the married-couple family households, those with 1 or 2 children have the highest poverty rate, with 25 households (10.5%) falling below the poverty line. Among the single-parent households, those with 3 or 4 children have the highest poverty rate, with 53 household (67.1%) living below poverty.
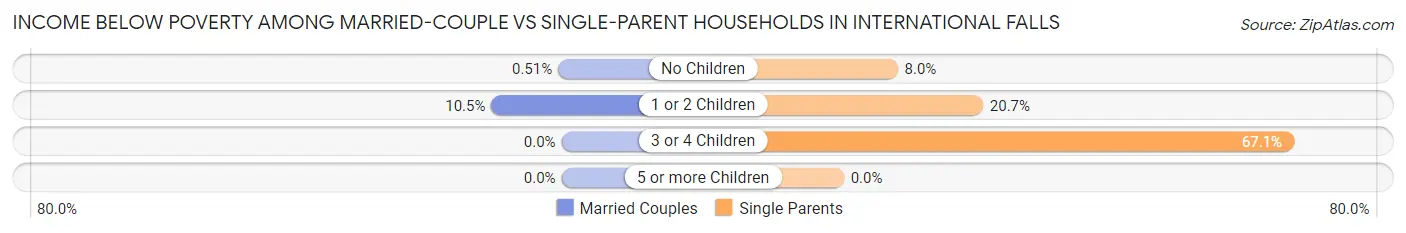
| Children | Married-Couple Families | Single-Parent Households |
| No Children | 3 (0.5%) | 11 (8.0%) |
| 1 or 2 Children | 25 (10.5%) | 45 (20.7%) |
| 3 or 4 Children | 0 (0.0%) | 53 (67.1%) |
| 5 or more Children | 0 (0.0%) | 0 (0.0%) |
| Total | 28 (3.2%) | 109 (25.2%) |
Race in International Falls
The most populous races in International Falls are White / Caucasian (5,335 | 92.1%), Two or more Races (220 | 3.8%), and Native / Alaskan (116 | 2.0%).
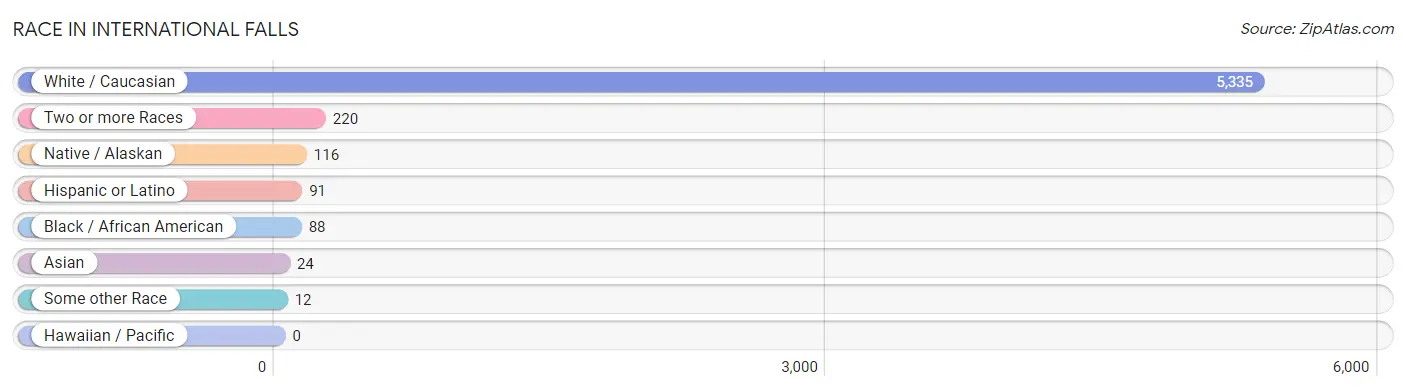
| Race | # Population | % Population |
| Asian | 24 | 0.4% |
| Black / African American | 88 | 1.5% |
| Hawaiian / Pacific | 0 | 0.0% |
| Hispanic or Latino | 91 | 1.6% |
| Native / Alaskan | 116 | 2.0% |
| White / Caucasian | 5,335 | 92.1% |
| Two or more Races | 220 | 3.8% |
| Some other Race | 12 | 0.2% |
| Total | 5,795 | 100.0% |
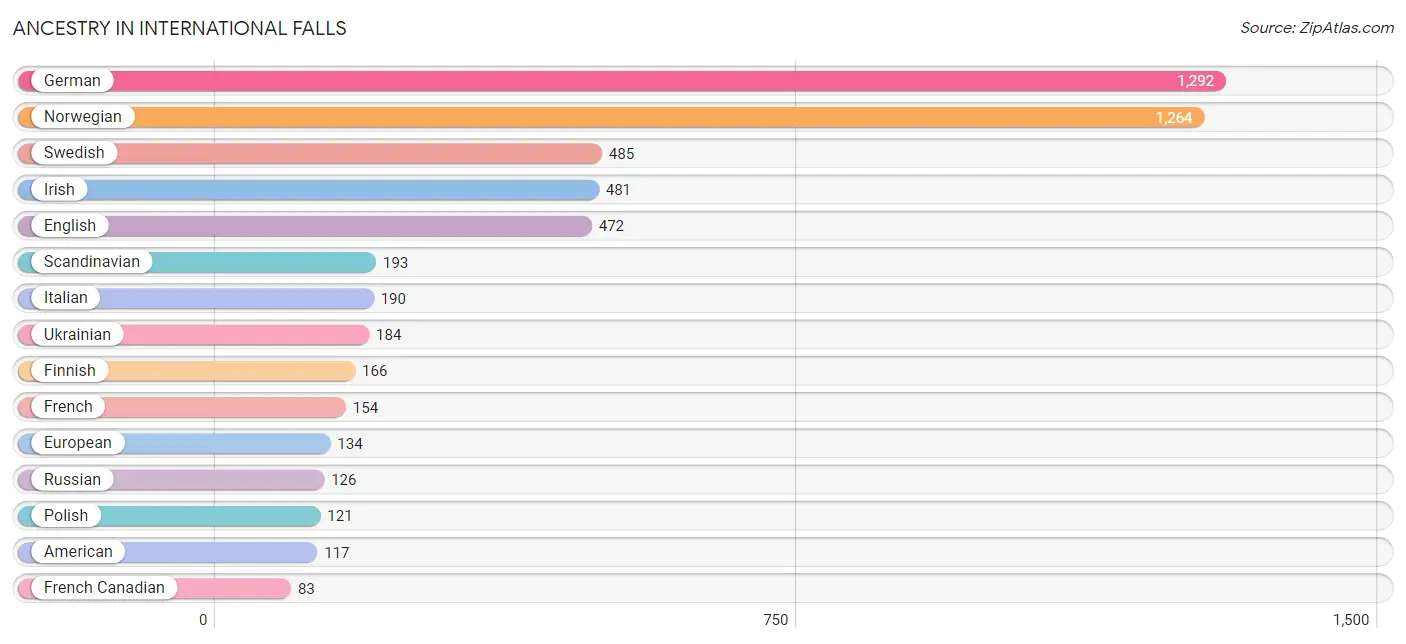
Ancestry in International Falls
The most populous ancestries reported in International Falls are German (1,292 | 22.3%), Norwegian (1,264 | 21.8%), Swedish (485 | 8.4%), Irish (481 | 8.3%), and English (472 | 8.1%), together accounting for 68.9% of all International Falls residents.
| Ancestry | # Population | % Population |
| African | 1 | 0.0% |
| Alaska Native | 12 | 0.2% |
| American | 117 | 2.0% |
| Apache | 16 | 0.3% |
| Austrian | 3 | 0.1% |
| Burmese | 22 | 0.4% |
| Canadian | 3 | 0.1% |
| Central American | 6 | 0.1% |
| Chippewa | 79 | 1.4% |
| Croatian | 4 | 0.1% |
| Czech | 27 | 0.5% |
| Dominican | 6 | 0.1% |
| Dutch | 50 | 0.9% |
| Eastern European | 15 | 0.3% |
| English | 472 | 8.1% |
| European | 134 | 2.3% |
| Finnish | 166 | 2.9% |
| French | 154 | 2.7% |
| French American Indian | 36 | 0.6% |
| French Canadian | 83 | 1.4% |
| German | 1,292 | 22.3% |
| Irish | 481 | 8.3% |
| Italian | 190 | 3.3% |
| Japanese | 15 | 0.3% |
| Korean | 10 | 0.2% |
| Luxembourger | 4 | 0.1% |
| Malaysian | 2 | 0.0% |
| Mexican | 43 | 0.7% |
| Northern European | 19 | 0.3% |
| Norwegian | 1,264 | 21.8% |
| Panamanian | 6 | 0.1% |
| Polish | 121 | 2.1% |
| Romanian | 3 | 0.1% |
| Russian | 126 | 2.2% |
| Scandinavian | 193 | 3.3% |
| Scotch-Irish | 43 | 0.7% |
| Scottish | 27 | 0.5% |
| Sioux | 16 | 0.3% |
| Slovak | 8 | 0.1% |
| Subsaharan African | 1 | 0.0% |
| Swedish | 485 | 8.4% |
| Ukrainian | 184 | 3.2% |
| Welsh | 3 | 0.1% |
| Yaqui | 2 | 0.0% | View All 44 Rows |
Immigrants in International Falls
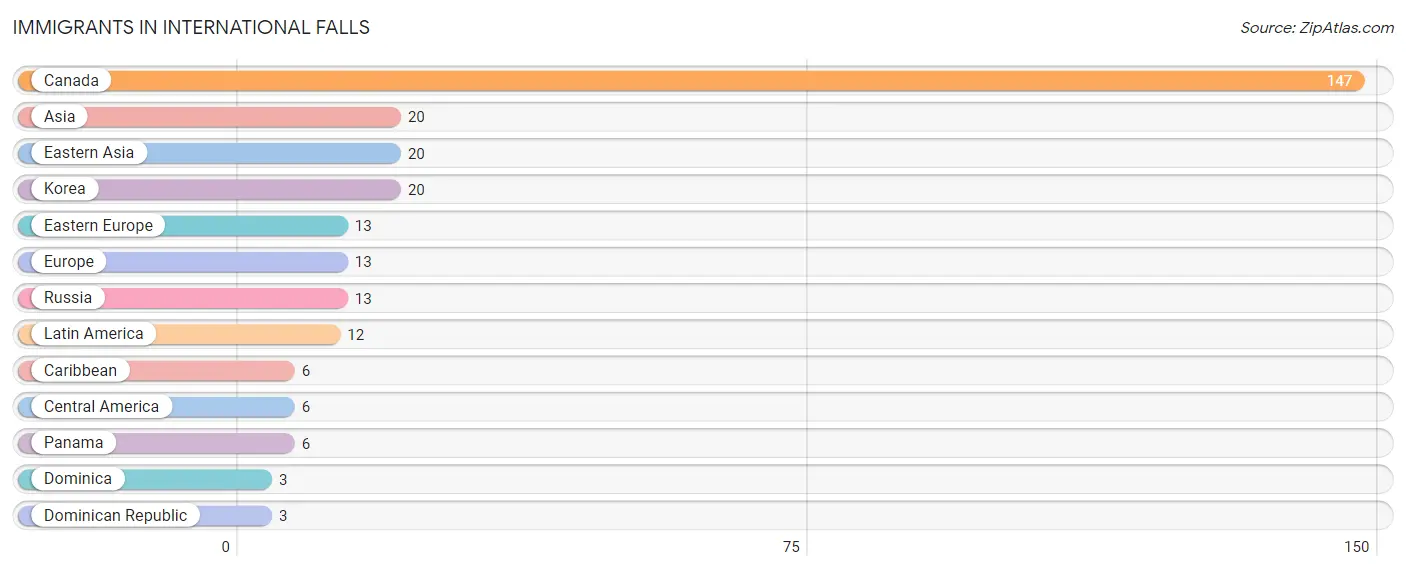
The most numerous immigrant groups reported in International Falls came from Canada (147 | 2.5%), Asia (20 | 0.4%), Eastern Asia (20 | 0.4%), Korea (20 | 0.4%), and Eastern Europe (13 | 0.2%), together accounting for 3.8% of all International Falls residents.
| Immigration Origin | # Population | % Population |
| Asia | 20 | 0.4% |
| Canada | 147 | 2.5% |
| Caribbean | 6 | 0.1% |
| Central America | 6 | 0.1% |
| Dominica | 3 | 0.1% |
| Dominican Republic | 3 | 0.1% |
| Eastern Asia | 20 | 0.4% |
| Eastern Europe | 13 | 0.2% |
| Europe | 13 | 0.2% |
| Korea | 20 | 0.4% |
| Latin America | 12 | 0.2% |
| Panama | 6 | 0.1% |
| Russia | 13 | 0.2% | View All 13 Rows |
Sex and Age in International Falls
Sex and Age in International Falls
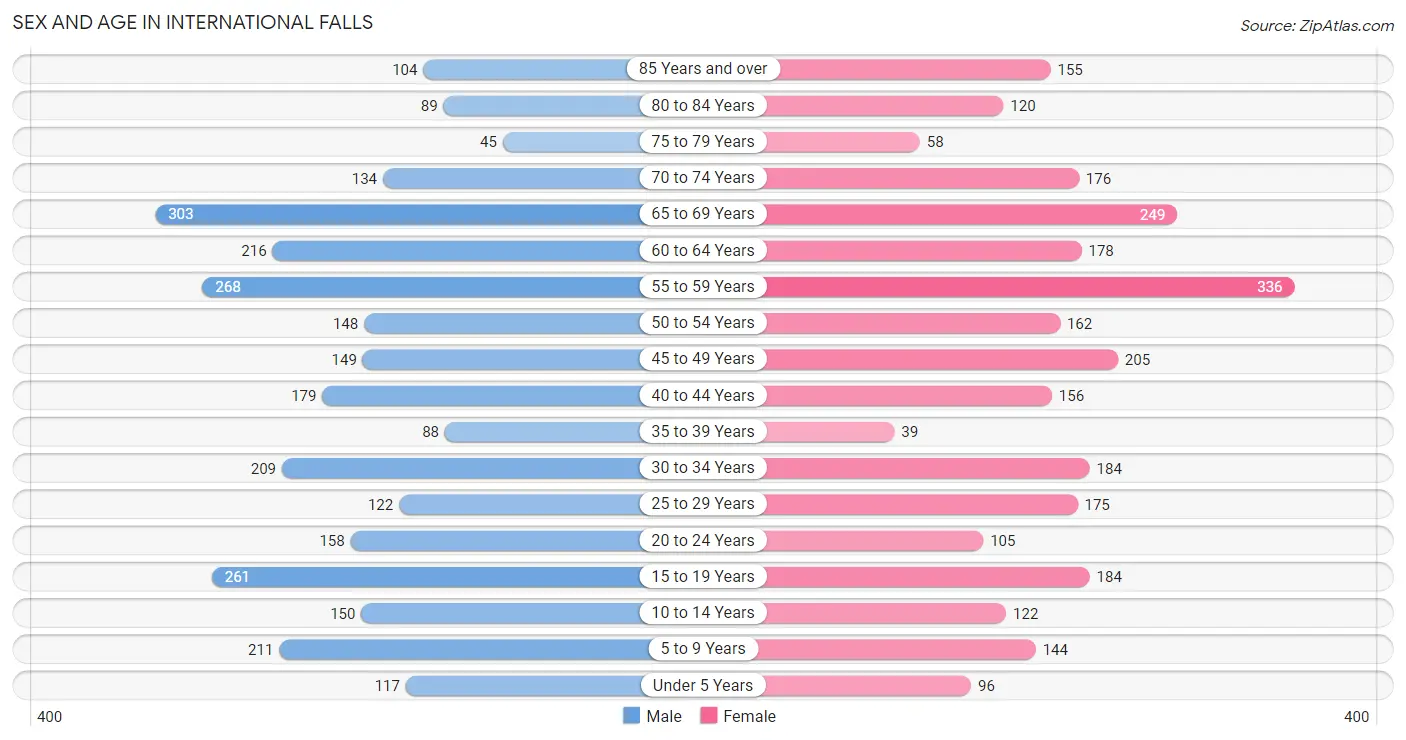
The most populous age groups in International Falls are 65 to 69 Years (303 | 10.3%) for men and 55 to 59 Years (336 | 11.8%) for women.
| Age Bracket | Male | Female |
| Under 5 Years | 117 (4.0%) | 96 (3.4%) |
| 5 to 9 Years | 211 (7.1%) | 144 (5.1%) |
| 10 to 14 Years | 150 (5.1%) | 122 (4.3%) |
| 15 to 19 Years | 261 (8.8%) | 184 (6.5%) |
| 20 to 24 Years | 158 (5.3%) | 105 (3.7%) |
| 25 to 29 Years | 122 (4.1%) | 175 (6.1%) |
| 30 to 34 Years | 209 (7.1%) | 184 (6.5%) |
| 35 to 39 Years | 88 (3.0%) | 39 (1.4%) |
| 40 to 44 Years | 179 (6.1%) | 156 (5.5%) |
| 45 to 49 Years | 149 (5.1%) | 205 (7.2%) |
| 50 to 54 Years | 148 (5.0%) | 162 (5.7%) |
| 55 to 59 Years | 268 (9.1%) | 336 (11.8%) |
| 60 to 64 Years | 216 (7.3%) | 178 (6.3%) |
| 65 to 69 Years | 303 (10.3%) | 249 (8.8%) |
| 70 to 74 Years | 134 (4.5%) | 176 (6.2%) |
| 75 to 79 Years | 45 (1.5%) | 58 (2.0%) |
| 80 to 84 Years | 89 (3.0%) | 120 (4.2%) |
| 85 Years and over | 104 (3.5%) | 155 (5.4%) |
| Total | 2,951 (100.0%) | 2,844 (100.0%) |
Families and Households in International Falls
Median Family Size in International Falls
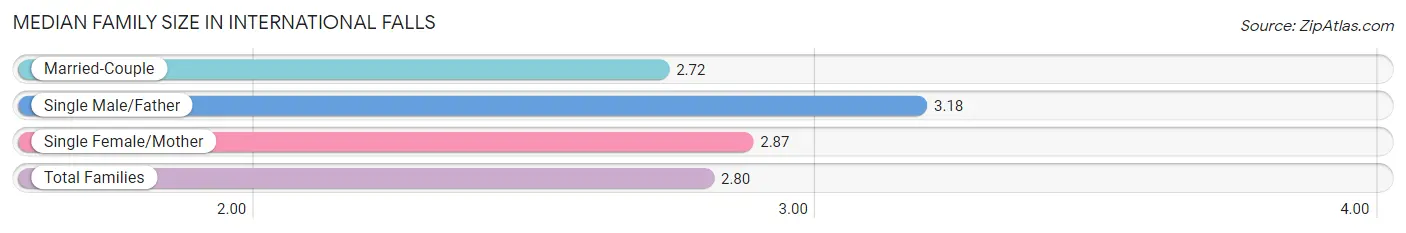
The median family size in International Falls is 2.80 persons per family, with single male/father families (111 | 8.5%) accounting for the largest median family size of 3.18 persons per family. On the other hand, married-couple families (879 | 67.0%) represent the smallest median family size with 2.72 persons per family.
| Family Type | # Families | Family Size |
| Married-Couple | 879 (67.0%) | 2.72 |
| Single Male/Father | 111 (8.5%) | 3.18 |
| Single Female/Mother | 322 (24.5%) | 2.87 |
| Total Families | 1,312 (100.0%) | 2.80 |
Median Household Size in International Falls
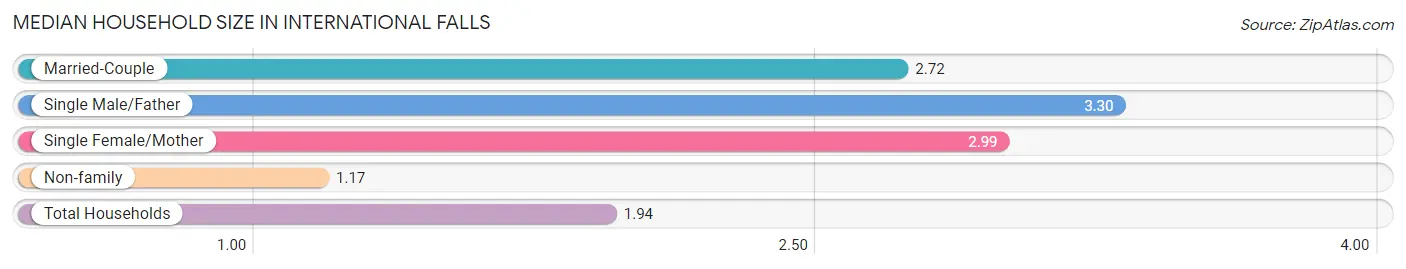
The median household size in International Falls is 1.94 persons per household, with single male/father households (111 | 3.9%) accounting for the largest median household size of 3.3 persons per household. non-family households (1,523 | 53.7%) represent the smallest median household size with 1.17 persons per household.
| Household Type | # Households | Household Size |
| Married-Couple | 879 (31.0%) | 2.72 |
| Single Male/Father | 111 (3.9%) | 3.30 |
| Single Female/Mother | 322 (11.4%) | 2.99 |
| Non-family | 1,523 (53.7%) | 1.17 |
| Total Households | 2,835 (100.0%) | 1.94 |
Household Size by Marriage Status in International Falls
Out of a total of 2,835 households in International Falls, 1,312 (46.3%) are family households, while 1,523 (53.7%) are nonfamily households. The most numerous type of family households are 2-person households, comprising 677, and the most common type of nonfamily households are 1-person households, comprising 1,253.
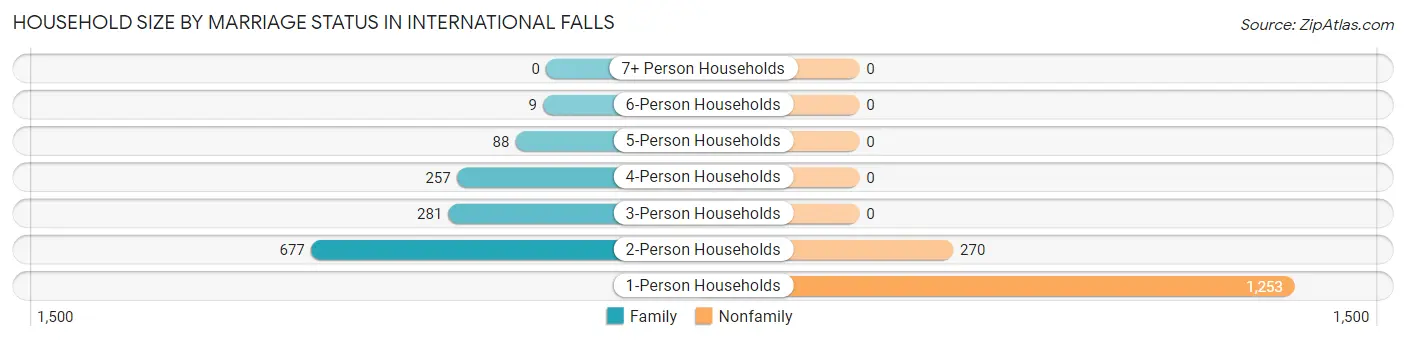
| Household Size | Family Households | Nonfamily Households |
| 1-Person Households | - | 1,253 (44.2%) |
| 2-Person Households | 677 (23.9%) | 270 (9.5%) |
| 3-Person Households | 281 (9.9%) | 0 (0.0%) |
| 4-Person Households | 257 (9.1%) | 0 (0.0%) |
| 5-Person Households | 88 (3.1%) | 0 (0.0%) |
| 6-Person Households | 9 (0.3%) | 0 (0.0%) |
| 7+ Person Households | 0 (0.0%) | 0 (0.0%) |
| Total | 1,312 (46.3%) | 1,523 (53.7%) |
Female Fertility in International Falls
Fertility by Age in International Falls
Average fertility rate in International Falls is 29.0 births per 1,000 women. Women in the age bracket of 20 to 34 years have the highest fertility rate with 65.0 births per 1,000 women. Women in the age bracket of 20 to 34 years acount for 100.0% of all women with births.
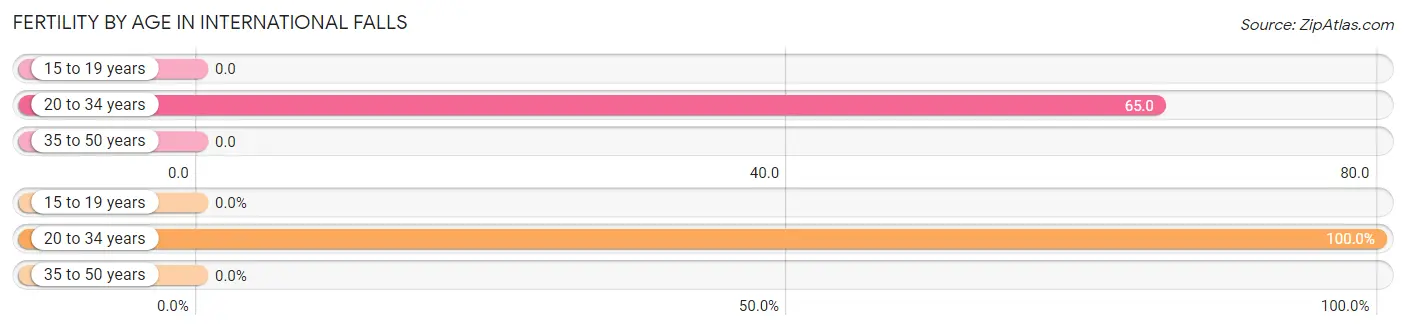
| Age Bracket | Women with Births | Births / 1,000 Women |
| 15 to 19 years | 0 (0.0%) | 0.0 |
| 20 to 34 years | 30 (100.0%) | 65.0 |
| 35 to 50 years | 0 (0.0%) | 0.0 |
| Total | 30 (100.0%) | 29.0 |
Fertility by Age by Marriage Status in International Falls
26.7% of women with births (30) in International Falls are married. The highest percentage of unmarried women with births falls into 20 to 34 years age bracket with 73.3% of them unmarried at the time of birth, while the lowest percentage of unmarried women with births belong to 20 to 34 years age bracket with 73.3% of them unmarried.
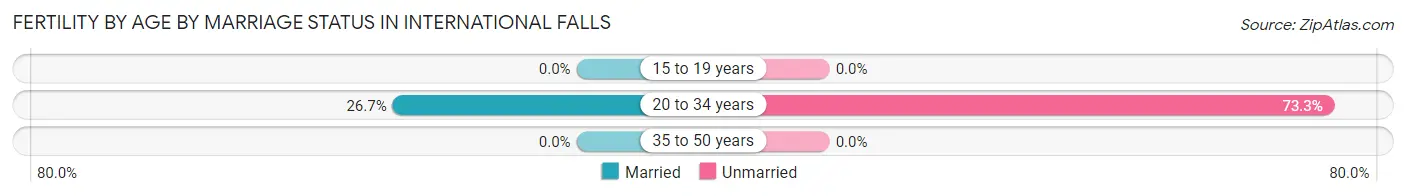
| Age Bracket | Married | Unmarried |
| 15 to 19 years | 0 (0.0%) | 0 (0.0%) |
| 20 to 34 years | 8 (26.7%) | 22 (73.3%) |
| 35 to 50 years | 0 (0.0%) | 0 (0.0%) |
| Total | 8 (26.7%) | 22 (73.3%) |
Fertility by Education in International Falls
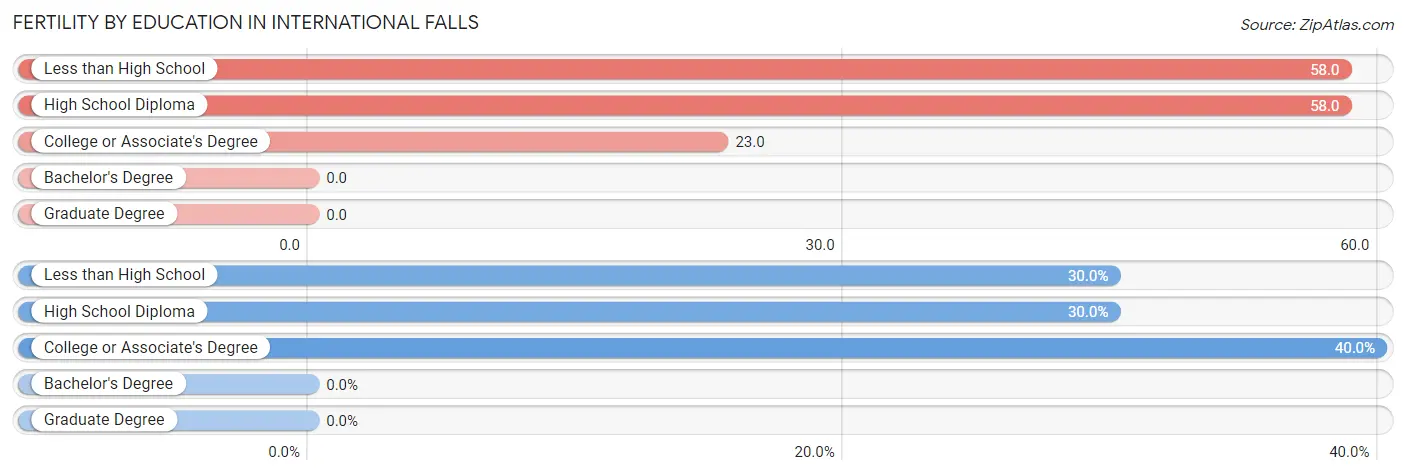
| Educational Attainment | Women with Births | Births / 1,000 Women |
| Less than High School | 9 (30.0%) | 58.0 |
| High School Diploma | 9 (30.0%) | 58.0 |
| College or Associate's Degree | 12 (40.0%) | 23.0 |
| Bachelor's Degree | 0 (0.0%) | 0.0 |
| Graduate Degree | 0 (0.0%) | 0.0 |
| Total | 30 (100.0%) | 29.0 |
Fertility by Education by Marriage Status in International Falls
73.3% of women with births in International Falls are unmarried. Women with the educational attainment of college or associate's degree are most likely to be married with 66.7% of them married at childbirth, while women with the educational attainment of less than high school are least likely to be married with 100.0% of them unmarried at childbirth.
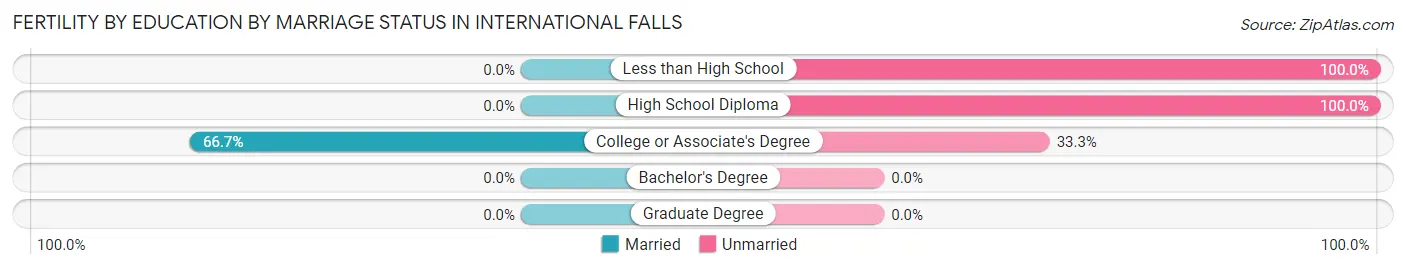
| Educational Attainment | Married | Unmarried |
| Less than High School | 0 (0.0%) | 9 (100.0%) |
| High School Diploma | 0 (0.0%) | 9 (100.0%) |
| College or Associate's Degree | 8 (66.7%) | 4 (33.3%) |
| Bachelor's Degree | 0 (0.0%) | 0 (0.0%) |
| Graduate Degree | 0 (0.0%) | 0 (0.0%) |
| Total | 8 (26.7%) | 22 (73.3%) |
Employment Characteristics in International Falls
Employment by Class of Employer in International Falls
Among the 2,589 employed individuals in International Falls, private company employees (1,696 | 65.5%), local government employees (334 | 12.9%), and not-for-profit organizations (259 | 10.0%) make up the most common classes of employment.
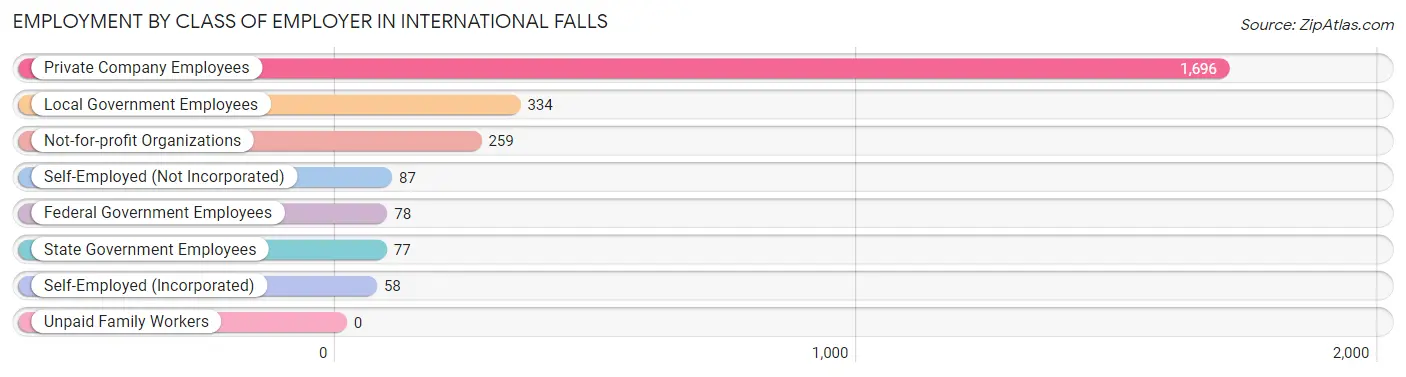
| Employer Class | # Employees | % Employees |
| Private Company Employees | 1,696 | 65.5% |
| Self-Employed (Incorporated) | 58 | 2.2% |
| Self-Employed (Not Incorporated) | 87 | 3.4% |
| Not-for-profit Organizations | 259 | 10.0% |
| Local Government Employees | 334 | 12.9% |
| State Government Employees | 77 | 3.0% |
| Federal Government Employees | 78 | 3.0% |
| Unpaid Family Workers | 0 | 0.0% |
| Total | 2,589 | 100.0% |
Employment Status by Age in International Falls
According to the labor force statistics for International Falls, out of the total population over 16 years of age (4,831), 58.1% or 2,807 individuals are in the labor force, with 6.9% or 194 of them unemployed. The age group with the highest labor force participation rate is 20 to 24 years, with 96.2% or 253 individuals in the labor force. Within the labor force, the 16 to 19 years age range has the highest percentage of unemployed individuals, with 34.6% or 71 of them being unemployed.
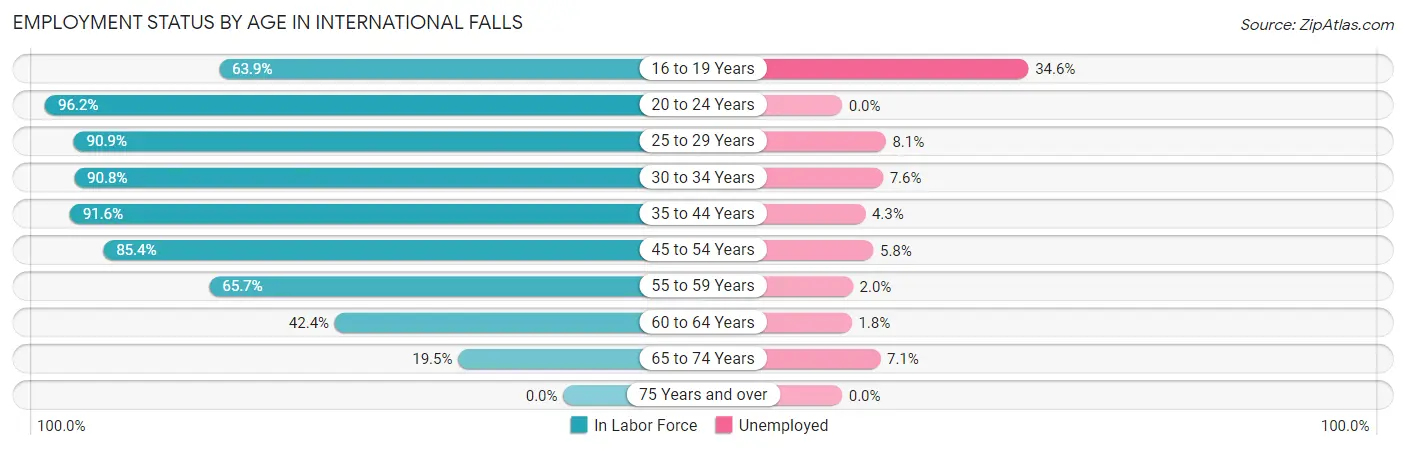
| Age Bracket | In Labor Force | Unemployed |
| 16 to 19 Years | 205 (63.9%) | 71 (34.6%) |
| 20 to 24 Years | 253 (96.2%) | 0 (0.0%) |
| 25 to 29 Years | 270 (90.9%) | 22 (8.1%) |
| 30 to 34 Years | 357 (90.8%) | 27 (7.6%) |
| 35 to 44 Years | 423 (91.6%) | 18 (4.3%) |
| 45 to 54 Years | 567 (85.4%) | 33 (5.8%) |
| 55 to 59 Years | 397 (65.7%) | 8 (2.0%) |
| 60 to 64 Years | 167 (42.4%) | 3 (1.8%) |
| 65 to 74 Years | 168 (19.5%) | 12 (7.1%) |
| 75 Years and over | 0 (0.0%) | 0 (0.0%) |
| Total | 2,807 (58.1%) | 194 (6.9%) |
Employment Status by Educational Attainment in International Falls
According to labor force statistics for International Falls, 77.5% of individuals (2,181) out of the total population between 25 and 64 years of age (2,814) are in the labor force, with 5.1% or 111 of them being unemployed. The group with the highest labor force participation rate are those with the educational attainment of bachelor's degree or higher, with 92.2% or 531 individuals in the labor force. Within the labor force, individuals with less than high school education have the highest percentage of unemployment, with 11.5% or 13 of them being unemployed.
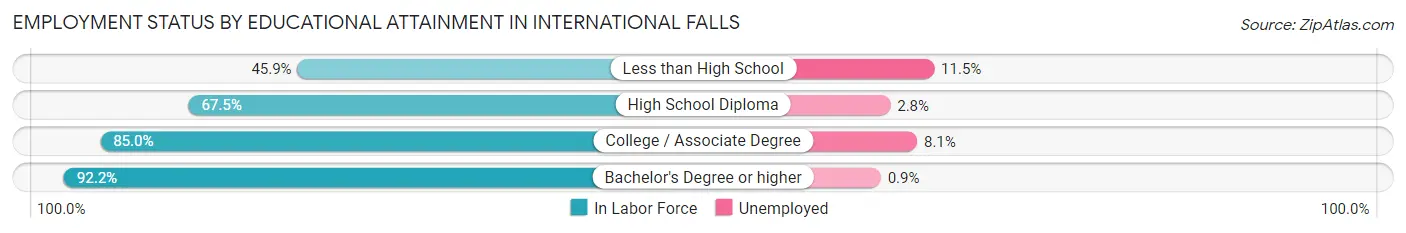
| Educational Attainment | In Labor Force | Unemployed |
| Less than High School | 113 (45.9%) | 28 (11.5%) |
| High School Diploma | 603 (67.5%) | 25 (2.8%) |
| College / Associate Degree | 934 (85.0%) | 89 (8.1%) |
| Bachelor's Degree or higher | 531 (92.2%) | 5 (0.9%) |
| Total | 2,181 (77.5%) | 144 (5.1%) |
Employment Occupations by Sex in International Falls
Management, Business, Science and Arts Occupations
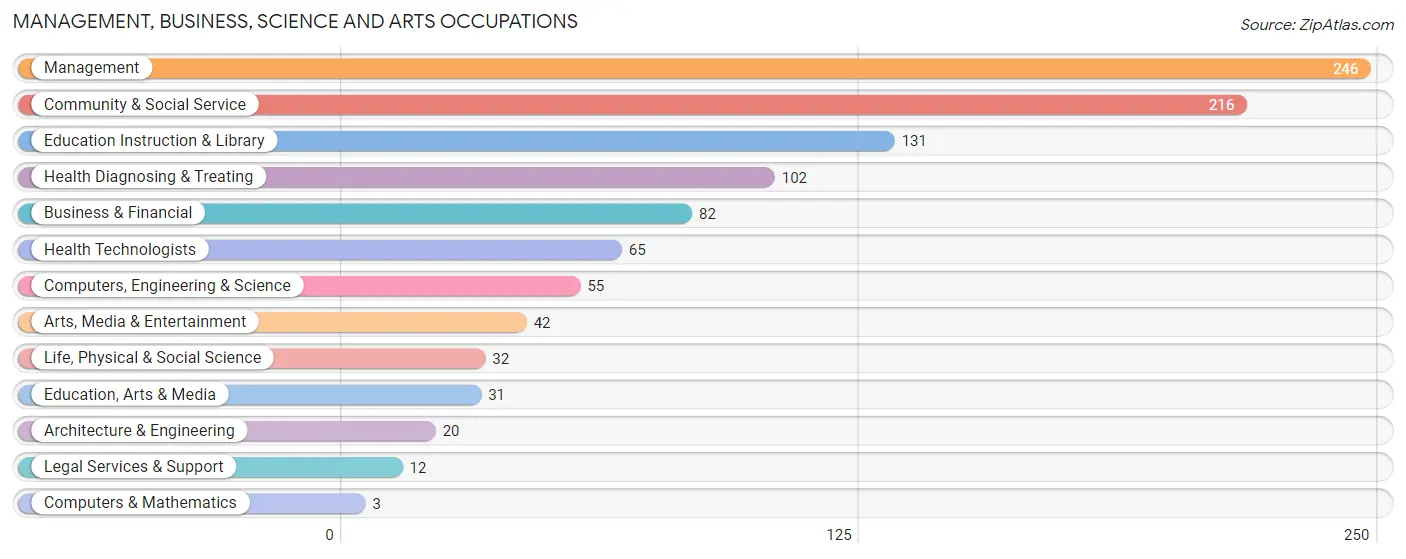
The most common Management, Business, Science and Arts occupations in International Falls are Management (246 | 9.4%), Community & Social Service (216 | 8.3%), Education Instruction & Library (131 | 5.0%), Health Diagnosing & Treating (102 | 3.9%), and Business & Financial (82 | 3.1%).
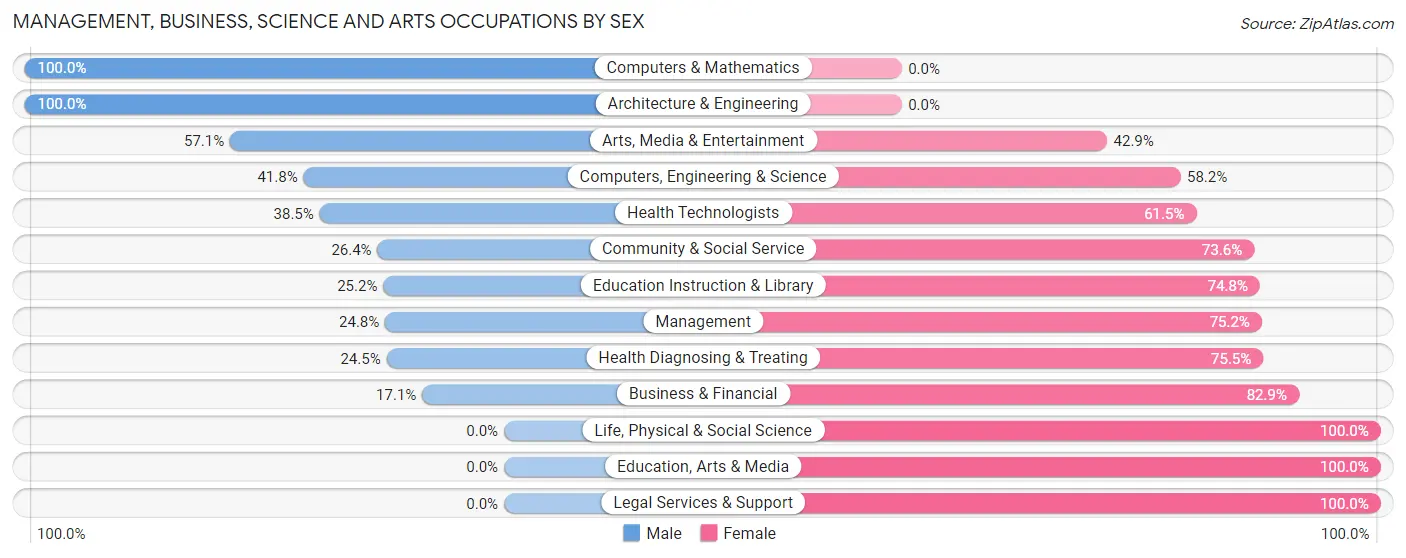
Management, Business, Science and Arts Occupations by Sex
Within the Management, Business, Science and Arts occupations in International Falls, the most male-oriented occupations are Computers & Mathematics (100.0%), Architecture & Engineering (100.0%), and Arts, Media & Entertainment (57.1%), while the most female-oriented occupations are Life, Physical & Social Science (100.0%), Education, Arts & Media (100.0%), and Legal Services & Support (100.0%).
| Occupation | Male | Female |
| Management | 61 (24.8%) | 185 (75.2%) |
| Business & Financial | 14 (17.1%) | 68 (82.9%) |
| Computers, Engineering & Science | 23 (41.8%) | 32 (58.2%) |
| Computers & Mathematics | 3 (100.0%) | 0 (0.0%) |
| Architecture & Engineering | 20 (100.0%) | 0 (0.0%) |
| Life, Physical & Social Science | 0 (0.0%) | 32 (100.0%) |
| Community & Social Service | 57 (26.4%) | 159 (73.6%) |
| Education, Arts & Media | 0 (0.0%) | 31 (100.0%) |
| Legal Services & Support | 0 (0.0%) | 12 (100.0%) |
| Education Instruction & Library | 33 (25.2%) | 98 (74.8%) |
| Arts, Media & Entertainment | 24 (57.1%) | 18 (42.9%) |
| Health Diagnosing & Treating | 25 (24.5%) | 77 (75.5%) |
| Health Technologists | 25 (38.5%) | 40 (61.5%) |
| Total (Category) | 180 (25.7%) | 521 (74.3%) |
| Total (Overall) | 1,298 (49.7%) | 1,315 (50.3%) |
Services Occupations
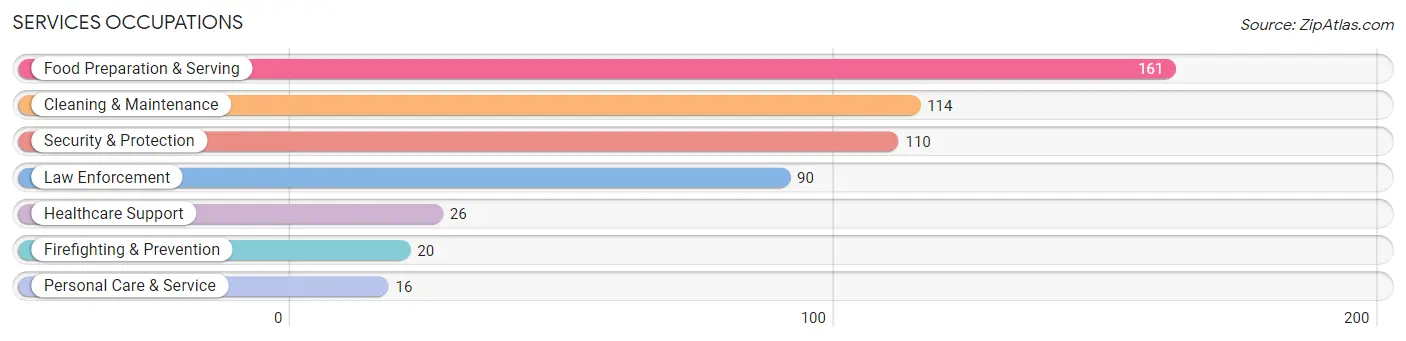
The most common Services occupations in International Falls are Food Preparation & Serving (161 | 6.2%), Cleaning & Maintenance (114 | 4.4%), Security & Protection (110 | 4.2%), Law Enforcement (90 | 3.4%), and Healthcare Support (26 | 1.0%).
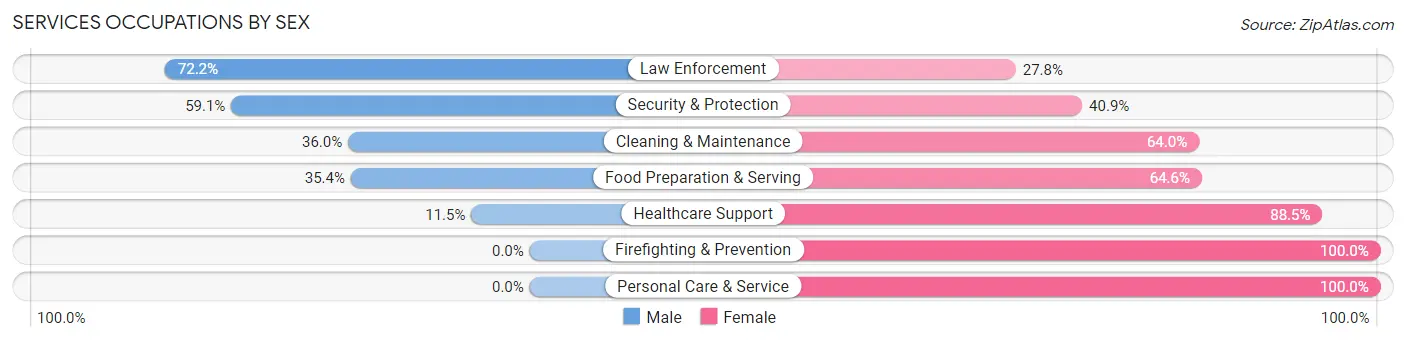
Services Occupations by Sex
Within the Services occupations in International Falls, the most male-oriented occupations are Law Enforcement (72.2%), Security & Protection (59.1%), and Cleaning & Maintenance (36.0%), while the most female-oriented occupations are Firefighting & Prevention (100.0%), Personal Care & Service (100.0%), and Healthcare Support (88.5%).
| Occupation | Male | Female |
| Healthcare Support | 3 (11.5%) | 23 (88.5%) |
| Security & Protection | 65 (59.1%) | 45 (40.9%) |
| Firefighting & Prevention | 0 (0.0%) | 20 (100.0%) |
| Law Enforcement | 65 (72.2%) | 25 (27.8%) |
| Food Preparation & Serving | 57 (35.4%) | 104 (64.6%) |
| Cleaning & Maintenance | 41 (36.0%) | 73 (64.0%) |
| Personal Care & Service | 0 (0.0%) | 16 (100.0%) |
| Total (Category) | 166 (38.9%) | 261 (61.1%) |
| Total (Overall) | 1,298 (49.7%) | 1,315 (50.3%) |
Sales and Office Occupations
The most common Sales and Office occupations in International Falls are Sales & Related (369 | 14.1%), and Office & Administration (302 | 11.6%).
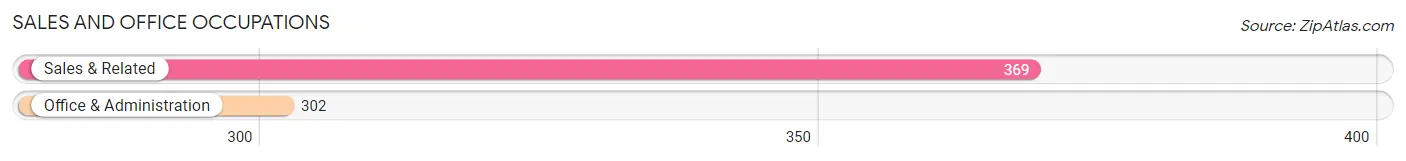
Sales and Office Occupations by Sex

| Occupation | Male | Female |
| Sales & Related | 215 (58.3%) | 154 (41.7%) |
| Office & Administration | 67 (22.2%) | 235 (77.8%) |
| Total (Category) | 282 (42.0%) | 389 (58.0%) |
| Total (Overall) | 1,298 (49.7%) | 1,315 (50.3%) |
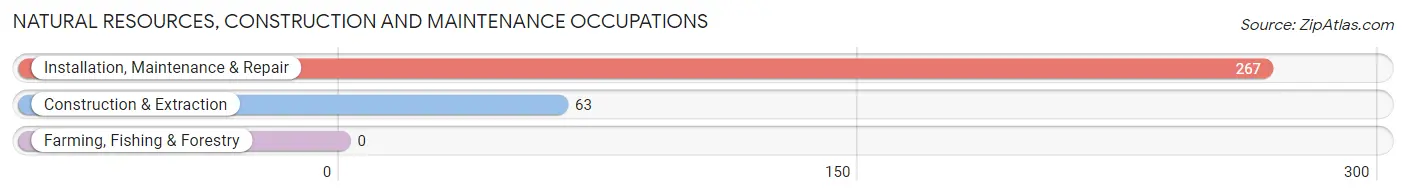
Natural Resources, Construction and Maintenance Occupations
The most common Natural Resources, Construction and Maintenance occupations in International Falls are Installation, Maintenance & Repair (267 | 10.2%), and Construction & Extraction (63 | 2.4%).
Natural Resources, Construction and Maintenance Occupations by Sex
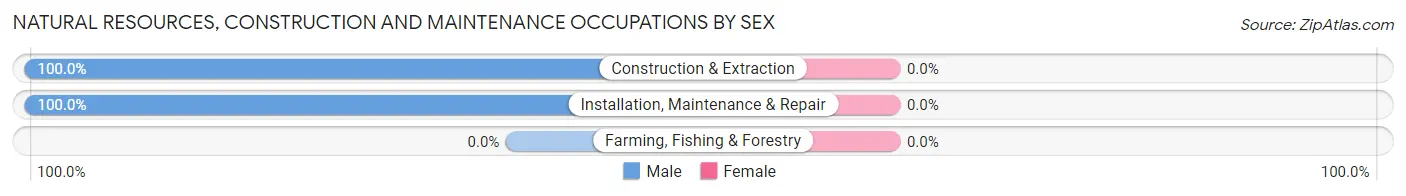
| Occupation | Male | Female |
| Farming, Fishing & Forestry | 0 (0.0%) | 0 (0.0%) |
| Construction & Extraction | 63 (100.0%) | 0 (0.0%) |
| Installation, Maintenance & Repair | 267 (100.0%) | 0 (0.0%) |
| Total (Category) | 330 (100.0%) | 0 (0.0%) |
| Total (Overall) | 1,298 (49.7%) | 1,315 (50.3%) |
Production, Transportation and Moving Occupations
The most common Production, Transportation and Moving occupations in International Falls are Material Moving (188 | 7.2%), Production (173 | 6.6%), and Transportation (123 | 4.7%).
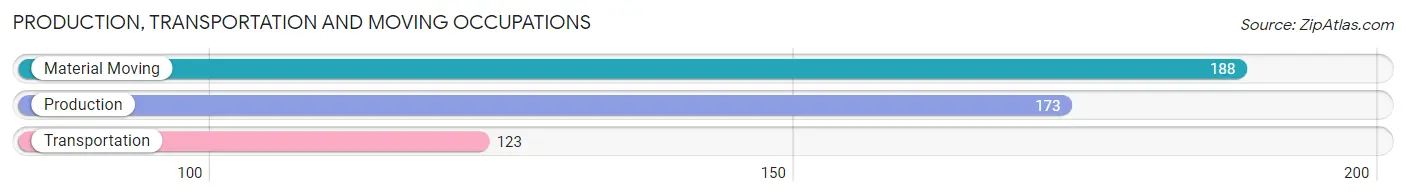
Production, Transportation and Moving Occupations by Sex
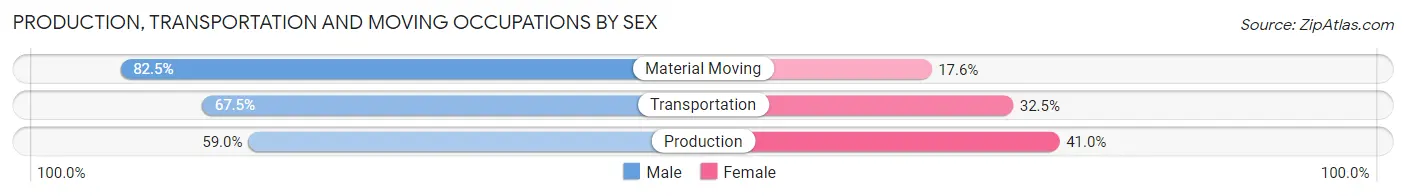
| Occupation | Male | Female |
| Production | 102 (59.0%) | 71 (41.0%) |
| Transportation | 83 (67.5%) | 40 (32.5%) |
| Material Moving | 155 (82.5%) | 33 (17.5%) |
| Total (Category) | 340 (70.3%) | 144 (29.7%) |
| Total (Overall) | 1,298 (49.7%) | 1,315 (50.3%) |
Employment Industries by Sex in International Falls
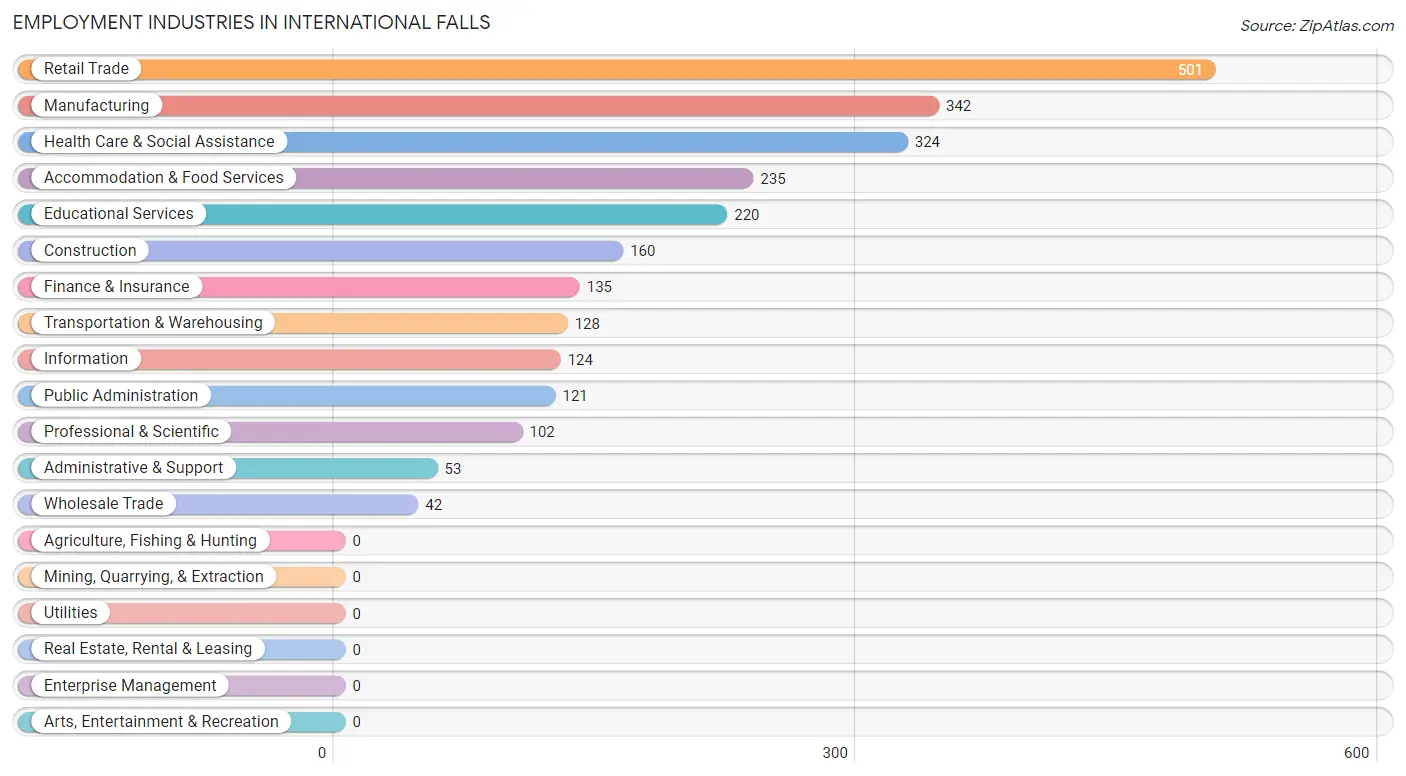
Employment Industries in International Falls
The major employment industries in International Falls include Retail Trade (501 | 19.2%), Manufacturing (342 | 13.1%), Health Care & Social Assistance (324 | 12.4%), Accommodation & Food Services (235 | 9.0%), and Educational Services (220 | 8.4%).
Employment Industries by Sex in International Falls
The International Falls industries that see more men than women are Wholesale Trade (100.0%), Transportation & Warehousing (93.0%), and Manufacturing (84.2%), whereas the industries that tend to have a higher number of women are Finance & Insurance (94.8%), Information (90.3%), and Health Care & Social Assistance (89.5%).
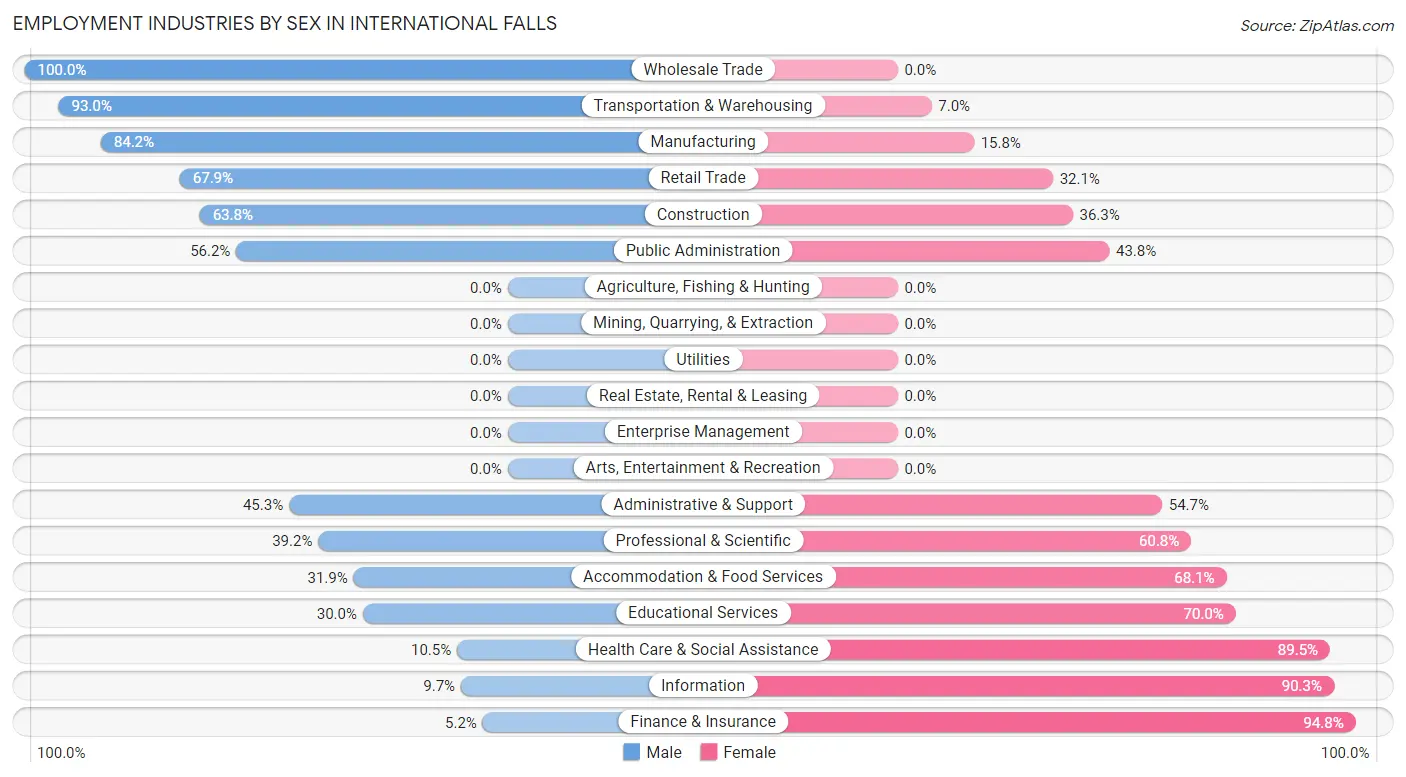
| Industry | Male | Female |
| Agriculture, Fishing & Hunting | 0 (0.0%) | 0 (0.0%) |
| Mining, Quarrying, & Extraction | 0 (0.0%) | 0 (0.0%) |
| Construction | 102 (63.7%) | 58 (36.2%) |
| Manufacturing | 288 (84.2%) | 54 (15.8%) |
| Wholesale Trade | 42 (100.0%) | 0 (0.0%) |
| Retail Trade | 340 (67.9%) | 161 (32.1%) |
| Transportation & Warehousing | 119 (93.0%) | 9 (7.0%) |
| Utilities | 0 (0.0%) | 0 (0.0%) |
| Information | 12 (9.7%) | 112 (90.3%) |
| Finance & Insurance | 7 (5.2%) | 128 (94.8%) |
| Real Estate, Rental & Leasing | 0 (0.0%) | 0 (0.0%) |
| Professional & Scientific | 40 (39.2%) | 62 (60.8%) |
| Enterprise Management | 0 (0.0%) | 0 (0.0%) |
| Administrative & Support | 24 (45.3%) | 29 (54.7%) |
| Educational Services | 66 (30.0%) | 154 (70.0%) |
| Health Care & Social Assistance | 34 (10.5%) | 290 (89.5%) |
| Arts, Entertainment & Recreation | 0 (0.0%) | 0 (0.0%) |
| Accommodation & Food Services | 75 (31.9%) | 160 (68.1%) |
| Public Administration | 68 (56.2%) | 53 (43.8%) |
| Total | 1,298 (49.7%) | 1,315 (50.3%) |
Education in International Falls
School Enrollment in International Falls
The most common levels of schooling among the 1,304 students in International Falls are middle school (276 | 21.2%), elementary school (273 | 20.9%), and college / undergraduate (268 | 20.5%).
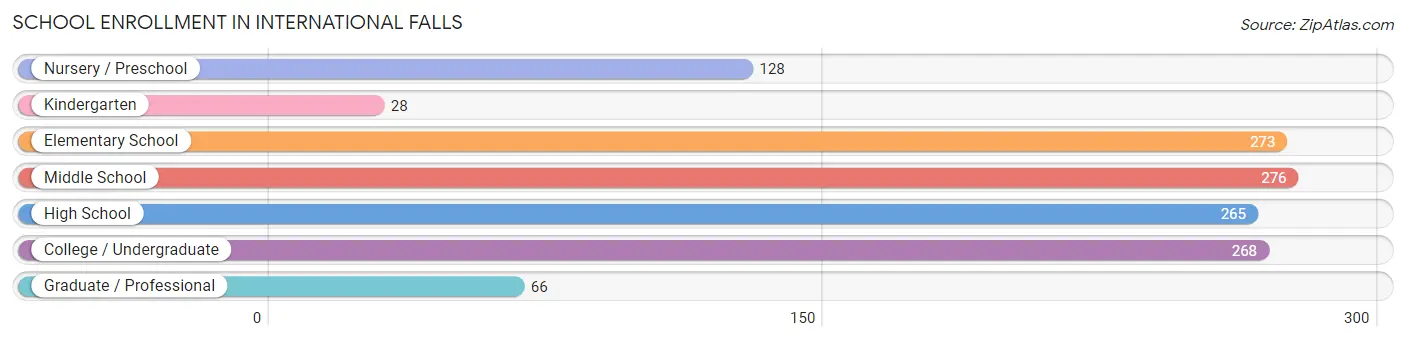
| School Level | # Students | % Students |
| Nursery / Preschool | 128 | 9.8% |
| Kindergarten | 28 | 2.1% |
| Elementary School | 273 | 20.9% |
| Middle School | 276 | 21.2% |
| High School | 265 | 20.3% |
| College / Undergraduate | 268 | 20.5% |
| Graduate / Professional | 66 | 5.1% |
| Total | 1,304 | 100.0% |
School Enrollment by Age by Funding Source in International Falls
Out of a total of 1,304 students who are enrolled in schools in International Falls, 96 (7.4%) attend a private institution, while the remaining 1,208 (92.6%) are enrolled in public schools. The age group of 18 to 19 year olds has the highest likelihood of being enrolled in private schools, with 35 (18.0% in the age bracket) enrolled. Conversely, the age group of 3 to 4 year olds has the lowest likelihood of being enrolled in a private school, with 67 (100.0% in the age bracket) attending a public institution.
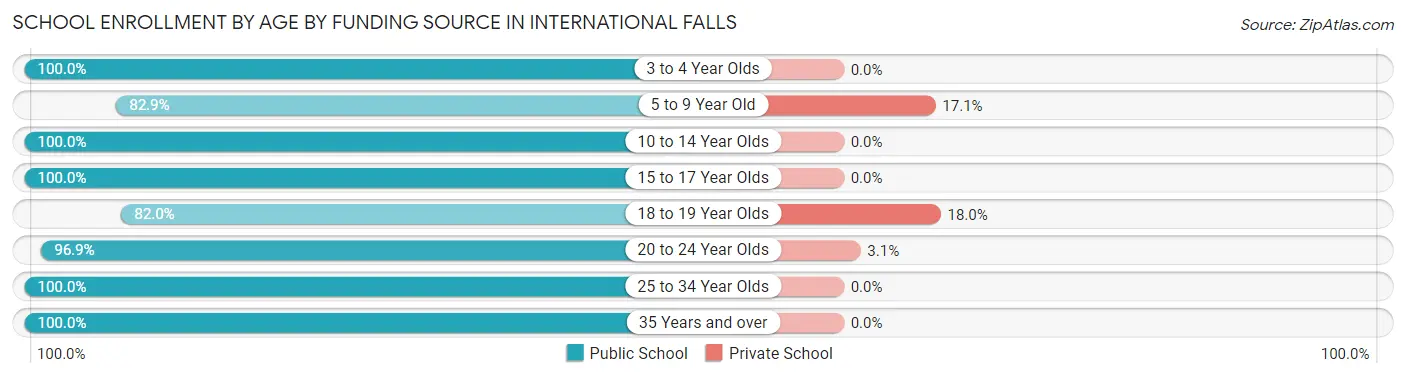
| Age Bracket | Public School | Private School |
| 3 to 4 Year Olds | 67 (100.0%) | 0 (0.0%) |
| 5 to 9 Year Old | 291 (82.9%) | 60 (17.1%) |
| 10 to 14 Year Olds | 272 (100.0%) | 0 (0.0%) |
| 15 to 17 Year Olds | 222 (100.0%) | 0 (0.0%) |
| 18 to 19 Year Olds | 159 (82.0%) | 35 (18.0%) |
| 20 to 24 Year Olds | 62 (96.9%) | 2 (3.1%) |
| 25 to 34 Year Olds | 46 (100.0%) | 0 (0.0%) |
| 35 Years and over | 88 (100.0%) | 0 (0.0%) |
| Total | 1,208 (92.6%) | 96 (7.4%) |
Educational Attainment by Field of Study in International Falls
Education (181 | 22.1%), arts & humanities (167 | 20.4%), science & technology (157 | 19.2%), business (87 | 10.6%), and bio, nature & agricultural (59 | 7.2%) are the most common fields of study among 818 individuals in International Falls who have obtained a bachelor's degree or higher.
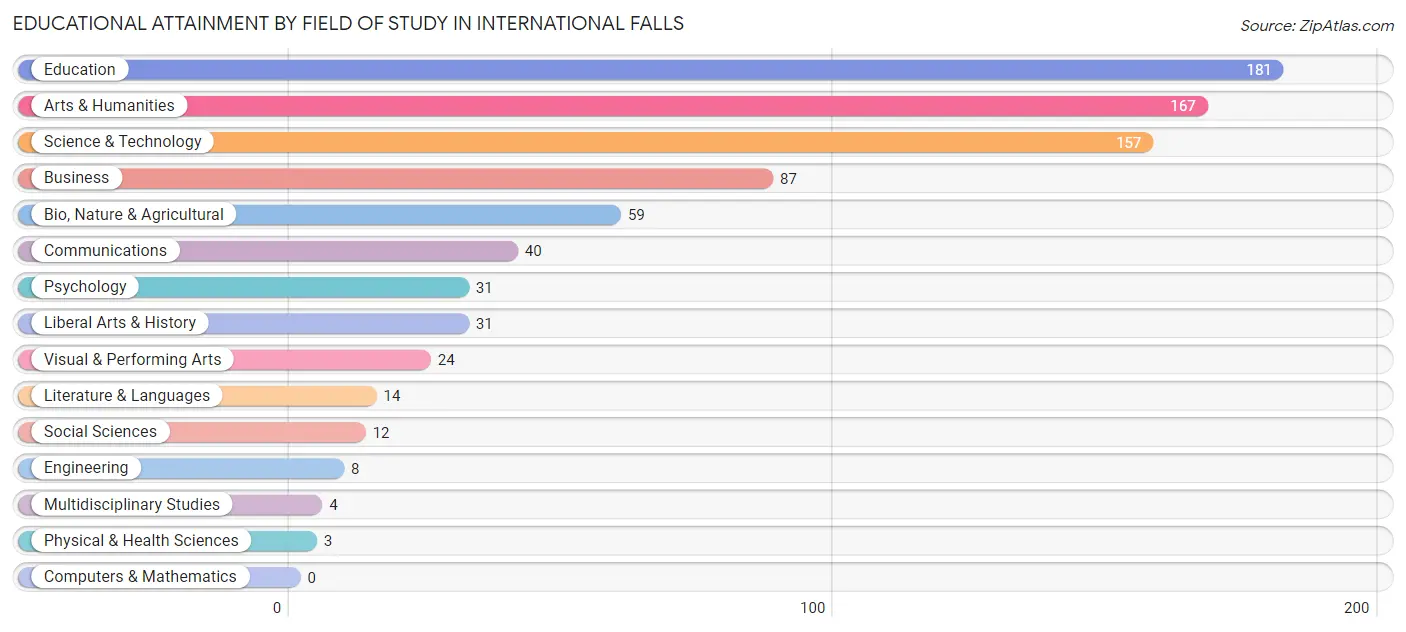
| Field of Study | # Graduates | % Graduates |
| Computers & Mathematics | 0 | 0.0% |
| Bio, Nature & Agricultural | 59 | 7.2% |
| Physical & Health Sciences | 3 | 0.4% |
| Psychology | 31 | 3.8% |
| Social Sciences | 12 | 1.5% |
| Engineering | 8 | 1.0% |
| Multidisciplinary Studies | 4 | 0.5% |
| Science & Technology | 157 | 19.2% |
| Business | 87 | 10.6% |
| Education | 181 | 22.1% |
| Literature & Languages | 14 | 1.7% |
| Liberal Arts & History | 31 | 3.8% |
| Visual & Performing Arts | 24 | 2.9% |
| Communications | 40 | 4.9% |
| Arts & Humanities | 167 | 20.4% |
| Total | 818 | 100.0% |
Transportation & Commute in International Falls
Vehicle Availability by Sex in International Falls
The most prevalent vehicle ownership categories in International Falls are males with 2 vehicles (694, accounting for 54.5%) and females with 2 vehicles (562, making up 54.6%).
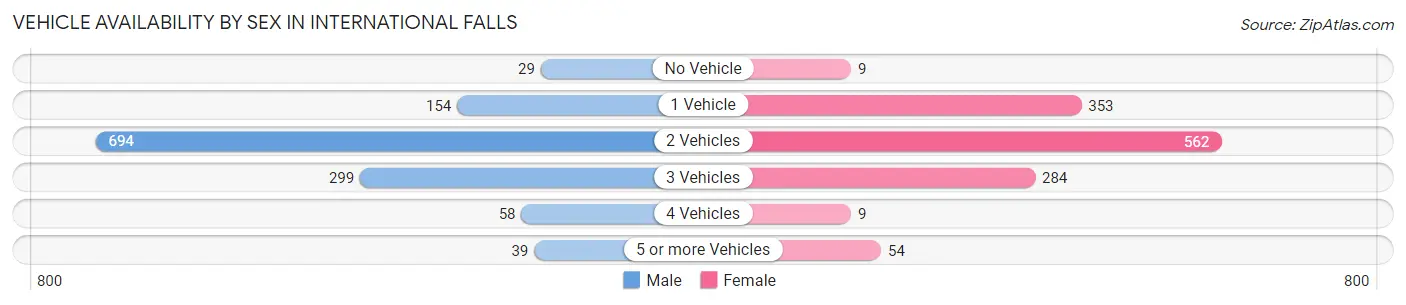
| Vehicles Available | Male | Female |
| No Vehicle | 29 (2.3%) | 9 (0.7%) |
| 1 Vehicle | 154 (12.1%) | 353 (27.8%) |
| 2 Vehicles | 694 (54.5%) | 562 (44.2%) |
| 3 Vehicles | 299 (23.5%) | 284 (22.3%) |
| 4 Vehicles | 58 (4.6%) | 9 (0.7%) |
| 5 or more Vehicles | 39 (3.1%) | 54 (4.3%) |
| Total | 1,273 (100.0%) | 1,271 (100.0%) |
Commute Time in International Falls
The most frequently occuring commute durations in International Falls are 5 to 9 minutes (1,278 commuters, 53.9%), 10 to 14 minutes (504 commuters, 21.3%), and less than 5 minutes (294 commuters, 12.4%).
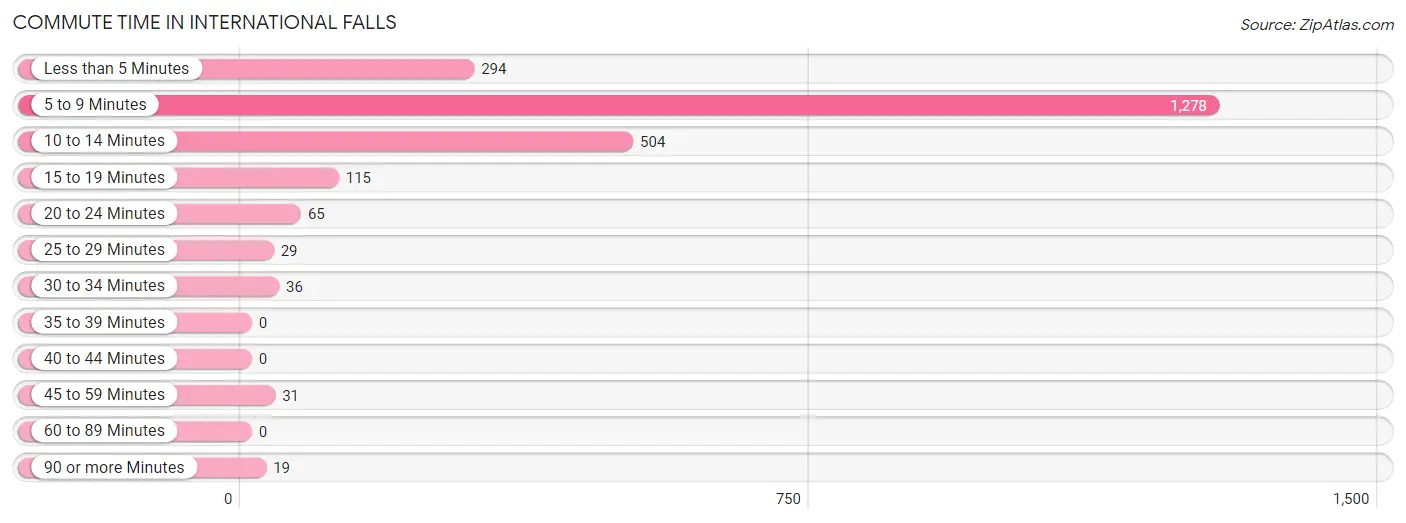
| Commute Time | # Commuters | % Commuters |
| Less than 5 Minutes | 294 | 12.4% |
| 5 to 9 Minutes | 1,278 | 53.9% |
| 10 to 14 Minutes | 504 | 21.3% |
| 15 to 19 Minutes | 115 | 4.9% |
| 20 to 24 Minutes | 65 | 2.7% |
| 25 to 29 Minutes | 29 | 1.2% |
| 30 to 34 Minutes | 36 | 1.5% |
| 35 to 39 Minutes | 0 | 0.0% |
| 40 to 44 Minutes | 0 | 0.0% |
| 45 to 59 Minutes | 31 | 1.3% |
| 60 to 89 Minutes | 0 | 0.0% |
| 90 or more Minutes | 19 | 0.8% |
Commute Time by Sex in International Falls
The most common commute times in International Falls are 5 to 9 minutes (663 commuters, 56.8%) for males and 5 to 9 minutes (615 commuters, 51.1%) for females.
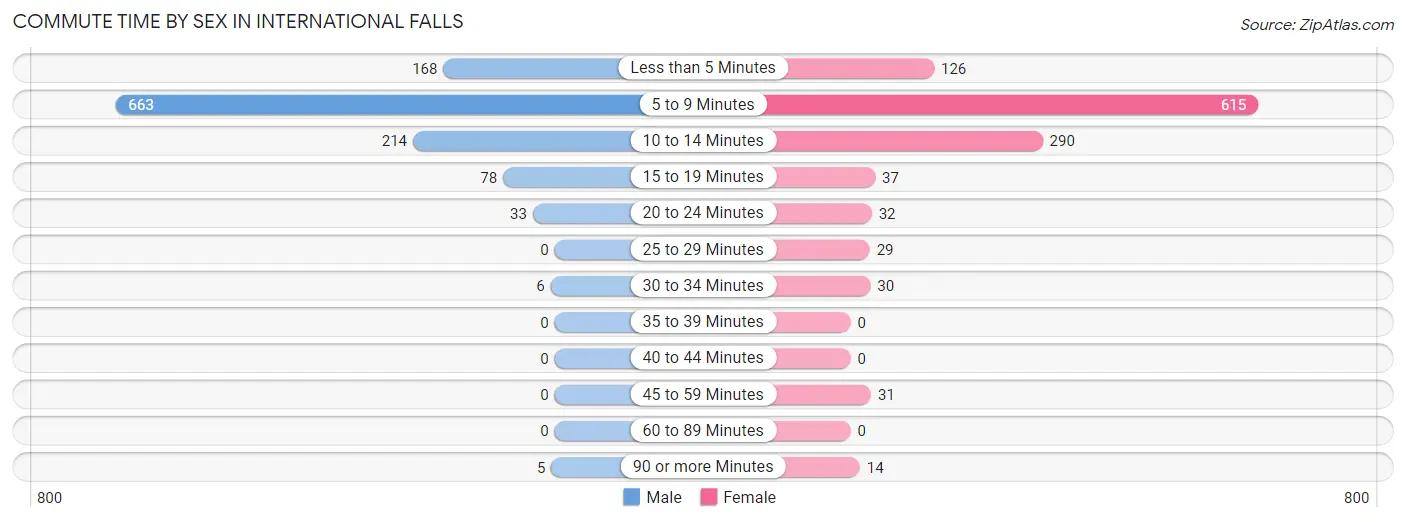
| Commute Time | Male | Female |
| Less than 5 Minutes | 168 (14.4%) | 126 (10.5%) |
| 5 to 9 Minutes | 663 (56.8%) | 615 (51.1%) |
| 10 to 14 Minutes | 214 (18.3%) | 290 (24.1%) |
| 15 to 19 Minutes | 78 (6.7%) | 37 (3.1%) |
| 20 to 24 Minutes | 33 (2.8%) | 32 (2.7%) |
| 25 to 29 Minutes | 0 (0.0%) | 29 (2.4%) |
| 30 to 34 Minutes | 6 (0.5%) | 30 (2.5%) |
| 35 to 39 Minutes | 0 (0.0%) | 0 (0.0%) |
| 40 to 44 Minutes | 0 (0.0%) | 0 (0.0%) |
| 45 to 59 Minutes | 0 (0.0%) | 31 (2.6%) |
| 60 to 89 Minutes | 0 (0.0%) | 0 (0.0%) |
| 90 or more Minutes | 5 (0.4%) | 14 (1.2%) |
Time of Departure to Work by Sex in International Falls
The most frequent times of departure to work in International Falls are 5:30 AM to 5:59 AM (172, 14.7%) for males and 7:30 AM to 7:59 AM (267, 22.2%) for females.
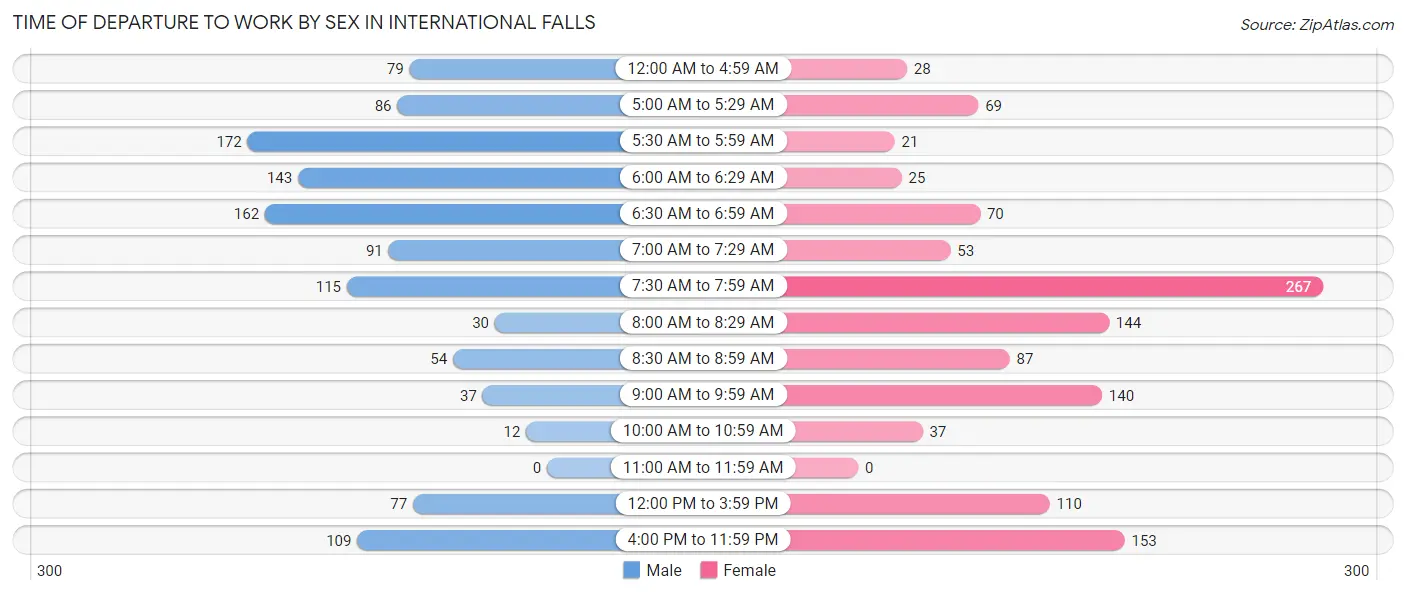
| Time of Departure | Male | Female |
| 12:00 AM to 4:59 AM | 79 (6.8%) | 28 (2.3%) |
| 5:00 AM to 5:29 AM | 86 (7.4%) | 69 (5.7%) |
| 5:30 AM to 5:59 AM | 172 (14.7%) | 21 (1.7%) |
| 6:00 AM to 6:29 AM | 143 (12.2%) | 25 (2.1%) |
| 6:30 AM to 6:59 AM | 162 (13.9%) | 70 (5.8%) |
| 7:00 AM to 7:29 AM | 91 (7.8%) | 53 (4.4%) |
| 7:30 AM to 7:59 AM | 115 (9.9%) | 267 (22.2%) |
| 8:00 AM to 8:29 AM | 30 (2.6%) | 144 (12.0%) |
| 8:30 AM to 8:59 AM | 54 (4.6%) | 87 (7.2%) |
| 9:00 AM to 9:59 AM | 37 (3.2%) | 140 (11.6%) |
| 10:00 AM to 10:59 AM | 12 (1.0%) | 37 (3.1%) |
| 11:00 AM to 11:59 AM | 0 (0.0%) | 0 (0.0%) |
| 12:00 PM to 3:59 PM | 77 (6.6%) | 110 (9.1%) |
| 4:00 PM to 11:59 PM | 109 (9.3%) | 153 (12.7%) |
| Total | 1,167 (100.0%) | 1,204 (100.0%) |
Housing Occupancy in International Falls
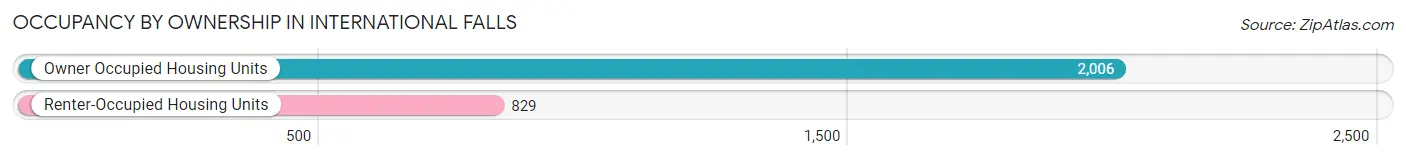
Occupancy by Ownership in International Falls
Of the total 2,835 dwellings in International Falls, owner-occupied units account for 2,006 (70.8%), while renter-occupied units make up 829 (29.2%).
| Occupancy | # Housing Units | % Housing Units |
| Owner Occupied Housing Units | 2,006 | 70.8% |
| Renter-Occupied Housing Units | 829 | 29.2% |
| Total Occupied Housing Units | 2,835 | 100.0% |
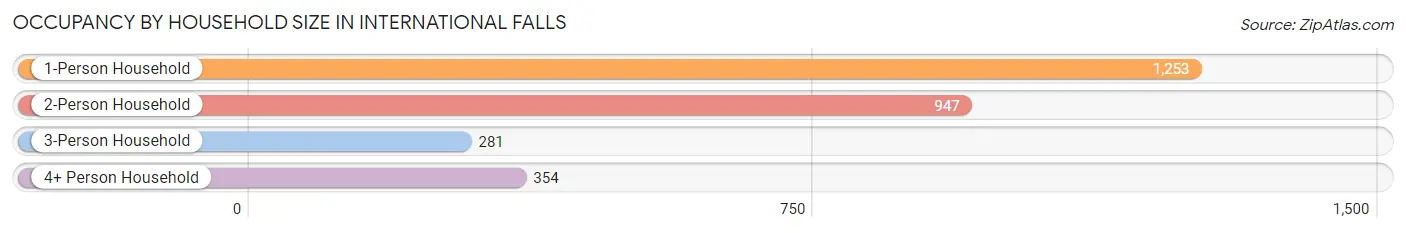
Occupancy by Household Size in International Falls
| Household Size | # Housing Units | % Housing Units |
| 1-Person Household | 1,253 | 44.2% |
| 2-Person Household | 947 | 33.4% |
| 3-Person Household | 281 | 9.9% |
| 4+ Person Household | 354 | 12.5% |
| Total Housing Units | 2,835 | 100.0% |
Occupancy by Ownership by Household Size in International Falls
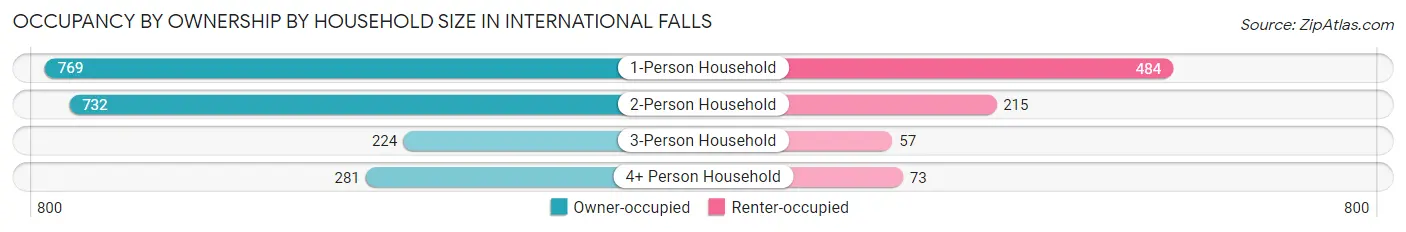
| Household Size | Owner-occupied | Renter-occupied |
| 1-Person Household | 769 (61.4%) | 484 (38.6%) |
| 2-Person Household | 732 (77.3%) | 215 (22.7%) |
| 3-Person Household | 224 (79.7%) | 57 (20.3%) |
| 4+ Person Household | 281 (79.4%) | 73 (20.6%) |
| Total Housing Units | 2,006 (70.8%) | 829 (29.2%) |
Occupancy by Educational Attainment in International Falls
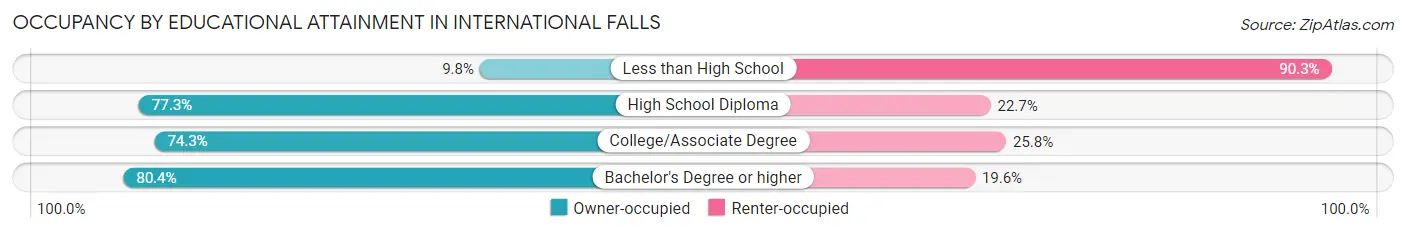
| Household Size | Owner-occupied | Renter-occupied |
| Less than High School | 23 (9.8%) | 213 (90.2%) |
| High School Diploma | 679 (77.3%) | 199 (22.7%) |
| College/Associate Degree | 963 (74.3%) | 334 (25.8%) |
| Bachelor's Degree or higher | 341 (80.4%) | 83 (19.6%) |
Occupancy by Age of Householder in International Falls
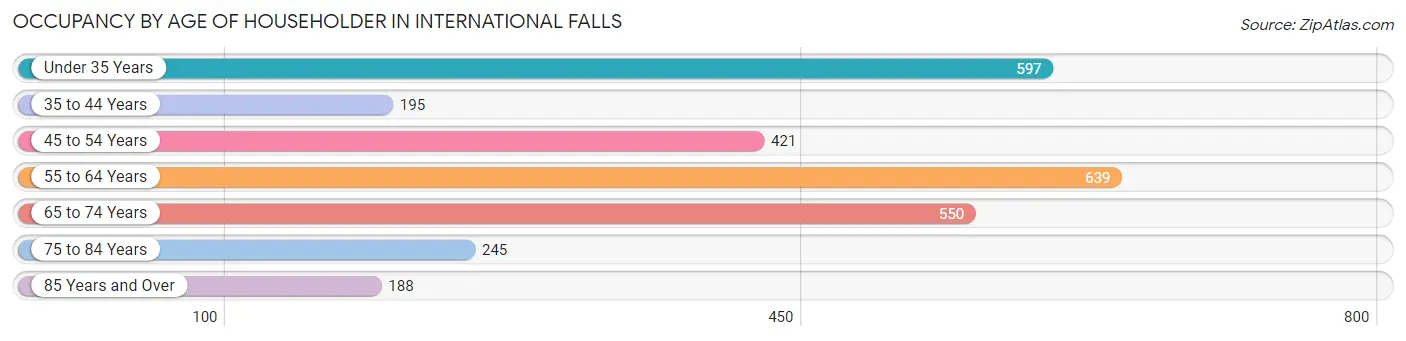
| Age Bracket | # Households | % Households |
| Under 35 Years | 597 | 21.1% |
| 35 to 44 Years | 195 | 6.9% |
| 45 to 54 Years | 421 | 14.8% |
| 55 to 64 Years | 639 | 22.5% |
| 65 to 74 Years | 550 | 19.4% |
| 75 to 84 Years | 245 | 8.6% |
| 85 Years and Over | 188 | 6.6% |
| Total | 2,835 | 100.0% |
Housing Finances in International Falls
Median Income by Occupancy in International Falls
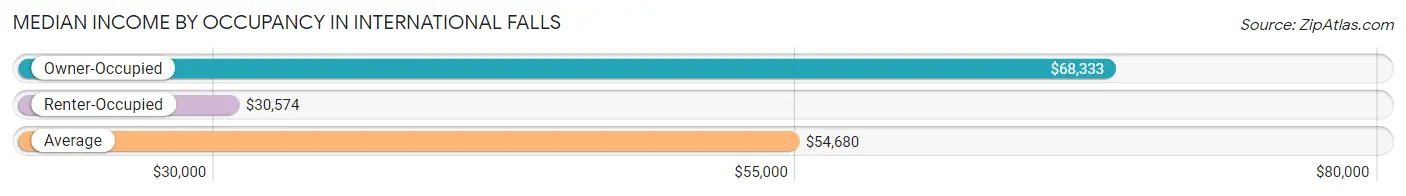
| Occupancy Type | # Households | Median Income |
| Owner-Occupied | 2,006 (70.8%) | $68,333 |
| Renter-Occupied | 829 (29.2%) | $30,574 |
| Average | 2,835 (100.0%) | $54,680 |
Occupancy by Householder Income Bracket in International Falls
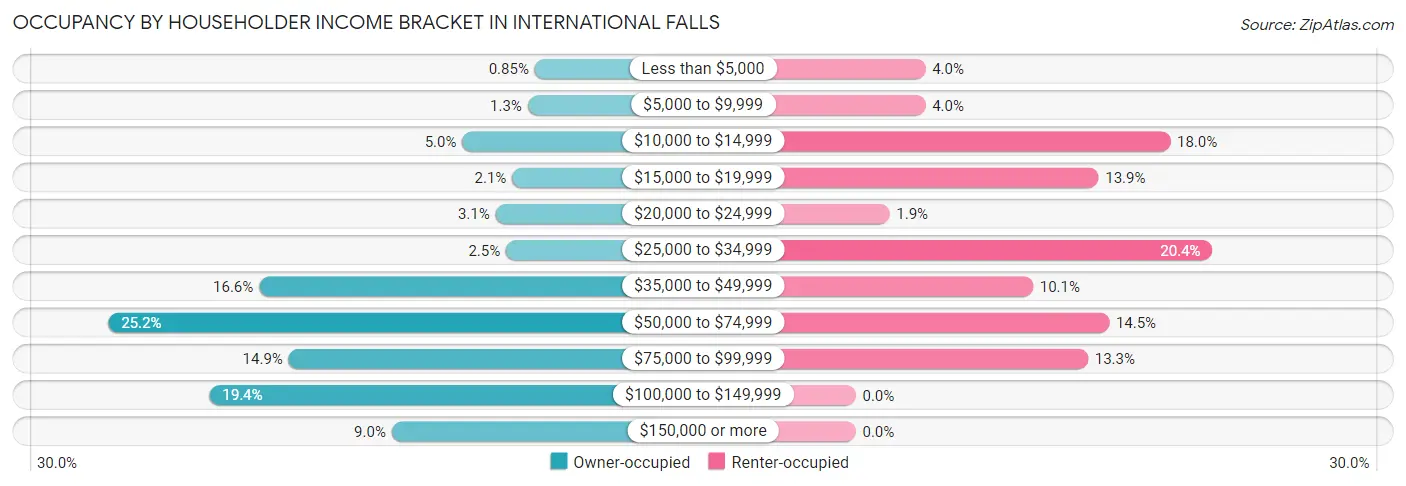
| Income Bracket | Owner-occupied | Renter-occupied |
| Less than $5,000 | 17 (0.9%) | 33 (4.0%) |
| $5,000 to $9,999 | 25 (1.3%) | 33 (4.0%) |
| $10,000 to $14,999 | 100 (5.0%) | 149 (18.0%) |
| $15,000 to $19,999 | 43 (2.1%) | 115 (13.9%) |
| $20,000 to $24,999 | 62 (3.1%) | 16 (1.9%) |
| $25,000 to $34,999 | 50 (2.5%) | 169 (20.4%) |
| $35,000 to $49,999 | 333 (16.6%) | 84 (10.1%) |
| $50,000 to $74,999 | 506 (25.2%) | 120 (14.5%) |
| $75,000 to $99,999 | 299 (14.9%) | 110 (13.3%) |
| $100,000 to $149,999 | 390 (19.4%) | 0 (0.0%) |
| $150,000 or more | 181 (9.0%) | 0 (0.0%) |
| Total | 2,006 (100.0%) | 829 (100.0%) |
Monthly Housing Cost Tiers in International Falls
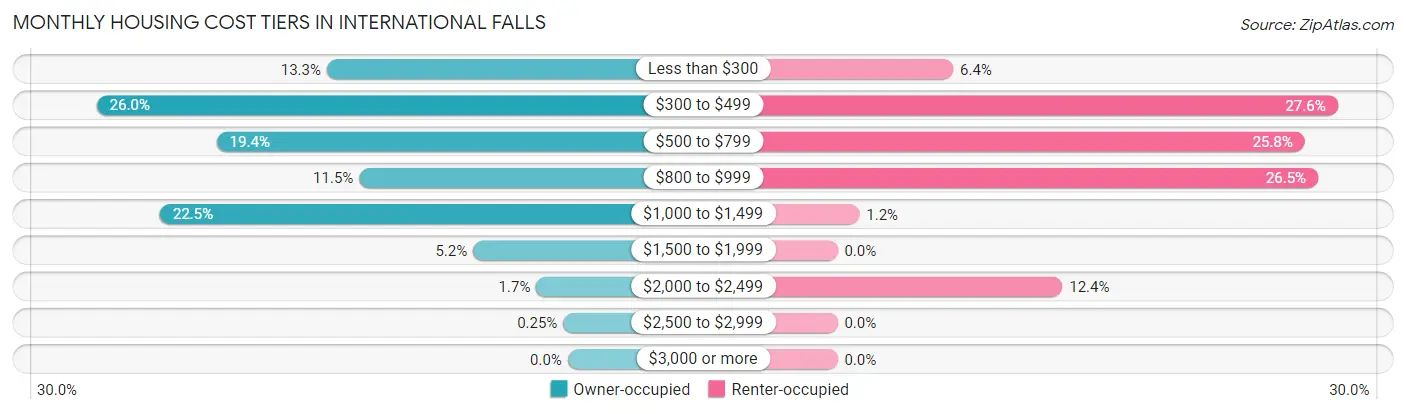
| Monthly Cost | Owner-occupied | Renter-occupied |
| Less than $300 | 267 (13.3%) | 53 (6.4%) |
| $300 to $499 | 522 (26.0%) | 229 (27.6%) |
| $500 to $799 | 389 (19.4%) | 214 (25.8%) |
| $800 to $999 | 231 (11.5%) | 220 (26.5%) |
| $1,000 to $1,499 | 452 (22.5%) | 10 (1.2%) |
| $1,500 to $1,999 | 105 (5.2%) | 0 (0.0%) |
| $2,000 to $2,499 | 35 (1.7%) | 103 (12.4%) |
| $2,500 to $2,999 | 5 (0.3%) | 0 (0.0%) |
| $3,000 or more | 0 (0.0%) | 0 (0.0%) |
| Total | 2,006 (100.0%) | 829 (100.0%) |
Physical Housing Characteristics in International Falls
Housing Structures in International Falls
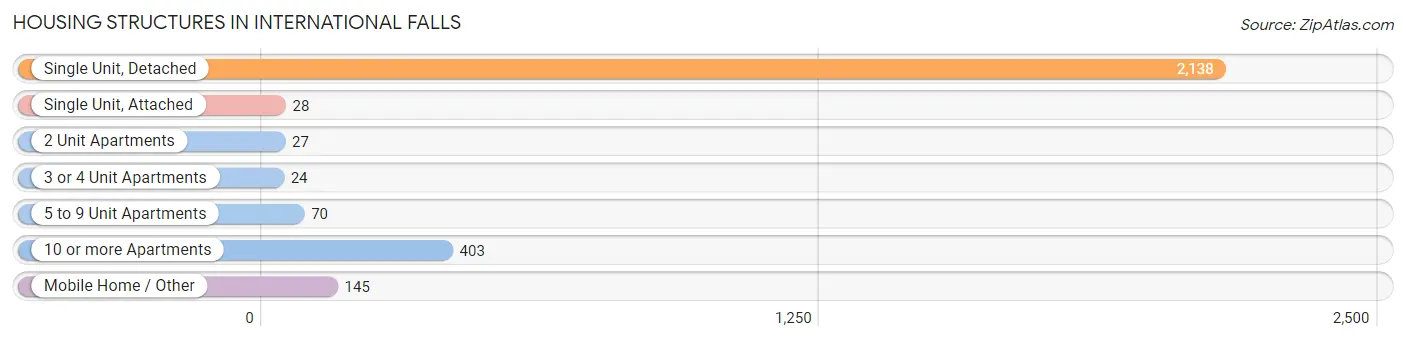
| Structure Type | # Housing Units | % Housing Units |
| Single Unit, Detached | 2,138 | 75.4% |
| Single Unit, Attached | 28 | 1.0% |
| 2 Unit Apartments | 27 | 0.9% |
| 3 or 4 Unit Apartments | 24 | 0.9% |
| 5 to 9 Unit Apartments | 70 | 2.5% |
| 10 or more Apartments | 403 | 14.2% |
| Mobile Home / Other | 145 | 5.1% |
| Total | 2,835 | 100.0% |
Housing Structures by Occupancy in International Falls
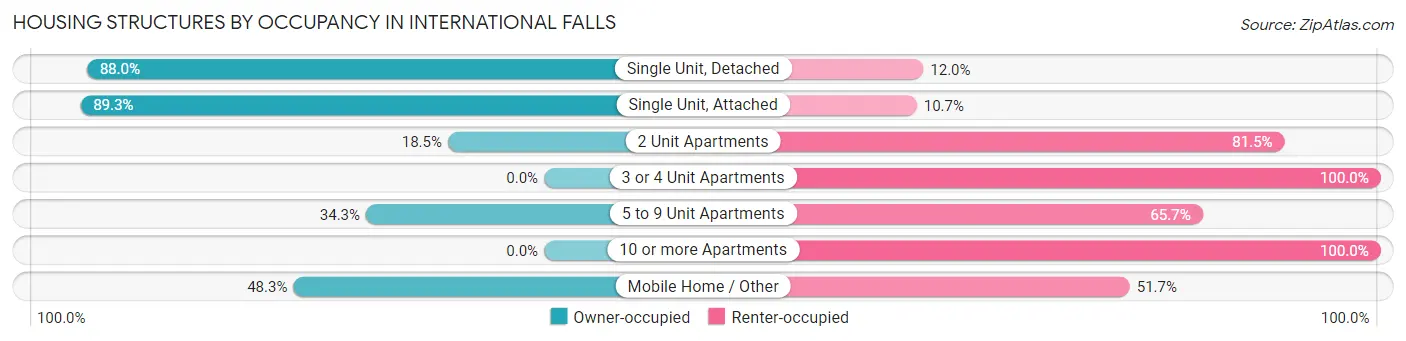
| Structure Type | Owner-occupied | Renter-occupied |
| Single Unit, Detached | 1,882 (88.0%) | 256 (12.0%) |
| Single Unit, Attached | 25 (89.3%) | 3 (10.7%) |
| 2 Unit Apartments | 5 (18.5%) | 22 (81.5%) |
| 3 or 4 Unit Apartments | 0 (0.0%) | 24 (100.0%) |
| 5 to 9 Unit Apartments | 24 (34.3%) | 46 (65.7%) |
| 10 or more Apartments | 0 (0.0%) | 403 (100.0%) |
| Mobile Home / Other | 70 (48.3%) | 75 (51.7%) |
| Total | 2,006 (70.8%) | 829 (29.2%) |
Housing Structures by Number of Rooms in International Falls
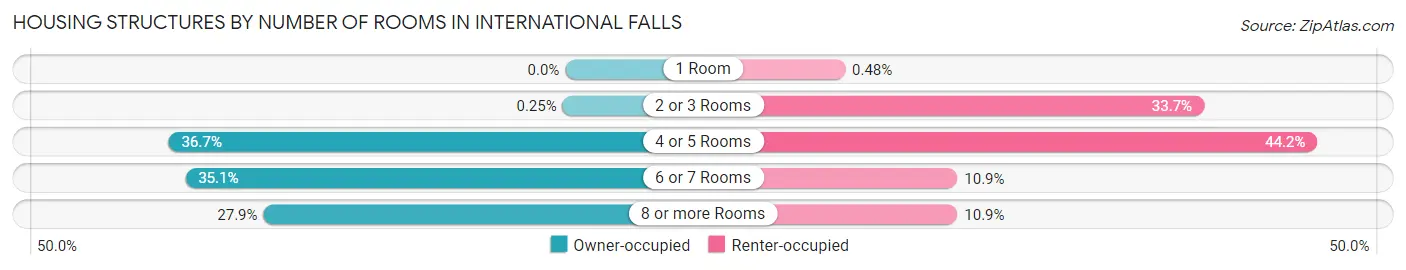
| Number of Rooms | Owner-occupied | Renter-occupied |
| 1 Room | 0 (0.0%) | 4 (0.5%) |
| 2 or 3 Rooms | 5 (0.3%) | 279 (33.7%) |
| 4 or 5 Rooms | 736 (36.7%) | 366 (44.2%) |
| 6 or 7 Rooms | 705 (35.1%) | 90 (10.9%) |
| 8 or more Rooms | 560 (27.9%) | 90 (10.9%) |
| Total | 2,006 (100.0%) | 829 (100.0%) |
Housing Structure by Heating Type in International Falls
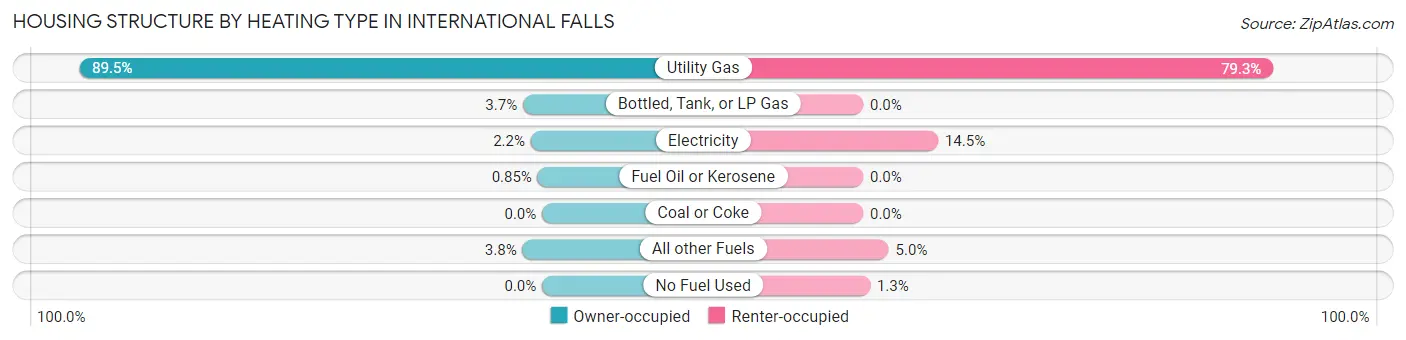
| Heating Type | Owner-occupied | Renter-occupied |
| Utility Gas | 1,795 (89.5%) | 657 (79.2%) |
| Bottled, Tank, or LP Gas | 74 (3.7%) | 0 (0.0%) |
| Electricity | 44 (2.2%) | 120 (14.5%) |
| Fuel Oil or Kerosene | 17 (0.9%) | 0 (0.0%) |
| Coal or Coke | 0 (0.0%) | 0 (0.0%) |
| All other Fuels | 76 (3.8%) | 41 (5.0%) |
| No Fuel Used | 0 (0.0%) | 11 (1.3%) |
| Total | 2,006 (100.0%) | 829 (100.0%) |
Household Vehicle Usage in International Falls
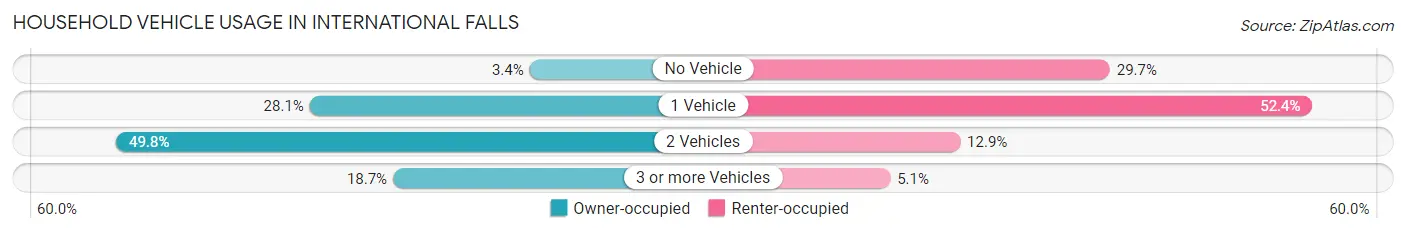
| Vehicles per Household | Owner-occupied | Renter-occupied |
| No Vehicle | 69 (3.4%) | 246 (29.7%) |
| 1 Vehicle | 563 (28.1%) | 434 (52.3%) |
| 2 Vehicles | 998 (49.7%) | 107 (12.9%) |
| 3 or more Vehicles | 376 (18.7%) | 42 (5.1%) |
| Total | 2,006 (100.0%) | 829 (100.0%) |
Real Estate & Mortgages in International Falls
Real Estate and Mortgage Overview in International Falls
| Characteristic | Without Mortgage | With Mortgage |
| Housing Units | 833 | 1,173 |
| Median Property Value | $82,700 | $132,700 |
| Median Household Income | $50,665 | $126 |
| Monthly Housing Costs | $365 | $0 |
| Real Estate Taxes | $855 | $5 |
Property Value by Mortgage Status in International Falls
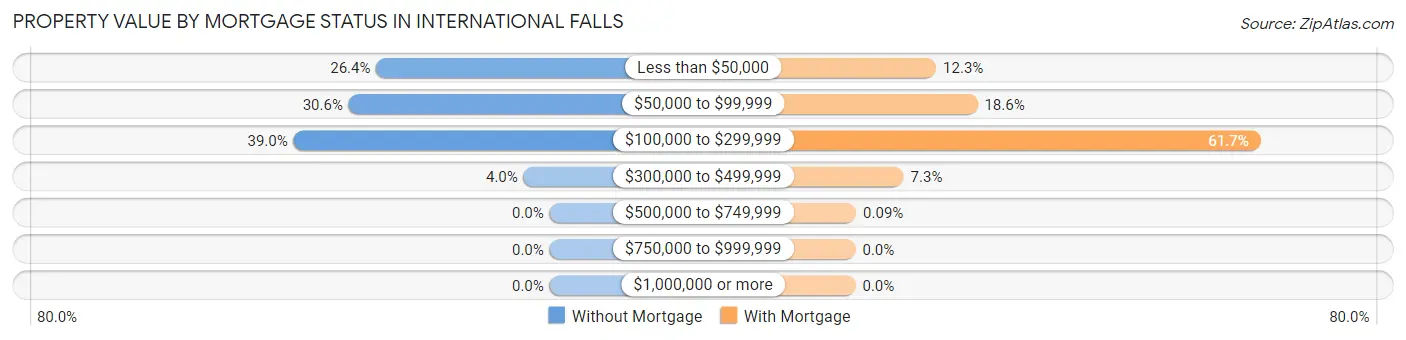
| Property Value | Without Mortgage | With Mortgage |
| Less than $50,000 | 220 (26.4%) | 144 (12.3%) |
| $50,000 to $99,999 | 255 (30.6%) | 218 (18.6%) |
| $100,000 to $299,999 | 325 (39.0%) | 724 (61.7%) |
| $300,000 to $499,999 | 33 (4.0%) | 86 (7.3%) |
| $500,000 to $749,999 | 0 (0.0%) | 1 (0.1%) |
| $750,000 to $999,999 | 0 (0.0%) | 0 (0.0%) |
| $1,000,000 or more | 0 (0.0%) | 0 (0.0%) |
| Total | 833 (100.0%) | 1,173 (100.0%) |
Household Income by Mortgage Status in International Falls
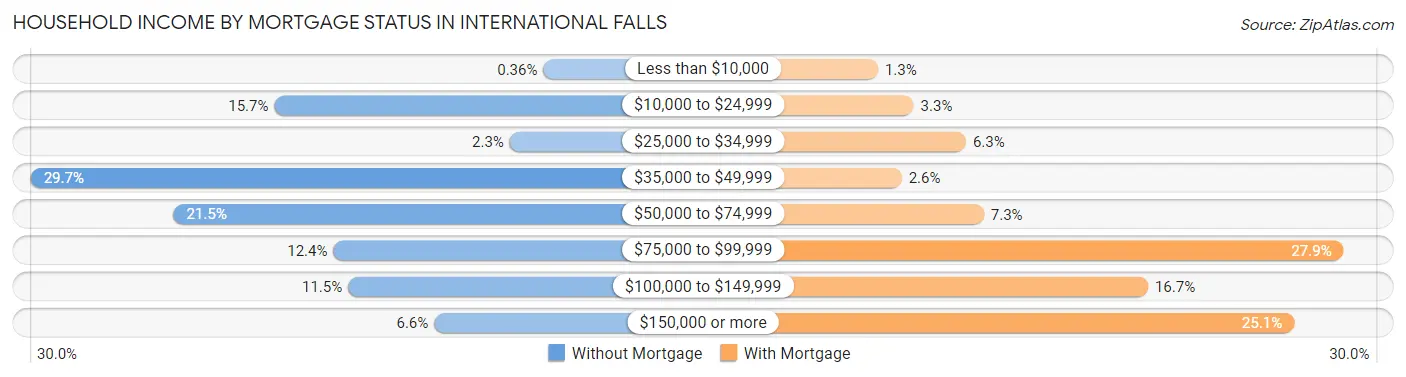
| Household Income | Without Mortgage | With Mortgage |
| Less than $10,000 | 3 (0.4%) | 15 (1.3%) |
| $10,000 to $24,999 | 131 (15.7%) | 39 (3.3%) |
| $25,000 to $34,999 | 19 (2.3%) | 74 (6.3%) |
| $35,000 to $49,999 | 247 (29.6%) | 31 (2.6%) |
| $50,000 to $74,999 | 179 (21.5%) | 86 (7.3%) |
| $75,000 to $99,999 | 103 (12.4%) | 327 (27.9%) |
| $100,000 to $149,999 | 96 (11.5%) | 196 (16.7%) |
| $150,000 or more | 55 (6.6%) | 294 (25.1%) |
| Total | 833 (100.0%) | 1,173 (100.0%) |
Property Value to Household Income Ratio in International Falls
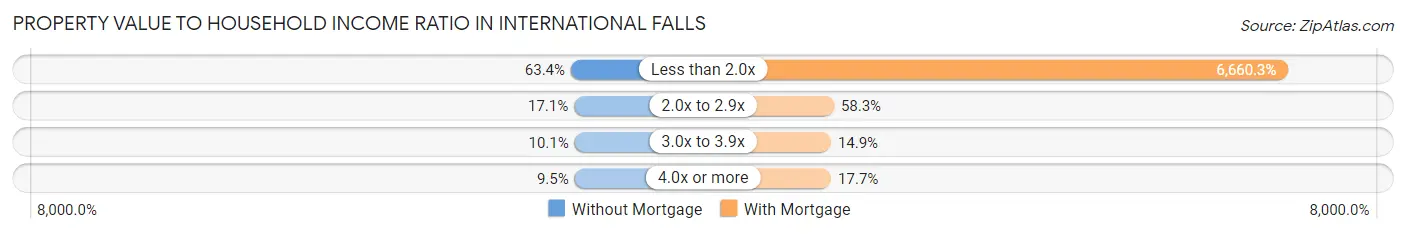
| Value-to-Income Ratio | Without Mortgage | With Mortgage |
| Less than 2.0x | 528 (63.4%) | 78,125 (6,660.3%) |
| 2.0x to 2.9x | 142 (17.1%) | 684 (58.3%) |
| 3.0x to 3.9x | 84 (10.1%) | 175 (14.9%) |
| 4.0x or more | 79 (9.5%) | 208 (17.7%) |
| Total | 833 (100.0%) | 1,173 (100.0%) |
Real Estate Taxes by Mortgage Status in International Falls
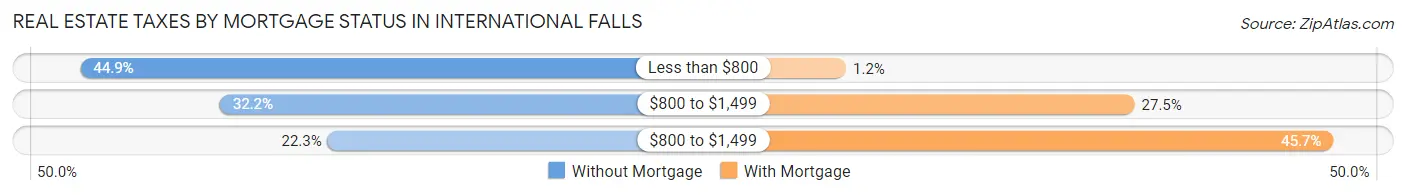
| Property Taxes | Without Mortgage | With Mortgage |
| Less than $800 | 374 (44.9%) | 14 (1.2%) |
| $800 to $1,499 | 268 (32.2%) | 323 (27.5%) |
| $800 to $1,499 | 186 (22.3%) | 536 (45.7%) |
| Total | 833 (100.0%) | 1,173 (100.0%) |
Health & Disability in International Falls
Health Insurance Coverage by Age in International Falls
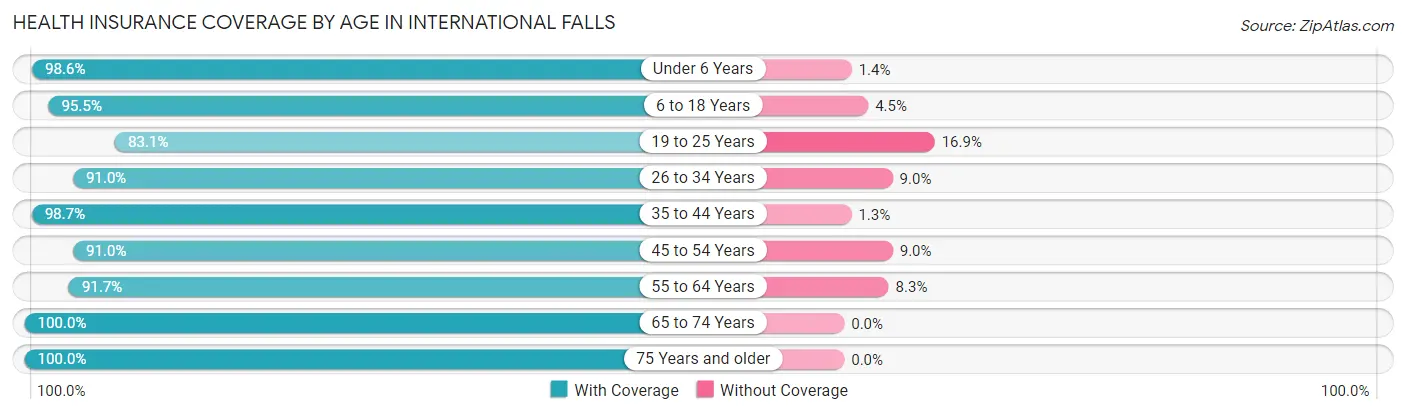
| Age Bracket | With Coverage | Without Coverage |
| Under 6 Years | 283 (98.6%) | 4 (1.4%) |
| 6 to 18 Years | 814 (95.5%) | 38 (4.5%) |
| 19 to 25 Years | 355 (83.1%) | 72 (16.9%) |
| 26 to 34 Years | 595 (91.0%) | 59 (9.0%) |
| 35 to 44 Years | 442 (98.7%) | 6 (1.3%) |
| 45 to 54 Years | 604 (91.0%) | 60 (9.0%) |
| 55 to 64 Years | 909 (91.7%) | 82 (8.3%) |
| 65 to 74 Years | 839 (100.0%) | 0 (0.0%) |
| 75 Years and older | 483 (100.0%) | 0 (0.0%) |
| Total | 5,324 (94.3%) | 321 (5.7%) |
Health Insurance Coverage by Citizenship Status in International Falls
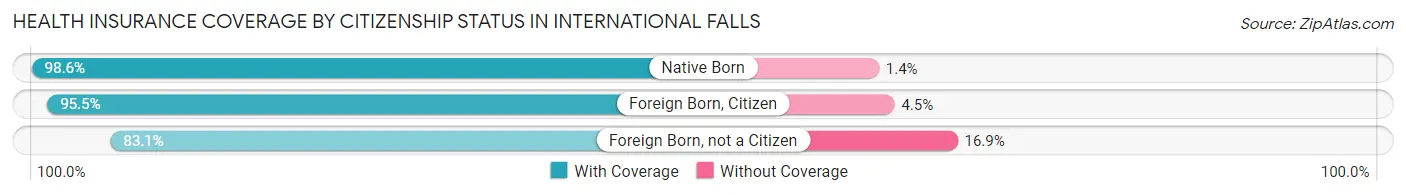
| Citizenship Status | With Coverage | Without Coverage |
| Native Born | 283 (98.6%) | 4 (1.4%) |
| Foreign Born, Citizen | 814 (95.5%) | 38 (4.5%) |
| Foreign Born, not a Citizen | 355 (83.1%) | 72 (16.9%) |
Health Insurance Coverage by Household Income in International Falls
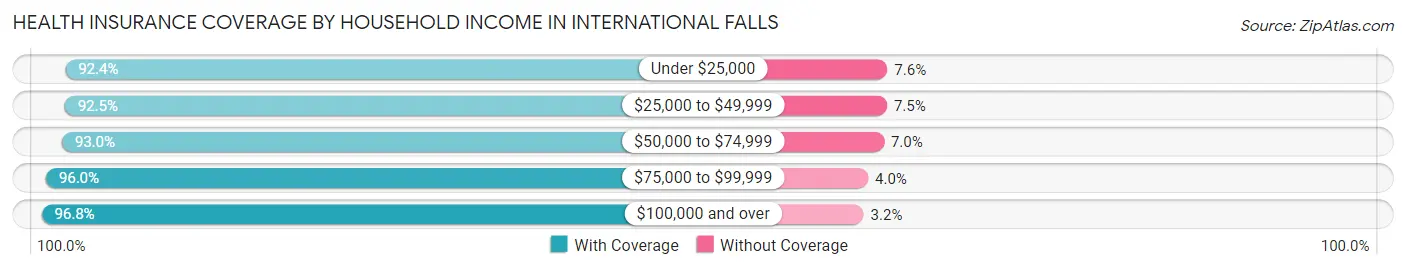
| Household Income | With Coverage | Without Coverage |
| Under $25,000 | 813 (92.4%) | 67 (7.6%) |
| $25,000 to $49,999 | 972 (92.5%) | 79 (7.5%) |
| $50,000 to $74,999 | 1,121 (93.0%) | 84 (7.0%) |
| $75,000 to $99,999 | 842 (96.0%) | 35 (4.0%) |
| $100,000 and over | 1,442 (96.8%) | 47 (3.2%) |
Public vs Private Health Insurance Coverage by Age in International Falls
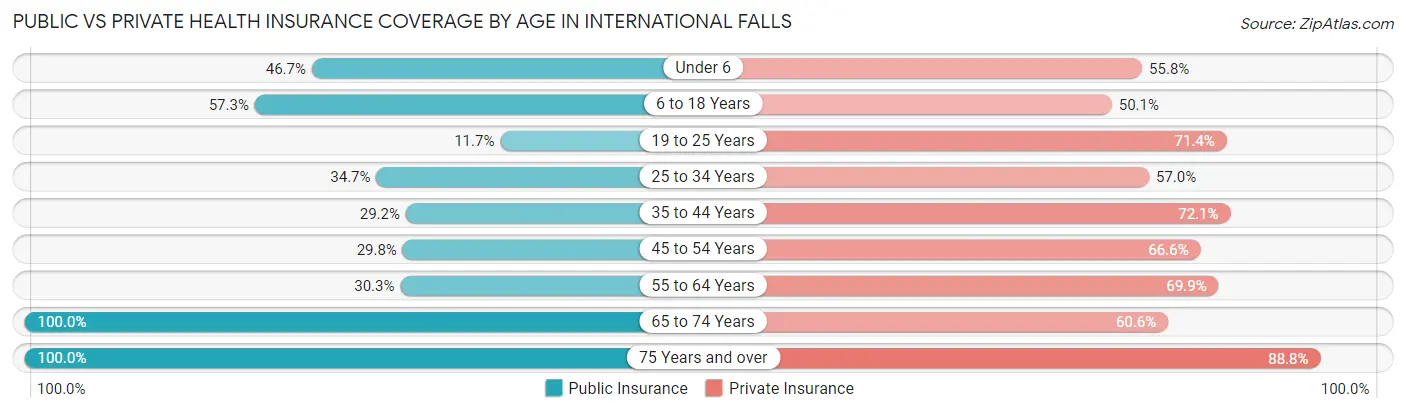
| Age Bracket | Public Insurance | Private Insurance |
| Under 6 | 134 (46.7%) | 160 (55.7%) |
| 6 to 18 Years | 488 (57.3%) | 427 (50.1%) |
| 19 to 25 Years | 50 (11.7%) | 305 (71.4%) |
| 25 to 34 Years | 227 (34.7%) | 373 (57.0%) |
| 35 to 44 Years | 131 (29.2%) | 323 (72.1%) |
| 45 to 54 Years | 198 (29.8%) | 442 (66.6%) |
| 55 to 64 Years | 300 (30.3%) | 693 (69.9%) |
| 65 to 74 Years | 839 (100.0%) | 508 (60.6%) |
| 75 Years and over | 483 (100.0%) | 429 (88.8%) |
| Total | 2,850 (50.5%) | 3,660 (64.8%) |
Disability Status by Sex by Age in International Falls
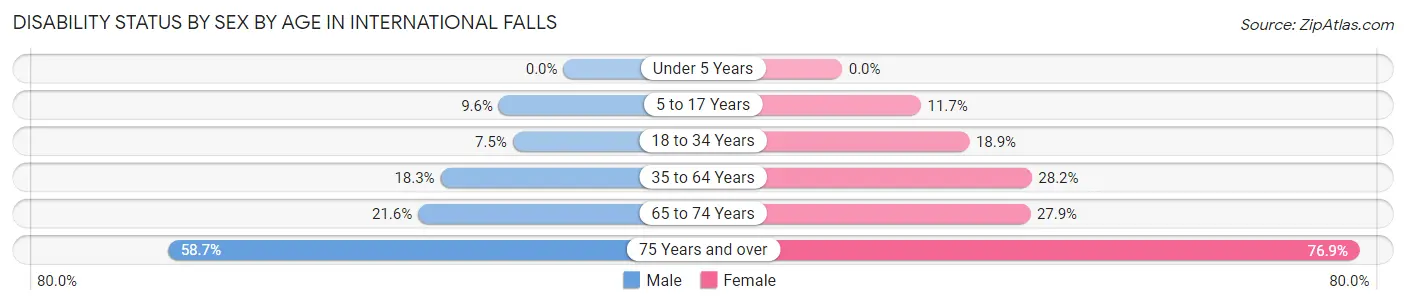
| Age Bracket | Male | Female |
| Under 5 Years | 0 (0.0%) | 0 (0.0%) |
| 5 to 17 Years | 50 (9.6%) | 38 (11.7%) |
| 18 to 34 Years | 43 (7.5%) | 111 (18.9%) |
| 35 to 64 Years | 190 (18.2%) | 299 (28.1%) |
| 65 to 74 Years | 93 (21.6%) | 114 (27.9%) |
| 75 Years and over | 131 (58.7%) | 200 (76.9%) |
Disability Class by Sex by Age in International Falls
Disability Class: Hearing Difficulty
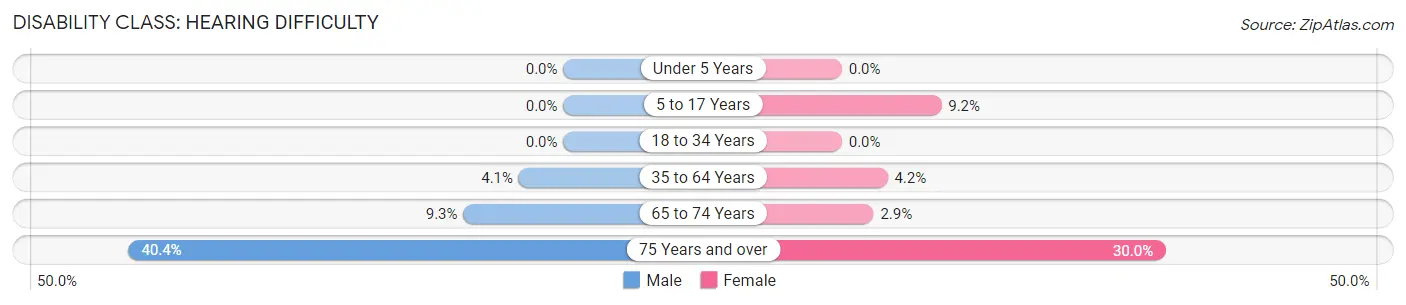
| Age Bracket | Male | Female |
| Under 5 Years | 0 (0.0%) | 0 (0.0%) |
| 5 to 17 Years | 0 (0.0%) | 30 (9.2%) |
| 18 to 34 Years | 0 (0.0%) | 0 (0.0%) |
| 35 to 64 Years | 43 (4.1%) | 45 (4.2%) |
| 65 to 74 Years | 40 (9.3%) | 12 (2.9%) |
| 75 Years and over | 90 (40.4%) | 78 (30.0%) |
Disability Class: Vision Difficulty
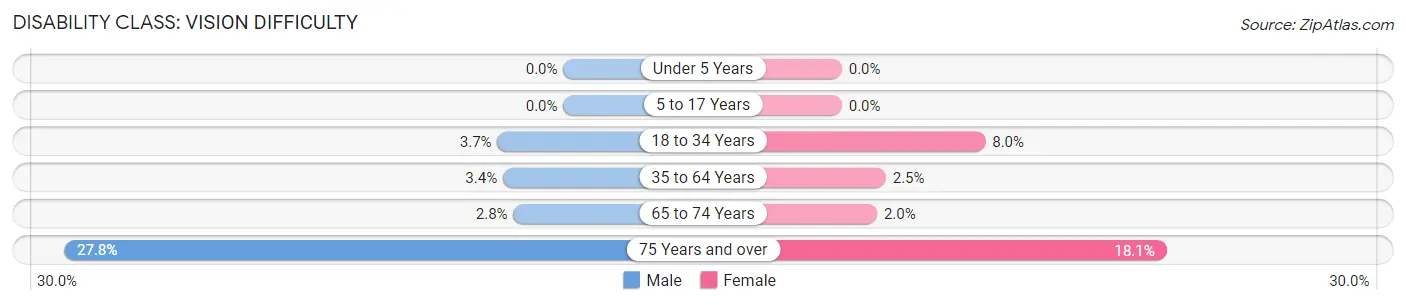
| Age Bracket | Male | Female |
| Under 5 Years | 0 (0.0%) | 0 (0.0%) |
| 5 to 17 Years | 0 (0.0%) | 0 (0.0%) |
| 18 to 34 Years | 21 (3.7%) | 47 (8.0%) |
| 35 to 64 Years | 35 (3.4%) | 26 (2.5%) |
| 65 to 74 Years | 12 (2.8%) | 8 (2.0%) |
| 75 Years and over | 62 (27.8%) | 47 (18.1%) |
Disability Class: Cognitive Difficulty
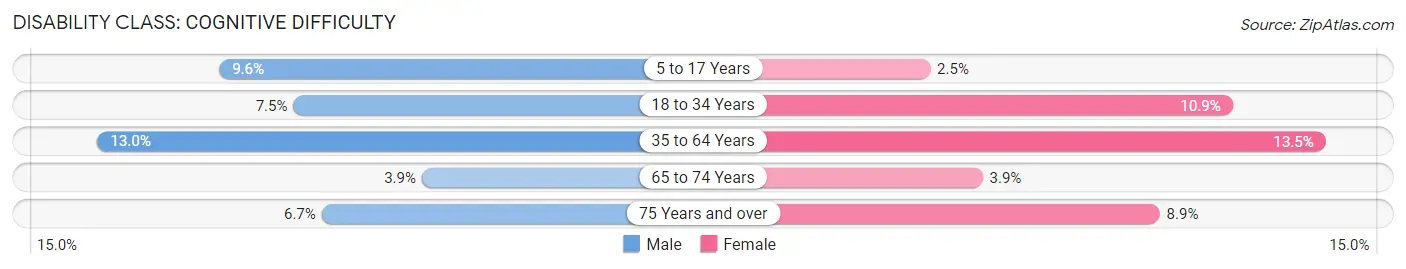
| Age Bracket | Male | Female |
| 5 to 17 Years | 50 (9.6%) | 8 (2.5%) |
| 18 to 34 Years | 43 (7.5%) | 64 (10.9%) |
| 35 to 64 Years | 135 (13.0%) | 143 (13.5%) |
| 65 to 74 Years | 17 (3.9%) | 16 (3.9%) |
| 75 Years and over | 15 (6.7%) | 23 (8.8%) |
Disability Class: Ambulatory Difficulty
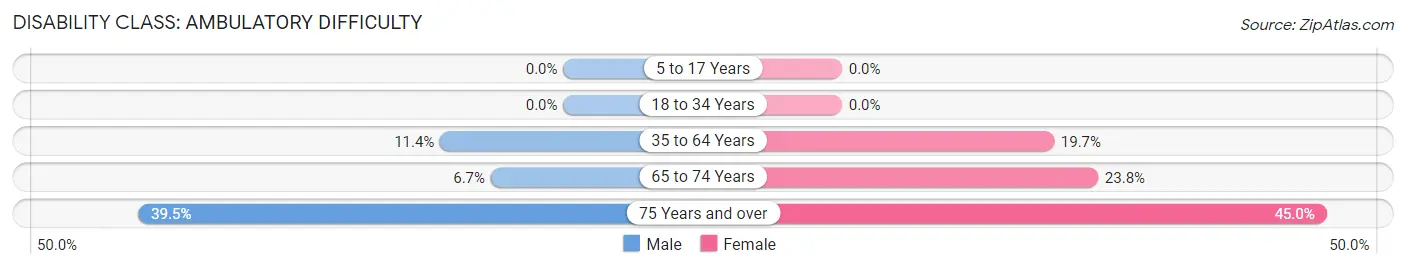
| Age Bracket | Male | Female |
| 5 to 17 Years | 0 (0.0%) | 0 (0.0%) |
| 18 to 34 Years | 0 (0.0%) | 0 (0.0%) |
| 35 to 64 Years | 119 (11.4%) | 209 (19.7%) |
| 65 to 74 Years | 29 (6.7%) | 97 (23.8%) |
| 75 Years and over | 88 (39.5%) | 117 (45.0%) |
Disability Class: Self-Care Difficulty
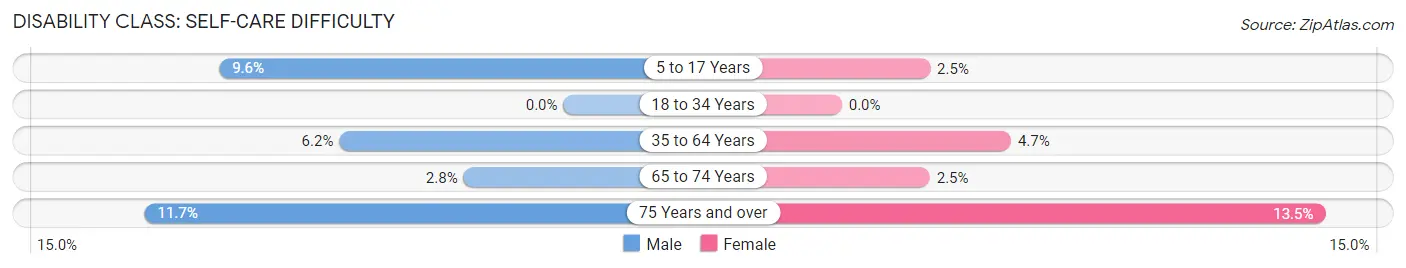
| Age Bracket | Male | Female |
| 5 to 17 Years | 50 (9.6%) | 8 (2.5%) |
| 18 to 34 Years | 0 (0.0%) | 0 (0.0%) |
| 35 to 64 Years | 65 (6.2%) | 50 (4.7%) |
| 65 to 74 Years | 12 (2.8%) | 10 (2.5%) |
| 75 Years and over | 26 (11.7%) | 35 (13.5%) |
Technology Access in International Falls
Computing Device Access in International Falls
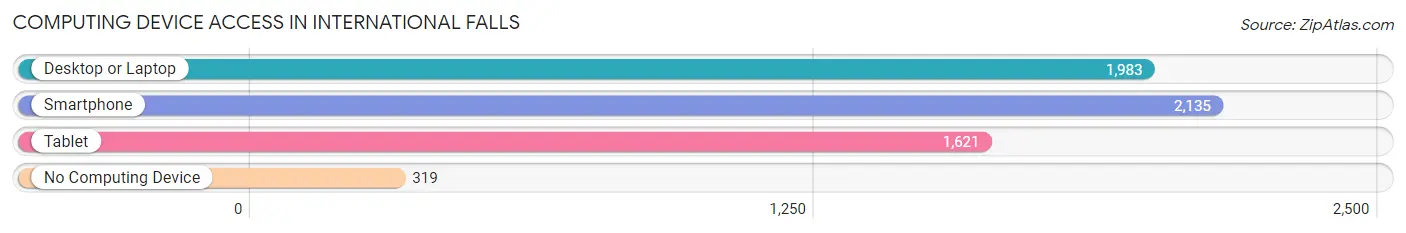
| Device Type | # Households | % Households |
| Desktop or Laptop | 1,983 | 70.0% |
| Smartphone | 2,135 | 75.3% |
| Tablet | 1,621 | 57.2% |
| No Computing Device | 319 | 11.3% |
| Total | 2,835 | 100.0% |
Internet Access in International Falls
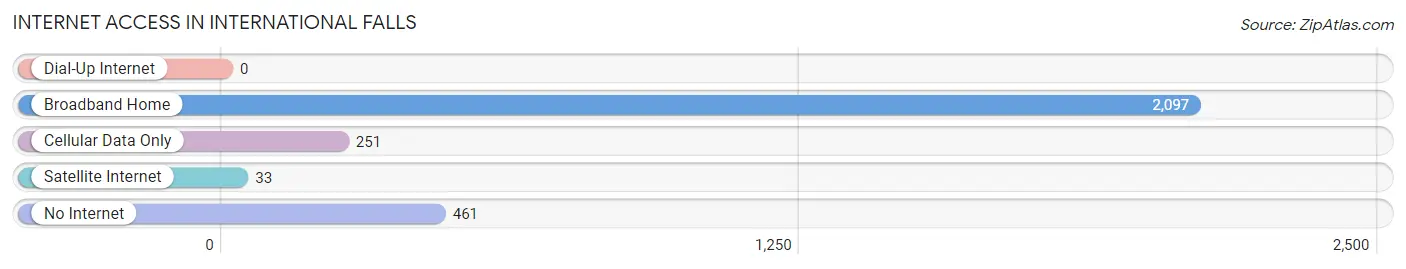
| Internet Type | # Households | % Households |
| Dial-Up Internet | 0 | 0.0% |
| Broadband Home | 2,097 | 74.0% |
| Cellular Data Only | 251 | 8.8% |
| Satellite Internet | 33 | 1.2% |
| No Internet | 461 | 16.3% |
| Total | 2,835 | 100.0% |
International Falls Summary
History
International Falls, Minnesota is a small city located in Koochiching County, Minnesota, United States. It is situated on the Rainy River, which forms the border between the United States and Canada. The city is the county seat of Koochiching County and is the largest city in the county. The city was founded in 1892 and was originally known as Falls City. The name was changed to International Falls in 1903 due to its proximity to the Canadian border.
The city was originally inhabited by the Ojibwe people, who were the first to settle in the area. The Ojibwe were attracted to the area due to its abundance of fish and game. The first European settlers arrived in the area in the late 1800s and began to establish logging camps. The logging industry was the main source of employment for the early settlers and was the primary industry in the area for many years.
The city was officially incorporated in 1903 and the first mayor was elected in 1904. The city quickly grew and by 1910, the population had reached 1,000. The city continued to grow and by 1920, the population had reached 2,500. The city experienced a period of rapid growth in the 1950s and 1960s, when the population reached 8,000.
Geography
International Falls is located in Koochiching County, Minnesota, United States. It is situated on the Rainy River, which forms the border between the United States and Canada. The city is located at the junction of the Rainy River and the Big Fork River. The city is located in a region of rolling hills and is surrounded by forests. The city is located approximately 60 miles north of Duluth, Minnesota and approximately 200 miles north of Minneapolis, Minnesota.
The city has a total area of 8.2 square miles, of which 8.1 square miles is land and 0.1 square miles is water. The city has a humid continental climate, with cold, snowy winters and warm, humid summers. The average temperature in January is 8°F and the average temperature in July is 72°F.
Economy
International Falls is the economic center of Koochiching County. The city is home to several large employers, including Boise Cascade, a paper mill, and the Rainy River Community College. The city is also home to several small businesses, including restaurants, retail stores, and service providers.
The city is also home to several tourist attractions, including Voyageurs National Park, which is located just outside of the city. The park is a popular destination for outdoor enthusiasts, offering camping, fishing, boating, and hiking opportunities. The city is also home to several festivals and events, including the International Falls Bass Festival and the International Falls Ice Fishing Derby.
Demographics
As of the 2010 census, the population of International Falls was 6,424. The population is spread out with 49.2% male and 50.8% female. The median age is 43.7 years. The racial makeup of the city is 94.2% White, 0.7% African American, 0.7% Native American, 0.3% Asian, 0.1% Pacific Islander, 2.2% from other races, and 1.8% from two or more races. The median household income is $37,917 and the median family income is $45,938. The per capita income is $20,945. The poverty rate is 16.2%.
Common Questions
What is Per Capita Income in International Falls?
Per Capita income in International Falls is $32,425.
What is the Median Family Income in International Falls?
Median Family Income in International Falls is $73,426.
What is the Median Household income in International Falls?
Median Household Income in International Falls is $54,680.
What is Income or Wage Gap in International Falls?
Income or Wage Gap in International Falls is 36.5%.
Women in International Falls earn 63.5 cents for every dollar earned by a man.
What is Inequality or Gini Index in International Falls?
Inequality or Gini Index in International Falls is 0.38.
What is the Total Population of International Falls?
Total Population of International Falls is 5,795.
What is the Total Male Population of International Falls?
Total Male Population of International Falls is 2,951.
What is the Total Female Population of International Falls?
Total Female Population of International Falls is 2,844.
What is the Ratio of Males per 100 Females in International Falls?
There are 103.76 Males per 100 Females in International Falls.
What is the Ratio of Females per 100 Males in International Falls?
There are 96.37 Females per 100 Males in International Falls.
What is the Median Population Age in International Falls?
Median Population Age in International Falls is 47.7 Years.
What is the Average Family Size in International Falls
Average Family Size in International Falls is 2.8 People.
What is the Average Household Size in International Falls
Average Household Size in International Falls is 1.9 People.
How Large is the Labor Force in International Falls?
There are 2,807 People in the Labor Forcein in International Falls.
What is the Percentage of People in the Labor Force in International Falls?
58.1% of People are in the Labor Force in International Falls.
What is the Unemployment Rate in International Falls?
Unemployment Rate in International Falls is 6.9%.