Cottonwood, MN Map & Demographics
Cottonwood Map
Cottonwood Overview
$40,715
PER CAPITA INCOME
$103,750
AVG FAMILY INCOME
$79,457
AVG HOUSEHOLD INCOME
26.8%
WAGE / INCOME GAP [ % ]
73.2¢/ $1
WAGE / INCOME GAP [ $ ]
0.41
INEQUALITY / GINI INDEX
1,150
TOTAL POPULATION
586
MALE POPULATION
564
FEMALE POPULATION
103.90
MALES / 100 FEMALES
96.25
FEMALES / 100 MALES
38.1
MEDIAN AGE
3.0
AVG FAMILY SIZE
2.3
AVG HOUSEHOLD SIZE
629
LABOR FORCE [ PEOPLE ]
70.9%
PERCENT IN LABOR FORCE
3.3%
UNEMPLOYMENT RATE
Cottonwood Zip Codes
Income in Cottonwood
Income Overview in Cottonwood
Per Capita Income in Cottonwood is $40,715, while median incomes of families and households are $103,750 and $79,457 respectively.
| Characteristic | Number | Measure |
| Per Capita Income | 1,150 | $40,715 |
| Median Family Income | 291 | $103,750 |
| Mean Family Income | 291 | $117,280 |
| Median Household Income | 492 | $79,457 |
| Mean Household Income | 492 | $92,351 |
| Income Deficit | 291 | $0 |
| Wage / Income Gap (%) | 1,150 | 26.82% |
| Wage / Income Gap ($) | 1,150 | 73.18¢ per $1 |
| Gini / Inequality Index | 1,150 | 0.41 |
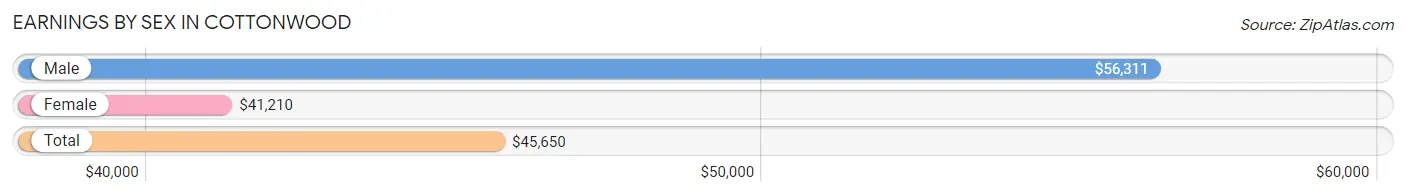
Earnings by Sex in Cottonwood
Average Earnings in Cottonwood are $45,650, $56,311 for men and $41,210 for women, a difference of 26.8%.
| Sex | Number | Average Earnings |
| Male | 365 (54.4%) | $56,311 |
| Female | 306 (45.6%) | $41,210 |
| Total | 671 (100.0%) | $45,650 |
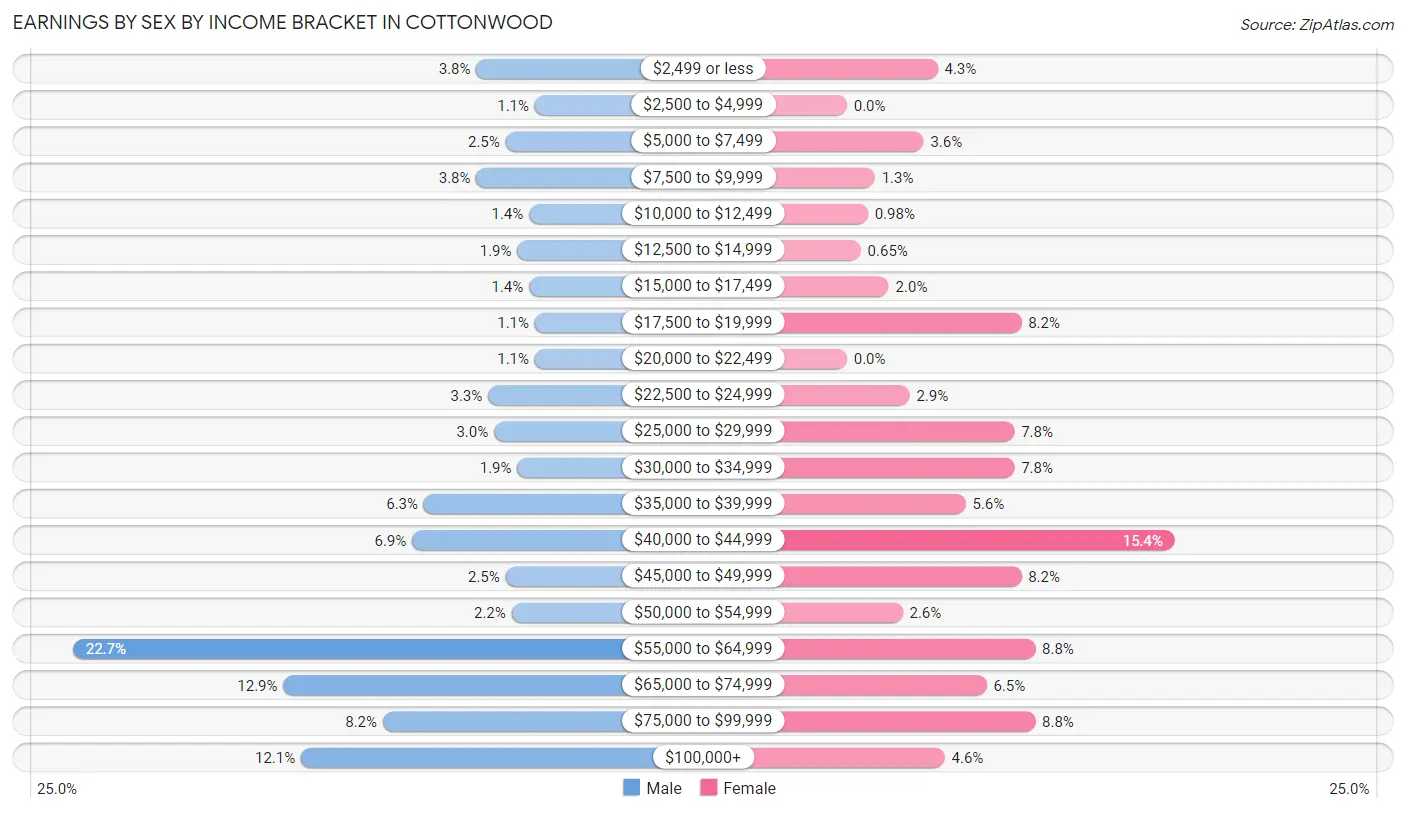
Earnings by Sex by Income Bracket in Cottonwood
The most common earnings brackets in Cottonwood are $55,000 to $64,999 for men (83 | 22.7%) and $40,000 to $44,999 for women (47 | 15.4%).
| Income | Male | Female |
| $2,499 or less | 14 (3.8%) | 13 (4.3%) |
| $2,500 to $4,999 | 4 (1.1%) | 0 (0.0%) |
| $5,000 to $7,499 | 9 (2.5%) | 11 (3.6%) |
| $7,500 to $9,999 | 14 (3.8%) | 4 (1.3%) |
| $10,000 to $12,499 | 5 (1.4%) | 3 (1.0%) |
| $12,500 to $14,999 | 7 (1.9%) | 2 (0.6%) |
| $15,000 to $17,499 | 5 (1.4%) | 6 (2.0%) |
| $17,500 to $19,999 | 4 (1.1%) | 25 (8.2%) |
| $20,000 to $22,499 | 4 (1.1%) | 0 (0.0%) |
| $22,500 to $24,999 | 12 (3.3%) | 9 (2.9%) |
| $25,000 to $29,999 | 11 (3.0%) | 24 (7.8%) |
| $30,000 to $34,999 | 7 (1.9%) | 24 (7.8%) |
| $35,000 to $39,999 | 23 (6.3%) | 17 (5.6%) |
| $40,000 to $44,999 | 25 (6.9%) | 47 (15.4%) |
| $45,000 to $49,999 | 9 (2.5%) | 25 (8.2%) |
| $50,000 to $54,999 | 8 (2.2%) | 8 (2.6%) |
| $55,000 to $64,999 | 83 (22.7%) | 27 (8.8%) |
| $65,000 to $74,999 | 47 (12.9%) | 20 (6.5%) |
| $75,000 to $99,999 | 30 (8.2%) | 27 (8.8%) |
| $100,000+ | 44 (12.0%) | 14 (4.6%) |
| Total | 365 (100.0%) | 306 (100.0%) |
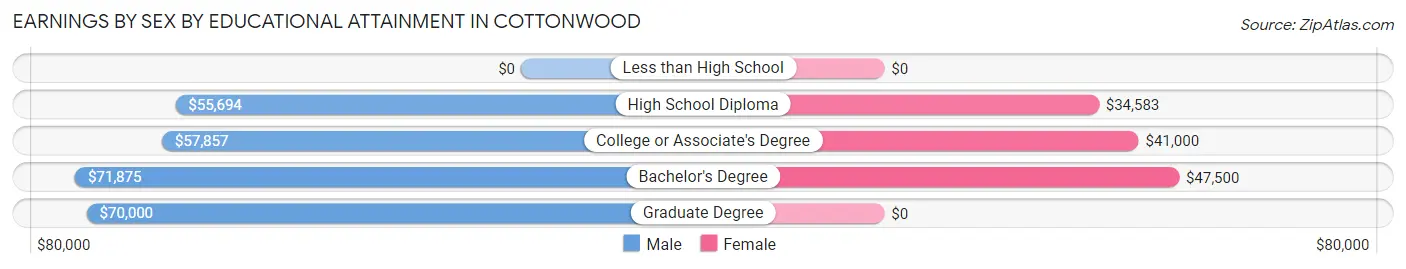
Earnings by Sex by Educational Attainment in Cottonwood
Average earnings in Cottonwood are $56,860 for men and $41,613 for women, a difference of 26.8%. Men with an educational attainment of bachelor's degree enjoy the highest average annual earnings of $71,875, while those with high school diploma education earn the least with $55,694. Women with an educational attainment of bachelor's degree earn the most with the average annual earnings of $47,500, while those with high school diploma education have the smallest earnings of $34,583.
| Educational Attainment | Male Income | Female Income |
| Less than High School | - | - |
| High School Diploma | $55,694 | $34,583 |
| College or Associate's Degree | $57,857 | $41,000 |
| Bachelor's Degree | $71,875 | $47,500 |
| Graduate Degree | $70,000 | $0 |
| Total | $56,860 | $41,613 |
Family Income in Cottonwood
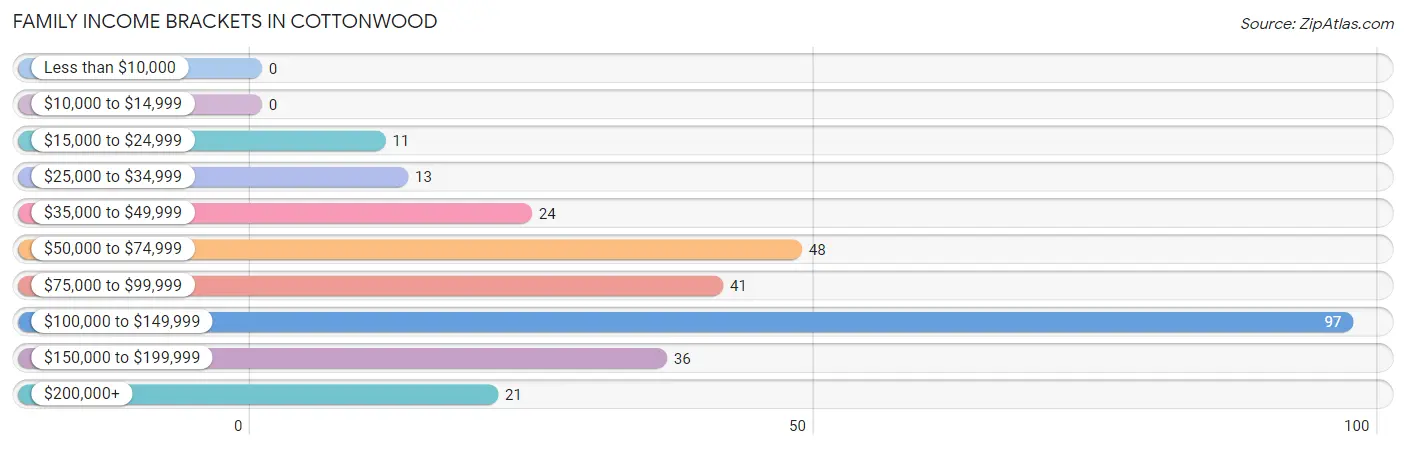
Family Income Brackets in Cottonwood
According to the Cottonwood family income data, there are 97 families falling into the $100,000 to $149,999 income range, which is the most common income bracket and makes up 33.3% of all families.
| Income Bracket | # Families | % Families |
| Less than $10,000 | 0 | 0.0% |
| $10,000 to $14,999 | 0 | 0.0% |
| $15,000 to $24,999 | 11 | 3.8% |
| $25,000 to $34,999 | 13 | 4.5% |
| $35,000 to $49,999 | 24 | 8.2% |
| $50,000 to $74,999 | 48 | 16.5% |
| $75,000 to $99,999 | 41 | 14.1% |
| $100,000 to $149,999 | 97 | 33.3% |
| $150,000 to $199,999 | 36 | 12.4% |
| $200,000+ | 21 | 7.2% |
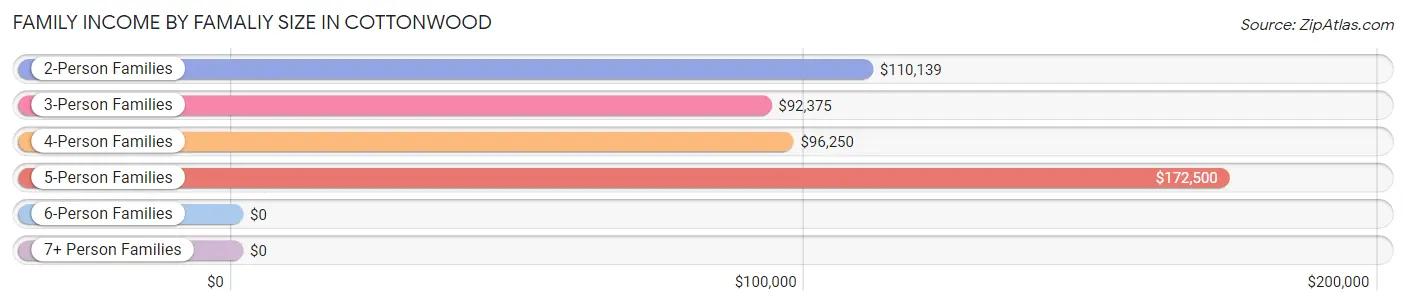
Family Income by Famaliy Size in Cottonwood
5-person families (24 | 8.3%) account for the highest median family income in Cottonwood with $172,500 per family, while 2-person families (159 | 54.6%) have the highest median income of $55,070 per family member.
| Income Bracket | # Families | Median Income |
| 2-Person Families | 159 (54.6%) | $110,139 |
| 3-Person Families | 45 (15.5%) | $92,375 |
| 4-Person Families | 54 (18.6%) | $96,250 |
| 5-Person Families | 24 (8.3%) | $172,500 |
| 6-Person Families | 6 (2.1%) | $0 |
| 7+ Person Families | 3 (1.0%) | $0 |
| Total | 291 (100.0%) | $103,750 |
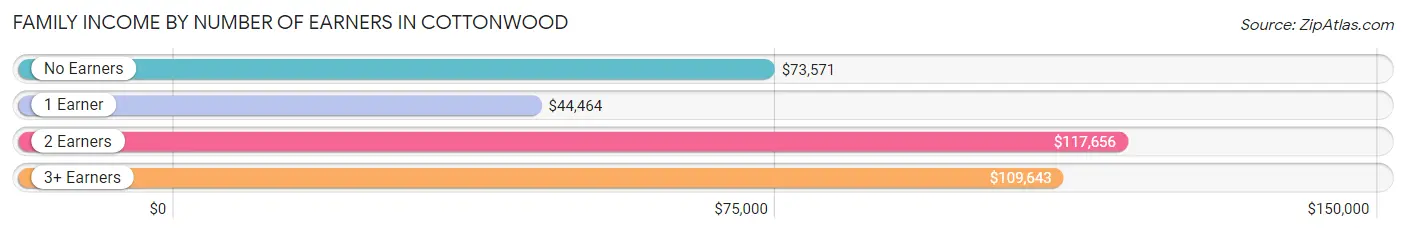
Family Income by Number of Earners in Cottonwood
The median family income in Cottonwood is $103,750, with families comprising 2 earners (171) having the highest median family income of $117,656, while families with 1 earner (64) have the lowest median family income of $44,464, accounting for 58.8% and 22.0% of families, respectively.
| Number of Earners | # Families | Median Income |
| No Earners | 30 (10.3%) | $73,571 |
| 1 Earner | 64 (22.0%) | $44,464 |
| 2 Earners | 171 (58.8%) | $117,656 |
| 3+ Earners | 26 (8.9%) | $109,643 |
| Total | 291 (100.0%) | $103,750 |
Household Income in Cottonwood
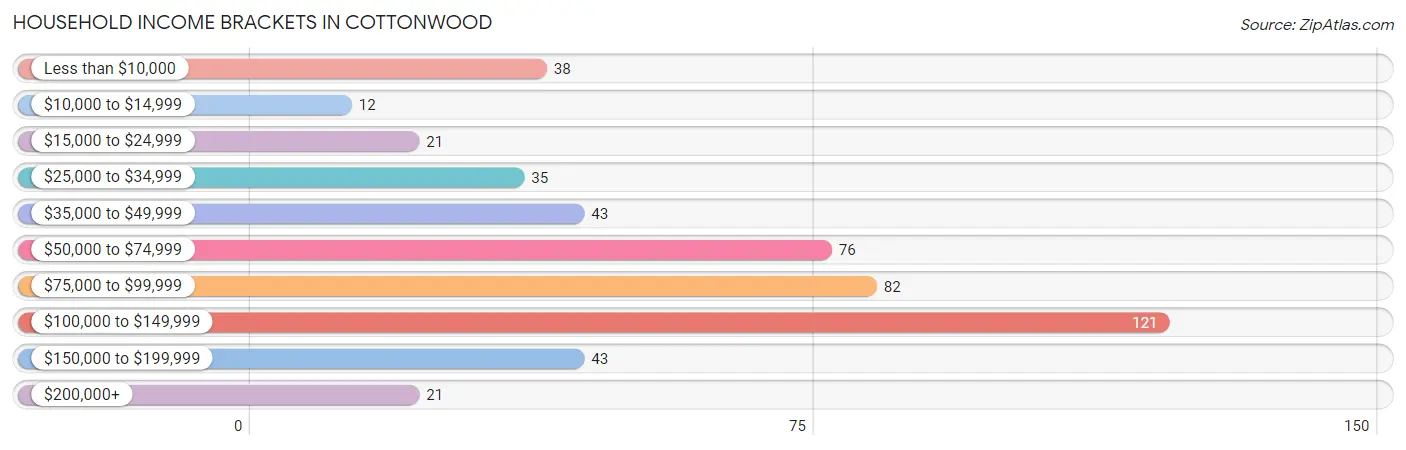
Household Income Brackets in Cottonwood
With 121 households falling in the category, the $100,000 to $149,999 income range is the most frequent in Cottonwood, accounting for 24.6% of all households. In contrast, only 12 households (2.4%) fall into the $10,000 to $14,999 income bracket, making it the least populous group.
| Income Bracket | # Households | % Households |
| Less than $10,000 | 38 | 7.7% |
| $10,000 to $14,999 | 12 | 2.4% |
| $15,000 to $24,999 | 21 | 4.3% |
| $25,000 to $34,999 | 35 | 7.1% |
| $35,000 to $49,999 | 43 | 8.7% |
| $50,000 to $74,999 | 76 | 15.4% |
| $75,000 to $99,999 | 82 | 16.7% |
| $100,000 to $149,999 | 121 | 24.6% |
| $150,000 to $199,999 | 43 | 8.7% |
| $200,000+ | 21 | 4.3% |
Household Income by Householder Age in Cottonwood
The median household income in Cottonwood is $79,457, with the highest median household income of $135,625 found in the 15 to 24 years age bracket for the primary householder. A total of 33 households (6.7%) fall into this category. Meanwhile, the 65+ years age bracket for the primary householder has the lowest median household income of $78,015, with 105 households (21.3%) in this group.
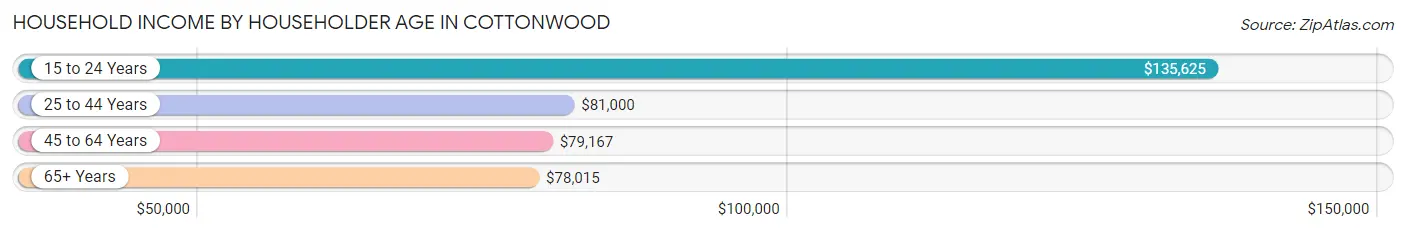
| Income Bracket | # Households | Median Income |
| 15 to 24 Years | 33 (6.7%) | $135,625 |
| 25 to 44 Years | 174 (35.4%) | $81,000 |
| 45 to 64 Years | 180 (36.6%) | $79,167 |
| 65+ Years | 105 (21.3%) | $78,015 |
| Total | 492 (100.0%) | $79,457 |
Poverty in Cottonwood
Income Below Poverty by Sex and Age in Cottonwood
With 7.3% poverty level for males and 16.2% for females among the residents of Cottonwood, 5 year old males and 45 to 54 year old females are the most vulnerable to poverty, with 8 males (27.6%) and 60 females (52.2%) in their respective age groups living below the poverty level.
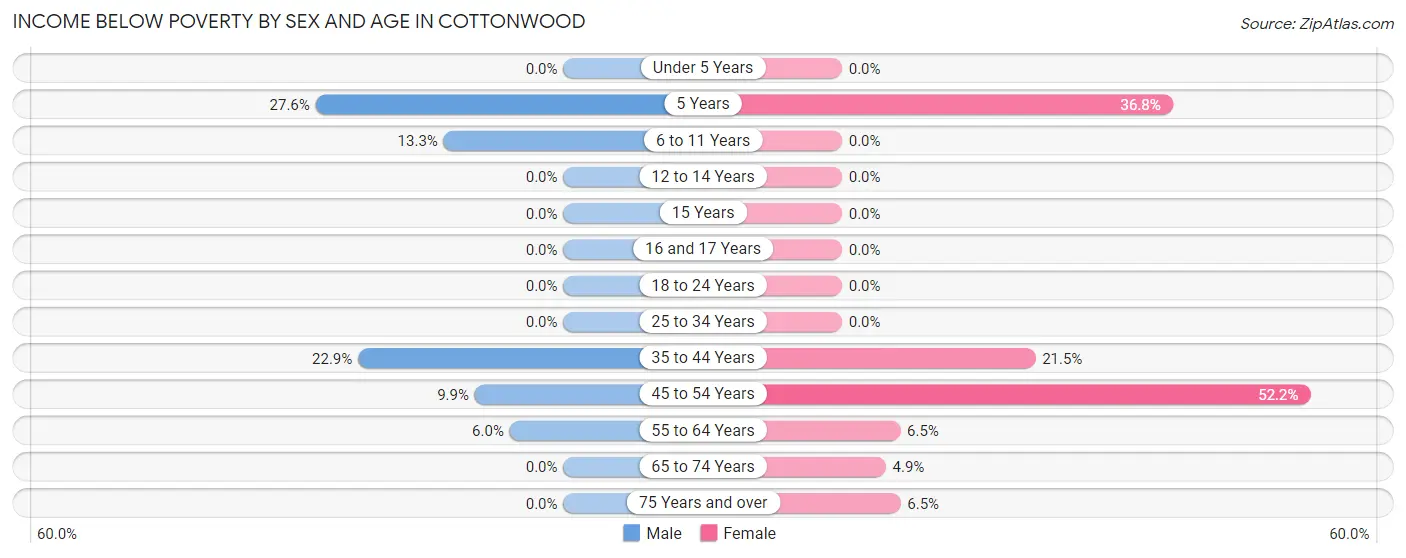
| Age Bracket | Male | Female |
| Under 5 Years | 0 (0.0%) | 0 (0.0%) |
| 5 Years | 8 (27.6%) | 7 (36.8%) |
| 6 to 11 Years | 8 (13.3%) | 0 (0.0%) |
| 12 to 14 Years | 0 (0.0%) | 0 (0.0%) |
| 15 Years | 0 (0.0%) | 0 (0.0%) |
| 16 and 17 Years | 0 (0.0%) | 0 (0.0%) |
| 18 to 24 Years | 0 (0.0%) | 0 (0.0%) |
| 25 to 34 Years | 0 (0.0%) | 0 (0.0%) |
| 35 to 44 Years | 16 (22.9%) | 14 (21.5%) |
| 45 to 54 Years | 7 (9.9%) | 60 (52.2%) |
| 55 to 64 Years | 4 (6.0%) | 5 (6.5%) |
| 65 to 74 Years | 0 (0.0%) | 2 (4.9%) |
| 75 Years and over | 0 (0.0%) | 3 (6.5%) |
| Total | 43 (7.3%) | 91 (16.2%) |
Income Above Poverty by Sex and Age in Cottonwood
According to the poverty statistics in Cottonwood, males aged under 5 years and females aged under 5 years are the age groups that are most secure financially, with 100.0% of males and 100.0% of females in these age groups living above the poverty line.
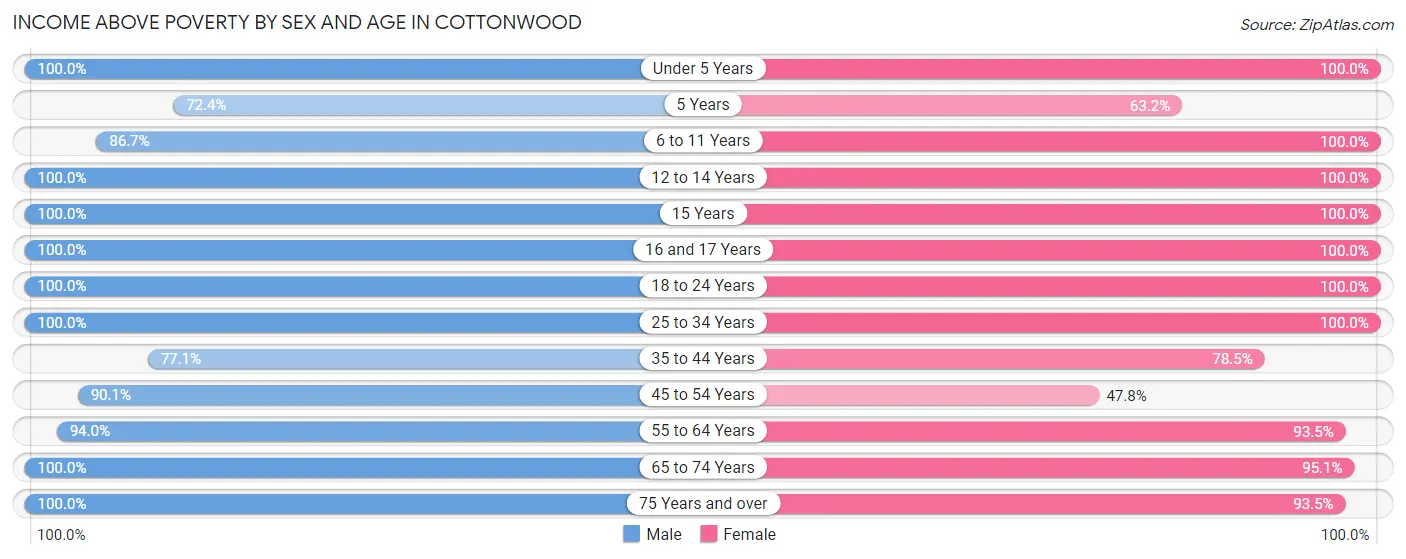
| Age Bracket | Male | Female |
| Under 5 Years | 57 (100.0%) | 29 (100.0%) |
| 5 Years | 21 (72.4%) | 12 (63.2%) |
| 6 to 11 Years | 52 (86.7%) | 20 (100.0%) |
| 12 to 14 Years | 13 (100.0%) | 12 (100.0%) |
| 15 Years | 3 (100.0%) | 21 (100.0%) |
| 16 and 17 Years | 11 (100.0%) | 9 (100.0%) |
| 18 to 24 Years | 64 (100.0%) | 14 (100.0%) |
| 25 to 34 Years | 65 (100.0%) | 95 (100.0%) |
| 35 to 44 Years | 54 (77.1%) | 51 (78.5%) |
| 45 to 54 Years | 64 (90.1%) | 55 (47.8%) |
| 55 to 64 Years | 63 (94.0%) | 72 (93.5%) |
| 65 to 74 Years | 42 (100.0%) | 39 (95.1%) |
| 75 Years and over | 33 (100.0%) | 43 (93.5%) |
| Total | 542 (92.6%) | 472 (83.8%) |
Income Below Poverty Among Married-Couple Families in Cottonwood
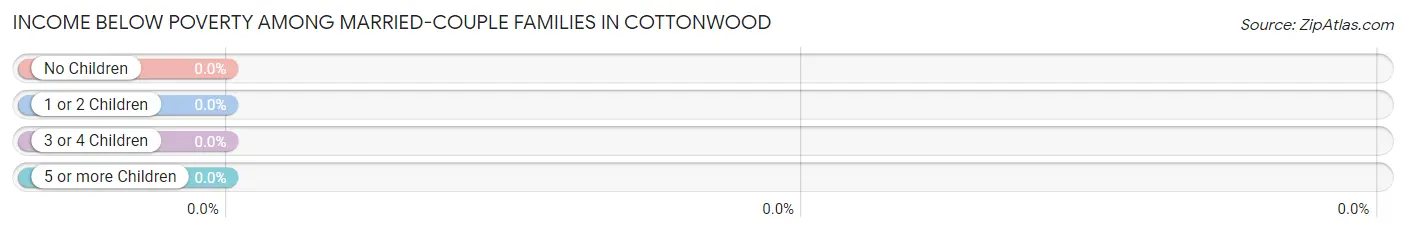
| Children | Above Poverty | Below Poverty |
| No Children | 145 (100.0%) | 0 (0.0%) |
| 1 or 2 Children | 61 (100.0%) | 0 (0.0%) |
| 3 or 4 Children | 28 (100.0%) | 0 (0.0%) |
| 5 or more Children | 3 (100.0%) | 0 (0.0%) |
| Total | 237 (100.0%) | 0 (0.0%) |
Income Below Poverty Among Single-Parent Households in Cottonwood
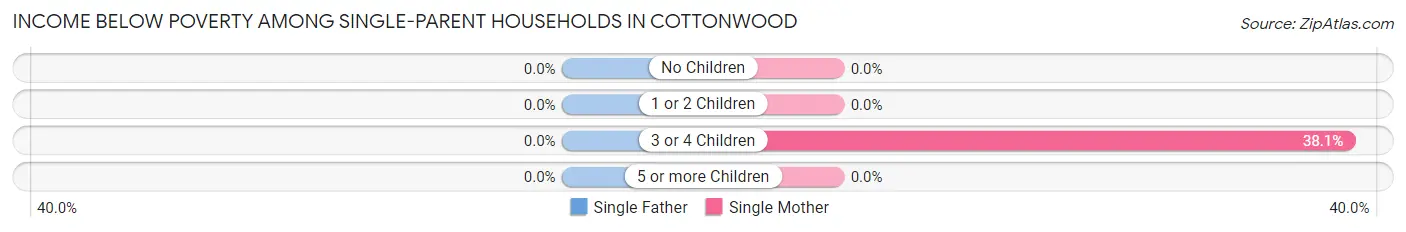
| Children | Single Father | Single Mother |
| No Children | 0 (0.0%) | 0 (0.0%) |
| 1 or 2 Children | 0 (0.0%) | 0 (0.0%) |
| 3 or 4 Children | 0 (0.0%) | 8 (38.1%) |
| 5 or more Children | 0 (0.0%) | 0 (0.0%) |
| Total | 0 (0.0%) | 8 (24.2%) |
Income Below Poverty Among Married-Couple vs Single-Parent Households in Cottonwood
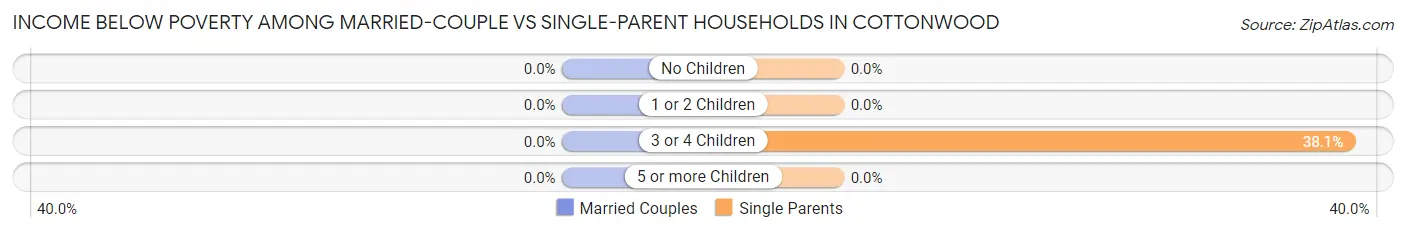
| Children | Married-Couple Families | Single-Parent Households |
| No Children | 0 (0.0%) | 0 (0.0%) |
| 1 or 2 Children | 0 (0.0%) | 0 (0.0%) |
| 3 or 4 Children | 0 (0.0%) | 8 (38.1%) |
| 5 or more Children | 0 (0.0%) | 0 (0.0%) |
| Total | 0 (0.0%) | 8 (14.8%) |
Race in Cottonwood
The most populous races in Cottonwood are White / Caucasian (1,059 | 92.1%), Hispanic or Latino (90 | 7.8%), and Some other Race (68 | 5.9%).
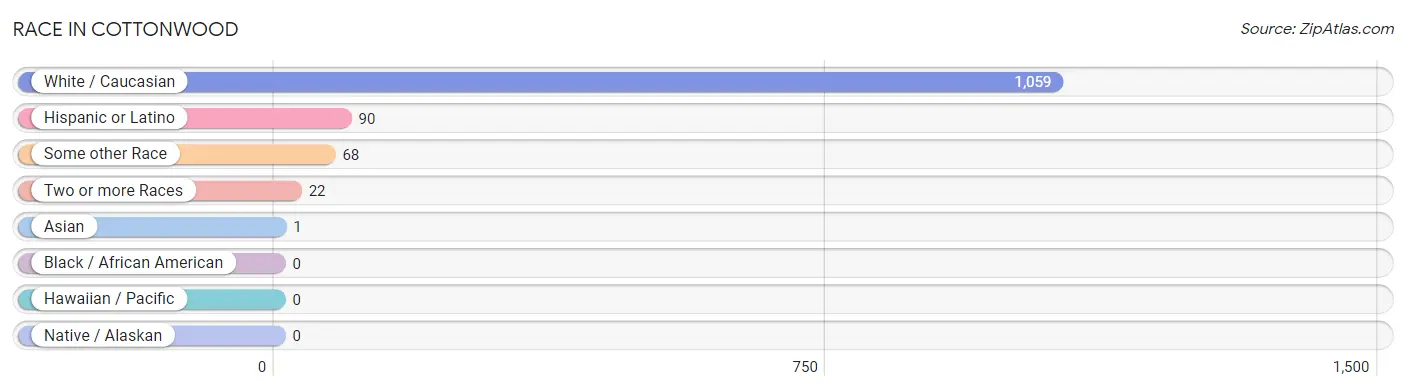
| Race | # Population | % Population |
| Asian | 1 | 0.1% |
| Black / African American | 0 | 0.0% |
| Hawaiian / Pacific | 0 | 0.0% |
| Hispanic or Latino | 90 | 7.8% |
| Native / Alaskan | 0 | 0.0% |
| White / Caucasian | 1,059 | 92.1% |
| Two or more Races | 22 | 1.9% |
| Some other Race | 68 | 5.9% |
| Total | 1,150 | 100.0% |
Ancestry in Cottonwood
The most populous ancestries reported in Cottonwood are German (484 | 42.1%), Norwegian (247 | 21.5%), Belgian (81 | 7.0%), Puerto Rican (69 | 6.0%), and Irish (67 | 5.8%), together accounting for 82.4% of all Cottonwood residents.
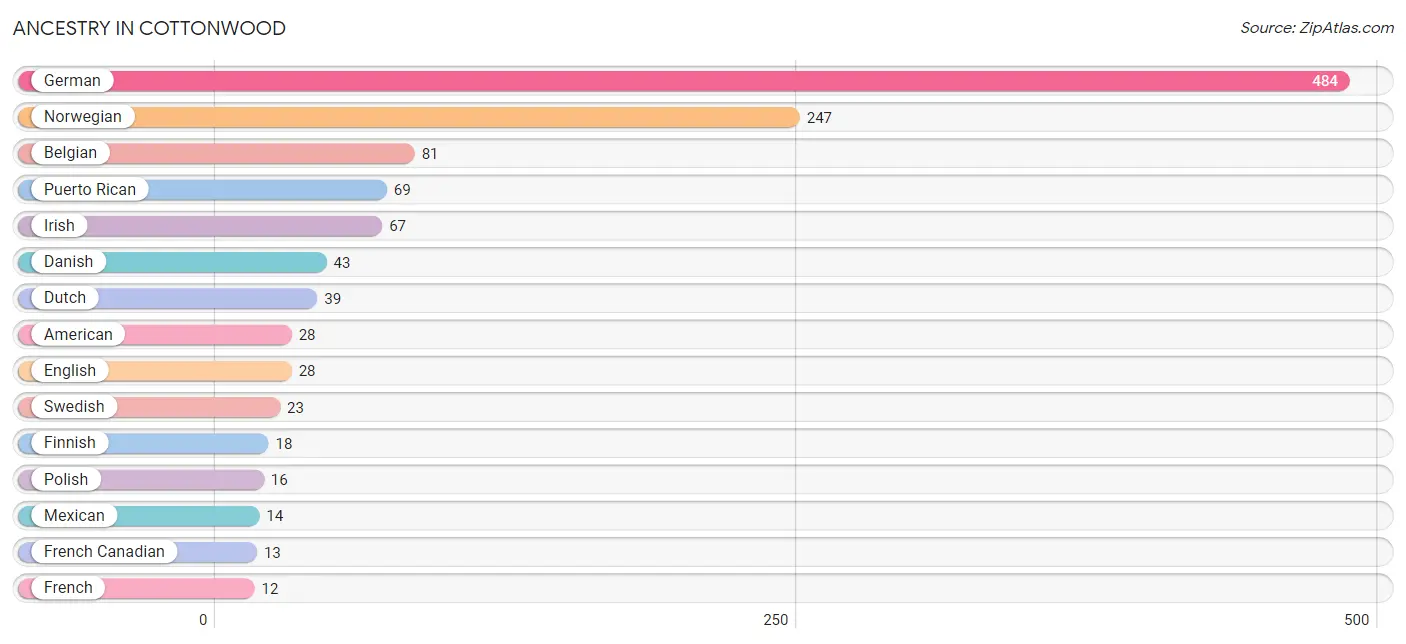
| Ancestry | # Population | % Population |
| American | 28 | 2.4% |
| Bangladeshi | 9 | 0.8% |
| Belgian | 81 | 7.0% |
| British | 10 | 0.9% |
| Czech | 10 | 0.9% |
| Danish | 43 | 3.7% |
| Dutch | 39 | 3.4% |
| English | 28 | 2.4% |
| Finnish | 18 | 1.6% |
| French | 12 | 1.0% |
| French Canadian | 13 | 1.1% |
| German | 484 | 42.1% |
| German Russian | 3 | 0.3% |
| Indian (Asian) | 1 | 0.1% |
| Irish | 67 | 5.8% |
| Italian | 3 | 0.3% |
| Japanese | 3 | 0.3% |
| Mexican | 14 | 1.2% |
| Norwegian | 247 | 21.5% |
| Polish | 16 | 1.4% |
| Puerto Rican | 69 | 6.0% |
| Scandinavian | 7 | 0.6% |
| Scottish | 3 | 0.3% |
| Slovak | 4 | 0.4% |
| South American | 6 | 0.5% |
| South American Indian | 6 | 0.5% |
| Swedish | 23 | 2.0% |
| Welsh | 10 | 0.9% | View All 28 Rows |
Immigrants in Cottonwood
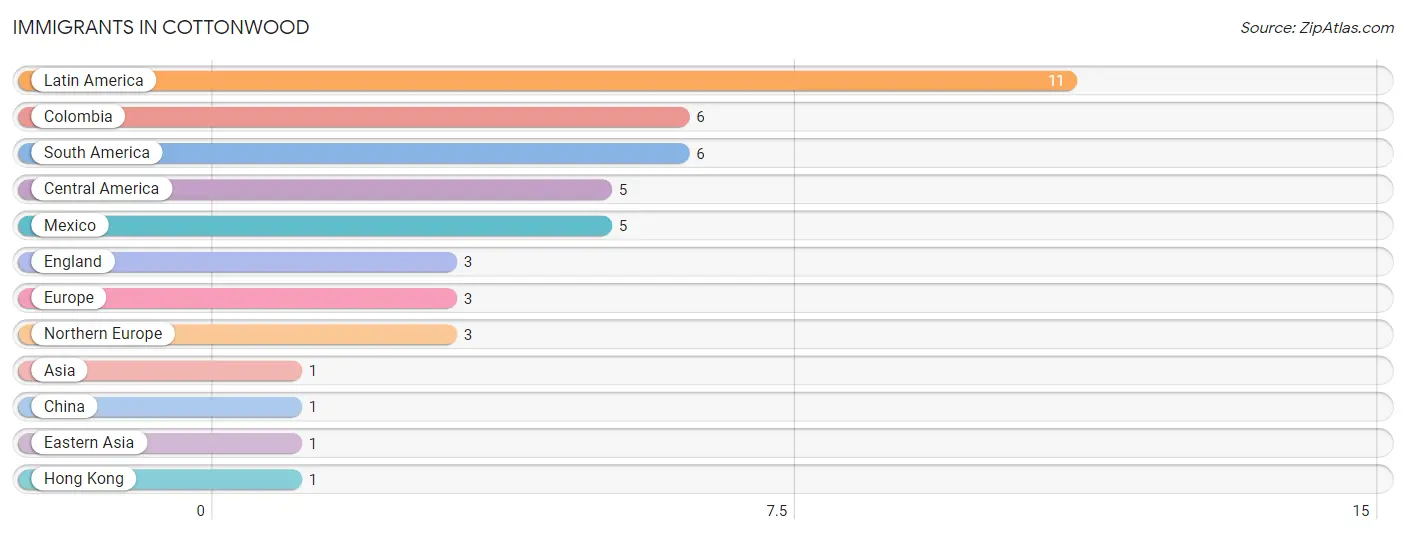
The most numerous immigrant groups reported in Cottonwood came from Latin America (11 | 1.0%), Colombia (6 | 0.5%), South America (6 | 0.5%), Central America (5 | 0.4%), and Mexico (5 | 0.4%), together accounting for 2.9% of all Cottonwood residents.
| Immigration Origin | # Population | % Population |
| Asia | 1 | 0.1% |
| Central America | 5 | 0.4% |
| China | 1 | 0.1% |
| Colombia | 6 | 0.5% |
| Eastern Asia | 1 | 0.1% |
| England | 3 | 0.3% |
| Europe | 3 | 0.3% |
| Hong Kong | 1 | 0.1% |
| Latin America | 11 | 1.0% |
| Mexico | 5 | 0.4% |
| Northern Europe | 3 | 0.3% |
| South America | 6 | 0.5% | View All 12 Rows |
Sex and Age in Cottonwood
Sex and Age in Cottonwood
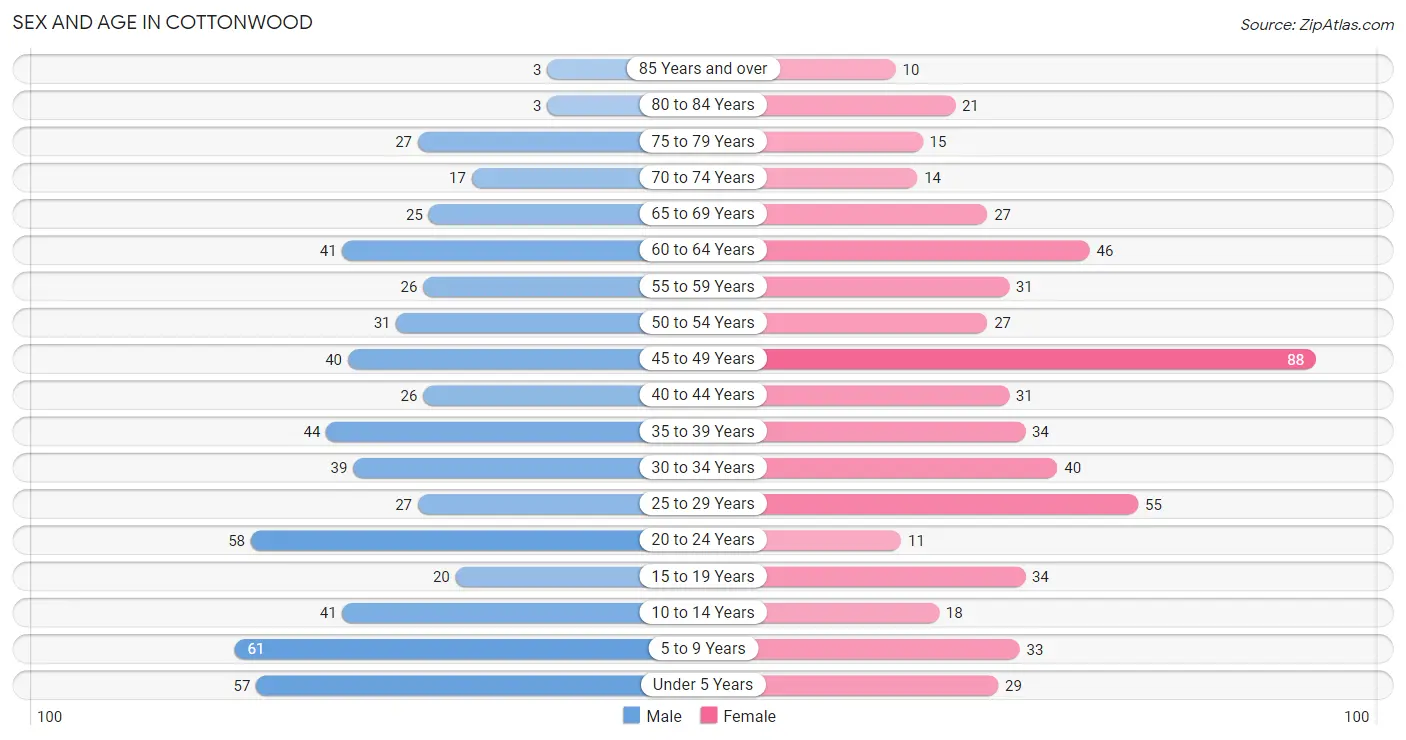
The most populous age groups in Cottonwood are 5 to 9 Years (61 | 10.4%) for men and 45 to 49 Years (88 | 15.6%) for women.
| Age Bracket | Male | Female |
| Under 5 Years | 57 (9.7%) | 29 (5.1%) |
| 5 to 9 Years | 61 (10.4%) | 33 (5.9%) |
| 10 to 14 Years | 41 (7.0%) | 18 (3.2%) |
| 15 to 19 Years | 20 (3.4%) | 34 (6.0%) |
| 20 to 24 Years | 58 (9.9%) | 11 (1.9%) |
| 25 to 29 Years | 27 (4.6%) | 55 (9.8%) |
| 30 to 34 Years | 39 (6.7%) | 40 (7.1%) |
| 35 to 39 Years | 44 (7.5%) | 34 (6.0%) |
| 40 to 44 Years | 26 (4.4%) | 31 (5.5%) |
| 45 to 49 Years | 40 (6.8%) | 88 (15.6%) |
| 50 to 54 Years | 31 (5.3%) | 27 (4.8%) |
| 55 to 59 Years | 26 (4.4%) | 31 (5.5%) |
| 60 to 64 Years | 41 (7.0%) | 46 (8.2%) |
| 65 to 69 Years | 25 (4.3%) | 27 (4.8%) |
| 70 to 74 Years | 17 (2.9%) | 14 (2.5%) |
| 75 to 79 Years | 27 (4.6%) | 15 (2.7%) |
| 80 to 84 Years | 3 (0.5%) | 21 (3.7%) |
| 85 Years and over | 3 (0.5%) | 10 (1.8%) |
| Total | 586 (100.0%) | 564 (100.0%) |
Families and Households in Cottonwood
Median Family Size in Cottonwood
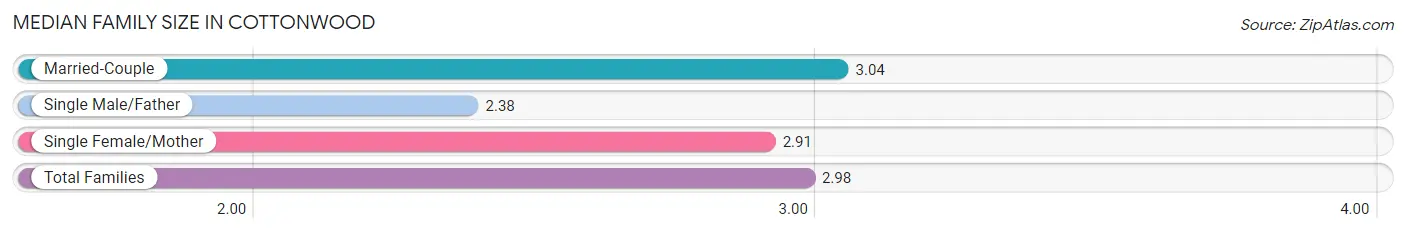
The median family size in Cottonwood is 2.98 persons per family, with married-couple families (237 | 81.4%) accounting for the largest median family size of 3.04 persons per family. On the other hand, single male/father families (21 | 7.2%) represent the smallest median family size with 2.38 persons per family.
| Family Type | # Families | Family Size |
| Married-Couple | 237 (81.4%) | 3.04 |
| Single Male/Father | 21 (7.2%) | 2.38 |
| Single Female/Mother | 33 (11.3%) | 2.91 |
| Total Families | 291 (100.0%) | 2.98 |
Median Household Size in Cottonwood
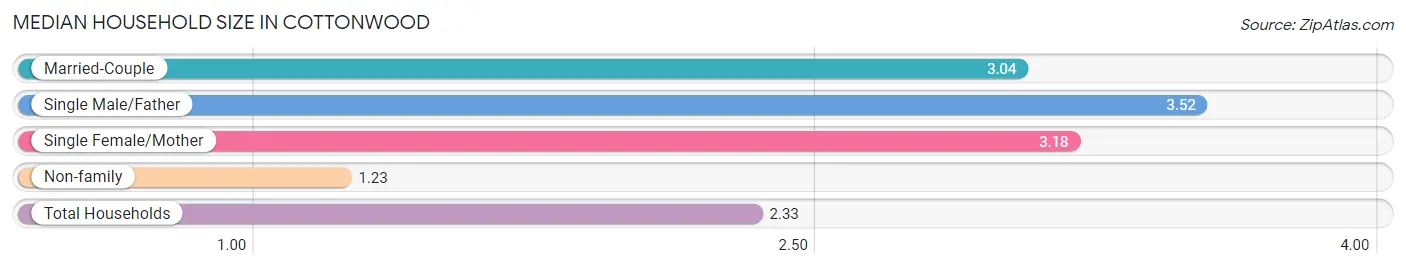
The median household size in Cottonwood is 2.33 persons per household, with single male/father households (21 | 4.3%) accounting for the largest median household size of 3.52 persons per household. non-family households (201 | 40.8%) represent the smallest median household size with 1.23 persons per household.
| Household Type | # Households | Household Size |
| Married-Couple | 237 (48.2%) | 3.04 |
| Single Male/Father | 21 (4.3%) | 3.52 |
| Single Female/Mother | 33 (6.7%) | 3.18 |
| Non-family | 201 (40.8%) | 1.23 |
| Total Households | 492 (100.0%) | 2.33 |
Household Size by Marriage Status in Cottonwood
Out of a total of 492 households in Cottonwood, 291 (59.2%) are family households, while 201 (40.8%) are nonfamily households. The most numerous type of family households are 2-person households, comprising 145, and the most common type of nonfamily households are 1-person households, comprising 161.
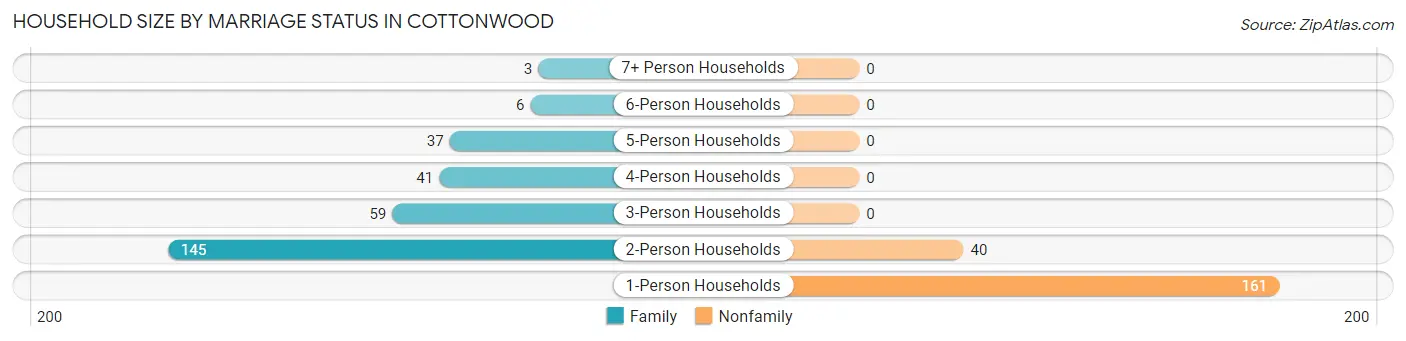
| Household Size | Family Households | Nonfamily Households |
| 1-Person Households | - | 161 (32.7%) |
| 2-Person Households | 145 (29.5%) | 40 (8.1%) |
| 3-Person Households | 59 (12.0%) | 0 (0.0%) |
| 4-Person Households | 41 (8.3%) | 0 (0.0%) |
| 5-Person Households | 37 (7.5%) | 0 (0.0%) |
| 6-Person Households | 6 (1.2%) | 0 (0.0%) |
| 7+ Person Households | 3 (0.6%) | 0 (0.0%) |
| Total | 291 (59.2%) | 201 (40.8%) |
Female Fertility in Cottonwood
Fertility by Age in Cottonwood
Average fertility rate in Cottonwood is 94.0 births per 1,000 women. Women in the age bracket of 20 to 34 years have the highest fertility rate with 236.0 births per 1,000 women. Women in the age bracket of 20 to 34 years acount for 89.3% of all women with births.
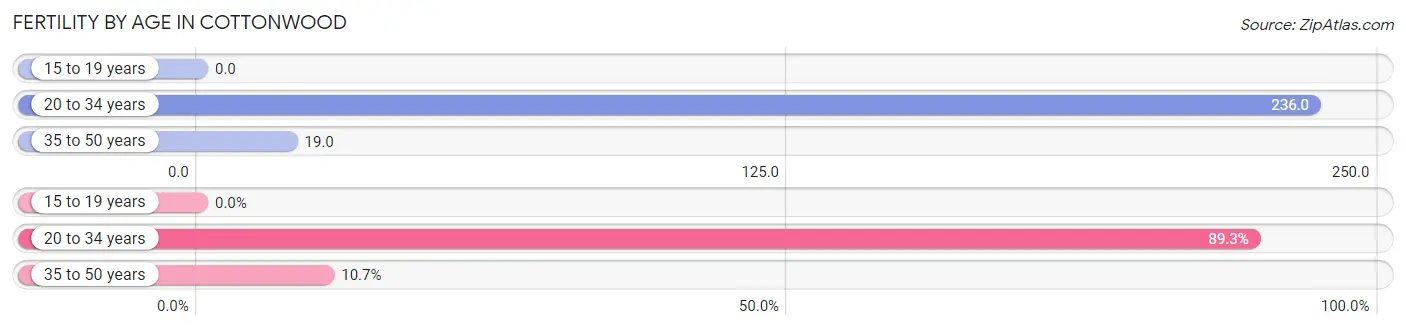
| Age Bracket | Women with Births | Births / 1,000 Women |
| 15 to 19 years | 0 (0.0%) | 0.0 |
| 20 to 34 years | 25 (89.3%) | 236.0 |
| 35 to 50 years | 3 (10.7%) | 19.0 |
| Total | 28 (100.0%) | 94.0 |
Fertility by Age by Marriage Status in Cottonwood
53.6% of women with births (28) in Cottonwood are married. The highest percentage of unmarried women with births falls into 20 to 34 years age bracket with 52.0% of them unmarried at the time of birth, while the lowest percentage of unmarried women with births belong to 35 to 50 years age bracket with 0.0% of them unmarried.
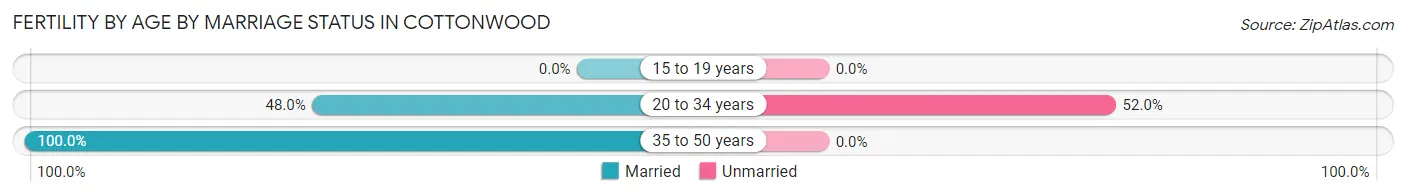
| Age Bracket | Married | Unmarried |
| 15 to 19 years | 0 (0.0%) | 0 (0.0%) |
| 20 to 34 years | 12 (48.0%) | 13 (52.0%) |
| 35 to 50 years | 3 (100.0%) | 0 (0.0%) |
| Total | 15 (53.6%) | 13 (46.4%) |
Fertility by Education in Cottonwood
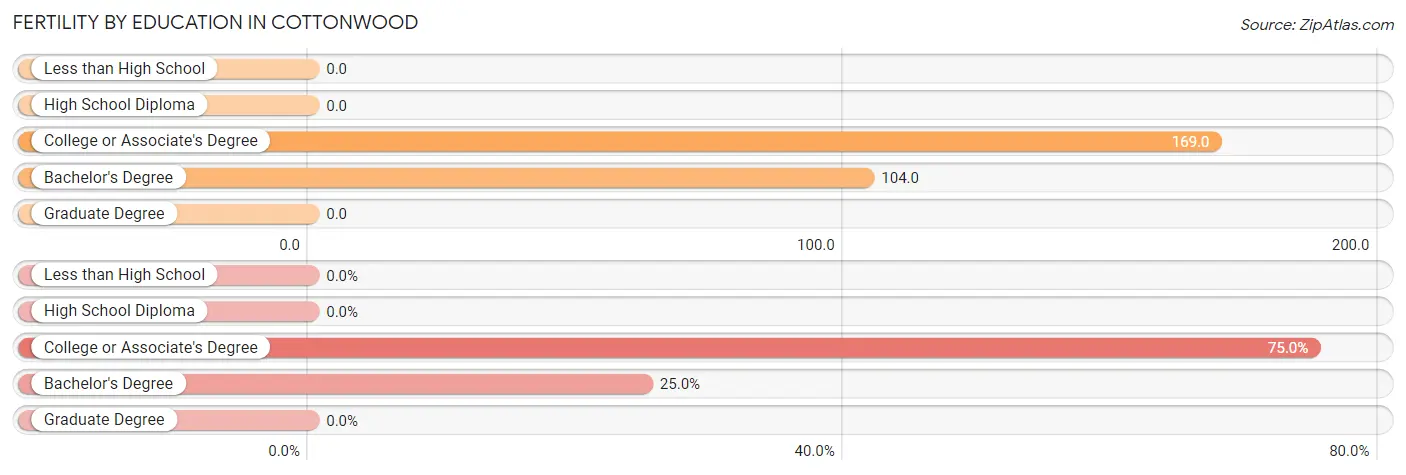
| Educational Attainment | Women with Births | Births / 1,000 Women |
| Less than High School | 0 (0.0%) | 0.0 |
| High School Diploma | 0 (0.0%) | 0.0 |
| College or Associate's Degree | 21 (75.0%) | 169.0 |
| Bachelor's Degree | 7 (25.0%) | 104.0 |
| Graduate Degree | 0 (0.0%) | 0.0 |
| Total | 28 (100.0%) | 94.0 |
Fertility by Education by Marriage Status in Cottonwood
46.4% of women with births in Cottonwood are unmarried. Women with the educational attainment of bachelor's degree are most likely to be married with 100.0% of them married at childbirth, while women with the educational attainment of college or associate's degree are least likely to be married with 61.9% of them unmarried at childbirth.
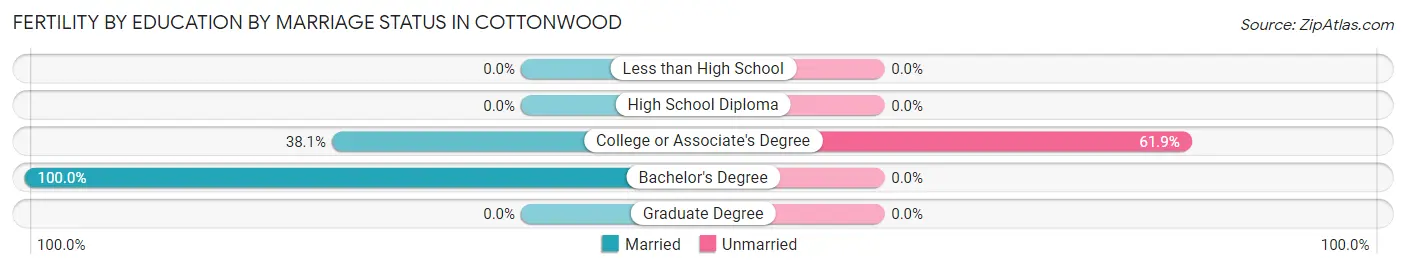
| Educational Attainment | Married | Unmarried |
| Less than High School | 0 (0.0%) | 0 (0.0%) |
| High School Diploma | 0 (0.0%) | 0 (0.0%) |
| College or Associate's Degree | 8 (38.1%) | 13 (61.9%) |
| Bachelor's Degree | 7 (100.0%) | 0 (0.0%) |
| Graduate Degree | 0 (0.0%) | 0 (0.0%) |
| Total | 15 (53.6%) | 13 (46.4%) |
Employment Characteristics in Cottonwood
Employment by Class of Employer in Cottonwood
Among the 605 employed individuals in Cottonwood, private company employees (444 | 73.4%), self-employed (not incorporated) (52 | 8.6%), and not-for-profit organizations (31 | 5.1%) make up the most common classes of employment.
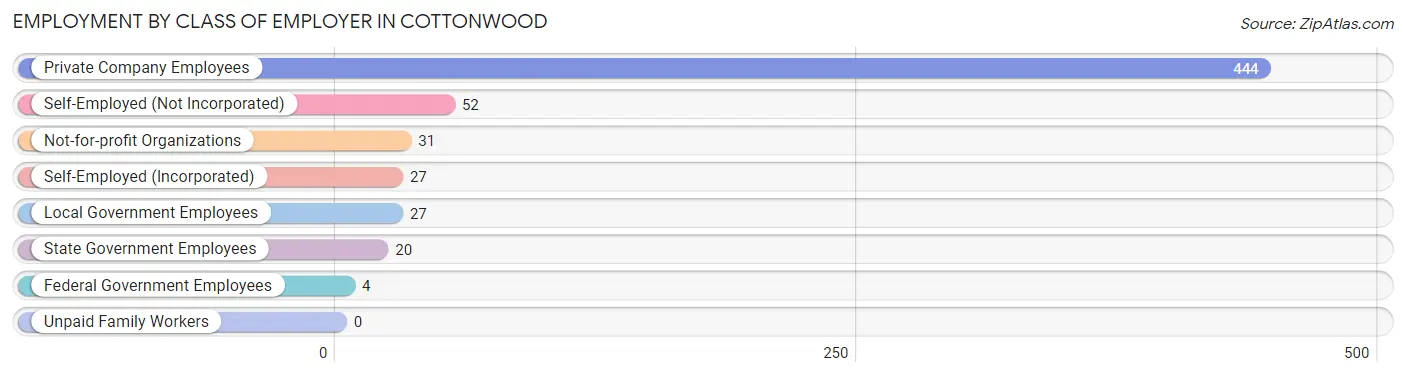
| Employer Class | # Employees | % Employees |
| Private Company Employees | 444 | 73.4% |
| Self-Employed (Incorporated) | 27 | 4.5% |
| Self-Employed (Not Incorporated) | 52 | 8.6% |
| Not-for-profit Organizations | 31 | 5.1% |
| Local Government Employees | 27 | 4.5% |
| State Government Employees | 20 | 3.3% |
| Federal Government Employees | 4 | 0.7% |
| Unpaid Family Workers | 0 | 0.0% |
| Total | 605 | 100.0% |
Employment Status by Age in Cottonwood
According to the labor force statistics for Cottonwood, out of the total population over 16 years of age (887), 70.9% or 629 individuals are in the labor force, with 3.3% or 21 of them unemployed. The age group with the highest labor force participation rate is 25 to 29 years, with 100.0% or 82 individuals in the labor force. Within the labor force, the 16 to 19 years age range has the highest percentage of unemployed individuals, with 100.0% or 2 of them being unemployed.
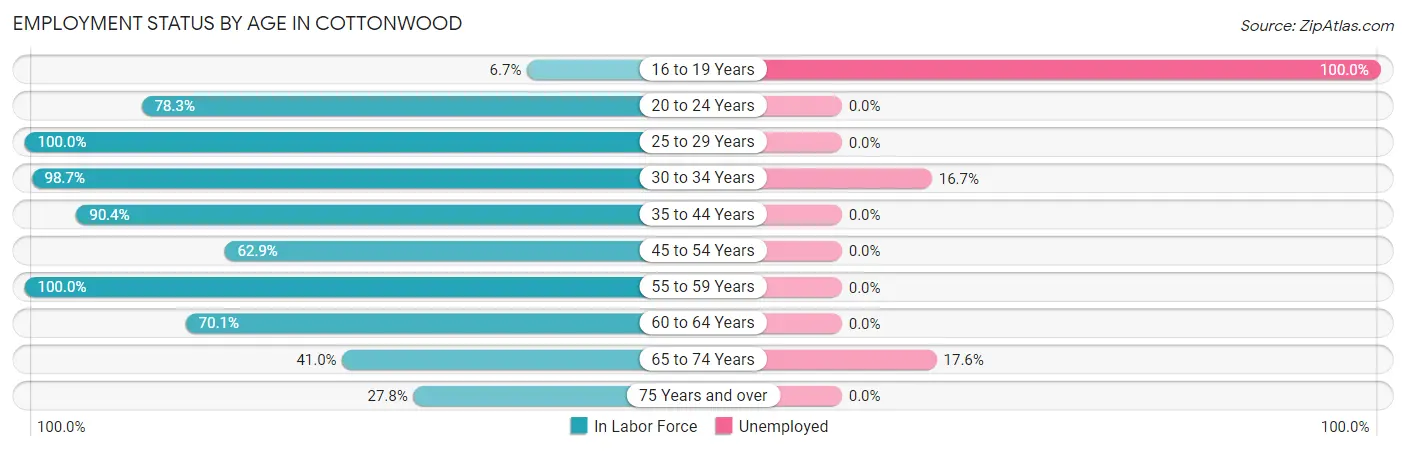
| Age Bracket | In Labor Force | Unemployed |
| 16 to 19 Years | 2 (6.7%) | 2 (100.0%) |
| 20 to 24 Years | 54 (78.3%) | 0 (0.0%) |
| 25 to 29 Years | 82 (100.0%) | 0 (0.0%) |
| 30 to 34 Years | 78 (98.7%) | 13 (16.7%) |
| 35 to 44 Years | 122 (90.4%) | 0 (0.0%) |
| 45 to 54 Years | 117 (62.9%) | 0 (0.0%) |
| 55 to 59 Years | 57 (100.0%) | 0 (0.0%) |
| 60 to 64 Years | 61 (70.1%) | 0 (0.0%) |
| 65 to 74 Years | 34 (41.0%) | 6 (17.6%) |
| 75 Years and over | 22 (27.8%) | 0 (0.0%) |
| Total | 629 (70.9%) | 21 (3.3%) |
Employment Status by Educational Attainment in Cottonwood
According to labor force statistics for Cottonwood, 82.6% of individuals (517) out of the total population between 25 and 64 years of age (626) are in the labor force, with 2.5% or 13 of them being unemployed. The group with the highest labor force participation rate are those with the educational attainment of college / associate degree, with 94.6% or 281 individuals in the labor force. Within the labor force, individuals with bachelor's degree or higher education have the highest percentage of unemployment, with 3.4% or 5 of them being unemployed.
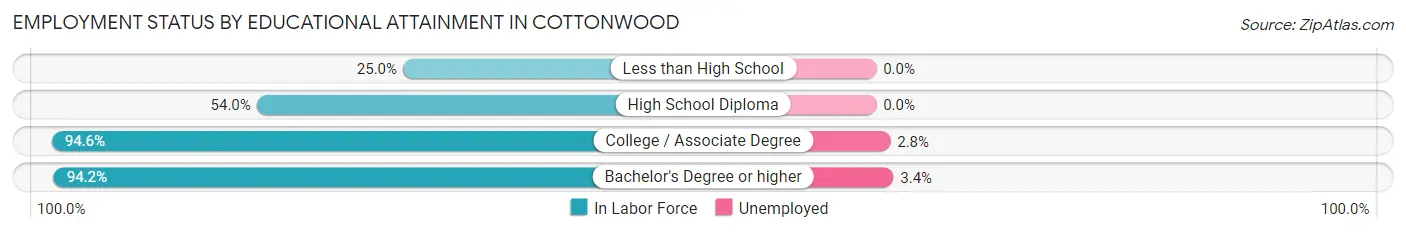
| Educational Attainment | In Labor Force | Unemployed |
| Less than High School | 3 (25.0%) | 0 (0.0%) |
| High School Diploma | 88 (54.0%) | 0 (0.0%) |
| College / Associate Degree | 281 (94.6%) | 8 (2.8%) |
| Bachelor's Degree or higher | 145 (94.2%) | 5 (3.4%) |
| Total | 517 (82.6%) | 16 (2.5%) |
Employment Occupations by Sex in Cottonwood
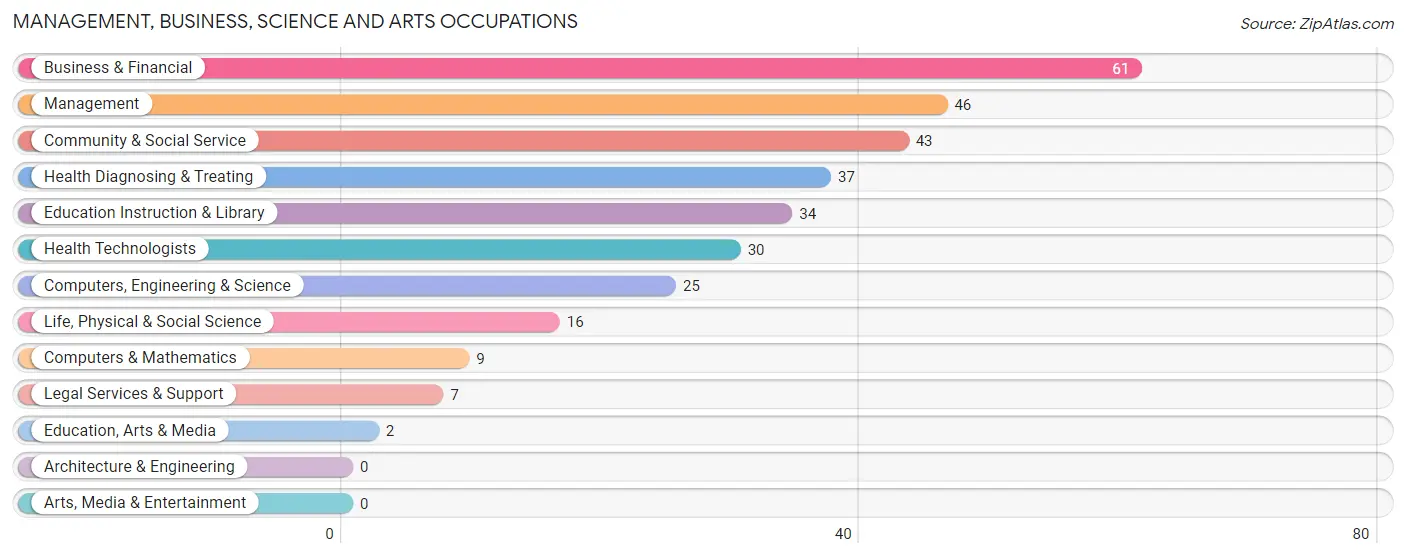
Management, Business, Science and Arts Occupations
The most common Management, Business, Science and Arts occupations in Cottonwood are Business & Financial (61 | 10.0%), Management (46 | 7.6%), Community & Social Service (43 | 7.1%), Health Diagnosing & Treating (37 | 6.1%), and Education Instruction & Library (34 | 5.6%).
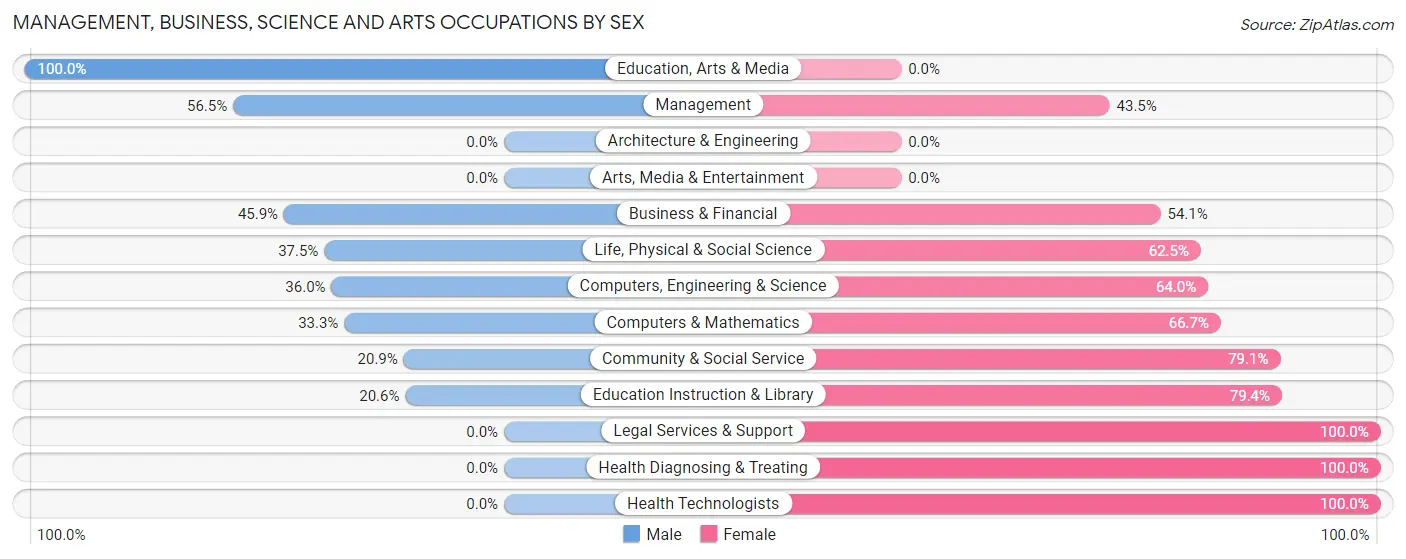
Management, Business, Science and Arts Occupations by Sex
Within the Management, Business, Science and Arts occupations in Cottonwood, the most male-oriented occupations are Education, Arts & Media (100.0%), Management (56.5%), and Business & Financial (45.9%), while the most female-oriented occupations are Legal Services & Support (100.0%), Health Diagnosing & Treating (100.0%), and Health Technologists (100.0%).
| Occupation | Male | Female |
| Management | 26 (56.5%) | 20 (43.5%) |
| Business & Financial | 28 (45.9%) | 33 (54.1%) |
| Computers, Engineering & Science | 9 (36.0%) | 16 (64.0%) |
| Computers & Mathematics | 3 (33.3%) | 6 (66.7%) |
| Architecture & Engineering | 0 (0.0%) | 0 (0.0%) |
| Life, Physical & Social Science | 6 (37.5%) | 10 (62.5%) |
| Community & Social Service | 9 (20.9%) | 34 (79.1%) |
| Education, Arts & Media | 2 (100.0%) | 0 (0.0%) |
| Legal Services & Support | 0 (0.0%) | 7 (100.0%) |
| Education Instruction & Library | 7 (20.6%) | 27 (79.4%) |
| Arts, Media & Entertainment | 0 (0.0%) | 0 (0.0%) |
| Health Diagnosing & Treating | 0 (0.0%) | 37 (100.0%) |
| Health Technologists | 0 (0.0%) | 30 (100.0%) |
| Total (Category) | 72 (34.0%) | 140 (66.0%) |
| Total (Overall) | 326 (53.6%) | 282 (46.4%) |
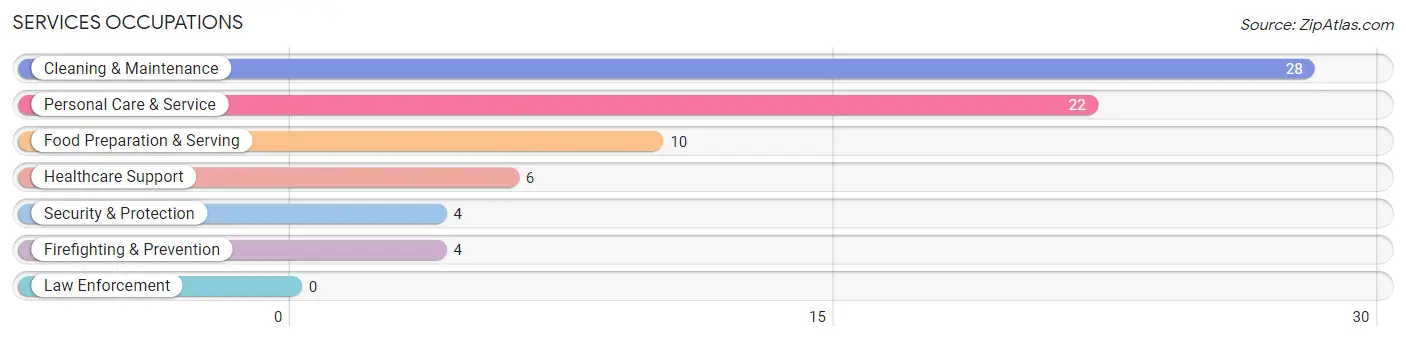
Services Occupations
The most common Services occupations in Cottonwood are Cleaning & Maintenance (28 | 4.6%), Personal Care & Service (22 | 3.6%), Food Preparation & Serving (10 | 1.6%), Healthcare Support (6 | 1.0%), and Security & Protection (4 | 0.7%).
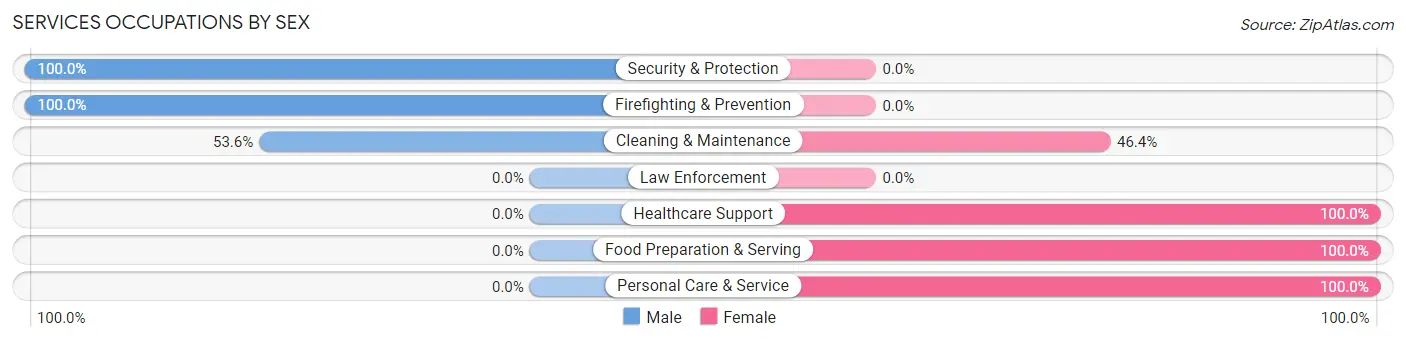
Services Occupations by Sex
Within the Services occupations in Cottonwood, the most male-oriented occupations are Security & Protection (100.0%), Firefighting & Prevention (100.0%), and Cleaning & Maintenance (53.6%), while the most female-oriented occupations are Healthcare Support (100.0%), Food Preparation & Serving (100.0%), and Personal Care & Service (100.0%).
| Occupation | Male | Female |
| Healthcare Support | 0 (0.0%) | 6 (100.0%) |
| Security & Protection | 4 (100.0%) | 0 (0.0%) |
| Firefighting & Prevention | 4 (100.0%) | 0 (0.0%) |
| Law Enforcement | 0 (0.0%) | 0 (0.0%) |
| Food Preparation & Serving | 0 (0.0%) | 10 (100.0%) |
| Cleaning & Maintenance | 15 (53.6%) | 13 (46.4%) |
| Personal Care & Service | 0 (0.0%) | 22 (100.0%) |
| Total (Category) | 19 (27.1%) | 51 (72.9%) |
| Total (Overall) | 326 (53.6%) | 282 (46.4%) |
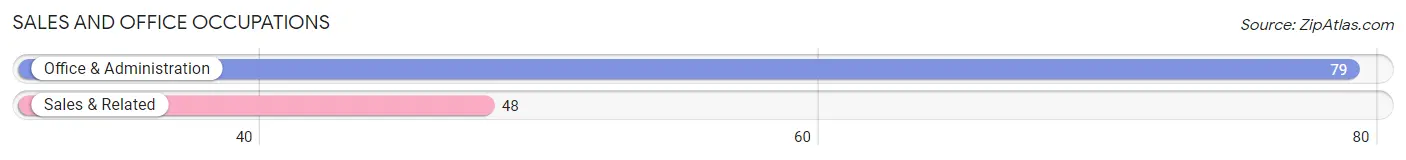
Sales and Office Occupations
The most common Sales and Office occupations in Cottonwood are Office & Administration (79 | 13.0%), and Sales & Related (48 | 7.9%).
Sales and Office Occupations by Sex
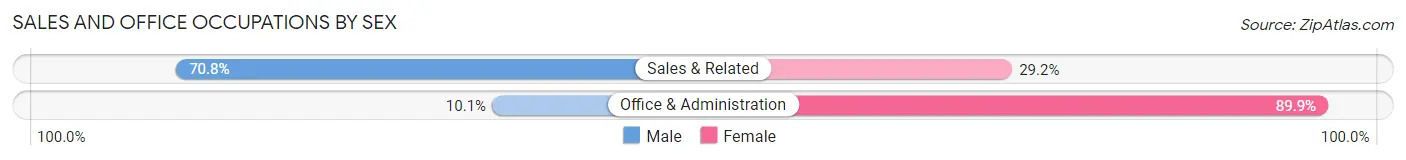
| Occupation | Male | Female |
| Sales & Related | 34 (70.8%) | 14 (29.2%) |
| Office & Administration | 8 (10.1%) | 71 (89.9%) |
| Total (Category) | 42 (33.1%) | 85 (66.9%) |
| Total (Overall) | 326 (53.6%) | 282 (46.4%) |
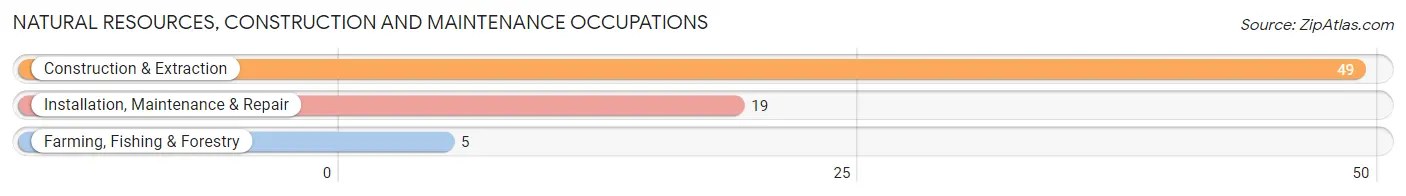
Natural Resources, Construction and Maintenance Occupations
The most common Natural Resources, Construction and Maintenance occupations in Cottonwood are Construction & Extraction (49 | 8.1%), Installation, Maintenance & Repair (19 | 3.1%), and Farming, Fishing & Forestry (5 | 0.8%).
Natural Resources, Construction and Maintenance Occupations by Sex
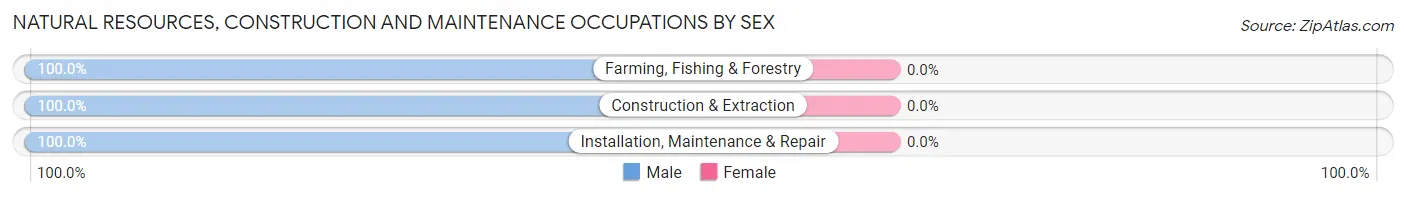
| Occupation | Male | Female |
| Farming, Fishing & Forestry | 5 (100.0%) | 0 (0.0%) |
| Construction & Extraction | 49 (100.0%) | 0 (0.0%) |
| Installation, Maintenance & Repair | 19 (100.0%) | 0 (0.0%) |
| Total (Category) | 73 (100.0%) | 0 (0.0%) |
| Total (Overall) | 326 (53.6%) | 282 (46.4%) |
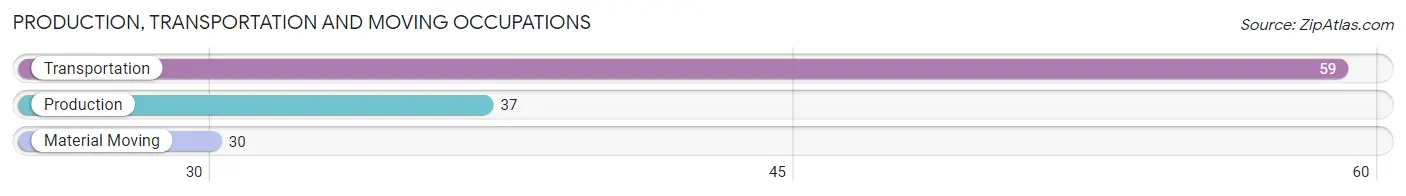
Production, Transportation and Moving Occupations
The most common Production, Transportation and Moving occupations in Cottonwood are Transportation (59 | 9.7%), Production (37 | 6.1%), and Material Moving (30 | 4.9%).
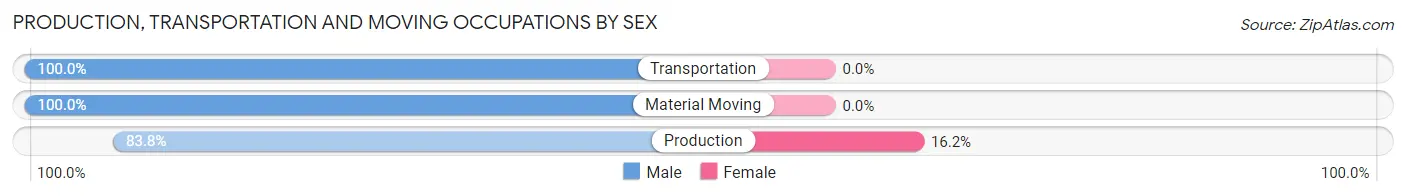
Production, Transportation and Moving Occupations by Sex
| Occupation | Male | Female |
| Production | 31 (83.8%) | 6 (16.2%) |
| Transportation | 59 (100.0%) | 0 (0.0%) |
| Material Moving | 30 (100.0%) | 0 (0.0%) |
| Total (Category) | 120 (95.2%) | 6 (4.8%) |
| Total (Overall) | 326 (53.6%) | 282 (46.4%) |
Employment Industries by Sex in Cottonwood
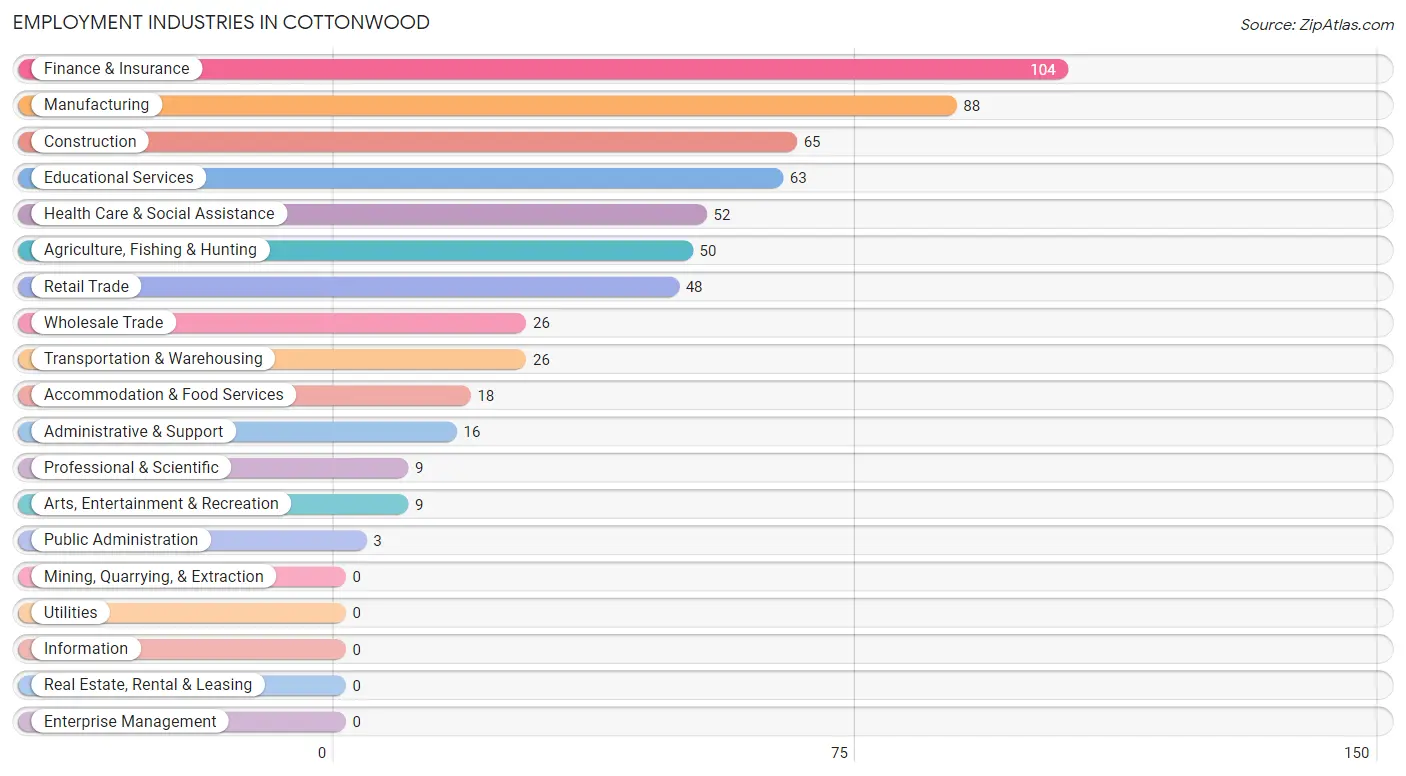
Employment Industries in Cottonwood
The major employment industries in Cottonwood include Finance & Insurance (104 | 17.1%), Manufacturing (88 | 14.5%), Construction (65 | 10.7%), Educational Services (63 | 10.4%), and Health Care & Social Assistance (52 | 8.6%).
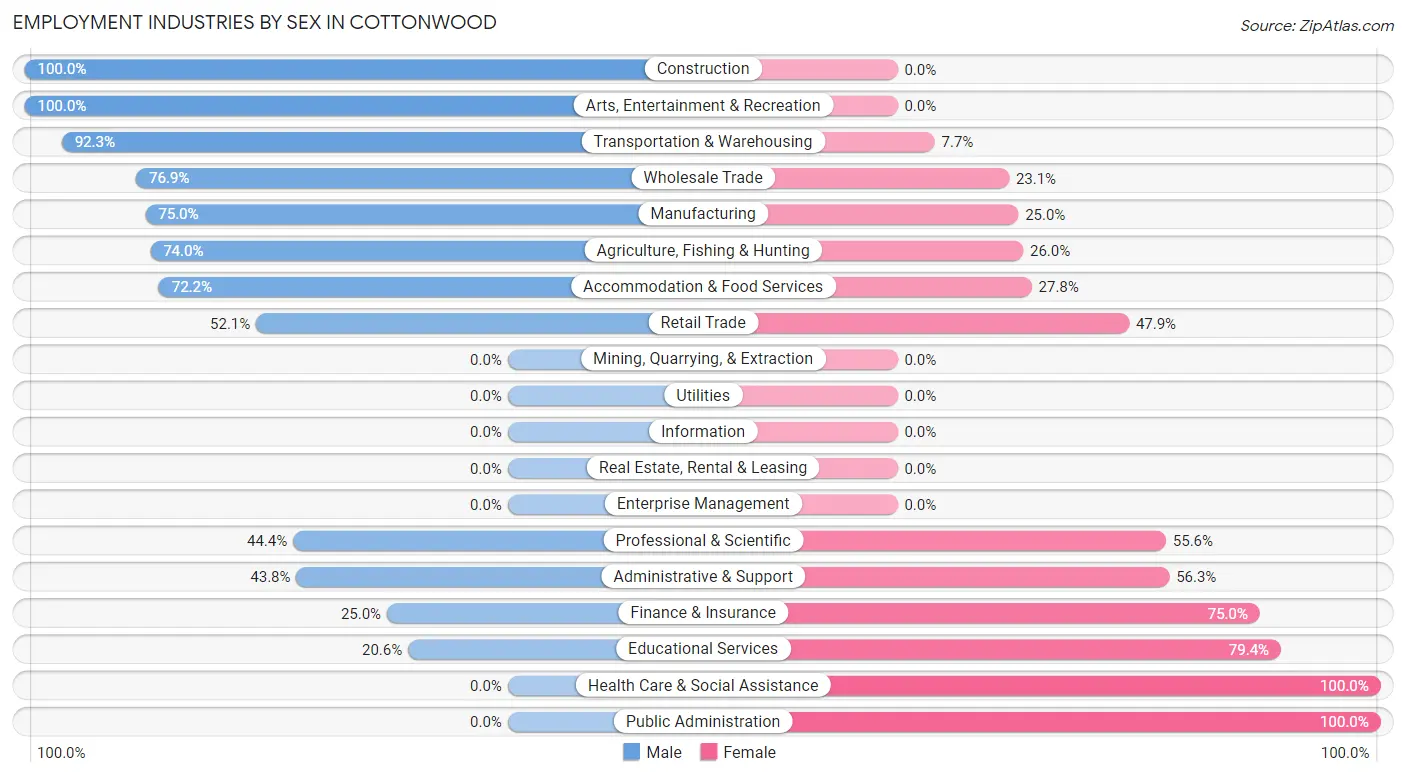
Employment Industries by Sex in Cottonwood
The Cottonwood industries that see more men than women are Construction (100.0%), Arts, Entertainment & Recreation (100.0%), and Transportation & Warehousing (92.3%), whereas the industries that tend to have a higher number of women are Health Care & Social Assistance (100.0%), Public Administration (100.0%), and Educational Services (79.4%).
| Industry | Male | Female |
| Agriculture, Fishing & Hunting | 37 (74.0%) | 13 (26.0%) |
| Mining, Quarrying, & Extraction | 0 (0.0%) | 0 (0.0%) |
| Construction | 65 (100.0%) | 0 (0.0%) |
| Manufacturing | 66 (75.0%) | 22 (25.0%) |
| Wholesale Trade | 20 (76.9%) | 6 (23.1%) |
| Retail Trade | 25 (52.1%) | 23 (47.9%) |
| Transportation & Warehousing | 24 (92.3%) | 2 (7.7%) |
| Utilities | 0 (0.0%) | 0 (0.0%) |
| Information | 0 (0.0%) | 0 (0.0%) |
| Finance & Insurance | 26 (25.0%) | 78 (75.0%) |
| Real Estate, Rental & Leasing | 0 (0.0%) | 0 (0.0%) |
| Professional & Scientific | 4 (44.4%) | 5 (55.6%) |
| Enterprise Management | 0 (0.0%) | 0 (0.0%) |
| Administrative & Support | 7 (43.8%) | 9 (56.2%) |
| Educational Services | 13 (20.6%) | 50 (79.4%) |
| Health Care & Social Assistance | 0 (0.0%) | 52 (100.0%) |
| Arts, Entertainment & Recreation | 9 (100.0%) | 0 (0.0%) |
| Accommodation & Food Services | 13 (72.2%) | 5 (27.8%) |
| Public Administration | 0 (0.0%) | 3 (100.0%) |
| Total | 326 (53.6%) | 282 (46.4%) |
Education in Cottonwood
School Enrollment in Cottonwood
The most common levels of schooling among the 258 students in Cottonwood are elementary school (60 | 23.3%), high school (57 | 22.1%), and nursery / preschool (50 | 19.4%).
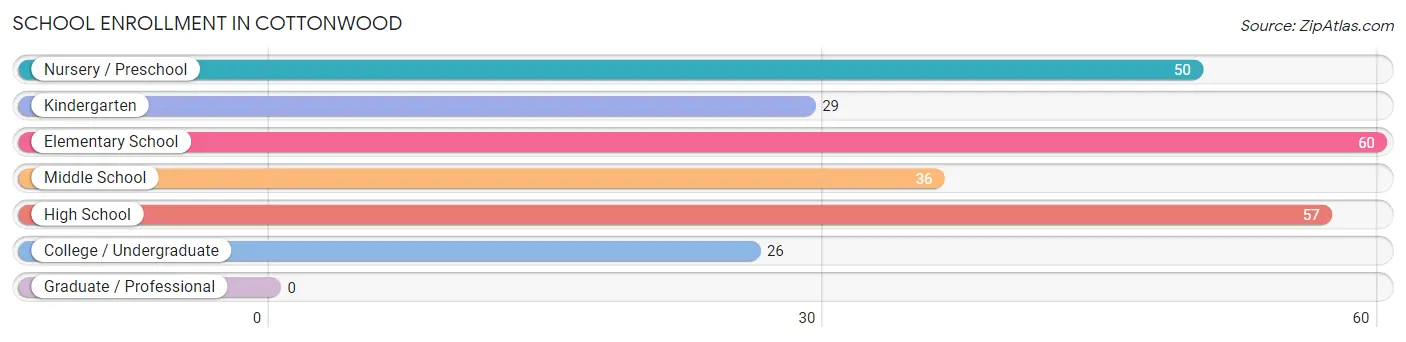
| School Level | # Students | % Students |
| Nursery / Preschool | 50 | 19.4% |
| Kindergarten | 29 | 11.2% |
| Elementary School | 60 | 23.3% |
| Middle School | 36 | 14.0% |
| High School | 57 | 22.1% |
| College / Undergraduate | 26 | 10.1% |
| Graduate / Professional | 0 | 0.0% |
| Total | 258 | 100.0% |
School Enrollment by Age by Funding Source in Cottonwood
Out of a total of 258 students who are enrolled in schools in Cottonwood, 13 (5.0%) attend a private institution, while the remaining 245 (95.0%) are enrolled in public schools. The age group of 5 to 9 year old has the highest likelihood of being enrolled in private schools, with 13 (14.4% in the age bracket) enrolled. Conversely, the age group of 3 to 4 year olds has the lowest likelihood of being enrolled in a private school, with 29 (100.0% in the age bracket) attending a public institution.
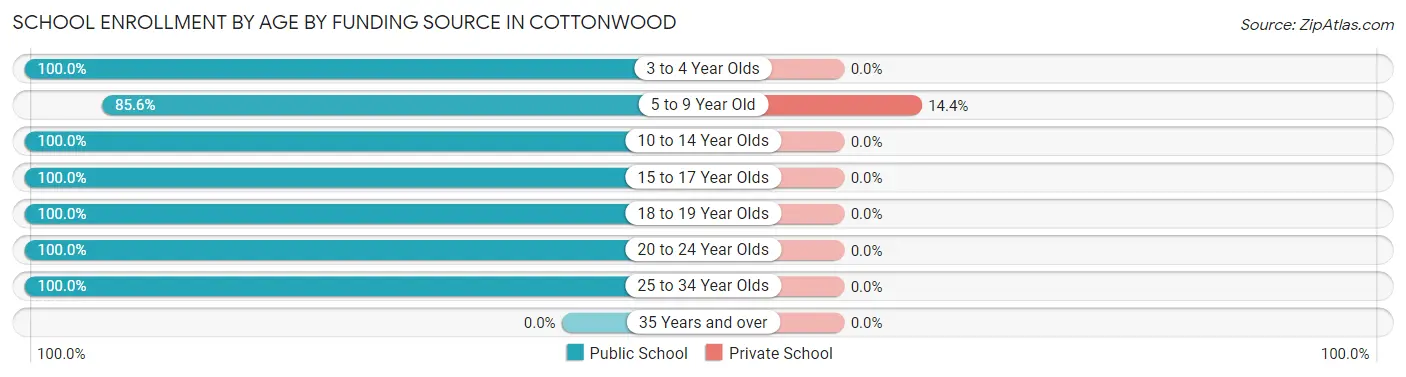
| Age Bracket | Public School | Private School |
| 3 to 4 Year Olds | 29 (100.0%) | 0 (0.0%) |
| 5 to 9 Year Old | 77 (85.6%) | 13 (14.4%) |
| 10 to 14 Year Olds | 59 (100.0%) | 0 (0.0%) |
| 15 to 17 Year Olds | 44 (100.0%) | 0 (0.0%) |
| 18 to 19 Year Olds | 10 (100.0%) | 0 (0.0%) |
| 20 to 24 Year Olds | 20 (100.0%) | 0 (0.0%) |
| 25 to 34 Year Olds | 6 (100.0%) | 0 (0.0%) |
| 35 Years and over | 0 (0.0%) | 0 (0.0%) |
| Total | 245 (95.0%) | 13 (5.0%) |
Educational Attainment by Field of Study in Cottonwood
Business (54 | 24.1%), education (47 | 21.0%), bio, nature & agricultural (29 | 13.0%), arts & humanities (24 | 10.7%), and science & technology (23 | 10.3%) are the most common fields of study among 224 individuals in Cottonwood who have obtained a bachelor's degree or higher.
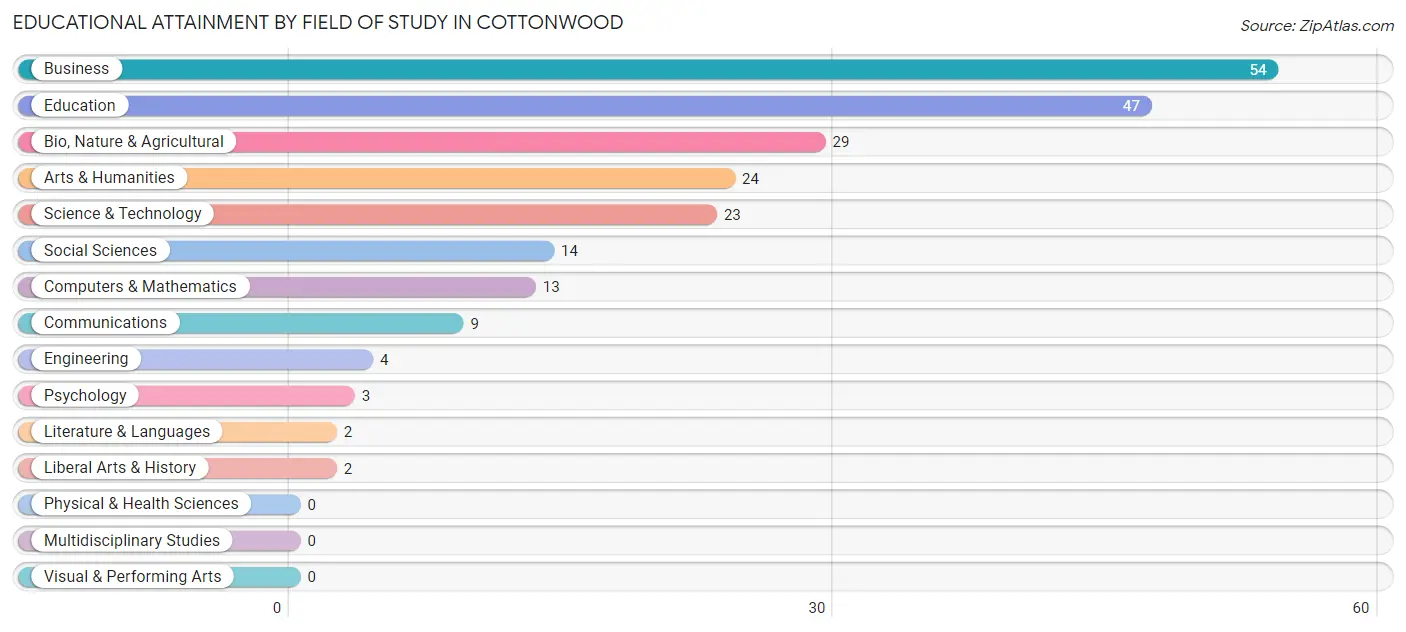
| Field of Study | # Graduates | % Graduates |
| Computers & Mathematics | 13 | 5.8% |
| Bio, Nature & Agricultural | 29 | 13.0% |
| Physical & Health Sciences | 0 | 0.0% |
| Psychology | 3 | 1.3% |
| Social Sciences | 14 | 6.2% |
| Engineering | 4 | 1.8% |
| Multidisciplinary Studies | 0 | 0.0% |
| Science & Technology | 23 | 10.3% |
| Business | 54 | 24.1% |
| Education | 47 | 21.0% |
| Literature & Languages | 2 | 0.9% |
| Liberal Arts & History | 2 | 0.9% |
| Visual & Performing Arts | 0 | 0.0% |
| Communications | 9 | 4.0% |
| Arts & Humanities | 24 | 10.7% |
| Total | 224 | 100.0% |
Transportation & Commute in Cottonwood
Vehicle Availability by Sex in Cottonwood
The most prevalent vehicle ownership categories in Cottonwood are males with 2 vehicles (216, accounting for 66.3%) and females with 2 vehicles (154, making up 77.4%).
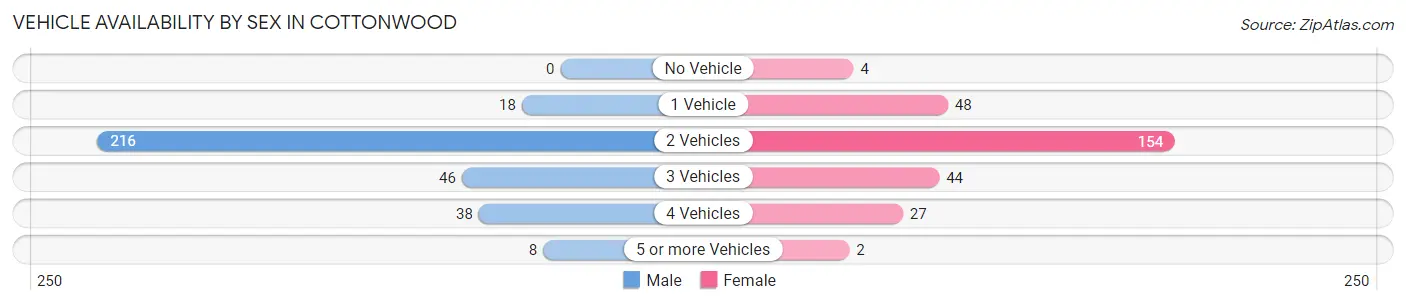
| Vehicles Available | Male | Female |
| No Vehicle | 0 (0.0%) | 4 (1.4%) |
| 1 Vehicle | 18 (5.5%) | 48 (17.2%) |
| 2 Vehicles | 216 (66.3%) | 154 (55.2%) |
| 3 Vehicles | 46 (14.1%) | 44 (15.8%) |
| 4 Vehicles | 38 (11.7%) | 27 (9.7%) |
| 5 or more Vehicles | 8 (2.5%) | 2 (0.7%) |
| Total | 326 (100.0%) | 279 (100.0%) |
Commute Time in Cottonwood
The most frequently occuring commute durations in Cottonwood are 5 to 9 minutes (136 commuters, 23.6%), 20 to 24 minutes (117 commuters, 20.3%), and 15 to 19 minutes (107 commuters, 18.6%).
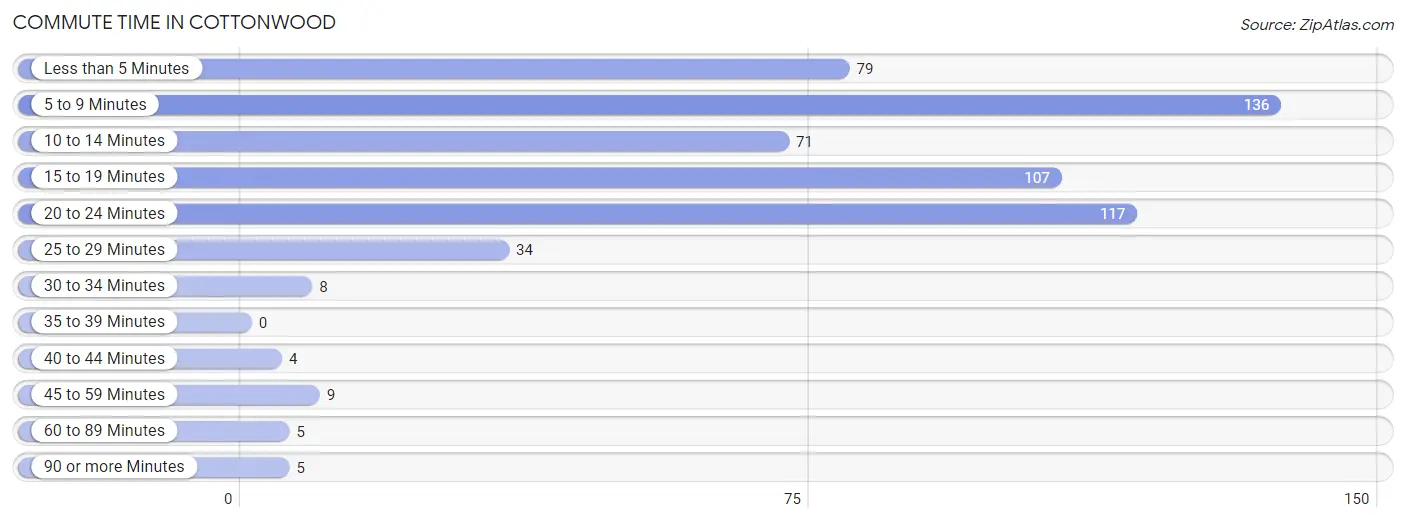
| Commute Time | # Commuters | % Commuters |
| Less than 5 Minutes | 79 | 13.7% |
| 5 to 9 Minutes | 136 | 23.6% |
| 10 to 14 Minutes | 71 | 12.3% |
| 15 to 19 Minutes | 107 | 18.6% |
| 20 to 24 Minutes | 117 | 20.3% |
| 25 to 29 Minutes | 34 | 5.9% |
| 30 to 34 Minutes | 8 | 1.4% |
| 35 to 39 Minutes | 0 | 0.0% |
| 40 to 44 Minutes | 4 | 0.7% |
| 45 to 59 Minutes | 9 | 1.6% |
| 60 to 89 Minutes | 5 | 0.9% |
| 90 or more Minutes | 5 | 0.9% |
Commute Time by Sex in Cottonwood
The most common commute times in Cottonwood are 10 to 14 minutes (64 commuters, 19.6%) for males and 5 to 9 minutes (79 commuters, 31.7%) for females.
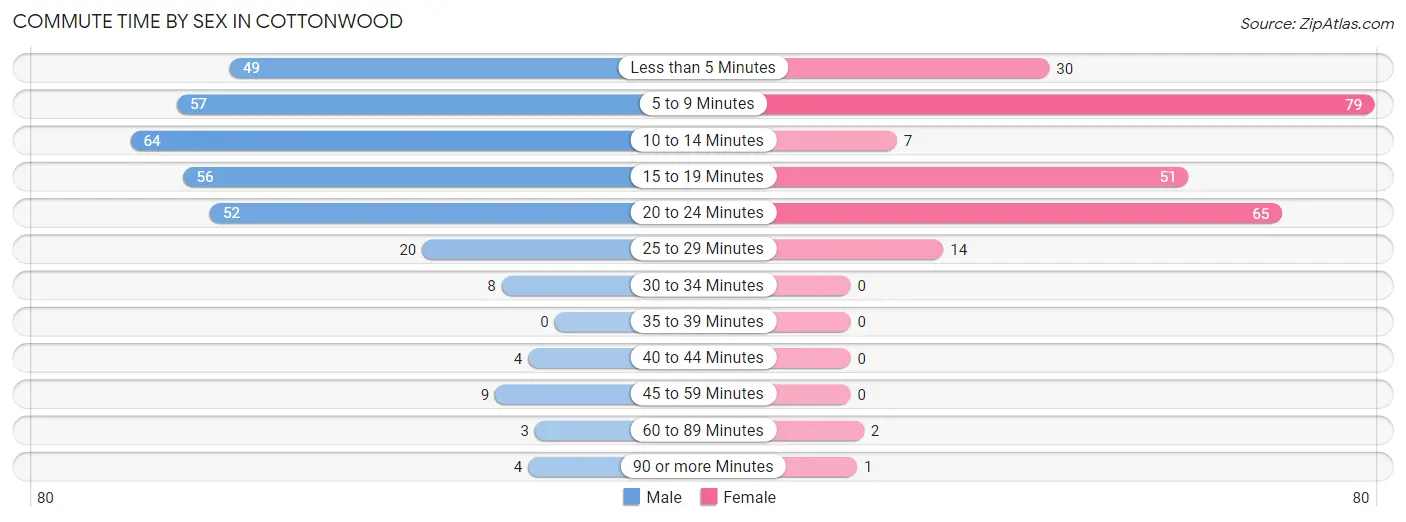
| Commute Time | Male | Female |
| Less than 5 Minutes | 49 (15.0%) | 30 (12.0%) |
| 5 to 9 Minutes | 57 (17.5%) | 79 (31.7%) |
| 10 to 14 Minutes | 64 (19.6%) | 7 (2.8%) |
| 15 to 19 Minutes | 56 (17.2%) | 51 (20.5%) |
| 20 to 24 Minutes | 52 (16.0%) | 65 (26.1%) |
| 25 to 29 Minutes | 20 (6.1%) | 14 (5.6%) |
| 30 to 34 Minutes | 8 (2.5%) | 0 (0.0%) |
| 35 to 39 Minutes | 0 (0.0%) | 0 (0.0%) |
| 40 to 44 Minutes | 4 (1.2%) | 0 (0.0%) |
| 45 to 59 Minutes | 9 (2.8%) | 0 (0.0%) |
| 60 to 89 Minutes | 3 (0.9%) | 2 (0.8%) |
| 90 or more Minutes | 4 (1.2%) | 1 (0.4%) |
Time of Departure to Work by Sex in Cottonwood
The most frequent times of departure to work in Cottonwood are 7:00 AM to 7:29 AM (166, 50.9%) for males and 7:00 AM to 7:29 AM (93, 37.3%) for females.
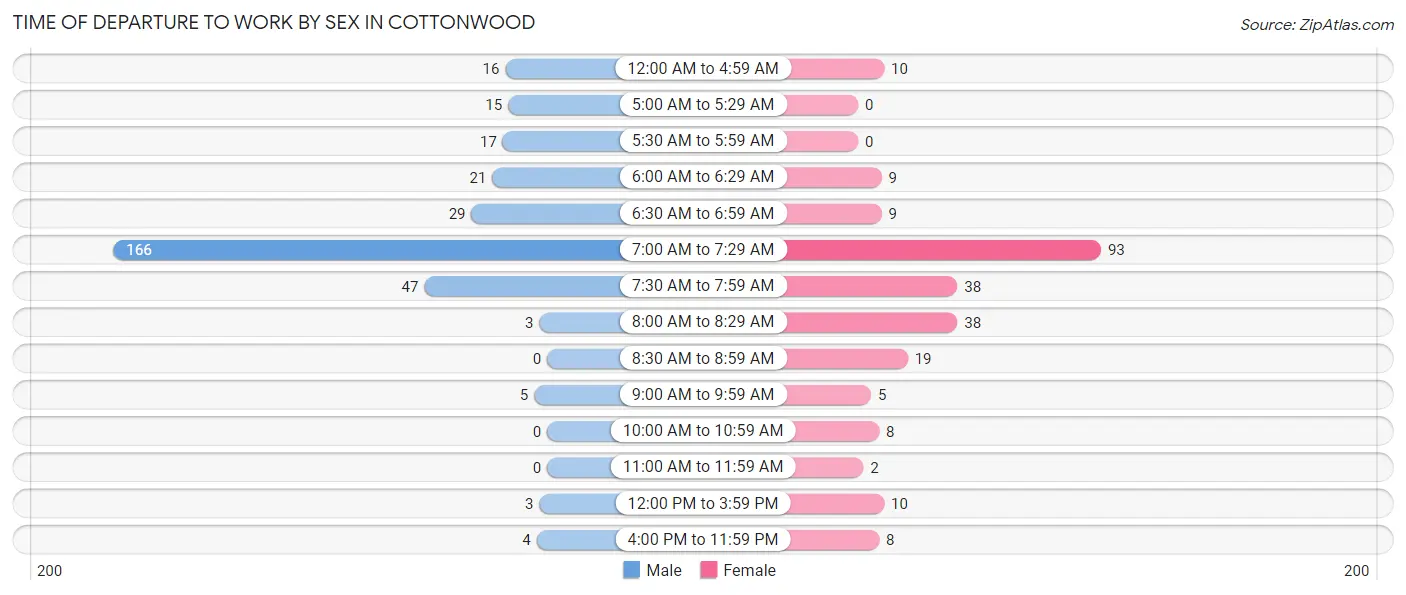
| Time of Departure | Male | Female |
| 12:00 AM to 4:59 AM | 16 (4.9%) | 10 (4.0%) |
| 5:00 AM to 5:29 AM | 15 (4.6%) | 0 (0.0%) |
| 5:30 AM to 5:59 AM | 17 (5.2%) | 0 (0.0%) |
| 6:00 AM to 6:29 AM | 21 (6.4%) | 9 (3.6%) |
| 6:30 AM to 6:59 AM | 29 (8.9%) | 9 (3.6%) |
| 7:00 AM to 7:29 AM | 166 (50.9%) | 93 (37.3%) |
| 7:30 AM to 7:59 AM | 47 (14.4%) | 38 (15.3%) |
| 8:00 AM to 8:29 AM | 3 (0.9%) | 38 (15.3%) |
| 8:30 AM to 8:59 AM | 0 (0.0%) | 19 (7.6%) |
| 9:00 AM to 9:59 AM | 5 (1.5%) | 5 (2.0%) |
| 10:00 AM to 10:59 AM | 0 (0.0%) | 8 (3.2%) |
| 11:00 AM to 11:59 AM | 0 (0.0%) | 2 (0.8%) |
| 12:00 PM to 3:59 PM | 3 (0.9%) | 10 (4.0%) |
| 4:00 PM to 11:59 PM | 4 (1.2%) | 8 (3.2%) |
| Total | 326 (100.0%) | 249 (100.0%) |
Housing Occupancy in Cottonwood
Occupancy by Ownership in Cottonwood
Of the total 492 dwellings in Cottonwood, owner-occupied units account for 362 (73.6%), while renter-occupied units make up 130 (26.4%).
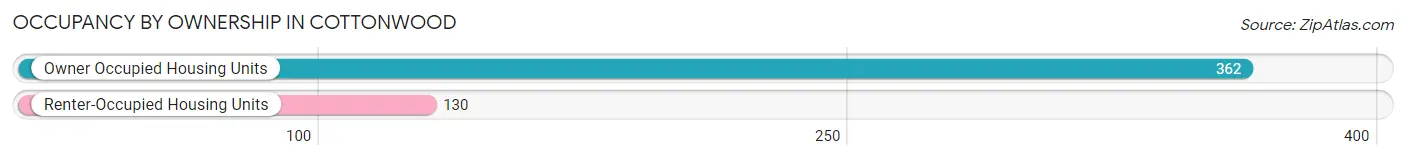
| Occupancy | # Housing Units | % Housing Units |
| Owner Occupied Housing Units | 362 | 73.6% |
| Renter-Occupied Housing Units | 130 | 26.4% |
| Total Occupied Housing Units | 492 | 100.0% |
Occupancy by Household Size in Cottonwood
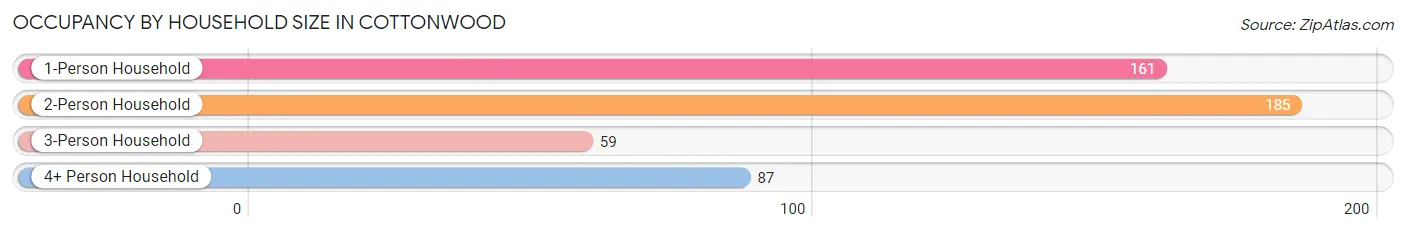
| Household Size | # Housing Units | % Housing Units |
| 1-Person Household | 161 | 32.7% |
| 2-Person Household | 185 | 37.6% |
| 3-Person Household | 59 | 12.0% |
| 4+ Person Household | 87 | 17.7% |
| Total Housing Units | 492 | 100.0% |
Occupancy by Ownership by Household Size in Cottonwood
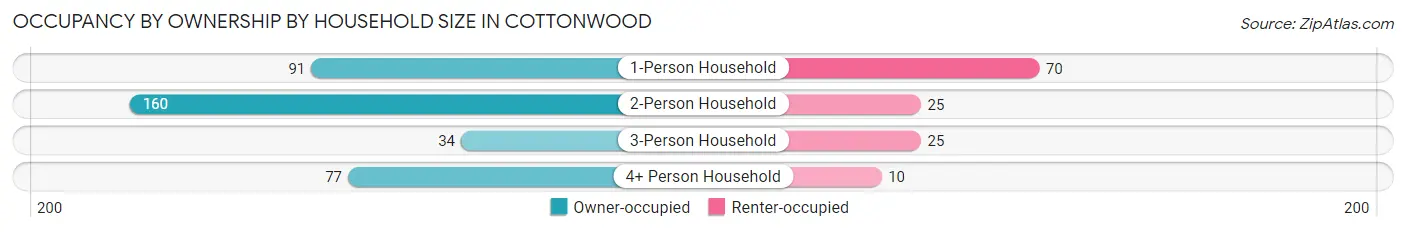
| Household Size | Owner-occupied | Renter-occupied |
| 1-Person Household | 91 (56.5%) | 70 (43.5%) |
| 2-Person Household | 160 (86.5%) | 25 (13.5%) |
| 3-Person Household | 34 (57.6%) | 25 (42.4%) |
| 4+ Person Household | 77 (88.5%) | 10 (11.5%) |
| Total Housing Units | 362 (73.6%) | 130 (26.4%) |
Occupancy by Educational Attainment in Cottonwood
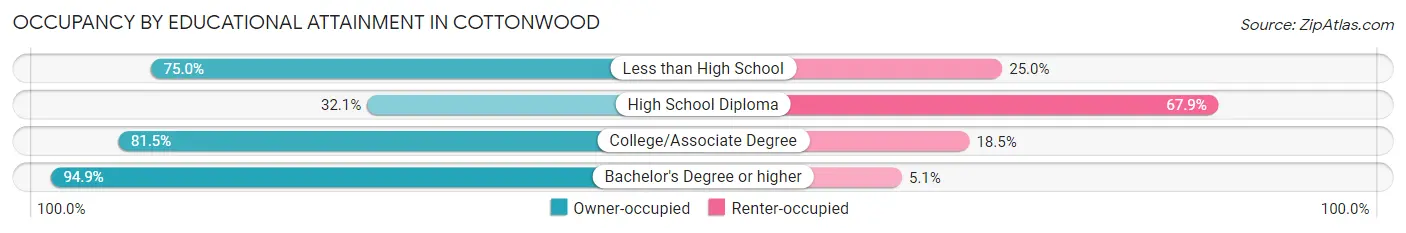
| Household Size | Owner-occupied | Renter-occupied |
| Less than High School | 9 (75.0%) | 3 (25.0%) |
| High School Diploma | 35 (32.1%) | 74 (67.9%) |
| College/Associate Degree | 207 (81.5%) | 47 (18.5%) |
| Bachelor's Degree or higher | 111 (94.9%) | 6 (5.1%) |
Occupancy by Age of Householder in Cottonwood
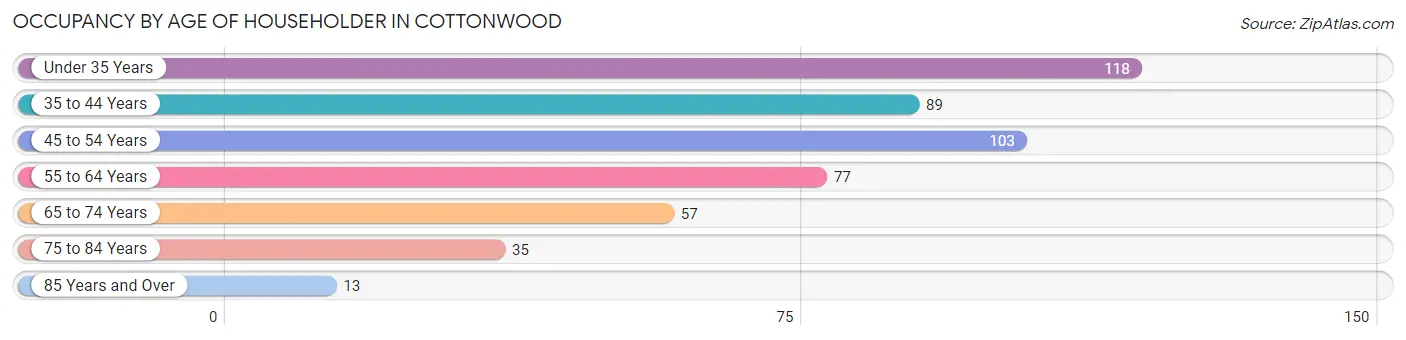
| Age Bracket | # Households | % Households |
| Under 35 Years | 118 | 24.0% |
| 35 to 44 Years | 89 | 18.1% |
| 45 to 54 Years | 103 | 20.9% |
| 55 to 64 Years | 77 | 15.7% |
| 65 to 74 Years | 57 | 11.6% |
| 75 to 84 Years | 35 | 7.1% |
| 85 Years and Over | 13 | 2.6% |
| Total | 492 | 100.0% |
Housing Finances in Cottonwood
Median Income by Occupancy in Cottonwood
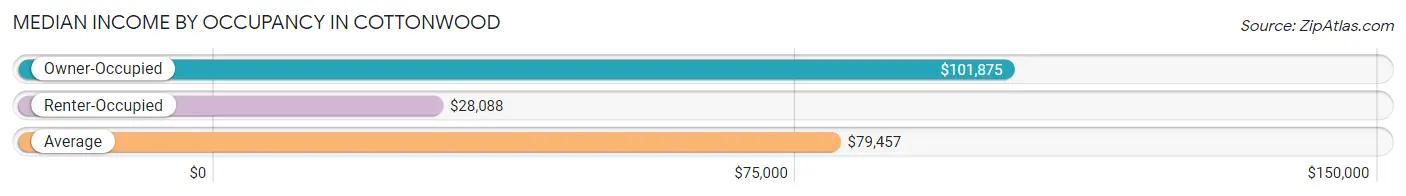
| Occupancy Type | # Households | Median Income |
| Owner-Occupied | 362 (73.6%) | $101,875 |
| Renter-Occupied | 130 (26.4%) | $28,088 |
| Average | 492 (100.0%) | $79,457 |
Occupancy by Householder Income Bracket in Cottonwood
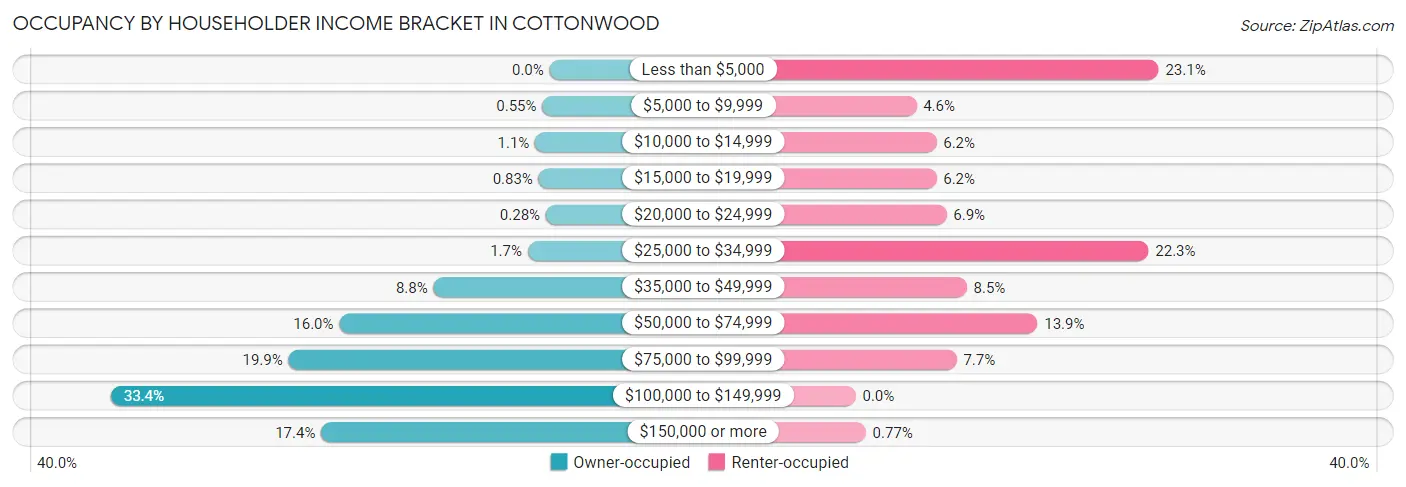
| Income Bracket | Owner-occupied | Renter-occupied |
| Less than $5,000 | 0 (0.0%) | 30 (23.1%) |
| $5,000 to $9,999 | 2 (0.5%) | 6 (4.6%) |
| $10,000 to $14,999 | 4 (1.1%) | 8 (6.1%) |
| $15,000 to $19,999 | 3 (0.8%) | 8 (6.1%) |
| $20,000 to $24,999 | 1 (0.3%) | 9 (6.9%) |
| $25,000 to $34,999 | 6 (1.7%) | 29 (22.3%) |
| $35,000 to $49,999 | 32 (8.8%) | 11 (8.5%) |
| $50,000 to $74,999 | 58 (16.0%) | 18 (13.9%) |
| $75,000 to $99,999 | 72 (19.9%) | 10 (7.7%) |
| $100,000 to $149,999 | 121 (33.4%) | 0 (0.0%) |
| $150,000 or more | 63 (17.4%) | 1 (0.8%) |
| Total | 362 (100.0%) | 130 (100.0%) |
Monthly Housing Cost Tiers in Cottonwood
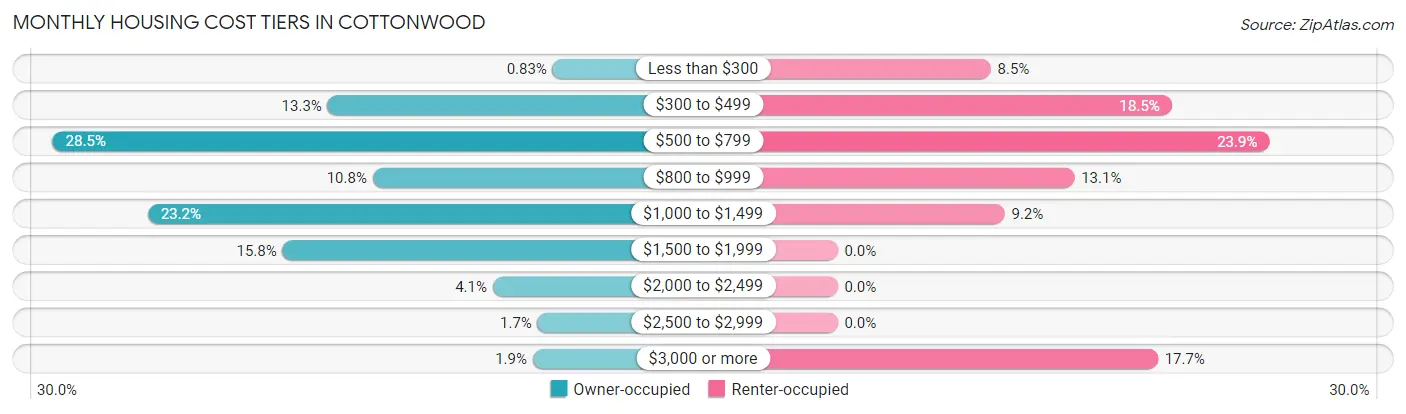
| Monthly Cost | Owner-occupied | Renter-occupied |
| Less than $300 | 3 (0.8%) | 11 (8.5%) |
| $300 to $499 | 48 (13.3%) | 24 (18.5%) |
| $500 to $799 | 103 (28.4%) | 31 (23.8%) |
| $800 to $999 | 39 (10.8%) | 17 (13.1%) |
| $1,000 to $1,499 | 84 (23.2%) | 12 (9.2%) |
| $1,500 to $1,999 | 57 (15.8%) | 0 (0.0%) |
| $2,000 to $2,499 | 15 (4.1%) | 0 (0.0%) |
| $2,500 to $2,999 | 6 (1.7%) | 0 (0.0%) |
| $3,000 or more | 7 (1.9%) | 23 (17.7%) |
| Total | 362 (100.0%) | 130 (100.0%) |
Physical Housing Characteristics in Cottonwood
Housing Structures in Cottonwood
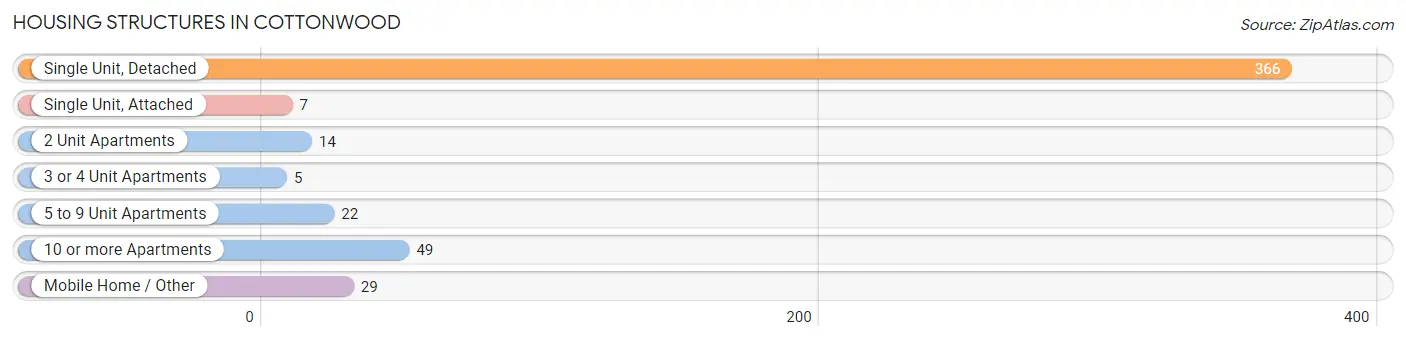
| Structure Type | # Housing Units | % Housing Units |
| Single Unit, Detached | 366 | 74.4% |
| Single Unit, Attached | 7 | 1.4% |
| 2 Unit Apartments | 14 | 2.9% |
| 3 or 4 Unit Apartments | 5 | 1.0% |
| 5 to 9 Unit Apartments | 22 | 4.5% |
| 10 or more Apartments | 49 | 10.0% |
| Mobile Home / Other | 29 | 5.9% |
| Total | 492 | 100.0% |
Housing Structures by Occupancy in Cottonwood
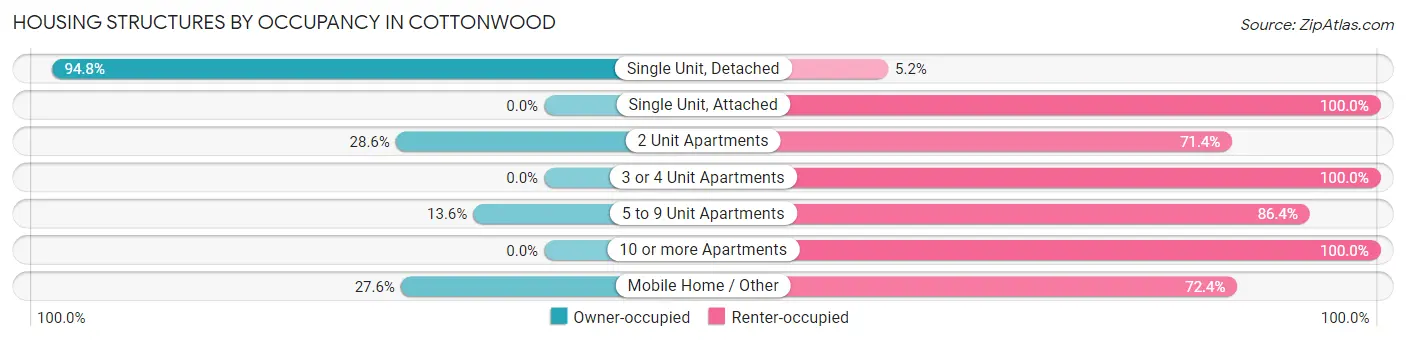
| Structure Type | Owner-occupied | Renter-occupied |
| Single Unit, Detached | 347 (94.8%) | 19 (5.2%) |
| Single Unit, Attached | 0 (0.0%) | 7 (100.0%) |
| 2 Unit Apartments | 4 (28.6%) | 10 (71.4%) |
| 3 or 4 Unit Apartments | 0 (0.0%) | 5 (100.0%) |
| 5 to 9 Unit Apartments | 3 (13.6%) | 19 (86.4%) |
| 10 or more Apartments | 0 (0.0%) | 49 (100.0%) |
| Mobile Home / Other | 8 (27.6%) | 21 (72.4%) |
| Total | 362 (73.6%) | 130 (26.4%) |
Housing Structures by Number of Rooms in Cottonwood
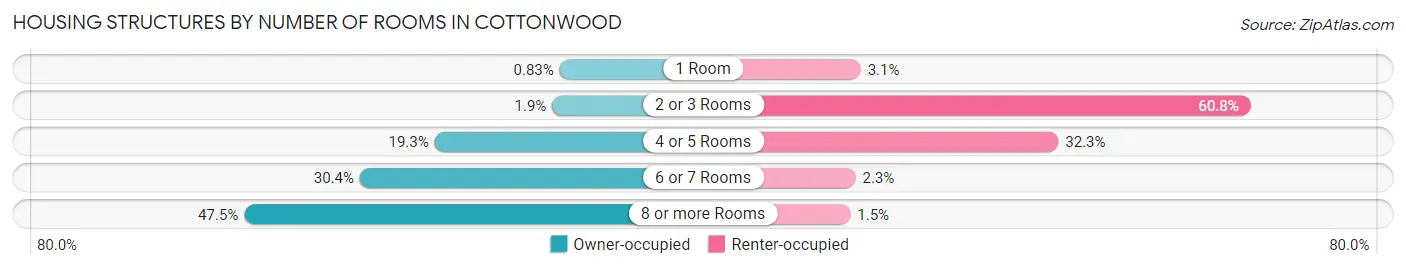
| Number of Rooms | Owner-occupied | Renter-occupied |
| 1 Room | 3 (0.8%) | 4 (3.1%) |
| 2 or 3 Rooms | 7 (1.9%) | 79 (60.8%) |
| 4 or 5 Rooms | 70 (19.3%) | 42 (32.3%) |
| 6 or 7 Rooms | 110 (30.4%) | 3 (2.3%) |
| 8 or more Rooms | 172 (47.5%) | 2 (1.5%) |
| Total | 362 (100.0%) | 130 (100.0%) |
Housing Structure by Heating Type in Cottonwood
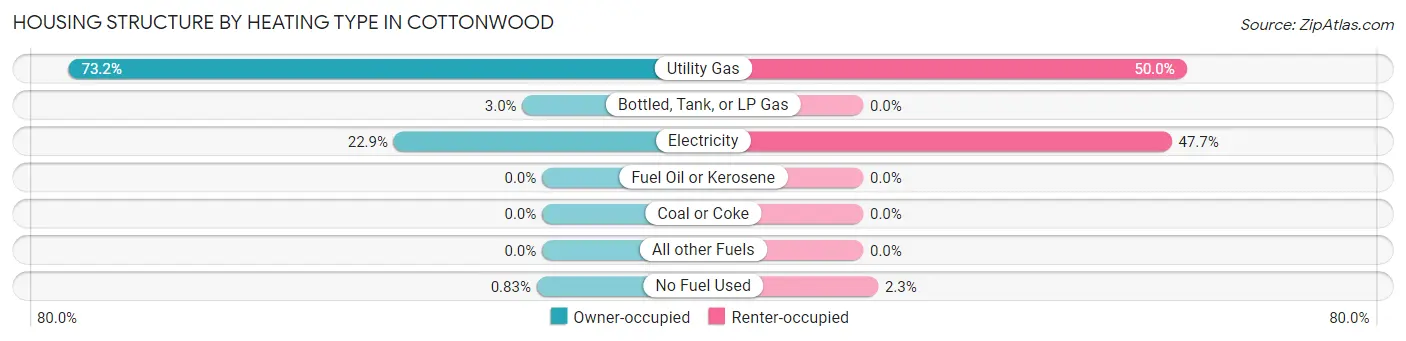
| Heating Type | Owner-occupied | Renter-occupied |
| Utility Gas | 265 (73.2%) | 65 (50.0%) |
| Bottled, Tank, or LP Gas | 11 (3.0%) | 0 (0.0%) |
| Electricity | 83 (22.9%) | 62 (47.7%) |
| Fuel Oil or Kerosene | 0 (0.0%) | 0 (0.0%) |
| Coal or Coke | 0 (0.0%) | 0 (0.0%) |
| All other Fuels | 0 (0.0%) | 0 (0.0%) |
| No Fuel Used | 3 (0.8%) | 3 (2.3%) |
| Total | 362 (100.0%) | 130 (100.0%) |
Household Vehicle Usage in Cottonwood
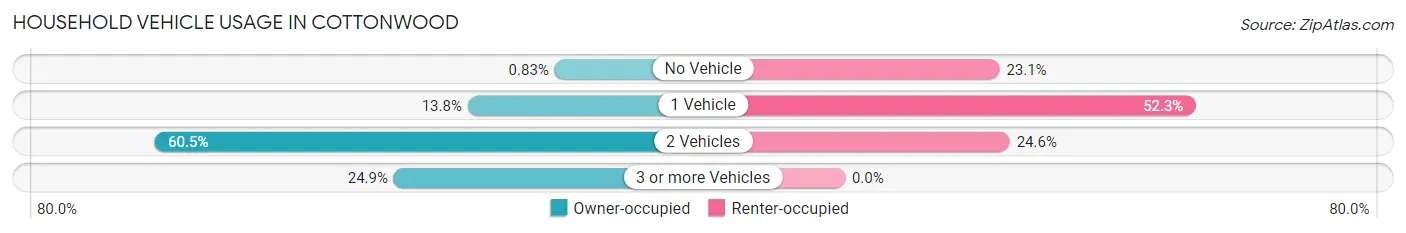
| Vehicles per Household | Owner-occupied | Renter-occupied |
| No Vehicle | 3 (0.8%) | 30 (23.1%) |
| 1 Vehicle | 50 (13.8%) | 68 (52.3%) |
| 2 Vehicles | 219 (60.5%) | 32 (24.6%) |
| 3 or more Vehicles | 90 (24.9%) | 0 (0.0%) |
| Total | 362 (100.0%) | 130 (100.0%) |
Real Estate & Mortgages in Cottonwood
Real Estate and Mortgage Overview in Cottonwood
| Characteristic | Without Mortgage | With Mortgage |
| Housing Units | 148 | 214 |
| Median Property Value | $158,800 | $173,300 |
| Median Household Income | $107,500 | $42 |
| Monthly Housing Costs | $559 | $7 |
| Real Estate Taxes | $1,871 | $0 |
Property Value by Mortgage Status in Cottonwood
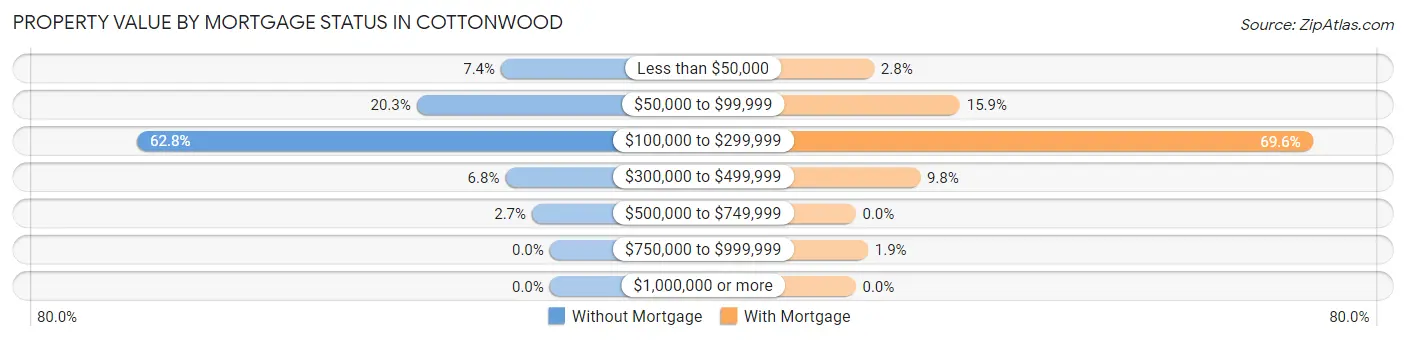
| Property Value | Without Mortgage | With Mortgage |
| Less than $50,000 | 11 (7.4%) | 6 (2.8%) |
| $50,000 to $99,999 | 30 (20.3%) | 34 (15.9%) |
| $100,000 to $299,999 | 93 (62.8%) | 149 (69.6%) |
| $300,000 to $499,999 | 10 (6.8%) | 21 (9.8%) |
| $500,000 to $749,999 | 4 (2.7%) | 0 (0.0%) |
| $750,000 to $999,999 | 0 (0.0%) | 4 (1.9%) |
| $1,000,000 or more | 0 (0.0%) | 0 (0.0%) |
| Total | 148 (100.0%) | 214 (100.0%) |
Household Income by Mortgage Status in Cottonwood
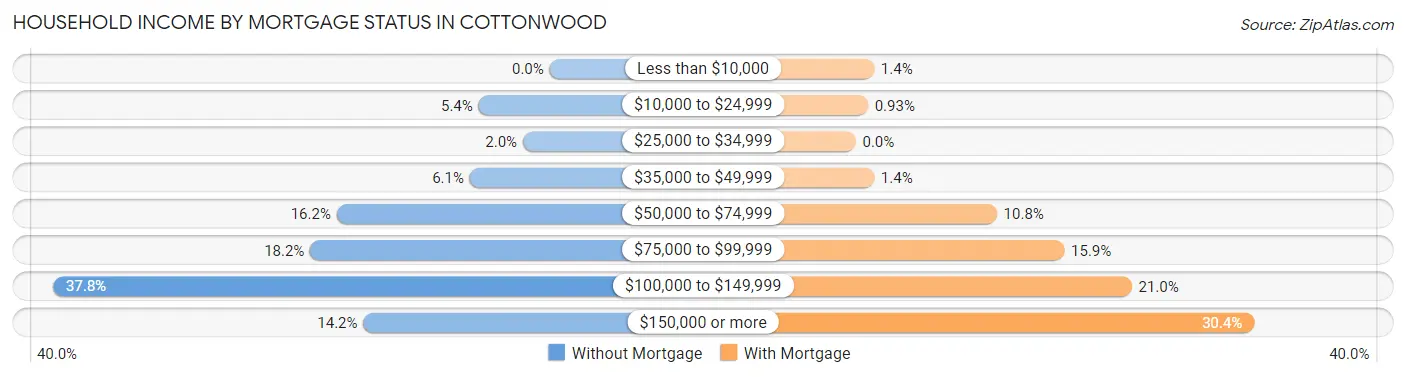
| Household Income | Without Mortgage | With Mortgage |
| Less than $10,000 | 0 (0.0%) | 3 (1.4%) |
| $10,000 to $24,999 | 8 (5.4%) | 2 (0.9%) |
| $25,000 to $34,999 | 3 (2.0%) | 0 (0.0%) |
| $35,000 to $49,999 | 9 (6.1%) | 3 (1.4%) |
| $50,000 to $74,999 | 24 (16.2%) | 23 (10.7%) |
| $75,000 to $99,999 | 27 (18.2%) | 34 (15.9%) |
| $100,000 to $149,999 | 56 (37.8%) | 45 (21.0%) |
| $150,000 or more | 21 (14.2%) | 65 (30.4%) |
| Total | 148 (100.0%) | 214 (100.0%) |
Property Value to Household Income Ratio in Cottonwood
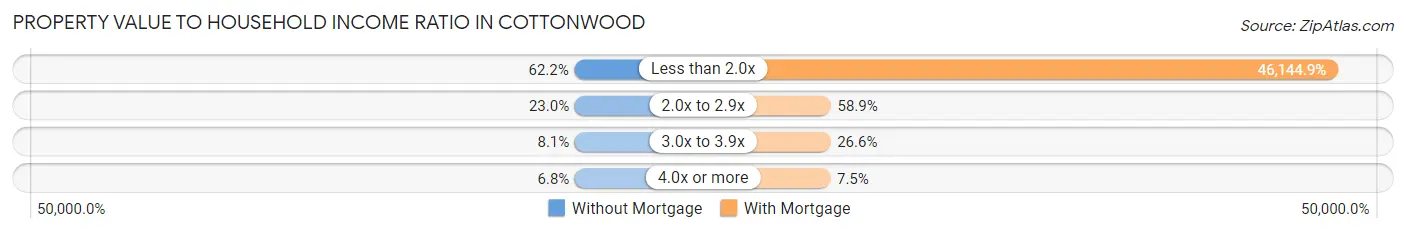
| Value-to-Income Ratio | Without Mortgage | With Mortgage |
| Less than 2.0x | 92 (62.2%) | 98,750 (46,144.9%) |
| 2.0x to 2.9x | 34 (23.0%) | 126 (58.9%) |
| 3.0x to 3.9x | 12 (8.1%) | 57 (26.6%) |
| 4.0x or more | 10 (6.8%) | 16 (7.5%) |
| Total | 148 (100.0%) | 214 (100.0%) |
Real Estate Taxes by Mortgage Status in Cottonwood
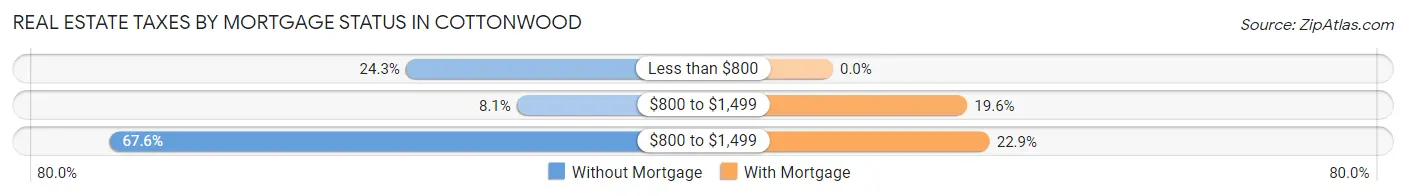
| Property Taxes | Without Mortgage | With Mortgage |
| Less than $800 | 36 (24.3%) | 0 (0.0%) |
| $800 to $1,499 | 12 (8.1%) | 42 (19.6%) |
| $800 to $1,499 | 100 (67.6%) | 49 (22.9%) |
| Total | 148 (100.0%) | 214 (100.0%) |
Health & Disability in Cottonwood
Health Insurance Coverage by Age in Cottonwood
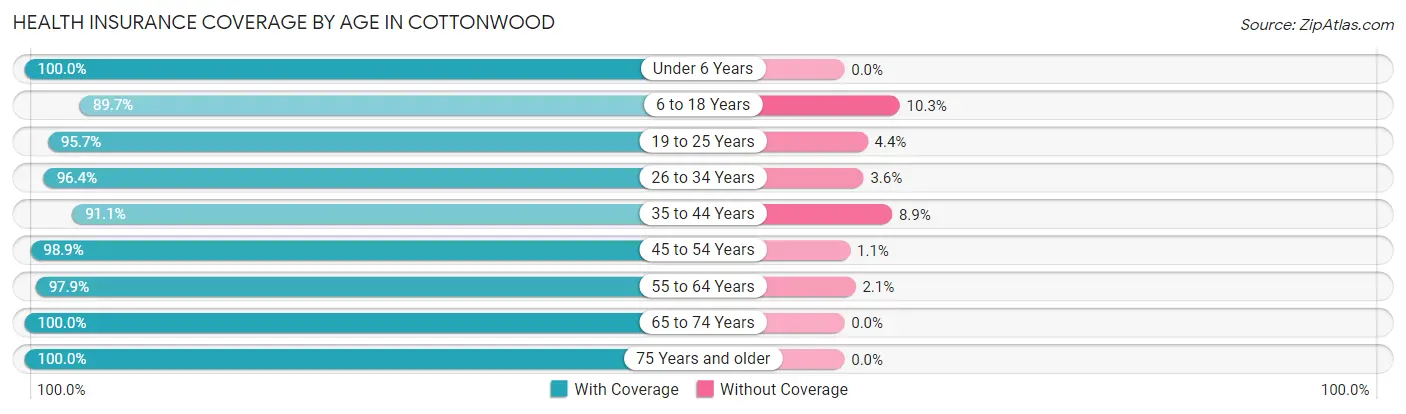
| Age Bracket | With Coverage | Without Coverage |
| Under 6 Years | 134 (100.0%) | 0 (0.0%) |
| 6 to 18 Years | 139 (89.7%) | 16 (10.3%) |
| 19 to 25 Years | 88 (95.7%) | 4 (4.3%) |
| 26 to 34 Years | 135 (96.4%) | 5 (3.6%) |
| 35 to 44 Years | 123 (91.1%) | 12 (8.9%) |
| 45 to 54 Years | 184 (98.9%) | 2 (1.1%) |
| 55 to 64 Years | 141 (97.9%) | 3 (2.1%) |
| 65 to 74 Years | 83 (100.0%) | 0 (0.0%) |
| 75 Years and older | 79 (100.0%) | 0 (0.0%) |
| Total | 1,106 (96.3%) | 42 (3.7%) |
Health Insurance Coverage by Citizenship Status in Cottonwood
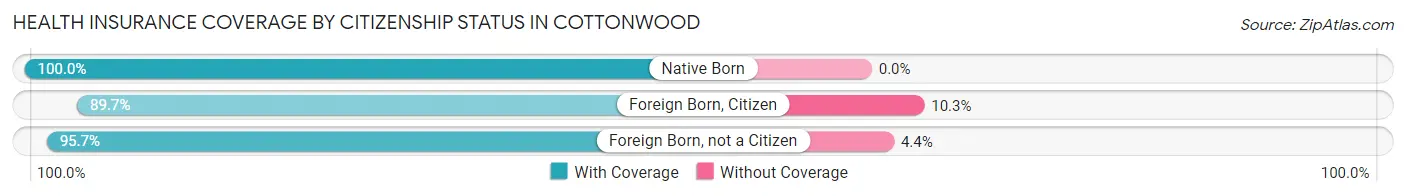
| Citizenship Status | With Coverage | Without Coverage |
| Native Born | 134 (100.0%) | 0 (0.0%) |
| Foreign Born, Citizen | 139 (89.7%) | 16 (10.3%) |
| Foreign Born, not a Citizen | 88 (95.7%) | 4 (4.3%) |
Health Insurance Coverage by Household Income in Cottonwood
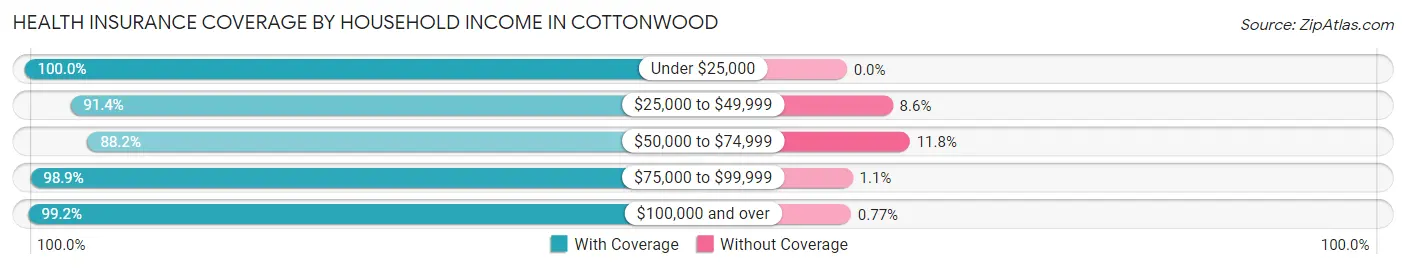
| Household Income | With Coverage | Without Coverage |
| Under $25,000 | 103 (100.0%) | 0 (0.0%) |
| $25,000 to $49,999 | 117 (91.4%) | 11 (8.6%) |
| $50,000 to $74,999 | 187 (88.2%) | 25 (11.8%) |
| $75,000 to $99,999 | 181 (98.9%) | 2 (1.1%) |
| $100,000 and over | 518 (99.2%) | 4 (0.8%) |
Public vs Private Health Insurance Coverage by Age in Cottonwood
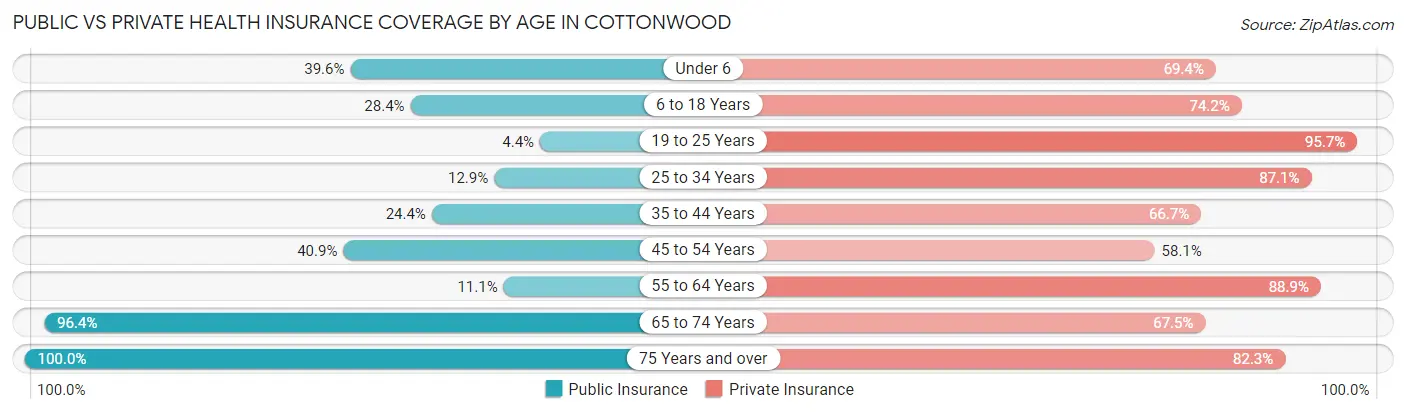
| Age Bracket | Public Insurance | Private Insurance |
| Under 6 | 53 (39.6%) | 93 (69.4%) |
| 6 to 18 Years | 44 (28.4%) | 115 (74.2%) |
| 19 to 25 Years | 4 (4.3%) | 88 (95.7%) |
| 25 to 34 Years | 18 (12.9%) | 122 (87.1%) |
| 35 to 44 Years | 33 (24.4%) | 90 (66.7%) |
| 45 to 54 Years | 76 (40.9%) | 108 (58.1%) |
| 55 to 64 Years | 16 (11.1%) | 128 (88.9%) |
| 65 to 74 Years | 80 (96.4%) | 56 (67.5%) |
| 75 Years and over | 79 (100.0%) | 65 (82.3%) |
| Total | 403 (35.1%) | 865 (75.3%) |
Disability Status by Sex by Age in Cottonwood
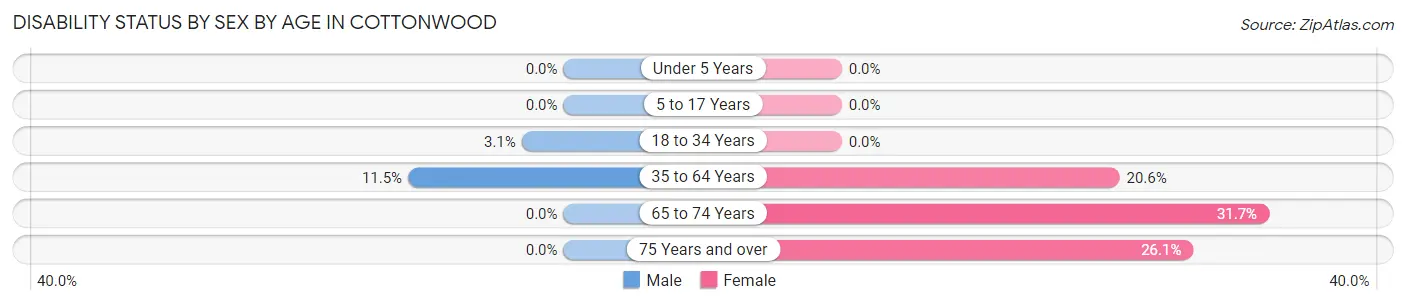
| Age Bracket | Male | Female |
| Under 5 Years | 0 (0.0%) | 0 (0.0%) |
| 5 to 17 Years | 0 (0.0%) | 0 (0.0%) |
| 18 to 34 Years | 4 (3.1%) | 0 (0.0%) |
| 35 to 64 Years | 24 (11.5%) | 53 (20.6%) |
| 65 to 74 Years | 0 (0.0%) | 13 (31.7%) |
| 75 Years and over | 0 (0.0%) | 12 (26.1%) |
Disability Class by Sex by Age in Cottonwood
Disability Class: Hearing Difficulty
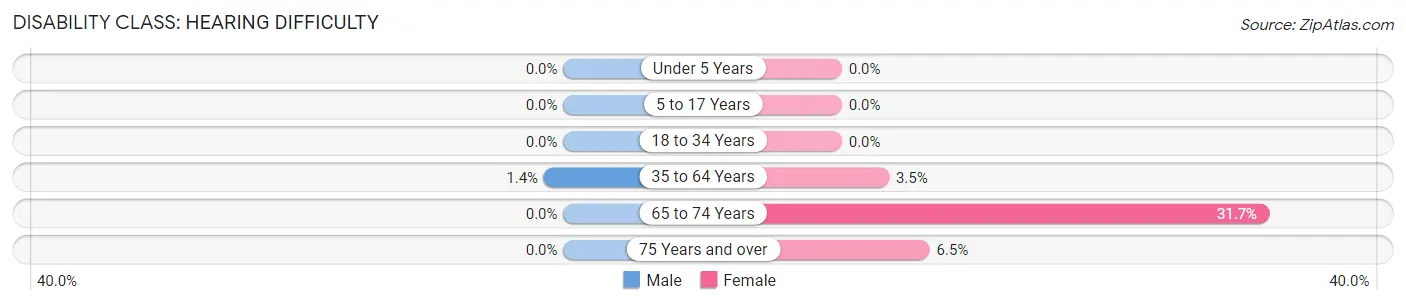
| Age Bracket | Male | Female |
| Under 5 Years | 0 (0.0%) | 0 (0.0%) |
| 5 to 17 Years | 0 (0.0%) | 0 (0.0%) |
| 18 to 34 Years | 0 (0.0%) | 0 (0.0%) |
| 35 to 64 Years | 3 (1.4%) | 9 (3.5%) |
| 65 to 74 Years | 0 (0.0%) | 13 (31.7%) |
| 75 Years and over | 0 (0.0%) | 3 (6.5%) |
Disability Class: Vision Difficulty
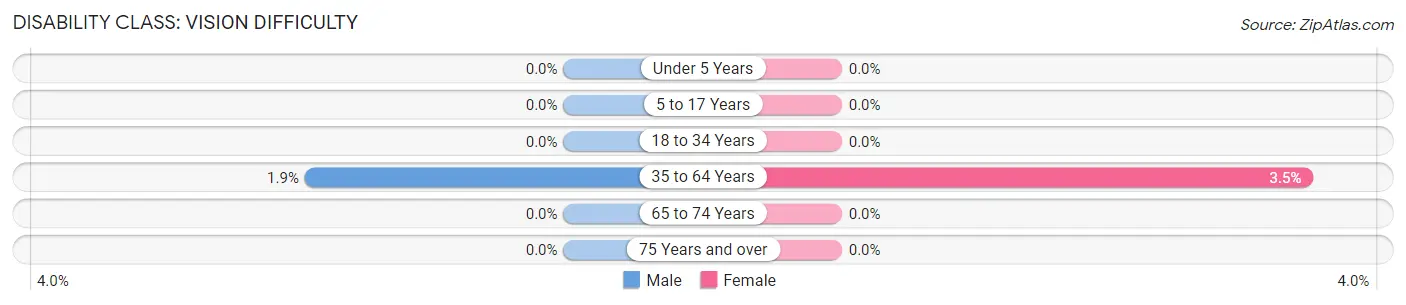
| Age Bracket | Male | Female |
| Under 5 Years | 0 (0.0%) | 0 (0.0%) |
| 5 to 17 Years | 0 (0.0%) | 0 (0.0%) |
| 18 to 34 Years | 0 (0.0%) | 0 (0.0%) |
| 35 to 64 Years | 4 (1.9%) | 9 (3.5%) |
| 65 to 74 Years | 0 (0.0%) | 0 (0.0%) |
| 75 Years and over | 0 (0.0%) | 0 (0.0%) |
Disability Class: Cognitive Difficulty
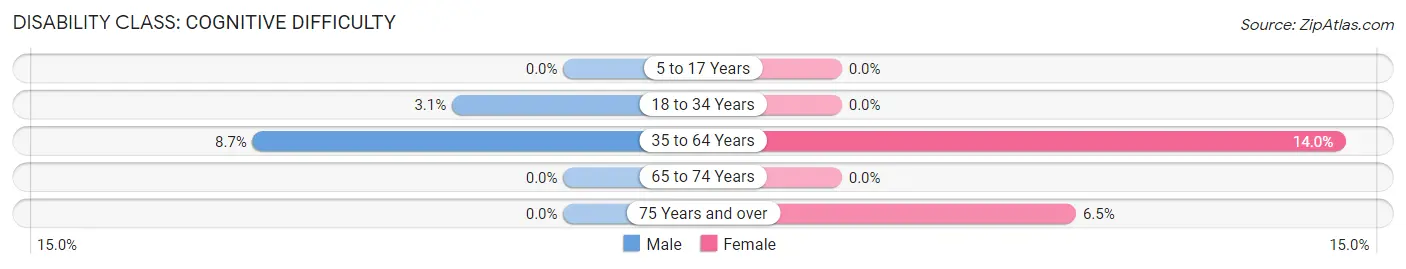
| Age Bracket | Male | Female |
| 5 to 17 Years | 0 (0.0%) | 0 (0.0%) |
| 18 to 34 Years | 4 (3.1%) | 0 (0.0%) |
| 35 to 64 Years | 18 (8.6%) | 36 (14.0%) |
| 65 to 74 Years | 0 (0.0%) | 0 (0.0%) |
| 75 Years and over | 0 (0.0%) | 3 (6.5%) |
Disability Class: Ambulatory Difficulty
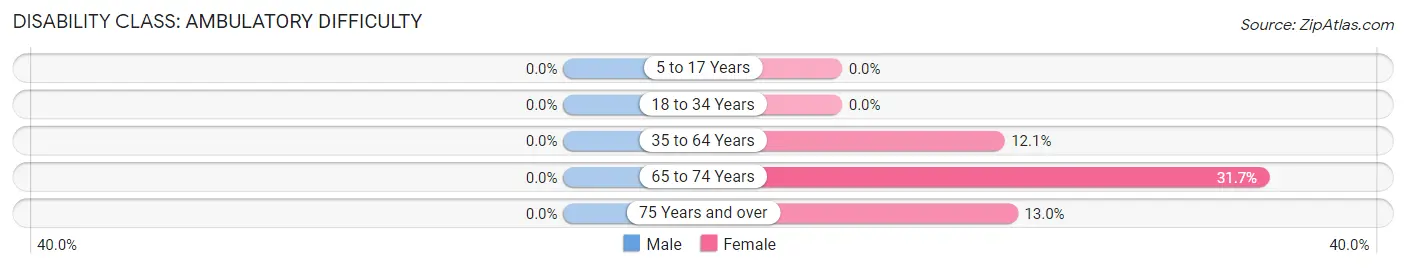
| Age Bracket | Male | Female |
| 5 to 17 Years | 0 (0.0%) | 0 (0.0%) |
| 18 to 34 Years | 0 (0.0%) | 0 (0.0%) |
| 35 to 64 Years | 0 (0.0%) | 31 (12.1%) |
| 65 to 74 Years | 0 (0.0%) | 13 (31.7%) |
| 75 Years and over | 0 (0.0%) | 6 (13.0%) |
Disability Class: Self-Care Difficulty
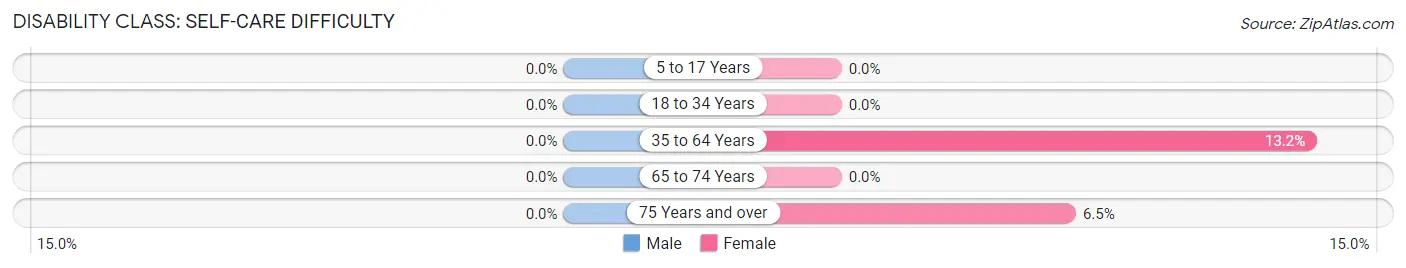
| Age Bracket | Male | Female |
| 5 to 17 Years | 0 (0.0%) | 0 (0.0%) |
| 18 to 34 Years | 0 (0.0%) | 0 (0.0%) |
| 35 to 64 Years | 0 (0.0%) | 34 (13.2%) |
| 65 to 74 Years | 0 (0.0%) | 0 (0.0%) |
| 75 Years and over | 0 (0.0%) | 3 (6.5%) |
Technology Access in Cottonwood
Computing Device Access in Cottonwood
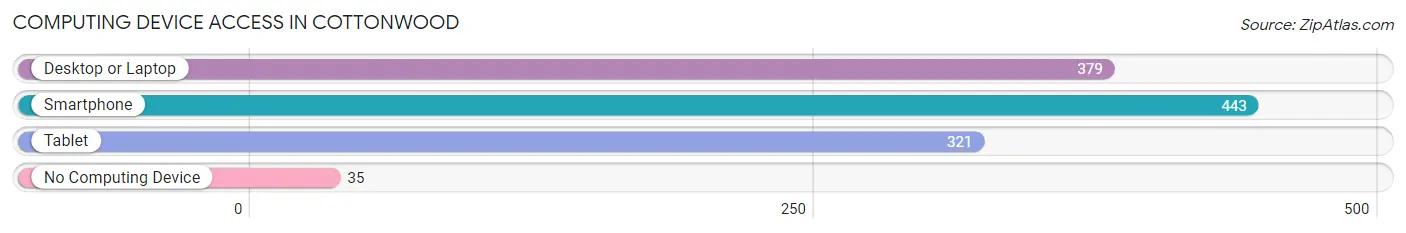
| Device Type | # Households | % Households |
| Desktop or Laptop | 379 | 77.0% |
| Smartphone | 443 | 90.0% |
| Tablet | 321 | 65.2% |
| No Computing Device | 35 | 7.1% |
| Total | 492 | 100.0% |
Internet Access in Cottonwood
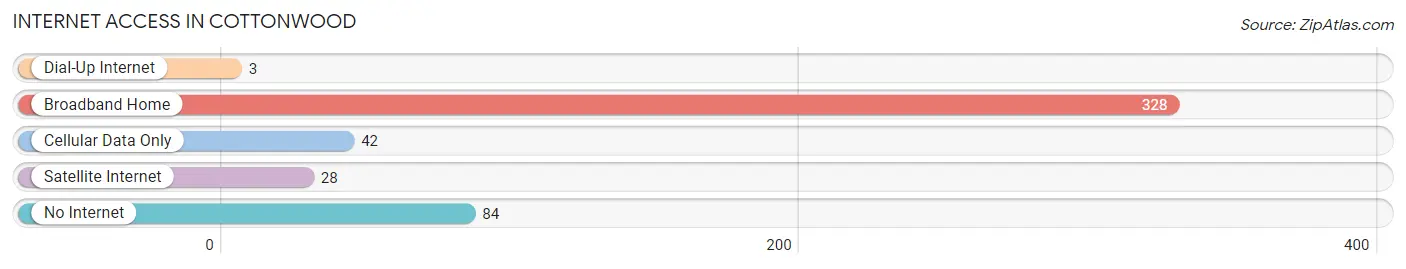
| Internet Type | # Households | % Households |
| Dial-Up Internet | 3 | 0.6% |
| Broadband Home | 328 | 66.7% |
| Cellular Data Only | 42 | 8.5% |
| Satellite Internet | 28 | 5.7% |
| No Internet | 84 | 17.1% |
| Total | 492 | 100.0% |
Cottonwood Summary
Cottonwood, Minnesota is a small city located in the southwestern corner of the state, in the heart of the Minnesota River Valley. It is situated on the banks of the Cottonwood River, which flows through the city and is a major source of recreation and leisure activities. The city is home to a population of approximately 1,500 people, and is the county seat of Cottonwood County.
History
The area that is now Cottonwood was first settled in the late 1800s by a group of German immigrants. The city was officially incorporated in 1887, and was named after the nearby Cottonwood River. The city quickly grew in size and importance, becoming a major hub for the surrounding agricultural communities. In the early 1900s, the city was home to a number of businesses, including a flour mill, a creamery, a lumber mill, and a brickyard.
In the mid-1900s, the city began to experience a decline in population and economic activity. This was due in part to the decline of the agricultural industry in the area, as well as the closure of the local railroad line. However, in recent years, the city has seen a resurgence in population and economic activity, due in part to the development of the nearby Minnesota Valley National Wildlife Refuge.
Geography
Cottonwood is located in the southwestern corner of Minnesota, in the heart of the Minnesota River Valley. The city is situated on the banks of the Cottonwood River, which flows through the city and is a major source of recreation and leisure activities. The city is surrounded by rolling hills and farmland, and is located approximately 30 miles from the cities of Mankato and St. Peter.
Economy
The economy of Cottonwood is largely based on agriculture and tourism. The city is home to a number of farms, which produce a variety of crops, including corn, soybeans, and wheat. The city is also home to a number of tourist attractions, including the Minnesota Valley National Wildlife Refuge, which is a popular destination for birdwatchers and nature lovers.
In addition to agriculture and tourism, the city is also home to a number of small businesses, including restaurants, retail stores, and service providers. The city is also home to a number of manufacturing companies, which produce a variety of products, including furniture, clothing, and electronics.
Demographics
As of the 2010 census, the population of Cottonwood was 1,500. The racial makeup of the city was 97.2% White, 0.7% African American, 0.3% Native American, 0.2% Asian, 0.1% Pacific Islander, and 1.5% from other races. The median household income in the city was $41,250, and the median family income was $50,000. The per capita income in the city was $20,000.
Conclusion
Cottonwood, Minnesota is a small city located in the southwestern corner of the state, in the heart of the Minnesota River Valley. It is situated on the banks of the Cottonwood River, which flows through the city and is a major source of recreation and leisure activities. The city is home to a population of approximately 1,500 people, and is the county seat of Cottonwood County. The economy of Cottonwood is largely based on agriculture and tourism, and the city is home to a number of small businesses, including restaurants, retail stores, and service providers. The racial makeup of the city is predominantly White, with a small percentage of African American, Native American, Asian, and Pacific Islander residents.
Common Questions
What is Per Capita Income in Cottonwood?
Per Capita income in Cottonwood is $40,715.
What is the Median Family Income in Cottonwood?
Median Family Income in Cottonwood is $103,750.
What is the Median Household income in Cottonwood?
Median Household Income in Cottonwood is $79,457.
What is Income or Wage Gap in Cottonwood?
Income or Wage Gap in Cottonwood is 26.8%.
Women in Cottonwood earn 73.2 cents for every dollar earned by a man.
What is Inequality or Gini Index in Cottonwood?
Inequality or Gini Index in Cottonwood is 0.41.
What is the Total Population of Cottonwood?
Total Population of Cottonwood is 1,150.
What is the Total Male Population of Cottonwood?
Total Male Population of Cottonwood is 586.
What is the Total Female Population of Cottonwood?
Total Female Population of Cottonwood is 564.
What is the Ratio of Males per 100 Females in Cottonwood?
There are 103.90 Males per 100 Females in Cottonwood.
What is the Ratio of Females per 100 Males in Cottonwood?
There are 96.25 Females per 100 Males in Cottonwood.
What is the Median Population Age in Cottonwood?
Median Population Age in Cottonwood is 38.1 Years.
What is the Average Family Size in Cottonwood
Average Family Size in Cottonwood is 3.0 People.
What is the Average Household Size in Cottonwood
Average Household Size in Cottonwood is 2.3 People.
How Large is the Labor Force in Cottonwood?
There are 629 People in the Labor Forcein in Cottonwood.
What is the Percentage of People in the Labor Force in Cottonwood?
70.9% of People are in the Labor Force in Cottonwood.
What is the Unemployment Rate in Cottonwood?
Unemployment Rate in Cottonwood is 3.3%.