Clearwater, MN Map & Demographics
Clearwater Map
Clearwater Overview
$33,618
PER CAPITA INCOME
$91,875
AVG FAMILY INCOME
$72,411
AVG HOUSEHOLD INCOME
31.2%
WAGE / INCOME GAP [ % ]
68.8¢/ $1
WAGE / INCOME GAP [ $ ]
0.35
INEQUALITY / GINI INDEX
1,734
TOTAL POPULATION
827
MALE POPULATION
907
FEMALE POPULATION
91.18
MALES / 100 FEMALES
109.67
FEMALES / 100 MALES
32.3
MEDIAN AGE
3.1
AVG FAMILY SIZE
2.5
AVG HOUSEHOLD SIZE
940
LABOR FORCE [ PEOPLE ]
76.4%
PERCENT IN LABOR FORCE
3.6%
UNEMPLOYMENT RATE
Clearwater Zip Codes
Clearwater Area Codes
Income in Clearwater
Income Overview in Clearwater
Per Capita Income in Clearwater is $33,618, while median incomes of families and households are $91,875 and $72,411 respectively.
| Characteristic | Number | Measure |
| Per Capita Income | 1,734 | $33,618 |
| Median Family Income | 441 | $91,875 |
| Mean Family Income | 441 | $97,549 |
| Median Household Income | 683 | $72,411 |
| Mean Household Income | 683 | $85,123 |
| Income Deficit | 441 | $0 |
| Wage / Income Gap (%) | 1,734 | 31.22% |
| Wage / Income Gap ($) | 1,734 | 68.78¢ per $1 |
| Gini / Inequality Index | 1,734 | 0.35 |
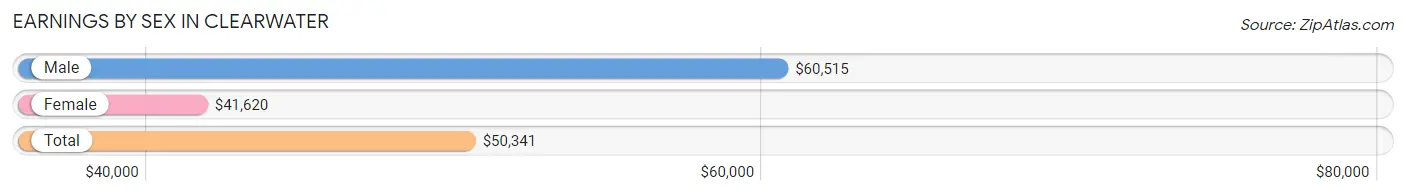
Earnings by Sex in Clearwater
Average Earnings in Clearwater are $50,341, $60,515 for men and $41,620 for women, a difference of 31.2%.
| Sex | Number | Average Earnings |
| Male | 473 (48.7%) | $60,515 |
| Female | 499 (51.3%) | $41,620 |
| Total | 972 (100.0%) | $50,341 |
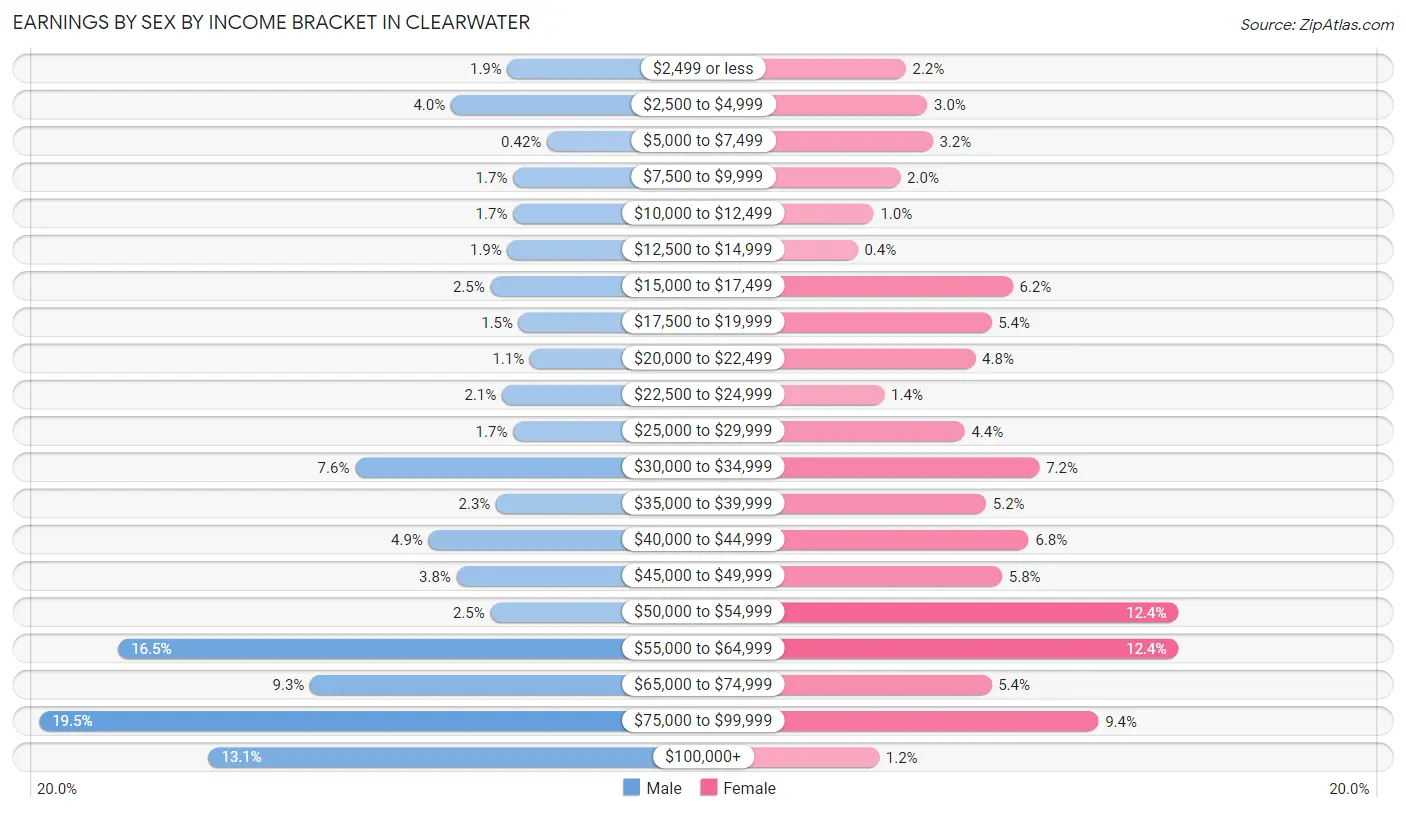
Earnings by Sex by Income Bracket in Clearwater
The most common earnings brackets in Clearwater are $75,000 to $99,999 for men (92 | 19.5%) and $50,000 to $54,999 for women (62 | 12.4%).
| Income | Male | Female |
| $2,499 or less | 9 (1.9%) | 11 (2.2%) |
| $2,500 to $4,999 | 19 (4.0%) | 15 (3.0%) |
| $5,000 to $7,499 | 2 (0.4%) | 16 (3.2%) |
| $7,500 to $9,999 | 8 (1.7%) | 10 (2.0%) |
| $10,000 to $12,499 | 8 (1.7%) | 5 (1.0%) |
| $12,500 to $14,999 | 9 (1.9%) | 2 (0.4%) |
| $15,000 to $17,499 | 12 (2.5%) | 31 (6.2%) |
| $17,500 to $19,999 | 7 (1.5%) | 27 (5.4%) |
| $20,000 to $22,499 | 5 (1.1%) | 24 (4.8%) |
| $22,500 to $24,999 | 10 (2.1%) | 7 (1.4%) |
| $25,000 to $29,999 | 8 (1.7%) | 22 (4.4%) |
| $30,000 to $34,999 | 36 (7.6%) | 36 (7.2%) |
| $35,000 to $39,999 | 11 (2.3%) | 26 (5.2%) |
| $40,000 to $44,999 | 23 (4.9%) | 34 (6.8%) |
| $45,000 to $49,999 | 18 (3.8%) | 29 (5.8%) |
| $50,000 to $54,999 | 12 (2.5%) | 62 (12.4%) |
| $55,000 to $64,999 | 78 (16.5%) | 62 (12.4%) |
| $65,000 to $74,999 | 44 (9.3%) | 27 (5.4%) |
| $75,000 to $99,999 | 92 (19.5%) | 47 (9.4%) |
| $100,000+ | 62 (13.1%) | 6 (1.2%) |
| Total | 473 (100.0%) | 499 (100.0%) |
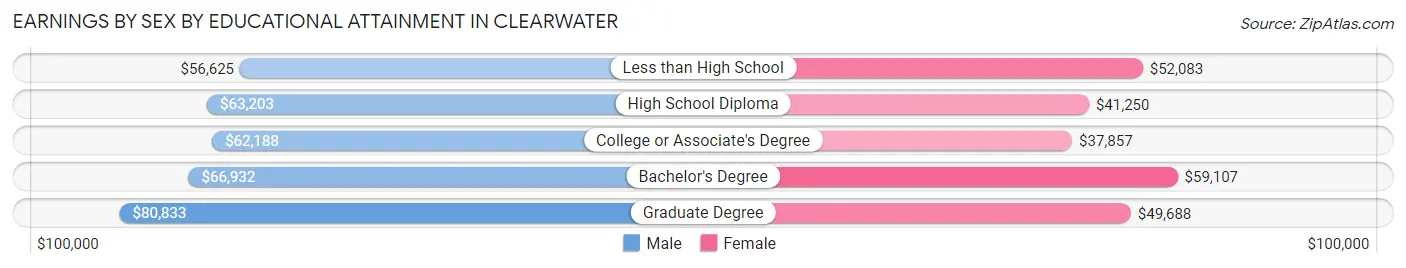
Earnings by Sex by Educational Attainment in Clearwater
Average earnings in Clearwater are $63,100 for men and $48,571 for women, a difference of 23.0%. Men with an educational attainment of graduate degree enjoy the highest average annual earnings of $80,833, while those with less than high school education earn the least with $56,625. Women with an educational attainment of bachelor's degree earn the most with the average annual earnings of $59,107, while those with college or associate's degree education have the smallest earnings of $37,857.
| Educational Attainment | Male Income | Female Income |
| Less than High School | $56,625 | $52,083 |
| High School Diploma | $63,203 | $41,250 |
| College or Associate's Degree | $62,188 | $37,857 |
| Bachelor's Degree | $66,932 | $59,107 |
| Graduate Degree | $80,833 | $49,688 |
| Total | $63,100 | $48,571 |
Family Income in Clearwater
Family Income Brackets in Clearwater
According to the Clearwater family income data, there are 111 families falling into the $50,000 to $74,999 income range, which is the most common income bracket and makes up 25.2% of all families. Conversely, the $10,000 to $14,999 income bracket is the least frequent group with only 8 families (1.8%) belonging to this category.
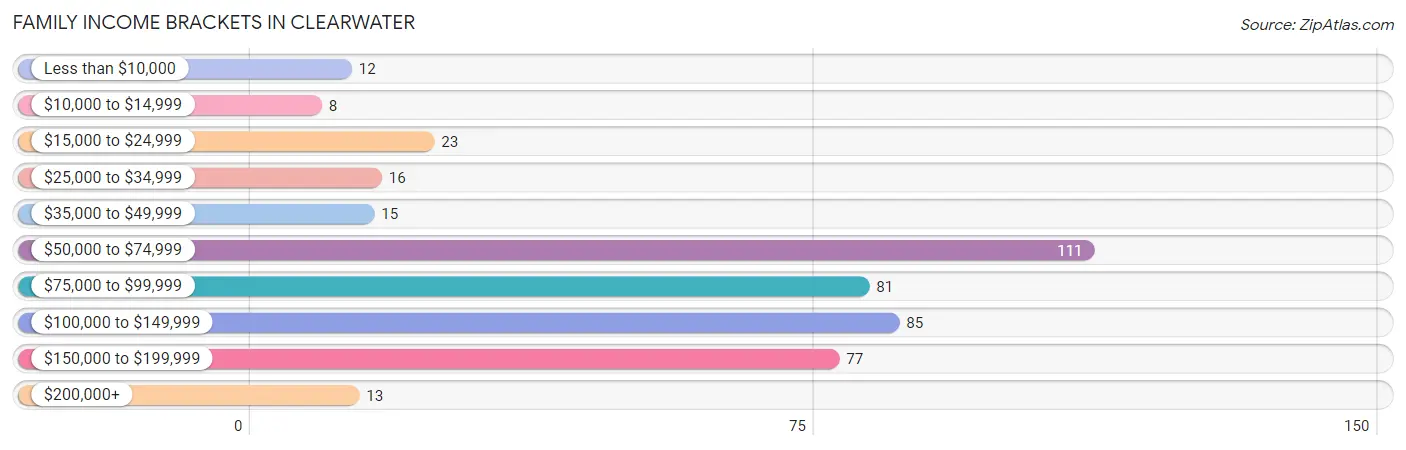
| Income Bracket | # Families | % Families |
| Less than $10,000 | 12 | 2.7% |
| $10,000 to $14,999 | 8 | 1.8% |
| $15,000 to $24,999 | 23 | 5.2% |
| $25,000 to $34,999 | 16 | 3.6% |
| $35,000 to $49,999 | 15 | 3.4% |
| $50,000 to $74,999 | 111 | 25.2% |
| $75,000 to $99,999 | 81 | 18.4% |
| $100,000 to $149,999 | 85 | 19.3% |
| $150,000 to $199,999 | 77 | 17.5% |
| $200,000+ | 13 | 2.9% |
Family Income by Famaliy Size in Clearwater
6-person families (25 | 5.7%) account for the highest median family income in Clearwater with $173,750 per family, while 2-person families (196 | 44.4%) have the highest median income of $35,903 per family member.
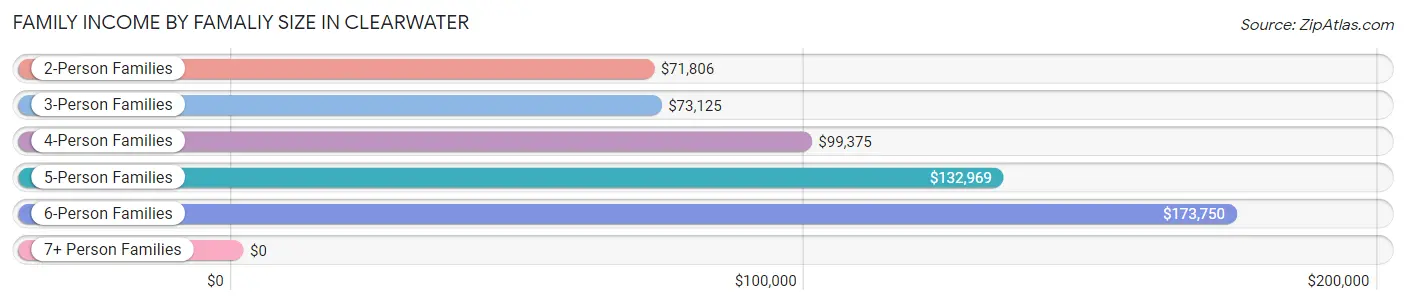
| Income Bracket | # Families | Median Income |
| 2-Person Families | 196 (44.4%) | $71,806 |
| 3-Person Families | 99 (22.5%) | $73,125 |
| 4-Person Families | 65 (14.7%) | $99,375 |
| 5-Person Families | 54 (12.2%) | $132,969 |
| 6-Person Families | 25 (5.7%) | $173,750 |
| 7+ Person Families | 2 (0.4%) | $0 |
| Total | 441 (100.0%) | $91,875 |
Family Income by Number of Earners in Clearwater
The median family income in Clearwater is $91,875, with families comprising 3+ earners (66) having the highest median family income of $172,976, while families with 1 earner (138) have the lowest median family income of $54,118, accounting for 15.0% and 31.3% of families, respectively.
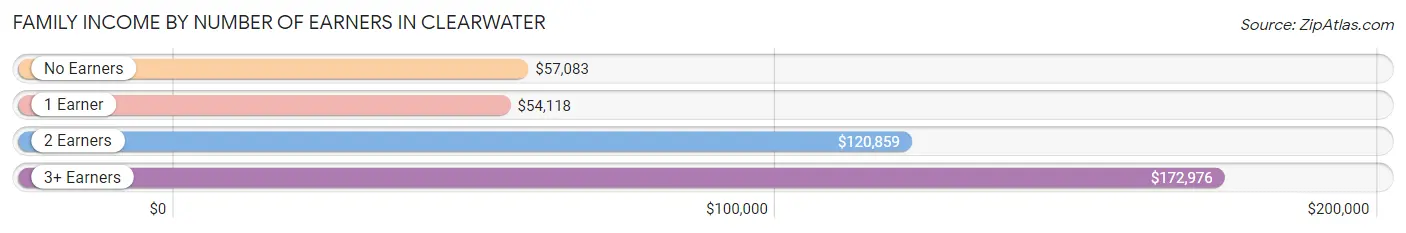
| Number of Earners | # Families | Median Income |
| No Earners | 56 (12.7%) | $57,083 |
| 1 Earner | 138 (31.3%) | $54,118 |
| 2 Earners | 181 (41.0%) | $120,859 |
| 3+ Earners | 66 (15.0%) | $172,976 |
| Total | 441 (100.0%) | $91,875 |
Household Income in Clearwater
Household Income Brackets in Clearwater
With 166 households falling in the category, the $50,000 to $74,999 income range is the most frequent in Clearwater, accounting for 24.3% of all households. In contrast, only 13 households (1.9%) fall into the $200,000+ income bracket, making it the least populous group.
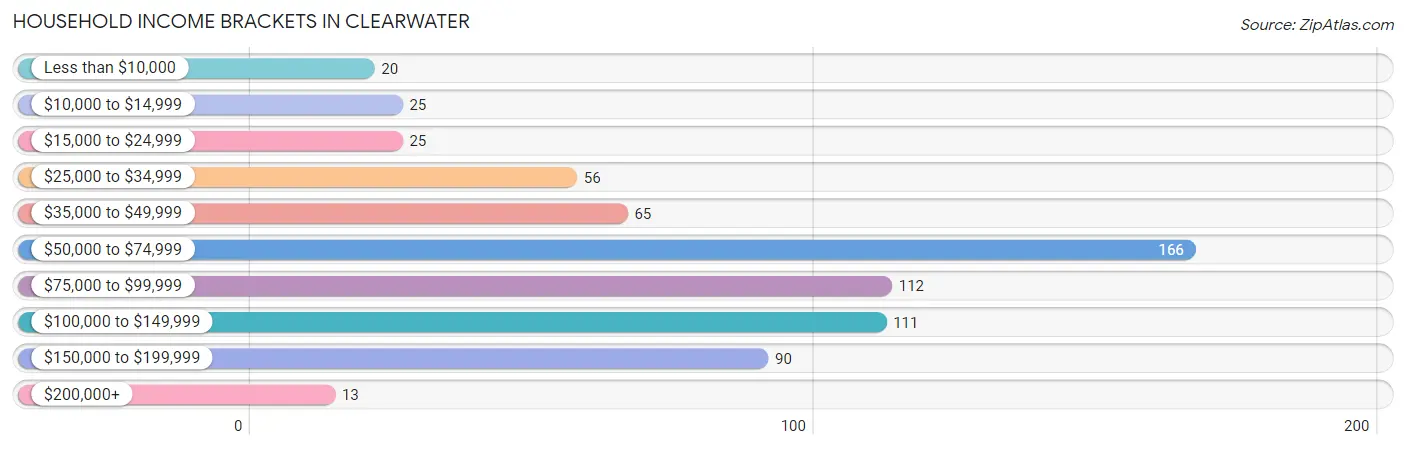
| Income Bracket | # Households | % Households |
| Less than $10,000 | 20 | 2.9% |
| $10,000 to $14,999 | 25 | 3.7% |
| $15,000 to $24,999 | 25 | 3.7% |
| $25,000 to $34,999 | 56 | 8.2% |
| $35,000 to $49,999 | 65 | 9.5% |
| $50,000 to $74,999 | 166 | 24.3% |
| $75,000 to $99,999 | 112 | 16.4% |
| $100,000 to $149,999 | 111 | 16.3% |
| $150,000 to $199,999 | 90 | 13.2% |
| $200,000+ | 13 | 1.9% |
Household Income by Householder Age in Clearwater
The median household income in Clearwater is $72,411, with the highest median household income of $89,167 found in the 45 to 64 years age bracket for the primary householder. A total of 198 households (29.0%) fall into this category. Meanwhile, the 65+ years age bracket for the primary householder has the lowest median household income of $57,361, with 145 households (21.2%) in this group.
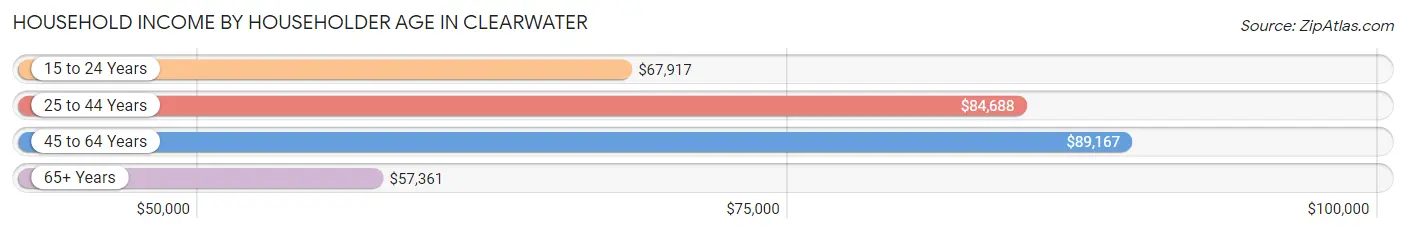
| Income Bracket | # Households | Median Income |
| 15 to 24 Years | 19 (2.8%) | $67,917 |
| 25 to 44 Years | 321 (47.0%) | $84,688 |
| 45 to 64 Years | 198 (29.0%) | $89,167 |
| 65+ Years | 145 (21.2%) | $57,361 |
| Total | 683 (100.0%) | $72,411 |
Poverty in Clearwater
Income Below Poverty by Sex and Age in Clearwater
With 5.2% poverty level for males and 7.5% for females among the residents of Clearwater, 15 year old males and 5 year old females are the most vulnerable to poverty, with 4 males (25.0%) and 9 females (34.6%) in their respective age groups living below the poverty level.
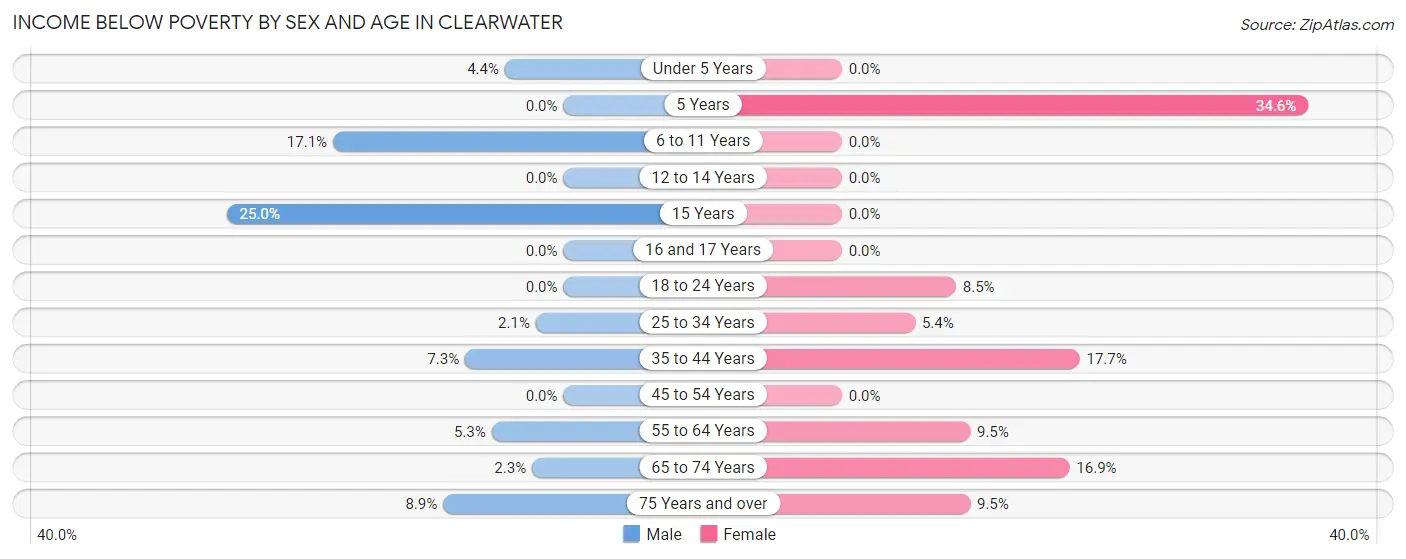
| Age Bracket | Male | Female |
| Under 5 Years | 3 (4.3%) | 0 (0.0%) |
| 5 Years | 0 (0.0%) | 9 (34.6%) |
| 6 to 11 Years | 13 (17.1%) | 0 (0.0%) |
| 12 to 14 Years | 0 (0.0%) | 0 (0.0%) |
| 15 Years | 4 (25.0%) | 0 (0.0%) |
| 16 and 17 Years | 0 (0.0%) | 0 (0.0%) |
| 18 to 24 Years | 0 (0.0%) | 5 (8.5%) |
| 25 to 34 Years | 3 (2.1%) | 10 (5.4%) |
| 35 to 44 Years | 10 (7.3%) | 18 (17.6%) |
| 45 to 54 Years | 0 (0.0%) | 0 (0.0%) |
| 55 to 64 Years | 4 (5.3%) | 8 (9.5%) |
| 65 to 74 Years | 1 (2.3%) | 12 (16.9%) |
| 75 Years and over | 5 (8.9%) | 6 (9.5%) |
| Total | 43 (5.2%) | 68 (7.5%) |
Income Above Poverty by Sex and Age in Clearwater
According to the poverty statistics in Clearwater, males aged 5 years and females aged under 5 years are the age groups that are most secure financially, with 100.0% of males and 100.0% of females in these age groups living above the poverty line.
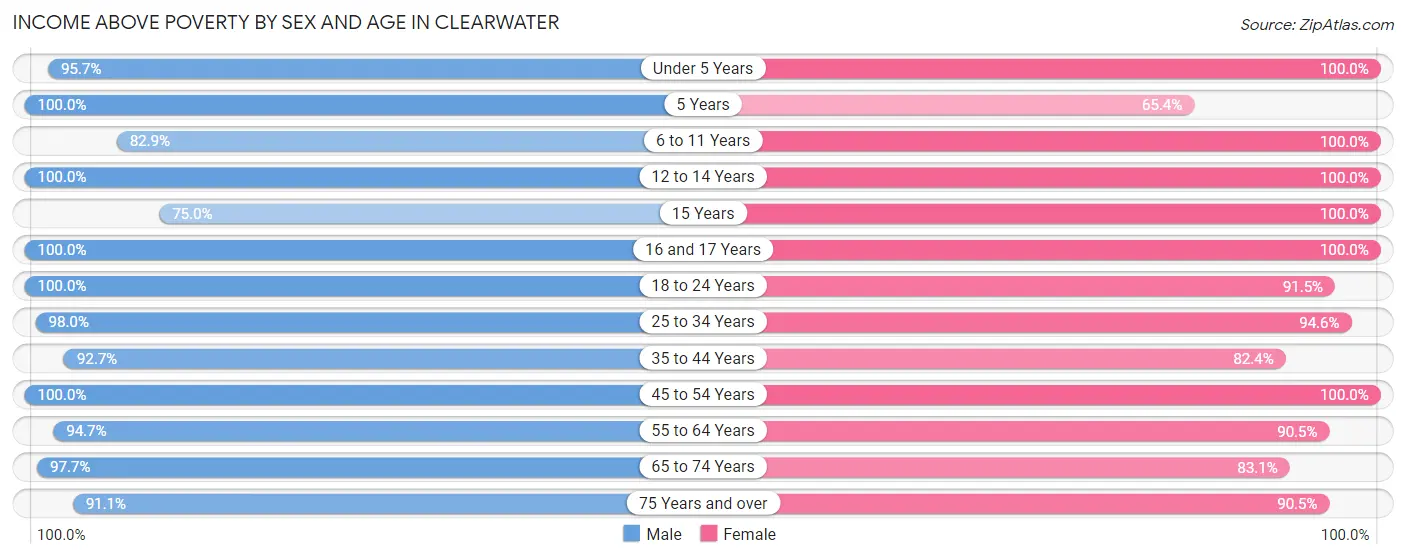
| Age Bracket | Male | Female |
| Under 5 Years | 66 (95.7%) | 69 (100.0%) |
| 5 Years | 36 (100.0%) | 17 (65.4%) |
| 6 to 11 Years | 63 (82.9%) | 86 (100.0%) |
| 12 to 14 Years | 50 (100.0%) | 56 (100.0%) |
| 15 Years | 12 (75.0%) | 9 (100.0%) |
| 16 and 17 Years | 5 (100.0%) | 27 (100.0%) |
| 18 to 24 Years | 42 (100.0%) | 54 (91.5%) |
| 25 to 34 Years | 143 (98.0%) | 174 (94.6%) |
| 35 to 44 Years | 127 (92.7%) | 84 (82.4%) |
| 45 to 54 Years | 70 (100.0%) | 67 (100.0%) |
| 55 to 64 Years | 71 (94.7%) | 76 (90.5%) |
| 65 to 74 Years | 42 (97.7%) | 59 (83.1%) |
| 75 Years and over | 51 (91.1%) | 57 (90.5%) |
| Total | 778 (94.8%) | 835 (92.5%) |
Income Below Poverty Among Married-Couple Families in Clearwater
The poverty statistics for married-couple families in Clearwater show that 1.3% or 4 of the total 316 families live below the poverty line. Families with no children have the highest poverty rate of 2.2%, comprising of 4 families. On the other hand, families with 1 or 2 children have the lowest poverty rate of 0.0%, which includes 0 families.
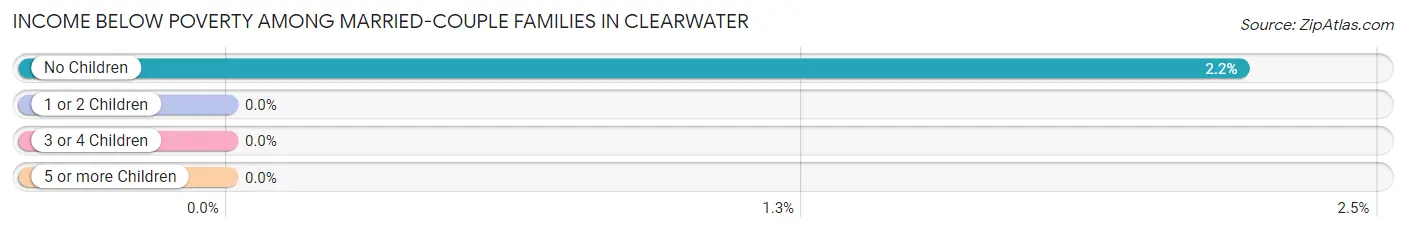
| Children | Above Poverty | Below Poverty |
| No Children | 178 (97.8%) | 4 (2.2%) |
| 1 or 2 Children | 59 (100.0%) | 0 (0.0%) |
| 3 or 4 Children | 75 (100.0%) | 0 (0.0%) |
| 5 or more Children | 0 (0.0%) | 0 (0.0%) |
| Total | 312 (98.7%) | 4 (1.3%) |
Income Below Poverty Among Single-Parent Households in Clearwater
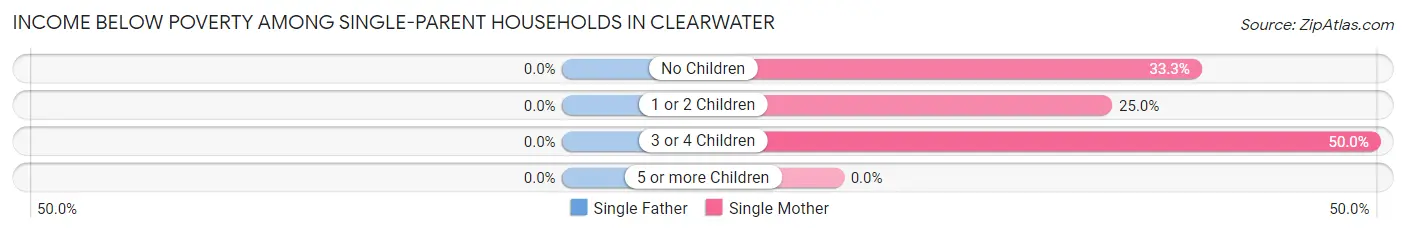
| Children | Single Father | Single Mother |
| No Children | 0 (0.0%) | 4 (33.3%) |
| 1 or 2 Children | 0 (0.0%) | 18 (25.0%) |
| 3 or 4 Children | 0 (0.0%) | 4 (50.0%) |
| 5 or more Children | 0 (0.0%) | 0 (0.0%) |
| Total | 0 (0.0%) | 26 (28.3%) |
Income Below Poverty Among Married-Couple vs Single-Parent Households in Clearwater
The poverty data for Clearwater shows that 4 of the married-couple family households (1.3%) and 26 of the single-parent households (20.8%) are living below the poverty level. Within the married-couple family households, those with no children have the highest poverty rate, with 4 households (2.2%) falling below the poverty line. Among the single-parent households, those with 3 or 4 children have the highest poverty rate, with 4 household (30.8%) living below poverty.
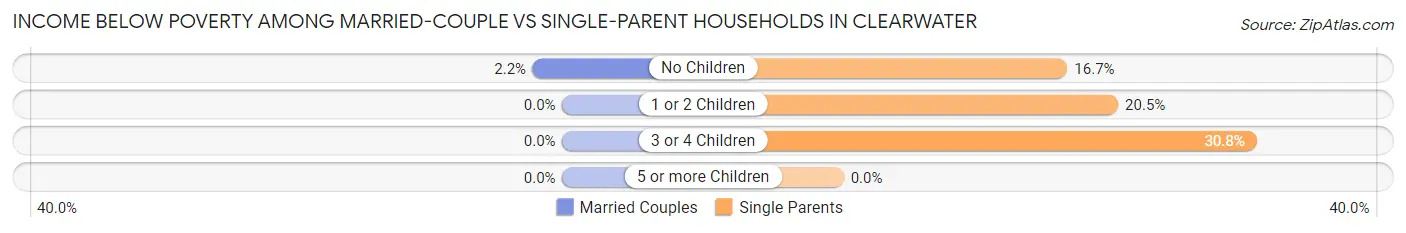
| Children | Married-Couple Families | Single-Parent Households |
| No Children | 4 (2.2%) | 4 (16.7%) |
| 1 or 2 Children | 0 (0.0%) | 18 (20.4%) |
| 3 or 4 Children | 0 (0.0%) | 4 (30.8%) |
| 5 or more Children | 0 (0.0%) | 0 (0.0%) |
| Total | 4 (1.3%) | 26 (20.8%) |
Race in Clearwater
The most populous races in Clearwater are White / Caucasian (1,612 | 93.0%), Two or more Races (80 | 4.6%), and Asian (21 | 1.2%).
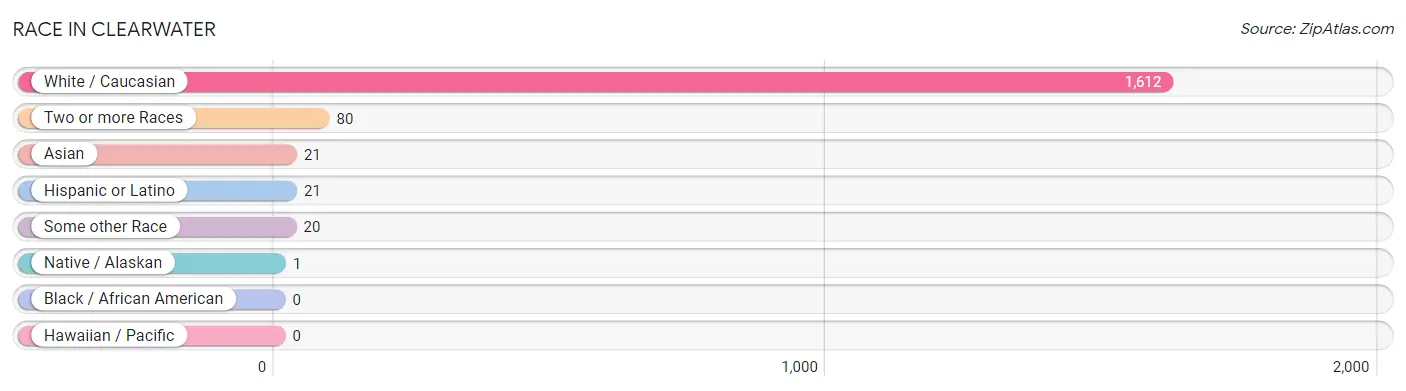
| Race | # Population | % Population |
| Asian | 21 | 1.2% |
| Black / African American | 0 | 0.0% |
| Hawaiian / Pacific | 0 | 0.0% |
| Hispanic or Latino | 21 | 1.2% |
| Native / Alaskan | 1 | 0.1% |
| White / Caucasian | 1,612 | 93.0% |
| Two or more Races | 80 | 4.6% |
| Some other Race | 20 | 1.1% |
| Total | 1,734 | 100.0% |
Ancestry in Clearwater
The most populous ancestries reported in Clearwater are German (698 | 40.3%), Norwegian (180 | 10.4%), Swedish (149 | 8.6%), Irish (93 | 5.4%), and American (89 | 5.1%), together accounting for 69.7% of all Clearwater residents.
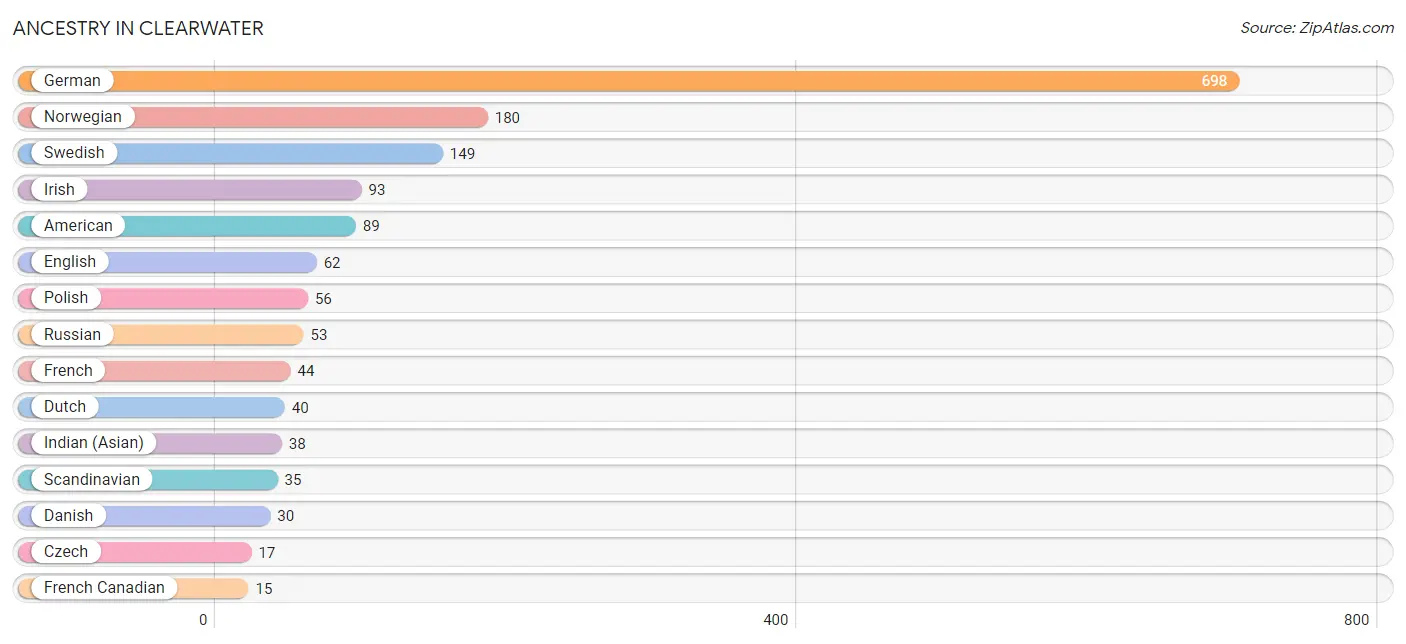
| Ancestry | # Population | % Population |
| American | 89 | 5.1% |
| Austrian | 3 | 0.2% |
| British | 3 | 0.2% |
| Burmese | 1 | 0.1% |
| Cherokee | 9 | 0.5% |
| Chippewa | 1 | 0.1% |
| Cuban | 11 | 0.6% |
| Czech | 17 | 1.0% |
| Czechoslovakian | 2 | 0.1% |
| Danish | 30 | 1.7% |
| Dutch | 40 | 2.3% |
| English | 62 | 3.6% |
| European | 9 | 0.5% |
| Finnish | 11 | 0.6% |
| French | 44 | 2.5% |
| French Canadian | 15 | 0.9% |
| German | 698 | 40.3% |
| Indian (Asian) | 38 | 2.2% |
| Irish | 93 | 5.4% |
| Italian | 12 | 0.7% |
| Japanese | 7 | 0.4% |
| Korean | 12 | 0.7% |
| Mexican | 10 | 0.6% |
| Norwegian | 180 | 10.4% |
| Polish | 56 | 3.2% |
| Russian | 53 | 3.1% |
| Scandinavian | 35 | 2.0% |
| Scotch-Irish | 3 | 0.2% |
| Scottish | 3 | 0.2% |
| Slovak | 13 | 0.7% |
| Swedish | 149 | 8.6% |
| Swiss | 3 | 0.2% |
| Thai | 10 | 0.6% |
| Ukrainian | 3 | 0.2% |
| Yugoslavian | 5 | 0.3% | View All 35 Rows |
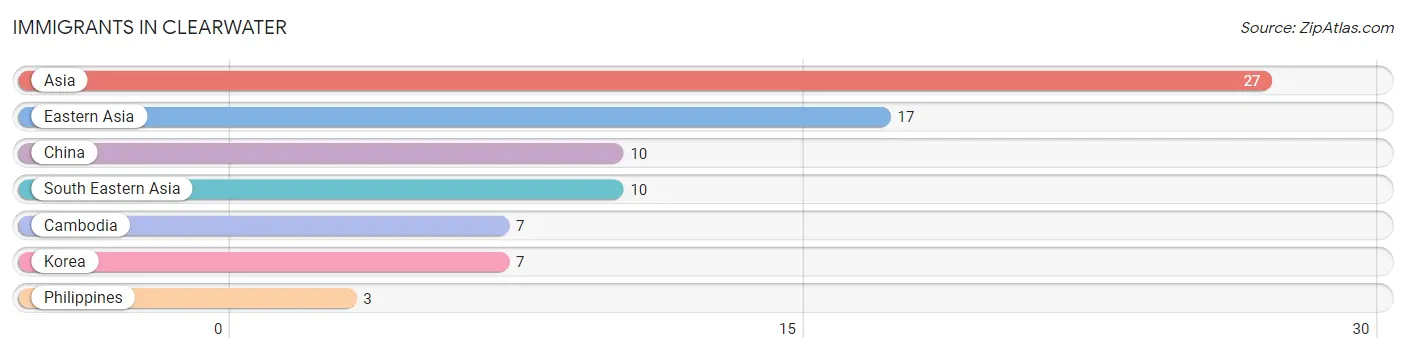
Immigrants in Clearwater
The most numerous immigrant groups reported in Clearwater came from Asia (27 | 1.6%), Eastern Asia (17 | 1.0%), China (10 | 0.6%), South Eastern Asia (10 | 0.6%), and Cambodia (7 | 0.4%), together accounting for 4.1% of all Clearwater residents.
| Immigration Origin | # Population | % Population |
| Asia | 27 | 1.6% |
| Cambodia | 7 | 0.4% |
| China | 10 | 0.6% |
| Eastern Asia | 17 | 1.0% |
| Korea | 7 | 0.4% |
| Philippines | 3 | 0.2% |
| South Eastern Asia | 10 | 0.6% | View All 7 Rows |
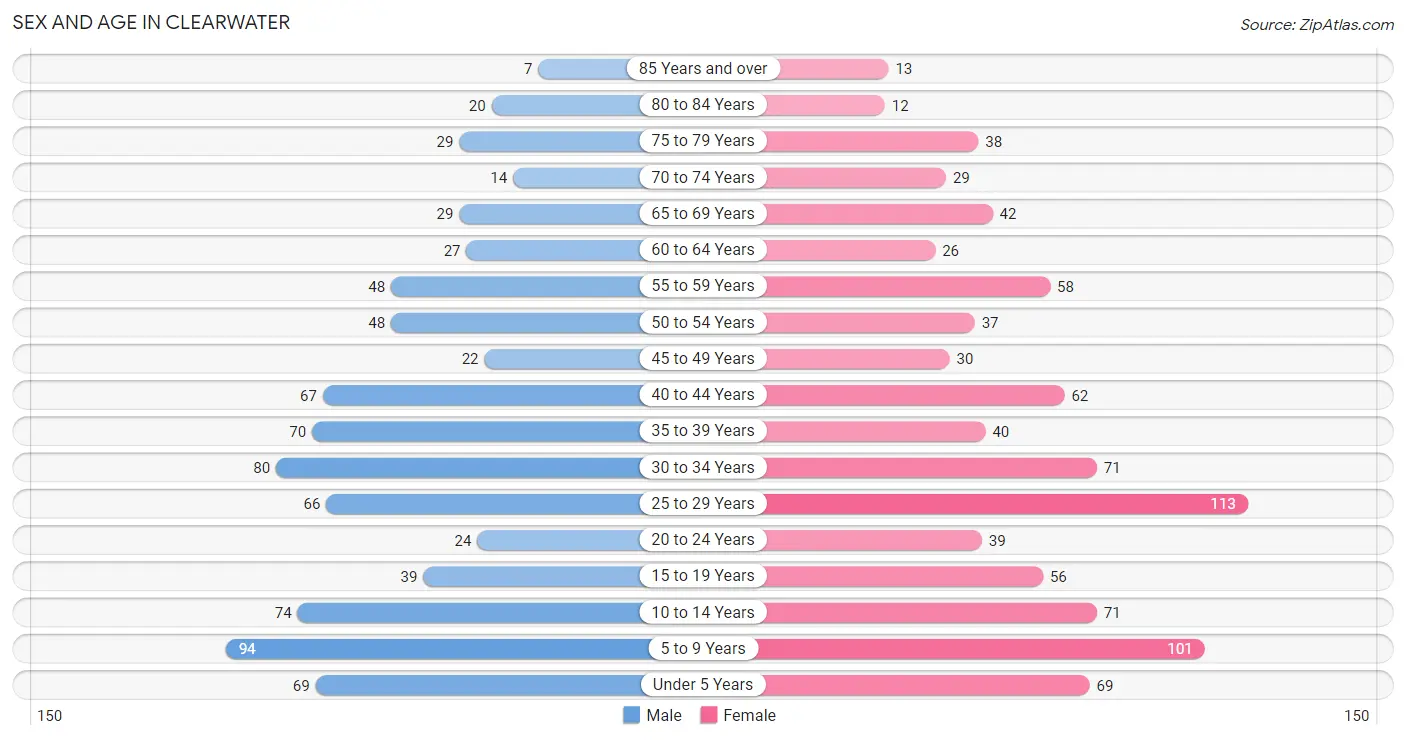
Sex and Age in Clearwater
Sex and Age in Clearwater
The most populous age groups in Clearwater are 5 to 9 Years (94 | 11.4%) for men and 25 to 29 Years (113 | 12.5%) for women.
| Age Bracket | Male | Female |
| Under 5 Years | 69 (8.3%) | 69 (7.6%) |
| 5 to 9 Years | 94 (11.4%) | 101 (11.1%) |
| 10 to 14 Years | 74 (8.9%) | 71 (7.8%) |
| 15 to 19 Years | 39 (4.7%) | 56 (6.2%) |
| 20 to 24 Years | 24 (2.9%) | 39 (4.3%) |
| 25 to 29 Years | 66 (8.0%) | 113 (12.5%) |
| 30 to 34 Years | 80 (9.7%) | 71 (7.8%) |
| 35 to 39 Years | 70 (8.5%) | 40 (4.4%) |
| 40 to 44 Years | 67 (8.1%) | 62 (6.8%) |
| 45 to 49 Years | 22 (2.7%) | 30 (3.3%) |
| 50 to 54 Years | 48 (5.8%) | 37 (4.1%) |
| 55 to 59 Years | 48 (5.8%) | 58 (6.4%) |
| 60 to 64 Years | 27 (3.3%) | 26 (2.9%) |
| 65 to 69 Years | 29 (3.5%) | 42 (4.6%) |
| 70 to 74 Years | 14 (1.7%) | 29 (3.2%) |
| 75 to 79 Years | 29 (3.5%) | 38 (4.2%) |
| 80 to 84 Years | 20 (2.4%) | 12 (1.3%) |
| 85 Years and over | 7 (0.9%) | 13 (1.4%) |
| Total | 827 (100.0%) | 907 (100.0%) |
Families and Households in Clearwater
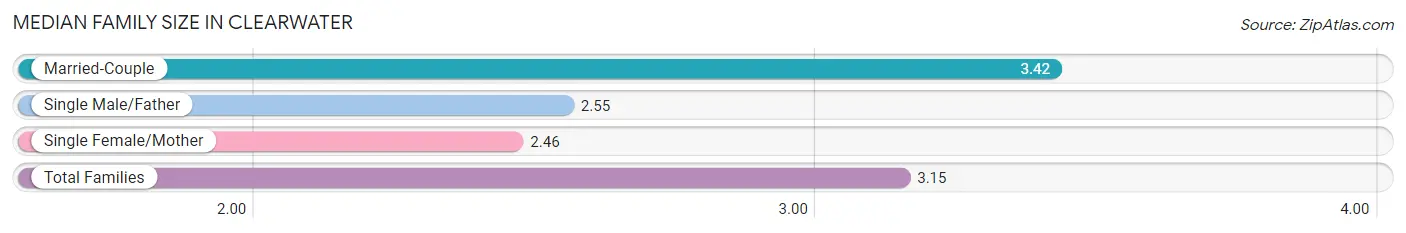
Median Family Size in Clearwater
The median family size in Clearwater is 3.15 persons per family, with married-couple families (316 | 71.7%) accounting for the largest median family size of 3.42 persons per family. On the other hand, single female/mother families (92 | 20.9%) represent the smallest median family size with 2.46 persons per family.
| Family Type | # Families | Family Size |
| Married-Couple | 316 (71.7%) | 3.42 |
| Single Male/Father | 33 (7.5%) | 2.55 |
| Single Female/Mother | 92 (20.9%) | 2.46 |
| Total Families | 441 (100.0%) | 3.15 |
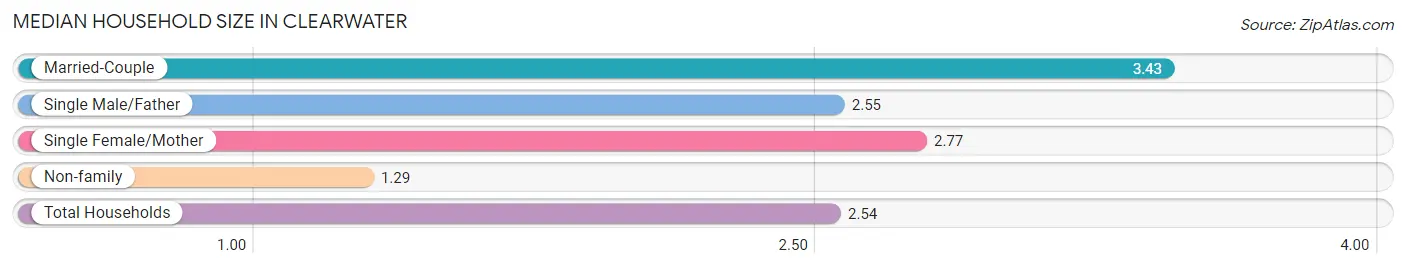
Median Household Size in Clearwater
The median household size in Clearwater is 2.54 persons per household, with married-couple households (316 | 46.3%) accounting for the largest median household size of 3.43 persons per household. non-family households (242 | 35.4%) represent the smallest median household size with 1.29 persons per household.
| Household Type | # Households | Household Size |
| Married-Couple | 316 (46.3%) | 3.43 |
| Single Male/Father | 33 (4.8%) | 2.55 |
| Single Female/Mother | 92 (13.5%) | 2.77 |
| Non-family | 242 (35.4%) | 1.29 |
| Total Households | 683 (100.0%) | 2.54 |
Household Size by Marriage Status in Clearwater
Out of a total of 683 households in Clearwater, 441 (64.6%) are family households, while 242 (35.4%) are nonfamily households. The most numerous type of family households are 2-person households, comprising 186, and the most common type of nonfamily households are 1-person households, comprising 176.
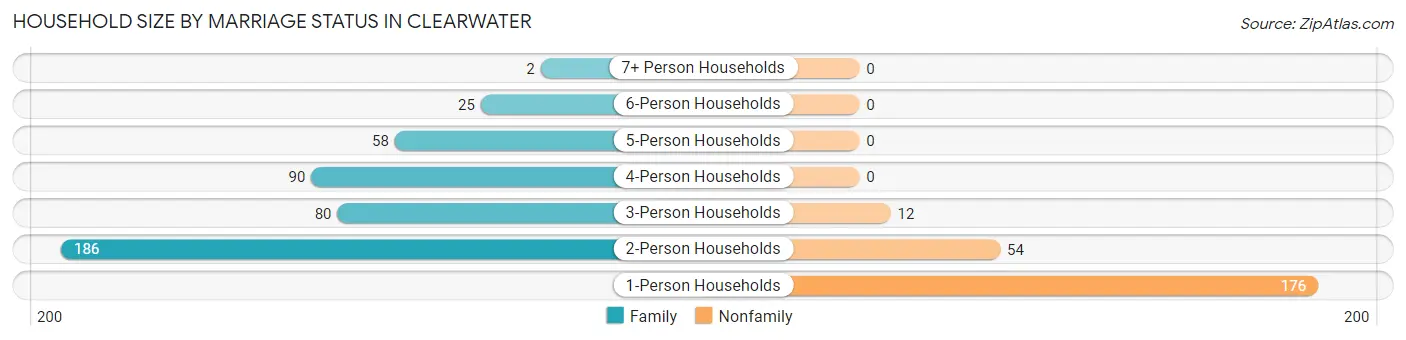
| Household Size | Family Households | Nonfamily Households |
| 1-Person Households | - | 176 (25.8%) |
| 2-Person Households | 186 (27.2%) | 54 (7.9%) |
| 3-Person Households | 80 (11.7%) | 12 (1.8%) |
| 4-Person Households | 90 (13.2%) | 0 (0.0%) |
| 5-Person Households | 58 (8.5%) | 0 (0.0%) |
| 6-Person Households | 25 (3.7%) | 0 (0.0%) |
| 7+ Person Households | 2 (0.3%) | 0 (0.0%) |
| Total | 441 (64.6%) | 242 (35.4%) |
Female Fertility in Clearwater
Fertility by Age in Clearwater
Average fertility rate in Clearwater is 85.0 births per 1,000 women. Women in the age bracket of 15 to 19 years have the highest fertility rate with 161.0 births per 1,000 women. Women in the age bracket of 20 to 34 years acount for 68.6% of all women with births.
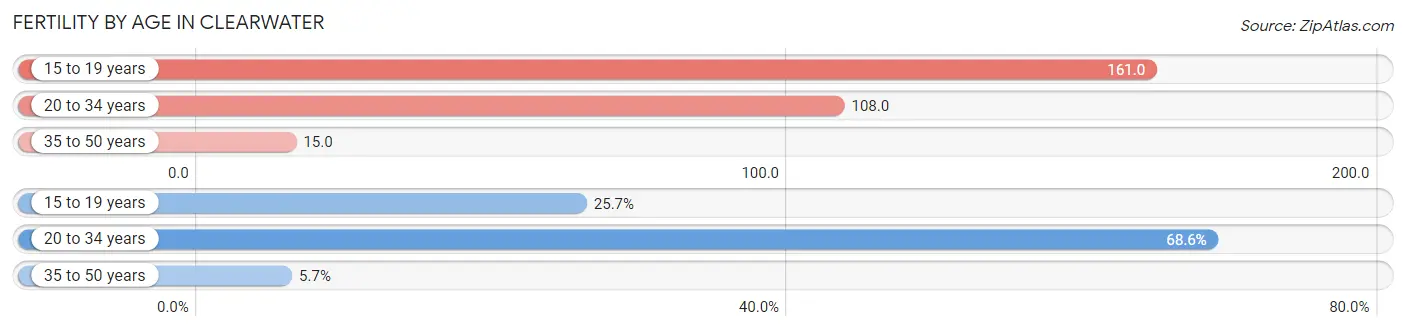
| Age Bracket | Women with Births | Births / 1,000 Women |
| 15 to 19 years | 9 (25.7%) | 161.0 |
| 20 to 34 years | 24 (68.6%) | 108.0 |
| 35 to 50 years | 2 (5.7%) | 15.0 |
| Total | 35 (100.0%) | 85.0 |
Fertility by Age by Marriage Status in Clearwater
45.7% of women with births (35) in Clearwater are married. The highest percentage of unmarried women with births falls into 15 to 19 years age bracket with 100.0% of them unmarried at the time of birth, while the lowest percentage of unmarried women with births belong to 35 to 50 years age bracket with 0.0% of them unmarried.
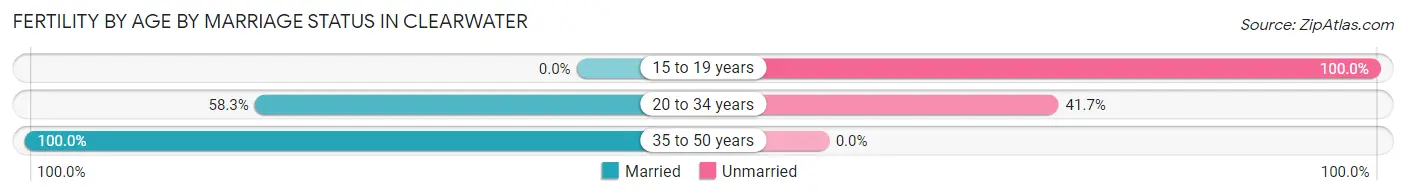
| Age Bracket | Married | Unmarried |
| 15 to 19 years | 0 (0.0%) | 9 (100.0%) |
| 20 to 34 years | 14 (58.3%) | 10 (41.7%) |
| 35 to 50 years | 2 (100.0%) | 0 (0.0%) |
| Total | 16 (45.7%) | 19 (54.3%) |
Fertility by Education in Clearwater
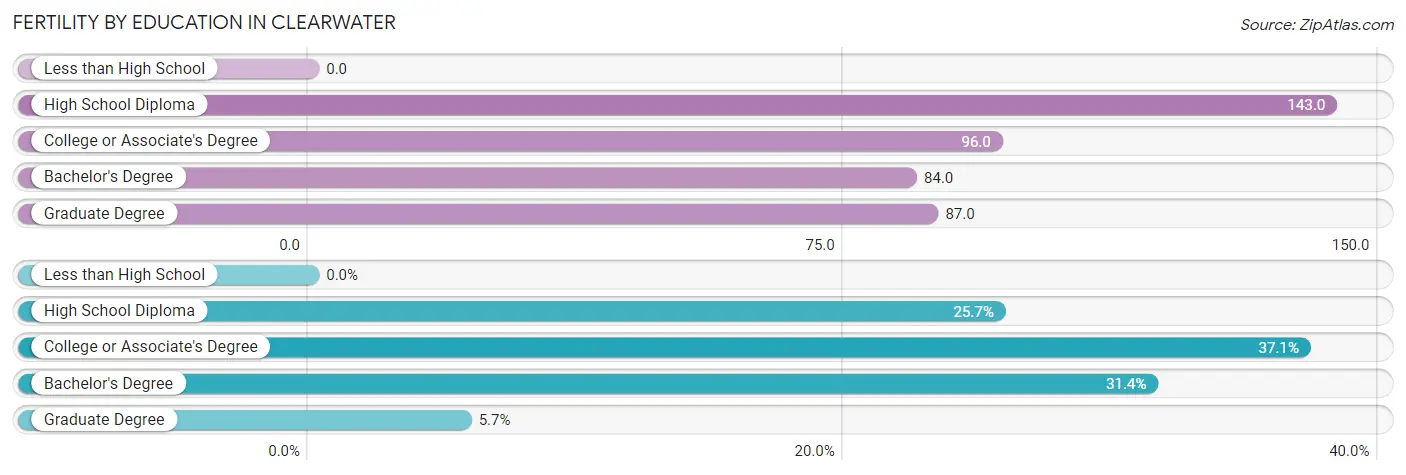
| Educational Attainment | Women with Births | Births / 1,000 Women |
| Less than High School | 0 (0.0%) | 0.0 |
| High School Diploma | 9 (25.7%) | 143.0 |
| College or Associate's Degree | 13 (37.1%) | 96.0 |
| Bachelor's Degree | 11 (31.4%) | 84.0 |
| Graduate Degree | 2 (5.7%) | 87.0 |
| Total | 35 (100.0%) | 85.0 |
Fertility by Education by Marriage Status in Clearwater
54.3% of women with births in Clearwater are unmarried. Women with the educational attainment of bachelor's degree are most likely to be married with 100.0% of them married at childbirth, while women with the educational attainment of high school diploma are least likely to be married with 100.0% of them unmarried at childbirth.
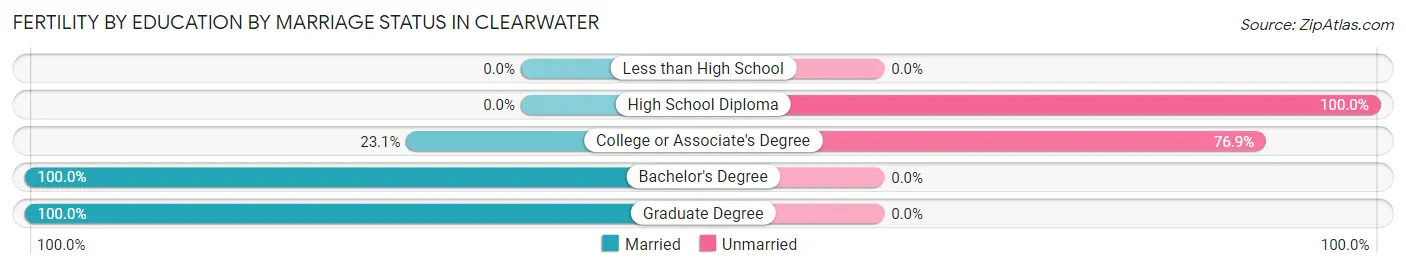
| Educational Attainment | Married | Unmarried |
| Less than High School | 0 (0.0%) | 0 (0.0%) |
| High School Diploma | 0 (0.0%) | 9 (100.0%) |
| College or Associate's Degree | 3 (23.1%) | 10 (76.9%) |
| Bachelor's Degree | 11 (100.0%) | 0 (0.0%) |
| Graduate Degree | 2 (100.0%) | 0 (0.0%) |
| Total | 16 (45.7%) | 19 (54.3%) |
Employment Characteristics in Clearwater
Employment by Class of Employer in Clearwater
Among the 898 employed individuals in Clearwater, private company employees (687 | 76.5%), not-for-profit organizations (72 | 8.0%), and local government employees (57 | 6.4%) make up the most common classes of employment.
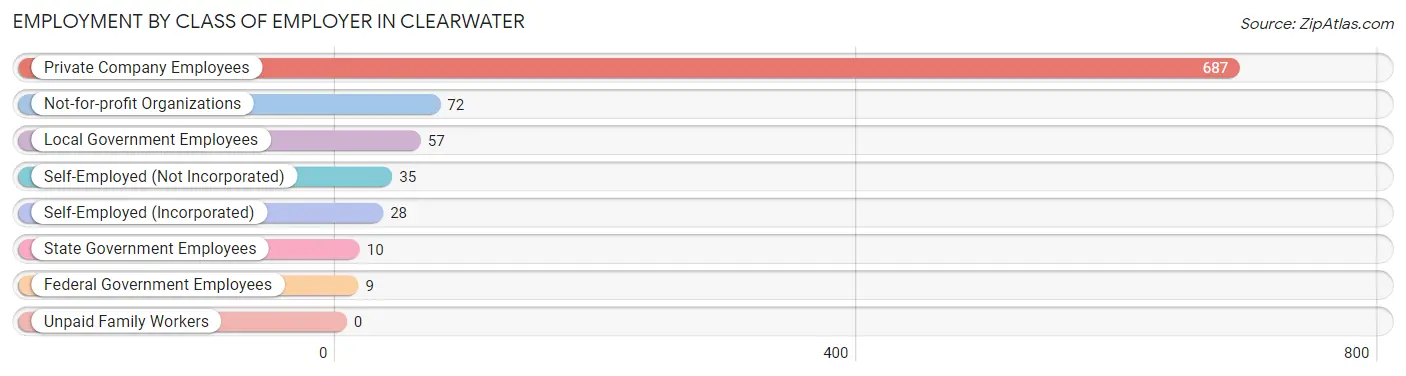
| Employer Class | # Employees | % Employees |
| Private Company Employees | 687 | 76.5% |
| Self-Employed (Incorporated) | 28 | 3.1% |
| Self-Employed (Not Incorporated) | 35 | 3.9% |
| Not-for-profit Organizations | 72 | 8.0% |
| Local Government Employees | 57 | 6.4% |
| State Government Employees | 10 | 1.1% |
| Federal Government Employees | 9 | 1.0% |
| Unpaid Family Workers | 0 | 0.0% |
| Total | 898 | 100.0% |
Employment Status by Age in Clearwater
According to the labor force statistics for Clearwater, out of the total population over 16 years of age (1,231), 76.4% or 940 individuals are in the labor force, with 3.6% or 34 of them unemployed. The age group with the highest labor force participation rate is 45 to 54 years, with 95.6% or 131 individuals in the labor force. Within the labor force, the 35 to 44 years age range has the highest percentage of unemployed individuals, with 8.1% or 18 of them being unemployed.
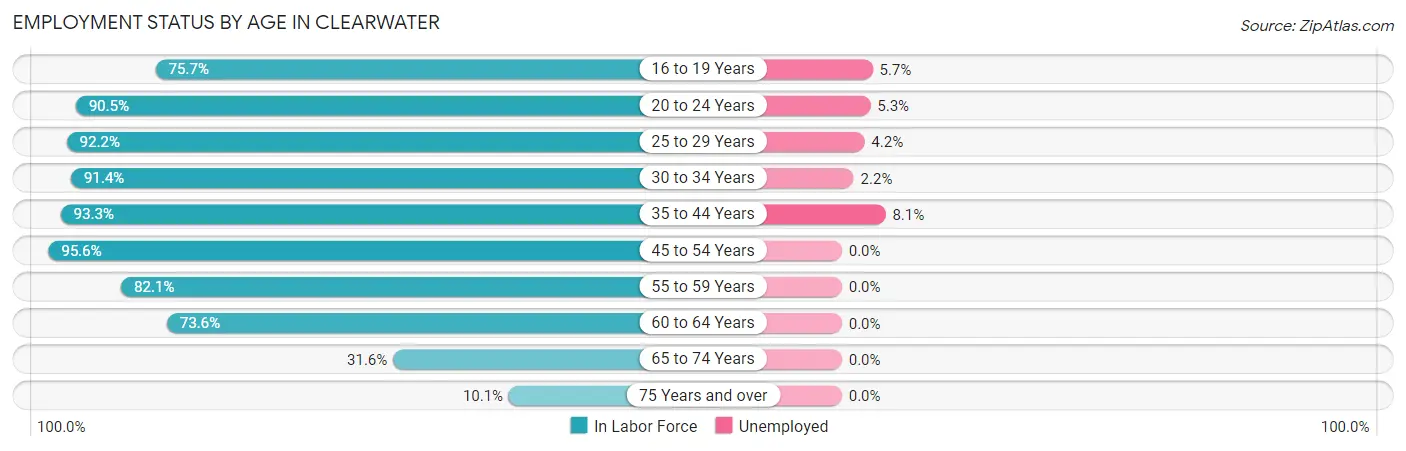
| Age Bracket | In Labor Force | Unemployed |
| 16 to 19 Years | 53 (75.7%) | 3 (5.7%) |
| 20 to 24 Years | 57 (90.5%) | 3 (5.3%) |
| 25 to 29 Years | 165 (92.2%) | 7 (4.2%) |
| 30 to 34 Years | 138 (91.4%) | 3 (2.2%) |
| 35 to 44 Years | 223 (93.3%) | 18 (8.1%) |
| 45 to 54 Years | 131 (95.6%) | 0 (0.0%) |
| 55 to 59 Years | 87 (82.1%) | 0 (0.0%) |
| 60 to 64 Years | 39 (73.6%) | 0 (0.0%) |
| 65 to 74 Years | 36 (31.6%) | 0 (0.0%) |
| 75 Years and over | 12 (10.1%) | 0 (0.0%) |
| Total | 940 (76.4%) | 34 (3.6%) |
Employment Status by Educational Attainment in Clearwater
According to labor force statistics for Clearwater, 90.5% of individuals (783) out of the total population between 25 and 64 years of age (865) are in the labor force, with 3.6% or 28 of them being unemployed. The group with the highest labor force participation rate are those with the educational attainment of less than high school, with 100.0% or 57 individuals in the labor force. Within the labor force, individuals with college / associate degree education have the highest percentage of unemployment, with 5.5% or 15 of them being unemployed.
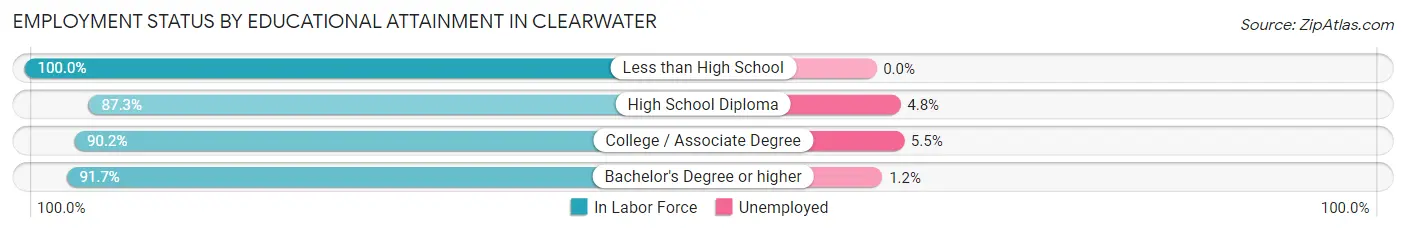
| Educational Attainment | In Labor Force | Unemployed |
| Less than High School | 57 (100.0%) | 0 (0.0%) |
| High School Diploma | 207 (87.3%) | 11 (4.8%) |
| College / Associate Degree | 275 (90.2%) | 17 (5.5%) |
| Bachelor's Degree or higher | 244 (91.7%) | 3 (1.2%) |
| Total | 783 (90.5%) | 31 (3.6%) |
Employment Occupations by Sex in Clearwater
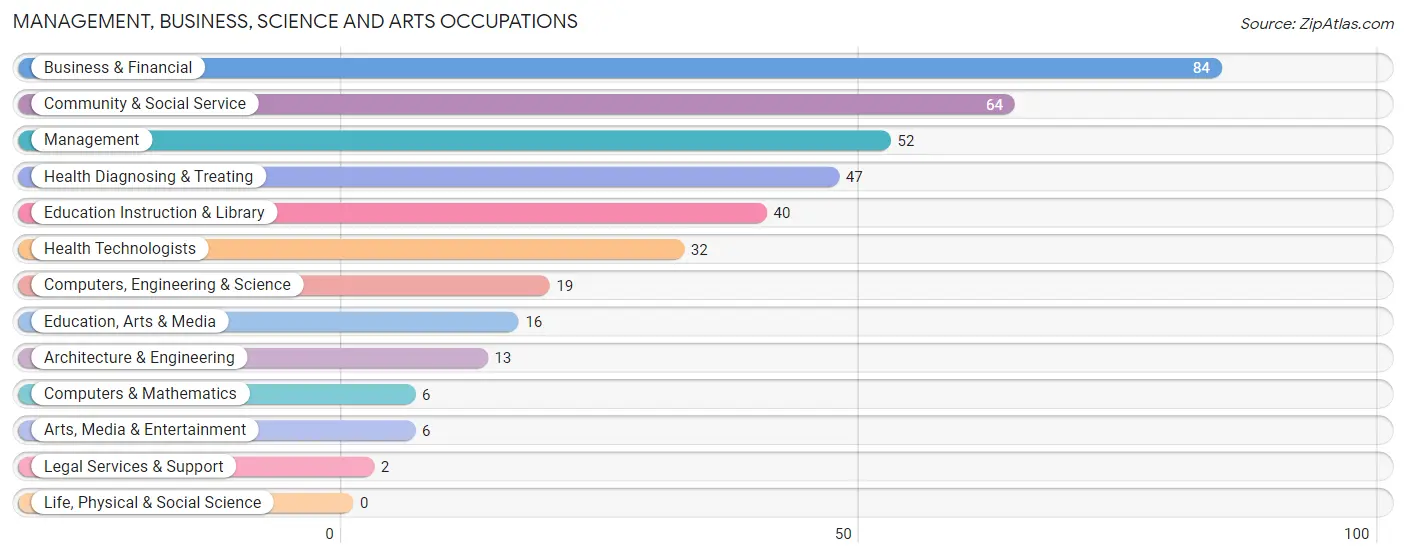
Management, Business, Science and Arts Occupations
The most common Management, Business, Science and Arts occupations in Clearwater are Business & Financial (84 | 9.3%), Community & Social Service (64 | 7.1%), Management (52 | 5.7%), Health Diagnosing & Treating (47 | 5.2%), and Education Instruction & Library (40 | 4.4%).
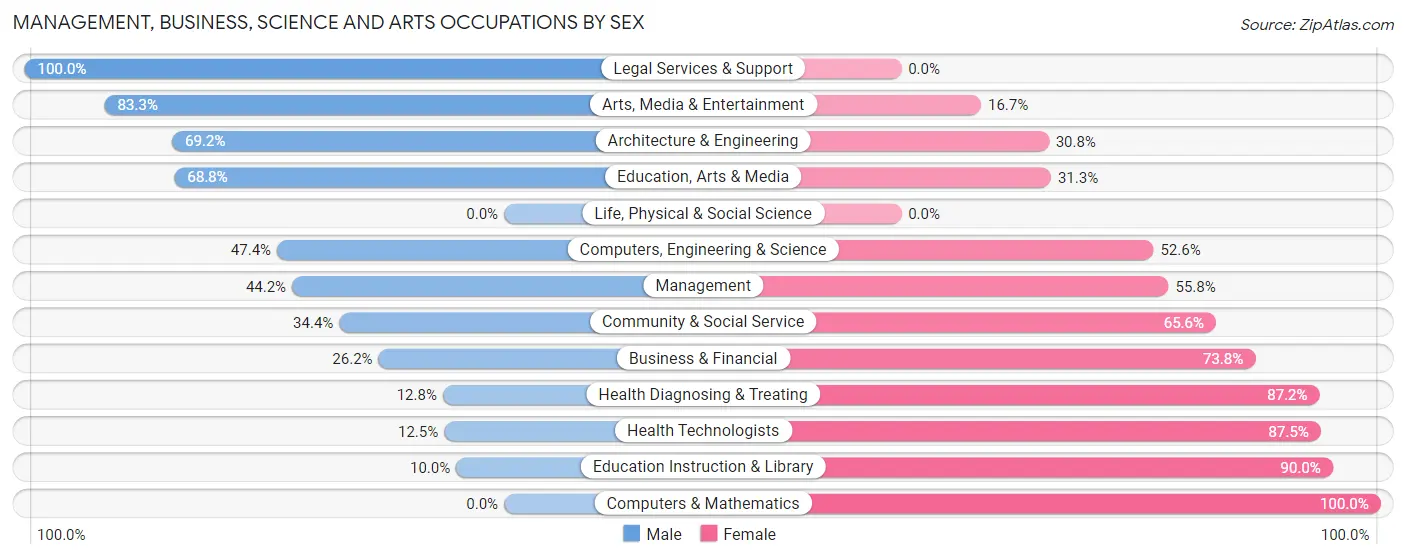
Management, Business, Science and Arts Occupations by Sex
Within the Management, Business, Science and Arts occupations in Clearwater, the most male-oriented occupations are Legal Services & Support (100.0%), Arts, Media & Entertainment (83.3%), and Architecture & Engineering (69.2%), while the most female-oriented occupations are Computers & Mathematics (100.0%), Education Instruction & Library (90.0%), and Health Technologists (87.5%).
| Occupation | Male | Female |
| Management | 23 (44.2%) | 29 (55.8%) |
| Business & Financial | 22 (26.2%) | 62 (73.8%) |
| Computers, Engineering & Science | 9 (47.4%) | 10 (52.6%) |
| Computers & Mathematics | 0 (0.0%) | 6 (100.0%) |
| Architecture & Engineering | 9 (69.2%) | 4 (30.8%) |
| Life, Physical & Social Science | 0 (0.0%) | 0 (0.0%) |
| Community & Social Service | 22 (34.4%) | 42 (65.6%) |
| Education, Arts & Media | 11 (68.8%) | 5 (31.2%) |
| Legal Services & Support | 2 (100.0%) | 0 (0.0%) |
| Education Instruction & Library | 4 (10.0%) | 36 (90.0%) |
| Arts, Media & Entertainment | 5 (83.3%) | 1 (16.7%) |
| Health Diagnosing & Treating | 6 (12.8%) | 41 (87.2%) |
| Health Technologists | 4 (12.5%) | 28 (87.5%) |
| Total (Category) | 82 (30.8%) | 184 (69.2%) |
| Total (Overall) | 434 (47.8%) | 473 (52.1%) |
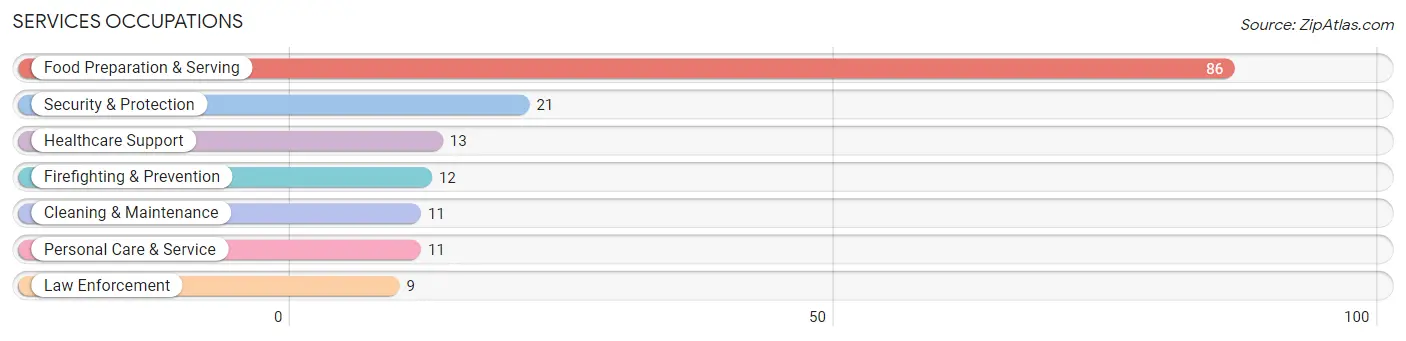
Services Occupations
The most common Services occupations in Clearwater are Food Preparation & Serving (86 | 9.5%), Security & Protection (21 | 2.3%), Healthcare Support (13 | 1.4%), Firefighting & Prevention (12 | 1.3%), and Cleaning & Maintenance (11 | 1.2%).
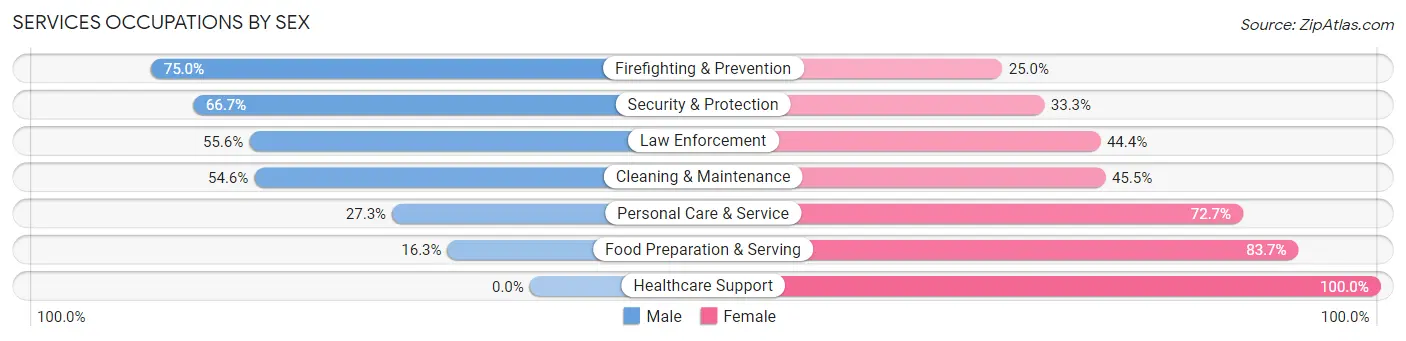
Services Occupations by Sex
Within the Services occupations in Clearwater, the most male-oriented occupations are Firefighting & Prevention (75.0%), Security & Protection (66.7%), and Law Enforcement (55.6%), while the most female-oriented occupations are Healthcare Support (100.0%), Food Preparation & Serving (83.7%), and Personal Care & Service (72.7%).
| Occupation | Male | Female |
| Healthcare Support | 0 (0.0%) | 13 (100.0%) |
| Security & Protection | 14 (66.7%) | 7 (33.3%) |
| Firefighting & Prevention | 9 (75.0%) | 3 (25.0%) |
| Law Enforcement | 5 (55.6%) | 4 (44.4%) |
| Food Preparation & Serving | 14 (16.3%) | 72 (83.7%) |
| Cleaning & Maintenance | 6 (54.5%) | 5 (45.5%) |
| Personal Care & Service | 3 (27.3%) | 8 (72.7%) |
| Total (Category) | 37 (26.1%) | 105 (73.9%) |
| Total (Overall) | 434 (47.8%) | 473 (52.1%) |
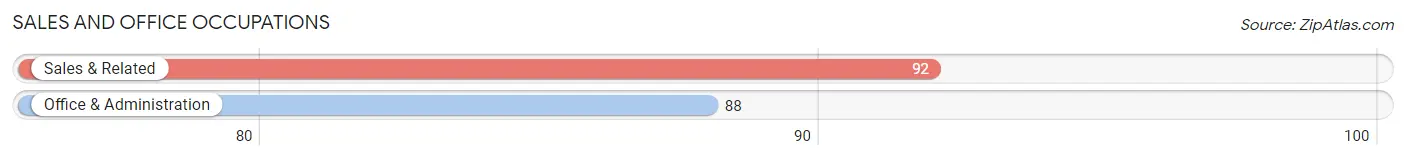
Sales and Office Occupations
The most common Sales and Office occupations in Clearwater are Sales & Related (92 | 10.1%), and Office & Administration (88 | 9.7%).
Sales and Office Occupations by Sex
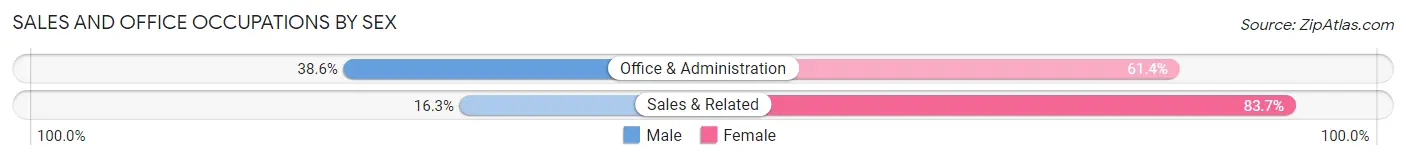
| Occupation | Male | Female |
| Sales & Related | 15 (16.3%) | 77 (83.7%) |
| Office & Administration | 34 (38.6%) | 54 (61.4%) |
| Total (Category) | 49 (27.2%) | 131 (72.8%) |
| Total (Overall) | 434 (47.8%) | 473 (52.1%) |
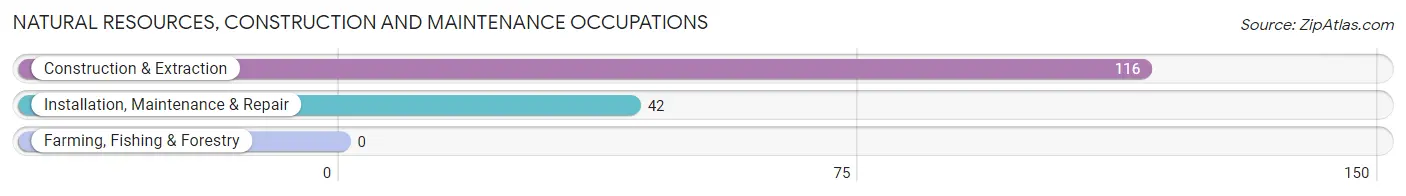
Natural Resources, Construction and Maintenance Occupations
The most common Natural Resources, Construction and Maintenance occupations in Clearwater are Construction & Extraction (116 | 12.8%), and Installation, Maintenance & Repair (42 | 4.6%).
Natural Resources, Construction and Maintenance Occupations by Sex
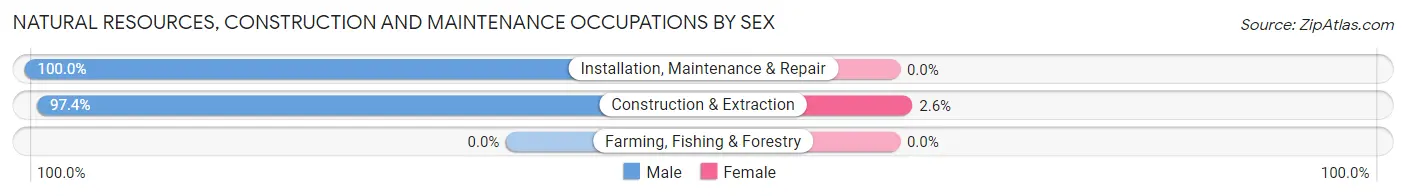
| Occupation | Male | Female |
| Farming, Fishing & Forestry | 0 (0.0%) | 0 (0.0%) |
| Construction & Extraction | 113 (97.4%) | 3 (2.6%) |
| Installation, Maintenance & Repair | 42 (100.0%) | 0 (0.0%) |
| Total (Category) | 155 (98.1%) | 3 (1.9%) |
| Total (Overall) | 434 (47.8%) | 473 (52.1%) |
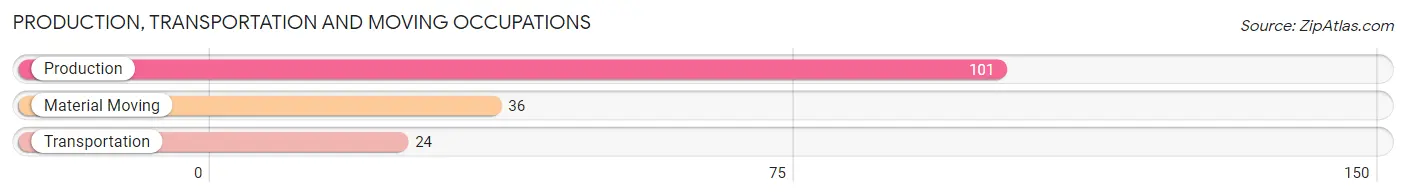
Production, Transportation and Moving Occupations
The most common Production, Transportation and Moving occupations in Clearwater are Production (101 | 11.1%), Material Moving (36 | 4.0%), and Transportation (24 | 2.6%).
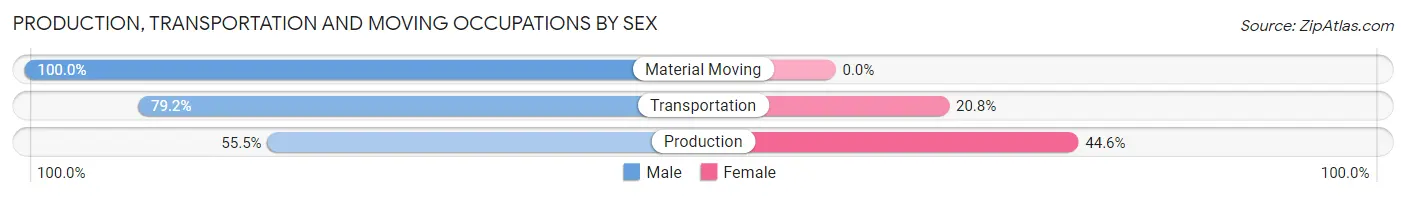
Production, Transportation and Moving Occupations by Sex
| Occupation | Male | Female |
| Production | 56 (55.4%) | 45 (44.6%) |
| Transportation | 19 (79.2%) | 5 (20.8%) |
| Material Moving | 36 (100.0%) | 0 (0.0%) |
| Total (Category) | 111 (68.9%) | 50 (31.1%) |
| Total (Overall) | 434 (47.8%) | 473 (52.1%) |
Employment Industries by Sex in Clearwater
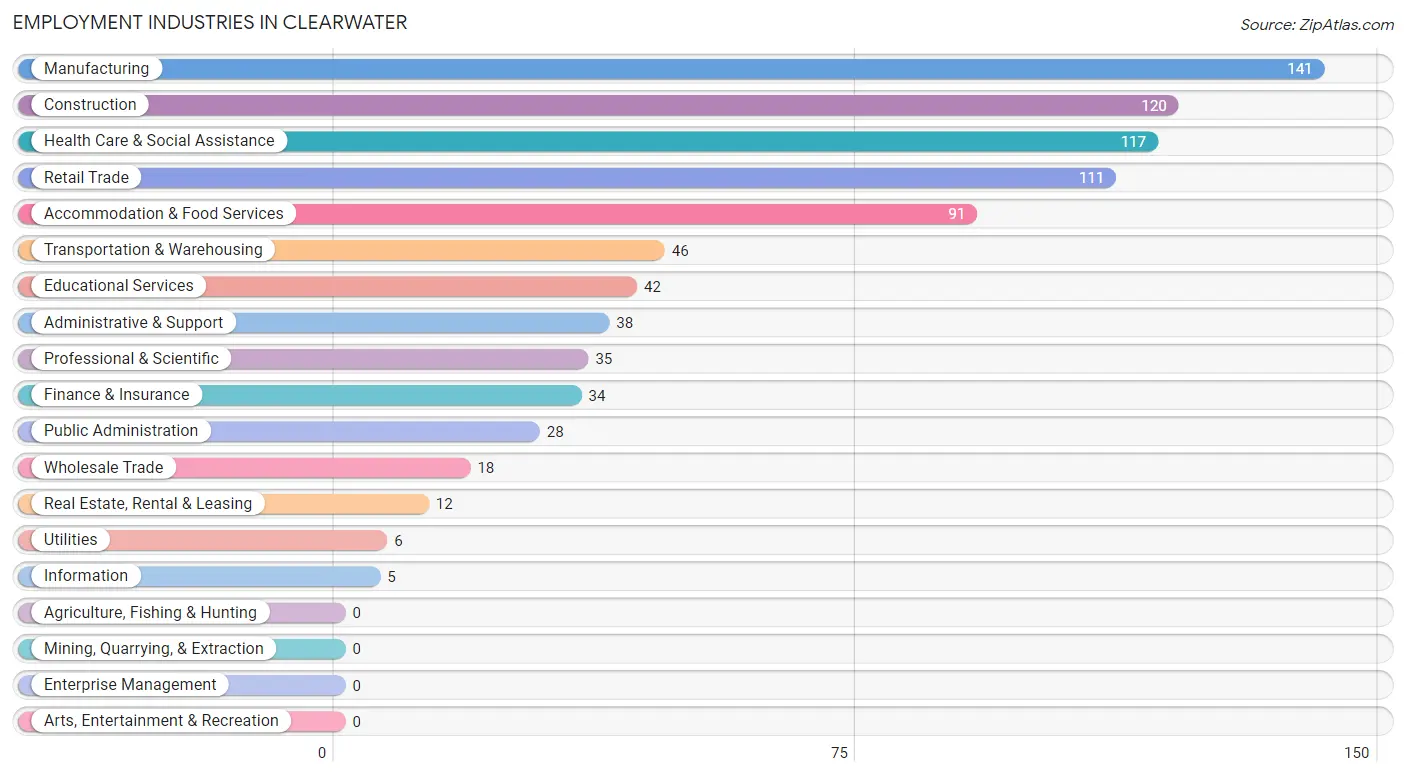
Employment Industries in Clearwater
The major employment industries in Clearwater include Manufacturing (141 | 15.5%), Construction (120 | 13.2%), Health Care & Social Assistance (117 | 12.9%), Retail Trade (111 | 12.2%), and Accommodation & Food Services (91 | 10.0%).
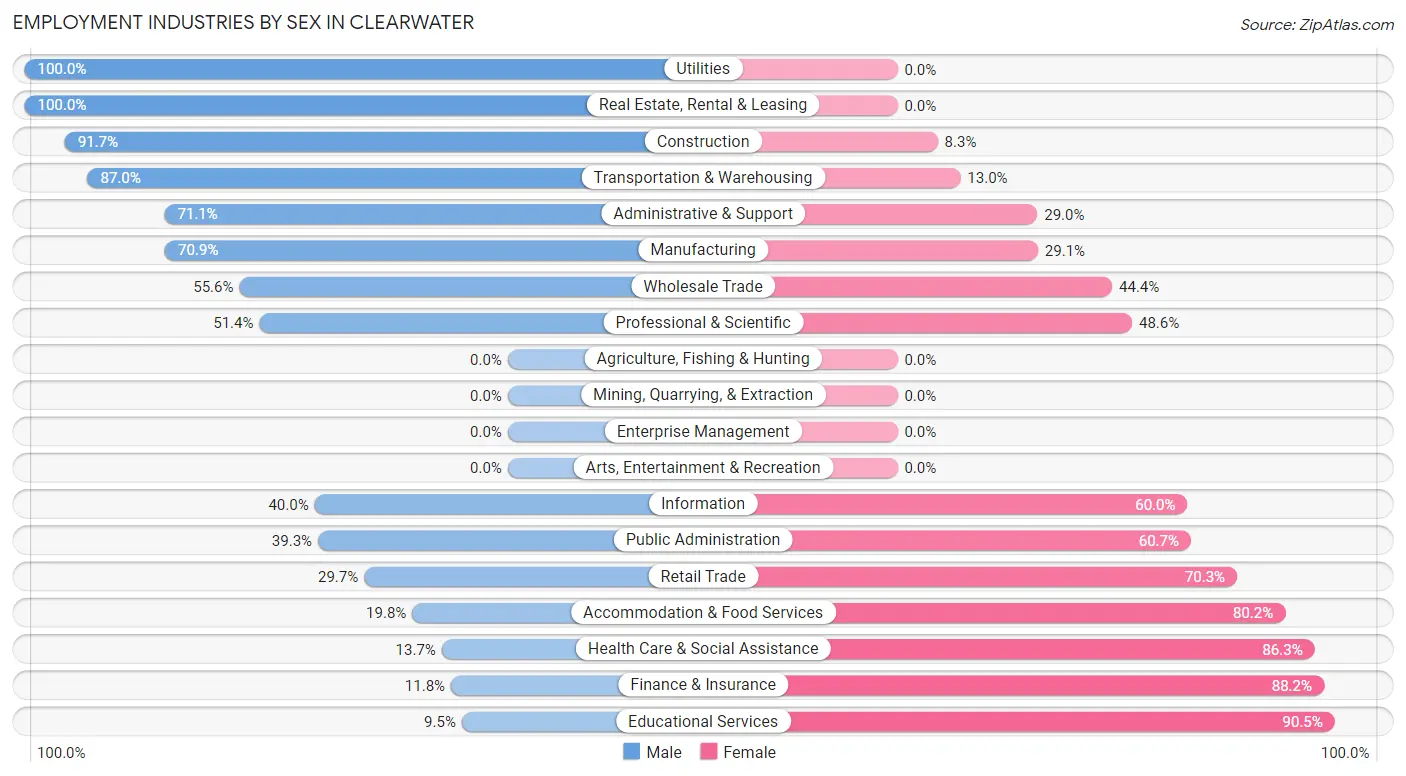
Employment Industries by Sex in Clearwater
The Clearwater industries that see more men than women are Utilities (100.0%), Real Estate, Rental & Leasing (100.0%), and Construction (91.7%), whereas the industries that tend to have a higher number of women are Educational Services (90.5%), Finance & Insurance (88.2%), and Health Care & Social Assistance (86.3%).
| Industry | Male | Female |
| Agriculture, Fishing & Hunting | 0 (0.0%) | 0 (0.0%) |
| Mining, Quarrying, & Extraction | 0 (0.0%) | 0 (0.0%) |
| Construction | 110 (91.7%) | 10 (8.3%) |
| Manufacturing | 100 (70.9%) | 41 (29.1%) |
| Wholesale Trade | 10 (55.6%) | 8 (44.4%) |
| Retail Trade | 33 (29.7%) | 78 (70.3%) |
| Transportation & Warehousing | 40 (87.0%) | 6 (13.0%) |
| Utilities | 6 (100.0%) | 0 (0.0%) |
| Information | 2 (40.0%) | 3 (60.0%) |
| Finance & Insurance | 4 (11.8%) | 30 (88.2%) |
| Real Estate, Rental & Leasing | 12 (100.0%) | 0 (0.0%) |
| Professional & Scientific | 18 (51.4%) | 17 (48.6%) |
| Enterprise Management | 0 (0.0%) | 0 (0.0%) |
| Administrative & Support | 27 (71.1%) | 11 (28.9%) |
| Educational Services | 4 (9.5%) | 38 (90.5%) |
| Health Care & Social Assistance | 16 (13.7%) | 101 (86.3%) |
| Arts, Entertainment & Recreation | 0 (0.0%) | 0 (0.0%) |
| Accommodation & Food Services | 18 (19.8%) | 73 (80.2%) |
| Public Administration | 11 (39.3%) | 17 (60.7%) |
| Total | 434 (47.8%) | 473 (52.1%) |
Education in Clearwater
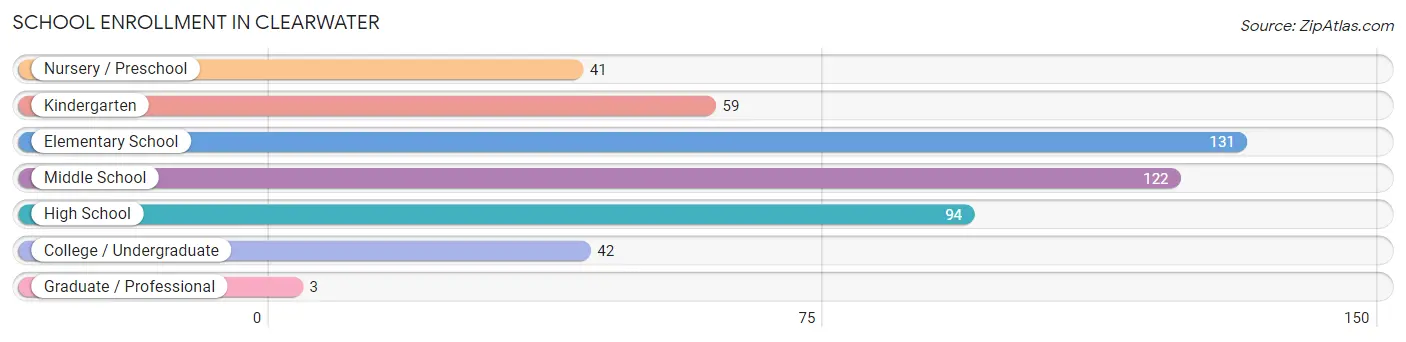
School Enrollment in Clearwater
The most common levels of schooling among the 492 students in Clearwater are elementary school (131 | 26.6%), middle school (122 | 24.8%), and high school (94 | 19.1%).
| School Level | # Students | % Students |
| Nursery / Preschool | 41 | 8.3% |
| Kindergarten | 59 | 12.0% |
| Elementary School | 131 | 26.6% |
| Middle School | 122 | 24.8% |
| High School | 94 | 19.1% |
| College / Undergraduate | 42 | 8.5% |
| Graduate / Professional | 3 | 0.6% |
| Total | 492 | 100.0% |
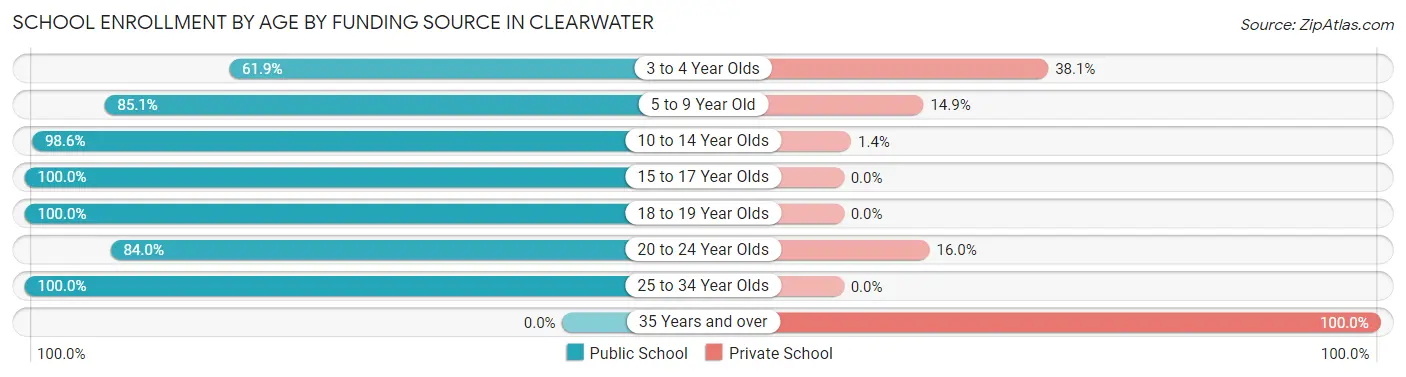
School Enrollment by Age by Funding Source in Clearwater
Out of a total of 492 students who are enrolled in schools in Clearwater, 46 (9.3%) attend a private institution, while the remaining 446 (90.7%) are enrolled in public schools. The age group of 35 years and over has the highest likelihood of being enrolled in private schools, with 3 (100.0% in the age bracket) enrolled. Conversely, the age group of 15 to 17 year olds has the lowest likelihood of being enrolled in a private school, with 57 (100.0% in the age bracket) attending a public institution.
| Age Bracket | Public School | Private School |
| 3 to 4 Year Olds | 13 (61.9%) | 8 (38.1%) |
| 5 to 9 Year Old | 166 (85.1%) | 29 (14.9%) |
| 10 to 14 Year Olds | 143 (98.6%) | 2 (1.4%) |
| 15 to 17 Year Olds | 57 (100.0%) | 0 (0.0%) |
| 18 to 19 Year Olds | 32 (100.0%) | 0 (0.0%) |
| 20 to 24 Year Olds | 21 (84.0%) | 4 (16.0%) |
| 25 to 34 Year Olds | 14 (100.0%) | 0 (0.0%) |
| 35 Years and over | 0 (0.0%) | 3 (100.0%) |
| Total | 446 (90.7%) | 46 (9.3%) |
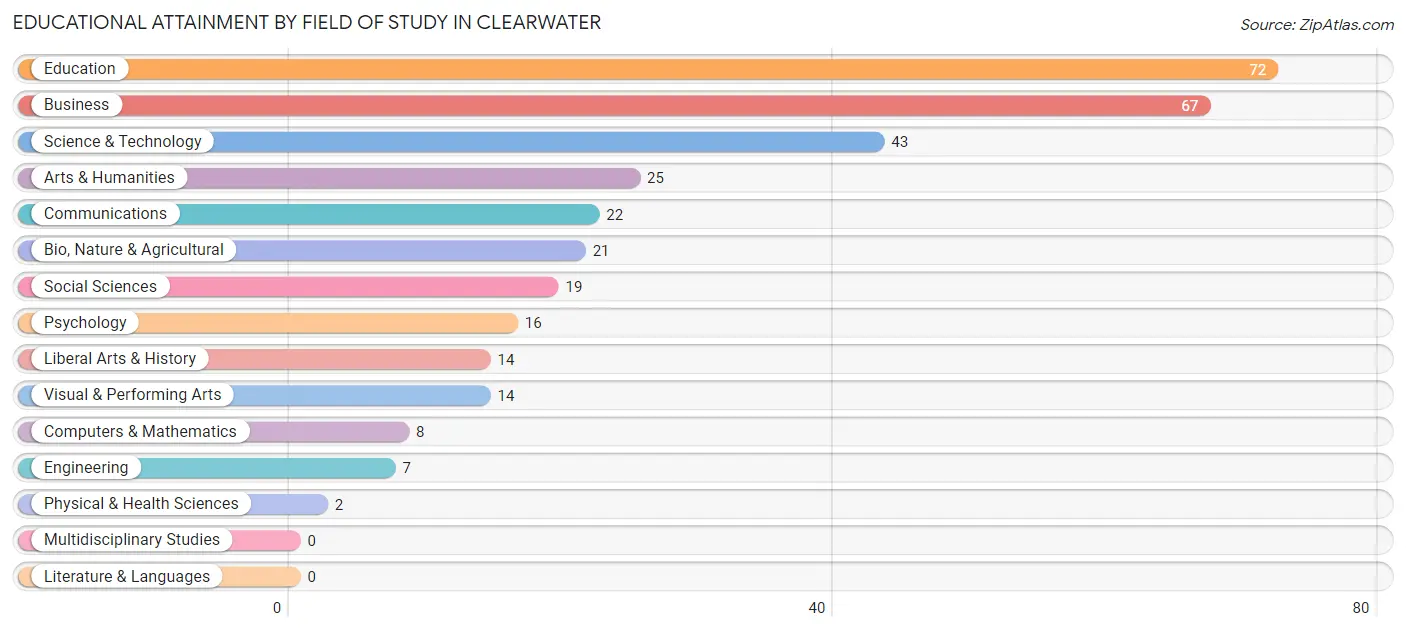
Educational Attainment by Field of Study in Clearwater
Education (72 | 21.8%), business (67 | 20.3%), science & technology (43 | 13.0%), arts & humanities (25 | 7.6%), and communications (22 | 6.7%) are the most common fields of study among 330 individuals in Clearwater who have obtained a bachelor's degree or higher.
| Field of Study | # Graduates | % Graduates |
| Computers & Mathematics | 8 | 2.4% |
| Bio, Nature & Agricultural | 21 | 6.4% |
| Physical & Health Sciences | 2 | 0.6% |
| Psychology | 16 | 4.9% |
| Social Sciences | 19 | 5.8% |
| Engineering | 7 | 2.1% |
| Multidisciplinary Studies | 0 | 0.0% |
| Science & Technology | 43 | 13.0% |
| Business | 67 | 20.3% |
| Education | 72 | 21.8% |
| Literature & Languages | 0 | 0.0% |
| Liberal Arts & History | 14 | 4.2% |
| Visual & Performing Arts | 14 | 4.2% |
| Communications | 22 | 6.7% |
| Arts & Humanities | 25 | 7.6% |
| Total | 330 | 100.0% |
Transportation & Commute in Clearwater
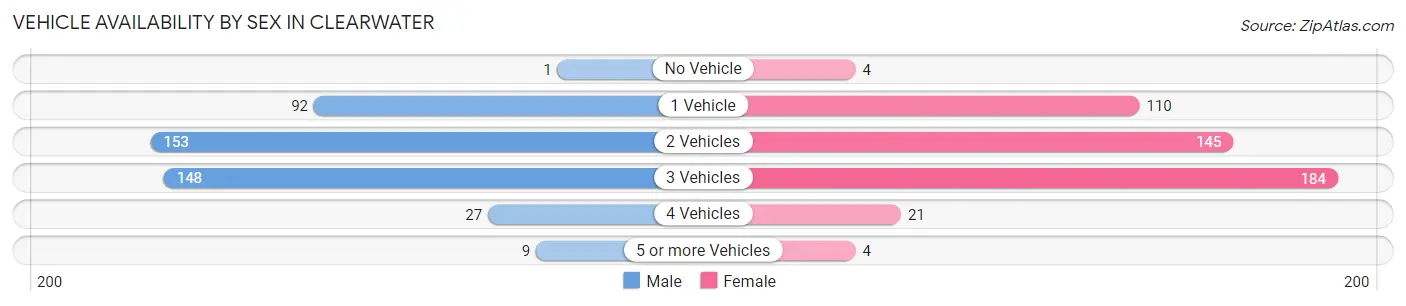
Vehicle Availability by Sex in Clearwater
The most prevalent vehicle ownership categories in Clearwater are males with 2 vehicles (153, accounting for 35.6%) and females with 2 vehicles (145, making up 32.7%).
| Vehicles Available | Male | Female |
| No Vehicle | 1 (0.2%) | 4 (0.9%) |
| 1 Vehicle | 92 (21.4%) | 110 (23.5%) |
| 2 Vehicles | 153 (35.6%) | 145 (31.0%) |
| 3 Vehicles | 148 (34.4%) | 184 (39.3%) |
| 4 Vehicles | 27 (6.3%) | 21 (4.5%) |
| 5 or more Vehicles | 9 (2.1%) | 4 (0.9%) |
| Total | 430 (100.0%) | 468 (100.0%) |
Commute Time in Clearwater
The most frequently occuring commute durations in Clearwater are 20 to 24 minutes (176 commuters, 20.8%), 60 to 89 minutes (120 commuters, 14.2%), and 5 to 9 minutes (91 commuters, 10.8%).
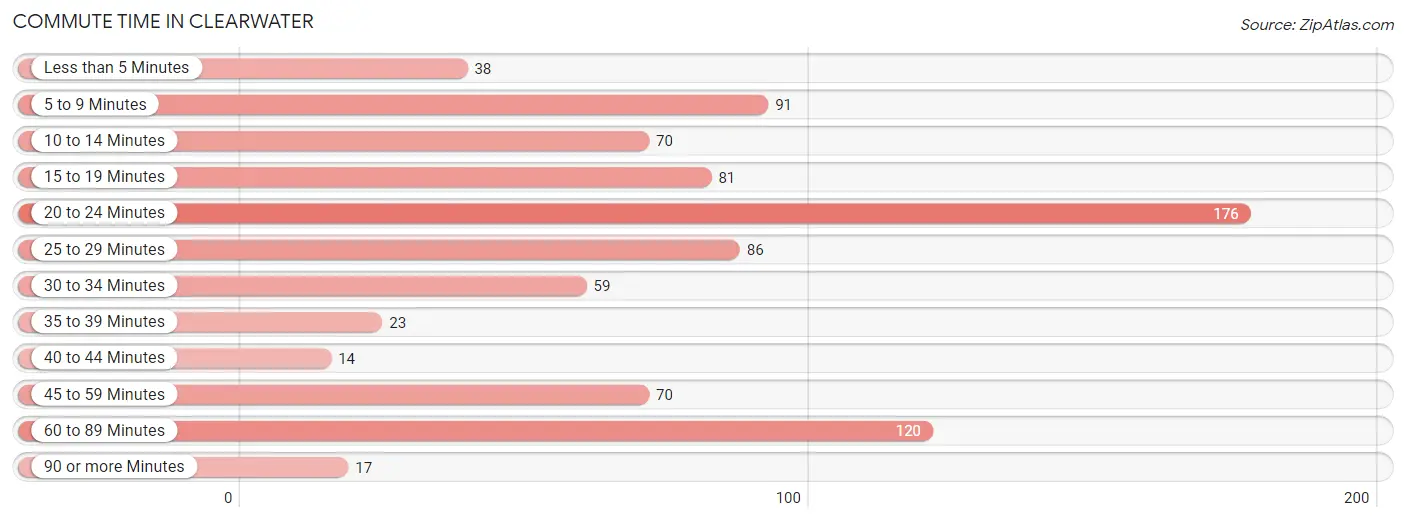
| Commute Time | # Commuters | % Commuters |
| Less than 5 Minutes | 38 | 4.5% |
| 5 to 9 Minutes | 91 | 10.8% |
| 10 to 14 Minutes | 70 | 8.3% |
| 15 to 19 Minutes | 81 | 9.6% |
| 20 to 24 Minutes | 176 | 20.8% |
| 25 to 29 Minutes | 86 | 10.2% |
| 30 to 34 Minutes | 59 | 7.0% |
| 35 to 39 Minutes | 23 | 2.7% |
| 40 to 44 Minutes | 14 | 1.7% |
| 45 to 59 Minutes | 70 | 8.3% |
| 60 to 89 Minutes | 120 | 14.2% |
| 90 or more Minutes | 17 | 2.0% |
Commute Time by Sex in Clearwater
The most common commute times in Clearwater are 60 to 89 minutes (95 commuters, 22.5%) for males and 20 to 24 minutes (126 commuters, 29.8%) for females.
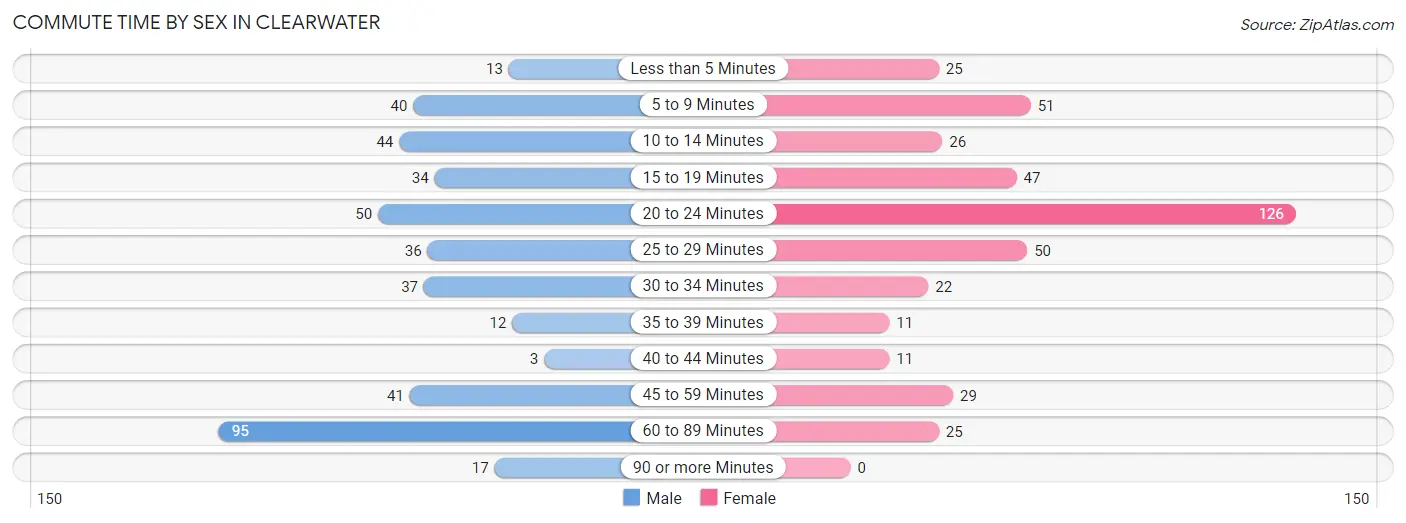
| Commute Time | Male | Female |
| Less than 5 Minutes | 13 (3.1%) | 25 (5.9%) |
| 5 to 9 Minutes | 40 (9.5%) | 51 (12.1%) |
| 10 to 14 Minutes | 44 (10.4%) | 26 (6.1%) |
| 15 to 19 Minutes | 34 (8.1%) | 47 (11.1%) |
| 20 to 24 Minutes | 50 (11.8%) | 126 (29.8%) |
| 25 to 29 Minutes | 36 (8.5%) | 50 (11.8%) |
| 30 to 34 Minutes | 37 (8.8%) | 22 (5.2%) |
| 35 to 39 Minutes | 12 (2.8%) | 11 (2.6%) |
| 40 to 44 Minutes | 3 (0.7%) | 11 (2.6%) |
| 45 to 59 Minutes | 41 (9.7%) | 29 (6.9%) |
| 60 to 89 Minutes | 95 (22.5%) | 25 (5.9%) |
| 90 or more Minutes | 17 (4.0%) | 0 (0.0%) |
Time of Departure to Work by Sex in Clearwater
The most frequent times of departure to work in Clearwater are 5:00 AM to 5:29 AM (83, 19.7%) for males and 7:00 AM to 7:29 AM (104, 24.6%) for females.
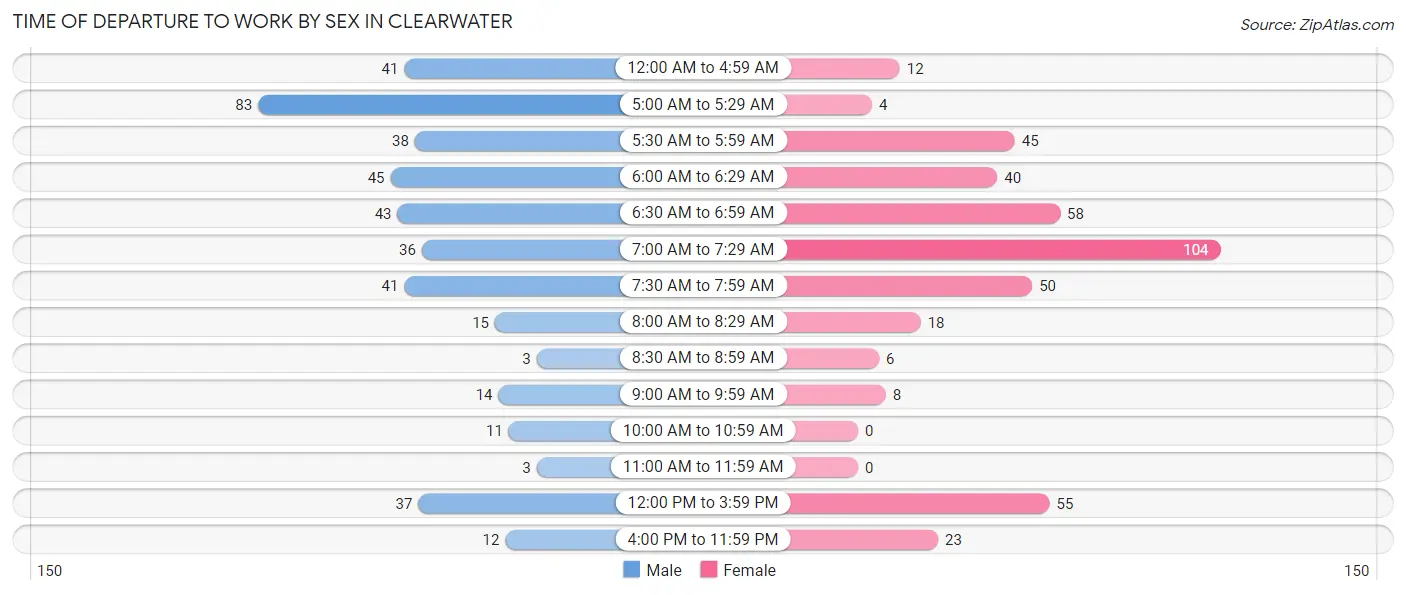
| Time of Departure | Male | Female |
| 12:00 AM to 4:59 AM | 41 (9.7%) | 12 (2.8%) |
| 5:00 AM to 5:29 AM | 83 (19.7%) | 4 (0.9%) |
| 5:30 AM to 5:59 AM | 38 (9.0%) | 45 (10.6%) |
| 6:00 AM to 6:29 AM | 45 (10.7%) | 40 (9.5%) |
| 6:30 AM to 6:59 AM | 43 (10.2%) | 58 (13.7%) |
| 7:00 AM to 7:29 AM | 36 (8.5%) | 104 (24.6%) |
| 7:30 AM to 7:59 AM | 41 (9.7%) | 50 (11.8%) |
| 8:00 AM to 8:29 AM | 15 (3.5%) | 18 (4.3%) |
| 8:30 AM to 8:59 AM | 3 (0.7%) | 6 (1.4%) |
| 9:00 AM to 9:59 AM | 14 (3.3%) | 8 (1.9%) |
| 10:00 AM to 10:59 AM | 11 (2.6%) | 0 (0.0%) |
| 11:00 AM to 11:59 AM | 3 (0.7%) | 0 (0.0%) |
| 12:00 PM to 3:59 PM | 37 (8.8%) | 55 (13.0%) |
| 4:00 PM to 11:59 PM | 12 (2.8%) | 23 (5.4%) |
| Total | 422 (100.0%) | 423 (100.0%) |
Housing Occupancy in Clearwater
Occupancy by Ownership in Clearwater
Of the total 683 dwellings in Clearwater, owner-occupied units account for 447 (65.4%), while renter-occupied units make up 236 (34.5%).
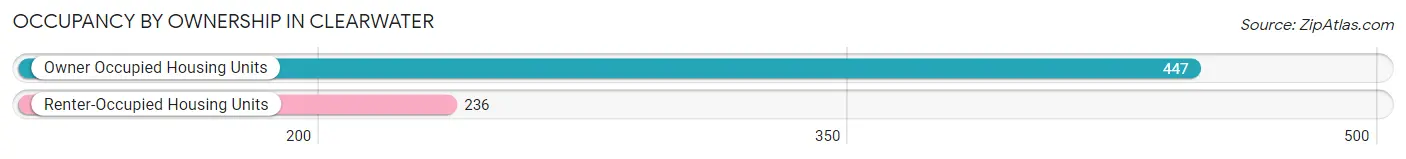
| Occupancy | # Housing Units | % Housing Units |
| Owner Occupied Housing Units | 447 | 65.4% |
| Renter-Occupied Housing Units | 236 | 34.5% |
| Total Occupied Housing Units | 683 | 100.0% |
Occupancy by Household Size in Clearwater
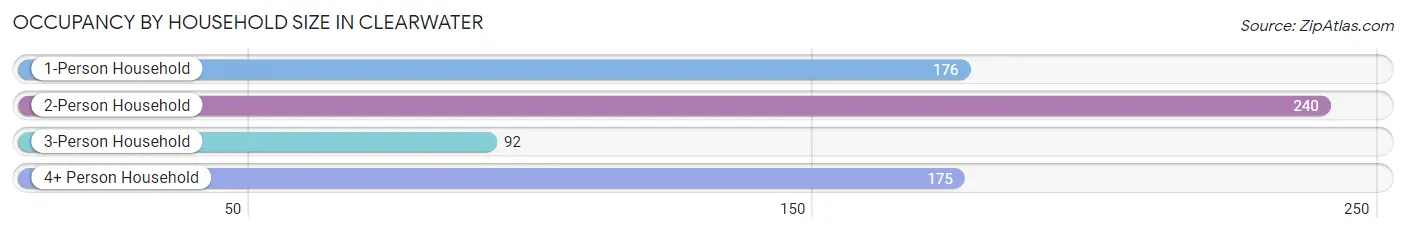
| Household Size | # Housing Units | % Housing Units |
| 1-Person Household | 176 | 25.8% |
| 2-Person Household | 240 | 35.1% |
| 3-Person Household | 92 | 13.5% |
| 4+ Person Household | 175 | 25.6% |
| Total Housing Units | 683 | 100.0% |
Occupancy by Ownership by Household Size in Clearwater
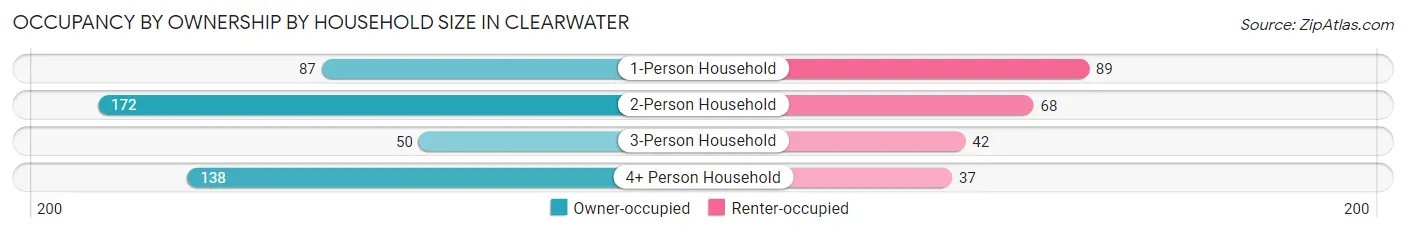
| Household Size | Owner-occupied | Renter-occupied |
| 1-Person Household | 87 (49.4%) | 89 (50.6%) |
| 2-Person Household | 172 (71.7%) | 68 (28.3%) |
| 3-Person Household | 50 (54.3%) | 42 (45.7%) |
| 4+ Person Household | 138 (78.9%) | 37 (21.1%) |
| Total Housing Units | 447 (65.4%) | 236 (34.5%) |
Occupancy by Educational Attainment in Clearwater
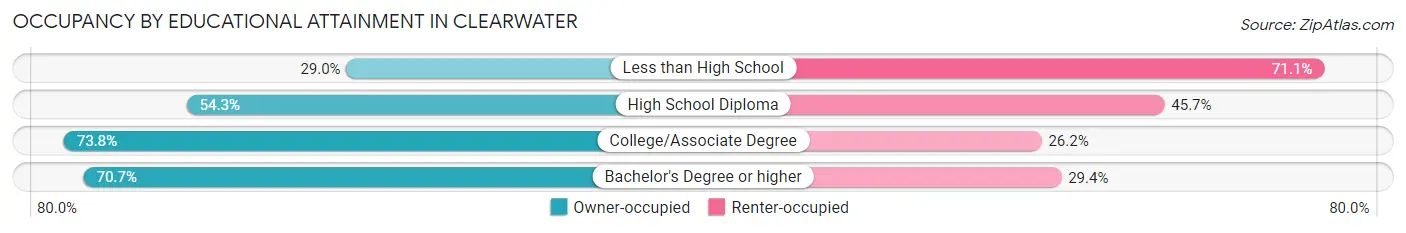
| Household Size | Owner-occupied | Renter-occupied |
| Less than High School | 11 (28.9%) | 27 (71.1%) |
| High School Diploma | 95 (54.3%) | 80 (45.7%) |
| College/Associate Degree | 211 (73.8%) | 75 (26.2%) |
| Bachelor's Degree or higher | 130 (70.7%) | 54 (29.3%) |
Occupancy by Age of Householder in Clearwater
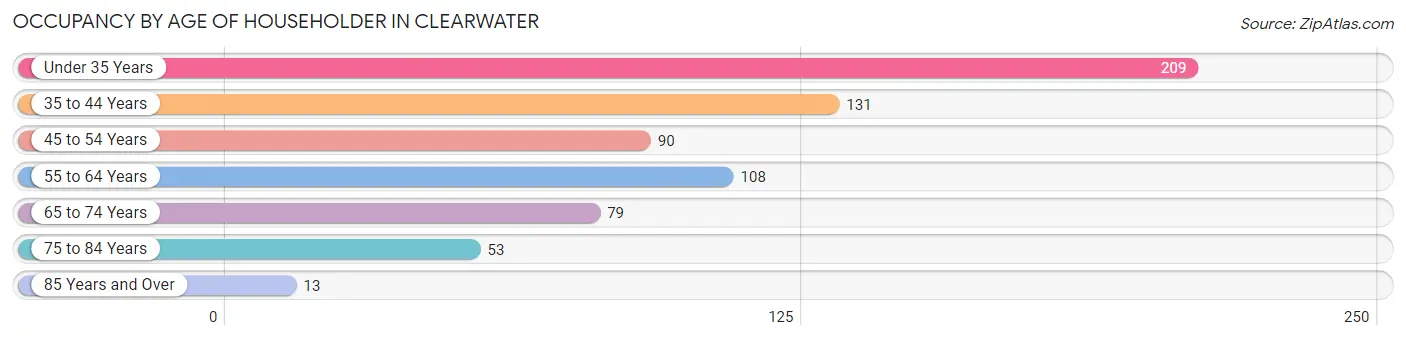
| Age Bracket | # Households | % Households |
| Under 35 Years | 209 | 30.6% |
| 35 to 44 Years | 131 | 19.2% |
| 45 to 54 Years | 90 | 13.2% |
| 55 to 64 Years | 108 | 15.8% |
| 65 to 74 Years | 79 | 11.6% |
| 75 to 84 Years | 53 | 7.8% |
| 85 Years and Over | 13 | 1.9% |
| Total | 683 | 100.0% |
Housing Finances in Clearwater
Median Income by Occupancy in Clearwater
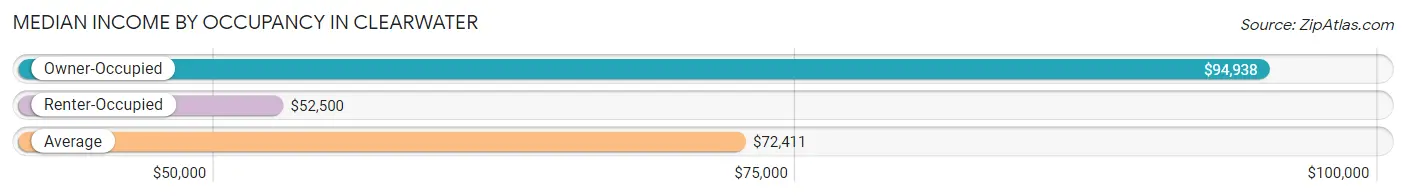
| Occupancy Type | # Households | Median Income |
| Owner-Occupied | 447 (65.4%) | $94,938 |
| Renter-Occupied | 236 (34.5%) | $52,500 |
| Average | 683 (100.0%) | $72,411 |
Occupancy by Householder Income Bracket in Clearwater
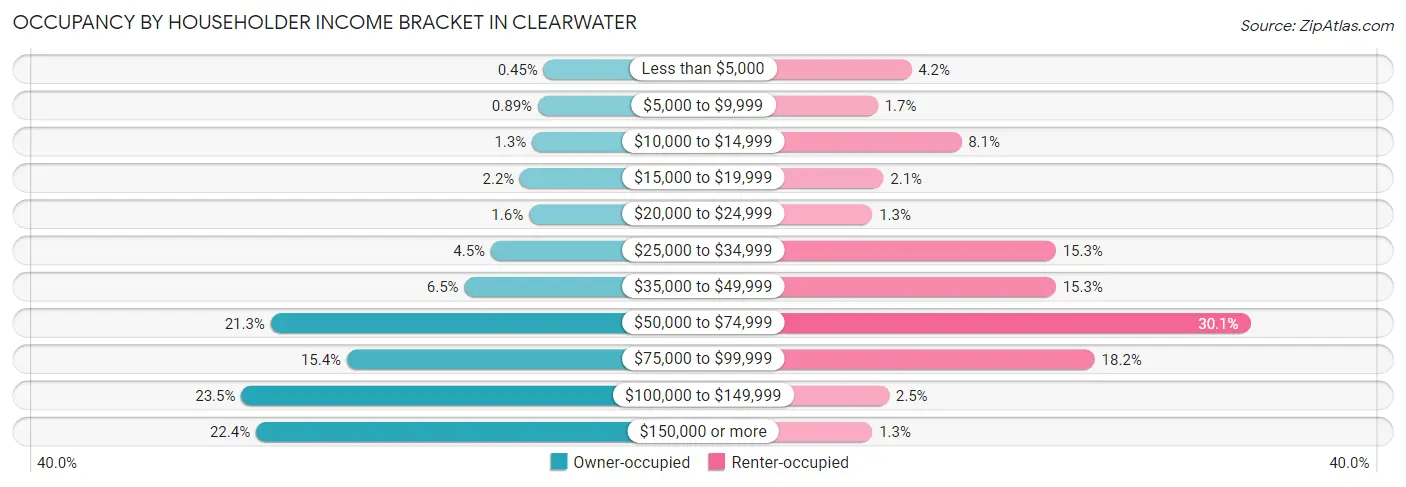
| Income Bracket | Owner-occupied | Renter-occupied |
| Less than $5,000 | 2 (0.4%) | 10 (4.2%) |
| $5,000 to $9,999 | 4 (0.9%) | 4 (1.7%) |
| $10,000 to $14,999 | 6 (1.3%) | 19 (8.1%) |
| $15,000 to $19,999 | 10 (2.2%) | 5 (2.1%) |
| $20,000 to $24,999 | 7 (1.6%) | 3 (1.3%) |
| $25,000 to $34,999 | 20 (4.5%) | 36 (15.2%) |
| $35,000 to $49,999 | 29 (6.5%) | 36 (15.2%) |
| $50,000 to $74,999 | 95 (21.2%) | 71 (30.1%) |
| $75,000 to $99,999 | 69 (15.4%) | 43 (18.2%) |
| $100,000 to $149,999 | 105 (23.5%) | 6 (2.5%) |
| $150,000 or more | 100 (22.4%) | 3 (1.3%) |
| Total | 447 (100.0%) | 236 (100.0%) |
Monthly Housing Cost Tiers in Clearwater
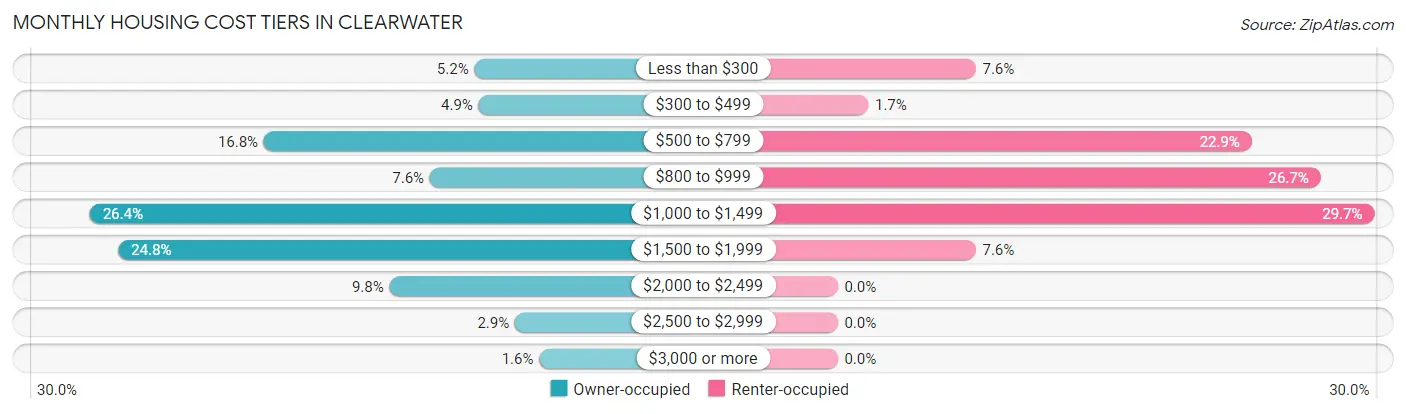
| Monthly Cost | Owner-occupied | Renter-occupied |
| Less than $300 | 23 (5.1%) | 18 (7.6%) |
| $300 to $499 | 22 (4.9%) | 4 (1.7%) |
| $500 to $799 | 75 (16.8%) | 54 (22.9%) |
| $800 to $999 | 34 (7.6%) | 63 (26.7%) |
| $1,000 to $1,499 | 118 (26.4%) | 70 (29.7%) |
| $1,500 to $1,999 | 111 (24.8%) | 18 (7.6%) |
| $2,000 to $2,499 | 44 (9.8%) | 0 (0.0%) |
| $2,500 to $2,999 | 13 (2.9%) | 0 (0.0%) |
| $3,000 or more | 7 (1.6%) | 0 (0.0%) |
| Total | 447 (100.0%) | 236 (100.0%) |
Physical Housing Characteristics in Clearwater
Housing Structures in Clearwater
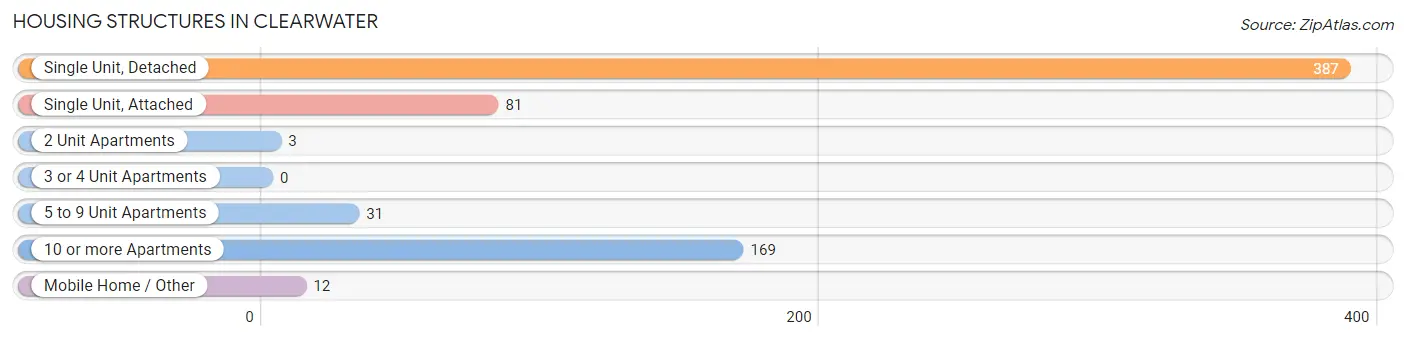
| Structure Type | # Housing Units | % Housing Units |
| Single Unit, Detached | 387 | 56.7% |
| Single Unit, Attached | 81 | 11.9% |
| 2 Unit Apartments | 3 | 0.4% |
| 3 or 4 Unit Apartments | 0 | 0.0% |
| 5 to 9 Unit Apartments | 31 | 4.5% |
| 10 or more Apartments | 169 | 24.7% |
| Mobile Home / Other | 12 | 1.8% |
| Total | 683 | 100.0% |
Housing Structures by Occupancy in Clearwater
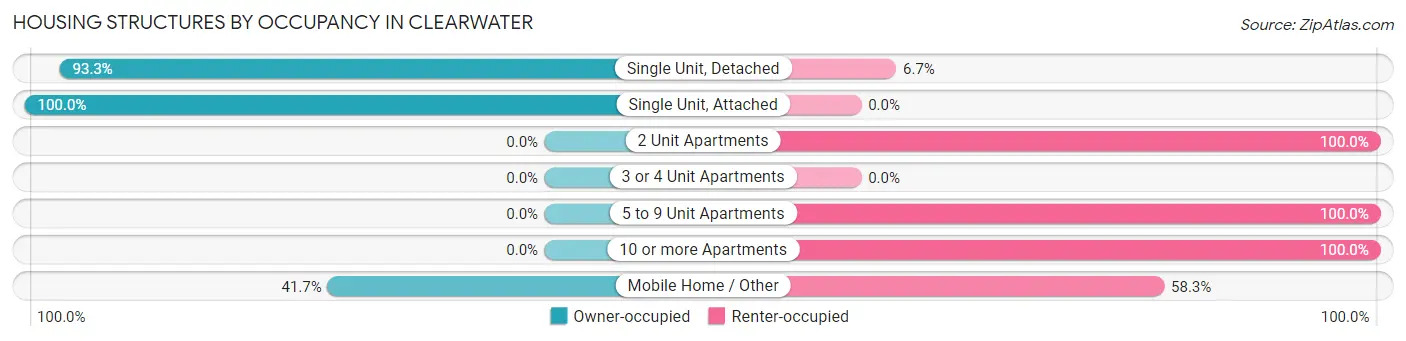
| Structure Type | Owner-occupied | Renter-occupied |
| Single Unit, Detached | 361 (93.3%) | 26 (6.7%) |
| Single Unit, Attached | 81 (100.0%) | 0 (0.0%) |
| 2 Unit Apartments | 0 (0.0%) | 3 (100.0%) |
| 3 or 4 Unit Apartments | 0 (0.0%) | 0 (0.0%) |
| 5 to 9 Unit Apartments | 0 (0.0%) | 31 (100.0%) |
| 10 or more Apartments | 0 (0.0%) | 169 (100.0%) |
| Mobile Home / Other | 5 (41.7%) | 7 (58.3%) |
| Total | 447 (65.4%) | 236 (34.5%) |
Housing Structures by Number of Rooms in Clearwater
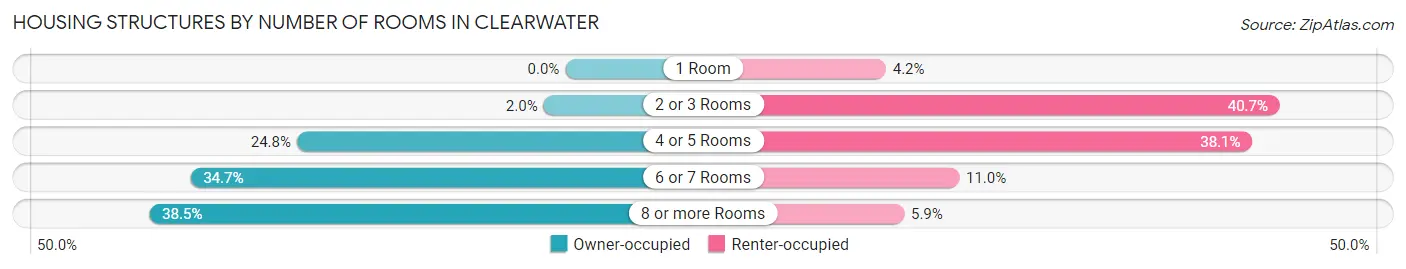
| Number of Rooms | Owner-occupied | Renter-occupied |
| 1 Room | 0 (0.0%) | 10 (4.2%) |
| 2 or 3 Rooms | 9 (2.0%) | 96 (40.7%) |
| 4 or 5 Rooms | 111 (24.8%) | 90 (38.1%) |
| 6 or 7 Rooms | 155 (34.7%) | 26 (11.0%) |
| 8 or more Rooms | 172 (38.5%) | 14 (5.9%) |
| Total | 447 (100.0%) | 236 (100.0%) |
Housing Structure by Heating Type in Clearwater
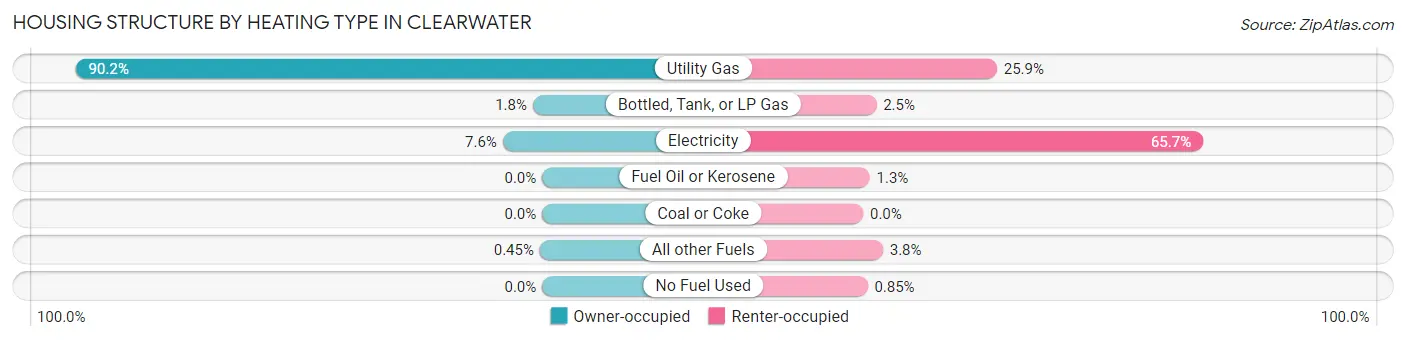
| Heating Type | Owner-occupied | Renter-occupied |
| Utility Gas | 403 (90.2%) | 61 (25.9%) |
| Bottled, Tank, or LP Gas | 8 (1.8%) | 6 (2.5%) |
| Electricity | 34 (7.6%) | 155 (65.7%) |
| Fuel Oil or Kerosene | 0 (0.0%) | 3 (1.3%) |
| Coal or Coke | 0 (0.0%) | 0 (0.0%) |
| All other Fuels | 2 (0.4%) | 9 (3.8%) |
| No Fuel Used | 0 (0.0%) | 2 (0.9%) |
| Total | 447 (100.0%) | 236 (100.0%) |
Household Vehicle Usage in Clearwater
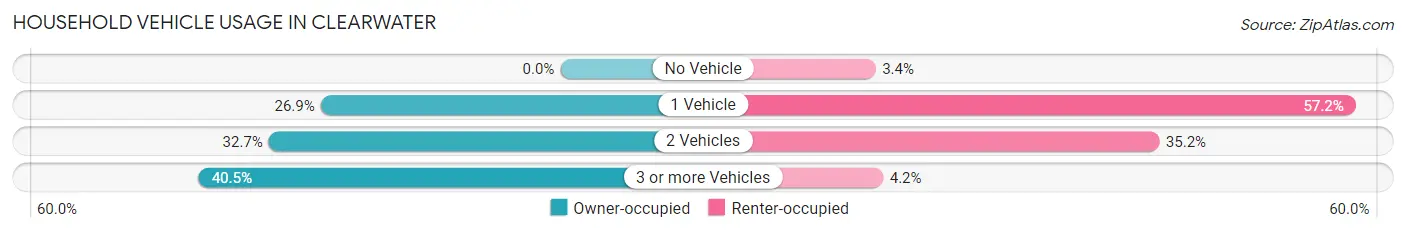
| Vehicles per Household | Owner-occupied | Renter-occupied |
| No Vehicle | 0 (0.0%) | 8 (3.4%) |
| 1 Vehicle | 120 (26.9%) | 135 (57.2%) |
| 2 Vehicles | 146 (32.7%) | 83 (35.2%) |
| 3 or more Vehicles | 181 (40.5%) | 10 (4.2%) |
| Total | 447 (100.0%) | 236 (100.0%) |
Real Estate & Mortgages in Clearwater
Real Estate and Mortgage Overview in Clearwater
| Characteristic | Without Mortgage | With Mortgage |
| Housing Units | 113 | 334 |
| Median Property Value | $236,600 | $234,800 |
| Median Household Income | $68,750 | $73 |
| Monthly Housing Costs | $598 | $7 |
| Real Estate Taxes | $2,563 | $7 |
Property Value by Mortgage Status in Clearwater
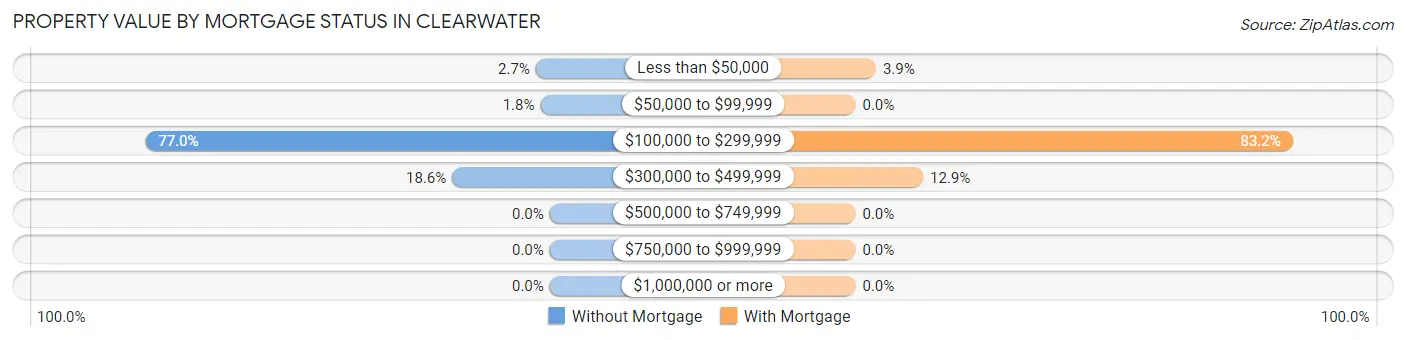
| Property Value | Without Mortgage | With Mortgage |
| Less than $50,000 | 3 (2.6%) | 13 (3.9%) |
| $50,000 to $99,999 | 2 (1.8%) | 0 (0.0%) |
| $100,000 to $299,999 | 87 (77.0%) | 278 (83.2%) |
| $300,000 to $499,999 | 21 (18.6%) | 43 (12.9%) |
| $500,000 to $749,999 | 0 (0.0%) | 0 (0.0%) |
| $750,000 to $999,999 | 0 (0.0%) | 0 (0.0%) |
| $1,000,000 or more | 0 (0.0%) | 0 (0.0%) |
| Total | 113 (100.0%) | 334 (100.0%) |
Household Income by Mortgage Status in Clearwater
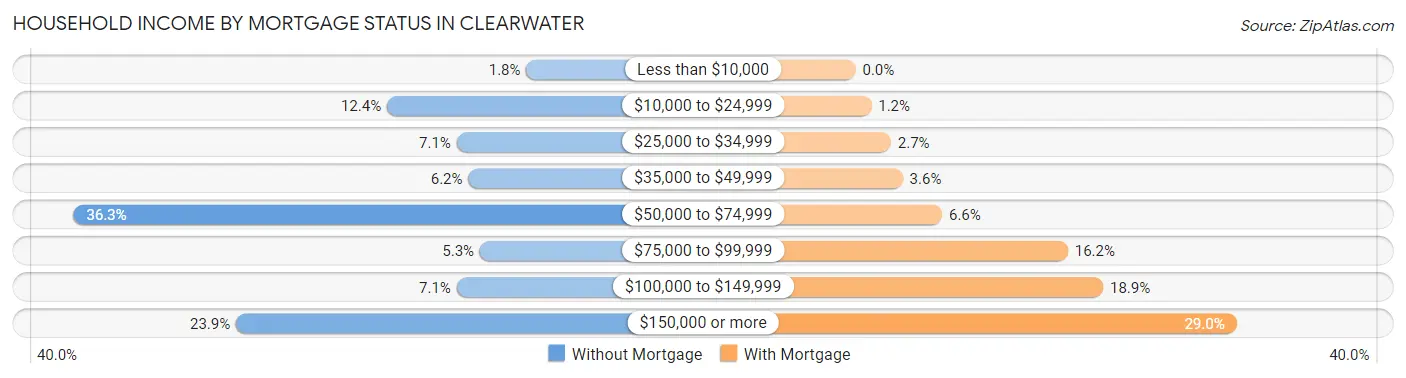
| Household Income | Without Mortgage | With Mortgage |
| Less than $10,000 | 2 (1.8%) | 0 (0.0%) |
| $10,000 to $24,999 | 14 (12.4%) | 4 (1.2%) |
| $25,000 to $34,999 | 8 (7.1%) | 9 (2.7%) |
| $35,000 to $49,999 | 7 (6.2%) | 12 (3.6%) |
| $50,000 to $74,999 | 41 (36.3%) | 22 (6.6%) |
| $75,000 to $99,999 | 6 (5.3%) | 54 (16.2%) |
| $100,000 to $149,999 | 8 (7.1%) | 63 (18.9%) |
| $150,000 or more | 27 (23.9%) | 97 (29.0%) |
| Total | 113 (100.0%) | 334 (100.0%) |
Property Value to Household Income Ratio in Clearwater
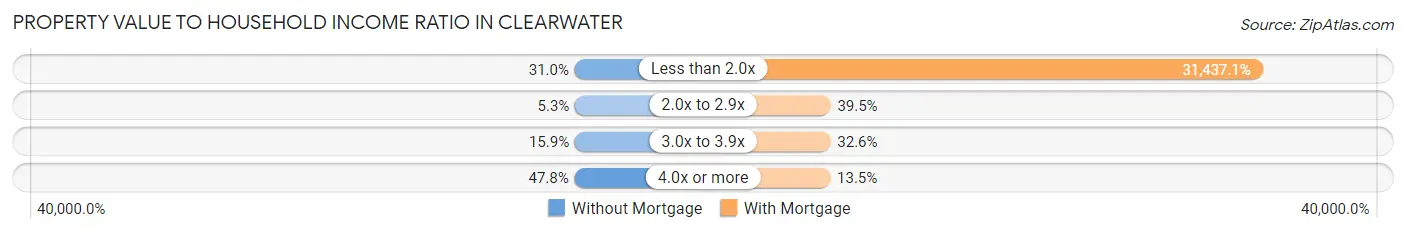
| Value-to-Income Ratio | Without Mortgage | With Mortgage |
| Less than 2.0x | 35 (31.0%) | 105,000 (31,437.1%) |
| 2.0x to 2.9x | 6 (5.3%) | 132 (39.5%) |
| 3.0x to 3.9x | 18 (15.9%) | 109 (32.6%) |
| 4.0x or more | 54 (47.8%) | 45 (13.5%) |
| Total | 113 (100.0%) | 334 (100.0%) |
Real Estate Taxes by Mortgage Status in Clearwater
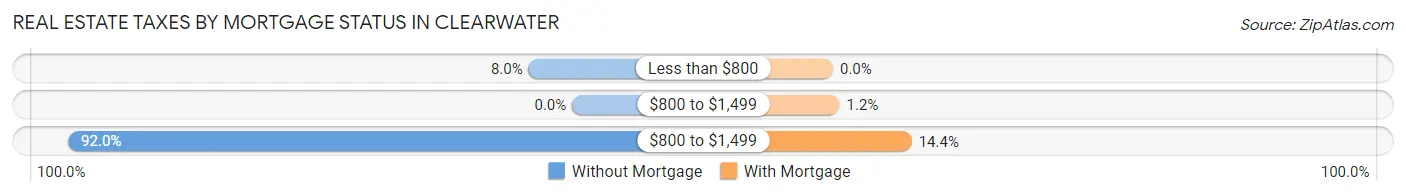
| Property Taxes | Without Mortgage | With Mortgage |
| Less than $800 | 9 (8.0%) | 0 (0.0%) |
| $800 to $1,499 | 0 (0.0%) | 4 (1.2%) |
| $800 to $1,499 | 104 (92.0%) | 48 (14.4%) |
| Total | 113 (100.0%) | 334 (100.0%) |
Health & Disability in Clearwater
Health Insurance Coverage by Age in Clearwater
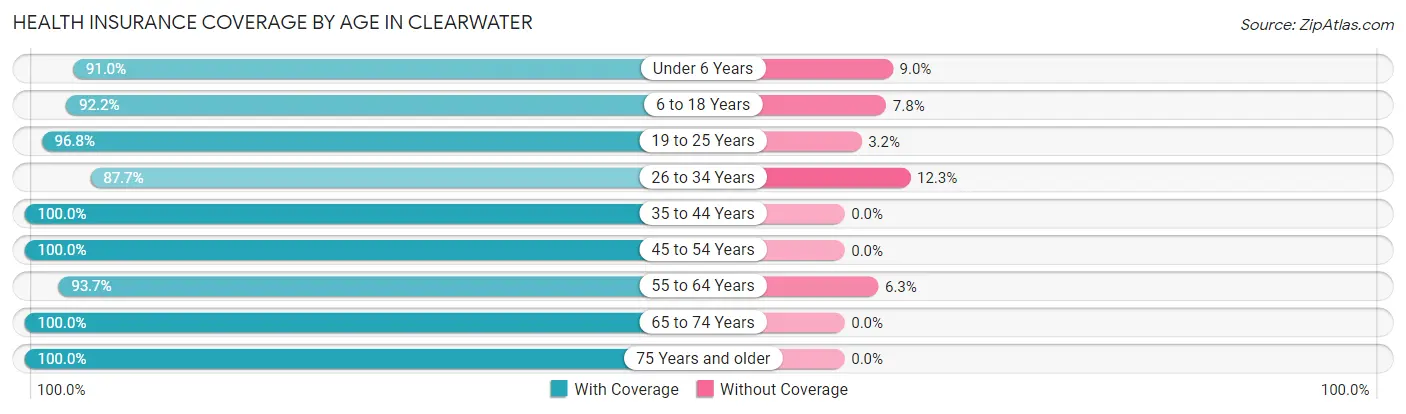
| Age Bracket | With Coverage | Without Coverage |
| Under 6 Years | 182 (91.0%) | 18 (9.0%) |
| 6 to 18 Years | 333 (92.2%) | 28 (7.8%) |
| 19 to 25 Years | 92 (96.8%) | 3 (3.2%) |
| 26 to 34 Years | 272 (87.7%) | 38 (12.3%) |
| 35 to 44 Years | 239 (100.0%) | 0 (0.0%) |
| 45 to 54 Years | 137 (100.0%) | 0 (0.0%) |
| 55 to 64 Years | 149 (93.7%) | 10 (6.3%) |
| 65 to 74 Years | 114 (100.0%) | 0 (0.0%) |
| 75 Years and older | 119 (100.0%) | 0 (0.0%) |
| Total | 1,637 (94.4%) | 97 (5.6%) |
Health Insurance Coverage by Citizenship Status in Clearwater
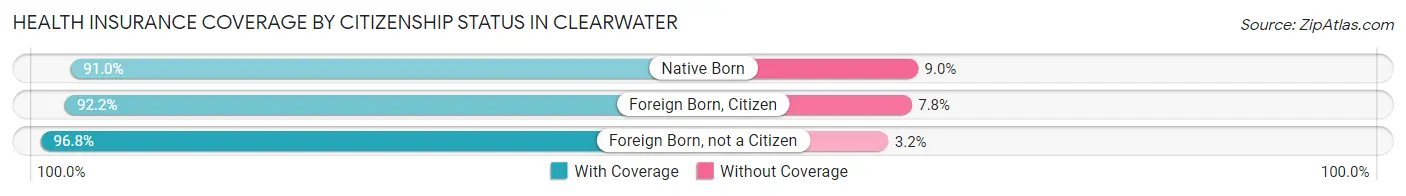
| Citizenship Status | With Coverage | Without Coverage |
| Native Born | 182 (91.0%) | 18 (9.0%) |
| Foreign Born, Citizen | 333 (92.2%) | 28 (7.8%) |
| Foreign Born, not a Citizen | 92 (96.8%) | 3 (3.2%) |
Health Insurance Coverage by Household Income in Clearwater
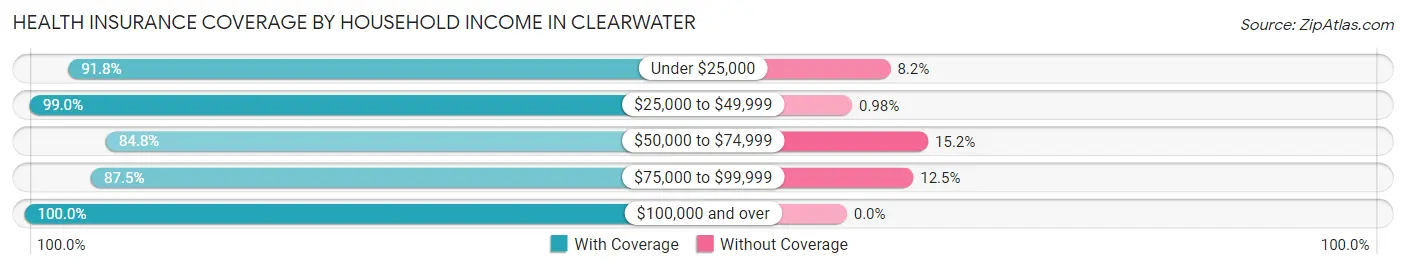
| Household Income | With Coverage | Without Coverage |
| Under $25,000 | 101 (91.8%) | 9 (8.2%) |
| $25,000 to $49,999 | 203 (99.0%) | 2 (1.0%) |
| $50,000 to $74,999 | 278 (84.8%) | 50 (15.2%) |
| $75,000 to $99,999 | 253 (87.5%) | 36 (12.5%) |
| $100,000 and over | 802 (100.0%) | 0 (0.0%) |
Public vs Private Health Insurance Coverage by Age in Clearwater
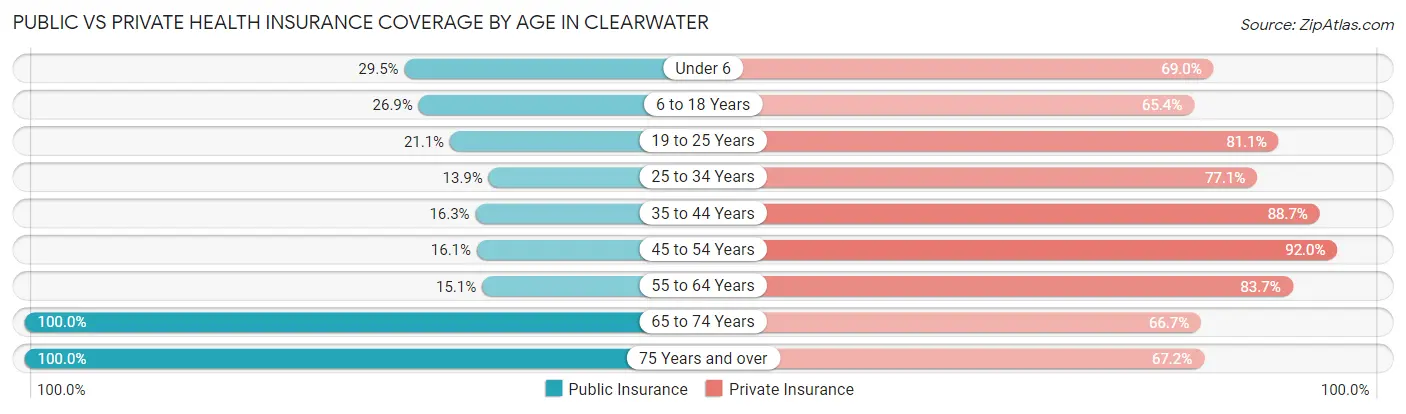
| Age Bracket | Public Insurance | Private Insurance |
| Under 6 | 59 (29.5%) | 138 (69.0%) |
| 6 to 18 Years | 97 (26.9%) | 236 (65.4%) |
| 19 to 25 Years | 20 (21.0%) | 77 (81.0%) |
| 25 to 34 Years | 43 (13.9%) | 239 (77.1%) |
| 35 to 44 Years | 39 (16.3%) | 212 (88.7%) |
| 45 to 54 Years | 22 (16.1%) | 126 (92.0%) |
| 55 to 64 Years | 24 (15.1%) | 133 (83.7%) |
| 65 to 74 Years | 114 (100.0%) | 76 (66.7%) |
| 75 Years and over | 119 (100.0%) | 80 (67.2%) |
| Total | 537 (31.0%) | 1,317 (75.9%) |
Disability Status by Sex by Age in Clearwater
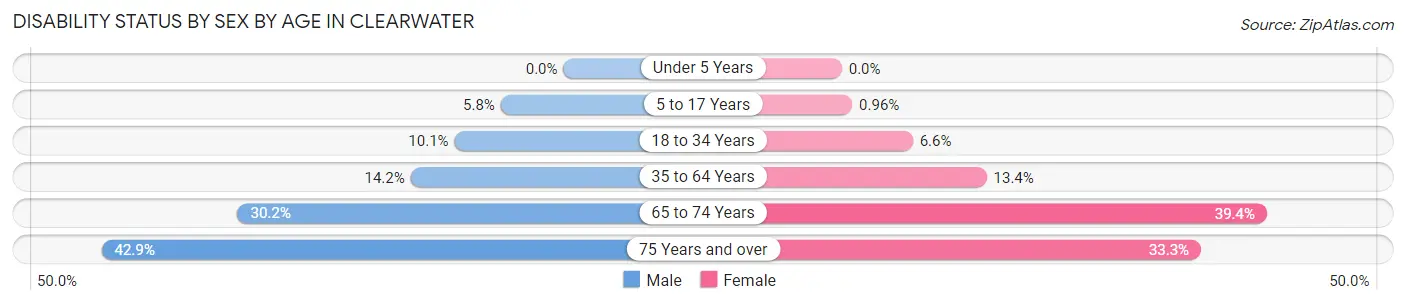
| Age Bracket | Male | Female |
| Under 5 Years | 0 (0.0%) | 0 (0.0%) |
| 5 to 17 Years | 11 (5.8%) | 2 (1.0%) |
| 18 to 34 Years | 19 (10.1%) | 16 (6.6%) |
| 35 to 64 Years | 40 (14.2%) | 34 (13.4%) |
| 65 to 74 Years | 13 (30.2%) | 28 (39.4%) |
| 75 Years and over | 24 (42.9%) | 21 (33.3%) |
Disability Class by Sex by Age in Clearwater
Disability Class: Hearing Difficulty
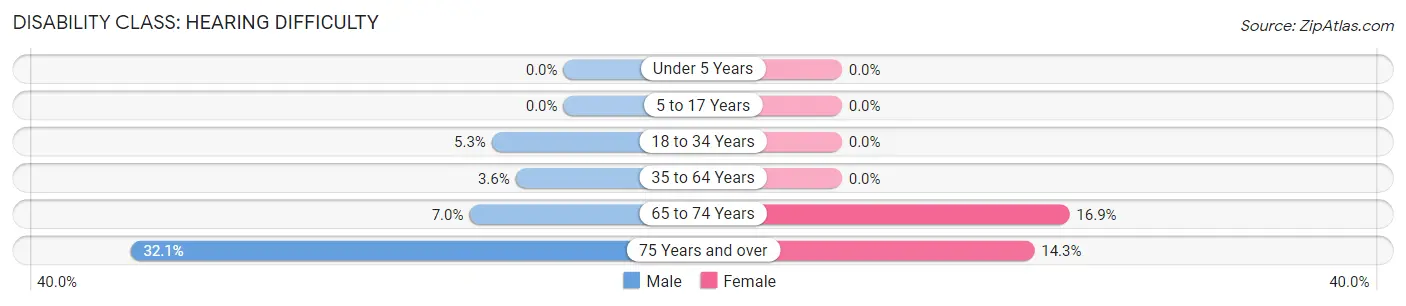
| Age Bracket | Male | Female |
| Under 5 Years | 0 (0.0%) | 0 (0.0%) |
| 5 to 17 Years | 0 (0.0%) | 0 (0.0%) |
| 18 to 34 Years | 10 (5.3%) | 0 (0.0%) |
| 35 to 64 Years | 10 (3.5%) | 0 (0.0%) |
| 65 to 74 Years | 3 (7.0%) | 12 (16.9%) |
| 75 Years and over | 18 (32.1%) | 9 (14.3%) |
Disability Class: Vision Difficulty
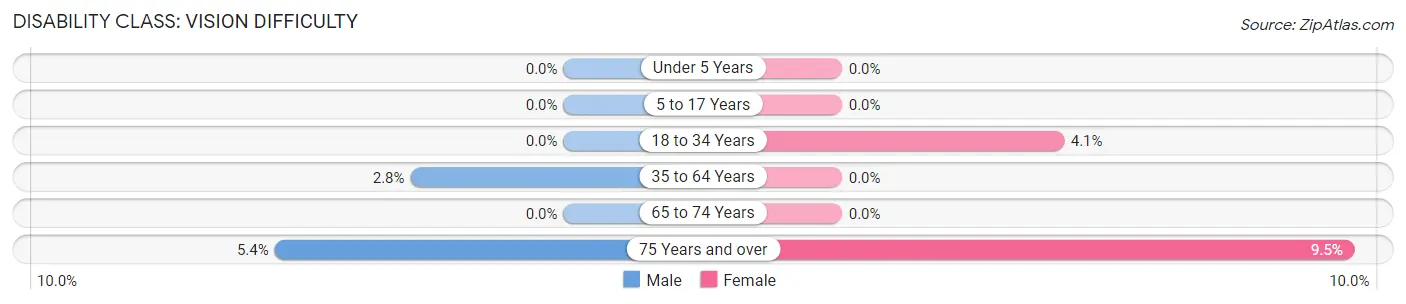
| Age Bracket | Male | Female |
| Under 5 Years | 0 (0.0%) | 0 (0.0%) |
| 5 to 17 Years | 0 (0.0%) | 0 (0.0%) |
| 18 to 34 Years | 0 (0.0%) | 10 (4.1%) |
| 35 to 64 Years | 8 (2.8%) | 0 (0.0%) |
| 65 to 74 Years | 0 (0.0%) | 0 (0.0%) |
| 75 Years and over | 3 (5.4%) | 6 (9.5%) |
Disability Class: Cognitive Difficulty
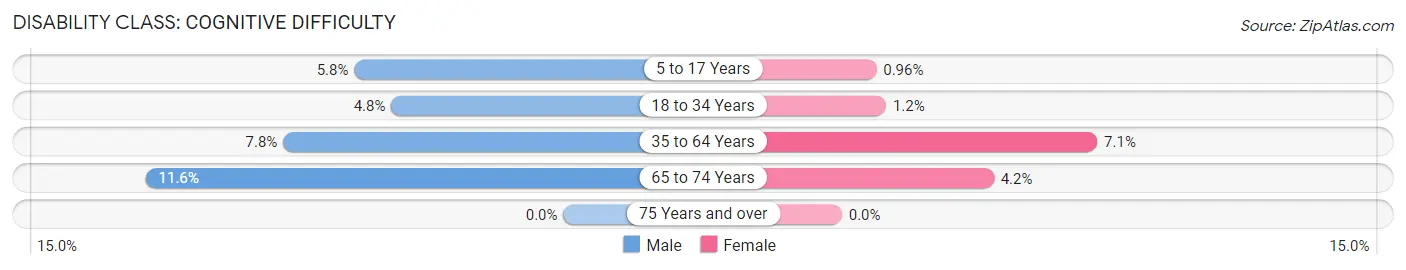
| Age Bracket | Male | Female |
| 5 to 17 Years | 11 (5.8%) | 2 (1.0%) |
| 18 to 34 Years | 9 (4.8%) | 3 (1.2%) |
| 35 to 64 Years | 22 (7.8%) | 18 (7.1%) |
| 65 to 74 Years | 5 (11.6%) | 3 (4.2%) |
| 75 Years and over | 0 (0.0%) | 0 (0.0%) |
Disability Class: Ambulatory Difficulty
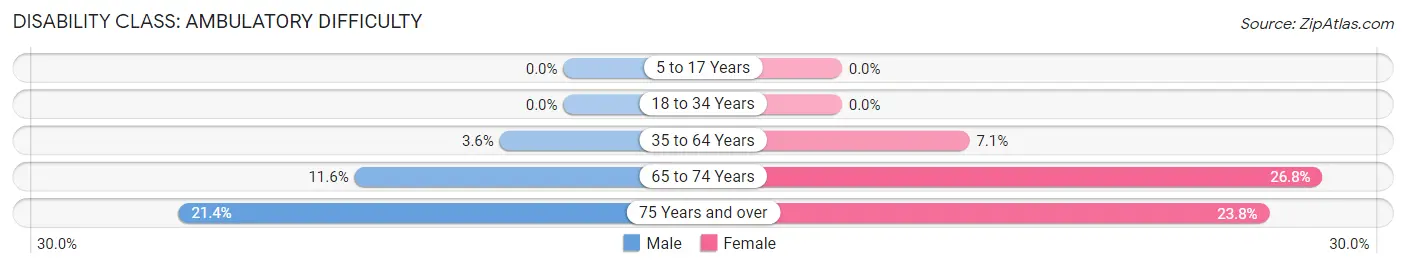
| Age Bracket | Male | Female |
| 5 to 17 Years | 0 (0.0%) | 0 (0.0%) |
| 18 to 34 Years | 0 (0.0%) | 0 (0.0%) |
| 35 to 64 Years | 10 (3.5%) | 18 (7.1%) |
| 65 to 74 Years | 5 (11.6%) | 19 (26.8%) |
| 75 Years and over | 12 (21.4%) | 15 (23.8%) |
Disability Class: Self-Care Difficulty
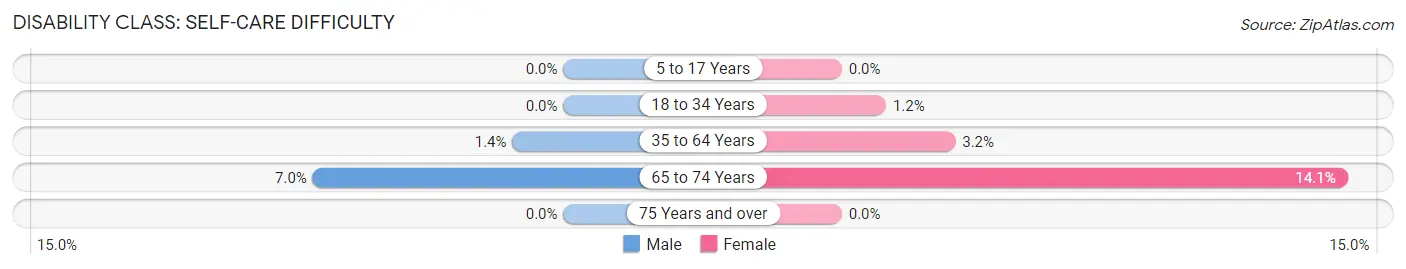
| Age Bracket | Male | Female |
| 5 to 17 Years | 0 (0.0%) | 0 (0.0%) |
| 18 to 34 Years | 0 (0.0%) | 3 (1.2%) |
| 35 to 64 Years | 4 (1.4%) | 8 (3.2%) |
| 65 to 74 Years | 3 (7.0%) | 10 (14.1%) |
| 75 Years and over | 0 (0.0%) | 0 (0.0%) |
Technology Access in Clearwater
Computing Device Access in Clearwater
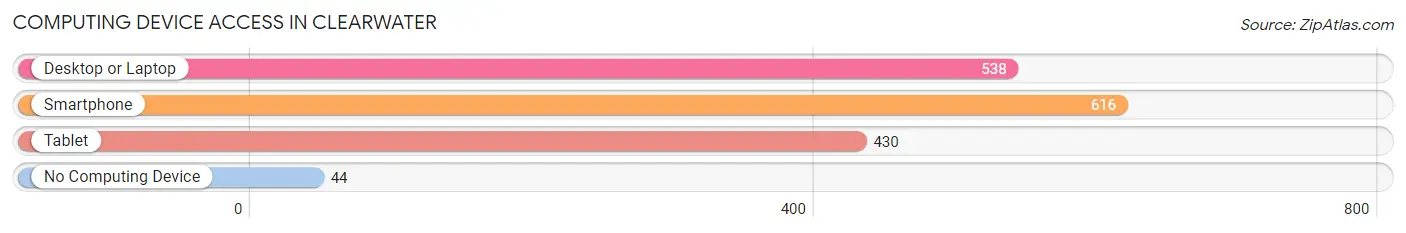
| Device Type | # Households | % Households |
| Desktop or Laptop | 538 | 78.8% |
| Smartphone | 616 | 90.2% |
| Tablet | 430 | 63.0% |
| No Computing Device | 44 | 6.4% |
| Total | 683 | 100.0% |
Internet Access in Clearwater
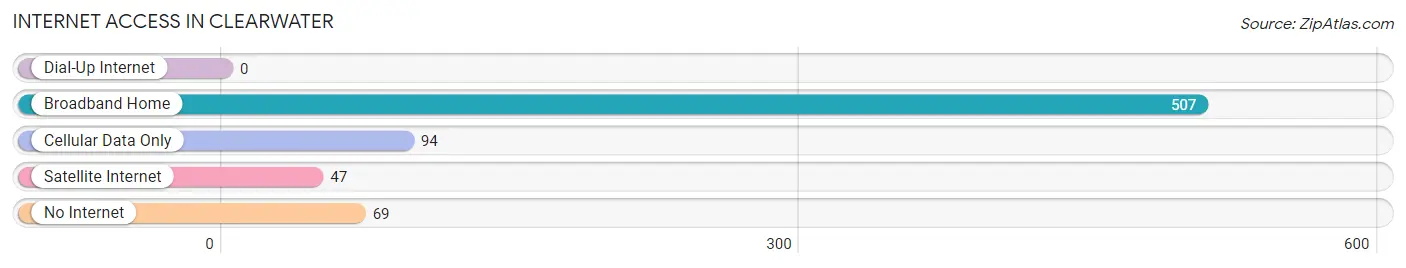
| Internet Type | # Households | % Households |
| Dial-Up Internet | 0 | 0.0% |
| Broadband Home | 507 | 74.2% |
| Cellular Data Only | 94 | 13.8% |
| Satellite Internet | 47 | 6.9% |
| No Internet | 69 | 10.1% |
| Total | 683 | 100.0% |
Clearwater Summary
Clearwater, Minnesota is a small city located in the central part of the state, about 25 miles northwest of Minneapolis. It is part of the Twin Cities metropolitan area and is home to a population of about 8,000 people. The city is situated on the banks of the Mississippi River and is surrounded by rolling hills and lush forests.
History
Clearwater was first settled in 1855 by a group of German immigrants. The town was originally called “Clearwater Station” and was a stop on the St. Paul and Pacific Railroad. The town was officially incorporated in 1872 and was named after the nearby Clearwater Creek.
In the late 19th century, Clearwater was a thriving agricultural community. The town was known for its dairy farms and was home to several cheese factories. The town also had a thriving lumber industry, with several sawmills located in the area.
In the early 20th century, Clearwater began to experience a population boom. The town was home to several large manufacturing companies, including a paper mill and a canning factory. The town also had a thriving retail sector, with several stores and restaurants located in the downtown area.
Geography
Clearwater is located in the central part of Minnesota, about 25 miles northwest of Minneapolis. The city is situated on the banks of the Mississippi River and is surrounded by rolling hills and lush forests. The city is located in Wright County and is part of the Twin Cities metropolitan area.
The city has a total area of 4.2 square miles, all of which is land. The city has a humid continental climate, with cold winters and warm summers. The average annual temperature is around 40 degrees Fahrenheit.
Economy
Clearwater’s economy is largely based on manufacturing and retail. The city is home to several large manufacturing companies, including a paper mill and a canning factory. The city also has a thriving retail sector, with several stores and restaurants located in the downtown area.
The city is also home to several small businesses, including a brewery, a winery, and a distillery. The city is also home to several medical facilities, including a hospital and several clinics.
Demographics
As of the 2010 census, Clearwater had a population of 8,000 people. The racial makeup of the city was 95.3% White, 0.7% African American, 0.3% Native American, 0.7% Asian, 0.1% Pacific Islander, and 2.0% from other races. Hispanic or Latino of any race were 2.3% of the population.
The median household income in Clearwater was $50,000, and the median family income was $60,000. The per capita income was $25,000. About 8.5% of the population was below the poverty line.
Clearwater is a small city with a rich history and a vibrant economy. The city is home to several large manufacturing companies and a thriving retail sector. The city also has a diverse population and a strong sense of community.
Common Questions
What is Per Capita Income in Clearwater?
Per Capita income in Clearwater is $33,618.
What is the Median Family Income in Clearwater?
Median Family Income in Clearwater is $91,875.
What is the Median Household income in Clearwater?
Median Household Income in Clearwater is $72,411.
What is Income or Wage Gap in Clearwater?
Income or Wage Gap in Clearwater is 31.2%.
Women in Clearwater earn 68.8 cents for every dollar earned by a man.
What is Inequality or Gini Index in Clearwater?
Inequality or Gini Index in Clearwater is 0.35.
What is the Total Population of Clearwater?
Total Population of Clearwater is 1,734.
What is the Total Male Population of Clearwater?
Total Male Population of Clearwater is 827.
What is the Total Female Population of Clearwater?
Total Female Population of Clearwater is 907.
What is the Ratio of Males per 100 Females in Clearwater?
There are 91.18 Males per 100 Females in Clearwater.
What is the Ratio of Females per 100 Males in Clearwater?
There are 109.67 Females per 100 Males in Clearwater.
What is the Median Population Age in Clearwater?
Median Population Age in Clearwater is 32.3 Years.
What is the Average Family Size in Clearwater
Average Family Size in Clearwater is 3.1 People.
What is the Average Household Size in Clearwater
Average Household Size in Clearwater is 2.5 People.
How Large is the Labor Force in Clearwater?
There are 940 People in the Labor Forcein in Clearwater.
What is the Percentage of People in the Labor Force in Clearwater?
76.4% of People are in the Labor Force in Clearwater.
What is the Unemployment Rate in Clearwater?
Unemployment Rate in Clearwater is 3.6%.