Rockford, MN Map & Demographics
Rockford Map
Rockford Overview
$41,083
PER CAPITA INCOME
$100,224
AVG FAMILY INCOME
$76,181
AVG HOUSEHOLD INCOME
33.8%
WAGE / INCOME GAP [ % ]
66.2¢/ $1
WAGE / INCOME GAP [ $ ]
$4,527
FAMILY INCOME DEFICIT
0.40
INEQUALITY / GINI INDEX
4,638
TOTAL POPULATION
2,299
MALE POPULATION
2,339
FEMALE POPULATION
98.29
MALES / 100 FEMALES
101.74
FEMALES / 100 MALES
39.8
MEDIAN AGE
3.1
AVG FAMILY SIZE
2.6
AVG HOUSEHOLD SIZE
2,809
LABOR FORCE [ PEOPLE ]
73.2%
PERCENT IN LABOR FORCE
3.1%
UNEMPLOYMENT RATE
Rockford Zip Codes
Rockford Area Codes
Income in Rockford
Income Overview in Rockford
Per Capita Income in Rockford is $41,083, while median incomes of families and households are $100,224 and $76,181 respectively.
| Characteristic | Number | Measure |
| Per Capita Income | 4,638 | $41,083 |
| Median Family Income | 1,143 | $100,224 |
| Mean Family Income | 1,143 | $123,206 |
| Median Household Income | 1,810 | $76,181 |
| Mean Household Income | 1,810 | $103,436 |
| Income Deficit | 1,143 | $4,527 |
| Wage / Income Gap (%) | 4,638 | 33.85% |
| Wage / Income Gap ($) | 4,638 | 66.15¢ per $1 |
| Gini / Inequality Index | 4,638 | 0.40 |
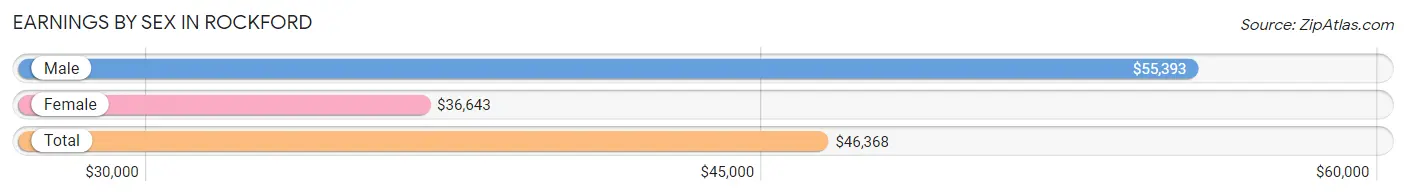
Earnings by Sex in Rockford
Average Earnings in Rockford are $46,368, $55,393 for men and $36,643 for women, a difference of 33.9%.
| Sex | Number | Average Earnings |
| Male | 1,534 (53.0%) | $55,393 |
| Female | 1,358 (47.0%) | $36,643 |
| Total | 2,892 (100.0%) | $46,368 |
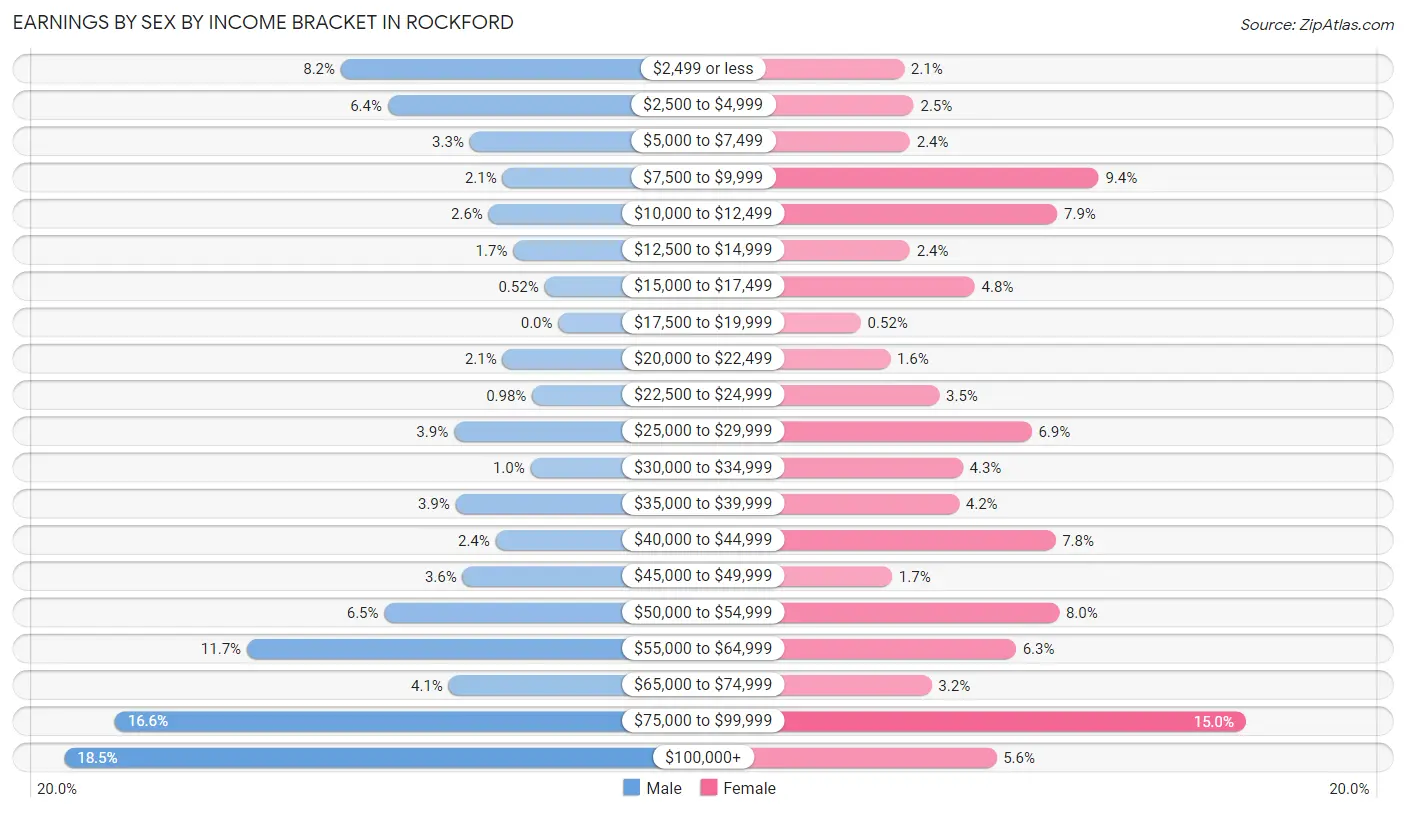
Earnings by Sex by Income Bracket in Rockford
The most common earnings brackets in Rockford are $100,000+ for men (284 | 18.5%) and $75,000 to $99,999 for women (203 | 14.9%).
| Income | Male | Female |
| $2,499 or less | 125 (8.2%) | 29 (2.1%) |
| $2,500 to $4,999 | 98 (6.4%) | 34 (2.5%) |
| $5,000 to $7,499 | 51 (3.3%) | 32 (2.4%) |
| $7,500 to $9,999 | 32 (2.1%) | 128 (9.4%) |
| $10,000 to $12,499 | 40 (2.6%) | 107 (7.9%) |
| $12,500 to $14,999 | 26 (1.7%) | 32 (2.4%) |
| $15,000 to $17,499 | 8 (0.5%) | 65 (4.8%) |
| $17,500 to $19,999 | 0 (0.0%) | 7 (0.5%) |
| $20,000 to $22,499 | 32 (2.1%) | 22 (1.6%) |
| $22,500 to $24,999 | 15 (1.0%) | 47 (3.5%) |
| $25,000 to $29,999 | 60 (3.9%) | 94 (6.9%) |
| $30,000 to $34,999 | 16 (1.0%) | 59 (4.3%) |
| $35,000 to $39,999 | 59 (3.8%) | 57 (4.2%) |
| $40,000 to $44,999 | 36 (2.4%) | 106 (7.8%) |
| $45,000 to $49,999 | 55 (3.6%) | 23 (1.7%) |
| $50,000 to $54,999 | 100 (6.5%) | 108 (8.0%) |
| $55,000 to $64,999 | 179 (11.7%) | 86 (6.3%) |
| $65,000 to $74,999 | 63 (4.1%) | 43 (3.2%) |
| $75,000 to $99,999 | 255 (16.6%) | 203 (14.9%) |
| $100,000+ | 284 (18.5%) | 76 (5.6%) |
| Total | 1,534 (100.0%) | 1,358 (100.0%) |
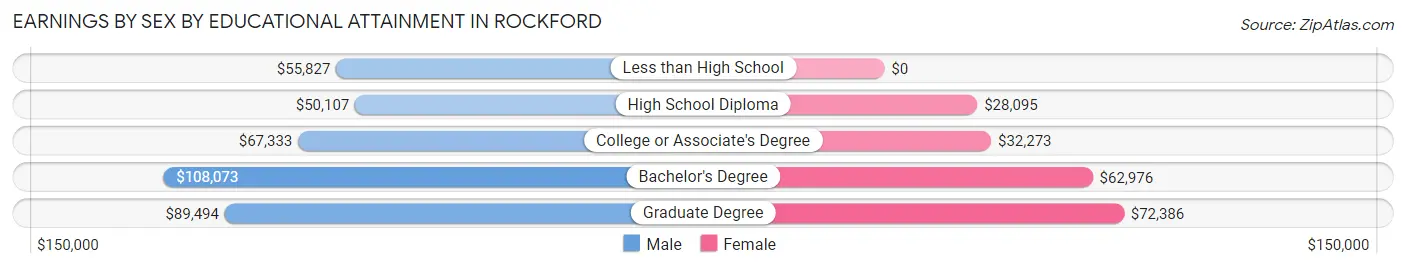
Earnings by Sex by Educational Attainment in Rockford
Average earnings in Rockford are $70,156 for men and $40,587 for women, a difference of 42.1%. Men with an educational attainment of bachelor's degree enjoy the highest average annual earnings of $108,073, while those with high school diploma education earn the least with $50,107. Women with an educational attainment of graduate degree earn the most with the average annual earnings of $72,386, while those with high school diploma education have the smallest earnings of $28,095.
| Educational Attainment | Male Income | Female Income |
| Less than High School | $55,827 | $0 |
| High School Diploma | $50,107 | $28,095 |
| College or Associate's Degree | $67,333 | $32,273 |
| Bachelor's Degree | $108,073 | $62,976 |
| Graduate Degree | $89,494 | $72,386 |
| Total | $70,156 | $40,587 |
Family Income in Rockford
Family Income Brackets in Rockford
According to the Rockford family income data, there are 251 families falling into the $200,000+ income range, which is the most common income bracket and makes up 22.0% of all families.
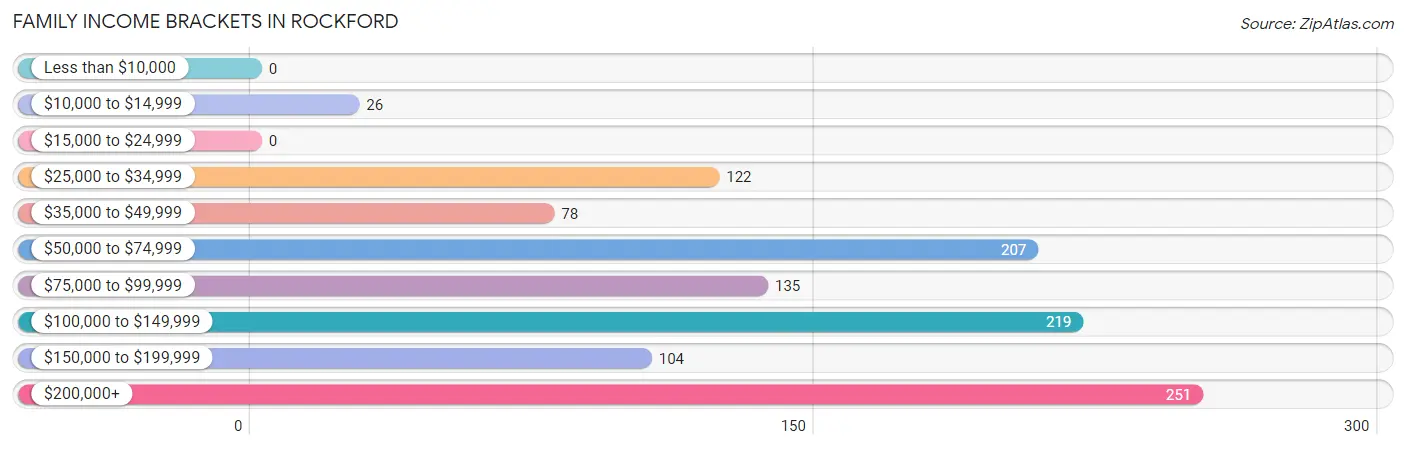
| Income Bracket | # Families | % Families |
| Less than $10,000 | 0 | 0.0% |
| $10,000 to $14,999 | 26 | 2.3% |
| $15,000 to $24,999 | 0 | 0.0% |
| $25,000 to $34,999 | 122 | 10.7% |
| $35,000 to $49,999 | 78 | 6.8% |
| $50,000 to $74,999 | 207 | 18.1% |
| $75,000 to $99,999 | 135 | 11.8% |
| $100,000 to $149,999 | 219 | 19.2% |
| $150,000 to $199,999 | 104 | 9.1% |
| $200,000+ | 251 | 22.0% |
Family Income by Famaliy Size in Rockford
4-person families (315 | 27.6%) account for the highest median family income in Rockford with $221,382 per family, while 4-person families (315 | 27.6%) have the highest median income of $55,346 per family member.
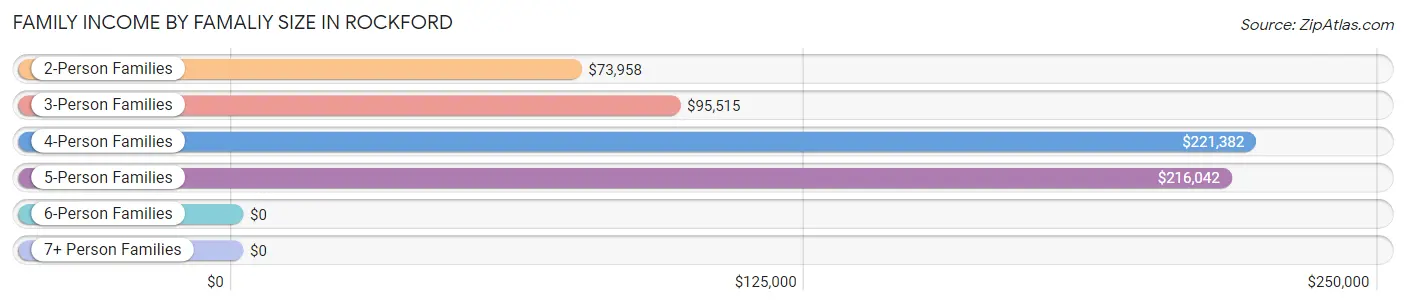
| Income Bracket | # Families | Median Income |
| 2-Person Families | 449 (39.3%) | $73,958 |
| 3-Person Families | 299 (26.2%) | $95,515 |
| 4-Person Families | 315 (27.6%) | $221,382 |
| 5-Person Families | 43 (3.8%) | $216,042 |
| 6-Person Families | 18 (1.6%) | $0 |
| 7+ Person Families | 19 (1.7%) | $0 |
| Total | 1,143 (100.0%) | $100,224 |
Family Income by Number of Earners in Rockford
The median family income in Rockford is $100,224, with families comprising 3+ earners (262) having the highest median family income of $238,590, while families with 1 earner (250) have the lowest median family income of $46,667, accounting for 22.9% and 21.9% of families, respectively.
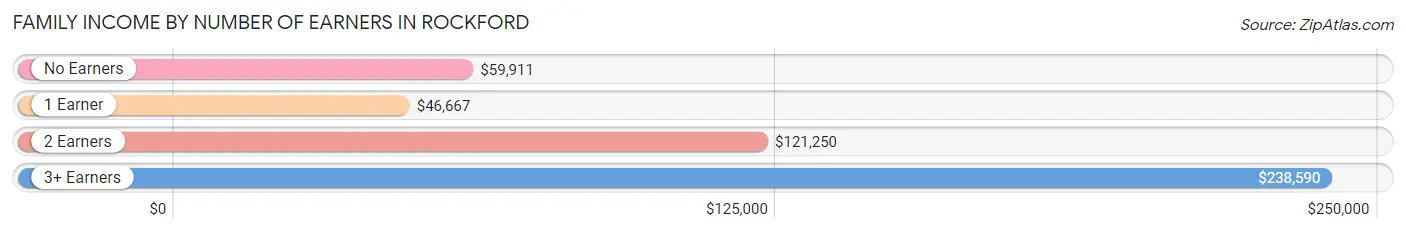
| Number of Earners | # Families | Median Income |
| No Earners | 153 (13.4%) | $59,911 |
| 1 Earner | 250 (21.9%) | $46,667 |
| 2 Earners | 478 (41.8%) | $121,250 |
| 3+ Earners | 262 (22.9%) | $238,590 |
| Total | 1,143 (100.0%) | $100,224 |
Household Income in Rockford
Household Income Brackets in Rockford
With 380 households falling in the category, the $50,000 to $74,999 income range is the most frequent in Rockford, accounting for 21.0% of all households. In contrast, only 27 households (1.5%) fall into the less than $10,000 income bracket, making it the least populous group.
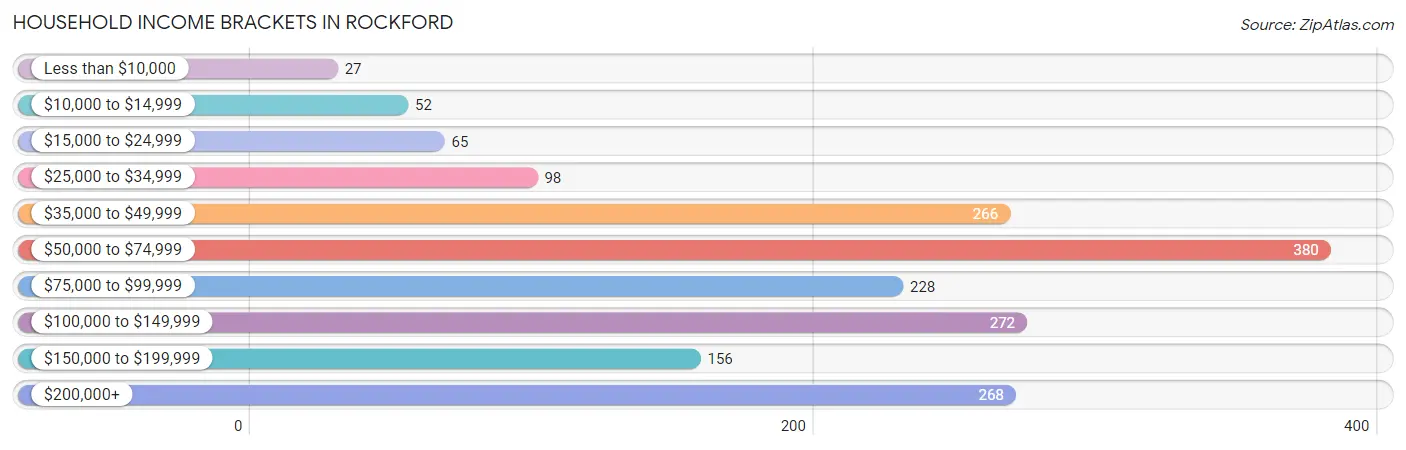
| Income Bracket | # Households | % Households |
| Less than $10,000 | 27 | 1.5% |
| $10,000 to $14,999 | 52 | 2.9% |
| $15,000 to $24,999 | 65 | 3.6% |
| $25,000 to $34,999 | 98 | 5.4% |
| $35,000 to $49,999 | 266 | 14.7% |
| $50,000 to $74,999 | 380 | 21.0% |
| $75,000 to $99,999 | 228 | 12.6% |
| $100,000 to $149,999 | 272 | 15.0% |
| $150,000 to $199,999 | 156 | 8.6% |
| $200,000+ | 268 | 14.8% |
Household Income by Householder Age in Rockford
The median household income in Rockford is $76,181, with the highest median household income of $87,210 found in the 25 to 44 years age bracket for the primary householder. A total of 495 households (27.4%) fall into this category. Meanwhile, the 15 to 24 years age bracket for the primary householder has the lowest median household income of $0, with 50 households (2.8%) in this group.
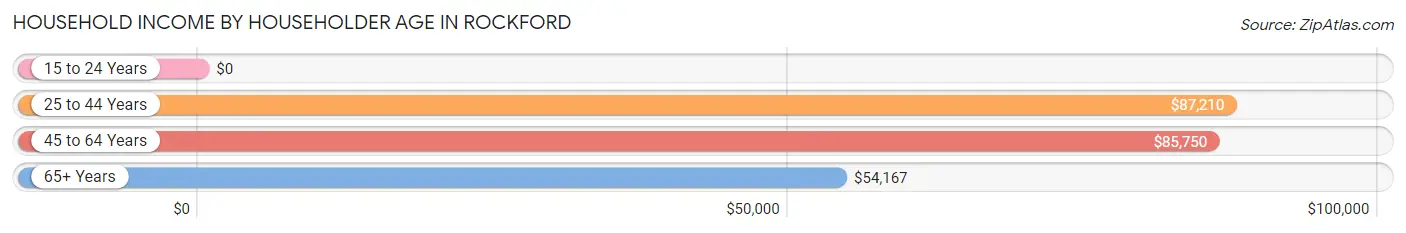
| Income Bracket | # Households | Median Income |
| 15 to 24 Years | 50 (2.8%) | $0 |
| 25 to 44 Years | 495 (27.4%) | $87,210 |
| 45 to 64 Years | 883 (48.8%) | $85,750 |
| 65+ Years | 382 (21.1%) | $54,167 |
| Total | 1,810 (100.0%) | $76,181 |
Poverty in Rockford
Income Below Poverty by Sex and Age in Rockford
With 5.9% poverty level for males and 12.0% for females among the residents of Rockford, 18 to 24 year old males and 5 year old females are the most vulnerable to poverty, with 103 males (32.1%) and 27 females (100.0%) in their respective age groups living below the poverty level.
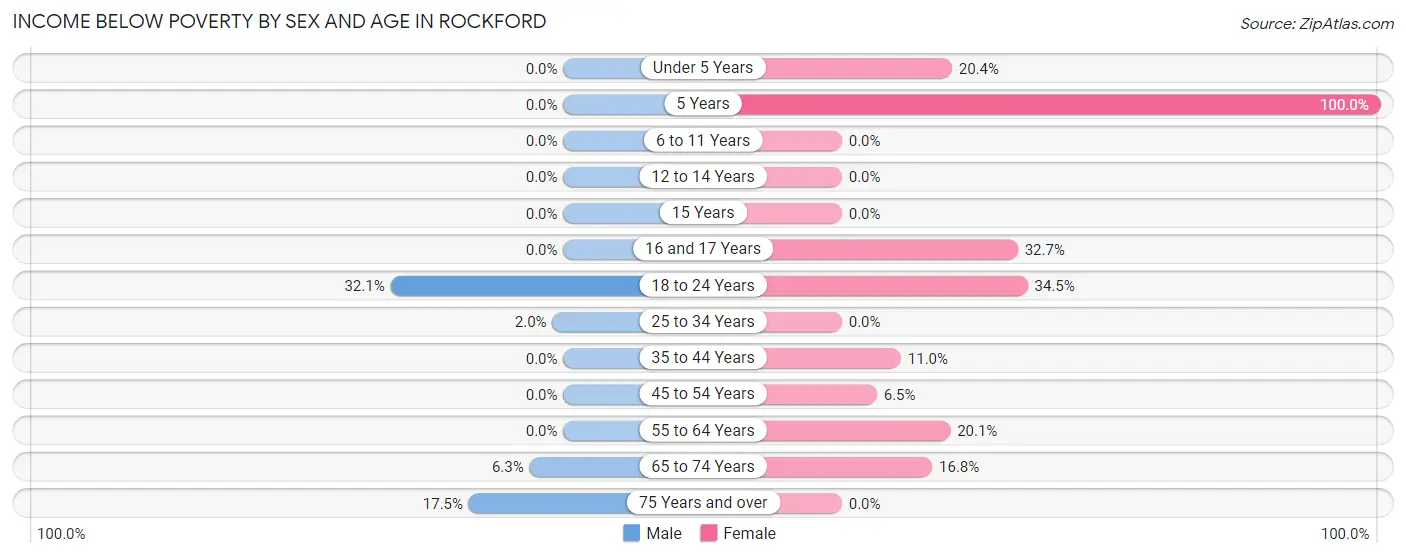
| Age Bracket | Male | Female |
| Under 5 Years | 0 (0.0%) | 29 (20.4%) |
| 5 Years | 0 (0.0%) | 27 (100.0%) |
| 6 to 11 Years | 0 (0.0%) | 0 (0.0%) |
| 12 to 14 Years | 0 (0.0%) | 0 (0.0%) |
| 15 Years | 0 (0.0%) | 0 (0.0%) |
| 16 and 17 Years | 0 (0.0%) | 16 (32.7%) |
| 18 to 24 Years | 103 (32.1%) | 50 (34.5%) |
| 25 to 34 Years | 7 (2.0%) | 0 (0.0%) |
| 35 to 44 Years | 0 (0.0%) | 33 (11.0%) |
| 45 to 54 Years | 0 (0.0%) | 26 (6.5%) |
| 55 to 64 Years | 0 (0.0%) | 68 (20.1%) |
| 65 to 74 Years | 16 (6.3%) | 31 (16.8%) |
| 75 Years and over | 10 (17.5%) | 0 (0.0%) |
| Total | 136 (5.9%) | 280 (12.0%) |
Income Above Poverty by Sex and Age in Rockford
According to the poverty statistics in Rockford, males aged under 5 years and females aged 6 to 11 years are the age groups that are most secure financially, with 100.0% of males and 100.0% of females in these age groups living above the poverty line.
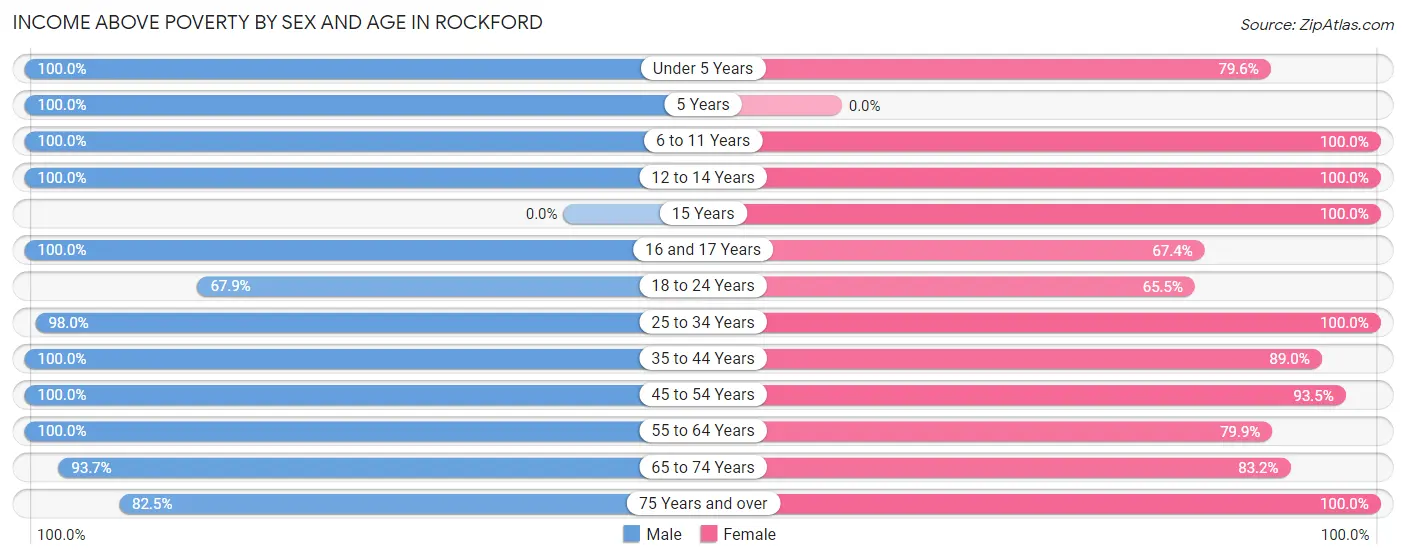
| Age Bracket | Male | Female |
| Under 5 Years | 29 (100.0%) | 113 (79.6%) |
| 5 Years | 7 (100.0%) | 0 (0.0%) |
| 6 to 11 Years | 153 (100.0%) | 149 (100.0%) |
| 12 to 14 Years | 65 (100.0%) | 129 (100.0%) |
| 15 Years | 0 (0.0%) | 99 (100.0%) |
| 16 and 17 Years | 170 (100.0%) | 33 (67.3%) |
| 18 to 24 Years | 218 (67.9%) | 95 (65.5%) |
| 25 to 34 Years | 339 (98.0%) | 266 (100.0%) |
| 35 to 44 Years | 222 (100.0%) | 268 (89.0%) |
| 45 to 54 Years | 458 (100.0%) | 374 (93.5%) |
| 55 to 64 Years | 216 (100.0%) | 270 (79.9%) |
| 65 to 74 Years | 239 (93.7%) | 154 (83.2%) |
| 75 Years and over | 47 (82.5%) | 109 (100.0%) |
| Total | 2,163 (94.1%) | 2,059 (88.0%) |
Income Below Poverty Among Married-Couple Families in Rockford
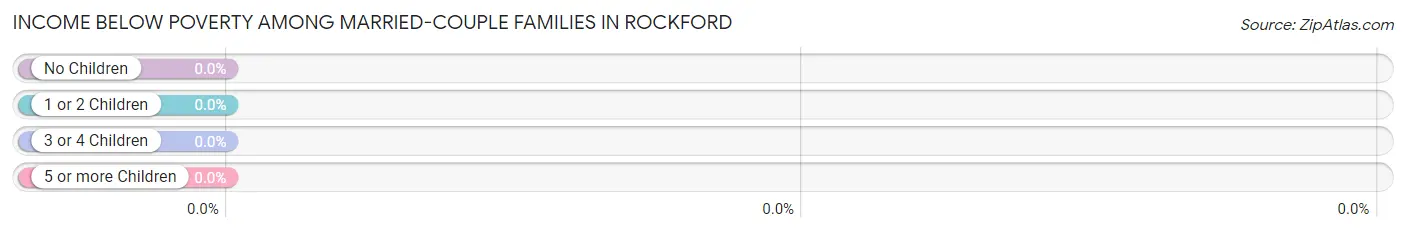
| Children | Above Poverty | Below Poverty |
| No Children | 365 (100.0%) | 0 (0.0%) |
| 1 or 2 Children | 427 (100.0%) | 0 (0.0%) |
| 3 or 4 Children | 37 (100.0%) | 0 (0.0%) |
| 5 or more Children | 0 (0.0%) | 0 (0.0%) |
| Total | 829 (100.0%) | 0 (0.0%) |
Income Below Poverty Among Single-Parent Households in Rockford
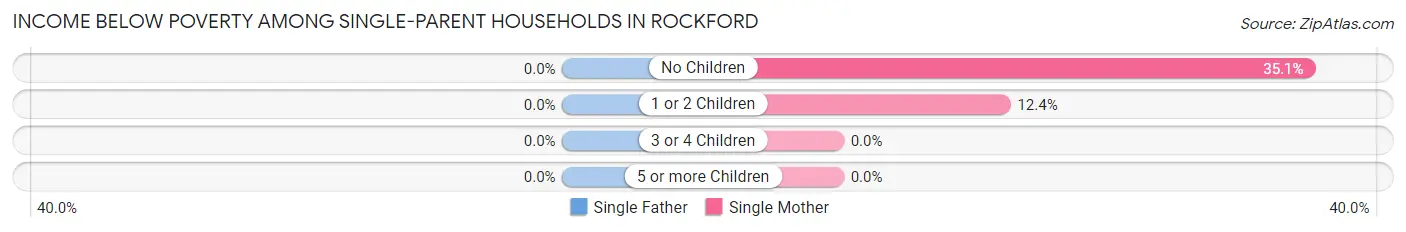
| Children | Single Father | Single Mother |
| No Children | 0 (0.0%) | 26 (35.1%) |
| 1 or 2 Children | 0 (0.0%) | 22 (12.4%) |
| 3 or 4 Children | 0 (0.0%) | 0 (0.0%) |
| 5 or more Children | 0 (0.0%) | 0 (0.0%) |
| Total | 0 (0.0%) | 48 (19.1%) |
Income Below Poverty Among Married-Couple vs Single-Parent Households in Rockford
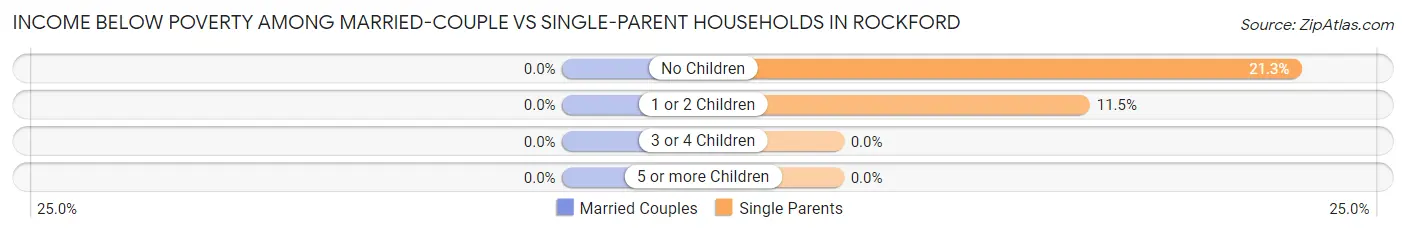
| Children | Married-Couple Families | Single-Parent Households |
| No Children | 0 (0.0%) | 26 (21.3%) |
| 1 or 2 Children | 0 (0.0%) | 22 (11.5%) |
| 3 or 4 Children | 0 (0.0%) | 0 (0.0%) |
| 5 or more Children | 0 (0.0%) | 0 (0.0%) |
| Total | 0 (0.0%) | 48 (15.3%) |
Race in Rockford
The most populous races in Rockford are White / Caucasian (4,269 | 92.0%), Hispanic or Latino (242 | 5.2%), and Asian (174 | 3.7%).
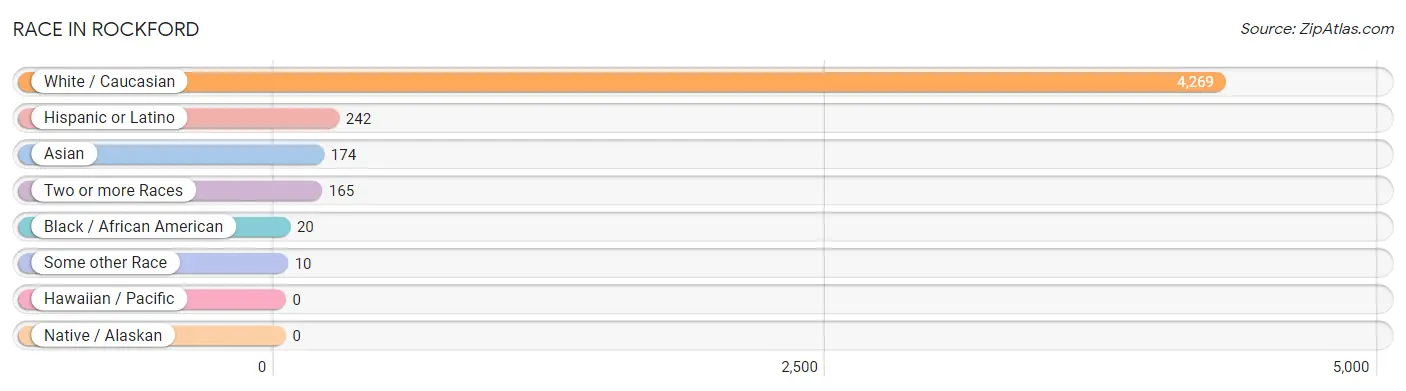
| Race | # Population | % Population |
| Asian | 174 | 3.7% |
| Black / African American | 20 | 0.4% |
| Hawaiian / Pacific | 0 | 0.0% |
| Hispanic or Latino | 242 | 5.2% |
| Native / Alaskan | 0 | 0.0% |
| White / Caucasian | 4,269 | 92.0% |
| Two or more Races | 165 | 3.6% |
| Some other Race | 10 | 0.2% |
| Total | 4,638 | 100.0% |
Ancestry in Rockford
The most populous ancestries reported in Rockford are German (1,389 | 29.9%), Norwegian (867 | 18.7%), Irish (366 | 7.9%), English (271 | 5.8%), and Mexican (242 | 5.2%), together accounting for 67.6% of all Rockford residents.
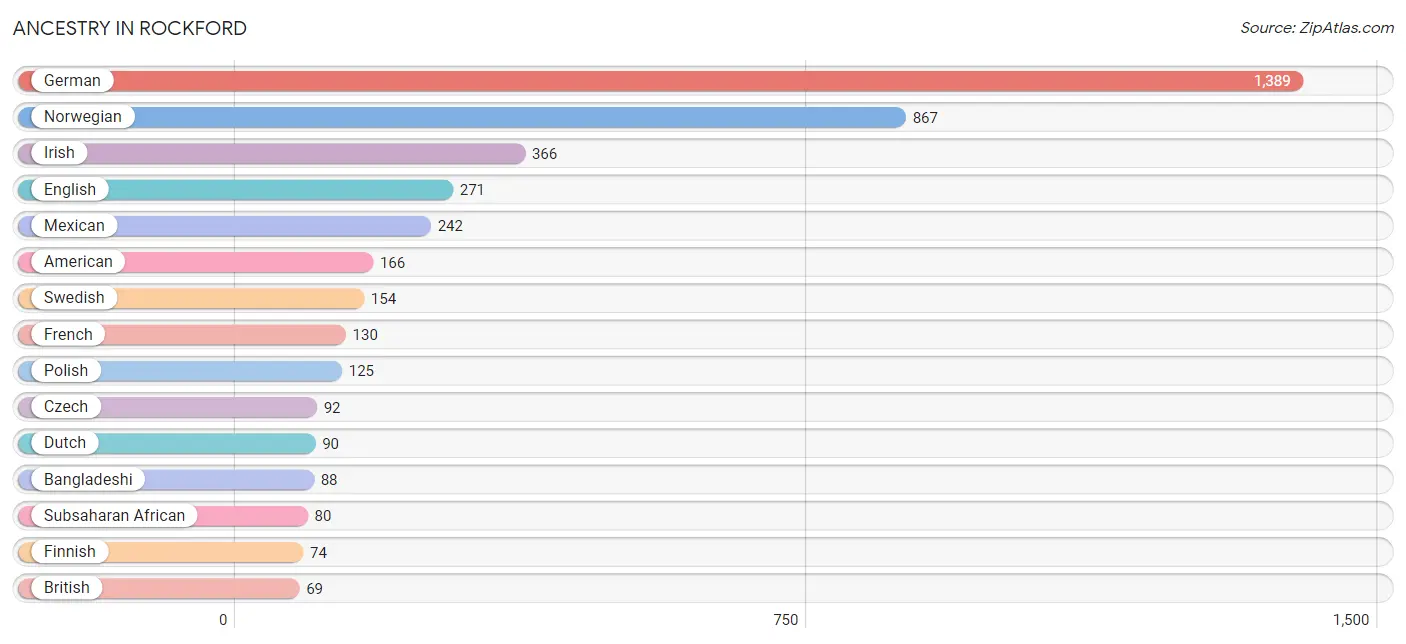
| Ancestry | # Population | % Population |
| African | 56 | 1.2% |
| American | 166 | 3.6% |
| Bangladeshi | 88 | 1.9% |
| British | 69 | 1.5% |
| Burmese | 41 | 0.9% |
| Czech | 92 | 2.0% |
| Dutch | 90 | 1.9% |
| English | 271 | 5.8% |
| Ethiopian | 24 | 0.5% |
| European | 63 | 1.4% |
| Finnish | 74 | 1.6% |
| French | 130 | 2.8% |
| French Canadian | 8 | 0.2% |
| German | 1,389 | 29.9% |
| Indian (Asian) | 19 | 0.4% |
| Irish | 366 | 7.9% |
| Italian | 26 | 0.6% |
| Japanese | 16 | 0.3% |
| Korean | 10 | 0.2% |
| Latvian | 11 | 0.2% |
| Luxembourger | 12 | 0.3% |
| Mexican | 242 | 5.2% |
| Norwegian | 867 | 18.7% |
| Polish | 125 | 2.7% |
| Scandinavian | 26 | 0.6% |
| Scottish | 67 | 1.4% |
| Slavic | 15 | 0.3% |
| Sri Lankan | 35 | 0.7% |
| Subsaharan African | 80 | 1.7% |
| Swedish | 154 | 3.3% |
| Ukrainian | 21 | 0.4% | View All 31 Rows |
Immigrants in Rockford
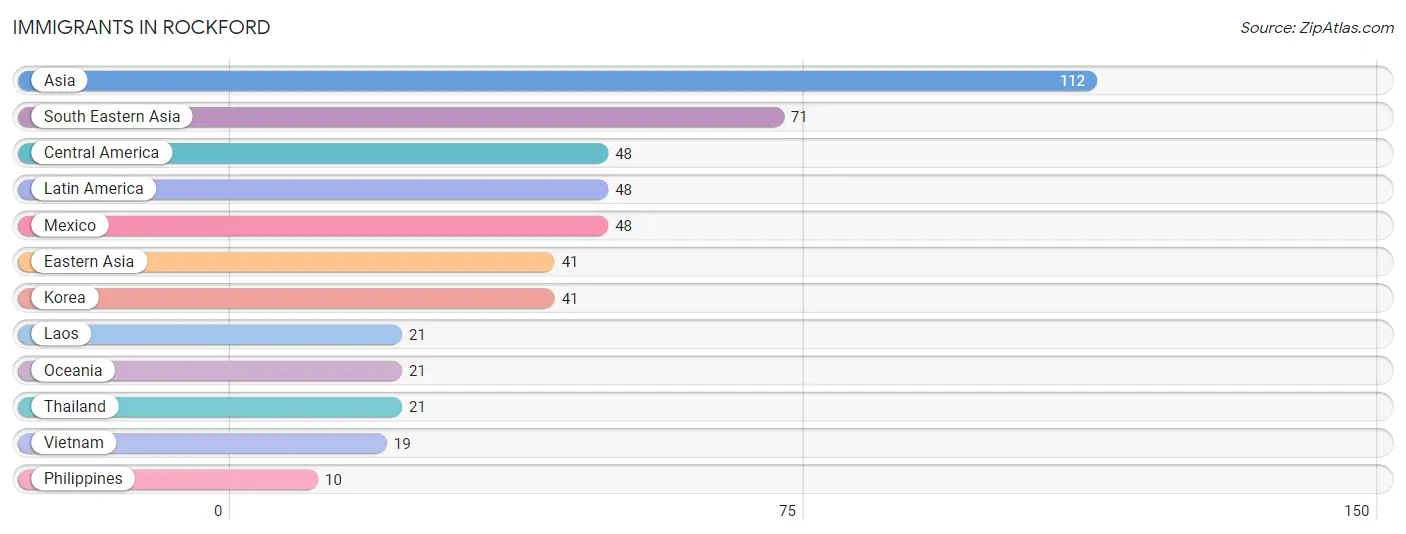
The most numerous immigrant groups reported in Rockford came from Asia (112 | 2.4%), South Eastern Asia (71 | 1.5%), Central America (48 | 1.0%), Latin America (48 | 1.0%), and Mexico (48 | 1.0%), together accounting for 7.0% of all Rockford residents.
| Immigration Origin | # Population | % Population |
| Asia | 112 | 2.4% |
| Central America | 48 | 1.0% |
| Eastern Asia | 41 | 0.9% |
| Korea | 41 | 0.9% |
| Laos | 21 | 0.4% |
| Latin America | 48 | 1.0% |
| Mexico | 48 | 1.0% |
| Oceania | 21 | 0.4% |
| Philippines | 10 | 0.2% |
| South Eastern Asia | 71 | 1.5% |
| Thailand | 21 | 0.4% |
| Vietnam | 19 | 0.4% | View All 12 Rows |
Sex and Age in Rockford
Sex and Age in Rockford
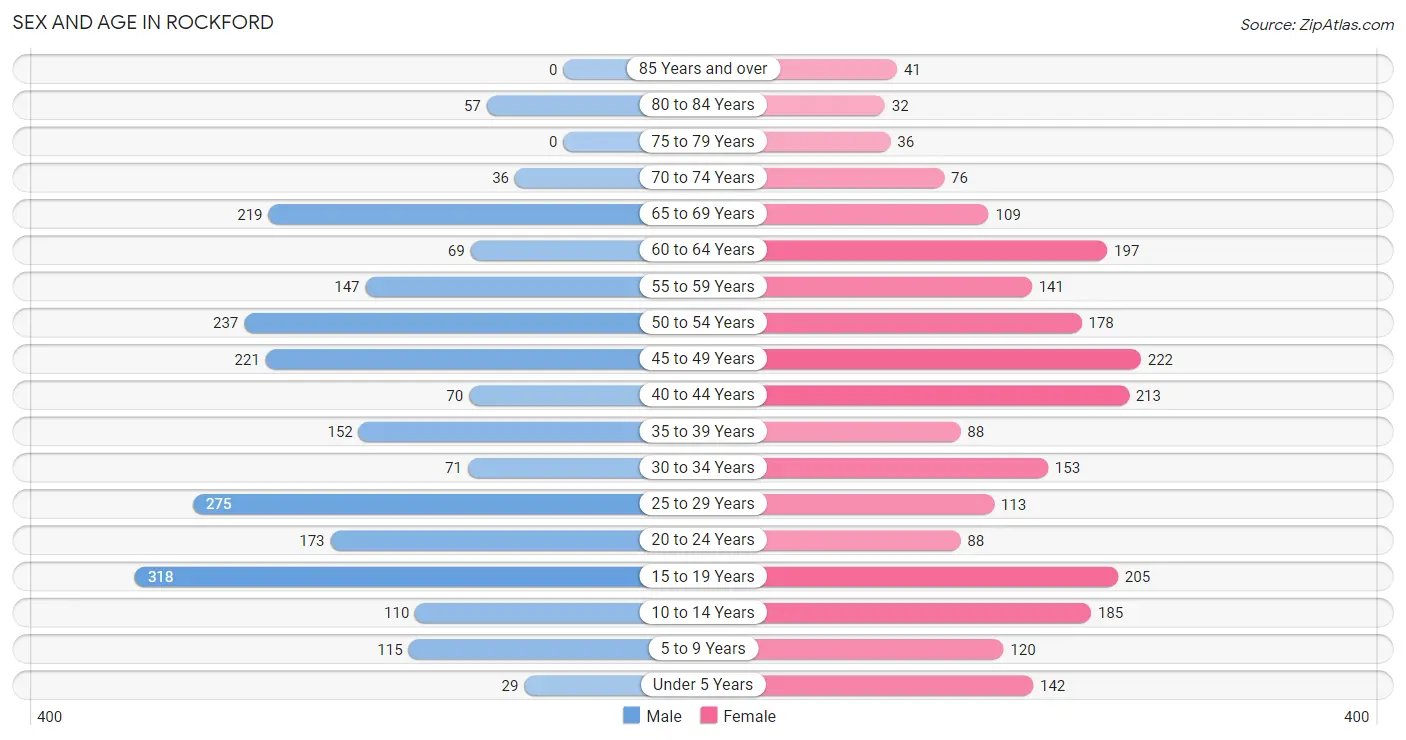
The most populous age groups in Rockford are 15 to 19 Years (318 | 13.8%) for men and 45 to 49 Years (222 | 9.5%) for women.
| Age Bracket | Male | Female |
| Under 5 Years | 29 (1.3%) | 142 (6.1%) |
| 5 to 9 Years | 115 (5.0%) | 120 (5.1%) |
| 10 to 14 Years | 110 (4.8%) | 185 (7.9%) |
| 15 to 19 Years | 318 (13.8%) | 205 (8.8%) |
| 20 to 24 Years | 173 (7.5%) | 88 (3.8%) |
| 25 to 29 Years | 275 (12.0%) | 113 (4.8%) |
| 30 to 34 Years | 71 (3.1%) | 153 (6.5%) |
| 35 to 39 Years | 152 (6.6%) | 88 (3.8%) |
| 40 to 44 Years | 70 (3.0%) | 213 (9.1%) |
| 45 to 49 Years | 221 (9.6%) | 222 (9.5%) |
| 50 to 54 Years | 237 (10.3%) | 178 (7.6%) |
| 55 to 59 Years | 147 (6.4%) | 141 (6.0%) |
| 60 to 64 Years | 69 (3.0%) | 197 (8.4%) |
| 65 to 69 Years | 219 (9.5%) | 109 (4.7%) |
| 70 to 74 Years | 36 (1.6%) | 76 (3.3%) |
| 75 to 79 Years | 0 (0.0%) | 36 (1.5%) |
| 80 to 84 Years | 57 (2.5%) | 32 (1.4%) |
| 85 Years and over | 0 (0.0%) | 41 (1.8%) |
| Total | 2,299 (100.0%) | 2,339 (100.0%) |
Families and Households in Rockford
Median Family Size in Rockford
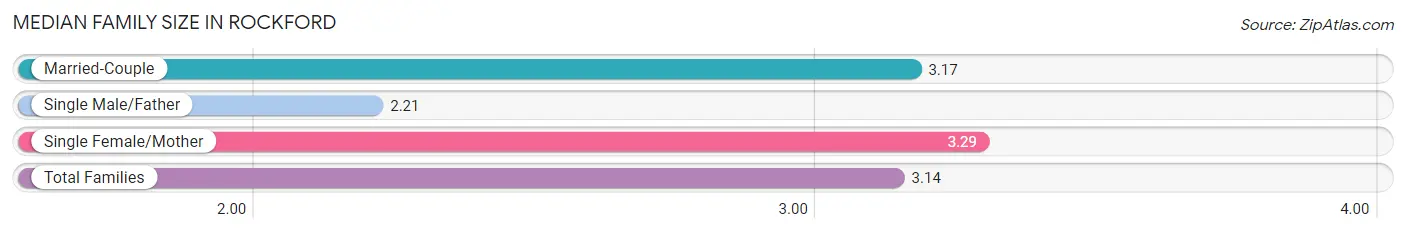
The median family size in Rockford is 3.14 persons per family, with single female/mother families (251 | 22.0%) accounting for the largest median family size of 3.29 persons per family. On the other hand, single male/father families (63 | 5.5%) represent the smallest median family size with 2.21 persons per family.
| Family Type | # Families | Family Size |
| Married-Couple | 829 (72.5%) | 3.17 |
| Single Male/Father | 63 (5.5%) | 2.21 |
| Single Female/Mother | 251 (22.0%) | 3.29 |
| Total Families | 1,143 (100.0%) | 3.14 |
Median Household Size in Rockford
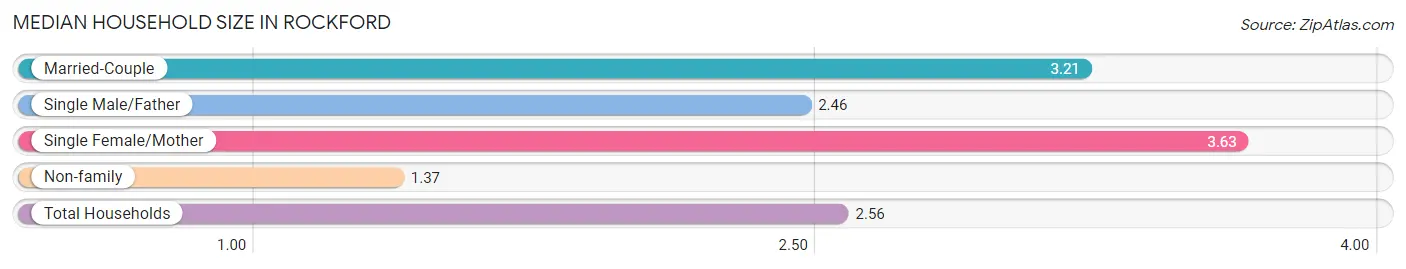
The median household size in Rockford is 2.56 persons per household, with single female/mother households (251 | 13.9%) accounting for the largest median household size of 3.63 persons per household. non-family households (667 | 36.8%) represent the smallest median household size with 1.37 persons per household.
| Household Type | # Households | Household Size |
| Married-Couple | 829 (45.8%) | 3.21 |
| Single Male/Father | 63 (3.5%) | 2.46 |
| Single Female/Mother | 251 (13.9%) | 3.63 |
| Non-family | 667 (36.8%) | 1.37 |
| Total Households | 1,810 (100.0%) | 2.56 |
Household Size by Marriage Status in Rockford
Out of a total of 1,810 households in Rockford, 1,143 (63.1%) are family households, while 667 (36.8%) are nonfamily households. The most numerous type of family households are 2-person households, comprising 449, and the most common type of nonfamily households are 1-person households, comprising 487.
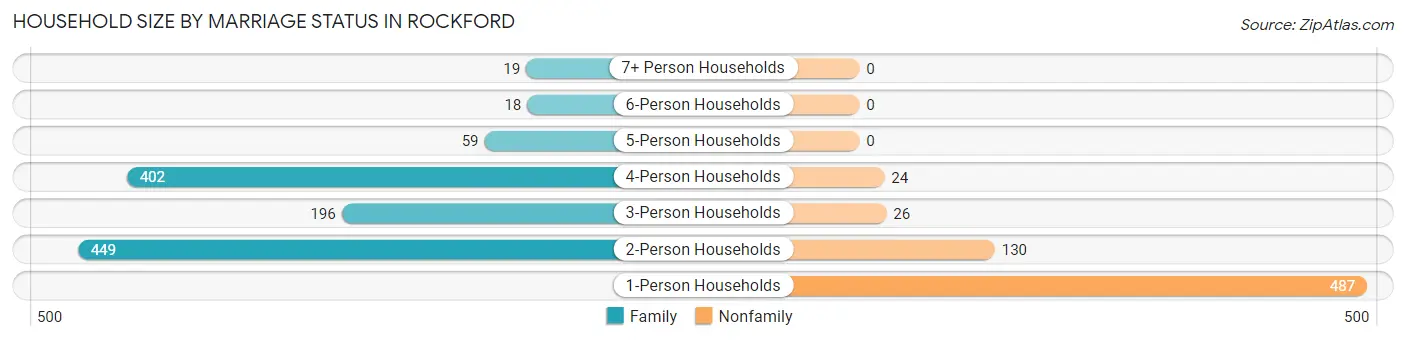
| Household Size | Family Households | Nonfamily Households |
| 1-Person Households | - | 487 (26.9%) |
| 2-Person Households | 449 (24.8%) | 130 (7.2%) |
| 3-Person Households | 196 (10.8%) | 26 (1.4%) |
| 4-Person Households | 402 (22.2%) | 24 (1.3%) |
| 5-Person Households | 59 (3.3%) | 0 (0.0%) |
| 6-Person Households | 18 (1.0%) | 0 (0.0%) |
| 7+ Person Households | 19 (1.1%) | 0 (0.0%) |
| Total | 1,143 (63.1%) | 667 (36.8%) |
Female Fertility in Rockford
Fertility by Age in Rockford
Average fertility rate in Rockford is 19.0 births per 1,000 women. Women in the age bracket of 20 to 34 years have the highest fertility rate with 59.0 births per 1,000 women. Women in the age bracket of 20 to 34 years acount for 100.0% of all women with births.
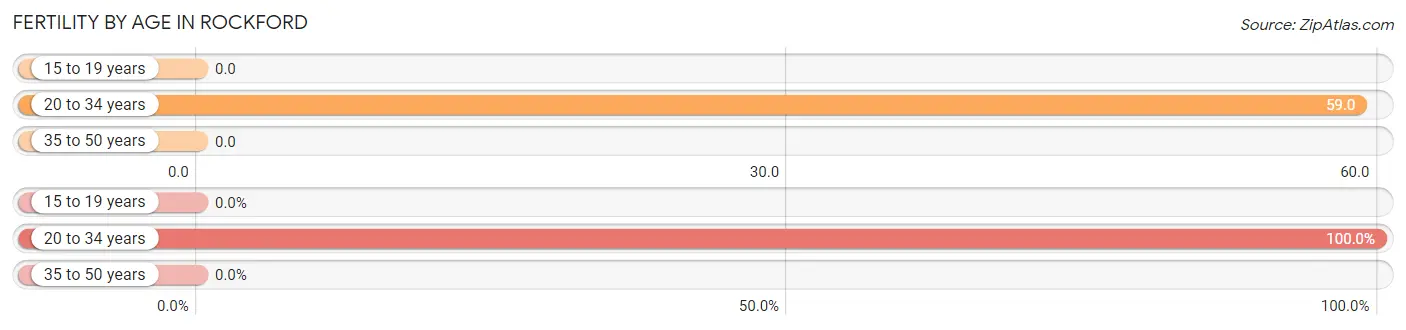
| Age Bracket | Women with Births | Births / 1,000 Women |
| 15 to 19 years | 0 (0.0%) | 0.0 |
| 20 to 34 years | 21 (100.0%) | 59.0 |
| 35 to 50 years | 0 (0.0%) | 0.0 |
| Total | 21 (100.0%) | 19.0 |
Fertility by Age by Marriage Status in Rockford
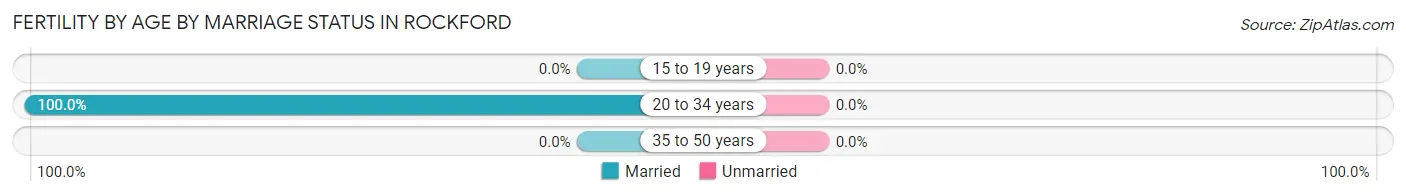
| Age Bracket | Married | Unmarried |
| 15 to 19 years | 0 (0.0%) | 0 (0.0%) |
| 20 to 34 years | 21 (100.0%) | 0 (0.0%) |
| 35 to 50 years | 0 (0.0%) | 0 (0.0%) |
| Total | 21 (100.0%) | 0 (0.0%) |
Fertility by Education in Rockford
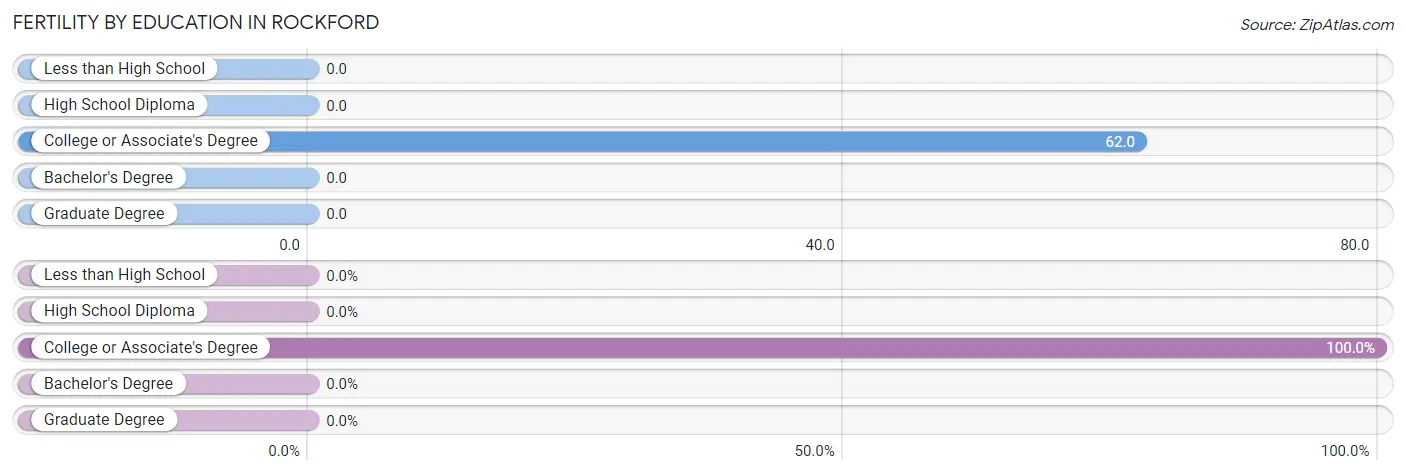
| Educational Attainment | Women with Births | Births / 1,000 Women |
| Less than High School | 0 (0.0%) | 0.0 |
| High School Diploma | 0 (0.0%) | 0.0 |
| College or Associate's Degree | 21 (100.0%) | 62.0 |
| Bachelor's Degree | 0 (0.0%) | 0.0 |
| Graduate Degree | 0 (0.0%) | 0.0 |
| Total | 21 (100.0%) | 19.0 |
Fertility by Education by Marriage Status in Rockford
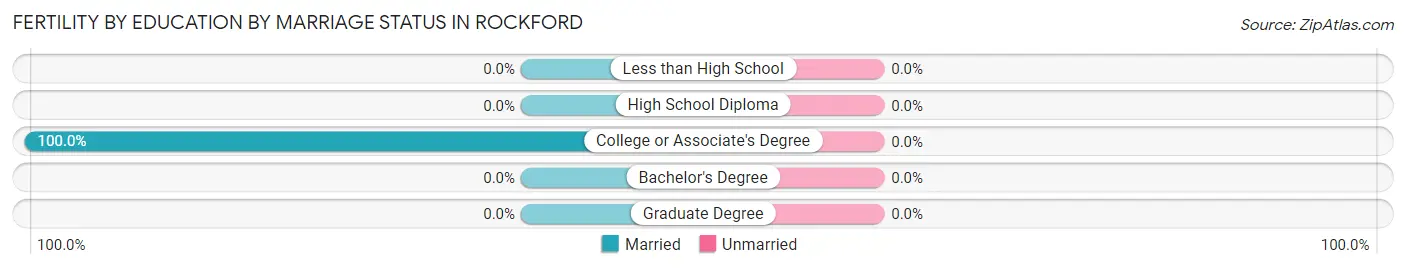
| Educational Attainment | Married | Unmarried |
| Less than High School | 0 (0.0%) | 0 (0.0%) |
| High School Diploma | 0 (0.0%) | 0 (0.0%) |
| College or Associate's Degree | 21 (100.0%) | 0 (0.0%) |
| Bachelor's Degree | 0 (0.0%) | 0 (0.0%) |
| Graduate Degree | 0 (0.0%) | 0 (0.0%) |
| Total | 21 (100.0%) | 0 (0.0%) |
Employment Characteristics in Rockford
Employment by Class of Employer in Rockford
Among the 2,721 employed individuals in Rockford, private company employees (1,929 | 70.9%), local government employees (284 | 10.4%), and not-for-profit organizations (216 | 7.9%) make up the most common classes of employment.
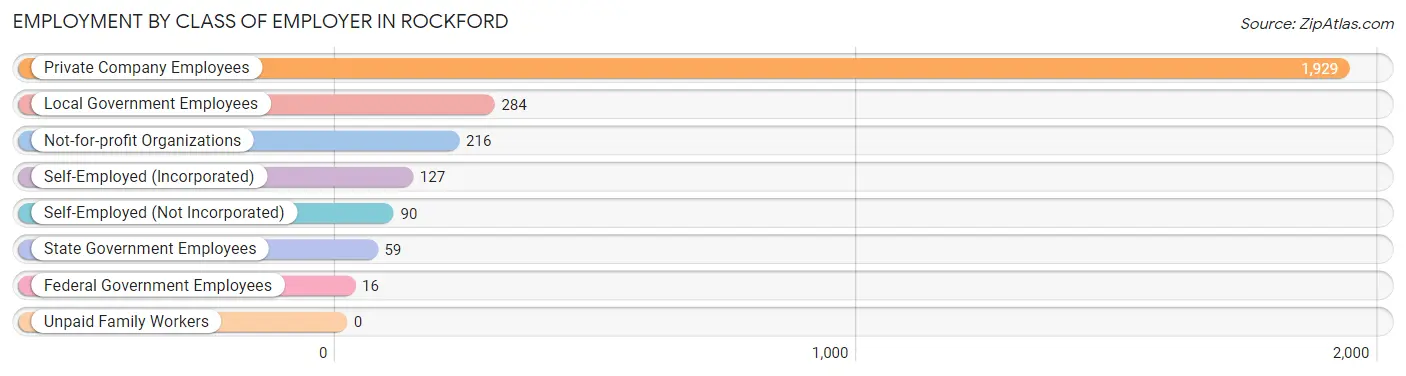
| Employer Class | # Employees | % Employees |
| Private Company Employees | 1,929 | 70.9% |
| Self-Employed (Incorporated) | 127 | 4.7% |
| Self-Employed (Not Incorporated) | 90 | 3.3% |
| Not-for-profit Organizations | 216 | 7.9% |
| Local Government Employees | 284 | 10.4% |
| State Government Employees | 59 | 2.2% |
| Federal Government Employees | 16 | 0.6% |
| Unpaid Family Workers | 0 | 0.0% |
| Total | 2,721 | 100.0% |
Employment Status by Age in Rockford
According to the labor force statistics for Rockford, out of the total population over 16 years of age (3,838), 73.2% or 2,809 individuals are in the labor force, with 3.1% or 87 of them unemployed. The age group with the highest labor force participation rate is 30 to 34 years, with 100.0% or 224 individuals in the labor force. Within the labor force, the 35 to 44 years age range has the highest percentage of unemployed individuals, with 10.9% or 50 of them being unemployed.
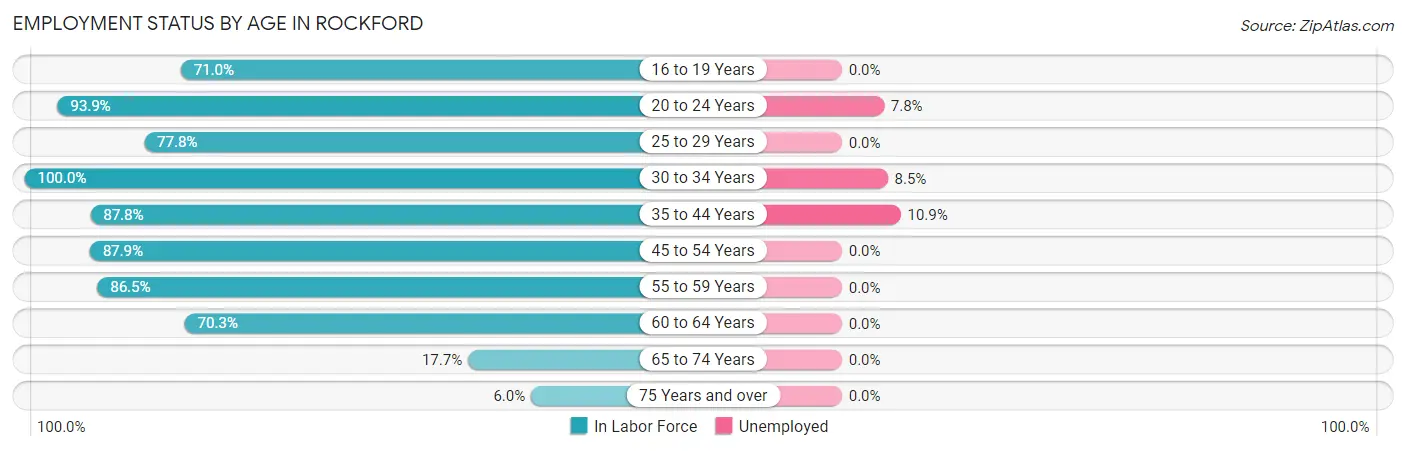
| Age Bracket | In Labor Force | Unemployed |
| 16 to 19 Years | 301 (71.0%) | 0 (0.0%) |
| 20 to 24 Years | 245 (93.9%) | 19 (7.8%) |
| 25 to 29 Years | 302 (77.8%) | 0 (0.0%) |
| 30 to 34 Years | 224 (100.0%) | 19 (8.5%) |
| 35 to 44 Years | 459 (87.8%) | 50 (10.9%) |
| 45 to 54 Years | 754 (87.9%) | 0 (0.0%) |
| 55 to 59 Years | 249 (86.5%) | 0 (0.0%) |
| 60 to 64 Years | 187 (70.3%) | 0 (0.0%) |
| 65 to 74 Years | 78 (17.7%) | 0 (0.0%) |
| 75 Years and over | 10 (6.0%) | 0 (0.0%) |
| Total | 2,809 (73.2%) | 87 (3.1%) |
Employment Status by Educational Attainment in Rockford
According to labor force statistics for Rockford, 85.4% of individuals (2,175) out of the total population between 25 and 64 years of age (2,547) are in the labor force, with 3.2% or 70 of them being unemployed. The group with the highest labor force participation rate are those with the educational attainment of college / associate degree, with 96.5% or 752 individuals in the labor force. Within the labor force, individuals with college / associate degree education have the highest percentage of unemployment, with 5.5% or 41 of them being unemployed.
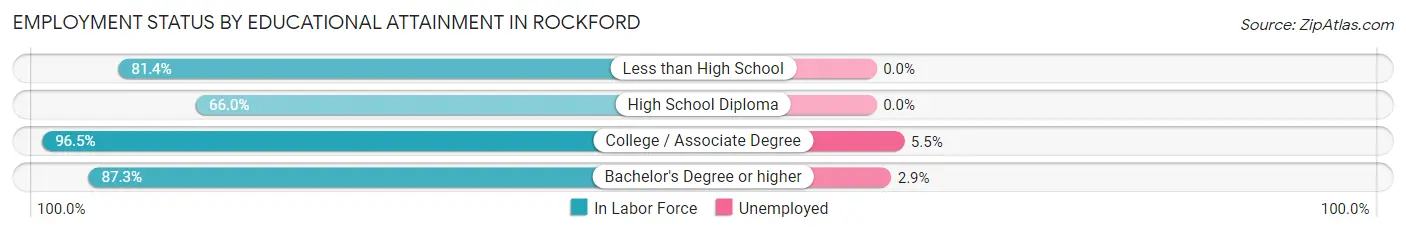
| Educational Attainment | In Labor Force | Unemployed |
| Less than High School | 114 (81.4%) | 0 (0.0%) |
| High School Diploma | 348 (66.0%) | 0 (0.0%) |
| College / Associate Degree | 752 (96.5%) | 43 (5.5%) |
| Bachelor's Degree or higher | 961 (87.3%) | 32 (2.9%) |
| Total | 2,175 (85.4%) | 82 (3.2%) |
Employment Occupations by Sex in Rockford
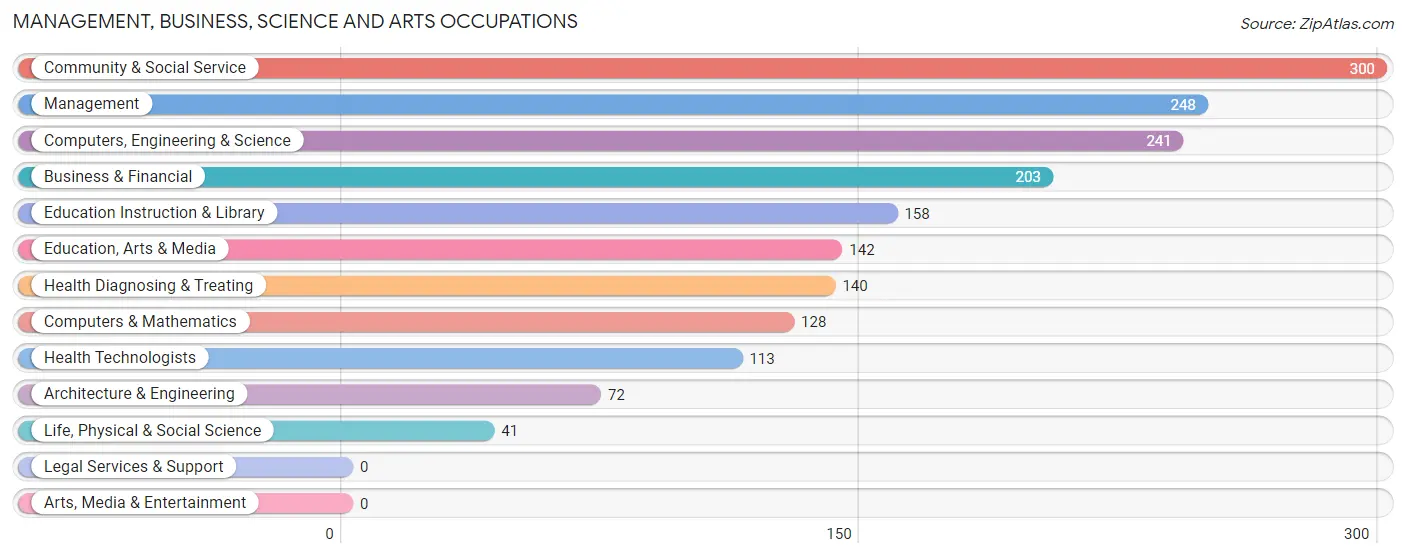
Management, Business, Science and Arts Occupations
The most common Management, Business, Science and Arts occupations in Rockford are Community & Social Service (300 | 11.0%), Management (248 | 9.1%), Computers, Engineering & Science (241 | 8.9%), Business & Financial (203 | 7.5%), and Education Instruction & Library (158 | 5.8%).
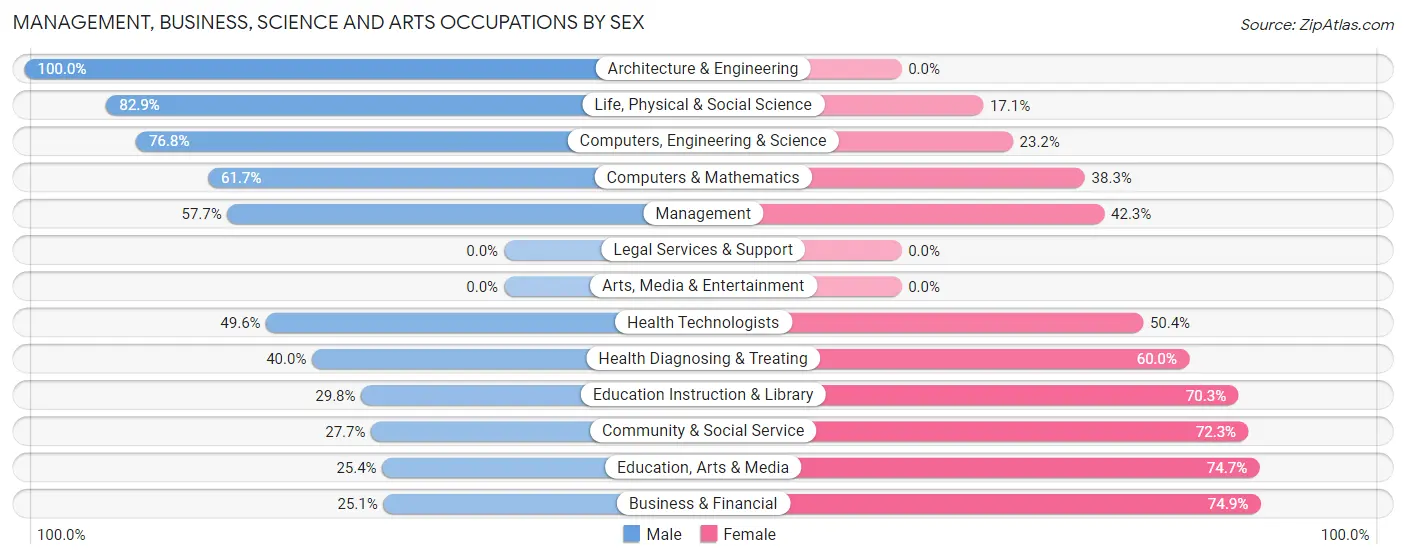
Management, Business, Science and Arts Occupations by Sex
Within the Management, Business, Science and Arts occupations in Rockford, the most male-oriented occupations are Architecture & Engineering (100.0%), Life, Physical & Social Science (82.9%), and Computers, Engineering & Science (76.8%), while the most female-oriented occupations are Business & Financial (74.9%), Education, Arts & Media (74.7%), and Community & Social Service (72.3%).
| Occupation | Male | Female |
| Management | 143 (57.7%) | 105 (42.3%) |
| Business & Financial | 51 (25.1%) | 152 (74.9%) |
| Computers, Engineering & Science | 185 (76.8%) | 56 (23.2%) |
| Computers & Mathematics | 79 (61.7%) | 49 (38.3%) |
| Architecture & Engineering | 72 (100.0%) | 0 (0.0%) |
| Life, Physical & Social Science | 34 (82.9%) | 7 (17.1%) |
| Community & Social Service | 83 (27.7%) | 217 (72.3%) |
| Education, Arts & Media | 36 (25.4%) | 106 (74.7%) |
| Legal Services & Support | 0 (0.0%) | 0 (0.0%) |
| Education Instruction & Library | 47 (29.7%) | 111 (70.3%) |
| Arts, Media & Entertainment | 0 (0.0%) | 0 (0.0%) |
| Health Diagnosing & Treating | 56 (40.0%) | 84 (60.0%) |
| Health Technologists | 56 (49.6%) | 57 (50.4%) |
| Total (Category) | 518 (45.8%) | 614 (54.2%) |
| Total (Overall) | 1,454 (53.4%) | 1,267 (46.6%) |
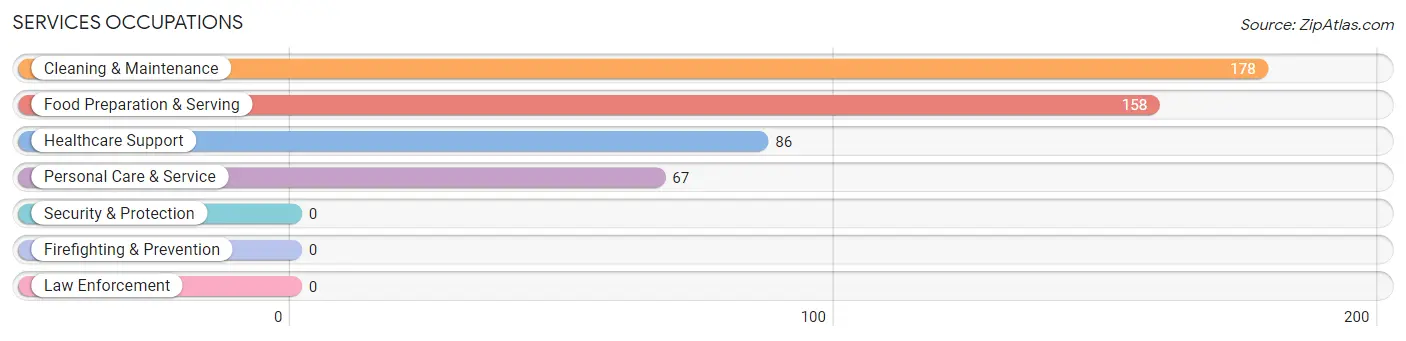
Services Occupations
The most common Services occupations in Rockford are Cleaning & Maintenance (178 | 6.5%), Food Preparation & Serving (158 | 5.8%), Healthcare Support (86 | 3.2%), and Personal Care & Service (67 | 2.5%).
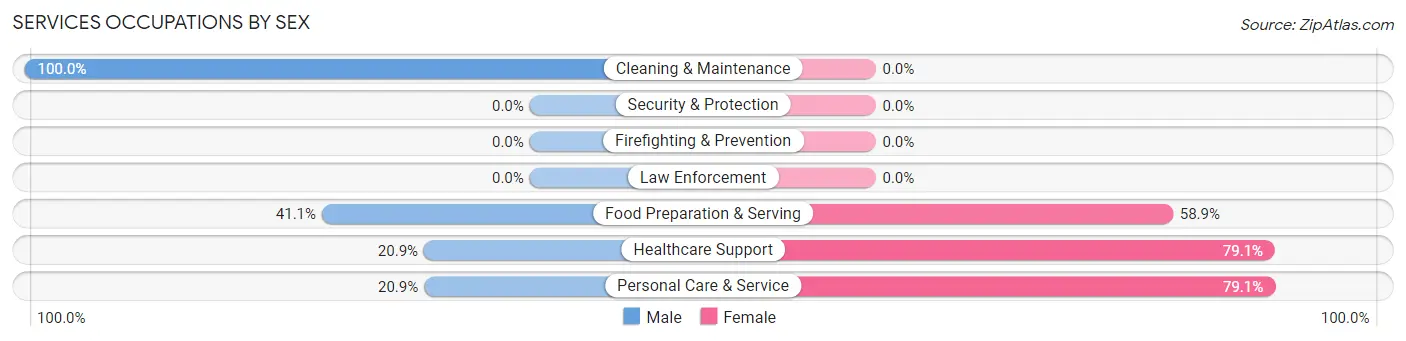
Services Occupations by Sex
Within the Services occupations in Rockford, the most male-oriented occupations are Cleaning & Maintenance (100.0%), Food Preparation & Serving (41.1%), and Healthcare Support (20.9%), while the most female-oriented occupations are Personal Care & Service (79.1%), Healthcare Support (79.1%), and Food Preparation & Serving (58.9%).
| Occupation | Male | Female |
| Healthcare Support | 18 (20.9%) | 68 (79.1%) |
| Security & Protection | 0 (0.0%) | 0 (0.0%) |
| Firefighting & Prevention | 0 (0.0%) | 0 (0.0%) |
| Law Enforcement | 0 (0.0%) | 0 (0.0%) |
| Food Preparation & Serving | 65 (41.1%) | 93 (58.9%) |
| Cleaning & Maintenance | 178 (100.0%) | 0 (0.0%) |
| Personal Care & Service | 14 (20.9%) | 53 (79.1%) |
| Total (Category) | 275 (56.2%) | 214 (43.8%) |
| Total (Overall) | 1,454 (53.4%) | 1,267 (46.6%) |
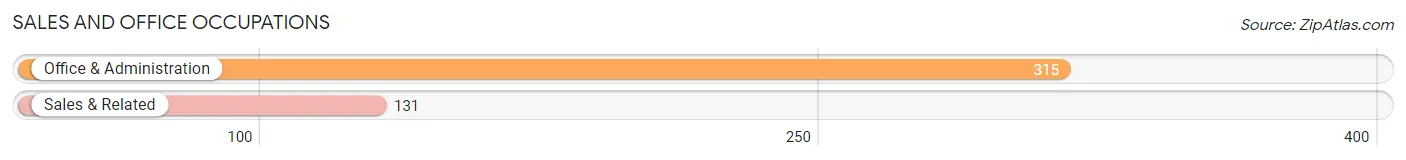
Sales and Office Occupations
The most common Sales and Office occupations in Rockford are Office & Administration (315 | 11.6%), and Sales & Related (131 | 4.8%).
Sales and Office Occupations by Sex
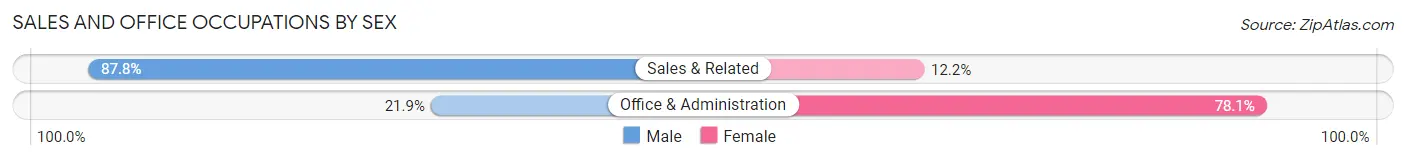
| Occupation | Male | Female |
| Sales & Related | 115 (87.8%) | 16 (12.2%) |
| Office & Administration | 69 (21.9%) | 246 (78.1%) |
| Total (Category) | 184 (41.3%) | 262 (58.7%) |
| Total (Overall) | 1,454 (53.4%) | 1,267 (46.6%) |
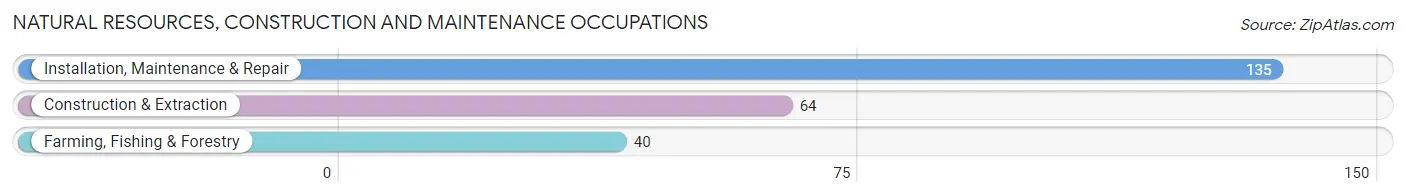
Natural Resources, Construction and Maintenance Occupations
The most common Natural Resources, Construction and Maintenance occupations in Rockford are Installation, Maintenance & Repair (135 | 5.0%), Construction & Extraction (64 | 2.4%), and Farming, Fishing & Forestry (40 | 1.5%).
Natural Resources, Construction and Maintenance Occupations by Sex
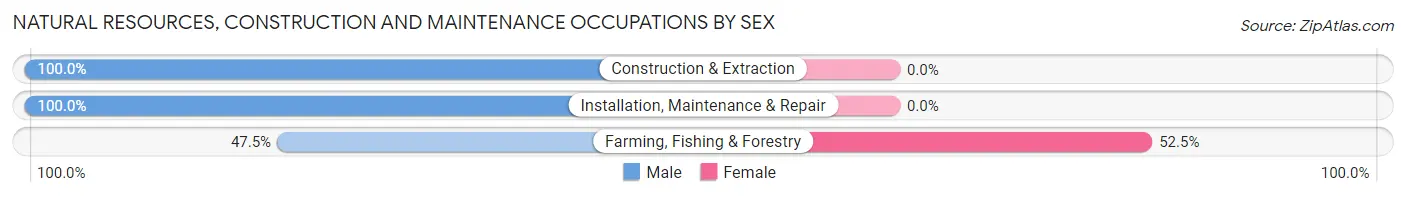
| Occupation | Male | Female |
| Farming, Fishing & Forestry | 19 (47.5%) | 21 (52.5%) |
| Construction & Extraction | 64 (100.0%) | 0 (0.0%) |
| Installation, Maintenance & Repair | 135 (100.0%) | 0 (0.0%) |
| Total (Category) | 218 (91.2%) | 21 (8.8%) |
| Total (Overall) | 1,454 (53.4%) | 1,267 (46.6%) |
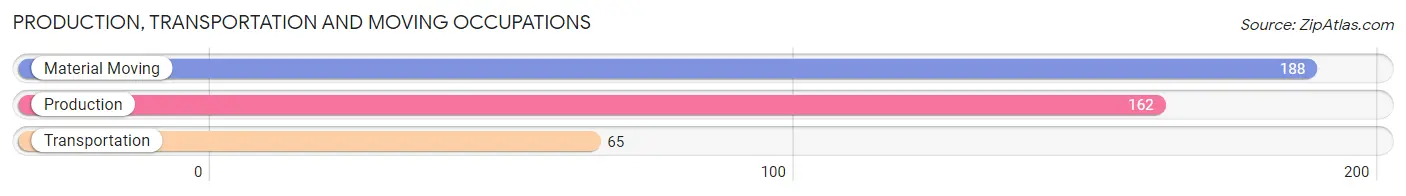
Production, Transportation and Moving Occupations
The most common Production, Transportation and Moving occupations in Rockford are Material Moving (188 | 6.9%), Production (162 | 5.9%), and Transportation (65 | 2.4%).
Production, Transportation and Moving Occupations by Sex
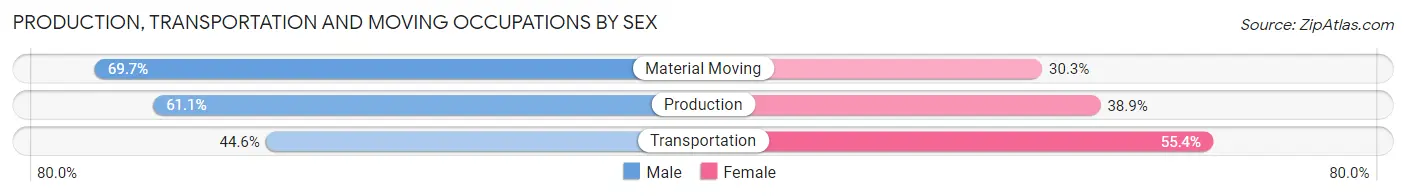
| Occupation | Male | Female |
| Production | 99 (61.1%) | 63 (38.9%) |
| Transportation | 29 (44.6%) | 36 (55.4%) |
| Material Moving | 131 (69.7%) | 57 (30.3%) |
| Total (Category) | 259 (62.4%) | 156 (37.6%) |
| Total (Overall) | 1,454 (53.4%) | 1,267 (46.6%) |
Employment Industries by Sex in Rockford
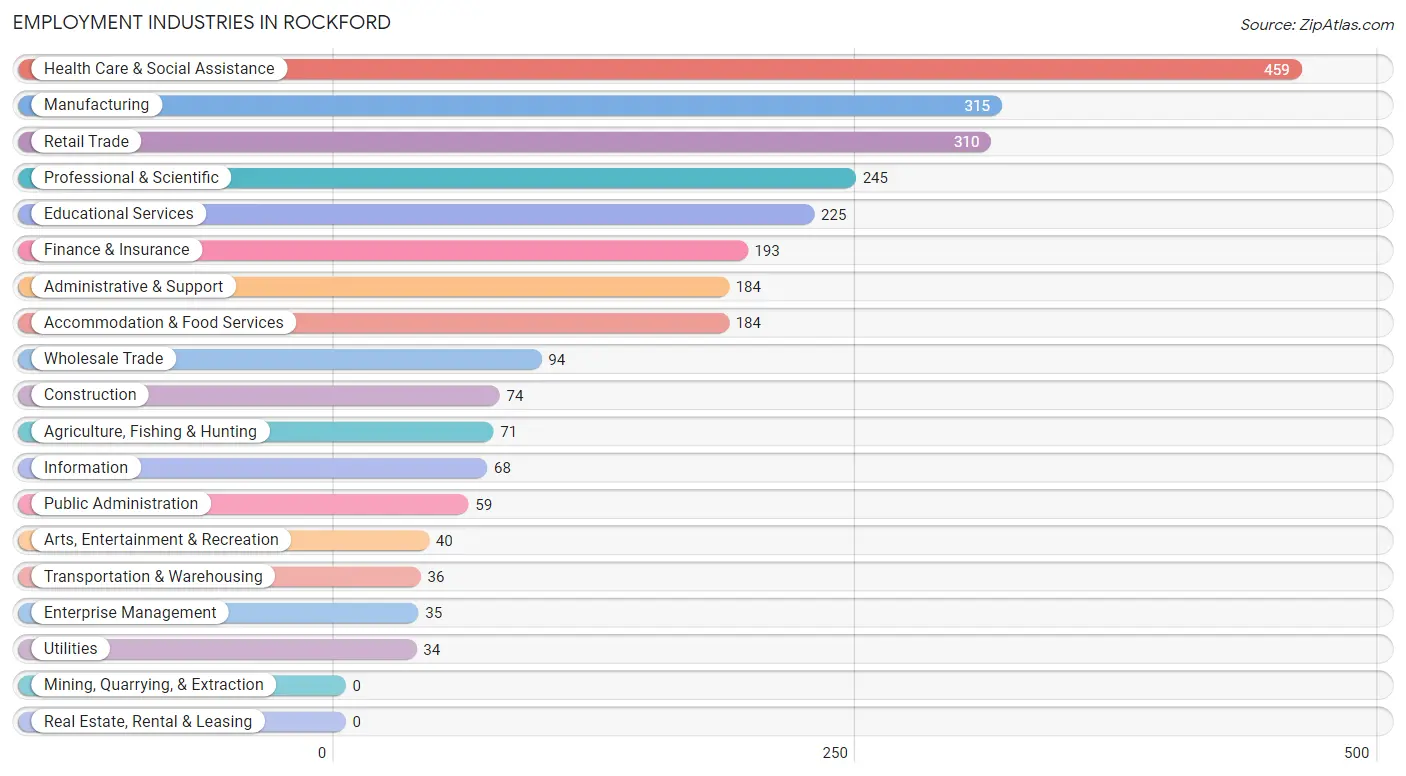
Employment Industries in Rockford
The major employment industries in Rockford include Health Care & Social Assistance (459 | 16.9%), Manufacturing (315 | 11.6%), Retail Trade (310 | 11.4%), Professional & Scientific (245 | 9.0%), and Educational Services (225 | 8.3%).
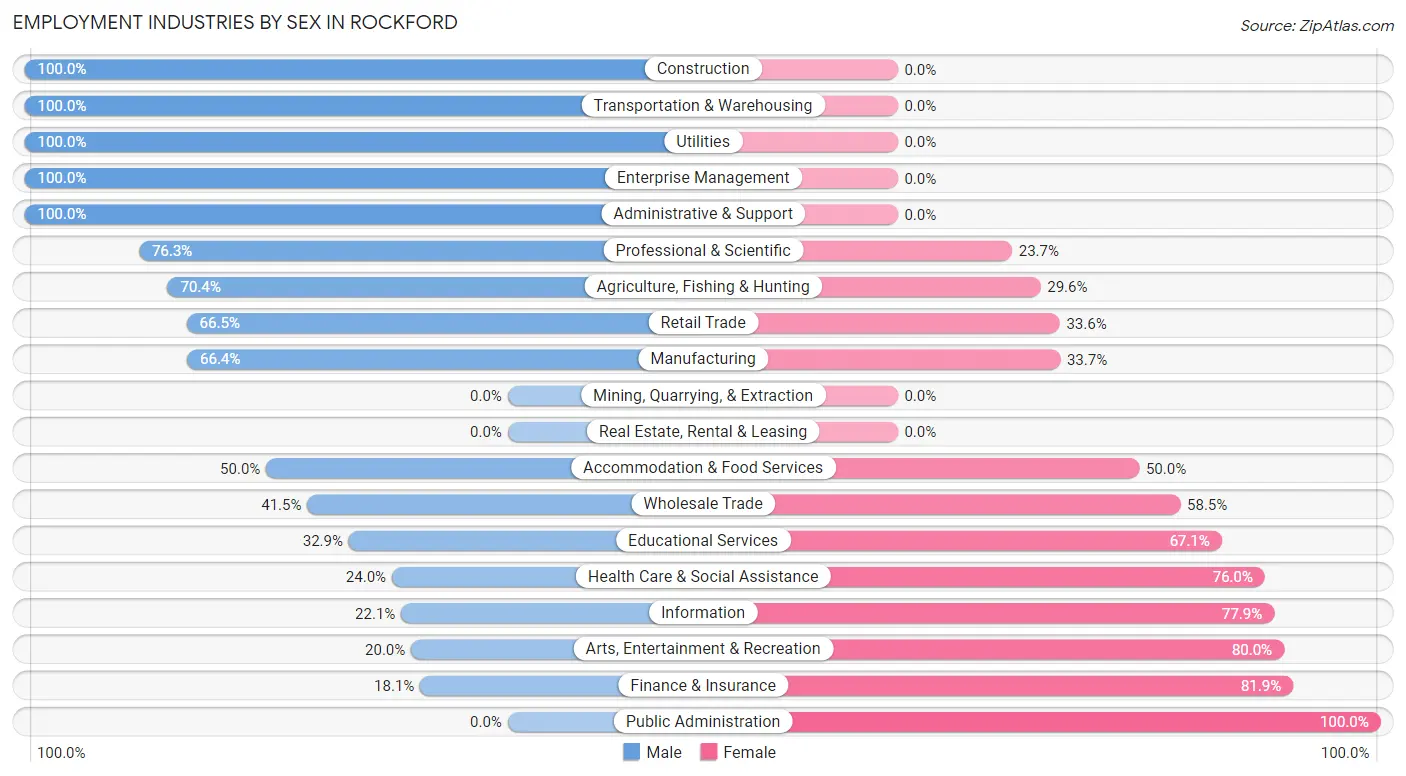
Employment Industries by Sex in Rockford
The Rockford industries that see more men than women are Construction (100.0%), Transportation & Warehousing (100.0%), and Utilities (100.0%), whereas the industries that tend to have a higher number of women are Public Administration (100.0%), Finance & Insurance (81.9%), and Arts, Entertainment & Recreation (80.0%).
| Industry | Male | Female |
| Agriculture, Fishing & Hunting | 50 (70.4%) | 21 (29.6%) |
| Mining, Quarrying, & Extraction | 0 (0.0%) | 0 (0.0%) |
| Construction | 74 (100.0%) | 0 (0.0%) |
| Manufacturing | 209 (66.3%) | 106 (33.7%) |
| Wholesale Trade | 39 (41.5%) | 55 (58.5%) |
| Retail Trade | 206 (66.4%) | 104 (33.6%) |
| Transportation & Warehousing | 36 (100.0%) | 0 (0.0%) |
| Utilities | 34 (100.0%) | 0 (0.0%) |
| Information | 15 (22.1%) | 53 (77.9%) |
| Finance & Insurance | 35 (18.1%) | 158 (81.9%) |
| Real Estate, Rental & Leasing | 0 (0.0%) | 0 (0.0%) |
| Professional & Scientific | 187 (76.3%) | 58 (23.7%) |
| Enterprise Management | 35 (100.0%) | 0 (0.0%) |
| Administrative & Support | 184 (100.0%) | 0 (0.0%) |
| Educational Services | 74 (32.9%) | 151 (67.1%) |
| Health Care & Social Assistance | 110 (24.0%) | 349 (76.0%) |
| Arts, Entertainment & Recreation | 8 (20.0%) | 32 (80.0%) |
| Accommodation & Food Services | 92 (50.0%) | 92 (50.0%) |
| Public Administration | 0 (0.0%) | 59 (100.0%) |
| Total | 1,454 (53.4%) | 1,267 (46.6%) |
Education in Rockford
School Enrollment in Rockford
The most common levels of schooling among the 1,202 students in Rockford are high school (375 | 31.2%), elementary school (244 | 20.3%), and middle school (221 | 18.4%).
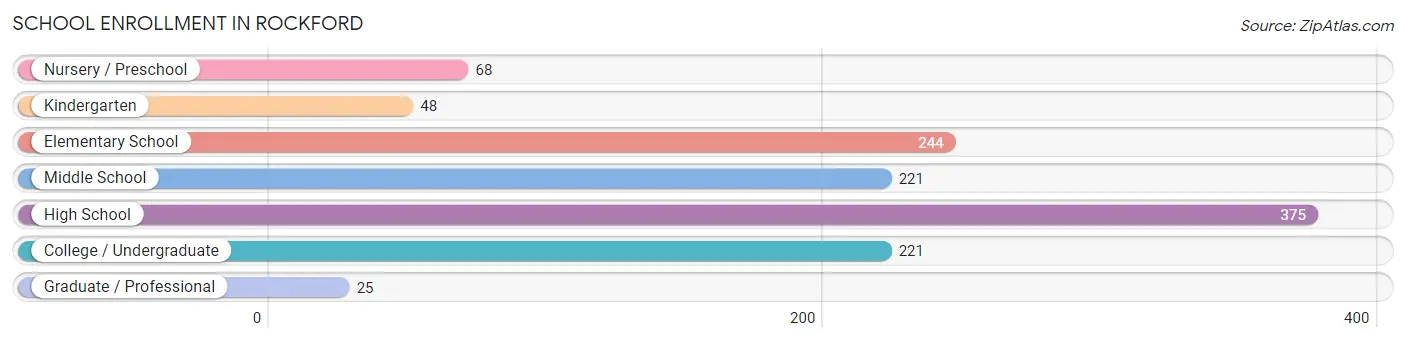
| School Level | # Students | % Students |
| Nursery / Preschool | 68 | 5.7% |
| Kindergarten | 48 | 4.0% |
| Elementary School | 244 | 20.3% |
| Middle School | 221 | 18.4% |
| High School | 375 | 31.2% |
| College / Undergraduate | 221 | 18.4% |
| Graduate / Professional | 25 | 2.1% |
| Total | 1,202 | 100.0% |
School Enrollment by Age by Funding Source in Rockford
Out of a total of 1,202 students who are enrolled in schools in Rockford, 244 (20.3%) attend a private institution, while the remaining 958 (79.7%) are enrolled in public schools. The age group of 3 to 4 year olds has the highest likelihood of being enrolled in private schools, with 48 (78.7% in the age bracket) enrolled. Conversely, the age group of 18 to 19 year olds has the lowest likelihood of being enrolled in a private school, with 126 (100.0% in the age bracket) attending a public institution.
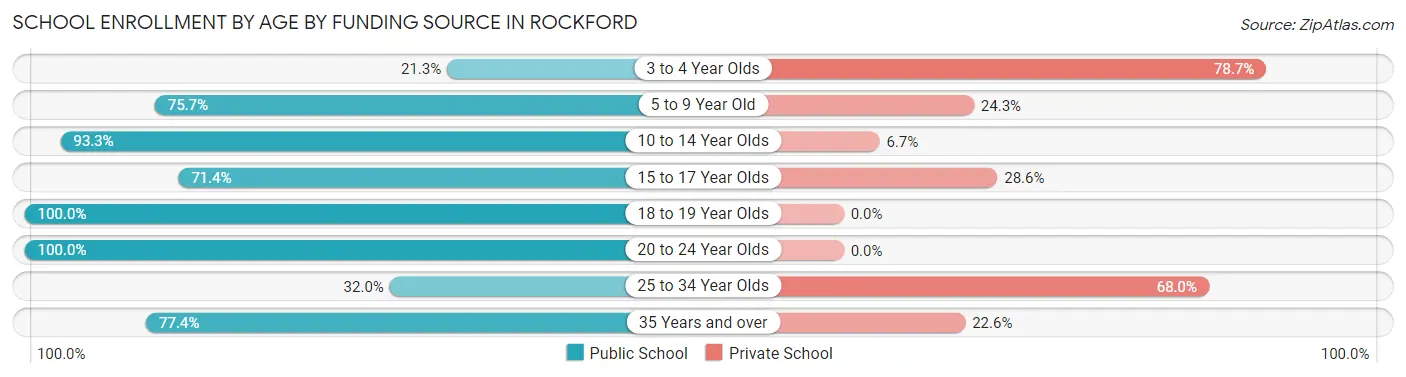
| Age Bracket | Public School | Private School |
| 3 to 4 Year Olds | 13 (21.3%) | 48 (78.7%) |
| 5 to 9 Year Old | 178 (75.7%) | 57 (24.3%) |
| 10 to 14 Year Olds | 266 (93.3%) | 19 (6.7%) |
| 15 to 17 Year Olds | 227 (71.4%) | 91 (28.6%) |
| 18 to 19 Year Olds | 126 (100.0%) | 0 (0.0%) |
| 20 to 24 Year Olds | 99 (100.0%) | 0 (0.0%) |
| 25 to 34 Year Olds | 8 (32.0%) | 17 (68.0%) |
| 35 Years and over | 41 (77.4%) | 12 (22.6%) |
| Total | 958 (79.7%) | 244 (20.3%) |
Educational Attainment by Field of Study in Rockford
Business (387 | 27.4%), education (215 | 15.2%), bio, nature & agricultural (144 | 10.2%), science & technology (141 | 10.0%), and psychology (109 | 7.7%) are the most common fields of study among 1,411 individuals in Rockford who have obtained a bachelor's degree or higher.
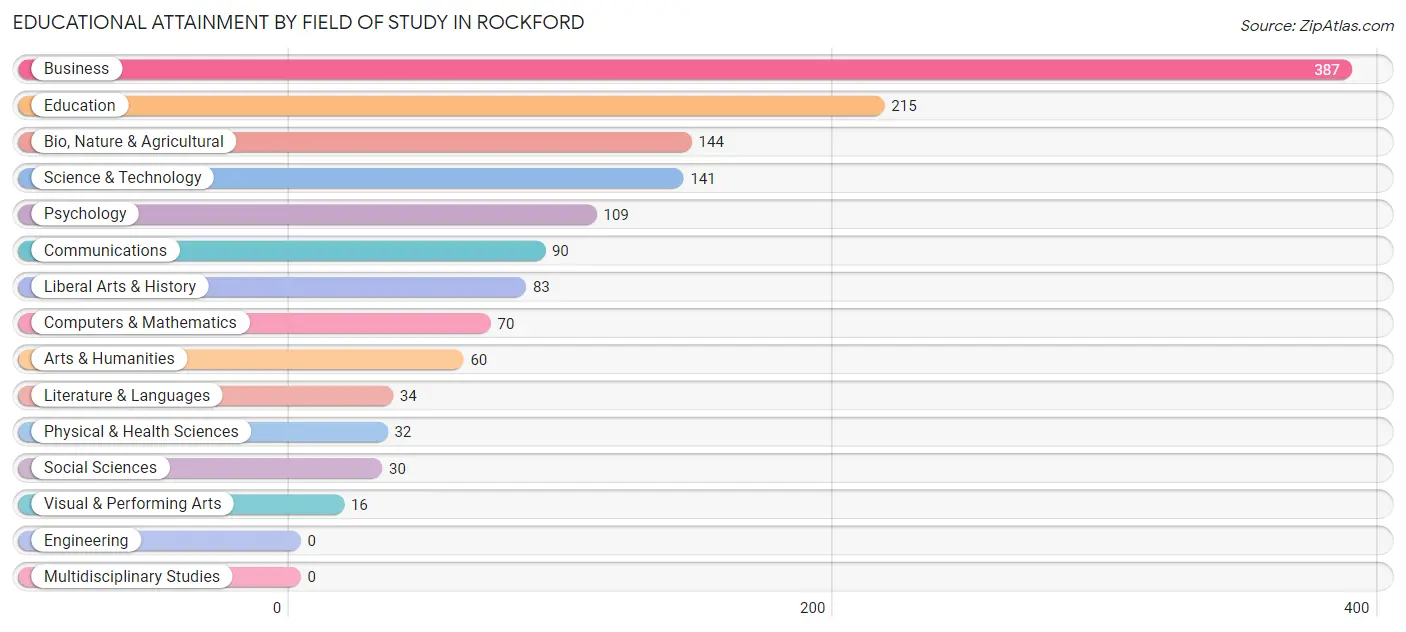
| Field of Study | # Graduates | % Graduates |
| Computers & Mathematics | 70 | 5.0% |
| Bio, Nature & Agricultural | 144 | 10.2% |
| Physical & Health Sciences | 32 | 2.3% |
| Psychology | 109 | 7.7% |
| Social Sciences | 30 | 2.1% |
| Engineering | 0 | 0.0% |
| Multidisciplinary Studies | 0 | 0.0% |
| Science & Technology | 141 | 10.0% |
| Business | 387 | 27.4% |
| Education | 215 | 15.2% |
| Literature & Languages | 34 | 2.4% |
| Liberal Arts & History | 83 | 5.9% |
| Visual & Performing Arts | 16 | 1.1% |
| Communications | 90 | 6.4% |
| Arts & Humanities | 60 | 4.3% |
| Total | 1,411 | 100.0% |
Transportation & Commute in Rockford
Vehicle Availability by Sex in Rockford
The most prevalent vehicle ownership categories in Rockford are males with 3 vehicles (581, accounting for 40.0%) and females with 3 vehicles (363, making up 45.9%).
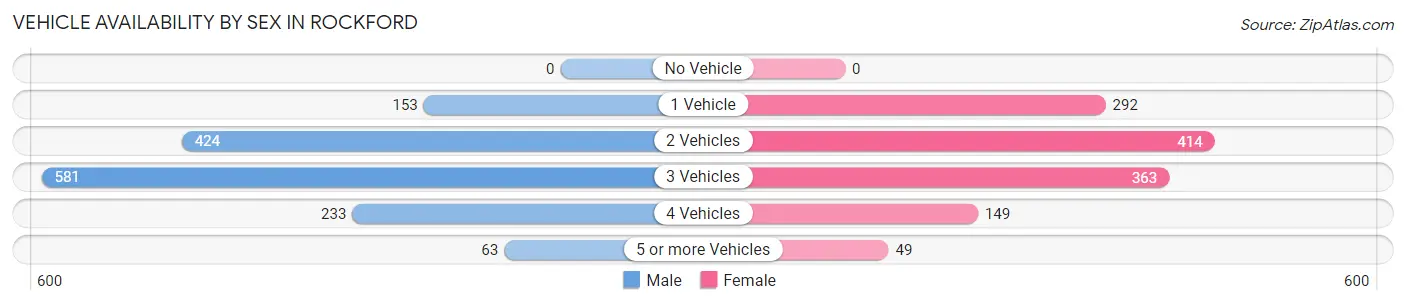
| Vehicles Available | Male | Female |
| No Vehicle | 0 (0.0%) | 0 (0.0%) |
| 1 Vehicle | 153 (10.5%) | 292 (23.1%) |
| 2 Vehicles | 424 (29.2%) | 414 (32.7%) |
| 3 Vehicles | 581 (40.0%) | 363 (28.6%) |
| 4 Vehicles | 233 (16.0%) | 149 (11.8%) |
| 5 or more Vehicles | 63 (4.3%) | 49 (3.9%) |
| Total | 1,454 (100.0%) | 1,267 (100.0%) |
Commute Time in Rockford
The most frequently occuring commute durations in Rockford are 5 to 9 minutes (376 commuters, 15.4%), 45 to 59 minutes (312 commuters, 12.8%), and 30 to 34 minutes (281 commuters, 11.5%).
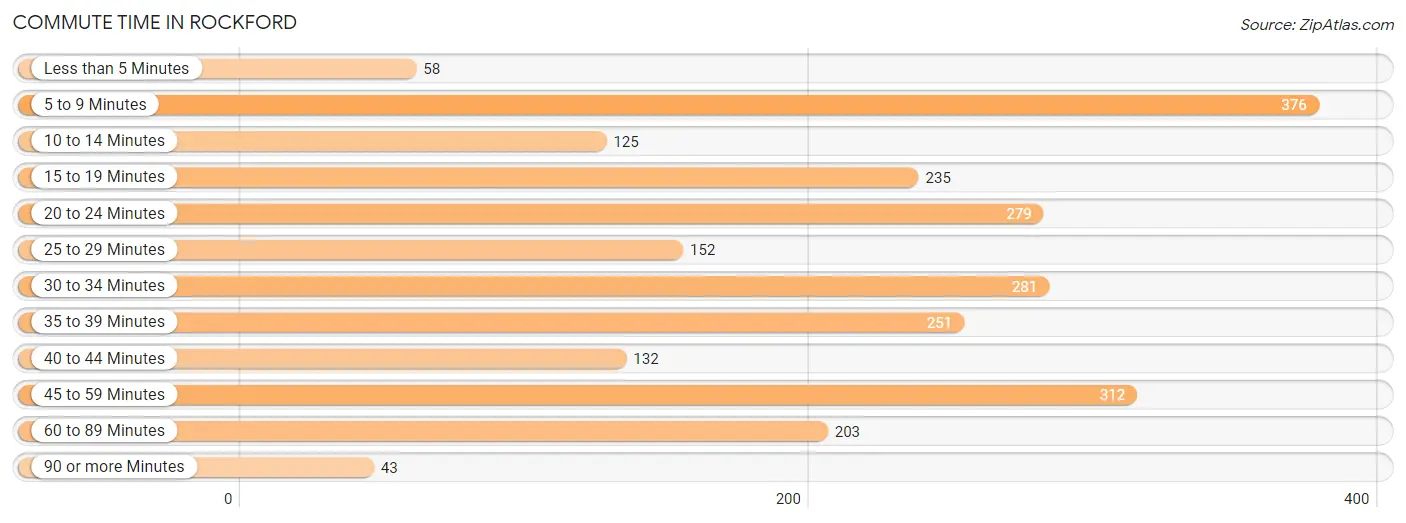
| Commute Time | # Commuters | % Commuters |
| Less than 5 Minutes | 58 | 2.4% |
| 5 to 9 Minutes | 376 | 15.4% |
| 10 to 14 Minutes | 125 | 5.1% |
| 15 to 19 Minutes | 235 | 9.6% |
| 20 to 24 Minutes | 279 | 11.4% |
| 25 to 29 Minutes | 152 | 6.2% |
| 30 to 34 Minutes | 281 | 11.5% |
| 35 to 39 Minutes | 251 | 10.3% |
| 40 to 44 Minutes | 132 | 5.4% |
| 45 to 59 Minutes | 312 | 12.8% |
| 60 to 89 Minutes | 203 | 8.3% |
| 90 or more Minutes | 43 | 1.8% |
Commute Time by Sex in Rockford
The most common commute times in Rockford are 45 to 59 minutes (232 commuters, 16.9%) for males and 5 to 9 minutes (182 commuters, 17.0%) for females.
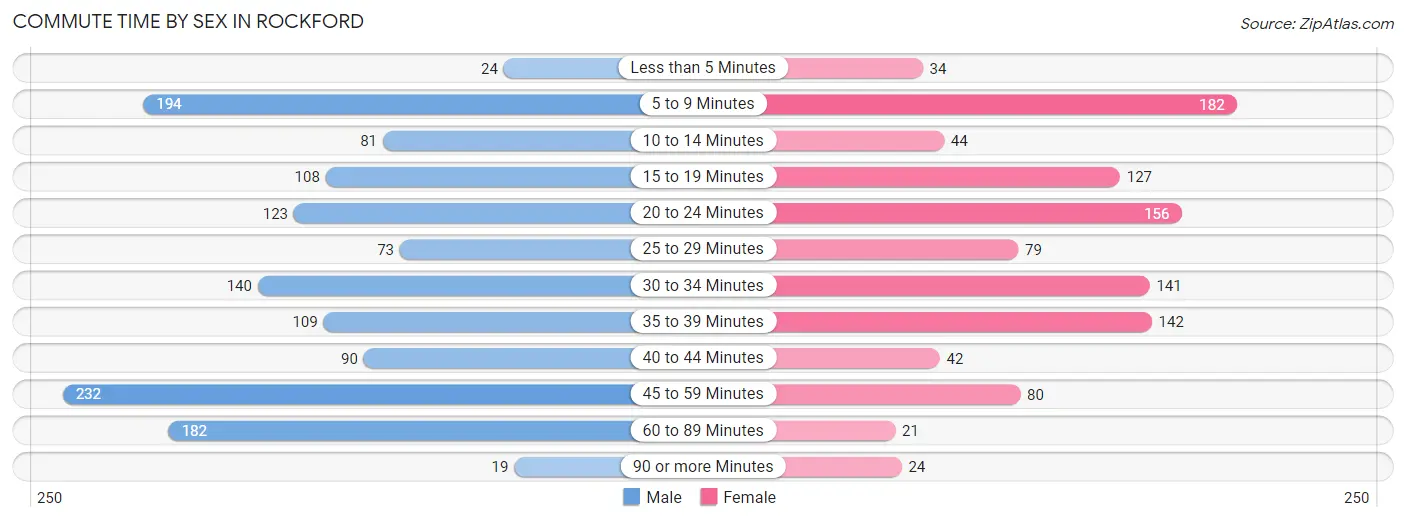
| Commute Time | Male | Female |
| Less than 5 Minutes | 24 (1.8%) | 34 (3.2%) |
| 5 to 9 Minutes | 194 (14.1%) | 182 (17.0%) |
| 10 to 14 Minutes | 81 (5.9%) | 44 (4.1%) |
| 15 to 19 Minutes | 108 (7.9%) | 127 (11.8%) |
| 20 to 24 Minutes | 123 (8.9%) | 156 (14.5%) |
| 25 to 29 Minutes | 73 (5.3%) | 79 (7.4%) |
| 30 to 34 Minutes | 140 (10.2%) | 141 (13.2%) |
| 35 to 39 Minutes | 109 (7.9%) | 142 (13.3%) |
| 40 to 44 Minutes | 90 (6.6%) | 42 (3.9%) |
| 45 to 59 Minutes | 232 (16.9%) | 80 (7.5%) |
| 60 to 89 Minutes | 182 (13.2%) | 21 (2.0%) |
| 90 or more Minutes | 19 (1.4%) | 24 (2.2%) |
Time of Departure to Work by Sex in Rockford
The most frequent times of departure to work in Rockford are 12:00 AM to 4:59 AM (325, 23.6%) for males and 7:00 AM to 7:29 AM (277, 25.8%) for females.
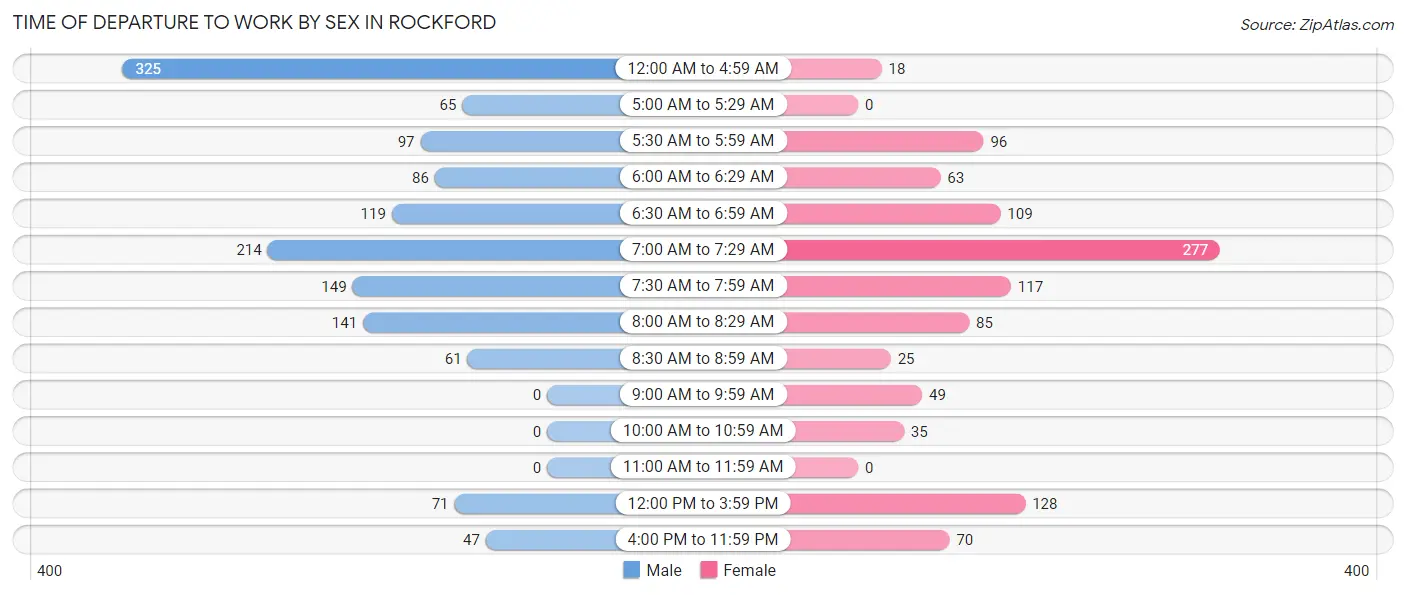
| Time of Departure | Male | Female |
| 12:00 AM to 4:59 AM | 325 (23.6%) | 18 (1.7%) |
| 5:00 AM to 5:29 AM | 65 (4.7%) | 0 (0.0%) |
| 5:30 AM to 5:59 AM | 97 (7.0%) | 96 (9.0%) |
| 6:00 AM to 6:29 AM | 86 (6.2%) | 63 (5.9%) |
| 6:30 AM to 6:59 AM | 119 (8.6%) | 109 (10.2%) |
| 7:00 AM to 7:29 AM | 214 (15.6%) | 277 (25.8%) |
| 7:30 AM to 7:59 AM | 149 (10.8%) | 117 (10.9%) |
| 8:00 AM to 8:29 AM | 141 (10.2%) | 85 (7.9%) |
| 8:30 AM to 8:59 AM | 61 (4.4%) | 25 (2.3%) |
| 9:00 AM to 9:59 AM | 0 (0.0%) | 49 (4.6%) |
| 10:00 AM to 10:59 AM | 0 (0.0%) | 35 (3.3%) |
| 11:00 AM to 11:59 AM | 0 (0.0%) | 0 (0.0%) |
| 12:00 PM to 3:59 PM | 71 (5.2%) | 128 (11.9%) |
| 4:00 PM to 11:59 PM | 47 (3.4%) | 70 (6.5%) |
| Total | 1,375 (100.0%) | 1,072 (100.0%) |
Housing Occupancy in Rockford
Occupancy by Ownership in Rockford
Of the total 1,810 dwellings in Rockford, owner-occupied units account for 1,361 (75.2%), while renter-occupied units make up 449 (24.8%).
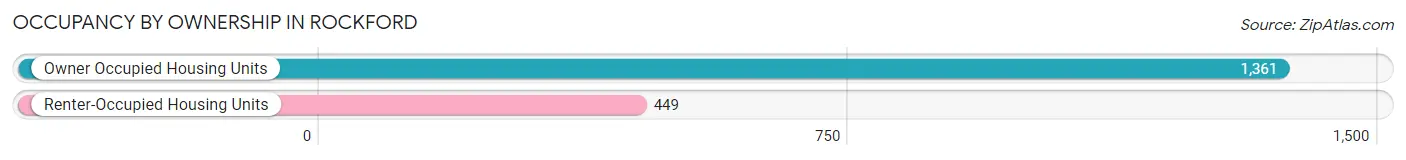
| Occupancy | # Housing Units | % Housing Units |
| Owner Occupied Housing Units | 1,361 | 75.2% |
| Renter-Occupied Housing Units | 449 | 24.8% |
| Total Occupied Housing Units | 1,810 | 100.0% |
Occupancy by Household Size in Rockford
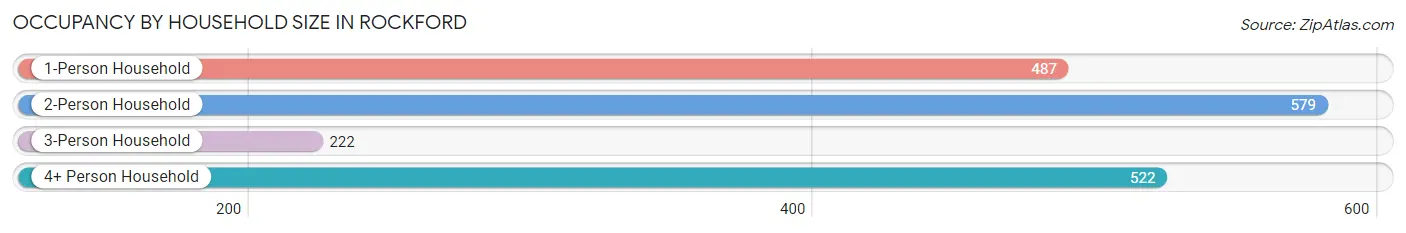
| Household Size | # Housing Units | % Housing Units |
| 1-Person Household | 487 | 26.9% |
| 2-Person Household | 579 | 32.0% |
| 3-Person Household | 222 | 12.3% |
| 4+ Person Household | 522 | 28.8% |
| Total Housing Units | 1,810 | 100.0% |
Occupancy by Ownership by Household Size in Rockford
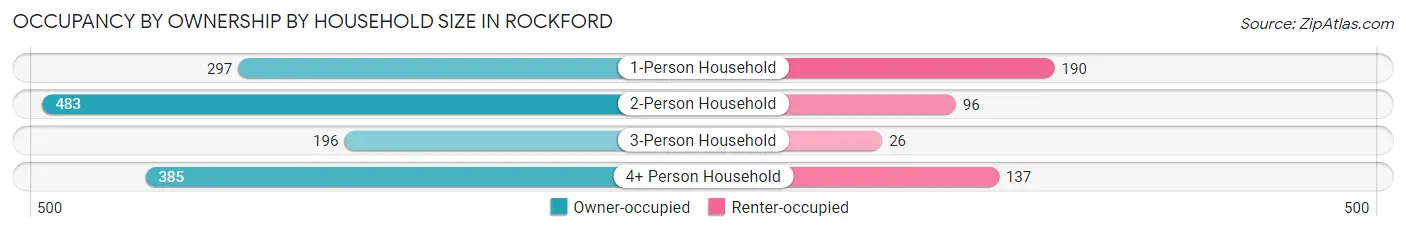
| Household Size | Owner-occupied | Renter-occupied |
| 1-Person Household | 297 (61.0%) | 190 (39.0%) |
| 2-Person Household | 483 (83.4%) | 96 (16.6%) |
| 3-Person Household | 196 (88.3%) | 26 (11.7%) |
| 4+ Person Household | 385 (73.8%) | 137 (26.3%) |
| Total Housing Units | 1,361 (75.2%) | 449 (24.8%) |
Occupancy by Educational Attainment in Rockford
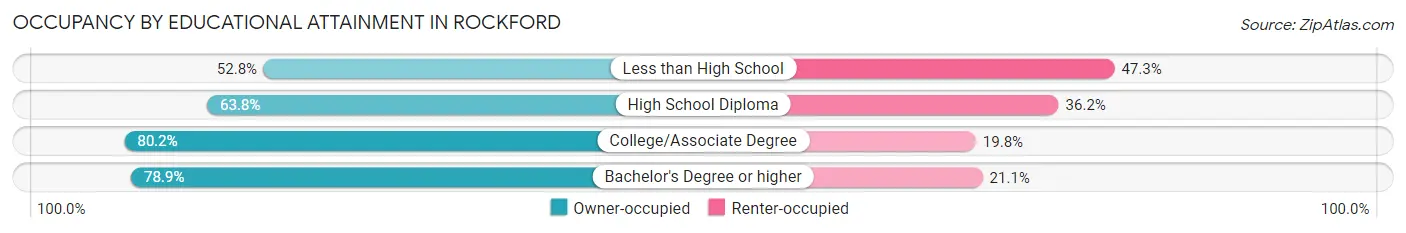
| Household Size | Owner-occupied | Renter-occupied |
| Less than High School | 48 (52.7%) | 43 (47.2%) |
| High School Diploma | 217 (63.8%) | 123 (36.2%) |
| College/Associate Degree | 483 (80.2%) | 119 (19.8%) |
| Bachelor's Degree or higher | 613 (78.9%) | 164 (21.1%) |
Occupancy by Age of Householder in Rockford
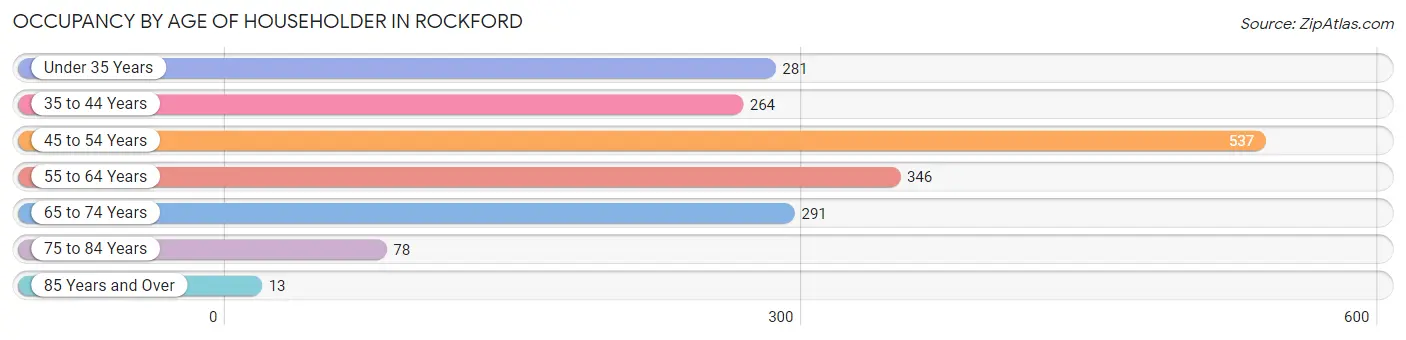
| Age Bracket | # Households | % Households |
| Under 35 Years | 281 | 15.5% |
| 35 to 44 Years | 264 | 14.6% |
| 45 to 54 Years | 537 | 29.7% |
| 55 to 64 Years | 346 | 19.1% |
| 65 to 74 Years | 291 | 16.1% |
| 75 to 84 Years | 78 | 4.3% |
| 85 Years and Over | 13 | 0.7% |
| Total | 1,810 | 100.0% |
Housing Finances in Rockford
Median Income by Occupancy in Rockford
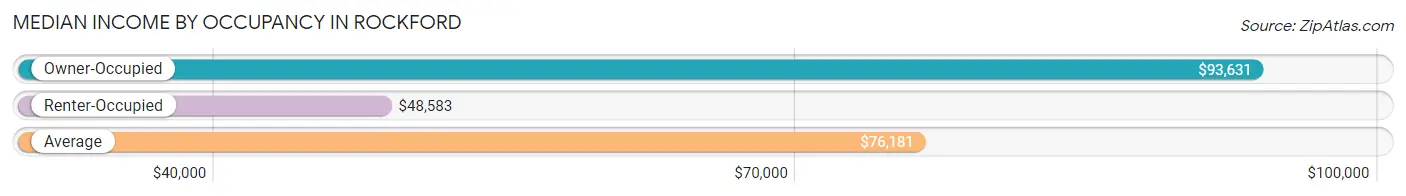
| Occupancy Type | # Households | Median Income |
| Owner-Occupied | 1,361 (75.2%) | $93,631 |
| Renter-Occupied | 449 (24.8%) | $48,583 |
| Average | 1,810 (100.0%) | $76,181 |
Occupancy by Householder Income Bracket in Rockford
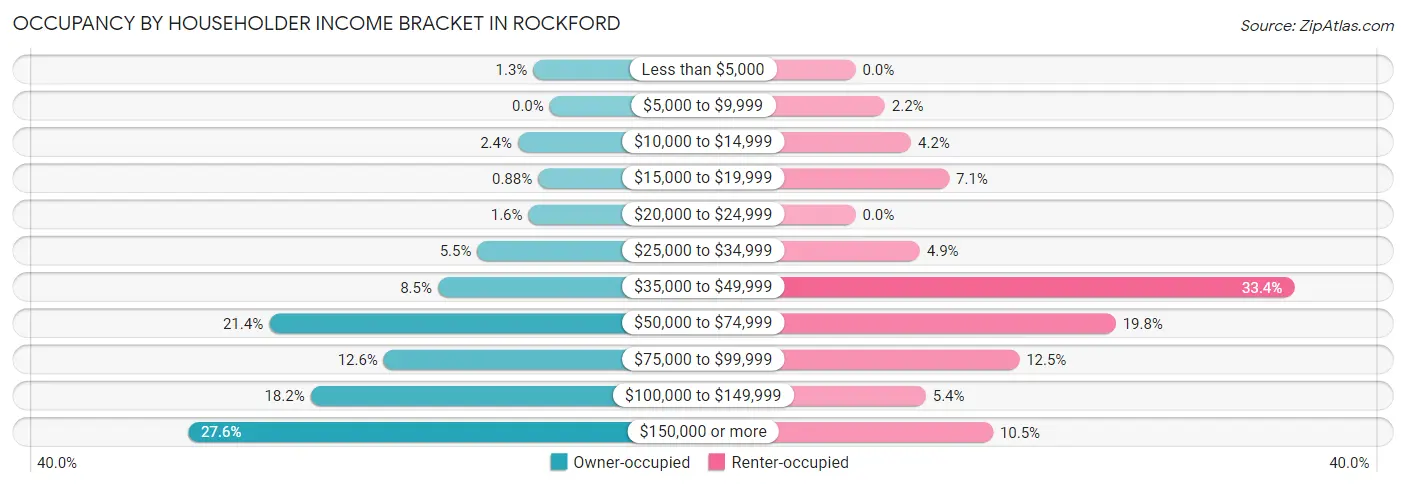
| Income Bracket | Owner-occupied | Renter-occupied |
| Less than $5,000 | 17 (1.3%) | 0 (0.0%) |
| $5,000 to $9,999 | 0 (0.0%) | 10 (2.2%) |
| $10,000 to $14,999 | 33 (2.4%) | 19 (4.2%) |
| $15,000 to $19,999 | 12 (0.9%) | 32 (7.1%) |
| $20,000 to $24,999 | 22 (1.6%) | 0 (0.0%) |
| $25,000 to $34,999 | 75 (5.5%) | 22 (4.9%) |
| $35,000 to $49,999 | 116 (8.5%) | 150 (33.4%) |
| $50,000 to $74,999 | 291 (21.4%) | 89 (19.8%) |
| $75,000 to $99,999 | 172 (12.6%) | 56 (12.5%) |
| $100,000 to $149,999 | 248 (18.2%) | 24 (5.3%) |
| $150,000 or more | 375 (27.6%) | 47 (10.5%) |
| Total | 1,361 (100.0%) | 449 (100.0%) |
Monthly Housing Cost Tiers in Rockford
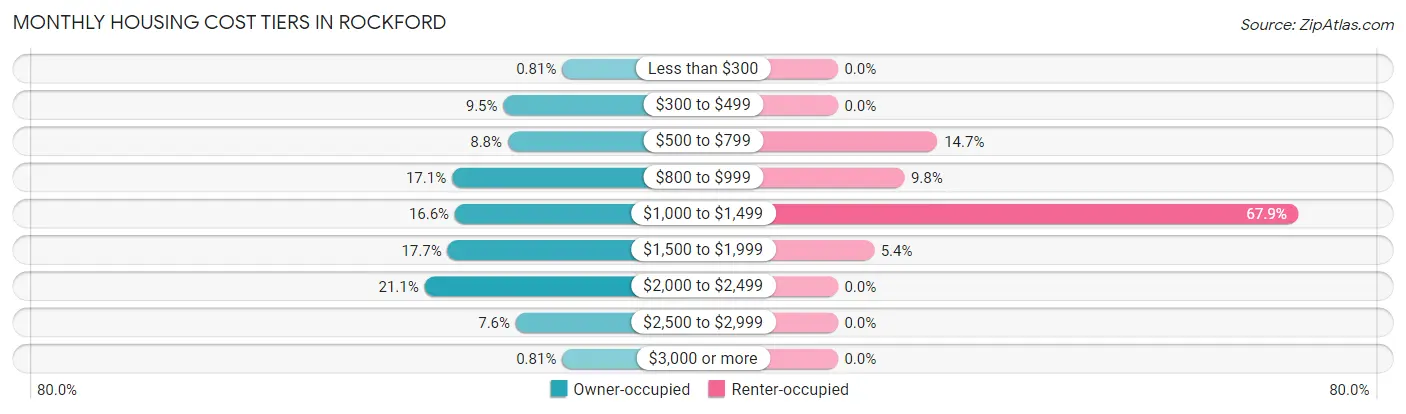
| Monthly Cost | Owner-occupied | Renter-occupied |
| Less than $300 | 11 (0.8%) | 0 (0.0%) |
| $300 to $499 | 129 (9.5%) | 0 (0.0%) |
| $500 to $799 | 120 (8.8%) | 66 (14.7%) |
| $800 to $999 | 232 (17.1%) | 44 (9.8%) |
| $1,000 to $1,499 | 226 (16.6%) | 305 (67.9%) |
| $1,500 to $1,999 | 241 (17.7%) | 24 (5.3%) |
| $2,000 to $2,499 | 287 (21.1%) | 0 (0.0%) |
| $2,500 to $2,999 | 104 (7.6%) | 0 (0.0%) |
| $3,000 or more | 11 (0.8%) | 0 (0.0%) |
| Total | 1,361 (100.0%) | 449 (100.0%) |
Physical Housing Characteristics in Rockford
Housing Structures in Rockford
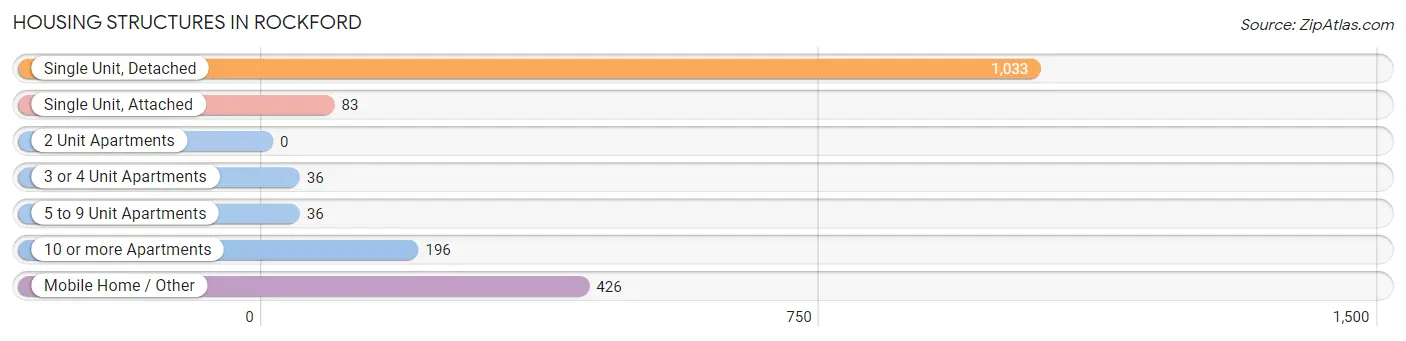
| Structure Type | # Housing Units | % Housing Units |
| Single Unit, Detached | 1,033 | 57.1% |
| Single Unit, Attached | 83 | 4.6% |
| 2 Unit Apartments | 0 | 0.0% |
| 3 or 4 Unit Apartments | 36 | 2.0% |
| 5 to 9 Unit Apartments | 36 | 2.0% |
| 10 or more Apartments | 196 | 10.8% |
| Mobile Home / Other | 426 | 23.5% |
| Total | 1,810 | 100.0% |
Housing Structures by Occupancy in Rockford
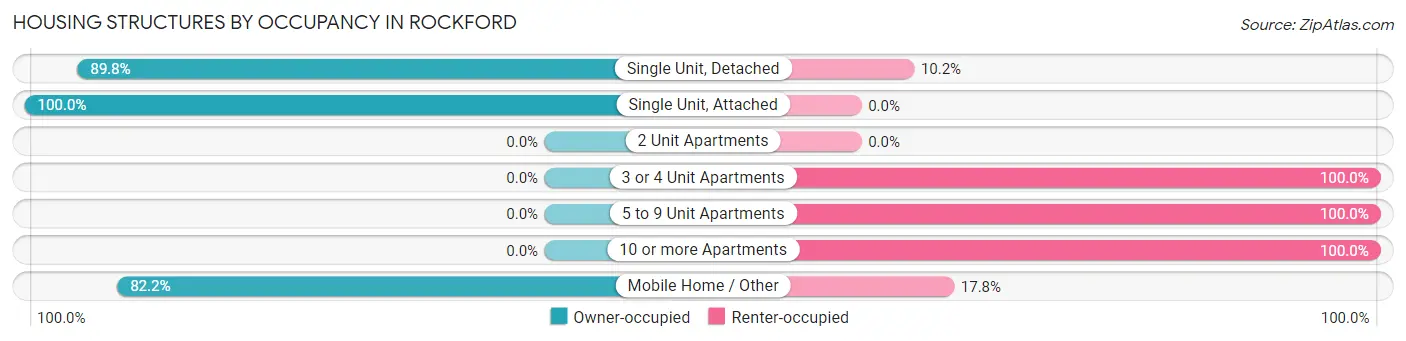
| Structure Type | Owner-occupied | Renter-occupied |
| Single Unit, Detached | 928 (89.8%) | 105 (10.2%) |
| Single Unit, Attached | 83 (100.0%) | 0 (0.0%) |
| 2 Unit Apartments | 0 (0.0%) | 0 (0.0%) |
| 3 or 4 Unit Apartments | 0 (0.0%) | 36 (100.0%) |
| 5 to 9 Unit Apartments | 0 (0.0%) | 36 (100.0%) |
| 10 or more Apartments | 0 (0.0%) | 196 (100.0%) |
| Mobile Home / Other | 350 (82.2%) | 76 (17.8%) |
| Total | 1,361 (75.2%) | 449 (24.8%) |
Housing Structures by Number of Rooms in Rockford
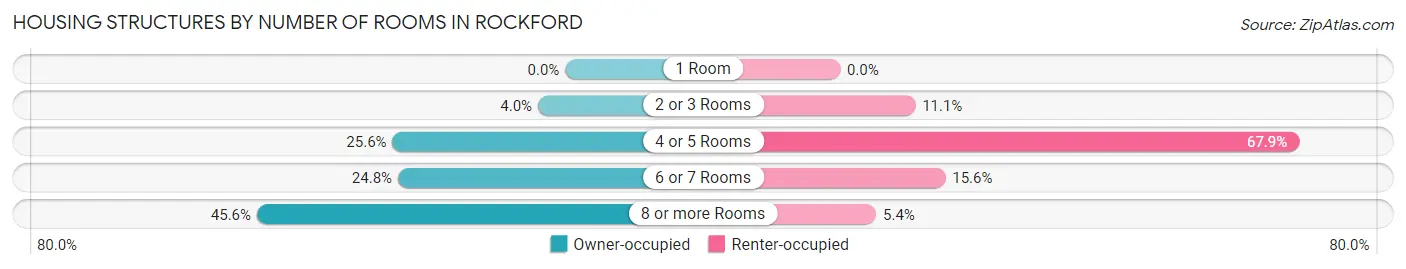
| Number of Rooms | Owner-occupied | Renter-occupied |
| 1 Room | 0 (0.0%) | 0 (0.0%) |
| 2 or 3 Rooms | 55 (4.0%) | 50 (11.1%) |
| 4 or 5 Rooms | 348 (25.6%) | 305 (67.9%) |
| 6 or 7 Rooms | 337 (24.8%) | 70 (15.6%) |
| 8 or more Rooms | 621 (45.6%) | 24 (5.3%) |
| Total | 1,361 (100.0%) | 449 (100.0%) |
Housing Structure by Heating Type in Rockford
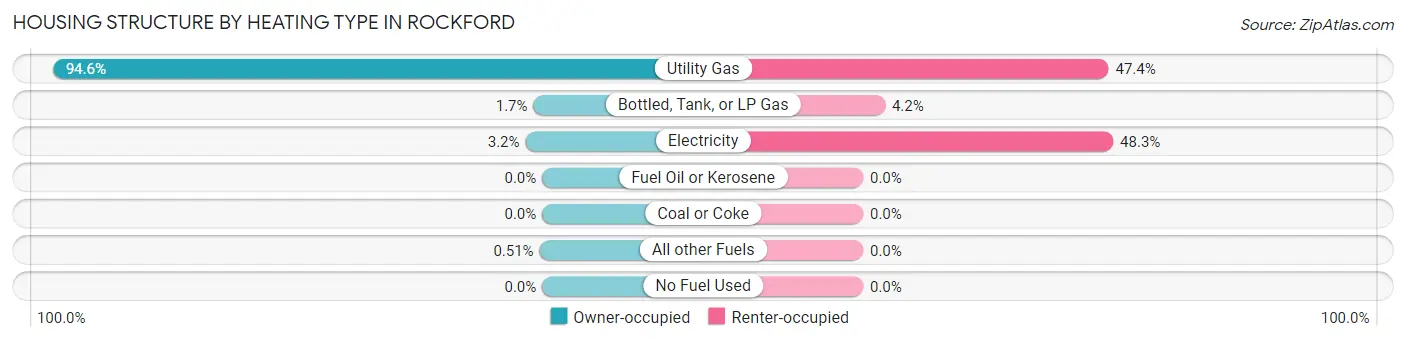
| Heating Type | Owner-occupied | Renter-occupied |
| Utility Gas | 1,287 (94.6%) | 213 (47.4%) |
| Bottled, Tank, or LP Gas | 23 (1.7%) | 19 (4.2%) |
| Electricity | 44 (3.2%) | 217 (48.3%) |
| Fuel Oil or Kerosene | 0 (0.0%) | 0 (0.0%) |
| Coal or Coke | 0 (0.0%) | 0 (0.0%) |
| All other Fuels | 7 (0.5%) | 0 (0.0%) |
| No Fuel Used | 0 (0.0%) | 0 (0.0%) |
| Total | 1,361 (100.0%) | 449 (100.0%) |
Household Vehicle Usage in Rockford
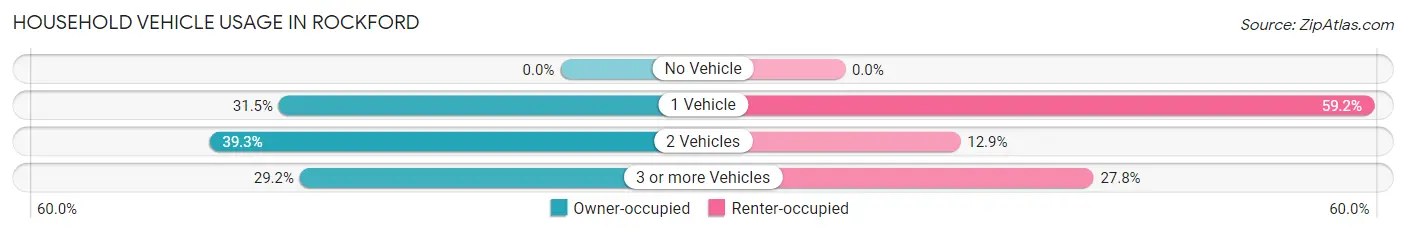
| Vehicles per Household | Owner-occupied | Renter-occupied |
| No Vehicle | 0 (0.0%) | 0 (0.0%) |
| 1 Vehicle | 429 (31.5%) | 266 (59.2%) |
| 2 Vehicles | 535 (39.3%) | 58 (12.9%) |
| 3 or more Vehicles | 397 (29.2%) | 125 (27.8%) |
| Total | 1,361 (100.0%) | 449 (100.0%) |
Real Estate & Mortgages in Rockford
Real Estate and Mortgage Overview in Rockford
| Characteristic | Without Mortgage | With Mortgage |
| Housing Units | 471 | 890 |
| Median Property Value | - | - |
| Median Household Income | $61,161 | $348 |
| Monthly Housing Costs | $794 | $11 |
| Real Estate Taxes | $1,016 | $0 |
Property Value by Mortgage Status in Rockford
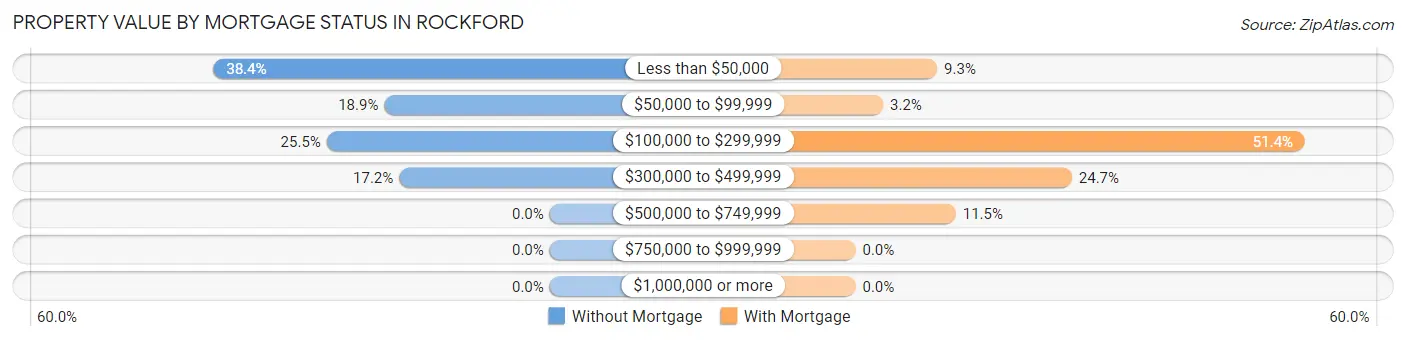
| Property Value | Without Mortgage | With Mortgage |
| Less than $50,000 | 181 (38.4%) | 83 (9.3%) |
| $50,000 to $99,999 | 89 (18.9%) | 28 (3.2%) |
| $100,000 to $299,999 | 120 (25.5%) | 457 (51.3%) |
| $300,000 to $499,999 | 81 (17.2%) | 220 (24.7%) |
| $500,000 to $749,999 | 0 (0.0%) | 102 (11.5%) |
| $750,000 to $999,999 | 0 (0.0%) | 0 (0.0%) |
| $1,000,000 or more | 0 (0.0%) | 0 (0.0%) |
| Total | 471 (100.0%) | 890 (100.0%) |
Household Income by Mortgage Status in Rockford
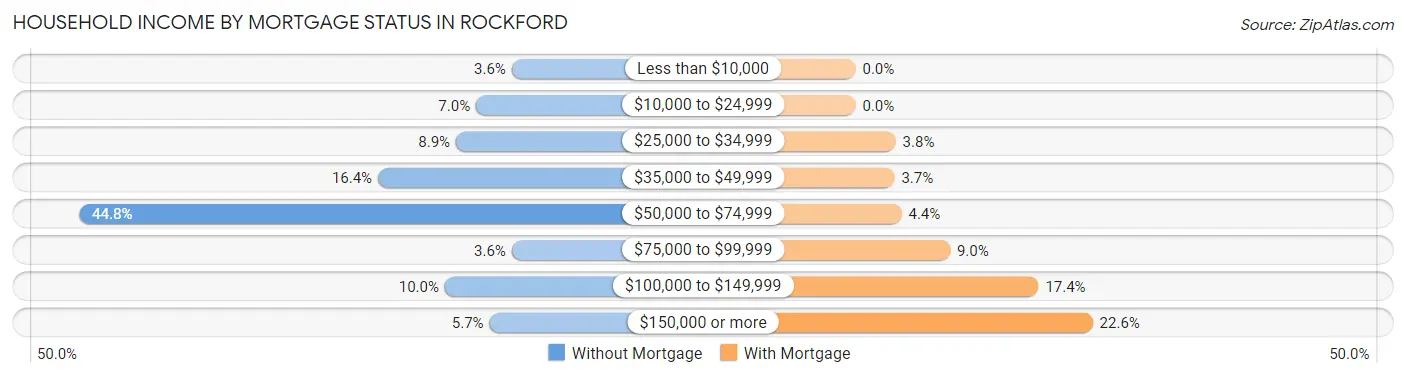
| Household Income | Without Mortgage | With Mortgage |
| Less than $10,000 | 17 (3.6%) | 0 (0.0%) |
| $10,000 to $24,999 | 33 (7.0%) | 0 (0.0%) |
| $25,000 to $34,999 | 42 (8.9%) | 34 (3.8%) |
| $35,000 to $49,999 | 77 (16.4%) | 33 (3.7%) |
| $50,000 to $74,999 | 211 (44.8%) | 39 (4.4%) |
| $75,000 to $99,999 | 17 (3.6%) | 80 (9.0%) |
| $100,000 to $149,999 | 47 (10.0%) | 155 (17.4%) |
| $150,000 or more | 27 (5.7%) | 201 (22.6%) |
| Total | 471 (100.0%) | 890 (100.0%) |
Property Value to Household Income Ratio in Rockford
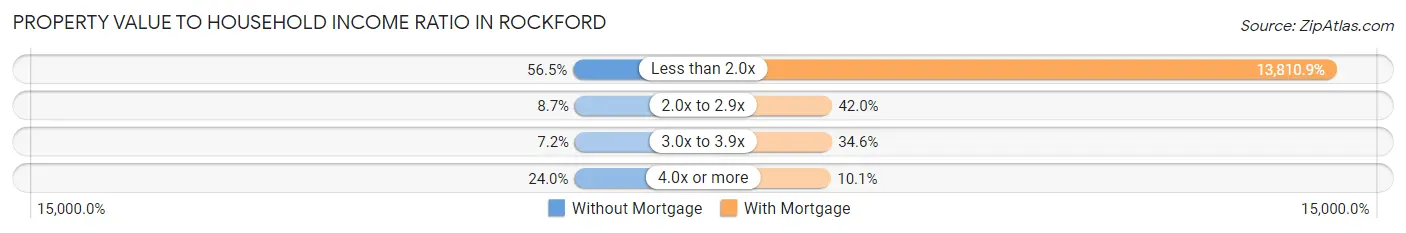
| Value-to-Income Ratio | Without Mortgage | With Mortgage |
| Less than 2.0x | 266 (56.5%) | 122,917 (13,810.9%) |
| 2.0x to 2.9x | 41 (8.7%) | 374 (42.0%) |
| 3.0x to 3.9x | 34 (7.2%) | 308 (34.6%) |
| 4.0x or more | 113 (24.0%) | 90 (10.1%) |
| Total | 471 (100.0%) | 890 (100.0%) |
Real Estate Taxes by Mortgage Status in Rockford
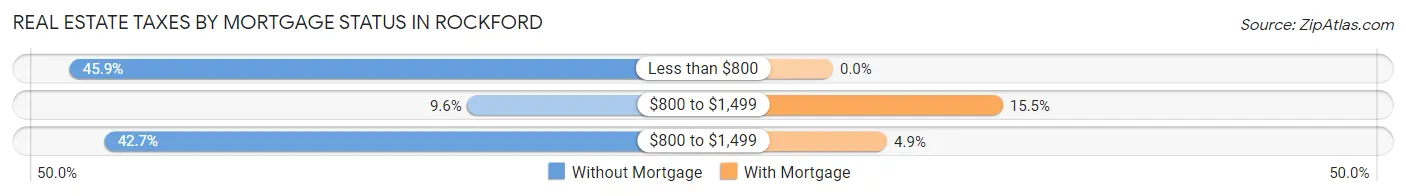
| Property Taxes | Without Mortgage | With Mortgage |
| Less than $800 | 216 (45.9%) | 0 (0.0%) |
| $800 to $1,499 | 45 (9.6%) | 138 (15.5%) |
| $800 to $1,499 | 201 (42.7%) | 44 (4.9%) |
| Total | 471 (100.0%) | 890 (100.0%) |
Health & Disability in Rockford
Health Insurance Coverage by Age in Rockford
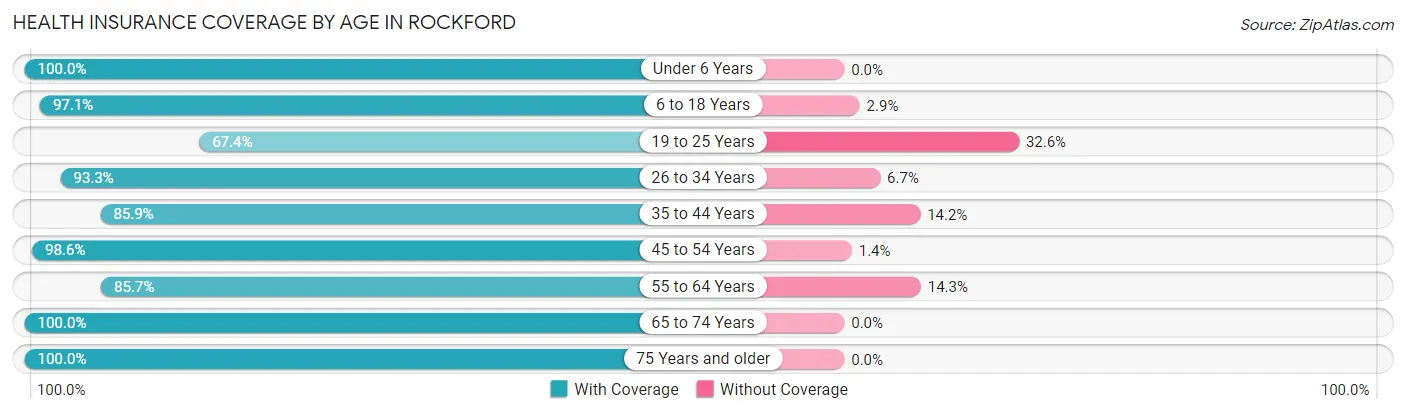
| Age Bracket | With Coverage | Without Coverage |
| Under 6 Years | 205 (100.0%) | 0 (0.0%) |
| 6 to 18 Years | 846 (97.1%) | 25 (2.9%) |
| 19 to 25 Years | 325 (67.4%) | 157 (32.6%) |
| 26 to 34 Years | 503 (93.3%) | 36 (6.7%) |
| 35 to 44 Years | 449 (85.9%) | 74 (14.1%) |
| 45 to 54 Years | 846 (98.6%) | 12 (1.4%) |
| 55 to 64 Years | 475 (85.7%) | 79 (14.3%) |
| 65 to 74 Years | 440 (100.0%) | 0 (0.0%) |
| 75 Years and older | 166 (100.0%) | 0 (0.0%) |
| Total | 4,255 (91.7%) | 383 (8.3%) |
Health Insurance Coverage by Citizenship Status in Rockford
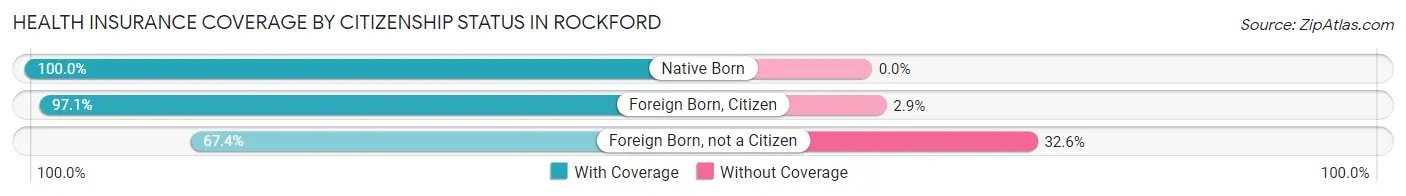
| Citizenship Status | With Coverage | Without Coverage |
| Native Born | 205 (100.0%) | 0 (0.0%) |
| Foreign Born, Citizen | 846 (97.1%) | 25 (2.9%) |
| Foreign Born, not a Citizen | 325 (67.4%) | 157 (32.6%) |
Health Insurance Coverage by Household Income in Rockford
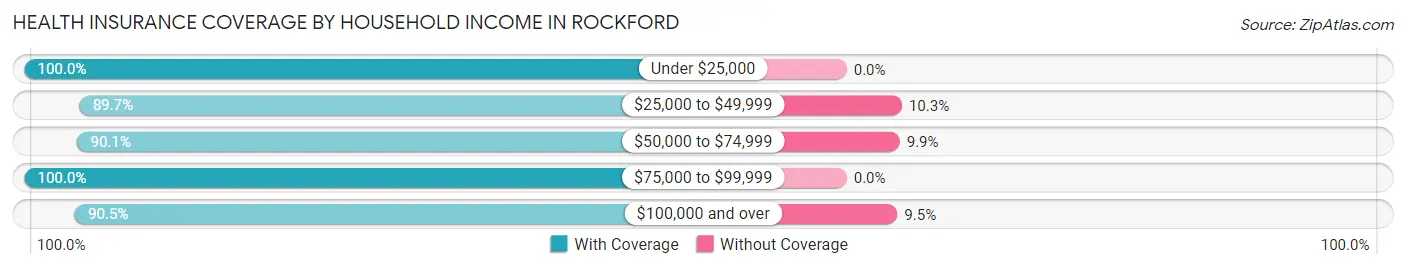
| Household Income | With Coverage | Without Coverage |
| Under $25,000 | 174 (100.0%) | 0 (0.0%) |
| $25,000 to $49,999 | 642 (89.7%) | 74 (10.3%) |
| $50,000 to $74,999 | 644 (90.1%) | 71 (9.9%) |
| $75,000 to $99,999 | 522 (100.0%) | 0 (0.0%) |
| $100,000 and over | 2,273 (90.5%) | 238 (9.5%) |
Public vs Private Health Insurance Coverage by Age in Rockford
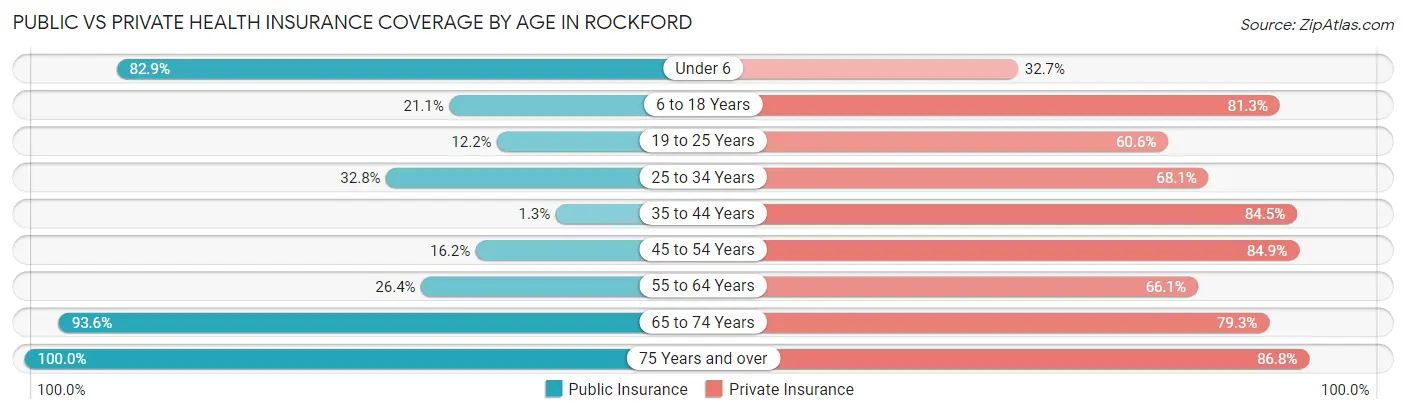
| Age Bracket | Public Insurance | Private Insurance |
| Under 6 | 170 (82.9%) | 67 (32.7%) |
| 6 to 18 Years | 184 (21.1%) | 708 (81.3%) |
| 19 to 25 Years | 59 (12.2%) | 292 (60.6%) |
| 25 to 34 Years | 177 (32.8%) | 367 (68.1%) |
| 35 to 44 Years | 7 (1.3%) | 442 (84.5%) |
| 45 to 54 Years | 139 (16.2%) | 728 (84.9%) |
| 55 to 64 Years | 146 (26.4%) | 366 (66.1%) |
| 65 to 74 Years | 412 (93.6%) | 349 (79.3%) |
| 75 Years and over | 166 (100.0%) | 144 (86.8%) |
| Total | 1,460 (31.5%) | 3,463 (74.7%) |
Disability Status by Sex by Age in Rockford
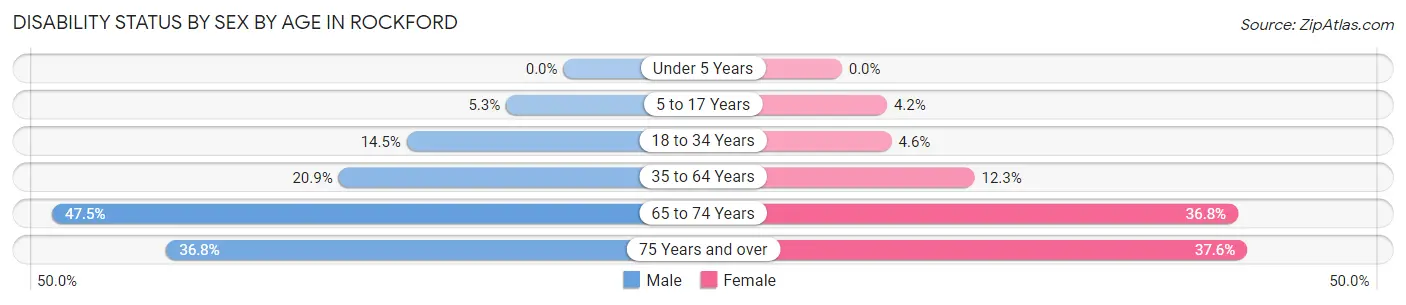
| Age Bracket | Male | Female |
| Under 5 Years | 0 (0.0%) | 0 (0.0%) |
| 5 to 17 Years | 21 (5.3%) | 19 (4.2%) |
| 18 to 34 Years | 97 (14.5%) | 19 (4.6%) |
| 35 to 64 Years | 187 (20.9%) | 128 (12.3%) |
| 65 to 74 Years | 121 (47.4%) | 68 (36.8%) |
| 75 Years and over | 21 (36.8%) | 41 (37.6%) |
Disability Class by Sex by Age in Rockford
Disability Class: Hearing Difficulty
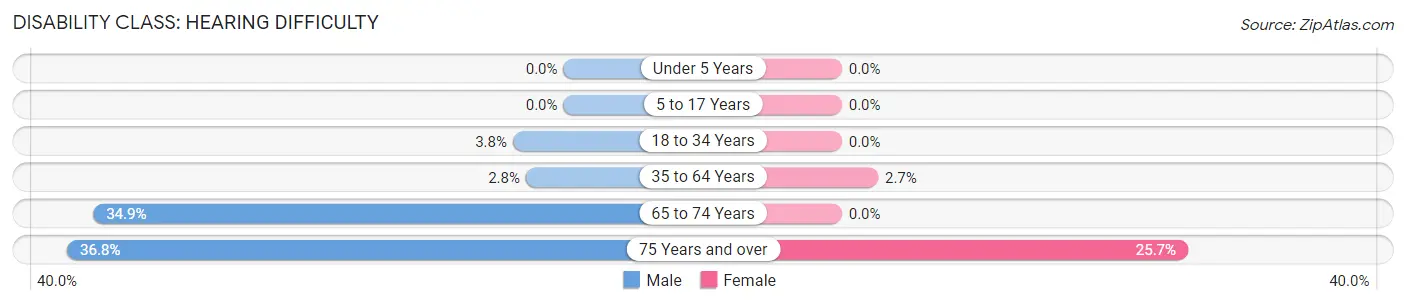
| Age Bracket | Male | Female |
| Under 5 Years | 0 (0.0%) | 0 (0.0%) |
| 5 to 17 Years | 0 (0.0%) | 0 (0.0%) |
| 18 to 34 Years | 25 (3.7%) | 0 (0.0%) |
| 35 to 64 Years | 25 (2.8%) | 28 (2.7%) |
| 65 to 74 Years | 89 (34.9%) | 0 (0.0%) |
| 75 Years and over | 21 (36.8%) | 28 (25.7%) |
Disability Class: Vision Difficulty
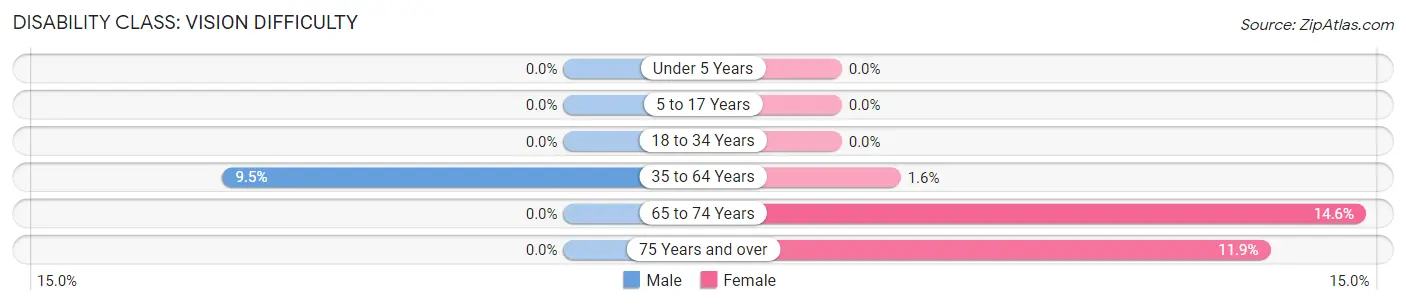
| Age Bracket | Male | Female |
| Under 5 Years | 0 (0.0%) | 0 (0.0%) |
| 5 to 17 Years | 0 (0.0%) | 0 (0.0%) |
| 18 to 34 Years | 0 (0.0%) | 0 (0.0%) |
| 35 to 64 Years | 85 (9.5%) | 17 (1.6%) |
| 65 to 74 Years | 0 (0.0%) | 27 (14.6%) |
| 75 Years and over | 0 (0.0%) | 13 (11.9%) |
Disability Class: Cognitive Difficulty
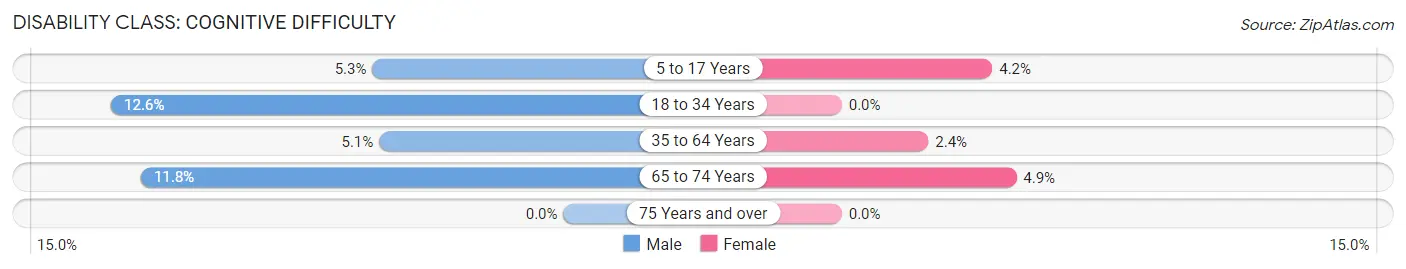
| Age Bracket | Male | Female |
| 5 to 17 Years | 21 (5.3%) | 19 (4.2%) |
| 18 to 34 Years | 84 (12.6%) | 0 (0.0%) |
| 35 to 64 Years | 46 (5.1%) | 25 (2.4%) |
| 65 to 74 Years | 30 (11.8%) | 9 (4.9%) |
| 75 Years and over | 0 (0.0%) | 0 (0.0%) |
Disability Class: Ambulatory Difficulty
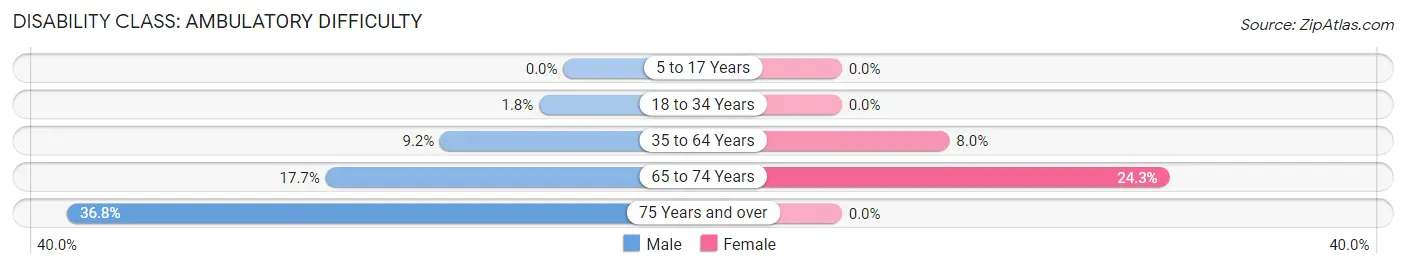
| Age Bracket | Male | Female |
| 5 to 17 Years | 0 (0.0%) | 0 (0.0%) |
| 18 to 34 Years | 12 (1.8%) | 0 (0.0%) |
| 35 to 64 Years | 82 (9.1%) | 83 (8.0%) |
| 65 to 74 Years | 45 (17.6%) | 45 (24.3%) |
| 75 Years and over | 21 (36.8%) | 0 (0.0%) |
Disability Class: Self-Care Difficulty
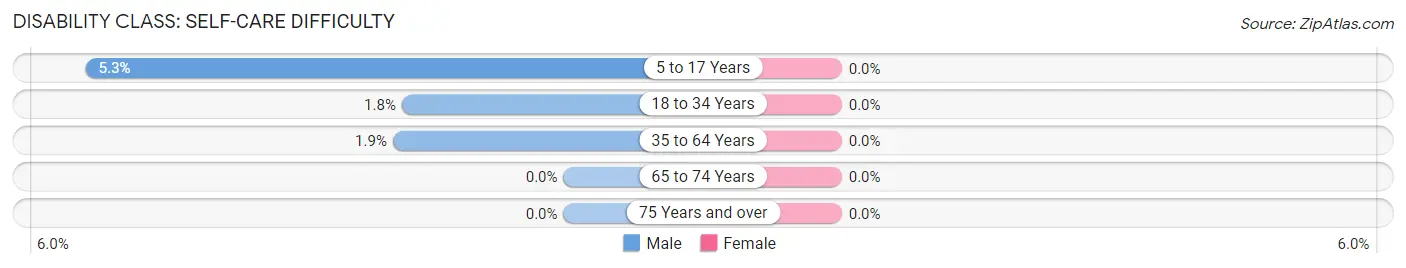
| Age Bracket | Male | Female |
| 5 to 17 Years | 21 (5.3%) | 0 (0.0%) |
| 18 to 34 Years | 12 (1.8%) | 0 (0.0%) |
| 35 to 64 Years | 17 (1.9%) | 0 (0.0%) |
| 65 to 74 Years | 0 (0.0%) | 0 (0.0%) |
| 75 Years and over | 0 (0.0%) | 0 (0.0%) |
Technology Access in Rockford
Computing Device Access in Rockford
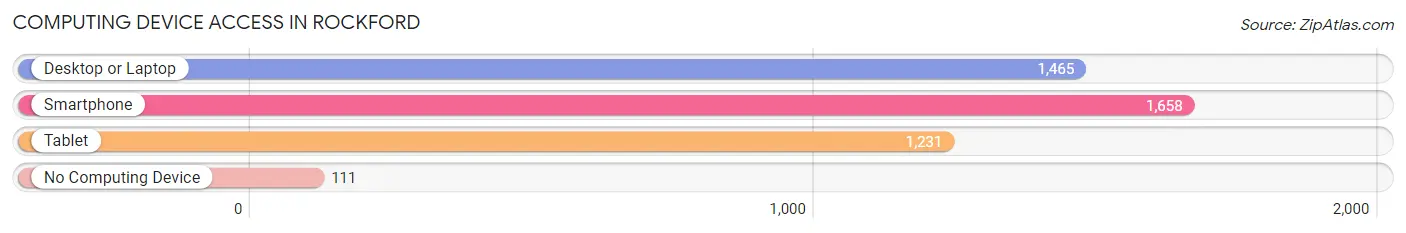
| Device Type | # Households | % Households |
| Desktop or Laptop | 1,465 | 80.9% |
| Smartphone | 1,658 | 91.6% |
| Tablet | 1,231 | 68.0% |
| No Computing Device | 111 | 6.1% |
| Total | 1,810 | 100.0% |
Internet Access in Rockford
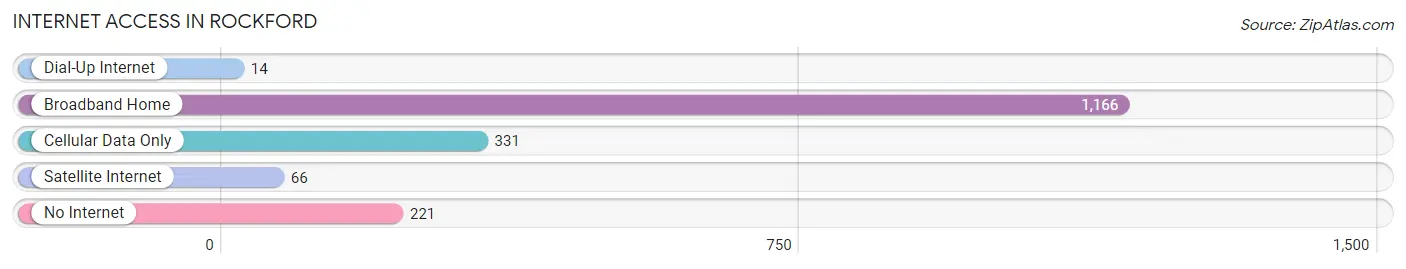
| Internet Type | # Households | % Households |
| Dial-Up Internet | 14 | 0.8% |
| Broadband Home | 1,166 | 64.4% |
| Cellular Data Only | 331 | 18.3% |
| Satellite Internet | 66 | 3.6% |
| No Internet | 221 | 12.2% |
| Total | 1,810 | 100.0% |
Rockford Summary
Rockford, Minnesota is a small city located in Wright County, approximately 40 miles northwest of Minneapolis. The city is situated on the banks of the Crow River and is home to a population of approximately 4,000 people.
History
Rockford was first settled in 1855 by a group of Swedish immigrants. The city was named after Rockford, Illinois, which was the hometown of one of the settlers. The city was officially incorporated in 1876.
In the late 19th century, Rockford was a thriving agricultural community. The city was home to a number of grain mills, a creamery, and a cheese factory. The city also had a number of small businesses, including a blacksmith shop, a general store, and a hotel.
In the early 20th century, Rockford experienced a period of growth and development. The city was home to a number of manufacturing businesses, including a furniture factory, a canning factory, and a brickyard. The city also had a number of retail stores, including a hardware store, a grocery store, and a drug store.
Geography
Rockford is located in the central part of Wright County, approximately 40 miles northwest of Minneapolis. The city is situated on the banks of the Crow River and is surrounded by rolling hills and farmland. The city has a total area of 2.2 square miles, all of which is land.
Economy
Rockford’s economy is largely based on agriculture and manufacturing. The city is home to a number of grain mills, a creamery, and a cheese factory. The city also has a number of small businesses, including a hardware store, a grocery store, and a drug store.
The city is also home to a number of manufacturing businesses, including a furniture factory, a canning factory, and a brickyard. The city also has a number of retail stores, including a hardware store, a grocery store, and a drug store.
Demographics
As of the 2010 census, Rockford had a population of 4,000 people. The racial makeup of the city was 97.2% White, 0.7% African American, 0.2% Native American, 0.3% Asian, 0.2% from other races, and 1.6% from two or more races. Hispanic or Latino of any race were 1.2% of the population.
The median income for a household in Rockford was $50,000, and the median income for a family was $54,000. The per capita income for the city was $21,000. About 8.2% of families and 10.2% of the population were below the poverty line, including 14.2% of those under age 18 and 8.2% of those age 65 or over.
Rockford is a small city with a rich history and a vibrant economy. The city is home to a number of manufacturing businesses, as well as a number of small businesses. The city also has a diverse population, with a mix of races and ethnicities. Rockford is a great place to live and work, and is a great example of a small city with a lot to offer.
Common Questions
What is Per Capita Income in Rockford?
Per Capita income in Rockford is $41,083.
What is the Median Family Income in Rockford?
Median Family Income in Rockford is $100,224.
What is the Median Household income in Rockford?
Median Household Income in Rockford is $76,181.
What is Income or Wage Gap in Rockford?
Income or Wage Gap in Rockford is 33.8%.
Women in Rockford earn 66.2 cents for every dollar earned by a man.
What is Family Income Deficit in Rockford?
Family Income Deficit in Rockford is $4,527.
Families that are below poverty line in Rockford earn $4,527 less on average than the poverty threshold level.
What is Inequality or Gini Index in Rockford?
Inequality or Gini Index in Rockford is 0.40.
What is the Total Population of Rockford?
Total Population of Rockford is 4,638.
What is the Total Male Population of Rockford?
Total Male Population of Rockford is 2,299.
What is the Total Female Population of Rockford?
Total Female Population of Rockford is 2,339.
What is the Ratio of Males per 100 Females in Rockford?
There are 98.29 Males per 100 Females in Rockford.
What is the Ratio of Females per 100 Males in Rockford?
There are 101.74 Females per 100 Males in Rockford.
What is the Median Population Age in Rockford?
Median Population Age in Rockford is 39.8 Years.
What is the Average Family Size in Rockford
Average Family Size in Rockford is 3.1 People.
What is the Average Household Size in Rockford
Average Household Size in Rockford is 2.6 People.
How Large is the Labor Force in Rockford?
There are 2,809 People in the Labor Forcein in Rockford.
What is the Percentage of People in the Labor Force in Rockford?
73.2% of People are in the Labor Force in Rockford.
What is the Unemployment Rate in Rockford?
Unemployment Rate in Rockford is 3.1%.