Windom, MN Map & Demographics
Windom Map
Windom Overview
$32,550
PER CAPITA INCOME
$80,665
AVG FAMILY INCOME
$54,603
AVG HOUSEHOLD INCOME
36.4%
WAGE / INCOME GAP [ % ]
63.6¢/ $1
WAGE / INCOME GAP [ $ ]
$9,045
FAMILY INCOME DEFICIT
0.40
INEQUALITY / GINI INDEX
4,770
TOTAL POPULATION
2,410
MALE POPULATION
2,360
FEMALE POPULATION
102.12
MALES / 100 FEMALES
97.93
FEMALES / 100 MALES
41.6
MEDIAN AGE
2.9
AVG FAMILY SIZE
2.3
AVG HOUSEHOLD SIZE
2,323
LABOR FORCE [ PEOPLE ]
60.5%
PERCENT IN LABOR FORCE
5.3%
UNEMPLOYMENT RATE
Windom Zip Codes
Windom Area Codes
Income in Windom
Income Overview in Windom
Per Capita Income in Windom is $32,550, while median incomes of families and households are $80,665 and $54,603 respectively.
| Characteristic | Number | Measure |
| Per Capita Income | 4,770 | $32,550 |
| Median Family Income | 1,223 | $80,665 |
| Mean Family Income | 1,223 | $86,812 |
| Median Household Income | 1,955 | $54,603 |
| Mean Household Income | 1,955 | $77,083 |
| Income Deficit | 1,223 | $9,045 |
| Wage / Income Gap (%) | 4,770 | 36.45% |
| Wage / Income Gap ($) | 4,770 | 63.55¢ per $1 |
| Gini / Inequality Index | 4,770 | 0.40 |
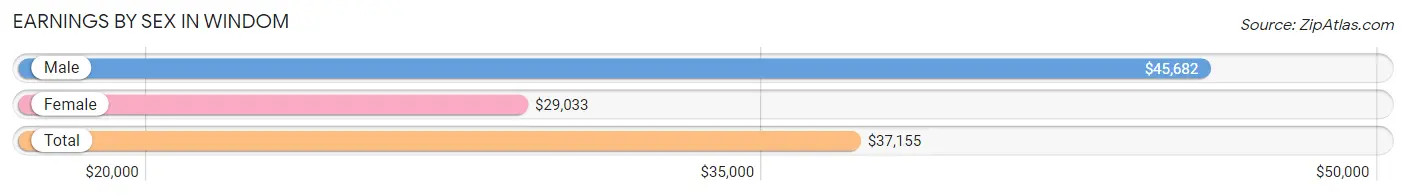
Earnings by Sex in Windom
Average Earnings in Windom are $37,155, $45,682 for men and $29,033 for women, a difference of 36.4%.
| Sex | Number | Average Earnings |
| Male | 1,278 (53.0%) | $45,682 |
| Female | 1,135 (47.0%) | $29,033 |
| Total | 2,413 (100.0%) | $37,155 |
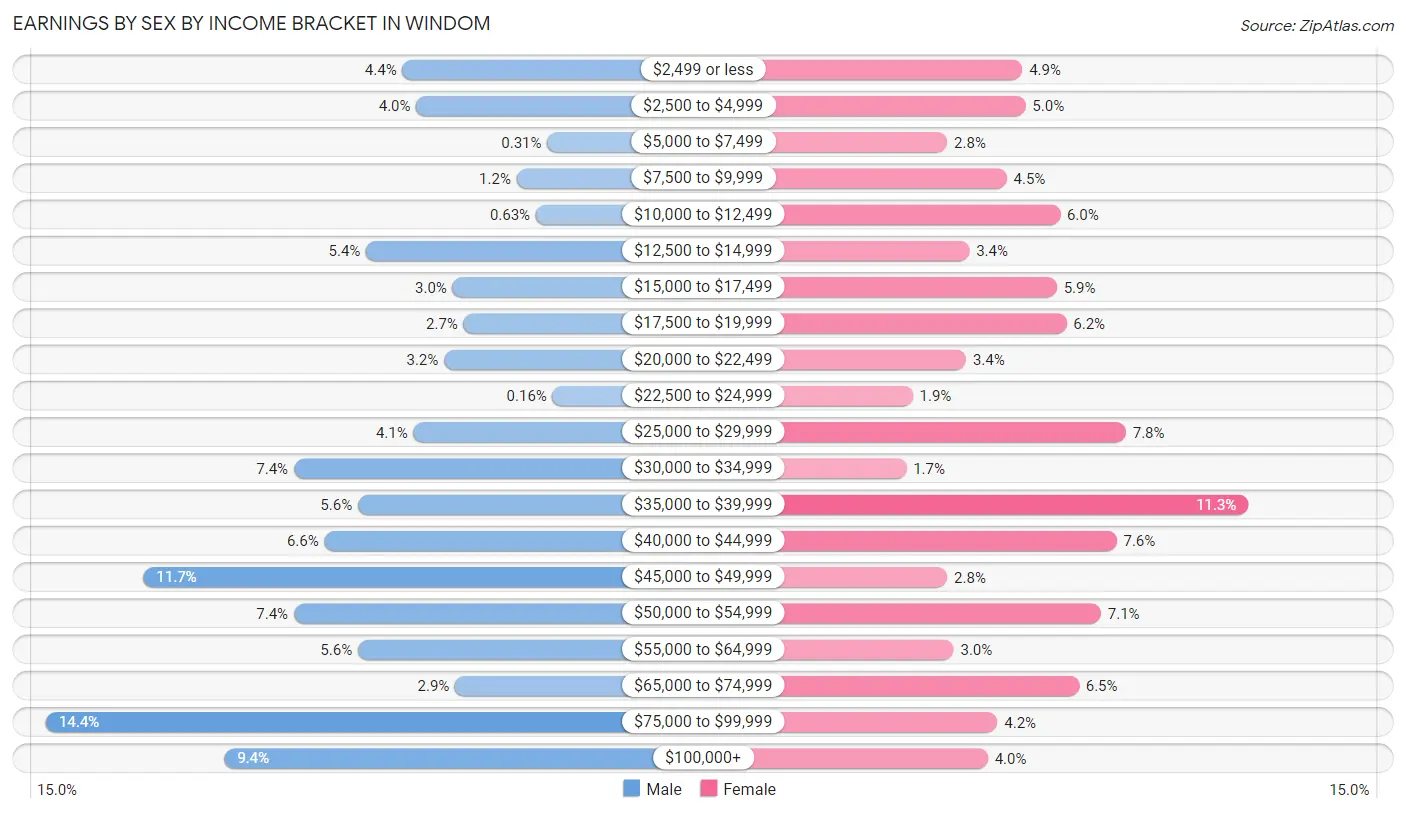
Earnings by Sex by Income Bracket in Windom
The most common earnings brackets in Windom are $75,000 to $99,999 for men (184 | 14.4%) and $35,000 to $39,999 for women (128 | 11.3%).
| Income | Male | Female |
| $2,499 or less | 56 (4.4%) | 56 (4.9%) |
| $2,500 to $4,999 | 51 (4.0%) | 57 (5.0%) |
| $5,000 to $7,499 | 4 (0.3%) | 32 (2.8%) |
| $7,500 to $9,999 | 15 (1.2%) | 51 (4.5%) |
| $10,000 to $12,499 | 8 (0.6%) | 68 (6.0%) |
| $12,500 to $14,999 | 69 (5.4%) | 39 (3.4%) |
| $15,000 to $17,499 | 38 (3.0%) | 67 (5.9%) |
| $17,500 to $19,999 | 34 (2.7%) | 70 (6.2%) |
| $20,000 to $22,499 | 41 (3.2%) | 38 (3.4%) |
| $22,500 to $24,999 | 2 (0.2%) | 21 (1.8%) |
| $25,000 to $29,999 | 52 (4.1%) | 89 (7.8%) |
| $30,000 to $34,999 | 95 (7.4%) | 19 (1.7%) |
| $35,000 to $39,999 | 72 (5.6%) | 128 (11.3%) |
| $40,000 to $44,999 | 84 (6.6%) | 86 (7.6%) |
| $45,000 to $49,999 | 149 (11.7%) | 32 (2.8%) |
| $50,000 to $54,999 | 95 (7.4%) | 81 (7.1%) |
| $55,000 to $64,999 | 72 (5.6%) | 34 (3.0%) |
| $65,000 to $74,999 | 37 (2.9%) | 74 (6.5%) |
| $75,000 to $99,999 | 184 (14.4%) | 48 (4.2%) |
| $100,000+ | 120 (9.4%) | 45 (4.0%) |
| Total | 1,278 (100.0%) | 1,135 (100.0%) |
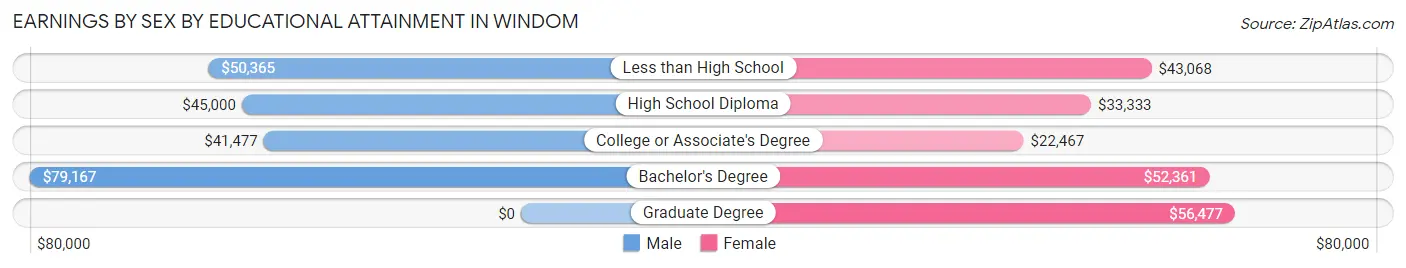
Earnings by Sex by Educational Attainment in Windom
Average earnings in Windom are $48,680 for men and $35,301 for women, a difference of 27.5%. Men with an educational attainment of bachelor's degree enjoy the highest average annual earnings of $79,167, while those with college or associate's degree education earn the least with $41,477. Women with an educational attainment of graduate degree earn the most with the average annual earnings of $56,477, while those with college or associate's degree education have the smallest earnings of $22,467.
| Educational Attainment | Male Income | Female Income |
| Less than High School | $50,365 | $43,068 |
| High School Diploma | $45,000 | $33,333 |
| College or Associate's Degree | $41,477 | $22,467 |
| Bachelor's Degree | $79,167 | $52,361 |
| Graduate Degree | - | - |
| Total | $48,680 | $35,301 |
Family Income in Windom
Family Income Brackets in Windom
According to the Windom family income data, there are 238 families falling into the $100,000 to $149,999 income range, which is the most common income bracket and makes up 19.5% of all families.
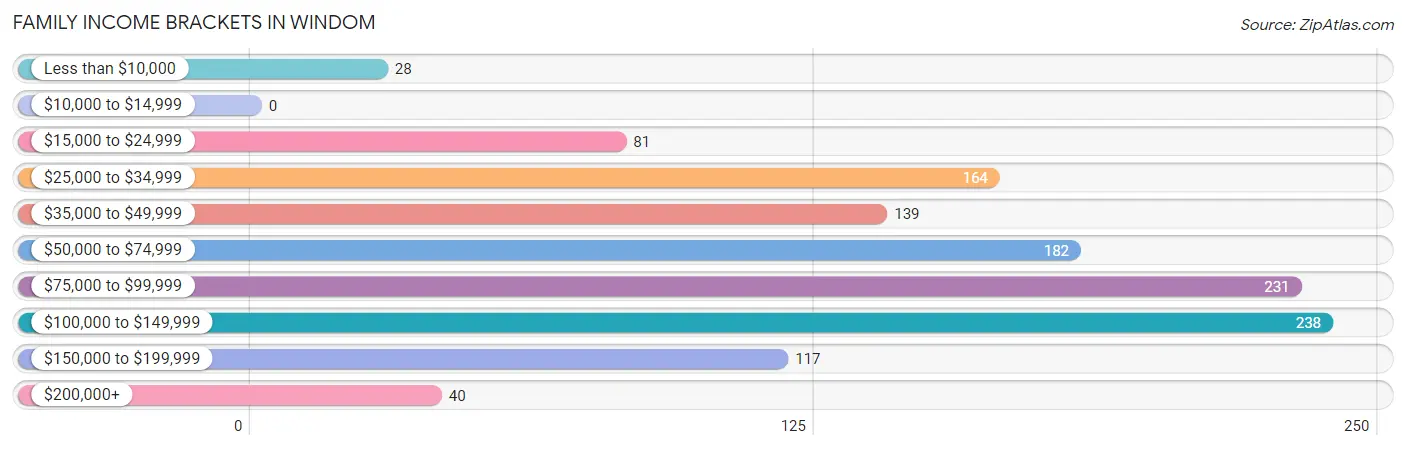
| Income Bracket | # Families | % Families |
| Less than $10,000 | 28 | 2.3% |
| $10,000 to $14,999 | 0 | 0.0% |
| $15,000 to $24,999 | 81 | 6.6% |
| $25,000 to $34,999 | 164 | 13.4% |
| $35,000 to $49,999 | 139 | 11.4% |
| $50,000 to $74,999 | 182 | 14.9% |
| $75,000 to $99,999 | 231 | 18.9% |
| $100,000 to $149,999 | 238 | 19.5% |
| $150,000 to $199,999 | 117 | 9.6% |
| $200,000+ | 40 | 3.3% |
Family Income by Famaliy Size in Windom
4-person families (134 | 11.0%) account for the highest median family income in Windom with $122,625 per family, while 2-person families (713 | 58.3%) have the highest median income of $32,942 per family member.
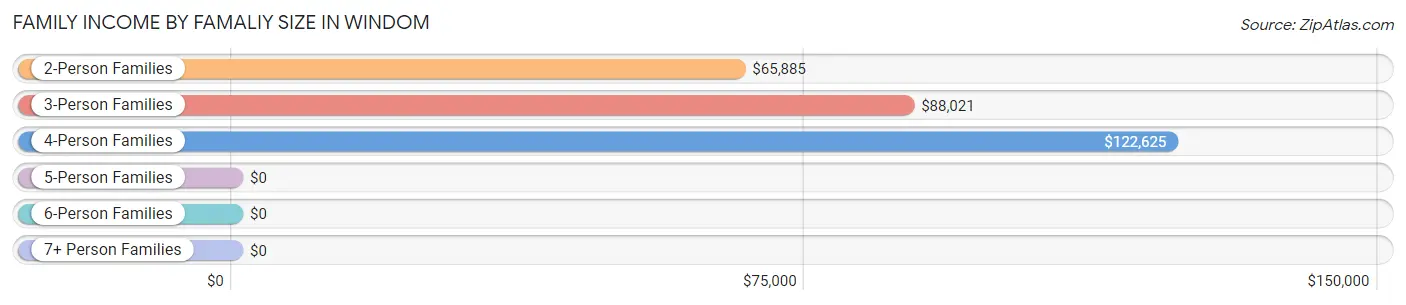
| Income Bracket | # Families | Median Income |
| 2-Person Families | 713 (58.3%) | $65,885 |
| 3-Person Families | 203 (16.6%) | $88,021 |
| 4-Person Families | 134 (11.0%) | $122,625 |
| 5-Person Families | 61 (5.0%) | $0 |
| 6-Person Families | 102 (8.3%) | $0 |
| 7+ Person Families | 10 (0.8%) | $0 |
| Total | 1,223 (100.0%) | $80,665 |
Family Income by Number of Earners in Windom
The median family income in Windom is $80,665, with families comprising 3+ earners (94) having the highest median family income of $111,250, while families with no earners (267) have the lowest median family income of $43,472, accounting for 7.7% and 21.8% of families, respectively.
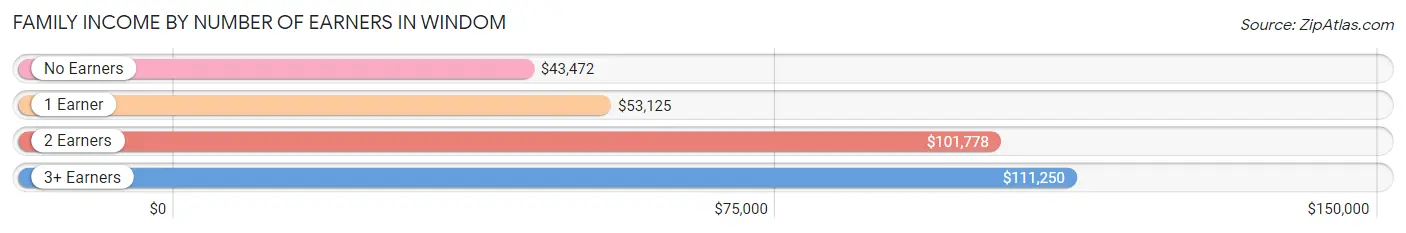
| Number of Earners | # Families | Median Income |
| No Earners | 267 (21.8%) | $43,472 |
| 1 Earner | 350 (28.6%) | $53,125 |
| 2 Earners | 512 (41.9%) | $101,778 |
| 3+ Earners | 94 (7.7%) | $111,250 |
| Total | 1,223 (100.0%) | $80,665 |
Household Income in Windom
Household Income Brackets in Windom
With 338 households falling in the category, the $25,000 to $34,999 income range is the most frequent in Windom, accounting for 17.3% of all households. In contrast, only 20 households (1.0%) fall into the $10,000 to $14,999 income bracket, making it the least populous group.
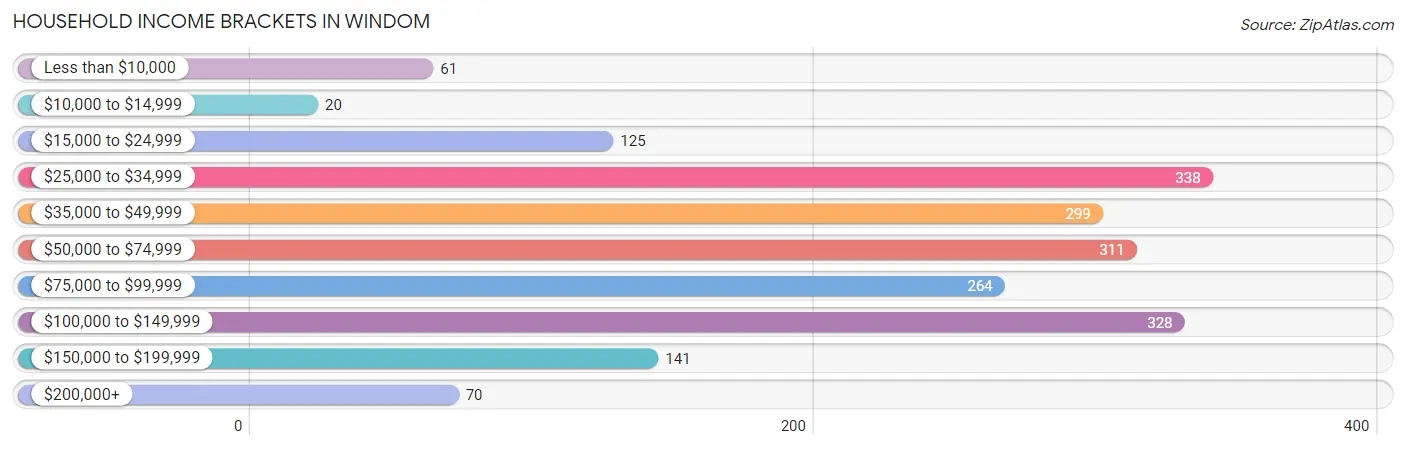
| Income Bracket | # Households | % Households |
| Less than $10,000 | 61 | 3.1% |
| $10,000 to $14,999 | 20 | 1.0% |
| $15,000 to $24,999 | 125 | 6.4% |
| $25,000 to $34,999 | 338 | 17.3% |
| $35,000 to $49,999 | 299 | 15.3% |
| $50,000 to $74,999 | 311 | 15.9% |
| $75,000 to $99,999 | 264 | 13.5% |
| $100,000 to $149,999 | 328 | 16.8% |
| $150,000 to $199,999 | 141 | 7.2% |
| $200,000+ | 70 | 3.6% |
Household Income by Householder Age in Windom
The median household income in Windom is $54,603, with the highest median household income of $95,208 found in the 25 to 44 years age bracket for the primary householder. A total of 574 households (29.4%) fall into this category. Meanwhile, the 15 to 24 years age bracket for the primary householder has the lowest median household income of $0, with 51 households (2.6%) in this group.
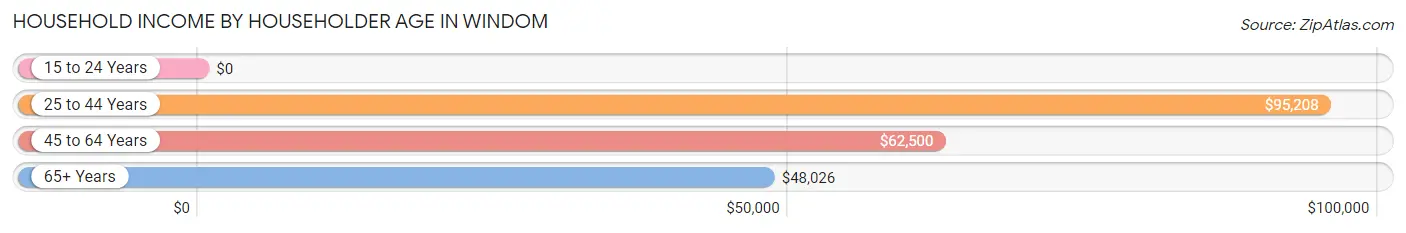
| Income Bracket | # Households | Median Income |
| 15 to 24 Years | 51 (2.6%) | $0 |
| 25 to 44 Years | 574 (29.4%) | $95,208 |
| 45 to 64 Years | 658 (33.7%) | $62,500 |
| 65+ Years | 672 (34.4%) | $48,026 |
| Total | 1,955 (100.0%) | $54,603 |
Poverty in Windom
Income Below Poverty by Sex and Age in Windom
With 9.4% poverty level for males and 15.1% for females among the residents of Windom, 12 to 14 year old males and 15 year old females are the most vulnerable to poverty, with 34 males (41.5%) and 6 females (100.0%) in their respective age groups living below the poverty level.
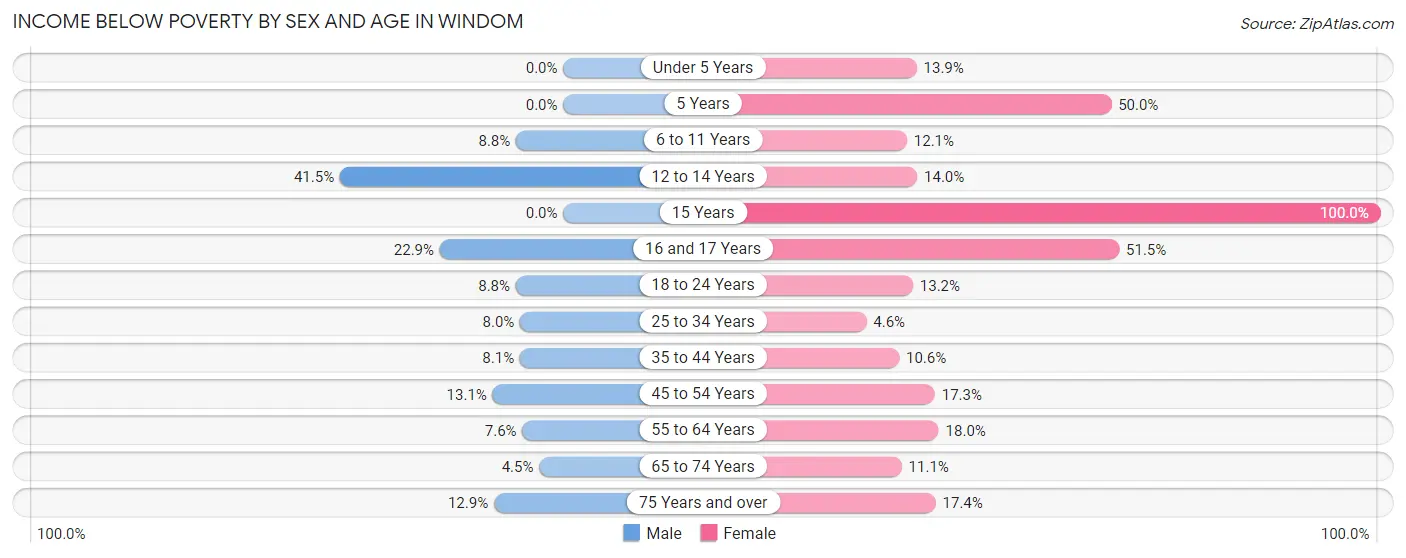
| Age Bracket | Male | Female |
| Under 5 Years | 0 (0.0%) | 25 (13.9%) |
| 5 Years | 0 (0.0%) | 9 (50.0%) |
| 6 to 11 Years | 20 (8.8%) | 18 (12.1%) |
| 12 to 14 Years | 34 (41.5%) | 13 (14.0%) |
| 15 Years | 0 (0.0%) | 6 (100.0%) |
| 16 and 17 Years | 11 (22.9%) | 35 (51.5%) |
| 18 to 24 Years | 17 (8.8%) | 19 (13.2%) |
| 25 to 34 Years | 31 (8.0%) | 11 (4.5%) |
| 35 to 44 Years | 21 (8.1%) | 24 (10.6%) |
| 45 to 54 Years | 21 (13.1%) | 39 (17.3%) |
| 55 to 64 Years | 25 (7.6%) | 57 (18.0%) |
| 65 to 74 Years | 12 (4.5%) | 31 (11.1%) |
| 75 Years and over | 34 (12.9%) | 51 (17.4%) |
| Total | 226 (9.4%) | 338 (15.1%) |
Income Above Poverty by Sex and Age in Windom
According to the poverty statistics in Windom, males aged under 5 years and females aged 25 to 34 years are the age groups that are most secure financially, with 100.0% of males and 95.5% of females in these age groups living above the poverty line.
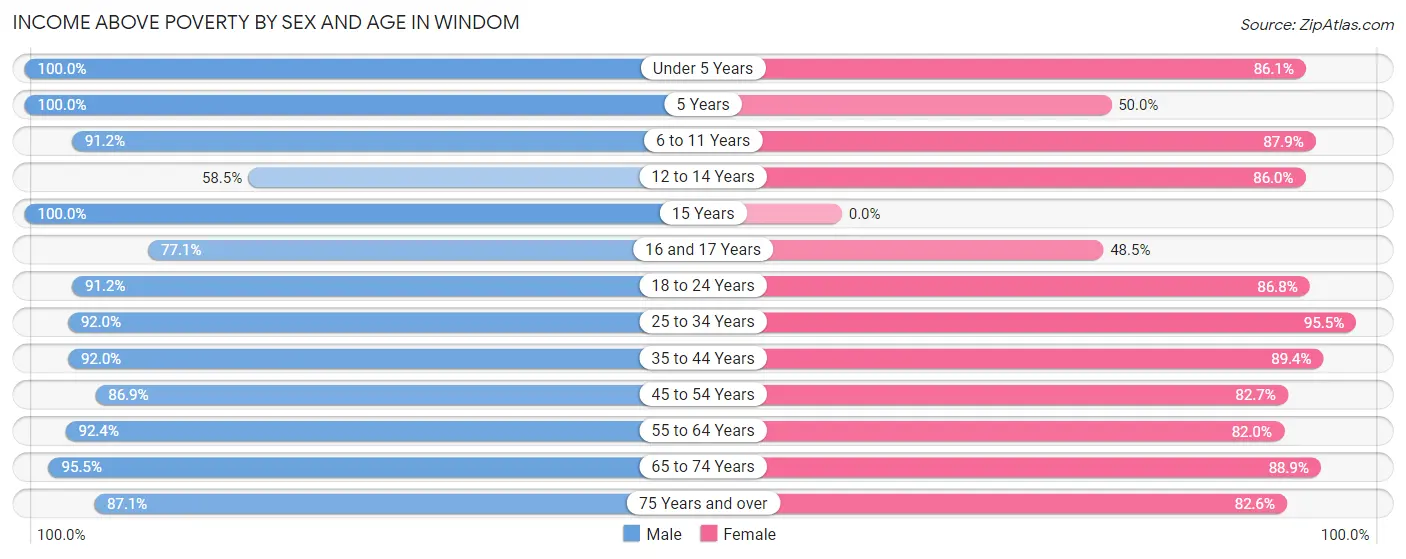
| Age Bracket | Male | Female |
| Under 5 Years | 88 (100.0%) | 155 (86.1%) |
| 5 Years | 40 (100.0%) | 9 (50.0%) |
| 6 to 11 Years | 208 (91.2%) | 131 (87.9%) |
| 12 to 14 Years | 48 (58.5%) | 80 (86.0%) |
| 15 Years | 46 (100.0%) | 0 (0.0%) |
| 16 and 17 Years | 37 (77.1%) | 33 (48.5%) |
| 18 to 24 Years | 176 (91.2%) | 125 (86.8%) |
| 25 to 34 Years | 356 (92.0%) | 231 (95.5%) |
| 35 to 44 Years | 240 (91.9%) | 202 (89.4%) |
| 45 to 54 Years | 139 (86.9%) | 187 (82.7%) |
| 55 to 64 Years | 304 (92.4%) | 260 (82.0%) |
| 65 to 74 Years | 257 (95.5%) | 248 (88.9%) |
| 75 Years and over | 230 (87.1%) | 242 (82.6%) |
| Total | 2,169 (90.6%) | 1,903 (84.9%) |
Income Below Poverty Among Married-Couple Families in Windom
The poverty statistics for married-couple families in Windom show that 2.4% or 22 of the total 935 families live below the poverty line. Families with no children have the highest poverty rate of 3.9%, comprising of 22 families. On the other hand, families with 1 or 2 children have the lowest poverty rate of 0.0%, which includes 0 families.
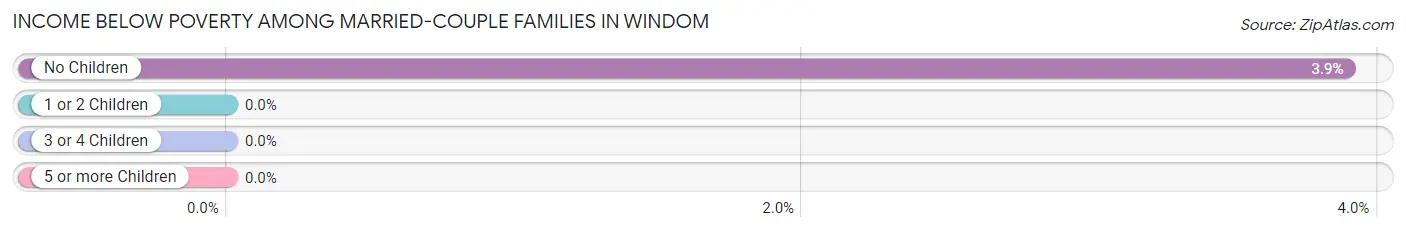
| Children | Above Poverty | Below Poverty |
| No Children | 543 (96.1%) | 22 (3.9%) |
| 1 or 2 Children | 260 (100.0%) | 0 (0.0%) |
| 3 or 4 Children | 110 (100.0%) | 0 (0.0%) |
| 5 or more Children | 0 (0.0%) | 0 (0.0%) |
| Total | 913 (97.7%) | 22 (2.4%) |
Income Below Poverty Among Single-Parent Households in Windom
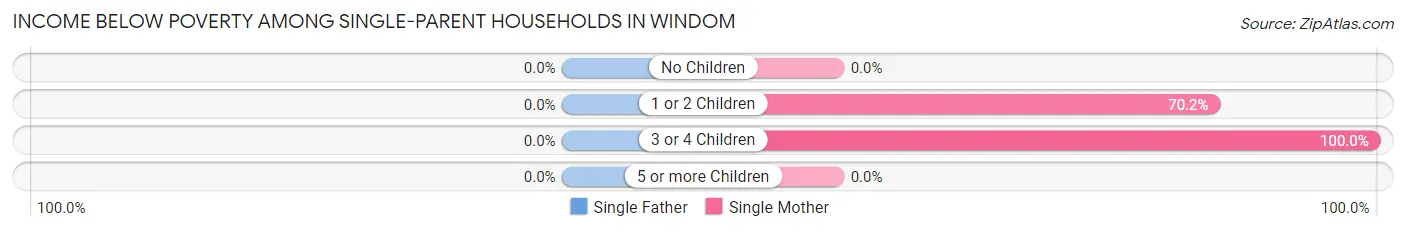
| Children | Single Father | Single Mother |
| No Children | 0 (0.0%) | 0 (0.0%) |
| 1 or 2 Children | 0 (0.0%) | 47 (70.2%) |
| 3 or 4 Children | 0 (0.0%) | 32 (100.0%) |
| 5 or more Children | 0 (0.0%) | 0 (0.0%) |
| Total | 0 (0.0%) | 79 (52.3%) |
Income Below Poverty Among Married-Couple vs Single-Parent Households in Windom
The poverty data for Windom shows that 22 of the married-couple family households (2.4%) and 79 of the single-parent households (27.4%) are living below the poverty level. Within the married-couple family households, those with no children have the highest poverty rate, with 22 households (3.9%) falling below the poverty line. Among the single-parent households, those with 3 or 4 children have the highest poverty rate, with 32 household (100.0%) living below poverty.
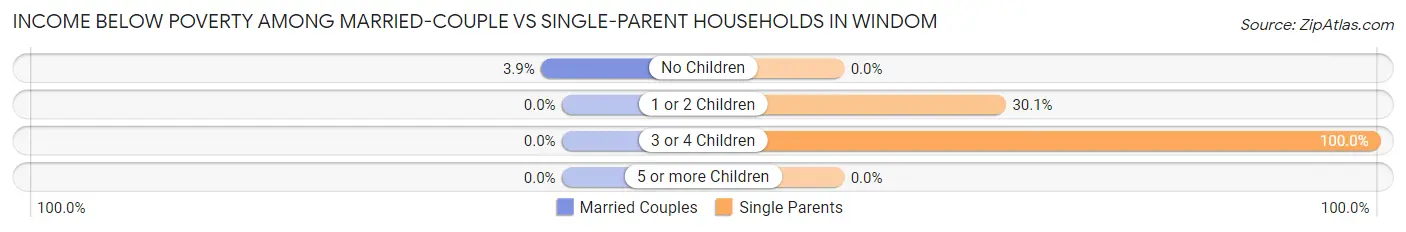
| Children | Married-Couple Families | Single-Parent Households |
| No Children | 22 (3.9%) | 0 (0.0%) |
| 1 or 2 Children | 0 (0.0%) | 47 (30.1%) |
| 3 or 4 Children | 0 (0.0%) | 32 (100.0%) |
| 5 or more Children | 0 (0.0%) | 0 (0.0%) |
| Total | 22 (2.4%) | 79 (27.4%) |
Race in Windom
The most populous races in Windom are White / Caucasian (3,901 | 81.8%), Hispanic or Latino (634 | 13.3%), and Some other Race (360 | 7.5%).
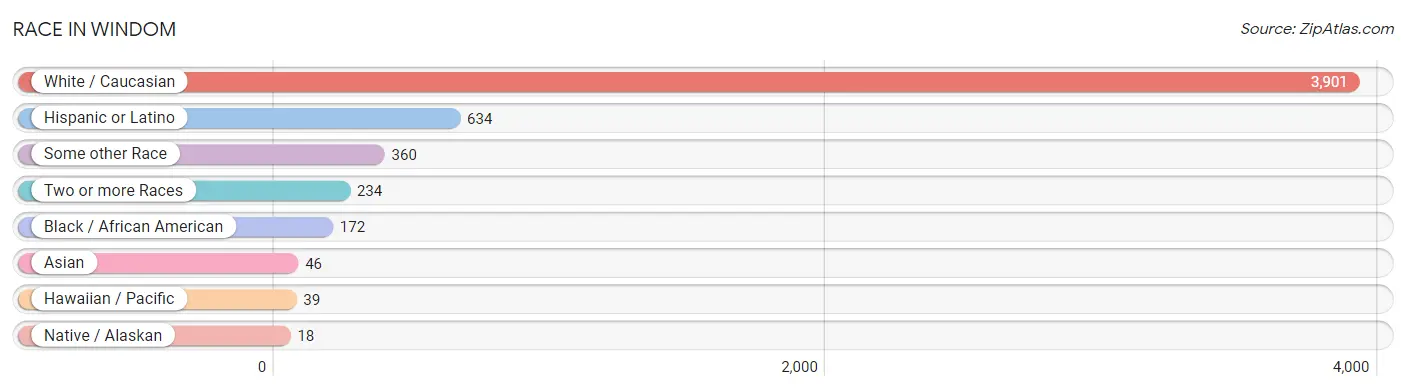
| Race | # Population | % Population |
| Asian | 46 | 1.0% |
| Black / African American | 172 | 3.6% |
| Hawaiian / Pacific | 39 | 0.8% |
| Hispanic or Latino | 634 | 13.3% |
| Native / Alaskan | 18 | 0.4% |
| White / Caucasian | 3,901 | 81.8% |
| Two or more Races | 234 | 4.9% |
| Some other Race | 360 | 7.5% |
| Total | 4,770 | 100.0% |
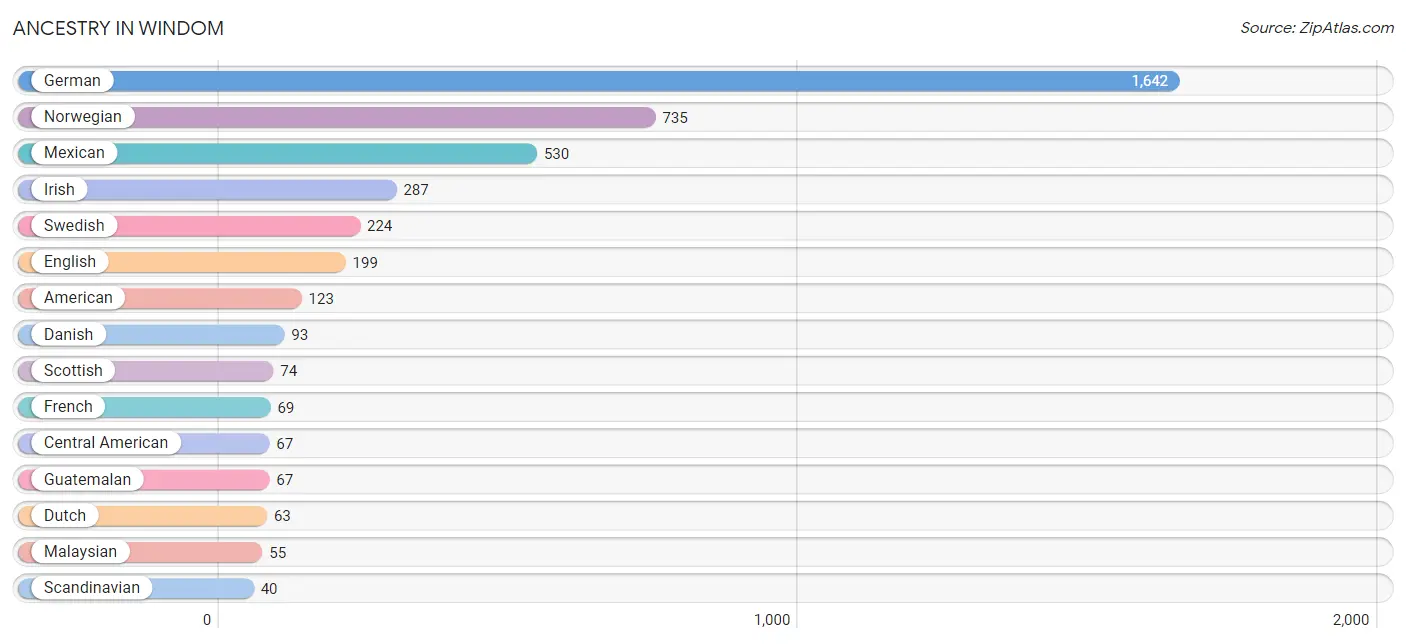
Ancestry in Windom
The most populous ancestries reported in Windom are German (1,642 | 34.4%), Norwegian (735 | 15.4%), Mexican (530 | 11.1%), Irish (287 | 6.0%), and Swedish (224 | 4.7%), together accounting for 71.7% of all Windom residents.
| Ancestry | # Population | % Population |
| American | 123 | 2.6% |
| Armenian | 7 | 0.2% |
| Bangladeshi | 3 | 0.1% |
| Central American | 67 | 1.4% |
| Cherokee | 11 | 0.2% |
| Chippewa | 15 | 0.3% |
| Cuban | 24 | 0.5% |
| Czech | 14 | 0.3% |
| Danish | 93 | 1.9% |
| Dutch | 63 | 1.3% |
| Eastern European | 5 | 0.1% |
| English | 199 | 4.2% |
| Finnish | 34 | 0.7% |
| French | 69 | 1.5% |
| German | 1,642 | 34.4% |
| Guatemalan | 67 | 1.4% |
| Indian (Asian) | 9 | 0.2% |
| Irish | 287 | 6.0% |
| Japanese | 15 | 0.3% |
| Malaysian | 55 | 1.1% |
| Mexican | 530 | 11.1% |
| Norwegian | 735 | 15.4% |
| Pakistani | 15 | 0.3% |
| Polish | 18 | 0.4% |
| Scandinavian | 40 | 0.8% |
| Scotch-Irish | 36 | 0.7% |
| Scottish | 74 | 1.5% |
| Sri Lankan | 15 | 0.3% |
| Swedish | 224 | 4.7% |
| Swiss | 9 | 0.2% |
| Turkish | 18 | 0.4% |
| Welsh | 18 | 0.4% | View All 32 Rows |
Immigrants in Windom
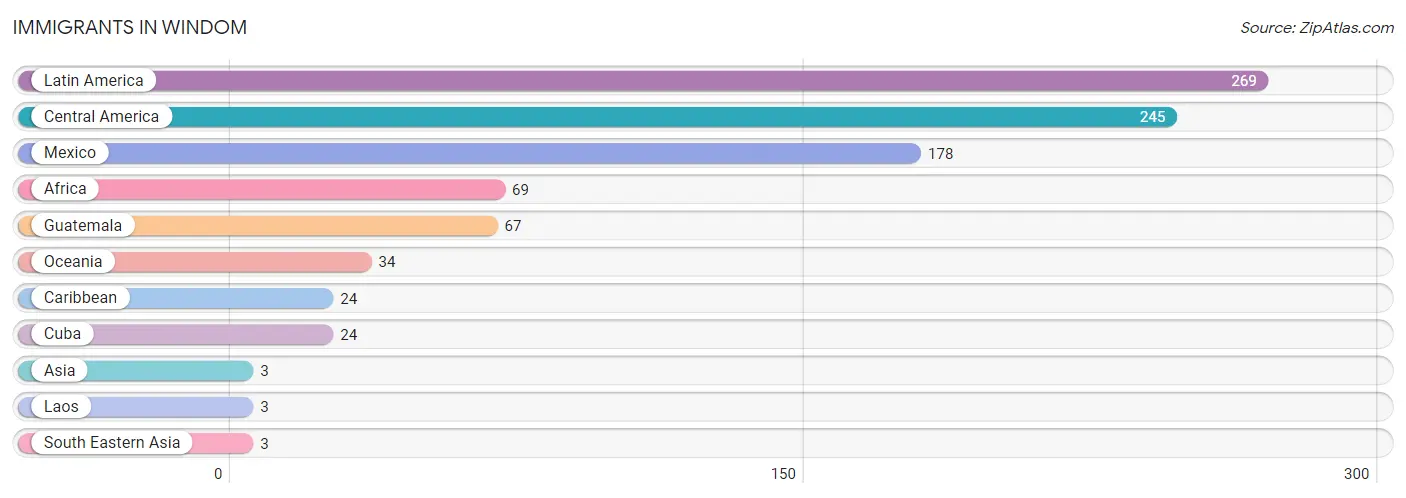
The most numerous immigrant groups reported in Windom came from Latin America (269 | 5.6%), Central America (245 | 5.1%), Mexico (178 | 3.7%), Africa (69 | 1.5%), and Guatemala (67 | 1.4%), together accounting for 17.4% of all Windom residents.
| Immigration Origin | # Population | % Population |
| Africa | 69 | 1.5% |
| Asia | 3 | 0.1% |
| Caribbean | 24 | 0.5% |
| Central America | 245 | 5.1% |
| Cuba | 24 | 0.5% |
| Guatemala | 67 | 1.4% |
| Laos | 3 | 0.1% |
| Latin America | 269 | 5.6% |
| Mexico | 178 | 3.7% |
| Oceania | 34 | 0.7% |
| South Eastern Asia | 3 | 0.1% | View All 11 Rows |
Sex and Age in Windom
Sex and Age in Windom
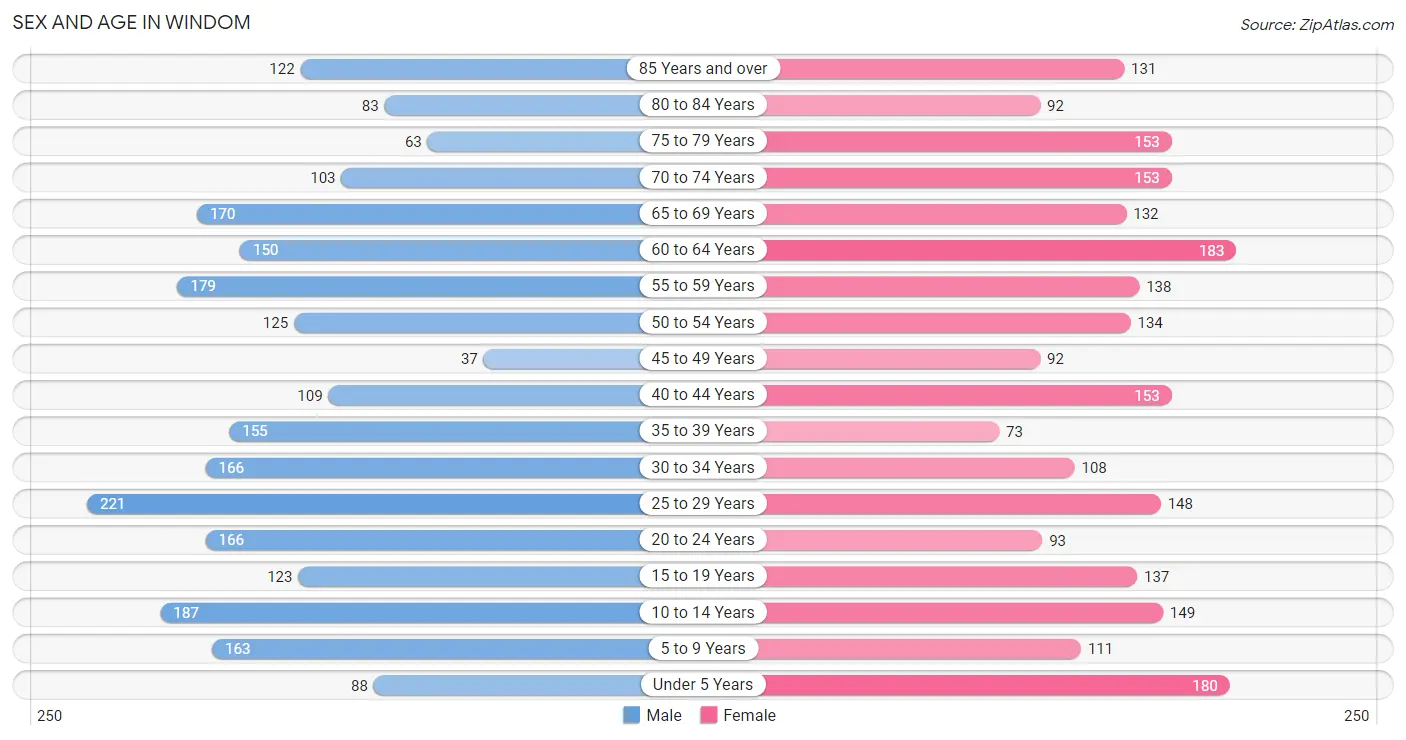
The most populous age groups in Windom are 25 to 29 Years (221 | 9.2%) for men and 60 to 64 Years (183 | 7.7%) for women.
| Age Bracket | Male | Female |
| Under 5 Years | 88 (3.6%) | 180 (7.6%) |
| 5 to 9 Years | 163 (6.8%) | 111 (4.7%) |
| 10 to 14 Years | 187 (7.8%) | 149 (6.3%) |
| 15 to 19 Years | 123 (5.1%) | 137 (5.8%) |
| 20 to 24 Years | 166 (6.9%) | 93 (3.9%) |
| 25 to 29 Years | 221 (9.2%) | 148 (6.3%) |
| 30 to 34 Years | 166 (6.9%) | 108 (4.6%) |
| 35 to 39 Years | 155 (6.4%) | 73 (3.1%) |
| 40 to 44 Years | 109 (4.5%) | 153 (6.5%) |
| 45 to 49 Years | 37 (1.5%) | 92 (3.9%) |
| 50 to 54 Years | 125 (5.2%) | 134 (5.7%) |
| 55 to 59 Years | 179 (7.4%) | 138 (5.9%) |
| 60 to 64 Years | 150 (6.2%) | 183 (7.7%) |
| 65 to 69 Years | 170 (7.0%) | 132 (5.6%) |
| 70 to 74 Years | 103 (4.3%) | 153 (6.5%) |
| 75 to 79 Years | 63 (2.6%) | 153 (6.5%) |
| 80 to 84 Years | 83 (3.4%) | 92 (3.9%) |
| 85 Years and over | 122 (5.1%) | 131 (5.6%) |
| Total | 2,410 (100.0%) | 2,360 (100.0%) |
Families and Households in Windom
Median Family Size in Windom
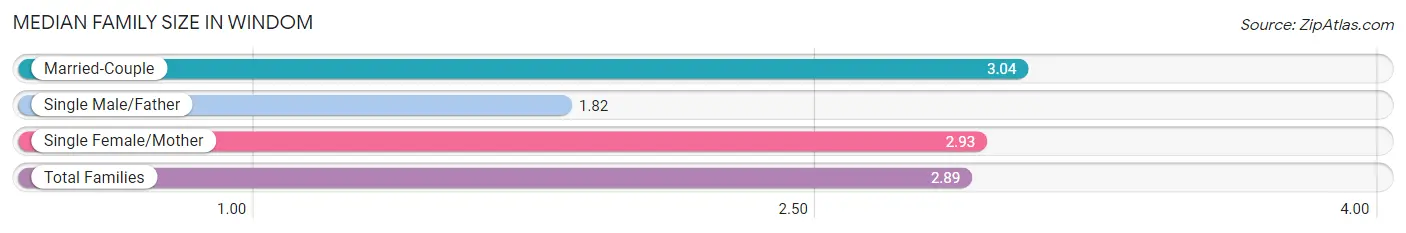
The median family size in Windom is 2.89 persons per family, with married-couple families (935 | 76.4%) accounting for the largest median family size of 3.04 persons per family. On the other hand, single male/father families (137 | 11.2%) represent the smallest median family size with 1.82 persons per family.
| Family Type | # Families | Family Size |
| Married-Couple | 935 (76.4%) | 3.04 |
| Single Male/Father | 137 (11.2%) | 1.82 |
| Single Female/Mother | 151 (12.3%) | 2.93 |
| Total Families | 1,223 (100.0%) | 2.89 |
Median Household Size in Windom
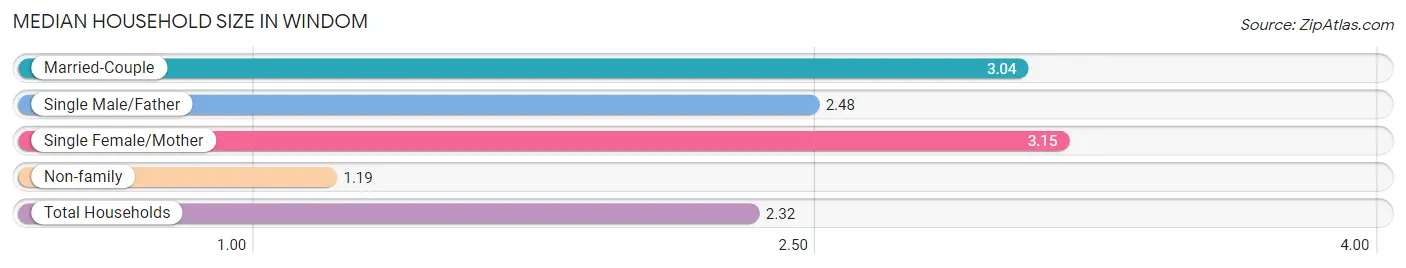
The median household size in Windom is 2.32 persons per household, with single female/mother households (151 | 7.7%) accounting for the largest median household size of 3.15 persons per household. non-family households (732 | 37.4%) represent the smallest median household size with 1.19 persons per household.
| Household Type | # Households | Household Size |
| Married-Couple | 935 (47.8%) | 3.04 |
| Single Male/Father | 137 (7.0%) | 2.48 |
| Single Female/Mother | 151 (7.7%) | 3.15 |
| Non-family | 732 (37.4%) | 1.19 |
| Total Households | 1,955 (100.0%) | 2.32 |
Household Size by Marriage Status in Windom
Out of a total of 1,955 households in Windom, 1,223 (62.6%) are family households, while 732 (37.4%) are nonfamily households. The most numerous type of family households are 2-person households, comprising 619, and the most common type of nonfamily households are 1-person households, comprising 639.
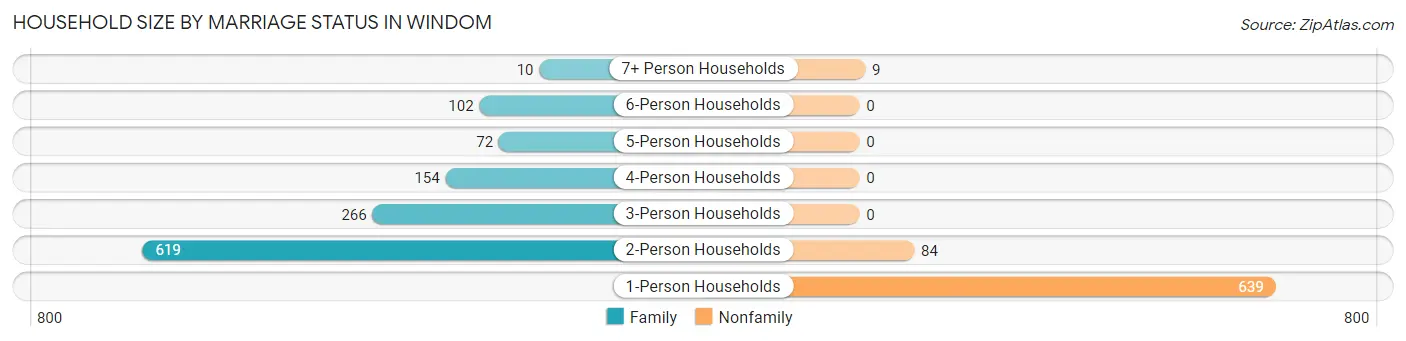
| Household Size | Family Households | Nonfamily Households |
| 1-Person Households | - | 639 (32.7%) |
| 2-Person Households | 619 (31.7%) | 84 (4.3%) |
| 3-Person Households | 266 (13.6%) | 0 (0.0%) |
| 4-Person Households | 154 (7.9%) | 0 (0.0%) |
| 5-Person Households | 72 (3.7%) | 0 (0.0%) |
| 6-Person Households | 102 (5.2%) | 0 (0.0%) |
| 7+ Person Households | 10 (0.5%) | 9 (0.5%) |
| Total | 1,223 (62.6%) | 732 (37.4%) |
Female Fertility in Windom
Fertility by Age in Windom
Average fertility rate in Windom is 24.0 births per 1,000 women. Women in the age bracket of 20 to 34 years have the highest fertility rate with 57.0 births per 1,000 women. Women in the age bracket of 20 to 34 years acount for 100.0% of all women with births.
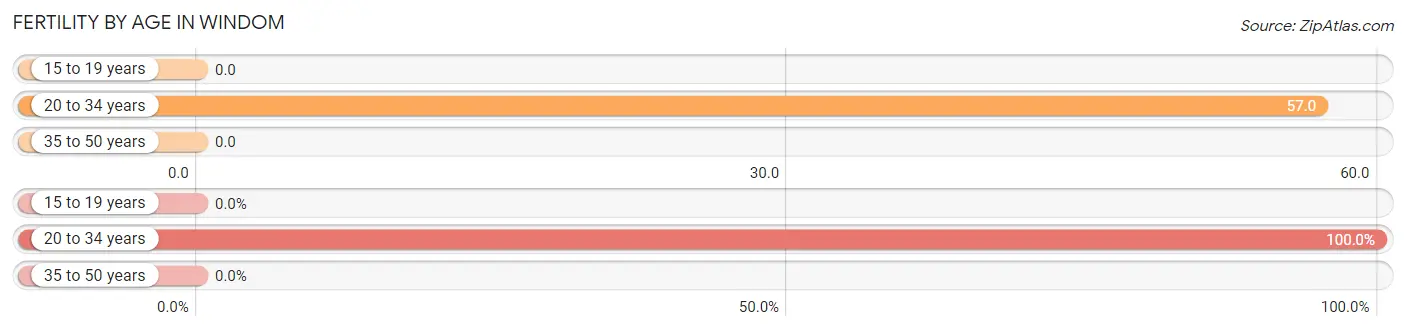
| Age Bracket | Women with Births | Births / 1,000 Women |
| 15 to 19 years | 0 (0.0%) | 0.0 |
| 20 to 34 years | 20 (100.0%) | 57.0 |
| 35 to 50 years | 0 (0.0%) | 0.0 |
| Total | 20 (100.0%) | 24.0 |
Fertility by Age by Marriage Status in Windom
45.0% of women with births (20) in Windom are married. The highest percentage of unmarried women with births falls into 20 to 34 years age bracket with 55.0% of them unmarried at the time of birth, while the lowest percentage of unmarried women with births belong to 20 to 34 years age bracket with 55.0% of them unmarried.
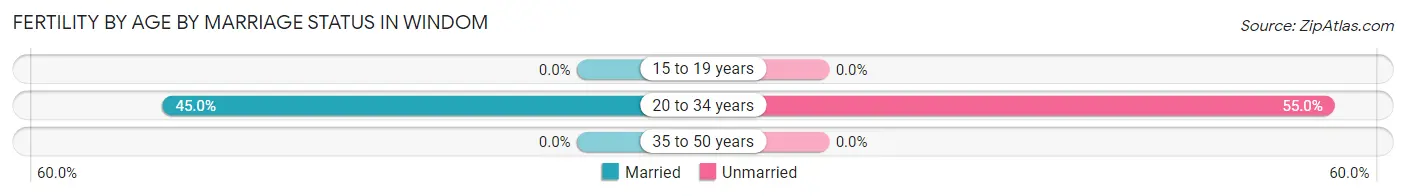
| Age Bracket | Married | Unmarried |
| 15 to 19 years | 0 (0.0%) | 0 (0.0%) |
| 20 to 34 years | 9 (45.0%) | 11 (55.0%) |
| 35 to 50 years | 0 (0.0%) | 0 (0.0%) |
| Total | 9 (45.0%) | 11 (55.0%) |
Fertility by Education in Windom
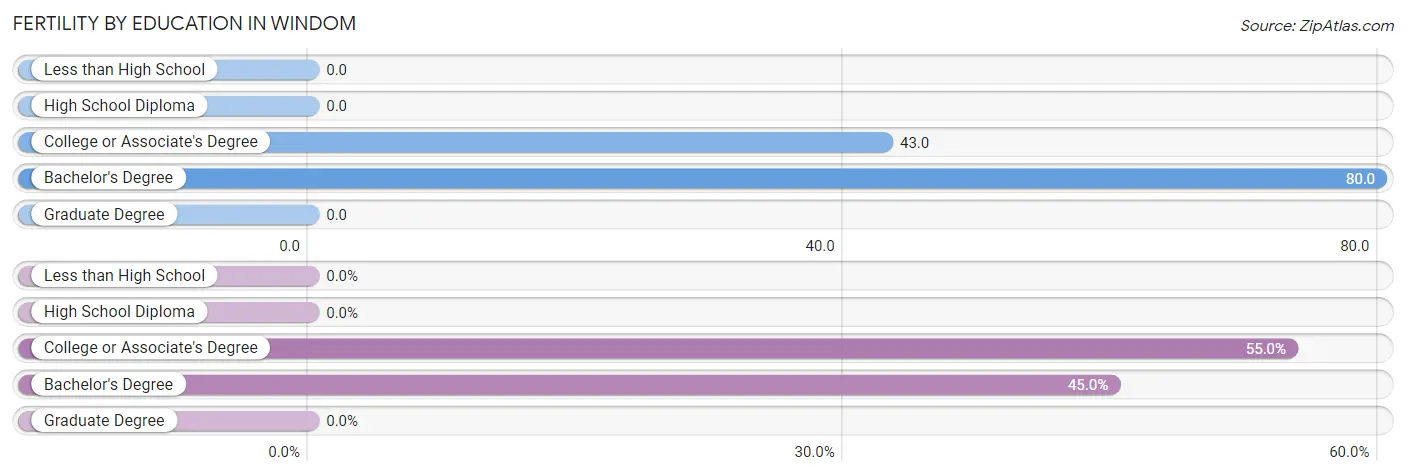
| Educational Attainment | Women with Births | Births / 1,000 Women |
| Less than High School | 0 (0.0%) | 0.0 |
| High School Diploma | 0 (0.0%) | 0.0 |
| College or Associate's Degree | 11 (55.0%) | 43.0 |
| Bachelor's Degree | 9 (45.0%) | 80.0 |
| Graduate Degree | 0 (0.0%) | 0.0 |
| Total | 20 (100.0%) | 24.0 |
Fertility by Education by Marriage Status in Windom
55.0% of women with births in Windom are unmarried. Women with the educational attainment of bachelor's degree are most likely to be married with 100.0% of them married at childbirth, while women with the educational attainment of college or associate's degree are least likely to be married with 100.0% of them unmarried at childbirth.
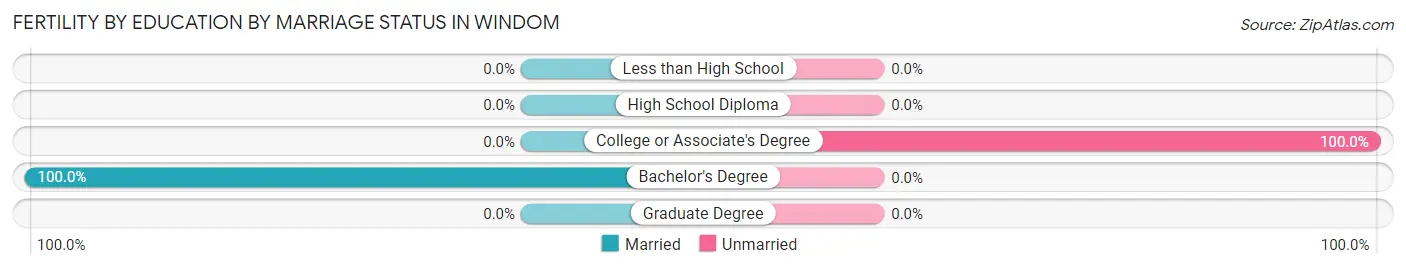
| Educational Attainment | Married | Unmarried |
| Less than High School | 0 (0.0%) | 0 (0.0%) |
| High School Diploma | 0 (0.0%) | 0 (0.0%) |
| College or Associate's Degree | 0 (0.0%) | 11 (100.0%) |
| Bachelor's Degree | 9 (100.0%) | 0 (0.0%) |
| Graduate Degree | 0 (0.0%) | 0 (0.0%) |
| Total | 9 (45.0%) | 11 (55.0%) |
Employment Characteristics in Windom
Employment by Class of Employer in Windom
Among the 2,116 employed individuals in Windom, private company employees (1,346 | 63.6%), local government employees (248 | 11.7%), and not-for-profit organizations (192 | 9.1%) make up the most common classes of employment.
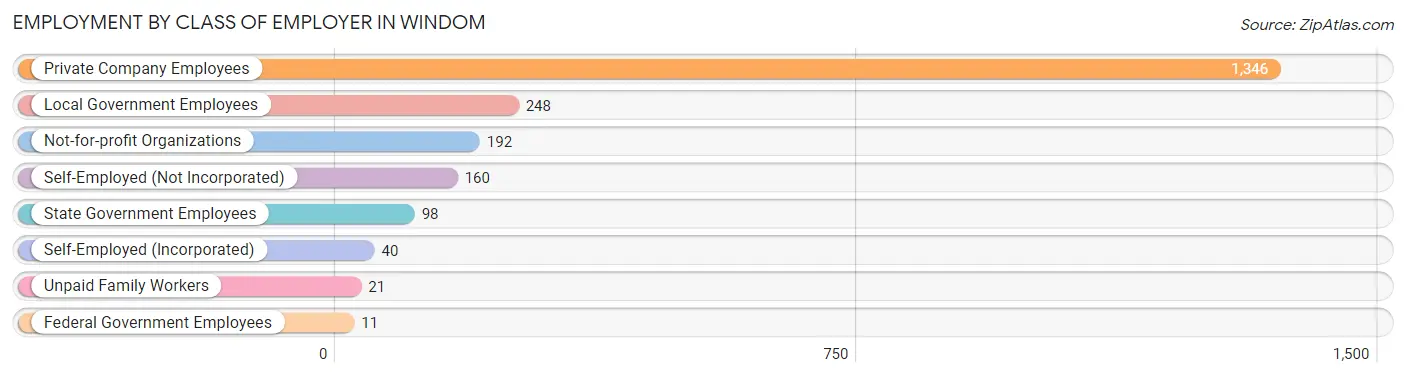
| Employer Class | # Employees | % Employees |
| Private Company Employees | 1,346 | 63.6% |
| Self-Employed (Incorporated) | 40 | 1.9% |
| Self-Employed (Not Incorporated) | 160 | 7.6% |
| Not-for-profit Organizations | 192 | 9.1% |
| Local Government Employees | 248 | 11.7% |
| State Government Employees | 98 | 4.6% |
| Federal Government Employees | 11 | 0.5% |
| Unpaid Family Workers | 21 | 1.0% |
| Total | 2,116 | 100.0% |
Employment Status by Age in Windom
According to the labor force statistics for Windom, out of the total population over 16 years of age (3,840), 60.5% or 2,323 individuals are in the labor force, with 5.3% or 123 of them unemployed. The age group with the highest labor force participation rate is 30 to 34 years, with 88.7% or 243 individuals in the labor force. Within the labor force, the 16 to 19 years age range has the highest percentage of unemployed individuals, with 20.4% or 19 of them being unemployed.
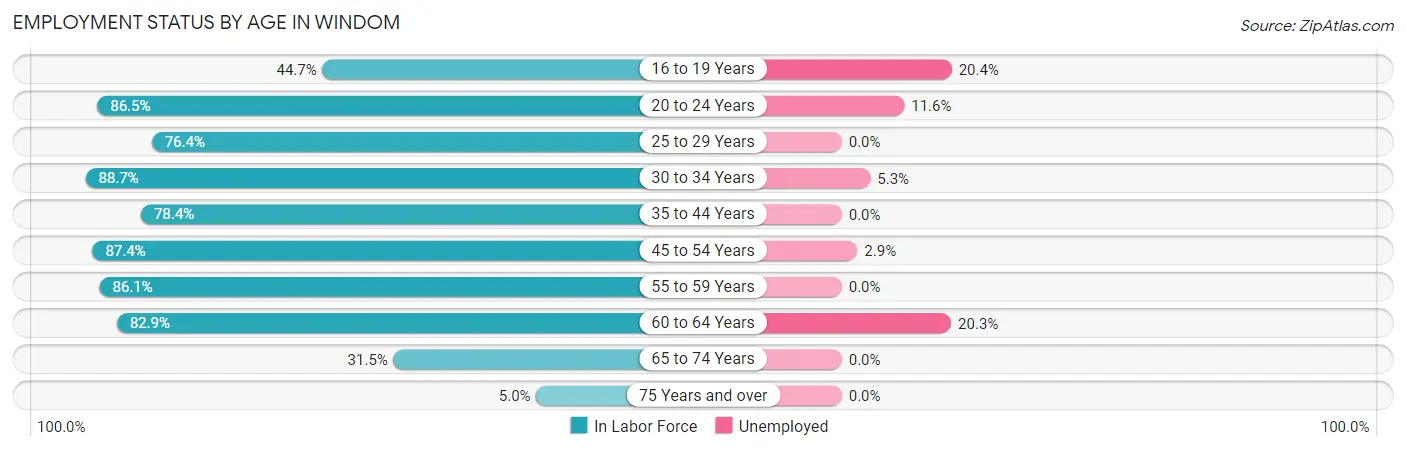
| Age Bracket | In Labor Force | Unemployed |
| 16 to 19 Years | 93 (44.7%) | 19 (20.4%) |
| 20 to 24 Years | 224 (86.5%) | 26 (11.6%) |
| 25 to 29 Years | 282 (76.4%) | 0 (0.0%) |
| 30 to 34 Years | 243 (88.7%) | 13 (5.3%) |
| 35 to 44 Years | 384 (78.4%) | 0 (0.0%) |
| 45 to 54 Years | 339 (87.4%) | 10 (2.9%) |
| 55 to 59 Years | 273 (86.1%) | 0 (0.0%) |
| 60 to 64 Years | 276 (82.9%) | 56 (20.3%) |
| 65 to 74 Years | 176 (31.5%) | 0 (0.0%) |
| 75 Years and over | 32 (5.0%) | 0 (0.0%) |
| Total | 2,323 (60.5%) | 123 (5.3%) |
Employment Status by Educational Attainment in Windom
According to labor force statistics for Windom, 82.8% of individuals (1,798) out of the total population between 25 and 64 years of age (2,171) are in the labor force, with 4.4% or 79 of them being unemployed. The group with the highest labor force participation rate are those with the educational attainment of bachelor's degree or higher, with 93.6% or 501 individuals in the labor force. Within the labor force, individuals with less than high school education have the highest percentage of unemployment, with 14.8% or 13 of them being unemployed.
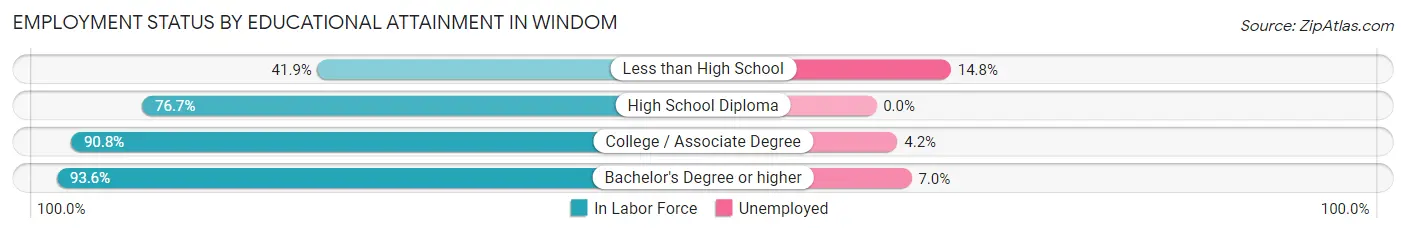
| Educational Attainment | In Labor Force | Unemployed |
| Less than High School | 88 (41.9%) | 31 (14.8%) |
| High School Diploma | 474 (76.7%) | 0 (0.0%) |
| College / Associate Degree | 734 (90.8%) | 34 (4.2%) |
| Bachelor's Degree or higher | 501 (93.6%) | 37 (7.0%) |
| Total | 1,798 (82.8%) | 96 (4.4%) |
Employment Occupations by Sex in Windom
Management, Business, Science and Arts Occupations
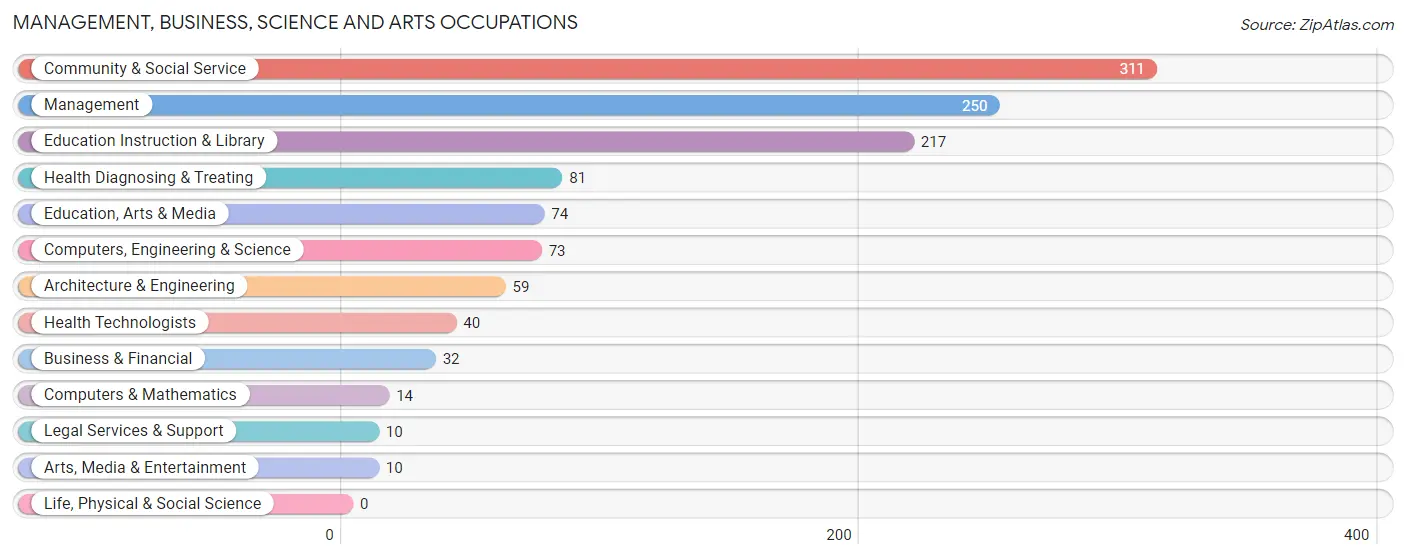
The most common Management, Business, Science and Arts occupations in Windom are Community & Social Service (311 | 14.1%), Management (250 | 11.4%), Education Instruction & Library (217 | 9.9%), Health Diagnosing & Treating (81 | 3.7%), and Education, Arts & Media (74 | 3.4%).
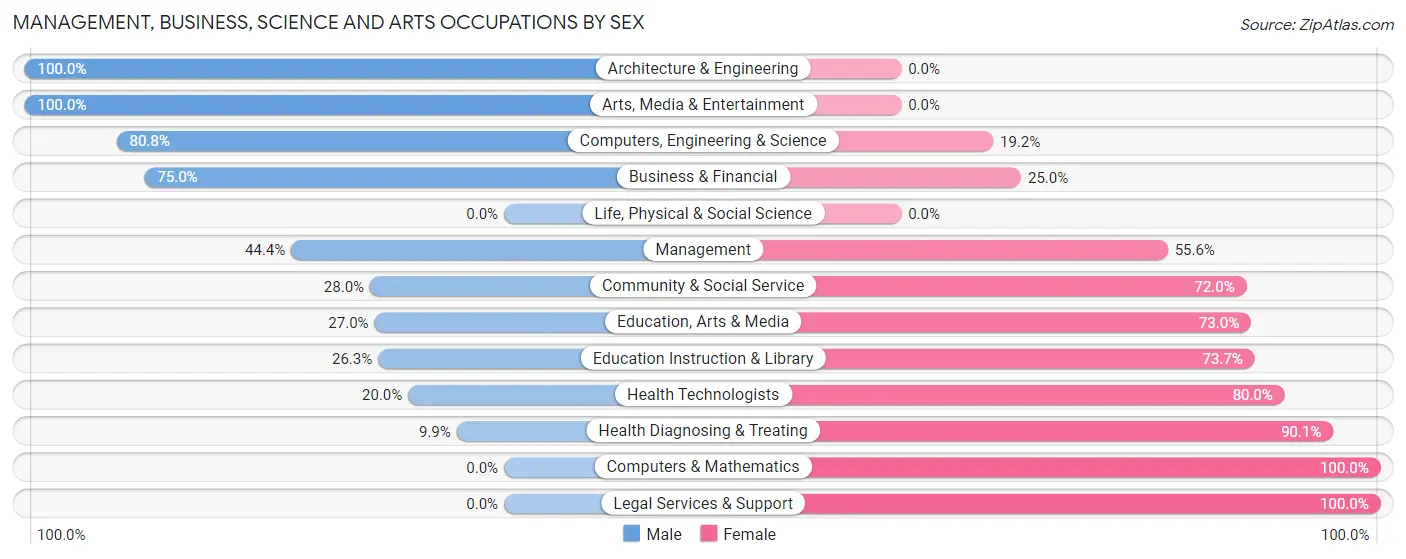
Management, Business, Science and Arts Occupations by Sex
Within the Management, Business, Science and Arts occupations in Windom, the most male-oriented occupations are Architecture & Engineering (100.0%), Arts, Media & Entertainment (100.0%), and Computers, Engineering & Science (80.8%), while the most female-oriented occupations are Computers & Mathematics (100.0%), Legal Services & Support (100.0%), and Health Diagnosing & Treating (90.1%).
| Occupation | Male | Female |
| Management | 111 (44.4%) | 139 (55.6%) |
| Business & Financial | 24 (75.0%) | 8 (25.0%) |
| Computers, Engineering & Science | 59 (80.8%) | 14 (19.2%) |
| Computers & Mathematics | 0 (0.0%) | 14 (100.0%) |
| Architecture & Engineering | 59 (100.0%) | 0 (0.0%) |
| Life, Physical & Social Science | 0 (0.0%) | 0 (0.0%) |
| Community & Social Service | 87 (28.0%) | 224 (72.0%) |
| Education, Arts & Media | 20 (27.0%) | 54 (73.0%) |
| Legal Services & Support | 0 (0.0%) | 10 (100.0%) |
| Education Instruction & Library | 57 (26.3%) | 160 (73.7%) |
| Arts, Media & Entertainment | 10 (100.0%) | 0 (0.0%) |
| Health Diagnosing & Treating | 8 (9.9%) | 73 (90.1%) |
| Health Technologists | 8 (20.0%) | 32 (80.0%) |
| Total (Category) | 289 (38.7%) | 458 (61.3%) |
| Total (Overall) | 1,202 (54.7%) | 996 (45.3%) |
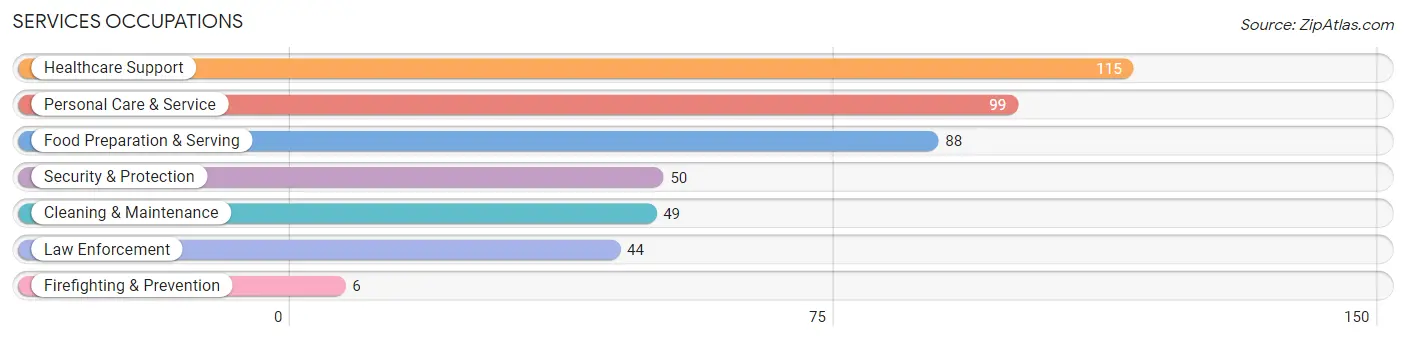
Services Occupations
The most common Services occupations in Windom are Healthcare Support (115 | 5.2%), Personal Care & Service (99 | 4.5%), Food Preparation & Serving (88 | 4.0%), Security & Protection (50 | 2.3%), and Cleaning & Maintenance (49 | 2.2%).
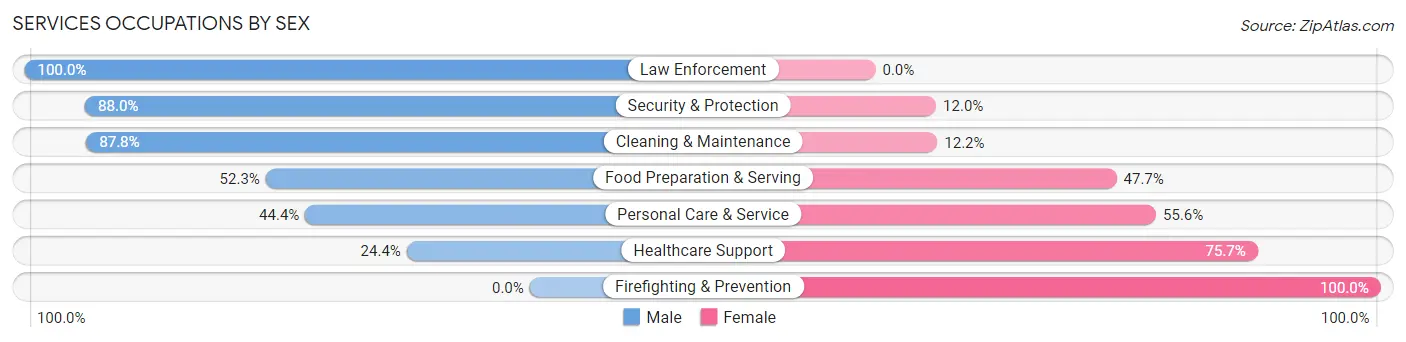
Services Occupations by Sex
Within the Services occupations in Windom, the most male-oriented occupations are Law Enforcement (100.0%), Security & Protection (88.0%), and Cleaning & Maintenance (87.8%), while the most female-oriented occupations are Firefighting & Prevention (100.0%), Healthcare Support (75.6%), and Personal Care & Service (55.6%).
| Occupation | Male | Female |
| Healthcare Support | 28 (24.3%) | 87 (75.6%) |
| Security & Protection | 44 (88.0%) | 6 (12.0%) |
| Firefighting & Prevention | 0 (0.0%) | 6 (100.0%) |
| Law Enforcement | 44 (100.0%) | 0 (0.0%) |
| Food Preparation & Serving | 46 (52.3%) | 42 (47.7%) |
| Cleaning & Maintenance | 43 (87.8%) | 6 (12.2%) |
| Personal Care & Service | 44 (44.4%) | 55 (55.6%) |
| Total (Category) | 205 (51.1%) | 196 (48.9%) |
| Total (Overall) | 1,202 (54.7%) | 996 (45.3%) |
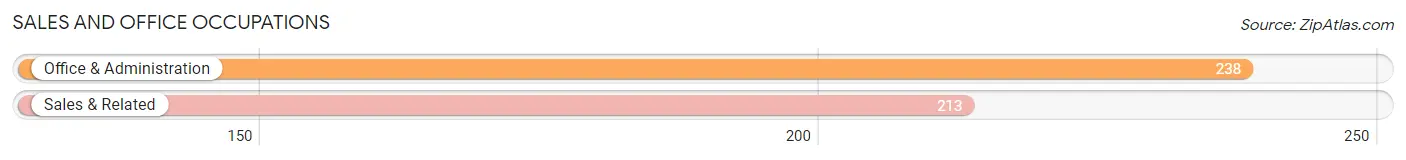
Sales and Office Occupations
The most common Sales and Office occupations in Windom are Office & Administration (238 | 10.8%), and Sales & Related (213 | 9.7%).
Sales and Office Occupations by Sex
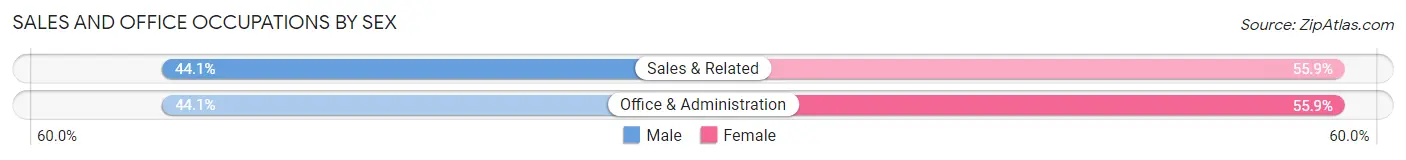
| Occupation | Male | Female |
| Sales & Related | 94 (44.1%) | 119 (55.9%) |
| Office & Administration | 105 (44.1%) | 133 (55.9%) |
| Total (Category) | 199 (44.1%) | 252 (55.9%) |
| Total (Overall) | 1,202 (54.7%) | 996 (45.3%) |
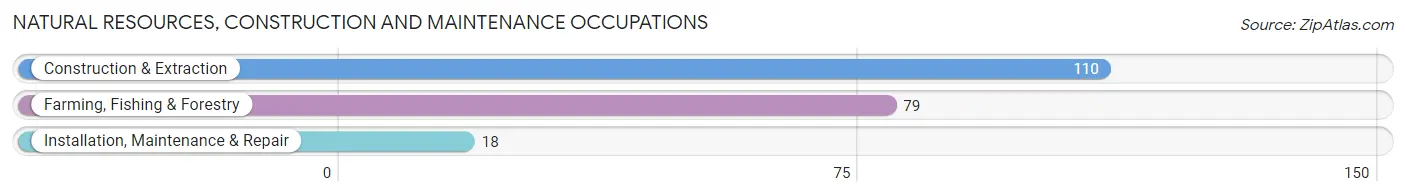
Natural Resources, Construction and Maintenance Occupations
The most common Natural Resources, Construction and Maintenance occupations in Windom are Construction & Extraction (110 | 5.0%), Farming, Fishing & Forestry (79 | 3.6%), and Installation, Maintenance & Repair (18 | 0.8%).
Natural Resources, Construction and Maintenance Occupations by Sex
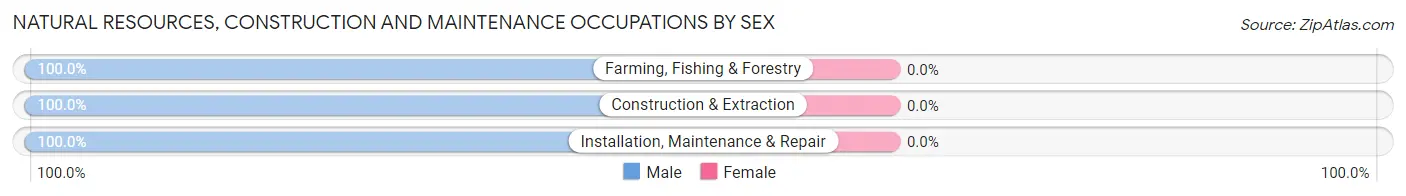
| Occupation | Male | Female |
| Farming, Fishing & Forestry | 79 (100.0%) | 0 (0.0%) |
| Construction & Extraction | 110 (100.0%) | 0 (0.0%) |
| Installation, Maintenance & Repair | 18 (100.0%) | 0 (0.0%) |
| Total (Category) | 207 (100.0%) | 0 (0.0%) |
| Total (Overall) | 1,202 (54.7%) | 996 (45.3%) |
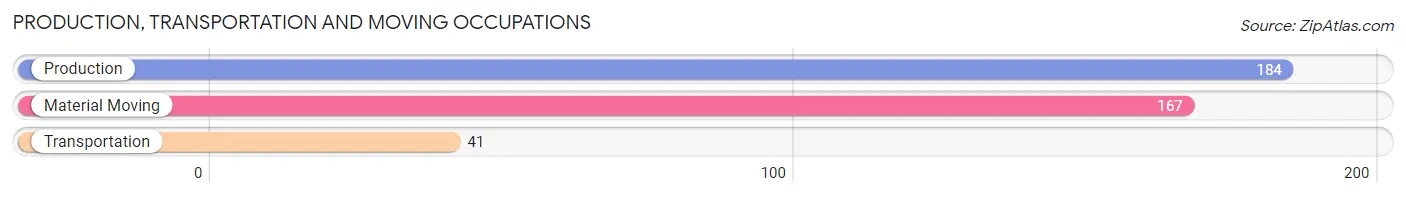
Production, Transportation and Moving Occupations
The most common Production, Transportation and Moving occupations in Windom are Production (184 | 8.4%), Material Moving (167 | 7.6%), and Transportation (41 | 1.9%).
Production, Transportation and Moving Occupations by Sex
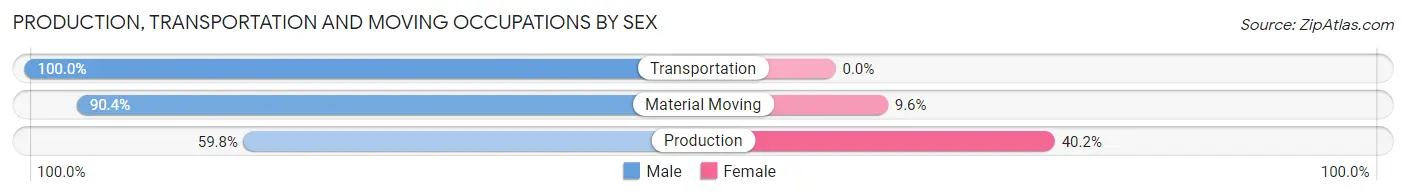
| Occupation | Male | Female |
| Production | 110 (59.8%) | 74 (40.2%) |
| Transportation | 41 (100.0%) | 0 (0.0%) |
| Material Moving | 151 (90.4%) | 16 (9.6%) |
| Total (Category) | 302 (77.0%) | 90 (23.0%) |
| Total (Overall) | 1,202 (54.7%) | 996 (45.3%) |
Employment Industries by Sex in Windom
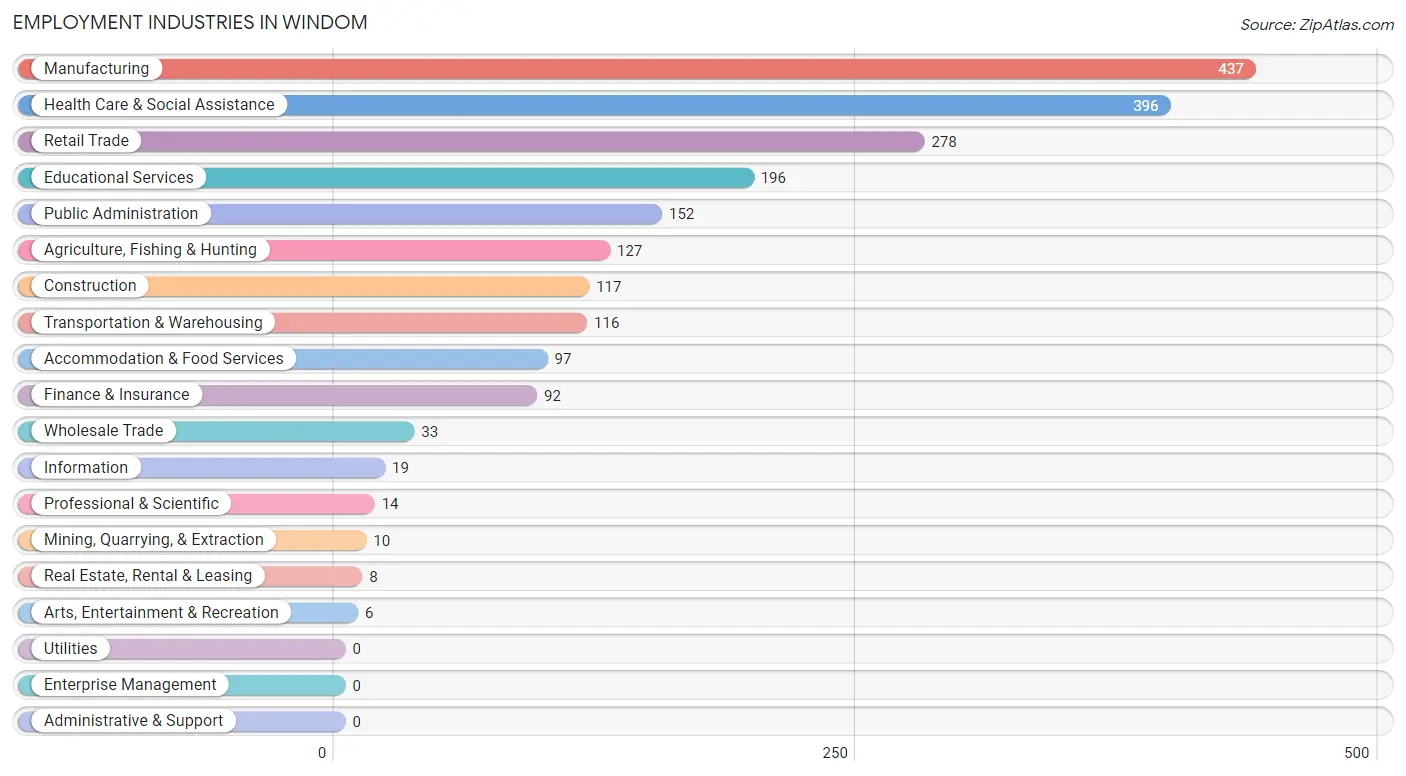
Employment Industries in Windom
The major employment industries in Windom include Manufacturing (437 | 19.9%), Health Care & Social Assistance (396 | 18.0%), Retail Trade (278 | 12.7%), Educational Services (196 | 8.9%), and Public Administration (152 | 6.9%).
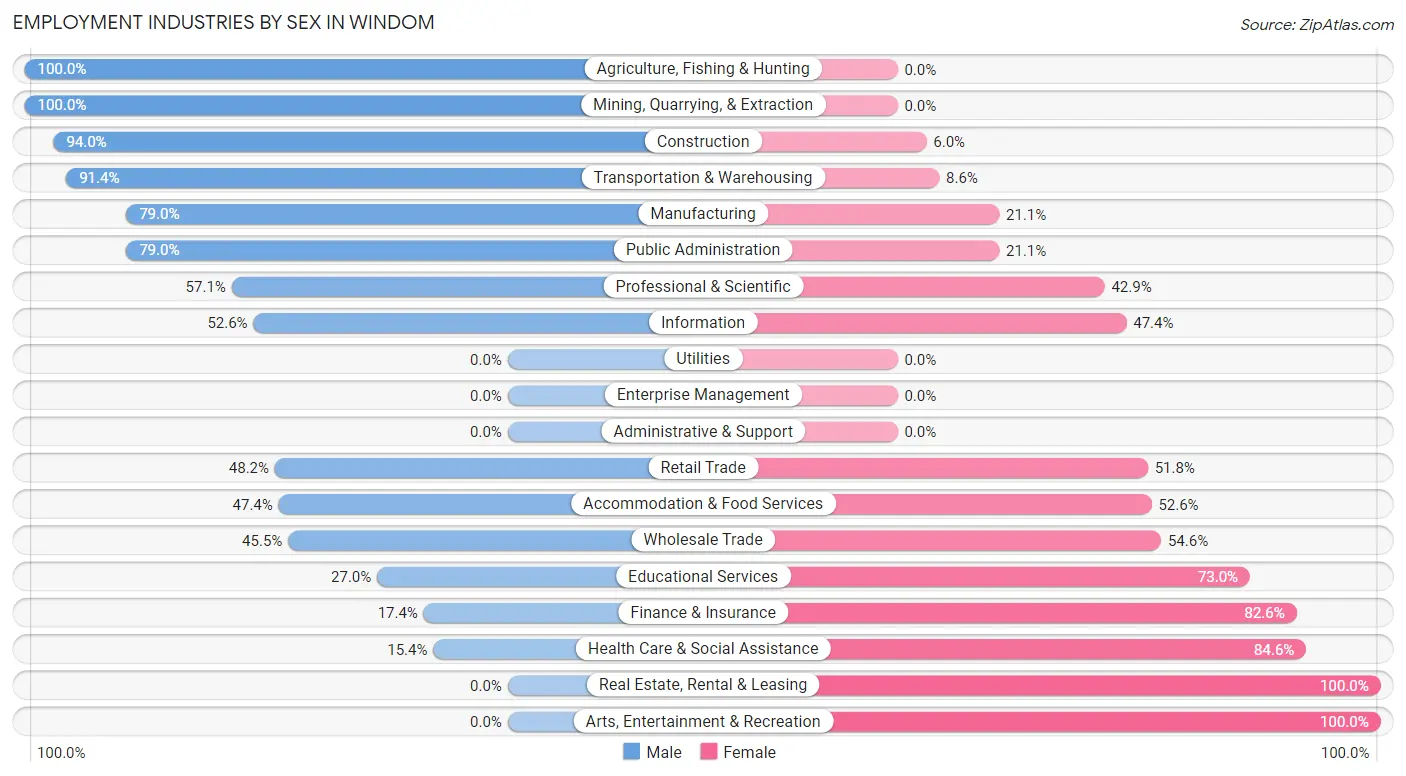
Employment Industries by Sex in Windom
The Windom industries that see more men than women are Agriculture, Fishing & Hunting (100.0%), Mining, Quarrying, & Extraction (100.0%), and Construction (94.0%), whereas the industries that tend to have a higher number of women are Real Estate, Rental & Leasing (100.0%), Arts, Entertainment & Recreation (100.0%), and Health Care & Social Assistance (84.6%).
| Industry | Male | Female |
| Agriculture, Fishing & Hunting | 127 (100.0%) | 0 (0.0%) |
| Mining, Quarrying, & Extraction | 10 (100.0%) | 0 (0.0%) |
| Construction | 110 (94.0%) | 7 (6.0%) |
| Manufacturing | 345 (78.9%) | 92 (21.0%) |
| Wholesale Trade | 15 (45.5%) | 18 (54.5%) |
| Retail Trade | 134 (48.2%) | 144 (51.8%) |
| Transportation & Warehousing | 106 (91.4%) | 10 (8.6%) |
| Utilities | 0 (0.0%) | 0 (0.0%) |
| Information | 10 (52.6%) | 9 (47.4%) |
| Finance & Insurance | 16 (17.4%) | 76 (82.6%) |
| Real Estate, Rental & Leasing | 0 (0.0%) | 8 (100.0%) |
| Professional & Scientific | 8 (57.1%) | 6 (42.9%) |
| Enterprise Management | 0 (0.0%) | 0 (0.0%) |
| Administrative & Support | 0 (0.0%) | 0 (0.0%) |
| Educational Services | 53 (27.0%) | 143 (73.0%) |
| Health Care & Social Assistance | 61 (15.4%) | 335 (84.6%) |
| Arts, Entertainment & Recreation | 0 (0.0%) | 6 (100.0%) |
| Accommodation & Food Services | 46 (47.4%) | 51 (52.6%) |
| Public Administration | 120 (78.9%) | 32 (21.0%) |
| Total | 1,202 (54.7%) | 996 (45.3%) |
Education in Windom
School Enrollment in Windom
The most common levels of schooling among the 1,022 students in Windom are middle school (263 | 25.7%), high school (260 | 25.4%), and elementary school (256 | 25.1%).
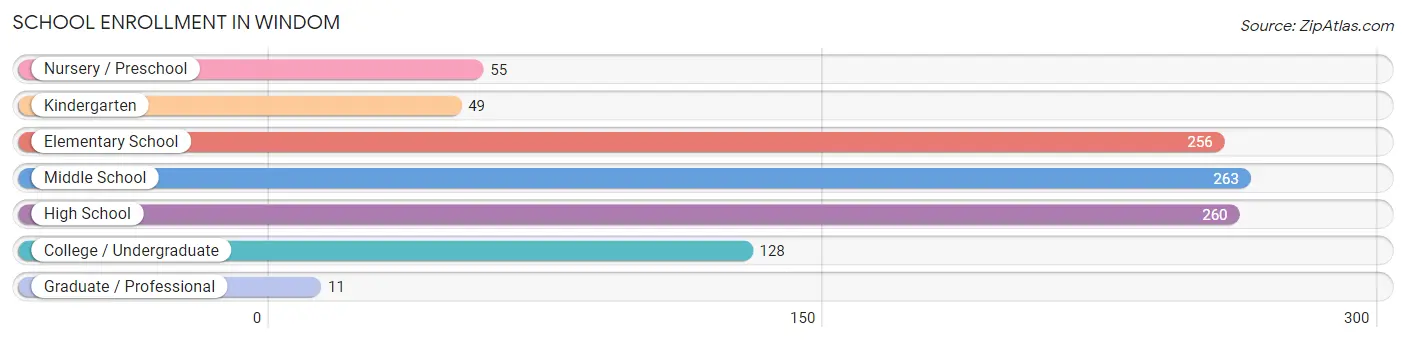
| School Level | # Students | % Students |
| Nursery / Preschool | 55 | 5.4% |
| Kindergarten | 49 | 4.8% |
| Elementary School | 256 | 25.1% |
| Middle School | 263 | 25.7% |
| High School | 260 | 25.4% |
| College / Undergraduate | 128 | 12.5% |
| Graduate / Professional | 11 | 1.1% |
| Total | 1,022 | 100.0% |
School Enrollment by Age by Funding Source in Windom
Out of a total of 1,022 students who are enrolled in schools in Windom, 57 (5.6%) attend a private institution, while the remaining 965 (94.4%) are enrolled in public schools. The age group of 18 to 19 year olds has the highest likelihood of being enrolled in private schools, with 25 (100.0% in the age bracket) enrolled. Conversely, the age group of 3 to 4 year olds has the lowest likelihood of being enrolled in a private school, with 46 (100.0% in the age bracket) attending a public institution.
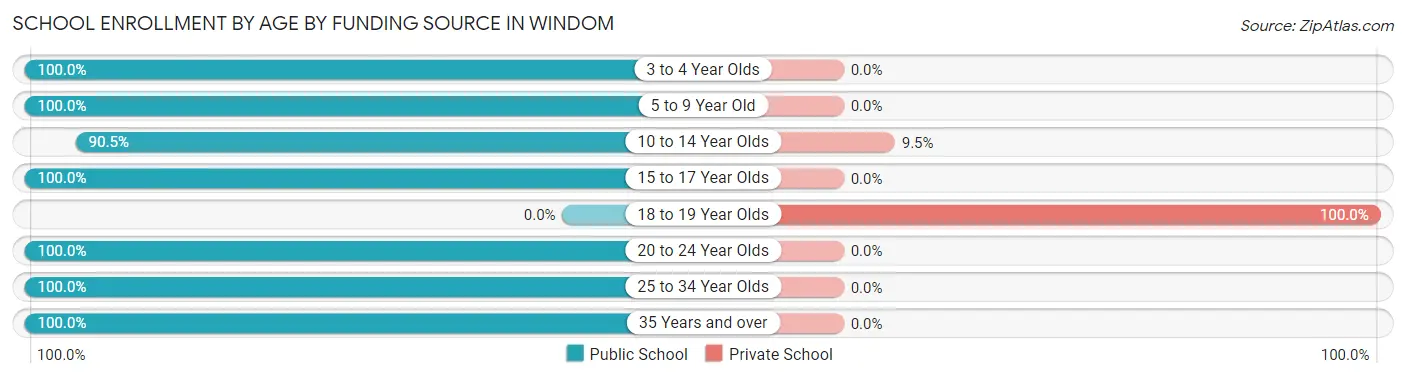
| Age Bracket | Public School | Private School |
| 3 to 4 Year Olds | 46 (100.0%) | 0 (0.0%) |
| 5 to 9 Year Old | 274 (100.0%) | 0 (0.0%) |
| 10 to 14 Year Olds | 304 (90.5%) | 32 (9.5%) |
| 15 to 17 Year Olds | 163 (100.0%) | 0 (0.0%) |
| 18 to 19 Year Olds | 0 (0.0%) | 25 (100.0%) |
| 20 to 24 Year Olds | 87 (100.0%) | 0 (0.0%) |
| 25 to 34 Year Olds | 51 (100.0%) | 0 (0.0%) |
| 35 Years and over | 40 (100.0%) | 0 (0.0%) |
| Total | 965 (94.4%) | 57 (5.6%) |
Educational Attainment by Field of Study in Windom
Education (242 | 27.0%), business (128 | 14.3%), science & technology (114 | 12.7%), bio, nature & agricultural (92 | 10.3%), and arts & humanities (80 | 8.9%) are the most common fields of study among 896 individuals in Windom who have obtained a bachelor's degree or higher.
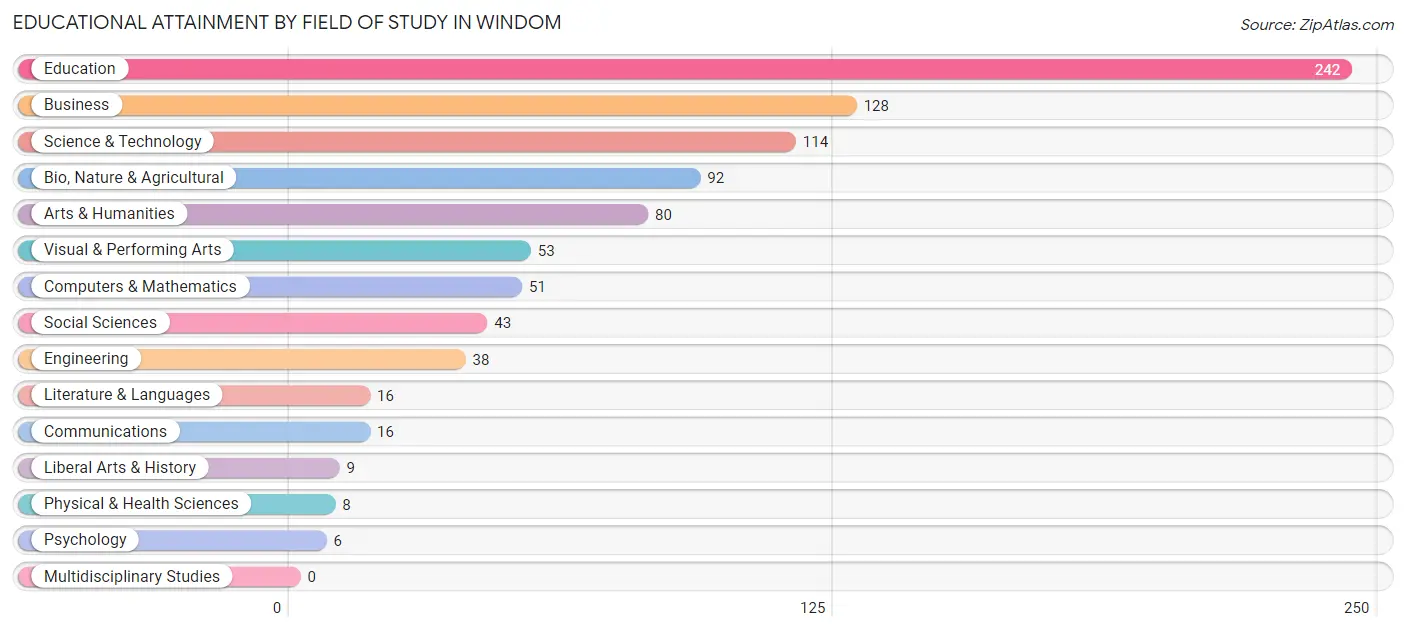
| Field of Study | # Graduates | % Graduates |
| Computers & Mathematics | 51 | 5.7% |
| Bio, Nature & Agricultural | 92 | 10.3% |
| Physical & Health Sciences | 8 | 0.9% |
| Psychology | 6 | 0.7% |
| Social Sciences | 43 | 4.8% |
| Engineering | 38 | 4.2% |
| Multidisciplinary Studies | 0 | 0.0% |
| Science & Technology | 114 | 12.7% |
| Business | 128 | 14.3% |
| Education | 242 | 27.0% |
| Literature & Languages | 16 | 1.8% |
| Liberal Arts & History | 9 | 1.0% |
| Visual & Performing Arts | 53 | 5.9% |
| Communications | 16 | 1.8% |
| Arts & Humanities | 80 | 8.9% |
| Total | 896 | 100.0% |
Transportation & Commute in Windom
Vehicle Availability by Sex in Windom
The most prevalent vehicle ownership categories in Windom are males with 2 vehicles (572, accounting for 49.9%) and females with 2 vehicles (559, making up 60.3%).
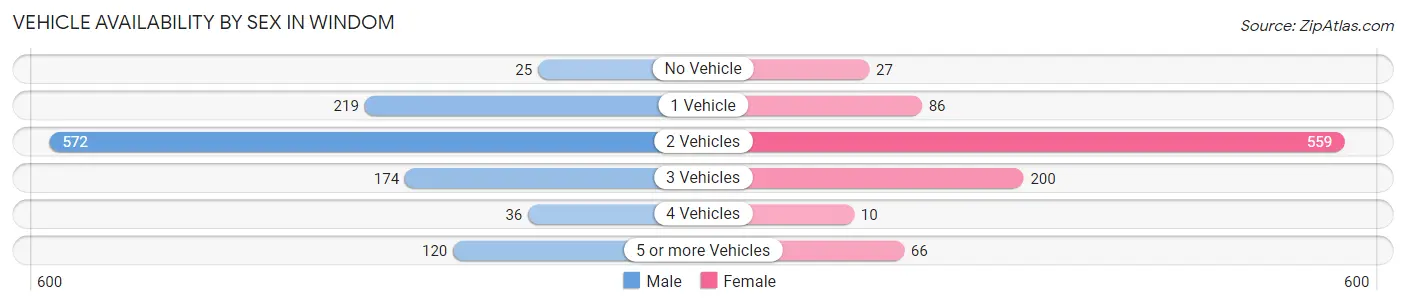
| Vehicles Available | Male | Female |
| No Vehicle | 25 (2.2%) | 27 (2.9%) |
| 1 Vehicle | 219 (19.1%) | 86 (9.1%) |
| 2 Vehicles | 572 (49.9%) | 559 (59.0%) |
| 3 Vehicles | 174 (15.2%) | 200 (21.1%) |
| 4 Vehicles | 36 (3.1%) | 10 (1.1%) |
| 5 or more Vehicles | 120 (10.5%) | 66 (7.0%) |
| Total | 1,146 (100.0%) | 948 (100.0%) |
Commute Time in Windom
The most frequently occuring commute durations in Windom are 5 to 9 minutes (724 commuters, 35.8%), 10 to 14 minutes (450 commuters, 22.3%), and less than 5 minutes (318 commuters, 15.7%).
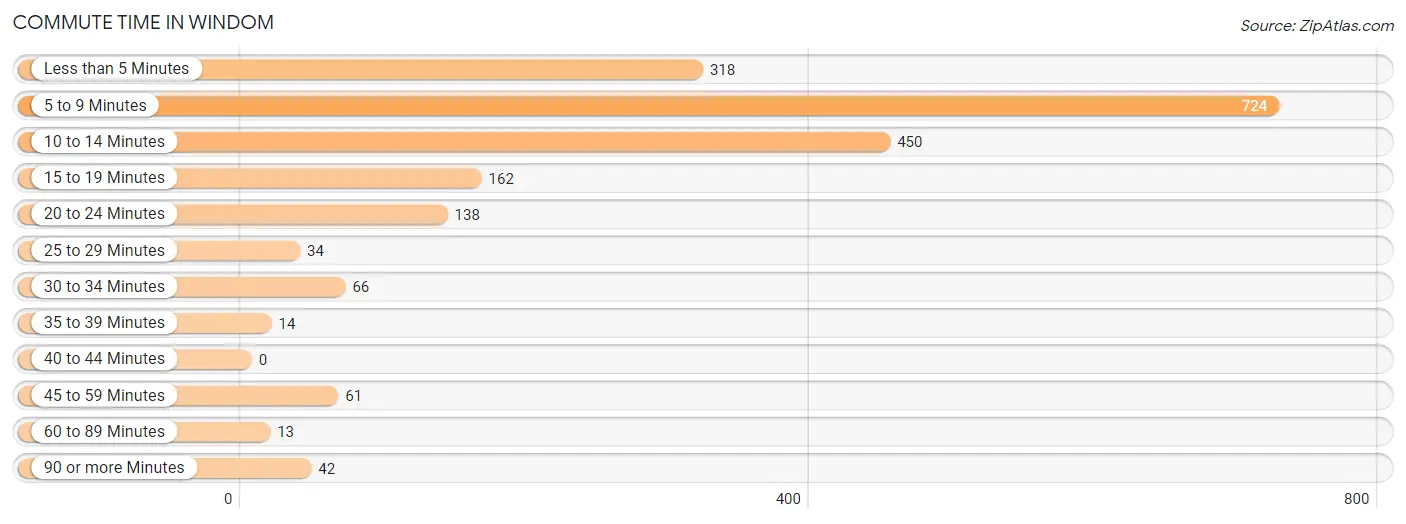
| Commute Time | # Commuters | % Commuters |
| Less than 5 Minutes | 318 | 15.7% |
| 5 to 9 Minutes | 724 | 35.8% |
| 10 to 14 Minutes | 450 | 22.3% |
| 15 to 19 Minutes | 162 | 8.0% |
| 20 to 24 Minutes | 138 | 6.8% |
| 25 to 29 Minutes | 34 | 1.7% |
| 30 to 34 Minutes | 66 | 3.3% |
| 35 to 39 Minutes | 14 | 0.7% |
| 40 to 44 Minutes | 0 | 0.0% |
| 45 to 59 Minutes | 61 | 3.0% |
| 60 to 89 Minutes | 13 | 0.6% |
| 90 or more Minutes | 42 | 2.1% |
Commute Time by Sex in Windom
The most common commute times in Windom are 5 to 9 minutes (383 commuters, 34.1%) for males and 5 to 9 minutes (341 commuters, 37.9%) for females.
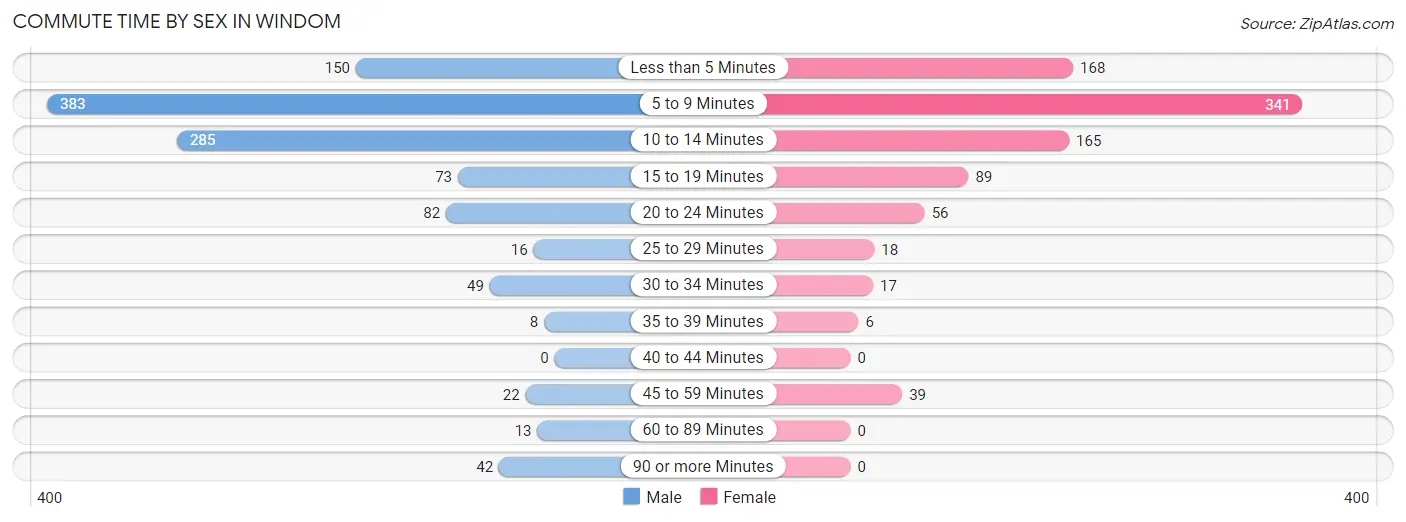
| Commute Time | Male | Female |
| Less than 5 Minutes | 150 (13.4%) | 168 (18.7%) |
| 5 to 9 Minutes | 383 (34.1%) | 341 (37.9%) |
| 10 to 14 Minutes | 285 (25.4%) | 165 (18.3%) |
| 15 to 19 Minutes | 73 (6.5%) | 89 (9.9%) |
| 20 to 24 Minutes | 82 (7.3%) | 56 (6.2%) |
| 25 to 29 Minutes | 16 (1.4%) | 18 (2.0%) |
| 30 to 34 Minutes | 49 (4.4%) | 17 (1.9%) |
| 35 to 39 Minutes | 8 (0.7%) | 6 (0.7%) |
| 40 to 44 Minutes | 0 (0.0%) | 0 (0.0%) |
| 45 to 59 Minutes | 22 (2.0%) | 39 (4.3%) |
| 60 to 89 Minutes | 13 (1.2%) | 0 (0.0%) |
| 90 or more Minutes | 42 (3.7%) | 0 (0.0%) |
Time of Departure to Work by Sex in Windom
The most frequent times of departure to work in Windom are 7:30 AM to 7:59 AM (195, 17.4%) for males and 7:30 AM to 7:59 AM (271, 30.1%) for females.
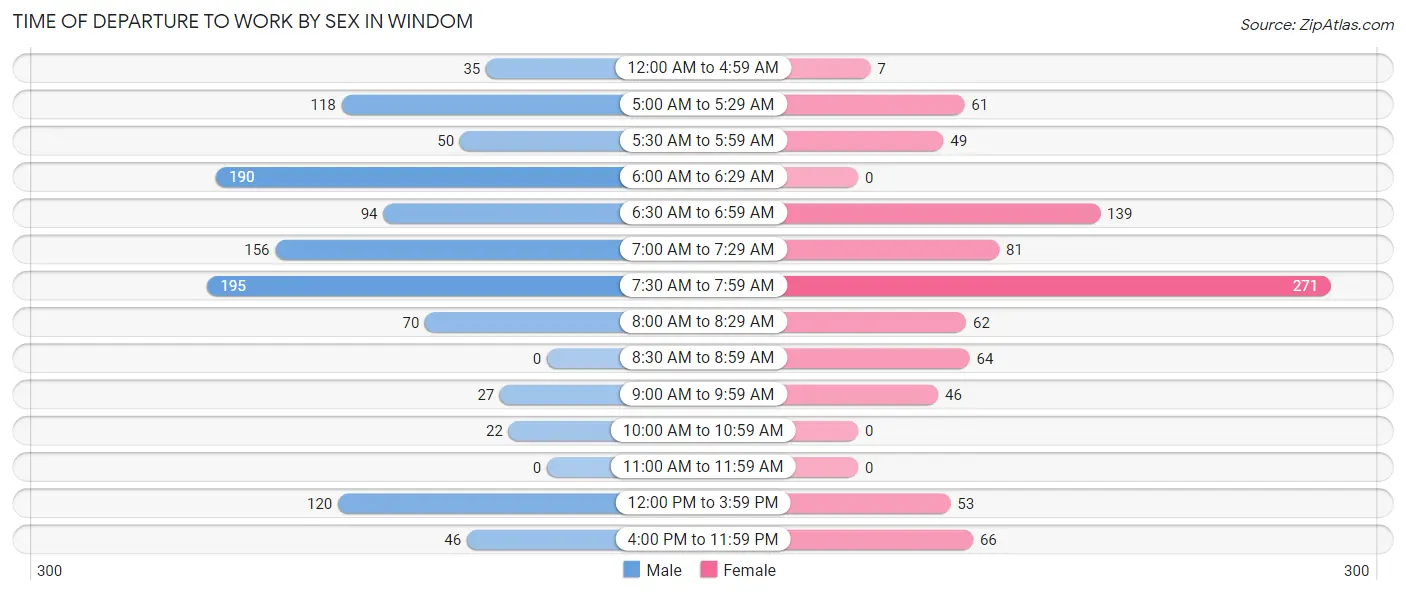
| Time of Departure | Male | Female |
| 12:00 AM to 4:59 AM | 35 (3.1%) | 7 (0.8%) |
| 5:00 AM to 5:29 AM | 118 (10.5%) | 61 (6.8%) |
| 5:30 AM to 5:59 AM | 50 (4.4%) | 49 (5.4%) |
| 6:00 AM to 6:29 AM | 190 (16.9%) | 0 (0.0%) |
| 6:30 AM to 6:59 AM | 94 (8.4%) | 139 (15.5%) |
| 7:00 AM to 7:29 AM | 156 (13.9%) | 81 (9.0%) |
| 7:30 AM to 7:59 AM | 195 (17.4%) | 271 (30.1%) |
| 8:00 AM to 8:29 AM | 70 (6.2%) | 62 (6.9%) |
| 8:30 AM to 8:59 AM | 0 (0.0%) | 64 (7.1%) |
| 9:00 AM to 9:59 AM | 27 (2.4%) | 46 (5.1%) |
| 10:00 AM to 10:59 AM | 22 (2.0%) | 0 (0.0%) |
| 11:00 AM to 11:59 AM | 0 (0.0%) | 0 (0.0%) |
| 12:00 PM to 3:59 PM | 120 (10.7%) | 53 (5.9%) |
| 4:00 PM to 11:59 PM | 46 (4.1%) | 66 (7.3%) |
| Total | 1,123 (100.0%) | 899 (100.0%) |
Housing Occupancy in Windom
Occupancy by Ownership in Windom
Of the total 1,955 dwellings in Windom, owner-occupied units account for 1,397 (71.5%), while renter-occupied units make up 558 (28.5%).
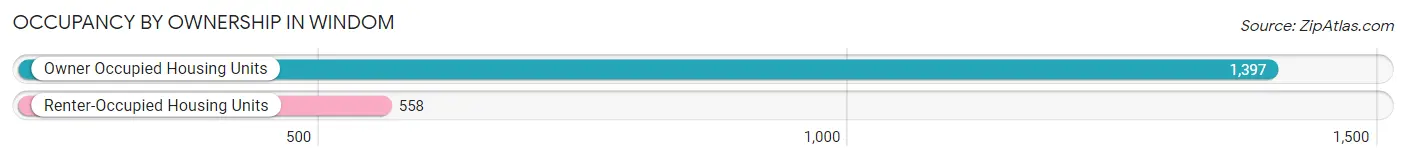
| Occupancy | # Housing Units | % Housing Units |
| Owner Occupied Housing Units | 1,397 | 71.5% |
| Renter-Occupied Housing Units | 558 | 28.5% |
| Total Occupied Housing Units | 1,955 | 100.0% |
Occupancy by Household Size in Windom
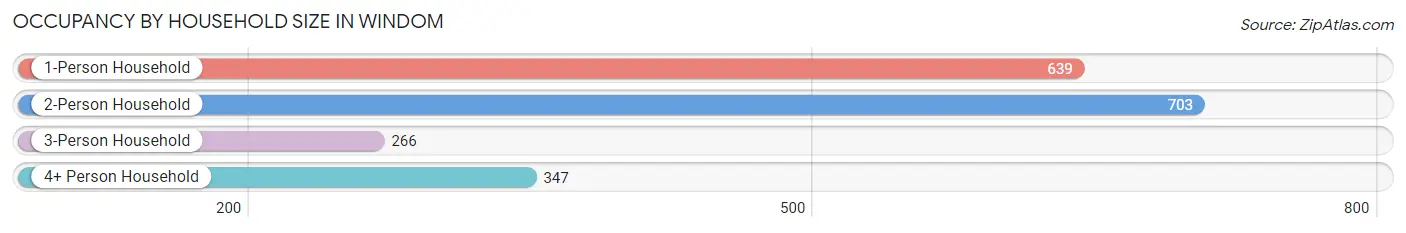
| Household Size | # Housing Units | % Housing Units |
| 1-Person Household | 639 | 32.7% |
| 2-Person Household | 703 | 36.0% |
| 3-Person Household | 266 | 13.6% |
| 4+ Person Household | 347 | 17.7% |
| Total Housing Units | 1,955 | 100.0% |
Occupancy by Ownership by Household Size in Windom
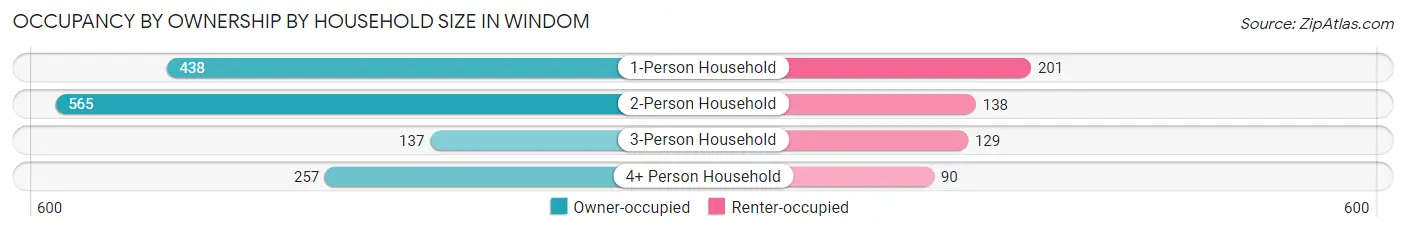
| Household Size | Owner-occupied | Renter-occupied |
| 1-Person Household | 438 (68.5%) | 201 (31.5%) |
| 2-Person Household | 565 (80.4%) | 138 (19.6%) |
| 3-Person Household | 137 (51.5%) | 129 (48.5%) |
| 4+ Person Household | 257 (74.1%) | 90 (25.9%) |
| Total Housing Units | 1,397 (71.5%) | 558 (28.5%) |
Occupancy by Educational Attainment in Windom
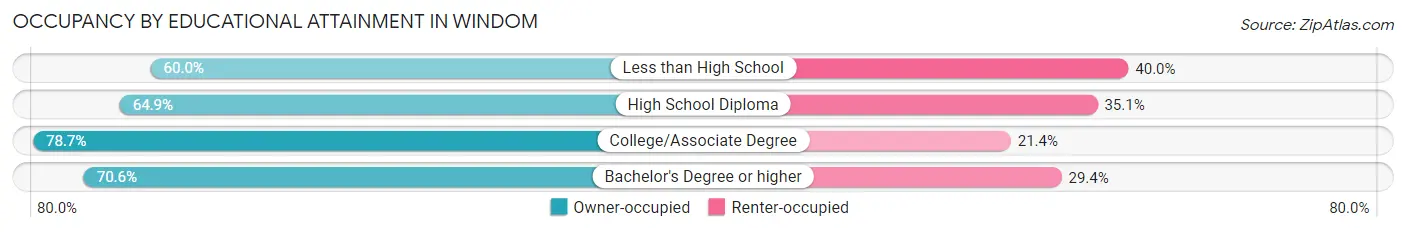
| Household Size | Owner-occupied | Renter-occupied |
| Less than High School | 69 (60.0%) | 46 (40.0%) |
| High School Diploma | 379 (64.9%) | 205 (35.1%) |
| College/Associate Degree | 608 (78.6%) | 165 (21.3%) |
| Bachelor's Degree or higher | 341 (70.6%) | 142 (29.4%) |
Occupancy by Age of Householder in Windom
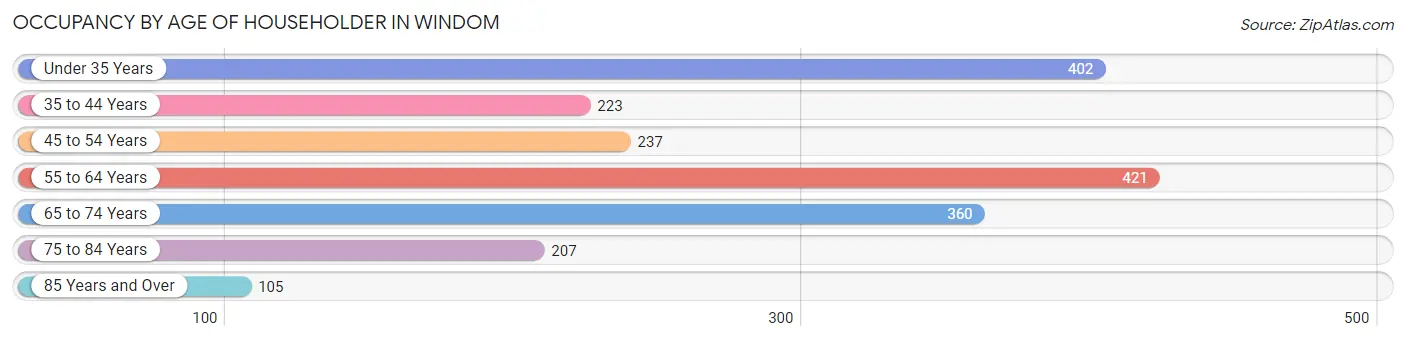
| Age Bracket | # Households | % Households |
| Under 35 Years | 402 | 20.6% |
| 35 to 44 Years | 223 | 11.4% |
| 45 to 54 Years | 237 | 12.1% |
| 55 to 64 Years | 421 | 21.5% |
| 65 to 74 Years | 360 | 18.4% |
| 75 to 84 Years | 207 | 10.6% |
| 85 Years and Over | 105 | 5.4% |
| Total | 1,955 | 100.0% |
Housing Finances in Windom
Median Income by Occupancy in Windom
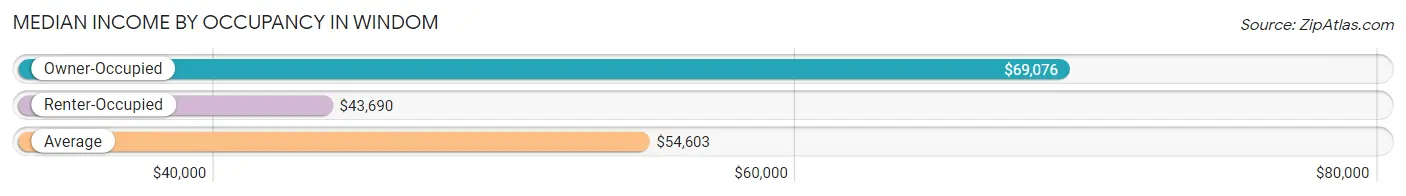
| Occupancy Type | # Households | Median Income |
| Owner-Occupied | 1,397 (71.5%) | $69,076 |
| Renter-Occupied | 558 (28.5%) | $43,690 |
| Average | 1,955 (100.0%) | $54,603 |
Occupancy by Householder Income Bracket in Windom
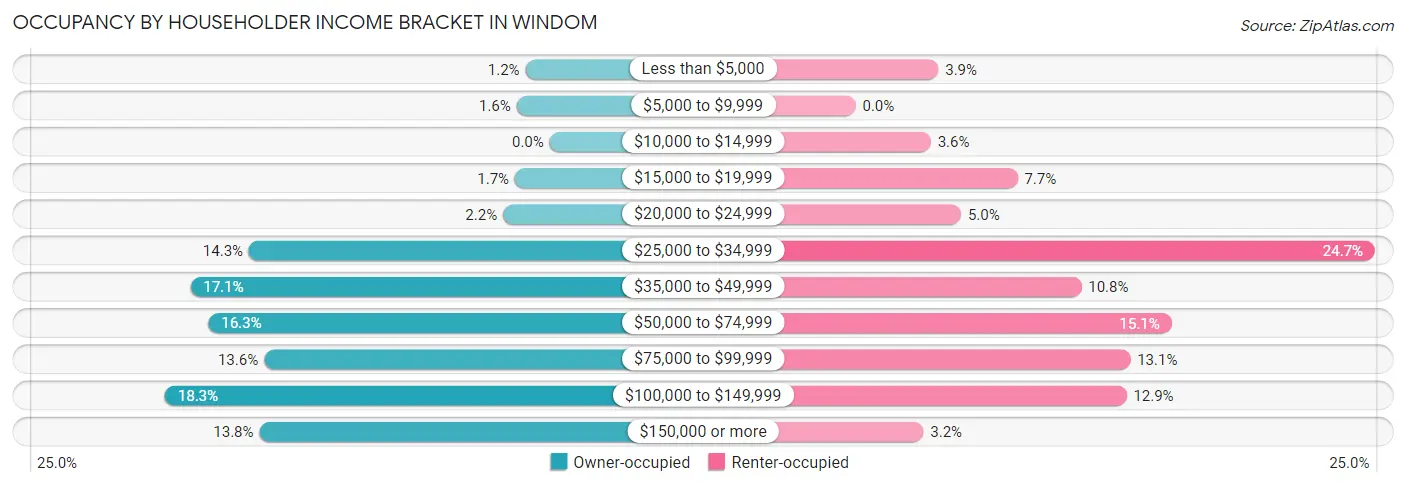
| Income Bracket | Owner-occupied | Renter-occupied |
| Less than $5,000 | 16 (1.1%) | 22 (3.9%) |
| $5,000 to $9,999 | 22 (1.6%) | 0 (0.0%) |
| $10,000 to $14,999 | 0 (0.0%) | 20 (3.6%) |
| $15,000 to $19,999 | 23 (1.7%) | 43 (7.7%) |
| $20,000 to $24,999 | 31 (2.2%) | 28 (5.0%) |
| $25,000 to $34,999 | 200 (14.3%) | 138 (24.7%) |
| $35,000 to $49,999 | 239 (17.1%) | 60 (10.7%) |
| $50,000 to $74,999 | 227 (16.3%) | 84 (15.0%) |
| $75,000 to $99,999 | 190 (13.6%) | 73 (13.1%) |
| $100,000 to $149,999 | 256 (18.3%) | 72 (12.9%) |
| $150,000 or more | 193 (13.8%) | 18 (3.2%) |
| Total | 1,397 (100.0%) | 558 (100.0%) |
Monthly Housing Cost Tiers in Windom
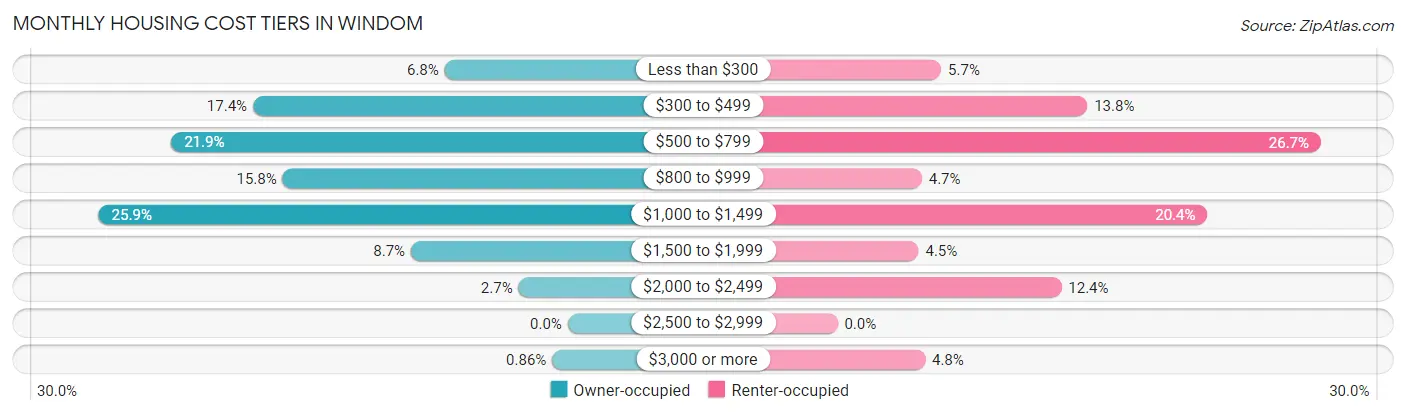
| Monthly Cost | Owner-occupied | Renter-occupied |
| Less than $300 | 95 (6.8%) | 32 (5.7%) |
| $300 to $499 | 243 (17.4%) | 77 (13.8%) |
| $500 to $799 | 306 (21.9%) | 149 (26.7%) |
| $800 to $999 | 220 (15.8%) | 26 (4.7%) |
| $1,000 to $1,499 | 362 (25.9%) | 114 (20.4%) |
| $1,500 to $1,999 | 121 (8.7%) | 25 (4.5%) |
| $2,000 to $2,499 | 38 (2.7%) | 69 (12.4%) |
| $2,500 to $2,999 | 0 (0.0%) | 0 (0.0%) |
| $3,000 or more | 12 (0.9%) | 27 (4.8%) |
| Total | 1,397 (100.0%) | 558 (100.0%) |
Physical Housing Characteristics in Windom
Housing Structures in Windom
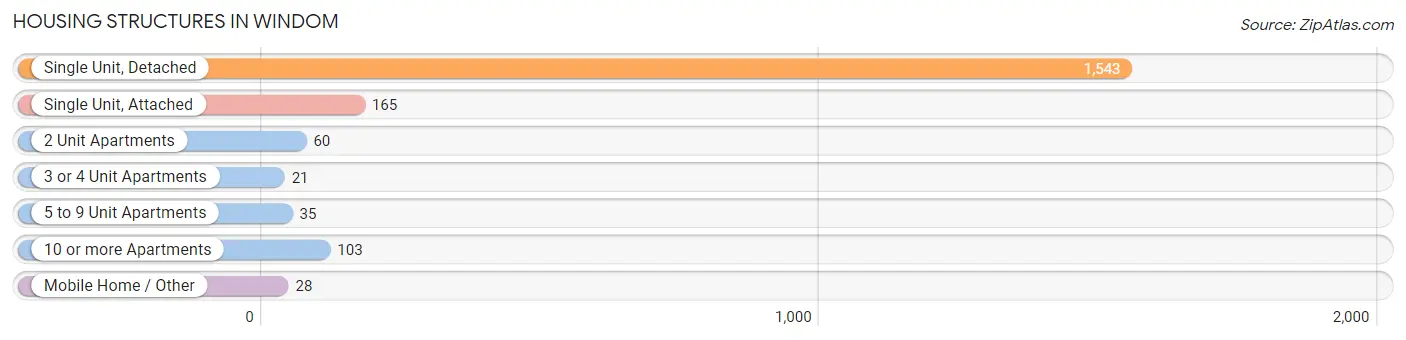
| Structure Type | # Housing Units | % Housing Units |
| Single Unit, Detached | 1,543 | 78.9% |
| Single Unit, Attached | 165 | 8.4% |
| 2 Unit Apartments | 60 | 3.1% |
| 3 or 4 Unit Apartments | 21 | 1.1% |
| 5 to 9 Unit Apartments | 35 | 1.8% |
| 10 or more Apartments | 103 | 5.3% |
| Mobile Home / Other | 28 | 1.4% |
| Total | 1,955 | 100.0% |
Housing Structures by Occupancy in Windom
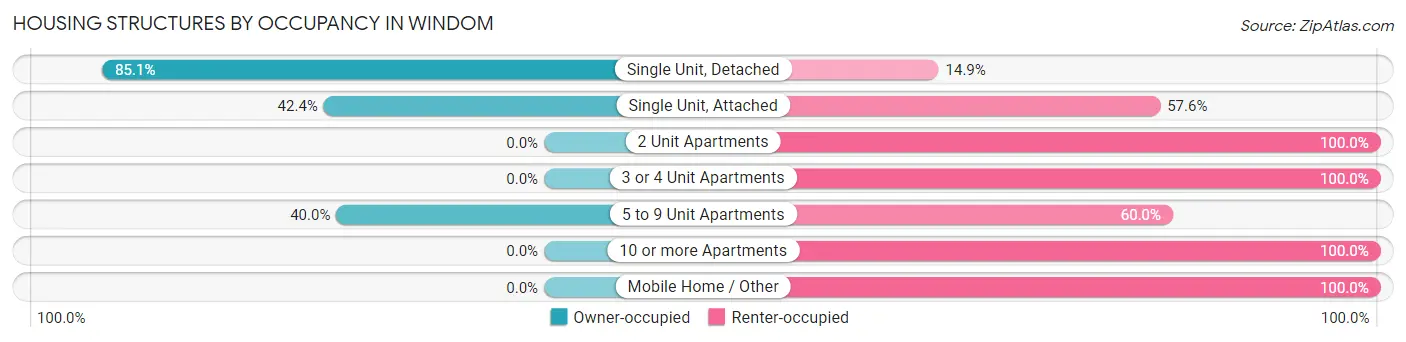
| Structure Type | Owner-occupied | Renter-occupied |
| Single Unit, Detached | 1,313 (85.1%) | 230 (14.9%) |
| Single Unit, Attached | 70 (42.4%) | 95 (57.6%) |
| 2 Unit Apartments | 0 (0.0%) | 60 (100.0%) |
| 3 or 4 Unit Apartments | 0 (0.0%) | 21 (100.0%) |
| 5 to 9 Unit Apartments | 14 (40.0%) | 21 (60.0%) |
| 10 or more Apartments | 0 (0.0%) | 103 (100.0%) |
| Mobile Home / Other | 0 (0.0%) | 28 (100.0%) |
| Total | 1,397 (71.5%) | 558 (28.5%) |
Housing Structures by Number of Rooms in Windom
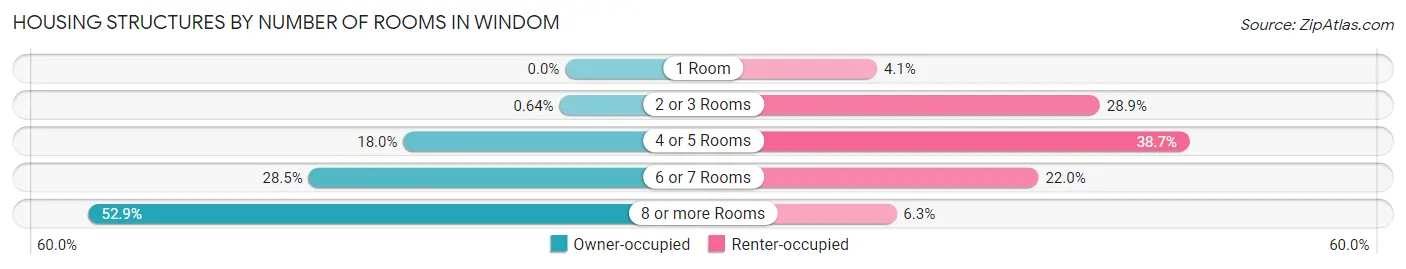
| Number of Rooms | Owner-occupied | Renter-occupied |
| 1 Room | 0 (0.0%) | 23 (4.1%) |
| 2 or 3 Rooms | 9 (0.6%) | 161 (28.8%) |
| 4 or 5 Rooms | 251 (18.0%) | 216 (38.7%) |
| 6 or 7 Rooms | 398 (28.5%) | 123 (22.0%) |
| 8 or more Rooms | 739 (52.9%) | 35 (6.3%) |
| Total | 1,397 (100.0%) | 558 (100.0%) |
Housing Structure by Heating Type in Windom
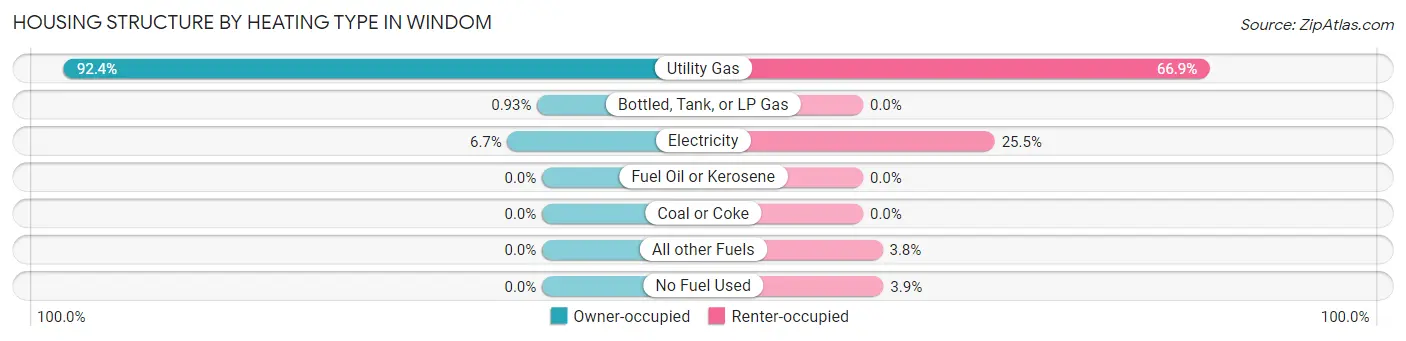
| Heating Type | Owner-occupied | Renter-occupied |
| Utility Gas | 1,291 (92.4%) | 373 (66.8%) |
| Bottled, Tank, or LP Gas | 13 (0.9%) | 0 (0.0%) |
| Electricity | 93 (6.7%) | 142 (25.5%) |
| Fuel Oil or Kerosene | 0 (0.0%) | 0 (0.0%) |
| Coal or Coke | 0 (0.0%) | 0 (0.0%) |
| All other Fuels | 0 (0.0%) | 21 (3.8%) |
| No Fuel Used | 0 (0.0%) | 22 (3.9%) |
| Total | 1,397 (100.0%) | 558 (100.0%) |
Household Vehicle Usage in Windom
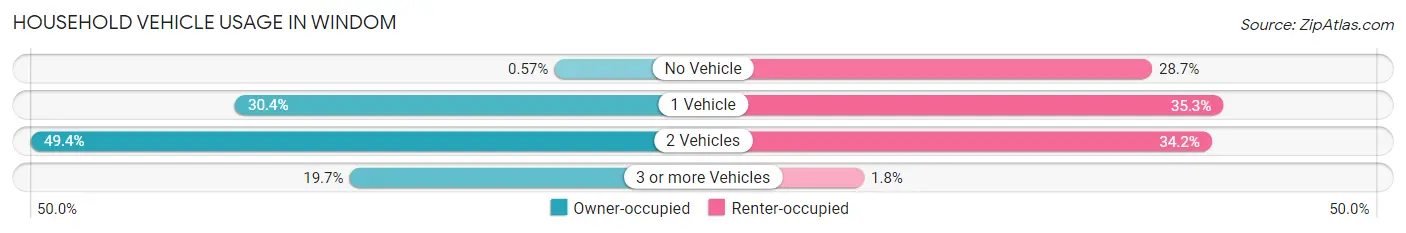
| Vehicles per Household | Owner-occupied | Renter-occupied |
| No Vehicle | 8 (0.6%) | 160 (28.7%) |
| 1 Vehicle | 424 (30.3%) | 197 (35.3%) |
| 2 Vehicles | 690 (49.4%) | 191 (34.2%) |
| 3 or more Vehicles | 275 (19.7%) | 10 (1.8%) |
| Total | 1,397 (100.0%) | 558 (100.0%) |
Real Estate & Mortgages in Windom
Real Estate and Mortgage Overview in Windom
| Characteristic | Without Mortgage | With Mortgage |
| Housing Units | 621 | 776 |
| Median Property Value | $135,500 | $150,800 |
| Median Household Income | $50,481 | $127 |
| Monthly Housing Costs | $487 | $12 |
| Real Estate Taxes | $1,949 | $22 |
Property Value by Mortgage Status in Windom
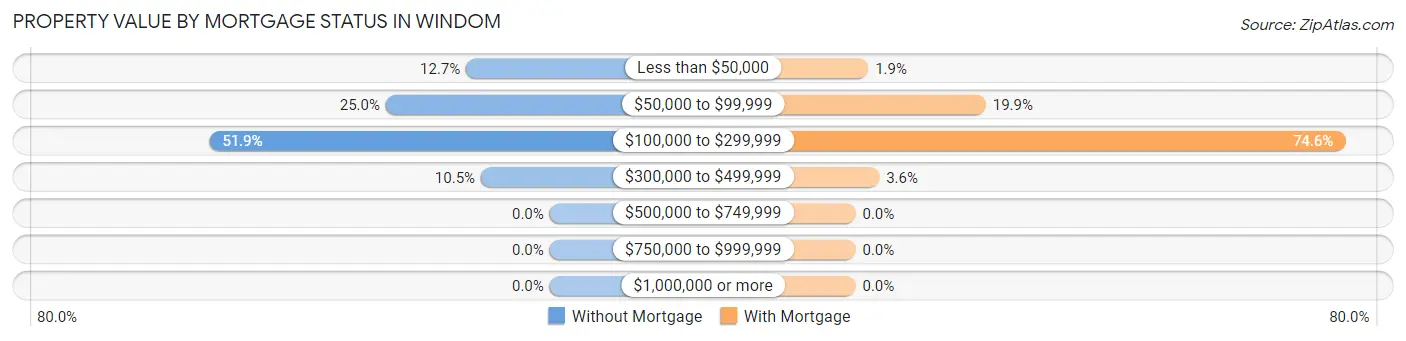
| Property Value | Without Mortgage | With Mortgage |
| Less than $50,000 | 79 (12.7%) | 15 (1.9%) |
| $50,000 to $99,999 | 155 (25.0%) | 154 (19.9%) |
| $100,000 to $299,999 | 322 (51.8%) | 579 (74.6%) |
| $300,000 to $499,999 | 65 (10.5%) | 28 (3.6%) |
| $500,000 to $749,999 | 0 (0.0%) | 0 (0.0%) |
| $750,000 to $999,999 | 0 (0.0%) | 0 (0.0%) |
| $1,000,000 or more | 0 (0.0%) | 0 (0.0%) |
| Total | 621 (100.0%) | 776 (100.0%) |
Household Income by Mortgage Status in Windom
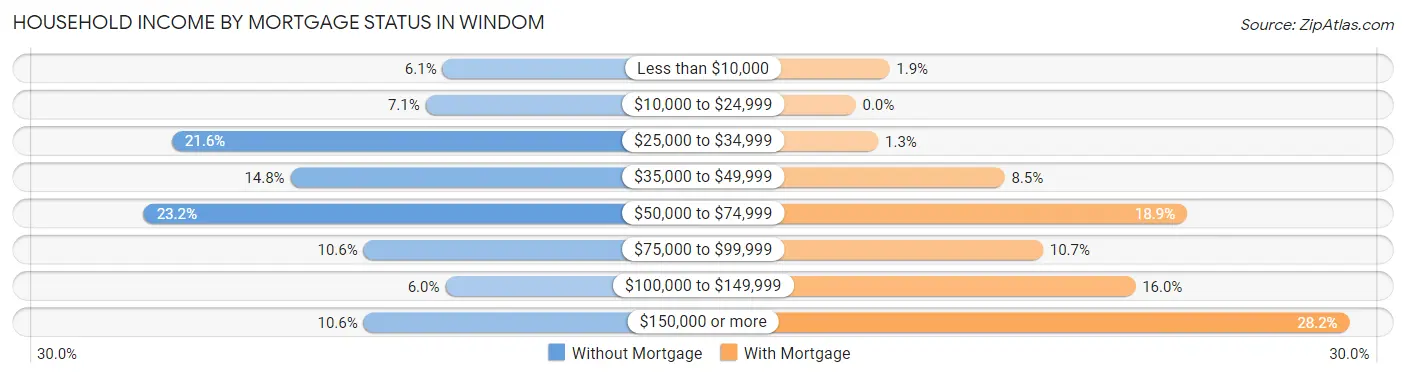
| Household Income | Without Mortgage | With Mortgage |
| Less than $10,000 | 38 (6.1%) | 15 (1.9%) |
| $10,000 to $24,999 | 44 (7.1%) | 0 (0.0%) |
| $25,000 to $34,999 | 134 (21.6%) | 10 (1.3%) |
| $35,000 to $49,999 | 92 (14.8%) | 66 (8.5%) |
| $50,000 to $74,999 | 144 (23.2%) | 147 (18.9%) |
| $75,000 to $99,999 | 66 (10.6%) | 83 (10.7%) |
| $100,000 to $149,999 | 37 (6.0%) | 124 (16.0%) |
| $150,000 or more | 66 (10.6%) | 219 (28.2%) |
| Total | 621 (100.0%) | 776 (100.0%) |
Property Value to Household Income Ratio in Windom
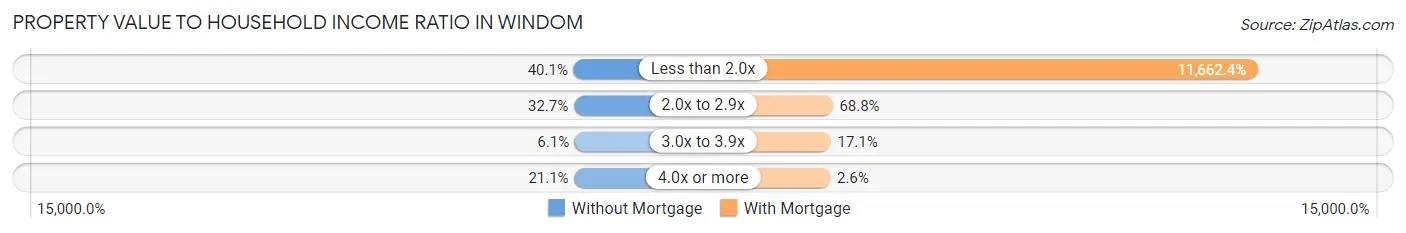
| Value-to-Income Ratio | Without Mortgage | With Mortgage |
| Less than 2.0x | 249 (40.1%) | 90,500 (11,662.4%) |
| 2.0x to 2.9x | 203 (32.7%) | 534 (68.8%) |
| 3.0x to 3.9x | 38 (6.1%) | 133 (17.1%) |
| 4.0x or more | 131 (21.1%) | 20 (2.6%) |
| Total | 621 (100.0%) | 776 (100.0%) |
Real Estate Taxes by Mortgage Status in Windom
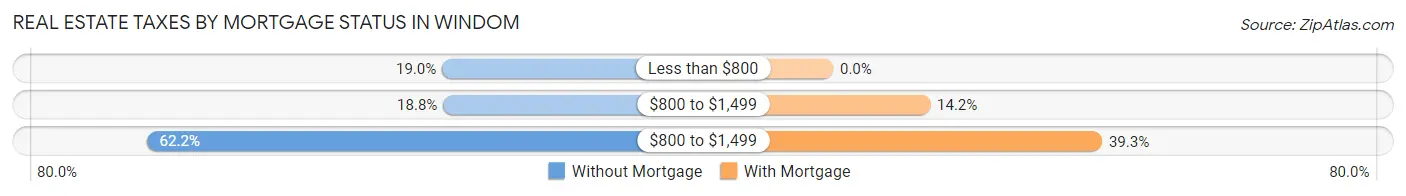
| Property Taxes | Without Mortgage | With Mortgage |
| Less than $800 | 118 (19.0%) | 0 (0.0%) |
| $800 to $1,499 | 117 (18.8%) | 110 (14.2%) |
| $800 to $1,499 | 386 (62.2%) | 305 (39.3%) |
| Total | 621 (100.0%) | 776 (100.0%) |
Health & Disability in Windom
Health Insurance Coverage by Age in Windom
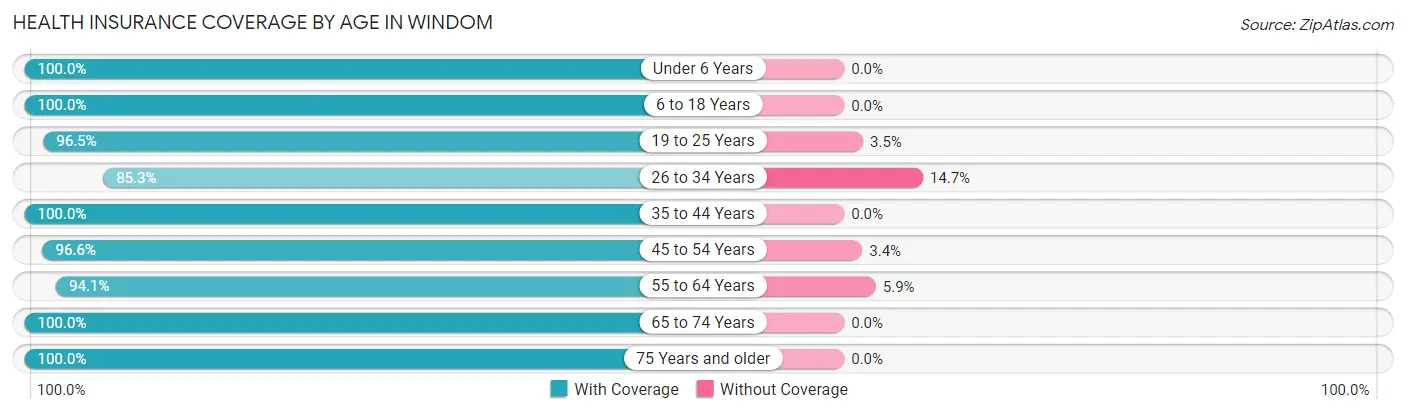
| Age Bracket | With Coverage | Without Coverage |
| Under 6 Years | 326 (100.0%) | 0 (0.0%) |
| 6 to 18 Years | 764 (100.0%) | 0 (0.0%) |
| 19 to 25 Years | 330 (96.5%) | 12 (3.5%) |
| 26 to 34 Years | 495 (85.3%) | 85 (14.7%) |
| 35 to 44 Years | 487 (100.0%) | 0 (0.0%) |
| 45 to 54 Years | 373 (96.6%) | 13 (3.4%) |
| 55 to 64 Years | 608 (94.1%) | 38 (5.9%) |
| 65 to 74 Years | 548 (100.0%) | 0 (0.0%) |
| 75 Years and older | 557 (100.0%) | 0 (0.0%) |
| Total | 4,488 (96.8%) | 148 (3.2%) |
Health Insurance Coverage by Citizenship Status in Windom
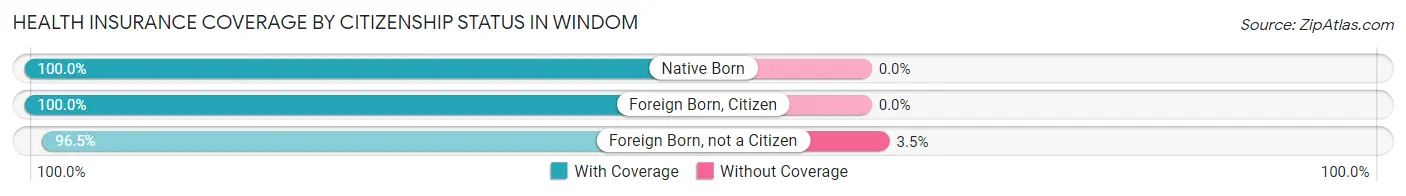
| Citizenship Status | With Coverage | Without Coverage |
| Native Born | 326 (100.0%) | 0 (0.0%) |
| Foreign Born, Citizen | 764 (100.0%) | 0 (0.0%) |
| Foreign Born, not a Citizen | 330 (96.5%) | 12 (3.5%) |
Health Insurance Coverage by Household Income in Windom
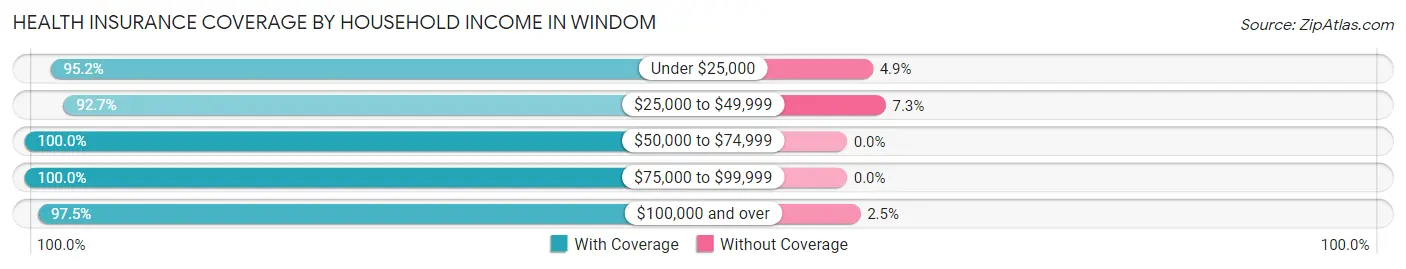
| Household Income | With Coverage | Without Coverage |
| Under $25,000 | 255 (95.2%) | 13 (4.9%) |
| $25,000 to $49,999 | 1,200 (92.7%) | 94 (7.3%) |
| $50,000 to $74,999 | 670 (100.0%) | 0 (0.0%) |
| $75,000 to $99,999 | 664 (100.0%) | 0 (0.0%) |
| $100,000 and over | 1,591 (97.5%) | 41 (2.5%) |
Public vs Private Health Insurance Coverage by Age in Windom
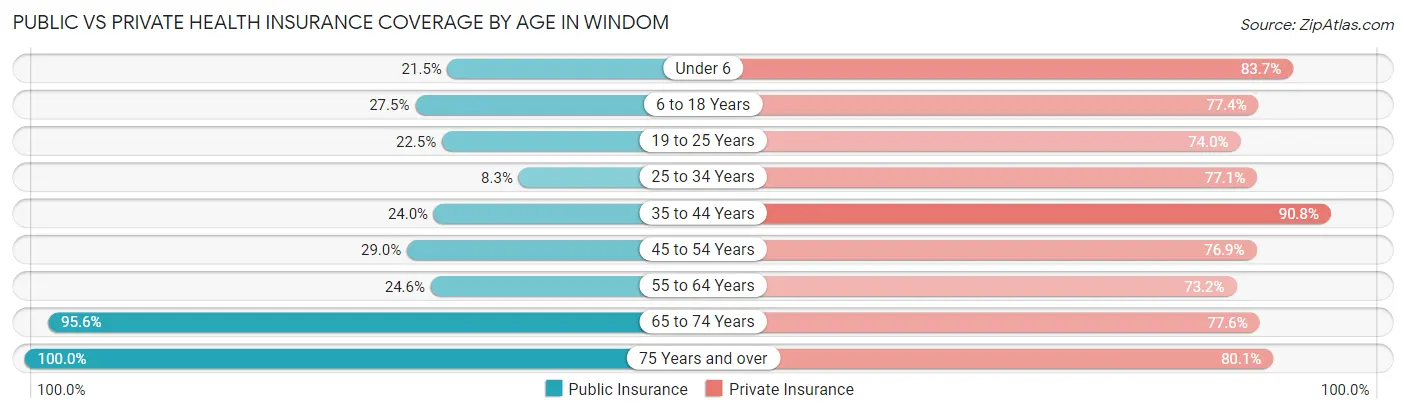
| Age Bracket | Public Insurance | Private Insurance |
| Under 6 | 70 (21.5%) | 273 (83.7%) |
| 6 to 18 Years | 210 (27.5%) | 591 (77.4%) |
| 19 to 25 Years | 77 (22.5%) | 253 (74.0%) |
| 25 to 34 Years | 48 (8.3%) | 447 (77.1%) |
| 35 to 44 Years | 117 (24.0%) | 442 (90.8%) |
| 45 to 54 Years | 112 (29.0%) | 297 (76.9%) |
| 55 to 64 Years | 159 (24.6%) | 473 (73.2%) |
| 65 to 74 Years | 524 (95.6%) | 425 (77.5%) |
| 75 Years and over | 557 (100.0%) | 446 (80.1%) |
| Total | 1,874 (40.4%) | 3,647 (78.7%) |
Disability Status by Sex by Age in Windom
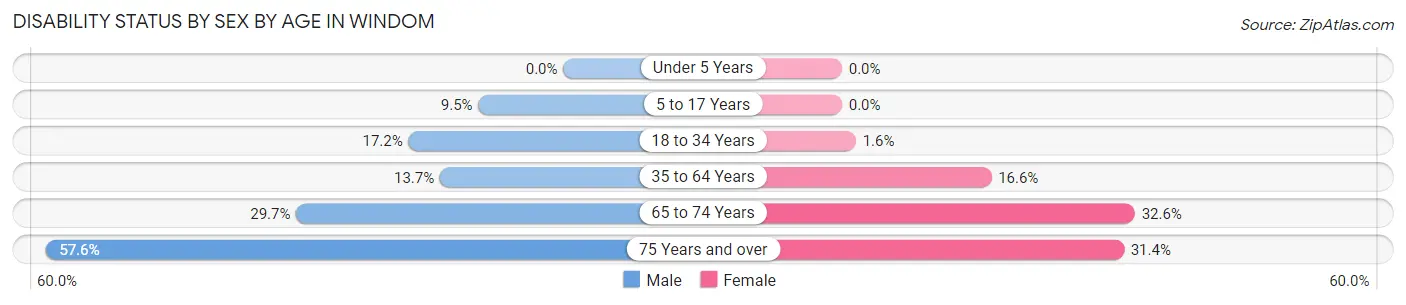
| Age Bracket | Male | Female |
| Under 5 Years | 0 (0.0%) | 0 (0.0%) |
| 5 to 17 Years | 42 (9.5%) | 0 (0.0%) |
| 18 to 34 Years | 100 (17.2%) | 6 (1.5%) |
| 35 to 64 Years | 103 (13.7%) | 128 (16.6%) |
| 65 to 74 Years | 80 (29.7%) | 91 (32.6%) |
| 75 Years and over | 152 (57.6%) | 92 (31.4%) |
Disability Class by Sex by Age in Windom
Disability Class: Hearing Difficulty
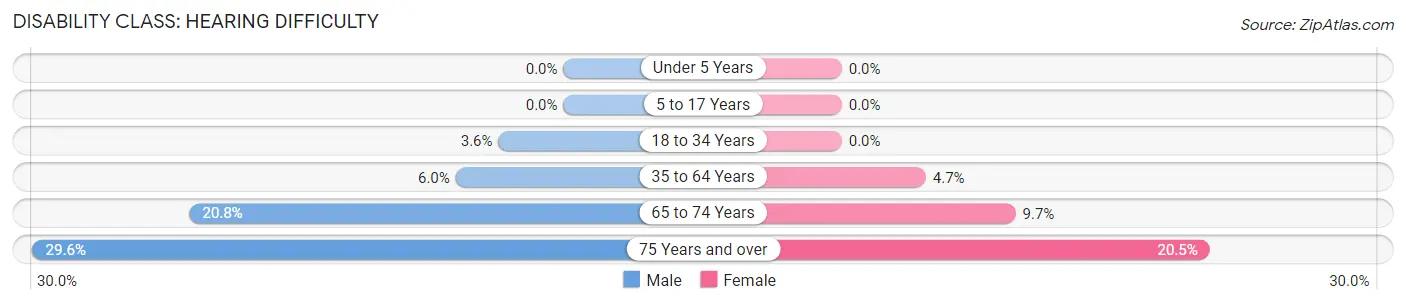
| Age Bracket | Male | Female |
| Under 5 Years | 0 (0.0%) | 0 (0.0%) |
| 5 to 17 Years | 0 (0.0%) | 0 (0.0%) |
| 18 to 34 Years | 21 (3.6%) | 0 (0.0%) |
| 35 to 64 Years | 45 (6.0%) | 36 (4.7%) |
| 65 to 74 Years | 56 (20.8%) | 27 (9.7%) |
| 75 Years and over | 78 (29.5%) | 60 (20.5%) |
Disability Class: Vision Difficulty
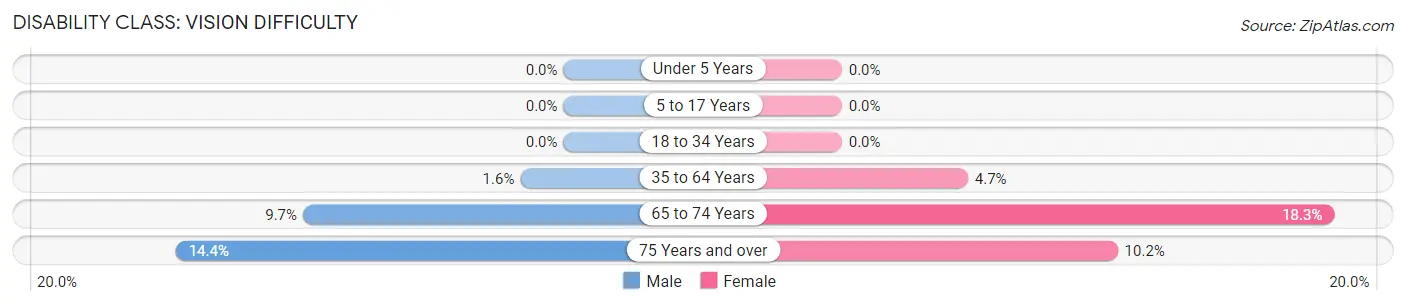
| Age Bracket | Male | Female |
| Under 5 Years | 0 (0.0%) | 0 (0.0%) |
| 5 to 17 Years | 0 (0.0%) | 0 (0.0%) |
| 18 to 34 Years | 0 (0.0%) | 0 (0.0%) |
| 35 to 64 Years | 12 (1.6%) | 36 (4.7%) |
| 65 to 74 Years | 26 (9.7%) | 51 (18.3%) |
| 75 Years and over | 38 (14.4%) | 30 (10.2%) |
Disability Class: Cognitive Difficulty
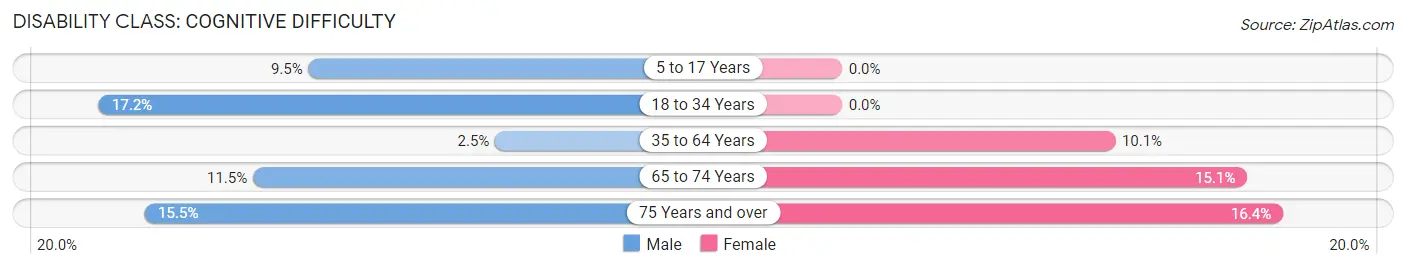
| Age Bracket | Male | Female |
| 5 to 17 Years | 42 (9.5%) | 0 (0.0%) |
| 18 to 34 Years | 100 (17.2%) | 0 (0.0%) |
| 35 to 64 Years | 19 (2.5%) | 78 (10.1%) |
| 65 to 74 Years | 31 (11.5%) | 42 (15.0%) |
| 75 Years and over | 41 (15.5%) | 48 (16.4%) |
Disability Class: Ambulatory Difficulty
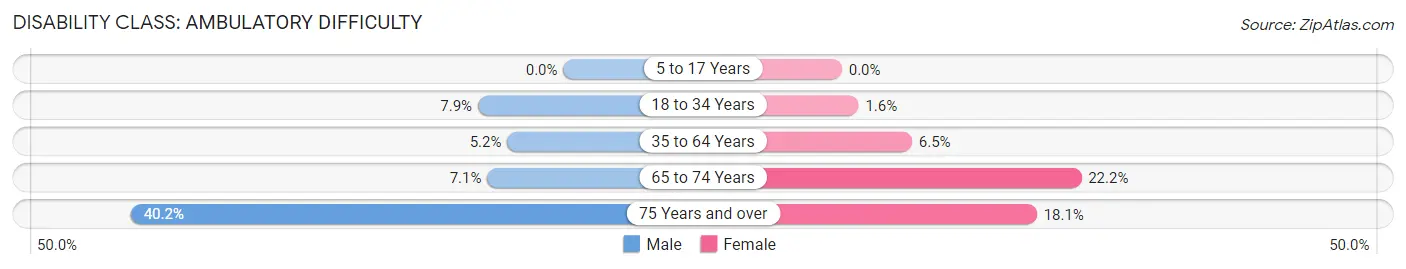
| Age Bracket | Male | Female |
| 5 to 17 Years | 0 (0.0%) | 0 (0.0%) |
| 18 to 34 Years | 46 (7.9%) | 6 (1.5%) |
| 35 to 64 Years | 39 (5.2%) | 50 (6.5%) |
| 65 to 74 Years | 19 (7.1%) | 62 (22.2%) |
| 75 Years and over | 106 (40.2%) | 53 (18.1%) |
Disability Class: Self-Care Difficulty
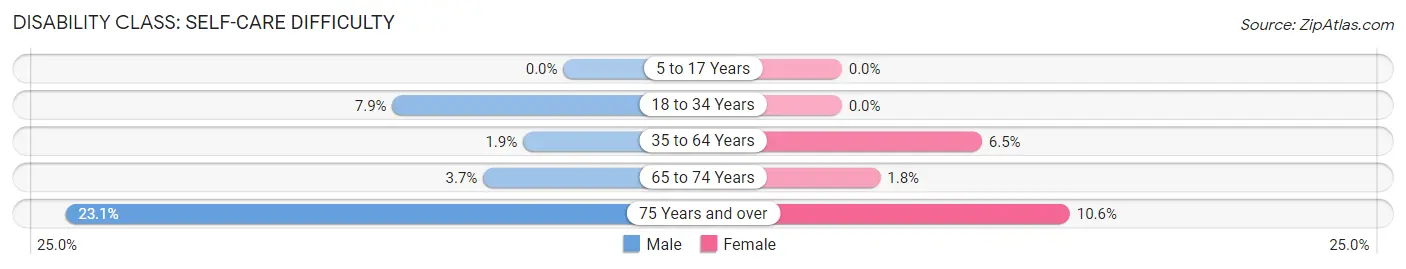
| Age Bracket | Male | Female |
| 5 to 17 Years | 0 (0.0%) | 0 (0.0%) |
| 18 to 34 Years | 46 (7.9%) | 0 (0.0%) |
| 35 to 64 Years | 14 (1.9%) | 50 (6.5%) |
| 65 to 74 Years | 10 (3.7%) | 5 (1.8%) |
| 75 Years and over | 61 (23.1%) | 31 (10.6%) |
Technology Access in Windom
Computing Device Access in Windom
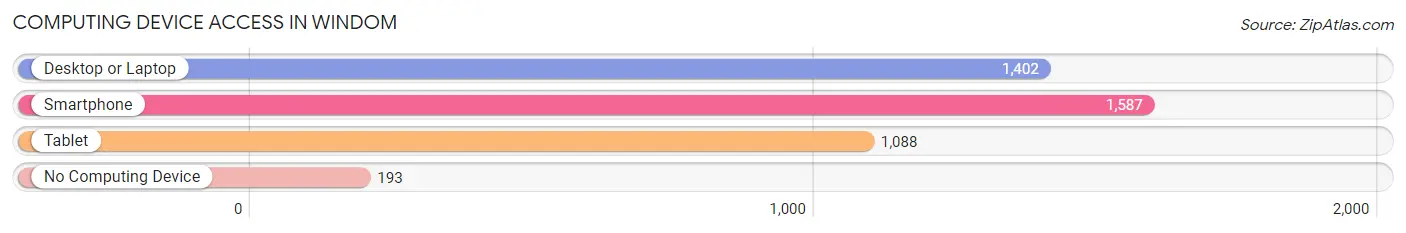
| Device Type | # Households | % Households |
| Desktop or Laptop | 1,402 | 71.7% |
| Smartphone | 1,587 | 81.2% |
| Tablet | 1,088 | 55.6% |
| No Computing Device | 193 | 9.9% |
| Total | 1,955 | 100.0% |
Internet Access in Windom
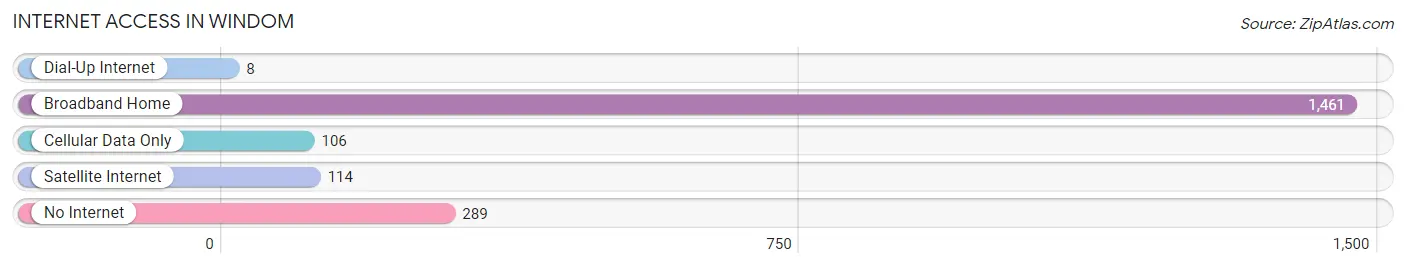
| Internet Type | # Households | % Households |
| Dial-Up Internet | 8 | 0.4% |
| Broadband Home | 1,461 | 74.7% |
| Cellular Data Only | 106 | 5.4% |
| Satellite Internet | 114 | 5.8% |
| No Internet | 289 | 14.8% |
| Total | 1,955 | 100.0% |
Windom Summary
Windom, Minnesota is a small city located in Cottonwood County in the southwestern part of the state. It is situated along the Des Moines River and is the county seat of Cottonwood County. The city has a population of 4,619 as of the 2010 census.
History
The area that is now Windom was first settled in 1871 by a group of settlers from Wisconsin. The city was named after William Windom, a United States Senator from Minnesota. The city was incorporated in 1881 and was designated as the county seat of Cottonwood County in 1883.
In the early 1900s, Windom was a thriving agricultural community. The city was home to several grain elevators, a creamery, and a flour mill. The city also had a railroad line that connected it to other towns in the area.
In the 1950s, the city began to experience a decline in population as people moved away to larger cities. However, in the late 1970s, the city began to experience a resurgence as people began to move back to the area.
Geography
Windom is located in the southwestern part of Minnesota, in Cottonwood County. It is situated along the Des Moines River and is about 50 miles southwest of Mankato. The city has a total area of 2.3 square miles, all of which is land.
The city has a humid continental climate, with cold winters and hot, humid summers. The average temperature in January is 16°F and the average temperature in July is 75°F. The average annual precipitation is 28 inches.
Economy
Windom’s economy is largely based on agriculture. The city is home to several grain elevators, a creamery, and a flour mill. The city also has a number of small businesses, including retail stores, restaurants, and service providers.
The city is also home to a number of manufacturing companies, including a plastics manufacturer, a metal fabricator, and a food processor. The city is also home to a number of healthcare providers, including a hospital, a nursing home, and several clinics.
Demographics
As of the 2010 census, Windom had a population of 4,619. The racial makeup of the city was 95.3% White, 0.7% African American, 0.3% Native American, 0.4% Asian, 0.1% Pacific Islander, 1.7% from other races, and 1.5% from two or more races. Hispanic or Latino of any race were 3.2% of the population.
The median income for a household in the city was $41,944 and the median income for a family was $50,917. The per capita income for the city was $20,845. About 8.3% of families and 11.2% of the population were below the poverty line, including 15.2% of those under age 18 and 8.2% of those age 65 or over.
Windom is a small city with a rich history and a diverse economy. The city has a strong agricultural base and is home to a number of manufacturing and healthcare providers. The city has a diverse population and a median income that is slightly higher than the state average.
Common Questions
What is Per Capita Income in Windom?
Per Capita income in Windom is $32,550.
What is the Median Family Income in Windom?
Median Family Income in Windom is $80,665.
What is the Median Household income in Windom?
Median Household Income in Windom is $54,603.
What is Income or Wage Gap in Windom?
Income or Wage Gap in Windom is 36.4%.
Women in Windom earn 63.6 cents for every dollar earned by a man.
What is Family Income Deficit in Windom?
Family Income Deficit in Windom is $9,045.
Families that are below poverty line in Windom earn $9,045 less on average than the poverty threshold level.
What is Inequality or Gini Index in Windom?
Inequality or Gini Index in Windom is 0.40.
What is the Total Population of Windom?
Total Population of Windom is 4,770.
What is the Total Male Population of Windom?
Total Male Population of Windom is 2,410.
What is the Total Female Population of Windom?
Total Female Population of Windom is 2,360.
What is the Ratio of Males per 100 Females in Windom?
There are 102.12 Males per 100 Females in Windom.
What is the Ratio of Females per 100 Males in Windom?
There are 97.93 Females per 100 Males in Windom.
What is the Median Population Age in Windom?
Median Population Age in Windom is 41.6 Years.
What is the Average Family Size in Windom
Average Family Size in Windom is 2.9 People.
What is the Average Household Size in Windom
Average Household Size in Windom is 2.3 People.
How Large is the Labor Force in Windom?
There are 2,323 People in the Labor Forcein in Windom.
What is the Percentage of People in the Labor Force in Windom?
60.5% of People are in the Labor Force in Windom.
What is the Unemployment Rate in Windom?
Unemployment Rate in Windom is 5.3%.