Alexandria, MN Map & Demographics
Alexandria Map
Alexandria Overview
$38,089
PER CAPITA INCOME
$81,603
AVG FAMILY INCOME
$57,309
AVG HOUSEHOLD INCOME
24.8%
WAGE / INCOME GAP [ % ]
75.2¢/ $1
WAGE / INCOME GAP [ $ ]
$11,476
FAMILY INCOME DEFICIT
0.45
INEQUALITY / GINI INDEX
14,400
TOTAL POPULATION
6,968
MALE POPULATION
7,432
FEMALE POPULATION
93.76
MALES / 100 FEMALES
106.66
FEMALES / 100 MALES
37.9
MEDIAN AGE
2.6
AVG FAMILY SIZE
2.0
AVG HOUSEHOLD SIZE
7,666
LABOR FORCE [ PEOPLE ]
65.2%
PERCENT IN LABOR FORCE
4.0%
UNEMPLOYMENT RATE
Alexandria Zip Codes
Alexandria Area Codes
Income in Alexandria
Income Overview in Alexandria
Per Capita Income in Alexandria is $38,089, while median incomes of families and households are $81,603 and $57,309 respectively.
| Characteristic | Number | Measure |
| Per Capita Income | 14,400 | $38,089 |
| Median Family Income | 3,761 | $81,603 |
| Mean Family Income | 3,761 | $106,658 |
| Median Household Income | 6,960 | $57,309 |
| Mean Household Income | 6,960 | $79,572 |
| Income Deficit | 3,761 | $11,476 |
| Wage / Income Gap (%) | 14,400 | 24.82% |
| Wage / Income Gap ($) | 14,400 | 75.18¢ per $1 |
| Gini / Inequality Index | 14,400 | 0.45 |
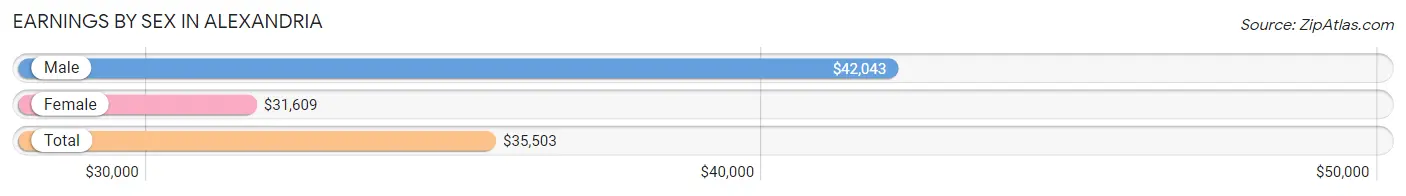
Earnings by Sex in Alexandria
Average Earnings in Alexandria are $35,503, $42,043 for men and $31,609 for women, a difference of 24.8%.
| Sex | Number | Average Earnings |
| Male | 4,259 (51.9%) | $42,043 |
| Female | 3,952 (48.1%) | $31,609 |
| Total | 8,211 (100.0%) | $35,503 |
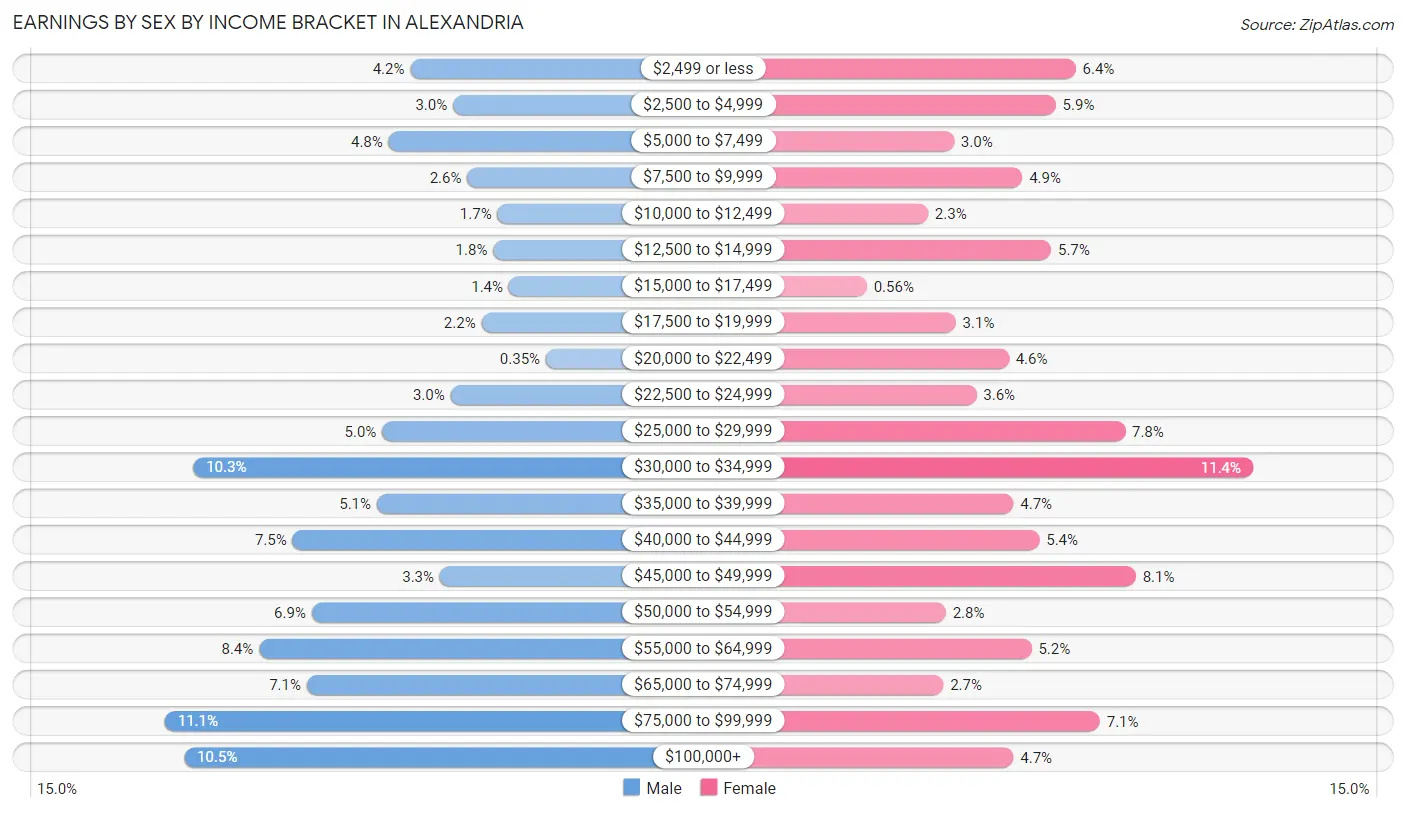
Earnings by Sex by Income Bracket in Alexandria
The most common earnings brackets in Alexandria are $75,000 to $99,999 for men (471 | 11.1%) and $30,000 to $34,999 for women (451 | 11.4%).
| Income | Male | Female |
| $2,499 or less | 177 (4.2%) | 254 (6.4%) |
| $2,500 to $4,999 | 126 (3.0%) | 232 (5.9%) |
| $5,000 to $7,499 | 203 (4.8%) | 119 (3.0%) |
| $7,500 to $9,999 | 109 (2.6%) | 195 (4.9%) |
| $10,000 to $12,499 | 73 (1.7%) | 90 (2.3%) |
| $12,500 to $14,999 | 78 (1.8%) | 227 (5.7%) |
| $15,000 to $17,499 | 59 (1.4%) | 22 (0.6%) |
| $17,500 to $19,999 | 92 (2.2%) | 121 (3.1%) |
| $20,000 to $22,499 | 15 (0.4%) | 180 (4.5%) |
| $22,500 to $24,999 | 129 (3.0%) | 144 (3.6%) |
| $25,000 to $29,999 | 211 (5.0%) | 309 (7.8%) |
| $30,000 to $34,999 | 437 (10.3%) | 451 (11.4%) |
| $35,000 to $39,999 | 217 (5.1%) | 185 (4.7%) |
| $40,000 to $44,999 | 318 (7.5%) | 214 (5.4%) |
| $45,000 to $49,999 | 142 (3.3%) | 321 (8.1%) |
| $50,000 to $54,999 | 295 (6.9%) | 110 (2.8%) |
| $55,000 to $64,999 | 358 (8.4%) | 205 (5.2%) |
| $65,000 to $74,999 | 301 (7.1%) | 107 (2.7%) |
| $75,000 to $99,999 | 471 (11.1%) | 281 (7.1%) |
| $100,000+ | 448 (10.5%) | 185 (4.7%) |
| Total | 4,259 (100.0%) | 3,952 (100.0%) |
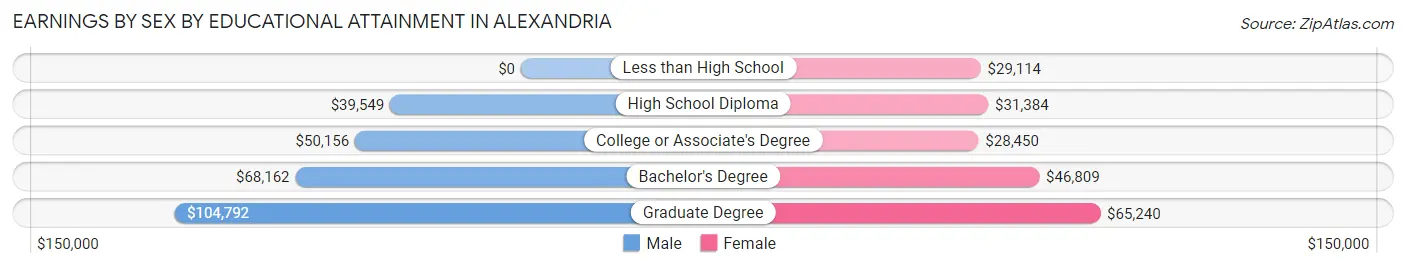
Earnings by Sex by Educational Attainment in Alexandria
Average earnings in Alexandria are $52,367 for men and $34,505 for women, a difference of 34.1%. Men with an educational attainment of graduate degree enjoy the highest average annual earnings of $104,792, while those with high school diploma education earn the least with $39,549. Women with an educational attainment of graduate degree earn the most with the average annual earnings of $65,240, while those with college or associate's degree education have the smallest earnings of $28,450.
| Educational Attainment | Male Income | Female Income |
| Less than High School | - | - |
| High School Diploma | $39,549 | $31,384 |
| College or Associate's Degree | $50,156 | $28,450 |
| Bachelor's Degree | $68,162 | $46,809 |
| Graduate Degree | $104,792 | $65,240 |
| Total | $52,367 | $34,505 |
Family Income in Alexandria
Family Income Brackets in Alexandria
According to the Alexandria family income data, there are 700 families falling into the $100,000 to $149,999 income range, which is the most common income bracket and makes up 18.6% of all families. Conversely, the $10,000 to $14,999 income bracket is the least frequent group with only 4 families (0.1%) belonging to this category.
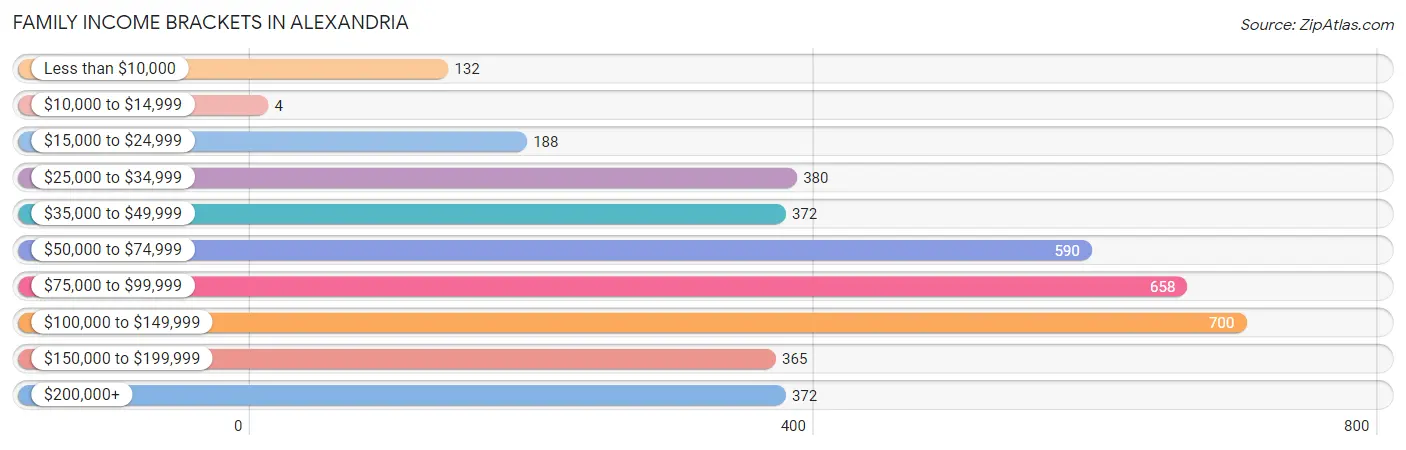
| Income Bracket | # Families | % Families |
| Less than $10,000 | 132 | 3.5% |
| $10,000 to $14,999 | 4 | 0.1% |
| $15,000 to $24,999 | 188 | 5.0% |
| $25,000 to $34,999 | 380 | 10.1% |
| $35,000 to $49,999 | 372 | 9.9% |
| $50,000 to $74,999 | 590 | 15.7% |
| $75,000 to $99,999 | 658 | 17.5% |
| $100,000 to $149,999 | 700 | 18.6% |
| $150,000 to $199,999 | 365 | 9.7% |
| $200,000+ | 372 | 9.9% |
Family Income by Famaliy Size in Alexandria
6-person families (70 | 1.9%) account for the highest median family income in Alexandria with $216,133 per family, while 2-person families (2,175 | 57.8%) have the highest median income of $38,812 per family member.
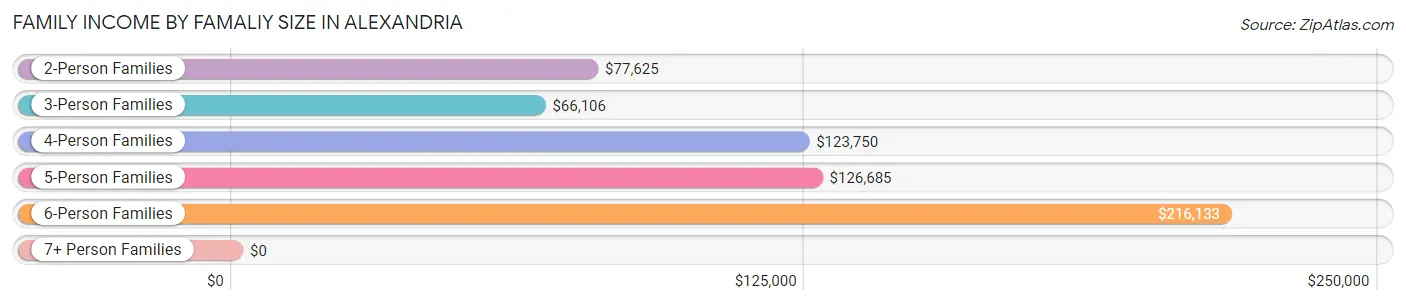
| Income Bracket | # Families | Median Income |
| 2-Person Families | 2,175 (57.8%) | $77,625 |
| 3-Person Families | 817 (21.7%) | $66,106 |
| 4-Person Families | 442 (11.7%) | $123,750 |
| 5-Person Families | 247 (6.6%) | $126,685 |
| 6-Person Families | 70 (1.9%) | $216,133 |
| 7+ Person Families | 10 (0.3%) | $0 |
| Total | 3,761 (100.0%) | $81,603 |
Family Income by Number of Earners in Alexandria
The median family income in Alexandria is $81,603, with families comprising 3+ earners (296) having the highest median family income of $140,833, while families with 1 earner (1,299) have the lowest median family income of $45,573, accounting for 7.9% and 34.5% of families, respectively.
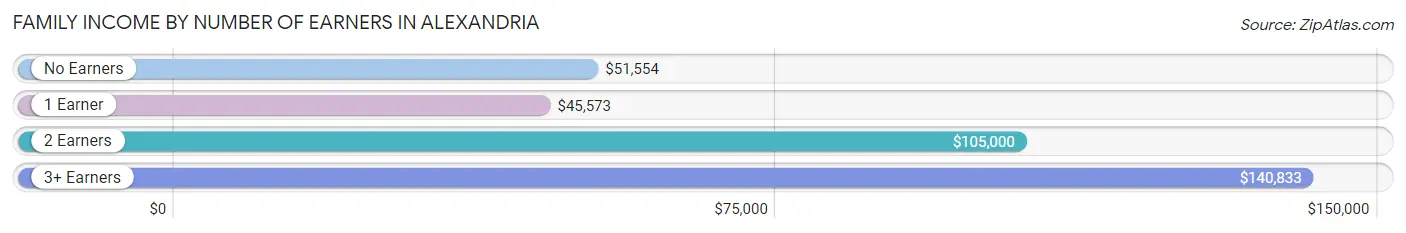
| Number of Earners | # Families | Median Income |
| No Earners | 530 (14.1%) | $51,554 |
| 1 Earner | 1,299 (34.5%) | $45,573 |
| 2 Earners | 1,636 (43.5%) | $105,000 |
| 3+ Earners | 296 (7.9%) | $140,833 |
| Total | 3,761 (100.0%) | $81,603 |
Household Income in Alexandria
Household Income Brackets in Alexandria
With 1,274 households falling in the category, the $50,000 to $74,999 income range is the most frequent in Alexandria, accounting for 18.3% of all households. In contrast, only 271 households (3.9%) fall into the less than $10,000 income bracket, making it the least populous group.
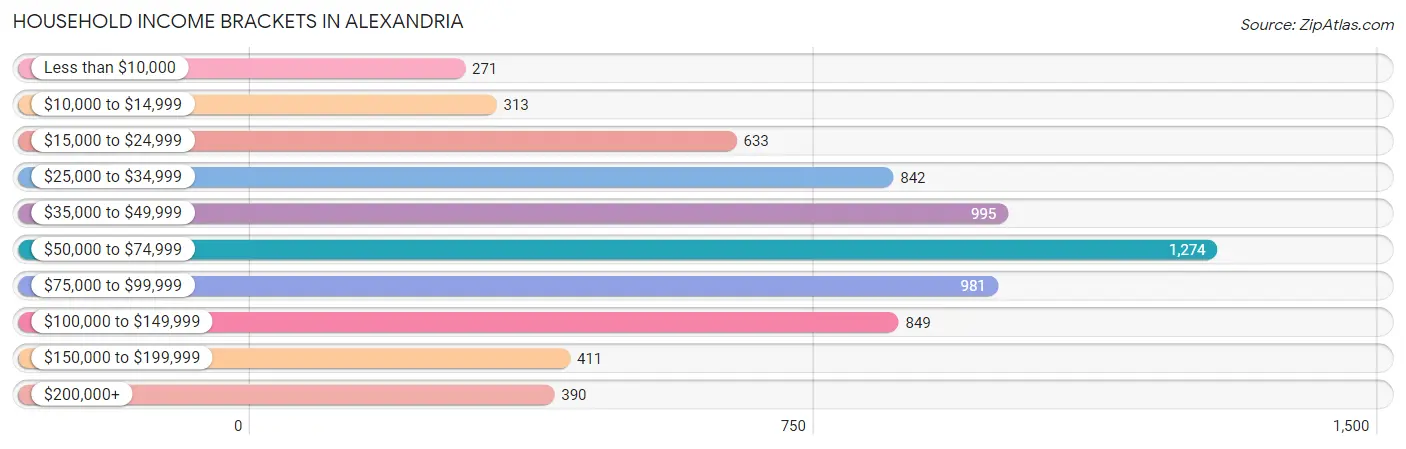
| Income Bracket | # Households | % Households |
| Less than $10,000 | 271 | 3.9% |
| $10,000 to $14,999 | 313 | 4.5% |
| $15,000 to $24,999 | 633 | 9.1% |
| $25,000 to $34,999 | 842 | 12.1% |
| $35,000 to $49,999 | 995 | 14.3% |
| $50,000 to $74,999 | 1,274 | 18.3% |
| $75,000 to $99,999 | 981 | 14.1% |
| $100,000 to $149,999 | 849 | 12.2% |
| $150,000 to $199,999 | 411 | 5.9% |
| $200,000+ | 390 | 5.6% |
Household Income by Householder Age in Alexandria
The median household income in Alexandria is $57,309, with the highest median household income of $79,104 found in the 45 to 64 years age bracket for the primary householder. A total of 2,015 households (28.9%) fall into this category. Meanwhile, the 15 to 24 years age bracket for the primary householder has the lowest median household income of $40,477, with 801 households (11.5%) in this group.
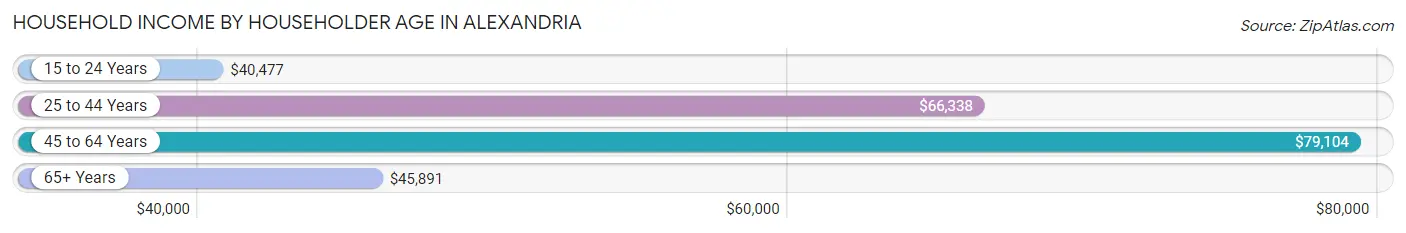
| Income Bracket | # Households | Median Income |
| 15 to 24 Years | 801 (11.5%) | $40,477 |
| 25 to 44 Years | 2,064 (29.7%) | $66,338 |
| 45 to 64 Years | 2,015 (28.9%) | $79,104 |
| 65+ Years | 2,080 (29.9%) | $45,891 |
| Total | 6,960 (100.0%) | $57,309 |
Poverty in Alexandria
Income Below Poverty by Sex and Age in Alexandria
With 9.1% poverty level for males and 17.1% for females among the residents of Alexandria, 6 to 11 year old males and 16 and 17 year old females are the most vulnerable to poverty, with 77 males (18.1%) and 64 females (41.8%) in their respective age groups living below the poverty level.
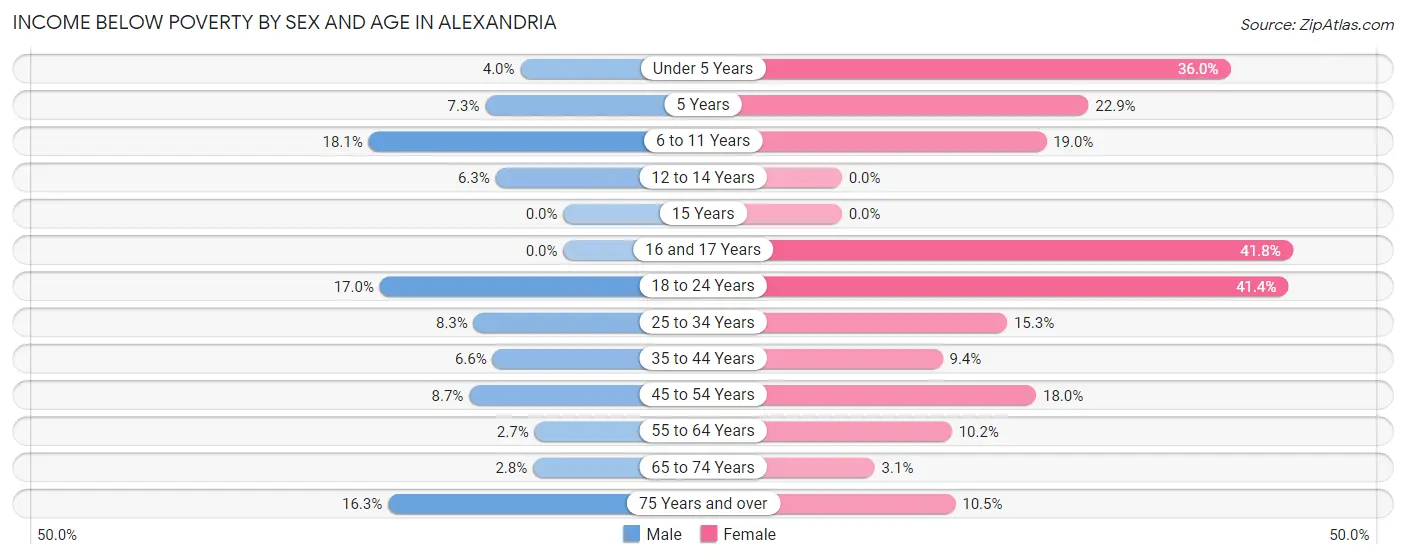
| Age Bracket | Male | Female |
| Under 5 Years | 17 (4.0%) | 151 (36.0%) |
| 5 Years | 15 (7.2%) | 38 (22.9%) |
| 6 to 11 Years | 77 (18.1%) | 81 (19.0%) |
| 12 to 14 Years | 21 (6.3%) | 0 (0.0%) |
| 15 Years | 0 (0.0%) | 0 (0.0%) |
| 16 and 17 Years | 0 (0.0%) | 64 (41.8%) |
| 18 to 24 Years | 130 (17.0%) | 324 (41.4%) |
| 25 to 34 Years | 91 (8.3%) | 145 (15.3%) |
| 35 to 44 Years | 46 (6.6%) | 70 (9.3%) |
| 45 to 54 Years | 55 (8.7%) | 128 (18.0%) |
| 55 to 64 Years | 21 (2.7%) | 95 (10.2%) |
| 65 to 74 Years | 13 (2.8%) | 20 (3.0%) |
| 75 Years and over | 130 (16.3%) | 112 (10.5%) |
| Total | 616 (9.1%) | 1,228 (17.1%) |
Income Above Poverty by Sex and Age in Alexandria
According to the poverty statistics in Alexandria, males aged 15 years and females aged 12 to 14 years are the age groups that are most secure financially, with 100.0% of males and 100.0% of females in these age groups living above the poverty line.
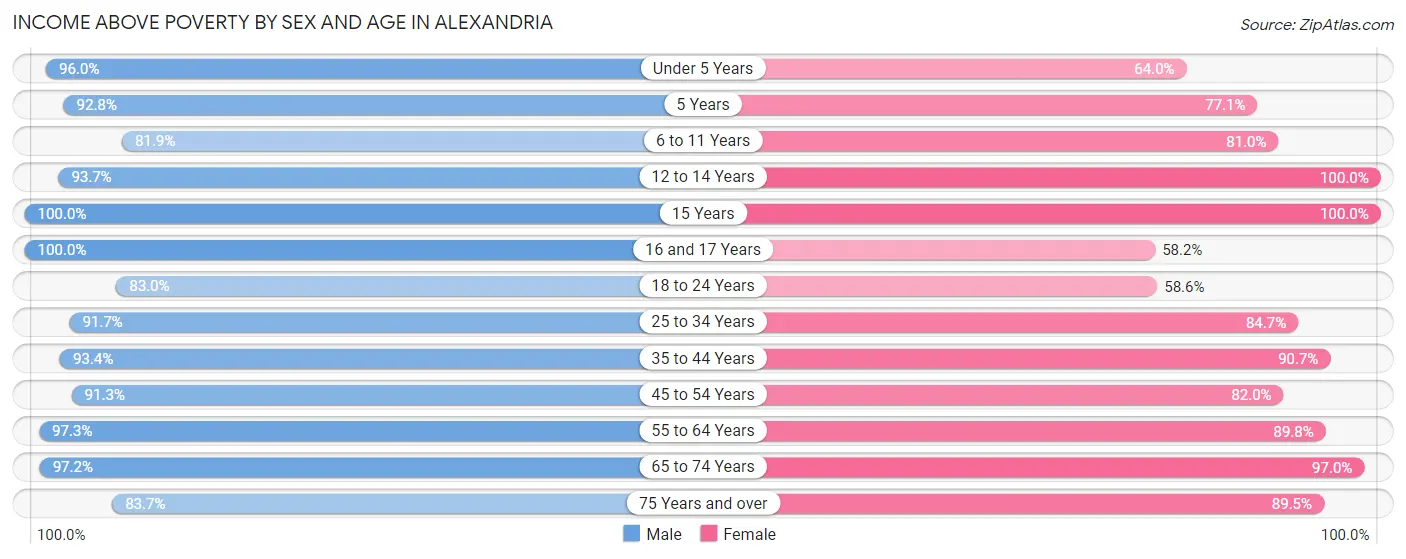
| Age Bracket | Male | Female |
| Under 5 Years | 409 (96.0%) | 268 (64.0%) |
| 5 Years | 192 (92.7%) | 128 (77.1%) |
| 6 to 11 Years | 349 (81.9%) | 346 (81.0%) |
| 12 to 14 Years | 313 (93.7%) | 117 (100.0%) |
| 15 Years | 32 (100.0%) | 79 (100.0%) |
| 16 and 17 Years | 136 (100.0%) | 89 (58.2%) |
| 18 to 24 Years | 633 (83.0%) | 458 (58.6%) |
| 25 to 34 Years | 1,001 (91.7%) | 801 (84.7%) |
| 35 to 44 Years | 654 (93.4%) | 679 (90.6%) |
| 45 to 54 Years | 574 (91.3%) | 582 (82.0%) |
| 55 to 64 Years | 762 (97.3%) | 836 (89.8%) |
| 65 to 74 Years | 450 (97.2%) | 635 (97.0%) |
| 75 Years and over | 669 (83.7%) | 952 (89.5%) |
| Total | 6,174 (90.9%) | 5,970 (82.9%) |
Income Below Poverty Among Married-Couple Families in Alexandria
The poverty statistics for married-couple families in Alexandria show that 1.8% or 46 of the total 2,543 families live below the poverty line. Families with 5 or more children have the highest poverty rate of 100.0%, comprising of 10 families. On the other hand, families with no children have the lowest poverty rate of 0.3%, which includes 5 families.
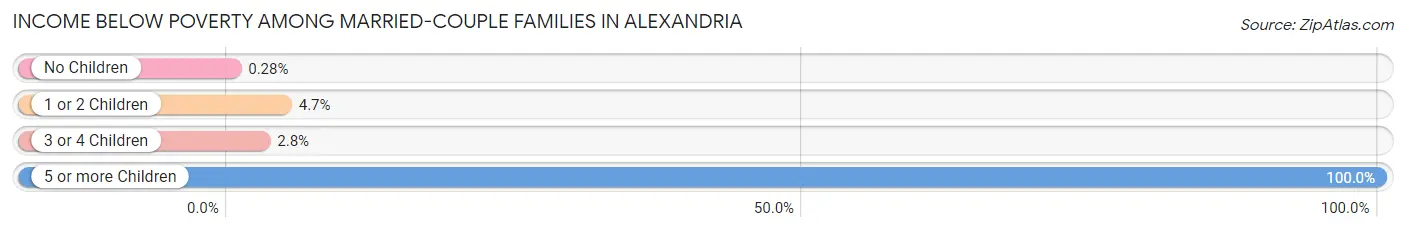
| Children | Above Poverty | Below Poverty |
| No Children | 1,766 (99.7%) | 5 (0.3%) |
| 1 or 2 Children | 489 (95.3%) | 24 (4.7%) |
| 3 or 4 Children | 242 (97.2%) | 7 (2.8%) |
| 5 or more Children | 0 (0.0%) | 10 (100.0%) |
| Total | 2,497 (98.2%) | 46 (1.8%) |
Income Below Poverty Among Single-Parent Households in Alexandria
According to the poverty data in Alexandria, 22.2% or 77 single-father households and 14.6% or 127 single-mother households are living below the poverty line. Among single-father households, those with 1 or 2 children have the highest poverty rate, with 65 households (24.2%) experiencing poverty. Likewise, among single-mother households, those with 1 or 2 children have the highest poverty rate, with 119 households (19.9%) falling below the poverty line.
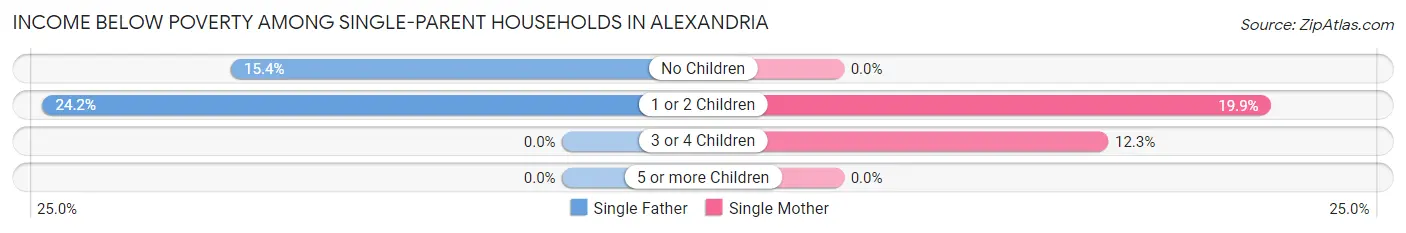
| Children | Single Father | Single Mother |
| No Children | 12 (15.4%) | 0 (0.0%) |
| 1 or 2 Children | 65 (24.2%) | 119 (19.9%) |
| 3 or 4 Children | 0 (0.0%) | 8 (12.3%) |
| 5 or more Children | 0 (0.0%) | 0 (0.0%) |
| Total | 77 (22.2%) | 127 (14.6%) |
Income Below Poverty Among Married-Couple vs Single-Parent Households in Alexandria
The poverty data for Alexandria shows that 46 of the married-couple family households (1.8%) and 204 of the single-parent households (16.8%) are living below the poverty level. Within the married-couple family households, those with 5 or more children have the highest poverty rate, with 10 households (100.0%) falling below the poverty line. Among the single-parent households, those with 1 or 2 children have the highest poverty rate, with 184 household (21.2%) living below poverty.
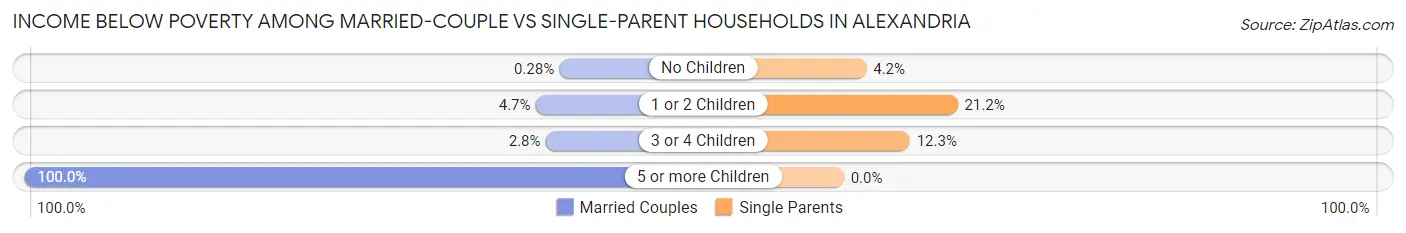
| Children | Married-Couple Families | Single-Parent Households |
| No Children | 5 (0.3%) | 12 (4.2%) |
| 1 or 2 Children | 24 (4.7%) | 184 (21.2%) |
| 3 or 4 Children | 7 (2.8%) | 8 (12.3%) |
| 5 or more Children | 10 (100.0%) | 0 (0.0%) |
| Total | 46 (1.8%) | 204 (16.8%) |
Race in Alexandria
The most populous races in Alexandria are White / Caucasian (13,421 | 93.2%), Hispanic or Latino (636 | 4.4%), and Two or more Races (419 | 2.9%).
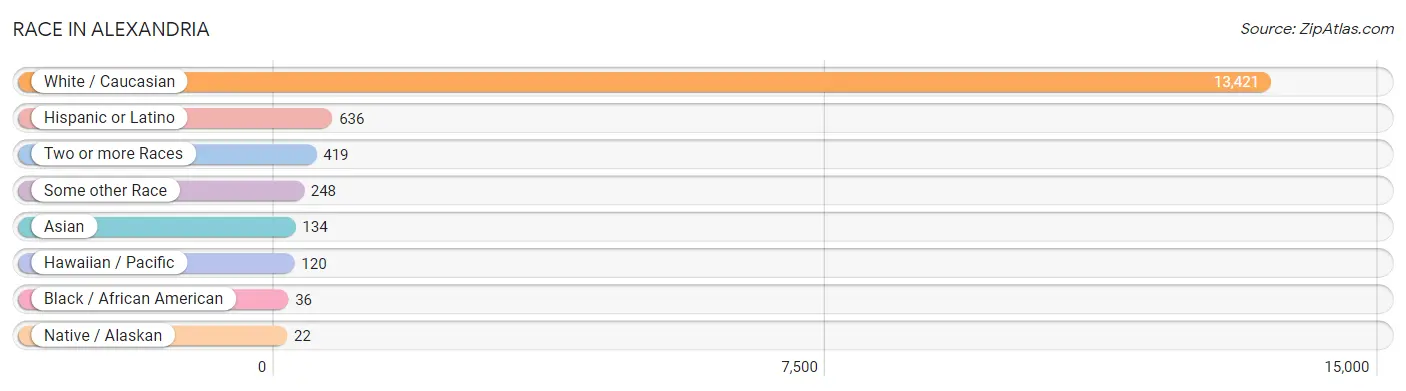
| Race | # Population | % Population |
| Asian | 134 | 0.9% |
| Black / African American | 36 | 0.3% |
| Hawaiian / Pacific | 120 | 0.8% |
| Hispanic or Latino | 636 | 4.4% |
| Native / Alaskan | 22 | 0.2% |
| White / Caucasian | 13,421 | 93.2% |
| Two or more Races | 419 | 2.9% |
| Some other Race | 248 | 1.7% |
| Total | 14,400 | 100.0% |
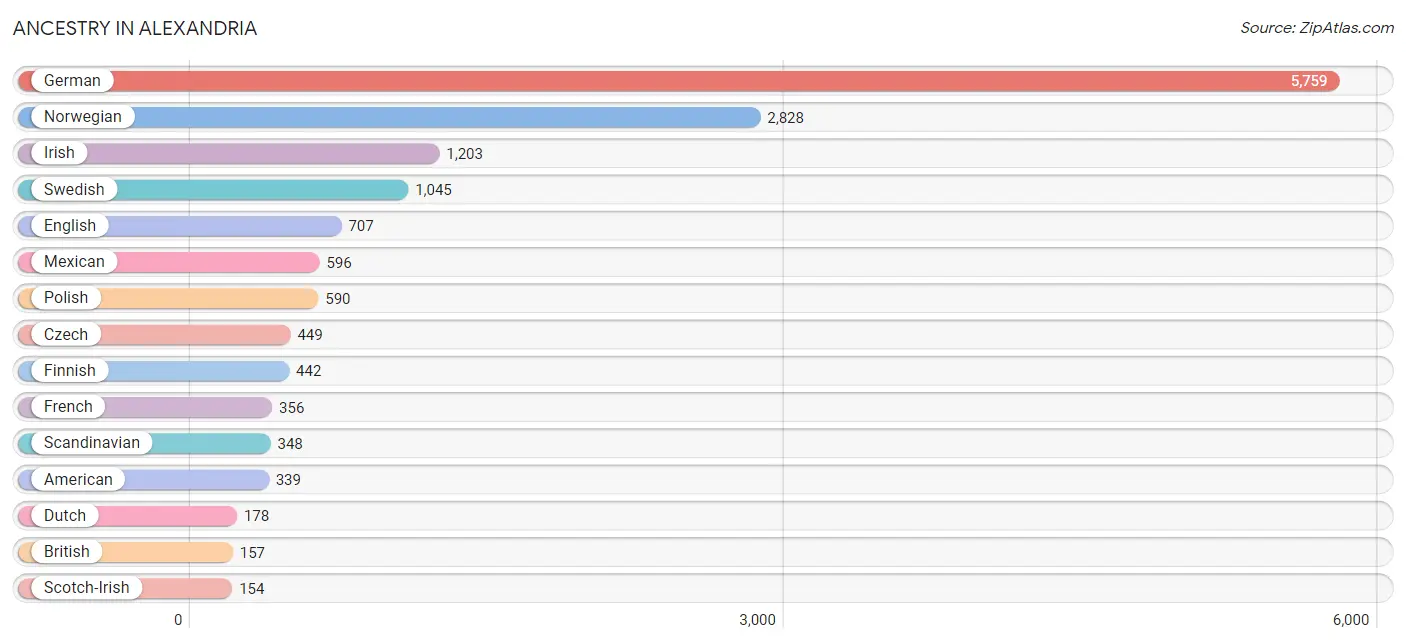
Ancestry in Alexandria
The most populous ancestries reported in Alexandria are German (5,759 | 40.0%), Norwegian (2,828 | 19.6%), Irish (1,203 | 8.4%), Swedish (1,045 | 7.3%), and English (707 | 4.9%), together accounting for 80.1% of all Alexandria residents.
| Ancestry | # Population | % Population |
| American | 339 | 2.4% |
| Apache | 6 | 0.0% |
| Arab | 2 | 0.0% |
| Armenian | 8 | 0.1% |
| Austrian | 19 | 0.1% |
| Bangladeshi | 5 | 0.0% |
| Belgian | 27 | 0.2% |
| Bhutanese | 10 | 0.1% |
| Blackfeet | 9 | 0.1% |
| British | 157 | 1.1% |
| Cherokee | 15 | 0.1% |
| Chippewa | 9 | 0.1% |
| Colombian | 2 | 0.0% |
| Croatian | 54 | 0.4% |
| Cuban | 1 | 0.0% |
| Czech | 449 | 3.1% |
| Czechoslovakian | 59 | 0.4% |
| Danish | 143 | 1.0% |
| Dutch | 178 | 1.2% |
| English | 707 | 4.9% |
| European | 88 | 0.6% |
| Finnish | 442 | 3.1% |
| French | 356 | 2.5% |
| French American Indian | 5 | 0.0% |
| French Canadian | 127 | 0.9% |
| German | 5,759 | 40.0% |
| Hungarian | 50 | 0.4% |
| Icelander | 27 | 0.2% |
| Indian (Asian) | 13 | 0.1% |
| Irish | 1,203 | 8.4% |
| Italian | 36 | 0.3% |
| Japanese | 41 | 0.3% |
| Luxembourger | 18 | 0.1% |
| Malaysian | 2 | 0.0% |
| Mexican | 596 | 4.1% |
| Northern European | 54 | 0.4% |
| Norwegian | 2,828 | 19.6% |
| Pakistani | 41 | 0.3% |
| Polish | 590 | 4.1% |
| Puerto Rican | 23 | 0.2% |
| Romanian | 24 | 0.2% |
| Russian | 114 | 0.8% |
| Samoan | 120 | 0.8% |
| Scandinavian | 348 | 2.4% |
| Scotch-Irish | 154 | 1.1% |
| Scottish | 147 | 1.0% |
| Sioux | 25 | 0.2% |
| Slovak | 23 | 0.2% |
| Somali | 1 | 0.0% |
| South American | 2 | 0.0% |
| Spaniard | 6 | 0.0% |
| Sri Lankan | 127 | 0.9% |
| Subsaharan African | 1 | 0.0% |
| Swedish | 1,045 | 7.3% |
| Swiss | 116 | 0.8% |
| Welsh | 10 | 0.1% | View All 56 Rows |
Immigrants in Alexandria
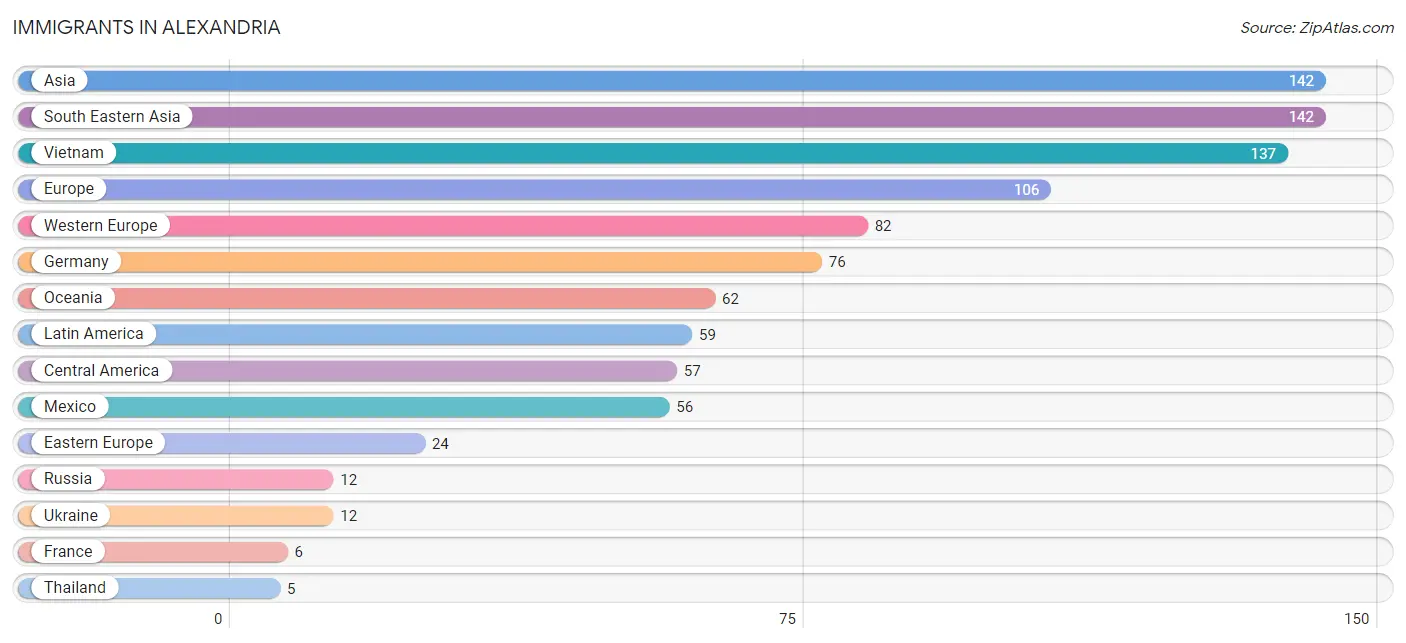
The most numerous immigrant groups reported in Alexandria came from Asia (142 | 1.0%), South Eastern Asia (142 | 1.0%), Vietnam (137 | 0.9%), Europe (106 | 0.7%), and Western Europe (82 | 0.6%), together accounting for 4.2% of all Alexandria residents.
| Immigration Origin | # Population | % Population |
| Asia | 142 | 1.0% |
| Central America | 57 | 0.4% |
| Colombia | 2 | 0.0% |
| Eastern Europe | 24 | 0.2% |
| Europe | 106 | 0.7% |
| France | 6 | 0.0% |
| Germany | 76 | 0.5% |
| Latin America | 59 | 0.4% |
| Mexico | 56 | 0.4% |
| Oceania | 62 | 0.4% |
| Panama | 1 | 0.0% |
| Russia | 12 | 0.1% |
| South America | 2 | 0.0% |
| South Eastern Asia | 142 | 1.0% |
| Thailand | 5 | 0.0% |
| Ukraine | 12 | 0.1% |
| Vietnam | 137 | 0.9% |
| Western Europe | 82 | 0.6% | View All 18 Rows |
Sex and Age in Alexandria
Sex and Age in Alexandria
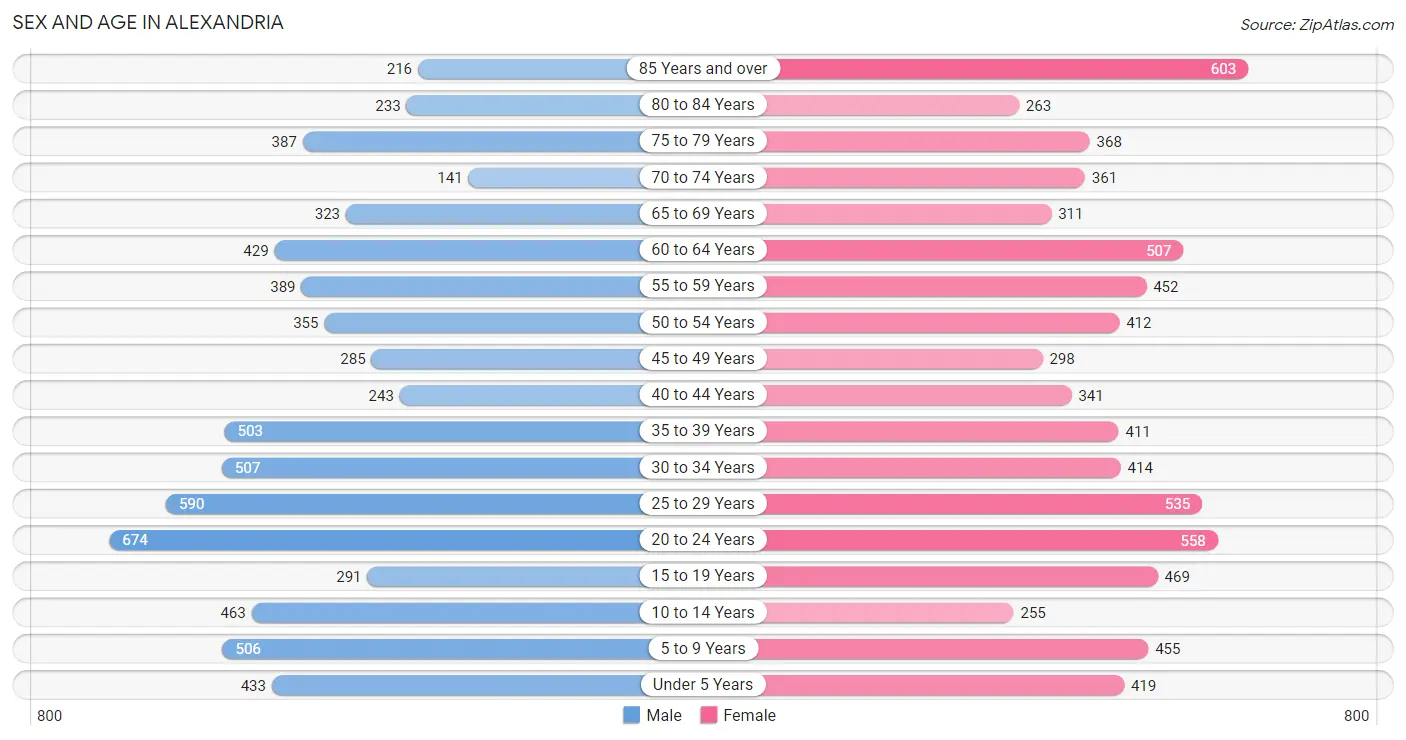
The most populous age groups in Alexandria are 20 to 24 Years (674 | 9.7%) for men and 85 Years and over (603 | 8.1%) for women.
| Age Bracket | Male | Female |
| Under 5 Years | 433 (6.2%) | 419 (5.6%) |
| 5 to 9 Years | 506 (7.3%) | 455 (6.1%) |
| 10 to 14 Years | 463 (6.6%) | 255 (3.4%) |
| 15 to 19 Years | 291 (4.2%) | 469 (6.3%) |
| 20 to 24 Years | 674 (9.7%) | 558 (7.5%) |
| 25 to 29 Years | 590 (8.5%) | 535 (7.2%) |
| 30 to 34 Years | 507 (7.3%) | 414 (5.6%) |
| 35 to 39 Years | 503 (7.2%) | 411 (5.5%) |
| 40 to 44 Years | 243 (3.5%) | 341 (4.6%) |
| 45 to 49 Years | 285 (4.1%) | 298 (4.0%) |
| 50 to 54 Years | 355 (5.1%) | 412 (5.5%) |
| 55 to 59 Years | 389 (5.6%) | 452 (6.1%) |
| 60 to 64 Years | 429 (6.2%) | 507 (6.8%) |
| 65 to 69 Years | 323 (4.6%) | 311 (4.2%) |
| 70 to 74 Years | 141 (2.0%) | 361 (4.9%) |
| 75 to 79 Years | 387 (5.6%) | 368 (5.0%) |
| 80 to 84 Years | 233 (3.3%) | 263 (3.5%) |
| 85 Years and over | 216 (3.1%) | 603 (8.1%) |
| Total | 6,968 (100.0%) | 7,432 (100.0%) |
Families and Households in Alexandria
Median Family Size in Alexandria
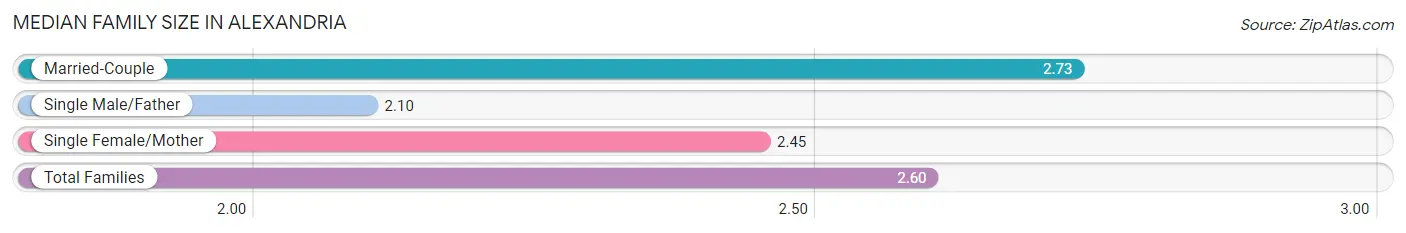
The median family size in Alexandria is 2.60 persons per family, with married-couple families (2,543 | 67.6%) accounting for the largest median family size of 2.73 persons per family. On the other hand, single male/father families (347 | 9.2%) represent the smallest median family size with 2.10 persons per family.
| Family Type | # Families | Family Size |
| Married-Couple | 2,543 (67.6%) | 2.73 |
| Single Male/Father | 347 (9.2%) | 2.10 |
| Single Female/Mother | 871 (23.2%) | 2.45 |
| Total Families | 3,761 (100.0%) | 2.60 |
Median Household Size in Alexandria
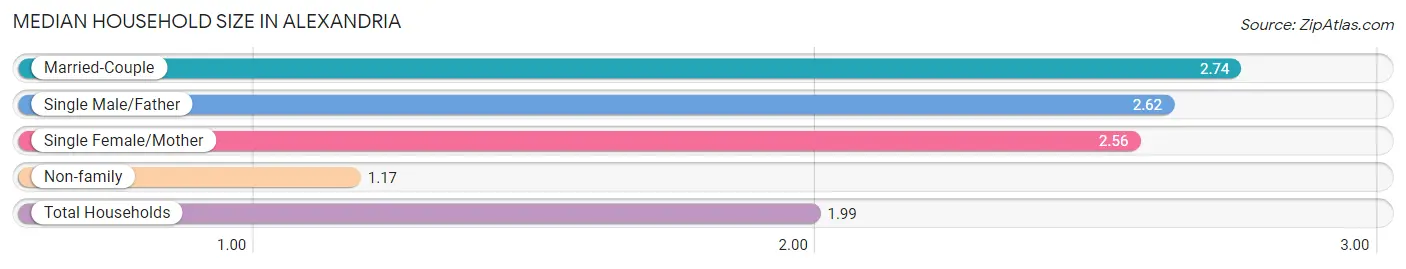
The median household size in Alexandria is 1.99 persons per household, with married-couple households (2,543 | 36.5%) accounting for the largest median household size of 2.74 persons per household. non-family households (3,199 | 46.0%) represent the smallest median household size with 1.17 persons per household.
| Household Type | # Households | Household Size |
| Married-Couple | 2,543 (36.5%) | 2.74 |
| Single Male/Father | 347 (5.0%) | 2.62 |
| Single Female/Mother | 871 (12.5%) | 2.56 |
| Non-family | 3,199 (46.0%) | 1.17 |
| Total Households | 6,960 (100.0%) | 1.99 |
Household Size by Marriage Status in Alexandria
Out of a total of 6,960 households in Alexandria, 3,761 (54.0%) are family households, while 3,199 (46.0%) are nonfamily households. The most numerous type of family households are 2-person households, comprising 2,025, and the most common type of nonfamily households are 1-person households, comprising 2,650.
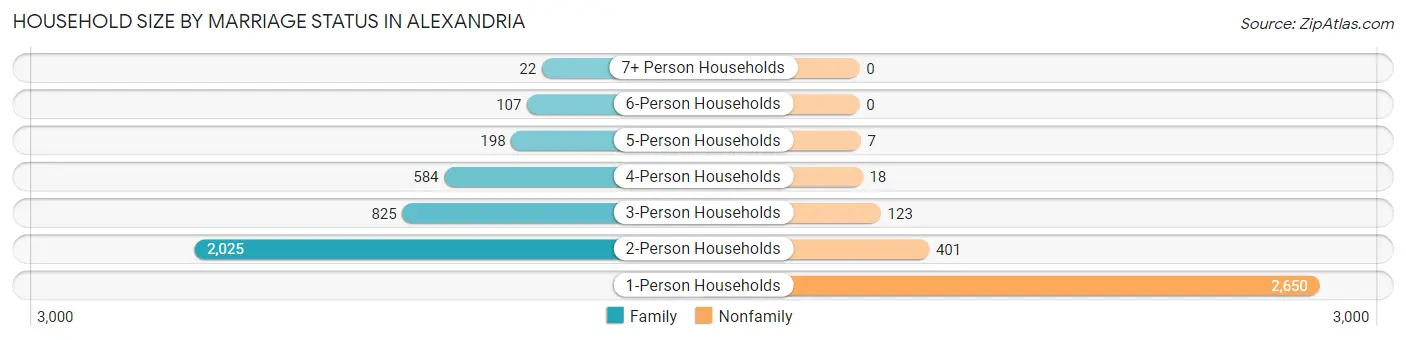
| Household Size | Family Households | Nonfamily Households |
| 1-Person Households | - | 2,650 (38.1%) |
| 2-Person Households | 2,025 (29.1%) | 401 (5.8%) |
| 3-Person Households | 825 (11.8%) | 123 (1.8%) |
| 4-Person Households | 584 (8.4%) | 18 (0.3%) |
| 5-Person Households | 198 (2.8%) | 7 (0.1%) |
| 6-Person Households | 107 (1.5%) | 0 (0.0%) |
| 7+ Person Households | 22 (0.3%) | 0 (0.0%) |
| Total | 3,761 (54.0%) | 3,199 (46.0%) |
Female Fertility in Alexandria
Fertility by Age in Alexandria
Average fertility rate in Alexandria is 45.0 births per 1,000 women. Women in the age bracket of 20 to 34 years have the highest fertility rate with 94.0 births per 1,000 women. Women in the age bracket of 20 to 34 years acount for 100.0% of all women with births.
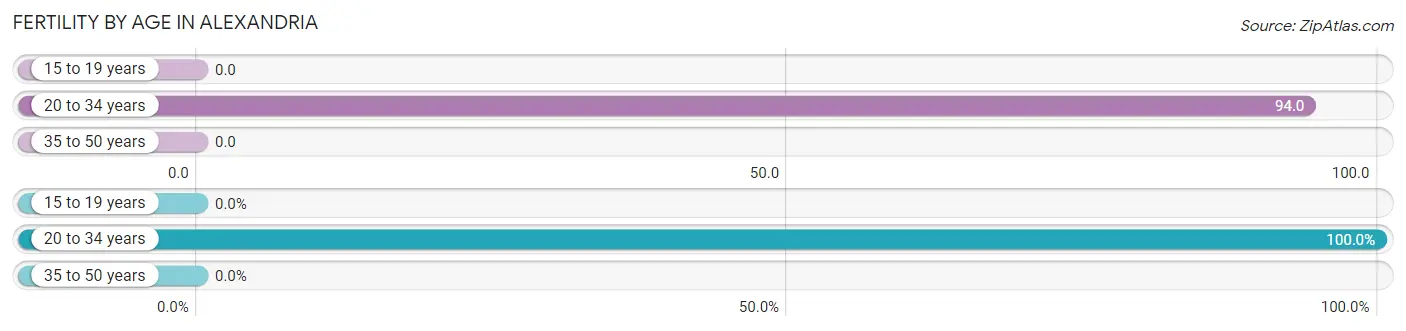
| Age Bracket | Women with Births | Births / 1,000 Women |
| 15 to 19 years | 0 (0.0%) | 0.0 |
| 20 to 34 years | 141 (100.0%) | 94.0 |
| 35 to 50 years | 0 (0.0%) | 0.0 |
| Total | 141 (100.0%) | 45.0 |
Fertility by Age by Marriage Status in Alexandria
66.7% of women with births (141) in Alexandria are married. The highest percentage of unmarried women with births falls into 20 to 34 years age bracket with 33.3% of them unmarried at the time of birth, while the lowest percentage of unmarried women with births belong to 20 to 34 years age bracket with 33.3% of them unmarried.
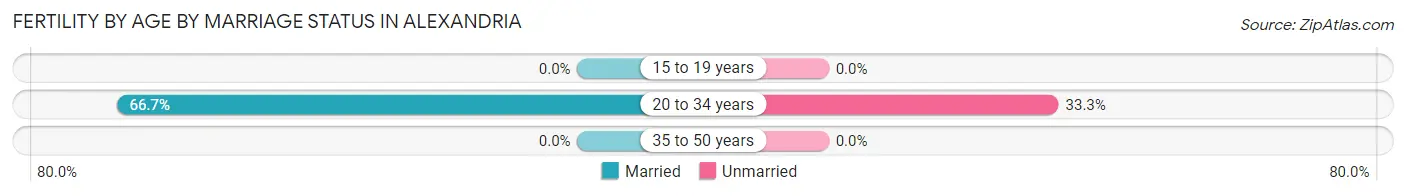
| Age Bracket | Married | Unmarried |
| 15 to 19 years | 0 (0.0%) | 0 (0.0%) |
| 20 to 34 years | 94 (66.7%) | 47 (33.3%) |
| 35 to 50 years | 0 (0.0%) | 0 (0.0%) |
| Total | 94 (66.7%) | 47 (33.3%) |
Fertility by Education in Alexandria
Average fertility rate in Alexandria is 45.0 births per 1,000 women. Women with the education attainment of graduate degree have the highest fertility rate of 81.0 births per 1,000 women, while women with the education attainment of bachelor's degree have the lowest fertility at 34.0 births per 1,000 women. Women with the education attainment of college or associate's degree represent 32.6% of all women with births.
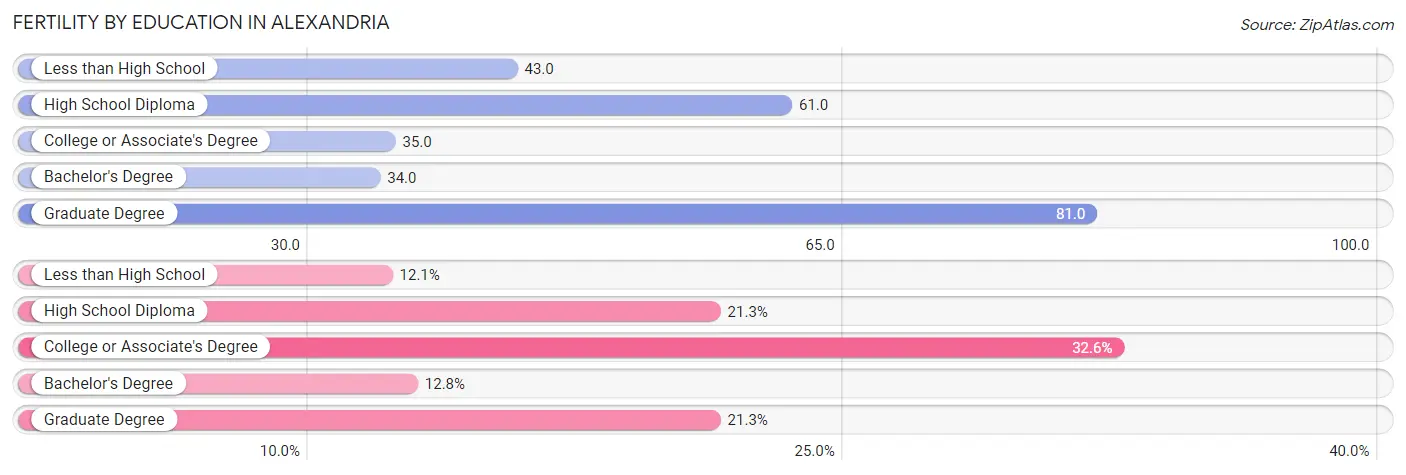
| Educational Attainment | Women with Births | Births / 1,000 Women |
| Less than High School | 17 (12.1%) | 43.0 |
| High School Diploma | 30 (21.3%) | 61.0 |
| College or Associate's Degree | 46 (32.6%) | 35.0 |
| Bachelor's Degree | 18 (12.8%) | 34.0 |
| Graduate Degree | 30 (21.3%) | 81.0 |
| Total | 141 (100.0%) | 45.0 |
Fertility by Education by Marriage Status in Alexandria
33.3% of women with births in Alexandria are unmarried. Women with the educational attainment of college or associate's degree are most likely to be married with 100.0% of them married at childbirth, while women with the educational attainment of less than high school are least likely to be married with 100.0% of them unmarried at childbirth.
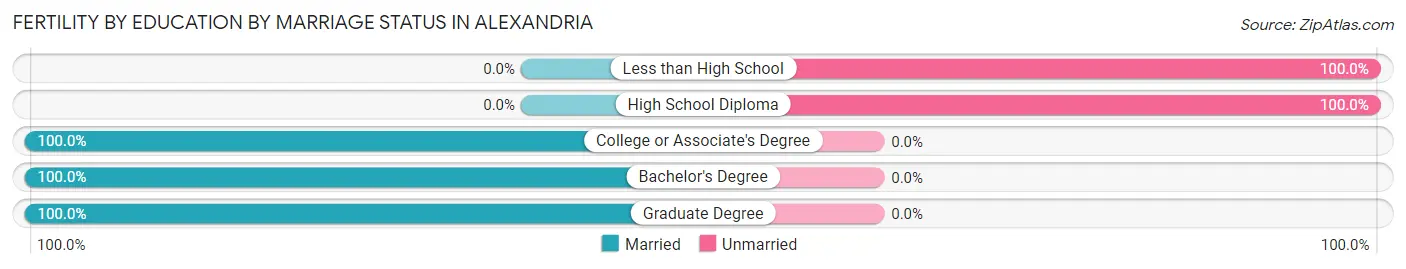
| Educational Attainment | Married | Unmarried |
| Less than High School | 0 (0.0%) | 17 (100.0%) |
| High School Diploma | 0 (0.0%) | 30 (100.0%) |
| College or Associate's Degree | 46 (100.0%) | 0 (0.0%) |
| Bachelor's Degree | 18 (100.0%) | 0 (0.0%) |
| Graduate Degree | 30 (100.0%) | 0 (0.0%) |
| Total | 94 (66.7%) | 47 (33.3%) |
Employment Characteristics in Alexandria
Employment by Class of Employer in Alexandria
Among the 7,269 employed individuals in Alexandria, private company employees (5,482 | 75.4%), local government employees (524 | 7.2%), and not-for-profit organizations (404 | 5.6%) make up the most common classes of employment.
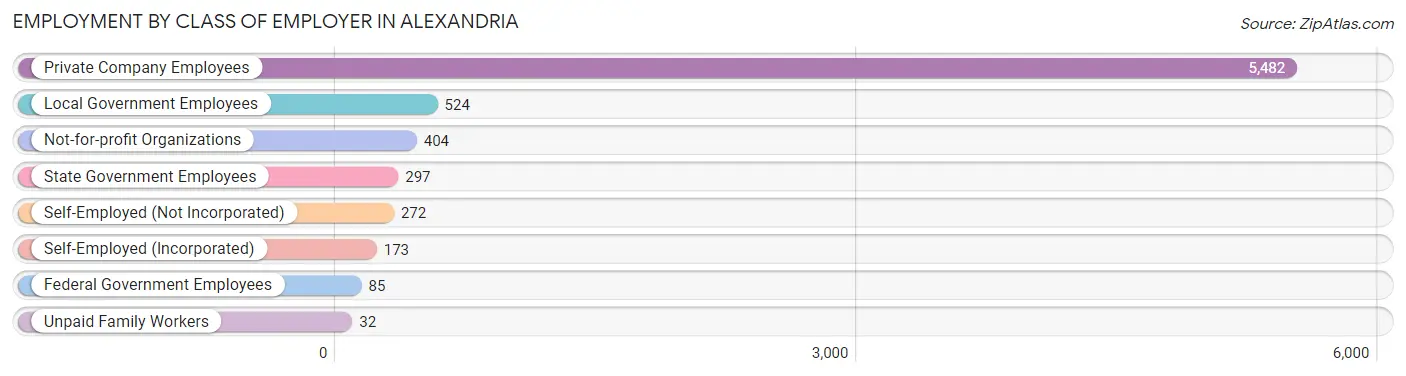
| Employer Class | # Employees | % Employees |
| Private Company Employees | 5,482 | 75.4% |
| Self-Employed (Incorporated) | 173 | 2.4% |
| Self-Employed (Not Incorporated) | 272 | 3.7% |
| Not-for-profit Organizations | 404 | 5.6% |
| Local Government Employees | 524 | 7.2% |
| State Government Employees | 297 | 4.1% |
| Federal Government Employees | 85 | 1.2% |
| Unpaid Family Workers | 32 | 0.4% |
| Total | 7,269 | 100.0% |
Employment Status by Age in Alexandria
According to the labor force statistics for Alexandria, out of the total population over 16 years of age (11,757), 65.2% or 7,666 individuals are in the labor force, with 4.0% or 307 of them unemployed. The age group with the highest labor force participation rate is 25 to 29 years, with 94.8% or 1,066 individuals in the labor force. Within the labor force, the 16 to 19 years age range has the highest percentage of unemployed individuals, with 20.1% or 77 of them being unemployed.
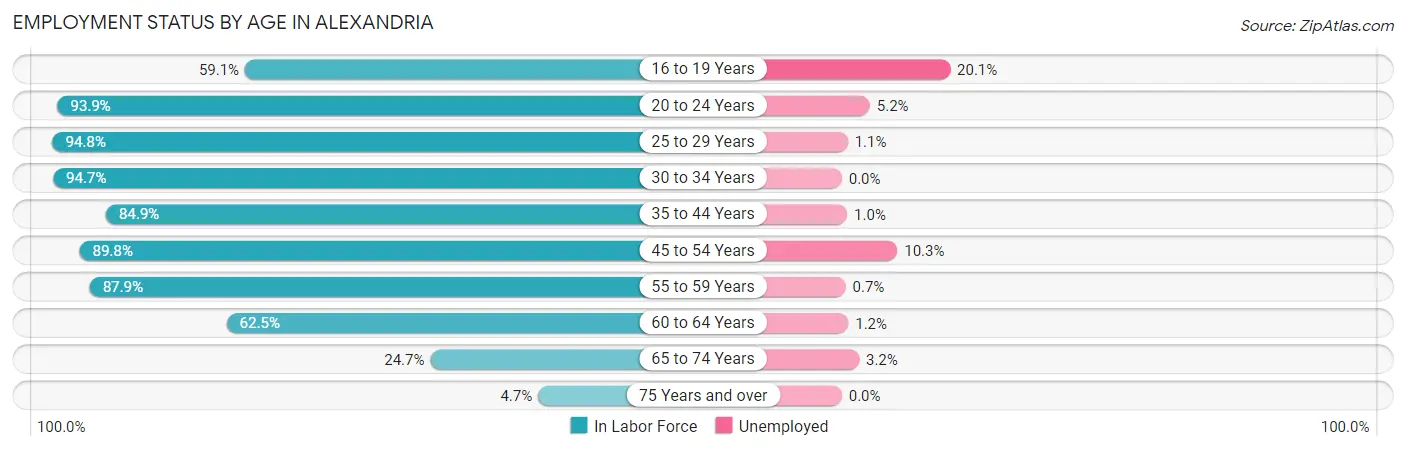
| Age Bracket | In Labor Force | Unemployed |
| 16 to 19 Years | 383 (59.1%) | 77 (20.1%) |
| 20 to 24 Years | 1,157 (93.9%) | 60 (5.2%) |
| 25 to 29 Years | 1,066 (94.8%) | 12 (1.1%) |
| 30 to 34 Years | 872 (94.7%) | 0 (0.0%) |
| 35 to 44 Years | 1,272 (84.9%) | 13 (1.0%) |
| 45 to 54 Years | 1,212 (89.8%) | 125 (10.3%) |
| 55 to 59 Years | 739 (87.9%) | 5 (0.7%) |
| 60 to 64 Years | 585 (62.5%) | 7 (1.2%) |
| 65 to 74 Years | 281 (24.7%) | 9 (3.2%) |
| 75 Years and over | 97 (4.7%) | 0 (0.0%) |
| Total | 7,666 (65.2%) | 307 (4.0%) |
Employment Status by Educational Attainment in Alexandria
According to labor force statistics for Alexandria, 86.1% of individuals (5,744) out of the total population between 25 and 64 years of age (6,671) are in the labor force, with 2.8% or 161 of them being unemployed. The group with the highest labor force participation rate are those with the educational attainment of bachelor's degree or higher, with 94.1% or 2,056 individuals in the labor force. Within the labor force, individuals with high school diploma education have the highest percentage of unemployment, with 5.2% or 72 of them being unemployed.
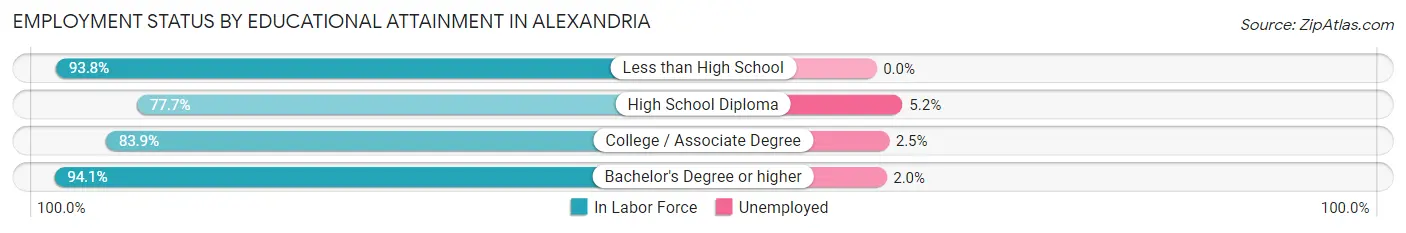
| Educational Attainment | In Labor Force | Unemployed |
| Less than High School | 316 (93.8%) | 0 (0.0%) |
| High School Diploma | 1,375 (77.7%) | 92 (5.2%) |
| College / Associate Degree | 1,997 (83.9%) | 60 (2.5%) |
| Bachelor's Degree or higher | 2,056 (94.1%) | 44 (2.0%) |
| Total | 5,744 (86.1%) | 187 (2.8%) |
Employment Occupations by Sex in Alexandria
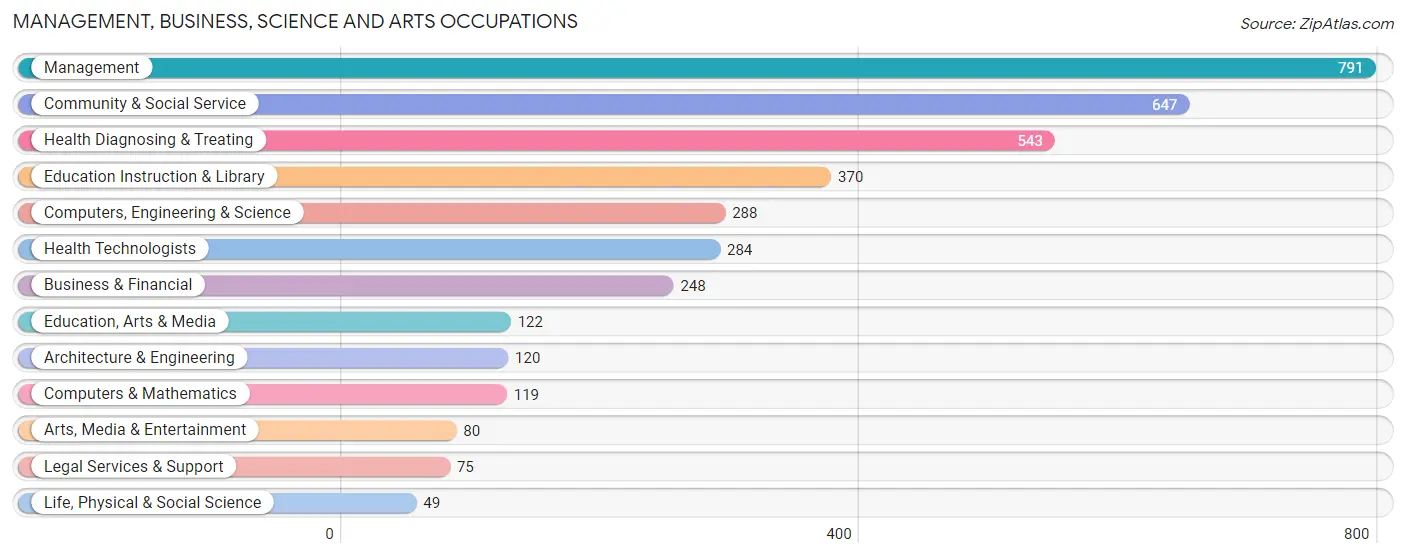
Management, Business, Science and Arts Occupations
The most common Management, Business, Science and Arts occupations in Alexandria are Management (791 | 10.8%), Community & Social Service (647 | 8.8%), Health Diagnosing & Treating (543 | 7.4%), Education Instruction & Library (370 | 5.1%), and Computers, Engineering & Science (288 | 3.9%).
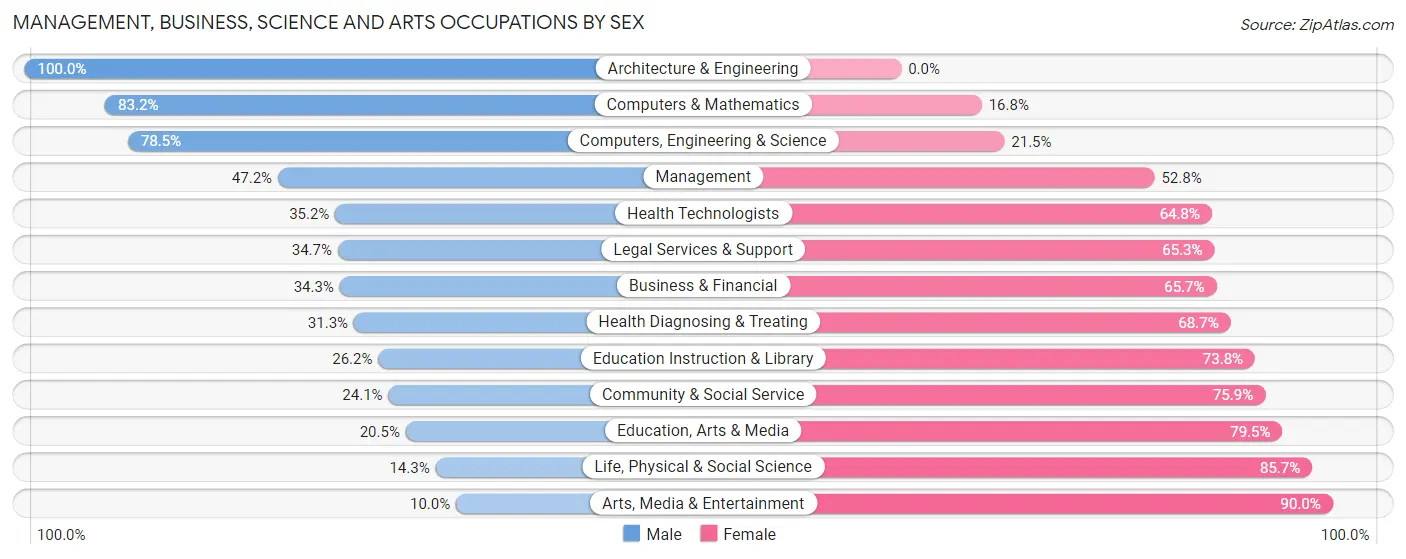
Management, Business, Science and Arts Occupations by Sex
Within the Management, Business, Science and Arts occupations in Alexandria, the most male-oriented occupations are Architecture & Engineering (100.0%), Computers & Mathematics (83.2%), and Computers, Engineering & Science (78.5%), while the most female-oriented occupations are Arts, Media & Entertainment (90.0%), Life, Physical & Social Science (85.7%), and Education, Arts & Media (79.5%).
| Occupation | Male | Female |
| Management | 373 (47.2%) | 418 (52.8%) |
| Business & Financial | 85 (34.3%) | 163 (65.7%) |
| Computers, Engineering & Science | 226 (78.5%) | 62 (21.5%) |
| Computers & Mathematics | 99 (83.2%) | 20 (16.8%) |
| Architecture & Engineering | 120 (100.0%) | 0 (0.0%) |
| Life, Physical & Social Science | 7 (14.3%) | 42 (85.7%) |
| Community & Social Service | 156 (24.1%) | 491 (75.9%) |
| Education, Arts & Media | 25 (20.5%) | 97 (79.5%) |
| Legal Services & Support | 26 (34.7%) | 49 (65.3%) |
| Education Instruction & Library | 97 (26.2%) | 273 (73.8%) |
| Arts, Media & Entertainment | 8 (10.0%) | 72 (90.0%) |
| Health Diagnosing & Treating | 170 (31.3%) | 373 (68.7%) |
| Health Technologists | 100 (35.2%) | 184 (64.8%) |
| Total (Category) | 1,010 (40.1%) | 1,507 (59.9%) |
| Total (Overall) | 3,660 (49.9%) | 3,670 (50.1%) |
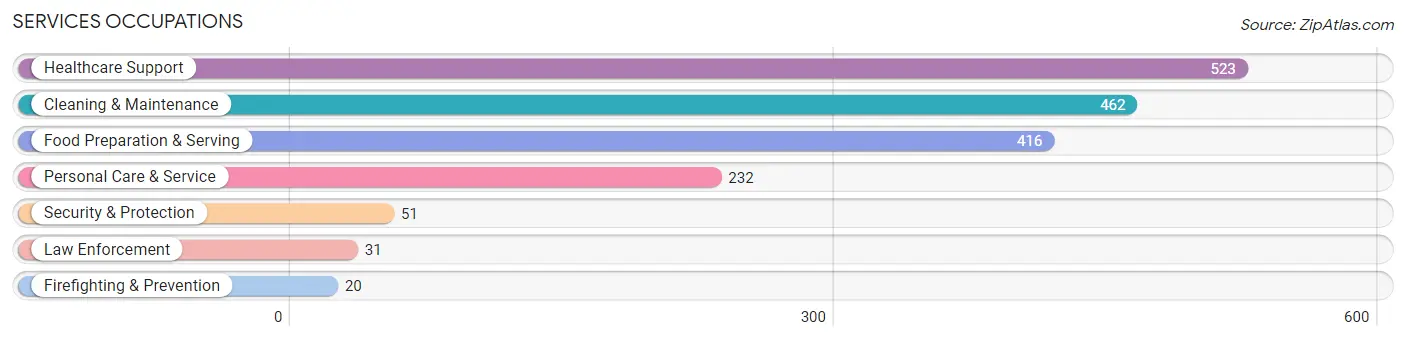
Services Occupations
The most common Services occupations in Alexandria are Healthcare Support (523 | 7.1%), Cleaning & Maintenance (462 | 6.3%), Food Preparation & Serving (416 | 5.7%), Personal Care & Service (232 | 3.2%), and Security & Protection (51 | 0.7%).
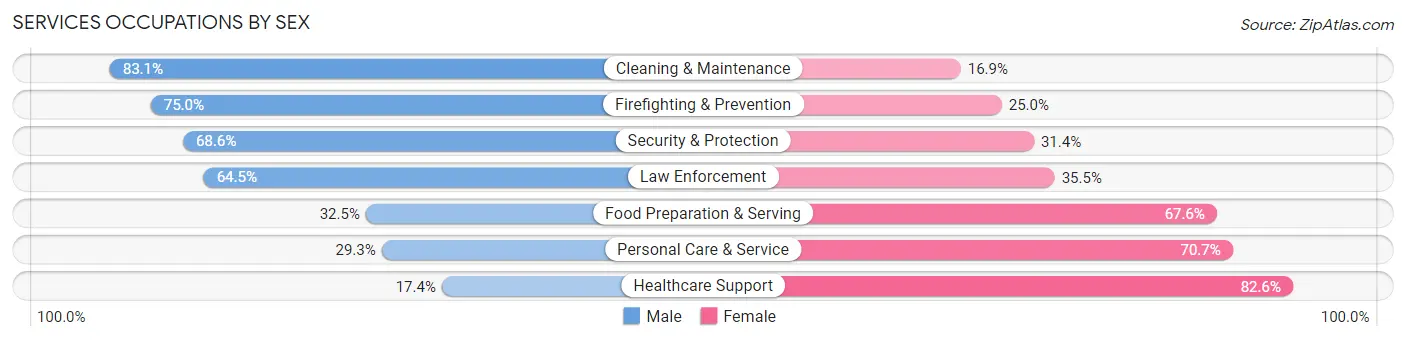
Services Occupations by Sex
Within the Services occupations in Alexandria, the most male-oriented occupations are Cleaning & Maintenance (83.1%), Firefighting & Prevention (75.0%), and Security & Protection (68.6%), while the most female-oriented occupations are Healthcare Support (82.6%), Personal Care & Service (70.7%), and Food Preparation & Serving (67.5%).
| Occupation | Male | Female |
| Healthcare Support | 91 (17.4%) | 432 (82.6%) |
| Security & Protection | 35 (68.6%) | 16 (31.4%) |
| Firefighting & Prevention | 15 (75.0%) | 5 (25.0%) |
| Law Enforcement | 20 (64.5%) | 11 (35.5%) |
| Food Preparation & Serving | 135 (32.5%) | 281 (67.5%) |
| Cleaning & Maintenance | 384 (83.1%) | 78 (16.9%) |
| Personal Care & Service | 68 (29.3%) | 164 (70.7%) |
| Total (Category) | 713 (42.3%) | 971 (57.7%) |
| Total (Overall) | 3,660 (49.9%) | 3,670 (50.1%) |
Sales and Office Occupations
The most common Sales and Office occupations in Alexandria are Sales & Related (658 | 9.0%), and Office & Administration (632 | 8.6%).
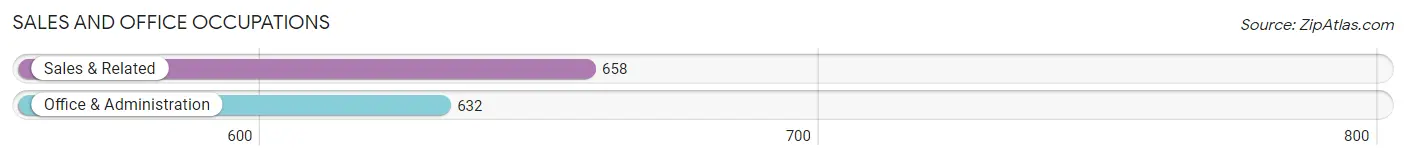
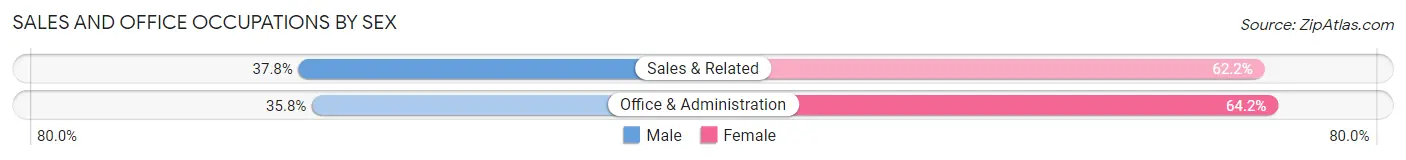
Sales and Office Occupations by Sex
| Occupation | Male | Female |
| Sales & Related | 249 (37.8%) | 409 (62.2%) |
| Office & Administration | 226 (35.8%) | 406 (64.2%) |
| Total (Category) | 475 (36.8%) | 815 (63.2%) |
| Total (Overall) | 3,660 (49.9%) | 3,670 (50.1%) |
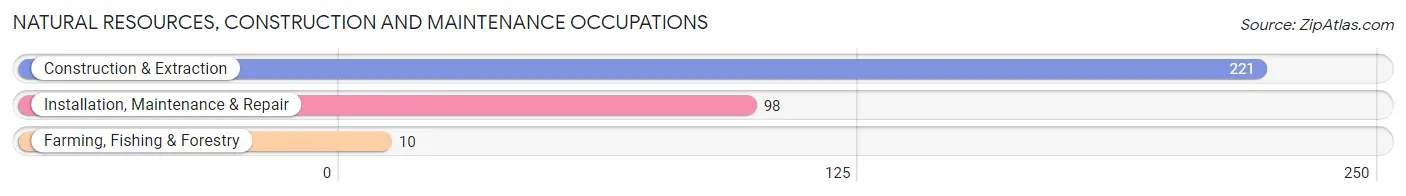
Natural Resources, Construction and Maintenance Occupations
The most common Natural Resources, Construction and Maintenance occupations in Alexandria are Construction & Extraction (221 | 3.0%), Installation, Maintenance & Repair (98 | 1.3%), and Farming, Fishing & Forestry (10 | 0.1%).
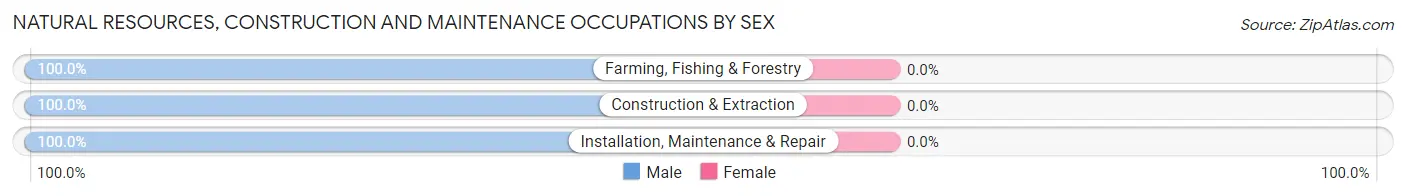
Natural Resources, Construction and Maintenance Occupations by Sex
| Occupation | Male | Female |
| Farming, Fishing & Forestry | 10 (100.0%) | 0 (0.0%) |
| Construction & Extraction | 221 (100.0%) | 0 (0.0%) |
| Installation, Maintenance & Repair | 98 (100.0%) | 0 (0.0%) |
| Total (Category) | 329 (100.0%) | 0 (0.0%) |
| Total (Overall) | 3,660 (49.9%) | 3,670 (50.1%) |
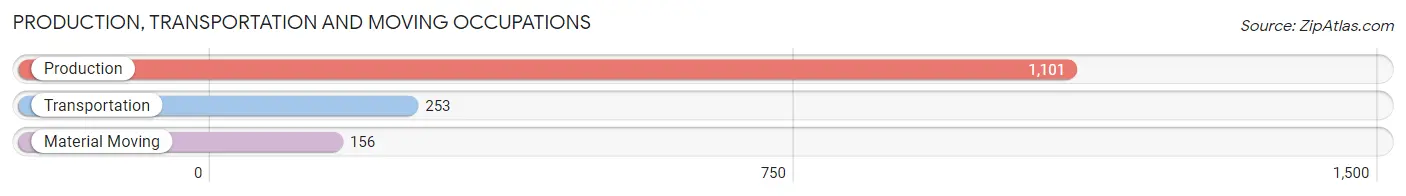
Production, Transportation and Moving Occupations
The most common Production, Transportation and Moving occupations in Alexandria are Production (1,101 | 15.0%), Transportation (253 | 3.5%), and Material Moving (156 | 2.1%).
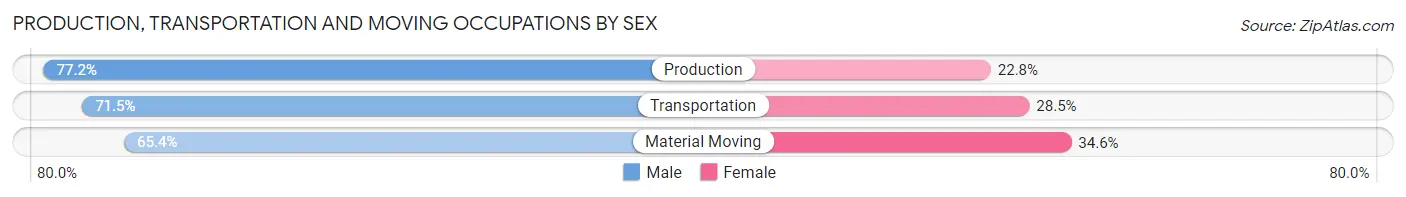
Production, Transportation and Moving Occupations by Sex
| Occupation | Male | Female |
| Production | 850 (77.2%) | 251 (22.8%) |
| Transportation | 181 (71.5%) | 72 (28.5%) |
| Material Moving | 102 (65.4%) | 54 (34.6%) |
| Total (Category) | 1,133 (75.0%) | 377 (25.0%) |
| Total (Overall) | 3,660 (49.9%) | 3,670 (50.1%) |
Employment Industries by Sex in Alexandria
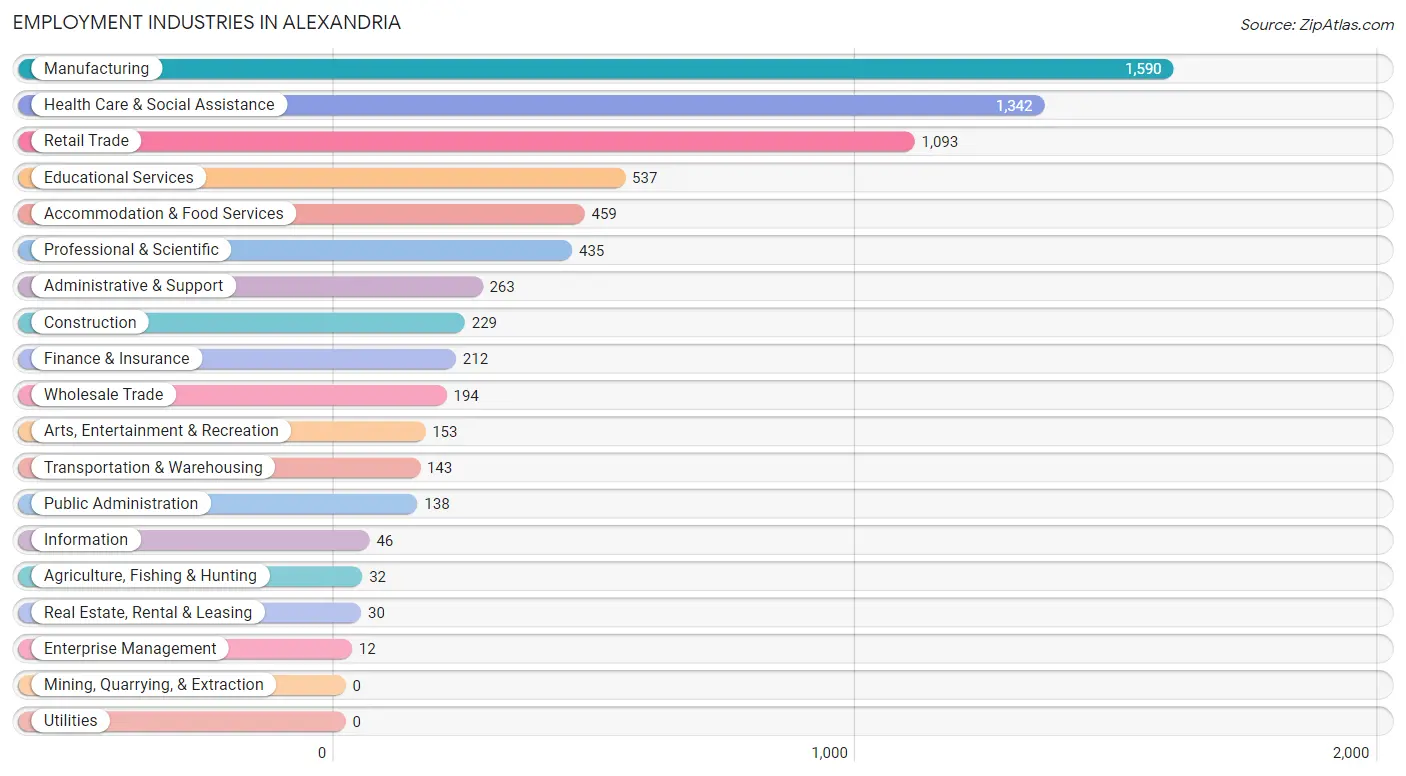
Employment Industries in Alexandria
The major employment industries in Alexandria include Manufacturing (1,590 | 21.7%), Health Care & Social Assistance (1,342 | 18.3%), Retail Trade (1,093 | 14.9%), Educational Services (537 | 7.3%), and Accommodation & Food Services (459 | 6.3%).
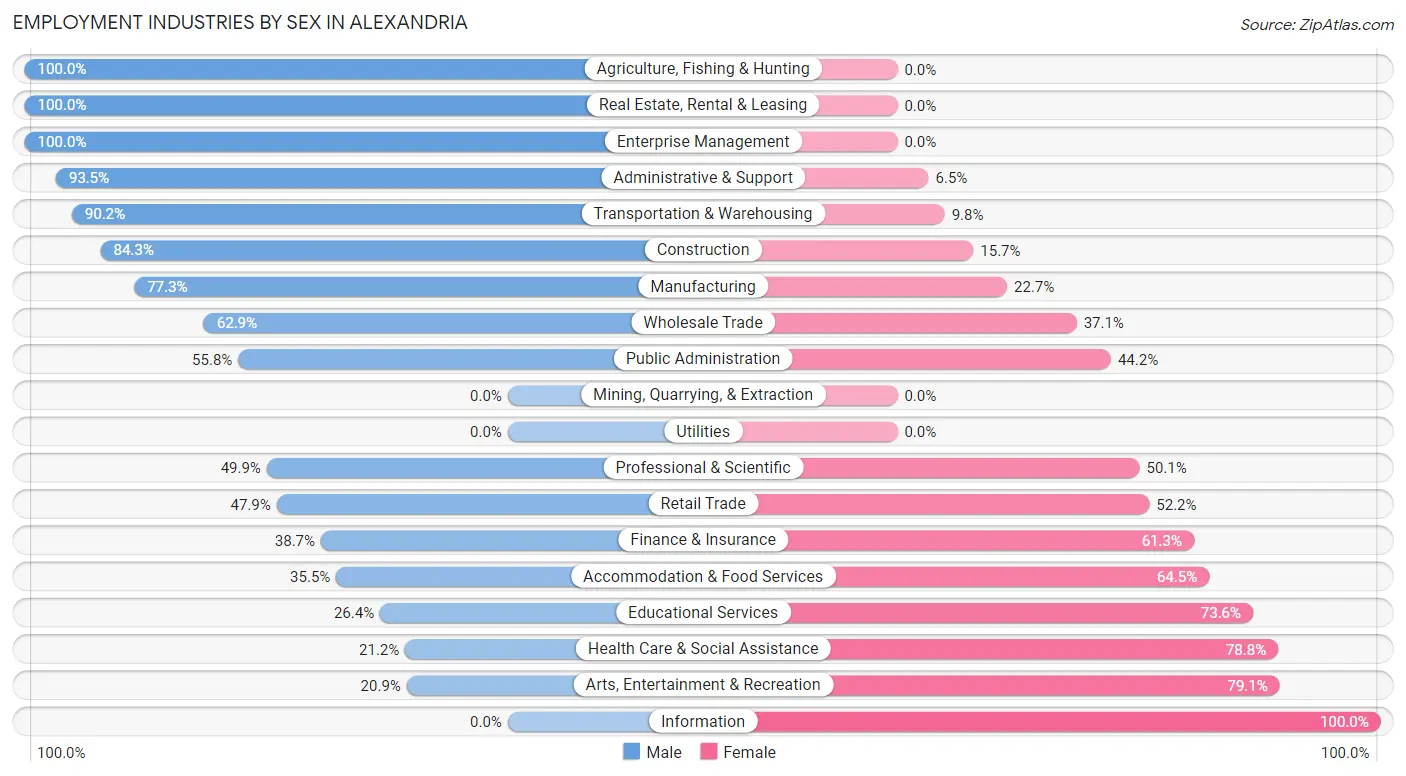
Employment Industries by Sex in Alexandria
The Alexandria industries that see more men than women are Agriculture, Fishing & Hunting (100.0%), Real Estate, Rental & Leasing (100.0%), and Enterprise Management (100.0%), whereas the industries that tend to have a higher number of women are Information (100.0%), Arts, Entertainment & Recreation (79.1%), and Health Care & Social Assistance (78.8%).
| Industry | Male | Female |
| Agriculture, Fishing & Hunting | 32 (100.0%) | 0 (0.0%) |
| Mining, Quarrying, & Extraction | 0 (0.0%) | 0 (0.0%) |
| Construction | 193 (84.3%) | 36 (15.7%) |
| Manufacturing | 1,229 (77.3%) | 361 (22.7%) |
| Wholesale Trade | 122 (62.9%) | 72 (37.1%) |
| Retail Trade | 523 (47.8%) | 570 (52.1%) |
| Transportation & Warehousing | 129 (90.2%) | 14 (9.8%) |
| Utilities | 0 (0.0%) | 0 (0.0%) |
| Information | 0 (0.0%) | 46 (100.0%) |
| Finance & Insurance | 82 (38.7%) | 130 (61.3%) |
| Real Estate, Rental & Leasing | 30 (100.0%) | 0 (0.0%) |
| Professional & Scientific | 217 (49.9%) | 218 (50.1%) |
| Enterprise Management | 12 (100.0%) | 0 (0.0%) |
| Administrative & Support | 246 (93.5%) | 17 (6.5%) |
| Educational Services | 142 (26.4%) | 395 (73.6%) |
| Health Care & Social Assistance | 285 (21.2%) | 1,057 (78.8%) |
| Arts, Entertainment & Recreation | 32 (20.9%) | 121 (79.1%) |
| Accommodation & Food Services | 163 (35.5%) | 296 (64.5%) |
| Public Administration | 77 (55.8%) | 61 (44.2%) |
| Total | 3,660 (49.9%) | 3,670 (50.1%) |
Education in Alexandria
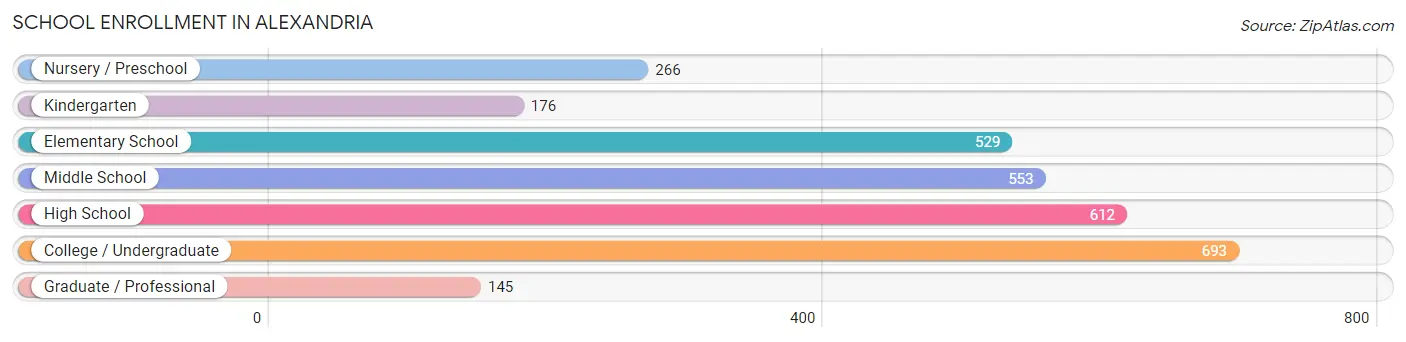
School Enrollment in Alexandria
The most common levels of schooling among the 2,974 students in Alexandria are college / undergraduate (693 | 23.3%), high school (612 | 20.6%), and middle school (553 | 18.6%).
| School Level | # Students | % Students |
| Nursery / Preschool | 266 | 8.9% |
| Kindergarten | 176 | 5.9% |
| Elementary School | 529 | 17.8% |
| Middle School | 553 | 18.6% |
| High School | 612 | 20.6% |
| College / Undergraduate | 693 | 23.3% |
| Graduate / Professional | 145 | 4.9% |
| Total | 2,974 | 100.0% |
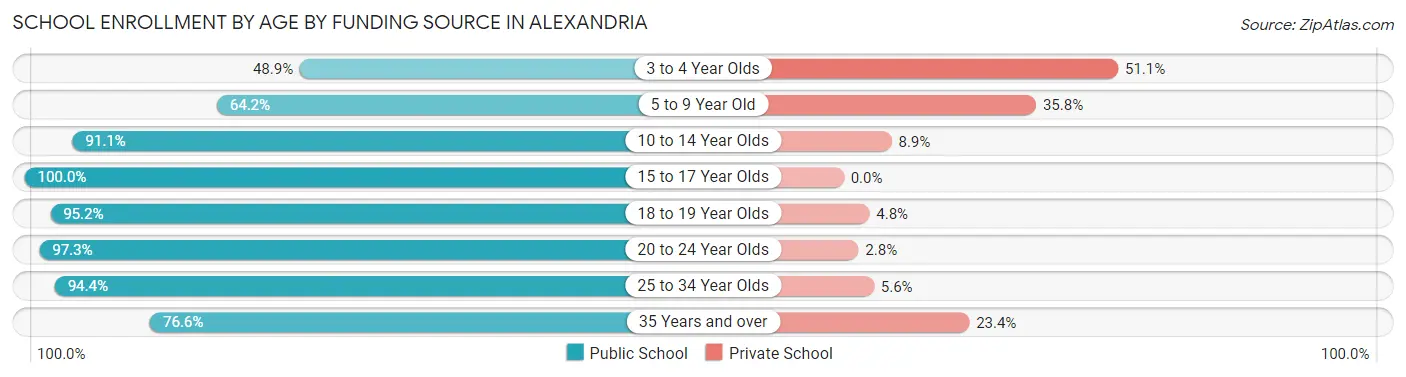
School Enrollment by Age by Funding Source in Alexandria
Out of a total of 2,974 students who are enrolled in schools in Alexandria, 446 (15.0%) attend a private institution, while the remaining 2,528 (85.0%) are enrolled in public schools. The age group of 3 to 4 year olds has the highest likelihood of being enrolled in private schools, with 46 (51.1% in the age bracket) enrolled. Conversely, the age group of 15 to 17 year olds has the lowest likelihood of being enrolled in a private school, with 388 (100.0% in the age bracket) attending a public institution.
| Age Bracket | Public School | Private School |
| 3 to 4 Year Olds | 44 (48.9%) | 46 (51.1%) |
| 5 to 9 Year Old | 507 (64.2%) | 283 (35.8%) |
| 10 to 14 Year Olds | 654 (91.1%) | 64 (8.9%) |
| 15 to 17 Year Olds | 388 (100.0%) | 0 (0.0%) |
| 18 to 19 Year Olds | 299 (95.2%) | 15 (4.8%) |
| 20 to 24 Year Olds | 425 (97.3%) | 12 (2.8%) |
| 25 to 34 Year Olds | 151 (94.4%) | 9 (5.6%) |
| 35 Years and over | 59 (76.6%) | 18 (23.4%) |
| Total | 2,528 (85.0%) | 446 (15.0%) |
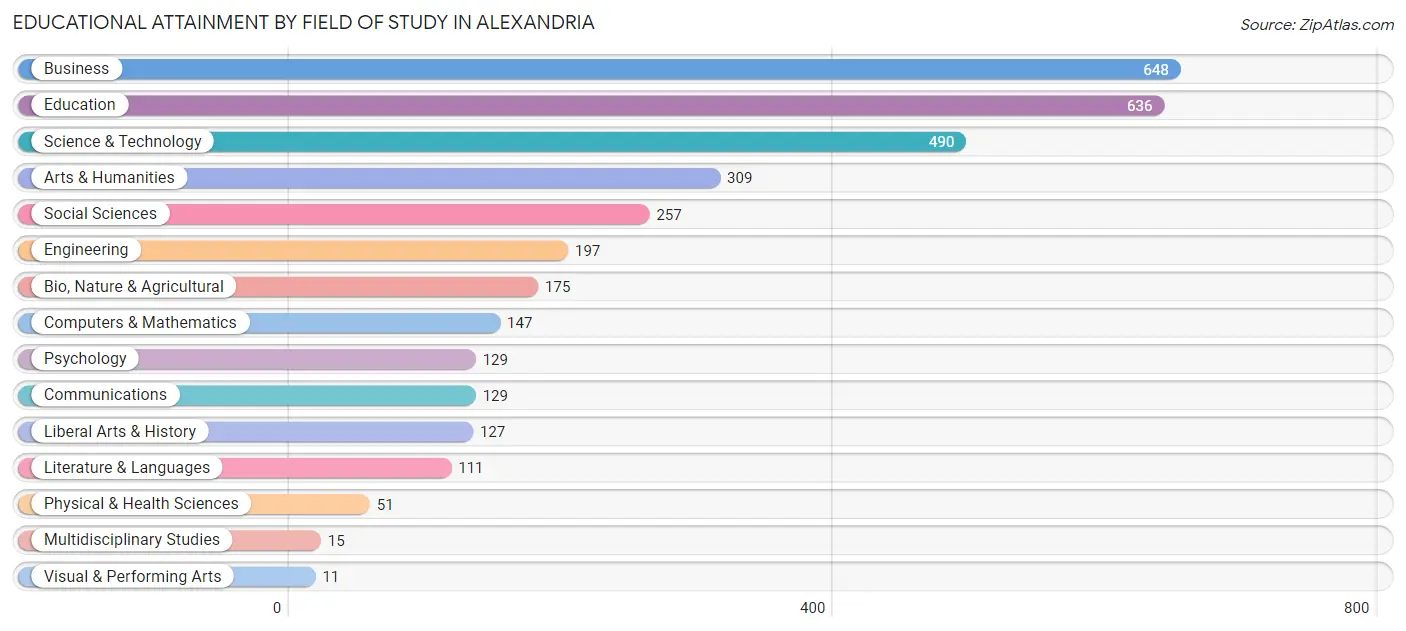
Educational Attainment by Field of Study in Alexandria
Business (648 | 18.9%), education (636 | 18.5%), science & technology (490 | 14.3%), arts & humanities (309 | 9.0%), and social sciences (257 | 7.5%) are the most common fields of study among 3,432 individuals in Alexandria who have obtained a bachelor's degree or higher.
| Field of Study | # Graduates | % Graduates |
| Computers & Mathematics | 147 | 4.3% |
| Bio, Nature & Agricultural | 175 | 5.1% |
| Physical & Health Sciences | 51 | 1.5% |
| Psychology | 129 | 3.8% |
| Social Sciences | 257 | 7.5% |
| Engineering | 197 | 5.7% |
| Multidisciplinary Studies | 15 | 0.4% |
| Science & Technology | 490 | 14.3% |
| Business | 648 | 18.9% |
| Education | 636 | 18.5% |
| Literature & Languages | 111 | 3.2% |
| Liberal Arts & History | 127 | 3.7% |
| Visual & Performing Arts | 11 | 0.3% |
| Communications | 129 | 3.8% |
| Arts & Humanities | 309 | 9.0% |
| Total | 3,432 | 100.0% |
Transportation & Commute in Alexandria
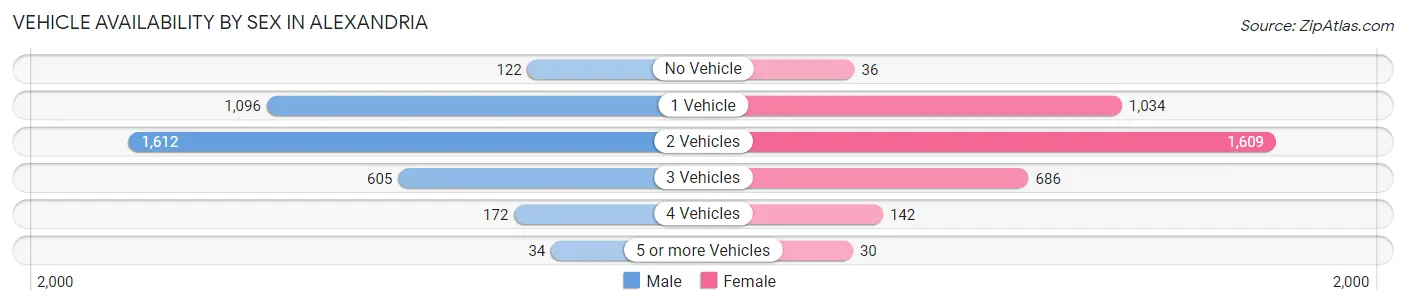
Vehicle Availability by Sex in Alexandria
The most prevalent vehicle ownership categories in Alexandria are males with 2 vehicles (1,612, accounting for 44.3%) and females with 2 vehicles (1,609, making up 45.6%).
| Vehicles Available | Male | Female |
| No Vehicle | 122 (3.4%) | 36 (1.0%) |
| 1 Vehicle | 1,096 (30.1%) | 1,034 (29.2%) |
| 2 Vehicles | 1,612 (44.3%) | 1,609 (45.5%) |
| 3 Vehicles | 605 (16.6%) | 686 (19.4%) |
| 4 Vehicles | 172 (4.7%) | 142 (4.0%) |
| 5 or more Vehicles | 34 (0.9%) | 30 (0.9%) |
| Total | 3,641 (100.0%) | 3,537 (100.0%) |
Commute Time in Alexandria
The most frequently occuring commute durations in Alexandria are 5 to 9 minutes (2,074 commuters, 31.0%), 10 to 14 minutes (1,660 commuters, 24.8%), and 15 to 19 minutes (1,080 commuters, 16.1%).
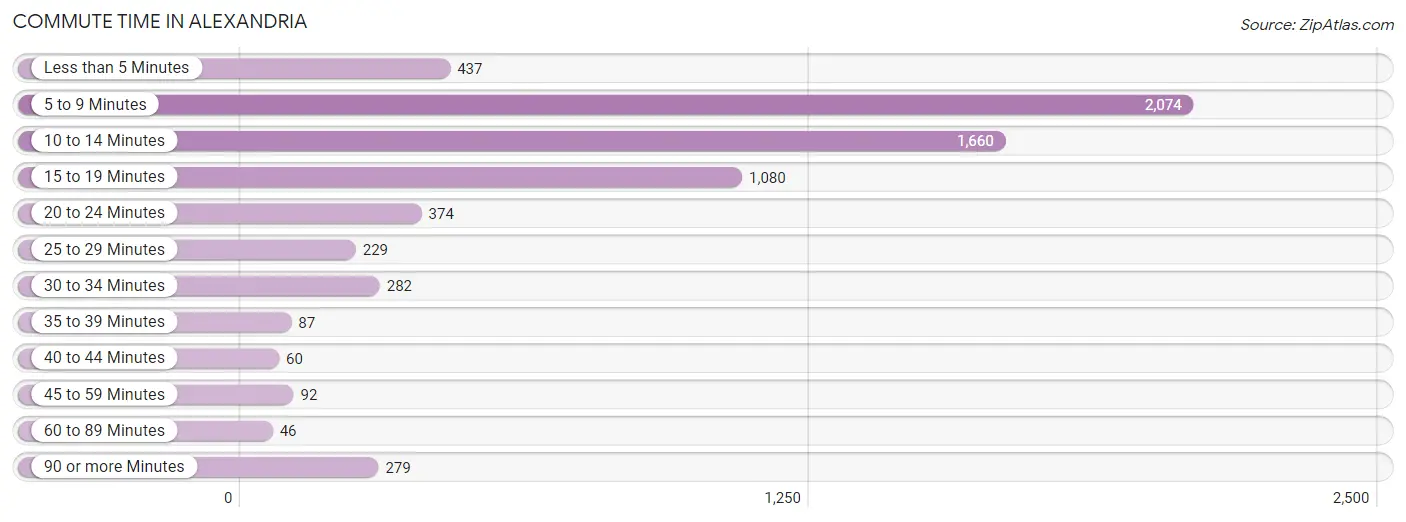
| Commute Time | # Commuters | % Commuters |
| Less than 5 Minutes | 437 | 6.5% |
| 5 to 9 Minutes | 2,074 | 31.0% |
| 10 to 14 Minutes | 1,660 | 24.8% |
| 15 to 19 Minutes | 1,080 | 16.1% |
| 20 to 24 Minutes | 374 | 5.6% |
| 25 to 29 Minutes | 229 | 3.4% |
| 30 to 34 Minutes | 282 | 4.2% |
| 35 to 39 Minutes | 87 | 1.3% |
| 40 to 44 Minutes | 60 | 0.9% |
| 45 to 59 Minutes | 92 | 1.4% |
| 60 to 89 Minutes | 46 | 0.7% |
| 90 or more Minutes | 279 | 4.2% |
Commute Time by Sex in Alexandria
The most common commute times in Alexandria are 5 to 9 minutes (1,118 commuters, 32.5%) for males and 5 to 9 minutes (956 commuters, 29.3%) for females.
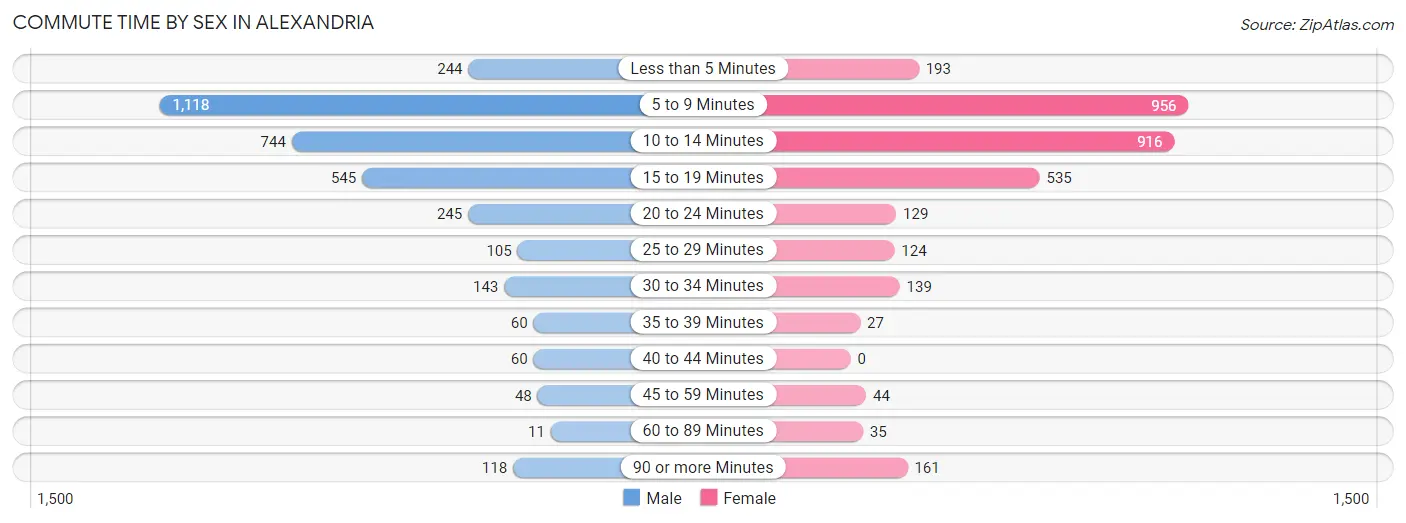
| Commute Time | Male | Female |
| Less than 5 Minutes | 244 (7.1%) | 193 (5.9%) |
| 5 to 9 Minutes | 1,118 (32.5%) | 956 (29.3%) |
| 10 to 14 Minutes | 744 (21.6%) | 916 (28.1%) |
| 15 to 19 Minutes | 545 (15.8%) | 535 (16.4%) |
| 20 to 24 Minutes | 245 (7.1%) | 129 (4.0%) |
| 25 to 29 Minutes | 105 (3.0%) | 124 (3.8%) |
| 30 to 34 Minutes | 143 (4.2%) | 139 (4.3%) |
| 35 to 39 Minutes | 60 (1.7%) | 27 (0.8%) |
| 40 to 44 Minutes | 60 (1.7%) | 0 (0.0%) |
| 45 to 59 Minutes | 48 (1.4%) | 44 (1.3%) |
| 60 to 89 Minutes | 11 (0.3%) | 35 (1.1%) |
| 90 or more Minutes | 118 (3.4%) | 161 (4.9%) |
Time of Departure to Work by Sex in Alexandria
The most frequent times of departure to work in Alexandria are 6:30 AM to 6:59 AM (530, 15.4%) for males and 7:30 AM to 7:59 AM (836, 25.7%) for females.
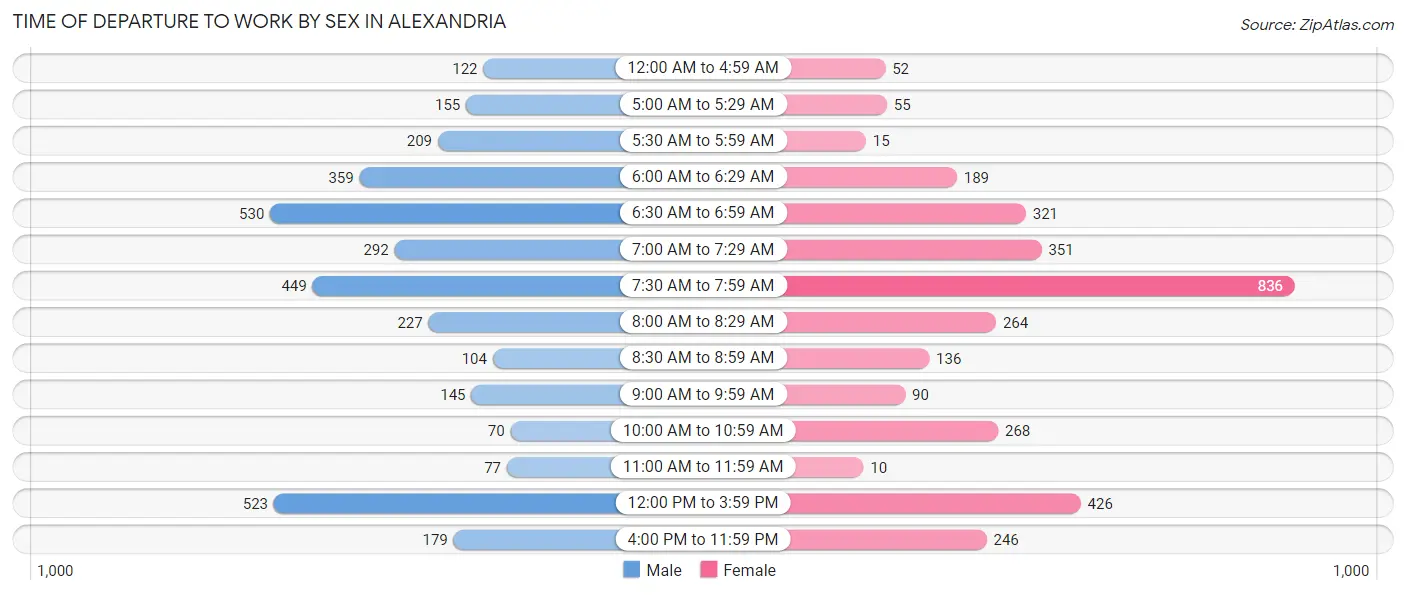
| Time of Departure | Male | Female |
| 12:00 AM to 4:59 AM | 122 (3.5%) | 52 (1.6%) |
| 5:00 AM to 5:29 AM | 155 (4.5%) | 55 (1.7%) |
| 5:30 AM to 5:59 AM | 209 (6.1%) | 15 (0.5%) |
| 6:00 AM to 6:29 AM | 359 (10.4%) | 189 (5.8%) |
| 6:30 AM to 6:59 AM | 530 (15.4%) | 321 (9.9%) |
| 7:00 AM to 7:29 AM | 292 (8.5%) | 351 (10.8%) |
| 7:30 AM to 7:59 AM | 449 (13.1%) | 836 (25.7%) |
| 8:00 AM to 8:29 AM | 227 (6.6%) | 264 (8.1%) |
| 8:30 AM to 8:59 AM | 104 (3.0%) | 136 (4.2%) |
| 9:00 AM to 9:59 AM | 145 (4.2%) | 90 (2.8%) |
| 10:00 AM to 10:59 AM | 70 (2.0%) | 268 (8.2%) |
| 11:00 AM to 11:59 AM | 77 (2.2%) | 10 (0.3%) |
| 12:00 PM to 3:59 PM | 523 (15.2%) | 426 (13.1%) |
| 4:00 PM to 11:59 PM | 179 (5.2%) | 246 (7.5%) |
| Total | 3,441 (100.0%) | 3,259 (100.0%) |
Housing Occupancy in Alexandria
Occupancy by Ownership in Alexandria
Of the total 6,960 dwellings in Alexandria, owner-occupied units account for 3,845 (55.2%), while renter-occupied units make up 3,115 (44.8%).
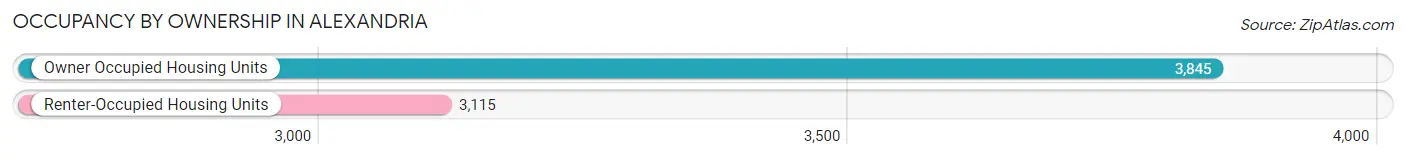
| Occupancy | # Housing Units | % Housing Units |
| Owner Occupied Housing Units | 3,845 | 55.2% |
| Renter-Occupied Housing Units | 3,115 | 44.8% |
| Total Occupied Housing Units | 6,960 | 100.0% |
Occupancy by Household Size in Alexandria
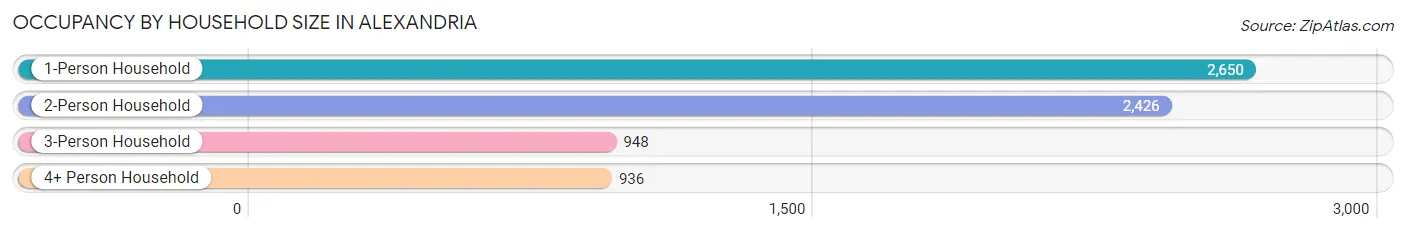
| Household Size | # Housing Units | % Housing Units |
| 1-Person Household | 2,650 | 38.1% |
| 2-Person Household | 2,426 | 34.9% |
| 3-Person Household | 948 | 13.6% |
| 4+ Person Household | 936 | 13.5% |
| Total Housing Units | 6,960 | 100.0% |
Occupancy by Ownership by Household Size in Alexandria
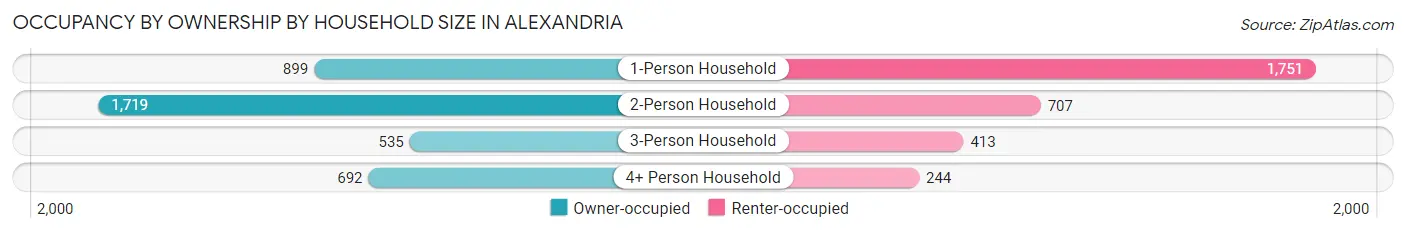
| Household Size | Owner-occupied | Renter-occupied |
| 1-Person Household | 899 (33.9%) | 1,751 (66.1%) |
| 2-Person Household | 1,719 (70.9%) | 707 (29.1%) |
| 3-Person Household | 535 (56.4%) | 413 (43.6%) |
| 4+ Person Household | 692 (73.9%) | 244 (26.1%) |
| Total Housing Units | 3,845 (55.2%) | 3,115 (44.8%) |
Occupancy by Educational Attainment in Alexandria
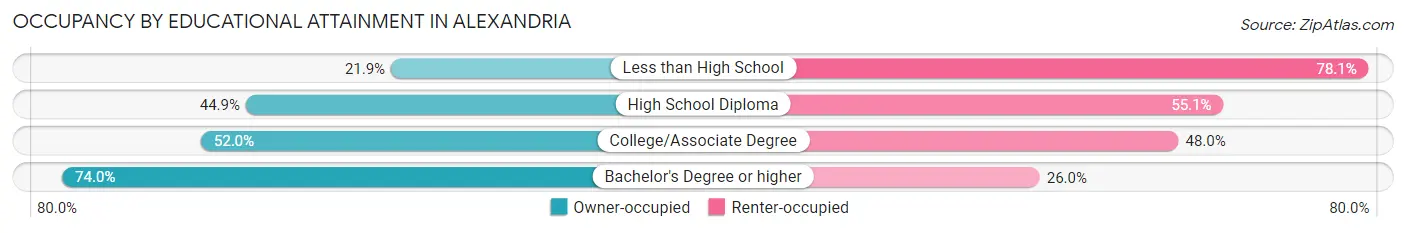
| Household Size | Owner-occupied | Renter-occupied |
| Less than High School | 81 (21.9%) | 289 (78.1%) |
| High School Diploma | 814 (44.9%) | 998 (55.1%) |
| College/Associate Degree | 1,390 (52.0%) | 1,281 (48.0%) |
| Bachelor's Degree or higher | 1,560 (74.0%) | 547 (26.0%) |
Occupancy by Age of Householder in Alexandria
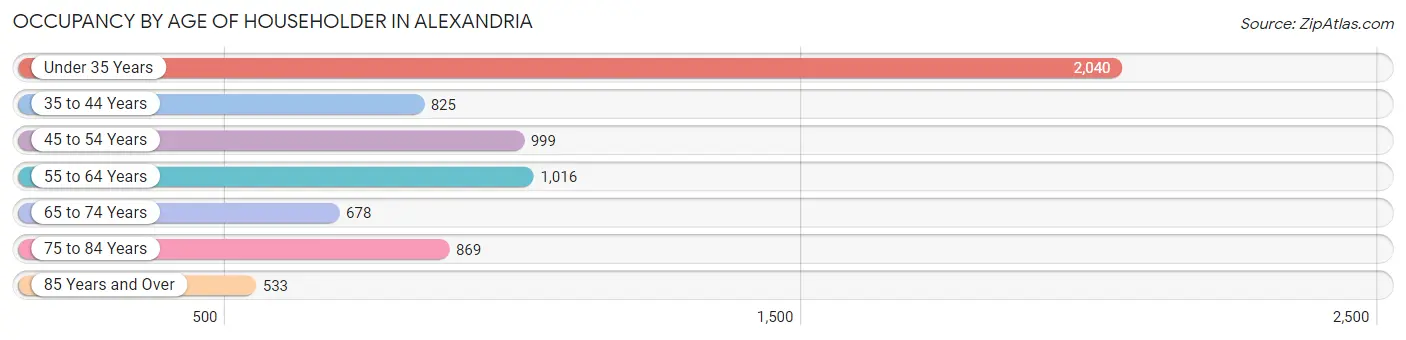
| Age Bracket | # Households | % Households |
| Under 35 Years | 2,040 | 29.3% |
| 35 to 44 Years | 825 | 11.8% |
| 45 to 54 Years | 999 | 14.3% |
| 55 to 64 Years | 1,016 | 14.6% |
| 65 to 74 Years | 678 | 9.7% |
| 75 to 84 Years | 869 | 12.5% |
| 85 Years and Over | 533 | 7.7% |
| Total | 6,960 | 100.0% |
Housing Finances in Alexandria
Median Income by Occupancy in Alexandria
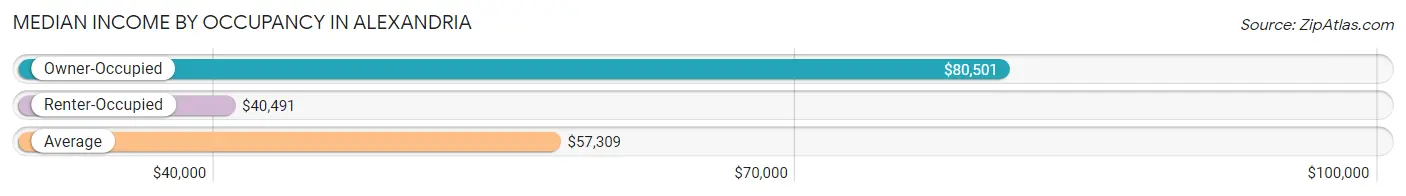
| Occupancy Type | # Households | Median Income |
| Owner-Occupied | 3,845 (55.2%) | $80,501 |
| Renter-Occupied | 3,115 (44.8%) | $40,491 |
| Average | 6,960 (100.0%) | $57,309 |
Occupancy by Householder Income Bracket in Alexandria
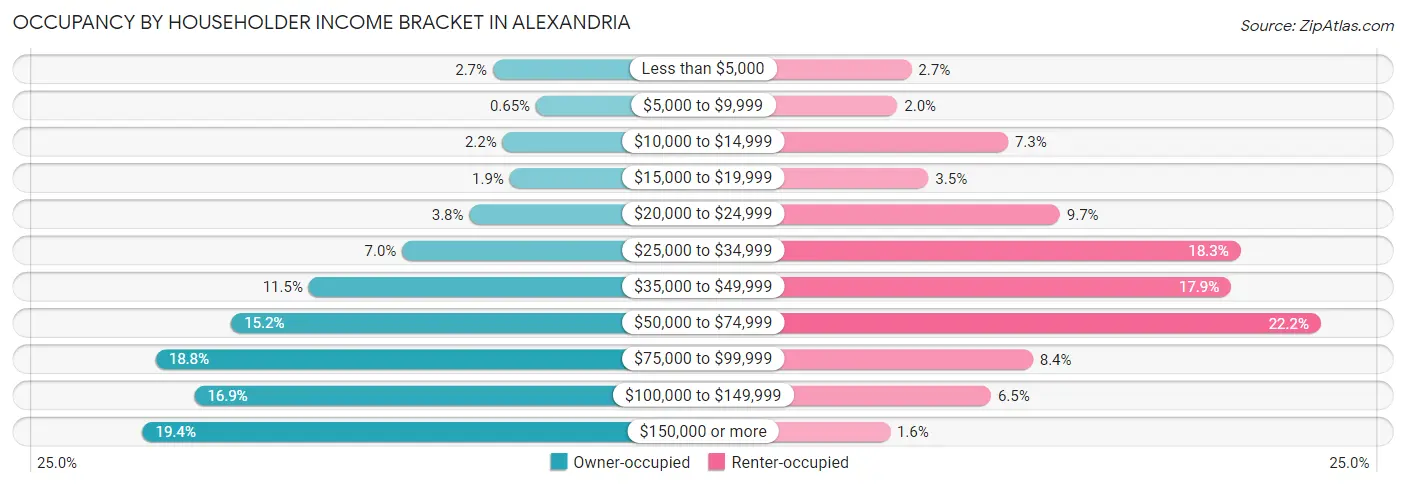
| Income Bracket | Owner-occupied | Renter-occupied |
| Less than $5,000 | 104 (2.7%) | 83 (2.7%) |
| $5,000 to $9,999 | 25 (0.6%) | 62 (2.0%) |
| $10,000 to $14,999 | 86 (2.2%) | 226 (7.3%) |
| $15,000 to $19,999 | 73 (1.9%) | 108 (3.5%) |
| $20,000 to $24,999 | 147 (3.8%) | 303 (9.7%) |
| $25,000 to $34,999 | 270 (7.0%) | 571 (18.3%) |
| $35,000 to $49,999 | 441 (11.5%) | 557 (17.9%) |
| $50,000 to $74,999 | 583 (15.2%) | 690 (22.2%) |
| $75,000 to $99,999 | 721 (18.8%) | 263 (8.4%) |
| $100,000 to $149,999 | 650 (16.9%) | 201 (6.5%) |
| $150,000 or more | 745 (19.4%) | 51 (1.6%) |
| Total | 3,845 (100.0%) | 3,115 (100.0%) |
Monthly Housing Cost Tiers in Alexandria
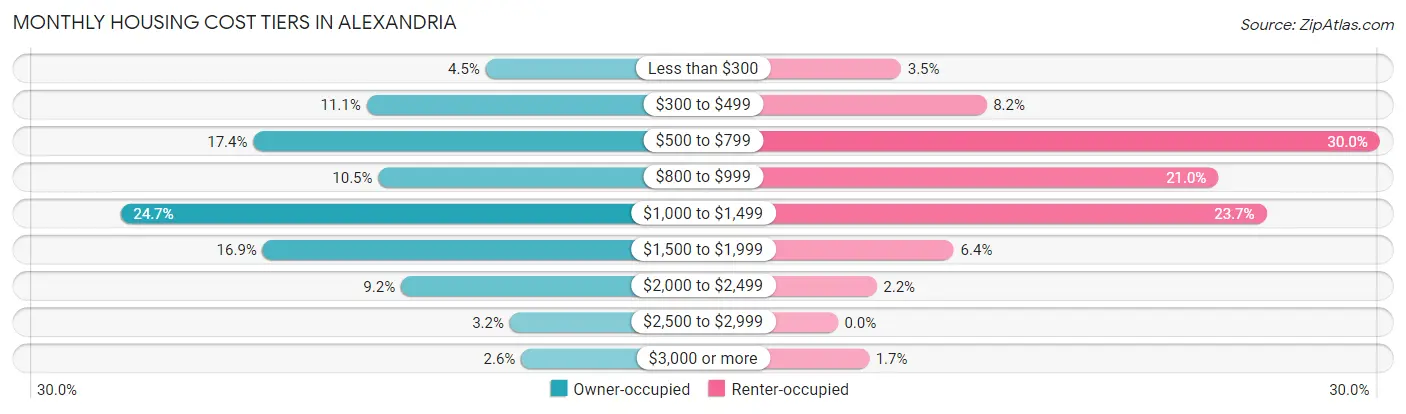
| Monthly Cost | Owner-occupied | Renter-occupied |
| Less than $300 | 174 (4.5%) | 109 (3.5%) |
| $300 to $499 | 427 (11.1%) | 256 (8.2%) |
| $500 to $799 | 668 (17.4%) | 933 (29.9%) |
| $800 to $999 | 402 (10.5%) | 655 (21.0%) |
| $1,000 to $1,499 | 950 (24.7%) | 738 (23.7%) |
| $1,500 to $1,999 | 648 (16.9%) | 200 (6.4%) |
| $2,000 to $2,499 | 354 (9.2%) | 67 (2.1%) |
| $2,500 to $2,999 | 123 (3.2%) | 0 (0.0%) |
| $3,000 or more | 99 (2.6%) | 54 (1.7%) |
| Total | 3,845 (100.0%) | 3,115 (100.0%) |
Physical Housing Characteristics in Alexandria
Housing Structures in Alexandria
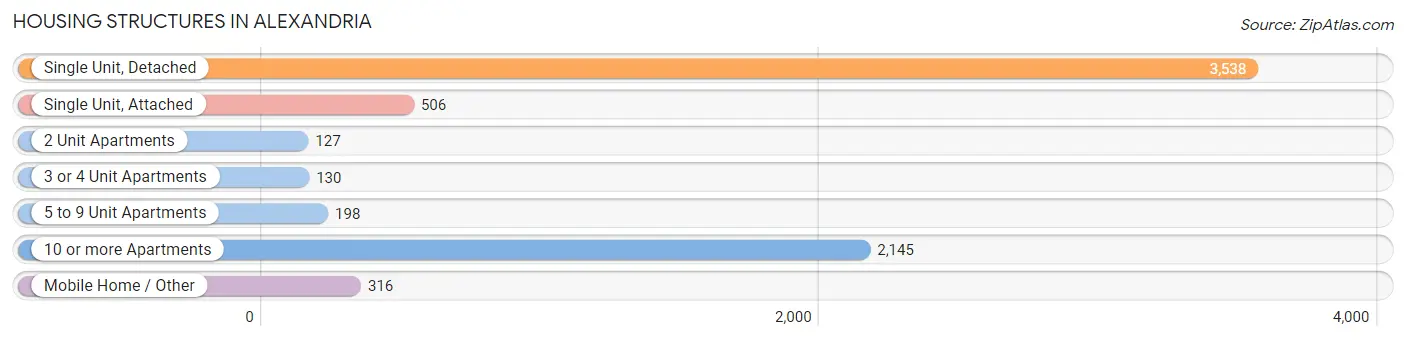
| Structure Type | # Housing Units | % Housing Units |
| Single Unit, Detached | 3,538 | 50.8% |
| Single Unit, Attached | 506 | 7.3% |
| 2 Unit Apartments | 127 | 1.8% |
| 3 or 4 Unit Apartments | 130 | 1.9% |
| 5 to 9 Unit Apartments | 198 | 2.8% |
| 10 or more Apartments | 2,145 | 30.8% |
| Mobile Home / Other | 316 | 4.5% |
| Total | 6,960 | 100.0% |
Housing Structures by Occupancy in Alexandria
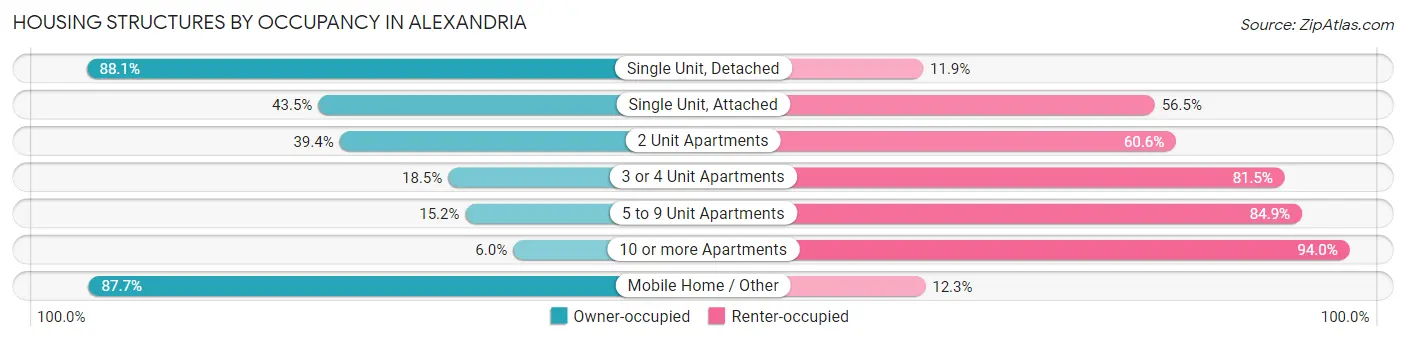
| Structure Type | Owner-occupied | Renter-occupied |
| Single Unit, Detached | 3,116 (88.1%) | 422 (11.9%) |
| Single Unit, Attached | 220 (43.5%) | 286 (56.5%) |
| 2 Unit Apartments | 50 (39.4%) | 77 (60.6%) |
| 3 or 4 Unit Apartments | 24 (18.5%) | 106 (81.5%) |
| 5 to 9 Unit Apartments | 30 (15.1%) | 168 (84.9%) |
| 10 or more Apartments | 128 (6.0%) | 2,017 (94.0%) |
| Mobile Home / Other | 277 (87.7%) | 39 (12.3%) |
| Total | 3,845 (55.2%) | 3,115 (44.8%) |
Housing Structures by Number of Rooms in Alexandria
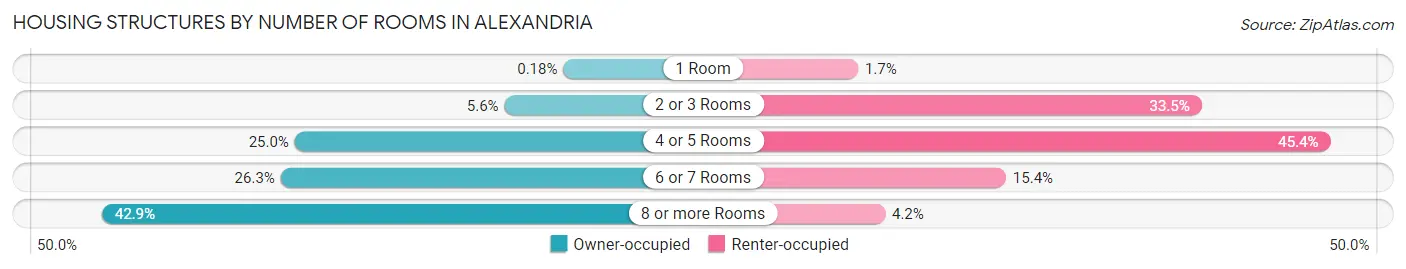
| Number of Rooms | Owner-occupied | Renter-occupied |
| 1 Room | 7 (0.2%) | 52 (1.7%) |
| 2 or 3 Rooms | 216 (5.6%) | 1,042 (33.5%) |
| 4 or 5 Rooms | 962 (25.0%) | 1,413 (45.4%) |
| 6 or 7 Rooms | 1,012 (26.3%) | 478 (15.3%) |
| 8 or more Rooms | 1,648 (42.9%) | 130 (4.2%) |
| Total | 3,845 (100.0%) | 3,115 (100.0%) |
Housing Structure by Heating Type in Alexandria
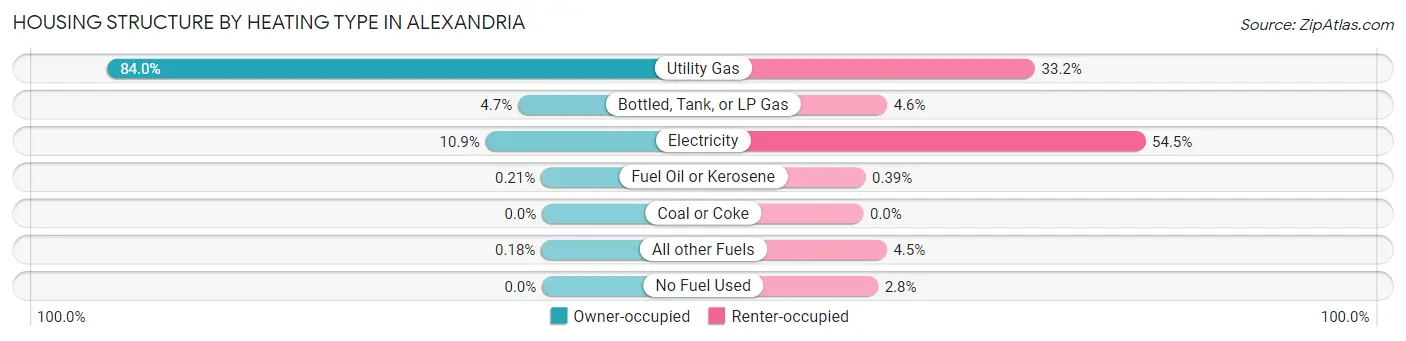
| Heating Type | Owner-occupied | Renter-occupied |
| Utility Gas | 3,231 (84.0%) | 1,033 (33.2%) |
| Bottled, Tank, or LP Gas | 179 (4.7%) | 143 (4.6%) |
| Electricity | 420 (10.9%) | 1,698 (54.5%) |
| Fuel Oil or Kerosene | 8 (0.2%) | 12 (0.4%) |
| Coal or Coke | 0 (0.0%) | 0 (0.0%) |
| All other Fuels | 7 (0.2%) | 141 (4.5%) |
| No Fuel Used | 0 (0.0%) | 88 (2.8%) |
| Total | 3,845 (100.0%) | 3,115 (100.0%) |
Household Vehicle Usage in Alexandria
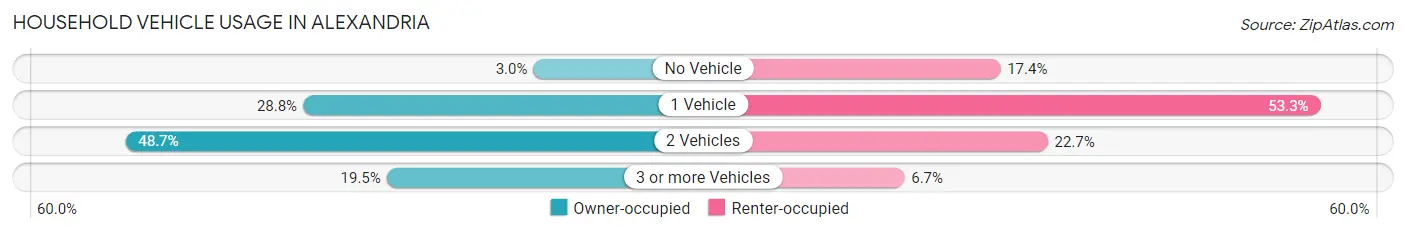
| Vehicles per Household | Owner-occupied | Renter-occupied |
| No Vehicle | 116 (3.0%) | 542 (17.4%) |
| 1 Vehicle | 1,108 (28.8%) | 1,659 (53.3%) |
| 2 Vehicles | 1,873 (48.7%) | 707 (22.7%) |
| 3 or more Vehicles | 748 (19.5%) | 207 (6.7%) |
| Total | 3,845 (100.0%) | 3,115 (100.0%) |
Real Estate & Mortgages in Alexandria
Real Estate and Mortgage Overview in Alexandria
| Characteristic | Without Mortgage | With Mortgage |
| Housing Units | 1,374 | 2,471 |
| Median Property Value | $219,900 | $236,600 |
| Median Household Income | $57,714 | $608 |
| Monthly Housing Costs | $546 | $99 |
| Real Estate Taxes | $2,004 | $45 |
Property Value by Mortgage Status in Alexandria
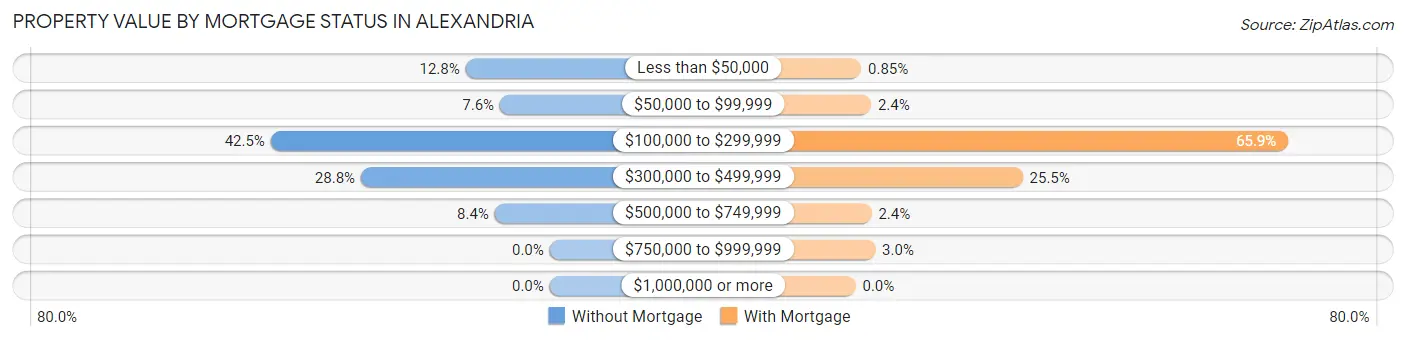
| Property Value | Without Mortgage | With Mortgage |
| Less than $50,000 | 176 (12.8%) | 21 (0.9%) |
| $50,000 to $99,999 | 104 (7.6%) | 58 (2.4%) |
| $100,000 to $299,999 | 584 (42.5%) | 1,629 (65.9%) |
| $300,000 to $499,999 | 395 (28.7%) | 629 (25.5%) |
| $500,000 to $749,999 | 115 (8.4%) | 60 (2.4%) |
| $750,000 to $999,999 | 0 (0.0%) | 74 (3.0%) |
| $1,000,000 or more | 0 (0.0%) | 0 (0.0%) |
| Total | 1,374 (100.0%) | 2,471 (100.0%) |
Household Income by Mortgage Status in Alexandria
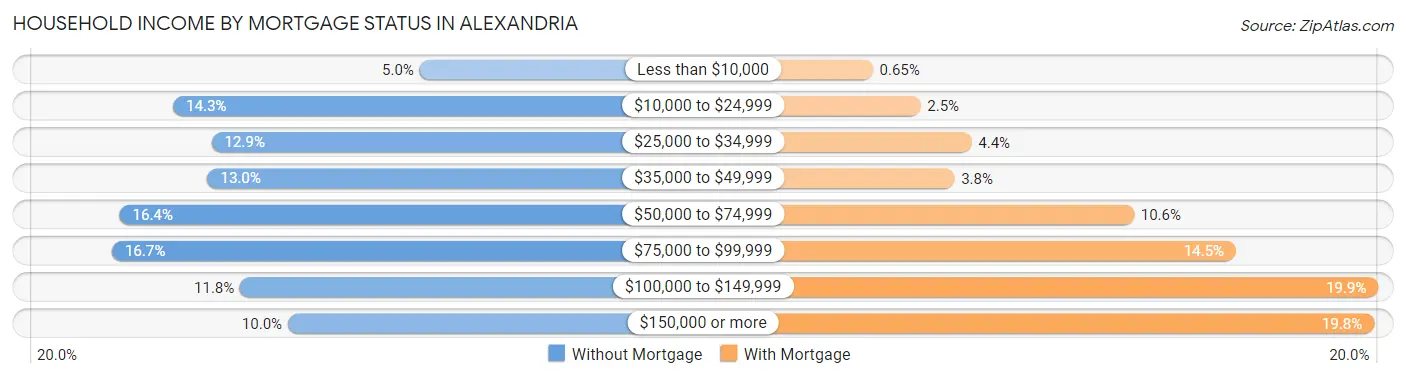
| Household Income | Without Mortgage | With Mortgage |
| Less than $10,000 | 68 (5.0%) | 16 (0.6%) |
| $10,000 to $24,999 | 197 (14.3%) | 61 (2.5%) |
| $25,000 to $34,999 | 177 (12.9%) | 109 (4.4%) |
| $35,000 to $49,999 | 179 (13.0%) | 93 (3.8%) |
| $50,000 to $74,999 | 225 (16.4%) | 262 (10.6%) |
| $75,000 to $99,999 | 229 (16.7%) | 358 (14.5%) |
| $100,000 to $149,999 | 162 (11.8%) | 492 (19.9%) |
| $150,000 or more | 137 (10.0%) | 488 (19.8%) |
| Total | 1,374 (100.0%) | 2,471 (100.0%) |
Property Value to Household Income Ratio in Alexandria
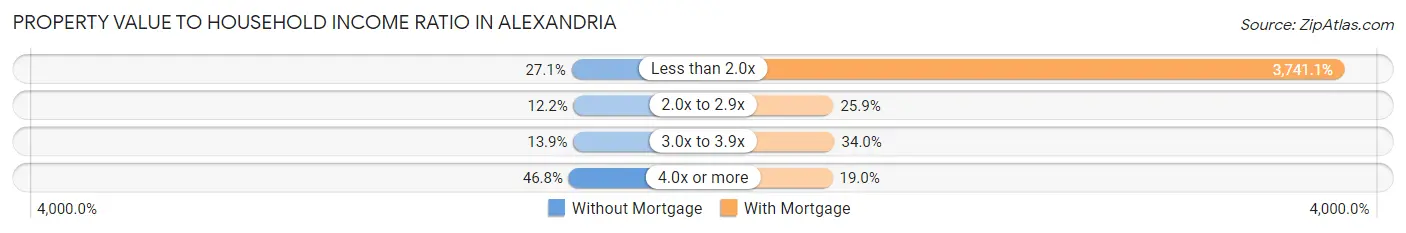
| Value-to-Income Ratio | Without Mortgage | With Mortgage |
| Less than 2.0x | 372 (27.1%) | 92,443 (3,741.1%) |
| 2.0x to 2.9x | 168 (12.2%) | 640 (25.9%) |
| 3.0x to 3.9x | 191 (13.9%) | 840 (34.0%) |
| 4.0x or more | 643 (46.8%) | 470 (19.0%) |
| Total | 1,374 (100.0%) | 2,471 (100.0%) |
Real Estate Taxes by Mortgage Status in Alexandria
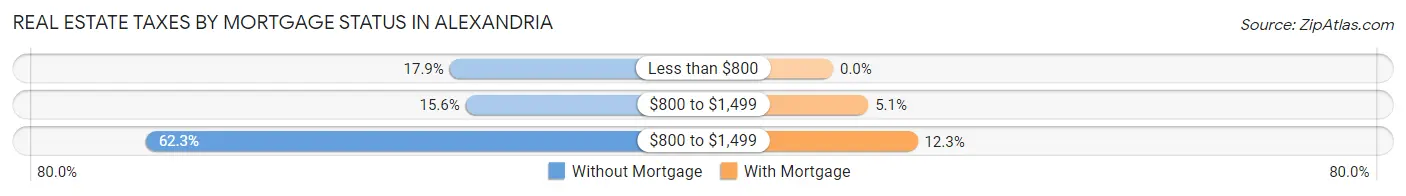
| Property Taxes | Without Mortgage | With Mortgage |
| Less than $800 | 246 (17.9%) | 0 (0.0%) |
| $800 to $1,499 | 214 (15.6%) | 127 (5.1%) |
| $800 to $1,499 | 856 (62.3%) | 305 (12.3%) |
| Total | 1,374 (100.0%) | 2,471 (100.0%) |
Health & Disability in Alexandria
Health Insurance Coverage by Age in Alexandria
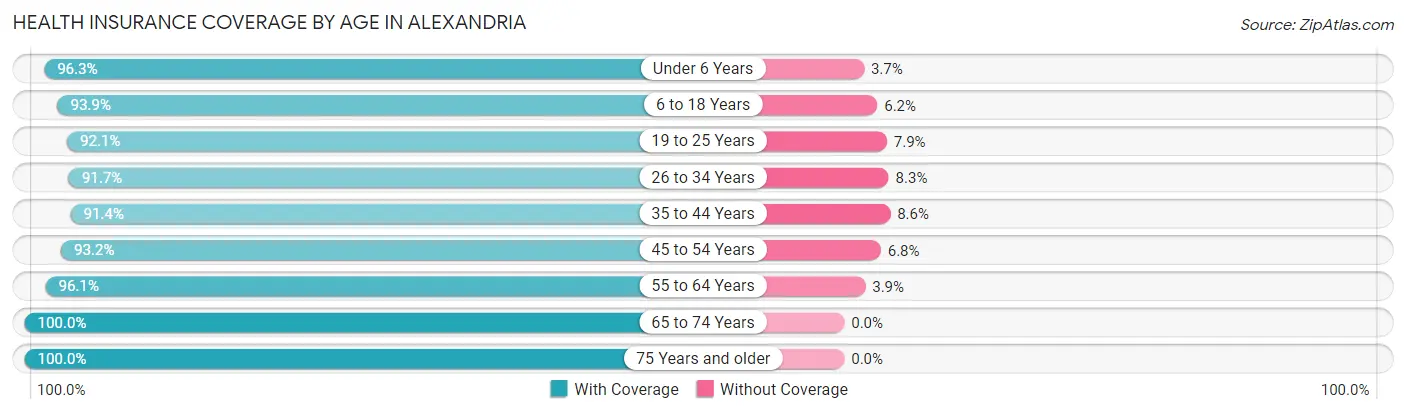
| Age Bracket | With Coverage | Without Coverage |
| Under 6 Years | 1,180 (96.3%) | 45 (3.7%) |
| 6 to 18 Years | 1,771 (93.9%) | 116 (6.1%) |
| 19 to 25 Years | 1,439 (92.1%) | 124 (7.9%) |
| 26 to 34 Years | 1,697 (91.7%) | 153 (8.3%) |
| 35 to 44 Years | 1,301 (91.4%) | 122 (8.6%) |
| 45 to 54 Years | 1,248 (93.2%) | 91 (6.8%) |
| 55 to 64 Years | 1,647 (96.1%) | 67 (3.9%) |
| 65 to 74 Years | 1,118 (100.0%) | 0 (0.0%) |
| 75 Years and older | 1,863 (100.0%) | 0 (0.0%) |
| Total | 13,264 (94.9%) | 718 (5.1%) |
Health Insurance Coverage by Citizenship Status in Alexandria
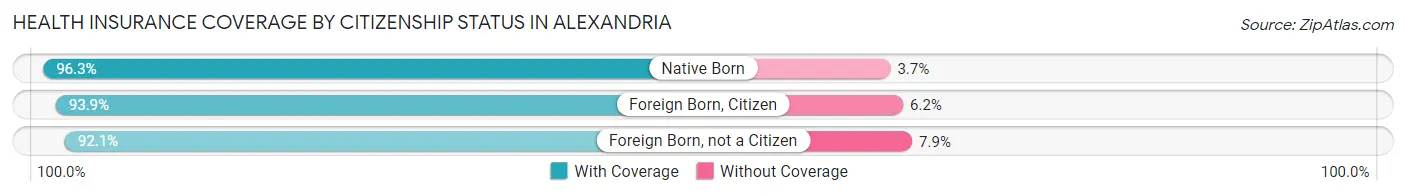
| Citizenship Status | With Coverage | Without Coverage |
| Native Born | 1,180 (96.3%) | 45 (3.7%) |
| Foreign Born, Citizen | 1,771 (93.9%) | 116 (6.1%) |
| Foreign Born, not a Citizen | 1,439 (92.1%) | 124 (7.9%) |
Health Insurance Coverage by Household Income in Alexandria
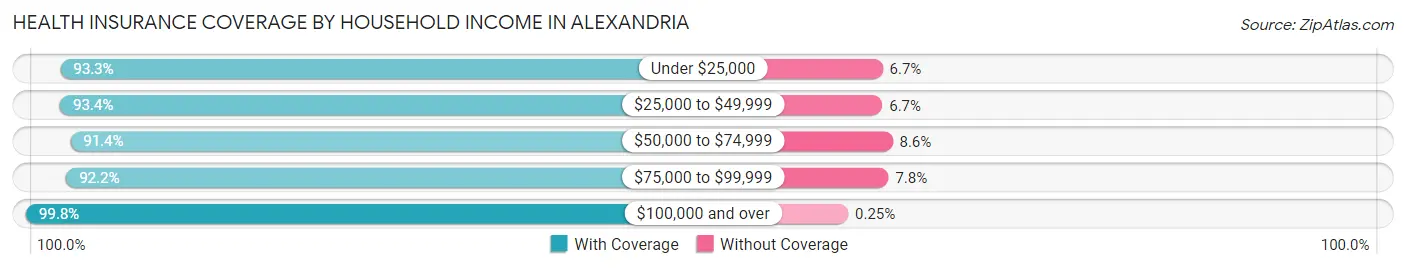
| Household Income | With Coverage | Without Coverage |
| Under $25,000 | 1,515 (93.3%) | 109 (6.7%) |
| $25,000 to $49,999 | 3,103 (93.3%) | 221 (6.7%) |
| $50,000 to $74,999 | 2,134 (91.4%) | 200 (8.6%) |
| $75,000 to $99,999 | 2,018 (92.2%) | 171 (7.8%) |
| $100,000 and over | 4,348 (99.8%) | 11 (0.3%) |
Public vs Private Health Insurance Coverage by Age in Alexandria
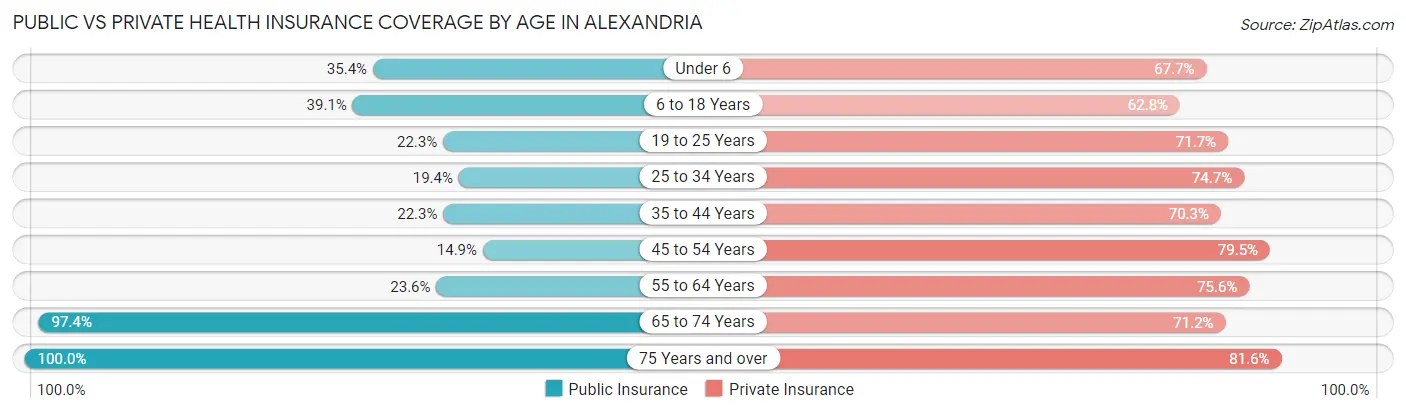
| Age Bracket | Public Insurance | Private Insurance |
| Under 6 | 433 (35.3%) | 829 (67.7%) |
| 6 to 18 Years | 738 (39.1%) | 1,184 (62.7%) |
| 19 to 25 Years | 349 (22.3%) | 1,120 (71.7%) |
| 25 to 34 Years | 359 (19.4%) | 1,381 (74.7%) |
| 35 to 44 Years | 317 (22.3%) | 1,001 (70.3%) |
| 45 to 54 Years | 200 (14.9%) | 1,064 (79.5%) |
| 55 to 64 Years | 404 (23.6%) | 1,296 (75.6%) |
| 65 to 74 Years | 1,089 (97.4%) | 796 (71.2%) |
| 75 Years and over | 1,863 (100.0%) | 1,520 (81.6%) |
| Total | 5,752 (41.1%) | 10,191 (72.9%) |
Disability Status by Sex by Age in Alexandria
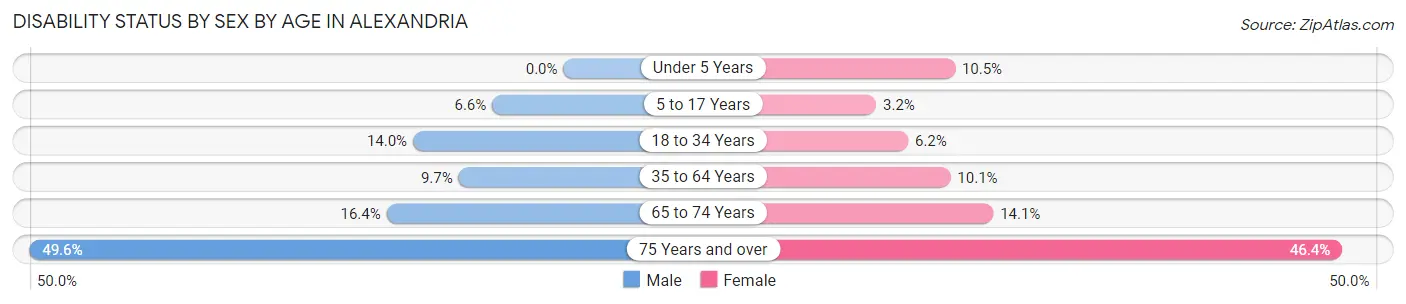
| Age Bracket | Male | Female |
| Under 5 Years | 0 (0.0%) | 44 (10.5%) |
| 5 to 17 Years | 75 (6.6%) | 30 (3.2%) |
| 18 to 34 Years | 259 (14.0%) | 107 (6.1%) |
| 35 to 64 Years | 203 (9.7%) | 241 (10.1%) |
| 65 to 74 Years | 76 (16.4%) | 92 (14.1%) |
| 75 Years and over | 396 (49.6%) | 494 (46.4%) |
Disability Class by Sex by Age in Alexandria
Disability Class: Hearing Difficulty
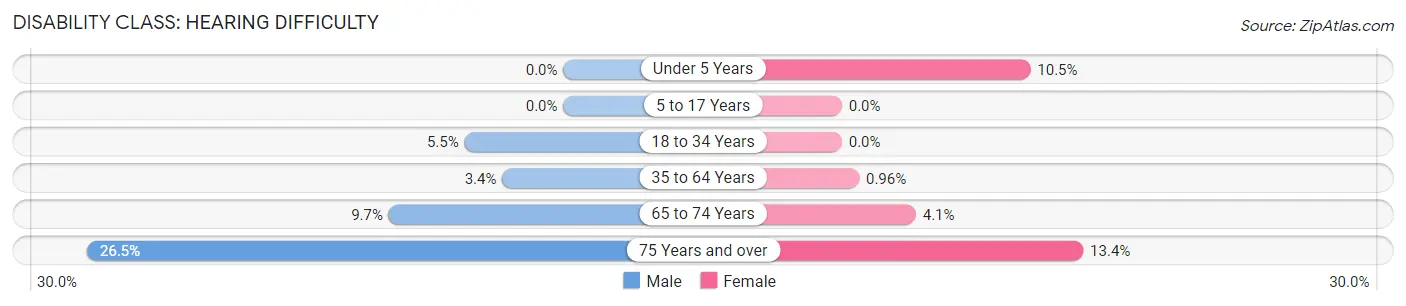
| Age Bracket | Male | Female |
| Under 5 Years | 0 (0.0%) | 44 (10.5%) |
| 5 to 17 Years | 0 (0.0%) | 0 (0.0%) |
| 18 to 34 Years | 102 (5.5%) | 0 (0.0%) |
| 35 to 64 Years | 71 (3.4%) | 23 (1.0%) |
| 65 to 74 Years | 45 (9.7%) | 27 (4.1%) |
| 75 Years and over | 212 (26.5%) | 143 (13.4%) |
Disability Class: Vision Difficulty
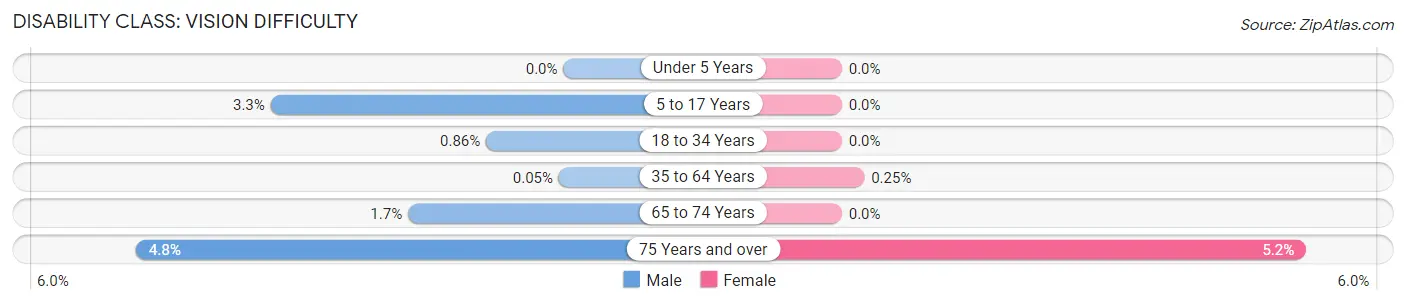
| Age Bracket | Male | Female |
| Under 5 Years | 0 (0.0%) | 0 (0.0%) |
| 5 to 17 Years | 37 (3.3%) | 0 (0.0%) |
| 18 to 34 Years | 16 (0.9%) | 0 (0.0%) |
| 35 to 64 Years | 1 (0.1%) | 6 (0.3%) |
| 65 to 74 Years | 8 (1.7%) | 0 (0.0%) |
| 75 Years and over | 38 (4.8%) | 55 (5.2%) |
Disability Class: Cognitive Difficulty
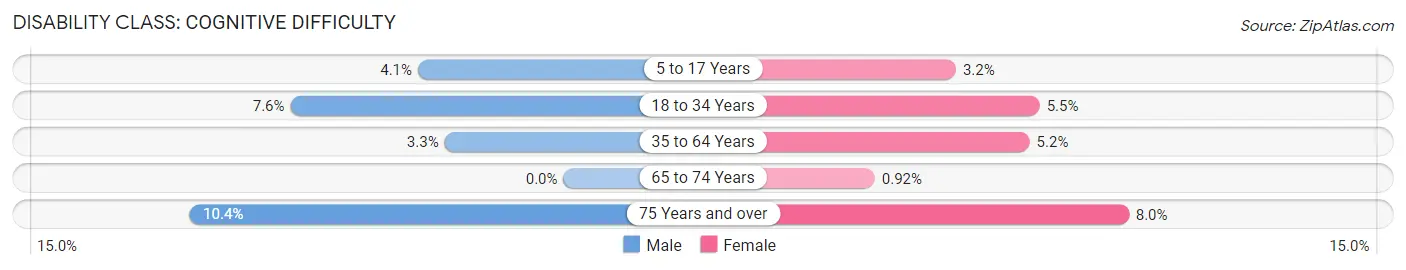
| Age Bracket | Male | Female |
| 5 to 17 Years | 46 (4.1%) | 30 (3.2%) |
| 18 to 34 Years | 141 (7.6%) | 96 (5.5%) |
| 35 to 64 Years | 69 (3.3%) | 125 (5.2%) |
| 65 to 74 Years | 0 (0.0%) | 6 (0.9%) |
| 75 Years and over | 83 (10.4%) | 85 (8.0%) |
Disability Class: Ambulatory Difficulty
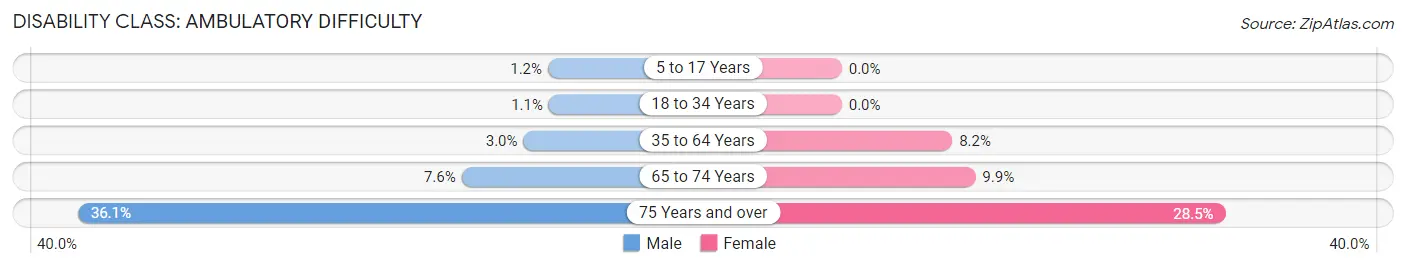
| Age Bracket | Male | Female |
| 5 to 17 Years | 13 (1.1%) | 0 (0.0%) |
| 18 to 34 Years | 20 (1.1%) | 0 (0.0%) |
| 35 to 64 Years | 62 (3.0%) | 196 (8.2%) |
| 65 to 74 Years | 35 (7.6%) | 65 (9.9%) |
| 75 Years and over | 288 (36.0%) | 303 (28.5%) |
Disability Class: Self-Care Difficulty
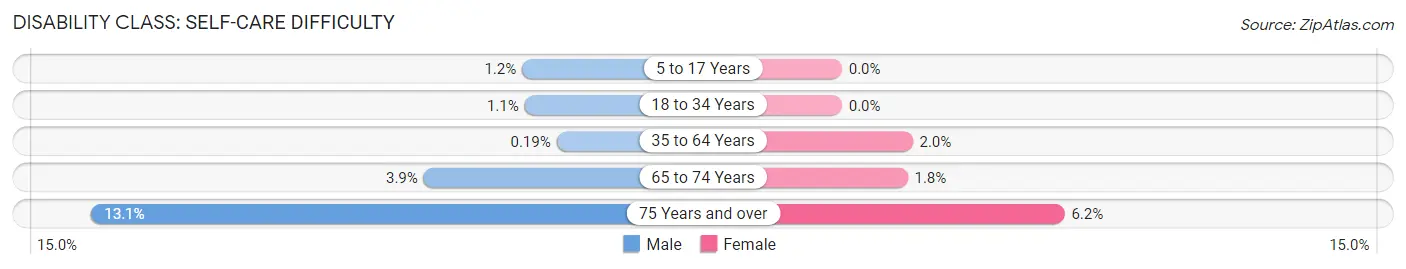
| Age Bracket | Male | Female |
| 5 to 17 Years | 13 (1.1%) | 0 (0.0%) |
| 18 to 34 Years | 20 (1.1%) | 0 (0.0%) |
| 35 to 64 Years | 4 (0.2%) | 47 (2.0%) |
| 65 to 74 Years | 18 (3.9%) | 12 (1.8%) |
| 75 Years and over | 105 (13.1%) | 66 (6.2%) |
Technology Access in Alexandria
Computing Device Access in Alexandria
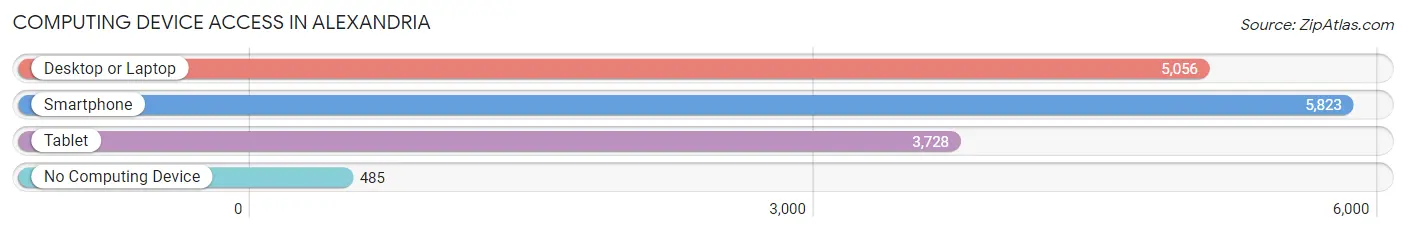
| Device Type | # Households | % Households |
| Desktop or Laptop | 5,056 | 72.6% |
| Smartphone | 5,823 | 83.7% |
| Tablet | 3,728 | 53.6% |
| No Computing Device | 485 | 7.0% |
| Total | 6,960 | 100.0% |
Internet Access in Alexandria
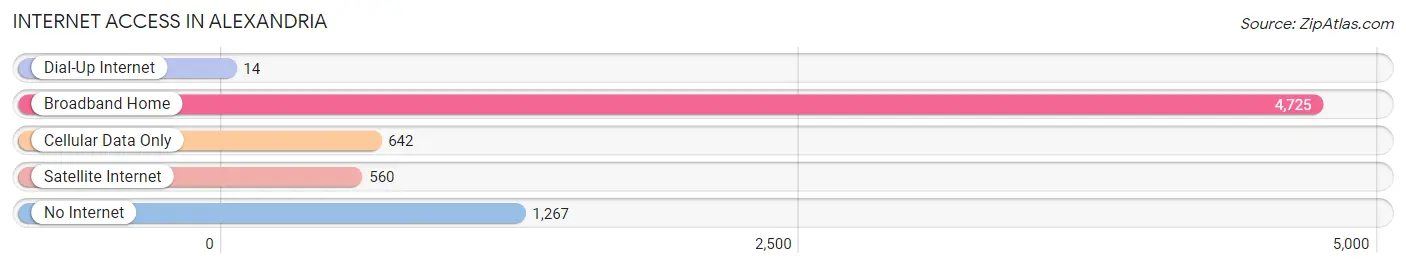
| Internet Type | # Households | % Households |
| Dial-Up Internet | 14 | 0.2% |
| Broadband Home | 4,725 | 67.9% |
| Cellular Data Only | 642 | 9.2% |
| Satellite Internet | 560 | 8.1% |
| No Internet | 1,267 | 18.2% |
| Total | 6,960 | 100.0% |
Alexandria Summary
Alexandria, Minnesota is a city located in Douglas County, Minnesota, United States. It is the county seat of Douglas County and is located along the western shore of Lake Agnes. The population was 11,070 at the 2010 census.
History
The area that is now Alexandria was first settled in 1858 by three families from Sweden. The city was named after Alexander and William Kinkead, two brothers who had settled in the area in 1866. The city was incorporated in 1877 and was designated as the county seat of Douglas County in 1881.
In the late 19th century, Alexandria was a major center for the lumber industry. The city was also home to a number of manufacturing companies, including a flour mill, a creamery, a canning factory, and a furniture factory.
Geography
Alexandria is located at the junction of Interstate 94 and Minnesota State Highway 29. It is approximately 130 miles northwest of Minneapolis and St. Paul. The city is situated on the western shore of Lake Agnes, a small lake that is part of the Chain of Lakes.
The city has a total area of 8.2 square miles, of which 7.9 square miles is land and 0.3 square miles is water.
Economy
Alexandria is a regional center for healthcare, retail, and manufacturing. The city is home to several major employers, including Douglas County Hospital, Alexandria Industries, and Viking Coca-Cola Bottling Company.
The city is also home to a number of small businesses, including restaurants, shops, and service providers. Tourism is also an important part of the local economy, with visitors coming to the city to enjoy its lakes, parks, and other attractions.
Demographics
As of the 2010 census, there were 11,070 people, 4,541 households, and 2,845 families residing in the city. The population density was 1,400.2 people per square mile. The racial makeup of the city was 95.2% White, 0.7% African American, 0.4% Native American, 0.7% Asian, 0.1% Pacific Islander, 1.3% from other races, and 1.6% from two or more races. Hispanic or Latino of any race were 3.2% of the population.
The median income for a household in the city was $41,945, and the median income for a family was $51,945. The per capita income for the city was $21,845. About 8.2% of families and 11.2% of the population were below the poverty line, including 16.2% of those under age 18 and 8.2% of those age 65 or over.
Alexandria is a diverse city with a variety of cultures and backgrounds. The city is home to a large number of immigrants from countries such as Mexico, Somalia, and Laos. The city also has a large population of Native Americans, with the largest group being the Ojibwe.
Common Questions
What is Per Capita Income in Alexandria?
Per Capita income in Alexandria is $38,089.
What is the Median Family Income in Alexandria?
Median Family Income in Alexandria is $81,603.
What is the Median Household income in Alexandria?
Median Household Income in Alexandria is $57,309.
What is Income or Wage Gap in Alexandria?
Income or Wage Gap in Alexandria is 24.8%.
Women in Alexandria earn 75.2 cents for every dollar earned by a man.
What is Family Income Deficit in Alexandria?
Family Income Deficit in Alexandria is $11,476.
Families that are below poverty line in Alexandria earn $11,476 less on average than the poverty threshold level.
What is Inequality or Gini Index in Alexandria?
Inequality or Gini Index in Alexandria is 0.45.
What is the Total Population of Alexandria?
Total Population of Alexandria is 14,400.
What is the Total Male Population of Alexandria?
Total Male Population of Alexandria is 6,968.
What is the Total Female Population of Alexandria?
Total Female Population of Alexandria is 7,432.
What is the Ratio of Males per 100 Females in Alexandria?
There are 93.76 Males per 100 Females in Alexandria.
What is the Ratio of Females per 100 Males in Alexandria?
There are 106.66 Females per 100 Males in Alexandria.
What is the Median Population Age in Alexandria?
Median Population Age in Alexandria is 37.9 Years.
What is the Average Family Size in Alexandria
Average Family Size in Alexandria is 2.6 People.
What is the Average Household Size in Alexandria
Average Household Size in Alexandria is 2.0 People.
How Large is the Labor Force in Alexandria?
There are 7,666 People in the Labor Forcein in Alexandria.
What is the Percentage of People in the Labor Force in Alexandria?
65.2% of People are in the Labor Force in Alexandria.
What is the Unemployment Rate in Alexandria?
Unemployment Rate in Alexandria is 4.0%.