Carlton, MN Map & Demographics
Carlton Map
Carlton Overview
$30,953
PER CAPITA INCOME
$67,250
AVG FAMILY INCOME
$52,232
AVG HOUSEHOLD INCOME
29.9%
WAGE / INCOME GAP [ % ]
70.1¢/ $1
WAGE / INCOME GAP [ $ ]
0.40
INEQUALITY / GINI INDEX
955
TOTAL POPULATION
499
MALE POPULATION
456
FEMALE POPULATION
109.43
MALES / 100 FEMALES
91.38
FEMALES / 100 MALES
50.7
MEDIAN AGE
2.6
AVG FAMILY SIZE
2.0
AVG HOUSEHOLD SIZE
409
LABOR FORCE [ PEOPLE ]
50.2%
PERCENT IN LABOR FORCE
13.0%
UNEMPLOYMENT RATE
Carlton Zip Codes
Carlton Area Codes
Income in Carlton
Income Overview in Carlton
Per Capita Income in Carlton is $30,953, while median incomes of families and households are $67,250 and $52,232 respectively.
| Characteristic | Number | Measure |
| Per Capita Income | 955 | $30,953 |
| Median Family Income | 218 | $67,250 |
| Mean Family Income | 218 | $87,790 |
| Median Household Income | 395 | $52,232 |
| Mean Household Income | 395 | $72,820 |
| Income Deficit | 218 | $0 |
| Wage / Income Gap (%) | 955 | 29.85% |
| Wage / Income Gap ($) | 955 | 70.15¢ per $1 |
| Gini / Inequality Index | 955 | 0.40 |
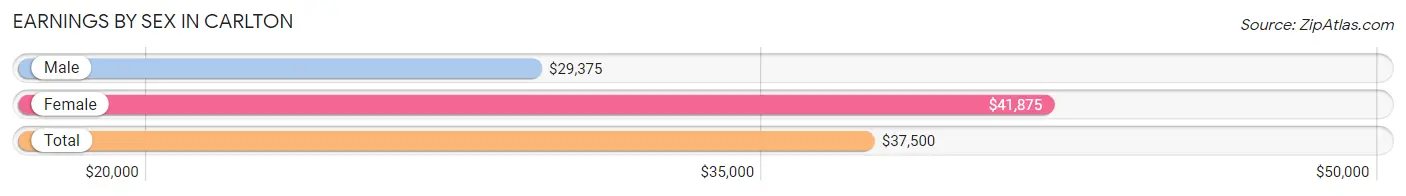
Earnings by Sex in Carlton
Average Earnings in Carlton are $37,500, $29,375 for men and $41,875 for women, a difference of 29.8%.
| Sex | Number | Average Earnings |
| Male | 269 (60.6%) | $29,375 |
| Female | 175 (39.4%) | $41,875 |
| Total | 444 (100.0%) | $37,500 |
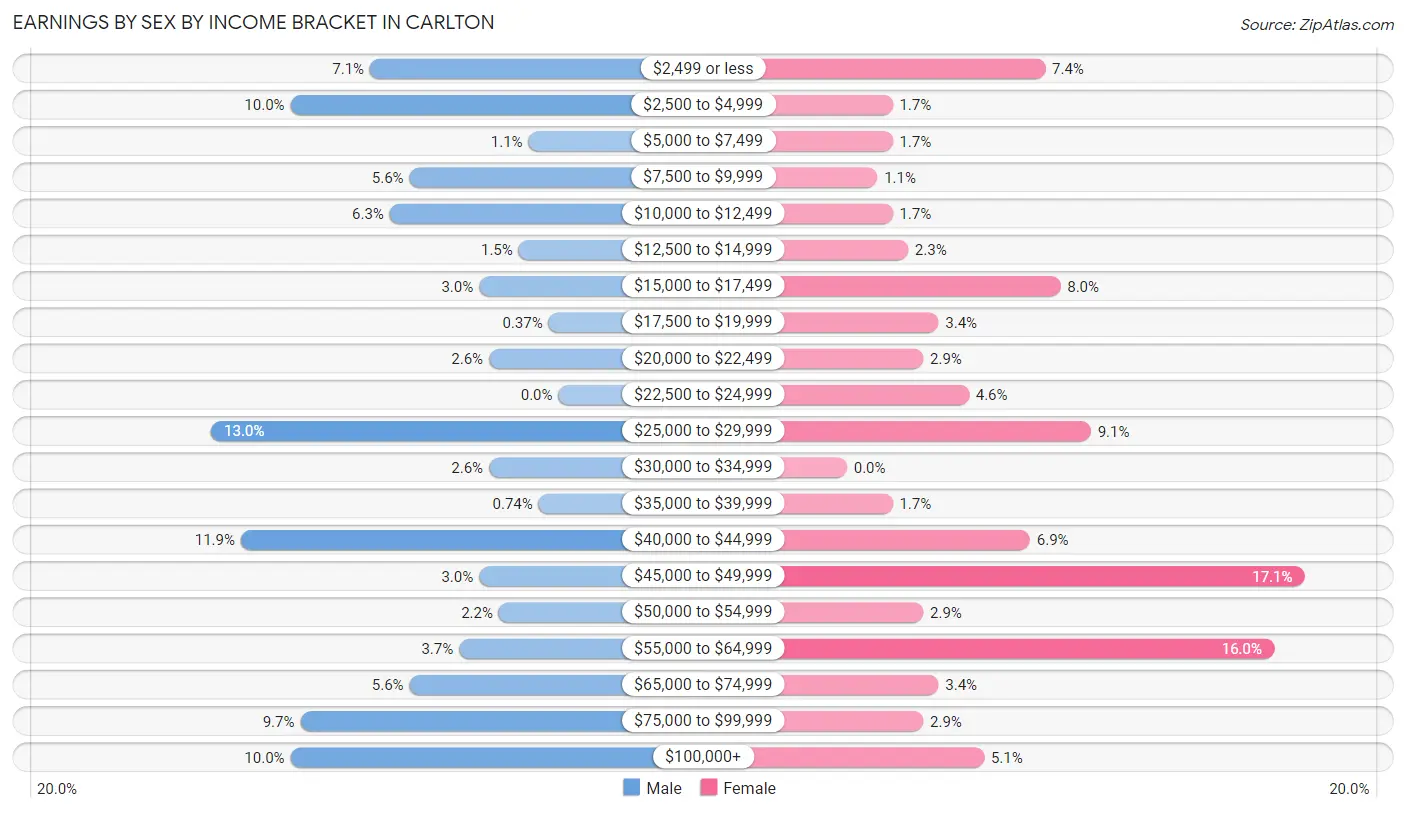
Earnings by Sex by Income Bracket in Carlton
The most common earnings brackets in Carlton are $25,000 to $29,999 for men (35 | 13.0%) and $45,000 to $49,999 for women (30 | 17.1%).
| Income | Male | Female |
| $2,499 or less | 19 (7.1%) | 13 (7.4%) |
| $2,500 to $4,999 | 27 (10.0%) | 3 (1.7%) |
| $5,000 to $7,499 | 3 (1.1%) | 3 (1.7%) |
| $7,500 to $9,999 | 15 (5.6%) | 2 (1.1%) |
| $10,000 to $12,499 | 17 (6.3%) | 3 (1.7%) |
| $12,500 to $14,999 | 4 (1.5%) | 4 (2.3%) |
| $15,000 to $17,499 | 8 (3.0%) | 14 (8.0%) |
| $17,500 to $19,999 | 1 (0.4%) | 6 (3.4%) |
| $20,000 to $22,499 | 7 (2.6%) | 5 (2.9%) |
| $22,500 to $24,999 | 0 (0.0%) | 8 (4.6%) |
| $25,000 to $29,999 | 35 (13.0%) | 16 (9.1%) |
| $30,000 to $34,999 | 7 (2.6%) | 0 (0.0%) |
| $35,000 to $39,999 | 2 (0.7%) | 3 (1.7%) |
| $40,000 to $44,999 | 32 (11.9%) | 12 (6.9%) |
| $45,000 to $49,999 | 8 (3.0%) | 30 (17.1%) |
| $50,000 to $54,999 | 6 (2.2%) | 5 (2.9%) |
| $55,000 to $64,999 | 10 (3.7%) | 28 (16.0%) |
| $65,000 to $74,999 | 15 (5.6%) | 6 (3.4%) |
| $75,000 to $99,999 | 26 (9.7%) | 5 (2.9%) |
| $100,000+ | 27 (10.0%) | 9 (5.1%) |
| Total | 269 (100.0%) | 175 (100.0%) |
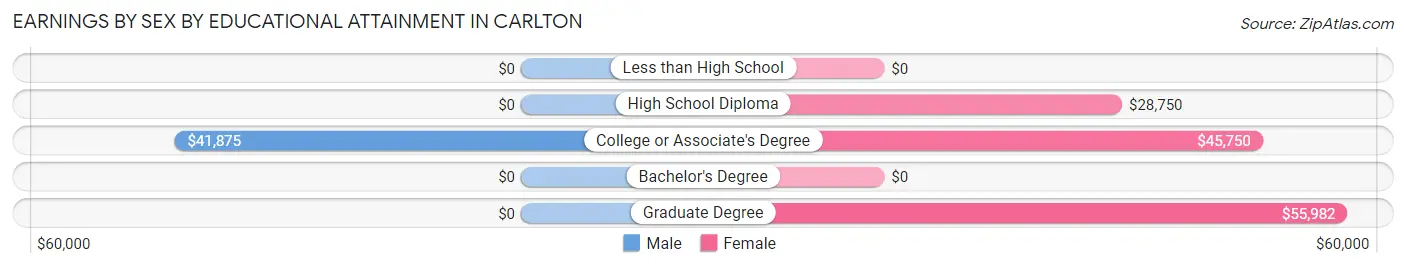
Earnings by Sex by Educational Attainment in Carlton
Average earnings in Carlton are $41,250 for men and $42,125 for women, a difference of 2.1%. Men with an educational attainment of college or associate's degree enjoy the highest average annual earnings of $41,875, while those with college or associate's degree education earn the least with $41,875. Women with an educational attainment of graduate degree earn the most with the average annual earnings of $55,982, while those with high school diploma education have the smallest earnings of $28,750.
| Educational Attainment | Male Income | Female Income |
| Less than High School | - | - |
| High School Diploma | - | - |
| College or Associate's Degree | $41,875 | $45,750 |
| Bachelor's Degree | - | - |
| Graduate Degree | - | - |
| Total | $41,250 | $42,125 |
Family Income in Carlton
Family Income Brackets in Carlton
According to the Carlton family income data, there are 59 families falling into the $50,000 to $74,999 income range, which is the most common income bracket and makes up 27.1% of all families.
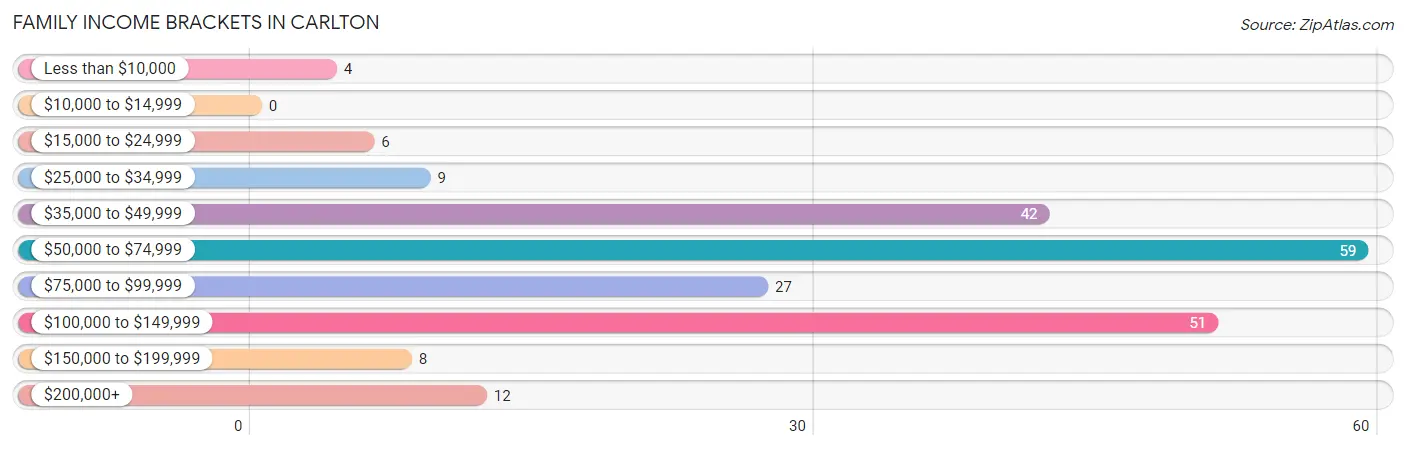
| Income Bracket | # Families | % Families |
| Less than $10,000 | 4 | 1.8% |
| $10,000 to $14,999 | 0 | 0.0% |
| $15,000 to $24,999 | 6 | 2.8% |
| $25,000 to $34,999 | 9 | 4.1% |
| $35,000 to $49,999 | 42 | 19.3% |
| $50,000 to $74,999 | 59 | 27.1% |
| $75,000 to $99,999 | 27 | 12.4% |
| $100,000 to $149,999 | 51 | 23.4% |
| $150,000 to $199,999 | 8 | 3.7% |
| $200,000+ | 12 | 5.5% |
Family Income by Famaliy Size in Carlton
4-person families (13 | 6.0%) account for the highest median family income in Carlton with $150,469 per family, while 4-person families (13 | 6.0%) have the highest median income of $37,617 per family member.
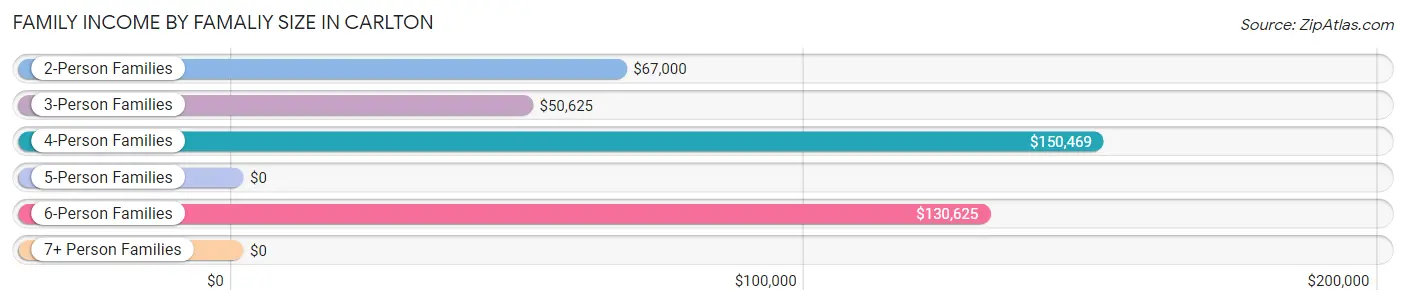
| Income Bracket | # Families | Median Income |
| 2-Person Families | 124 (56.9%) | $67,000 |
| 3-Person Families | 61 (28.0%) | $50,625 |
| 4-Person Families | 13 (6.0%) | $150,469 |
| 5-Person Families | 13 (6.0%) | $0 |
| 6-Person Families | 7 (3.2%) | $130,625 |
| 7+ Person Families | 0 (0.0%) | $0 |
| Total | 218 (100.0%) | $67,250 |
Family Income by Number of Earners in Carlton
The median family income in Carlton is $67,250, with families comprising 3+ earners (12) having the highest median family income of $245,357, while families with 1 earner (57) have the lowest median family income of $44,375, accounting for 5.5% and 26.2% of families, respectively.
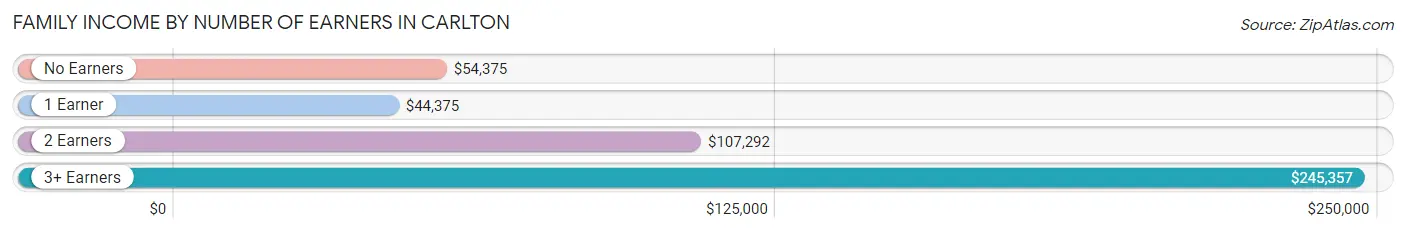
| Number of Earners | # Families | Median Income |
| No Earners | 46 (21.1%) | $54,375 |
| 1 Earner | 57 (26.2%) | $44,375 |
| 2 Earners | 103 (47.2%) | $107,292 |
| 3+ Earners | 12 (5.5%) | $245,357 |
| Total | 218 (100.0%) | $67,250 |
Household Income in Carlton
Household Income Brackets in Carlton
With 76 households falling in the category, the $35,000 to $49,999 income range is the most frequent in Carlton, accounting for 19.2% of all households. In contrast, only 8 households (2.0%) fall into the $10,000 to $14,999 income bracket, making it the least populous group.
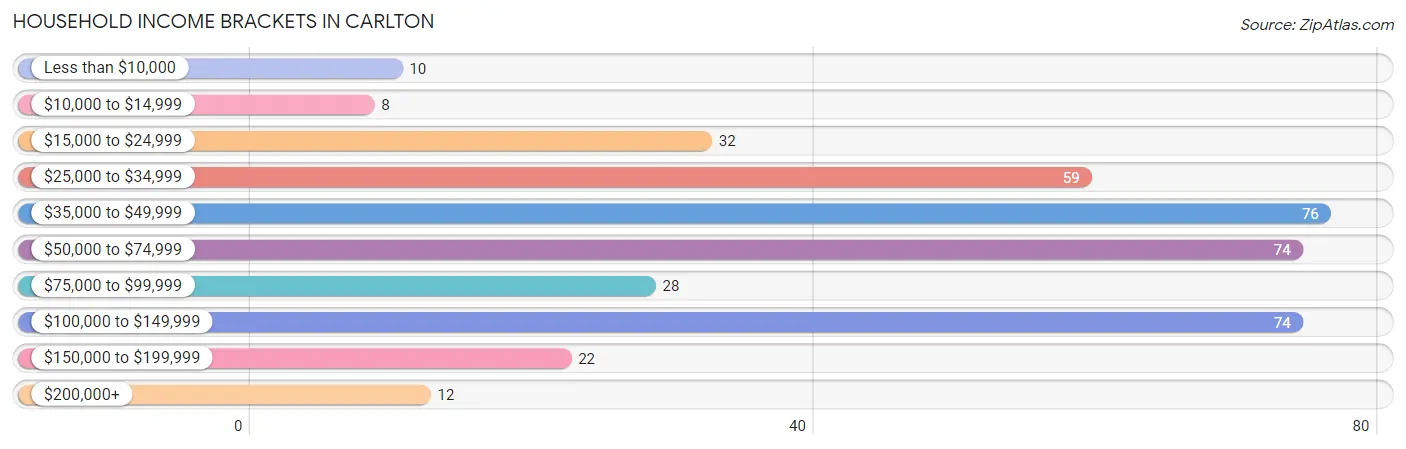
| Income Bracket | # Households | % Households |
| Less than $10,000 | 10 | 2.5% |
| $10,000 to $14,999 | 8 | 2.0% |
| $15,000 to $24,999 | 32 | 8.1% |
| $25,000 to $34,999 | 59 | 14.9% |
| $35,000 to $49,999 | 76 | 19.2% |
| $50,000 to $74,999 | 74 | 18.7% |
| $75,000 to $99,999 | 28 | 7.1% |
| $100,000 to $149,999 | 74 | 18.7% |
| $150,000 to $199,999 | 22 | 5.6% |
| $200,000+ | 12 | 3.0% |
Household Income by Householder Age in Carlton
The median household income in Carlton is $52,232, with the highest median household income of $103,750 found in the 25 to 44 years age bracket for the primary householder. A total of 90 households (22.8%) fall into this category. Meanwhile, the 15 to 24 years age bracket for the primary householder has the lowest median household income of $0, with 1 households (0.3%) in this group.
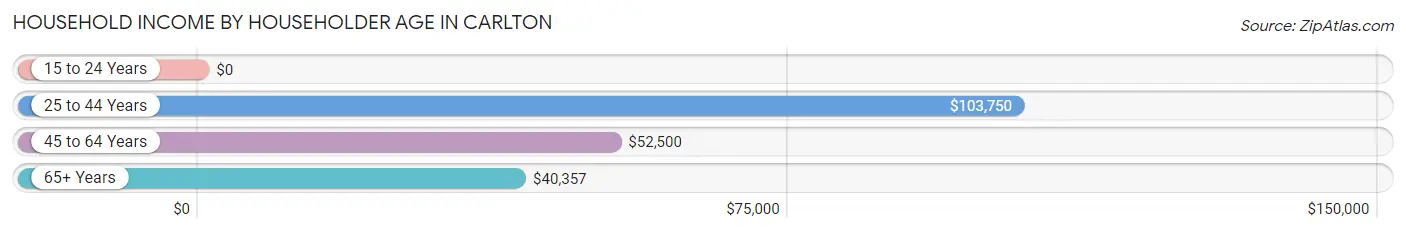
| Income Bracket | # Households | Median Income |
| 15 to 24 Years | 1 (0.3%) | $0 |
| 25 to 44 Years | 90 (22.8%) | $103,750 |
| 45 to 64 Years | 170 (43.0%) | $52,500 |
| 65+ Years | 134 (33.9%) | $40,357 |
| Total | 395 (100.0%) | $52,232 |
Poverty in Carlton
Income Below Poverty by Sex and Age in Carlton
With 3.8% poverty level for males and 8.3% for females among the residents of Carlton, 55 to 64 year old males and under 5 year old females are the most vulnerable to poverty, with 6 males (14.0%) and 7 females (87.5%) in their respective age groups living below the poverty level.
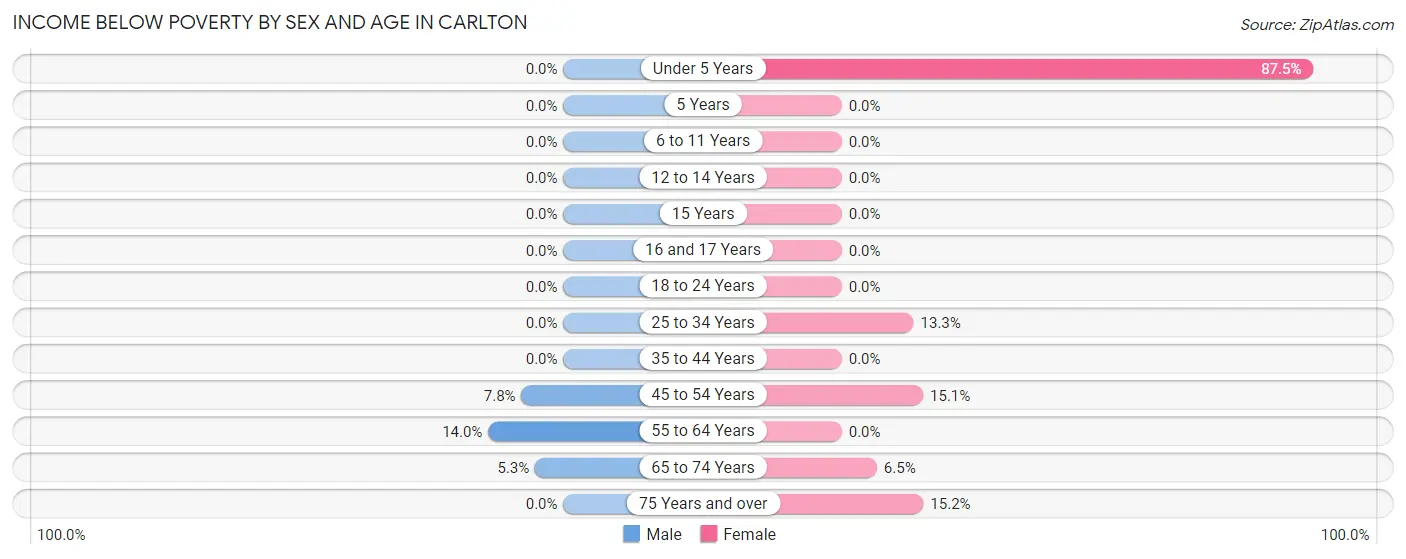
| Age Bracket | Male | Female |
| Under 5 Years | 0 (0.0%) | 7 (87.5%) |
| 5 Years | 0 (0.0%) | 0 (0.0%) |
| 6 to 11 Years | 0 (0.0%) | 0 (0.0%) |
| 12 to 14 Years | 0 (0.0%) | 0 (0.0%) |
| 15 Years | 0 (0.0%) | 0 (0.0%) |
| 16 and 17 Years | 0 (0.0%) | 0 (0.0%) |
| 18 to 24 Years | 0 (0.0%) | 0 (0.0%) |
| 25 to 34 Years | 0 (0.0%) | 4 (13.3%) |
| 35 to 44 Years | 0 (0.0%) | 0 (0.0%) |
| 45 to 54 Years | 7 (7.8%) | 8 (15.1%) |
| 55 to 64 Years | 6 (14.0%) | 0 (0.0%) |
| 65 to 74 Years | 3 (5.3%) | 3 (6.5%) |
| 75 Years and over | 0 (0.0%) | 10 (15.1%) |
| Total | 16 (3.8%) | 32 (8.3%) |
Income Above Poverty by Sex and Age in Carlton
According to the poverty statistics in Carlton, males aged under 5 years and females aged 6 to 11 years are the age groups that are most secure financially, with 100.0% of males and 100.0% of females in these age groups living above the poverty line.
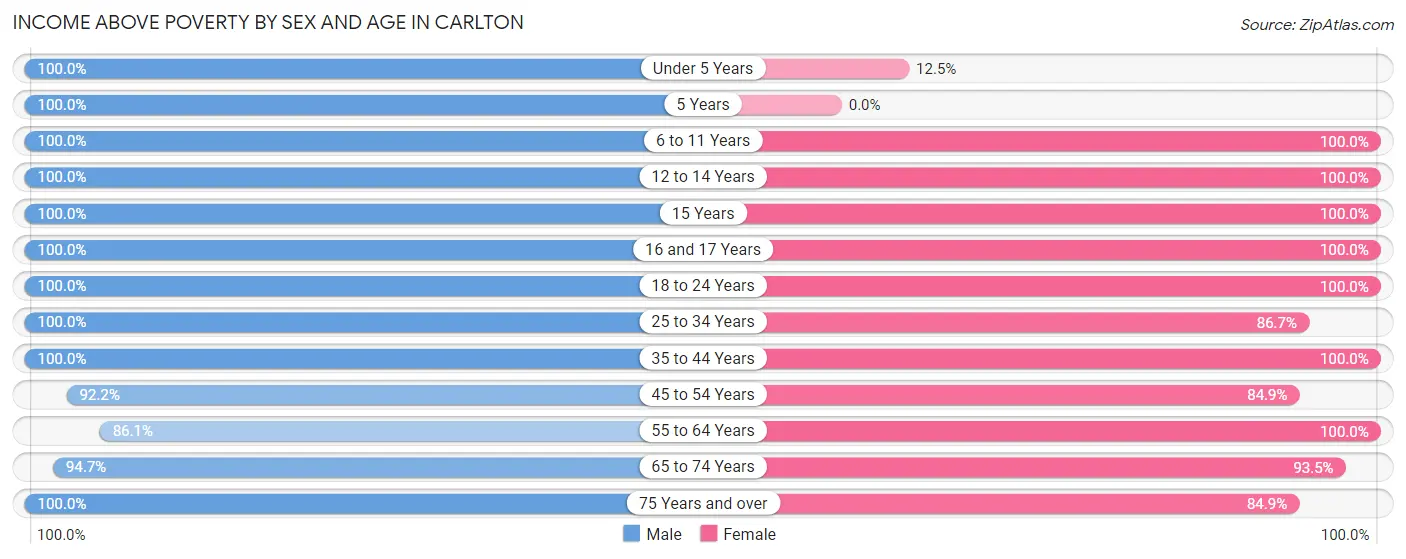
| Age Bracket | Male | Female |
| Under 5 Years | 8 (100.0%) | 1 (12.5%) |
| 5 Years | 3 (100.0%) | 0 (0.0%) |
| 6 to 11 Years | 25 (100.0%) | 37 (100.0%) |
| 12 to 14 Years | 26 (100.0%) | 10 (100.0%) |
| 15 Years | 12 (100.0%) | 4 (100.0%) |
| 16 and 17 Years | 9 (100.0%) | 19 (100.0%) |
| 18 to 24 Years | 28 (100.0%) | 2 (100.0%) |
| 25 to 34 Years | 33 (100.0%) | 26 (86.7%) |
| 35 to 44 Years | 61 (100.0%) | 49 (100.0%) |
| 45 to 54 Years | 83 (92.2%) | 45 (84.9%) |
| 55 to 64 Years | 37 (86.1%) | 62 (100.0%) |
| 65 to 74 Years | 54 (94.7%) | 43 (93.5%) |
| 75 Years and over | 23 (100.0%) | 56 (84.9%) |
| Total | 402 (96.2%) | 354 (91.7%) |
Income Below Poverty Among Married-Couple Families in Carlton
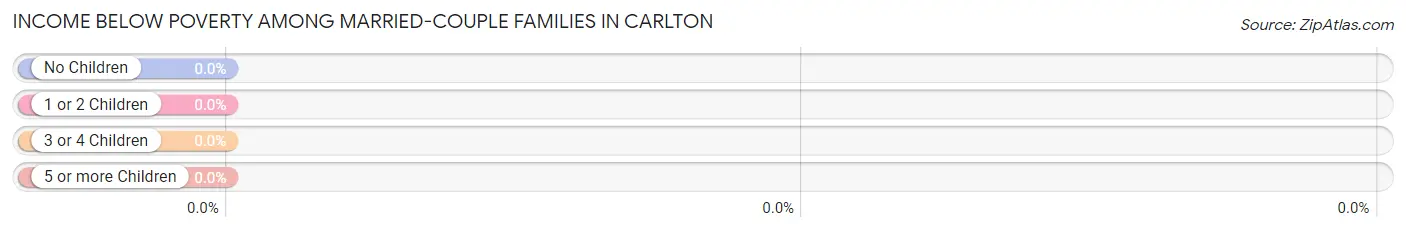
| Children | Above Poverty | Below Poverty |
| No Children | 106 (100.0%) | 0 (0.0%) |
| 1 or 2 Children | 18 (100.0%) | 0 (0.0%) |
| 3 or 4 Children | 20 (100.0%) | 0 (0.0%) |
| 5 or more Children | 0 (0.0%) | 0 (0.0%) |
| Total | 144 (100.0%) | 0 (0.0%) |
Income Below Poverty Among Single-Parent Households in Carlton
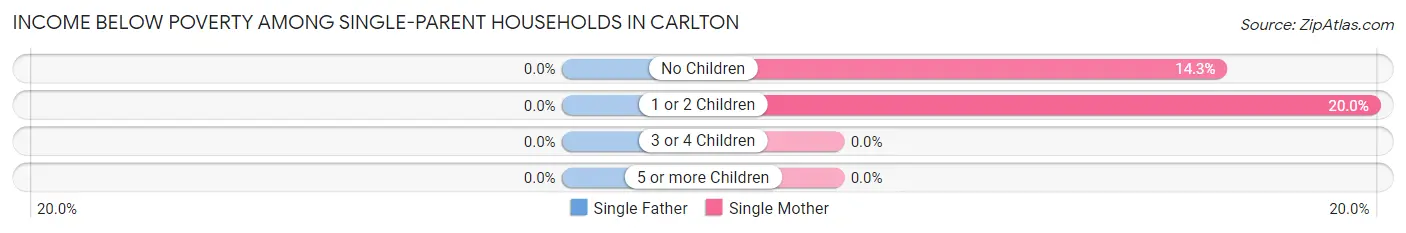
| Children | Single Father | Single Mother |
| No Children | 0 (0.0%) | 3 (14.3%) |
| 1 or 2 Children | 0 (0.0%) | 4 (20.0%) |
| 3 or 4 Children | 0 (0.0%) | 0 (0.0%) |
| 5 or more Children | 0 (0.0%) | 0 (0.0%) |
| Total | 0 (0.0%) | 7 (17.1%) |
Income Below Poverty Among Married-Couple vs Single-Parent Households in Carlton
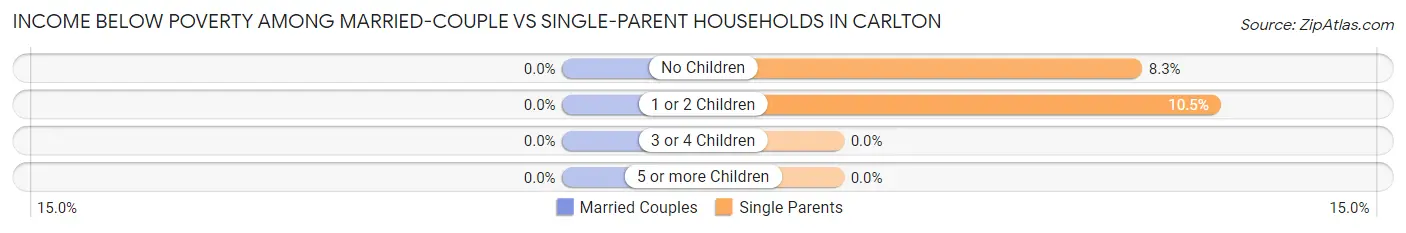
| Children | Married-Couple Families | Single-Parent Households |
| No Children | 0 (0.0%) | 3 (8.3%) |
| 1 or 2 Children | 0 (0.0%) | 4 (10.5%) |
| 3 or 4 Children | 0 (0.0%) | 0 (0.0%) |
| 5 or more Children | 0 (0.0%) | 0 (0.0%) |
| Total | 0 (0.0%) | 7 (9.5%) |
Race in Carlton
The most populous races in Carlton are White / Caucasian (857 | 89.7%), Two or more Races (46 | 4.8%), and Native / Alaskan (35 | 3.7%).
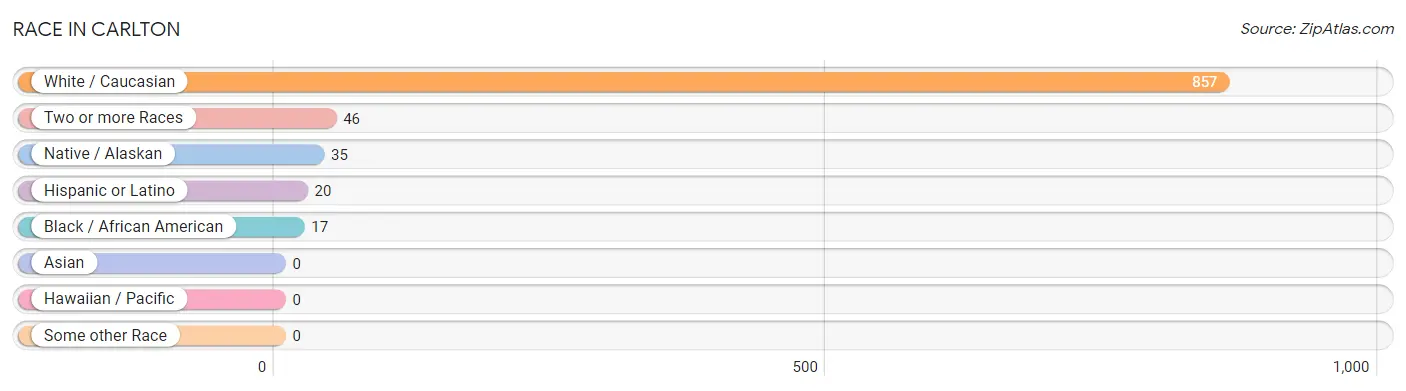
| Race | # Population | % Population |
| Asian | 0 | 0.0% |
| Black / African American | 17 | 1.8% |
| Hawaiian / Pacific | 0 | 0.0% |
| Hispanic or Latino | 20 | 2.1% |
| Native / Alaskan | 35 | 3.7% |
| White / Caucasian | 857 | 89.7% |
| Two or more Races | 46 | 4.8% |
| Some other Race | 0 | 0.0% |
| Total | 955 | 100.0% |
Ancestry in Carlton
The most populous ancestries reported in Carlton are German (184 | 19.3%), Finnish (163 | 17.1%), English (91 | 9.5%), Swedish (90 | 9.4%), and Norwegian (87 | 9.1%), together accounting for 64.4% of all Carlton residents.
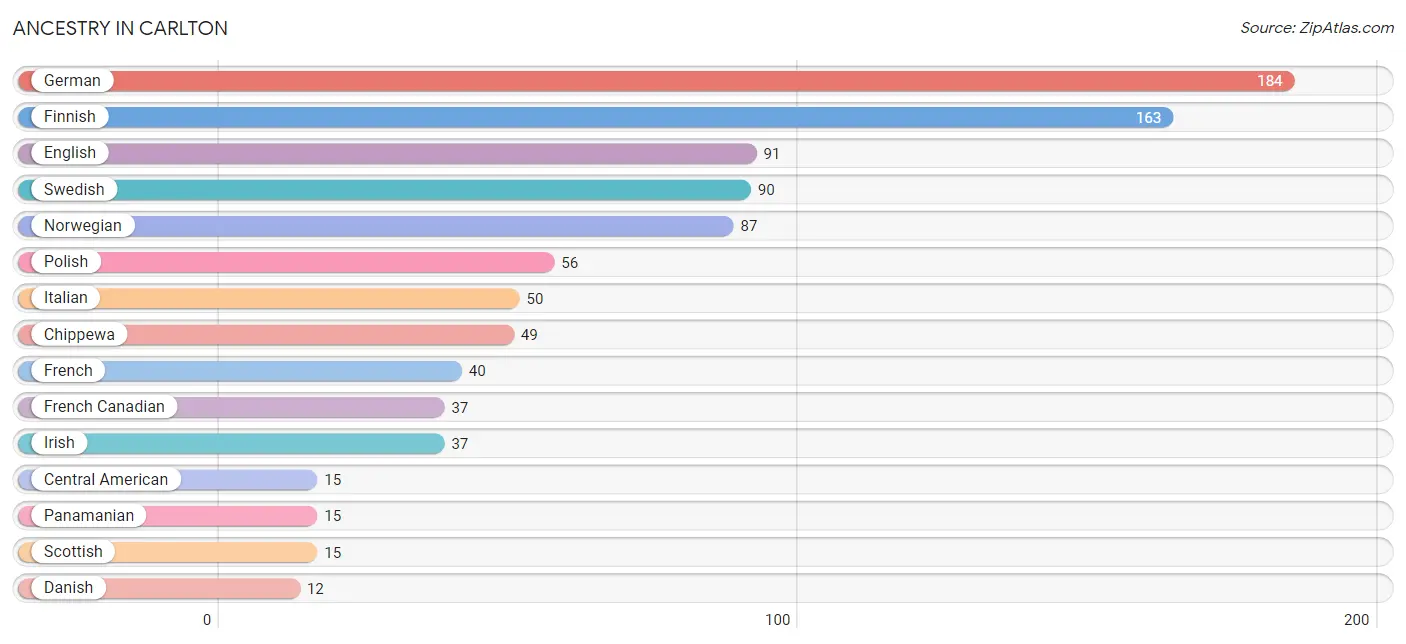
| Ancestry | # Population | % Population |
| American | 10 | 1.1% |
| Canadian | 2 | 0.2% |
| Central American | 15 | 1.6% |
| Chippewa | 49 | 5.1% |
| Czech | 3 | 0.3% |
| Danish | 12 | 1.3% |
| Dutch | 7 | 0.7% |
| English | 91 | 9.5% |
| European | 9 | 0.9% |
| Finnish | 163 | 17.1% |
| French | 40 | 4.2% |
| French Canadian | 37 | 3.9% |
| German | 184 | 19.3% |
| Irish | 37 | 3.9% |
| Italian | 50 | 5.2% |
| Japanese | 1 | 0.1% |
| Norwegian | 87 | 9.1% |
| Panamanian | 15 | 1.6% |
| Polish | 56 | 5.9% |
| Scandinavian | 3 | 0.3% |
| Scotch-Irish | 1 | 0.1% |
| Scottish | 15 | 1.6% |
| Serbian | 7 | 0.7% |
| Sri Lankan | 1 | 0.1% |
| Swedish | 90 | 9.4% |
| Swiss | 4 | 0.4% |
| Yugoslavian | 2 | 0.2% | View All 27 Rows |
Immigrants in Carlton
The most numerous immigrant groups reported in Carlton came from Canada (2 | 0.2%), Europe (2 | 0.2%), Germany (2 | 0.2%), Western Europe (2 | 0.2%), and Caribbean (1 | 0.1%), together accounting for 0.9% of all Carlton residents.
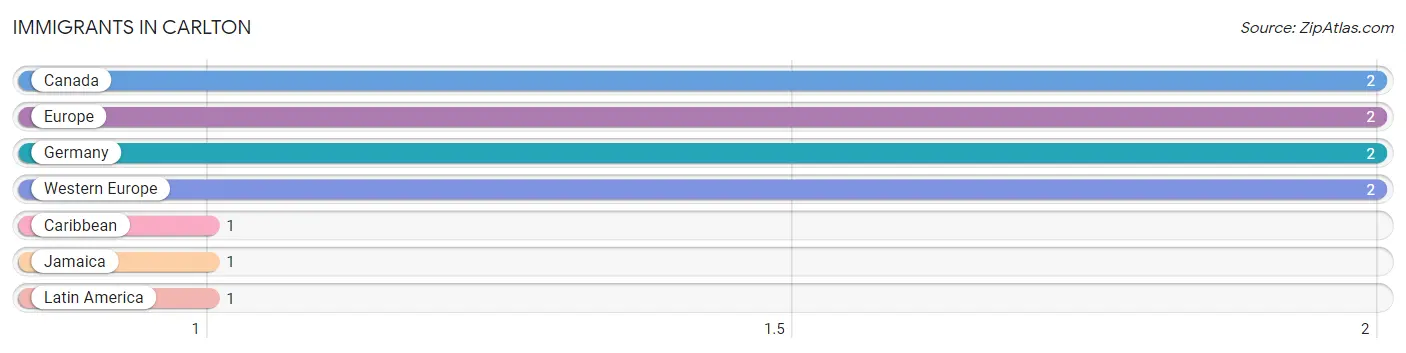
| Immigration Origin | # Population | % Population |
| Canada | 2 | 0.2% |
| Caribbean | 1 | 0.1% |
| Europe | 2 | 0.2% |
| Germany | 2 | 0.2% |
| Jamaica | 1 | 0.1% |
| Latin America | 1 | 0.1% |
| Western Europe | 2 | 0.2% | View All 7 Rows |
Sex and Age in Carlton
Sex and Age in Carlton
The most populous age groups in Carlton are 50 to 54 Years (80 | 16.0%) for men and 60 to 64 Years (60 | 13.2%) for women.
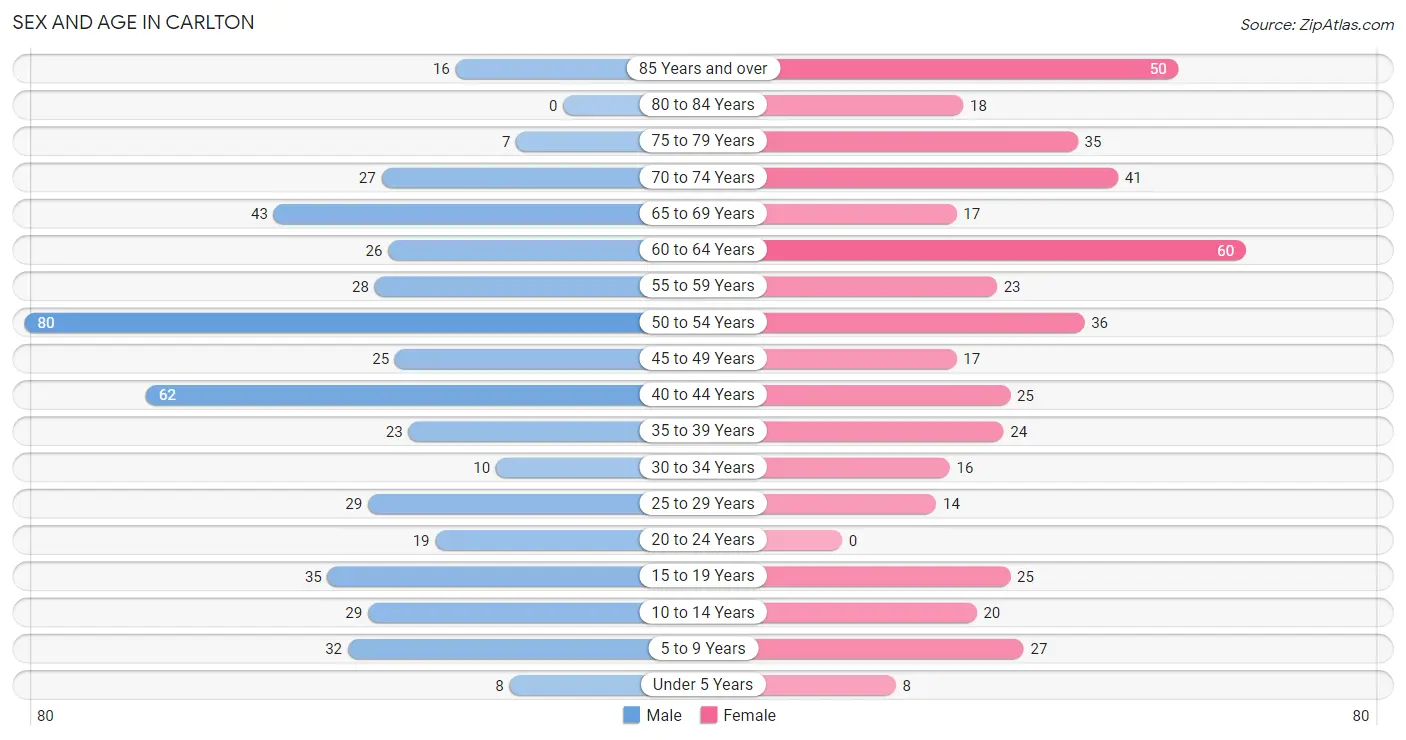
| Age Bracket | Male | Female |
| Under 5 Years | 8 (1.6%) | 8 (1.8%) |
| 5 to 9 Years | 32 (6.4%) | 27 (5.9%) |
| 10 to 14 Years | 29 (5.8%) | 20 (4.4%) |
| 15 to 19 Years | 35 (7.0%) | 25 (5.5%) |
| 20 to 24 Years | 19 (3.8%) | 0 (0.0%) |
| 25 to 29 Years | 29 (5.8%) | 14 (3.1%) |
| 30 to 34 Years | 10 (2.0%) | 16 (3.5%) |
| 35 to 39 Years | 23 (4.6%) | 24 (5.3%) |
| 40 to 44 Years | 62 (12.4%) | 25 (5.5%) |
| 45 to 49 Years | 25 (5.0%) | 17 (3.7%) |
| 50 to 54 Years | 80 (16.0%) | 36 (7.9%) |
| 55 to 59 Years | 28 (5.6%) | 23 (5.0%) |
| 60 to 64 Years | 26 (5.2%) | 60 (13.2%) |
| 65 to 69 Years | 43 (8.6%) | 17 (3.7%) |
| 70 to 74 Years | 27 (5.4%) | 41 (9.0%) |
| 75 to 79 Years | 7 (1.4%) | 35 (7.7%) |
| 80 to 84 Years | 0 (0.0%) | 18 (4.0%) |
| 85 Years and over | 16 (3.2%) | 50 (11.0%) |
| Total | 499 (100.0%) | 456 (100.0%) |
Families and Households in Carlton
Median Family Size in Carlton
The median family size in Carlton is 2.61 persons per family, with married-couple families (144 | 66.1%) accounting for the largest median family size of 2.68 persons per family. On the other hand, single male/father families (33 | 15.1%) represent the smallest median family size with 2.39 persons per family.
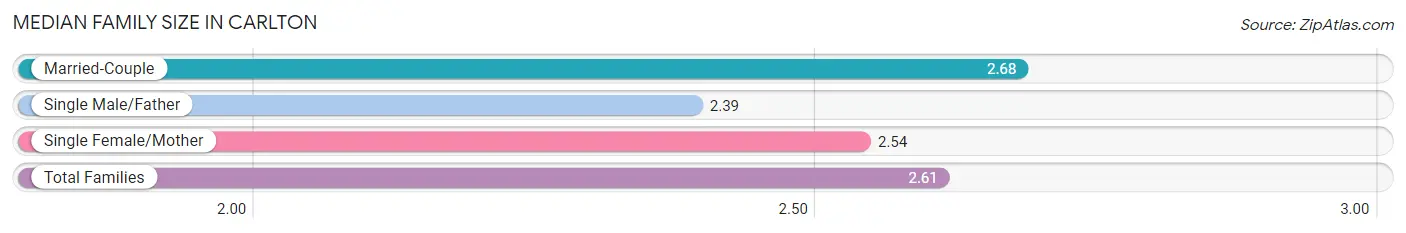
| Family Type | # Families | Family Size |
| Married-Couple | 144 (66.1%) | 2.68 |
| Single Male/Father | 33 (15.1%) | 2.39 |
| Single Female/Mother | 41 (18.8%) | 2.54 |
| Total Families | 218 (100.0%) | 2.61 |
Median Household Size in Carlton
The median household size in Carlton is 2.02 persons per household, with married-couple households (144 | 36.5%) accounting for the largest median household size of 2.75 persons per household. non-family households (177 | 44.8%) represent the smallest median household size with 1.21 persons per household.
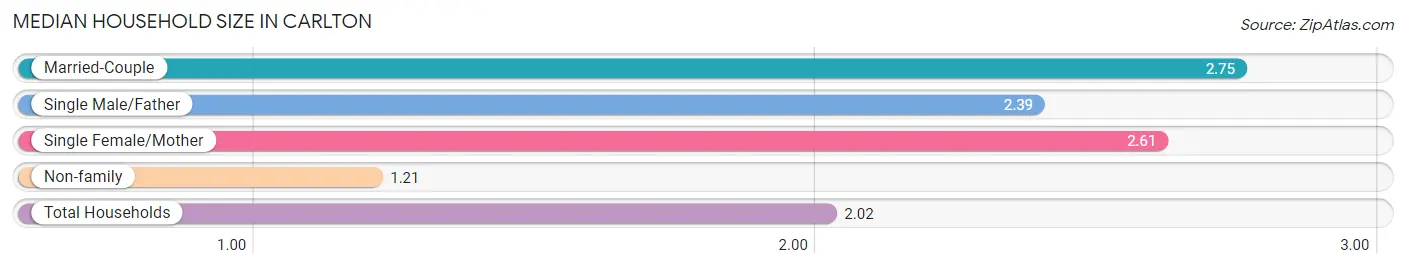
| Household Type | # Households | Household Size |
| Married-Couple | 144 (36.5%) | 2.75 |
| Single Male/Father | 33 (8.4%) | 2.39 |
| Single Female/Mother | 41 (10.4%) | 2.61 |
| Non-family | 177 (44.8%) | 1.21 |
| Total Households | 395 (100.0%) | 2.02 |
Household Size by Marriage Status in Carlton
Out of a total of 395 households in Carlton, 218 (55.2%) are family households, while 177 (44.8%) are nonfamily households. The most numerous type of family households are 2-person households, comprising 110, and the most common type of nonfamily households are 1-person households, comprising 138.
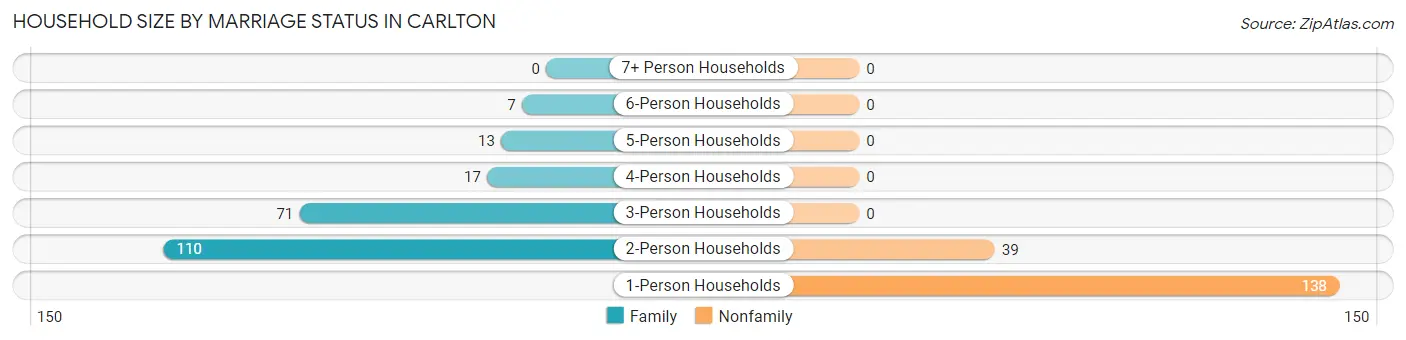
| Household Size | Family Households | Nonfamily Households |
| 1-Person Households | - | 138 (34.9%) |
| 2-Person Households | 110 (27.9%) | 39 (9.9%) |
| 3-Person Households | 71 (18.0%) | 0 (0.0%) |
| 4-Person Households | 17 (4.3%) | 0 (0.0%) |
| 5-Person Households | 13 (3.3%) | 0 (0.0%) |
| 6-Person Households | 7 (1.8%) | 0 (0.0%) |
| 7+ Person Households | 0 (0.0%) | 0 (0.0%) |
| Total | 218 (55.2%) | 177 (44.8%) |
Female Fertility in Carlton
Fertility by Age in Carlton
Average fertility rate in Carlton is 53.0 births per 1,000 women. Women in the age bracket of 20 to 34 years have the highest fertility rate with 233.0 births per 1,000 women. Women in the age bracket of 20 to 34 years acount for 100.0% of all women with births.
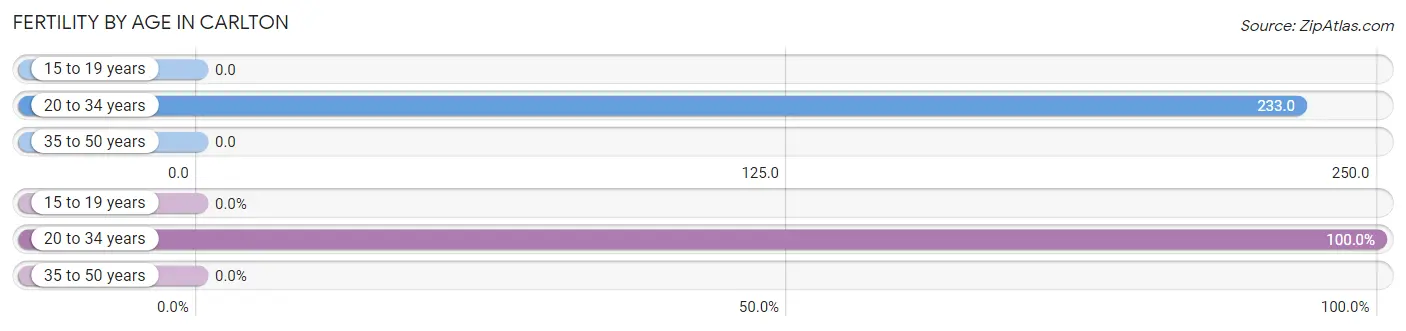
| Age Bracket | Women with Births | Births / 1,000 Women |
| 15 to 19 years | 0 (0.0%) | 0.0 |
| 20 to 34 years | 7 (100.0%) | 233.0 |
| 35 to 50 years | 0 (0.0%) | 0.0 |
| Total | 7 (100.0%) | 53.0 |
Fertility by Age by Marriage Status in Carlton
42.9% of women with births (7) in Carlton are married. The highest percentage of unmarried women with births falls into 20 to 34 years age bracket with 57.1% of them unmarried at the time of birth, while the lowest percentage of unmarried women with births belong to 20 to 34 years age bracket with 57.1% of them unmarried.
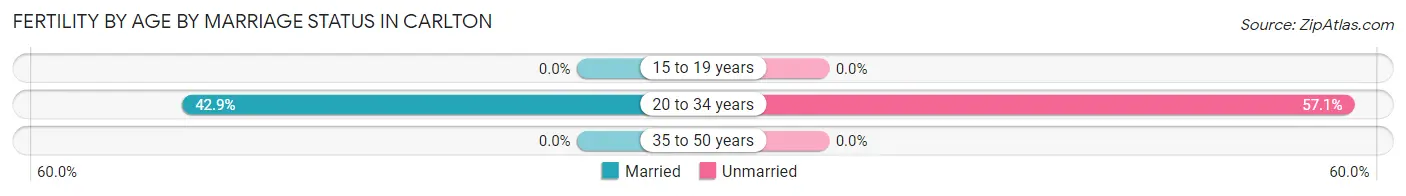
| Age Bracket | Married | Unmarried |
| 15 to 19 years | 0 (0.0%) | 0 (0.0%) |
| 20 to 34 years | 3 (42.9%) | 4 (57.1%) |
| 35 to 50 years | 0 (0.0%) | 0 (0.0%) |
| Total | 3 (42.9%) | 4 (57.1%) |
Fertility by Education in Carlton
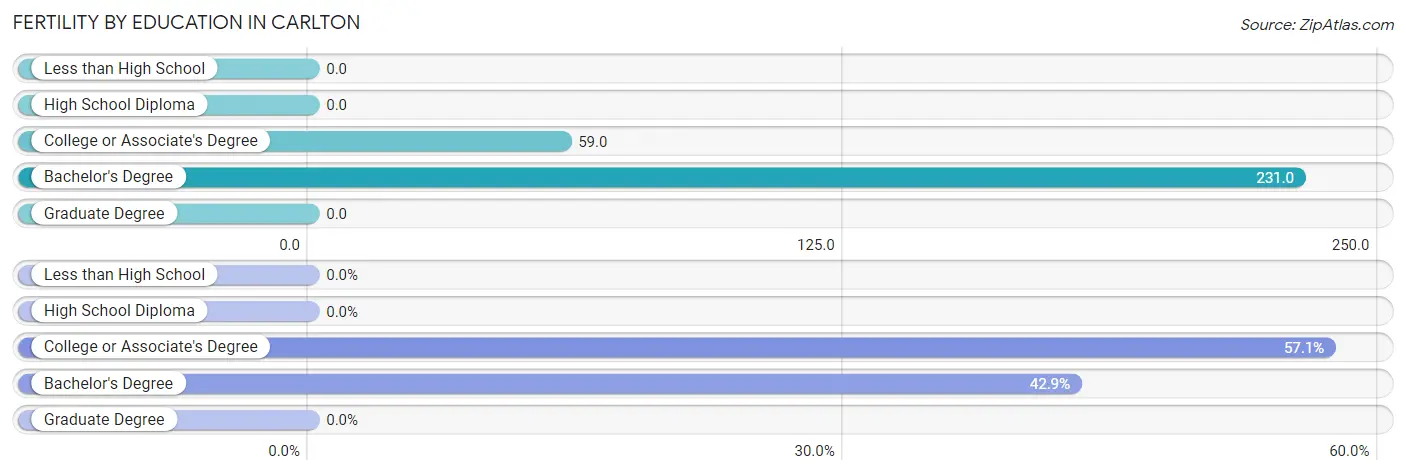
| Educational Attainment | Women with Births | Births / 1,000 Women |
| Less than High School | 0 (0.0%) | 0.0 |
| High School Diploma | 0 (0.0%) | 0.0 |
| College or Associate's Degree | 4 (57.1%) | 59.0 |
| Bachelor's Degree | 3 (42.9%) | 231.0 |
| Graduate Degree | 0 (0.0%) | 0.0 |
| Total | 7 (100.0%) | 53.0 |
Fertility by Education by Marriage Status in Carlton
57.1% of women with births in Carlton are unmarried. Women with the educational attainment of bachelor's degree are most likely to be married with 100.0% of them married at childbirth, while women with the educational attainment of college or associate's degree are least likely to be married with 100.0% of them unmarried at childbirth.
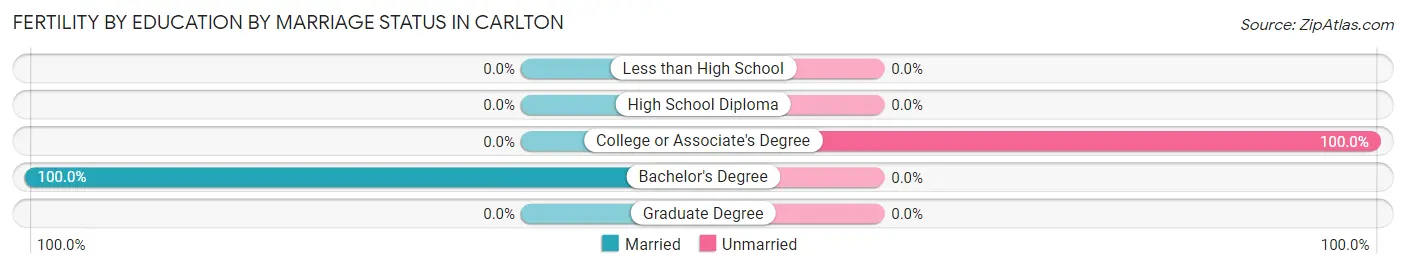
| Educational Attainment | Married | Unmarried |
| Less than High School | 0 (0.0%) | 0 (0.0%) |
| High School Diploma | 0 (0.0%) | 0 (0.0%) |
| College or Associate's Degree | 0 (0.0%) | 4 (100.0%) |
| Bachelor's Degree | 3 (100.0%) | 0 (0.0%) |
| Graduate Degree | 0 (0.0%) | 0 (0.0%) |
| Total | 3 (42.9%) | 4 (57.1%) |
Employment Characteristics in Carlton
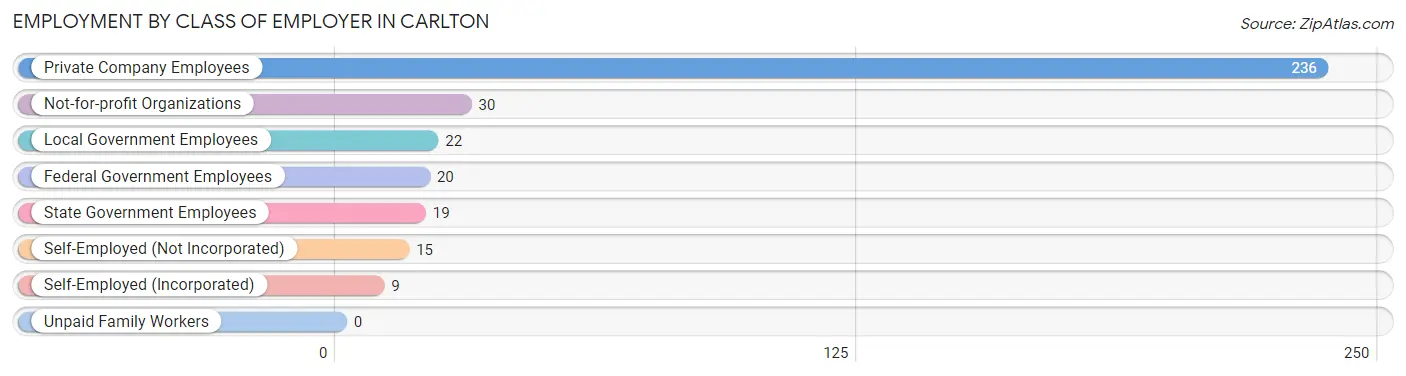
Employment by Class of Employer in Carlton
Among the 351 employed individuals in Carlton, private company employees (236 | 67.2%), not-for-profit organizations (30 | 8.6%), and local government employees (22 | 6.3%) make up the most common classes of employment.
| Employer Class | # Employees | % Employees |
| Private Company Employees | 236 | 67.2% |
| Self-Employed (Incorporated) | 9 | 2.6% |
| Self-Employed (Not Incorporated) | 15 | 4.3% |
| Not-for-profit Organizations | 30 | 8.6% |
| Local Government Employees | 22 | 6.3% |
| State Government Employees | 19 | 5.4% |
| Federal Government Employees | 20 | 5.7% |
| Unpaid Family Workers | 0 | 0.0% |
| Total | 351 | 100.0% |
Employment Status by Age in Carlton
According to the labor force statistics for Carlton, out of the total population over 16 years of age (815), 50.2% or 409 individuals are in the labor force, with 13.0% or 53 of them unemployed. The age group with the highest labor force participation rate is 30 to 34 years, with 88.5% or 23 individuals in the labor force. Within the labor force, the 16 to 19 years age range has the highest percentage of unemployed individuals, with 45.9% or 17 of them being unemployed.
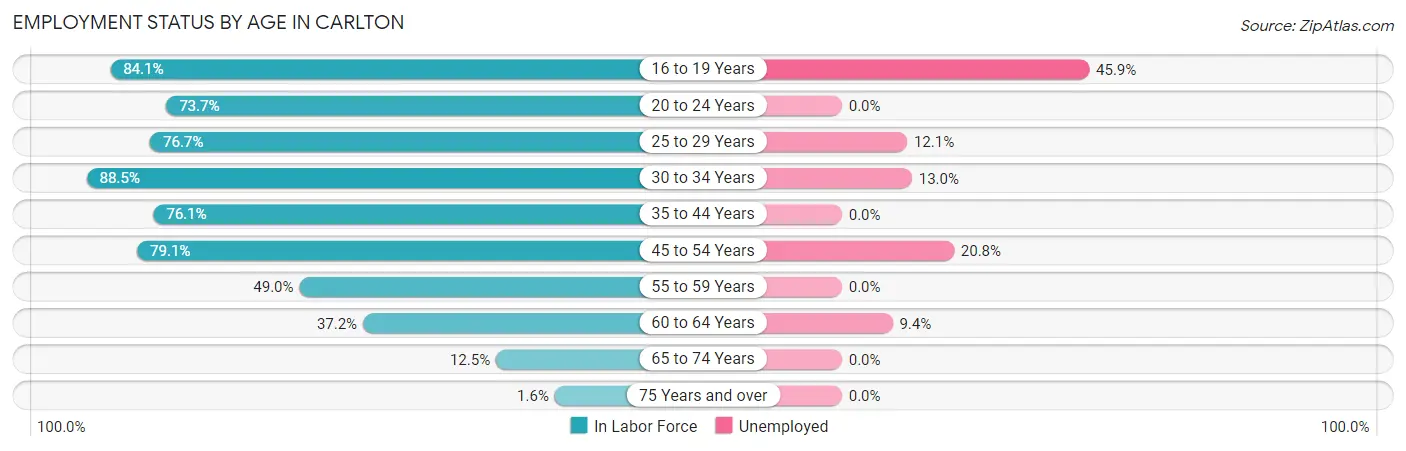
| Age Bracket | In Labor Force | Unemployed |
| 16 to 19 Years | 37 (84.1%) | 17 (45.9%) |
| 20 to 24 Years | 14 (73.7%) | 0 (0.0%) |
| 25 to 29 Years | 33 (76.7%) | 4 (12.1%) |
| 30 to 34 Years | 23 (88.5%) | 3 (13.0%) |
| 35 to 44 Years | 102 (76.1%) | 0 (0.0%) |
| 45 to 54 Years | 125 (79.1%) | 26 (20.8%) |
| 55 to 59 Years | 25 (49.0%) | 0 (0.0%) |
| 60 to 64 Years | 32 (37.2%) | 3 (9.4%) |
| 65 to 74 Years | 16 (12.5%) | 0 (0.0%) |
| 75 Years and over | 2 (1.6%) | 0 (0.0%) |
| Total | 409 (50.2%) | 53 (13.0%) |
Employment Status by Educational Attainment in Carlton
According to labor force statistics for Carlton, 68.3% of individuals (340) out of the total population between 25 and 64 years of age (498) are in the labor force, with 10.6% or 36 of them being unemployed. The group with the highest labor force participation rate are those with the educational attainment of college / associate degree, with 74.8% or 151 individuals in the labor force. Within the labor force, individuals with less than high school education have the highest percentage of unemployment, with 33.3% or 3 of them being unemployed.
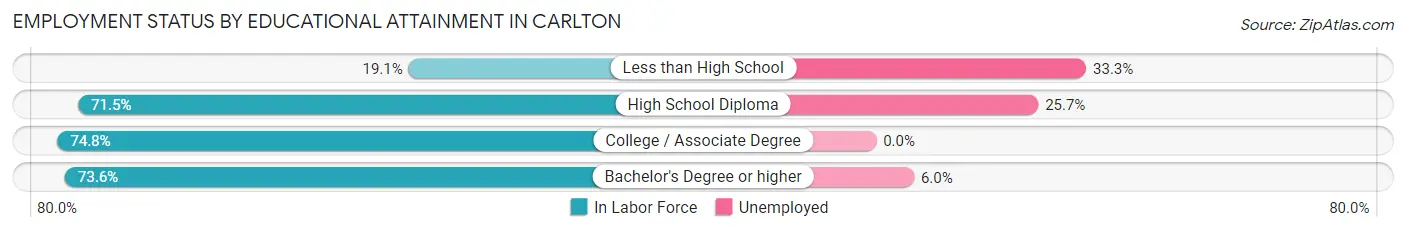
| Educational Attainment | In Labor Force | Unemployed |
| Less than High School | 9 (19.1%) | 16 (33.3%) |
| High School Diploma | 113 (71.5%) | 41 (25.7%) |
| College / Associate Degree | 151 (74.8%) | 0 (0.0%) |
| Bachelor's Degree or higher | 67 (73.6%) | 5 (6.0%) |
| Total | 340 (68.3%) | 53 (10.6%) |
Employment Occupations by Sex in Carlton
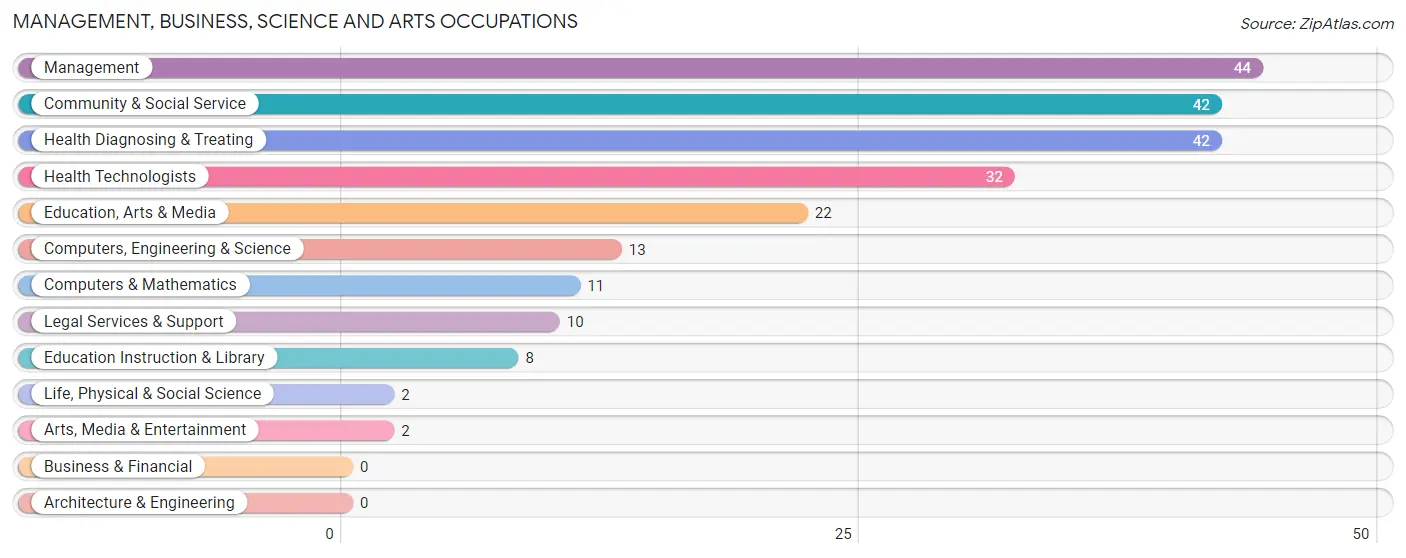
Management, Business, Science and Arts Occupations
The most common Management, Business, Science and Arts occupations in Carlton are Management (44 | 12.4%), Community & Social Service (42 | 11.8%), Health Diagnosing & Treating (42 | 11.8%), Health Technologists (32 | 9.0%), and Education, Arts & Media (22 | 6.2%).
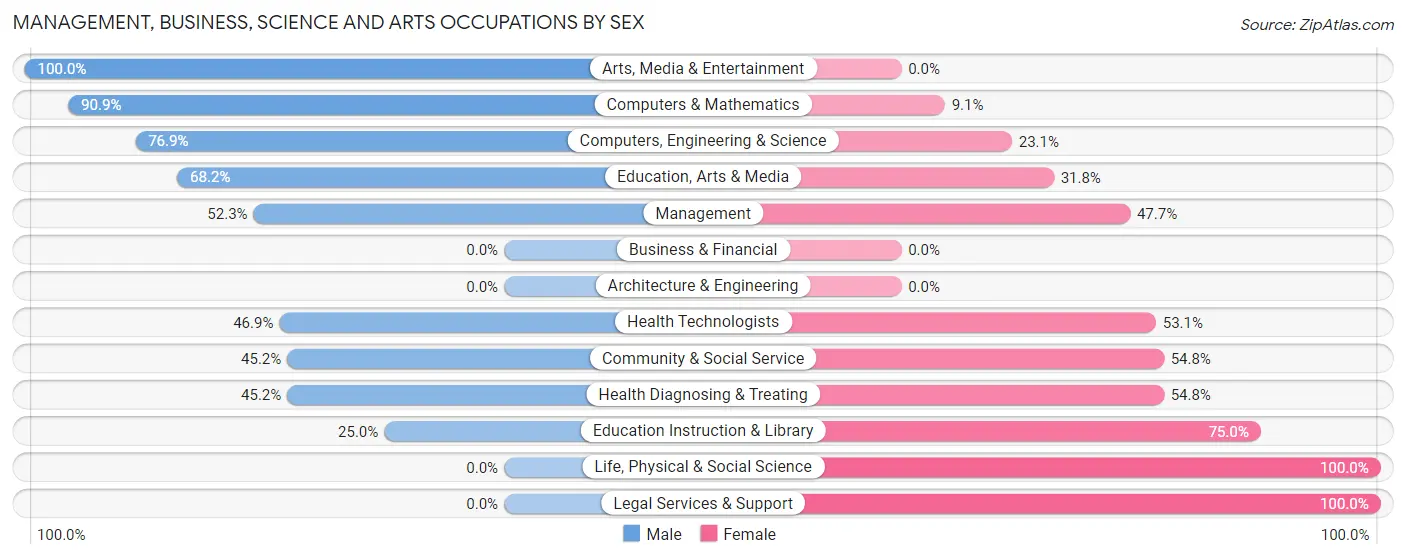
Management, Business, Science and Arts Occupations by Sex
Within the Management, Business, Science and Arts occupations in Carlton, the most male-oriented occupations are Arts, Media & Entertainment (100.0%), Computers & Mathematics (90.9%), and Computers, Engineering & Science (76.9%), while the most female-oriented occupations are Life, Physical & Social Science (100.0%), Legal Services & Support (100.0%), and Education Instruction & Library (75.0%).
| Occupation | Male | Female |
| Management | 23 (52.3%) | 21 (47.7%) |
| Business & Financial | 0 (0.0%) | 0 (0.0%) |
| Computers, Engineering & Science | 10 (76.9%) | 3 (23.1%) |
| Computers & Mathematics | 10 (90.9%) | 1 (9.1%) |
| Architecture & Engineering | 0 (0.0%) | 0 (0.0%) |
| Life, Physical & Social Science | 0 (0.0%) | 2 (100.0%) |
| Community & Social Service | 19 (45.2%) | 23 (54.8%) |
| Education, Arts & Media | 15 (68.2%) | 7 (31.8%) |
| Legal Services & Support | 0 (0.0%) | 10 (100.0%) |
| Education Instruction & Library | 2 (25.0%) | 6 (75.0%) |
| Arts, Media & Entertainment | 2 (100.0%) | 0 (0.0%) |
| Health Diagnosing & Treating | 19 (45.2%) | 23 (54.8%) |
| Health Technologists | 15 (46.9%) | 17 (53.1%) |
| Total (Category) | 71 (50.3%) | 70 (49.6%) |
| Total (Overall) | 198 (55.6%) | 158 (44.4%) |
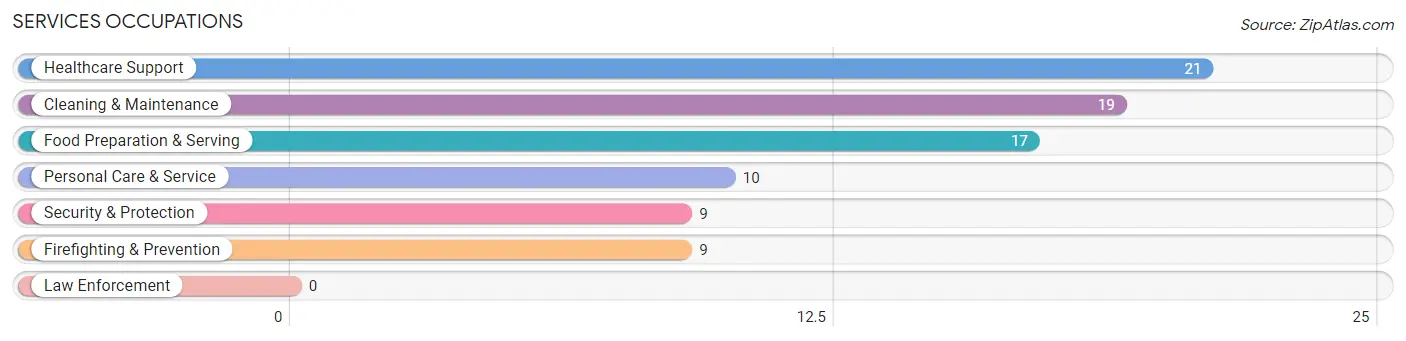
Services Occupations
The most common Services occupations in Carlton are Healthcare Support (21 | 5.9%), Cleaning & Maintenance (19 | 5.3%), Food Preparation & Serving (17 | 4.8%), Personal Care & Service (10 | 2.8%), and Security & Protection (9 | 2.5%).
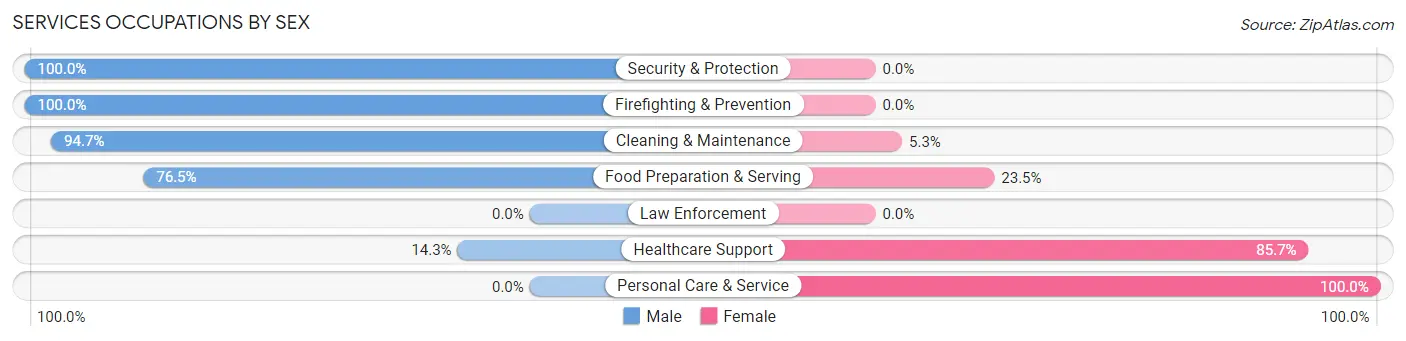
Services Occupations by Sex
Within the Services occupations in Carlton, the most male-oriented occupations are Security & Protection (100.0%), Firefighting & Prevention (100.0%), and Cleaning & Maintenance (94.7%), while the most female-oriented occupations are Personal Care & Service (100.0%), Healthcare Support (85.7%), and Food Preparation & Serving (23.5%).
| Occupation | Male | Female |
| Healthcare Support | 3 (14.3%) | 18 (85.7%) |
| Security & Protection | 9 (100.0%) | 0 (0.0%) |
| Firefighting & Prevention | 9 (100.0%) | 0 (0.0%) |
| Law Enforcement | 0 (0.0%) | 0 (0.0%) |
| Food Preparation & Serving | 13 (76.5%) | 4 (23.5%) |
| Cleaning & Maintenance | 18 (94.7%) | 1 (5.3%) |
| Personal Care & Service | 0 (0.0%) | 10 (100.0%) |
| Total (Category) | 43 (56.6%) | 33 (43.4%) |
| Total (Overall) | 198 (55.6%) | 158 (44.4%) |
Sales and Office Occupations
The most common Sales and Office occupations in Carlton are Sales & Related (32 | 9.0%), and Office & Administration (18 | 5.1%).
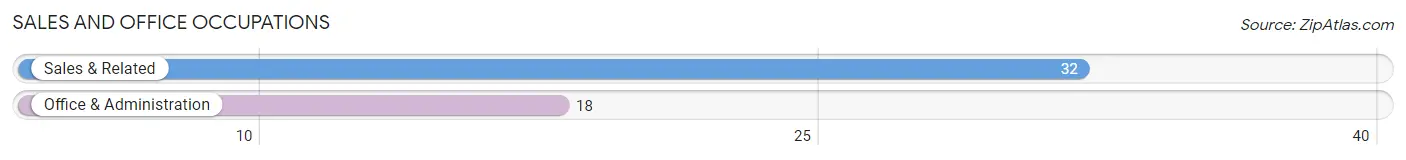
Sales and Office Occupations by Sex
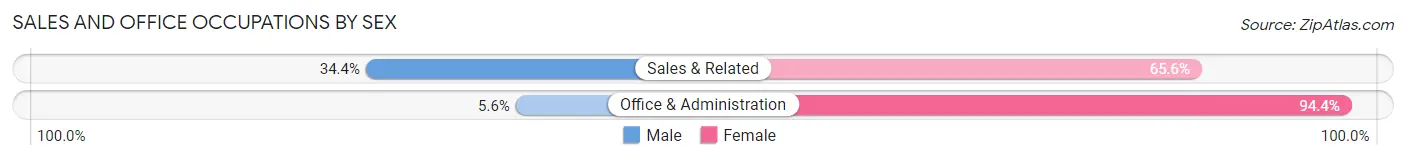
| Occupation | Male | Female |
| Sales & Related | 11 (34.4%) | 21 (65.6%) |
| Office & Administration | 1 (5.6%) | 17 (94.4%) |
| Total (Category) | 12 (24.0%) | 38 (76.0%) |
| Total (Overall) | 198 (55.6%) | 158 (44.4%) |
Natural Resources, Construction and Maintenance Occupations
The most common Natural Resources, Construction and Maintenance occupations in Carlton are Installation, Maintenance & Repair (12 | 3.4%), and Construction & Extraction (9 | 2.5%).
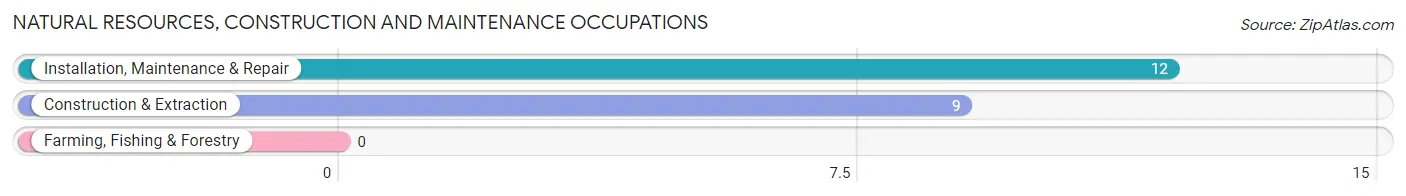
Natural Resources, Construction and Maintenance Occupations by Sex
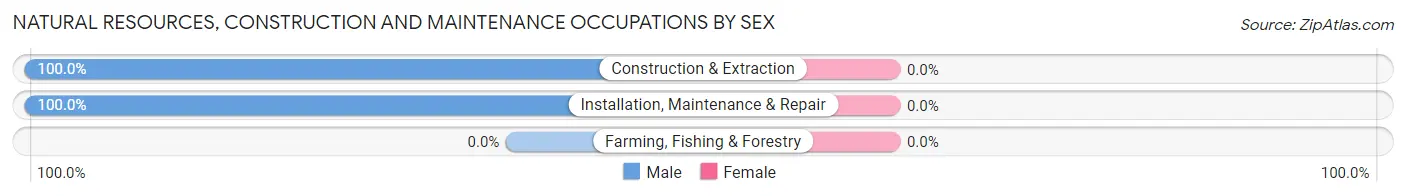
| Occupation | Male | Female |
| Farming, Fishing & Forestry | 0 (0.0%) | 0 (0.0%) |
| Construction & Extraction | 9 (100.0%) | 0 (0.0%) |
| Installation, Maintenance & Repair | 12 (100.0%) | 0 (0.0%) |
| Total (Category) | 21 (100.0%) | 0 (0.0%) |
| Total (Overall) | 198 (55.6%) | 158 (44.4%) |
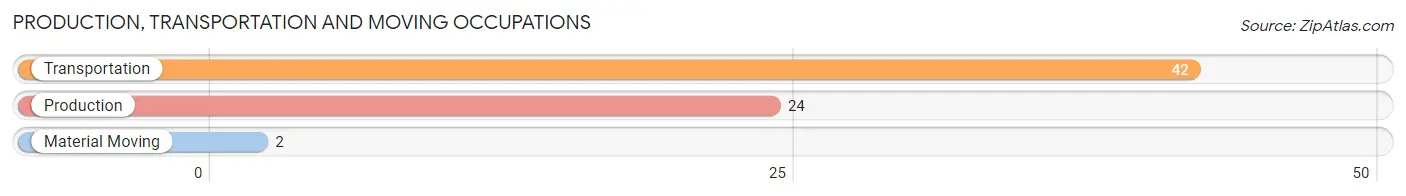
Production, Transportation and Moving Occupations
The most common Production, Transportation and Moving occupations in Carlton are Transportation (42 | 11.8%), Production (24 | 6.7%), and Material Moving (2 | 0.6%).
Production, Transportation and Moving Occupations by Sex
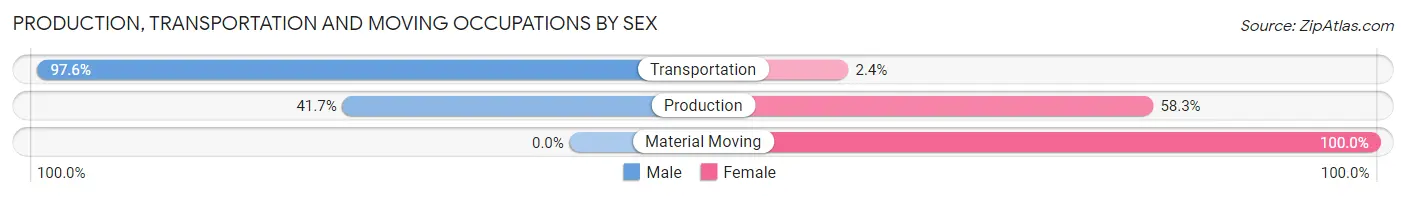
| Occupation | Male | Female |
| Production | 10 (41.7%) | 14 (58.3%) |
| Transportation | 41 (97.6%) | 1 (2.4%) |
| Material Moving | 0 (0.0%) | 2 (100.0%) |
| Total (Category) | 51 (75.0%) | 17 (25.0%) |
| Total (Overall) | 198 (55.6%) | 158 (44.4%) |
Employment Industries by Sex in Carlton
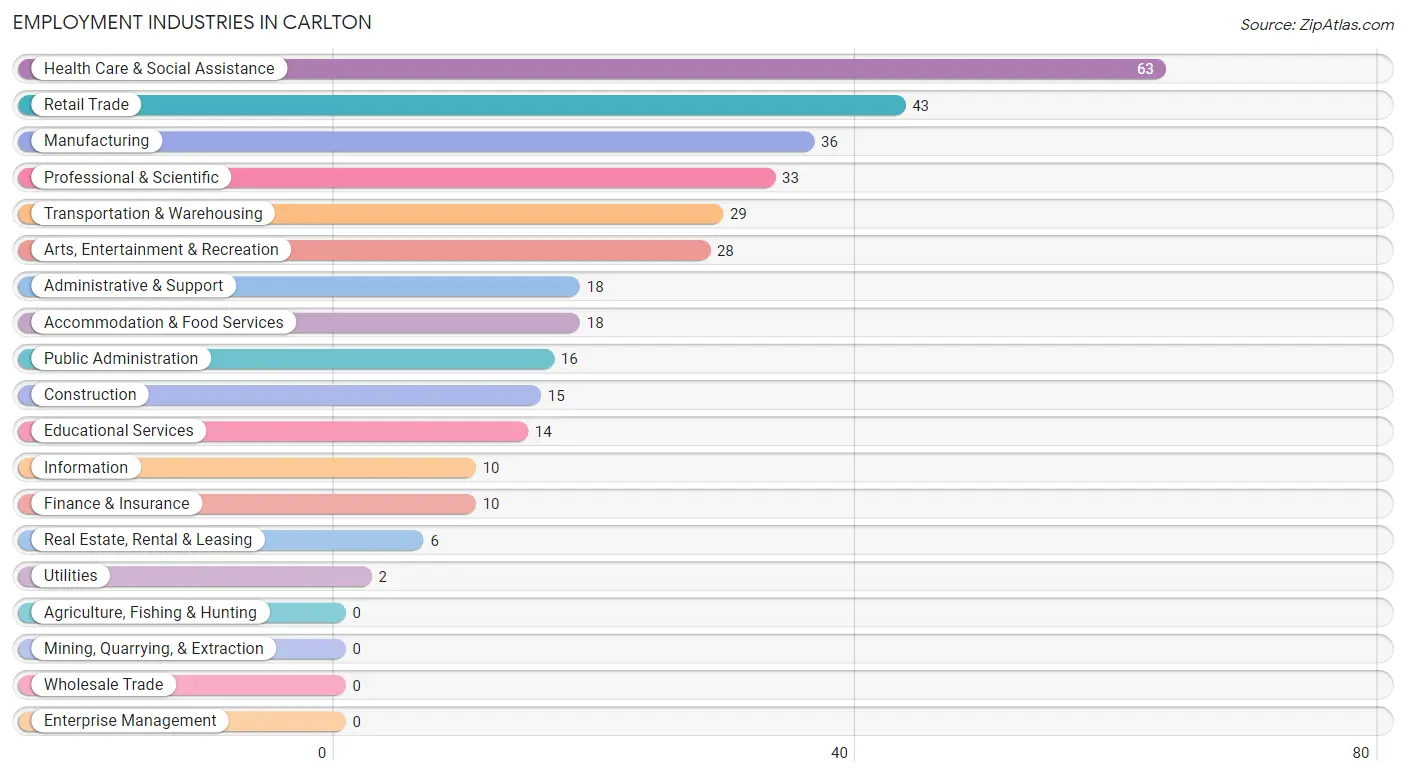
Employment Industries in Carlton
The major employment industries in Carlton include Health Care & Social Assistance (63 | 17.7%), Retail Trade (43 | 12.1%), Manufacturing (36 | 10.1%), Professional & Scientific (33 | 9.3%), and Transportation & Warehousing (29 | 8.2%).
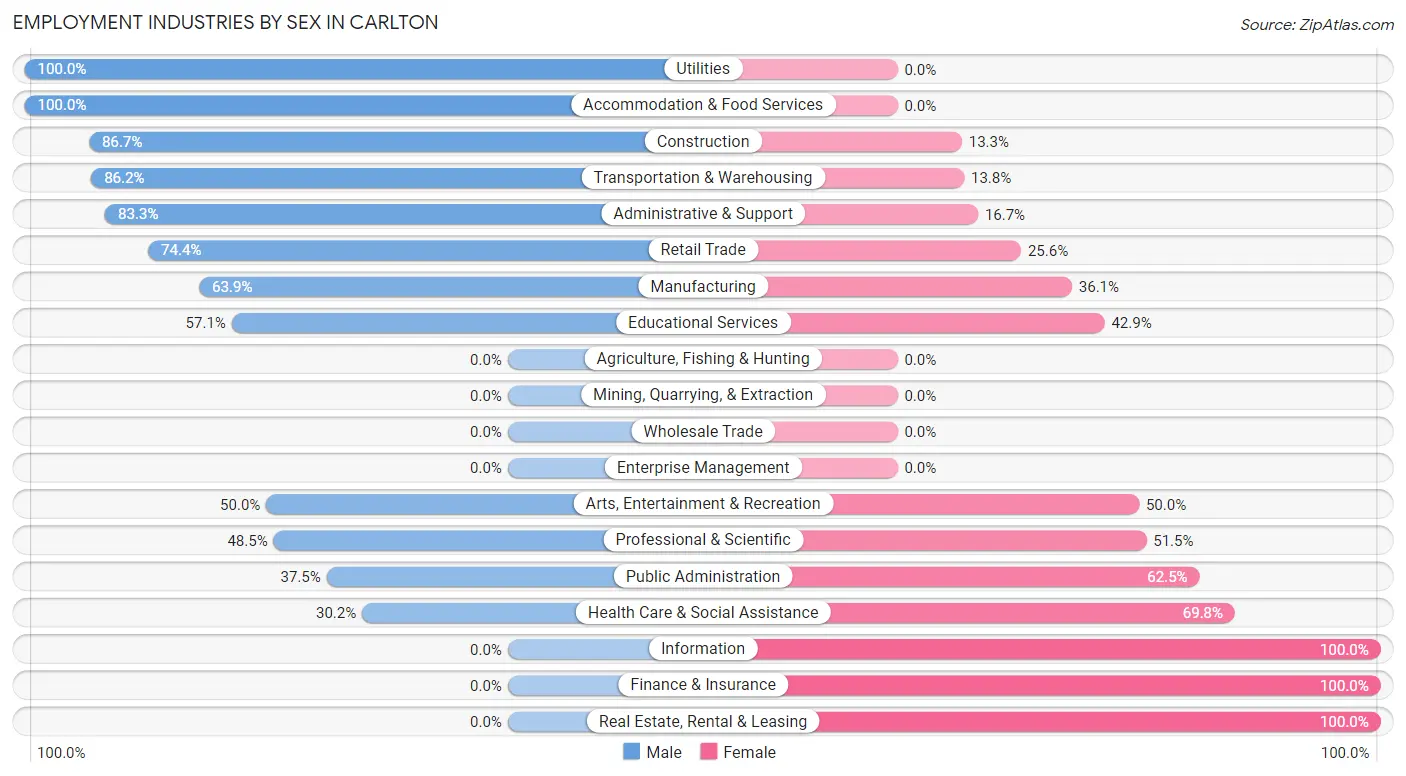
Employment Industries by Sex in Carlton
The Carlton industries that see more men than women are Utilities (100.0%), Accommodation & Food Services (100.0%), and Construction (86.7%), whereas the industries that tend to have a higher number of women are Information (100.0%), Finance & Insurance (100.0%), and Real Estate, Rental & Leasing (100.0%).
| Industry | Male | Female |
| Agriculture, Fishing & Hunting | 0 (0.0%) | 0 (0.0%) |
| Mining, Quarrying, & Extraction | 0 (0.0%) | 0 (0.0%) |
| Construction | 13 (86.7%) | 2 (13.3%) |
| Manufacturing | 23 (63.9%) | 13 (36.1%) |
| Wholesale Trade | 0 (0.0%) | 0 (0.0%) |
| Retail Trade | 32 (74.4%) | 11 (25.6%) |
| Transportation & Warehousing | 25 (86.2%) | 4 (13.8%) |
| Utilities | 2 (100.0%) | 0 (0.0%) |
| Information | 0 (0.0%) | 10 (100.0%) |
| Finance & Insurance | 0 (0.0%) | 10 (100.0%) |
| Real Estate, Rental & Leasing | 0 (0.0%) | 6 (100.0%) |
| Professional & Scientific | 16 (48.5%) | 17 (51.5%) |
| Enterprise Management | 0 (0.0%) | 0 (0.0%) |
| Administrative & Support | 15 (83.3%) | 3 (16.7%) |
| Educational Services | 8 (57.1%) | 6 (42.9%) |
| Health Care & Social Assistance | 19 (30.2%) | 44 (69.8%) |
| Arts, Entertainment & Recreation | 14 (50.0%) | 14 (50.0%) |
| Accommodation & Food Services | 18 (100.0%) | 0 (0.0%) |
| Public Administration | 6 (37.5%) | 10 (62.5%) |
| Total | 198 (55.6%) | 158 (44.4%) |
Education in Carlton
School Enrollment in Carlton
The most common levels of schooling among the 189 students in Carlton are high school (68 | 36.0%), elementary school (52 | 27.5%), and middle school (36 | 19.1%).
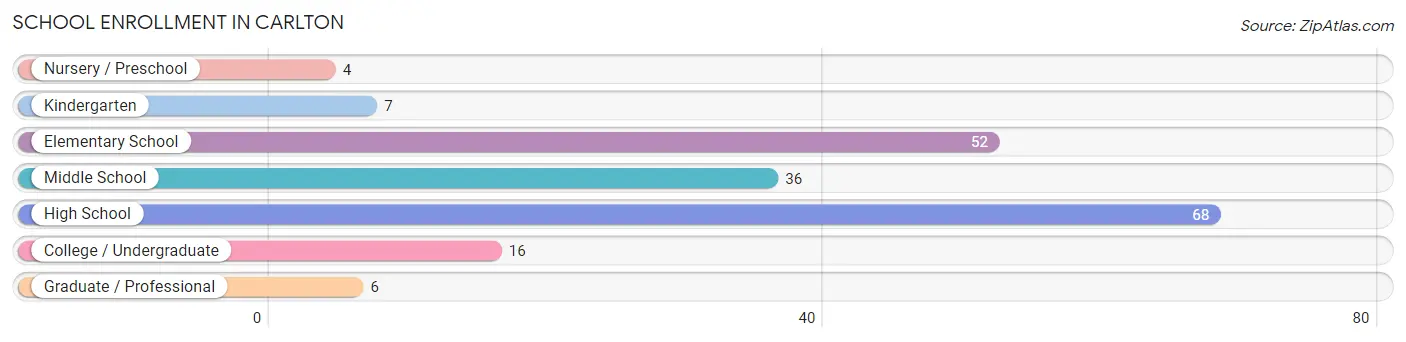
| School Level | # Students | % Students |
| Nursery / Preschool | 4 | 2.1% |
| Kindergarten | 7 | 3.7% |
| Elementary School | 52 | 27.5% |
| Middle School | 36 | 19.1% |
| High School | 68 | 36.0% |
| College / Undergraduate | 16 | 8.5% |
| Graduate / Professional | 6 | 3.2% |
| Total | 189 | 100.0% |
School Enrollment by Age by Funding Source in Carlton
Out of a total of 189 students who are enrolled in schools in Carlton, 27 (14.3%) attend a private institution, while the remaining 162 (85.7%) are enrolled in public schools. The age group of 35 years and over has the highest likelihood of being enrolled in private schools, with 12 (60.0% in the age bracket) enrolled. Conversely, the age group of 3 to 4 year olds has the lowest likelihood of being enrolled in a private school, with 1 (100.0% in the age bracket) attending a public institution.
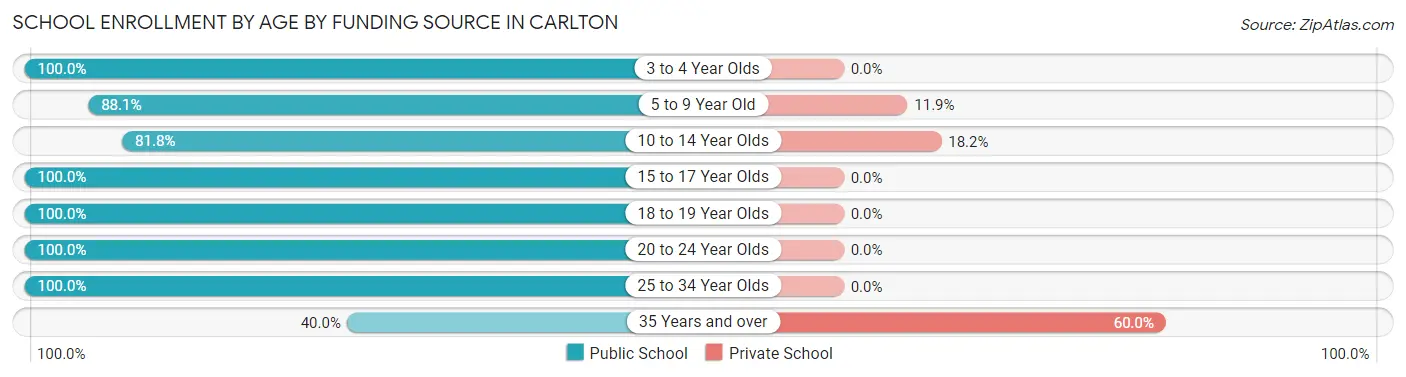
| Age Bracket | Public School | Private School |
| 3 to 4 Year Olds | 1 (100.0%) | 0 (0.0%) |
| 5 to 9 Year Old | 52 (88.1%) | 7 (11.9%) |
| 10 to 14 Year Olds | 36 (81.8%) | 8 (18.2%) |
| 15 to 17 Year Olds | 44 (100.0%) | 0 (0.0%) |
| 18 to 19 Year Olds | 15 (100.0%) | 0 (0.0%) |
| 20 to 24 Year Olds | 5 (100.0%) | 0 (0.0%) |
| 25 to 34 Year Olds | 1 (100.0%) | 0 (0.0%) |
| 35 Years and over | 8 (40.0%) | 12 (60.0%) |
| Total | 162 (85.7%) | 27 (14.3%) |
Educational Attainment by Field of Study in Carlton
Education (46 | 30.1%), business (34 | 22.2%), arts & humanities (21 | 13.7%), liberal arts & history (18 | 11.8%), and computers & mathematics (9 | 5.9%) are the most common fields of study among 153 individuals in Carlton who have obtained a bachelor's degree or higher.

| Field of Study | # Graduates | % Graduates |
| Computers & Mathematics | 9 | 5.9% |
| Bio, Nature & Agricultural | 4 | 2.6% |
| Physical & Health Sciences | 1 | 0.6% |
| Psychology | 3 | 2.0% |
| Social Sciences | 4 | 2.6% |
| Engineering | 0 | 0.0% |
| Multidisciplinary Studies | 0 | 0.0% |
| Science & Technology | 8 | 5.2% |
| Business | 34 | 22.2% |
| Education | 46 | 30.1% |
| Literature & Languages | 2 | 1.3% |
| Liberal Arts & History | 18 | 11.8% |
| Visual & Performing Arts | 0 | 0.0% |
| Communications | 3 | 2.0% |
| Arts & Humanities | 21 | 13.7% |
| Total | 153 | 100.0% |
Transportation & Commute in Carlton
Vehicle Availability by Sex in Carlton
The most prevalent vehicle ownership categories in Carlton are males with 2 vehicles (76, accounting for 40.2%) and females with 2 vehicles (74, making up 48.4%).
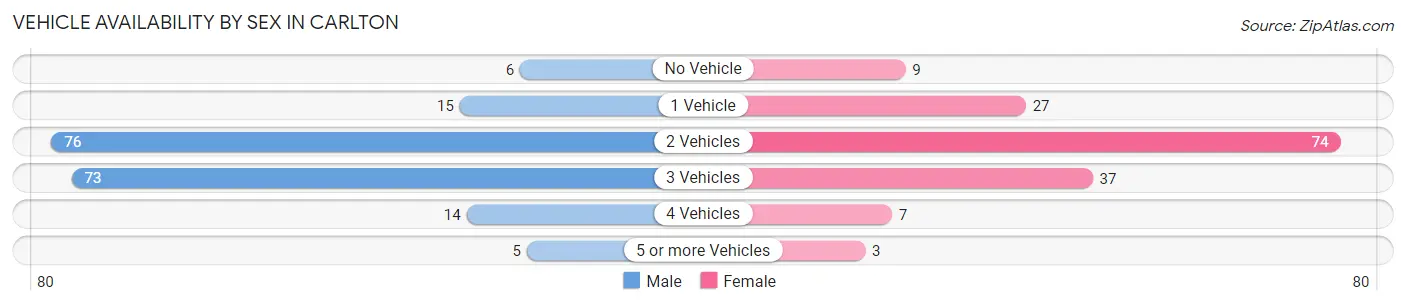
| Vehicles Available | Male | Female |
| No Vehicle | 6 (3.2%) | 9 (5.7%) |
| 1 Vehicle | 15 (7.9%) | 27 (17.2%) |
| 2 Vehicles | 76 (40.2%) | 74 (47.1%) |
| 3 Vehicles | 73 (38.6%) | 37 (23.6%) |
| 4 Vehicles | 14 (7.4%) | 7 (4.5%) |
| 5 or more Vehicles | 5 (2.6%) | 3 (1.9%) |
| Total | 189 (100.0%) | 157 (100.0%) |
Commute Time in Carlton
The most frequently occuring commute durations in Carlton are 10 to 14 minutes (91 commuters, 28.9%), 5 to 9 minutes (51 commuters, 16.2%), and 30 to 34 minutes (35 commuters, 11.1%).
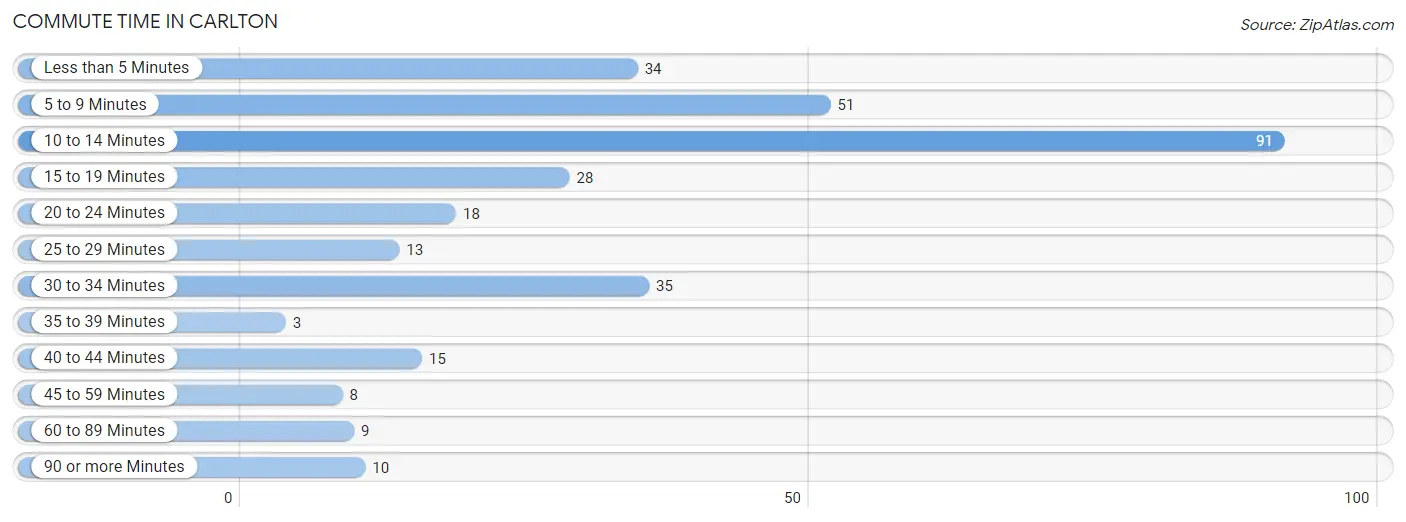
| Commute Time | # Commuters | % Commuters |
| Less than 5 Minutes | 34 | 10.8% |
| 5 to 9 Minutes | 51 | 16.2% |
| 10 to 14 Minutes | 91 | 28.9% |
| 15 to 19 Minutes | 28 | 8.9% |
| 20 to 24 Minutes | 18 | 5.7% |
| 25 to 29 Minutes | 13 | 4.1% |
| 30 to 34 Minutes | 35 | 11.1% |
| 35 to 39 Minutes | 3 | 0.9% |
| 40 to 44 Minutes | 15 | 4.8% |
| 45 to 59 Minutes | 8 | 2.5% |
| 60 to 89 Minutes | 9 | 2.9% |
| 90 or more Minutes | 10 | 3.2% |
Commute Time by Sex in Carlton
The most common commute times in Carlton are 10 to 14 minutes (44 commuters, 24.9%) for males and 10 to 14 minutes (47 commuters, 34.1%) for females.
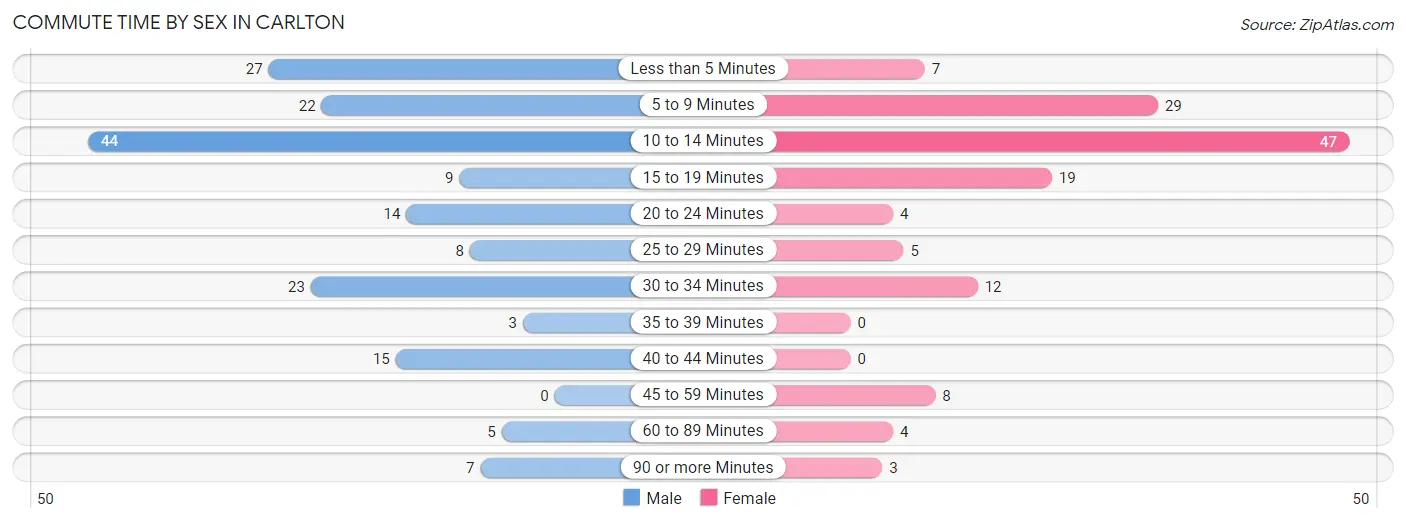
| Commute Time | Male | Female |
| Less than 5 Minutes | 27 (15.2%) | 7 (5.1%) |
| 5 to 9 Minutes | 22 (12.4%) | 29 (21.0%) |
| 10 to 14 Minutes | 44 (24.9%) | 47 (34.1%) |
| 15 to 19 Minutes | 9 (5.1%) | 19 (13.8%) |
| 20 to 24 Minutes | 14 (7.9%) | 4 (2.9%) |
| 25 to 29 Minutes | 8 (4.5%) | 5 (3.6%) |
| 30 to 34 Minutes | 23 (13.0%) | 12 (8.7%) |
| 35 to 39 Minutes | 3 (1.7%) | 0 (0.0%) |
| 40 to 44 Minutes | 15 (8.5%) | 0 (0.0%) |
| 45 to 59 Minutes | 0 (0.0%) | 8 (5.8%) |
| 60 to 89 Minutes | 5 (2.8%) | 4 (2.9%) |
| 90 or more Minutes | 7 (4.0%) | 3 (2.2%) |
Time of Departure to Work by Sex in Carlton
The most frequent times of departure to work in Carlton are 5:00 AM to 5:29 AM (28, 15.8%) for males and 12:00 PM to 3:59 PM (31, 22.5%) for females.
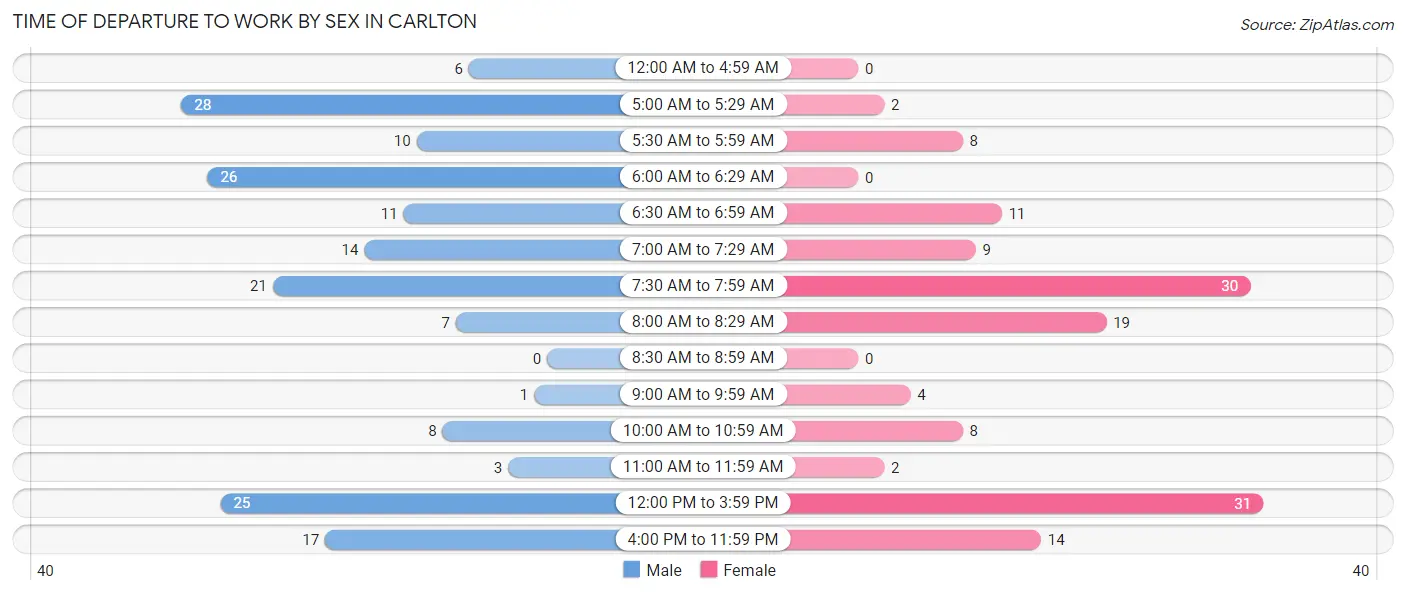
| Time of Departure | Male | Female |
| 12:00 AM to 4:59 AM | 6 (3.4%) | 0 (0.0%) |
| 5:00 AM to 5:29 AM | 28 (15.8%) | 2 (1.5%) |
| 5:30 AM to 5:59 AM | 10 (5.7%) | 8 (5.8%) |
| 6:00 AM to 6:29 AM | 26 (14.7%) | 0 (0.0%) |
| 6:30 AM to 6:59 AM | 11 (6.2%) | 11 (8.0%) |
| 7:00 AM to 7:29 AM | 14 (7.9%) | 9 (6.5%) |
| 7:30 AM to 7:59 AM | 21 (11.9%) | 30 (21.7%) |
| 8:00 AM to 8:29 AM | 7 (4.0%) | 19 (13.8%) |
| 8:30 AM to 8:59 AM | 0 (0.0%) | 0 (0.0%) |
| 9:00 AM to 9:59 AM | 1 (0.6%) | 4 (2.9%) |
| 10:00 AM to 10:59 AM | 8 (4.5%) | 8 (5.8%) |
| 11:00 AM to 11:59 AM | 3 (1.7%) | 2 (1.5%) |
| 12:00 PM to 3:59 PM | 25 (14.1%) | 31 (22.5%) |
| 4:00 PM to 11:59 PM | 17 (9.6%) | 14 (10.1%) |
| Total | 177 (100.0%) | 138 (100.0%) |
Housing Occupancy in Carlton
Occupancy by Ownership in Carlton
Of the total 395 dwellings in Carlton, owner-occupied units account for 265 (67.1%), while renter-occupied units make up 130 (32.9%).
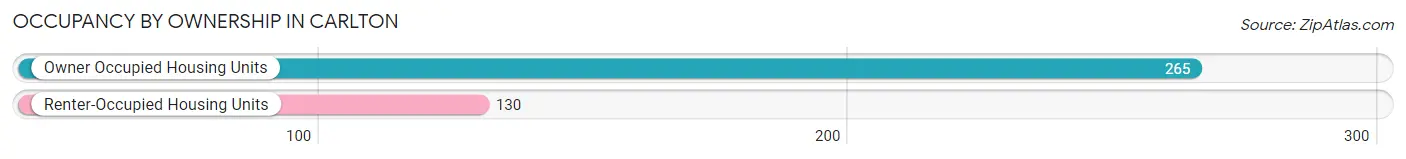
| Occupancy | # Housing Units | % Housing Units |
| Owner Occupied Housing Units | 265 | 67.1% |
| Renter-Occupied Housing Units | 130 | 32.9% |
| Total Occupied Housing Units | 395 | 100.0% |
Occupancy by Household Size in Carlton
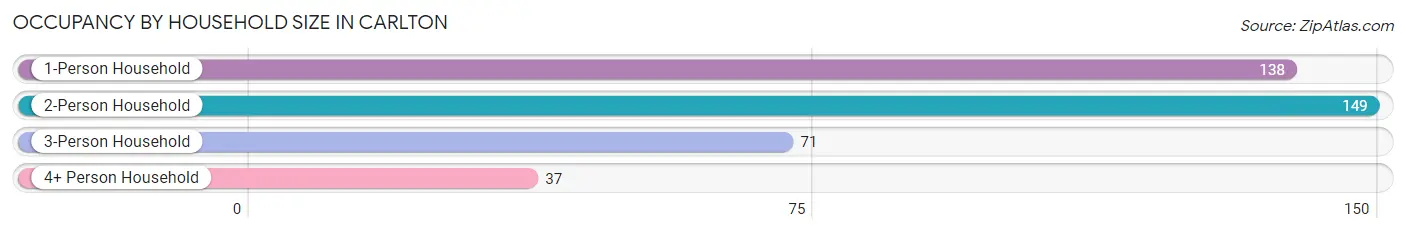
| Household Size | # Housing Units | % Housing Units |
| 1-Person Household | 138 | 34.9% |
| 2-Person Household | 149 | 37.7% |
| 3-Person Household | 71 | 18.0% |
| 4+ Person Household | 37 | 9.4% |
| Total Housing Units | 395 | 100.0% |
Occupancy by Ownership by Household Size in Carlton
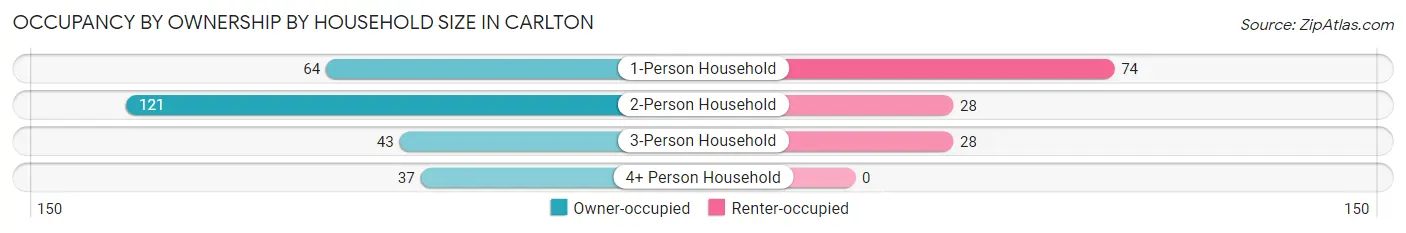
| Household Size | Owner-occupied | Renter-occupied |
| 1-Person Household | 64 (46.4%) | 74 (53.6%) |
| 2-Person Household | 121 (81.2%) | 28 (18.8%) |
| 3-Person Household | 43 (60.6%) | 28 (39.4%) |
| 4+ Person Household | 37 (100.0%) | 0 (0.0%) |
| Total Housing Units | 265 (67.1%) | 130 (32.9%) |
Occupancy by Educational Attainment in Carlton
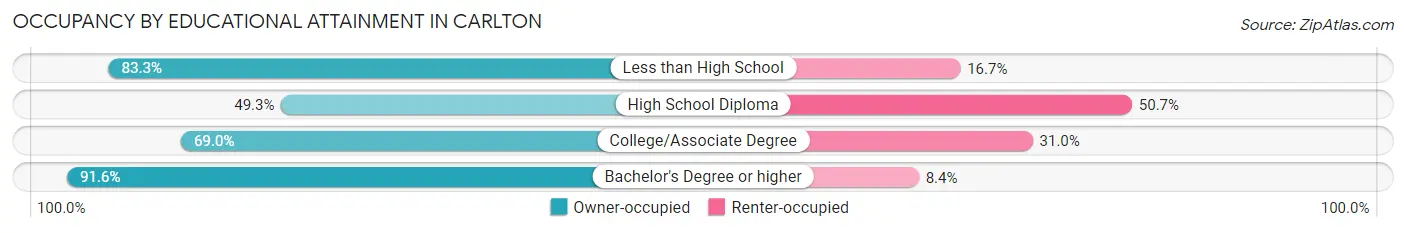
| Household Size | Owner-occupied | Renter-occupied |
| Less than High School | 10 (83.3%) | 2 (16.7%) |
| High School Diploma | 70 (49.3%) | 72 (50.7%) |
| College/Associate Degree | 109 (69.0%) | 49 (31.0%) |
| Bachelor's Degree or higher | 76 (91.6%) | 7 (8.4%) |
Occupancy by Age of Householder in Carlton
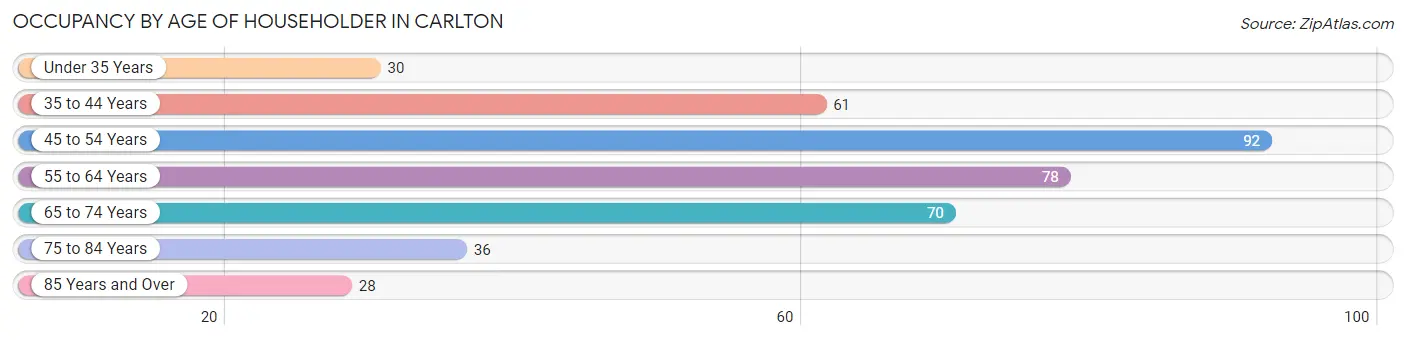
| Age Bracket | # Households | % Households |
| Under 35 Years | 30 | 7.6% |
| 35 to 44 Years | 61 | 15.4% |
| 45 to 54 Years | 92 | 23.3% |
| 55 to 64 Years | 78 | 19.8% |
| 65 to 74 Years | 70 | 17.7% |
| 75 to 84 Years | 36 | 9.1% |
| 85 Years and Over | 28 | 7.1% |
| Total | 395 | 100.0% |
Housing Finances in Carlton
Median Income by Occupancy in Carlton
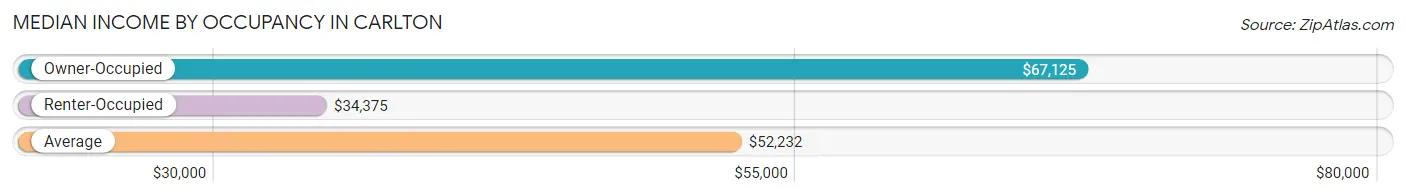
| Occupancy Type | # Households | Median Income |
| Owner-Occupied | 265 (67.1%) | $67,125 |
| Renter-Occupied | 130 (32.9%) | $34,375 |
| Average | 395 (100.0%) | $52,232 |
Occupancy by Householder Income Bracket in Carlton
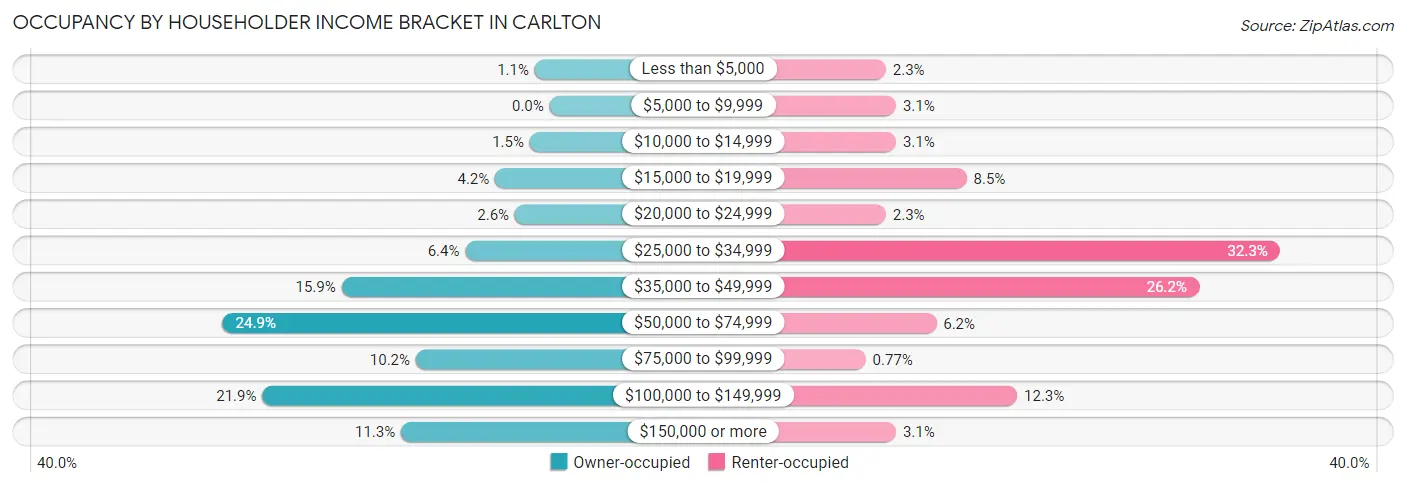
| Income Bracket | Owner-occupied | Renter-occupied |
| Less than $5,000 | 3 (1.1%) | 3 (2.3%) |
| $5,000 to $9,999 | 0 (0.0%) | 4 (3.1%) |
| $10,000 to $14,999 | 4 (1.5%) | 4 (3.1%) |
| $15,000 to $19,999 | 11 (4.2%) | 11 (8.5%) |
| $20,000 to $24,999 | 7 (2.6%) | 3 (2.3%) |
| $25,000 to $34,999 | 17 (6.4%) | 42 (32.3%) |
| $35,000 to $49,999 | 42 (15.9%) | 34 (26.2%) |
| $50,000 to $74,999 | 66 (24.9%) | 8 (6.1%) |
| $75,000 to $99,999 | 27 (10.2%) | 1 (0.8%) |
| $100,000 to $149,999 | 58 (21.9%) | 16 (12.3%) |
| $150,000 or more | 30 (11.3%) | 4 (3.1%) |
| Total | 265 (100.0%) | 130 (100.0%) |
Monthly Housing Cost Tiers in Carlton
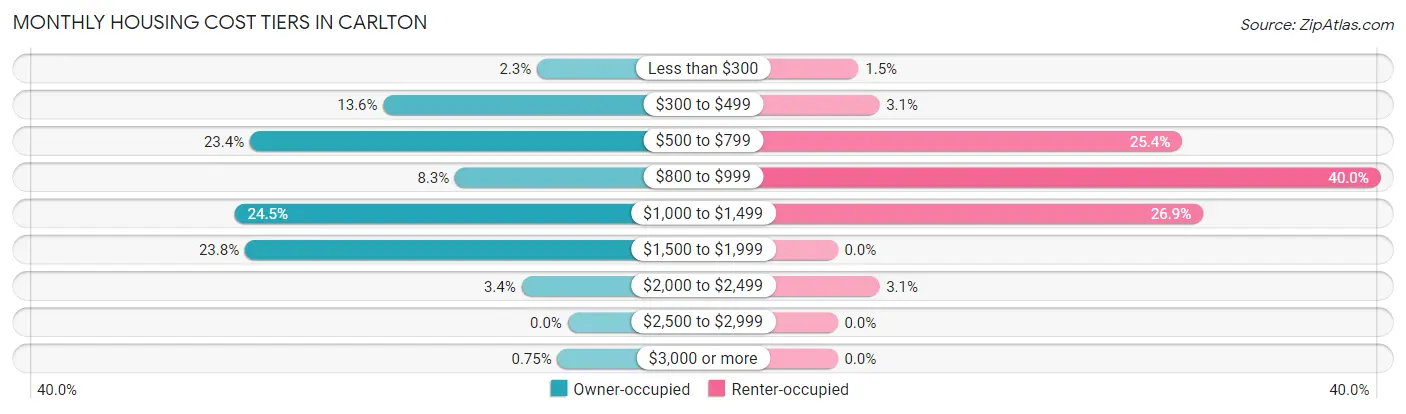
| Monthly Cost | Owner-occupied | Renter-occupied |
| Less than $300 | 6 (2.3%) | 2 (1.5%) |
| $300 to $499 | 36 (13.6%) | 4 (3.1%) |
| $500 to $799 | 62 (23.4%) | 33 (25.4%) |
| $800 to $999 | 22 (8.3%) | 52 (40.0%) |
| $1,000 to $1,499 | 65 (24.5%) | 35 (26.9%) |
| $1,500 to $1,999 | 63 (23.8%) | 0 (0.0%) |
| $2,000 to $2,499 | 9 (3.4%) | 4 (3.1%) |
| $2,500 to $2,999 | 0 (0.0%) | 0 (0.0%) |
| $3,000 or more | 2 (0.7%) | 0 (0.0%) |
| Total | 265 (100.0%) | 130 (100.0%) |
Physical Housing Characteristics in Carlton
Housing Structures in Carlton
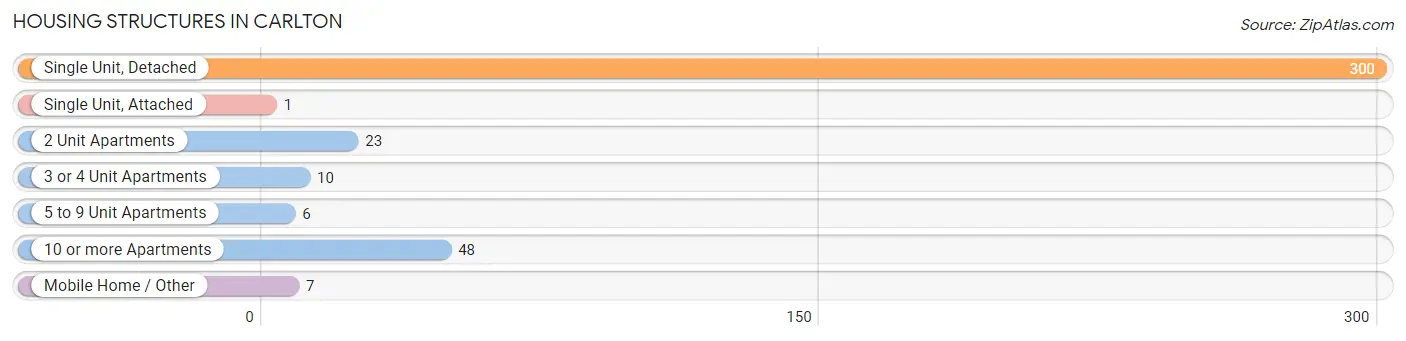
| Structure Type | # Housing Units | % Housing Units |
| Single Unit, Detached | 300 | 75.9% |
| Single Unit, Attached | 1 | 0.3% |
| 2 Unit Apartments | 23 | 5.8% |
| 3 or 4 Unit Apartments | 10 | 2.5% |
| 5 to 9 Unit Apartments | 6 | 1.5% |
| 10 or more Apartments | 48 | 12.1% |
| Mobile Home / Other | 7 | 1.8% |
| Total | 395 | 100.0% |
Housing Structures by Occupancy in Carlton
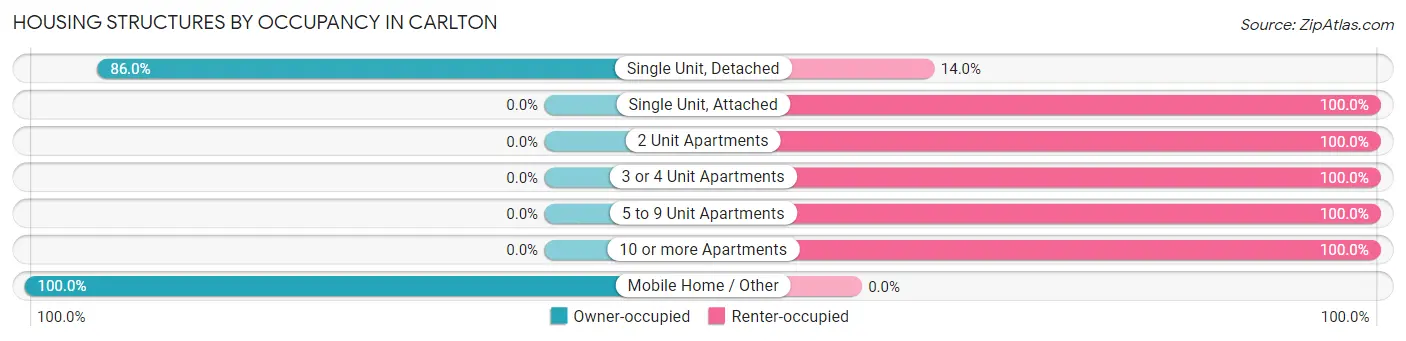
| Structure Type | Owner-occupied | Renter-occupied |
| Single Unit, Detached | 258 (86.0%) | 42 (14.0%) |
| Single Unit, Attached | 0 (0.0%) | 1 (100.0%) |
| 2 Unit Apartments | 0 (0.0%) | 23 (100.0%) |
| 3 or 4 Unit Apartments | 0 (0.0%) | 10 (100.0%) |
| 5 to 9 Unit Apartments | 0 (0.0%) | 6 (100.0%) |
| 10 or more Apartments | 0 (0.0%) | 48 (100.0%) |
| Mobile Home / Other | 7 (100.0%) | 0 (0.0%) |
| Total | 265 (67.1%) | 130 (32.9%) |
Housing Structures by Number of Rooms in Carlton
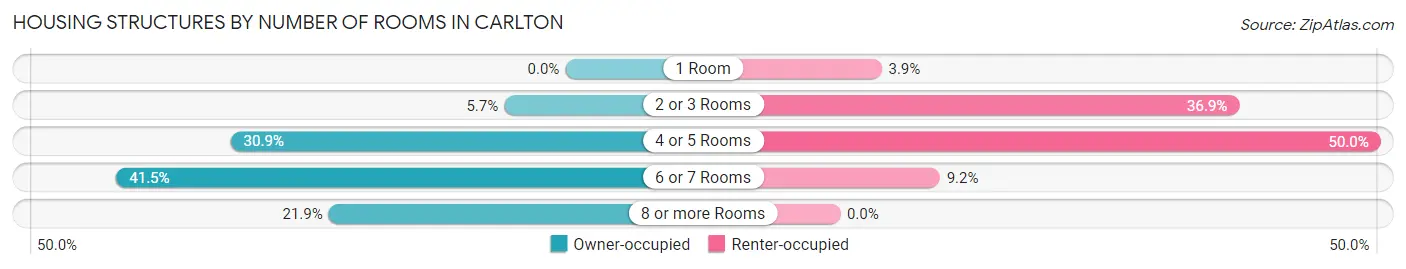
| Number of Rooms | Owner-occupied | Renter-occupied |
| 1 Room | 0 (0.0%) | 5 (3.8%) |
| 2 or 3 Rooms | 15 (5.7%) | 48 (36.9%) |
| 4 or 5 Rooms | 82 (30.9%) | 65 (50.0%) |
| 6 or 7 Rooms | 110 (41.5%) | 12 (9.2%) |
| 8 or more Rooms | 58 (21.9%) | 0 (0.0%) |
| Total | 265 (100.0%) | 130 (100.0%) |
Housing Structure by Heating Type in Carlton
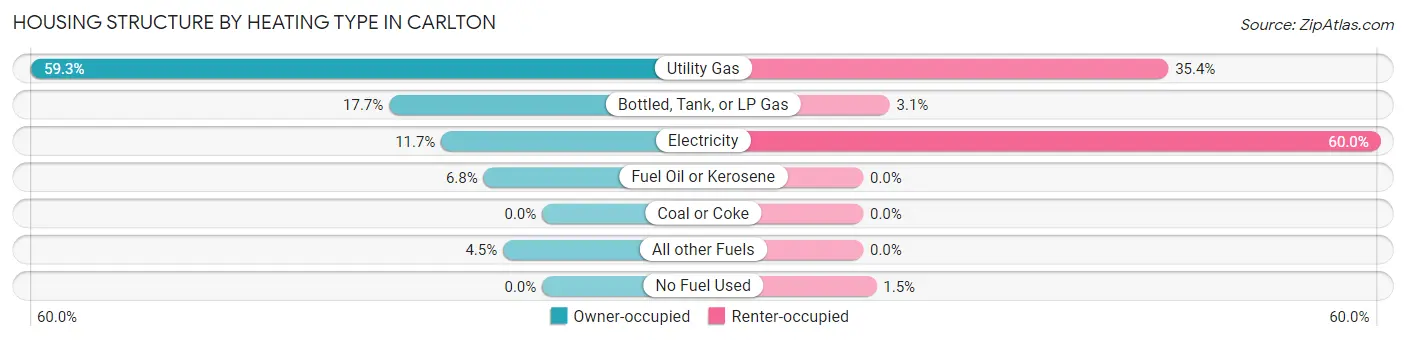
| Heating Type | Owner-occupied | Renter-occupied |
| Utility Gas | 157 (59.3%) | 46 (35.4%) |
| Bottled, Tank, or LP Gas | 47 (17.7%) | 4 (3.1%) |
| Electricity | 31 (11.7%) | 78 (60.0%) |
| Fuel Oil or Kerosene | 18 (6.8%) | 0 (0.0%) |
| Coal or Coke | 0 (0.0%) | 0 (0.0%) |
| All other Fuels | 12 (4.5%) | 0 (0.0%) |
| No Fuel Used | 0 (0.0%) | 2 (1.5%) |
| Total | 265 (100.0%) | 130 (100.0%) |
Household Vehicle Usage in Carlton
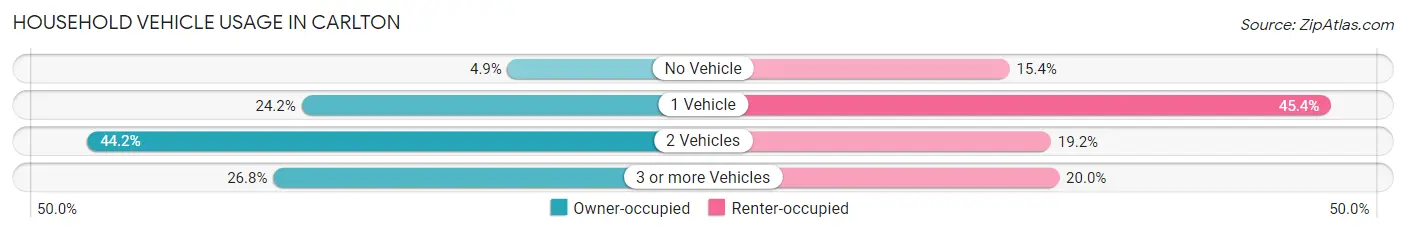
| Vehicles per Household | Owner-occupied | Renter-occupied |
| No Vehicle | 13 (4.9%) | 20 (15.4%) |
| 1 Vehicle | 64 (24.1%) | 59 (45.4%) |
| 2 Vehicles | 117 (44.2%) | 25 (19.2%) |
| 3 or more Vehicles | 71 (26.8%) | 26 (20.0%) |
| Total | 265 (100.0%) | 130 (100.0%) |
Real Estate & Mortgages in Carlton
Real Estate and Mortgage Overview in Carlton
| Characteristic | Without Mortgage | With Mortgage |
| Housing Units | 100 | 165 |
| Median Property Value | $155,000 | $203,100 |
| Median Household Income | $55,000 | $27 |
| Monthly Housing Costs | $543 | $2 |
| Real Estate Taxes | $2,483 | $0 |
Property Value by Mortgage Status in Carlton
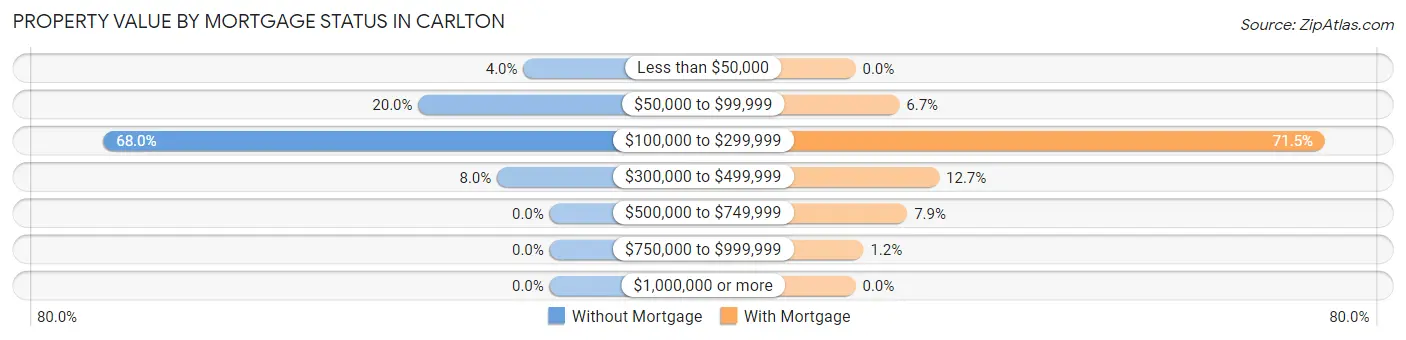
| Property Value | Without Mortgage | With Mortgage |
| Less than $50,000 | 4 (4.0%) | 0 (0.0%) |
| $50,000 to $99,999 | 20 (20.0%) | 11 (6.7%) |
| $100,000 to $299,999 | 68 (68.0%) | 118 (71.5%) |
| $300,000 to $499,999 | 8 (8.0%) | 21 (12.7%) |
| $500,000 to $749,999 | 0 (0.0%) | 13 (7.9%) |
| $750,000 to $999,999 | 0 (0.0%) | 2 (1.2%) |
| $1,000,000 or more | 0 (0.0%) | 0 (0.0%) |
| Total | 100 (100.0%) | 165 (100.0%) |
Household Income by Mortgage Status in Carlton
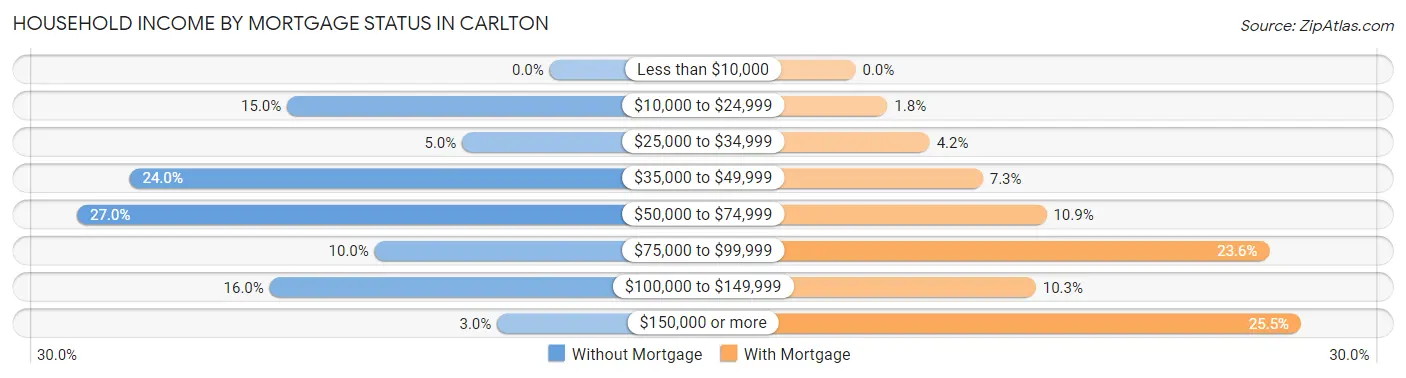
| Household Income | Without Mortgage | With Mortgage |
| Less than $10,000 | 0 (0.0%) | 0 (0.0%) |
| $10,000 to $24,999 | 15 (15.0%) | 3 (1.8%) |
| $25,000 to $34,999 | 5 (5.0%) | 7 (4.2%) |
| $35,000 to $49,999 | 24 (24.0%) | 12 (7.3%) |
| $50,000 to $74,999 | 27 (27.0%) | 18 (10.9%) |
| $75,000 to $99,999 | 10 (10.0%) | 39 (23.6%) |
| $100,000 to $149,999 | 16 (16.0%) | 17 (10.3%) |
| $150,000 or more | 3 (3.0%) | 42 (25.5%) |
| Total | 100 (100.0%) | 165 (100.0%) |
Property Value to Household Income Ratio in Carlton
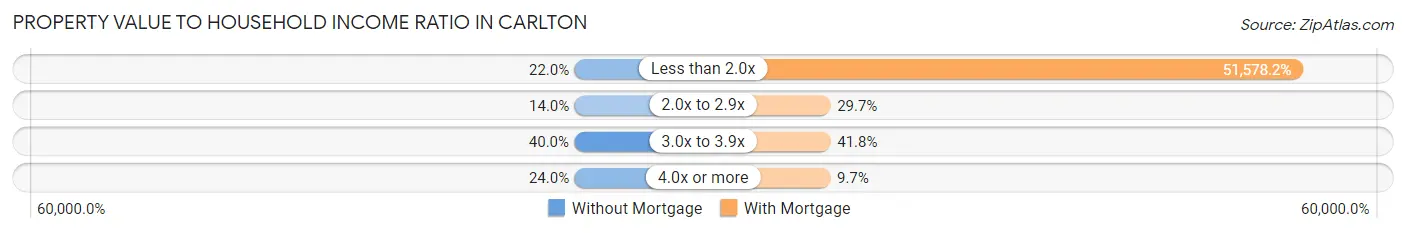
| Value-to-Income Ratio | Without Mortgage | With Mortgage |
| Less than 2.0x | 22 (22.0%) | 85,104 (51,578.2%) |
| 2.0x to 2.9x | 14 (14.0%) | 49 (29.7%) |
| 3.0x to 3.9x | 40 (40.0%) | 69 (41.8%) |
| 4.0x or more | 24 (24.0%) | 16 (9.7%) |
| Total | 100 (100.0%) | 165 (100.0%) |
Real Estate Taxes by Mortgage Status in Carlton
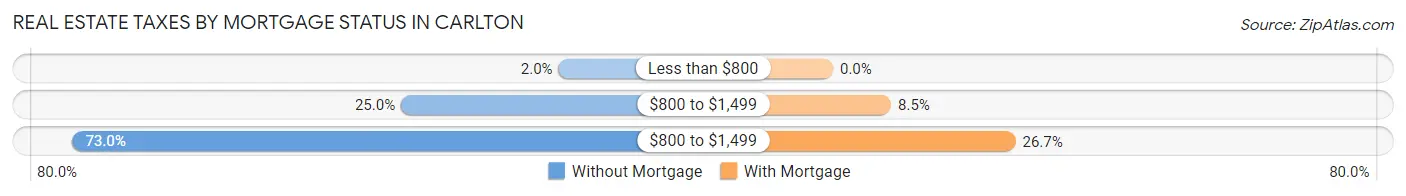
| Property Taxes | Without Mortgage | With Mortgage |
| Less than $800 | 2 (2.0%) | 0 (0.0%) |
| $800 to $1,499 | 25 (25.0%) | 14 (8.5%) |
| $800 to $1,499 | 73 (73.0%) | 44 (26.7%) |
| Total | 100 (100.0%) | 165 (100.0%) |
Health & Disability in Carlton
Health Insurance Coverage by Age in Carlton
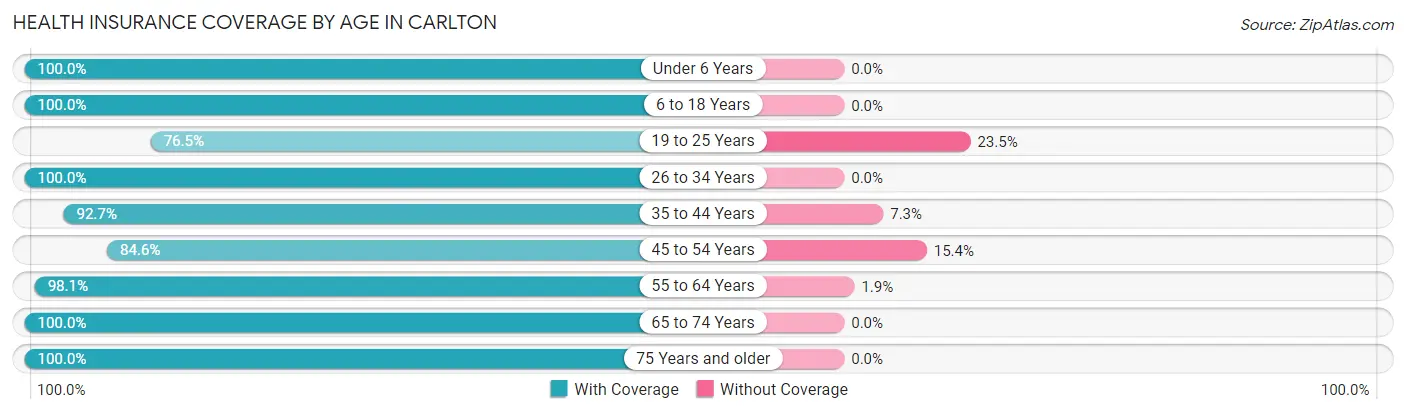
| Age Bracket | With Coverage | Without Coverage |
| Under 6 Years | 19 (100.0%) | 0 (0.0%) |
| 6 to 18 Years | 159 (100.0%) | 0 (0.0%) |
| 19 to 25 Years | 26 (76.5%) | 8 (23.5%) |
| 26 to 34 Years | 49 (100.0%) | 0 (0.0%) |
| 35 to 44 Years | 102 (92.7%) | 8 (7.3%) |
| 45 to 54 Years | 121 (84.6%) | 22 (15.4%) |
| 55 to 64 Years | 103 (98.1%) | 2 (1.9%) |
| 65 to 74 Years | 103 (100.0%) | 0 (0.0%) |
| 75 Years and older | 89 (100.0%) | 0 (0.0%) |
| Total | 771 (95.1%) | 40 (4.9%) |
Health Insurance Coverage by Citizenship Status in Carlton
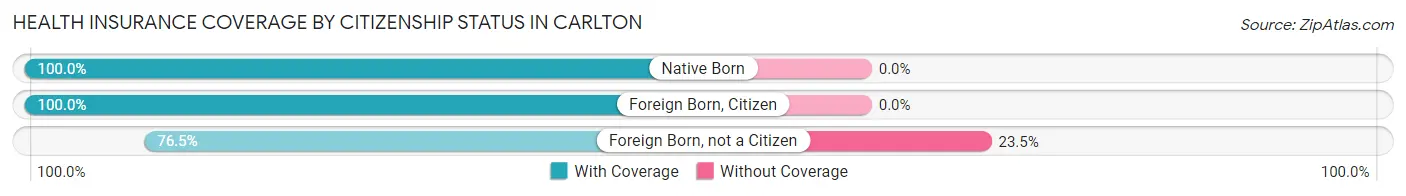
| Citizenship Status | With Coverage | Without Coverage |
| Native Born | 19 (100.0%) | 0 (0.0%) |
| Foreign Born, Citizen | 159 (100.0%) | 0 (0.0%) |
| Foreign Born, not a Citizen | 26 (76.5%) | 8 (23.5%) |
Health Insurance Coverage by Household Income in Carlton
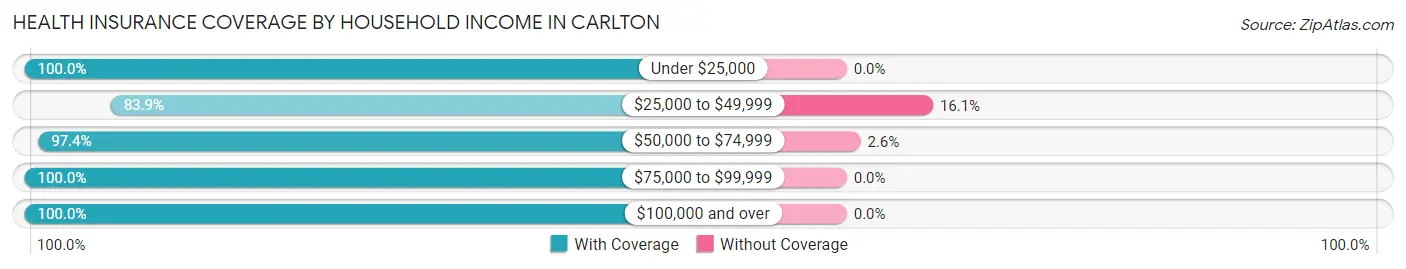
| Household Income | With Coverage | Without Coverage |
| Under $25,000 | 66 (100.0%) | 0 (0.0%) |
| $25,000 to $49,999 | 187 (83.9%) | 36 (16.1%) |
| $50,000 to $74,999 | 152 (97.4%) | 4 (2.6%) |
| $75,000 to $99,999 | 73 (100.0%) | 0 (0.0%) |
| $100,000 and over | 279 (100.0%) | 0 (0.0%) |
Public vs Private Health Insurance Coverage by Age in Carlton
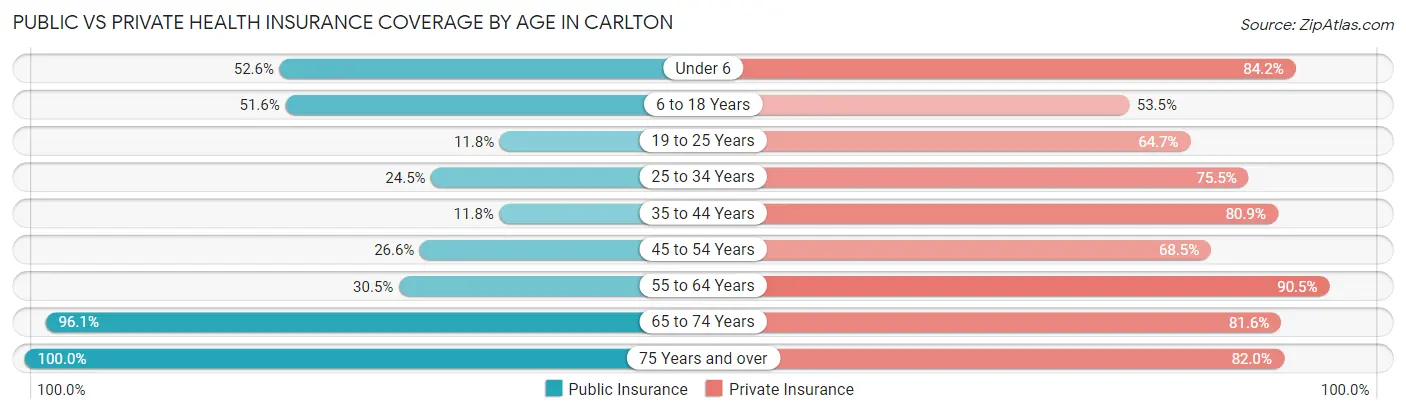
| Age Bracket | Public Insurance | Private Insurance |
| Under 6 | 10 (52.6%) | 16 (84.2%) |
| 6 to 18 Years | 82 (51.6%) | 85 (53.5%) |
| 19 to 25 Years | 4 (11.8%) | 22 (64.7%) |
| 25 to 34 Years | 12 (24.5%) | 37 (75.5%) |
| 35 to 44 Years | 13 (11.8%) | 89 (80.9%) |
| 45 to 54 Years | 38 (26.6%) | 98 (68.5%) |
| 55 to 64 Years | 32 (30.5%) | 95 (90.5%) |
| 65 to 74 Years | 99 (96.1%) | 84 (81.6%) |
| 75 Years and over | 89 (100.0%) | 73 (82.0%) |
| Total | 379 (46.7%) | 599 (73.9%) |
Disability Status by Sex by Age in Carlton
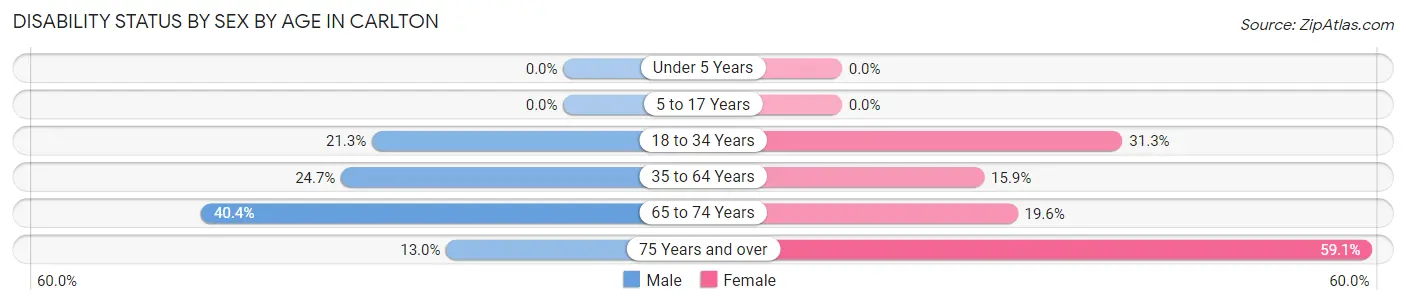
| Age Bracket | Male | Female |
| Under 5 Years | 0 (0.0%) | 0 (0.0%) |
| 5 to 17 Years | 0 (0.0%) | 0 (0.0%) |
| 18 to 34 Years | 13 (21.3%) | 10 (31.2%) |
| 35 to 64 Years | 48 (24.7%) | 26 (15.9%) |
| 65 to 74 Years | 23 (40.4%) | 9 (19.6%) |
| 75 Years and over | 3 (13.0%) | 39 (59.1%) |
Disability Class by Sex by Age in Carlton
Disability Class: Hearing Difficulty
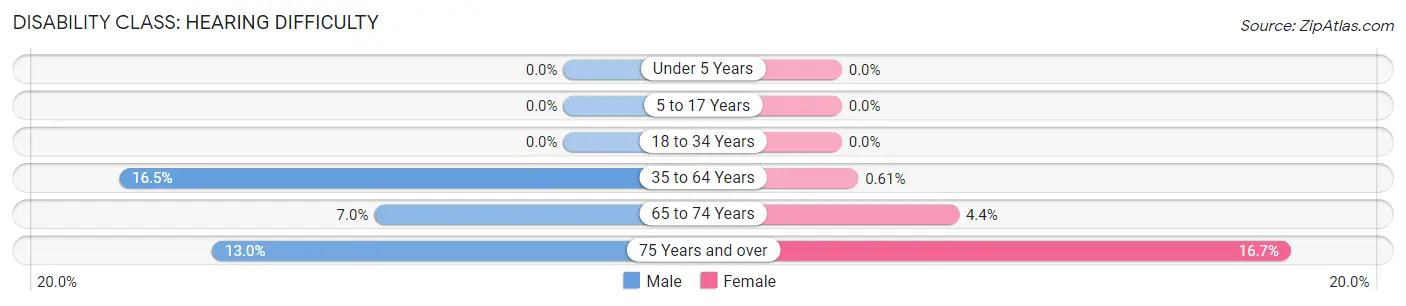
| Age Bracket | Male | Female |
| Under 5 Years | 0 (0.0%) | 0 (0.0%) |
| 5 to 17 Years | 0 (0.0%) | 0 (0.0%) |
| 18 to 34 Years | 0 (0.0%) | 0 (0.0%) |
| 35 to 64 Years | 32 (16.5%) | 1 (0.6%) |
| 65 to 74 Years | 4 (7.0%) | 2 (4.3%) |
| 75 Years and over | 3 (13.0%) | 11 (16.7%) |
Disability Class: Vision Difficulty
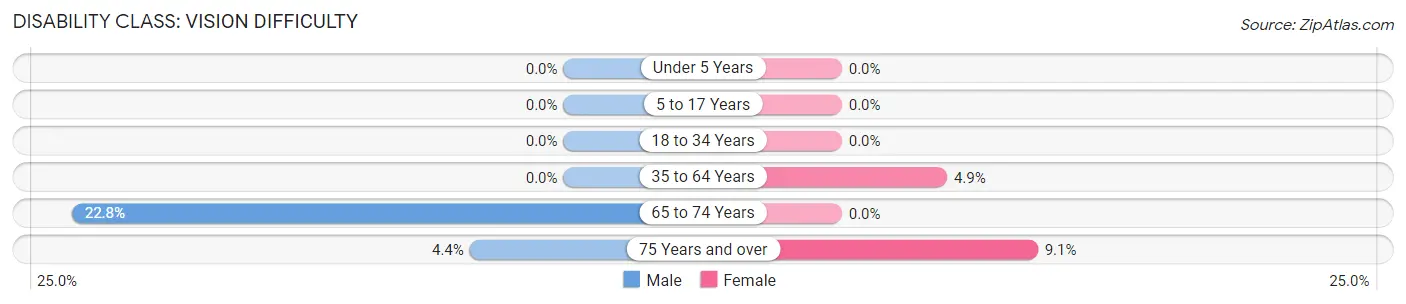
| Age Bracket | Male | Female |
| Under 5 Years | 0 (0.0%) | 0 (0.0%) |
| 5 to 17 Years | 0 (0.0%) | 0 (0.0%) |
| 18 to 34 Years | 0 (0.0%) | 0 (0.0%) |
| 35 to 64 Years | 0 (0.0%) | 8 (4.9%) |
| 65 to 74 Years | 13 (22.8%) | 0 (0.0%) |
| 75 Years and over | 1 (4.3%) | 6 (9.1%) |
Disability Class: Cognitive Difficulty
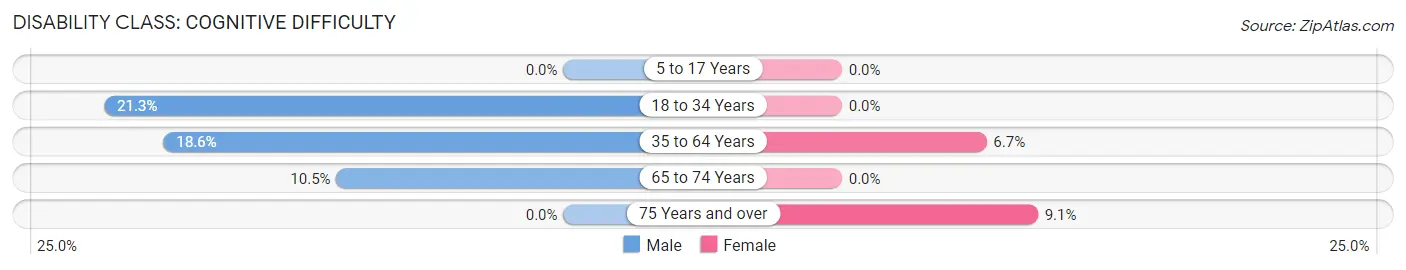
| Age Bracket | Male | Female |
| 5 to 17 Years | 0 (0.0%) | 0 (0.0%) |
| 18 to 34 Years | 13 (21.3%) | 0 (0.0%) |
| 35 to 64 Years | 36 (18.6%) | 11 (6.7%) |
| 65 to 74 Years | 6 (10.5%) | 0 (0.0%) |
| 75 Years and over | 0 (0.0%) | 6 (9.1%) |
Disability Class: Ambulatory Difficulty
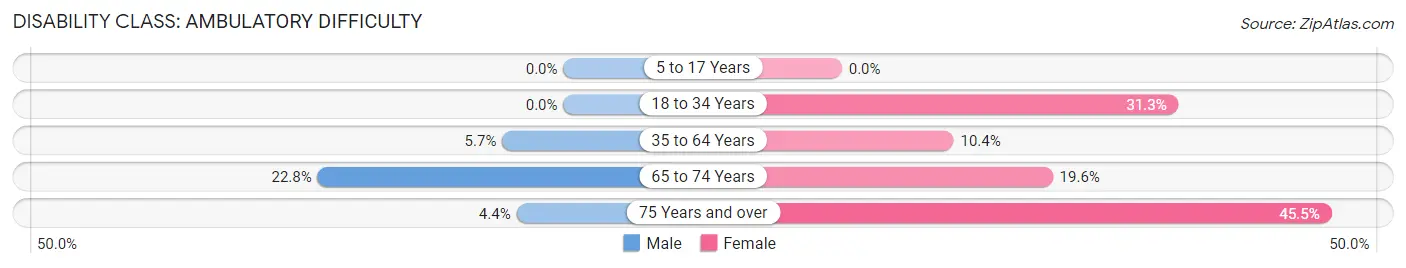
| Age Bracket | Male | Female |
| 5 to 17 Years | 0 (0.0%) | 0 (0.0%) |
| 18 to 34 Years | 0 (0.0%) | 10 (31.2%) |
| 35 to 64 Years | 11 (5.7%) | 17 (10.4%) |
| 65 to 74 Years | 13 (22.8%) | 9 (19.6%) |
| 75 Years and over | 1 (4.3%) | 30 (45.5%) |
Disability Class: Self-Care Difficulty
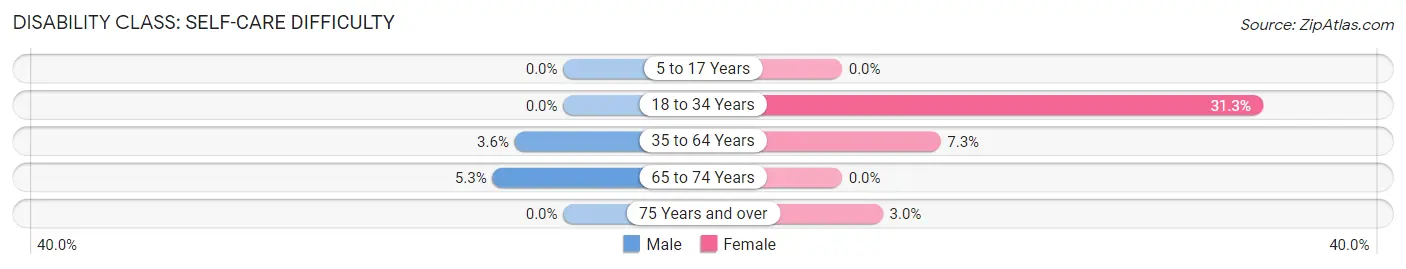
| Age Bracket | Male | Female |
| 5 to 17 Years | 0 (0.0%) | 0 (0.0%) |
| 18 to 34 Years | 0 (0.0%) | 10 (31.2%) |
| 35 to 64 Years | 7 (3.6%) | 12 (7.3%) |
| 65 to 74 Years | 3 (5.3%) | 0 (0.0%) |
| 75 Years and over | 0 (0.0%) | 2 (3.0%) |
Technology Access in Carlton
Computing Device Access in Carlton
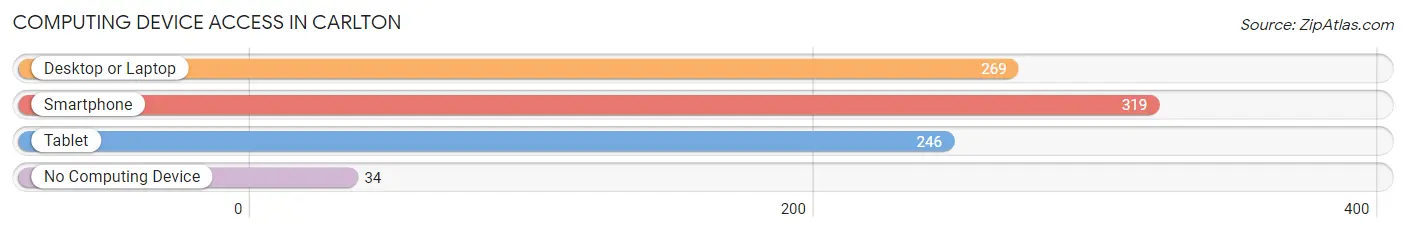
| Device Type | # Households | % Households |
| Desktop or Laptop | 269 | 68.1% |
| Smartphone | 319 | 80.8% |
| Tablet | 246 | 62.3% |
| No Computing Device | 34 | 8.6% |
| Total | 395 | 100.0% |
Internet Access in Carlton
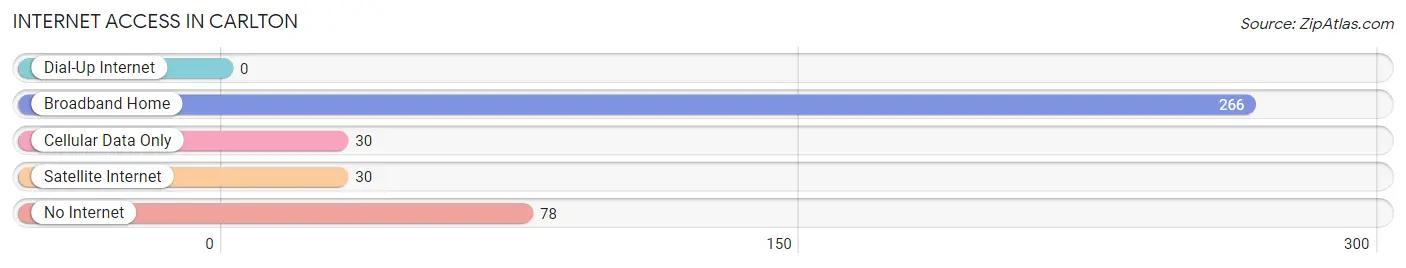
| Internet Type | # Households | % Households |
| Dial-Up Internet | 0 | 0.0% |
| Broadband Home | 266 | 67.3% |
| Cellular Data Only | 30 | 7.6% |
| Satellite Internet | 30 | 7.6% |
| No Internet | 78 | 19.8% |
| Total | 395 | 100.0% |
Carlton Summary
Carlton, Minnesota is a small city located in Carlton County, in the northeastern part of the state. It is situated on the banks of the St. Louis River, and is part of the Duluth, Minnesota metropolitan area. The city has a population of approximately 1,500 people, and is the county seat of Carlton County.
History
The area that is now Carlton was first settled in the late 1800s by Finnish immigrants. The city was officially incorporated in 1891, and was named after Reuben Carlton, a prominent local businessman. The city was initially a logging and farming community, and the economy was largely based on the timber industry. In the early 1900s, the city began to develop into a small industrial center, with several factories and mills being built in the area.
Geography
Carlton is located in the northeastern part of Minnesota, in Carlton County. It is situated on the banks of the St. Louis River, and is part of the Duluth, Minnesota metropolitan area. The city has a total area of 2.2 square miles, all of which is land. The terrain is mostly flat, with some rolling hills in the area. The climate is humid continental, with cold winters and warm summers.
Economy
The economy of Carlton is largely based on the timber industry, with several sawmills and paper mills located in the area. The city also has a number of small businesses, including restaurants, retail stores, and service providers. The city is also home to a number of manufacturing companies, including a furniture factory and a plastics factory. The city is also home to a number of government offices, including the Carlton County Courthouse.
Demographics
As of the 2010 census, the population of Carlton was 1,500 people. The racial makeup of the city was 94.2% White, 0.7% African American, 0.7% Native American, 0.7% Asian, 0.1% Pacific Islander, and 3.3% from other races. The median household income was $37,500, and the median family income was $45,000. The per capita income was $19,000. The unemployment rate was 6.2%.
Conclusion
Carlton, Minnesota is a small city located in Carlton County, in the northeastern part of the state. It is situated on the banks of the St. Louis River, and is part of the Duluth, Minnesota metropolitan area. The city has a population of approximately 1,500 people, and is the county seat of Carlton County. The economy of Carlton is largely based on the timber industry, with several sawmills and paper mills located in the area. The city also has a number of small businesses, including restaurants, retail stores, and service providers. The racial makeup of the city was 94.2% White, 0.7% African American, 0.7% Native American, 0.7% Asian, 0.1% Pacific Islander, and 3.3% from other races. The median household income was $37,500, and the median family income was $45,000. The per capita income was $19,000. The unemployment rate was 6.2%.
Common Questions
What is Per Capita Income in Carlton?
Per Capita income in Carlton is $30,953.
What is the Median Family Income in Carlton?
Median Family Income in Carlton is $67,250.
What is the Median Household income in Carlton?
Median Household Income in Carlton is $52,232.
What is Income or Wage Gap in Carlton?
Income or Wage Gap in Carlton is 29.9%.
Women in Carlton earn 70.1 cents for every dollar earned by a man.
What is Inequality or Gini Index in Carlton?
Inequality or Gini Index in Carlton is 0.40.
What is the Total Population of Carlton?
Total Population of Carlton is 955.
What is the Total Male Population of Carlton?
Total Male Population of Carlton is 499.
What is the Total Female Population of Carlton?
Total Female Population of Carlton is 456.
What is the Ratio of Males per 100 Females in Carlton?
There are 109.43 Males per 100 Females in Carlton.
What is the Ratio of Females per 100 Males in Carlton?
There are 91.38 Females per 100 Males in Carlton.
What is the Median Population Age in Carlton?
Median Population Age in Carlton is 50.7 Years.
What is the Average Family Size in Carlton
Average Family Size in Carlton is 2.6 People.
What is the Average Household Size in Carlton
Average Household Size in Carlton is 2.0 People.
How Large is the Labor Force in Carlton?
There are 409 People in the Labor Forcein in Carlton.
What is the Percentage of People in the Labor Force in Carlton?
50.2% of People are in the Labor Force in Carlton.
What is the Unemployment Rate in Carlton?
Unemployment Rate in Carlton is 13.0%.