Blue Earth, MN Map & Demographics
Blue Earth Map
Blue Earth Overview
$34,860
PER CAPITA INCOME
$98,802
AVG FAMILY INCOME
$61,950
AVG HOUSEHOLD INCOME
12.7%
WAGE / INCOME GAP [ % ]
87.3¢/ $1
WAGE / INCOME GAP [ $ ]
0.42
INEQUALITY / GINI INDEX
3,181
TOTAL POPULATION
1,571
MALE POPULATION
1,610
FEMALE POPULATION
97.58
MALES / 100 FEMALES
102.48
FEMALES / 100 MALES
42.4
MEDIAN AGE
2.8
AVG FAMILY SIZE
2.2
AVG HOUSEHOLD SIZE
1,717
LABOR FORCE [ PEOPLE ]
65.2%
PERCENT IN LABOR FORCE
4.4%
UNEMPLOYMENT RATE
Blue Earth Zip Codes
Blue Earth Area Codes
Income in Blue Earth
Income Overview in Blue Earth
Per Capita Income in Blue Earth is $34,860, while median incomes of families and households are $98,802 and $61,950 respectively.
| Characteristic | Number | Measure |
| Per Capita Income | 3,181 | $34,860 |
| Median Family Income | 823 | $98,802 |
| Mean Family Income | 823 | $100,392 |
| Median Household Income | 1,359 | $61,950 |
| Mean Household Income | 1,359 | $78,117 |
| Income Deficit | 823 | $0 |
| Wage / Income Gap (%) | 3,181 | 12.67% |
| Wage / Income Gap ($) | 3,181 | 87.33¢ per $1 |
| Gini / Inequality Index | 3,181 | 0.42 |
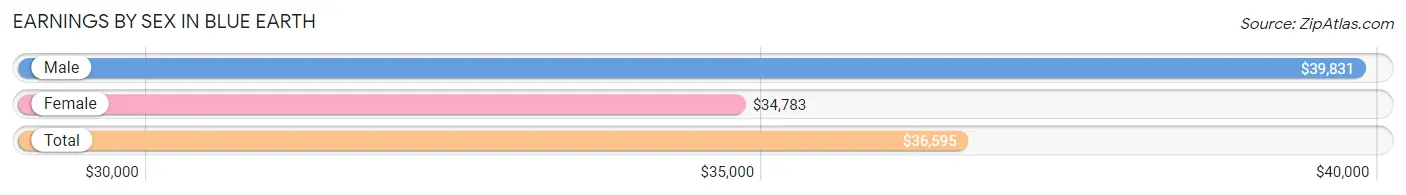
Earnings by Sex in Blue Earth
Average Earnings in Blue Earth are $36,595, $39,831 for men and $34,783 for women, a difference of 12.7%.
| Sex | Number | Average Earnings |
| Male | 967 (50.8%) | $39,831 |
| Female | 936 (49.2%) | $34,783 |
| Total | 1,903 (100.0%) | $36,595 |
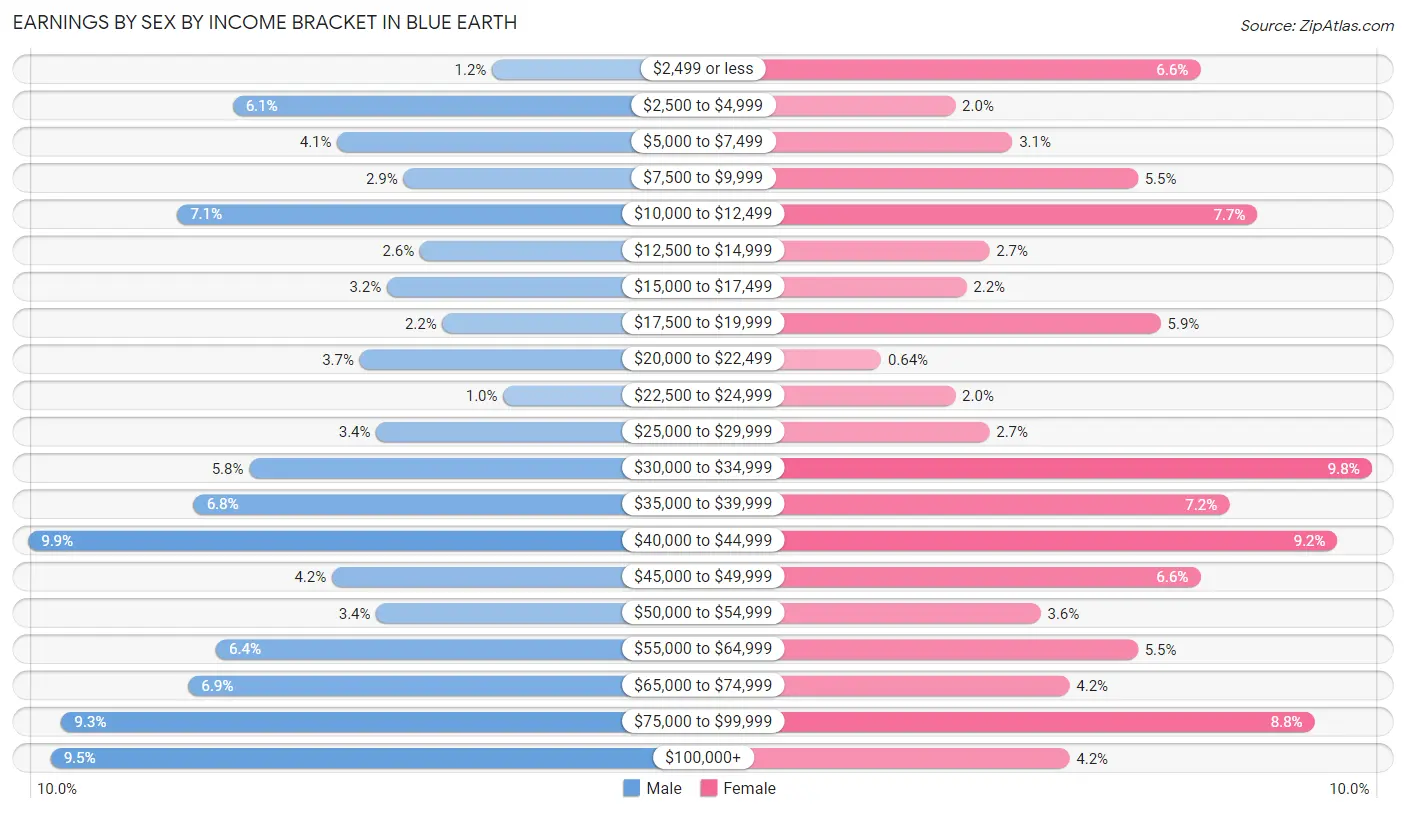
Earnings by Sex by Income Bracket in Blue Earth
The most common earnings brackets in Blue Earth are $40,000 to $44,999 for men (96 | 9.9%) and $30,000 to $34,999 for women (92 | 9.8%).
| Income | Male | Female |
| $2,499 or less | 12 (1.2%) | 62 (6.6%) |
| $2,500 to $4,999 | 59 (6.1%) | 19 (2.0%) |
| $5,000 to $7,499 | 40 (4.1%) | 29 (3.1%) |
| $7,500 to $9,999 | 28 (2.9%) | 51 (5.4%) |
| $10,000 to $12,499 | 69 (7.1%) | 72 (7.7%) |
| $12,500 to $14,999 | 25 (2.6%) | 25 (2.7%) |
| $15,000 to $17,499 | 31 (3.2%) | 21 (2.2%) |
| $17,500 to $19,999 | 21 (2.2%) | 55 (5.9%) |
| $20,000 to $22,499 | 36 (3.7%) | 6 (0.6%) |
| $22,500 to $24,999 | 10 (1.0%) | 19 (2.0%) |
| $25,000 to $29,999 | 33 (3.4%) | 25 (2.7%) |
| $30,000 to $34,999 | 56 (5.8%) | 92 (9.8%) |
| $35,000 to $39,999 | 66 (6.8%) | 67 (7.2%) |
| $40,000 to $44,999 | 96 (9.9%) | 86 (9.2%) |
| $45,000 to $49,999 | 41 (4.2%) | 62 (6.6%) |
| $50,000 to $54,999 | 33 (3.4%) | 34 (3.6%) |
| $55,000 to $64,999 | 62 (6.4%) | 51 (5.4%) |
| $65,000 to $74,999 | 67 (6.9%) | 39 (4.2%) |
| $75,000 to $99,999 | 90 (9.3%) | 82 (8.8%) |
| $100,000+ | 92 (9.5%) | 39 (4.2%) |
| Total | 967 (100.0%) | 936 (100.0%) |
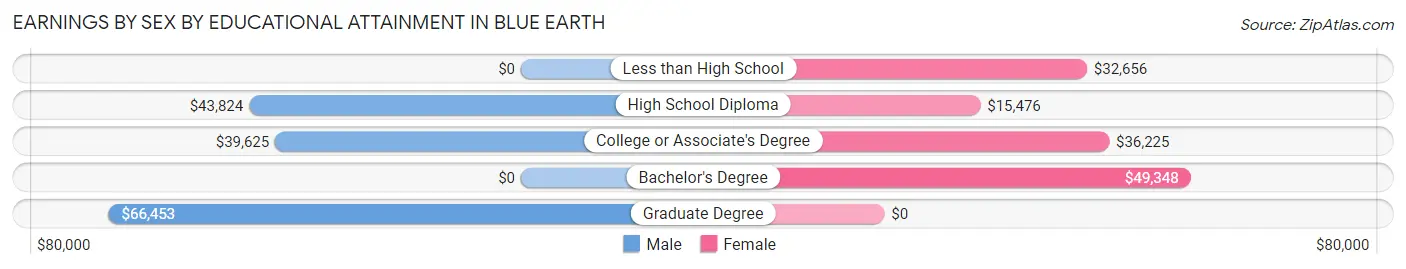
Earnings by Sex by Educational Attainment in Blue Earth
Average earnings in Blue Earth are $44,099 for men and $36,832 for women, a difference of 16.5%. Men with an educational attainment of graduate degree enjoy the highest average annual earnings of $66,453, while those with college or associate's degree education earn the least with $39,625. Women with an educational attainment of bachelor's degree earn the most with the average annual earnings of $49,348, while those with high school diploma education have the smallest earnings of $15,476.
| Educational Attainment | Male Income | Female Income |
| Less than High School | - | - |
| High School Diploma | $43,824 | $15,476 |
| College or Associate's Degree | $39,625 | $36,225 |
| Bachelor's Degree | - | - |
| Graduate Degree | $66,453 | $0 |
| Total | $44,099 | $36,832 |
Family Income in Blue Earth
Family Income Brackets in Blue Earth
According to the Blue Earth family income data, there are 288 families falling into the $100,000 to $149,999 income range, which is the most common income bracket and makes up 35.0% of all families. Conversely, the less than $10,000 income bracket is the least frequent group with only 8 families (1.0%) belonging to this category.
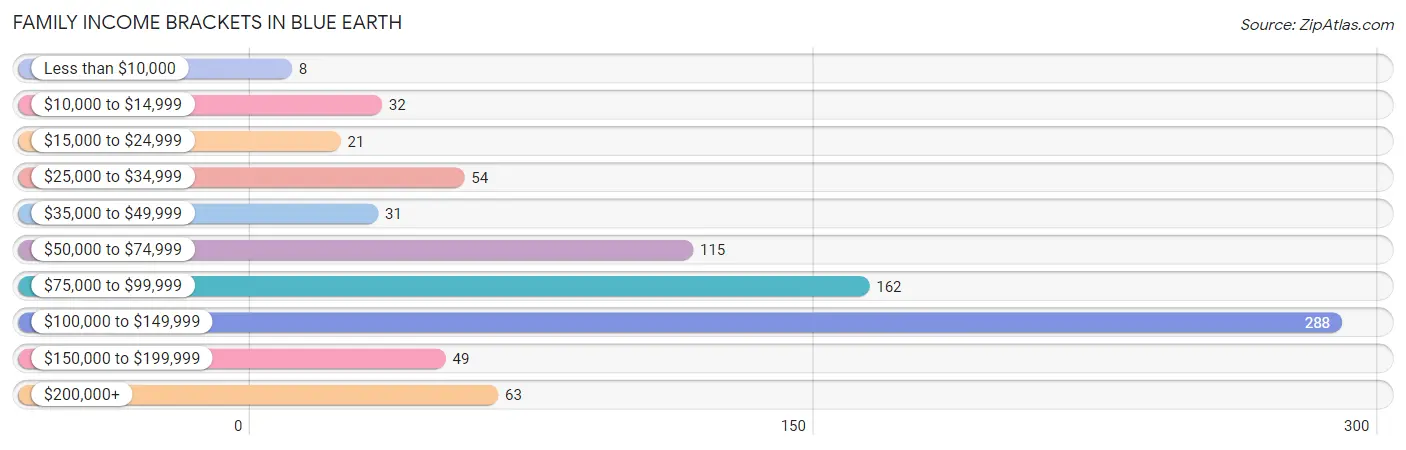
| Income Bracket | # Families | % Families |
| Less than $10,000 | 8 | 1.0% |
| $10,000 to $14,999 | 32 | 3.9% |
| $15,000 to $24,999 | 21 | 2.6% |
| $25,000 to $34,999 | 54 | 6.6% |
| $35,000 to $49,999 | 31 | 3.8% |
| $50,000 to $74,999 | 115 | 14.0% |
| $75,000 to $99,999 | 162 | 19.7% |
| $100,000 to $149,999 | 288 | 35.0% |
| $150,000 to $199,999 | 49 | 6.0% |
| $200,000+ | 63 | 7.7% |
Family Income by Famaliy Size in Blue Earth
3-person families (149 | 18.1%) account for the highest median family income in Blue Earth with $104,650 per family, while 2-person families (506 | 61.5%) have the highest median income of $44,808 per family member.
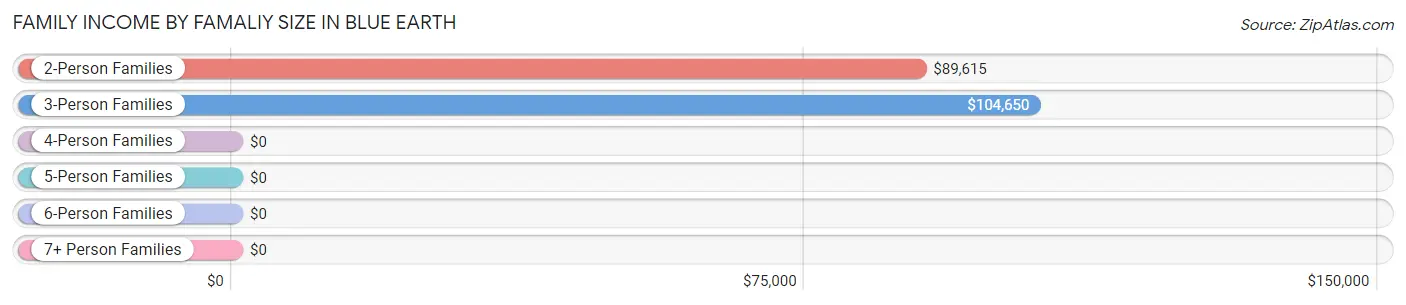
| Income Bracket | # Families | Median Income |
| 2-Person Families | 506 (61.5%) | $89,615 |
| 3-Person Families | 149 (18.1%) | $104,650 |
| 4-Person Families | 131 (15.9%) | $0 |
| 5-Person Families | 37 (4.5%) | $0 |
| 6-Person Families | 0 (0.0%) | $0 |
| 7+ Person Families | 0 (0.0%) | $0 |
| Total | 823 (100.0%) | $98,802 |
Family Income by Number of Earners in Blue Earth
The median family income in Blue Earth is $98,802, with families comprising 3+ earners (139) having the highest median family income of $138,594, while families with 1 earner (199) have the lowest median family income of $55,197, accounting for 16.9% and 24.2% of families, respectively.
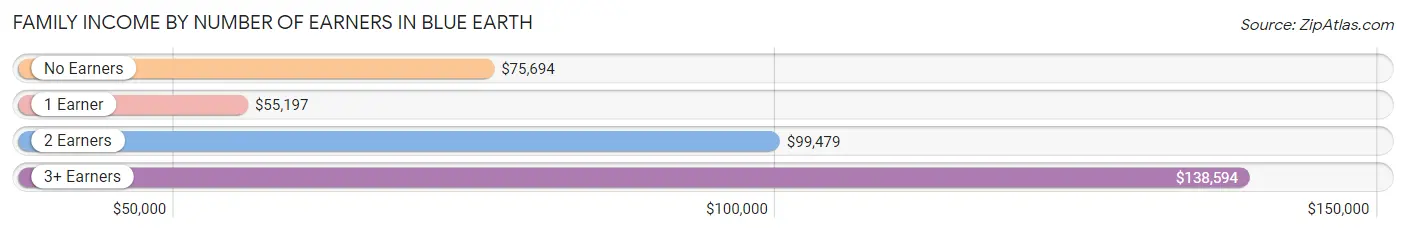
| Number of Earners | # Families | Median Income |
| No Earners | 59 (7.2%) | $75,694 |
| 1 Earner | 199 (24.2%) | $55,197 |
| 2 Earners | 426 (51.8%) | $99,479 |
| 3+ Earners | 139 (16.9%) | $138,594 |
| Total | 823 (100.0%) | $98,802 |
Household Income in Blue Earth
Household Income Brackets in Blue Earth
With 289 households falling in the category, the $100,000 to $149,999 income range is the most frequent in Blue Earth, accounting for 21.3% of all households. In contrast, only 50 households (3.7%) fall into the less than $10,000 income bracket, making it the least populous group.
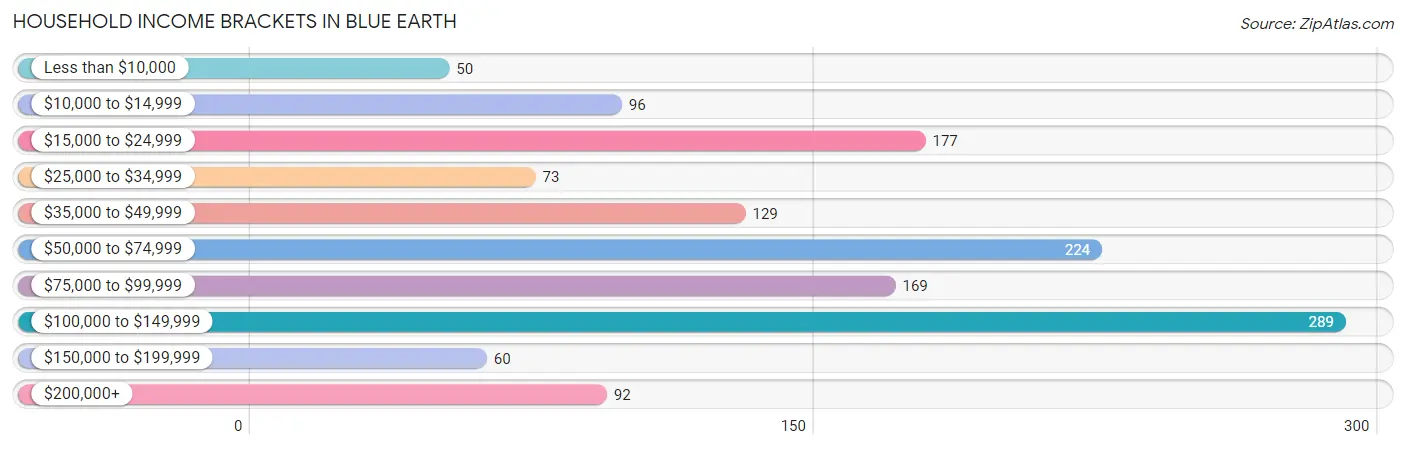
| Income Bracket | # Households | % Households |
| Less than $10,000 | 50 | 3.7% |
| $10,000 to $14,999 | 96 | 7.1% |
| $15,000 to $24,999 | 177 | 13.0% |
| $25,000 to $34,999 | 73 | 5.4% |
| $35,000 to $49,999 | 129 | 9.5% |
| $50,000 to $74,999 | 224 | 16.5% |
| $75,000 to $99,999 | 169 | 12.4% |
| $100,000 to $149,999 | 289 | 21.3% |
| $150,000 to $199,999 | 60 | 4.4% |
| $200,000+ | 92 | 6.8% |
Household Income by Householder Age in Blue Earth
The median household income in Blue Earth is $61,950, with the highest median household income of $75,750 found in the 45 to 64 years age bracket for the primary householder. A total of 410 households (30.2%) fall into this category. Meanwhile, the 15 to 24 years age bracket for the primary householder has the lowest median household income of $0, with 25 households (1.8%) in this group.
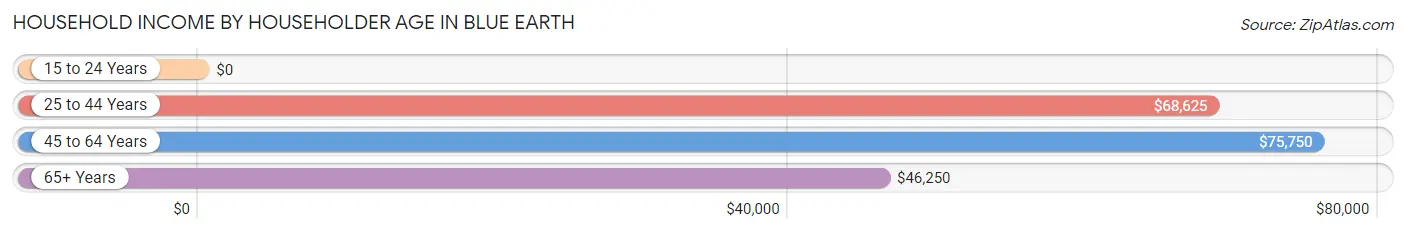
| Income Bracket | # Households | Median Income |
| 15 to 24 Years | 25 (1.8%) | $0 |
| 25 to 44 Years | 475 (34.9%) | $68,625 |
| 45 to 64 Years | 410 (30.2%) | $75,750 |
| 65+ Years | 449 (33.0%) | $46,250 |
| Total | 1,359 (100.0%) | $61,950 |
Poverty in Blue Earth
Income Below Poverty by Sex and Age in Blue Earth
With 8.1% poverty level for males and 15.2% for females among the residents of Blue Earth, 5 year old males and 5 year old females are the most vulnerable to poverty, with 10 males (100.0%) and 17 females (60.7%) in their respective age groups living below the poverty level.
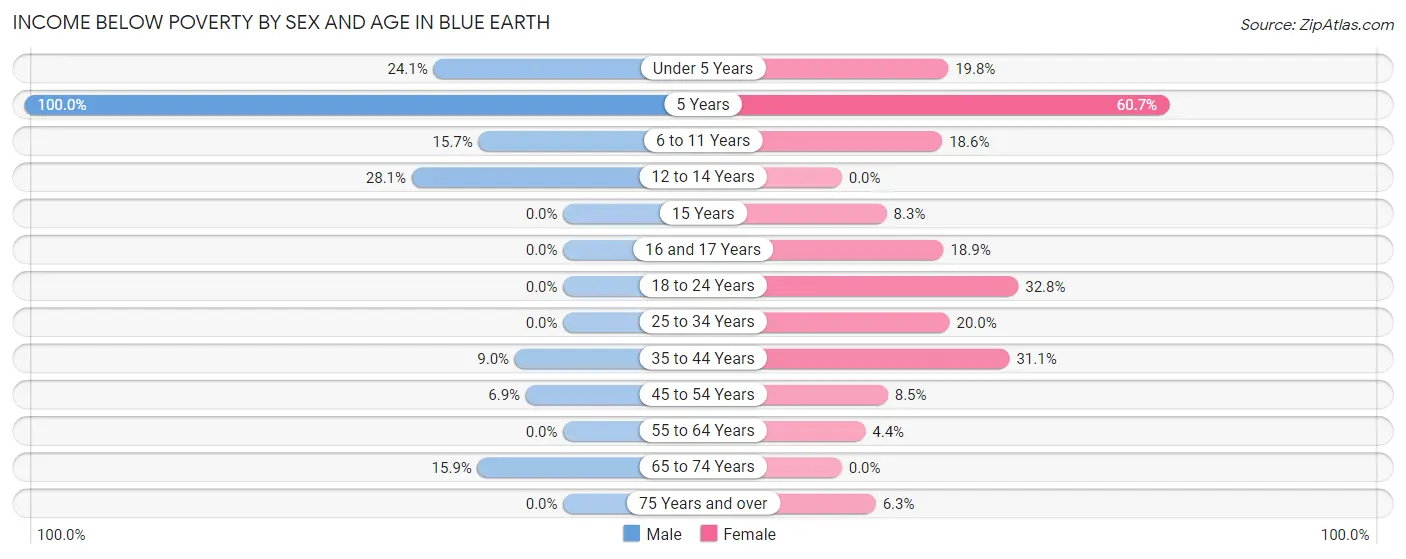
| Age Bracket | Male | Female |
| Under 5 Years | 20 (24.1%) | 16 (19.8%) |
| 5 Years | 10 (100.0%) | 17 (60.7%) |
| 6 to 11 Years | 28 (15.7%) | 11 (18.6%) |
| 12 to 14 Years | 9 (28.1%) | 0 (0.0%) |
| 15 Years | 0 (0.0%) | 1 (8.3%) |
| 16 and 17 Years | 0 (0.0%) | 10 (18.9%) |
| 18 to 24 Years | 0 (0.0%) | 19 (32.8%) |
| 25 to 34 Years | 0 (0.0%) | 35 (20.0%) |
| 35 to 44 Years | 22 (9.0%) | 80 (31.1%) |
| 45 to 54 Years | 10 (6.9%) | 17 (8.5%) |
| 55 to 64 Years | 0 (0.0%) | 9 (4.4%) |
| 65 to 74 Years | 21 (15.9%) | 0 (0.0%) |
| 75 Years and over | 0 (0.0%) | 16 (6.3%) |
| Total | 120 (8.1%) | 231 (15.2%) |
Income Above Poverty by Sex and Age in Blue Earth
According to the poverty statistics in Blue Earth, males aged 15 years and females aged 12 to 14 years are the age groups that are most secure financially, with 100.0% of males and 100.0% of females in these age groups living above the poverty line.
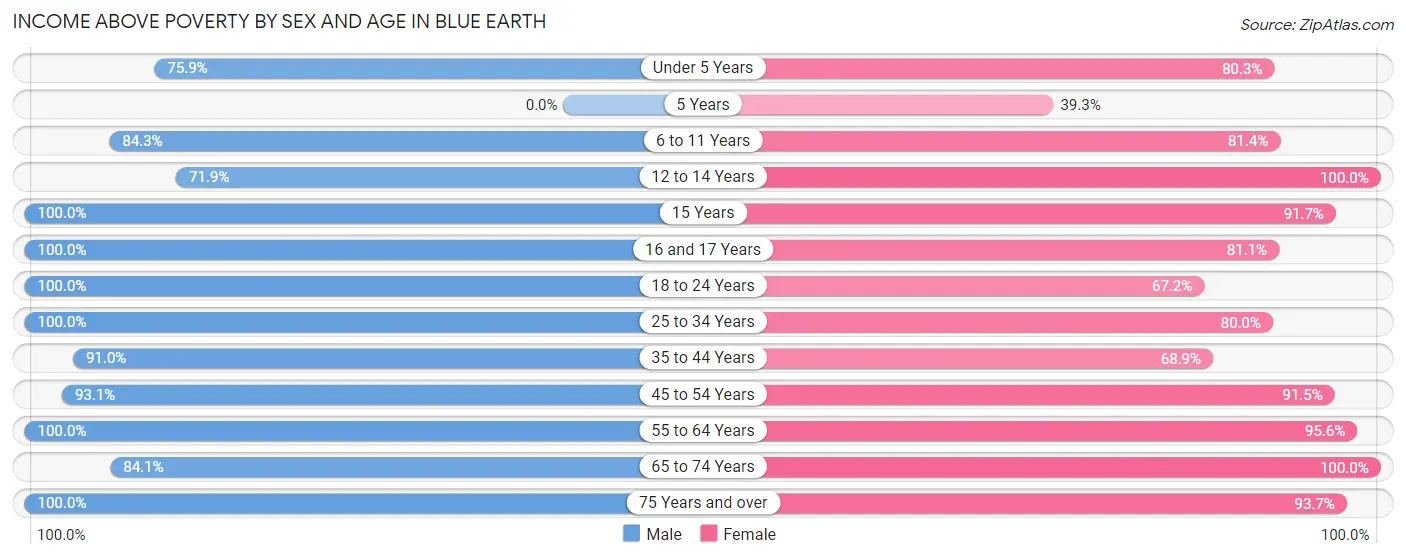
| Age Bracket | Male | Female |
| Under 5 Years | 63 (75.9%) | 65 (80.2%) |
| 5 Years | 0 (0.0%) | 11 (39.3%) |
| 6 to 11 Years | 150 (84.3%) | 48 (81.4%) |
| 12 to 14 Years | 23 (71.9%) | 23 (100.0%) |
| 15 Years | 40 (100.0%) | 11 (91.7%) |
| 16 and 17 Years | 41 (100.0%) | 43 (81.1%) |
| 18 to 24 Years | 118 (100.0%) | 39 (67.2%) |
| 25 to 34 Years | 180 (100.0%) | 140 (80.0%) |
| 35 to 44 Years | 223 (91.0%) | 177 (68.9%) |
| 45 to 54 Years | 134 (93.1%) | 182 (91.5%) |
| 55 to 64 Years | 173 (100.0%) | 197 (95.6%) |
| 65 to 74 Years | 111 (84.1%) | 112 (100.0%) |
| 75 Years and over | 107 (100.0%) | 238 (93.7%) |
| Total | 1,363 (91.9%) | 1,286 (84.8%) |
Income Below Poverty Among Married-Couple Families in Blue Earth
The poverty statistics for married-couple families in Blue Earth show that 2.8% or 18 of the total 654 families live below the poverty line. Families with 1 or 2 children have the highest poverty rate of 13.7%, comprising of 18 families. On the other hand, families with no children have the lowest poverty rate of 0.0%, which includes 0 families.
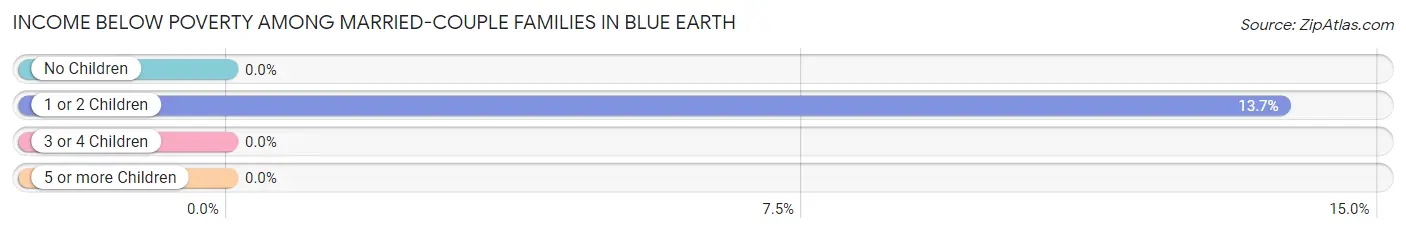
| Children | Above Poverty | Below Poverty |
| No Children | 497 (100.0%) | 0 (0.0%) |
| 1 or 2 Children | 113 (86.3%) | 18 (13.7%) |
| 3 or 4 Children | 26 (100.0%) | 0 (0.0%) |
| 5 or more Children | 0 (0.0%) | 0 (0.0%) |
| Total | 636 (97.3%) | 18 (2.8%) |
Income Below Poverty Among Single-Parent Households in Blue Earth
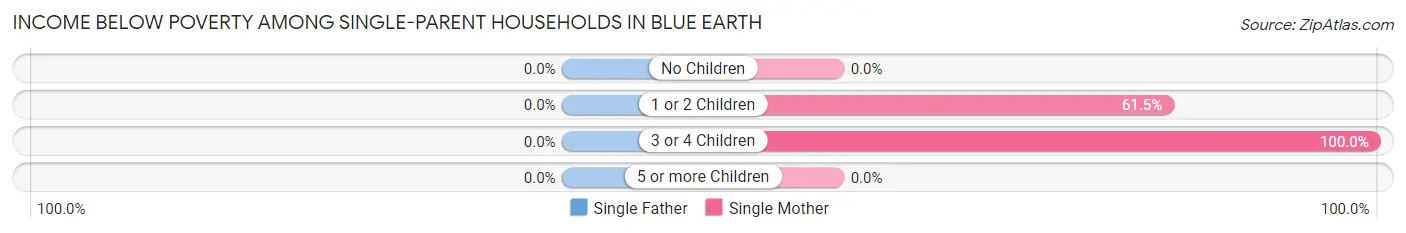
| Children | Single Father | Single Mother |
| No Children | 0 (0.0%) | 0 (0.0%) |
| 1 or 2 Children | 0 (0.0%) | 24 (61.5%) |
| 3 or 4 Children | 0 (0.0%) | 19 (100.0%) |
| 5 or more Children | 0 (0.0%) | 0 (0.0%) |
| Total | 0 (0.0%) | 43 (55.8%) |
Income Below Poverty Among Married-Couple vs Single-Parent Households in Blue Earth
The poverty data for Blue Earth shows that 18 of the married-couple family households (2.8%) and 43 of the single-parent households (25.4%) are living below the poverty level. Within the married-couple family households, those with 1 or 2 children have the highest poverty rate, with 18 households (13.7%) falling below the poverty line. Among the single-parent households, those with 3 or 4 children have the highest poverty rate, with 19 household (100.0%) living below poverty.
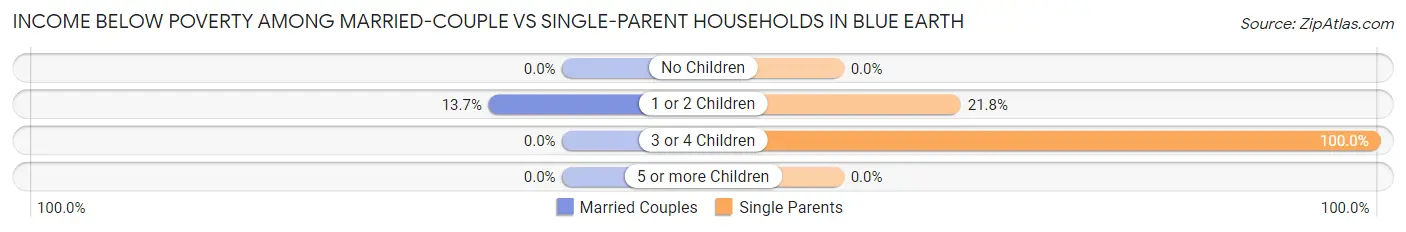
| Children | Married-Couple Families | Single-Parent Households |
| No Children | 0 (0.0%) | 0 (0.0%) |
| 1 or 2 Children | 18 (13.7%) | 24 (21.8%) |
| 3 or 4 Children | 0 (0.0%) | 19 (100.0%) |
| 5 or more Children | 0 (0.0%) | 0 (0.0%) |
| Total | 18 (2.8%) | 43 (25.4%) |
Race in Blue Earth
The most populous races in Blue Earth are White / Caucasian (2,779 | 87.4%), Hispanic or Latino (385 | 12.1%), and Two or more Races (199 | 6.3%).
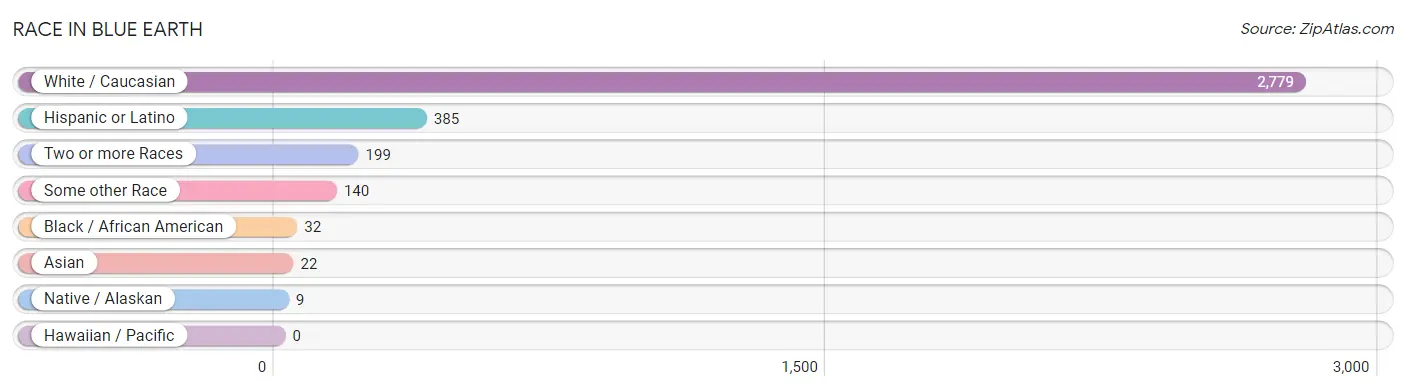
| Race | # Population | % Population |
| Asian | 22 | 0.7% |
| Black / African American | 32 | 1.0% |
| Hawaiian / Pacific | 0 | 0.0% |
| Hispanic or Latino | 385 | 12.1% |
| Native / Alaskan | 9 | 0.3% |
| White / Caucasian | 2,779 | 87.4% |
| Two or more Races | 199 | 6.3% |
| Some other Race | 140 | 4.4% |
| Total | 3,181 | 100.0% |
Ancestry in Blue Earth
The most populous ancestries reported in Blue Earth are German (1,143 | 35.9%), Norwegian (756 | 23.8%), Mexican (367 | 11.5%), Irish (187 | 5.9%), and English (186 | 5.9%), together accounting for 83.0% of all Blue Earth residents.
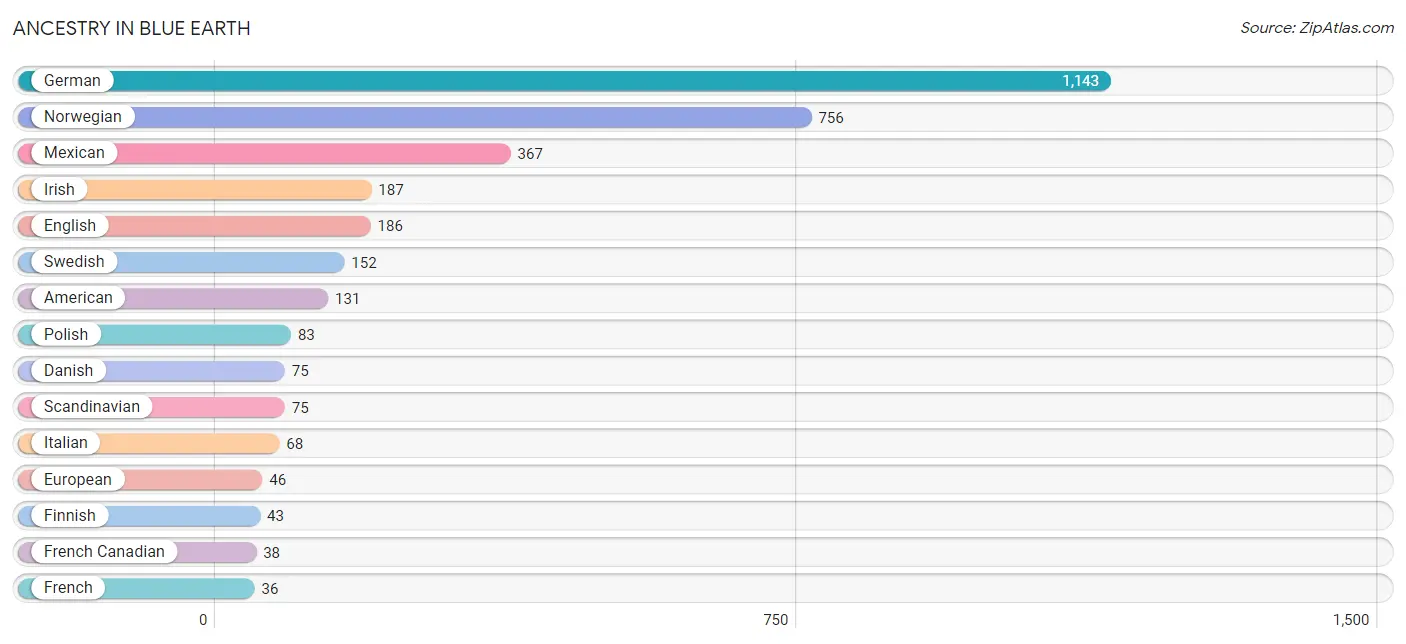
| Ancestry | # Population | % Population |
| American | 131 | 4.1% |
| Belgian | 14 | 0.4% |
| British | 8 | 0.3% |
| Czechoslovakian | 7 | 0.2% |
| Danish | 75 | 2.4% |
| Dutch | 24 | 0.7% |
| English | 186 | 5.9% |
| European | 46 | 1.5% |
| Finnish | 43 | 1.3% |
| French | 36 | 1.1% |
| French Canadian | 38 | 1.2% |
| German | 1,143 | 35.9% |
| Icelander | 6 | 0.2% |
| Irish | 187 | 5.9% |
| Italian | 68 | 2.1% |
| Japanese | 22 | 0.7% |
| Mexican | 367 | 11.5% |
| Norwegian | 756 | 23.8% |
| Polish | 83 | 2.6% |
| Russian | 8 | 0.3% |
| Scandinavian | 75 | 2.4% |
| Scottish | 14 | 0.4% |
| Swedish | 152 | 4.8% |
| Turkish | 19 | 0.6% |
| Welsh | 13 | 0.4% | View All 25 Rows |
Immigrants in Blue Earth
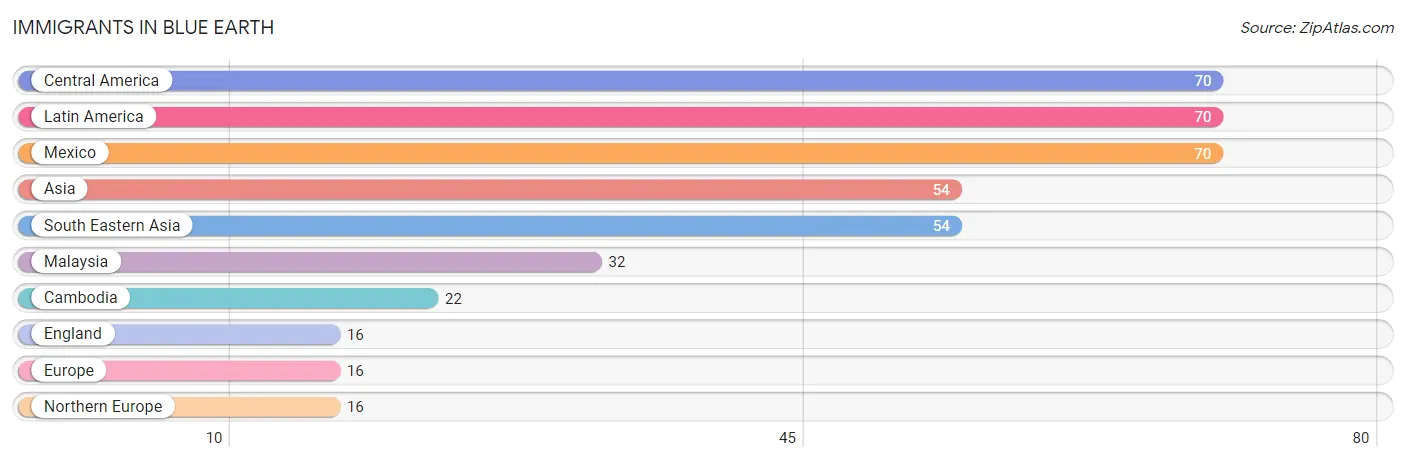
The most numerous immigrant groups reported in Blue Earth came from Central America (70 | 2.2%), Latin America (70 | 2.2%), Mexico (70 | 2.2%), Asia (54 | 1.7%), and South Eastern Asia (54 | 1.7%), together accounting for 10.0% of all Blue Earth residents.
| Immigration Origin | # Population | % Population |
| Asia | 54 | 1.7% |
| Cambodia | 22 | 0.7% |
| Central America | 70 | 2.2% |
| England | 16 | 0.5% |
| Europe | 16 | 0.5% |
| Latin America | 70 | 2.2% |
| Malaysia | 32 | 1.0% |
| Mexico | 70 | 2.2% |
| Northern Europe | 16 | 0.5% |
| South Eastern Asia | 54 | 1.7% | View All 10 Rows |
Sex and Age in Blue Earth
Sex and Age in Blue Earth
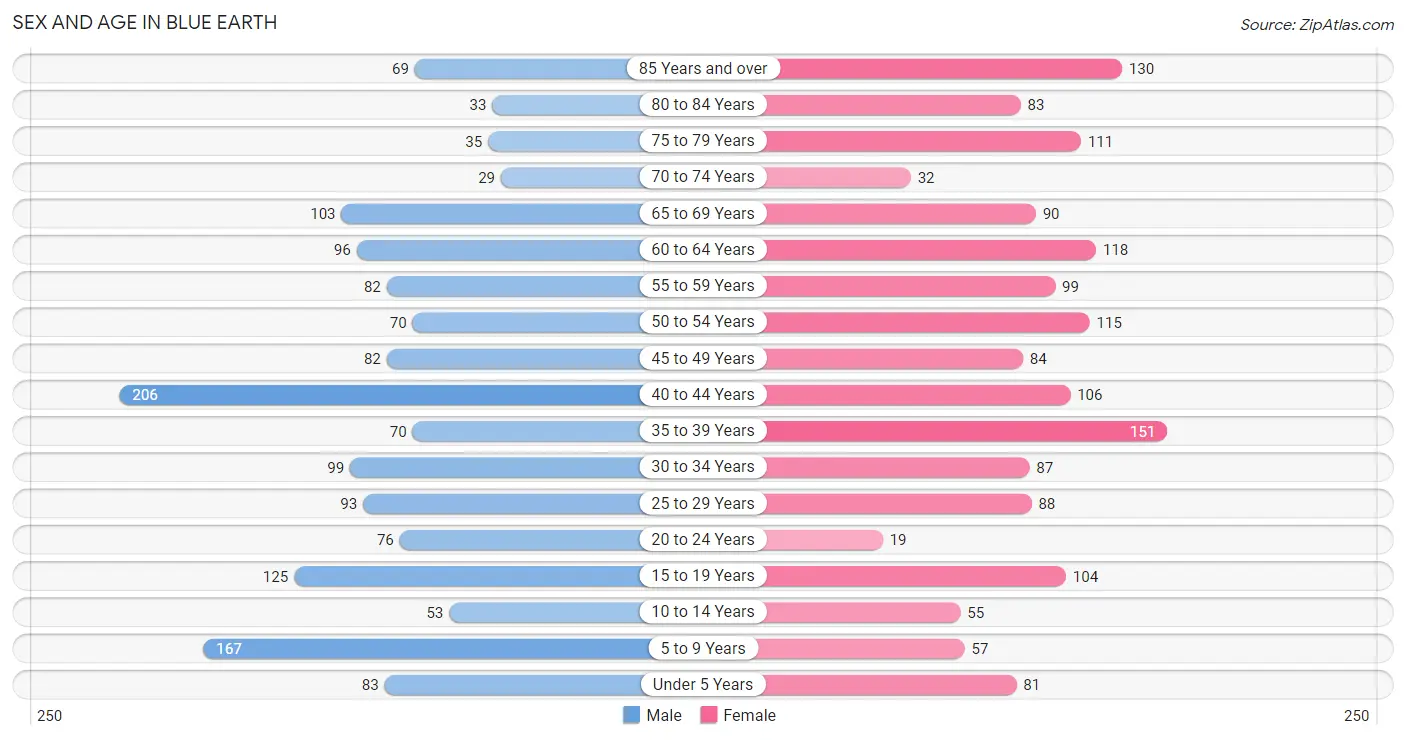
The most populous age groups in Blue Earth are 40 to 44 Years (206 | 13.1%) for men and 35 to 39 Years (151 | 9.4%) for women.
| Age Bracket | Male | Female |
| Under 5 Years | 83 (5.3%) | 81 (5.0%) |
| 5 to 9 Years | 167 (10.6%) | 57 (3.5%) |
| 10 to 14 Years | 53 (3.4%) | 55 (3.4%) |
| 15 to 19 Years | 125 (8.0%) | 104 (6.5%) |
| 20 to 24 Years | 76 (4.8%) | 19 (1.2%) |
| 25 to 29 Years | 93 (5.9%) | 88 (5.5%) |
| 30 to 34 Years | 99 (6.3%) | 87 (5.4%) |
| 35 to 39 Years | 70 (4.5%) | 151 (9.4%) |
| 40 to 44 Years | 206 (13.1%) | 106 (6.6%) |
| 45 to 49 Years | 82 (5.2%) | 84 (5.2%) |
| 50 to 54 Years | 70 (4.5%) | 115 (7.1%) |
| 55 to 59 Years | 82 (5.2%) | 99 (6.1%) |
| 60 to 64 Years | 96 (6.1%) | 118 (7.3%) |
| 65 to 69 Years | 103 (6.6%) | 90 (5.6%) |
| 70 to 74 Years | 29 (1.8%) | 32 (2.0%) |
| 75 to 79 Years | 35 (2.2%) | 111 (6.9%) |
| 80 to 84 Years | 33 (2.1%) | 83 (5.2%) |
| 85 Years and over | 69 (4.4%) | 130 (8.1%) |
| Total | 1,571 (100.0%) | 1,610 (100.0%) |
Families and Households in Blue Earth
Median Family Size in Blue Earth
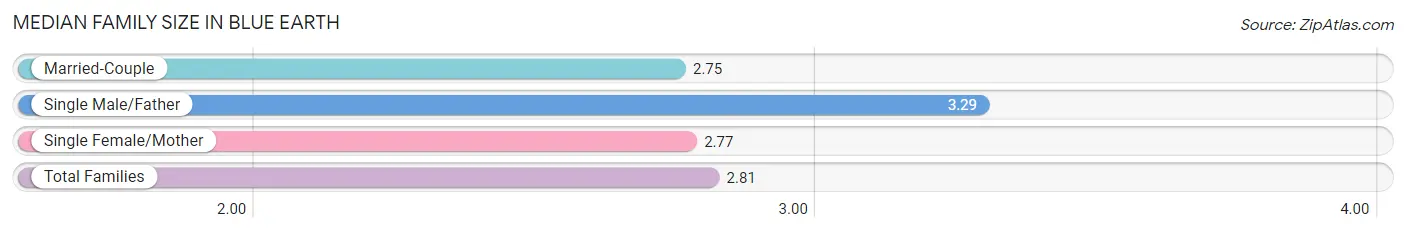
The median family size in Blue Earth is 2.81 persons per family, with single male/father families (92 | 11.2%) accounting for the largest median family size of 3.29 persons per family. On the other hand, married-couple families (654 | 79.5%) represent the smallest median family size with 2.75 persons per family.
| Family Type | # Families | Family Size |
| Married-Couple | 654 (79.5%) | 2.75 |
| Single Male/Father | 92 (11.2%) | 3.29 |
| Single Female/Mother | 77 (9.4%) | 2.77 |
| Total Families | 823 (100.0%) | 2.81 |
Median Household Size in Blue Earth
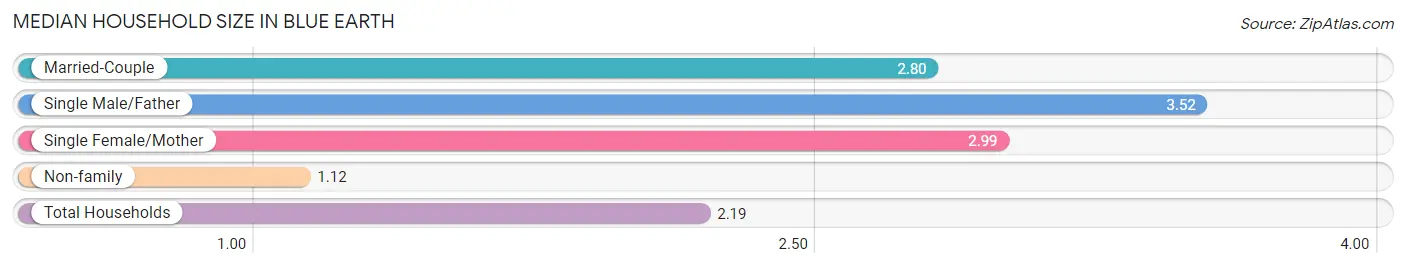
The median household size in Blue Earth is 2.19 persons per household, with single male/father households (92 | 6.8%) accounting for the largest median household size of 3.52 persons per household. non-family households (536 | 39.4%) represent the smallest median household size with 1.12 persons per household.
| Household Type | # Households | Household Size |
| Married-Couple | 654 (48.1%) | 2.80 |
| Single Male/Father | 92 (6.8%) | 3.52 |
| Single Female/Mother | 77 (5.7%) | 2.99 |
| Non-family | 536 (39.4%) | 1.12 |
| Total Households | 1,359 (100.0%) | 2.19 |
Household Size by Marriage Status in Blue Earth
Out of a total of 1,359 households in Blue Earth, 823 (60.6%) are family households, while 536 (39.4%) are nonfamily households. The most numerous type of family households are 2-person households, comprising 483, and the most common type of nonfamily households are 1-person households, comprising 477.
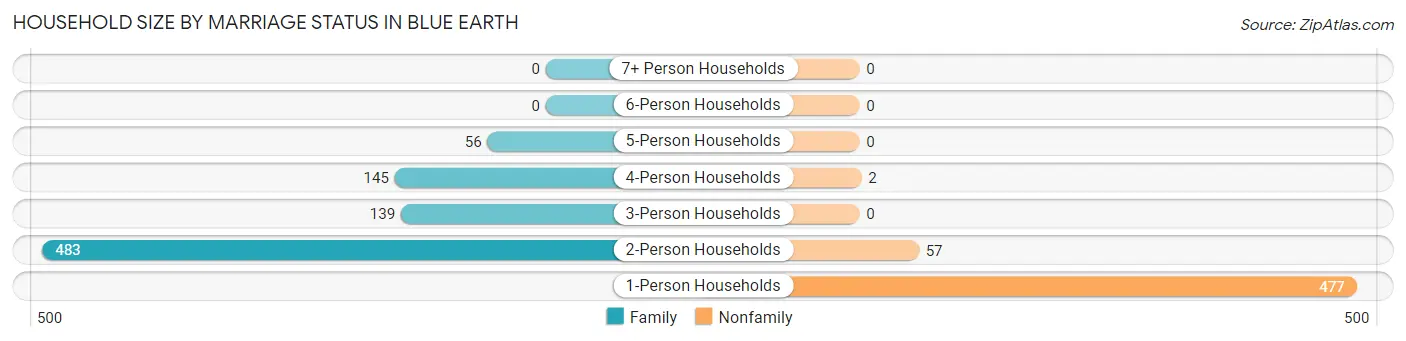
| Household Size | Family Households | Nonfamily Households |
| 1-Person Households | - | 477 (35.1%) |
| 2-Person Households | 483 (35.5%) | 57 (4.2%) |
| 3-Person Households | 139 (10.2%) | 0 (0.0%) |
| 4-Person Households | 145 (10.7%) | 2 (0.2%) |
| 5-Person Households | 56 (4.1%) | 0 (0.0%) |
| 6-Person Households | 0 (0.0%) | 0 (0.0%) |
| 7+ Person Households | 0 (0.0%) | 0 (0.0%) |
| Total | 823 (60.6%) | 536 (39.4%) |
Female Fertility in Blue Earth
Fertility by Age in Blue Earth
Average fertility rate in Blue Earth is 64.0 births per 1,000 women. Women in the age bracket of 20 to 34 years have the highest fertility rate with 98.0 births per 1,000 women. Women in the age bracket of 35 to 50 years acount for 54.8% of all women with births.
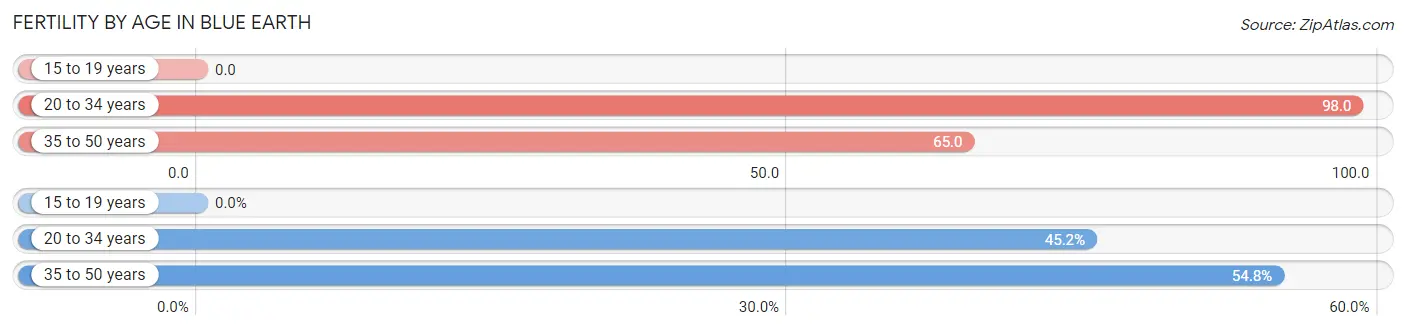
| Age Bracket | Women with Births | Births / 1,000 Women |
| 15 to 19 years | 0 (0.0%) | 0.0 |
| 20 to 34 years | 19 (45.2%) | 98.0 |
| 35 to 50 years | 23 (54.8%) | 65.0 |
| Total | 42 (100.0%) | 64.0 |
Fertility by Age by Marriage Status in Blue Earth
54.8% of women with births (42) in Blue Earth are married. The highest percentage of unmarried women with births falls into 20 to 34 years age bracket with 100.0% of them unmarried at the time of birth, while the lowest percentage of unmarried women with births belong to 35 to 50 years age bracket with 0.0% of them unmarried.
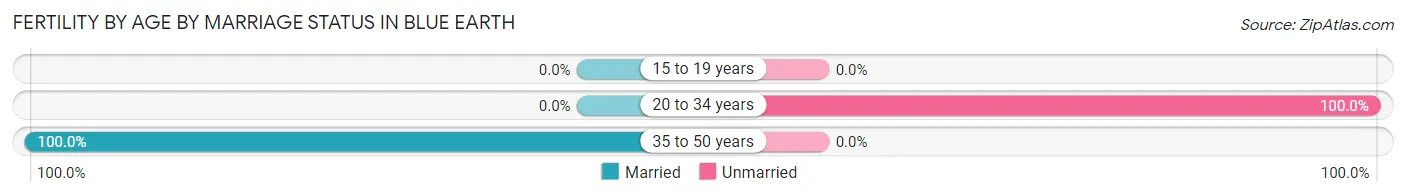
| Age Bracket | Married | Unmarried |
| 15 to 19 years | 0 (0.0%) | 0 (0.0%) |
| 20 to 34 years | 0 (0.0%) | 19 (100.0%) |
| 35 to 50 years | 23 (100.0%) | 0 (0.0%) |
| Total | 23 (54.8%) | 19 (45.2%) |
Fertility by Education in Blue Earth
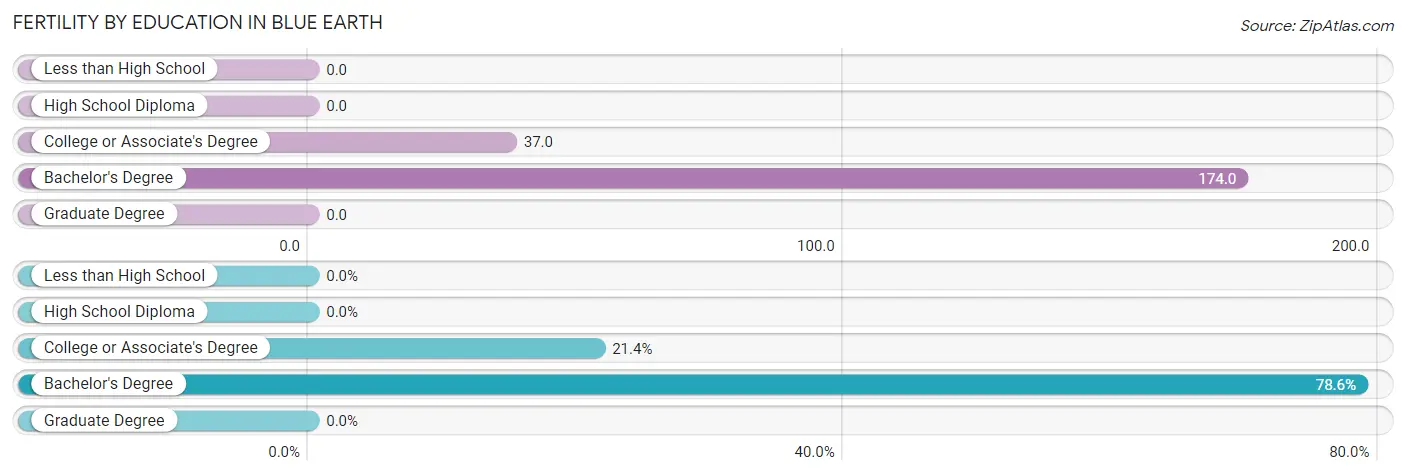
| Educational Attainment | Women with Births | Births / 1,000 Women |
| Less than High School | 0 (0.0%) | 0.0 |
| High School Diploma | 0 (0.0%) | 0.0 |
| College or Associate's Degree | 9 (21.4%) | 37.0 |
| Bachelor's Degree | 33 (78.6%) | 174.0 |
| Graduate Degree | 0 (0.0%) | 0.0 |
| Total | 42 (100.0%) | 64.0 |
Fertility by Education by Marriage Status in Blue Earth
45.2% of women with births in Blue Earth are unmarried. Women with the educational attainment of college or associate's degree are most likely to be married with 100.0% of them married at childbirth, while women with the educational attainment of bachelor's degree are least likely to be married with 57.6% of them unmarried at childbirth.
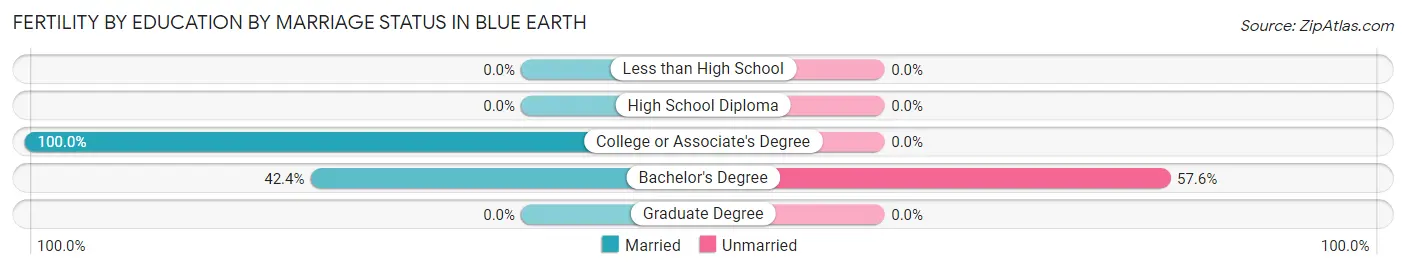
| Educational Attainment | Married | Unmarried |
| Less than High School | 0 (0.0%) | 0 (0.0%) |
| High School Diploma | 0 (0.0%) | 0 (0.0%) |
| College or Associate's Degree | 9 (100.0%) | 0 (0.0%) |
| Bachelor's Degree | 14 (42.4%) | 19 (57.6%) |
| Graduate Degree | 0 (0.0%) | 0 (0.0%) |
| Total | 23 (54.8%) | 19 (45.2%) |
Employment Characteristics in Blue Earth
Employment by Class of Employer in Blue Earth
Among the 1,586 employed individuals in Blue Earth, private company employees (943 | 59.5%), local government employees (169 | 10.7%), and not-for-profit organizations (153 | 9.7%) make up the most common classes of employment.
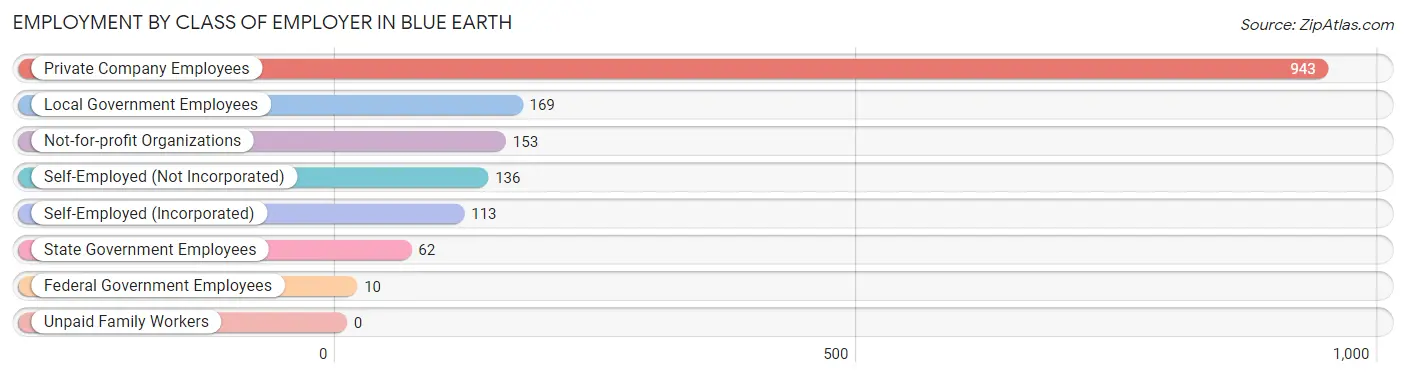
| Employer Class | # Employees | % Employees |
| Private Company Employees | 943 | 59.5% |
| Self-Employed (Incorporated) | 113 | 7.1% |
| Self-Employed (Not Incorporated) | 136 | 8.6% |
| Not-for-profit Organizations | 153 | 9.7% |
| Local Government Employees | 169 | 10.7% |
| State Government Employees | 62 | 3.9% |
| Federal Government Employees | 10 | 0.6% |
| Unpaid Family Workers | 0 | 0.0% |
| Total | 1,586 | 100.0% |
Employment Status by Age in Blue Earth
According to the labor force statistics for Blue Earth, out of the total population over 16 years of age (2,633), 65.2% or 1,717 individuals are in the labor force, with 4.4% or 76 of them unemployed. The age group with the highest labor force participation rate is 20 to 24 years, with 97.9% or 93 individuals in the labor force. Within the labor force, the 75 years and over age range has the highest percentage of unemployed individuals, with 50.0% or 8 of them being unemployed.
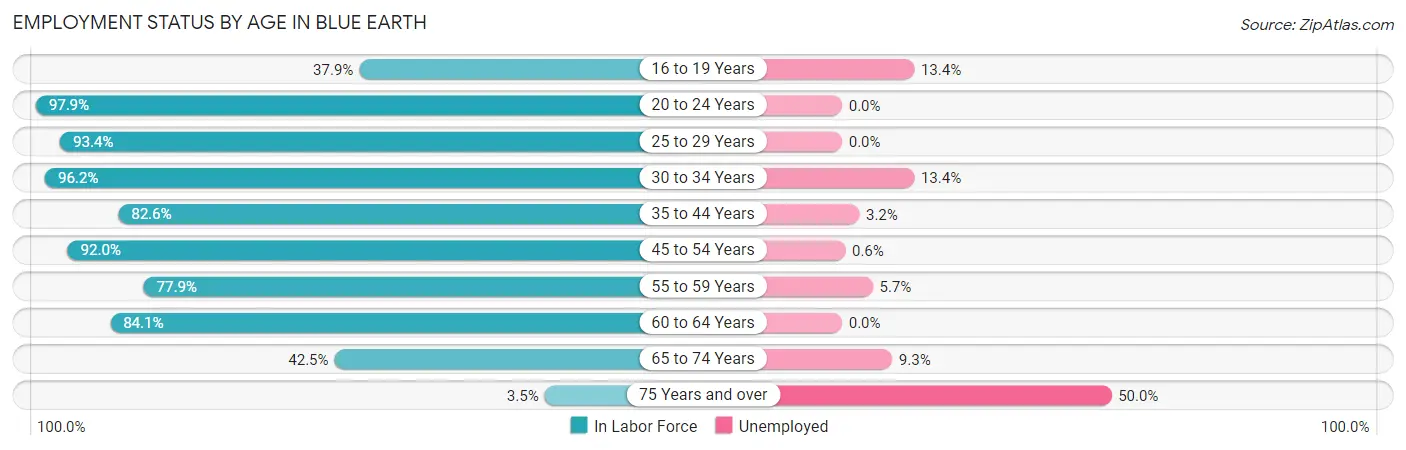
| Age Bracket | In Labor Force | Unemployed |
| 16 to 19 Years | 67 (37.9%) | 9 (13.4%) |
| 20 to 24 Years | 93 (97.9%) | 0 (0.0%) |
| 25 to 29 Years | 169 (93.4%) | 0 (0.0%) |
| 30 to 34 Years | 179 (96.2%) | 24 (13.4%) |
| 35 to 44 Years | 440 (82.6%) | 14 (3.2%) |
| 45 to 54 Years | 323 (92.0%) | 2 (0.6%) |
| 55 to 59 Years | 141 (77.9%) | 8 (5.7%) |
| 60 to 64 Years | 180 (84.1%) | 0 (0.0%) |
| 65 to 74 Years | 108 (42.5%) | 10 (9.3%) |
| 75 Years and over | 16 (3.5%) | 8 (50.0%) |
| Total | 1,717 (65.2%) | 76 (4.4%) |
Employment Status by Educational Attainment in Blue Earth
According to labor force statistics for Blue Earth, 87.0% of individuals (1,432) out of the total population between 25 and 64 years of age (1,646) are in the labor force, with 3.4% or 49 of them being unemployed. The group with the highest labor force participation rate are those with the educational attainment of bachelor's degree or higher, with 96.0% or 429 individuals in the labor force. Within the labor force, individuals with high school diploma education have the highest percentage of unemployment, with 10.5% or 38 of them being unemployed.
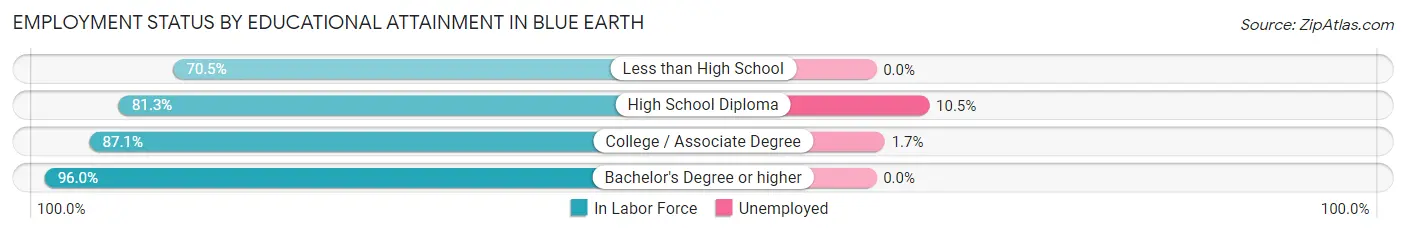
| Educational Attainment | In Labor Force | Unemployed |
| Less than High School | 67 (70.5%) | 0 (0.0%) |
| High School Diploma | 362 (81.3%) | 47 (10.5%) |
| College / Associate Degree | 574 (87.1%) | 11 (1.7%) |
| Bachelor's Degree or higher | 429 (96.0%) | 0 (0.0%) |
| Total | 1,432 (87.0%) | 56 (3.4%) |
Employment Occupations by Sex in Blue Earth
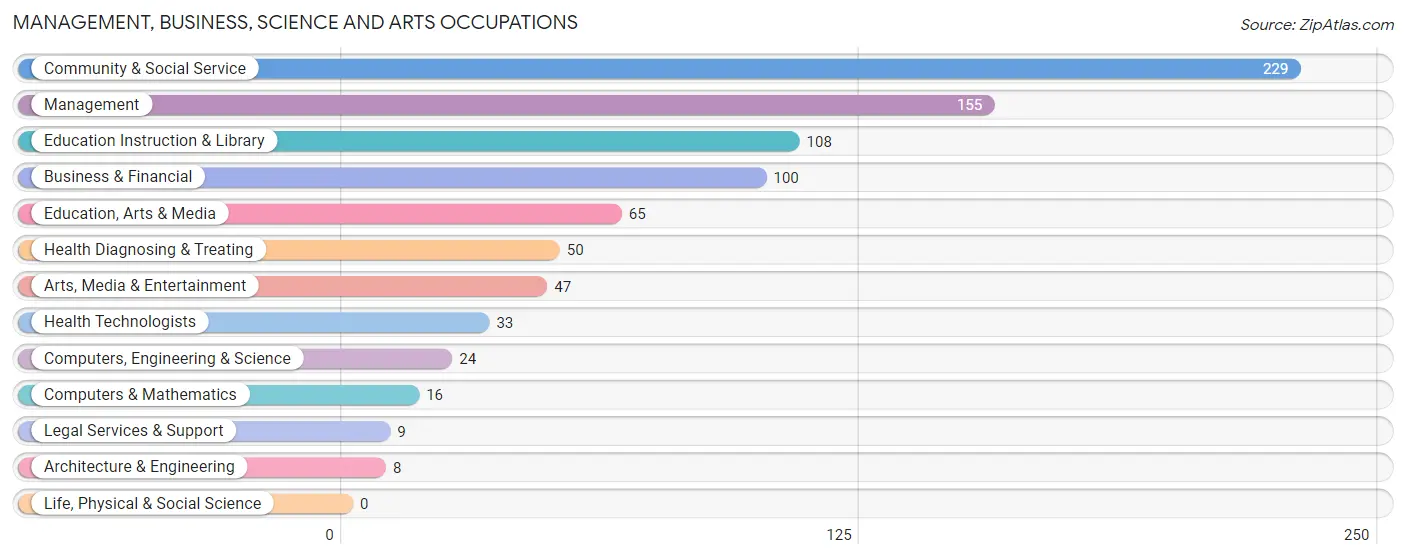
Management, Business, Science and Arts Occupations
The most common Management, Business, Science and Arts occupations in Blue Earth are Community & Social Service (229 | 14.0%), Management (155 | 9.5%), Education Instruction & Library (108 | 6.6%), Business & Financial (100 | 6.1%), and Education, Arts & Media (65 | 4.0%).
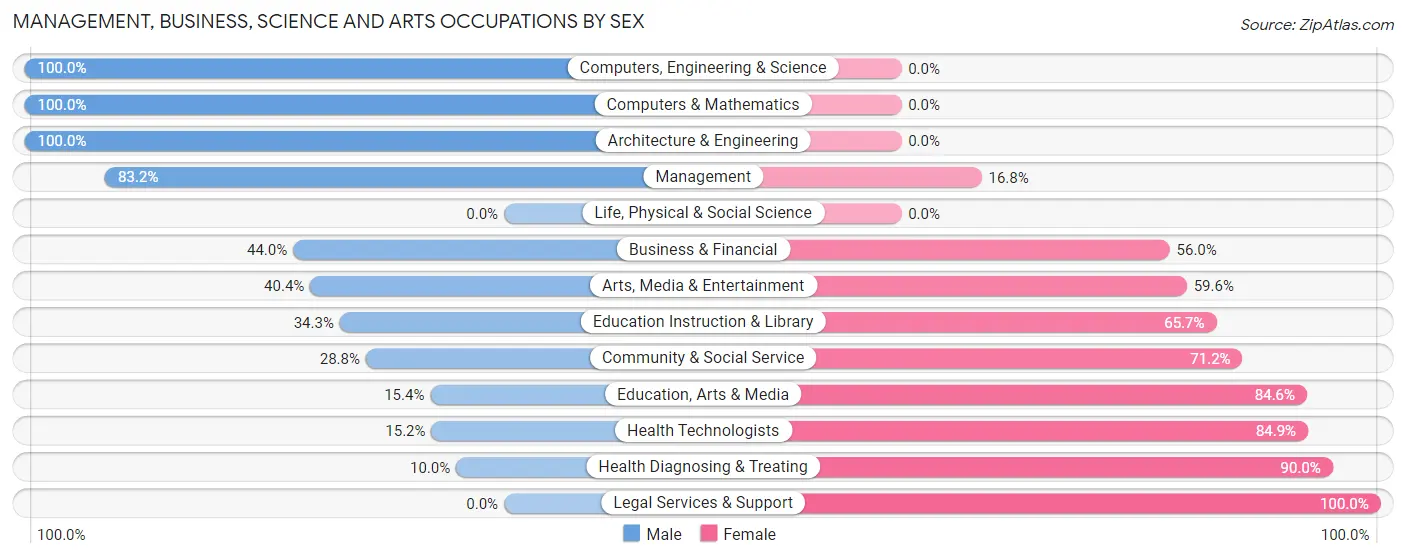
Management, Business, Science and Arts Occupations by Sex
Within the Management, Business, Science and Arts occupations in Blue Earth, the most male-oriented occupations are Computers, Engineering & Science (100.0%), Computers & Mathematics (100.0%), and Architecture & Engineering (100.0%), while the most female-oriented occupations are Legal Services & Support (100.0%), Health Diagnosing & Treating (90.0%), and Health Technologists (84.9%).
| Occupation | Male | Female |
| Management | 129 (83.2%) | 26 (16.8%) |
| Business & Financial | 44 (44.0%) | 56 (56.0%) |
| Computers, Engineering & Science | 24 (100.0%) | 0 (0.0%) |
| Computers & Mathematics | 16 (100.0%) | 0 (0.0%) |
| Architecture & Engineering | 8 (100.0%) | 0 (0.0%) |
| Life, Physical & Social Science | 0 (0.0%) | 0 (0.0%) |
| Community & Social Service | 66 (28.8%) | 163 (71.2%) |
| Education, Arts & Media | 10 (15.4%) | 55 (84.6%) |
| Legal Services & Support | 0 (0.0%) | 9 (100.0%) |
| Education Instruction & Library | 37 (34.3%) | 71 (65.7%) |
| Arts, Media & Entertainment | 19 (40.4%) | 28 (59.6%) |
| Health Diagnosing & Treating | 5 (10.0%) | 45 (90.0%) |
| Health Technologists | 5 (15.1%) | 28 (84.9%) |
| Total (Category) | 268 (48.0%) | 290 (52.0%) |
| Total (Overall) | 845 (51.5%) | 796 (48.5%) |
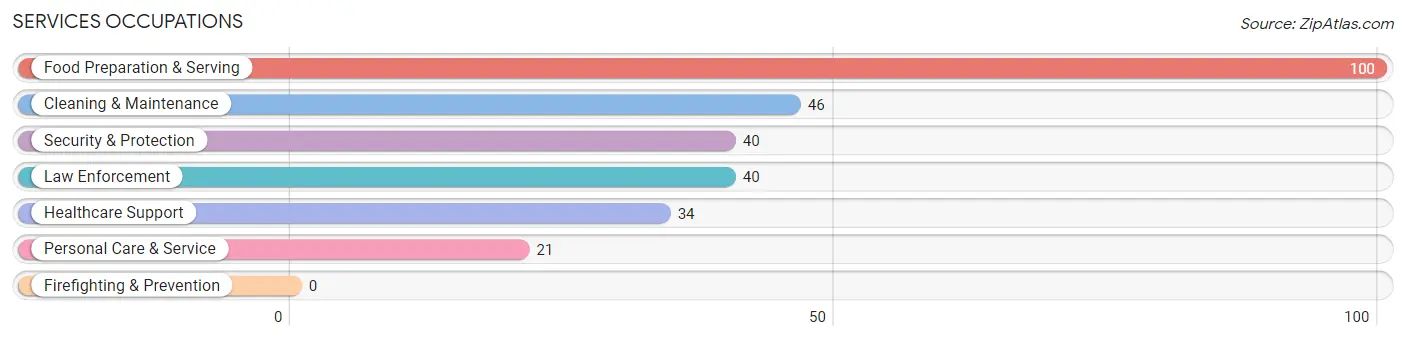
Services Occupations
The most common Services occupations in Blue Earth are Food Preparation & Serving (100 | 6.1%), Cleaning & Maintenance (46 | 2.8%), Security & Protection (40 | 2.4%), Law Enforcement (40 | 2.4%), and Healthcare Support (34 | 2.1%).
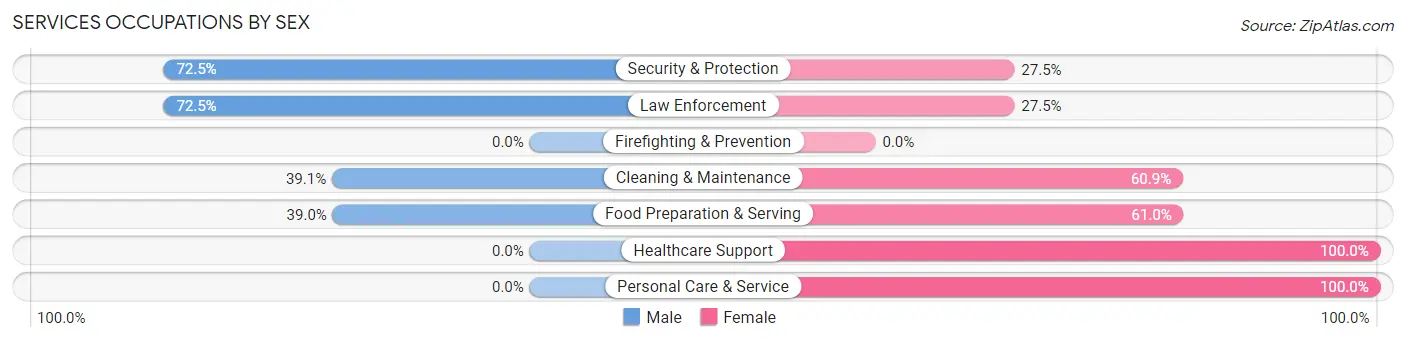
Services Occupations by Sex
Within the Services occupations in Blue Earth, the most male-oriented occupations are Security & Protection (72.5%), Law Enforcement (72.5%), and Cleaning & Maintenance (39.1%), while the most female-oriented occupations are Healthcare Support (100.0%), Personal Care & Service (100.0%), and Food Preparation & Serving (61.0%).
| Occupation | Male | Female |
| Healthcare Support | 0 (0.0%) | 34 (100.0%) |
| Security & Protection | 29 (72.5%) | 11 (27.5%) |
| Firefighting & Prevention | 0 (0.0%) | 0 (0.0%) |
| Law Enforcement | 29 (72.5%) | 11 (27.5%) |
| Food Preparation & Serving | 39 (39.0%) | 61 (61.0%) |
| Cleaning & Maintenance | 18 (39.1%) | 28 (60.9%) |
| Personal Care & Service | 0 (0.0%) | 21 (100.0%) |
| Total (Category) | 86 (35.7%) | 155 (64.3%) |
| Total (Overall) | 845 (51.5%) | 796 (48.5%) |
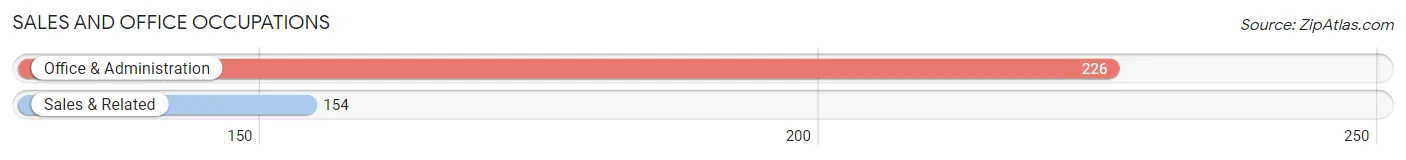
Sales and Office Occupations
The most common Sales and Office occupations in Blue Earth are Office & Administration (226 | 13.8%), and Sales & Related (154 | 9.4%).
Sales and Office Occupations by Sex
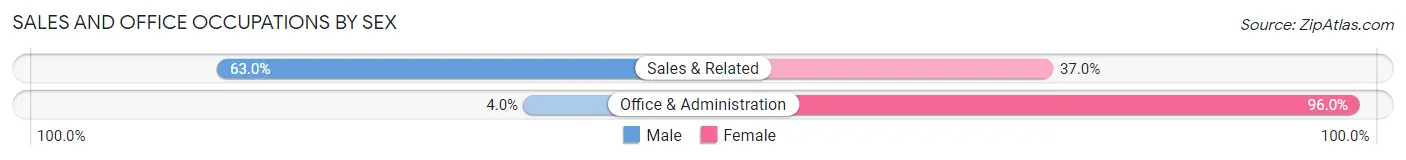
| Occupation | Male | Female |
| Sales & Related | 97 (63.0%) | 57 (37.0%) |
| Office & Administration | 9 (4.0%) | 217 (96.0%) |
| Total (Category) | 106 (27.9%) | 274 (72.1%) |
| Total (Overall) | 845 (51.5%) | 796 (48.5%) |
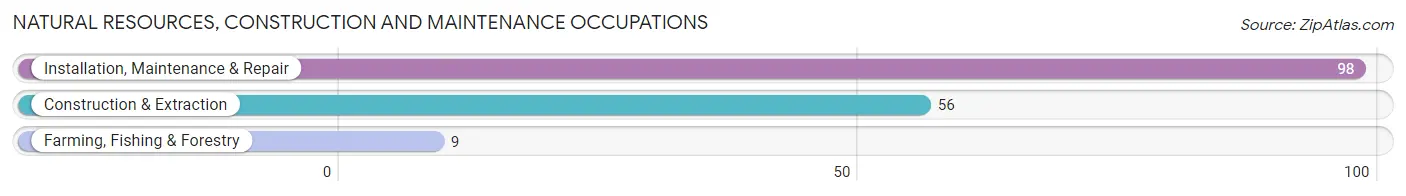
Natural Resources, Construction and Maintenance Occupations
The most common Natural Resources, Construction and Maintenance occupations in Blue Earth are Installation, Maintenance & Repair (98 | 6.0%), Construction & Extraction (56 | 3.4%), and Farming, Fishing & Forestry (9 | 0.5%).
Natural Resources, Construction and Maintenance Occupations by Sex
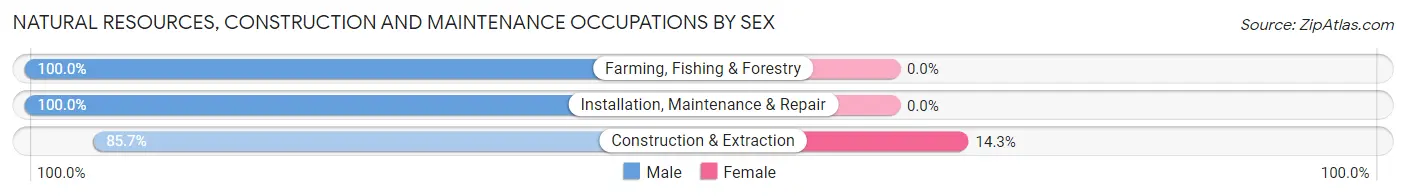
| Occupation | Male | Female |
| Farming, Fishing & Forestry | 9 (100.0%) | 0 (0.0%) |
| Construction & Extraction | 48 (85.7%) | 8 (14.3%) |
| Installation, Maintenance & Repair | 98 (100.0%) | 0 (0.0%) |
| Total (Category) | 155 (95.1%) | 8 (4.9%) |
| Total (Overall) | 845 (51.5%) | 796 (48.5%) |
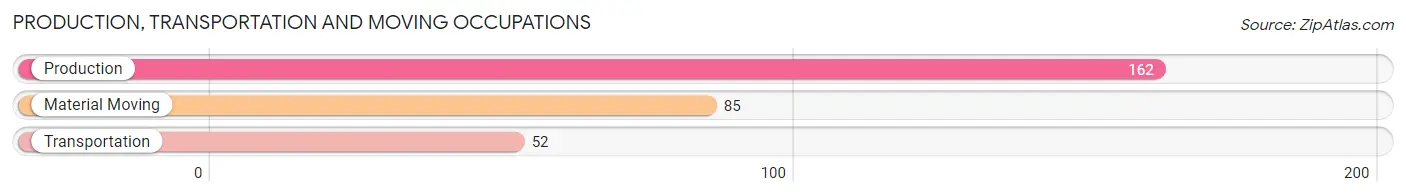
Production, Transportation and Moving Occupations
The most common Production, Transportation and Moving occupations in Blue Earth are Production (162 | 9.9%), Material Moving (85 | 5.2%), and Transportation (52 | 3.2%).
Production, Transportation and Moving Occupations by Sex
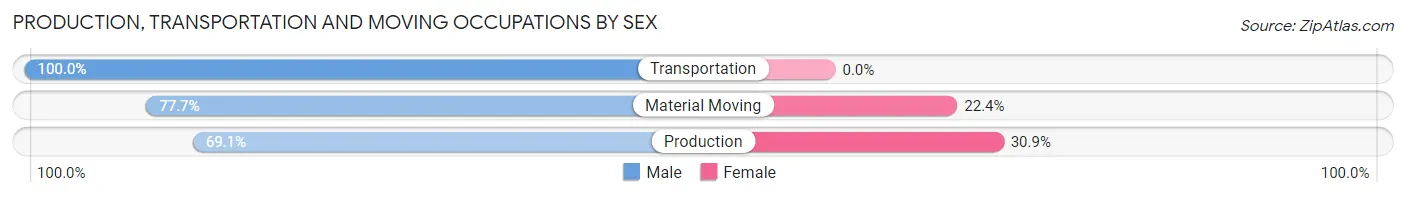
| Occupation | Male | Female |
| Production | 112 (69.1%) | 50 (30.9%) |
| Transportation | 52 (100.0%) | 0 (0.0%) |
| Material Moving | 66 (77.6%) | 19 (22.4%) |
| Total (Category) | 230 (76.9%) | 69 (23.1%) |
| Total (Overall) | 845 (51.5%) | 796 (48.5%) |
Employment Industries by Sex in Blue Earth
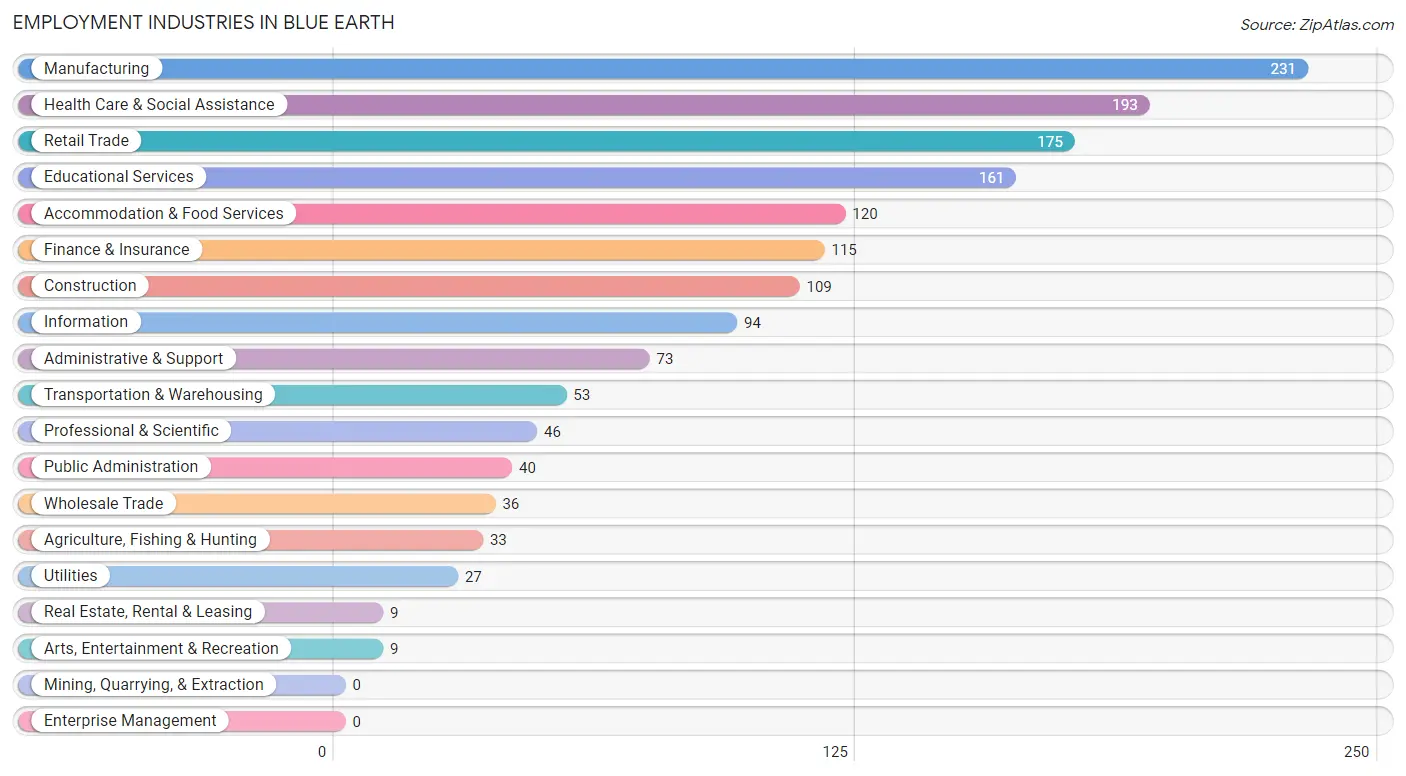
Employment Industries in Blue Earth
The major employment industries in Blue Earth include Manufacturing (231 | 14.1%), Health Care & Social Assistance (193 | 11.8%), Retail Trade (175 | 10.7%), Educational Services (161 | 9.8%), and Accommodation & Food Services (120 | 7.3%).
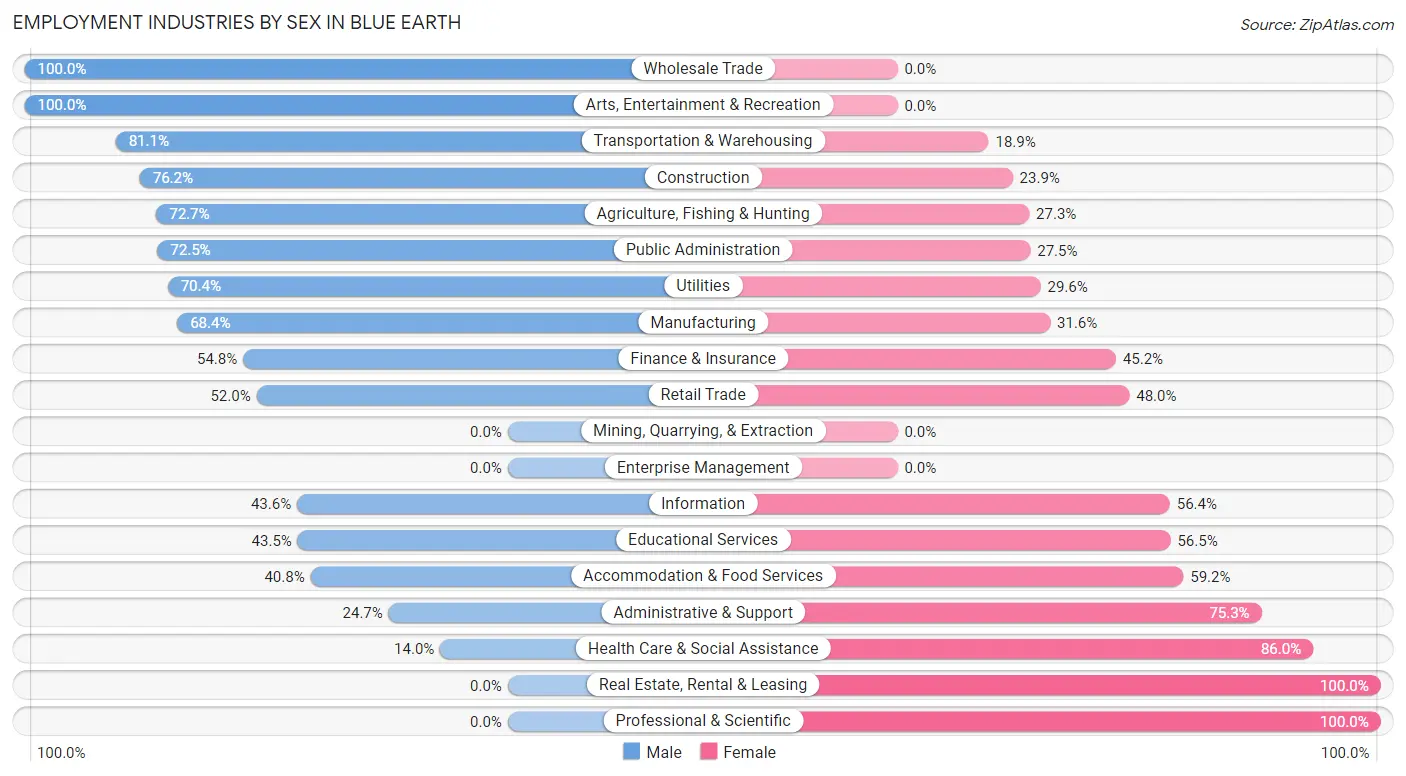
Employment Industries by Sex in Blue Earth
The Blue Earth industries that see more men than women are Wholesale Trade (100.0%), Arts, Entertainment & Recreation (100.0%), and Transportation & Warehousing (81.1%), whereas the industries that tend to have a higher number of women are Real Estate, Rental & Leasing (100.0%), Professional & Scientific (100.0%), and Health Care & Social Assistance (86.0%).
| Industry | Male | Female |
| Agriculture, Fishing & Hunting | 24 (72.7%) | 9 (27.3%) |
| Mining, Quarrying, & Extraction | 0 (0.0%) | 0 (0.0%) |
| Construction | 83 (76.1%) | 26 (23.8%) |
| Manufacturing | 158 (68.4%) | 73 (31.6%) |
| Wholesale Trade | 36 (100.0%) | 0 (0.0%) |
| Retail Trade | 91 (52.0%) | 84 (48.0%) |
| Transportation & Warehousing | 43 (81.1%) | 10 (18.9%) |
| Utilities | 19 (70.4%) | 8 (29.6%) |
| Information | 41 (43.6%) | 53 (56.4%) |
| Finance & Insurance | 63 (54.8%) | 52 (45.2%) |
| Real Estate, Rental & Leasing | 0 (0.0%) | 9 (100.0%) |
| Professional & Scientific | 0 (0.0%) | 46 (100.0%) |
| Enterprise Management | 0 (0.0%) | 0 (0.0%) |
| Administrative & Support | 18 (24.7%) | 55 (75.3%) |
| Educational Services | 70 (43.5%) | 91 (56.5%) |
| Health Care & Social Assistance | 27 (14.0%) | 166 (86.0%) |
| Arts, Entertainment & Recreation | 9 (100.0%) | 0 (0.0%) |
| Accommodation & Food Services | 49 (40.8%) | 71 (59.2%) |
| Public Administration | 29 (72.5%) | 11 (27.5%) |
| Total | 845 (51.5%) | 796 (48.5%) |
Education in Blue Earth
School Enrollment in Blue Earth
The most common levels of schooling among the 697 students in Blue Earth are high school (191 | 27.4%), college / undergraduate (140 | 20.1%), and elementary school (138 | 19.8%).
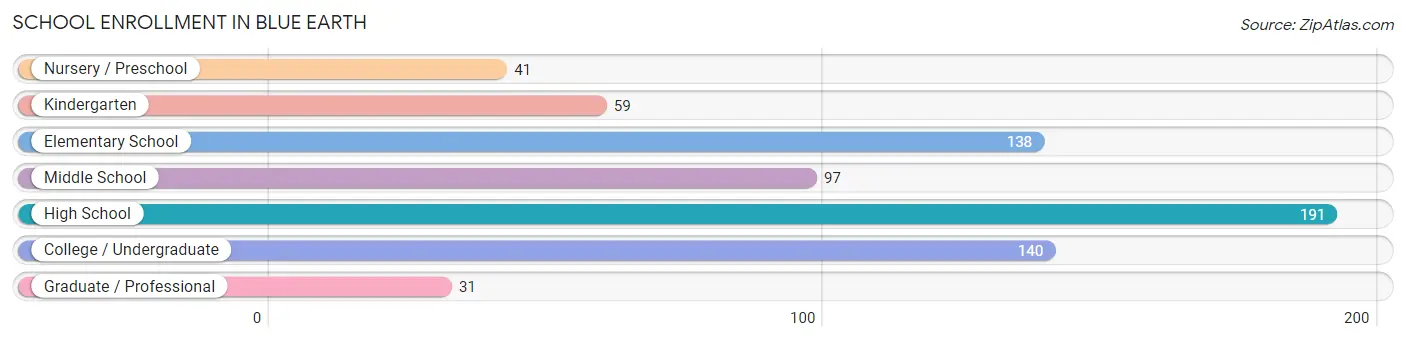
| School Level | # Students | % Students |
| Nursery / Preschool | 41 | 5.9% |
| Kindergarten | 59 | 8.5% |
| Elementary School | 138 | 19.8% |
| Middle School | 97 | 13.9% |
| High School | 191 | 27.4% |
| College / Undergraduate | 140 | 20.1% |
| Graduate / Professional | 31 | 4.4% |
| Total | 697 | 100.0% |
School Enrollment by Age by Funding Source in Blue Earth
Out of a total of 697 students who are enrolled in schools in Blue Earth, 114 (16.4%) attend a private institution, while the remaining 583 (83.6%) are enrolled in public schools. The age group of 35 years and over has the highest likelihood of being enrolled in private schools, with 31 (53.4% in the age bracket) enrolled. Conversely, the age group of 3 to 4 year olds has the lowest likelihood of being enrolled in a private school, with 14 (100.0% in the age bracket) attending a public institution.
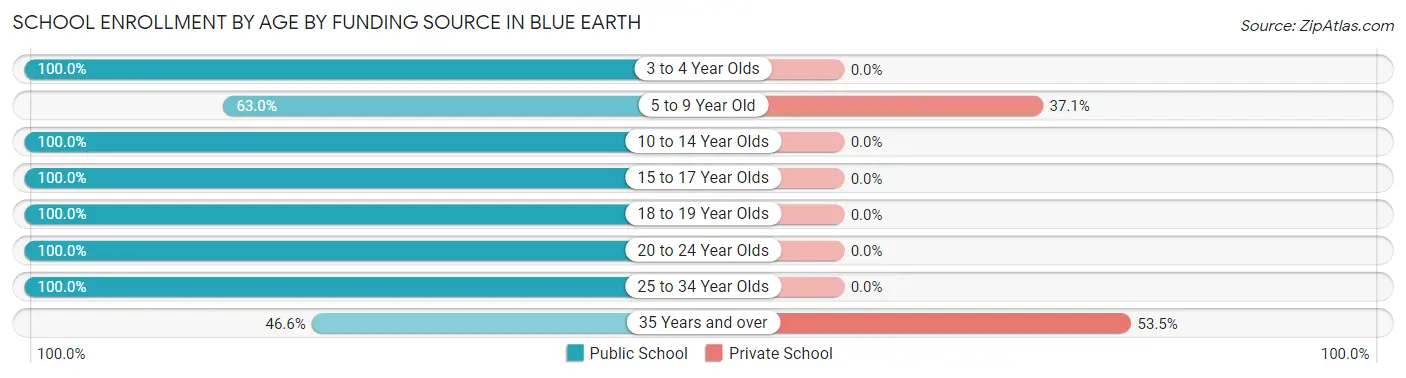
| Age Bracket | Public School | Private School |
| 3 to 4 Year Olds | 14 (100.0%) | 0 (0.0%) |
| 5 to 9 Year Old | 141 (62.9%) | 83 (37.0%) |
| 10 to 14 Year Olds | 108 (100.0%) | 0 (0.0%) |
| 15 to 17 Year Olds | 146 (100.0%) | 0 (0.0%) |
| 18 to 19 Year Olds | 71 (100.0%) | 0 (0.0%) |
| 20 to 24 Year Olds | 58 (100.0%) | 0 (0.0%) |
| 25 to 34 Year Olds | 18 (100.0%) | 0 (0.0%) |
| 35 Years and over | 27 (46.6%) | 31 (53.4%) |
| Total | 583 (83.6%) | 114 (16.4%) |
Educational Attainment by Field of Study in Blue Earth
Education (106 | 16.9%), business (102 | 16.3%), arts & humanities (67 | 10.7%), bio, nature & agricultural (64 | 10.2%), and literature & languages (51 | 8.2%) are the most common fields of study among 626 individuals in Blue Earth who have obtained a bachelor's degree or higher.
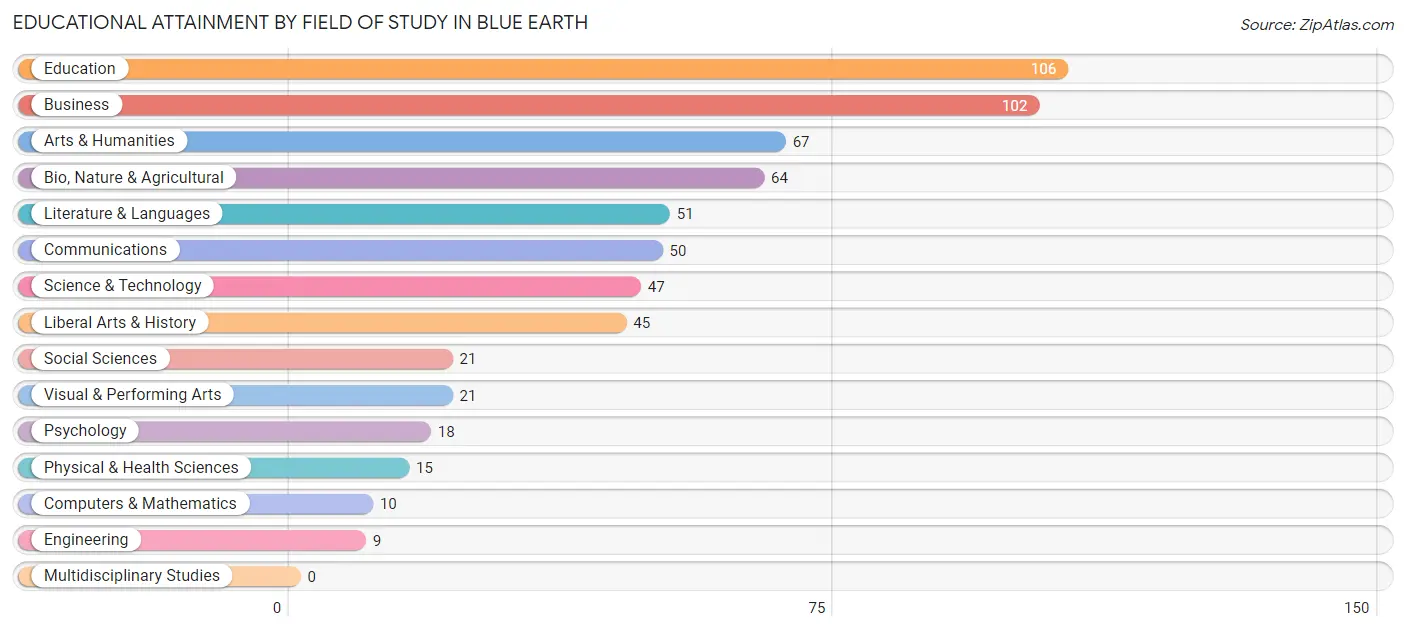
| Field of Study | # Graduates | % Graduates |
| Computers & Mathematics | 10 | 1.6% |
| Bio, Nature & Agricultural | 64 | 10.2% |
| Physical & Health Sciences | 15 | 2.4% |
| Psychology | 18 | 2.9% |
| Social Sciences | 21 | 3.4% |
| Engineering | 9 | 1.4% |
| Multidisciplinary Studies | 0 | 0.0% |
| Science & Technology | 47 | 7.5% |
| Business | 102 | 16.3% |
| Education | 106 | 16.9% |
| Literature & Languages | 51 | 8.2% |
| Liberal Arts & History | 45 | 7.2% |
| Visual & Performing Arts | 21 | 3.4% |
| Communications | 50 | 8.0% |
| Arts & Humanities | 67 | 10.7% |
| Total | 626 | 100.0% |
Transportation & Commute in Blue Earth
Vehicle Availability by Sex in Blue Earth
The most prevalent vehicle ownership categories in Blue Earth are males with 2 vehicles (332, accounting for 40.6%) and females with 2 vehicles (291, making up 43.2%).
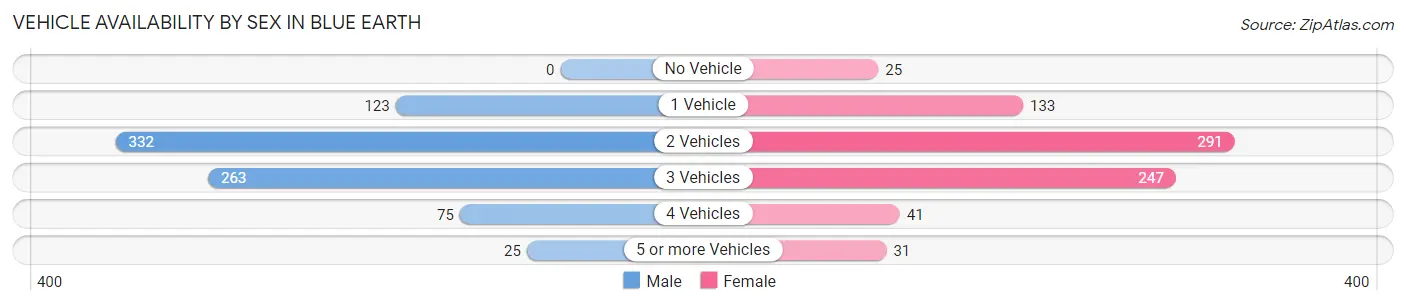
| Vehicles Available | Male | Female |
| No Vehicle | 0 (0.0%) | 25 (3.3%) |
| 1 Vehicle | 123 (15.0%) | 133 (17.3%) |
| 2 Vehicles | 332 (40.6%) | 291 (37.9%) |
| 3 Vehicles | 263 (32.2%) | 247 (32.2%) |
| 4 Vehicles | 75 (9.2%) | 41 (5.3%) |
| 5 or more Vehicles | 25 (3.1%) | 31 (4.0%) |
| Total | 818 (100.0%) | 768 (100.0%) |
Commute Time in Blue Earth
The most frequently occuring commute durations in Blue Earth are less than 5 minutes (420 commuters, 28.8%), 5 to 9 minutes (400 commuters, 27.4%), and 10 to 14 minutes (245 commuters, 16.8%).
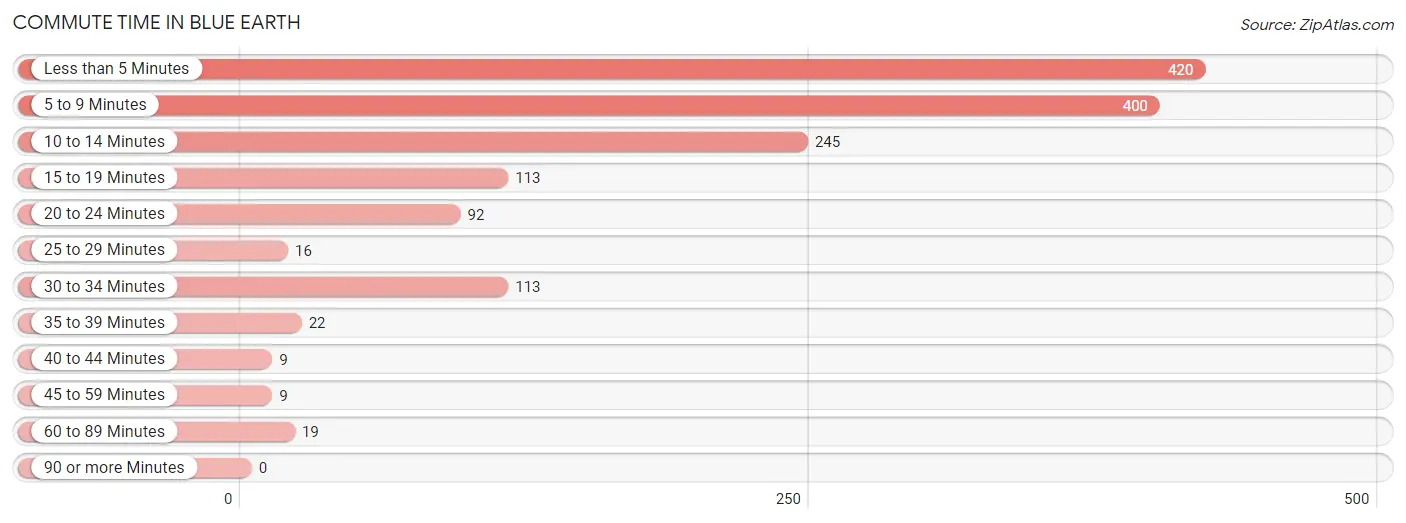
| Commute Time | # Commuters | % Commuters |
| Less than 5 Minutes | 420 | 28.8% |
| 5 to 9 Minutes | 400 | 27.4% |
| 10 to 14 Minutes | 245 | 16.8% |
| 15 to 19 Minutes | 113 | 7.7% |
| 20 to 24 Minutes | 92 | 6.3% |
| 25 to 29 Minutes | 16 | 1.1% |
| 30 to 34 Minutes | 113 | 7.7% |
| 35 to 39 Minutes | 22 | 1.5% |
| 40 to 44 Minutes | 9 | 0.6% |
| 45 to 59 Minutes | 9 | 0.6% |
| 60 to 89 Minutes | 19 | 1.3% |
| 90 or more Minutes | 0 | 0.0% |
Commute Time by Sex in Blue Earth
The most common commute times in Blue Earth are less than 5 minutes (210 commuters, 28.6%) for males and 5 to 9 minutes (227 commuters, 31.4%) for females.
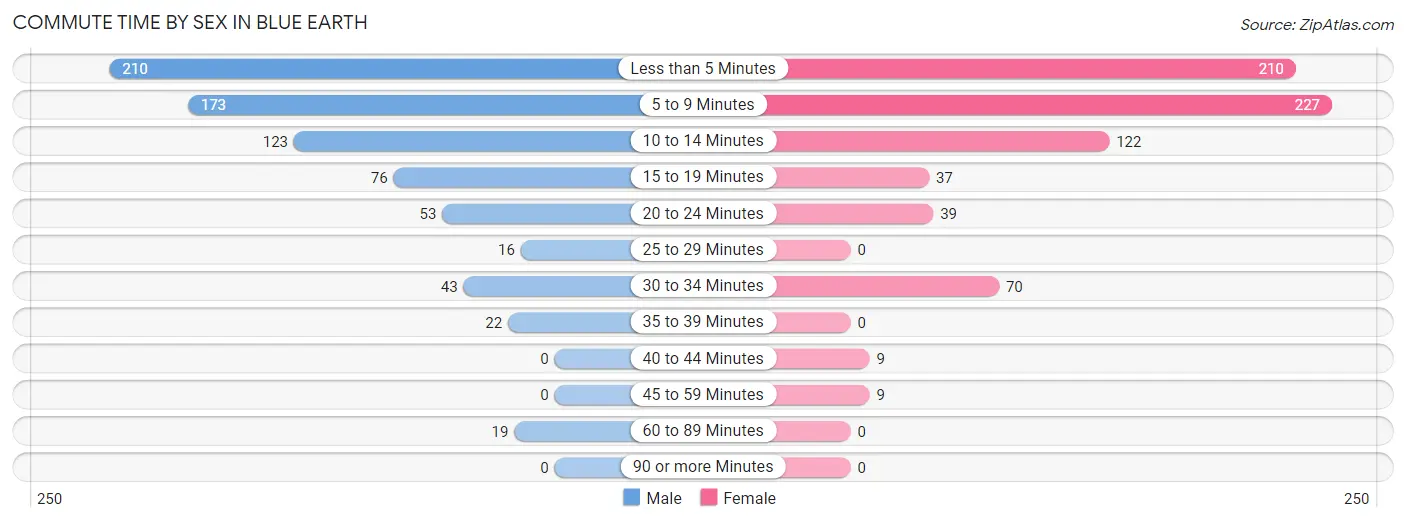
| Commute Time | Male | Female |
| Less than 5 Minutes | 210 (28.6%) | 210 (29.0%) |
| 5 to 9 Minutes | 173 (23.5%) | 227 (31.4%) |
| 10 to 14 Minutes | 123 (16.7%) | 122 (16.9%) |
| 15 to 19 Minutes | 76 (10.3%) | 37 (5.1%) |
| 20 to 24 Minutes | 53 (7.2%) | 39 (5.4%) |
| 25 to 29 Minutes | 16 (2.2%) | 0 (0.0%) |
| 30 to 34 Minutes | 43 (5.9%) | 70 (9.7%) |
| 35 to 39 Minutes | 22 (3.0%) | 0 (0.0%) |
| 40 to 44 Minutes | 0 (0.0%) | 9 (1.2%) |
| 45 to 59 Minutes | 0 (0.0%) | 9 (1.2%) |
| 60 to 89 Minutes | 19 (2.6%) | 0 (0.0%) |
| 90 or more Minutes | 0 (0.0%) | 0 (0.0%) |
Time of Departure to Work by Sex in Blue Earth
The most frequent times of departure to work in Blue Earth are 6:30 AM to 6:59 AM (141, 19.2%) for males and 7:30 AM to 7:59 AM (213, 29.5%) for females.
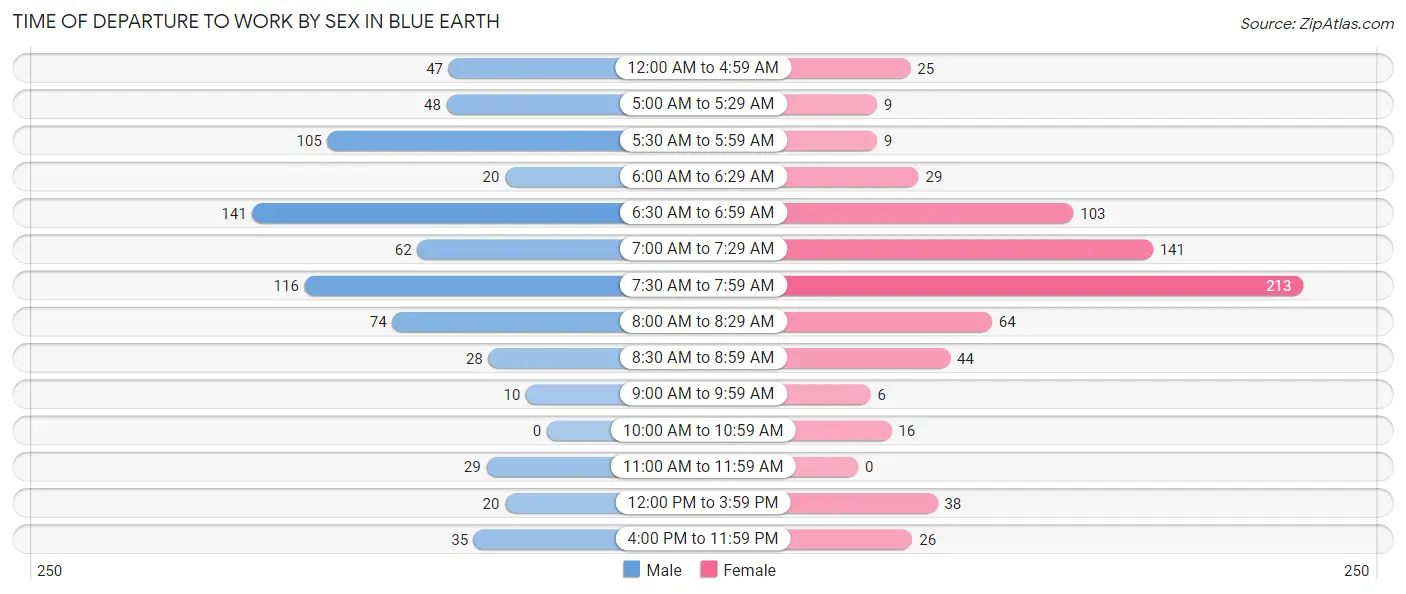
| Time of Departure | Male | Female |
| 12:00 AM to 4:59 AM | 47 (6.4%) | 25 (3.5%) |
| 5:00 AM to 5:29 AM | 48 (6.5%) | 9 (1.2%) |
| 5:30 AM to 5:59 AM | 105 (14.3%) | 9 (1.2%) |
| 6:00 AM to 6:29 AM | 20 (2.7%) | 29 (4.0%) |
| 6:30 AM to 6:59 AM | 141 (19.2%) | 103 (14.2%) |
| 7:00 AM to 7:29 AM | 62 (8.4%) | 141 (19.5%) |
| 7:30 AM to 7:59 AM | 116 (15.8%) | 213 (29.5%) |
| 8:00 AM to 8:29 AM | 74 (10.1%) | 64 (8.8%) |
| 8:30 AM to 8:59 AM | 28 (3.8%) | 44 (6.1%) |
| 9:00 AM to 9:59 AM | 10 (1.4%) | 6 (0.8%) |
| 10:00 AM to 10:59 AM | 0 (0.0%) | 16 (2.2%) |
| 11:00 AM to 11:59 AM | 29 (4.0%) | 0 (0.0%) |
| 12:00 PM to 3:59 PM | 20 (2.7%) | 38 (5.3%) |
| 4:00 PM to 11:59 PM | 35 (4.8%) | 26 (3.6%) |
| Total | 735 (100.0%) | 723 (100.0%) |
Housing Occupancy in Blue Earth
Occupancy by Ownership in Blue Earth
Of the total 1,359 dwellings in Blue Earth, owner-occupied units account for 960 (70.6%), while renter-occupied units make up 399 (29.4%).
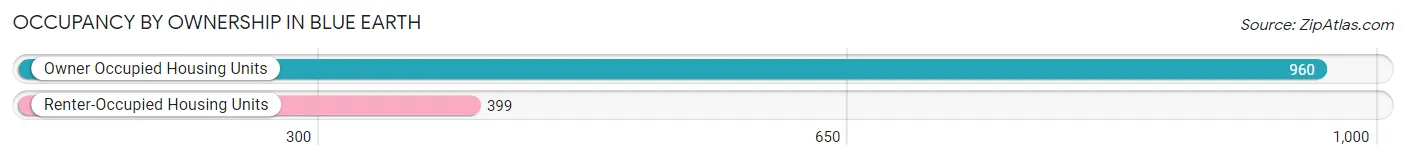
| Occupancy | # Housing Units | % Housing Units |
| Owner Occupied Housing Units | 960 | 70.6% |
| Renter-Occupied Housing Units | 399 | 29.4% |
| Total Occupied Housing Units | 1,359 | 100.0% |
Occupancy by Household Size in Blue Earth
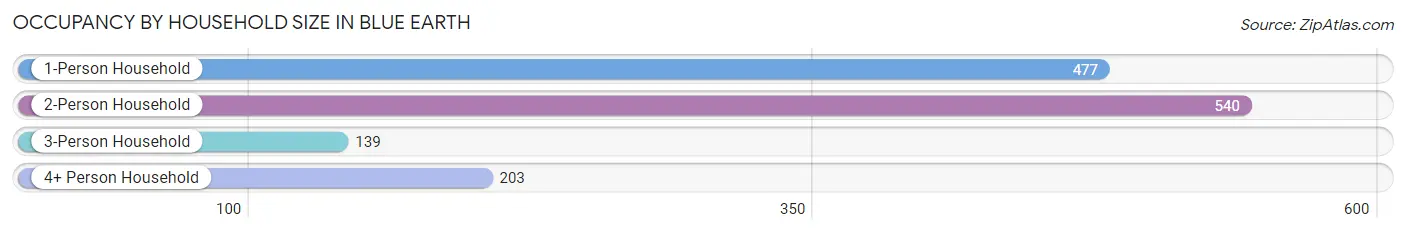
| Household Size | # Housing Units | % Housing Units |
| 1-Person Household | 477 | 35.1% |
| 2-Person Household | 540 | 39.7% |
| 3-Person Household | 139 | 10.2% |
| 4+ Person Household | 203 | 14.9% |
| Total Housing Units | 1,359 | 100.0% |
Occupancy by Ownership by Household Size in Blue Earth
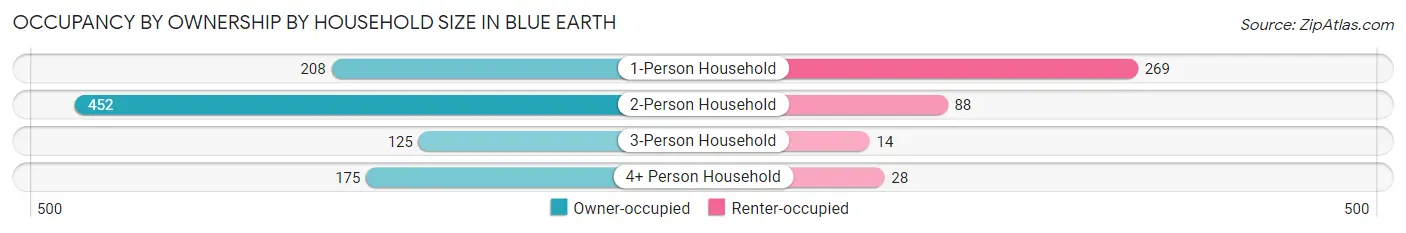
| Household Size | Owner-occupied | Renter-occupied |
| 1-Person Household | 208 (43.6%) | 269 (56.4%) |
| 2-Person Household | 452 (83.7%) | 88 (16.3%) |
| 3-Person Household | 125 (89.9%) | 14 (10.1%) |
| 4+ Person Household | 175 (86.2%) | 28 (13.8%) |
| Total Housing Units | 960 (70.6%) | 399 (29.4%) |
Occupancy by Educational Attainment in Blue Earth
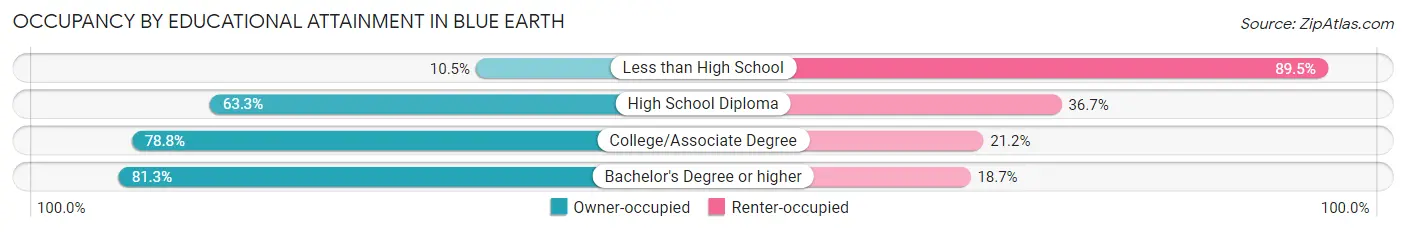
| Household Size | Owner-occupied | Renter-occupied |
| Less than High School | 8 (10.5%) | 68 (89.5%) |
| High School Diploma | 272 (63.3%) | 158 (36.7%) |
| College/Associate Degree | 419 (78.8%) | 113 (21.2%) |
| Bachelor's Degree or higher | 261 (81.3%) | 60 (18.7%) |
Occupancy by Age of Householder in Blue Earth
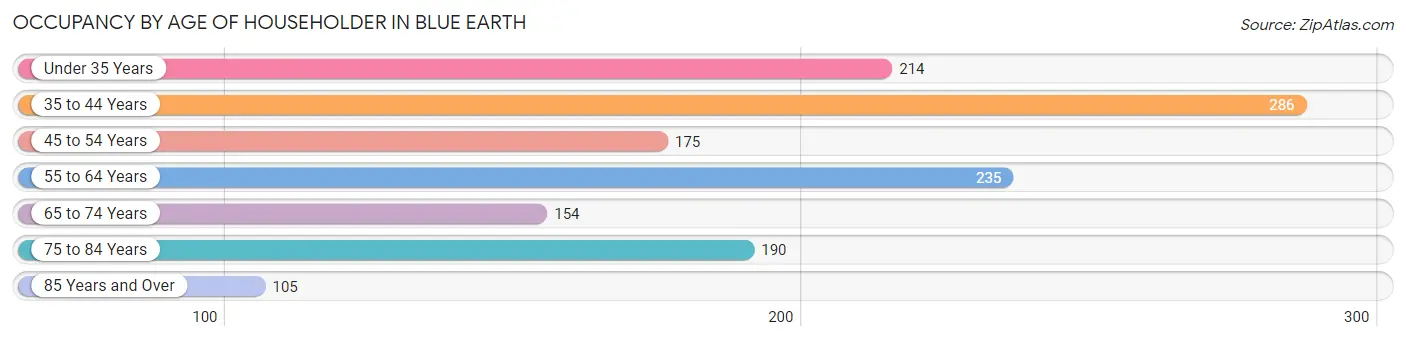
| Age Bracket | # Households | % Households |
| Under 35 Years | 214 | 15.8% |
| 35 to 44 Years | 286 | 21.0% |
| 45 to 54 Years | 175 | 12.9% |
| 55 to 64 Years | 235 | 17.3% |
| 65 to 74 Years | 154 | 11.3% |
| 75 to 84 Years | 190 | 14.0% |
| 85 Years and Over | 105 | 7.7% |
| Total | 1,359 | 100.0% |
Housing Finances in Blue Earth
Median Income by Occupancy in Blue Earth
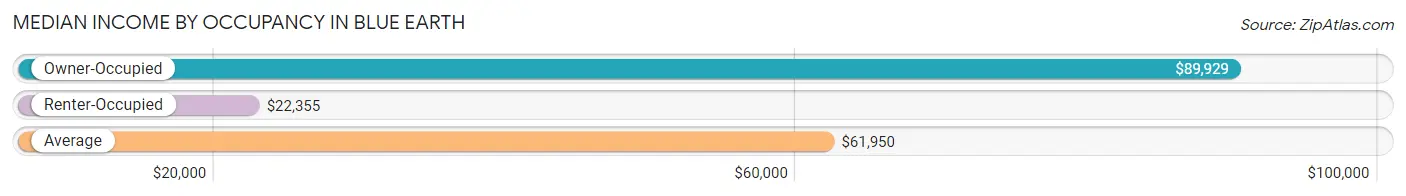
| Occupancy Type | # Households | Median Income |
| Owner-Occupied | 960 (70.6%) | $89,929 |
| Renter-Occupied | 399 (29.4%) | $22,355 |
| Average | 1,359 (100.0%) | $61,950 |
Occupancy by Householder Income Bracket in Blue Earth
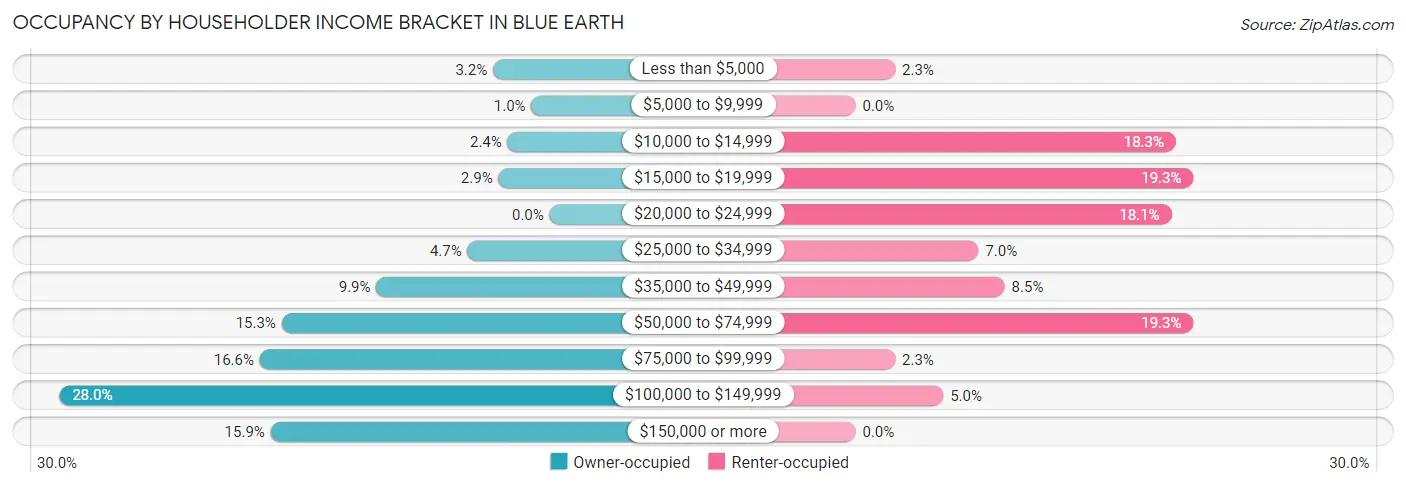
| Income Bracket | Owner-occupied | Renter-occupied |
| Less than $5,000 | 31 (3.2%) | 9 (2.3%) |
| $5,000 to $9,999 | 10 (1.0%) | 0 (0.0%) |
| $10,000 to $14,999 | 23 (2.4%) | 73 (18.3%) |
| $15,000 to $19,999 | 28 (2.9%) | 77 (19.3%) |
| $20,000 to $24,999 | 0 (0.0%) | 72 (18.0%) |
| $25,000 to $34,999 | 45 (4.7%) | 28 (7.0%) |
| $35,000 to $49,999 | 95 (9.9%) | 34 (8.5%) |
| $50,000 to $74,999 | 147 (15.3%) | 77 (19.3%) |
| $75,000 to $99,999 | 159 (16.6%) | 9 (2.3%) |
| $100,000 to $149,999 | 269 (28.0%) | 20 (5.0%) |
| $150,000 or more | 153 (15.9%) | 0 (0.0%) |
| Total | 960 (100.0%) | 399 (100.0%) |
Monthly Housing Cost Tiers in Blue Earth
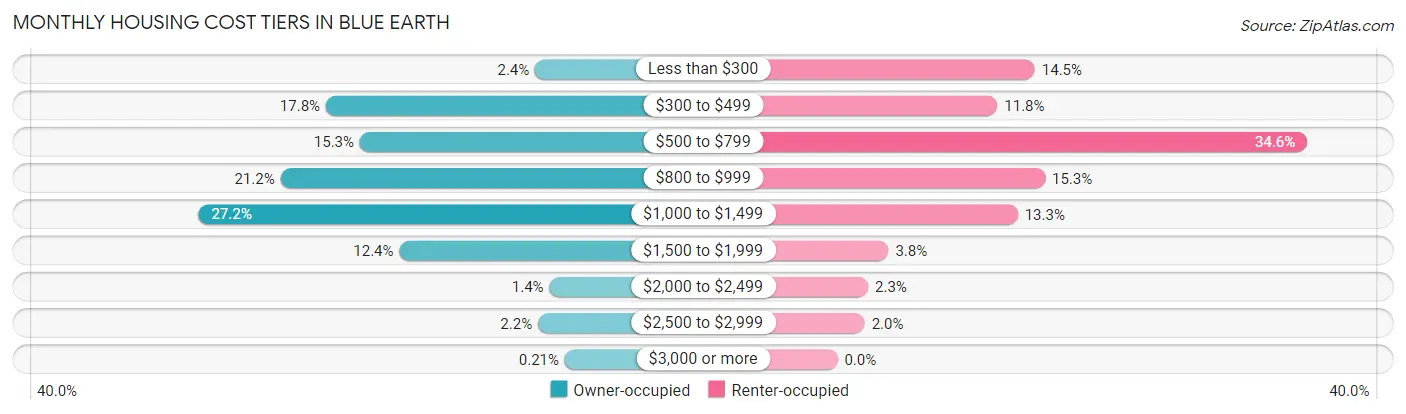
| Monthly Cost | Owner-occupied | Renter-occupied |
| Less than $300 | 23 (2.4%) | 58 (14.5%) |
| $300 to $499 | 171 (17.8%) | 47 (11.8%) |
| $500 to $799 | 147 (15.3%) | 138 (34.6%) |
| $800 to $999 | 203 (21.1%) | 61 (15.3%) |
| $1,000 to $1,499 | 261 (27.2%) | 53 (13.3%) |
| $1,500 to $1,999 | 119 (12.4%) | 15 (3.8%) |
| $2,000 to $2,499 | 13 (1.3%) | 9 (2.3%) |
| $2,500 to $2,999 | 21 (2.2%) | 8 (2.0%) |
| $3,000 or more | 2 (0.2%) | 0 (0.0%) |
| Total | 960 (100.0%) | 399 (100.0%) |
Physical Housing Characteristics in Blue Earth
Housing Structures in Blue Earth
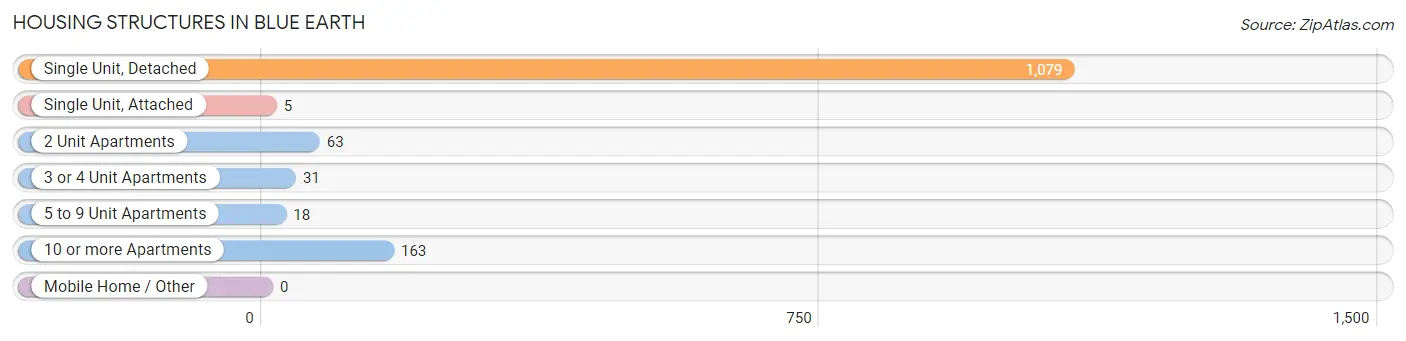
| Structure Type | # Housing Units | % Housing Units |
| Single Unit, Detached | 1,079 | 79.4% |
| Single Unit, Attached | 5 | 0.4% |
| 2 Unit Apartments | 63 | 4.6% |
| 3 or 4 Unit Apartments | 31 | 2.3% |
| 5 to 9 Unit Apartments | 18 | 1.3% |
| 10 or more Apartments | 163 | 12.0% |
| Mobile Home / Other | 0 | 0.0% |
| Total | 1,359 | 100.0% |
Housing Structures by Occupancy in Blue Earth
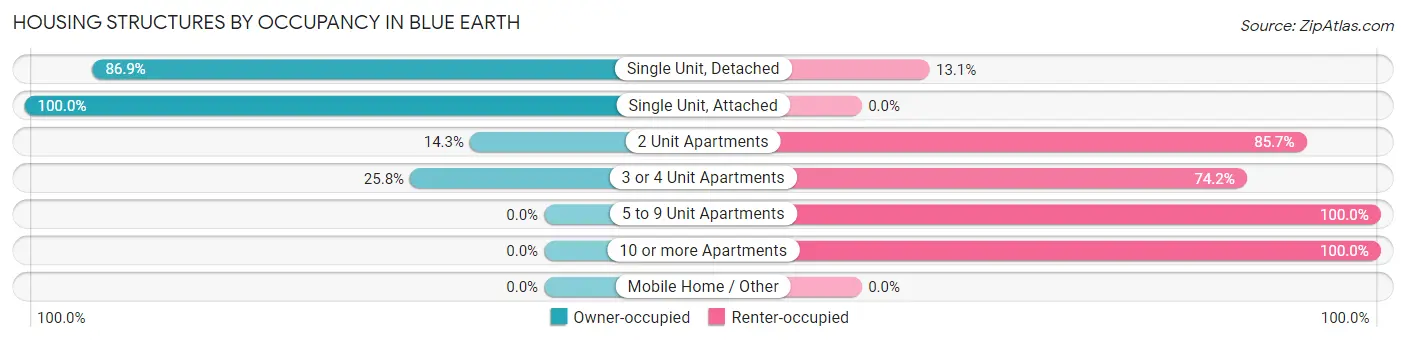
| Structure Type | Owner-occupied | Renter-occupied |
| Single Unit, Detached | 938 (86.9%) | 141 (13.1%) |
| Single Unit, Attached | 5 (100.0%) | 0 (0.0%) |
| 2 Unit Apartments | 9 (14.3%) | 54 (85.7%) |
| 3 or 4 Unit Apartments | 8 (25.8%) | 23 (74.2%) |
| 5 to 9 Unit Apartments | 0 (0.0%) | 18 (100.0%) |
| 10 or more Apartments | 0 (0.0%) | 163 (100.0%) |
| Mobile Home / Other | 0 (0.0%) | 0 (0.0%) |
| Total | 960 (70.6%) | 399 (29.4%) |
Housing Structures by Number of Rooms in Blue Earth
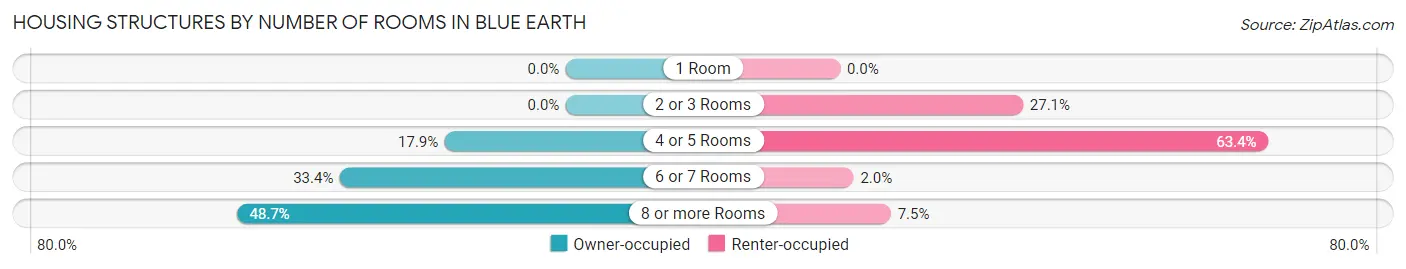
| Number of Rooms | Owner-occupied | Renter-occupied |
| 1 Room | 0 (0.0%) | 0 (0.0%) |
| 2 or 3 Rooms | 0 (0.0%) | 108 (27.1%) |
| 4 or 5 Rooms | 172 (17.9%) | 253 (63.4%) |
| 6 or 7 Rooms | 321 (33.4%) | 8 (2.0%) |
| 8 or more Rooms | 467 (48.6%) | 30 (7.5%) |
| Total | 960 (100.0%) | 399 (100.0%) |
Housing Structure by Heating Type in Blue Earth
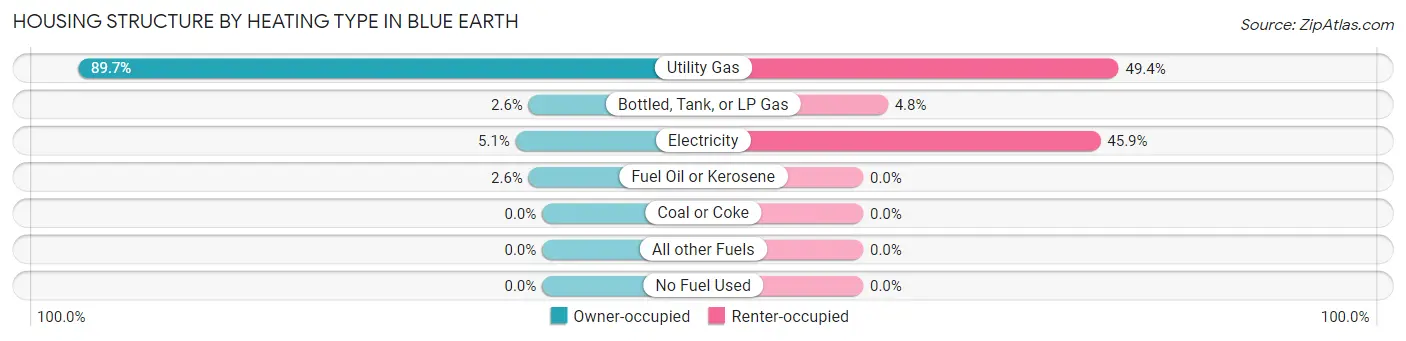
| Heating Type | Owner-occupied | Renter-occupied |
| Utility Gas | 861 (89.7%) | 197 (49.4%) |
| Bottled, Tank, or LP Gas | 25 (2.6%) | 19 (4.8%) |
| Electricity | 49 (5.1%) | 183 (45.9%) |
| Fuel Oil or Kerosene | 25 (2.6%) | 0 (0.0%) |
| Coal or Coke | 0 (0.0%) | 0 (0.0%) |
| All other Fuels | 0 (0.0%) | 0 (0.0%) |
| No Fuel Used | 0 (0.0%) | 0 (0.0%) |
| Total | 960 (100.0%) | 399 (100.0%) |
Household Vehicle Usage in Blue Earth
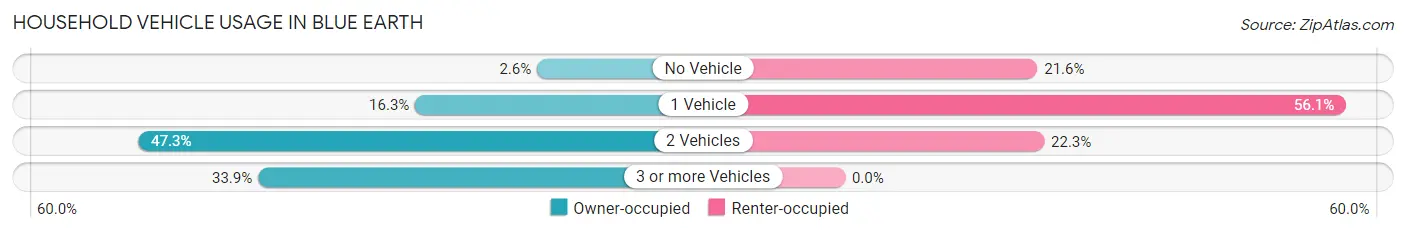
| Vehicles per Household | Owner-occupied | Renter-occupied |
| No Vehicle | 25 (2.6%) | 86 (21.5%) |
| 1 Vehicle | 156 (16.3%) | 224 (56.1%) |
| 2 Vehicles | 454 (47.3%) | 89 (22.3%) |
| 3 or more Vehicles | 325 (33.9%) | 0 (0.0%) |
| Total | 960 (100.0%) | 399 (100.0%) |
Real Estate & Mortgages in Blue Earth
Real Estate and Mortgage Overview in Blue Earth
| Characteristic | Without Mortgage | With Mortgage |
| Housing Units | 330 | 630 |
| Median Property Value | $119,700 | $123,600 |
| Median Household Income | $76,167 | $100 |
| Monthly Housing Costs | $465 | $2 |
| Real Estate Taxes | $1,385 | $12 |
Property Value by Mortgage Status in Blue Earth
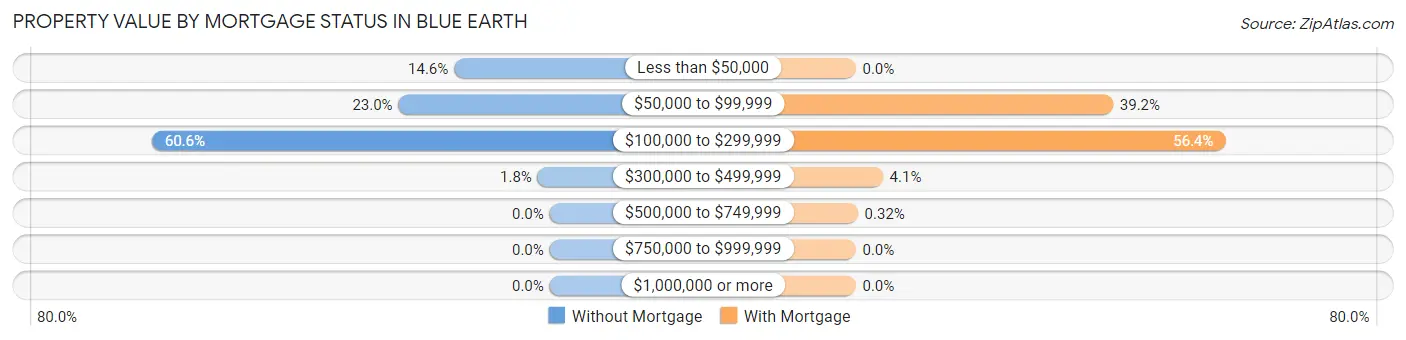
| Property Value | Without Mortgage | With Mortgage |
| Less than $50,000 | 48 (14.5%) | 0 (0.0%) |
| $50,000 to $99,999 | 76 (23.0%) | 247 (39.2%) |
| $100,000 to $299,999 | 200 (60.6%) | 355 (56.4%) |
| $300,000 to $499,999 | 6 (1.8%) | 26 (4.1%) |
| $500,000 to $749,999 | 0 (0.0%) | 2 (0.3%) |
| $750,000 to $999,999 | 0 (0.0%) | 0 (0.0%) |
| $1,000,000 or more | 0 (0.0%) | 0 (0.0%) |
| Total | 330 (100.0%) | 630 (100.0%) |
Household Income by Mortgage Status in Blue Earth
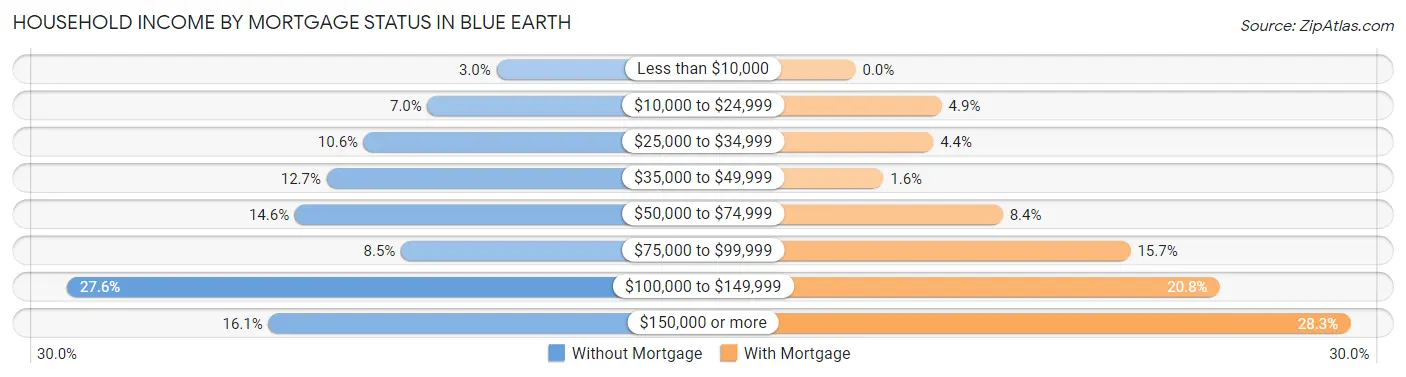
| Household Income | Without Mortgage | With Mortgage |
| Less than $10,000 | 10 (3.0%) | 0 (0.0%) |
| $10,000 to $24,999 | 23 (7.0%) | 31 (4.9%) |
| $25,000 to $34,999 | 35 (10.6%) | 28 (4.4%) |
| $35,000 to $49,999 | 42 (12.7%) | 10 (1.6%) |
| $50,000 to $74,999 | 48 (14.5%) | 53 (8.4%) |
| $75,000 to $99,999 | 28 (8.5%) | 99 (15.7%) |
| $100,000 to $149,999 | 91 (27.6%) | 131 (20.8%) |
| $150,000 or more | 53 (16.1%) | 178 (28.2%) |
| Total | 330 (100.0%) | 630 (100.0%) |
Property Value to Household Income Ratio in Blue Earth
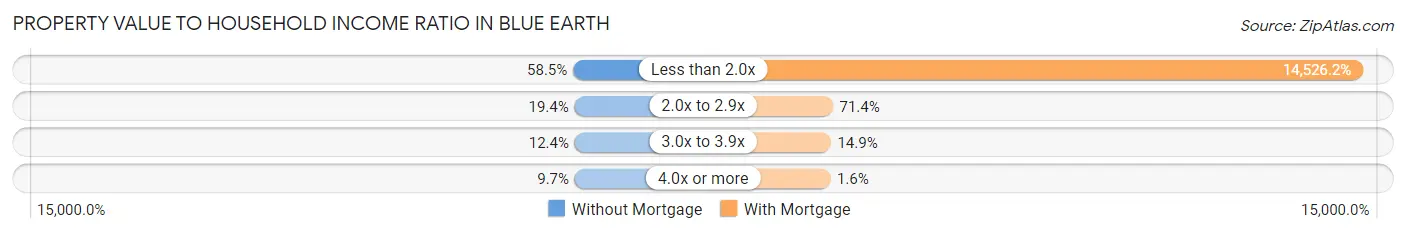
| Value-to-Income Ratio | Without Mortgage | With Mortgage |
| Less than 2.0x | 193 (58.5%) | 91,515 (14,526.2%) |
| 2.0x to 2.9x | 64 (19.4%) | 450 (71.4%) |
| 3.0x to 3.9x | 41 (12.4%) | 94 (14.9%) |
| 4.0x or more | 32 (9.7%) | 10 (1.6%) |
| Total | 330 (100.0%) | 630 (100.0%) |
Real Estate Taxes by Mortgage Status in Blue Earth
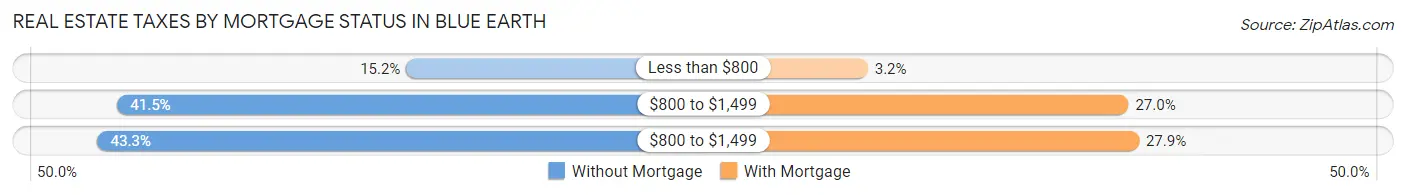
| Property Taxes | Without Mortgage | With Mortgage |
| Less than $800 | 50 (15.1%) | 20 (3.2%) |
| $800 to $1,499 | 137 (41.5%) | 170 (27.0%) |
| $800 to $1,499 | 143 (43.3%) | 176 (27.9%) |
| Total | 330 (100.0%) | 630 (100.0%) |
Health & Disability in Blue Earth
Health Insurance Coverage by Age in Blue Earth
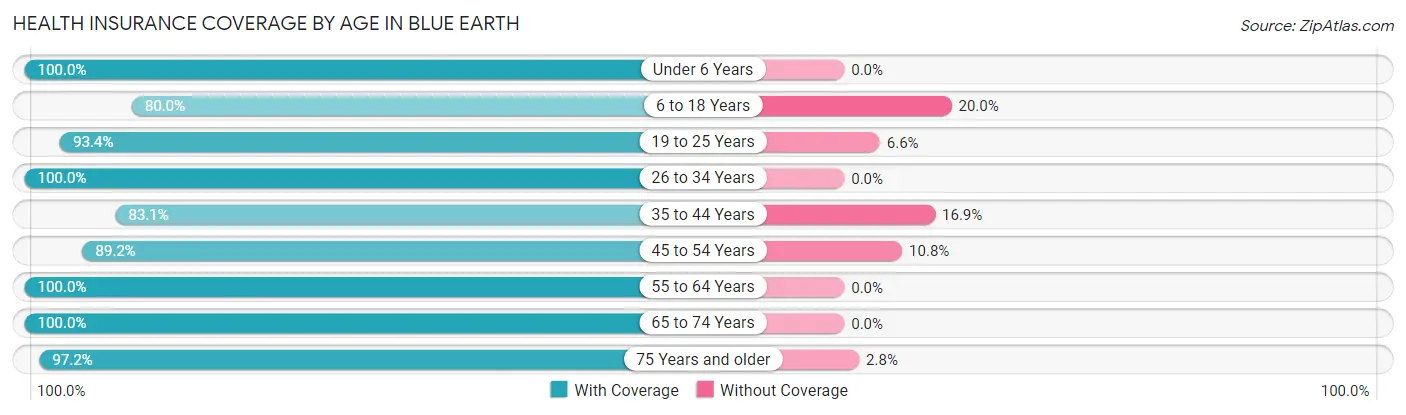
| Age Bracket | With Coverage | Without Coverage |
| Under 6 Years | 202 (100.0%) | 0 (0.0%) |
| 6 to 18 Years | 380 (80.0%) | 95 (20.0%) |
| 19 to 25 Years | 183 (93.4%) | 13 (6.6%) |
| 26 to 34 Years | 300 (100.0%) | 0 (0.0%) |
| 35 to 44 Years | 417 (83.1%) | 85 (16.9%) |
| 45 to 54 Years | 306 (89.2%) | 37 (10.8%) |
| 55 to 64 Years | 379 (100.0%) | 0 (0.0%) |
| 65 to 74 Years | 244 (100.0%) | 0 (0.0%) |
| 75 Years and older | 351 (97.2%) | 10 (2.8%) |
| Total | 2,762 (92.0%) | 240 (8.0%) |
Health Insurance Coverage by Citizenship Status in Blue Earth
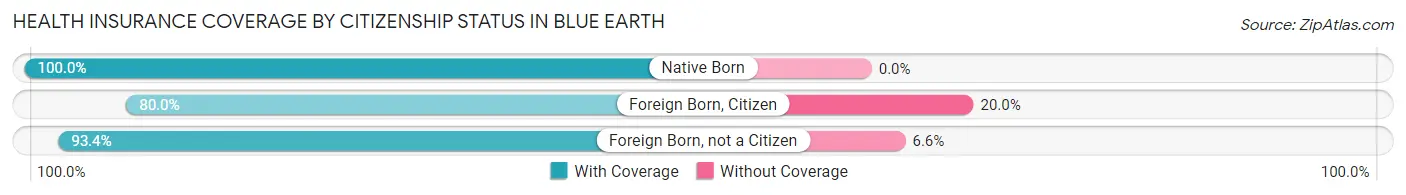
| Citizenship Status | With Coverage | Without Coverage |
| Native Born | 202 (100.0%) | 0 (0.0%) |
| Foreign Born, Citizen | 380 (80.0%) | 95 (20.0%) |
| Foreign Born, not a Citizen | 183 (93.4%) | 13 (6.6%) |
Health Insurance Coverage by Household Income in Blue Earth
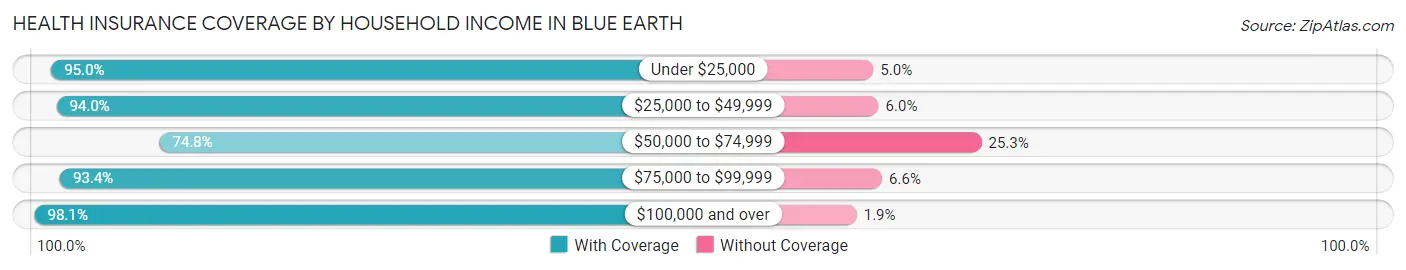
| Household Income | With Coverage | Without Coverage |
| Under $25,000 | 381 (95.0%) | 20 (5.0%) |
| $25,000 to $49,999 | 362 (94.0%) | 23 (6.0%) |
| $50,000 to $74,999 | 441 (74.8%) | 149 (25.3%) |
| $75,000 to $99,999 | 352 (93.4%) | 25 (6.6%) |
| $100,000 and over | 1,207 (98.1%) | 23 (1.9%) |
Public vs Private Health Insurance Coverage by Age in Blue Earth
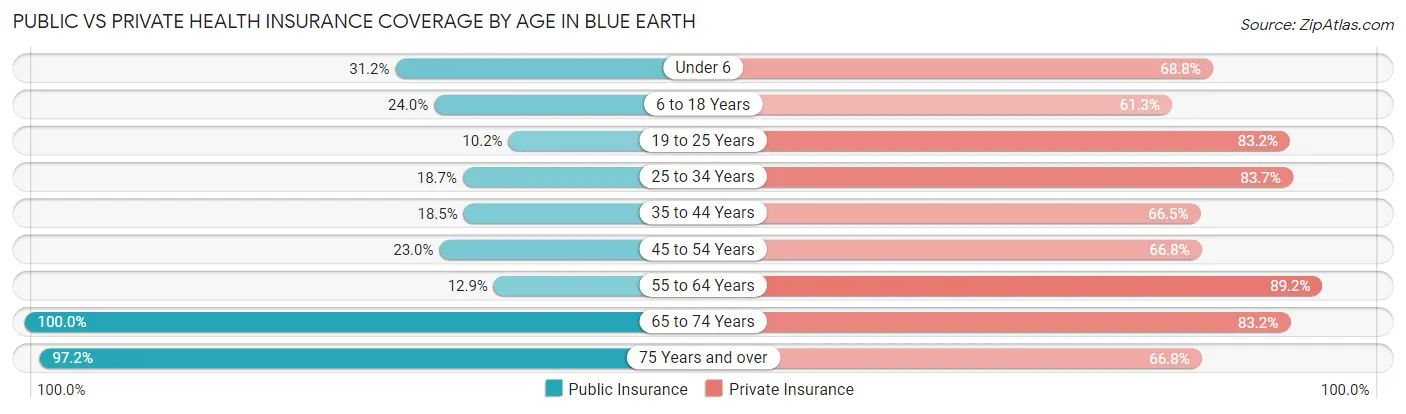
| Age Bracket | Public Insurance | Private Insurance |
| Under 6 | 63 (31.2%) | 139 (68.8%) |
| 6 to 18 Years | 114 (24.0%) | 291 (61.3%) |
| 19 to 25 Years | 20 (10.2%) | 163 (83.2%) |
| 25 to 34 Years | 56 (18.7%) | 251 (83.7%) |
| 35 to 44 Years | 93 (18.5%) | 334 (66.5%) |
| 45 to 54 Years | 79 (23.0%) | 229 (66.8%) |
| 55 to 64 Years | 49 (12.9%) | 338 (89.2%) |
| 65 to 74 Years | 244 (100.0%) | 203 (83.2%) |
| 75 Years and over | 351 (97.2%) | 241 (66.8%) |
| Total | 1,069 (35.6%) | 2,189 (72.9%) |
Disability Status by Sex by Age in Blue Earth
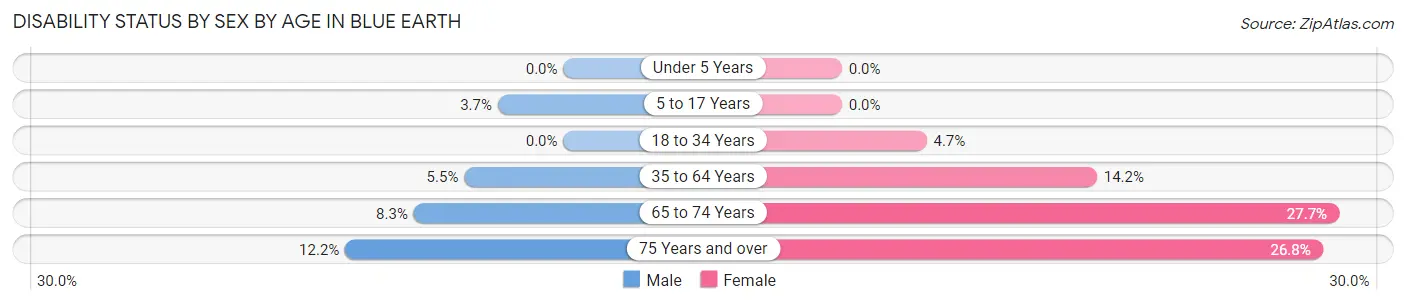
| Age Bracket | Male | Female |
| Under 5 Years | 0 (0.0%) | 0 (0.0%) |
| 5 to 17 Years | 11 (3.6%) | 0 (0.0%) |
| 18 to 34 Years | 0 (0.0%) | 11 (4.7%) |
| 35 to 64 Years | 31 (5.5%) | 94 (14.2%) |
| 65 to 74 Years | 11 (8.3%) | 31 (27.7%) |
| 75 Years and over | 13 (12.1%) | 68 (26.8%) |
Disability Class by Sex by Age in Blue Earth
Disability Class: Hearing Difficulty
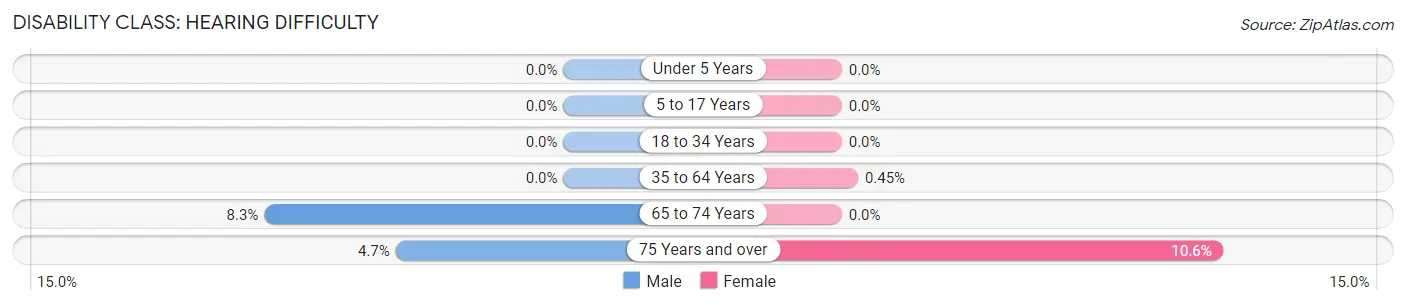
| Age Bracket | Male | Female |
| Under 5 Years | 0 (0.0%) | 0 (0.0%) |
| 5 to 17 Years | 0 (0.0%) | 0 (0.0%) |
| 18 to 34 Years | 0 (0.0%) | 0 (0.0%) |
| 35 to 64 Years | 0 (0.0%) | 3 (0.4%) |
| 65 to 74 Years | 11 (8.3%) | 0 (0.0%) |
| 75 Years and over | 5 (4.7%) | 27 (10.6%) |
Disability Class: Vision Difficulty
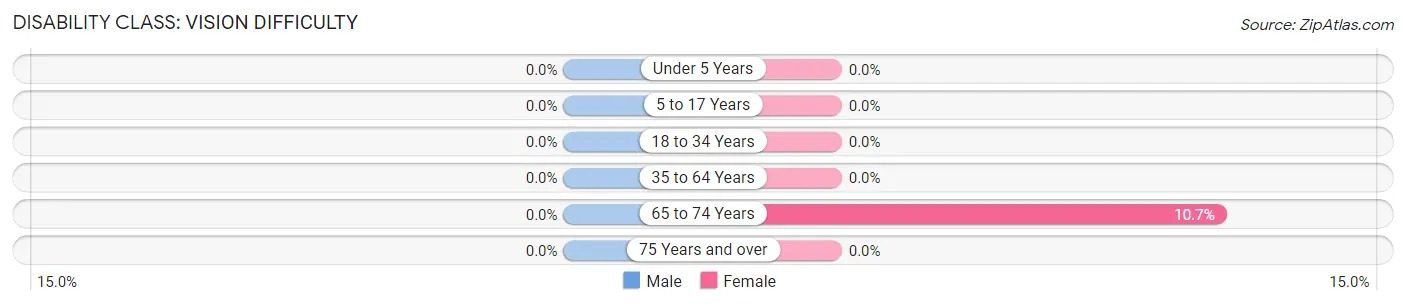
| Age Bracket | Male | Female |
| Under 5 Years | 0 (0.0%) | 0 (0.0%) |
| 5 to 17 Years | 0 (0.0%) | 0 (0.0%) |
| 18 to 34 Years | 0 (0.0%) | 0 (0.0%) |
| 35 to 64 Years | 0 (0.0%) | 0 (0.0%) |
| 65 to 74 Years | 0 (0.0%) | 12 (10.7%) |
| 75 Years and over | 0 (0.0%) | 0 (0.0%) |
Disability Class: Cognitive Difficulty
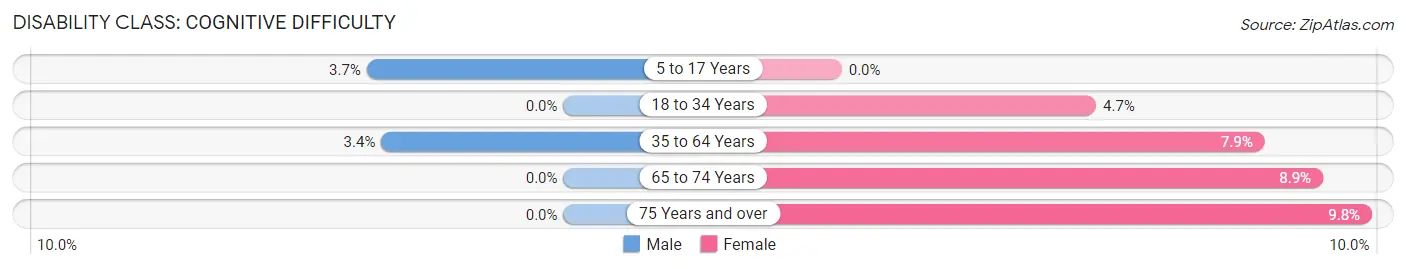
| Age Bracket | Male | Female |
| 5 to 17 Years | 11 (3.6%) | 0 (0.0%) |
| 18 to 34 Years | 0 (0.0%) | 11 (4.7%) |
| 35 to 64 Years | 19 (3.4%) | 52 (7.9%) |
| 65 to 74 Years | 0 (0.0%) | 10 (8.9%) |
| 75 Years and over | 0 (0.0%) | 25 (9.8%) |
Disability Class: Ambulatory Difficulty
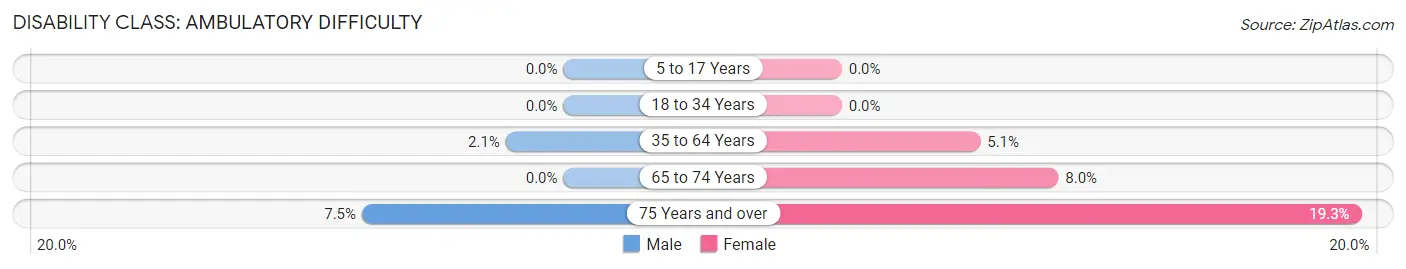
| Age Bracket | Male | Female |
| 5 to 17 Years | 0 (0.0%) | 0 (0.0%) |
| 18 to 34 Years | 0 (0.0%) | 0 (0.0%) |
| 35 to 64 Years | 12 (2.1%) | 34 (5.1%) |
| 65 to 74 Years | 0 (0.0%) | 9 (8.0%) |
| 75 Years and over | 8 (7.5%) | 49 (19.3%) |
Disability Class: Self-Care Difficulty
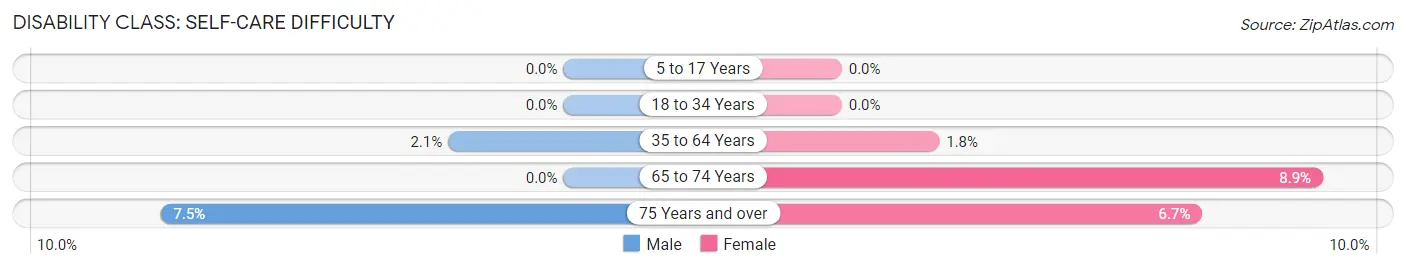
| Age Bracket | Male | Female |
| 5 to 17 Years | 0 (0.0%) | 0 (0.0%) |
| 18 to 34 Years | 0 (0.0%) | 0 (0.0%) |
| 35 to 64 Years | 12 (2.1%) | 12 (1.8%) |
| 65 to 74 Years | 0 (0.0%) | 10 (8.9%) |
| 75 Years and over | 8 (7.5%) | 17 (6.7%) |
Technology Access in Blue Earth
Computing Device Access in Blue Earth
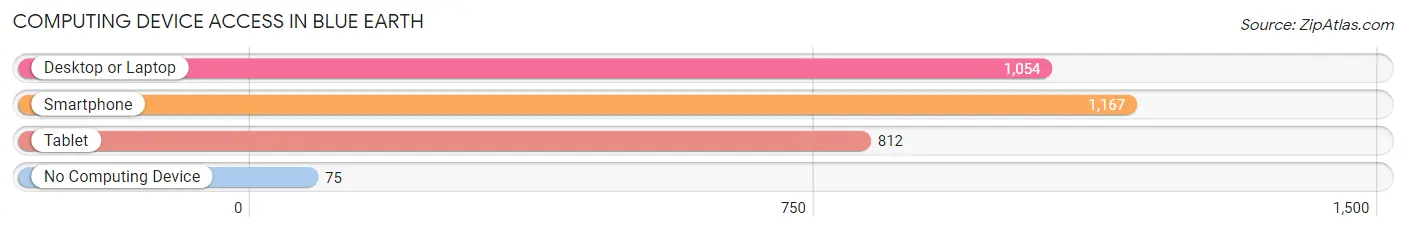
| Device Type | # Households | % Households |
| Desktop or Laptop | 1,054 | 77.6% |
| Smartphone | 1,167 | 85.9% |
| Tablet | 812 | 59.8% |
| No Computing Device | 75 | 5.5% |
| Total | 1,359 | 100.0% |
Internet Access in Blue Earth
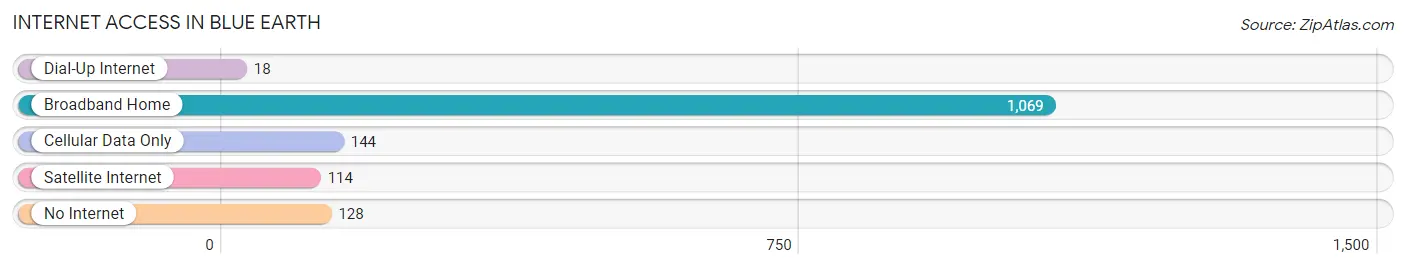
| Internet Type | # Households | % Households |
| Dial-Up Internet | 18 | 1.3% |
| Broadband Home | 1,069 | 78.7% |
| Cellular Data Only | 144 | 10.6% |
| Satellite Internet | 114 | 8.4% |
| No Internet | 128 | 9.4% |
| Total | 1,359 | 100.0% |
Blue Earth Summary
Introduction
Blue Earth is a city located in Faribault County, Minnesota, United States. It is the county seat of Faribault County and is located along the Blue Earth River. The population was 3,353 at the 2010 census. Blue Earth is part of the Mankato–North Mankato Metropolitan Statistical Area.
History
The area that is now Blue Earth was first settled in 1854 by a group of settlers from Ohio. The town was originally named "Blue Earth City" after the Blue Earth River, which was named by the Dakota Indians for the blue clay found along its banks. The town was incorporated in 1872 and was later renamed Blue Earth.
The city was a major stop on the Chicago, Milwaukee, St. Paul and Pacific Railroad, which ran through the city from 1872 to 1978. The railroad was a major employer in the city and helped to spur its growth.
Geography
Blue Earth is located at the intersection of Interstate 90 and U.S. Route 169. It is located in the south-central part of Minnesota, about 90 miles southwest of Minneapolis. The city is situated on the Blue Earth River, which flows through the city and is a tributary of the Minnesota River.
The city has a total area of 3.2 square miles, all of which is land. The city is located in a flat, open area with rolling hills and prairies.
Economy
Blue Earth's economy is largely based on agriculture and manufacturing. The city is home to several large agricultural companies, including Blue Earth Ag, a large grain and feed company. The city is also home to several manufacturing companies, including a large plastics manufacturer and a metal fabrication company.
The city is also home to several retail stores, including a Walmart Supercenter, a Target, and several other smaller stores.
Demographics
As of the 2010 census, the population of Blue Earth was 3,353. The racial makeup of the city was 95.2% White, 0.7% African American, 0.3% Native American, 0.7% Asian, 0.1% Pacific Islander, 1.7% from other races, and 1.2% from two or more races. Hispanic or Latino of any race were 4.2% of the population.
The median income for a household in the city was $45,938, and the median income for a family was $51,938. The per capita income for the city was $20,938. About 8.2% of families and 10.2% of the population were below the poverty line, including 14.2% of those under age 18 and 8.2% of those age 65 or over.
Conclusion
Blue Earth is a city located in Faribault County, Minnesota. It is the county seat of Faribault County and is located along the Blue Earth River. The city has a population of 3,353 and is part of the Mankato–North Mankato Metropolitan Statistical Area. The city's economy is largely based on agriculture and manufacturing, and it is home to several large agricultural and manufacturing companies. The city also has several retail stores, including a Walmart Supercenter and a Target. The population of Blue Earth is predominantly white, with a small percentage of African American, Native American, Asian, and Pacific Islander residents. The median income for a household in the city is $45,938, and the per capita income for the city is $20,938.
Common Questions
What is Per Capita Income in Blue Earth?
Per Capita income in Blue Earth is $34,860.
What is the Median Family Income in Blue Earth?
Median Family Income in Blue Earth is $98,802.
What is the Median Household income in Blue Earth?
Median Household Income in Blue Earth is $61,950.
What is Income or Wage Gap in Blue Earth?
Income or Wage Gap in Blue Earth is 12.7%.
Women in Blue Earth earn 87.3 cents for every dollar earned by a man.
What is Inequality or Gini Index in Blue Earth?
Inequality or Gini Index in Blue Earth is 0.42.
What is the Total Population of Blue Earth?
Total Population of Blue Earth is 3,181.
What is the Total Male Population of Blue Earth?
Total Male Population of Blue Earth is 1,571.
What is the Total Female Population of Blue Earth?
Total Female Population of Blue Earth is 1,610.
What is the Ratio of Males per 100 Females in Blue Earth?
There are 97.58 Males per 100 Females in Blue Earth.
What is the Ratio of Females per 100 Males in Blue Earth?
There are 102.48 Females per 100 Males in Blue Earth.
What is the Median Population Age in Blue Earth?
Median Population Age in Blue Earth is 42.4 Years.
What is the Average Family Size in Blue Earth
Average Family Size in Blue Earth is 2.8 People.
What is the Average Household Size in Blue Earth
Average Household Size in Blue Earth is 2.2 People.
How Large is the Labor Force in Blue Earth?
There are 1,717 People in the Labor Forcein in Blue Earth.
What is the Percentage of People in the Labor Force in Blue Earth?
65.2% of People are in the Labor Force in Blue Earth.
What is the Unemployment Rate in Blue Earth?
Unemployment Rate in Blue Earth is 4.4%.