Clarissa, MN Map & Demographics
Clarissa Map
Clarissa Overview
$24,414
PER CAPITA INCOME
$64,412
AVG FAMILY INCOME
$45,250
AVG HOUSEHOLD INCOME
5.3%
WAGE / INCOME GAP [ % ]
94.7¢/ $1
WAGE / INCOME GAP [ $ ]
0.38
INEQUALITY / GINI INDEX
676
TOTAL POPULATION
324
MALE POPULATION
352
FEMALE POPULATION
92.05
MALES / 100 FEMALES
108.64
FEMALES / 100 MALES
51.4
MEDIAN AGE
2.8
AVG FAMILY SIZE
2.0
AVG HOUSEHOLD SIZE
258
LABOR FORCE [ PEOPLE ]
46.7%
PERCENT IN LABOR FORCE
7.8%
UNEMPLOYMENT RATE
Clarissa Zip Codes
Clarissa Area Codes
Income in Clarissa
Income Overview in Clarissa
Per Capita Income in Clarissa is $24,414, while median incomes of families and households are $64,412 and $45,250 respectively.
| Characteristic | Number | Measure |
| Per Capita Income | 676 | $24,414 |
| Median Family Income | 156 | $64,412 |
| Mean Family Income | 156 | $63,524 |
| Median Household Income | 301 | $45,250 |
| Mean Household Income | 301 | $50,700 |
| Income Deficit | 156 | $0 |
| Wage / Income Gap (%) | 676 | 5.31% |
| Wage / Income Gap ($) | 676 | 94.69¢ per $1 |
| Gini / Inequality Index | 676 | 0.38 |
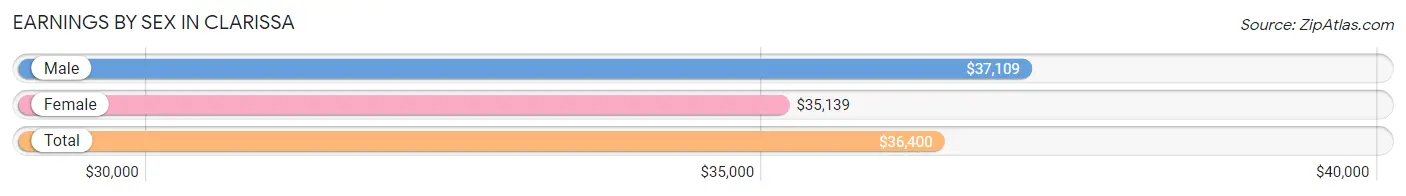
Earnings by Sex in Clarissa
Average Earnings in Clarissa are $36,400, $37,109 for men and $35,139 for women, a difference of 5.3%.
| Sex | Number | Average Earnings |
| Male | 145 (53.3%) | $37,109 |
| Female | 127 (46.7%) | $35,139 |
| Total | 272 (100.0%) | $36,400 |
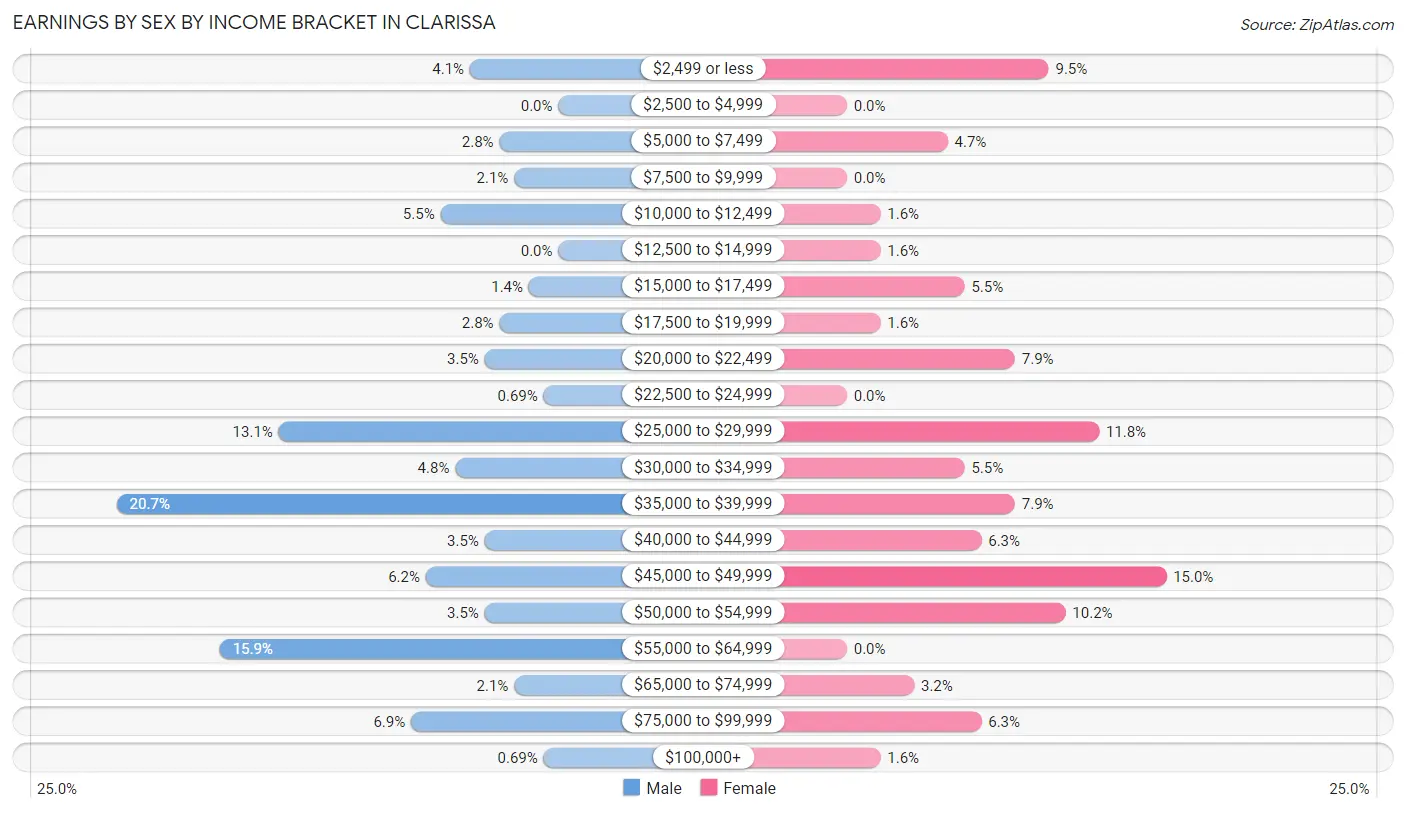
Earnings by Sex by Income Bracket in Clarissa
The most common earnings brackets in Clarissa are $35,000 to $39,999 for men (30 | 20.7%) and $45,000 to $49,999 for women (19 | 15.0%).
| Income | Male | Female |
| $2,499 or less | 6 (4.1%) | 12 (9.5%) |
| $2,500 to $4,999 | 0 (0.0%) | 0 (0.0%) |
| $5,000 to $7,499 | 4 (2.8%) | 6 (4.7%) |
| $7,500 to $9,999 | 3 (2.1%) | 0 (0.0%) |
| $10,000 to $12,499 | 8 (5.5%) | 2 (1.6%) |
| $12,500 to $14,999 | 0 (0.0%) | 2 (1.6%) |
| $15,000 to $17,499 | 2 (1.4%) | 7 (5.5%) |
| $17,500 to $19,999 | 4 (2.8%) | 2 (1.6%) |
| $20,000 to $22,499 | 5 (3.5%) | 10 (7.9%) |
| $22,500 to $24,999 | 1 (0.7%) | 0 (0.0%) |
| $25,000 to $29,999 | 19 (13.1%) | 15 (11.8%) |
| $30,000 to $34,999 | 7 (4.8%) | 7 (5.5%) |
| $35,000 to $39,999 | 30 (20.7%) | 10 (7.9%) |
| $40,000 to $44,999 | 5 (3.5%) | 8 (6.3%) |
| $45,000 to $49,999 | 9 (6.2%) | 19 (15.0%) |
| $50,000 to $54,999 | 5 (3.5%) | 13 (10.2%) |
| $55,000 to $64,999 | 23 (15.9%) | 0 (0.0%) |
| $65,000 to $74,999 | 3 (2.1%) | 4 (3.2%) |
| $75,000 to $99,999 | 10 (6.9%) | 8 (6.3%) |
| $100,000+ | 1 (0.7%) | 2 (1.6%) |
| Total | 145 (100.0%) | 127 (100.0%) |
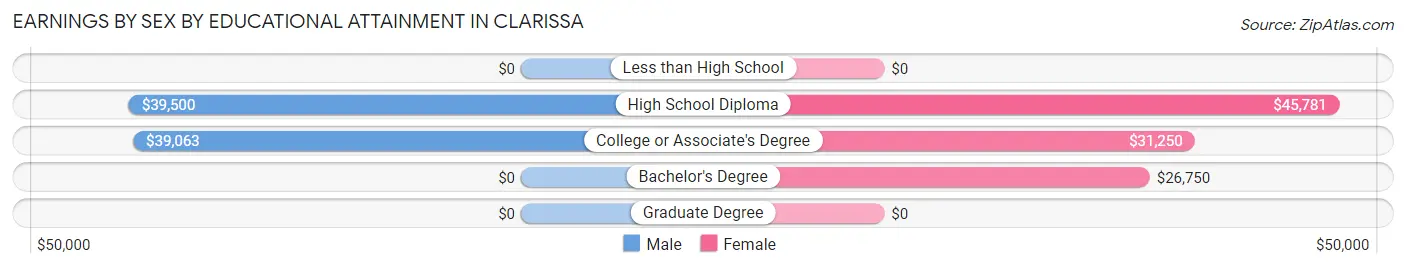
Earnings by Sex by Educational Attainment in Clarissa
Average earnings in Clarissa are $39,444 for men and $36,429 for women, a difference of 7.6%. Men with an educational attainment of high school diploma enjoy the highest average annual earnings of $39,500, while those with college or associate's degree education earn the least with $39,063. Women with an educational attainment of high school diploma earn the most with the average annual earnings of $45,781, while those with bachelor's degree education have the smallest earnings of $26,750.
| Educational Attainment | Male Income | Female Income |
| Less than High School | - | - |
| High School Diploma | $39,500 | $45,781 |
| College or Associate's Degree | $39,063 | $31,250 |
| Bachelor's Degree | - | - |
| Graduate Degree | - | - |
| Total | $39,444 | $36,429 |
Family Income in Clarissa
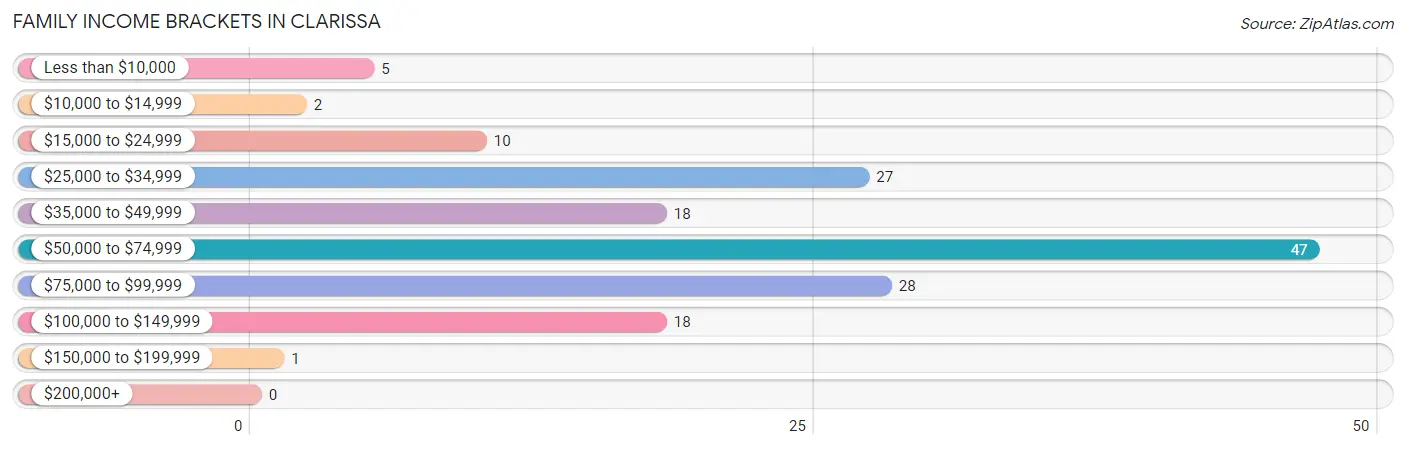
Family Income Brackets in Clarissa
According to the Clarissa family income data, there are 47 families falling into the $50,000 to $74,999 income range, which is the most common income bracket and makes up 30.1% of all families.
| Income Bracket | # Families | % Families |
| Less than $10,000 | 5 | 3.2% |
| $10,000 to $14,999 | 2 | 1.3% |
| $15,000 to $24,999 | 10 | 6.4% |
| $25,000 to $34,999 | 27 | 17.3% |
| $35,000 to $49,999 | 18 | 11.5% |
| $50,000 to $74,999 | 47 | 30.1% |
| $75,000 to $99,999 | 28 | 17.9% |
| $100,000 to $149,999 | 18 | 11.5% |
| $150,000 to $199,999 | 1 | 0.6% |
| $200,000+ | 0 | 0.0% |
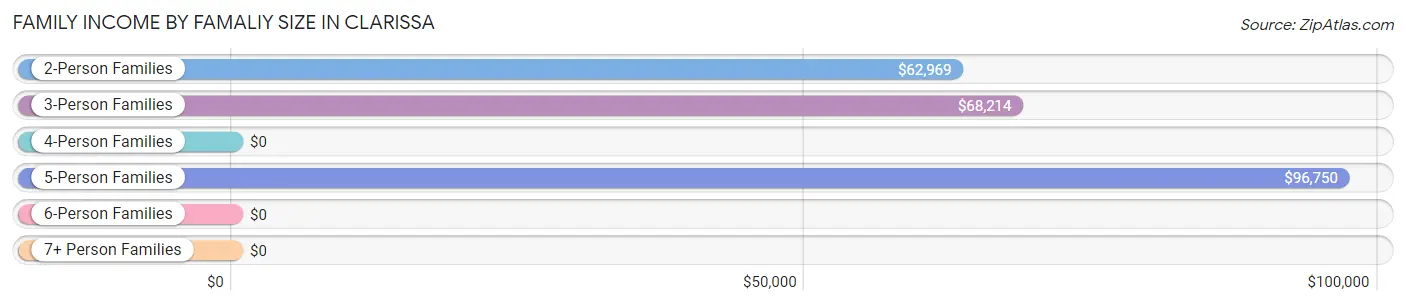
Family Income by Famaliy Size in Clarissa
5-person families (11 | 7.0%) account for the highest median family income in Clarissa with $96,750 per family, while 2-person families (100 | 64.1%) have the highest median income of $31,484 per family member.
| Income Bracket | # Families | Median Income |
| 2-Person Families | 100 (64.1%) | $62,969 |
| 3-Person Families | 32 (20.5%) | $68,214 |
| 4-Person Families | 7 (4.5%) | $0 |
| 5-Person Families | 11 (7.0%) | $96,750 |
| 6-Person Families | 1 (0.6%) | $0 |
| 7+ Person Families | 5 (3.2%) | $0 |
| Total | 156 (100.0%) | $64,412 |
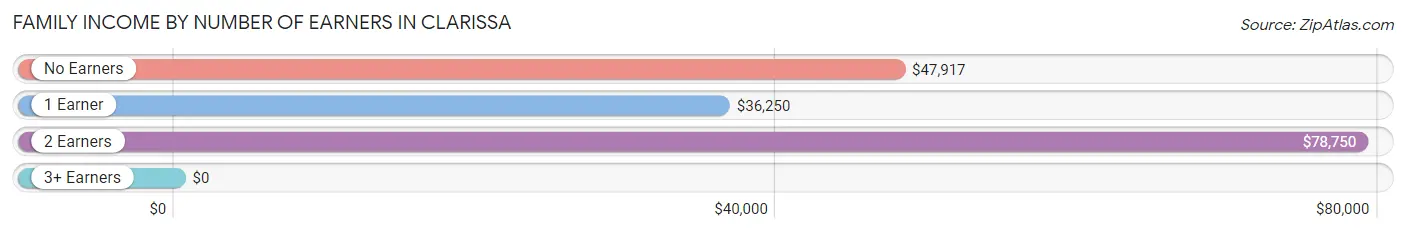
Family Income by Number of Earners in Clarissa
| Number of Earners | # Families | Median Income |
| No Earners | 57 (36.5%) | $47,917 |
| 1 Earner | 35 (22.4%) | $36,250 |
| 2 Earners | 62 (39.7%) | $78,750 |
| 3+ Earners | 2 (1.3%) | $0 |
| Total | 156 (100.0%) | $64,412 |
Household Income in Clarissa
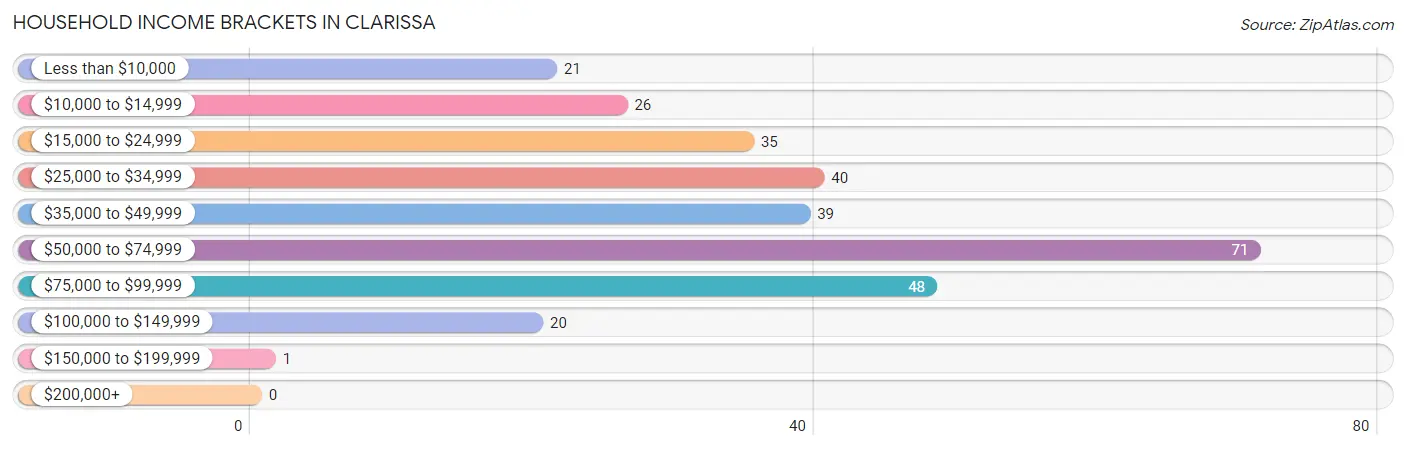
Household Income Brackets in Clarissa
With 71 households falling in the category, the $50,000 to $74,999 income range is the most frequent in Clarissa, accounting for 23.6% of all households.
| Income Bracket | # Households | % Households |
| Less than $10,000 | 21 | 7.0% |
| $10,000 to $14,999 | 26 | 8.6% |
| $15,000 to $24,999 | 35 | 11.6% |
| $25,000 to $34,999 | 40 | 13.3% |
| $35,000 to $49,999 | 39 | 13.0% |
| $50,000 to $74,999 | 71 | 23.6% |
| $75,000 to $99,999 | 48 | 15.9% |
| $100,000 to $149,999 | 20 | 6.6% |
| $150,000 to $199,999 | 1 | 0.3% |
| $200,000+ | 0 | 0.0% |
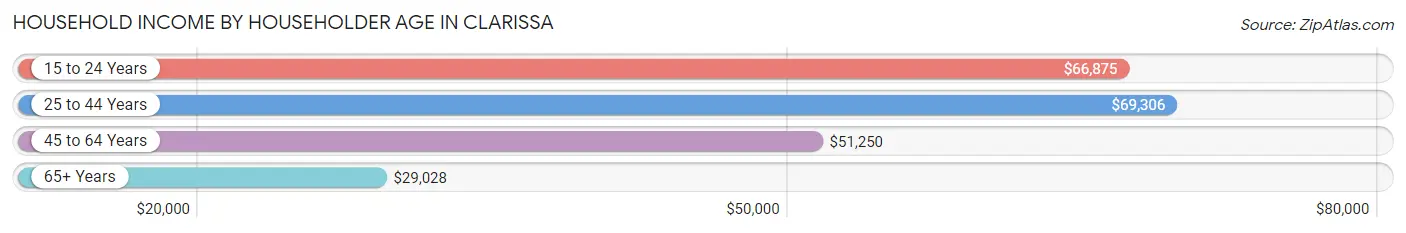
Household Income by Householder Age in Clarissa
The median household income in Clarissa is $45,250, with the highest median household income of $69,306 found in the 25 to 44 years age bracket for the primary householder. A total of 59 households (19.6%) fall into this category. Meanwhile, the 65+ years age bracket for the primary householder has the lowest median household income of $29,028, with 131 households (43.5%) in this group.
| Income Bracket | # Households | Median Income |
| 15 to 24 Years | 23 (7.6%) | $66,875 |
| 25 to 44 Years | 59 (19.6%) | $69,306 |
| 45 to 64 Years | 88 (29.2%) | $51,250 |
| 65+ Years | 131 (43.5%) | $29,028 |
| Total | 301 (100.0%) | $45,250 |
Poverty in Clarissa
Income Below Poverty by Sex and Age in Clarissa
With 10.1% poverty level for males and 18.8% for females among the residents of Clarissa, 6 to 11 year old males and 75 year old and over females are the most vulnerable to poverty, with 5 males (26.3%) and 14 females (26.4%) in their respective age groups living below the poverty level.
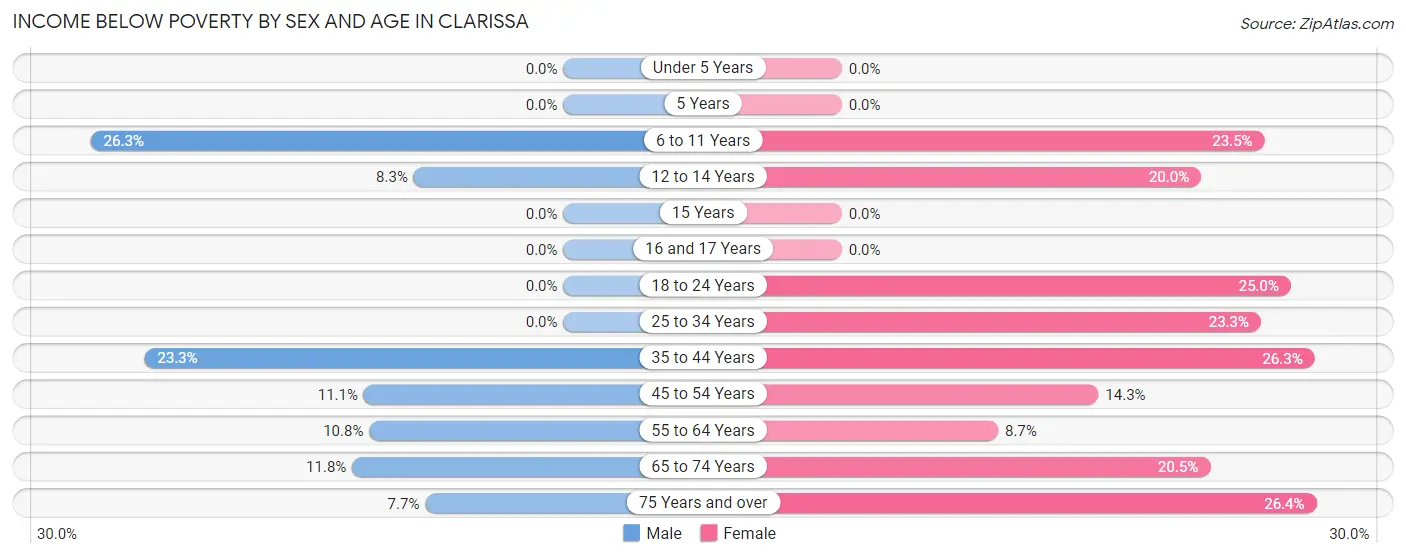
| Age Bracket | Male | Female |
| Under 5 Years | 0 (0.0%) | 0 (0.0%) |
| 5 Years | 0 (0.0%) | 0 (0.0%) |
| 6 to 11 Years | 5 (26.3%) | 8 (23.5%) |
| 12 to 14 Years | 2 (8.3%) | 3 (20.0%) |
| 15 Years | 0 (0.0%) | 0 (0.0%) |
| 16 and 17 Years | 0 (0.0%) | 0 (0.0%) |
| 18 to 24 Years | 0 (0.0%) | 6 (25.0%) |
| 25 to 34 Years | 0 (0.0%) | 7 (23.3%) |
| 35 to 44 Years | 7 (23.3%) | 5 (26.3%) |
| 45 to 54 Years | 4 (11.1%) | 3 (14.3%) |
| 55 to 64 Years | 4 (10.8%) | 4 (8.7%) |
| 65 to 74 Years | 4 (11.8%) | 8 (20.5%) |
| 75 Years and over | 5 (7.7%) | 14 (26.4%) |
| Total | 31 (10.1%) | 58 (18.8%) |
Income Above Poverty by Sex and Age in Clarissa
According to the poverty statistics in Clarissa, males aged under 5 years and females aged under 5 years are the age groups that are most secure financially, with 100.0% of males and 100.0% of females in these age groups living above the poverty line.
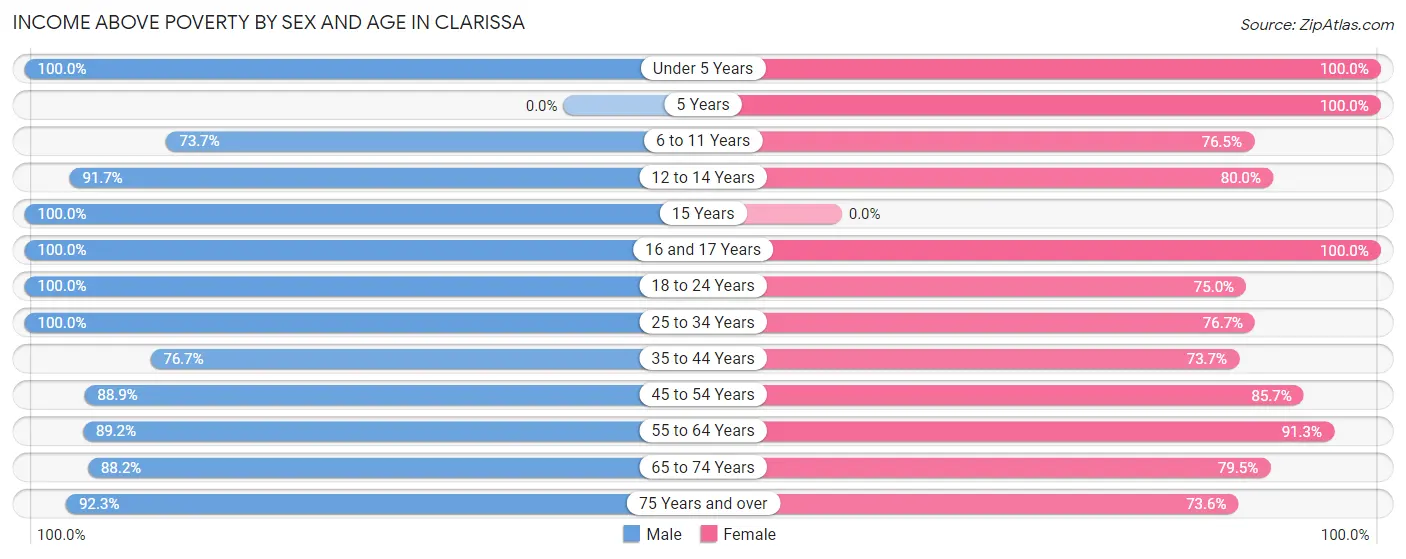
| Age Bracket | Male | Female |
| Under 5 Years | 11 (100.0%) | 15 (100.0%) |
| 5 Years | 0 (0.0%) | 3 (100.0%) |
| 6 to 11 Years | 14 (73.7%) | 26 (76.5%) |
| 12 to 14 Years | 22 (91.7%) | 12 (80.0%) |
| 15 Years | 2 (100.0%) | 0 (0.0%) |
| 16 and 17 Years | 3 (100.0%) | 9 (100.0%) |
| 18 to 24 Years | 30 (100.0%) | 18 (75.0%) |
| 25 to 34 Years | 17 (100.0%) | 23 (76.7%) |
| 35 to 44 Years | 23 (76.7%) | 14 (73.7%) |
| 45 to 54 Years | 32 (88.9%) | 18 (85.7%) |
| 55 to 64 Years | 33 (89.2%) | 42 (91.3%) |
| 65 to 74 Years | 30 (88.2%) | 31 (79.5%) |
| 75 Years and over | 60 (92.3%) | 39 (73.6%) |
| Total | 277 (89.9%) | 250 (81.2%) |
Income Below Poverty Among Married-Couple Families in Clarissa
The poverty statistics for married-couple families in Clarissa show that 2.5% or 3 of the total 119 families live below the poverty line. Families with no children have the highest poverty rate of 3.5%, comprising of 3 families. On the other hand, families with 1 or 2 children have the lowest poverty rate of 0.0%, which includes 0 families.
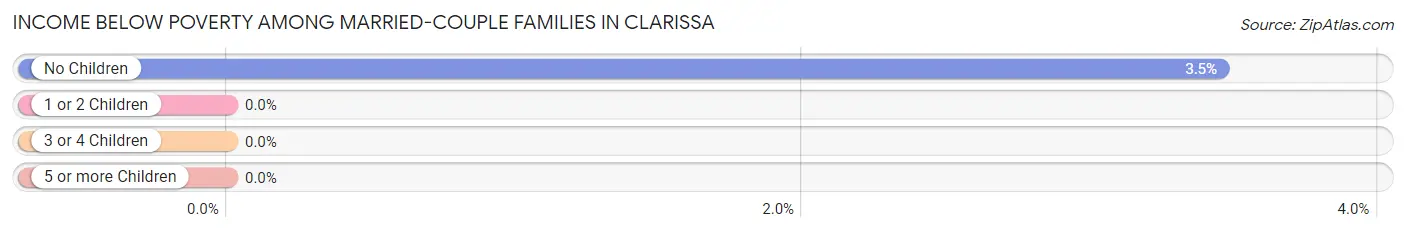
| Children | Above Poverty | Below Poverty |
| No Children | 84 (96.6%) | 3 (3.5%) |
| 1 or 2 Children | 15 (100.0%) | 0 (0.0%) |
| 3 or 4 Children | 12 (100.0%) | 0 (0.0%) |
| 5 or more Children | 5 (100.0%) | 0 (0.0%) |
| Total | 116 (97.5%) | 3 (2.5%) |
Income Below Poverty Among Single-Parent Households in Clarissa
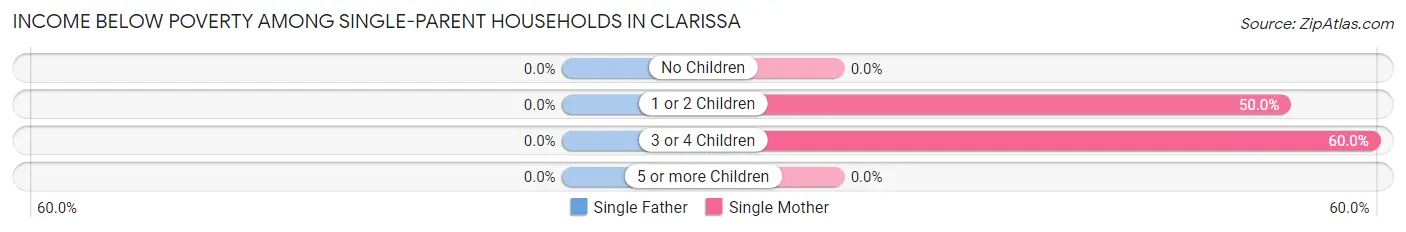
| Children | Single Father | Single Mother |
| No Children | 0 (0.0%) | 0 (0.0%) |
| 1 or 2 Children | 0 (0.0%) | 7 (50.0%) |
| 3 or 4 Children | 0 (0.0%) | 3 (60.0%) |
| 5 or more Children | 0 (0.0%) | 0 (0.0%) |
| Total | 0 (0.0%) | 10 (37.0%) |
Income Below Poverty Among Married-Couple vs Single-Parent Households in Clarissa
The poverty data for Clarissa shows that 3 of the married-couple family households (2.5%) and 10 of the single-parent households (27.0%) are living below the poverty level. Within the married-couple family households, those with no children have the highest poverty rate, with 3 households (3.5%) falling below the poverty line. Among the single-parent households, those with 3 or 4 children have the highest poverty rate, with 3 household (60.0%) living below poverty.
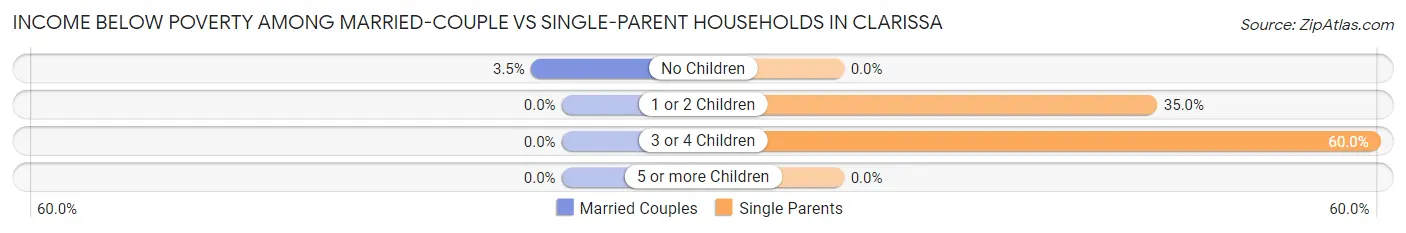
| Children | Married-Couple Families | Single-Parent Households |
| No Children | 3 (3.5%) | 0 (0.0%) |
| 1 or 2 Children | 0 (0.0%) | 7 (35.0%) |
| 3 or 4 Children | 0 (0.0%) | 3 (60.0%) |
| 5 or more Children | 0 (0.0%) | 0 (0.0%) |
| Total | 3 (2.5%) | 10 (27.0%) |
Race in Clarissa
The most populous races in Clarissa are White / Caucasian (580 | 85.8%), Two or more Races (78 | 11.5%), and Hispanic or Latino (17 | 2.5%).
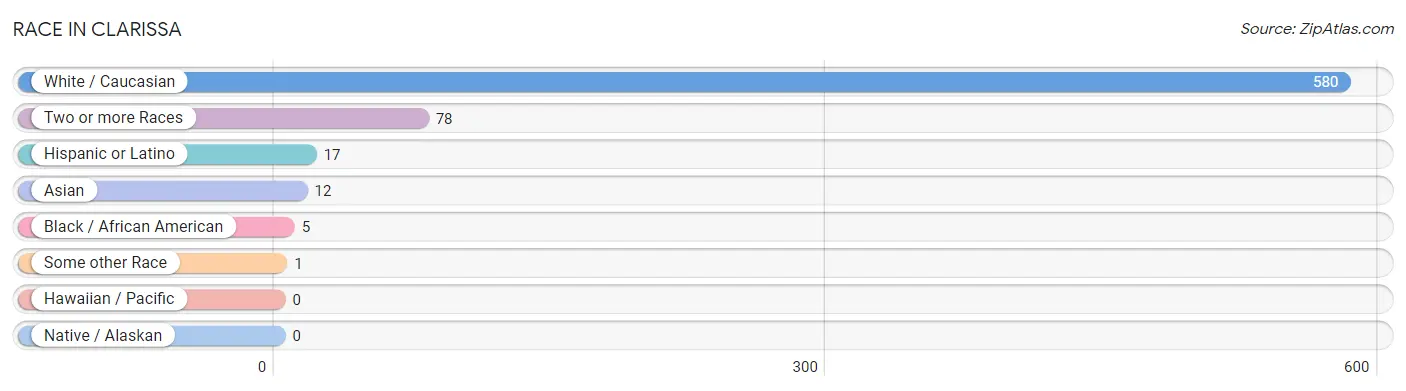
| Race | # Population | % Population |
| Asian | 12 | 1.8% |
| Black / African American | 5 | 0.7% |
| Hawaiian / Pacific | 0 | 0.0% |
| Hispanic or Latino | 17 | 2.5% |
| Native / Alaskan | 0 | 0.0% |
| White / Caucasian | 580 | 85.8% |
| Two or more Races | 78 | 11.5% |
| Some other Race | 1 | 0.2% |
| Total | 676 | 100.0% |
Ancestry in Clarissa
The most populous ancestries reported in Clarissa are German (211 | 31.2%), Norwegian (101 | 14.9%), Irish (54 | 8.0%), Polish (47 | 7.0%), and Swedish (36 | 5.3%), together accounting for 66.4% of all Clarissa residents.
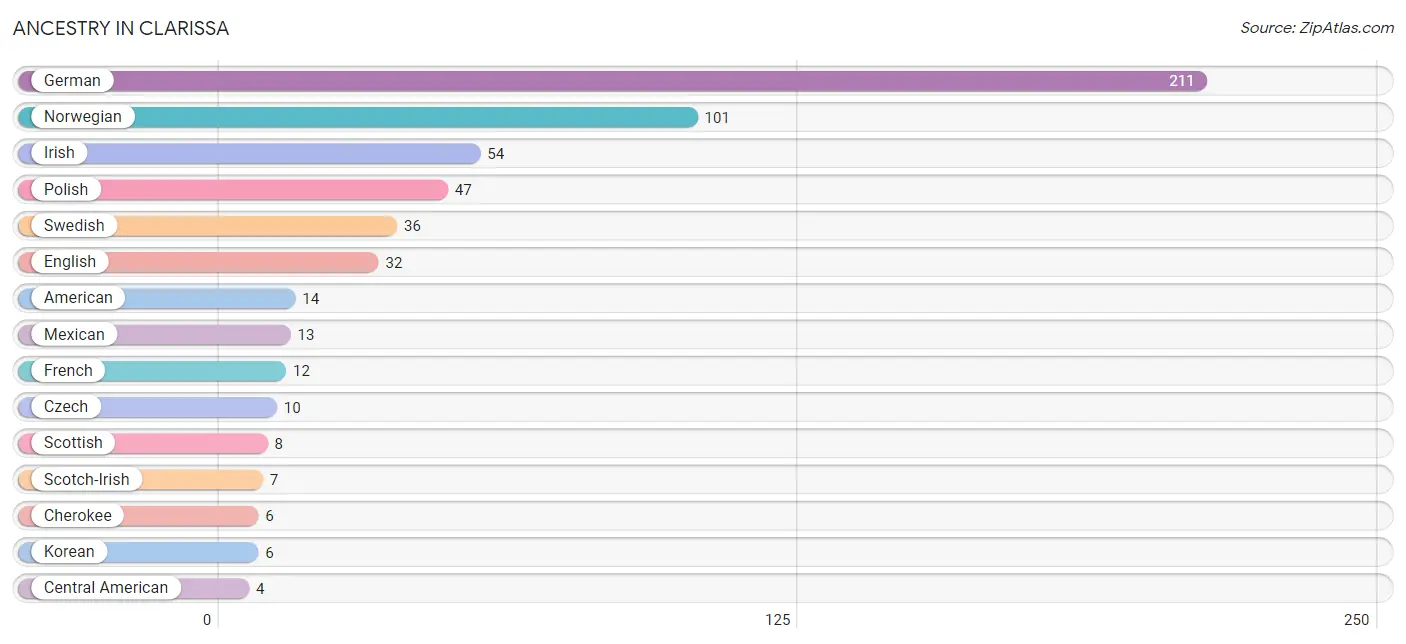
| Ancestry | # Population | % Population |
| American | 14 | 2.1% |
| Austrian | 3 | 0.4% |
| Belgian | 1 | 0.2% |
| Central American | 4 | 0.6% |
| Cherokee | 6 | 0.9% |
| Czech | 10 | 1.5% |
| Dutch | 2 | 0.3% |
| English | 32 | 4.7% |
| European | 2 | 0.3% |
| Finnish | 2 | 0.3% |
| French | 12 | 1.8% |
| French Canadian | 2 | 0.3% |
| German | 211 | 31.2% |
| Guatemalan | 3 | 0.4% |
| Honduran | 1 | 0.2% |
| Indian (Asian) | 4 | 0.6% |
| Irish | 54 | 8.0% |
| Italian | 1 | 0.2% |
| Japanese | 2 | 0.3% |
| Korean | 6 | 0.9% |
| Mexican | 13 | 1.9% |
| Nigerian | 2 | 0.3% |
| Norwegian | 101 | 14.9% |
| Polish | 47 | 7.0% |
| Scandinavian | 2 | 0.3% |
| Scotch-Irish | 7 | 1.0% |
| Scottish | 8 | 1.2% |
| Subsaharan African | 2 | 0.3% |
| Swedish | 36 | 5.3% | View All 29 Rows |
Immigrants in Clarissa
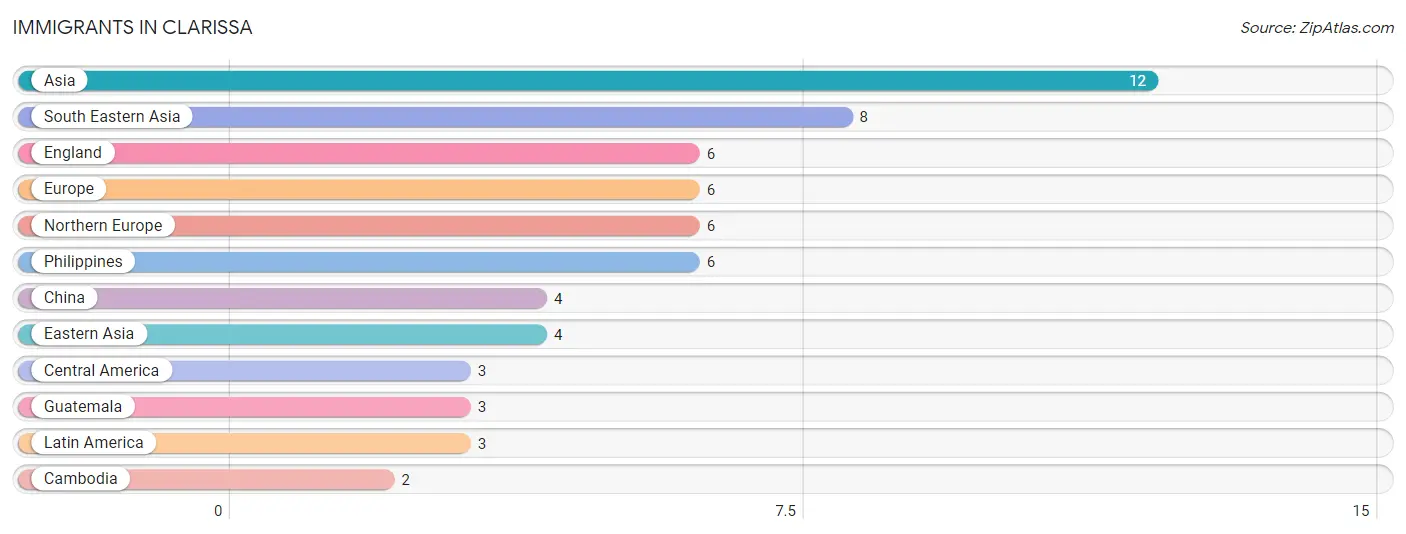
The most numerous immigrant groups reported in Clarissa came from Asia (12 | 1.8%), South Eastern Asia (8 | 1.2%), England (6 | 0.9%), Europe (6 | 0.9%), and Northern Europe (6 | 0.9%), together accounting for 5.6% of all Clarissa residents.
| Immigration Origin | # Population | % Population |
| Asia | 12 | 1.8% |
| Cambodia | 2 | 0.3% |
| Central America | 3 | 0.4% |
| China | 4 | 0.6% |
| Eastern Asia | 4 | 0.6% |
| England | 6 | 0.9% |
| Europe | 6 | 0.9% |
| Guatemala | 3 | 0.4% |
| Latin America | 3 | 0.4% |
| Northern Europe | 6 | 0.9% |
| Philippines | 6 | 0.9% |
| South Eastern Asia | 8 | 1.2% | View All 12 Rows |
Sex and Age in Clarissa
Sex and Age in Clarissa
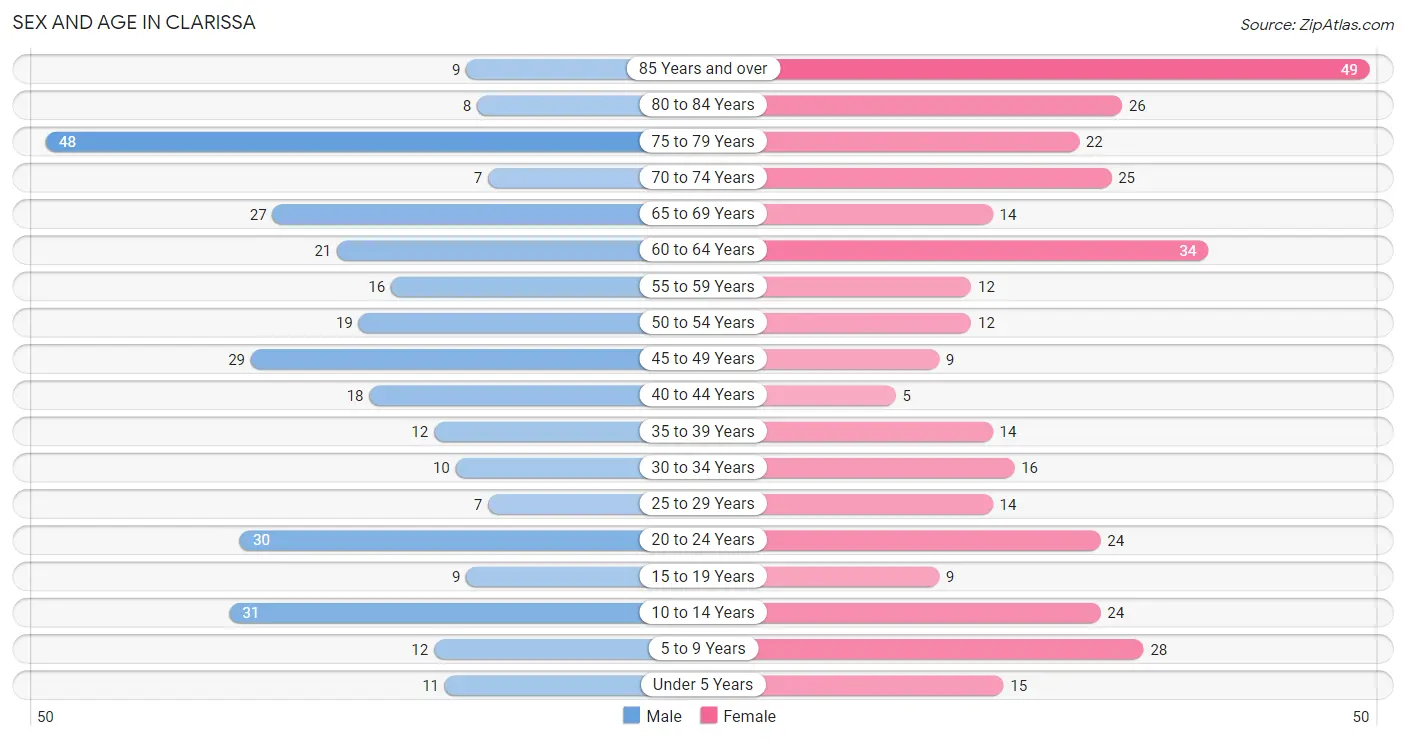
The most populous age groups in Clarissa are 75 to 79 Years (48 | 14.8%) for men and 85 Years and over (49 | 13.9%) for women.
| Age Bracket | Male | Female |
| Under 5 Years | 11 (3.4%) | 15 (4.3%) |
| 5 to 9 Years | 12 (3.7%) | 28 (8.0%) |
| 10 to 14 Years | 31 (9.6%) | 24 (6.8%) |
| 15 to 19 Years | 9 (2.8%) | 9 (2.6%) |
| 20 to 24 Years | 30 (9.3%) | 24 (6.8%) |
| 25 to 29 Years | 7 (2.2%) | 14 (4.0%) |
| 30 to 34 Years | 10 (3.1%) | 16 (4.5%) |
| 35 to 39 Years | 12 (3.7%) | 14 (4.0%) |
| 40 to 44 Years | 18 (5.6%) | 5 (1.4%) |
| 45 to 49 Years | 29 (8.9%) | 9 (2.6%) |
| 50 to 54 Years | 19 (5.9%) | 12 (3.4%) |
| 55 to 59 Years | 16 (4.9%) | 12 (3.4%) |
| 60 to 64 Years | 21 (6.5%) | 34 (9.7%) |
| 65 to 69 Years | 27 (8.3%) | 14 (4.0%) |
| 70 to 74 Years | 7 (2.2%) | 25 (7.1%) |
| 75 to 79 Years | 48 (14.8%) | 22 (6.2%) |
| 80 to 84 Years | 8 (2.5%) | 26 (7.4%) |
| 85 Years and over | 9 (2.8%) | 49 (13.9%) |
| Total | 324 (100.0%) | 352 (100.0%) |
Families and Households in Clarissa
Median Family Size in Clarissa
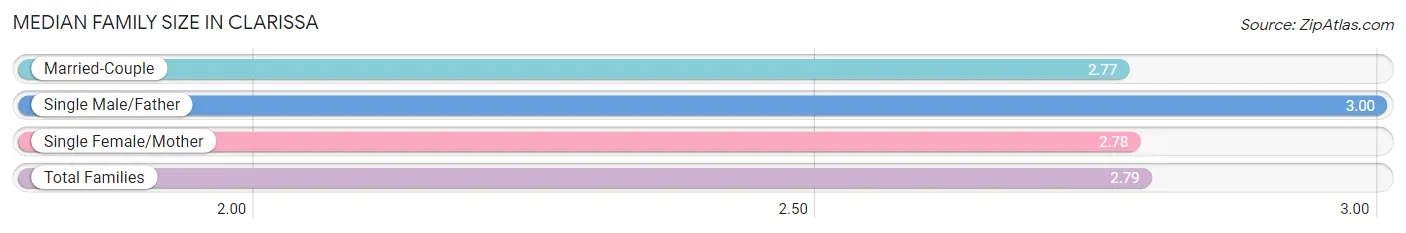
The median family size in Clarissa is 2.79 persons per family, with single male/father families (10 | 6.4%) accounting for the largest median family size of 3 persons per family. On the other hand, married-couple families (119 | 76.3%) represent the smallest median family size with 2.77 persons per family.
| Family Type | # Families | Family Size |
| Married-Couple | 119 (76.3%) | 2.77 |
| Single Male/Father | 10 (6.4%) | 3.00 |
| Single Female/Mother | 27 (17.3%) | 2.78 |
| Total Families | 156 (100.0%) | 2.79 |
Median Household Size in Clarissa
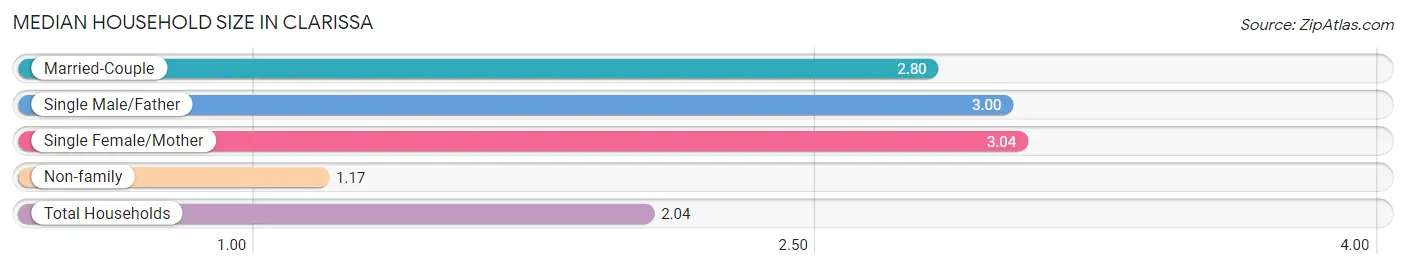
The median household size in Clarissa is 2.04 persons per household, with single female/mother households (27 | 9.0%) accounting for the largest median household size of 3.04 persons per household. non-family households (145 | 48.2%) represent the smallest median household size with 1.17 persons per household.
| Household Type | # Households | Household Size |
| Married-Couple | 119 (39.5%) | 2.80 |
| Single Male/Father | 10 (3.3%) | 3.00 |
| Single Female/Mother | 27 (9.0%) | 3.04 |
| Non-family | 145 (48.2%) | 1.17 |
| Total Households | 301 (100.0%) | 2.04 |
Household Size by Marriage Status in Clarissa
Out of a total of 301 households in Clarissa, 156 (51.8%) are family households, while 145 (48.2%) are nonfamily households. The most numerous type of family households are 2-person households, comprising 98, and the most common type of nonfamily households are 1-person households, comprising 121.
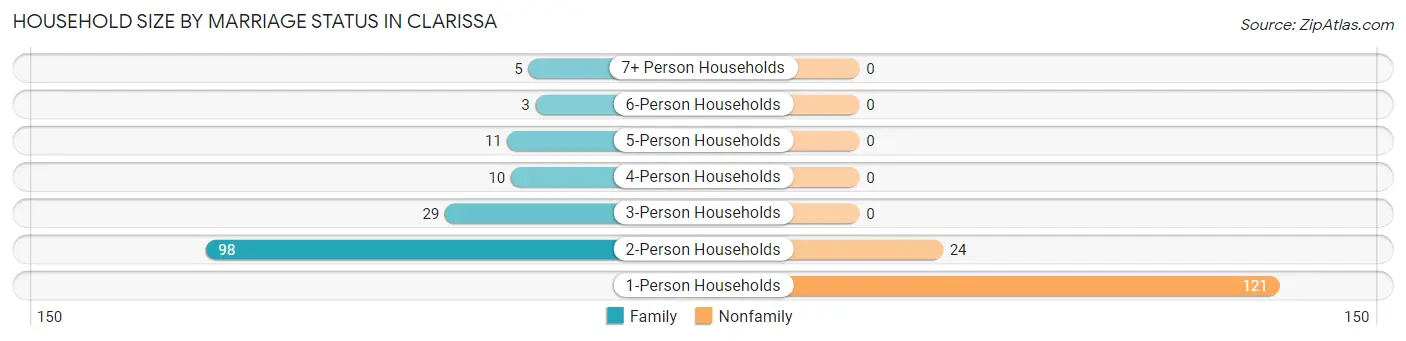
| Household Size | Family Households | Nonfamily Households |
| 1-Person Households | - | 121 (40.2%) |
| 2-Person Households | 98 (32.6%) | 24 (8.0%) |
| 3-Person Households | 29 (9.6%) | 0 (0.0%) |
| 4-Person Households | 10 (3.3%) | 0 (0.0%) |
| 5-Person Households | 11 (3.6%) | 0 (0.0%) |
| 6-Person Households | 3 (1.0%) | 0 (0.0%) |
| 7+ Person Households | 5 (1.7%) | 0 (0.0%) |
| Total | 156 (51.8%) | 145 (48.2%) |
Female Fertility in Clarissa
Fertility by Age in Clarissa
Average fertility rate in Clarissa is 41.0 births per 1,000 women. Women in the age bracket of 20 to 34 years have the highest fertility rate with 74.0 births per 1,000 women. Women in the age bracket of 20 to 34 years acount for 100.0% of all women with births.
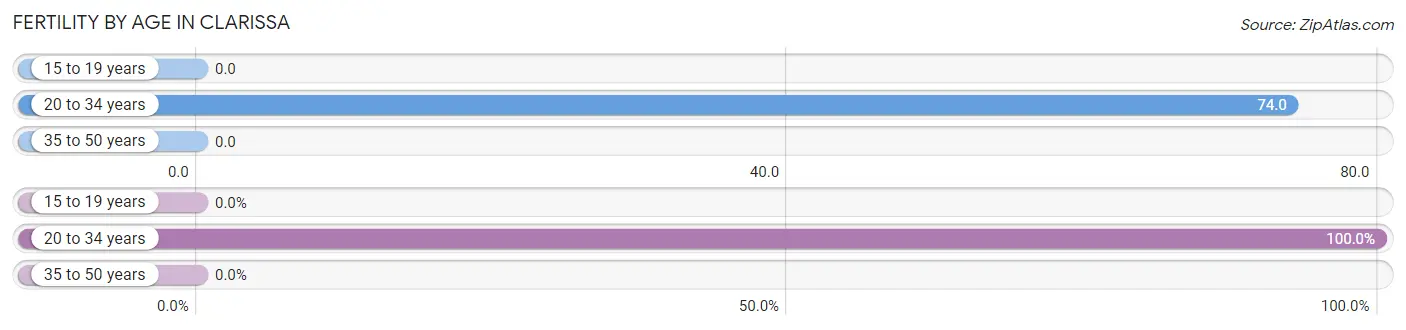
| Age Bracket | Women with Births | Births / 1,000 Women |
| 15 to 19 years | 0 (0.0%) | 0.0 |
| 20 to 34 years | 4 (100.0%) | 74.0 |
| 35 to 50 years | 0 (0.0%) | 0.0 |
| Total | 4 (100.0%) | 41.0 |
Fertility by Age by Marriage Status in Clarissa
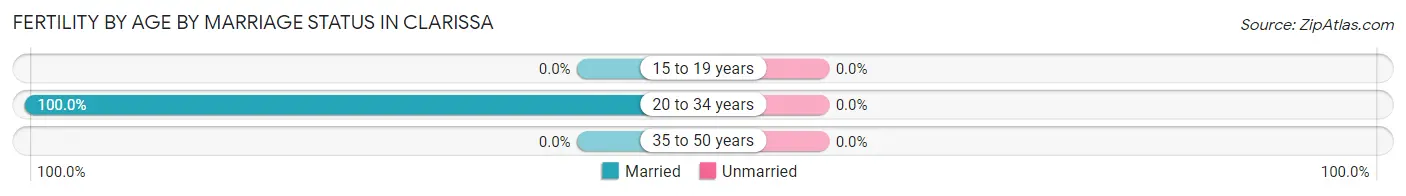
| Age Bracket | Married | Unmarried |
| 15 to 19 years | 0 (0.0%) | 0 (0.0%) |
| 20 to 34 years | 4 (100.0%) | 0 (0.0%) |
| 35 to 50 years | 0 (0.0%) | 0 (0.0%) |
| Total | 4 (100.0%) | 0 (0.0%) |
Fertility by Education in Clarissa
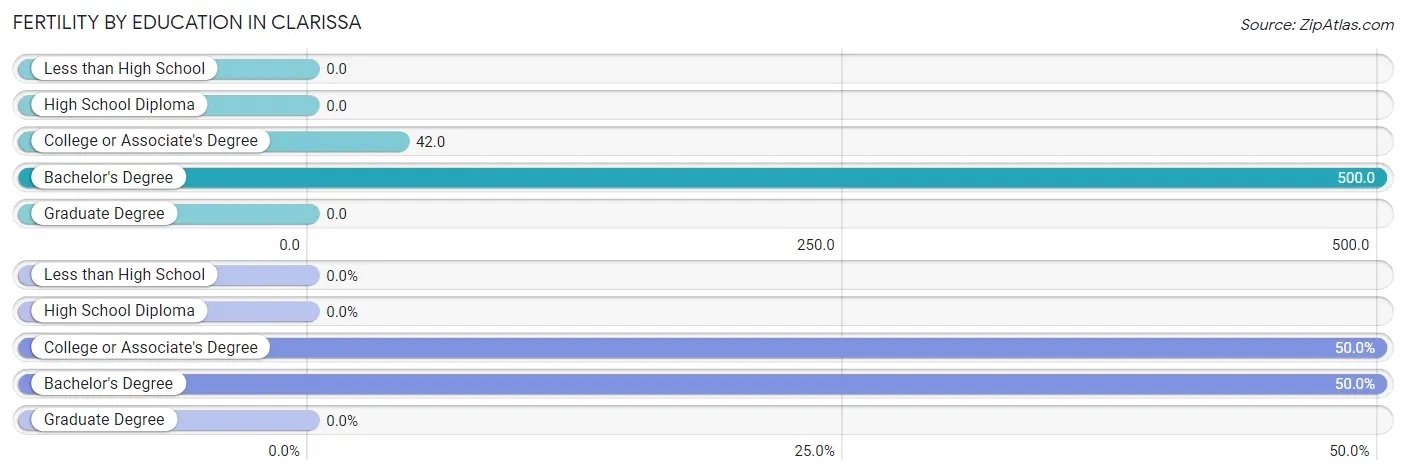
| Educational Attainment | Women with Births | Births / 1,000 Women |
| Less than High School | 0 (0.0%) | 0.0 |
| High School Diploma | 0 (0.0%) | 0.0 |
| College or Associate's Degree | 2 (50.0%) | 42.0 |
| Bachelor's Degree | 2 (50.0%) | 500.0 |
| Graduate Degree | 0 (0.0%) | 0.0 |
| Total | 4 (100.0%) | 41.0 |
Fertility by Education by Marriage Status in Clarissa
| Educational Attainment | Married | Unmarried |
| Less than High School | 0 (0.0%) | 0 (0.0%) |
| High School Diploma | 0 (0.0%) | 0 (0.0%) |
| College or Associate's Degree | 2 (100.0%) | 0 (0.0%) |
| Bachelor's Degree | 2 (100.0%) | 0 (0.0%) |
| Graduate Degree | 0 (0.0%) | 0 (0.0%) |
| Total | 4 (100.0%) | 0 (0.0%) |
Employment Characteristics in Clarissa
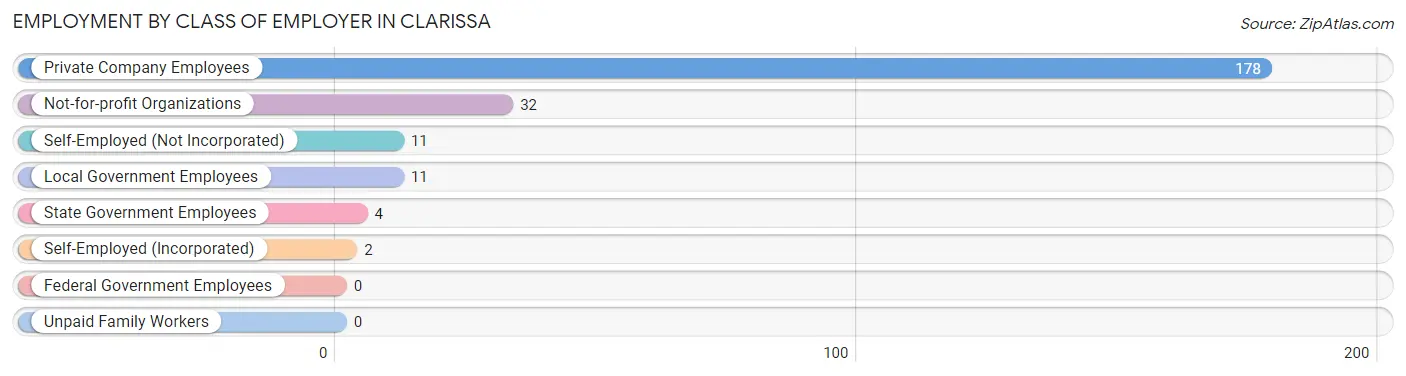
Employment by Class of Employer in Clarissa
Among the 238 employed individuals in Clarissa, private company employees (178 | 74.8%), not-for-profit organizations (32 | 13.5%), and self-employed (not incorporated) (11 | 4.6%) make up the most common classes of employment.
| Employer Class | # Employees | % Employees |
| Private Company Employees | 178 | 74.8% |
| Self-Employed (Incorporated) | 2 | 0.8% |
| Self-Employed (Not Incorporated) | 11 | 4.6% |
| Not-for-profit Organizations | 32 | 13.5% |
| Local Government Employees | 11 | 4.6% |
| State Government Employees | 4 | 1.7% |
| Federal Government Employees | 0 | 0.0% |
| Unpaid Family Workers | 0 | 0.0% |
| Total | 238 | 100.0% |
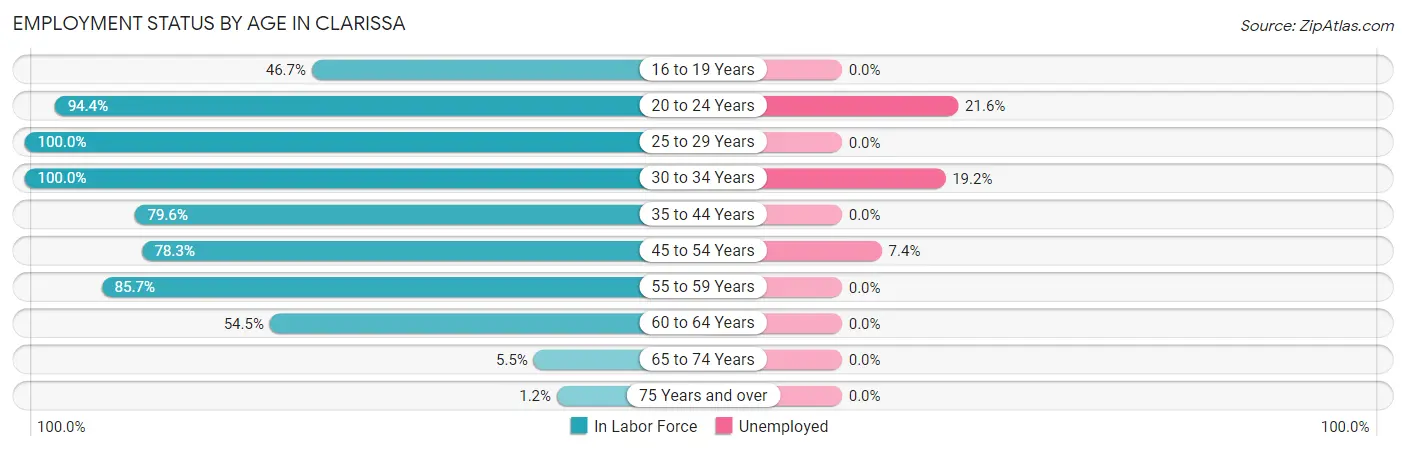
Employment Status by Age in Clarissa
According to the labor force statistics for Clarissa, out of the total population over 16 years of age (552), 46.7% or 258 individuals are in the labor force, with 7.8% or 20 of them unemployed. The age group with the highest labor force participation rate is 25 to 29 years, with 100.0% or 21 individuals in the labor force. Within the labor force, the 20 to 24 years age range has the highest percentage of unemployed individuals, with 21.6% or 11 of them being unemployed.
| Age Bracket | In Labor Force | Unemployed |
| 16 to 19 Years | 7 (46.7%) | 0 (0.0%) |
| 20 to 24 Years | 51 (94.4%) | 11 (21.6%) |
| 25 to 29 Years | 21 (100.0%) | 0 (0.0%) |
| 30 to 34 Years | 26 (100.0%) | 5 (19.2%) |
| 35 to 44 Years | 39 (79.6%) | 0 (0.0%) |
| 45 to 54 Years | 54 (78.3%) | 4 (7.4%) |
| 55 to 59 Years | 24 (85.7%) | 0 (0.0%) |
| 60 to 64 Years | 30 (54.5%) | 0 (0.0%) |
| 65 to 74 Years | 4 (5.5%) | 0 (0.0%) |
| 75 Years and over | 2 (1.2%) | 0 (0.0%) |
| Total | 258 (46.7%) | 20 (7.8%) |
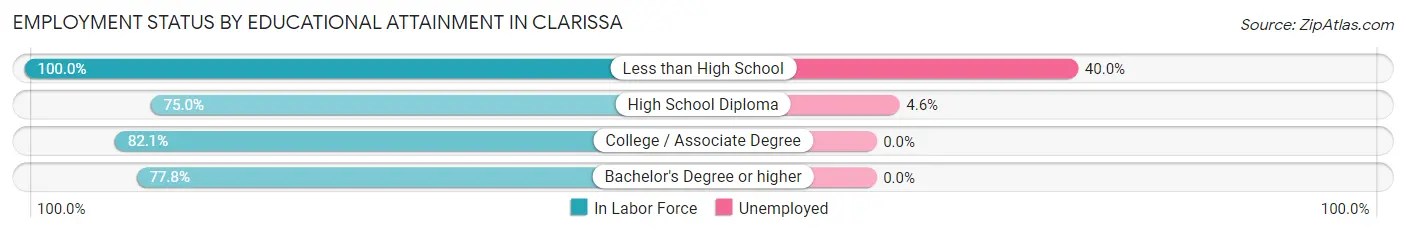
Employment Status by Educational Attainment in Clarissa
According to labor force statistics for Clarissa, 78.2% of individuals (194) out of the total population between 25 and 64 years of age (248) are in the labor force, with 4.6% or 9 of them being unemployed. The group with the highest labor force participation rate are those with the educational attainment of less than high school, with 100.0% or 10 individuals in the labor force. Within the labor force, individuals with less than high school education have the highest percentage of unemployment, with 40.0% or 4 of them being unemployed.
| Educational Attainment | In Labor Force | Unemployed |
| Less than High School | 10 (100.0%) | 4 (40.0%) |
| High School Diploma | 108 (75.0%) | 7 (4.6%) |
| College / Associate Degree | 55 (82.1%) | 0 (0.0%) |
| Bachelor's Degree or higher | 21 (77.8%) | 0 (0.0%) |
| Total | 194 (78.2%) | 11 (4.6%) |
Employment Occupations by Sex in Clarissa
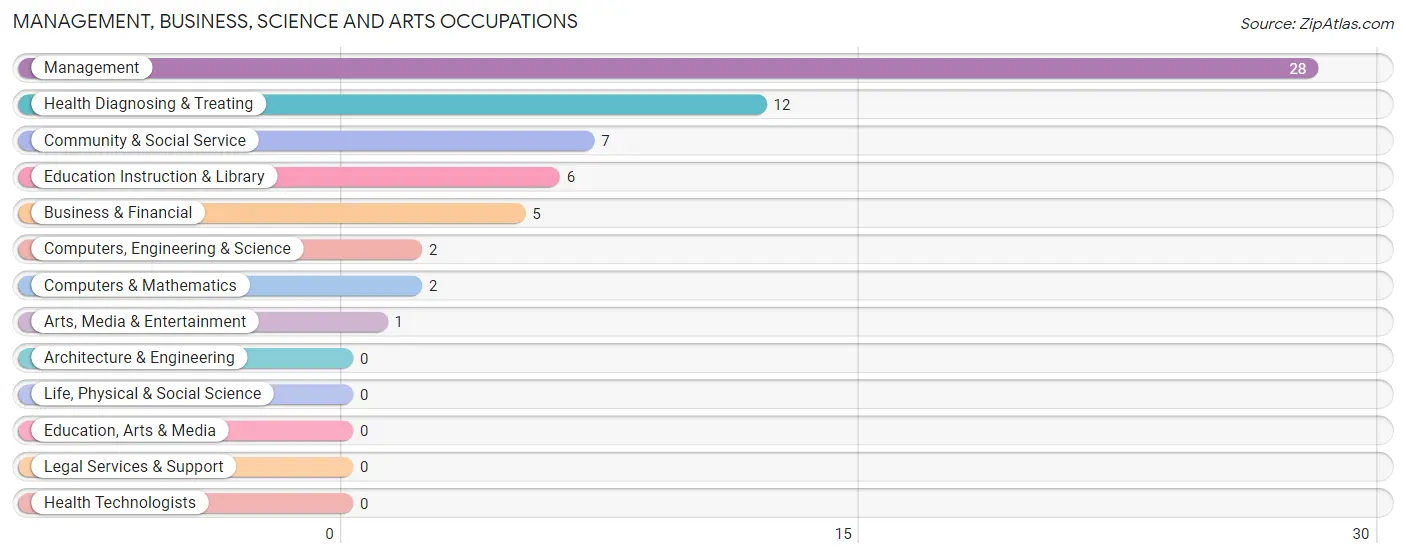
Management, Business, Science and Arts Occupations
The most common Management, Business, Science and Arts occupations in Clarissa are Management (28 | 11.8%), Health Diagnosing & Treating (12 | 5.0%), Community & Social Service (7 | 2.9%), Education Instruction & Library (6 | 2.5%), and Business & Financial (5 | 2.1%).
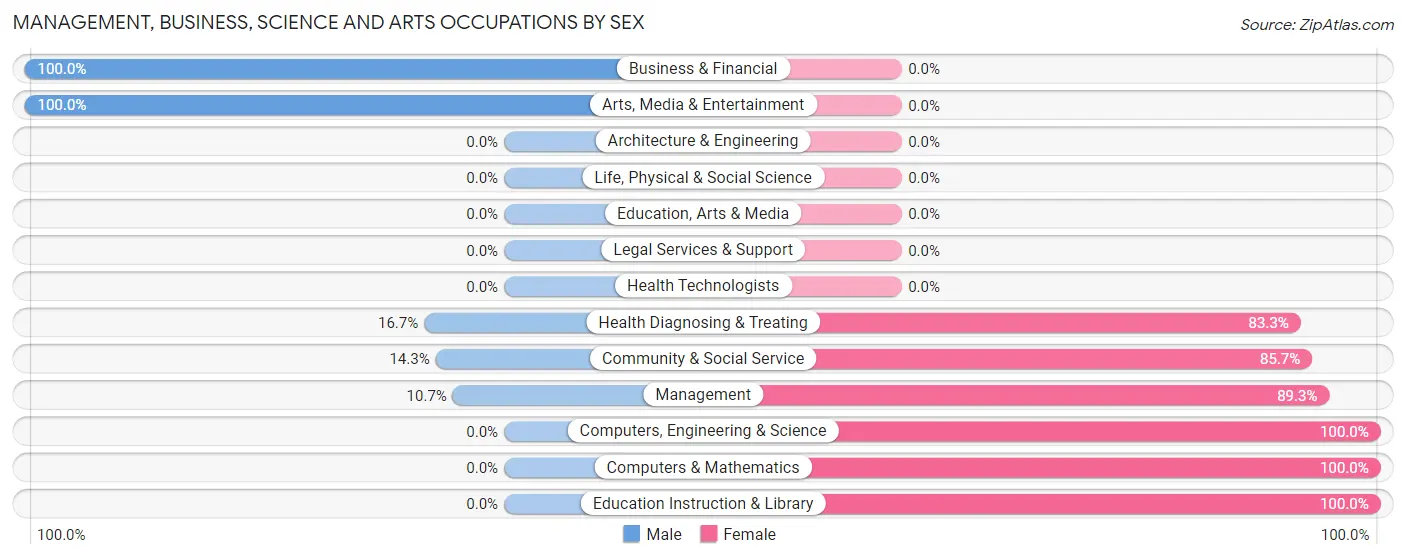
Management, Business, Science and Arts Occupations by Sex
Within the Management, Business, Science and Arts occupations in Clarissa, the most male-oriented occupations are Business & Financial (100.0%), Arts, Media & Entertainment (100.0%), and Health Diagnosing & Treating (16.7%), while the most female-oriented occupations are Computers, Engineering & Science (100.0%), Computers & Mathematics (100.0%), and Education Instruction & Library (100.0%).
| Occupation | Male | Female |
| Management | 3 (10.7%) | 25 (89.3%) |
| Business & Financial | 5 (100.0%) | 0 (0.0%) |
| Computers, Engineering & Science | 0 (0.0%) | 2 (100.0%) |
| Computers & Mathematics | 0 (0.0%) | 2 (100.0%) |
| Architecture & Engineering | 0 (0.0%) | 0 (0.0%) |
| Life, Physical & Social Science | 0 (0.0%) | 0 (0.0%) |
| Community & Social Service | 1 (14.3%) | 6 (85.7%) |
| Education, Arts & Media | 0 (0.0%) | 0 (0.0%) |
| Legal Services & Support | 0 (0.0%) | 0 (0.0%) |
| Education Instruction & Library | 0 (0.0%) | 6 (100.0%) |
| Arts, Media & Entertainment | 1 (100.0%) | 0 (0.0%) |
| Health Diagnosing & Treating | 2 (16.7%) | 10 (83.3%) |
| Health Technologists | 0 (0.0%) | 0 (0.0%) |
| Total (Category) | 11 (20.4%) | 43 (79.6%) |
| Total (Overall) | 127 (53.4%) | 111 (46.6%) |
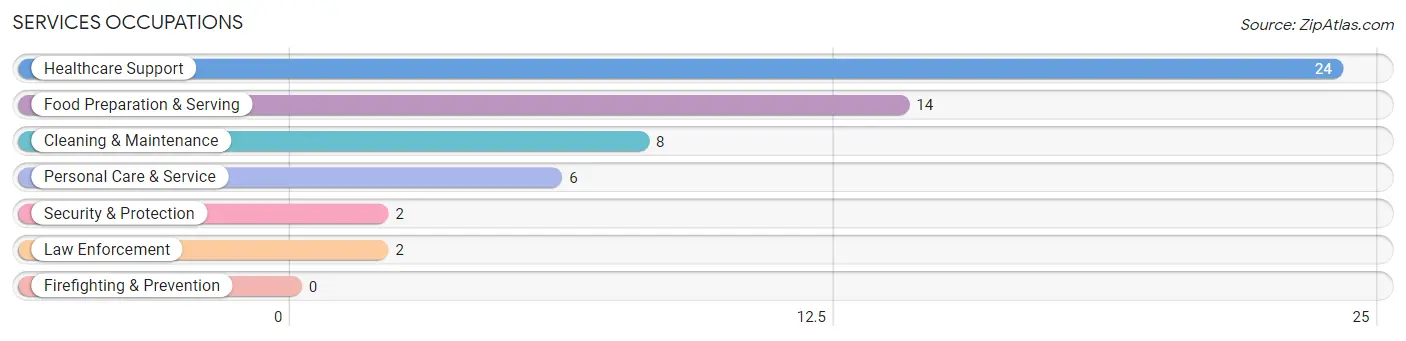
Services Occupations
The most common Services occupations in Clarissa are Healthcare Support (24 | 10.1%), Food Preparation & Serving (14 | 5.9%), Cleaning & Maintenance (8 | 3.4%), Personal Care & Service (6 | 2.5%), and Security & Protection (2 | 0.8%).
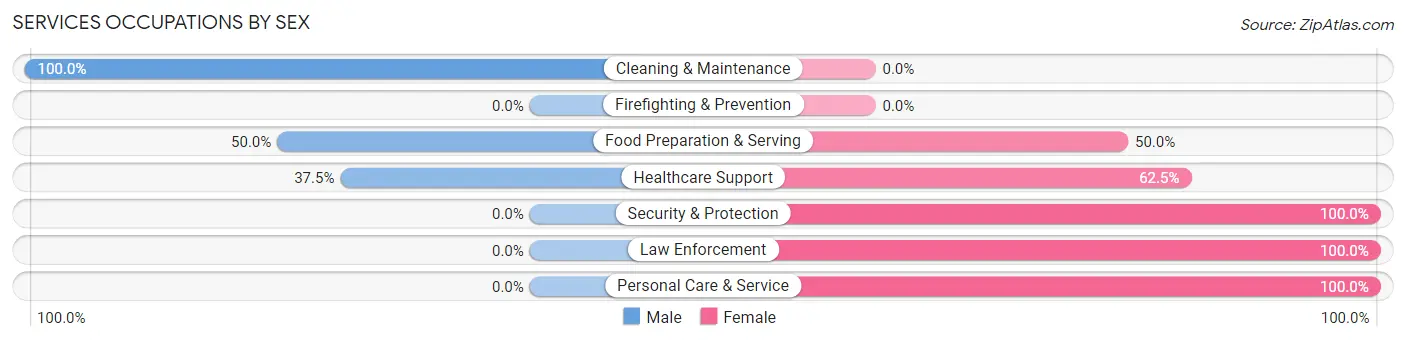
Services Occupations by Sex
Within the Services occupations in Clarissa, the most male-oriented occupations are Cleaning & Maintenance (100.0%), Food Preparation & Serving (50.0%), and Healthcare Support (37.5%), while the most female-oriented occupations are Security & Protection (100.0%), Law Enforcement (100.0%), and Personal Care & Service (100.0%).
| Occupation | Male | Female |
| Healthcare Support | 9 (37.5%) | 15 (62.5%) |
| Security & Protection | 0 (0.0%) | 2 (100.0%) |
| Firefighting & Prevention | 0 (0.0%) | 0 (0.0%) |
| Law Enforcement | 0 (0.0%) | 2 (100.0%) |
| Food Preparation & Serving | 7 (50.0%) | 7 (50.0%) |
| Cleaning & Maintenance | 8 (100.0%) | 0 (0.0%) |
| Personal Care & Service | 0 (0.0%) | 6 (100.0%) |
| Total (Category) | 24 (44.4%) | 30 (55.6%) |
| Total (Overall) | 127 (53.4%) | 111 (46.6%) |
Sales and Office Occupations
The most common Sales and Office occupations in Clarissa are Sales & Related (13 | 5.5%), and Office & Administration (12 | 5.0%).
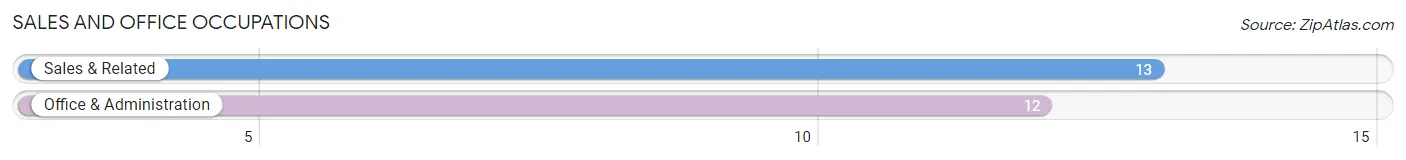
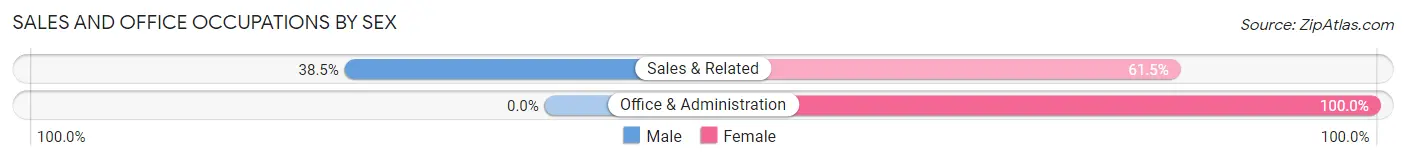
Sales and Office Occupations by Sex
| Occupation | Male | Female |
| Sales & Related | 5 (38.5%) | 8 (61.5%) |
| Office & Administration | 0 (0.0%) | 12 (100.0%) |
| Total (Category) | 5 (20.0%) | 20 (80.0%) |
| Total (Overall) | 127 (53.4%) | 111 (46.6%) |
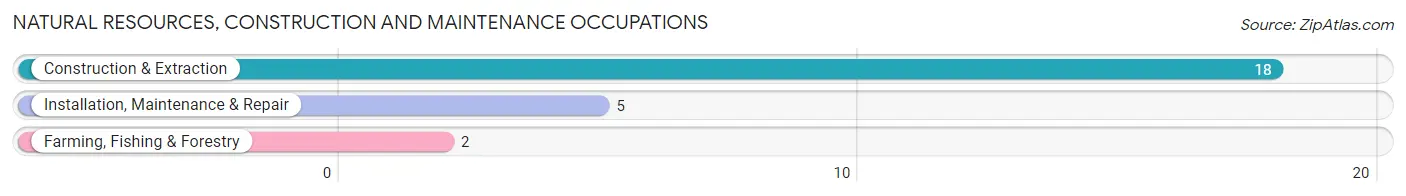
Natural Resources, Construction and Maintenance Occupations
The most common Natural Resources, Construction and Maintenance occupations in Clarissa are Construction & Extraction (18 | 7.6%), Installation, Maintenance & Repair (5 | 2.1%), and Farming, Fishing & Forestry (2 | 0.8%).
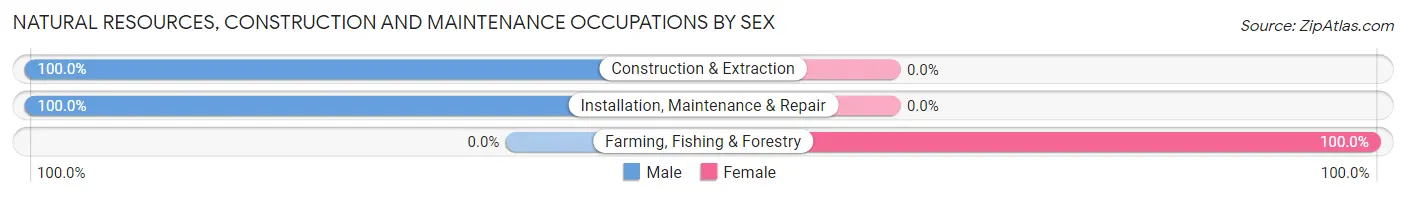
Natural Resources, Construction and Maintenance Occupations by Sex
| Occupation | Male | Female |
| Farming, Fishing & Forestry | 0 (0.0%) | 2 (100.0%) |
| Construction & Extraction | 18 (100.0%) | 0 (0.0%) |
| Installation, Maintenance & Repair | 5 (100.0%) | 0 (0.0%) |
| Total (Category) | 23 (92.0%) | 2 (8.0%) |
| Total (Overall) | 127 (53.4%) | 111 (46.6%) |
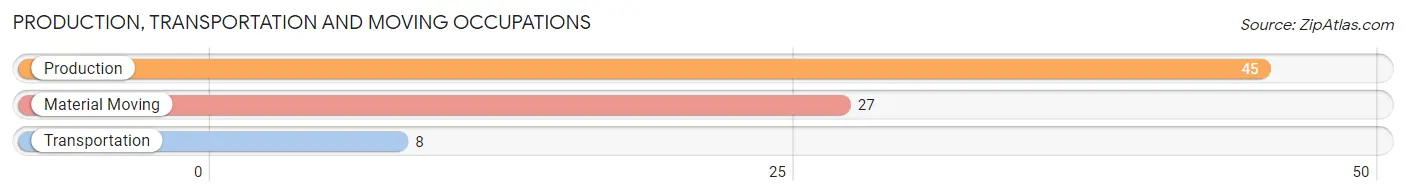
Production, Transportation and Moving Occupations
The most common Production, Transportation and Moving occupations in Clarissa are Production (45 | 18.9%), Material Moving (27 | 11.3%), and Transportation (8 | 3.4%).
Production, Transportation and Moving Occupations by Sex
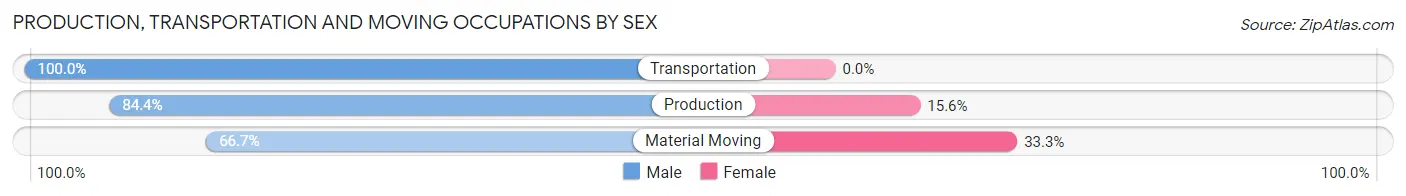
| Occupation | Male | Female |
| Production | 38 (84.4%) | 7 (15.6%) |
| Transportation | 8 (100.0%) | 0 (0.0%) |
| Material Moving | 18 (66.7%) | 9 (33.3%) |
| Total (Category) | 64 (80.0%) | 16 (20.0%) |
| Total (Overall) | 127 (53.4%) | 111 (46.6%) |
Employment Industries by Sex in Clarissa
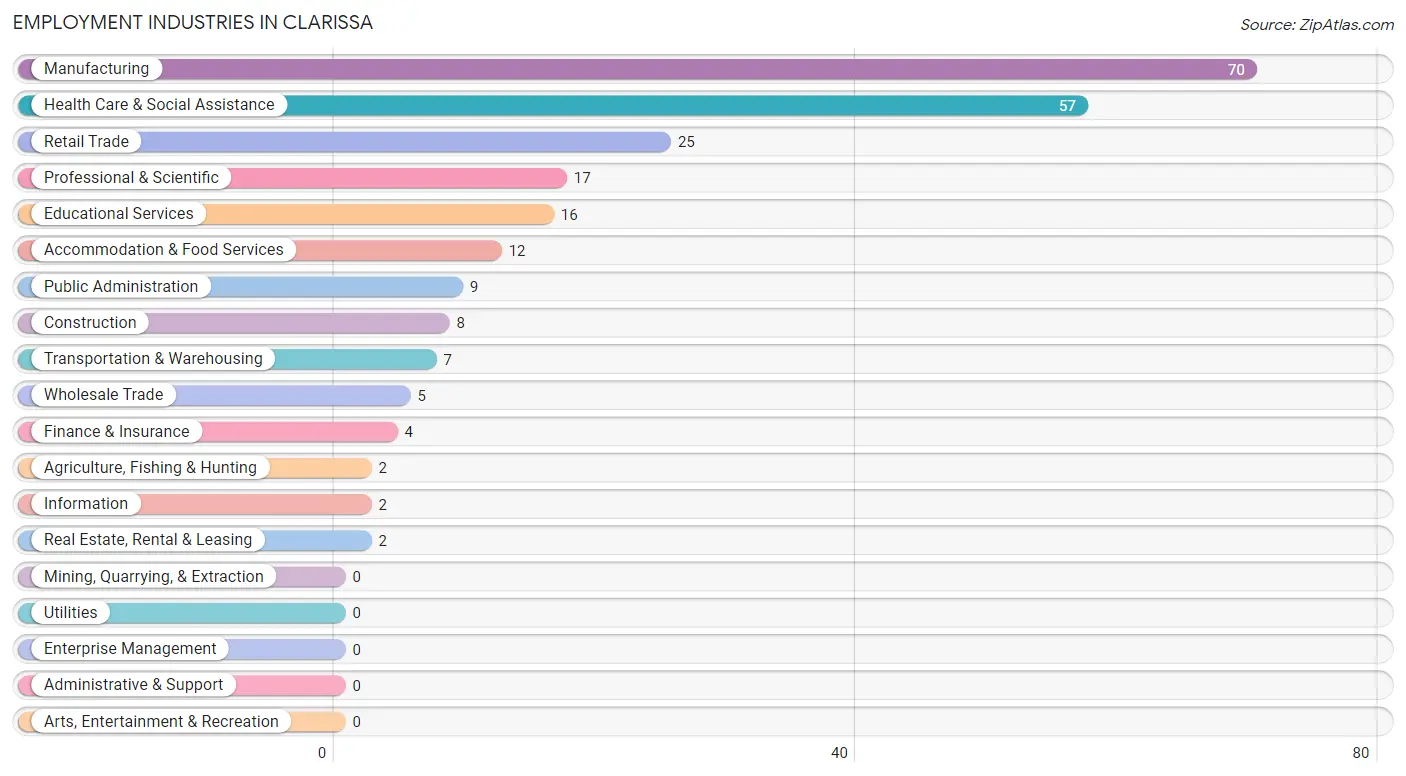
Employment Industries in Clarissa
The major employment industries in Clarissa include Manufacturing (70 | 29.4%), Health Care & Social Assistance (57 | 23.9%), Retail Trade (25 | 10.5%), Professional & Scientific (17 | 7.1%), and Educational Services (16 | 6.7%).
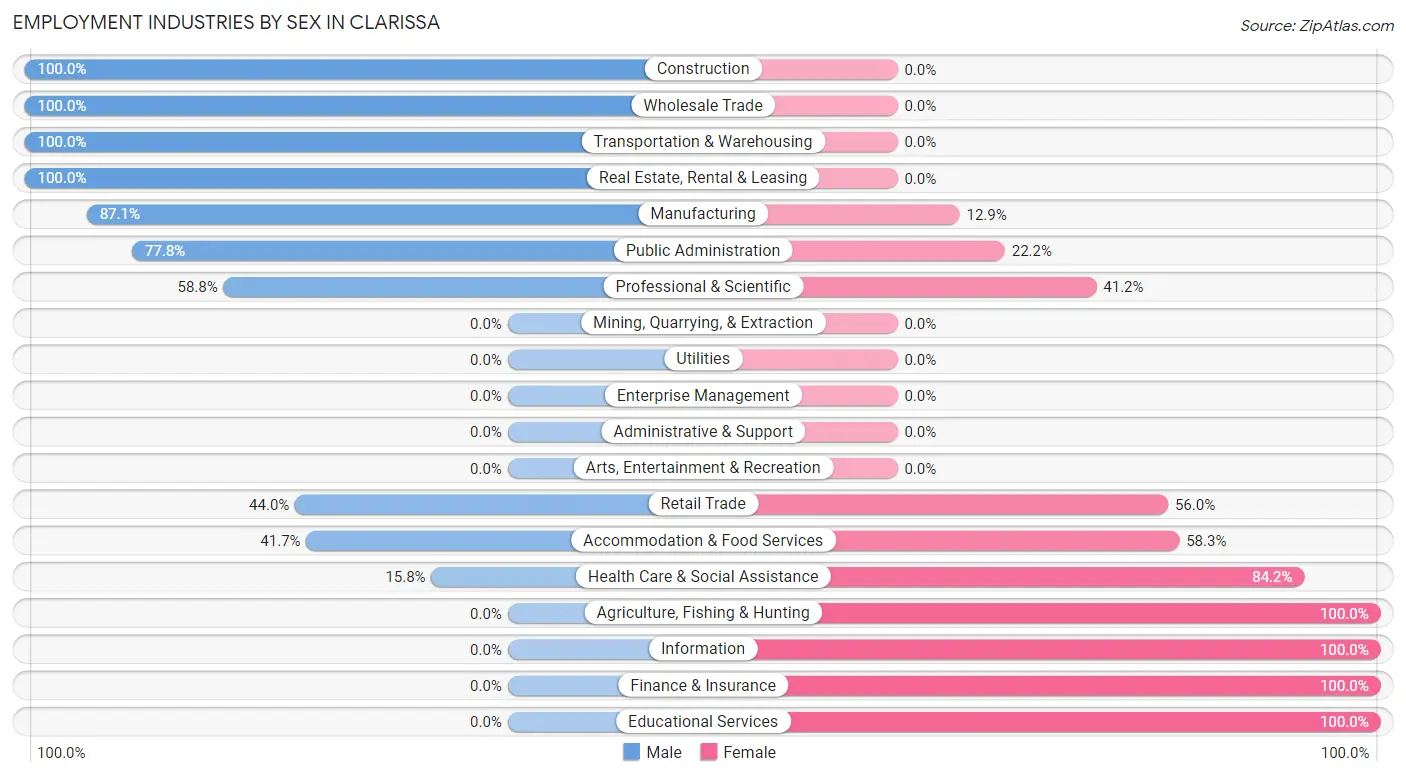
Employment Industries by Sex in Clarissa
The Clarissa industries that see more men than women are Construction (100.0%), Wholesale Trade (100.0%), and Transportation & Warehousing (100.0%), whereas the industries that tend to have a higher number of women are Agriculture, Fishing & Hunting (100.0%), Information (100.0%), and Finance & Insurance (100.0%).
| Industry | Male | Female |
| Agriculture, Fishing & Hunting | 0 (0.0%) | 2 (100.0%) |
| Mining, Quarrying, & Extraction | 0 (0.0%) | 0 (0.0%) |
| Construction | 8 (100.0%) | 0 (0.0%) |
| Manufacturing | 61 (87.1%) | 9 (12.9%) |
| Wholesale Trade | 5 (100.0%) | 0 (0.0%) |
| Retail Trade | 11 (44.0%) | 14 (56.0%) |
| Transportation & Warehousing | 7 (100.0%) | 0 (0.0%) |
| Utilities | 0 (0.0%) | 0 (0.0%) |
| Information | 0 (0.0%) | 2 (100.0%) |
| Finance & Insurance | 0 (0.0%) | 4 (100.0%) |
| Real Estate, Rental & Leasing | 2 (100.0%) | 0 (0.0%) |
| Professional & Scientific | 10 (58.8%) | 7 (41.2%) |
| Enterprise Management | 0 (0.0%) | 0 (0.0%) |
| Administrative & Support | 0 (0.0%) | 0 (0.0%) |
| Educational Services | 0 (0.0%) | 16 (100.0%) |
| Health Care & Social Assistance | 9 (15.8%) | 48 (84.2%) |
| Arts, Entertainment & Recreation | 0 (0.0%) | 0 (0.0%) |
| Accommodation & Food Services | 5 (41.7%) | 7 (58.3%) |
| Public Administration | 7 (77.8%) | 2 (22.2%) |
| Total | 127 (53.4%) | 111 (46.6%) |
Education in Clarissa
School Enrollment in Clarissa
The most common levels of schooling among the 131 students in Clarissa are middle school (37 | 28.2%), high school (34 | 26.0%), and elementary school (31 | 23.7%).
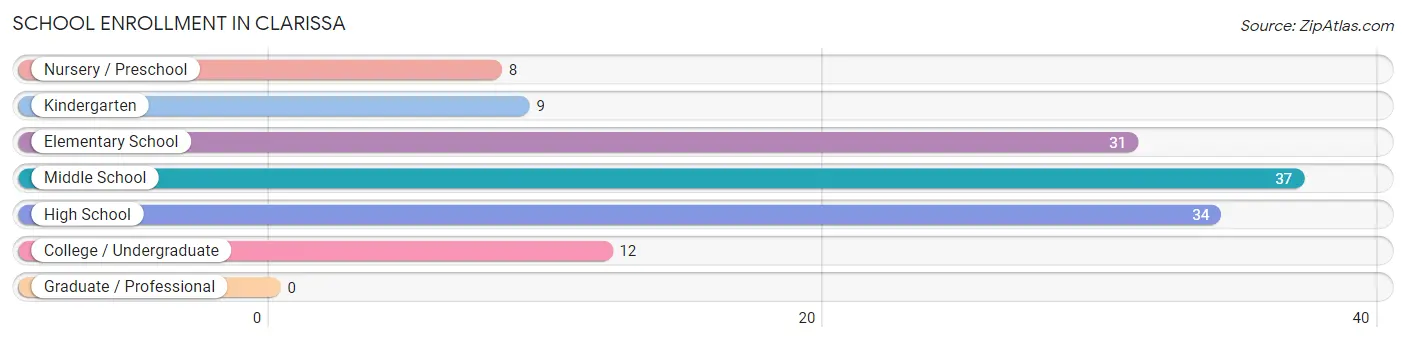
| School Level | # Students | % Students |
| Nursery / Preschool | 8 | 6.1% |
| Kindergarten | 9 | 6.9% |
| Elementary School | 31 | 23.7% |
| Middle School | 37 | 28.2% |
| High School | 34 | 26.0% |
| College / Undergraduate | 12 | 9.2% |
| Graduate / Professional | 0 | 0.0% |
| Total | 131 | 100.0% |
School Enrollment by Age by Funding Source in Clarissa
Out of a total of 131 students who are enrolled in schools in Clarissa, 8 (6.1%) attend a private institution, while the remaining 123 (93.9%) are enrolled in public schools. The age group of 5 to 9 year old has the highest likelihood of being enrolled in private schools, with 6 (15.4% in the age bracket) enrolled. Conversely, the age group of 3 to 4 year olds has the lowest likelihood of being enrolled in a private school, with 7 (100.0% in the age bracket) attending a public institution.
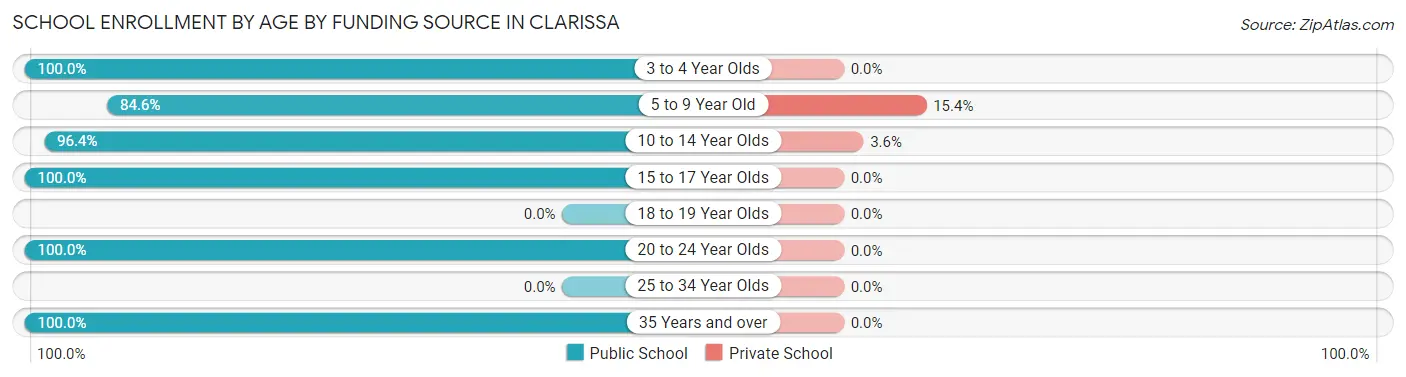
| Age Bracket | Public School | Private School |
| 3 to 4 Year Olds | 7 (100.0%) | 0 (0.0%) |
| 5 to 9 Year Old | 33 (84.6%) | 6 (15.4%) |
| 10 to 14 Year Olds | 53 (96.4%) | 2 (3.6%) |
| 15 to 17 Year Olds | 18 (100.0%) | 0 (0.0%) |
| 18 to 19 Year Olds | 0 (0.0%) | 0 (0.0%) |
| 20 to 24 Year Olds | 8 (100.0%) | 0 (0.0%) |
| 25 to 34 Year Olds | 0 (0.0%) | 0 (0.0%) |
| 35 Years and over | 4 (100.0%) | 0 (0.0%) |
| Total | 123 (93.9%) | 8 (6.1%) |
Educational Attainment by Field of Study in Clarissa
Education (17 | 38.6%), social sciences (8 | 18.2%), arts & humanities (8 | 18.2%), business (5 | 11.4%), and bio, nature & agricultural (2 | 4.5%) are the most common fields of study among 44 individuals in Clarissa who have obtained a bachelor's degree or higher.
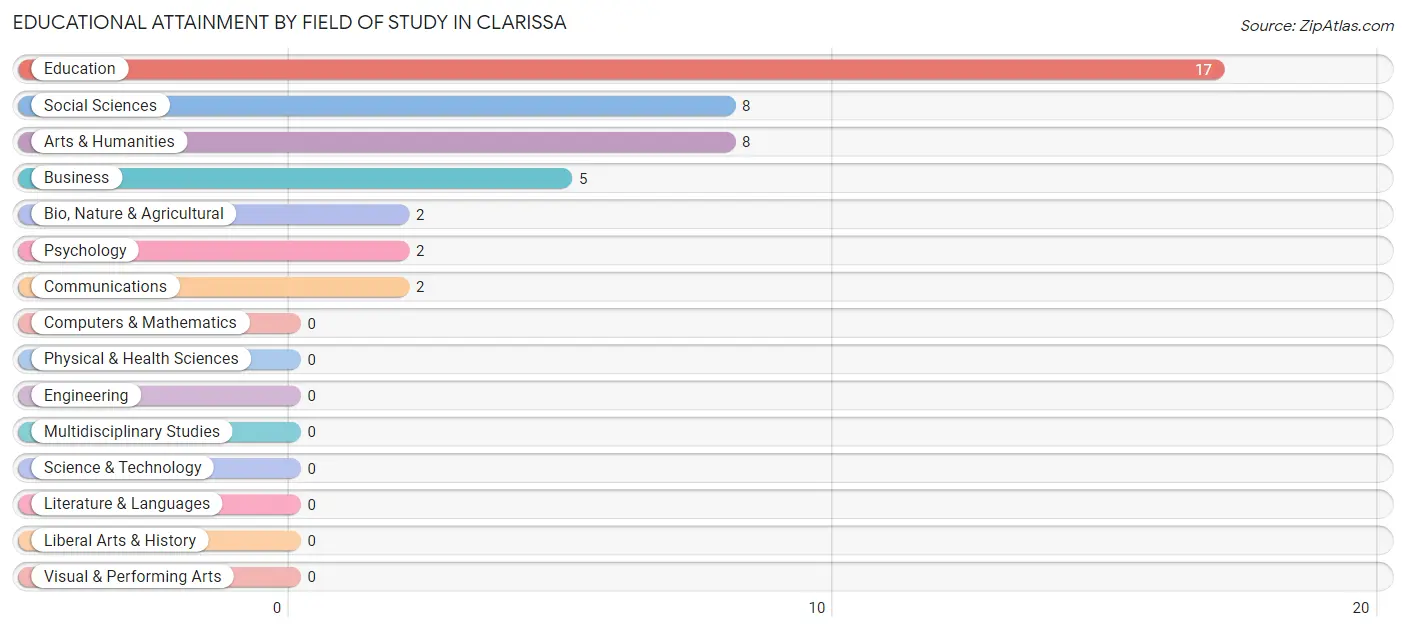
| Field of Study | # Graduates | % Graduates |
| Computers & Mathematics | 0 | 0.0% |
| Bio, Nature & Agricultural | 2 | 4.5% |
| Physical & Health Sciences | 0 | 0.0% |
| Psychology | 2 | 4.5% |
| Social Sciences | 8 | 18.2% |
| Engineering | 0 | 0.0% |
| Multidisciplinary Studies | 0 | 0.0% |
| Science & Technology | 0 | 0.0% |
| Business | 5 | 11.4% |
| Education | 17 | 38.6% |
| Literature & Languages | 0 | 0.0% |
| Liberal Arts & History | 0 | 0.0% |
| Visual & Performing Arts | 0 | 0.0% |
| Communications | 2 | 4.5% |
| Arts & Humanities | 8 | 18.2% |
| Total | 44 | 100.0% |
Transportation & Commute in Clarissa
Vehicle Availability by Sex in Clarissa
The most prevalent vehicle ownership categories in Clarissa are males with 2 vehicles (57, accounting for 44.9%) and females with 2 vehicles (48, making up 51.3%).
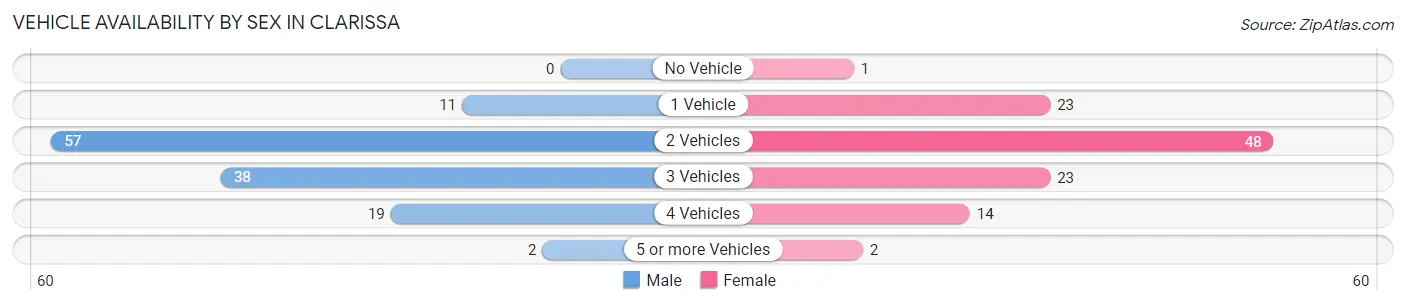
| Vehicles Available | Male | Female |
| No Vehicle | 0 (0.0%) | 1 (0.9%) |
| 1 Vehicle | 11 (8.7%) | 23 (20.7%) |
| 2 Vehicles | 57 (44.9%) | 48 (43.2%) |
| 3 Vehicles | 38 (29.9%) | 23 (20.7%) |
| 4 Vehicles | 19 (15.0%) | 14 (12.6%) |
| 5 or more Vehicles | 2 (1.6%) | 2 (1.8%) |
| Total | 127 (100.0%) | 111 (100.0%) |
Commute Time in Clarissa
The most frequently occuring commute durations in Clarissa are 30 to 34 minutes (32 commuters, 14.4%), 20 to 24 minutes (30 commuters, 13.5%), and 45 to 59 minutes (30 commuters, 13.5%).
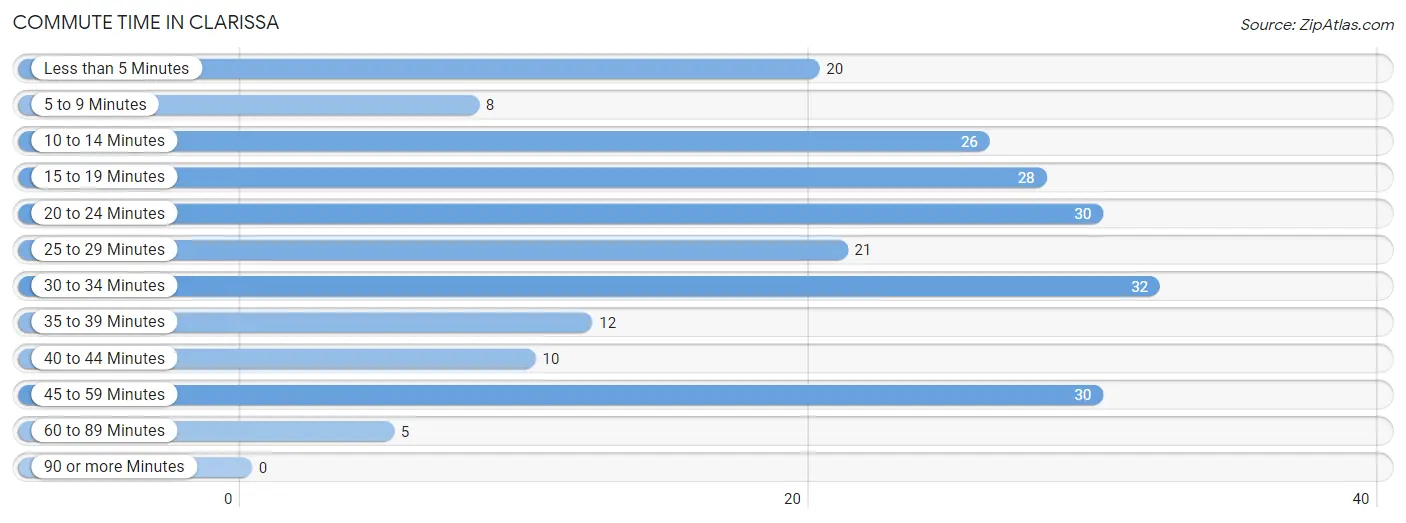
| Commute Time | # Commuters | % Commuters |
| Less than 5 Minutes | 20 | 9.0% |
| 5 to 9 Minutes | 8 | 3.6% |
| 10 to 14 Minutes | 26 | 11.7% |
| 15 to 19 Minutes | 28 | 12.6% |
| 20 to 24 Minutes | 30 | 13.5% |
| 25 to 29 Minutes | 21 | 9.5% |
| 30 to 34 Minutes | 32 | 14.4% |
| 35 to 39 Minutes | 12 | 5.4% |
| 40 to 44 Minutes | 10 | 4.5% |
| 45 to 59 Minutes | 30 | 13.5% |
| 60 to 89 Minutes | 5 | 2.2% |
| 90 or more Minutes | 0 | 0.0% |
Commute Time by Sex in Clarissa
The most common commute times in Clarissa are 45 to 59 minutes (23 commuters, 18.9%) for males and 10 to 14 minutes (21 commuters, 21.0%) for females.
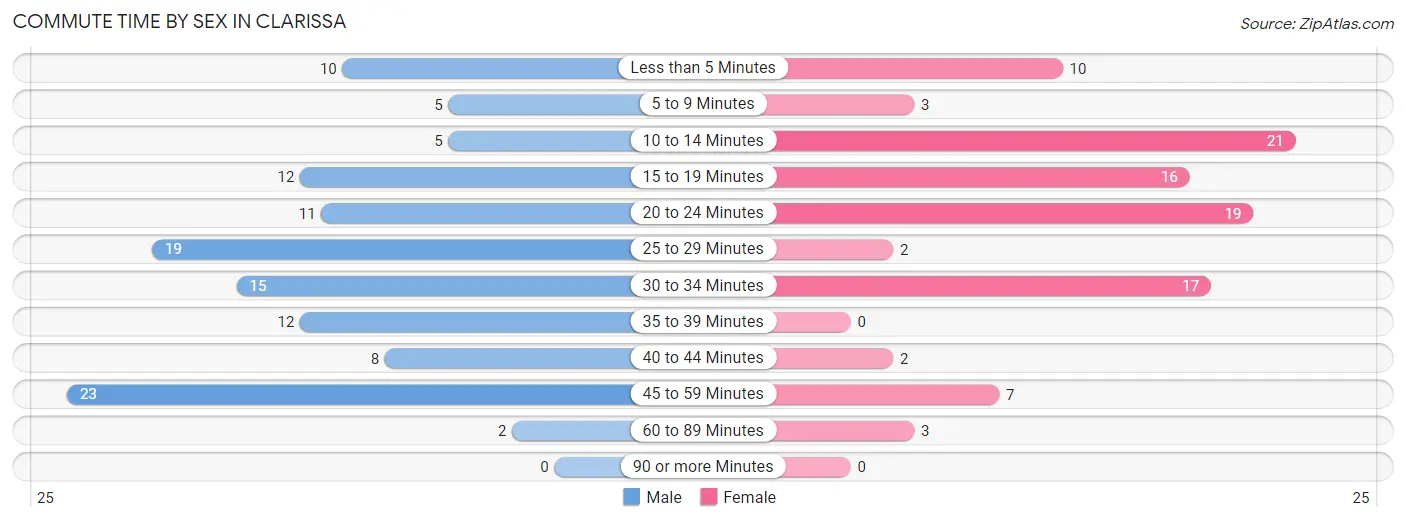
| Commute Time | Male | Female |
| Less than 5 Minutes | 10 (8.2%) | 10 (10.0%) |
| 5 to 9 Minutes | 5 (4.1%) | 3 (3.0%) |
| 10 to 14 Minutes | 5 (4.1%) | 21 (21.0%) |
| 15 to 19 Minutes | 12 (9.8%) | 16 (16.0%) |
| 20 to 24 Minutes | 11 (9.0%) | 19 (19.0%) |
| 25 to 29 Minutes | 19 (15.6%) | 2 (2.0%) |
| 30 to 34 Minutes | 15 (12.3%) | 17 (17.0%) |
| 35 to 39 Minutes | 12 (9.8%) | 0 (0.0%) |
| 40 to 44 Minutes | 8 (6.6%) | 2 (2.0%) |
| 45 to 59 Minutes | 23 (18.9%) | 7 (7.0%) |
| 60 to 89 Minutes | 2 (1.6%) | 3 (3.0%) |
| 90 or more Minutes | 0 (0.0%) | 0 (0.0%) |
Time of Departure to Work by Sex in Clarissa
The most frequent times of departure to work in Clarissa are 6:00 AM to 6:29 AM (20, 16.4%) for males and 4:00 PM to 11:59 PM (18, 18.0%) for females.
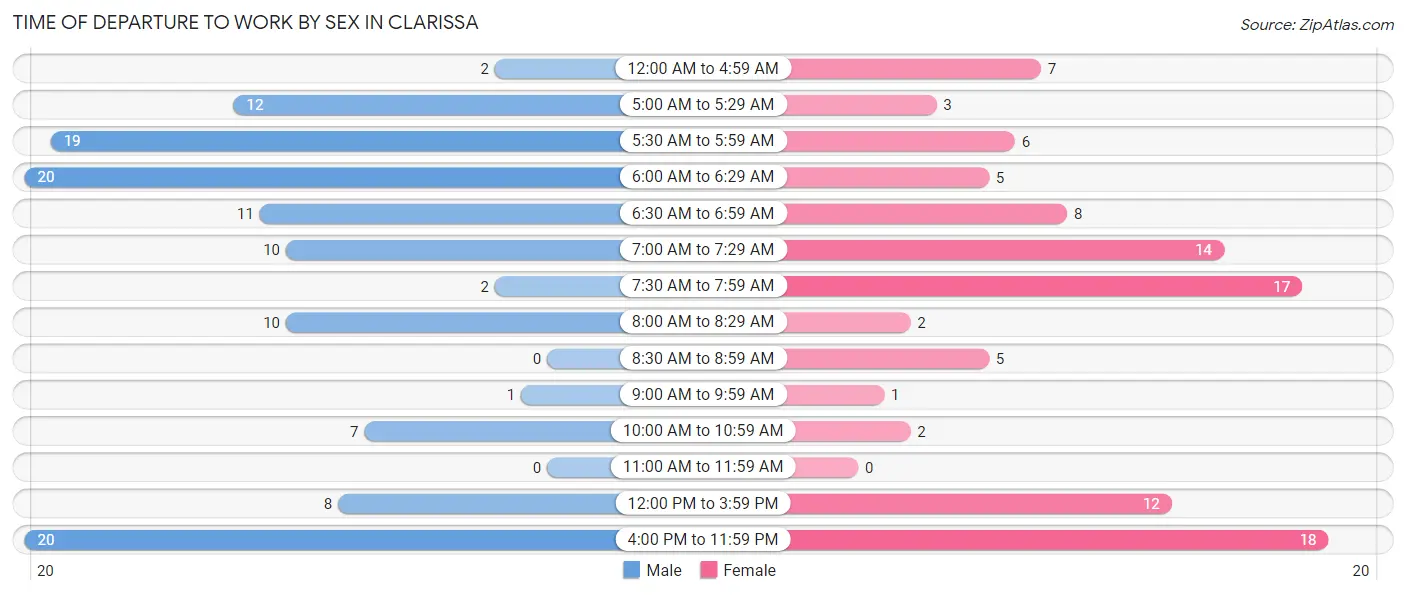
| Time of Departure | Male | Female |
| 12:00 AM to 4:59 AM | 2 (1.6%) | 7 (7.0%) |
| 5:00 AM to 5:29 AM | 12 (9.8%) | 3 (3.0%) |
| 5:30 AM to 5:59 AM | 19 (15.6%) | 6 (6.0%) |
| 6:00 AM to 6:29 AM | 20 (16.4%) | 5 (5.0%) |
| 6:30 AM to 6:59 AM | 11 (9.0%) | 8 (8.0%) |
| 7:00 AM to 7:29 AM | 10 (8.2%) | 14 (14.0%) |
| 7:30 AM to 7:59 AM | 2 (1.6%) | 17 (17.0%) |
| 8:00 AM to 8:29 AM | 10 (8.2%) | 2 (2.0%) |
| 8:30 AM to 8:59 AM | 0 (0.0%) | 5 (5.0%) |
| 9:00 AM to 9:59 AM | 1 (0.8%) | 1 (1.0%) |
| 10:00 AM to 10:59 AM | 7 (5.7%) | 2 (2.0%) |
| 11:00 AM to 11:59 AM | 0 (0.0%) | 0 (0.0%) |
| 12:00 PM to 3:59 PM | 8 (6.6%) | 12 (12.0%) |
| 4:00 PM to 11:59 PM | 20 (16.4%) | 18 (18.0%) |
| Total | 122 (100.0%) | 100 (100.0%) |
Housing Occupancy in Clarissa
Occupancy by Ownership in Clarissa
Of the total 301 dwellings in Clarissa, owner-occupied units account for 225 (74.8%), while renter-occupied units make up 76 (25.3%).
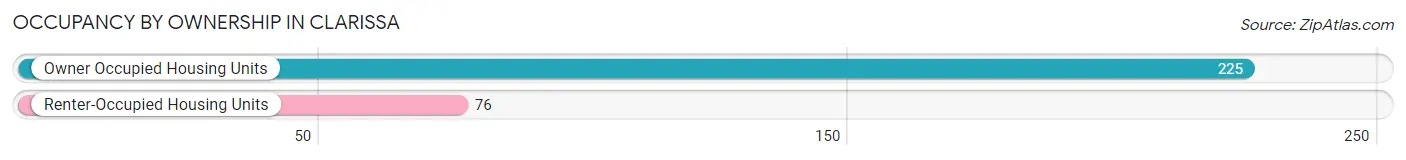
| Occupancy | # Housing Units | % Housing Units |
| Owner Occupied Housing Units | 225 | 74.8% |
| Renter-Occupied Housing Units | 76 | 25.3% |
| Total Occupied Housing Units | 301 | 100.0% |
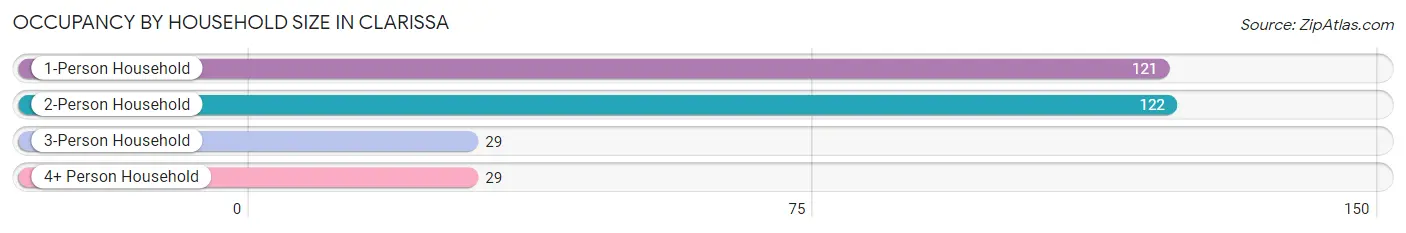
Occupancy by Household Size in Clarissa
| Household Size | # Housing Units | % Housing Units |
| 1-Person Household | 121 | 40.2% |
| 2-Person Household | 122 | 40.5% |
| 3-Person Household | 29 | 9.6% |
| 4+ Person Household | 29 | 9.6% |
| Total Housing Units | 301 | 100.0% |
Occupancy by Ownership by Household Size in Clarissa
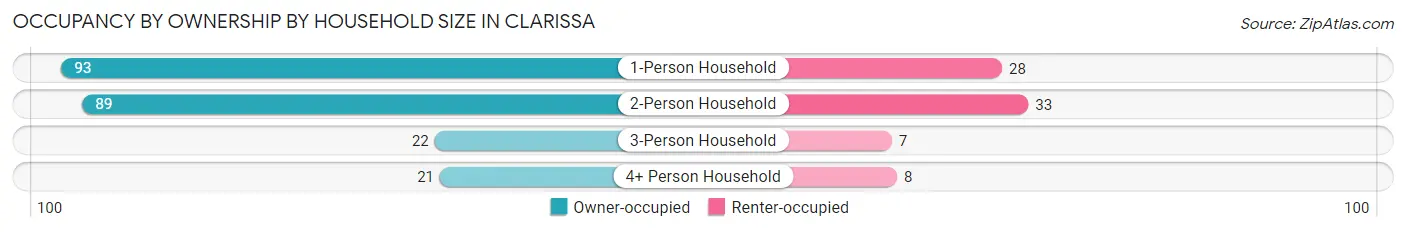
| Household Size | Owner-occupied | Renter-occupied |
| 1-Person Household | 93 (76.9%) | 28 (23.1%) |
| 2-Person Household | 89 (73.0%) | 33 (27.1%) |
| 3-Person Household | 22 (75.9%) | 7 (24.1%) |
| 4+ Person Household | 21 (72.4%) | 8 (27.6%) |
| Total Housing Units | 225 (74.8%) | 76 (25.3%) |
Occupancy by Educational Attainment in Clarissa
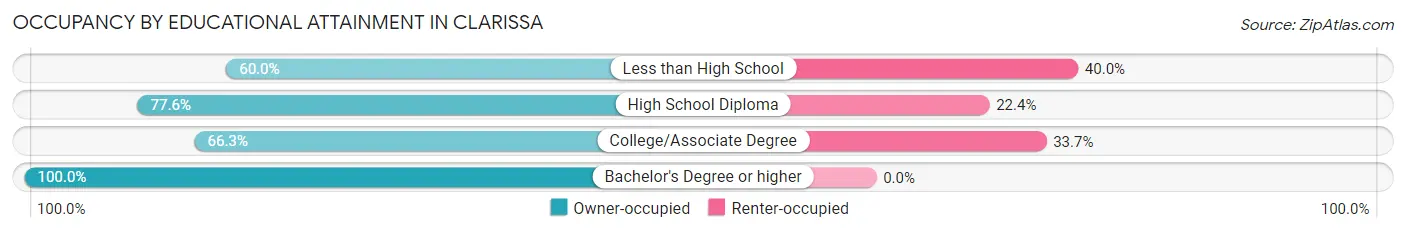
| Household Size | Owner-occupied | Renter-occupied |
| Less than High School | 15 (60.0%) | 10 (40.0%) |
| High School Diploma | 128 (77.6%) | 37 (22.4%) |
| College/Associate Degree | 57 (66.3%) | 29 (33.7%) |
| Bachelor's Degree or higher | 25 (100.0%) | 0 (0.0%) |
Occupancy by Age of Householder in Clarissa
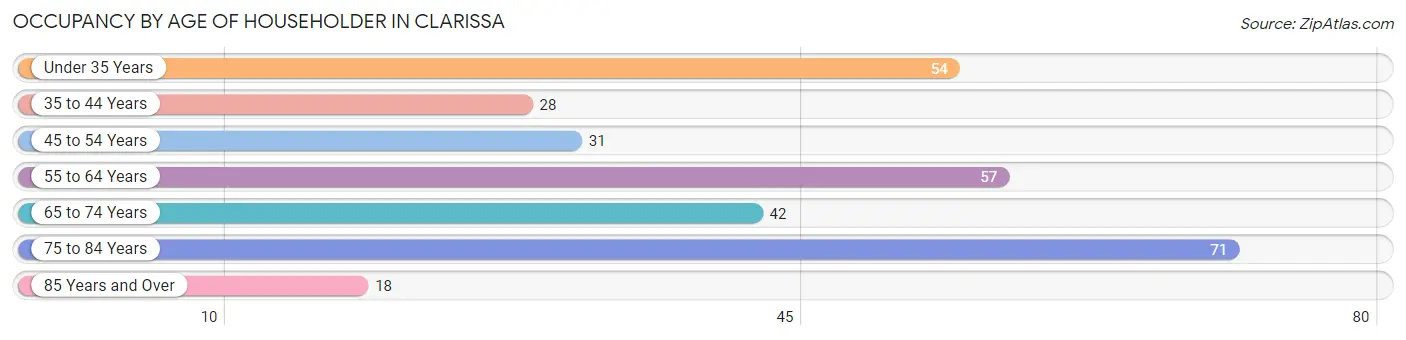
| Age Bracket | # Households | % Households |
| Under 35 Years | 54 | 17.9% |
| 35 to 44 Years | 28 | 9.3% |
| 45 to 54 Years | 31 | 10.3% |
| 55 to 64 Years | 57 | 18.9% |
| 65 to 74 Years | 42 | 14.0% |
| 75 to 84 Years | 71 | 23.6% |
| 85 Years and Over | 18 | 6.0% |
| Total | 301 | 100.0% |
Housing Finances in Clarissa
Median Income by Occupancy in Clarissa
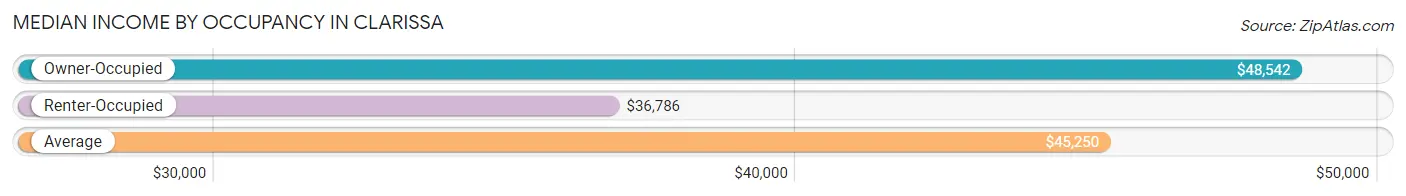
| Occupancy Type | # Households | Median Income |
| Owner-Occupied | 225 (74.8%) | $48,542 |
| Renter-Occupied | 76 (25.3%) | $36,786 |
| Average | 301 (100.0%) | $45,250 |
Occupancy by Householder Income Bracket in Clarissa
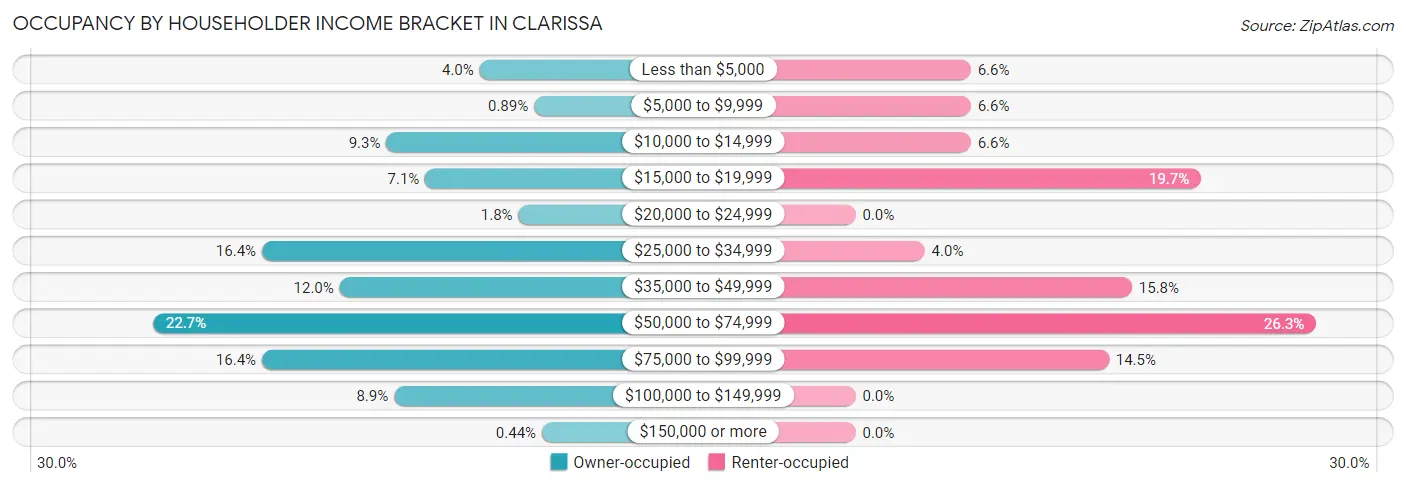
| Income Bracket | Owner-occupied | Renter-occupied |
| Less than $5,000 | 9 (4.0%) | 5 (6.6%) |
| $5,000 to $9,999 | 2 (0.9%) | 5 (6.6%) |
| $10,000 to $14,999 | 21 (9.3%) | 5 (6.6%) |
| $15,000 to $19,999 | 16 (7.1%) | 15 (19.7%) |
| $20,000 to $24,999 | 4 (1.8%) | 0 (0.0%) |
| $25,000 to $34,999 | 37 (16.4%) | 3 (4.0%) |
| $35,000 to $49,999 | 27 (12.0%) | 12 (15.8%) |
| $50,000 to $74,999 | 51 (22.7%) | 20 (26.3%) |
| $75,000 to $99,999 | 37 (16.4%) | 11 (14.5%) |
| $100,000 to $149,999 | 20 (8.9%) | 0 (0.0%) |
| $150,000 or more | 1 (0.4%) | 0 (0.0%) |
| Total | 225 (100.0%) | 76 (100.0%) |
Monthly Housing Cost Tiers in Clarissa
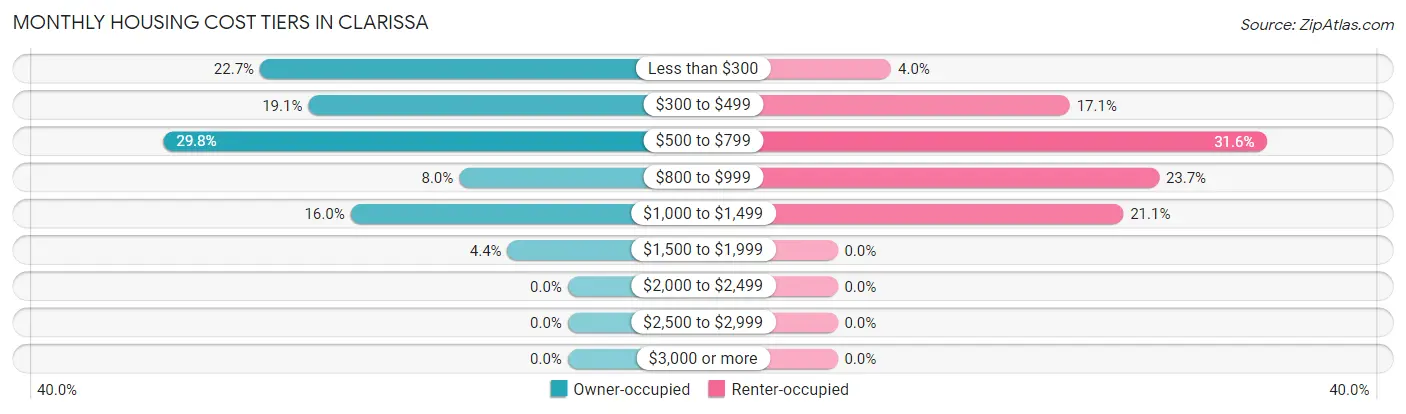
| Monthly Cost | Owner-occupied | Renter-occupied |
| Less than $300 | 51 (22.7%) | 3 (4.0%) |
| $300 to $499 | 43 (19.1%) | 13 (17.1%) |
| $500 to $799 | 67 (29.8%) | 24 (31.6%) |
| $800 to $999 | 18 (8.0%) | 18 (23.7%) |
| $1,000 to $1,499 | 36 (16.0%) | 16 (21.0%) |
| $1,500 to $1,999 | 10 (4.4%) | 0 (0.0%) |
| $2,000 to $2,499 | 0 (0.0%) | 0 (0.0%) |
| $2,500 to $2,999 | 0 (0.0%) | 0 (0.0%) |
| $3,000 or more | 0 (0.0%) | 0 (0.0%) |
| Total | 225 (100.0%) | 76 (100.0%) |
Physical Housing Characteristics in Clarissa
Housing Structures in Clarissa
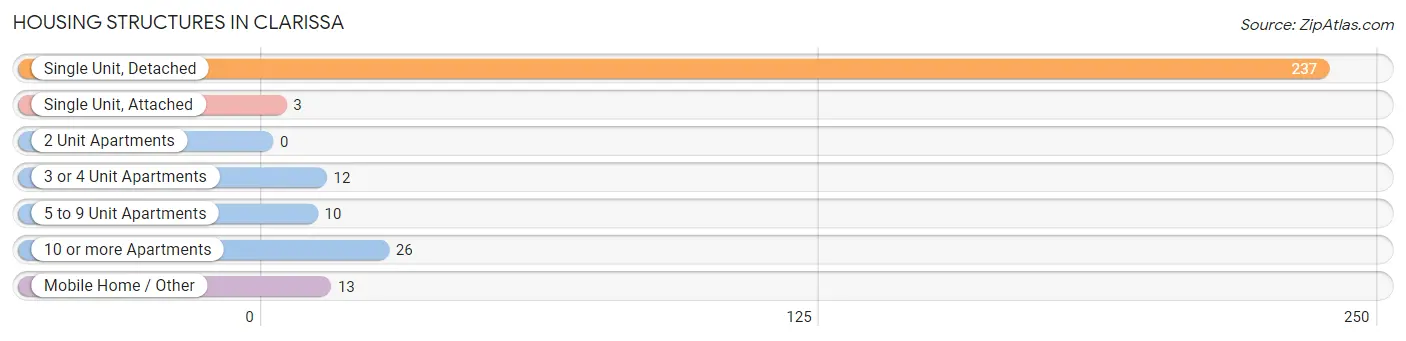
| Structure Type | # Housing Units | % Housing Units |
| Single Unit, Detached | 237 | 78.7% |
| Single Unit, Attached | 3 | 1.0% |
| 2 Unit Apartments | 0 | 0.0% |
| 3 or 4 Unit Apartments | 12 | 4.0% |
| 5 to 9 Unit Apartments | 10 | 3.3% |
| 10 or more Apartments | 26 | 8.6% |
| Mobile Home / Other | 13 | 4.3% |
| Total | 301 | 100.0% |
Housing Structures by Occupancy in Clarissa
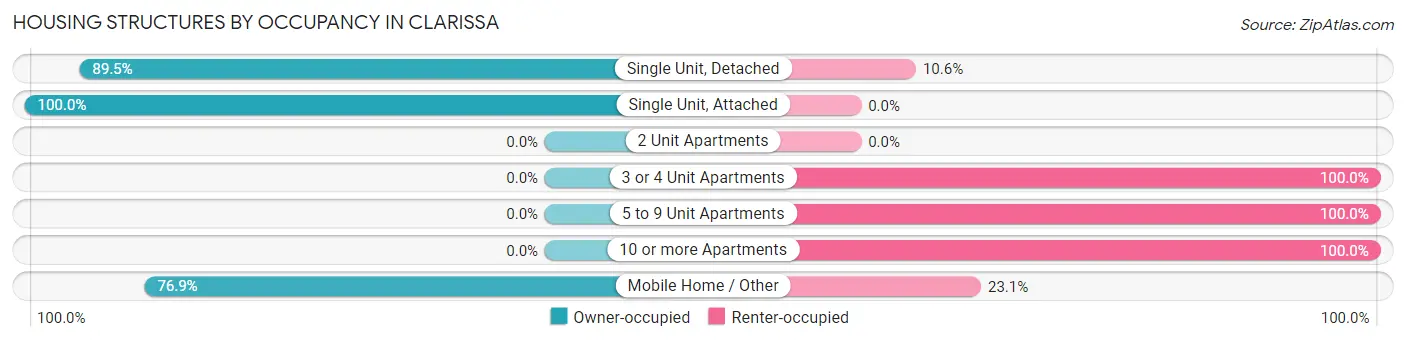
| Structure Type | Owner-occupied | Renter-occupied |
| Single Unit, Detached | 212 (89.4%) | 25 (10.5%) |
| Single Unit, Attached | 3 (100.0%) | 0 (0.0%) |
| 2 Unit Apartments | 0 (0.0%) | 0 (0.0%) |
| 3 or 4 Unit Apartments | 0 (0.0%) | 12 (100.0%) |
| 5 to 9 Unit Apartments | 0 (0.0%) | 10 (100.0%) |
| 10 or more Apartments | 0 (0.0%) | 26 (100.0%) |
| Mobile Home / Other | 10 (76.9%) | 3 (23.1%) |
| Total | 225 (74.8%) | 76 (25.3%) |
Housing Structures by Number of Rooms in Clarissa
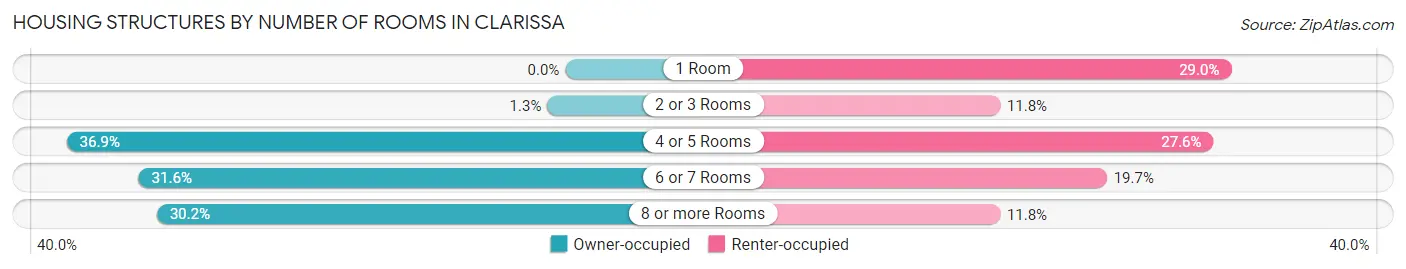
| Number of Rooms | Owner-occupied | Renter-occupied |
| 1 Room | 0 (0.0%) | 22 (28.9%) |
| 2 or 3 Rooms | 3 (1.3%) | 9 (11.8%) |
| 4 or 5 Rooms | 83 (36.9%) | 21 (27.6%) |
| 6 or 7 Rooms | 71 (31.6%) | 15 (19.7%) |
| 8 or more Rooms | 68 (30.2%) | 9 (11.8%) |
| Total | 225 (100.0%) | 76 (100.0%) |
Housing Structure by Heating Type in Clarissa
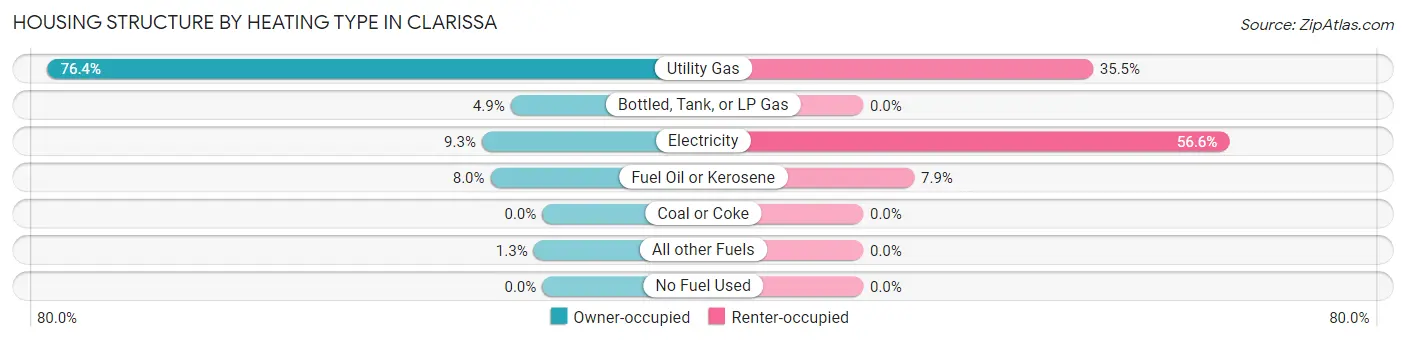
| Heating Type | Owner-occupied | Renter-occupied |
| Utility Gas | 172 (76.4%) | 27 (35.5%) |
| Bottled, Tank, or LP Gas | 11 (4.9%) | 0 (0.0%) |
| Electricity | 21 (9.3%) | 43 (56.6%) |
| Fuel Oil or Kerosene | 18 (8.0%) | 6 (7.9%) |
| Coal or Coke | 0 (0.0%) | 0 (0.0%) |
| All other Fuels | 3 (1.3%) | 0 (0.0%) |
| No Fuel Used | 0 (0.0%) | 0 (0.0%) |
| Total | 225 (100.0%) | 76 (100.0%) |
Household Vehicle Usage in Clarissa
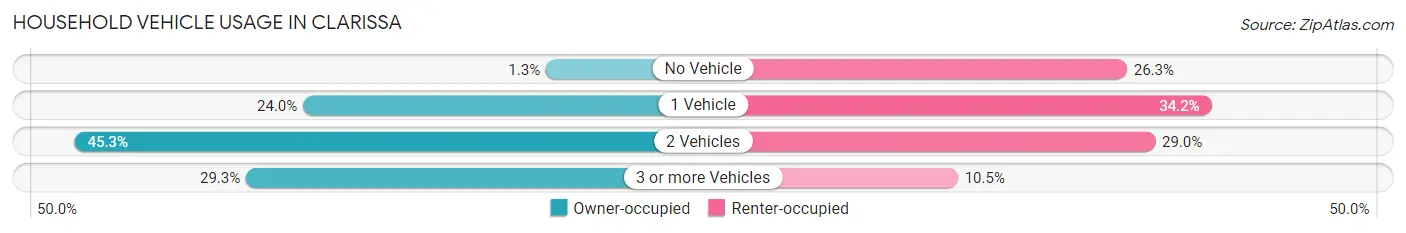
| Vehicles per Household | Owner-occupied | Renter-occupied |
| No Vehicle | 3 (1.3%) | 20 (26.3%) |
| 1 Vehicle | 54 (24.0%) | 26 (34.2%) |
| 2 Vehicles | 102 (45.3%) | 22 (28.9%) |
| 3 or more Vehicles | 66 (29.3%) | 8 (10.5%) |
| Total | 225 (100.0%) | 76 (100.0%) |
Real Estate & Mortgages in Clarissa
Real Estate and Mortgage Overview in Clarissa
| Characteristic | Without Mortgage | With Mortgage |
| Housing Units | 142 | 83 |
| Median Property Value | $85,000 | $113,300 |
| Median Household Income | $34,167 | $1 |
| Monthly Housing Costs | $400 | $0 |
| Real Estate Taxes | $911 | $0 |
Property Value by Mortgage Status in Clarissa
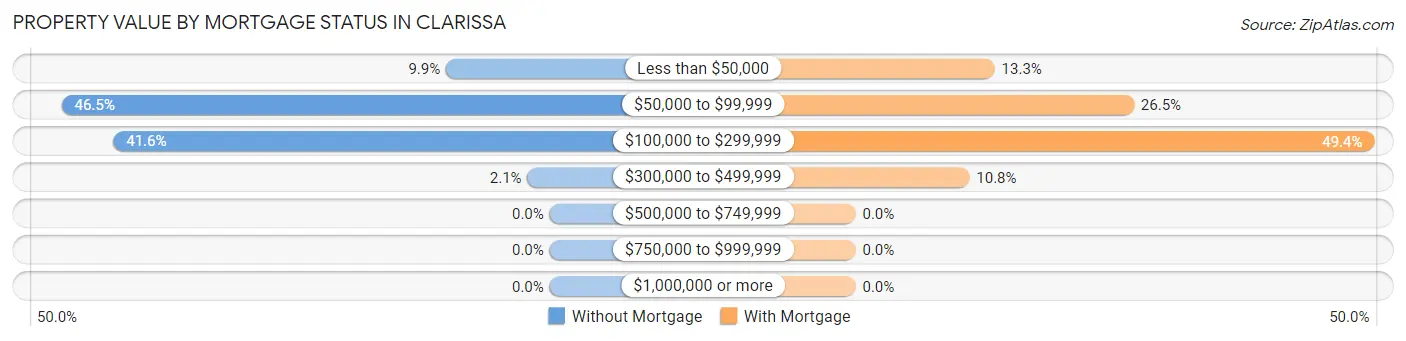
| Property Value | Without Mortgage | With Mortgage |
| Less than $50,000 | 14 (9.9%) | 11 (13.3%) |
| $50,000 to $99,999 | 66 (46.5%) | 22 (26.5%) |
| $100,000 to $299,999 | 59 (41.5%) | 41 (49.4%) |
| $300,000 to $499,999 | 3 (2.1%) | 9 (10.8%) |
| $500,000 to $749,999 | 0 (0.0%) | 0 (0.0%) |
| $750,000 to $999,999 | 0 (0.0%) | 0 (0.0%) |
| $1,000,000 or more | 0 (0.0%) | 0 (0.0%) |
| Total | 142 (100.0%) | 83 (100.0%) |
Household Income by Mortgage Status in Clarissa
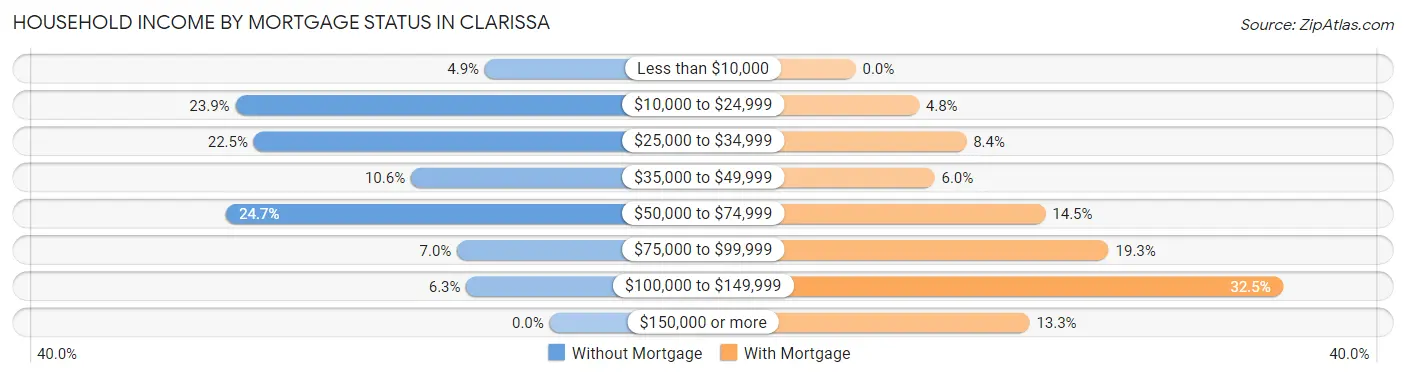
| Household Income | Without Mortgage | With Mortgage |
| Less than $10,000 | 7 (4.9%) | 0 (0.0%) |
| $10,000 to $24,999 | 34 (23.9%) | 4 (4.8%) |
| $25,000 to $34,999 | 32 (22.5%) | 7 (8.4%) |
| $35,000 to $49,999 | 15 (10.6%) | 5 (6.0%) |
| $50,000 to $74,999 | 35 (24.6%) | 12 (14.5%) |
| $75,000 to $99,999 | 10 (7.0%) | 16 (19.3%) |
| $100,000 to $149,999 | 9 (6.3%) | 27 (32.5%) |
| $150,000 or more | 0 (0.0%) | 11 (13.3%) |
| Total | 142 (100.0%) | 83 (100.0%) |
Property Value to Household Income Ratio in Clarissa
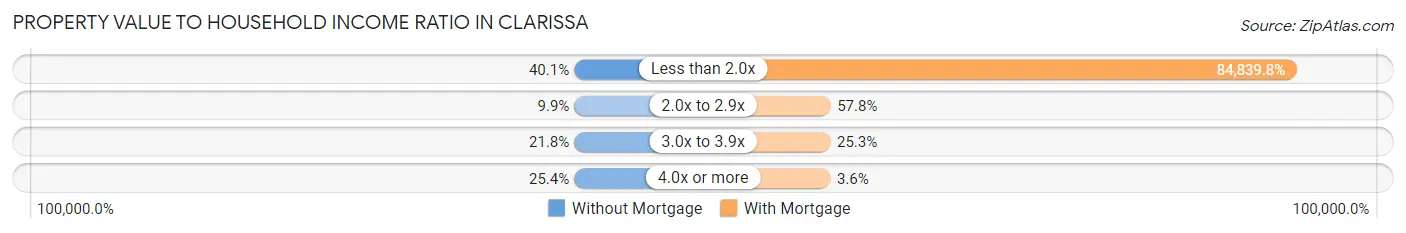
| Value-to-Income Ratio | Without Mortgage | With Mortgage |
| Less than 2.0x | 57 (40.1%) | 70,417 (84,839.8%) |
| 2.0x to 2.9x | 14 (9.9%) | 48 (57.8%) |
| 3.0x to 3.9x | 31 (21.8%) | 21 (25.3%) |
| 4.0x or more | 36 (25.4%) | 3 (3.6%) |
| Total | 142 (100.0%) | 83 (100.0%) |
Real Estate Taxes by Mortgage Status in Clarissa
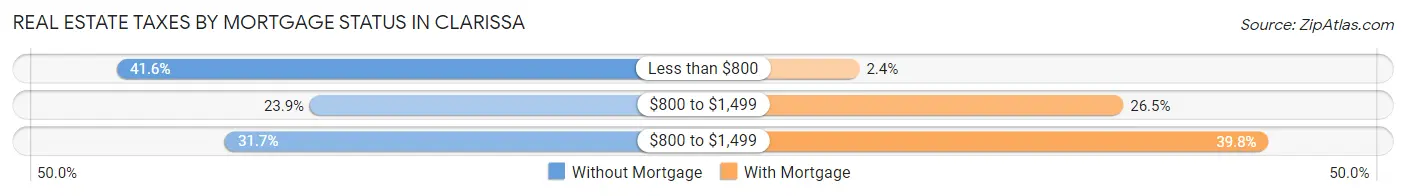
| Property Taxes | Without Mortgage | With Mortgage |
| Less than $800 | 59 (41.5%) | 2 (2.4%) |
| $800 to $1,499 | 34 (23.9%) | 22 (26.5%) |
| $800 to $1,499 | 45 (31.7%) | 33 (39.8%) |
| Total | 142 (100.0%) | 83 (100.0%) |
Health & Disability in Clarissa
Health Insurance Coverage by Age in Clarissa
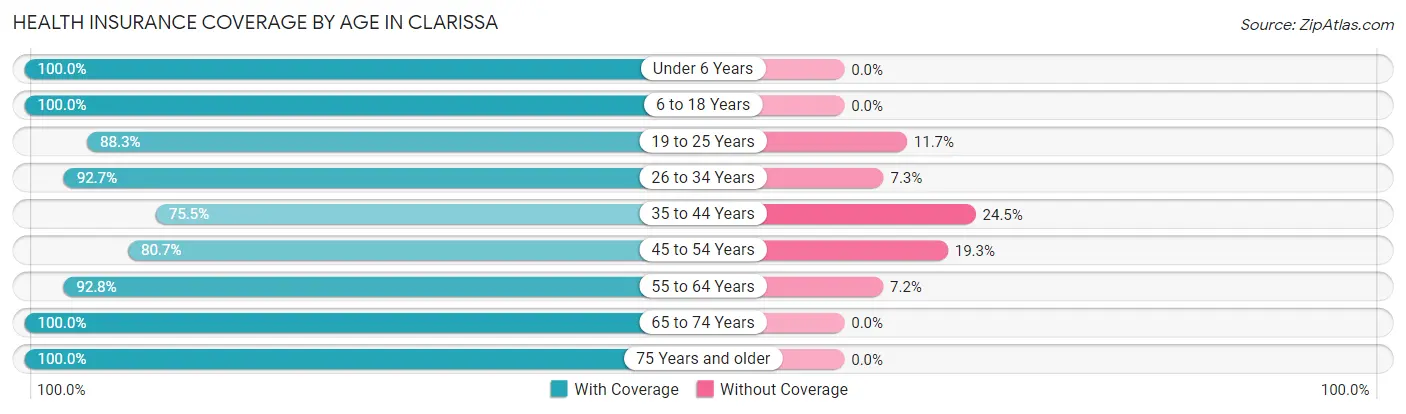
| Age Bracket | With Coverage | Without Coverage |
| Under 6 Years | 29 (100.0%) | 0 (0.0%) |
| 6 to 18 Years | 106 (100.0%) | 0 (0.0%) |
| 19 to 25 Years | 53 (88.3%) | 7 (11.7%) |
| 26 to 34 Years | 38 (92.7%) | 3 (7.3%) |
| 35 to 44 Years | 37 (75.5%) | 12 (24.5%) |
| 45 to 54 Years | 46 (80.7%) | 11 (19.3%) |
| 55 to 64 Years | 77 (92.8%) | 6 (7.2%) |
| 65 to 74 Years | 73 (100.0%) | 0 (0.0%) |
| 75 Years and older | 118 (100.0%) | 0 (0.0%) |
| Total | 577 (93.7%) | 39 (6.3%) |
Health Insurance Coverage by Citizenship Status in Clarissa
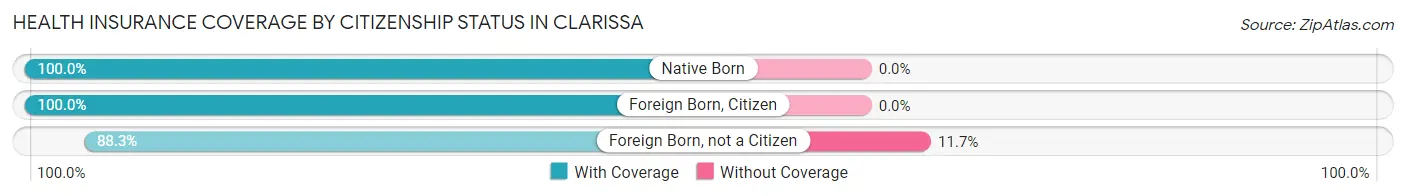
| Citizenship Status | With Coverage | Without Coverage |
| Native Born | 29 (100.0%) | 0 (0.0%) |
| Foreign Born, Citizen | 106 (100.0%) | 0 (0.0%) |
| Foreign Born, not a Citizen | 53 (88.3%) | 7 (11.7%) |
Health Insurance Coverage by Household Income in Clarissa
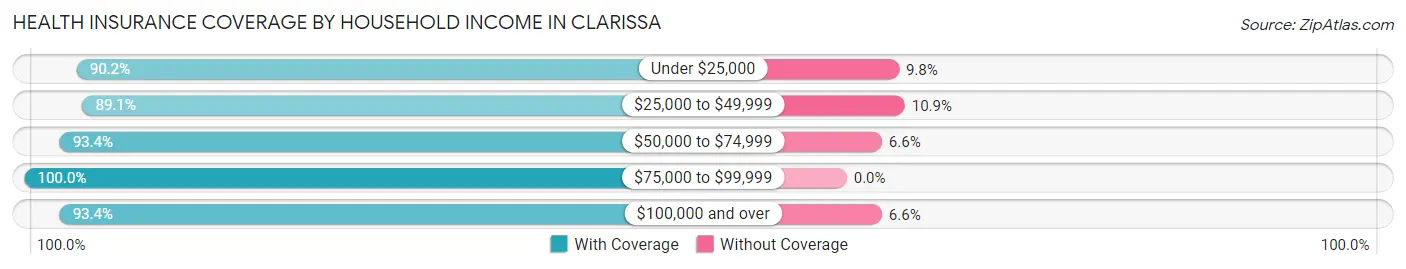
| Household Income | With Coverage | Without Coverage |
| Under $25,000 | 83 (90.2%) | 9 (9.8%) |
| $25,000 to $49,999 | 123 (89.1%) | 15 (10.9%) |
| $50,000 to $74,999 | 142 (93.4%) | 10 (6.6%) |
| $75,000 to $99,999 | 157 (100.0%) | 0 (0.0%) |
| $100,000 and over | 71 (93.4%) | 5 (6.6%) |
Public vs Private Health Insurance Coverage by Age in Clarissa
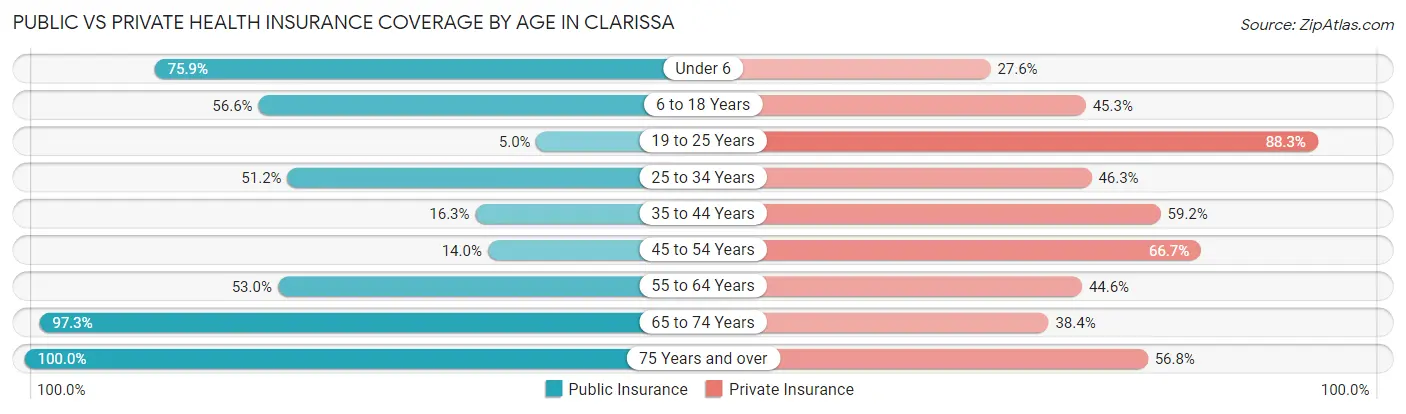
| Age Bracket | Public Insurance | Private Insurance |
| Under 6 | 22 (75.9%) | 8 (27.6%) |
| 6 to 18 Years | 60 (56.6%) | 48 (45.3%) |
| 19 to 25 Years | 3 (5.0%) | 53 (88.3%) |
| 25 to 34 Years | 21 (51.2%) | 19 (46.3%) |
| 35 to 44 Years | 8 (16.3%) | 29 (59.2%) |
| 45 to 54 Years | 8 (14.0%) | 38 (66.7%) |
| 55 to 64 Years | 44 (53.0%) | 37 (44.6%) |
| 65 to 74 Years | 71 (97.3%) | 28 (38.4%) |
| 75 Years and over | 118 (100.0%) | 67 (56.8%) |
| Total | 355 (57.6%) | 327 (53.1%) |
Disability Status by Sex by Age in Clarissa
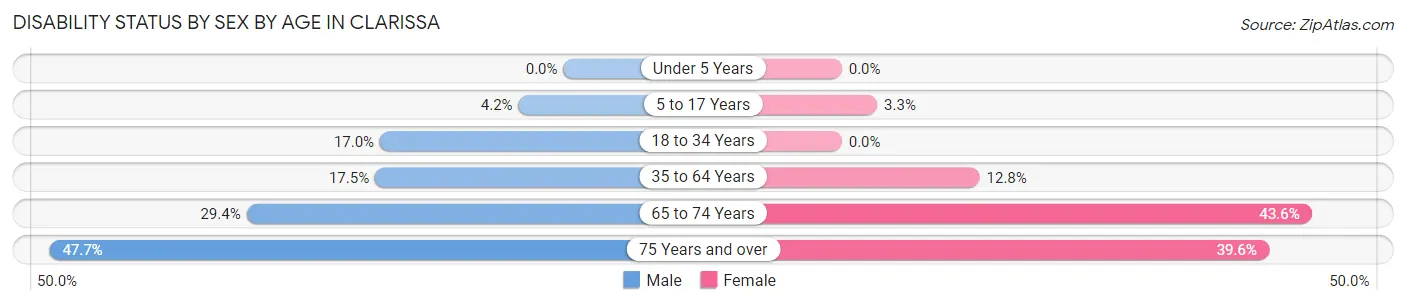
| Age Bracket | Male | Female |
| Under 5 Years | 0 (0.0%) | 0 (0.0%) |
| 5 to 17 Years | 2 (4.2%) | 2 (3.3%) |
| 18 to 34 Years | 8 (17.0%) | 0 (0.0%) |
| 35 to 64 Years | 18 (17.5%) | 11 (12.8%) |
| 65 to 74 Years | 10 (29.4%) | 17 (43.6%) |
| 75 Years and over | 31 (47.7%) | 21 (39.6%) |
Disability Class by Sex by Age in Clarissa
Disability Class: Hearing Difficulty
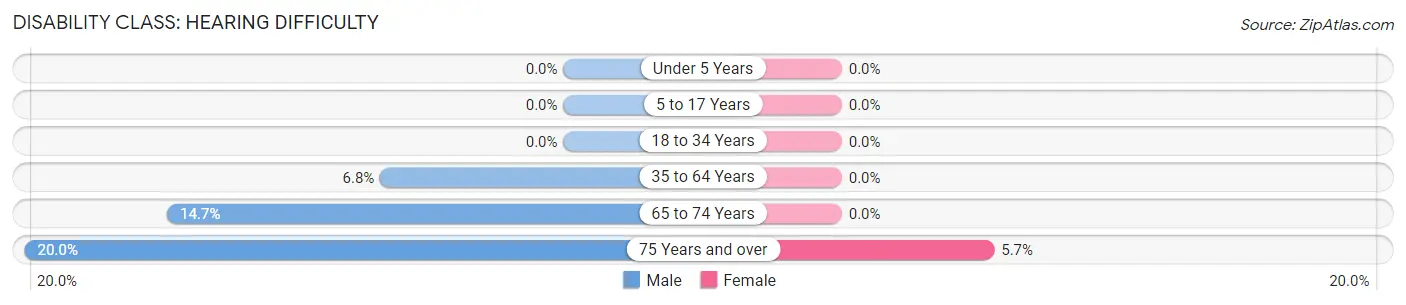
| Age Bracket | Male | Female |
| Under 5 Years | 0 (0.0%) | 0 (0.0%) |
| 5 to 17 Years | 0 (0.0%) | 0 (0.0%) |
| 18 to 34 Years | 0 (0.0%) | 0 (0.0%) |
| 35 to 64 Years | 7 (6.8%) | 0 (0.0%) |
| 65 to 74 Years | 5 (14.7%) | 0 (0.0%) |
| 75 Years and over | 13 (20.0%) | 3 (5.7%) |
Disability Class: Vision Difficulty
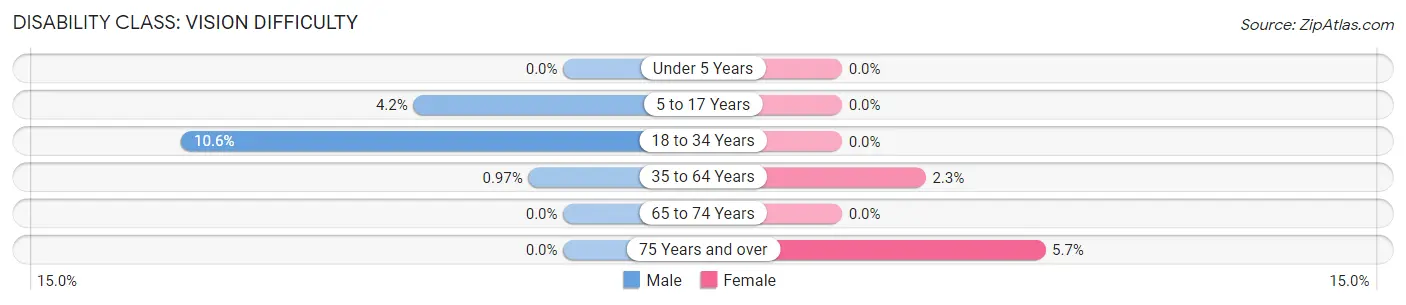
| Age Bracket | Male | Female |
| Under 5 Years | 0 (0.0%) | 0 (0.0%) |
| 5 to 17 Years | 2 (4.2%) | 0 (0.0%) |
| 18 to 34 Years | 5 (10.6%) | 0 (0.0%) |
| 35 to 64 Years | 1 (1.0%) | 2 (2.3%) |
| 65 to 74 Years | 0 (0.0%) | 0 (0.0%) |
| 75 Years and over | 0 (0.0%) | 3 (5.7%) |
Disability Class: Cognitive Difficulty

| Age Bracket | Male | Female |
| 5 to 17 Years | 0 (0.0%) | 2 (3.3%) |
| 18 to 34 Years | 3 (6.4%) | 0 (0.0%) |
| 35 to 64 Years | 1 (1.0%) | 4 (4.6%) |
| 65 to 74 Years | 4 (11.8%) | 12 (30.8%) |
| 75 Years and over | 12 (18.5%) | 10 (18.9%) |
Disability Class: Ambulatory Difficulty
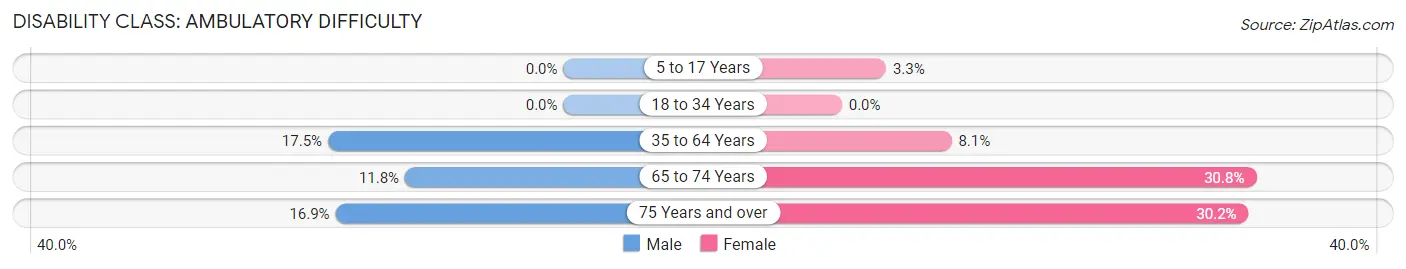
| Age Bracket | Male | Female |
| 5 to 17 Years | 0 (0.0%) | 2 (3.3%) |
| 18 to 34 Years | 0 (0.0%) | 0 (0.0%) |
| 35 to 64 Years | 18 (17.5%) | 7 (8.1%) |
| 65 to 74 Years | 4 (11.8%) | 12 (30.8%) |
| 75 Years and over | 11 (16.9%) | 16 (30.2%) |
Disability Class: Self-Care Difficulty
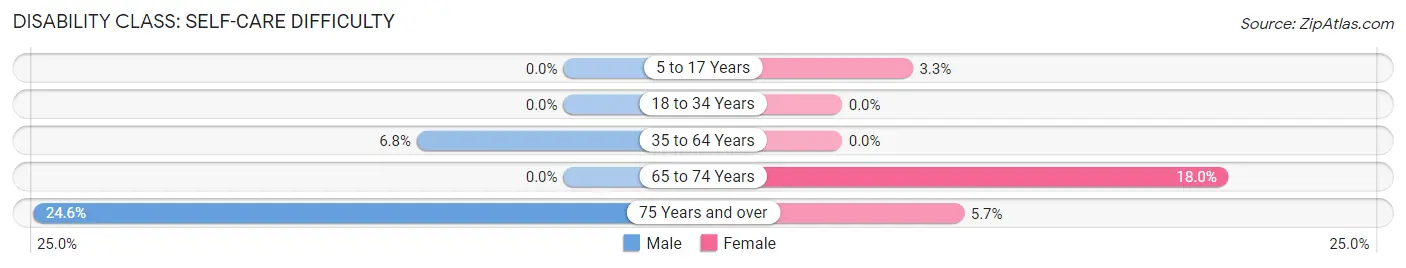
| Age Bracket | Male | Female |
| 5 to 17 Years | 0 (0.0%) | 2 (3.3%) |
| 18 to 34 Years | 0 (0.0%) | 0 (0.0%) |
| 35 to 64 Years | 7 (6.8%) | 0 (0.0%) |
| 65 to 74 Years | 0 (0.0%) | 7 (17.9%) |
| 75 Years and over | 16 (24.6%) | 3 (5.7%) |
Technology Access in Clarissa
Computing Device Access in Clarissa
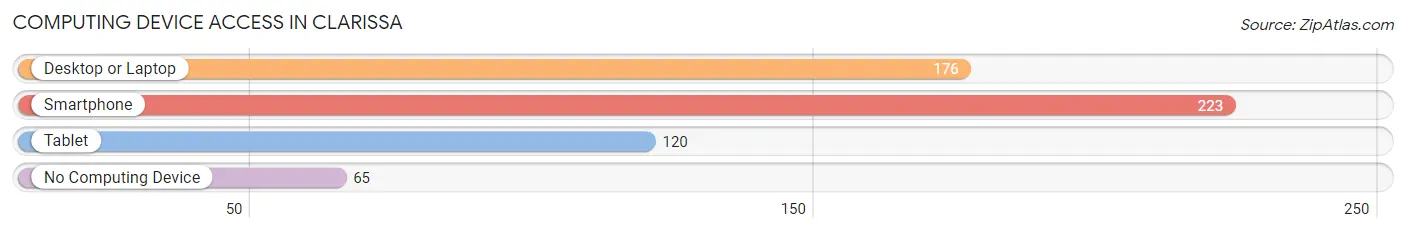
| Device Type | # Households | % Households |
| Desktop or Laptop | 176 | 58.5% |
| Smartphone | 223 | 74.1% |
| Tablet | 120 | 39.9% |
| No Computing Device | 65 | 21.6% |
| Total | 301 | 100.0% |
Internet Access in Clarissa
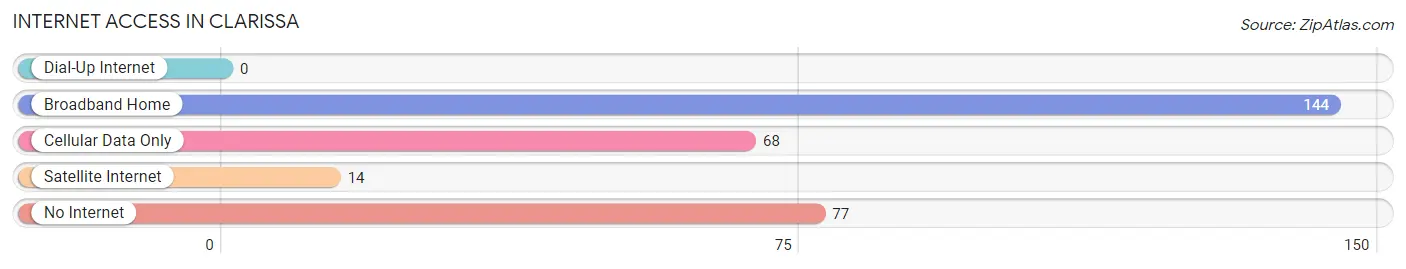
| Internet Type | # Households | % Households |
| Dial-Up Internet | 0 | 0.0% |
| Broadband Home | 144 | 47.8% |
| Cellular Data Only | 68 | 22.6% |
| Satellite Internet | 14 | 4.6% |
| No Internet | 77 | 25.6% |
| Total | 301 | 100.0% |
Clarissa Summary
Clarissa, Minnesota is a small city located in Todd County, in the central part of the state. It is situated on the banks of the Long Prairie River, and is surrounded by rolling hills and farmland. The city has a population of just over 1,000 people, and is a popular destination for outdoor recreation and small-town charm.
Geography
Clarissa is located in the central part of Minnesota, in Todd County. It is situated on the banks of the Long Prairie River, and is surrounded by rolling hills and farmland. The city is located about 30 miles north of St. Cloud, and about 90 miles northwest of Minneapolis. The city is located in the Central Lakes region of Minnesota, and is part of the St. Cloud Metropolitan Statistical Area.
The city has a total area of 1.2 square miles, all of which is land. The terrain is mostly flat, with some rolling hills in the surrounding area. The climate is humid continental, with cold winters and warm summers.
History
The area that is now Clarissa was first settled in the late 1800s by German and Scandinavian immigrants. The city was officially incorporated in 1891, and was named after Clarissa, the daughter of one of the city’s founders.
In the early 1900s, the city was a thriving agricultural center, with many farms and businesses in the area. The city was also home to a number of small manufacturing businesses, including a flour mill, a creamery, and a furniture factory.
In the 1950s, the city began to decline as many of the businesses and farms closed. The city’s population also began to decline, and by the 1970s, the city was in a state of decline.
In the 1980s, the city began to experience a resurgence, as new businesses and industries moved into the area. The city also began to attract new residents, and the population began to grow again.
Economy
The economy of Clarissa is largely based on agriculture and tourism. The city is home to a number of small businesses, including restaurants, retail stores, and service providers. The city is also home to a number of manufacturing businesses, including a furniture factory and a flour mill.
The city is also home to a number of tourist attractions, including the Clarissa Historical Museum, the Clarissa City Park, and the Clarissa Golf Course. The city is also home to a number of outdoor recreation opportunities, including fishing, hunting, and camping.
Demographics
As of the 2010 census, the population of Clarissa was 1,037. The racial makeup of the city was 97.3% White, 0.3% African American, 0.2% Native American, 0.2% Asian, 0.1% Pacific Islander, 0.7% from other races, and 1.2% from two or more races. Hispanic or Latino of any race were 1.7% of the population.
The median household income in Clarissa was $41,250, and the median family income was $48,750. The per capita income for the city was $19,945. About 8.3% of families and 10.2% of the population were below the poverty line, including 14.2% of those under age 18 and 8.3% of those age 65 or over.
Conclusion
Clarissa, Minnesota is a small city located in Todd County, in the central part of the state. It is situated on the banks of the Long Prairie River, and is surrounded by rolling hills and farmland. The city has a population of just over 1,000 people, and is a popular destination for outdoor recreation and small-town charm. The economy of Clarissa is largely based on agriculture and tourism, and the city is home to a number of small businesses, manufacturing businesses, and tourist attractions. The population of Clarissa is mostly White, with a small percentage of African American, Native American, Asian, and Pacific Islander residents. The median household income in Clarissa is $41,250, and the per capita income is $19,945.
Common Questions
What is Per Capita Income in Clarissa?
Per Capita income in Clarissa is $24,414.
What is the Median Family Income in Clarissa?
Median Family Income in Clarissa is $64,412.
What is the Median Household income in Clarissa?
Median Household Income in Clarissa is $45,250.
What is Income or Wage Gap in Clarissa?
Income or Wage Gap in Clarissa is 5.3%.
Women in Clarissa earn 94.7 cents for every dollar earned by a man.
What is Inequality or Gini Index in Clarissa?
Inequality or Gini Index in Clarissa is 0.38.
What is the Total Population of Clarissa?
Total Population of Clarissa is 676.
What is the Total Male Population of Clarissa?
Total Male Population of Clarissa is 324.
What is the Total Female Population of Clarissa?
Total Female Population of Clarissa is 352.
What is the Ratio of Males per 100 Females in Clarissa?
There are 92.05 Males per 100 Females in Clarissa.
What is the Ratio of Females per 100 Males in Clarissa?
There are 108.64 Females per 100 Males in Clarissa.
What is the Median Population Age in Clarissa?
Median Population Age in Clarissa is 51.4 Years.
What is the Average Family Size in Clarissa
Average Family Size in Clarissa is 2.8 People.
What is the Average Household Size in Clarissa
Average Household Size in Clarissa is 2.0 People.
How Large is the Labor Force in Clarissa?
There are 258 People in the Labor Forcein in Clarissa.
What is the Percentage of People in the Labor Force in Clarissa?
46.7% of People are in the Labor Force in Clarissa.
What is the Unemployment Rate in Clarissa?
Unemployment Rate in Clarissa is 7.8%.