Oronoco, MN Map & Demographics
Oronoco Map
Oronoco Overview
$55,753
PER CAPITA INCOME
$165,208
AVG FAMILY INCOME
$153,393
AVG HOUSEHOLD INCOME
15.5%
WAGE / INCOME GAP [ % ]
84.5¢/ $1
WAGE / INCOME GAP [ $ ]
0.38
INEQUALITY / GINI INDEX
1,696
TOTAL POPULATION
836
MALE POPULATION
860
FEMALE POPULATION
97.21
MALES / 100 FEMALES
102.87
FEMALES / 100 MALES
36.3
MEDIAN AGE
3.4
AVG FAMILY SIZE
3.1
AVG HOUSEHOLD SIZE
854
LABOR FORCE [ PEOPLE ]
76.9%
PERCENT IN LABOR FORCE
0.4%
UNEMPLOYMENT RATE
Oronoco Zip Codes
Oronoco Area Codes
Income in Oronoco
Income Overview in Oronoco
Per Capita Income in Oronoco is $55,753, while median incomes of families and households are $165,208 and $153,393 respectively.
| Characteristic | Number | Measure |
| Per Capita Income | 1,696 | $55,753 |
| Median Family Income | 469 | $165,208 |
| Mean Family Income | 469 | $186,448 |
| Median Household Income | 541 | $153,393 |
| Mean Household Income | 541 | $171,402 |
| Income Deficit | 469 | $0 |
| Wage / Income Gap (%) | 1,696 | 15.53% |
| Wage / Income Gap ($) | 1,696 | 84.47¢ per $1 |
| Gini / Inequality Index | 1,696 | 0.38 |
Earnings by Sex in Oronoco
Average Earnings in Oronoco are $75,450, $80,089 for men and $67,652 for women, a difference of 15.5%.

| Sex | Number | Average Earnings |
| Male | 491 (54.9%) | $80,089 |
| Female | 404 (45.1%) | $67,652 |
| Total | 895 (100.0%) | $75,450 |
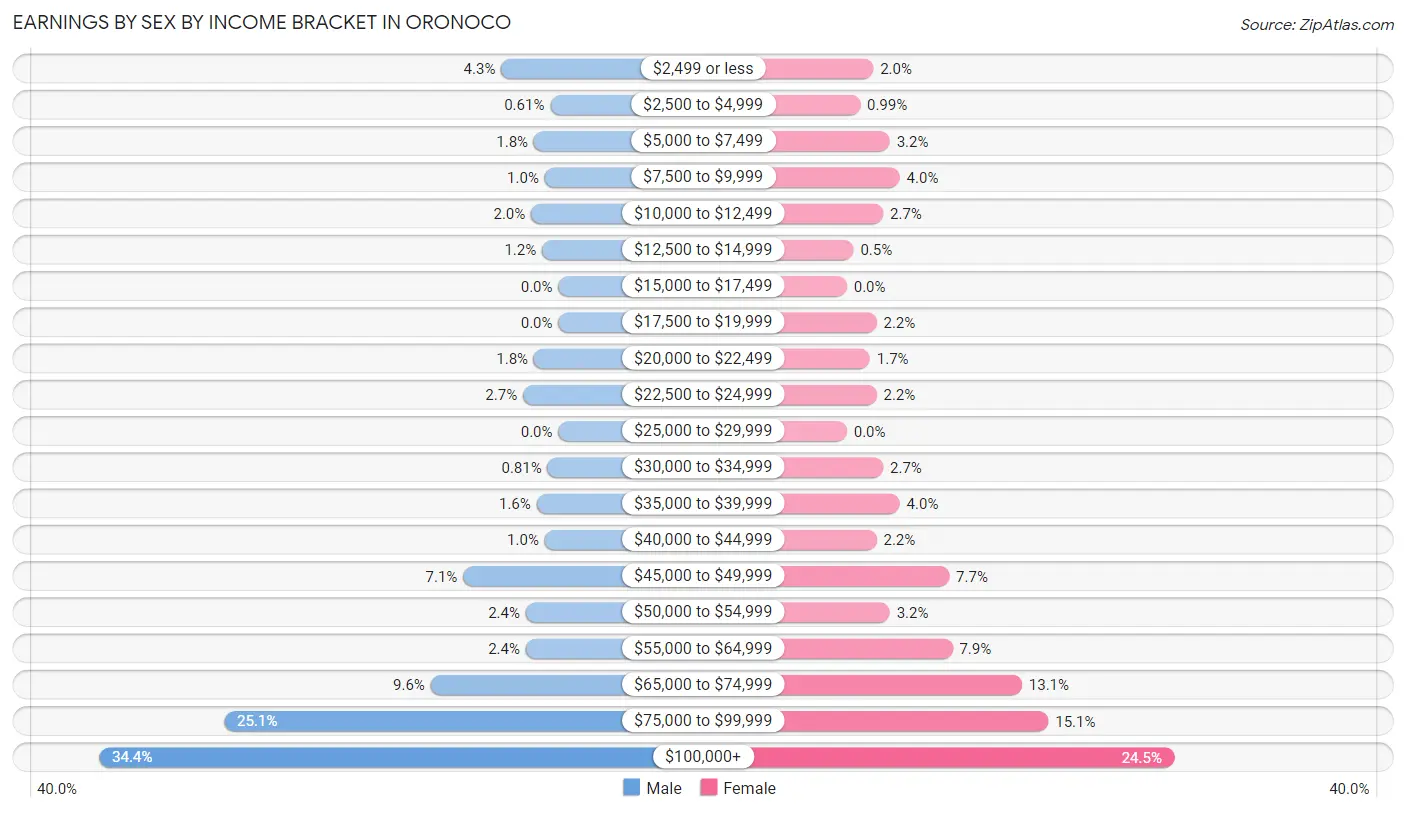
Earnings by Sex by Income Bracket in Oronoco
The most common earnings brackets in Oronoco are $100,000+ for men (169 | 34.4%) and $100,000+ for women (99 | 24.5%).
| Income | Male | Female |
| $2,499 or less | 21 (4.3%) | 8 (2.0%) |
| $2,500 to $4,999 | 3 (0.6%) | 4 (1.0%) |
| $5,000 to $7,499 | 9 (1.8%) | 13 (3.2%) |
| $7,500 to $9,999 | 5 (1.0%) | 16 (4.0%) |
| $10,000 to $12,499 | 10 (2.0%) | 11 (2.7%) |
| $12,500 to $14,999 | 6 (1.2%) | 2 (0.5%) |
| $15,000 to $17,499 | 0 (0.0%) | 0 (0.0%) |
| $17,500 to $19,999 | 0 (0.0%) | 9 (2.2%) |
| $20,000 to $22,499 | 9 (1.8%) | 7 (1.7%) |
| $22,500 to $24,999 | 13 (2.6%) | 9 (2.2%) |
| $25,000 to $29,999 | 0 (0.0%) | 0 (0.0%) |
| $30,000 to $34,999 | 4 (0.8%) | 11 (2.7%) |
| $35,000 to $39,999 | 8 (1.6%) | 16 (4.0%) |
| $40,000 to $44,999 | 5 (1.0%) | 9 (2.2%) |
| $45,000 to $49,999 | 35 (7.1%) | 31 (7.7%) |
| $50,000 to $54,999 | 12 (2.4%) | 13 (3.2%) |
| $55,000 to $64,999 | 12 (2.4%) | 32 (7.9%) |
| $65,000 to $74,999 | 47 (9.6%) | 53 (13.1%) |
| $75,000 to $99,999 | 123 (25.1%) | 61 (15.1%) |
| $100,000+ | 169 (34.4%) | 99 (24.5%) |
| Total | 491 (100.0%) | 404 (100.0%) |
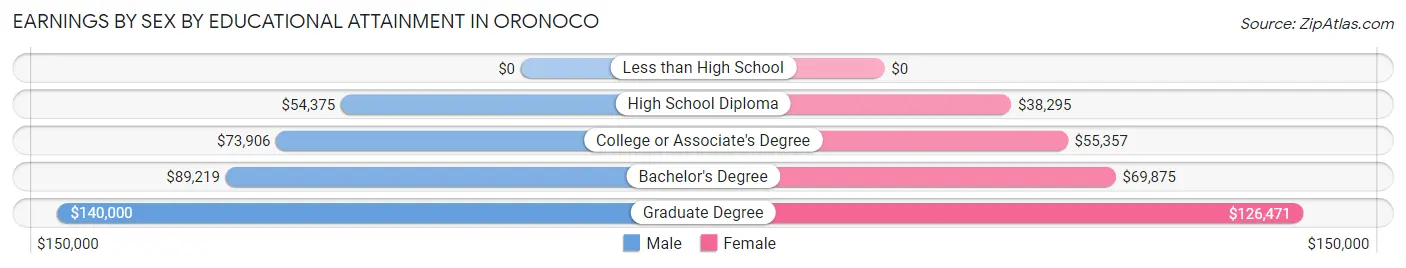
Earnings by Sex by Educational Attainment in Oronoco
Average earnings in Oronoco are $86,797 for men and $68,598 for women, a difference of 21.0%. Men with an educational attainment of graduate degree enjoy the highest average annual earnings of $140,000, while those with high school diploma education earn the least with $54,375. Women with an educational attainment of graduate degree earn the most with the average annual earnings of $126,471, while those with high school diploma education have the smallest earnings of $38,295.
| Educational Attainment | Male Income | Female Income |
| Less than High School | - | - |
| High School Diploma | $54,375 | $38,295 |
| College or Associate's Degree | $73,906 | $55,357 |
| Bachelor's Degree | $89,219 | $69,875 |
| Graduate Degree | $140,000 | $126,471 |
| Total | $86,797 | $68,598 |
Family Income in Oronoco
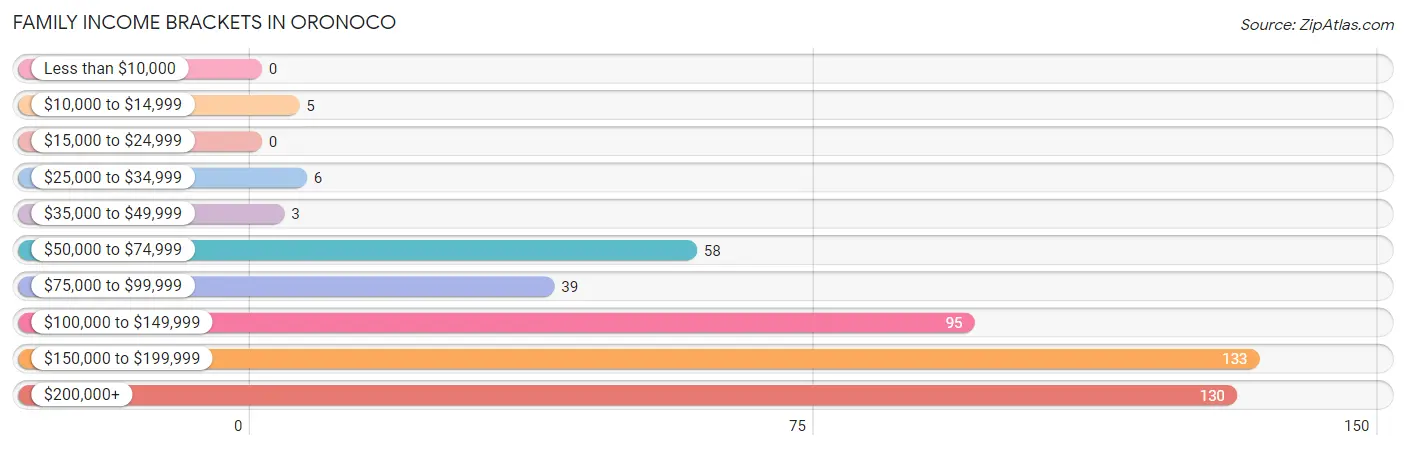
Family Income Brackets in Oronoco
According to the Oronoco family income data, there are 133 families falling into the $150,000 to $199,999 income range, which is the most common income bracket and makes up 28.4% of all families.
| Income Bracket | # Families | % Families |
| Less than $10,000 | 0 | 0.0% |
| $10,000 to $14,999 | 5 | 1.1% |
| $15,000 to $24,999 | 0 | 0.0% |
| $25,000 to $34,999 | 6 | 1.3% |
| $35,000 to $49,999 | 3 | 0.6% |
| $50,000 to $74,999 | 58 | 12.4% |
| $75,000 to $99,999 | 39 | 8.3% |
| $100,000 to $149,999 | 95 | 20.3% |
| $150,000 to $199,999 | 133 | 28.4% |
| $200,000+ | 130 | 27.7% |
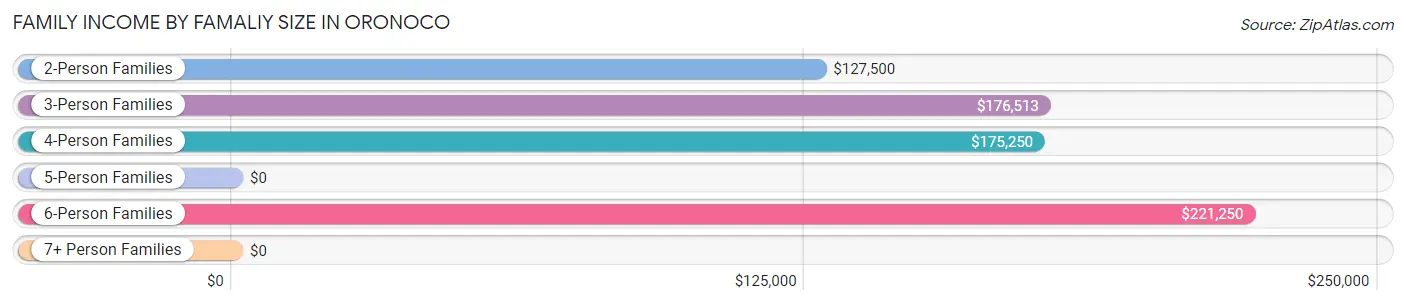
Family Income by Famaliy Size in Oronoco
6-person families (12 | 2.6%) account for the highest median family income in Oronoco with $221,250 per family, while 2-person families (176 | 37.5%) have the highest median income of $63,750 per family member.
| Income Bracket | # Families | Median Income |
| 2-Person Families | 176 (37.5%) | $127,500 |
| 3-Person Families | 89 (19.0%) | $176,513 |
| 4-Person Families | 149 (31.8%) | $175,250 |
| 5-Person Families | 39 (8.3%) | $0 |
| 6-Person Families | 12 (2.6%) | $221,250 |
| 7+ Person Families | 4 (0.9%) | $0 |
| Total | 469 (100.0%) | $165,208 |
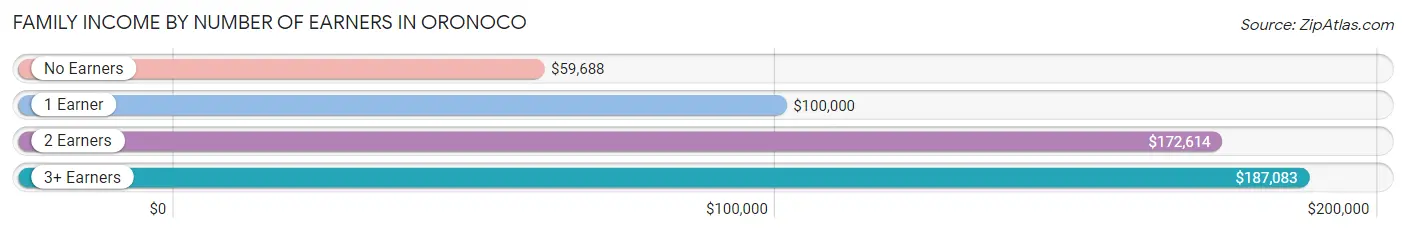
Family Income by Number of Earners in Oronoco
The median family income in Oronoco is $165,208, with families comprising 3+ earners (59) having the highest median family income of $187,083, while families with no earners (43) have the lowest median family income of $59,688, accounting for 12.6% and 9.2% of families, respectively.
| Number of Earners | # Families | Median Income |
| No Earners | 43 (9.2%) | $59,688 |
| 1 Earner | 92 (19.6%) | $100,000 |
| 2 Earners | 275 (58.6%) | $172,614 |
| 3+ Earners | 59 (12.6%) | $187,083 |
| Total | 469 (100.0%) | $165,208 |
Household Income in Oronoco
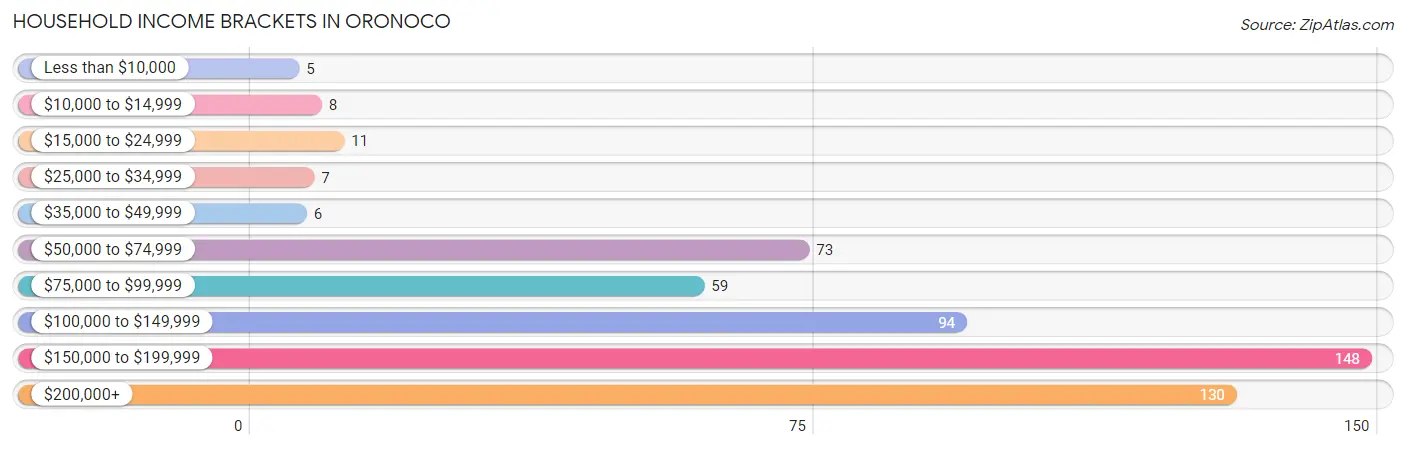
Household Income Brackets in Oronoco
With 148 households falling in the category, the $150,000 to $199,999 income range is the most frequent in Oronoco, accounting for 27.4% of all households. In contrast, only 5 households (0.9%) fall into the less than $10,000 income bracket, making it the least populous group.
| Income Bracket | # Households | % Households |
| Less than $10,000 | 5 | 0.9% |
| $10,000 to $14,999 | 8 | 1.5% |
| $15,000 to $24,999 | 11 | 2.0% |
| $25,000 to $34,999 | 7 | 1.3% |
| $35,000 to $49,999 | 6 | 1.1% |
| $50,000 to $74,999 | 73 | 13.5% |
| $75,000 to $99,999 | 59 | 10.9% |
| $100,000 to $149,999 | 94 | 17.4% |
| $150,000 to $199,999 | 148 | 27.4% |
| $200,000+ | 130 | 24.0% |
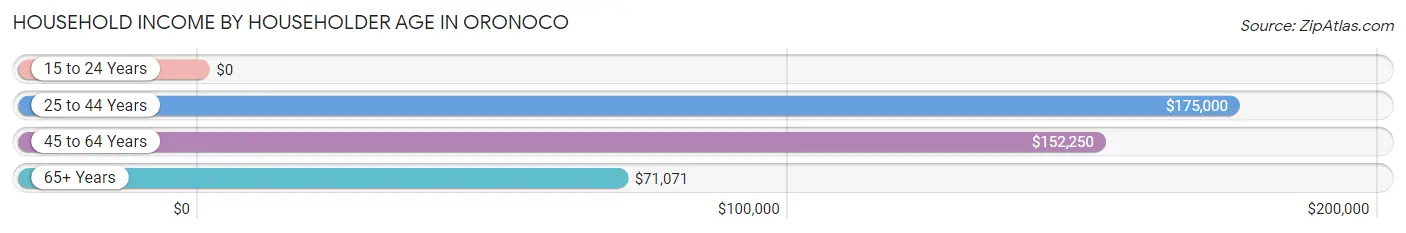
Household Income by Householder Age in Oronoco
The median household income in Oronoco is $153,393, with the highest median household income of $175,000 found in the 25 to 44 years age bracket for the primary householder. A total of 262 households (48.4%) fall into this category.
| Income Bracket | # Households | Median Income |
| 15 to 24 Years | 0 (0.0%) | $0 |
| 25 to 44 Years | 262 (48.4%) | $175,000 |
| 45 to 64 Years | 197 (36.4%) | $152,250 |
| 65+ Years | 82 (15.2%) | $71,071 |
| Total | 541 (100.0%) | $153,393 |
Poverty in Oronoco
Income Below Poverty by Sex and Age in Oronoco
With 2.8% poverty level for males and 1.6% for females among the residents of Oronoco, 65 to 74 year old males and 75 year old and over females are the most vulnerable to poverty, with 9 males (15.2%) and 4 females (15.4%) in their respective age groups living below the poverty level.
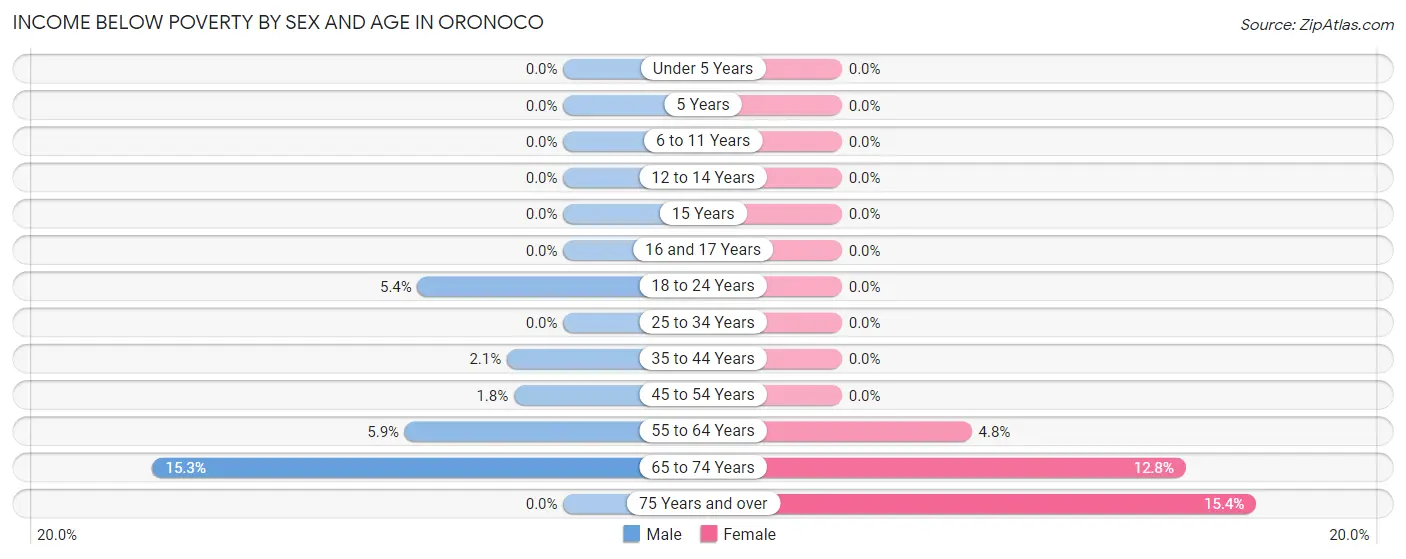
| Age Bracket | Male | Female |
| Under 5 Years | 0 (0.0%) | 0 (0.0%) |
| 5 Years | 0 (0.0%) | 0 (0.0%) |
| 6 to 11 Years | 0 (0.0%) | 0 (0.0%) |
| 12 to 14 Years | 0 (0.0%) | 0 (0.0%) |
| 15 Years | 0 (0.0%) | 0 (0.0%) |
| 16 and 17 Years | 0 (0.0%) | 0 (0.0%) |
| 18 to 24 Years | 2 (5.4%) | 0 (0.0%) |
| 25 to 34 Years | 0 (0.0%) | 0 (0.0%) |
| 35 to 44 Years | 4 (2.1%) | 0 (0.0%) |
| 45 to 54 Years | 2 (1.8%) | 0 (0.0%) |
| 55 to 64 Years | 6 (5.9%) | 4 (4.8%) |
| 65 to 74 Years | 9 (15.2%) | 6 (12.8%) |
| 75 Years and over | 0 (0.0%) | 4 (15.4%) |
| Total | 23 (2.8%) | 14 (1.6%) |
Income Above Poverty by Sex and Age in Oronoco
According to the poverty statistics in Oronoco, males aged under 5 years and females aged under 5 years are the age groups that are most secure financially, with 100.0% of males and 100.0% of females in these age groups living above the poverty line.
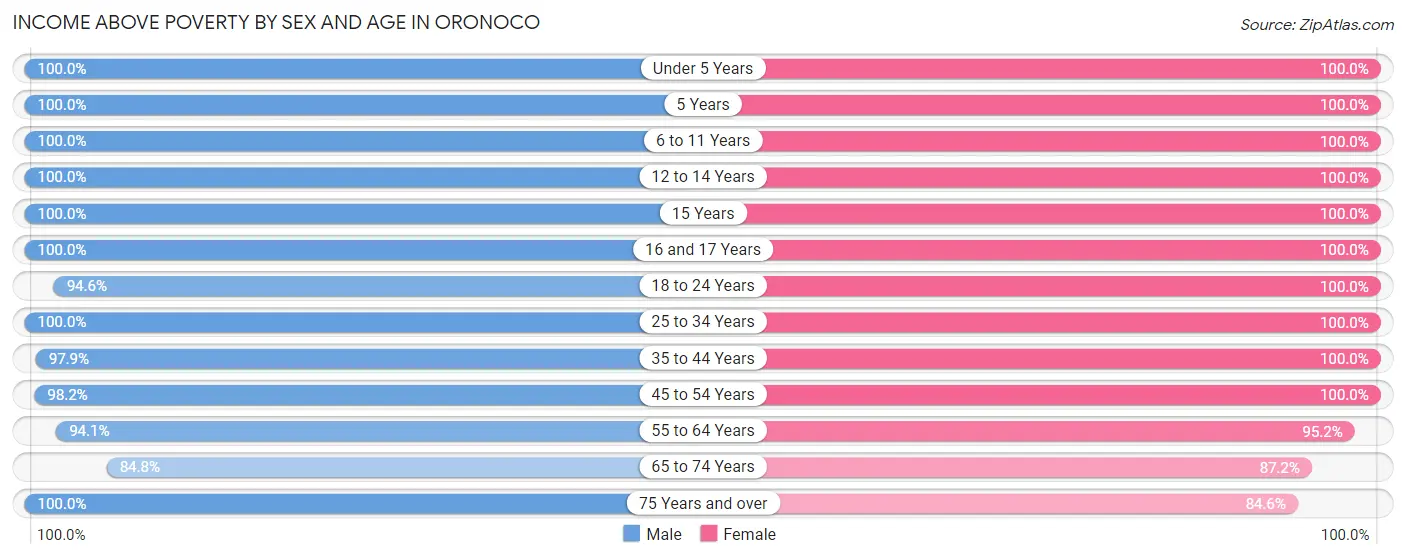
| Age Bracket | Male | Female |
| Under 5 Years | 43 (100.0%) | 70 (100.0%) |
| 5 Years | 4 (100.0%) | 16 (100.0%) |
| 6 to 11 Years | 145 (100.0%) | 193 (100.0%) |
| 12 to 14 Years | 51 (100.0%) | 47 (100.0%) |
| 15 Years | 8 (100.0%) | 9 (100.0%) |
| 16 and 17 Years | 35 (100.0%) | 19 (100.0%) |
| 18 to 24 Years | 35 (94.6%) | 10 (100.0%) |
| 25 to 34 Years | 43 (100.0%) | 62 (100.0%) |
| 35 to 44 Years | 187 (97.9%) | 198 (100.0%) |
| 45 to 54 Years | 107 (98.2%) | 80 (100.0%) |
| 55 to 64 Years | 96 (94.1%) | 79 (95.2%) |
| 65 to 74 Years | 50 (84.8%) | 41 (87.2%) |
| 75 Years and over | 9 (100.0%) | 22 (84.6%) |
| Total | 813 (97.3%) | 846 (98.4%) |
Income Below Poverty Among Married-Couple Families in Oronoco
The poverty statistics for married-couple families in Oronoco show that 1.3% or 5 of the total 393 families live below the poverty line. Families with no children have the highest poverty rate of 3.0%, comprising of 5 families. On the other hand, families with 1 or 2 children have the lowest poverty rate of 0.0%, which includes 0 families.
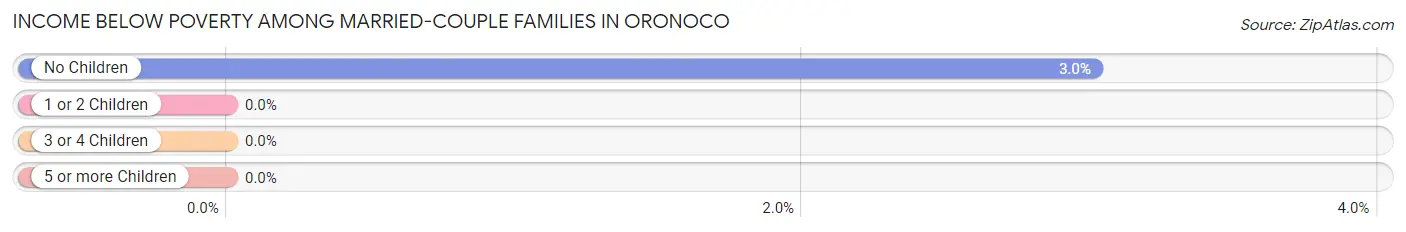
| Children | Above Poverty | Below Poverty |
| No Children | 161 (97.0%) | 5 (3.0%) |
| 1 or 2 Children | 184 (100.0%) | 0 (0.0%) |
| 3 or 4 Children | 39 (100.0%) | 0 (0.0%) |
| 5 or more Children | 4 (100.0%) | 0 (0.0%) |
| Total | 388 (98.7%) | 5 (1.3%) |
Income Below Poverty Among Single-Parent Households in Oronoco
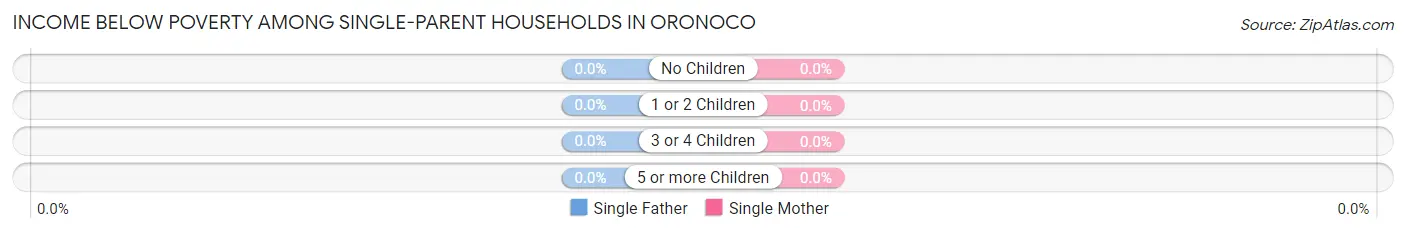
| Children | Single Father | Single Mother |
| No Children | 0 (0.0%) | 0 (0.0%) |
| 1 or 2 Children | 0 (0.0%) | 0 (0.0%) |
| 3 or 4 Children | 0 (0.0%) | 0 (0.0%) |
| 5 or more Children | 0 (0.0%) | 0 (0.0%) |
| Total | 0 (0.0%) | 0 (0.0%) |
Income Below Poverty Among Married-Couple vs Single-Parent Households in Oronoco
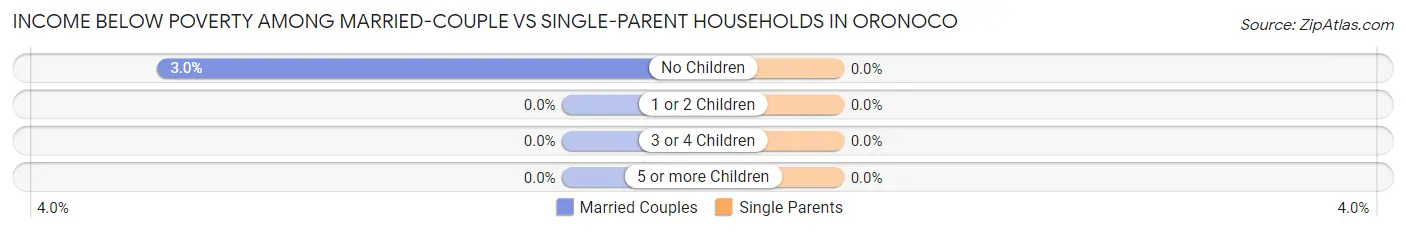
| Children | Married-Couple Families | Single-Parent Households |
| No Children | 5 (3.0%) | 0 (0.0%) |
| 1 or 2 Children | 0 (0.0%) | 0 (0.0%) |
| 3 or 4 Children | 0 (0.0%) | 0 (0.0%) |
| 5 or more Children | 0 (0.0%) | 0 (0.0%) |
| Total | 5 (1.3%) | 0 (0.0%) |
Race in Oronoco
The most populous races in Oronoco are White / Caucasian (1,553 | 91.6%), Two or more Races (102 | 6.0%), and Hispanic or Latino (87 | 5.1%).
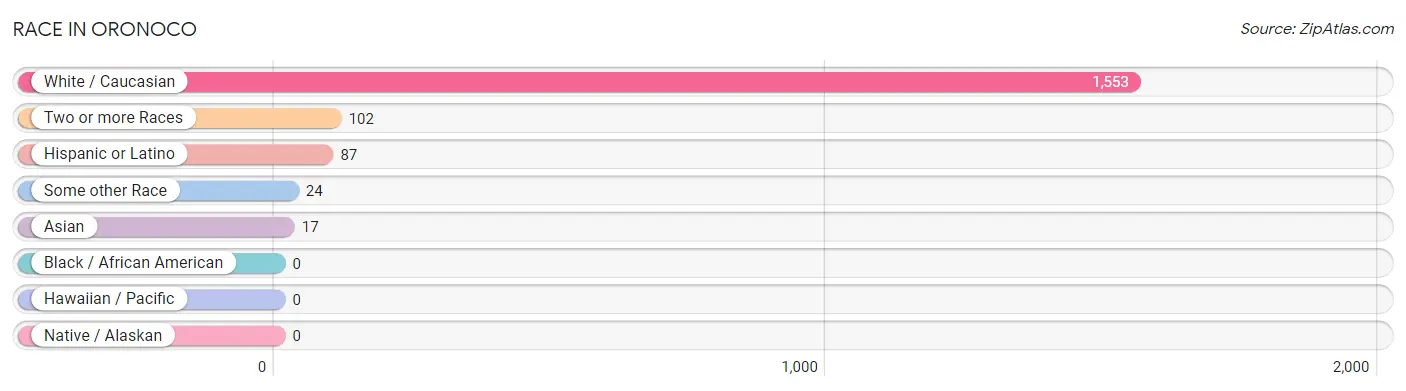
| Race | # Population | % Population |
| Asian | 17 | 1.0% |
| Black / African American | 0 | 0.0% |
| Hawaiian / Pacific | 0 | 0.0% |
| Hispanic or Latino | 87 | 5.1% |
| Native / Alaskan | 0 | 0.0% |
| White / Caucasian | 1,553 | 91.6% |
| Two or more Races | 102 | 6.0% |
| Some other Race | 24 | 1.4% |
| Total | 1,696 | 100.0% |
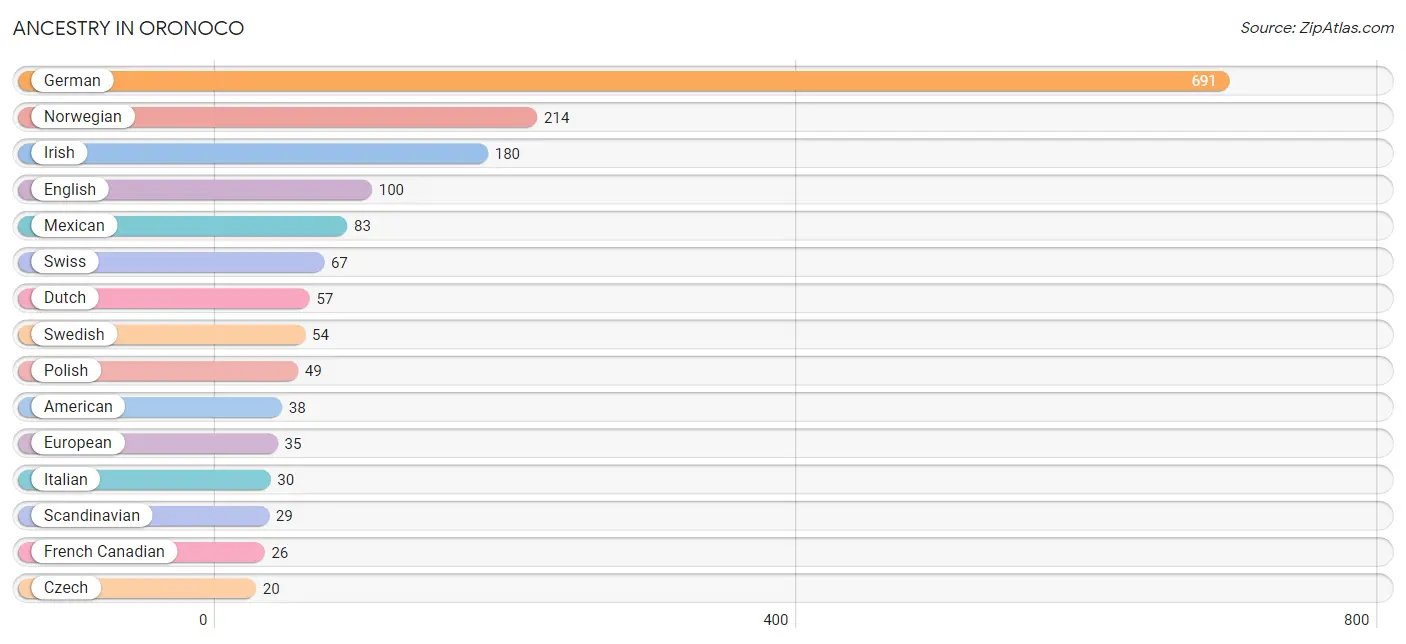
Ancestry in Oronoco
The most populous ancestries reported in Oronoco are German (691 | 40.7%), Norwegian (214 | 12.6%), Irish (180 | 10.6%), English (100 | 5.9%), and Mexican (83 | 4.9%), together accounting for 74.8% of all Oronoco residents.
| Ancestry | # Population | % Population |
| African | 10 | 0.6% |
| American | 38 | 2.2% |
| British | 8 | 0.5% |
| Burmese | 7 | 0.4% |
| Central American | 4 | 0.2% |
| Czech | 20 | 1.2% |
| Czechoslovakian | 6 | 0.4% |
| Danish | 13 | 0.8% |
| Dutch | 57 | 3.4% |
| English | 100 | 5.9% |
| European | 35 | 2.1% |
| Finnish | 7 | 0.4% |
| French | 19 | 1.1% |
| French Canadian | 26 | 1.5% |
| German | 691 | 40.7% |
| Greek | 3 | 0.2% |
| Guatemalan | 4 | 0.2% |
| Hungarian | 3 | 0.2% |
| Irish | 180 | 10.6% |
| Italian | 30 | 1.8% |
| Jamaican | 2 | 0.1% |
| Japanese | 8 | 0.5% |
| Korean | 10 | 0.6% |
| Lithuanian | 15 | 0.9% |
| Mexican | 83 | 4.9% |
| Nigerian | 5 | 0.3% |
| Northern European | 2 | 0.1% |
| Norwegian | 214 | 12.6% |
| Polish | 49 | 2.9% |
| Russian | 4 | 0.2% |
| Scandinavian | 29 | 1.7% |
| Scotch-Irish | 3 | 0.2% |
| Scottish | 6 | 0.4% |
| Slovak | 3 | 0.2% |
| Slovene | 3 | 0.2% |
| Subsaharan African | 15 | 0.9% |
| Swedish | 54 | 3.2% |
| Swiss | 67 | 4.0% |
| Welsh | 5 | 0.3% | View All 39 Rows |
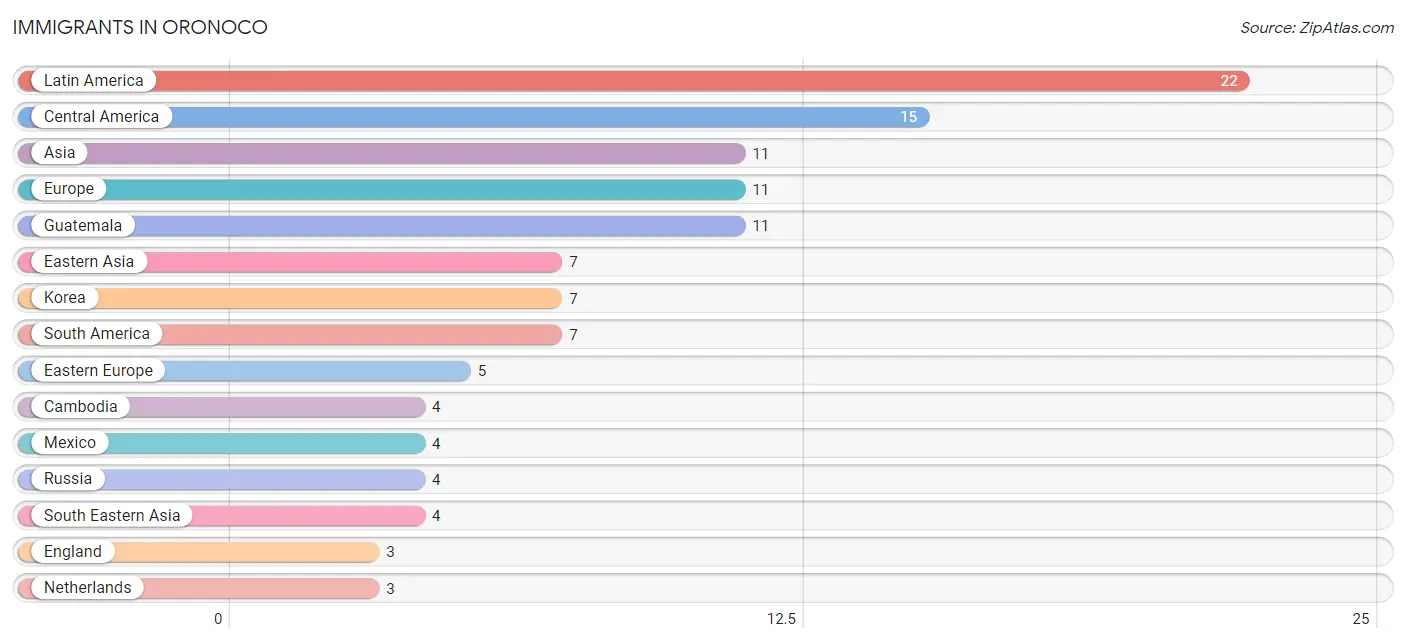
Immigrants in Oronoco
The most numerous immigrant groups reported in Oronoco came from Latin America (22 | 1.3%), Central America (15 | 0.9%), Asia (11 | 0.6%), Europe (11 | 0.6%), and Guatemala (11 | 0.6%), together accounting for 4.1% of all Oronoco residents.
| Immigration Origin | # Population | % Population |
| Asia | 11 | 0.6% |
| Cambodia | 4 | 0.2% |
| Central America | 15 | 0.9% |
| Eastern Asia | 7 | 0.4% |
| Eastern Europe | 5 | 0.3% |
| England | 3 | 0.2% |
| Europe | 11 | 0.6% |
| Guatemala | 11 | 0.6% |
| Korea | 7 | 0.4% |
| Latin America | 22 | 1.3% |
| Mexico | 4 | 0.2% |
| Netherlands | 3 | 0.2% |
| Northern Europe | 3 | 0.2% |
| Poland | 1 | 0.1% |
| Russia | 4 | 0.2% |
| South America | 7 | 0.4% |
| South Eastern Asia | 4 | 0.2% |
| Western Europe | 3 | 0.2% | View All 18 Rows |
Sex and Age in Oronoco
Sex and Age in Oronoco
The most populous age groups in Oronoco are 35 to 39 Years (117 | 14.0%) for men and 5 to 9 Years (168 | 19.5%) for women.
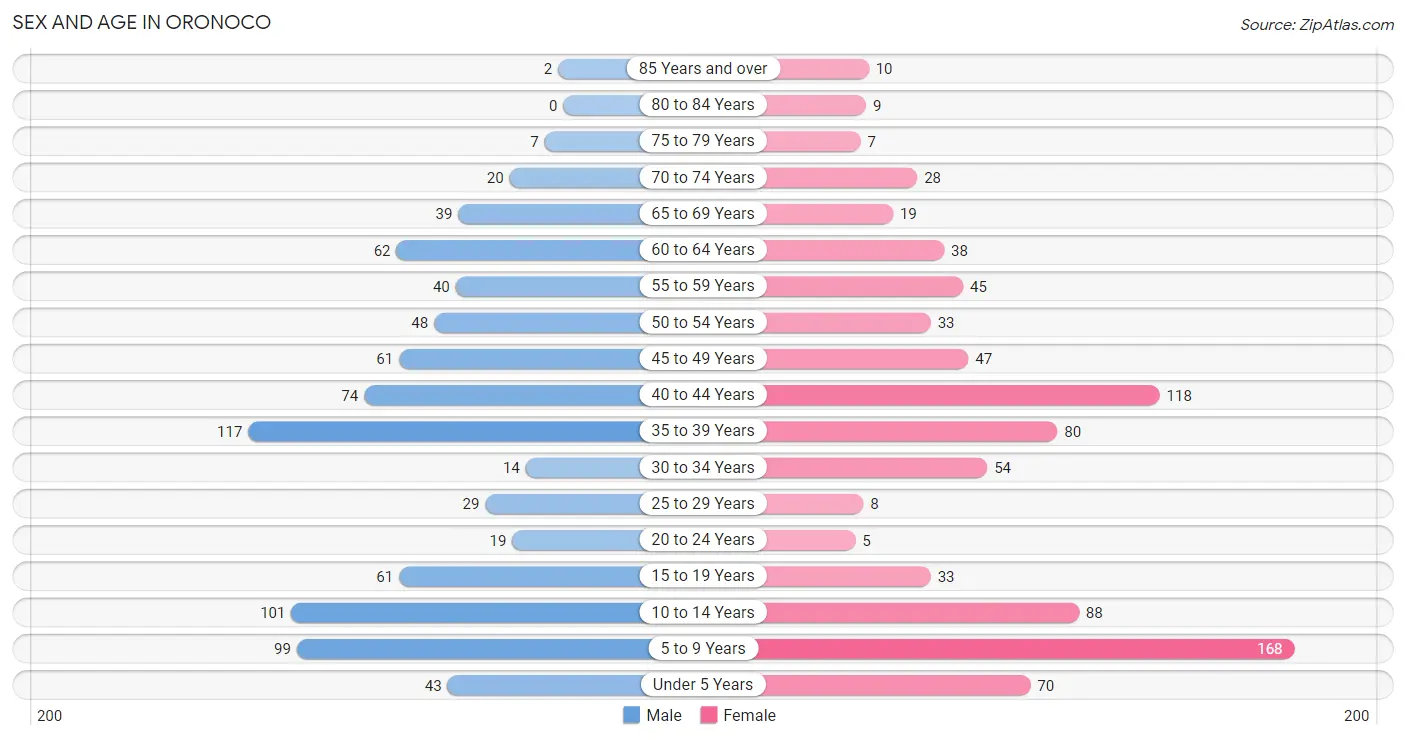
| Age Bracket | Male | Female |
| Under 5 Years | 43 (5.1%) | 70 (8.1%) |
| 5 to 9 Years | 99 (11.8%) | 168 (19.5%) |
| 10 to 14 Years | 101 (12.1%) | 88 (10.2%) |
| 15 to 19 Years | 61 (7.3%) | 33 (3.8%) |
| 20 to 24 Years | 19 (2.3%) | 5 (0.6%) |
| 25 to 29 Years | 29 (3.5%) | 8 (0.9%) |
| 30 to 34 Years | 14 (1.7%) | 54 (6.3%) |
| 35 to 39 Years | 117 (14.0%) | 80 (9.3%) |
| 40 to 44 Years | 74 (8.8%) | 118 (13.7%) |
| 45 to 49 Years | 61 (7.3%) | 47 (5.5%) |
| 50 to 54 Years | 48 (5.7%) | 33 (3.8%) |
| 55 to 59 Years | 40 (4.8%) | 45 (5.2%) |
| 60 to 64 Years | 62 (7.4%) | 38 (4.4%) |
| 65 to 69 Years | 39 (4.7%) | 19 (2.2%) |
| 70 to 74 Years | 20 (2.4%) | 28 (3.3%) |
| 75 to 79 Years | 7 (0.8%) | 7 (0.8%) |
| 80 to 84 Years | 0 (0.0%) | 9 (1.1%) |
| 85 Years and over | 2 (0.2%) | 10 (1.2%) |
| Total | 836 (100.0%) | 860 (100.0%) |
Families and Households in Oronoco
Median Family Size in Oronoco
The median family size in Oronoco is 3.37 persons per family, with married-couple families (393 | 83.8%) accounting for the largest median family size of 3.52 persons per family. On the other hand, single female/mother families (38 | 8.1%) represent the smallest median family size with 2.24 persons per family.
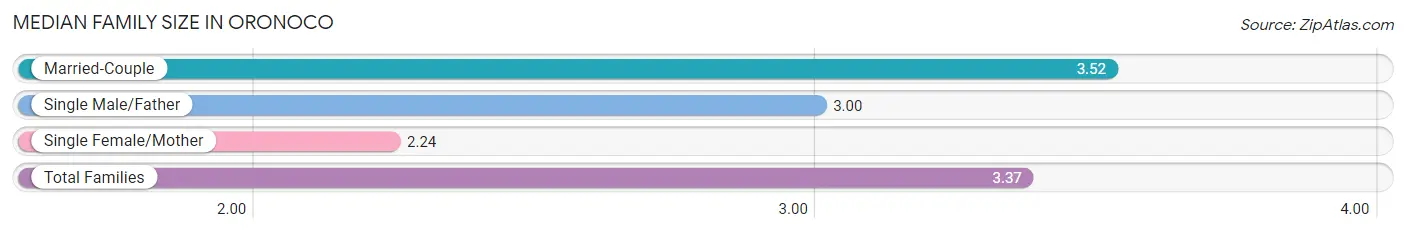
| Family Type | # Families | Family Size |
| Married-Couple | 393 (83.8%) | 3.52 |
| Single Male/Father | 38 (8.1%) | 3.00 |
| Single Female/Mother | 38 (8.1%) | 2.24 |
| Total Families | 469 (100.0%) | 3.37 |
Median Household Size in Oronoco
The median household size in Oronoco is 3.10 persons per household, with married-couple households (393 | 72.6%) accounting for the largest median household size of 3.52 persons per household. non-family households (72 | 13.3%) represent the smallest median household size with 1.13 persons per household.
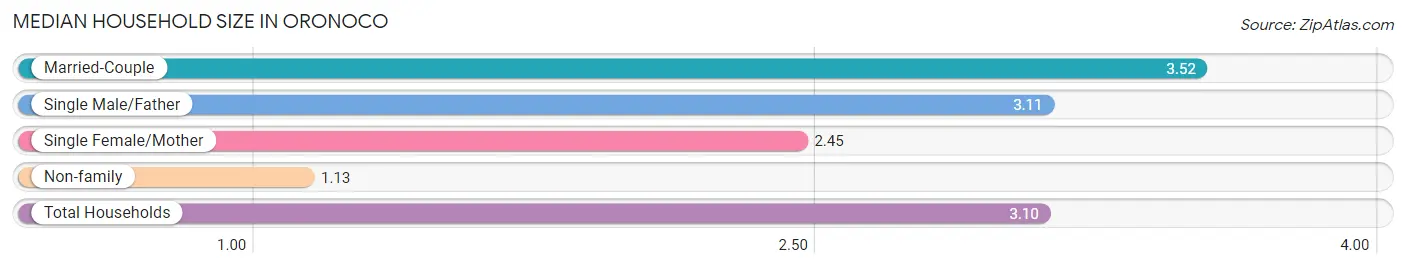
| Household Type | # Households | Household Size |
| Married-Couple | 393 (72.6%) | 3.52 |
| Single Male/Father | 38 (7.0%) | 3.11 |
| Single Female/Mother | 38 (7.0%) | 2.45 |
| Non-family | 72 (13.3%) | 1.13 |
| Total Households | 541 (100.0%) | 3.10 |
Household Size by Marriage Status in Oronoco
Out of a total of 541 households in Oronoco, 469 (86.7%) are family households, while 72 (13.3%) are nonfamily households. The most numerous type of family households are 2-person households, comprising 172, and the most common type of nonfamily households are 1-person households, comprising 62.
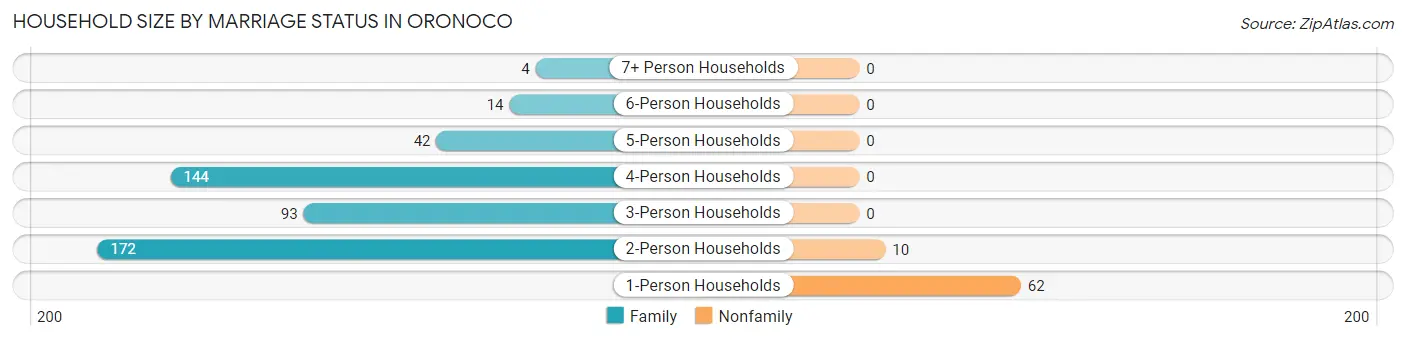
| Household Size | Family Households | Nonfamily Households |
| 1-Person Households | - | 62 (11.5%) |
| 2-Person Households | 172 (31.8%) | 10 (1.8%) |
| 3-Person Households | 93 (17.2%) | 0 (0.0%) |
| 4-Person Households | 144 (26.6%) | 0 (0.0%) |
| 5-Person Households | 42 (7.8%) | 0 (0.0%) |
| 6-Person Households | 14 (2.6%) | 0 (0.0%) |
| 7+ Person Households | 4 (0.7%) | 0 (0.0%) |
| Total | 469 (86.7%) | 72 (13.3%) |
Female Fertility in Oronoco
Fertility by Age in Oronoco
Average fertility rate in Oronoco is 77.0 births per 1,000 women. Women in the age bracket of 20 to 34 years have the highest fertility rate with 224.0 births per 1,000 women. Women in the age bracket of 20 to 34 years acount for 55.6% of all women with births.
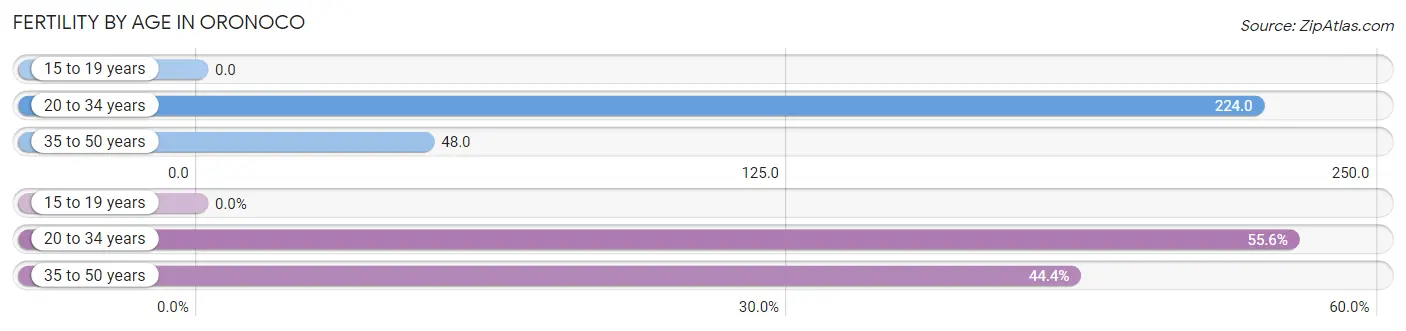
| Age Bracket | Women with Births | Births / 1,000 Women |
| 15 to 19 years | 0 (0.0%) | 0.0 |
| 20 to 34 years | 15 (55.6%) | 224.0 |
| 35 to 50 years | 12 (44.4%) | 48.0 |
| Total | 27 (100.0%) | 77.0 |
Fertility by Age by Marriage Status in Oronoco
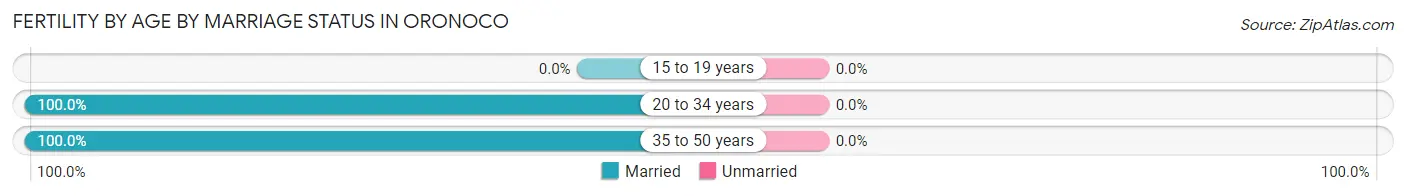
| Age Bracket | Married | Unmarried |
| 15 to 19 years | 0 (0.0%) | 0 (0.0%) |
| 20 to 34 years | 15 (100.0%) | 0 (0.0%) |
| 35 to 50 years | 12 (100.0%) | 0 (0.0%) |
| Total | 27 (100.0%) | 0 (0.0%) |
Fertility by Education in Oronoco
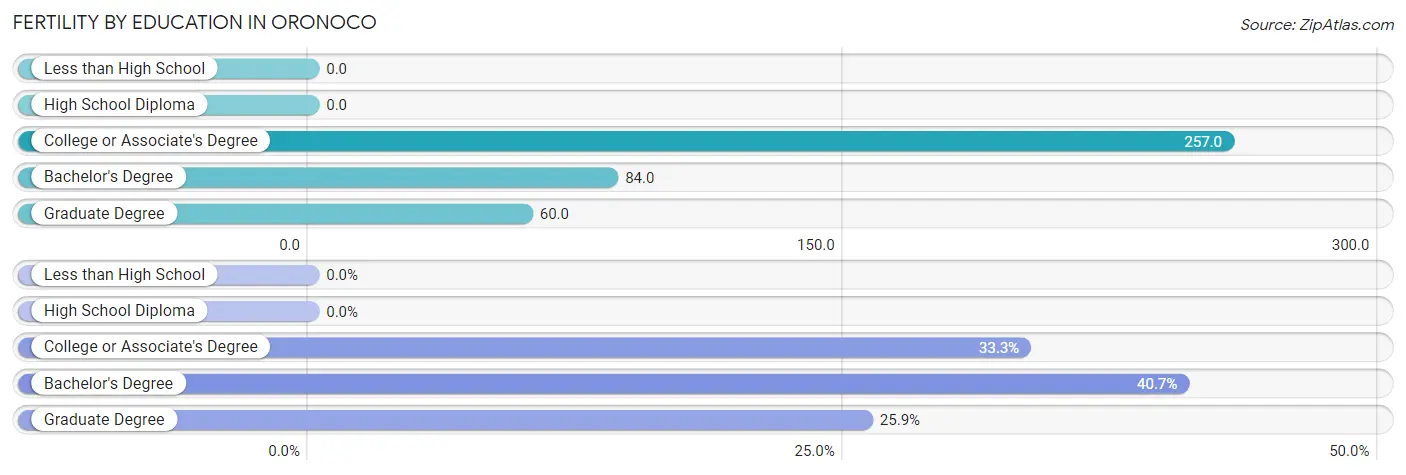
| Educational Attainment | Women with Births | Births / 1,000 Women |
| Less than High School | 0 (0.0%) | 0.0 |
| High School Diploma | 0 (0.0%) | 0.0 |
| College or Associate's Degree | 9 (33.3%) | 257.0 |
| Bachelor's Degree | 11 (40.7%) | 84.0 |
| Graduate Degree | 7 (25.9%) | 60.0 |
| Total | 27 (100.0%) | 77.0 |
Fertility by Education by Marriage Status in Oronoco
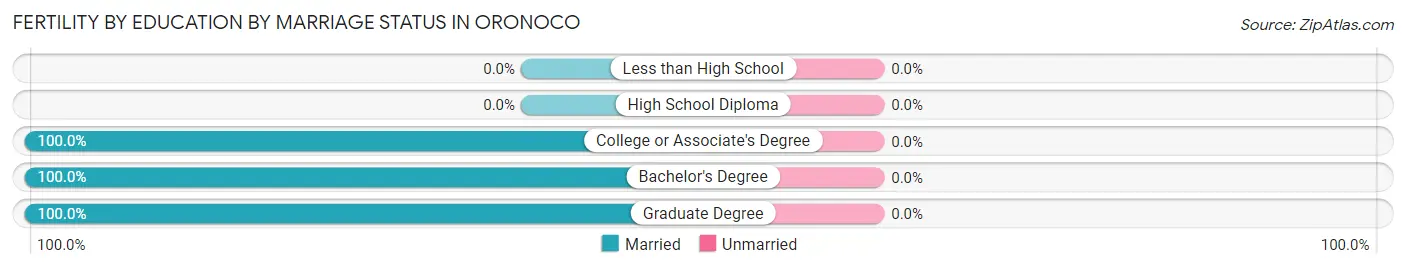
| Educational Attainment | Married | Unmarried |
| Less than High School | 0 (0.0%) | 0 (0.0%) |
| High School Diploma | 0 (0.0%) | 0 (0.0%) |
| College or Associate's Degree | 9 (100.0%) | 0 (0.0%) |
| Bachelor's Degree | 11 (100.0%) | 0 (0.0%) |
| Graduate Degree | 7 (100.0%) | 0 (0.0%) |
| Total | 27 (100.0%) | 0 (0.0%) |
Employment Characteristics in Oronoco
Employment by Class of Employer in Oronoco
Among the 829 employed individuals in Oronoco, private company employees (378 | 45.6%), not-for-profit organizations (313 | 37.8%), and local government employees (63 | 7.6%) make up the most common classes of employment.
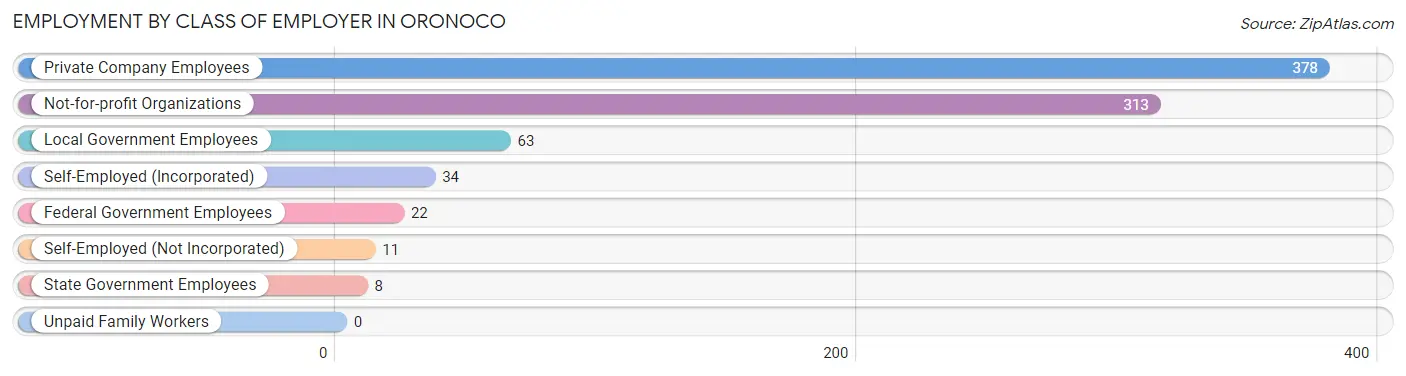
| Employer Class | # Employees | % Employees |
| Private Company Employees | 378 | 45.6% |
| Self-Employed (Incorporated) | 34 | 4.1% |
| Self-Employed (Not Incorporated) | 11 | 1.3% |
| Not-for-profit Organizations | 313 | 37.8% |
| Local Government Employees | 63 | 7.6% |
| State Government Employees | 8 | 1.0% |
| Federal Government Employees | 22 | 2.6% |
| Unpaid Family Workers | 0 | 0.0% |
| Total | 829 | 100.0% |
Employment Status by Age in Oronoco
According to the labor force statistics for Oronoco, out of the total population over 16 years of age (1,110), 76.9% or 854 individuals are in the labor force, with 0.4% or 3 of them unemployed. The age group with the highest labor force participation rate is 25 to 29 years, with 100.0% or 37 individuals in the labor force. Within the labor force, the 16 to 19 years age range has the highest percentage of unemployed individuals, with 5.4% or 2 of them being unemployed.
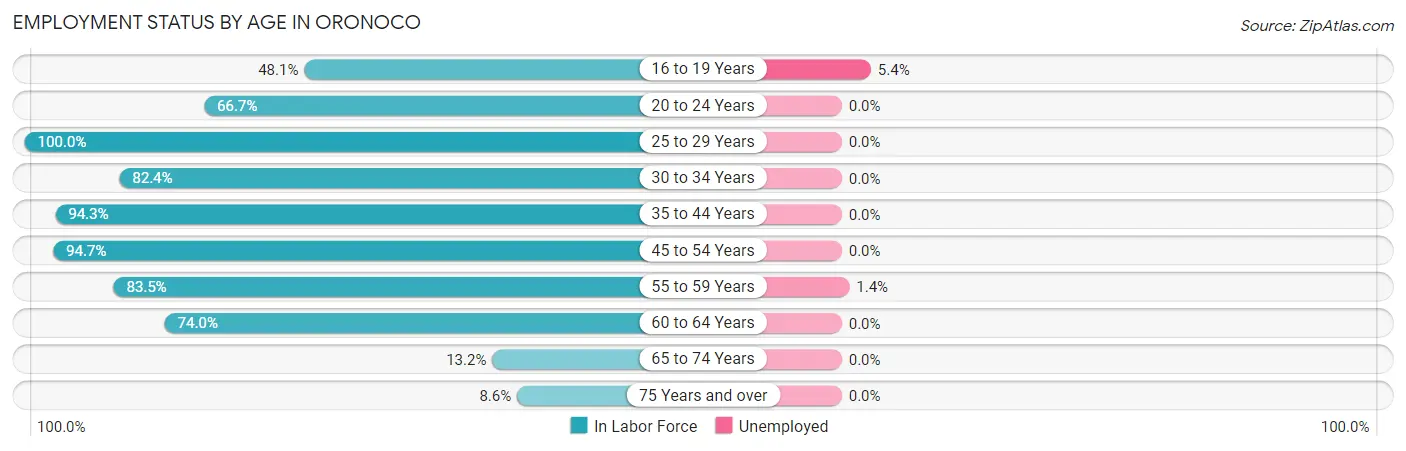
| Age Bracket | In Labor Force | Unemployed |
| 16 to 19 Years | 37 (48.1%) | 2 (5.4%) |
| 20 to 24 Years | 16 (66.7%) | 0 (0.0%) |
| 25 to 29 Years | 37 (100.0%) | 0 (0.0%) |
| 30 to 34 Years | 56 (82.4%) | 0 (0.0%) |
| 35 to 44 Years | 367 (94.3%) | 0 (0.0%) |
| 45 to 54 Years | 179 (94.7%) | 0 (0.0%) |
| 55 to 59 Years | 71 (83.5%) | 1 (1.4%) |
| 60 to 64 Years | 74 (74.0%) | 0 (0.0%) |
| 65 to 74 Years | 14 (13.2%) | 0 (0.0%) |
| 75 Years and over | 3 (8.6%) | 0 (0.0%) |
| Total | 854 (76.9%) | 3 (0.4%) |
Employment Status by Educational Attainment in Oronoco
According to labor force statistics for Oronoco, 90.3% of individuals (784) out of the total population between 25 and 64 years of age (868) are in the labor force, with 0.1% or 1 of them being unemployed. The group with the highest labor force participation rate are those with the educational attainment of college / associate degree, with 94.8% or 200 individuals in the labor force. Within the labor force, individuals with college / associate degree education have the highest percentage of unemployment, with 0.5% or 1 of them being unemployed.
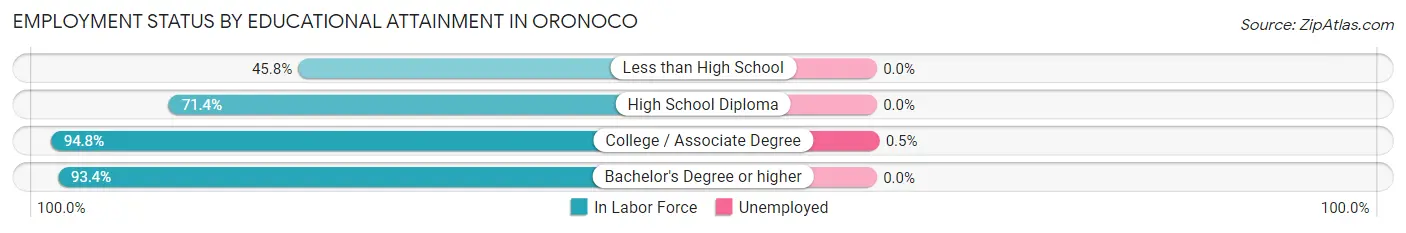
| Educational Attainment | In Labor Force | Unemployed |
| Less than High School | 11 (45.8%) | 0 (0.0%) |
| High School Diploma | 60 (71.4%) | 0 (0.0%) |
| College / Associate Degree | 200 (94.8%) | 1 (0.5%) |
| Bachelor's Degree or higher | 513 (93.4%) | 0 (0.0%) |
| Total | 784 (90.3%) | 1 (0.1%) |
Employment Occupations by Sex in Oronoco
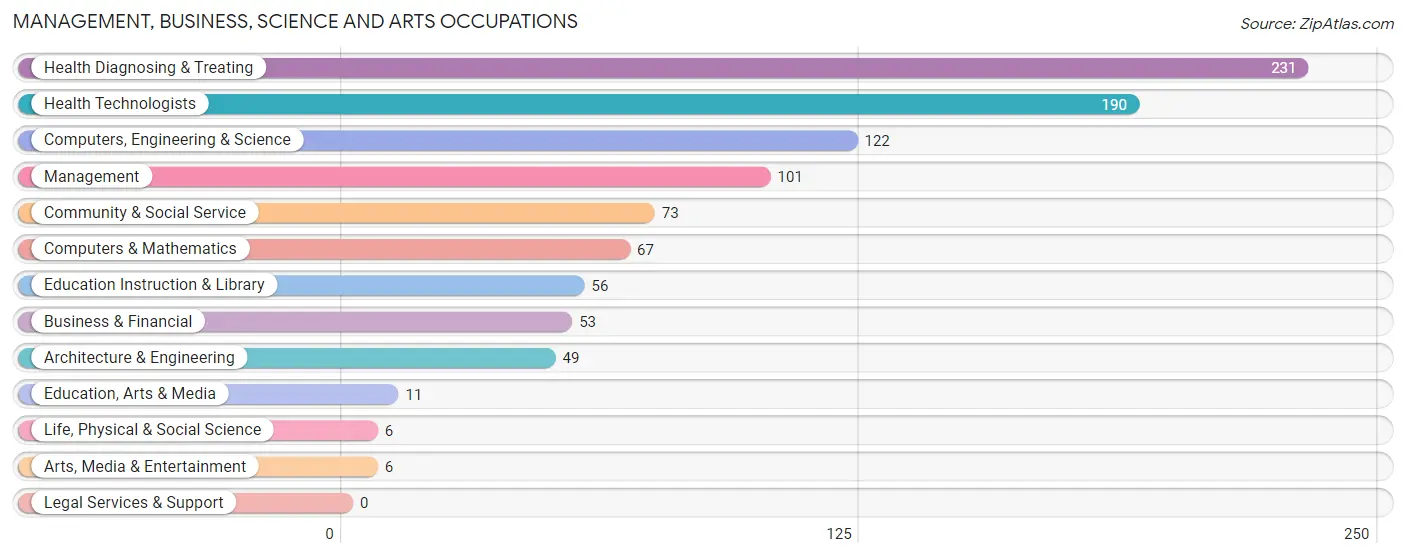
Management, Business, Science and Arts Occupations
The most common Management, Business, Science and Arts occupations in Oronoco are Health Diagnosing & Treating (231 | 27.1%), Health Technologists (190 | 22.3%), Computers, Engineering & Science (122 | 14.3%), Management (101 | 11.9%), and Community & Social Service (73 | 8.6%).
Management, Business, Science and Arts Occupations by Sex
Within the Management, Business, Science and Arts occupations in Oronoco, the most male-oriented occupations are Business & Financial (100.0%), Architecture & Engineering (79.6%), and Arts, Media & Entertainment (66.7%), while the most female-oriented occupations are Education Instruction & Library (83.9%), Community & Social Service (75.3%), and Life, Physical & Social Science (66.7%).
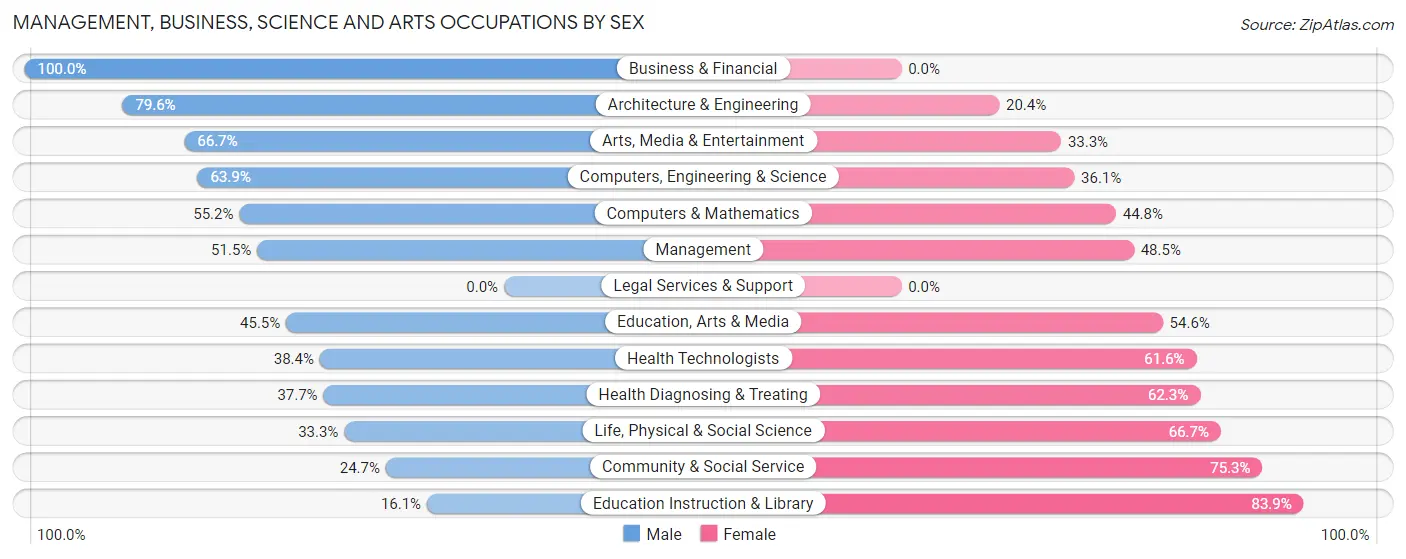
| Occupation | Male | Female |
| Management | 52 (51.5%) | 49 (48.5%) |
| Business & Financial | 53 (100.0%) | 0 (0.0%) |
| Computers, Engineering & Science | 78 (63.9%) | 44 (36.1%) |
| Computers & Mathematics | 37 (55.2%) | 30 (44.8%) |
| Architecture & Engineering | 39 (79.6%) | 10 (20.4%) |
| Life, Physical & Social Science | 2 (33.3%) | 4 (66.7%) |
| Community & Social Service | 18 (24.7%) | 55 (75.3%) |
| Education, Arts & Media | 5 (45.5%) | 6 (54.5%) |
| Legal Services & Support | 0 (0.0%) | 0 (0.0%) |
| Education Instruction & Library | 9 (16.1%) | 47 (83.9%) |
| Arts, Media & Entertainment | 4 (66.7%) | 2 (33.3%) |
| Health Diagnosing & Treating | 87 (37.7%) | 144 (62.3%) |
| Health Technologists | 73 (38.4%) | 117 (61.6%) |
| Total (Category) | 288 (49.7%) | 292 (50.3%) |
| Total (Overall) | 457 (53.7%) | 394 (46.3%) |
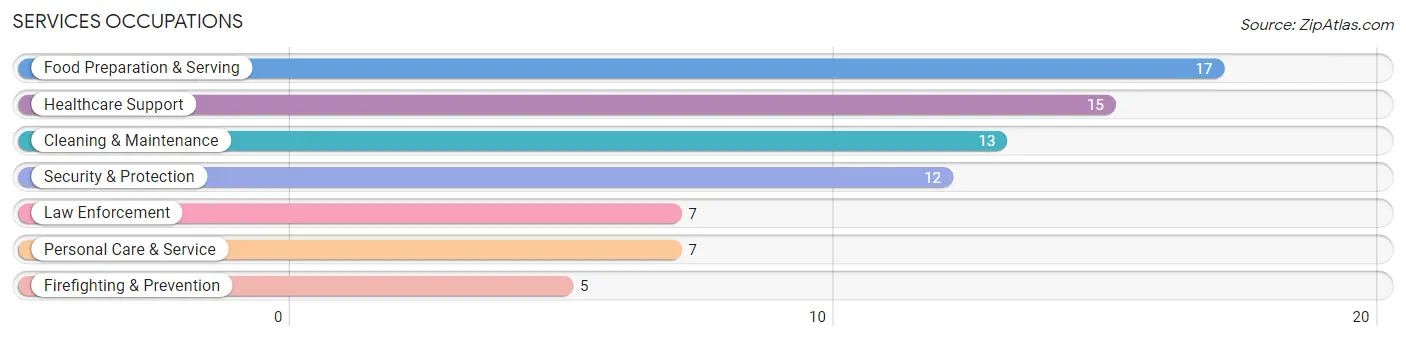
Services Occupations
The most common Services occupations in Oronoco are Food Preparation & Serving (17 | 2.0%), Healthcare Support (15 | 1.8%), Cleaning & Maintenance (13 | 1.5%), Security & Protection (12 | 1.4%), and Law Enforcement (7 | 0.8%).
Services Occupations by Sex
Within the Services occupations in Oronoco, the most male-oriented occupations are Law Enforcement (100.0%), Food Preparation & Serving (100.0%), and Security & Protection (58.3%), while the most female-oriented occupations are Firefighting & Prevention (100.0%), Personal Care & Service (100.0%), and Healthcare Support (80.0%).
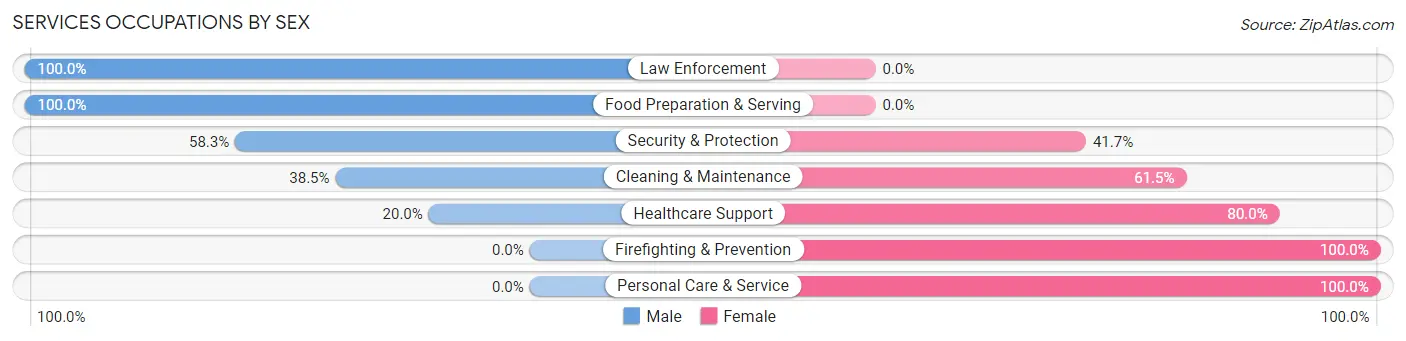
| Occupation | Male | Female |
| Healthcare Support | 3 (20.0%) | 12 (80.0%) |
| Security & Protection | 7 (58.3%) | 5 (41.7%) |
| Firefighting & Prevention | 0 (0.0%) | 5 (100.0%) |
| Law Enforcement | 7 (100.0%) | 0 (0.0%) |
| Food Preparation & Serving | 17 (100.0%) | 0 (0.0%) |
| Cleaning & Maintenance | 5 (38.5%) | 8 (61.5%) |
| Personal Care & Service | 0 (0.0%) | 7 (100.0%) |
| Total (Category) | 32 (50.0%) | 32 (50.0%) |
| Total (Overall) | 457 (53.7%) | 394 (46.3%) |
Sales and Office Occupations
The most common Sales and Office occupations in Oronoco are Sales & Related (74 | 8.7%), and Office & Administration (33 | 3.9%).
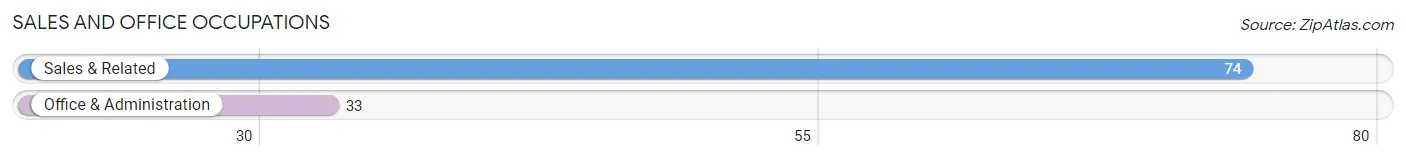
Sales and Office Occupations by Sex
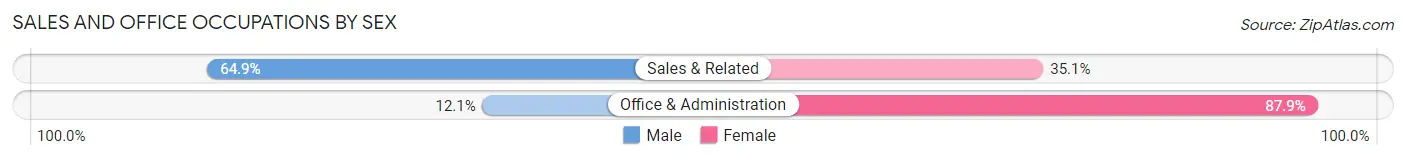
| Occupation | Male | Female |
| Sales & Related | 48 (64.9%) | 26 (35.1%) |
| Office & Administration | 4 (12.1%) | 29 (87.9%) |
| Total (Category) | 52 (48.6%) | 55 (51.4%) |
| Total (Overall) | 457 (53.7%) | 394 (46.3%) |
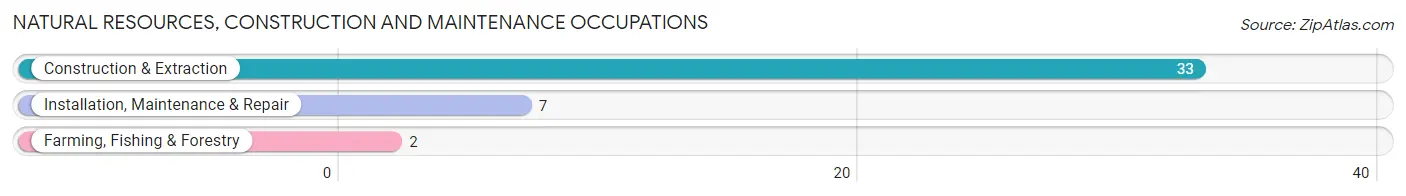
Natural Resources, Construction and Maintenance Occupations
The most common Natural Resources, Construction and Maintenance occupations in Oronoco are Construction & Extraction (33 | 3.9%), Installation, Maintenance & Repair (7 | 0.8%), and Farming, Fishing & Forestry (2 | 0.2%).
Natural Resources, Construction and Maintenance Occupations by Sex
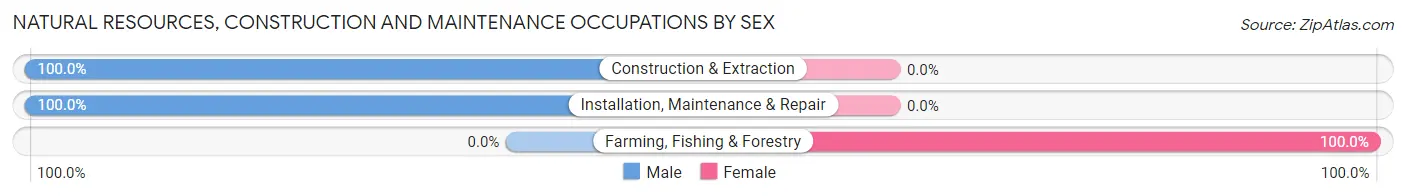
| Occupation | Male | Female |
| Farming, Fishing & Forestry | 0 (0.0%) | 2 (100.0%) |
| Construction & Extraction | 33 (100.0%) | 0 (0.0%) |
| Installation, Maintenance & Repair | 7 (100.0%) | 0 (0.0%) |
| Total (Category) | 40 (95.2%) | 2 (4.8%) |
| Total (Overall) | 457 (53.7%) | 394 (46.3%) |
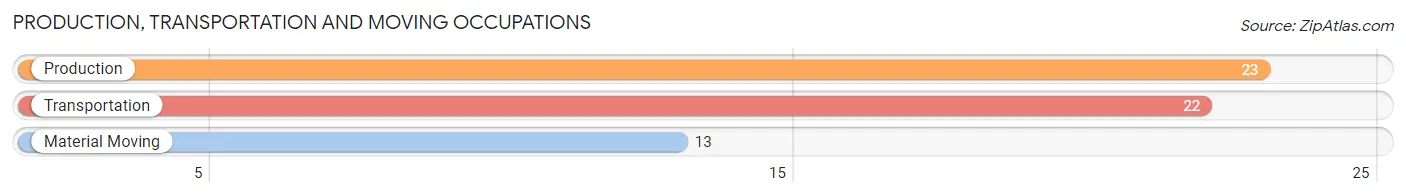
Production, Transportation and Moving Occupations
The most common Production, Transportation and Moving occupations in Oronoco are Production (23 | 2.7%), Transportation (22 | 2.6%), and Material Moving (13 | 1.5%).
Production, Transportation and Moving Occupations by Sex
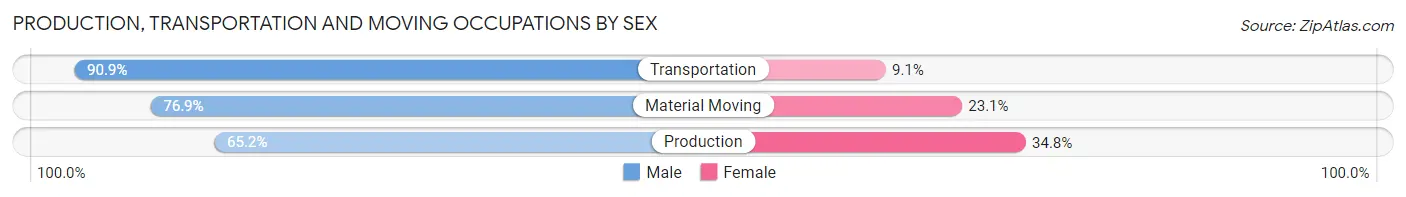
| Occupation | Male | Female |
| Production | 15 (65.2%) | 8 (34.8%) |
| Transportation | 20 (90.9%) | 2 (9.1%) |
| Material Moving | 10 (76.9%) | 3 (23.1%) |
| Total (Category) | 45 (77.6%) | 13 (22.4%) |
| Total (Overall) | 457 (53.7%) | 394 (46.3%) |
Employment Industries by Sex in Oronoco
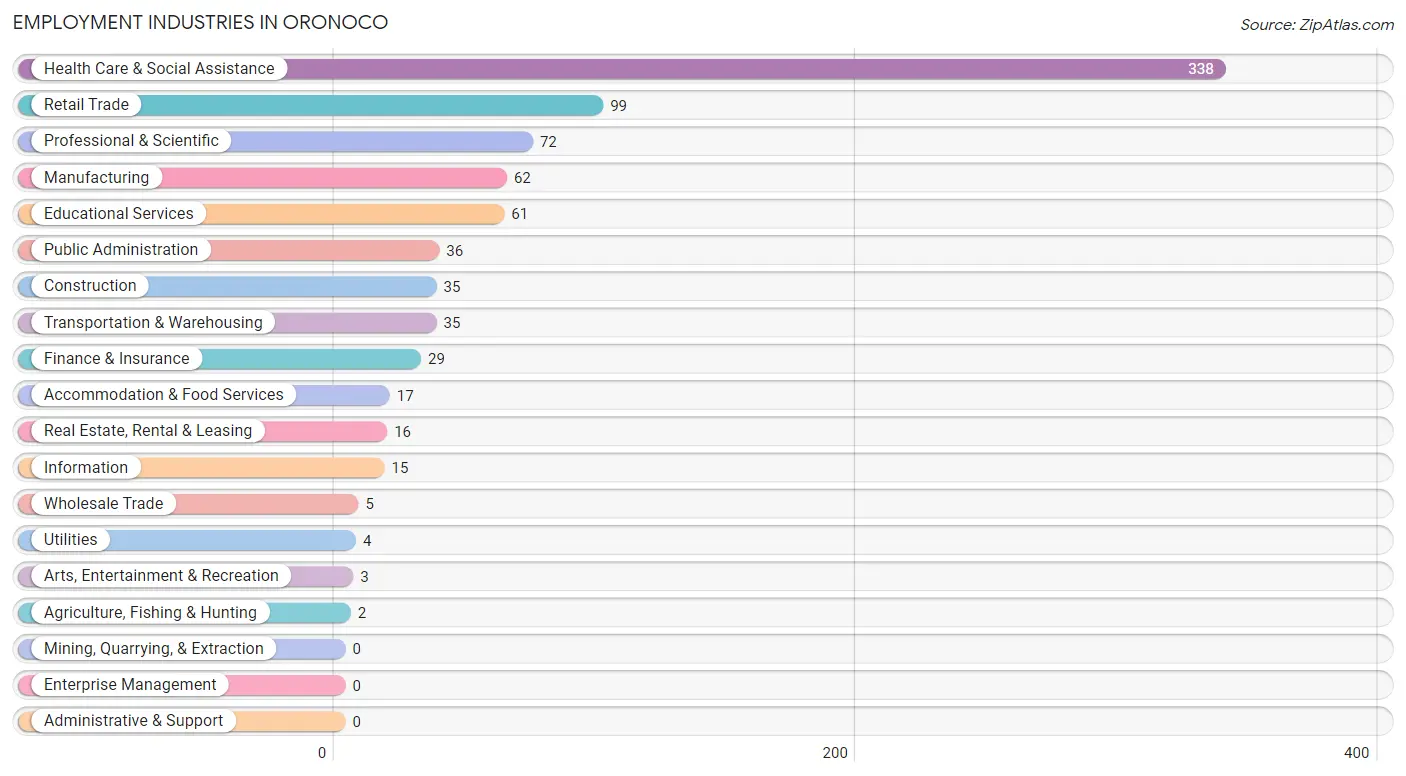
Employment Industries in Oronoco
The major employment industries in Oronoco include Health Care & Social Assistance (338 | 39.7%), Retail Trade (99 | 11.6%), Professional & Scientific (72 | 8.5%), Manufacturing (62 | 7.3%), and Educational Services (61 | 7.2%).
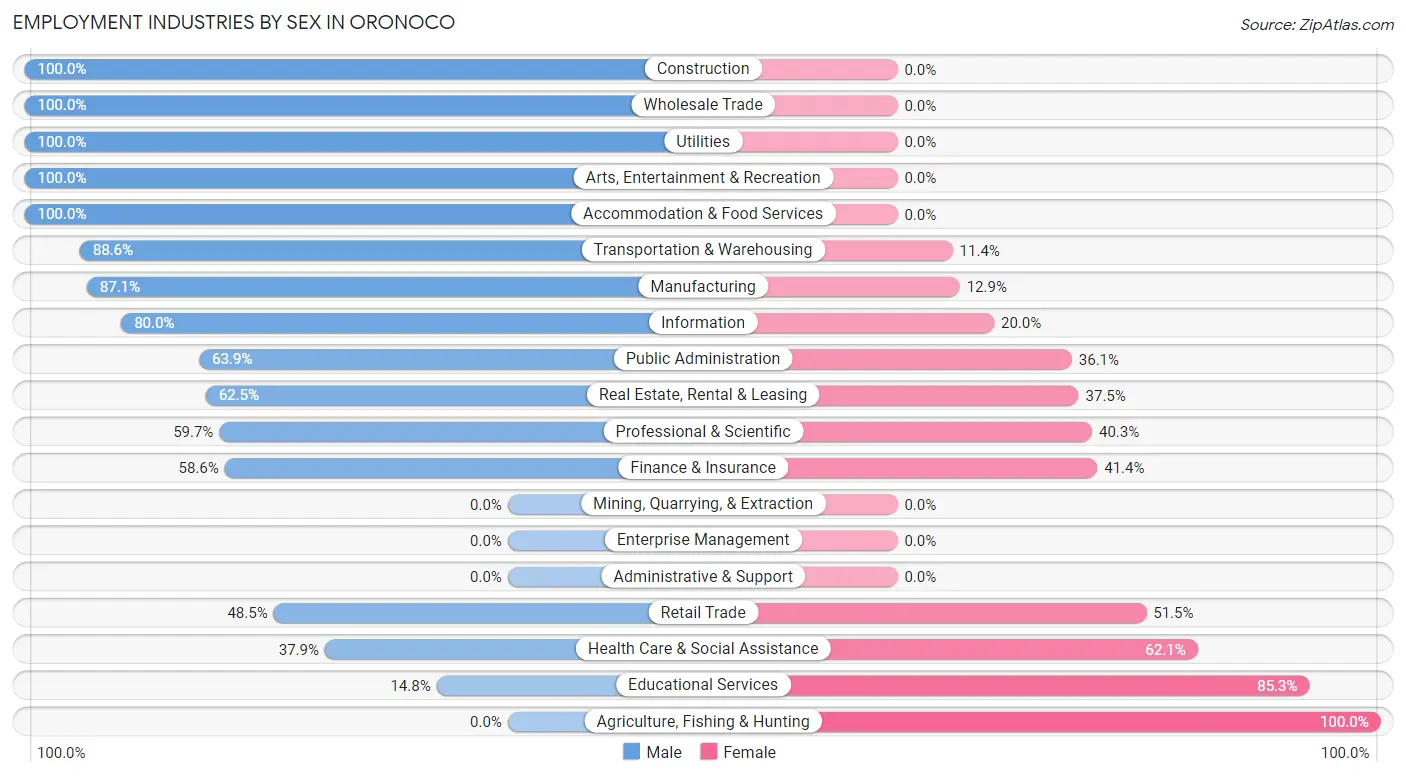
Employment Industries by Sex in Oronoco
The Oronoco industries that see more men than women are Construction (100.0%), Wholesale Trade (100.0%), and Utilities (100.0%), whereas the industries that tend to have a higher number of women are Agriculture, Fishing & Hunting (100.0%), Educational Services (85.3%), and Health Care & Social Assistance (62.1%).
| Industry | Male | Female |
| Agriculture, Fishing & Hunting | 0 (0.0%) | 2 (100.0%) |
| Mining, Quarrying, & Extraction | 0 (0.0%) | 0 (0.0%) |
| Construction | 35 (100.0%) | 0 (0.0%) |
| Manufacturing | 54 (87.1%) | 8 (12.9%) |
| Wholesale Trade | 5 (100.0%) | 0 (0.0%) |
| Retail Trade | 48 (48.5%) | 51 (51.5%) |
| Transportation & Warehousing | 31 (88.6%) | 4 (11.4%) |
| Utilities | 4 (100.0%) | 0 (0.0%) |
| Information | 12 (80.0%) | 3 (20.0%) |
| Finance & Insurance | 17 (58.6%) | 12 (41.4%) |
| Real Estate, Rental & Leasing | 10 (62.5%) | 6 (37.5%) |
| Professional & Scientific | 43 (59.7%) | 29 (40.3%) |
| Enterprise Management | 0 (0.0%) | 0 (0.0%) |
| Administrative & Support | 0 (0.0%) | 0 (0.0%) |
| Educational Services | 9 (14.7%) | 52 (85.3%) |
| Health Care & Social Assistance | 128 (37.9%) | 210 (62.1%) |
| Arts, Entertainment & Recreation | 3 (100.0%) | 0 (0.0%) |
| Accommodation & Food Services | 17 (100.0%) | 0 (0.0%) |
| Public Administration | 23 (63.9%) | 13 (36.1%) |
| Total | 457 (53.7%) | 394 (46.3%) |
Education in Oronoco
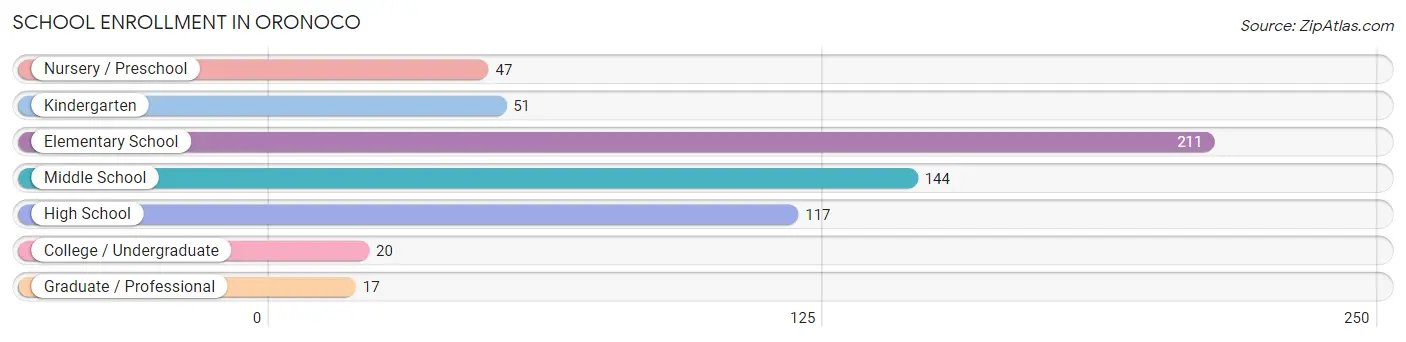
School Enrollment in Oronoco
The most common levels of schooling among the 607 students in Oronoco are elementary school (211 | 34.8%), middle school (144 | 23.7%), and high school (117 | 19.3%).
| School Level | # Students | % Students |
| Nursery / Preschool | 47 | 7.7% |
| Kindergarten | 51 | 8.4% |
| Elementary School | 211 | 34.8% |
| Middle School | 144 | 23.7% |
| High School | 117 | 19.3% |
| College / Undergraduate | 20 | 3.3% |
| Graduate / Professional | 17 | 2.8% |
| Total | 607 | 100.0% |
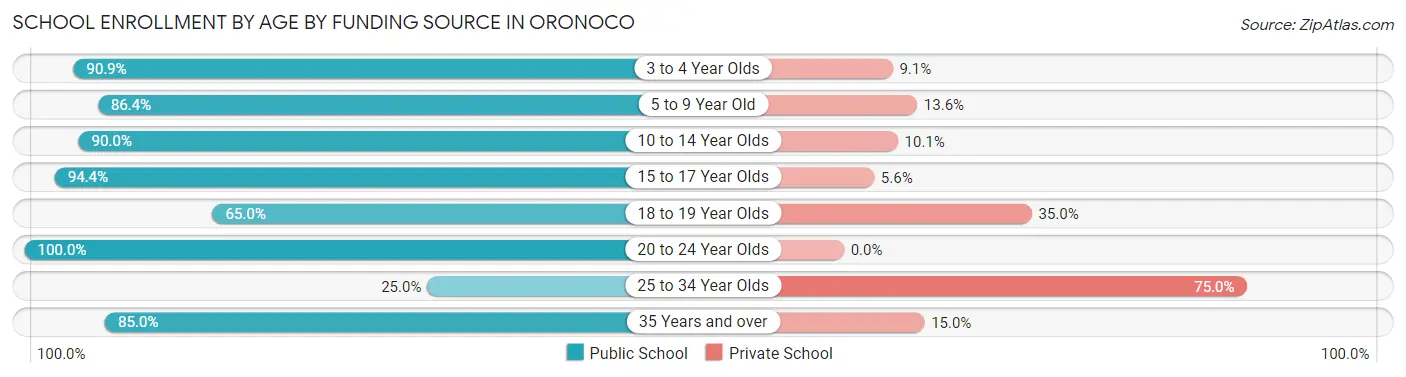
School Enrollment by Age by Funding Source in Oronoco
Out of a total of 607 students who are enrolled in schools in Oronoco, 75 (12.4%) attend a private institution, while the remaining 532 (87.6%) are enrolled in public schools. The age group of 25 to 34 year olds has the highest likelihood of being enrolled in private schools, with 3 (75.0% in the age bracket) enrolled. Conversely, the age group of 20 to 24 year olds has the lowest likelihood of being enrolled in a private school, with 6 (100.0% in the age bracket) attending a public institution.
| Age Bracket | Public School | Private School |
| 3 to 4 Year Olds | 30 (90.9%) | 3 (9.1%) |
| 5 to 9 Year Old | 228 (86.4%) | 36 (13.6%) |
| 10 to 14 Year Olds | 170 (89.9%) | 19 (10.1%) |
| 15 to 17 Year Olds | 67 (94.4%) | 4 (5.6%) |
| 18 to 19 Year Olds | 13 (65.0%) | 7 (35.0%) |
| 20 to 24 Year Olds | 6 (100.0%) | 0 (0.0%) |
| 25 to 34 Year Olds | 1 (25.0%) | 3 (75.0%) |
| 35 Years and over | 17 (85.0%) | 3 (15.0%) |
| Total | 532 (87.6%) | 75 (12.4%) |
Educational Attainment by Field of Study in Oronoco
Science & technology (232 | 35.8%), business (100 | 15.4%), education (57 | 8.8%), computers & mathematics (53 | 8.2%), and bio, nature & agricultural (52 | 8.0%) are the most common fields of study among 648 individuals in Oronoco who have obtained a bachelor's degree or higher.
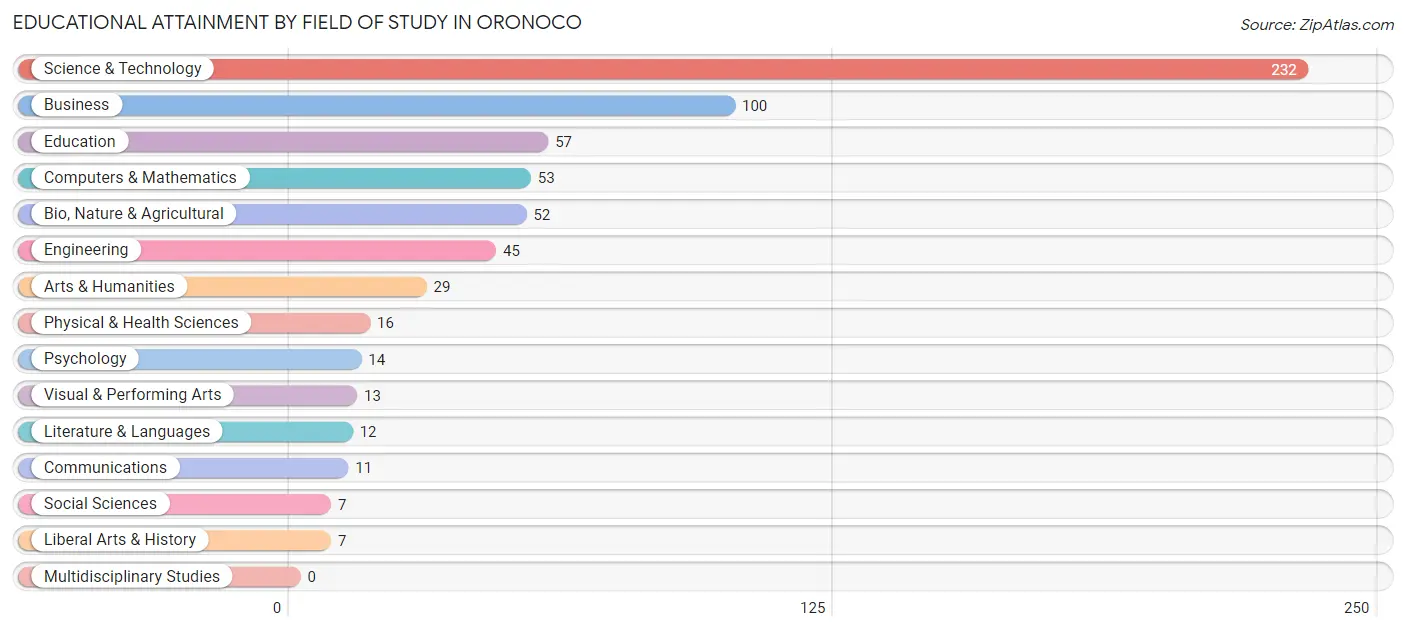
| Field of Study | # Graduates | % Graduates |
| Computers & Mathematics | 53 | 8.2% |
| Bio, Nature & Agricultural | 52 | 8.0% |
| Physical & Health Sciences | 16 | 2.5% |
| Psychology | 14 | 2.2% |
| Social Sciences | 7 | 1.1% |
| Engineering | 45 | 6.9% |
| Multidisciplinary Studies | 0 | 0.0% |
| Science & Technology | 232 | 35.8% |
| Business | 100 | 15.4% |
| Education | 57 | 8.8% |
| Literature & Languages | 12 | 1.8% |
| Liberal Arts & History | 7 | 1.1% |
| Visual & Performing Arts | 13 | 2.0% |
| Communications | 11 | 1.7% |
| Arts & Humanities | 29 | 4.5% |
| Total | 648 | 100.0% |
Transportation & Commute in Oronoco
Vehicle Availability by Sex in Oronoco
The most prevalent vehicle ownership categories in Oronoco are males with 2 vehicles (198, accounting for 43.9%) and females with 2 vehicles (174, making up 52.7%).
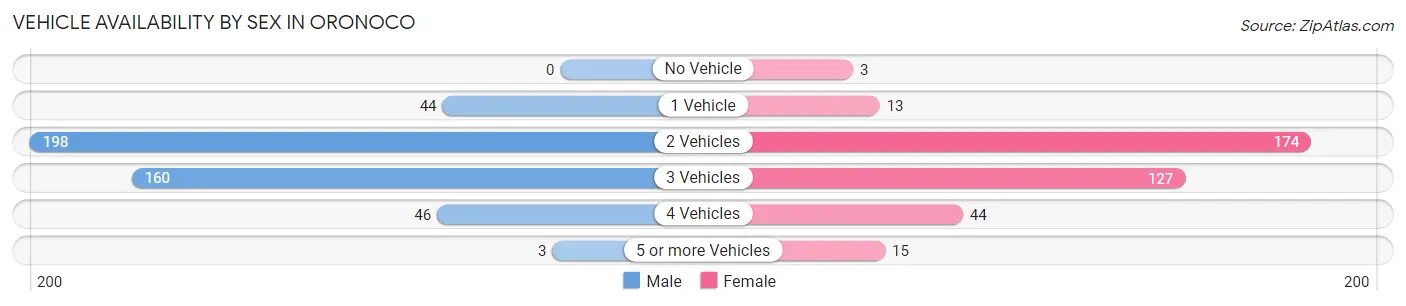
| Vehicles Available | Male | Female |
| No Vehicle | 0 (0.0%) | 3 (0.8%) |
| 1 Vehicle | 44 (9.8%) | 13 (3.5%) |
| 2 Vehicles | 198 (43.9%) | 174 (46.3%) |
| 3 Vehicles | 160 (35.5%) | 127 (33.8%) |
| 4 Vehicles | 46 (10.2%) | 44 (11.7%) |
| 5 or more Vehicles | 3 (0.7%) | 15 (4.0%) |
| Total | 451 (100.0%) | 376 (100.0%) |
Commute Time in Oronoco
The most frequently occuring commute durations in Oronoco are 15 to 19 minutes (234 commuters, 31.3%), 20 to 24 minutes (161 commuters, 21.5%), and 10 to 14 minutes (132 commuters, 17.6%).
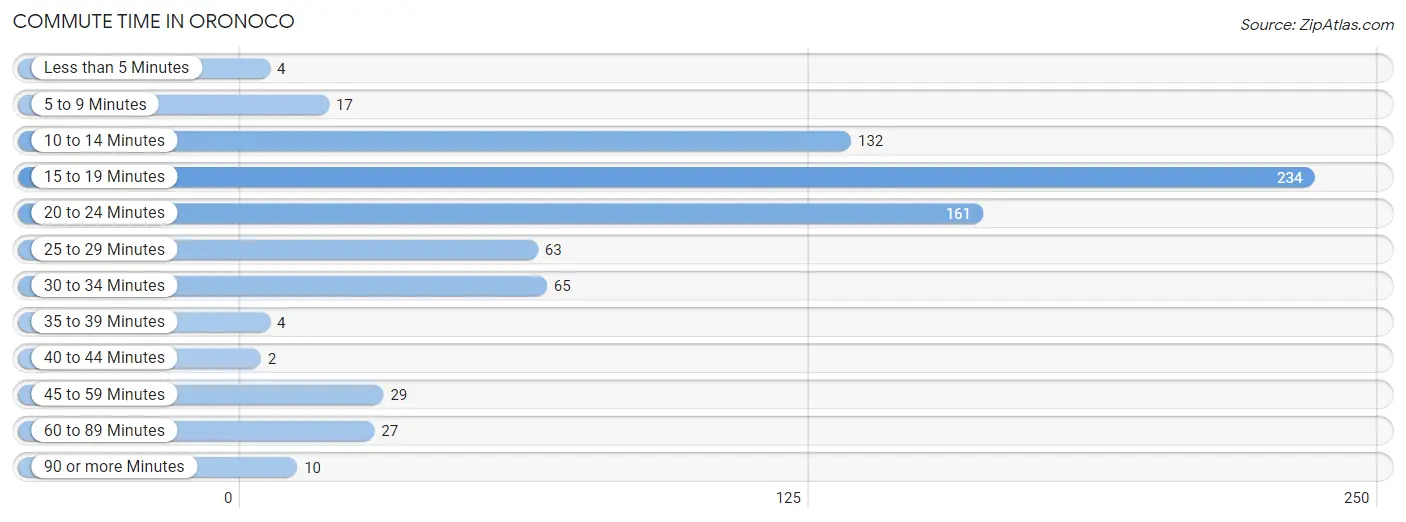
| Commute Time | # Commuters | % Commuters |
| Less than 5 Minutes | 4 | 0.5% |
| 5 to 9 Minutes | 17 | 2.3% |
| 10 to 14 Minutes | 132 | 17.6% |
| 15 to 19 Minutes | 234 | 31.3% |
| 20 to 24 Minutes | 161 | 21.5% |
| 25 to 29 Minutes | 63 | 8.4% |
| 30 to 34 Minutes | 65 | 8.7% |
| 35 to 39 Minutes | 4 | 0.5% |
| 40 to 44 Minutes | 2 | 0.3% |
| 45 to 59 Minutes | 29 | 3.9% |
| 60 to 89 Minutes | 27 | 3.6% |
| 90 or more Minutes | 10 | 1.3% |
Commute Time by Sex in Oronoco
The most common commute times in Oronoco are 15 to 19 minutes (118 commuters, 29.5%) for males and 15 to 19 minutes (116 commuters, 33.3%) for females.
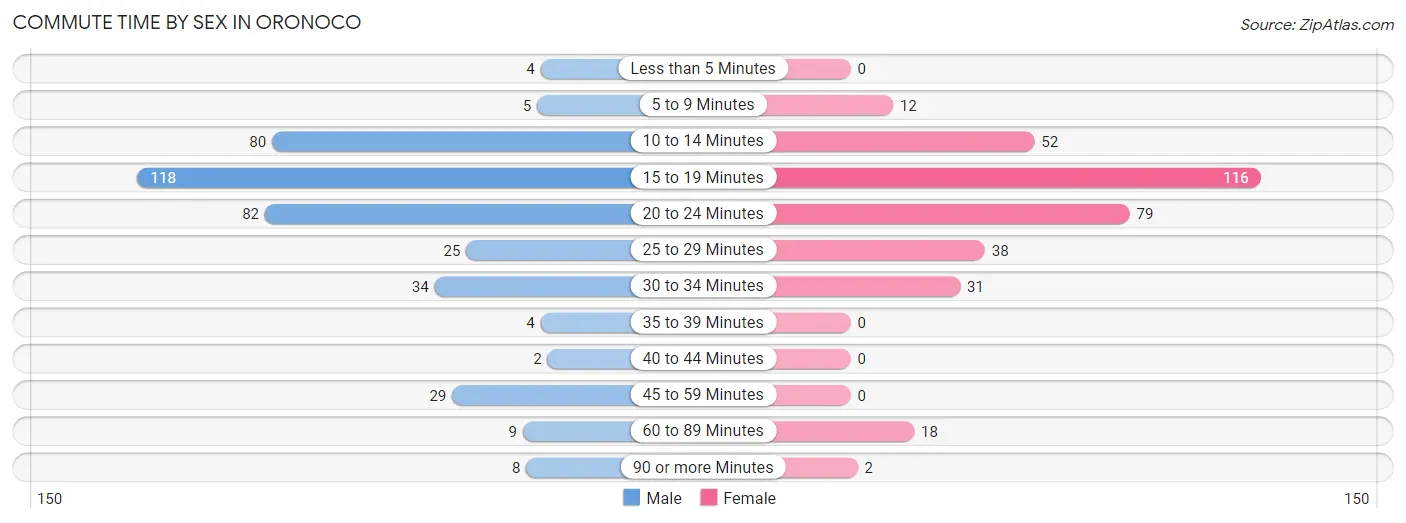
| Commute Time | Male | Female |
| Less than 5 Minutes | 4 (1.0%) | 0 (0.0%) |
| 5 to 9 Minutes | 5 (1.3%) | 12 (3.5%) |
| 10 to 14 Minutes | 80 (20.0%) | 52 (14.9%) |
| 15 to 19 Minutes | 118 (29.5%) | 116 (33.3%) |
| 20 to 24 Minutes | 82 (20.5%) | 79 (22.7%) |
| 25 to 29 Minutes | 25 (6.2%) | 38 (10.9%) |
| 30 to 34 Minutes | 34 (8.5%) | 31 (8.9%) |
| 35 to 39 Minutes | 4 (1.0%) | 0 (0.0%) |
| 40 to 44 Minutes | 2 (0.5%) | 0 (0.0%) |
| 45 to 59 Minutes | 29 (7.2%) | 0 (0.0%) |
| 60 to 89 Minutes | 9 (2.2%) | 18 (5.2%) |
| 90 or more Minutes | 8 (2.0%) | 2 (0.6%) |
Time of Departure to Work by Sex in Oronoco
The most frequent times of departure to work in Oronoco are 7:00 AM to 7:29 AM (78, 19.5%) for males and 7:00 AM to 7:29 AM (78, 22.4%) for females.
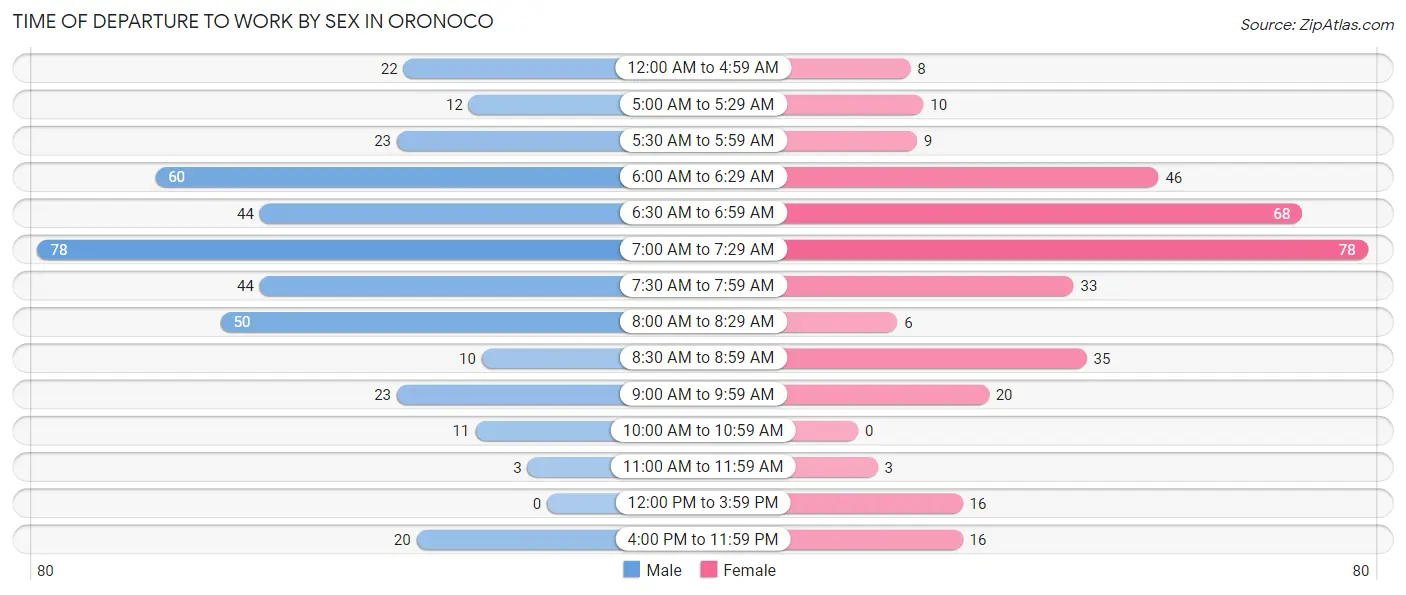
| Time of Departure | Male | Female |
| 12:00 AM to 4:59 AM | 22 (5.5%) | 8 (2.3%) |
| 5:00 AM to 5:29 AM | 12 (3.0%) | 10 (2.9%) |
| 5:30 AM to 5:59 AM | 23 (5.8%) | 9 (2.6%) |
| 6:00 AM to 6:29 AM | 60 (15.0%) | 46 (13.2%) |
| 6:30 AM to 6:59 AM | 44 (11.0%) | 68 (19.5%) |
| 7:00 AM to 7:29 AM | 78 (19.5%) | 78 (22.4%) |
| 7:30 AM to 7:59 AM | 44 (11.0%) | 33 (9.5%) |
| 8:00 AM to 8:29 AM | 50 (12.5%) | 6 (1.7%) |
| 8:30 AM to 8:59 AM | 10 (2.5%) | 35 (10.1%) |
| 9:00 AM to 9:59 AM | 23 (5.8%) | 20 (5.8%) |
| 10:00 AM to 10:59 AM | 11 (2.8%) | 0 (0.0%) |
| 11:00 AM to 11:59 AM | 3 (0.7%) | 3 (0.9%) |
| 12:00 PM to 3:59 PM | 0 (0.0%) | 16 (4.6%) |
| 4:00 PM to 11:59 PM | 20 (5.0%) | 16 (4.6%) |
| Total | 400 (100.0%) | 348 (100.0%) |
Housing Occupancy in Oronoco
Occupancy by Ownership in Oronoco
Of the total 541 dwellings in Oronoco, owner-occupied units account for 532 (98.3%), while renter-occupied units make up 9 (1.7%).
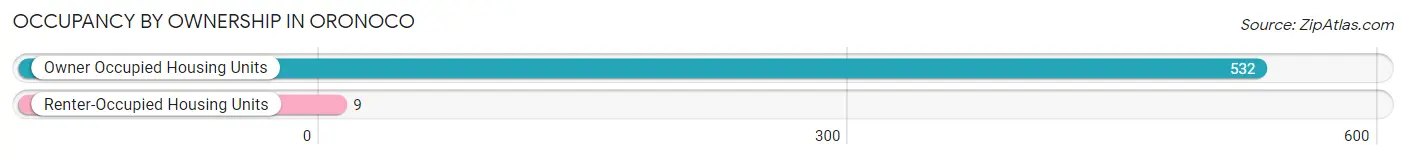
| Occupancy | # Housing Units | % Housing Units |
| Owner Occupied Housing Units | 532 | 98.3% |
| Renter-Occupied Housing Units | 9 | 1.7% |
| Total Occupied Housing Units | 541 | 100.0% |
Occupancy by Household Size in Oronoco
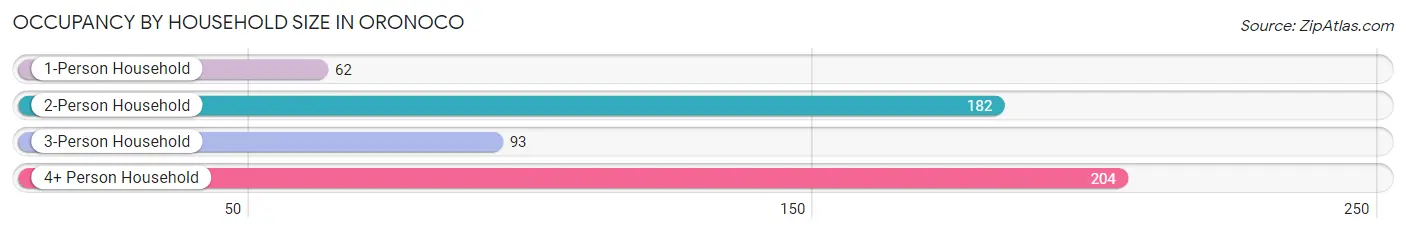
| Household Size | # Housing Units | % Housing Units |
| 1-Person Household | 62 | 11.5% |
| 2-Person Household | 182 | 33.6% |
| 3-Person Household | 93 | 17.2% |
| 4+ Person Household | 204 | 37.7% |
| Total Housing Units | 541 | 100.0% |
Occupancy by Ownership by Household Size in Oronoco
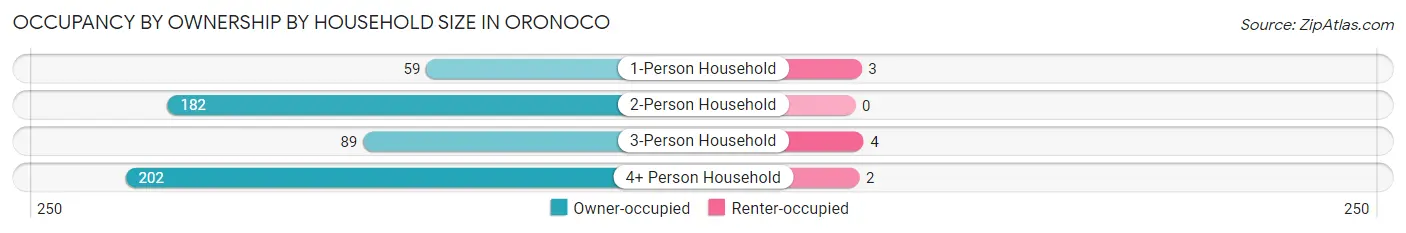
| Household Size | Owner-occupied | Renter-occupied |
| 1-Person Household | 59 (95.2%) | 3 (4.8%) |
| 2-Person Household | 182 (100.0%) | 0 (0.0%) |
| 3-Person Household | 89 (95.7%) | 4 (4.3%) |
| 4+ Person Household | 202 (99.0%) | 2 (1.0%) |
| Total Housing Units | 532 (98.3%) | 9 (1.7%) |
Occupancy by Educational Attainment in Oronoco
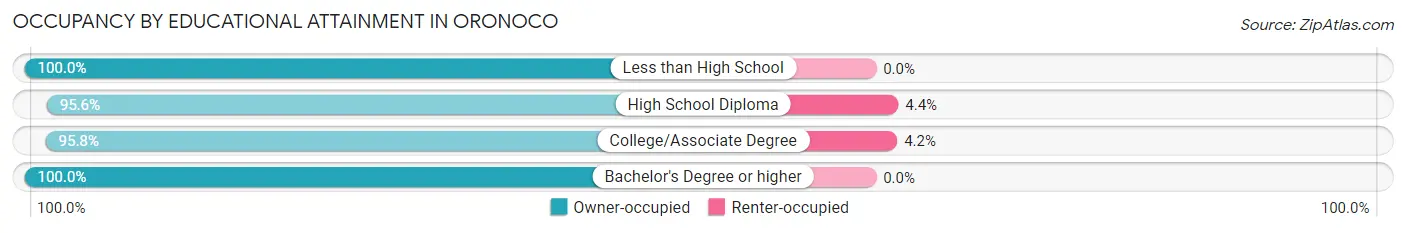
| Household Size | Owner-occupied | Renter-occupied |
| Less than High School | 4 (100.0%) | 0 (0.0%) |
| High School Diploma | 87 (95.6%) | 4 (4.4%) |
| College/Associate Degree | 115 (95.8%) | 5 (4.2%) |
| Bachelor's Degree or higher | 326 (100.0%) | 0 (0.0%) |
Occupancy by Age of Householder in Oronoco
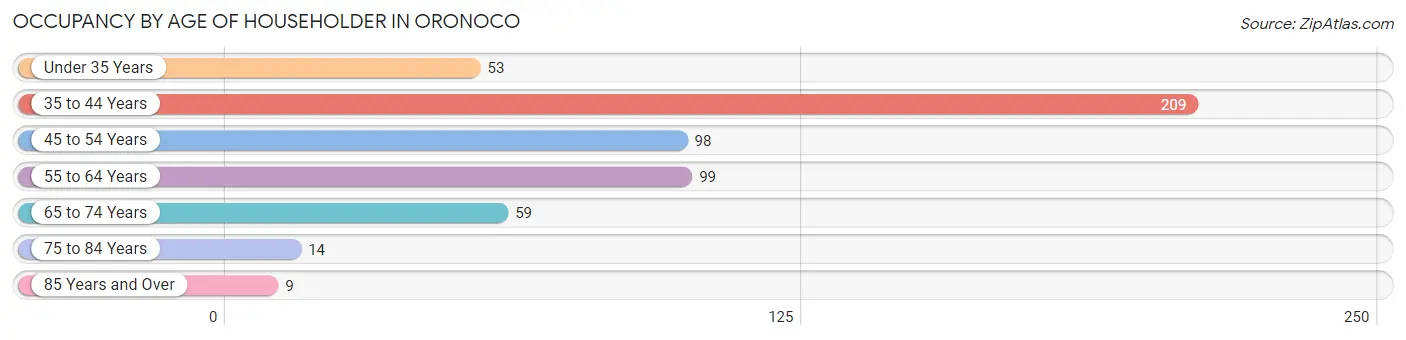
| Age Bracket | # Households | % Households |
| Under 35 Years | 53 | 9.8% |
| 35 to 44 Years | 209 | 38.6% |
| 45 to 54 Years | 98 | 18.1% |
| 55 to 64 Years | 99 | 18.3% |
| 65 to 74 Years | 59 | 10.9% |
| 75 to 84 Years | 14 | 2.6% |
| 85 Years and Over | 9 | 1.7% |
| Total | 541 | 100.0% |
Housing Finances in Oronoco
Median Income by Occupancy in Oronoco
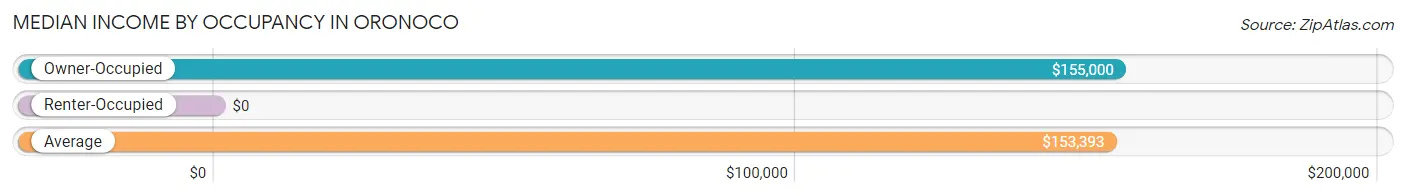
| Occupancy Type | # Households | Median Income |
| Owner-Occupied | 532 (98.3%) | $155,000 |
| Renter-Occupied | 9 (1.7%) | $0 |
| Average | 541 (100.0%) | $153,393 |
Occupancy by Householder Income Bracket in Oronoco
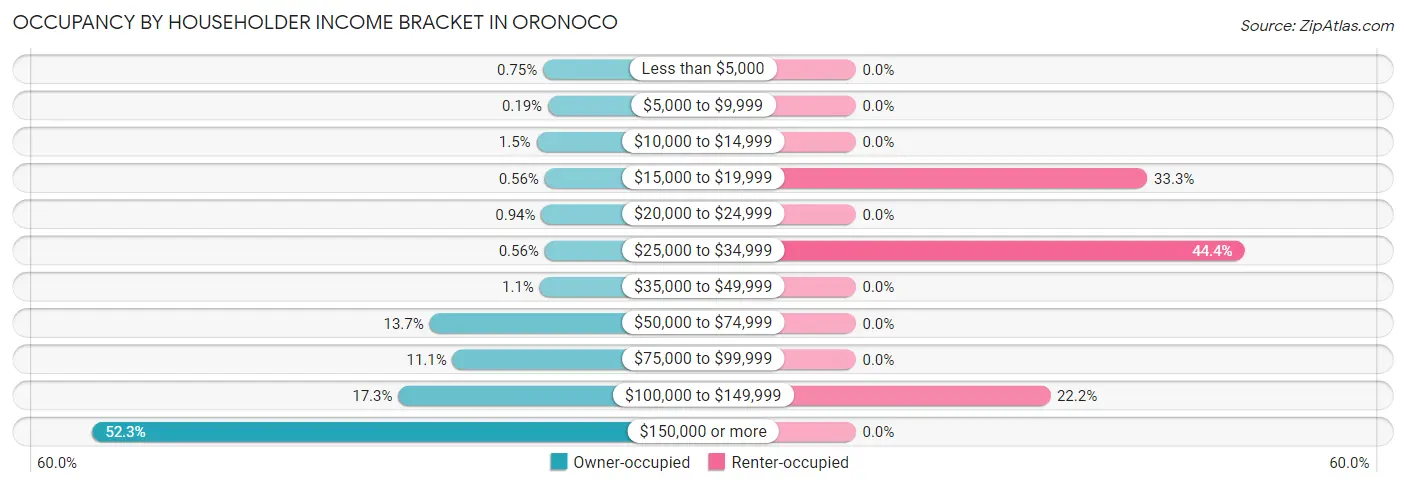
| Income Bracket | Owner-occupied | Renter-occupied |
| Less than $5,000 | 4 (0.7%) | 0 (0.0%) |
| $5,000 to $9,999 | 1 (0.2%) | 0 (0.0%) |
| $10,000 to $14,999 | 8 (1.5%) | 0 (0.0%) |
| $15,000 to $19,999 | 3 (0.6%) | 3 (33.3%) |
| $20,000 to $24,999 | 5 (0.9%) | 0 (0.0%) |
| $25,000 to $34,999 | 3 (0.6%) | 4 (44.4%) |
| $35,000 to $49,999 | 6 (1.1%) | 0 (0.0%) |
| $50,000 to $74,999 | 73 (13.7%) | 0 (0.0%) |
| $75,000 to $99,999 | 59 (11.1%) | 0 (0.0%) |
| $100,000 to $149,999 | 92 (17.3%) | 2 (22.2%) |
| $150,000 or more | 278 (52.3%) | 0 (0.0%) |
| Total | 532 (100.0%) | 9 (100.0%) |
Monthly Housing Cost Tiers in Oronoco
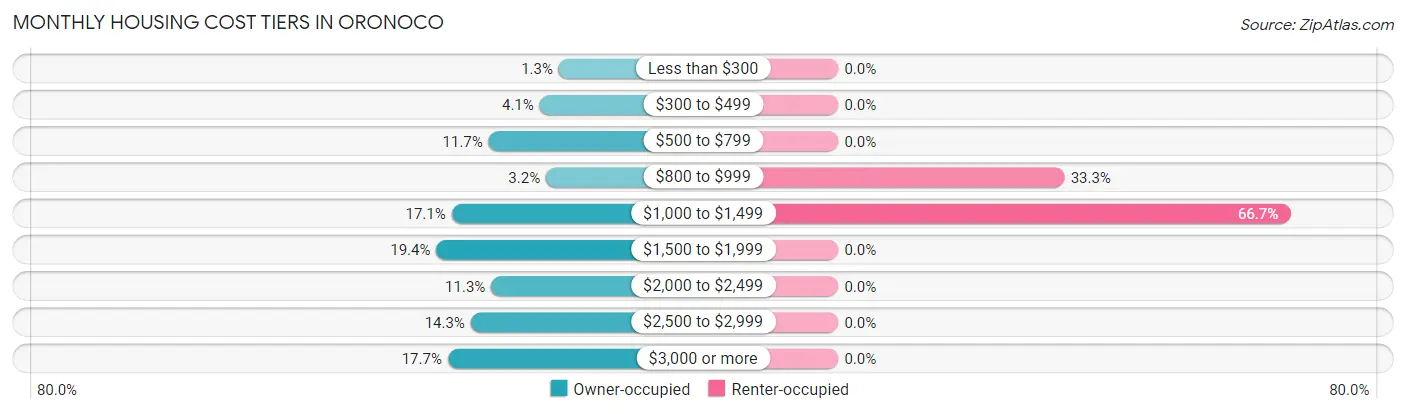
| Monthly Cost | Owner-occupied | Renter-occupied |
| Less than $300 | 7 (1.3%) | 0 (0.0%) |
| $300 to $499 | 22 (4.1%) | 0 (0.0%) |
| $500 to $799 | 62 (11.7%) | 0 (0.0%) |
| $800 to $999 | 17 (3.2%) | 3 (33.3%) |
| $1,000 to $1,499 | 91 (17.1%) | 6 (66.7%) |
| $1,500 to $1,999 | 103 (19.4%) | 0 (0.0%) |
| $2,000 to $2,499 | 60 (11.3%) | 0 (0.0%) |
| $2,500 to $2,999 | 76 (14.3%) | 0 (0.0%) |
| $3,000 or more | 94 (17.7%) | 0 (0.0%) |
| Total | 532 (100.0%) | 9 (100.0%) |
Physical Housing Characteristics in Oronoco
Housing Structures in Oronoco
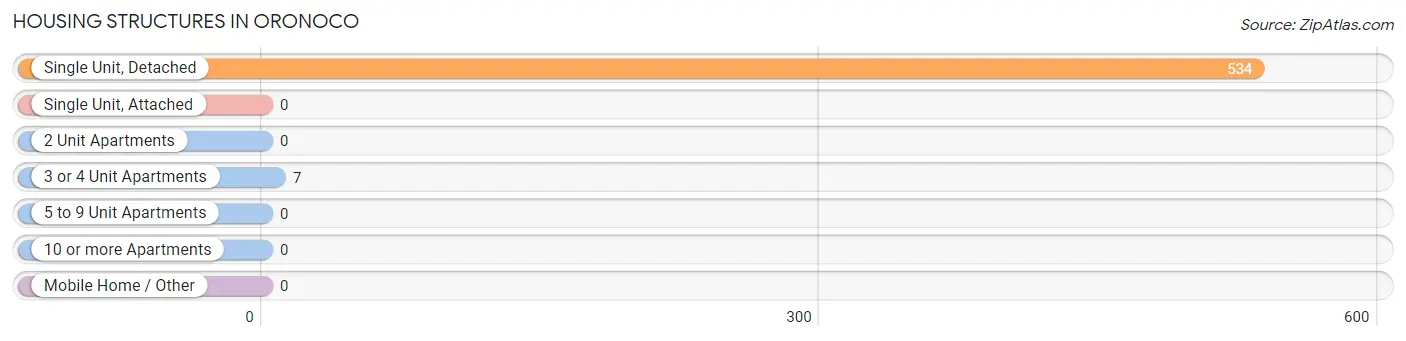
| Structure Type | # Housing Units | % Housing Units |
| Single Unit, Detached | 534 | 98.7% |
| Single Unit, Attached | 0 | 0.0% |
| 2 Unit Apartments | 0 | 0.0% |
| 3 or 4 Unit Apartments | 7 | 1.3% |
| 5 to 9 Unit Apartments | 0 | 0.0% |
| 10 or more Apartments | 0 | 0.0% |
| Mobile Home / Other | 0 | 0.0% |
| Total | 541 | 100.0% |
Housing Structures by Occupancy in Oronoco
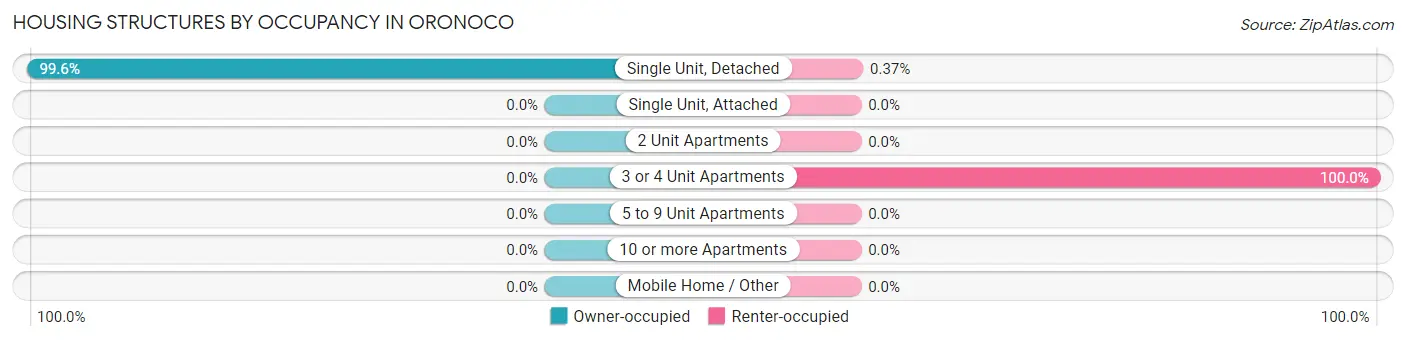
| Structure Type | Owner-occupied | Renter-occupied |
| Single Unit, Detached | 532 (99.6%) | 2 (0.4%) |
| Single Unit, Attached | 0 (0.0%) | 0 (0.0%) |
| 2 Unit Apartments | 0 (0.0%) | 0 (0.0%) |
| 3 or 4 Unit Apartments | 0 (0.0%) | 7 (100.0%) |
| 5 to 9 Unit Apartments | 0 (0.0%) | 0 (0.0%) |
| 10 or more Apartments | 0 (0.0%) | 0 (0.0%) |
| Mobile Home / Other | 0 (0.0%) | 0 (0.0%) |
| Total | 532 (98.3%) | 9 (1.7%) |
Housing Structures by Number of Rooms in Oronoco
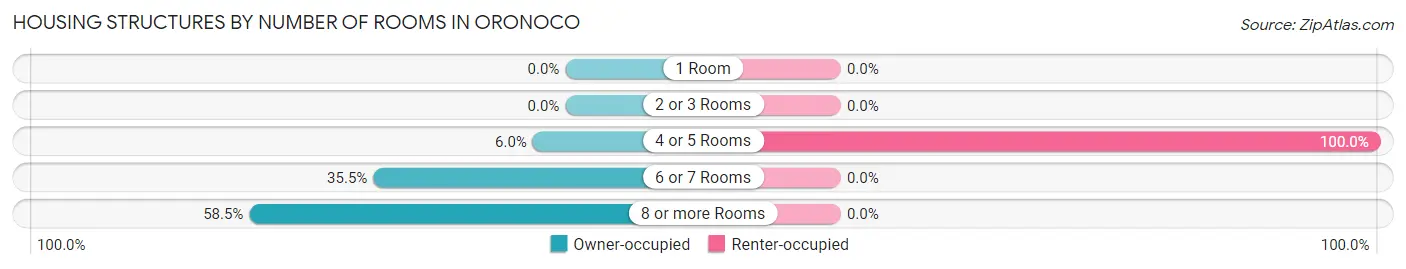
| Number of Rooms | Owner-occupied | Renter-occupied |
| 1 Room | 0 (0.0%) | 0 (0.0%) |
| 2 or 3 Rooms | 0 (0.0%) | 0 (0.0%) |
| 4 or 5 Rooms | 32 (6.0%) | 9 (100.0%) |
| 6 or 7 Rooms | 189 (35.5%) | 0 (0.0%) |
| 8 or more Rooms | 311 (58.5%) | 0 (0.0%) |
| Total | 532 (100.0%) | 9 (100.0%) |
Housing Structure by Heating Type in Oronoco
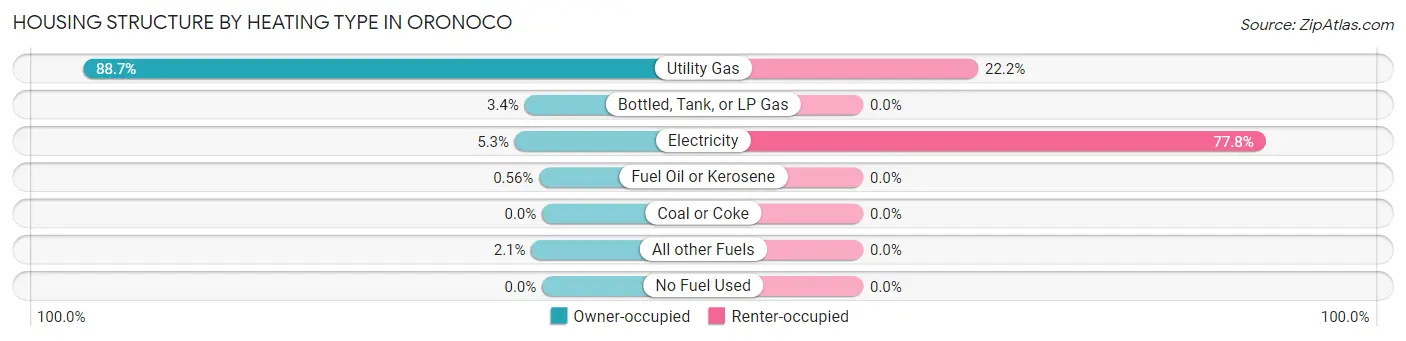
| Heating Type | Owner-occupied | Renter-occupied |
| Utility Gas | 472 (88.7%) | 2 (22.2%) |
| Bottled, Tank, or LP Gas | 18 (3.4%) | 0 (0.0%) |
| Electricity | 28 (5.3%) | 7 (77.8%) |
| Fuel Oil or Kerosene | 3 (0.6%) | 0 (0.0%) |
| Coal or Coke | 0 (0.0%) | 0 (0.0%) |
| All other Fuels | 11 (2.1%) | 0 (0.0%) |
| No Fuel Used | 0 (0.0%) | 0 (0.0%) |
| Total | 532 (100.0%) | 9 (100.0%) |
Household Vehicle Usage in Oronoco
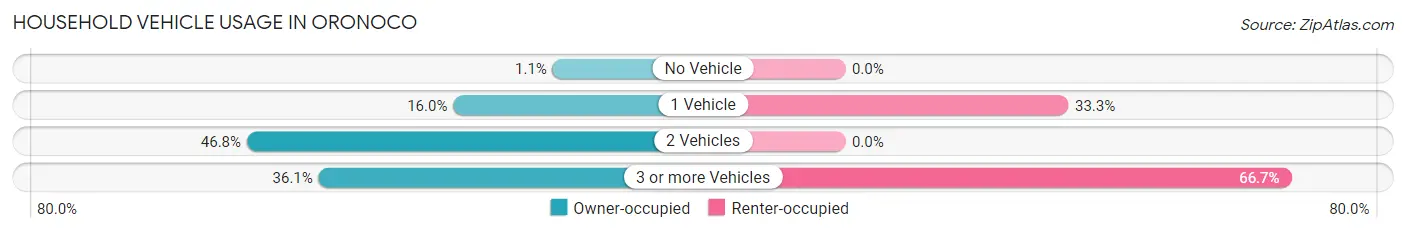
| Vehicles per Household | Owner-occupied | Renter-occupied |
| No Vehicle | 6 (1.1%) | 0 (0.0%) |
| 1 Vehicle | 85 (16.0%) | 3 (33.3%) |
| 2 Vehicles | 249 (46.8%) | 0 (0.0%) |
| 3 or more Vehicles | 192 (36.1%) | 6 (66.7%) |
| Total | 532 (100.0%) | 9 (100.0%) |
Real Estate & Mortgages in Oronoco
Real Estate and Mortgage Overview in Oronoco
| Characteristic | Without Mortgage | With Mortgage |
| Housing Units | 118 | 414 |
| Median Property Value | $306,500 | $432,700 |
| Median Household Income | $128,125 | $222 |
| Monthly Housing Costs | $700 | $94 |
| Real Estate Taxes | $3,737 | $4 |
Property Value by Mortgage Status in Oronoco
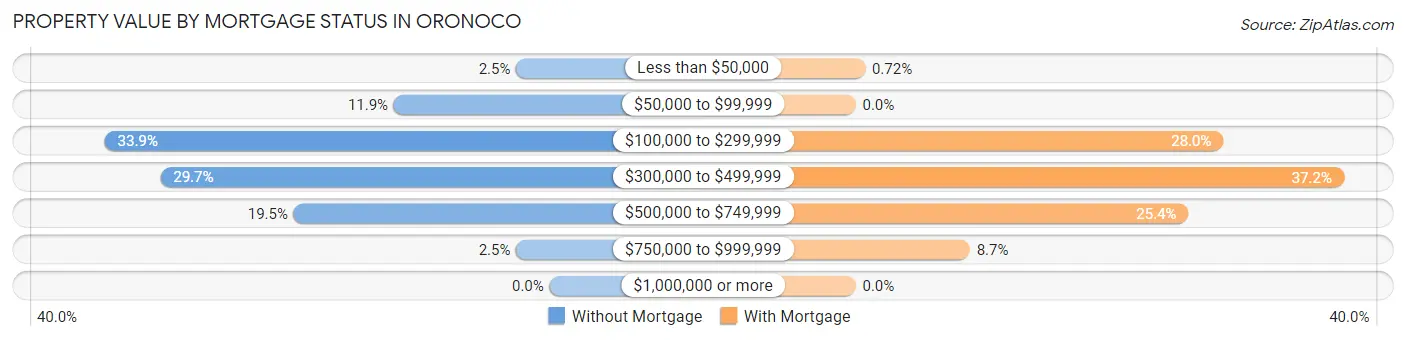
| Property Value | Without Mortgage | With Mortgage |
| Less than $50,000 | 3 (2.5%) | 3 (0.7%) |
| $50,000 to $99,999 | 14 (11.9%) | 0 (0.0%) |
| $100,000 to $299,999 | 40 (33.9%) | 116 (28.0%) |
| $300,000 to $499,999 | 35 (29.7%) | 154 (37.2%) |
| $500,000 to $749,999 | 23 (19.5%) | 105 (25.4%) |
| $750,000 to $999,999 | 3 (2.5%) | 36 (8.7%) |
| $1,000,000 or more | 0 (0.0%) | 0 (0.0%) |
| Total | 118 (100.0%) | 414 (100.0%) |
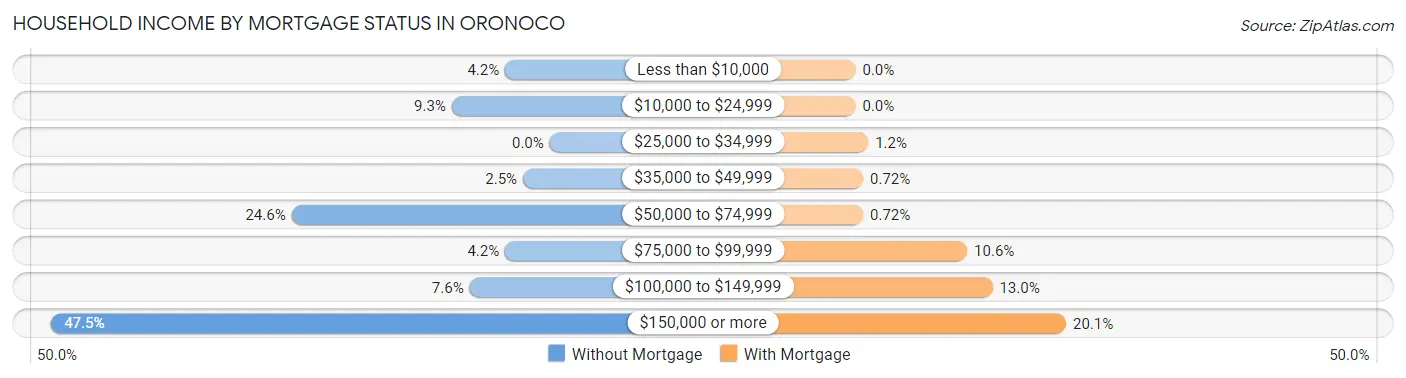
Household Income by Mortgage Status in Oronoco
| Household Income | Without Mortgage | With Mortgage |
| Less than $10,000 | 5 (4.2%) | 0 (0.0%) |
| $10,000 to $24,999 | 11 (9.3%) | 0 (0.0%) |
| $25,000 to $34,999 | 0 (0.0%) | 5 (1.2%) |
| $35,000 to $49,999 | 3 (2.5%) | 3 (0.7%) |
| $50,000 to $74,999 | 29 (24.6%) | 3 (0.7%) |
| $75,000 to $99,999 | 5 (4.2%) | 44 (10.6%) |
| $100,000 to $149,999 | 9 (7.6%) | 54 (13.0%) |
| $150,000 or more | 56 (47.5%) | 83 (20.1%) |
| Total | 118 (100.0%) | 414 (100.0%) |
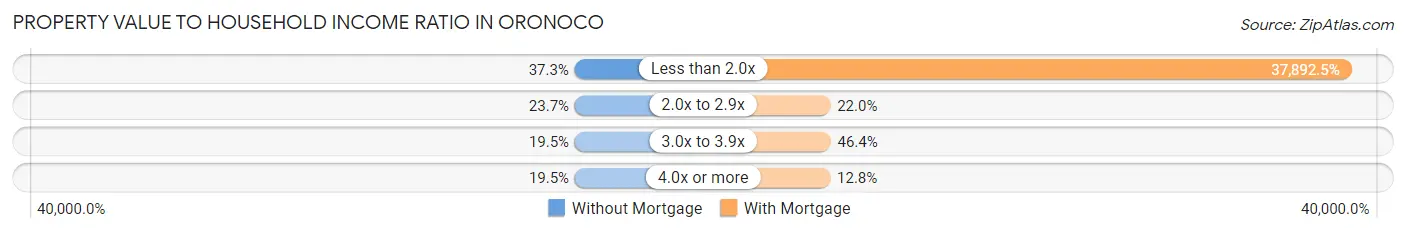
Property Value to Household Income Ratio in Oronoco
| Value-to-Income Ratio | Without Mortgage | With Mortgage |
| Less than 2.0x | 44 (37.3%) | 156,875 (37,892.5%) |
| 2.0x to 2.9x | 28 (23.7%) | 91 (22.0%) |
| 3.0x to 3.9x | 23 (19.5%) | 192 (46.4%) |
| 4.0x or more | 23 (19.5%) | 53 (12.8%) |
| Total | 118 (100.0%) | 414 (100.0%) |
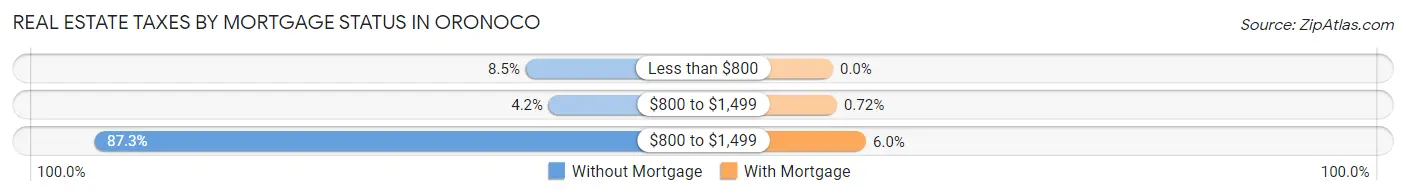
Real Estate Taxes by Mortgage Status in Oronoco
| Property Taxes | Without Mortgage | With Mortgage |
| Less than $800 | 10 (8.5%) | 0 (0.0%) |
| $800 to $1,499 | 5 (4.2%) | 3 (0.7%) |
| $800 to $1,499 | 103 (87.3%) | 25 (6.0%) |
| Total | 118 (100.0%) | 414 (100.0%) |
Health & Disability in Oronoco
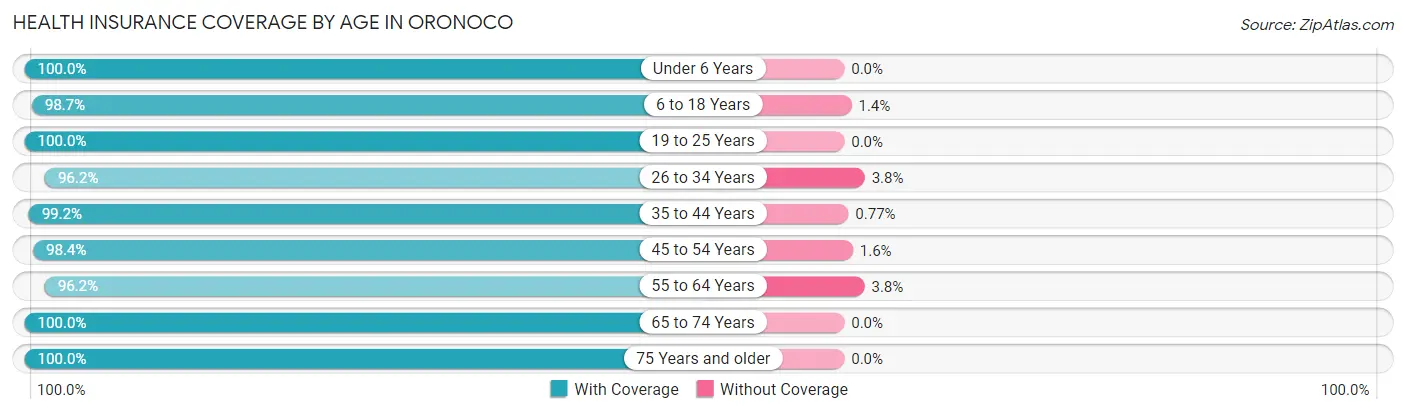
Health Insurance Coverage by Age in Oronoco
| Age Bracket | With Coverage | Without Coverage |
| Under 6 Years | 133 (100.0%) | 0 (0.0%) |
| 6 to 18 Years | 511 (98.7%) | 7 (1.3%) |
| 19 to 25 Years | 36 (100.0%) | 0 (0.0%) |
| 26 to 34 Years | 101 (96.2%) | 4 (3.8%) |
| 35 to 44 Years | 386 (99.2%) | 3 (0.8%) |
| 45 to 54 Years | 186 (98.4%) | 3 (1.6%) |
| 55 to 64 Years | 178 (96.2%) | 7 (3.8%) |
| 65 to 74 Years | 106 (100.0%) | 0 (0.0%) |
| 75 Years and older | 35 (100.0%) | 0 (0.0%) |
| Total | 1,672 (98.6%) | 24 (1.4%) |
Health Insurance Coverage by Citizenship Status in Oronoco
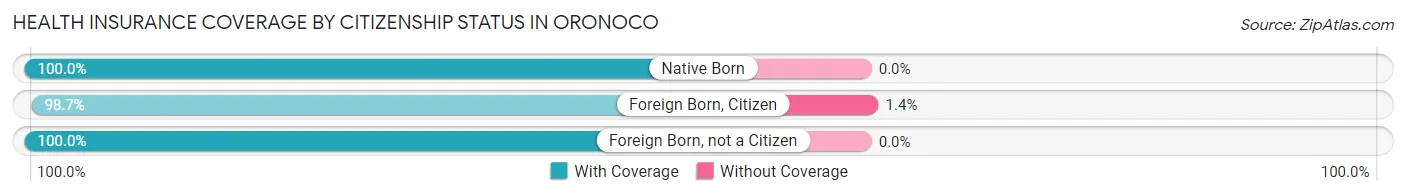
| Citizenship Status | With Coverage | Without Coverage |
| Native Born | 133 (100.0%) | 0 (0.0%) |
| Foreign Born, Citizen | 511 (98.7%) | 7 (1.3%) |
| Foreign Born, not a Citizen | 36 (100.0%) | 0 (0.0%) |
Health Insurance Coverage by Household Income in Oronoco
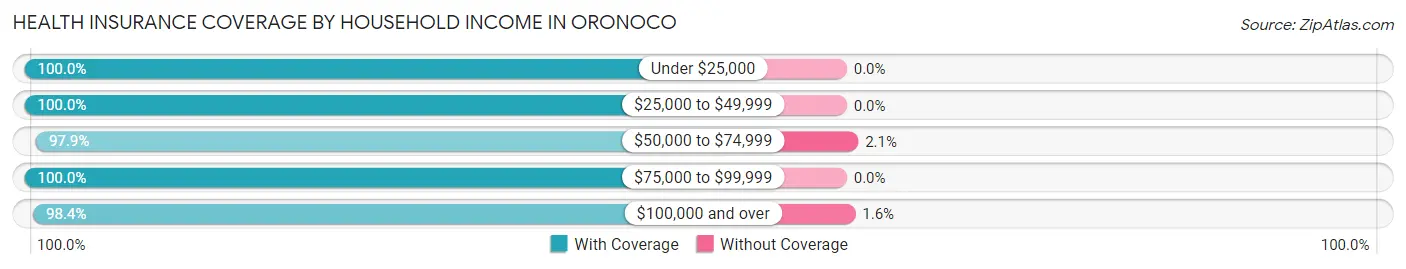
| Household Income | With Coverage | Without Coverage |
| Under $25,000 | 29 (100.0%) | 0 (0.0%) |
| $25,000 to $49,999 | 30 (100.0%) | 0 (0.0%) |
| $50,000 to $74,999 | 137 (97.9%) | 3 (2.1%) |
| $75,000 to $99,999 | 164 (100.0%) | 0 (0.0%) |
| $100,000 and over | 1,291 (98.4%) | 21 (1.6%) |
Public vs Private Health Insurance Coverage by Age in Oronoco
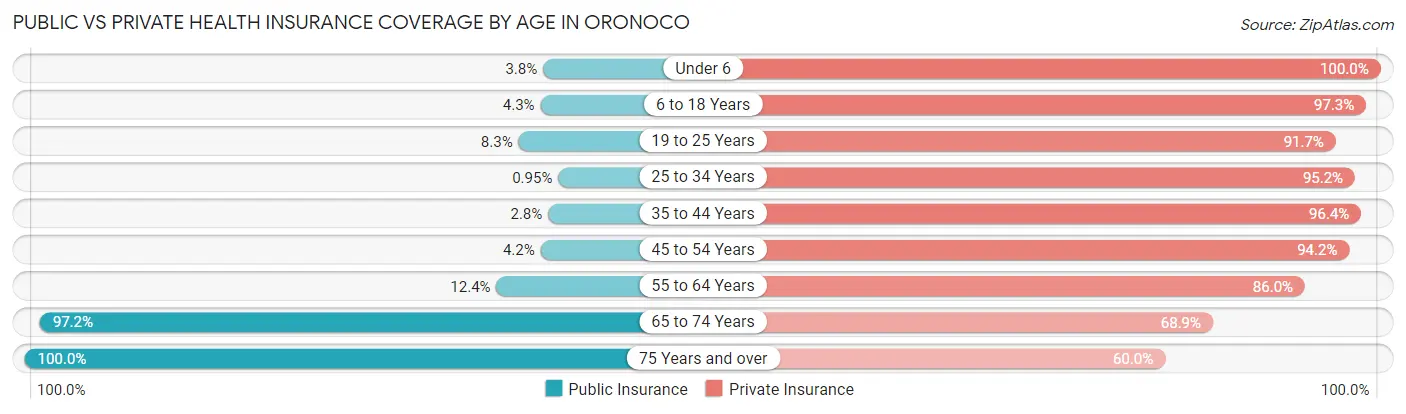
| Age Bracket | Public Insurance | Private Insurance |
| Under 6 | 5 (3.8%) | 133 (100.0%) |
| 6 to 18 Years | 22 (4.3%) | 504 (97.3%) |
| 19 to 25 Years | 3 (8.3%) | 33 (91.7%) |
| 25 to 34 Years | 1 (0.9%) | 100 (95.2%) |
| 35 to 44 Years | 11 (2.8%) | 375 (96.4%) |
| 45 to 54 Years | 8 (4.2%) | 178 (94.2%) |
| 55 to 64 Years | 23 (12.4%) | 159 (86.0%) |
| 65 to 74 Years | 103 (97.2%) | 73 (68.9%) |
| 75 Years and over | 35 (100.0%) | 21 (60.0%) |
| Total | 211 (12.4%) | 1,576 (92.9%) |
Disability Status by Sex by Age in Oronoco
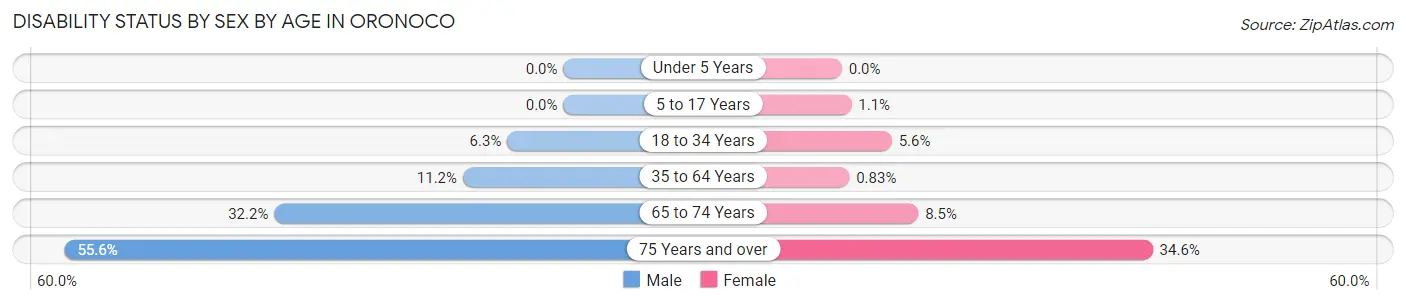
| Age Bracket | Male | Female |
| Under 5 Years | 0 (0.0%) | 0 (0.0%) |
| 5 to 17 Years | 0 (0.0%) | 3 (1.1%) |
| 18 to 34 Years | 5 (6.2%) | 4 (5.6%) |
| 35 to 64 Years | 45 (11.2%) | 3 (0.8%) |
| 65 to 74 Years | 19 (32.2%) | 4 (8.5%) |
| 75 Years and over | 5 (55.6%) | 9 (34.6%) |
Disability Class by Sex by Age in Oronoco
Disability Class: Hearing Difficulty
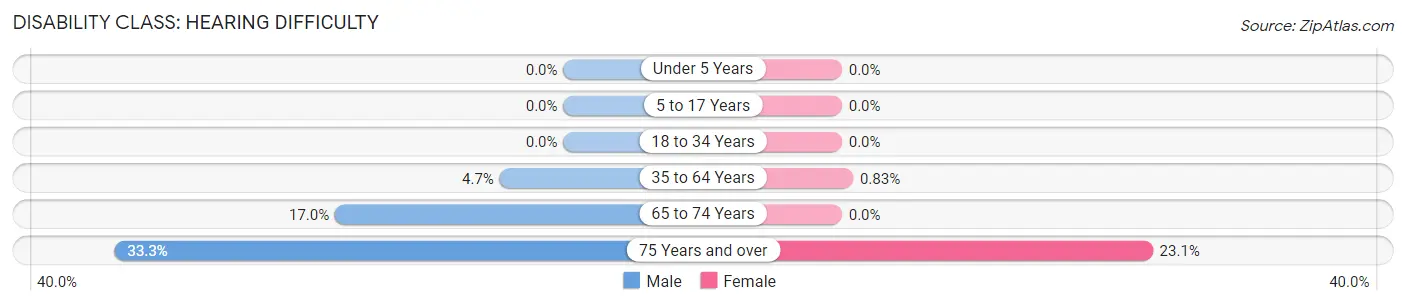
| Age Bracket | Male | Female |
| Under 5 Years | 0 (0.0%) | 0 (0.0%) |
| 5 to 17 Years | 0 (0.0%) | 0 (0.0%) |
| 18 to 34 Years | 0 (0.0%) | 0 (0.0%) |
| 35 to 64 Years | 19 (4.7%) | 3 (0.8%) |
| 65 to 74 Years | 10 (17.0%) | 0 (0.0%) |
| 75 Years and over | 3 (33.3%) | 6 (23.1%) |
Disability Class: Vision Difficulty
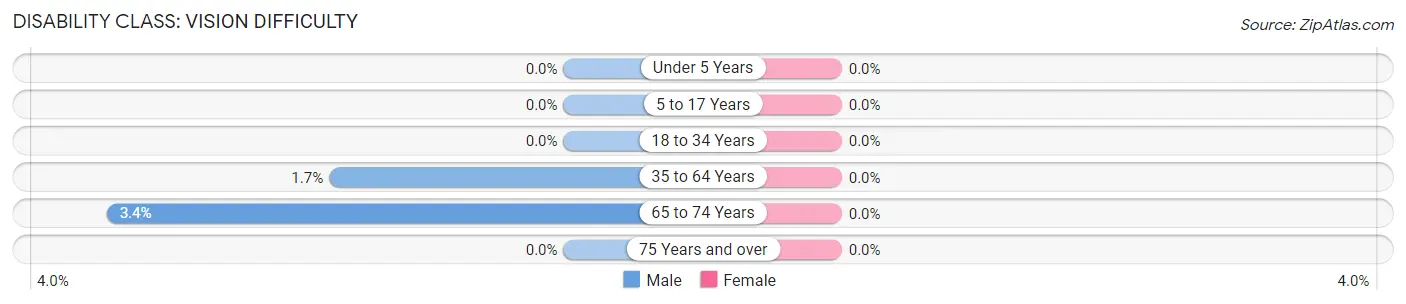
| Age Bracket | Male | Female |
| Under 5 Years | 0 (0.0%) | 0 (0.0%) |
| 5 to 17 Years | 0 (0.0%) | 0 (0.0%) |
| 18 to 34 Years | 0 (0.0%) | 0 (0.0%) |
| 35 to 64 Years | 7 (1.7%) | 0 (0.0%) |
| 65 to 74 Years | 2 (3.4%) | 0 (0.0%) |
| 75 Years and over | 0 (0.0%) | 0 (0.0%) |
Disability Class: Cognitive Difficulty
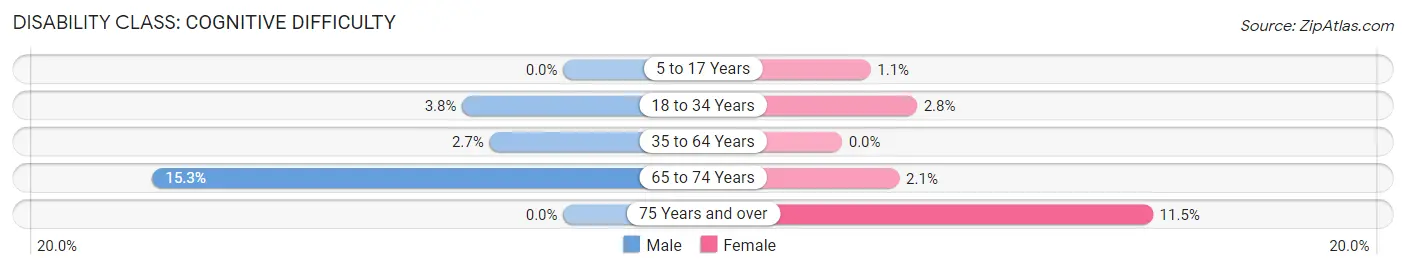
| Age Bracket | Male | Female |
| 5 to 17 Years | 0 (0.0%) | 3 (1.1%) |
| 18 to 34 Years | 3 (3.7%) | 2 (2.8%) |
| 35 to 64 Years | 11 (2.7%) | 0 (0.0%) |
| 65 to 74 Years | 9 (15.2%) | 1 (2.1%) |
| 75 Years and over | 0 (0.0%) | 3 (11.5%) |
Disability Class: Ambulatory Difficulty
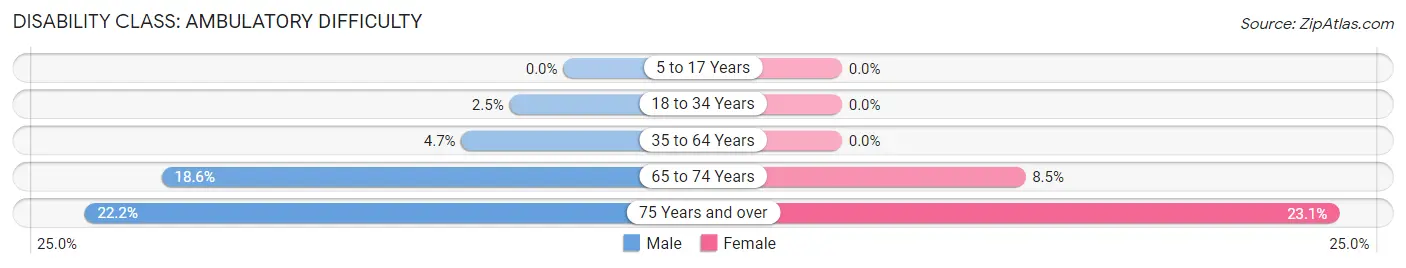
| Age Bracket | Male | Female |
| 5 to 17 Years | 0 (0.0%) | 0 (0.0%) |
| 18 to 34 Years | 2 (2.5%) | 0 (0.0%) |
| 35 to 64 Years | 19 (4.7%) | 0 (0.0%) |
| 65 to 74 Years | 11 (18.6%) | 4 (8.5%) |
| 75 Years and over | 2 (22.2%) | 6 (23.1%) |
Disability Class: Self-Care Difficulty
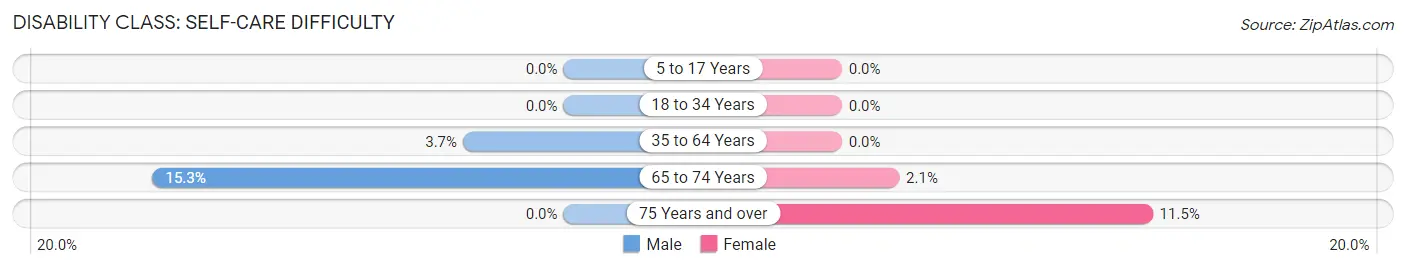
| Age Bracket | Male | Female |
| 5 to 17 Years | 0 (0.0%) | 0 (0.0%) |
| 18 to 34 Years | 0 (0.0%) | 0 (0.0%) |
| 35 to 64 Years | 15 (3.7%) | 0 (0.0%) |
| 65 to 74 Years | 9 (15.2%) | 1 (2.1%) |
| 75 Years and over | 0 (0.0%) | 3 (11.5%) |
Technology Access in Oronoco
Computing Device Access in Oronoco
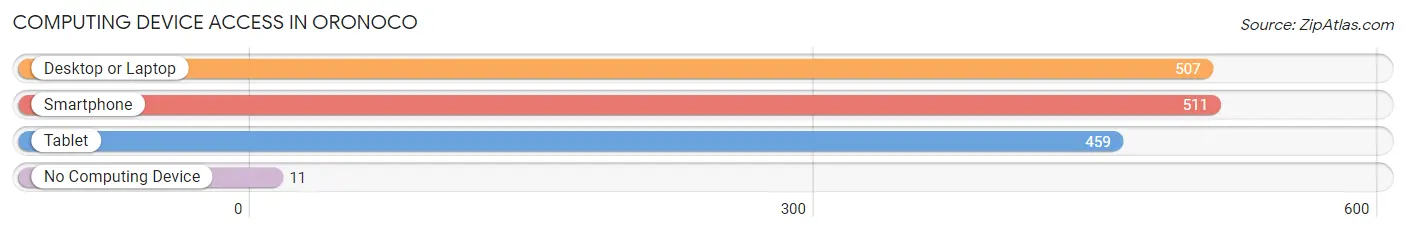
| Device Type | # Households | % Households |
| Desktop or Laptop | 507 | 93.7% |
| Smartphone | 511 | 94.5% |
| Tablet | 459 | 84.8% |
| No Computing Device | 11 | 2.0% |
| Total | 541 | 100.0% |
Internet Access in Oronoco
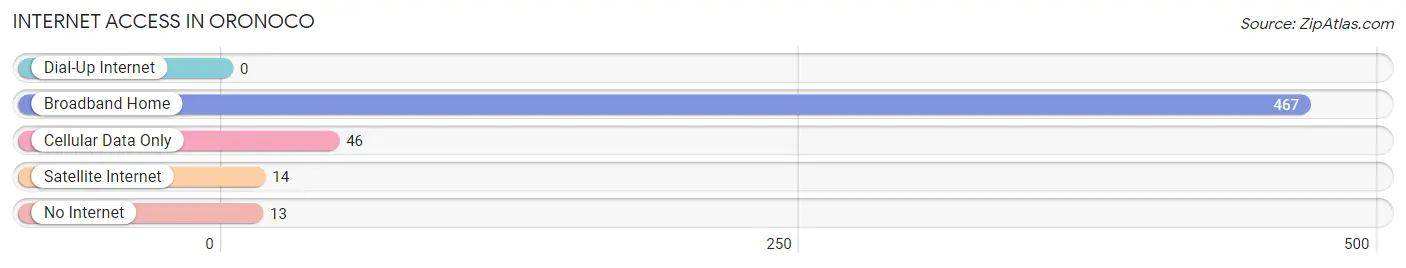
| Internet Type | # Households | % Households |
| Dial-Up Internet | 0 | 0.0% |
| Broadband Home | 467 | 86.3% |
| Cellular Data Only | 46 | 8.5% |
| Satellite Internet | 14 | 2.6% |
| No Internet | 13 | 2.4% |
| Total | 541 | 100.0% |
Oronoco Summary
Oronoco, Minnesota is a small city located in Olmsted County, in the southeastern part of the state. It is situated on the banks of the Zumbro River, and is part of the Rochester Metropolitan Statistical Area. The city has a population of 1,845, according to the 2010 census.
History
Oronoco was founded in 1854 by a group of settlers from New York. The city was named after the Oronoco River in Virginia, which was named after a Native American tribe. The settlers built a sawmill and a gristmill, and the city quickly grew. By 1856, the population had grown to over 500 people.
In 1858, the first post office was established in Oronoco. The city was incorporated in 1872, and the first mayor was elected in 1873.
In the late 19th century, Oronoco was a thriving agricultural community. The city was home to several grain elevators, a creamery, and a cheese factory. The city also had a number of stores, a hotel, and a bank.
In the early 20th century, Oronoco experienced a period of growth. The city was home to several factories, including a flour mill, a furniture factory, and a canning factory. The city also had a number of churches, a library, and a movie theater.
Geography
Oronoco is located in southeastern Minnesota, in Olmsted County. The city is situated on the banks of the Zumbro River, and is part of the Rochester Metropolitan Statistical Area. The city has a total area of 1.2 square miles, all of which is land.
The city is located in a hilly region, with the highest point being the Oronoco Hill, which is located in the northern part of the city. The city is located in a temperate climate, with hot summers and cold winters.
Economy
Oronoco’s economy is largely based on agriculture. The city is home to several farms, and the surrounding area is known for its production of corn, soybeans, and other crops. The city also has a number of businesses, including a grocery store, a hardware store, and a restaurant.
The city is also home to a number of manufacturing companies, including a furniture factory, a canning factory, and a flour mill. The city is also home to a number of small businesses, including a bakery, a barber shop, and a beauty salon.
Demographics
According to the 2010 census, Oronoco has a population of 1,845. The population is largely white (94.3%), with a small percentage of African Americans (2.2%) and Hispanics (2.2%). The median household income is $50,938, and the median age is 41.
Conclusion
Oronoco, Minnesota is a small city located in Olmsted County, in the southeastern part of the state. It is situated on the banks of the Zumbro River, and is part of the Rochester Metropolitan Statistical Area. The city has a population of 1,845, according to the 2010 census. The city’s economy is largely based on agriculture, and it is home to several manufacturing companies. The population is largely white, with a small percentage of African Americans and Hispanics.
Common Questions
What is Per Capita Income in Oronoco?
Per Capita income in Oronoco is $55,753.
What is the Median Family Income in Oronoco?
Median Family Income in Oronoco is $165,208.
What is the Median Household income in Oronoco?
Median Household Income in Oronoco is $153,393.
What is Income or Wage Gap in Oronoco?
Income or Wage Gap in Oronoco is 15.5%.
Women in Oronoco earn 84.5 cents for every dollar earned by a man.
What is Inequality or Gini Index in Oronoco?
Inequality or Gini Index in Oronoco is 0.38.
What is the Total Population of Oronoco?
Total Population of Oronoco is 1,696.
What is the Total Male Population of Oronoco?
Total Male Population of Oronoco is 836.
What is the Total Female Population of Oronoco?
Total Female Population of Oronoco is 860.
What is the Ratio of Males per 100 Females in Oronoco?
There are 97.21 Males per 100 Females in Oronoco.
What is the Ratio of Females per 100 Males in Oronoco?
There are 102.87 Females per 100 Males in Oronoco.
What is the Median Population Age in Oronoco?
Median Population Age in Oronoco is 36.3 Years.
What is the Average Family Size in Oronoco
Average Family Size in Oronoco is 3.4 People.
What is the Average Household Size in Oronoco
Average Household Size in Oronoco is 3.1 People.
How Large is the Labor Force in Oronoco?
There are 854 People in the Labor Forcein in Oronoco.
What is the Percentage of People in the Labor Force in Oronoco?
76.9% of People are in the Labor Force in Oronoco.
What is the Unemployment Rate in Oronoco?
Unemployment Rate in Oronoco is 0.4%.