Comstock, MN Map & Demographics
Comstock Map
Comstock Overview
$35,797
PER CAPITA INCOME
$113,125
AVG FAMILY INCOME
$91,250
AVG HOUSEHOLD INCOME
0.35
INEQUALITY / GINI INDEX
75
TOTAL POPULATION
40
MALE POPULATION
35
FEMALE POPULATION
114.29
MALES / 100 FEMALES
87.50
FEMALES / 100 MALES
59.5
MEDIAN AGE
2.6
AVG FAMILY SIZE
2.2
AVG HOUSEHOLD SIZE
43
LABOR FORCE [ PEOPLE ]
60.6%
PERCENT IN LABOR FORCE
9.3%
UNEMPLOYMENT RATE
Comstock Zip Codes
Comstock Area Codes
Income in Comstock
Income Overview in Comstock
Per Capita Income in Comstock is $35,797, while median incomes of families and households are $113,125 and $91,250 respectively.
| Characteristic | Number | Measure |
| Per Capita Income | 75 | $35,797 |
| Median Family Income | 25 | $113,125 |
| Mean Family Income | 25 | $90,660 |
| Median Household Income | 34 | $91,250 |
| Mean Household Income | 34 | $82,562 |
| Income Deficit | 25 | $0 |
| Wage / Income Gap (%) | 75 | 0.00% |
| Wage / Income Gap ($) | 75 | 100.00¢ per $1 |
| Gini / Inequality Index | 75 | 0.35 |
Earnings by Sex in Comstock
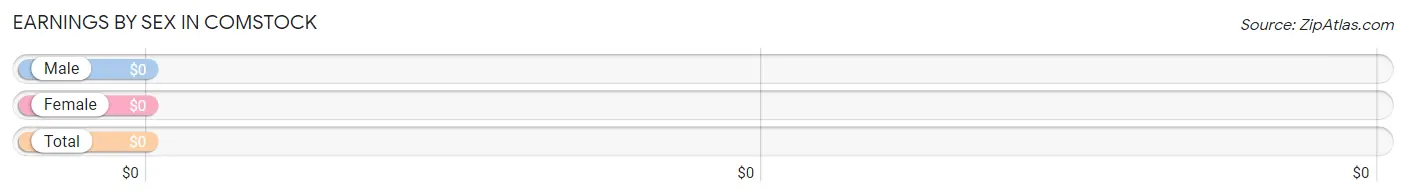
| Sex | Number | Average Earnings |
| Male | 28 (65.1%) | $0 |
| Female | 15 (34.9%) | $0 |
| Total | 43 (100.0%) | $0 |
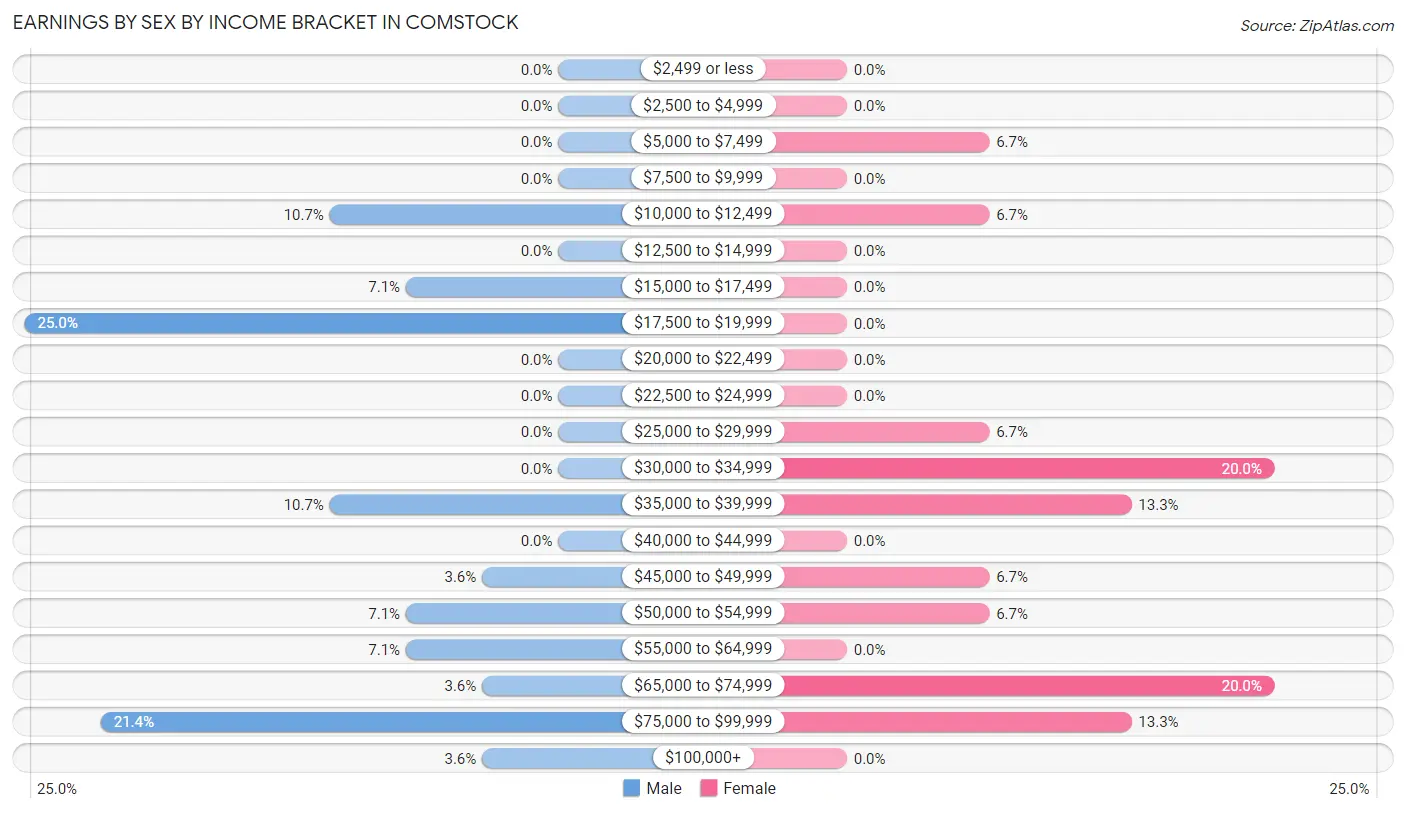
Earnings by Sex by Income Bracket in Comstock
The most common earnings brackets in Comstock are $17,500 to $19,999 for men (7 | 25.0%) and $30,000 to $34,999 for women (3 | 20.0%).
| Income | Male | Female |
| $2,499 or less | 0 (0.0%) | 0 (0.0%) |
| $2,500 to $4,999 | 0 (0.0%) | 0 (0.0%) |
| $5,000 to $7,499 | 0 (0.0%) | 1 (6.7%) |
| $7,500 to $9,999 | 0 (0.0%) | 0 (0.0%) |
| $10,000 to $12,499 | 3 (10.7%) | 1 (6.7%) |
| $12,500 to $14,999 | 0 (0.0%) | 0 (0.0%) |
| $15,000 to $17,499 | 2 (7.1%) | 0 (0.0%) |
| $17,500 to $19,999 | 7 (25.0%) | 0 (0.0%) |
| $20,000 to $22,499 | 0 (0.0%) | 0 (0.0%) |
| $22,500 to $24,999 | 0 (0.0%) | 0 (0.0%) |
| $25,000 to $29,999 | 0 (0.0%) | 1 (6.7%) |
| $30,000 to $34,999 | 0 (0.0%) | 3 (20.0%) |
| $35,000 to $39,999 | 3 (10.7%) | 2 (13.3%) |
| $40,000 to $44,999 | 0 (0.0%) | 0 (0.0%) |
| $45,000 to $49,999 | 1 (3.6%) | 1 (6.7%) |
| $50,000 to $54,999 | 2 (7.1%) | 1 (6.7%) |
| $55,000 to $64,999 | 2 (7.1%) | 0 (0.0%) |
| $65,000 to $74,999 | 1 (3.6%) | 3 (20.0%) |
| $75,000 to $99,999 | 6 (21.4%) | 2 (13.3%) |
| $100,000+ | 1 (3.6%) | 0 (0.0%) |
| Total | 28 (100.0%) | 15 (100.0%) |
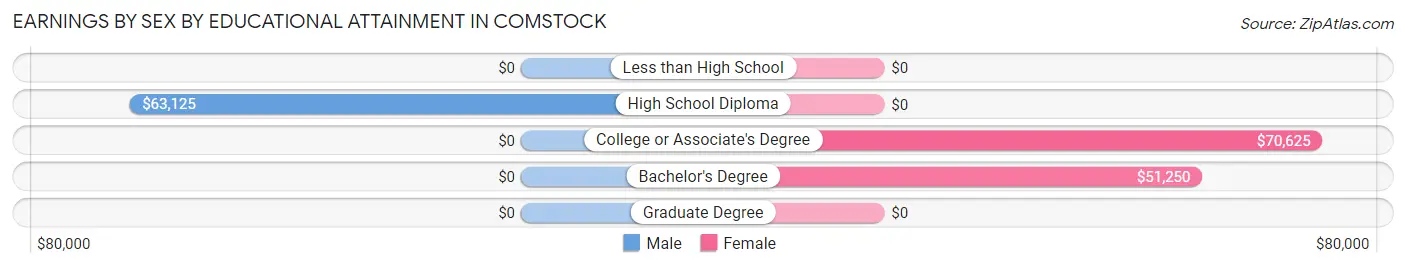
Earnings by Sex by Educational Attainment in Comstock
Average earnings in Comstock are $53,125 for men and $41,250 for women, a difference of 22.4%. Men with an educational attainment of high school diploma enjoy the highest average annual earnings of $63,125, while those with high school diploma education earn the least with $63,125. Women with an educational attainment of college or associate's degree earn the most with the average annual earnings of $70,625, while those with bachelor's degree education have the smallest earnings of $51,250.
| Educational Attainment | Male Income | Female Income |
| Less than High School | - | - |
| High School Diploma | $63,125 | $0 |
| College or Associate's Degree | - | - |
| Bachelor's Degree | - | - |
| Graduate Degree | - | - |
| Total | $53,125 | $41,250 |
Family Income in Comstock
Family Income Brackets in Comstock
According to the Comstock family income data, there are 9 families falling into the $100,000 to $149,999 income range, which is the most common income bracket and makes up 36.0% of all families.
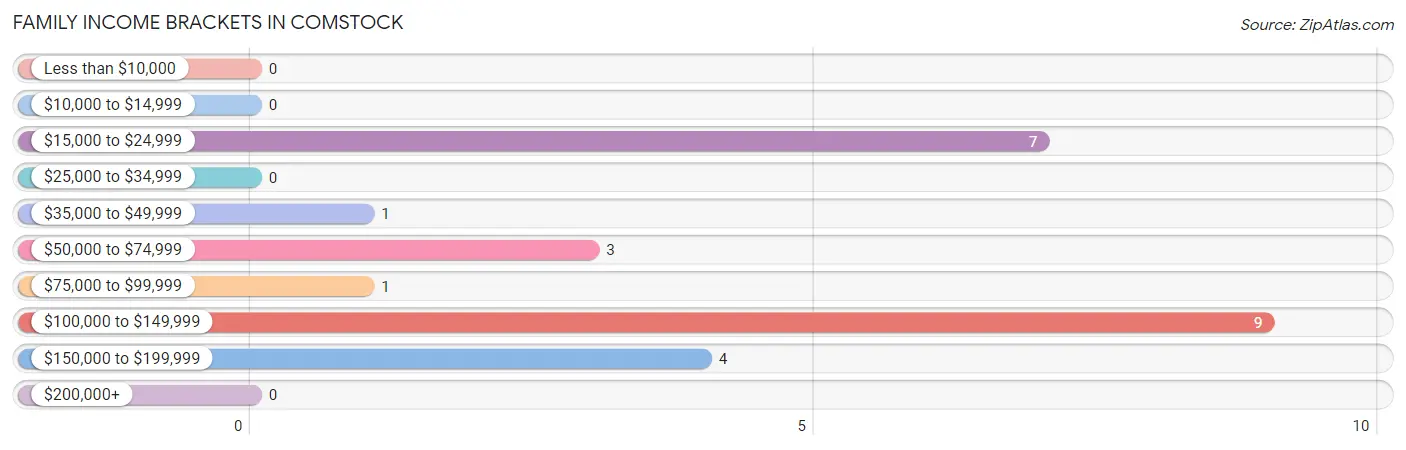
| Income Bracket | # Families | % Families |
| Less than $10,000 | 0 | 0.0% |
| $10,000 to $14,999 | 0 | 0.0% |
| $15,000 to $24,999 | 7 | 28.0% |
| $25,000 to $34,999 | 0 | 0.0% |
| $35,000 to $49,999 | 1 | 4.0% |
| $50,000 to $74,999 | 3 | 12.0% |
| $75,000 to $99,999 | 1 | 4.0% |
| $100,000 to $149,999 | 9 | 36.0% |
| $150,000 to $199,999 | 4 | 16.0% |
| $200,000+ | 0 | 0.0% |
Family Income by Famaliy Size in Comstock
3-person families (6 | 24.0%) account for the highest median family income in Comstock with $126,250 per family, while 3-person families (6 | 24.0%) have the highest median income of $42,083 per family member.
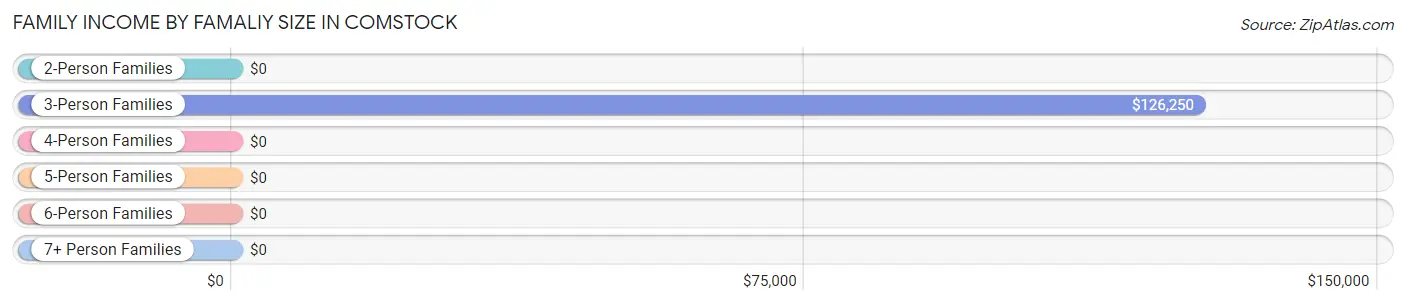
| Income Bracket | # Families | Median Income |
| 2-Person Families | 16 (64.0%) | $0 |
| 3-Person Families | 6 (24.0%) | $126,250 |
| 4-Person Families | 3 (12.0%) | $0 |
| 5-Person Families | 0 (0.0%) | $0 |
| 6-Person Families | 0 (0.0%) | $0 |
| 7+ Person Families | 0 (0.0%) | $0 |
| Total | 25 (100.0%) | $113,125 |
Family Income by Number of Earners in Comstock
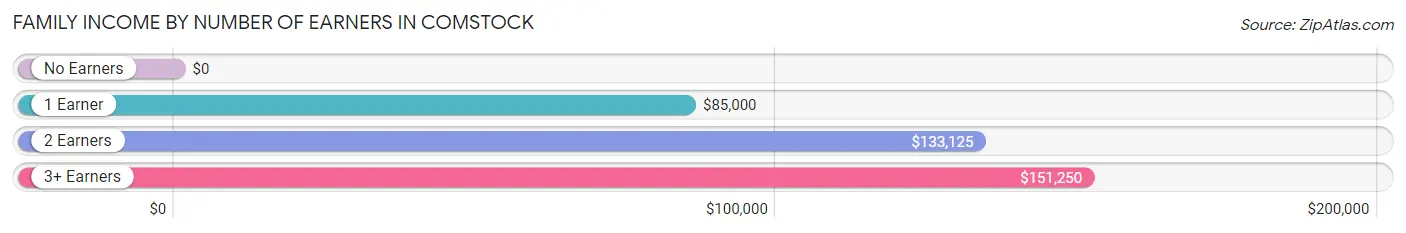
| Number of Earners | # Families | Median Income |
| No Earners | 8 (32.0%) | $0 |
| 1 Earner | 6 (24.0%) | $85,000 |
| 2 Earners | 7 (28.0%) | $133,125 |
| 3+ Earners | 4 (16.0%) | $151,250 |
| Total | 25 (100.0%) | $113,125 |
Household Income in Comstock
Household Income Brackets in Comstock
With 10 households falling in the category, the $100,000 to $149,999 income range is the most frequent in Comstock, accounting for 29.4% of all households.
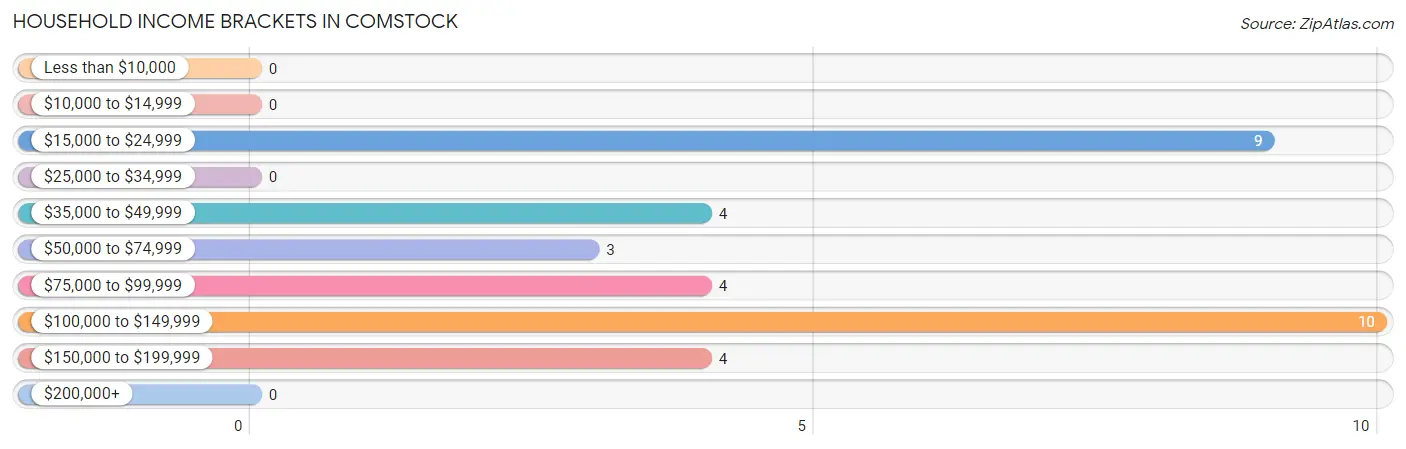
| Income Bracket | # Households | % Households |
| Less than $10,000 | 0 | 0.0% |
| $10,000 to $14,999 | 0 | 0.0% |
| $15,000 to $24,999 | 9 | 26.5% |
| $25,000 to $34,999 | 0 | 0.0% |
| $35,000 to $49,999 | 4 | 11.8% |
| $50,000 to $74,999 | 3 | 8.8% |
| $75,000 to $99,999 | 4 | 11.8% |
| $100,000 to $149,999 | 10 | 29.4% |
| $150,000 to $199,999 | 4 | 11.8% |
| $200,000+ | 0 | 0.0% |
Household Income by Householder Age in Comstock
The median household income in Comstock is $91,250, with the highest median household income of $118,750 found in the 25 to 44 years age bracket for the primary householder. A total of 8 households (23.5%) fall into this category.
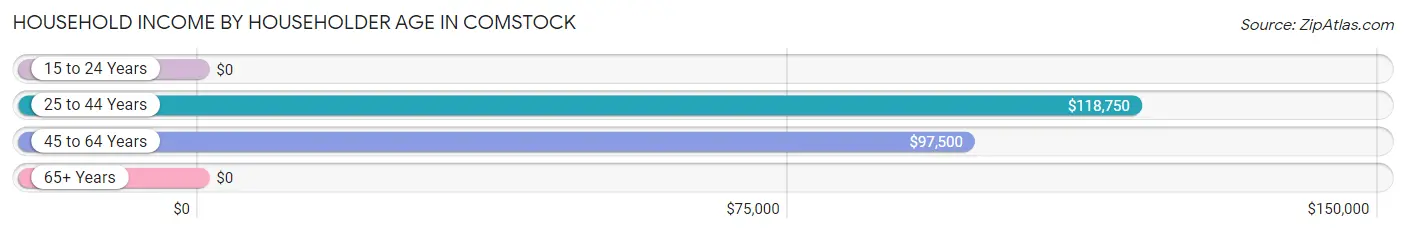
| Income Bracket | # Households | Median Income |
| 15 to 24 Years | 0 (0.0%) | $0 |
| 25 to 44 Years | 8 (23.5%) | $118,750 |
| 45 to 64 Years | 12 (35.3%) | $97,500 |
| 65+ Years | 14 (41.2%) | $0 |
| Total | 34 (100.0%) | $91,250 |
Poverty in Comstock
Income Below Poverty by Sex and Age in Comstock
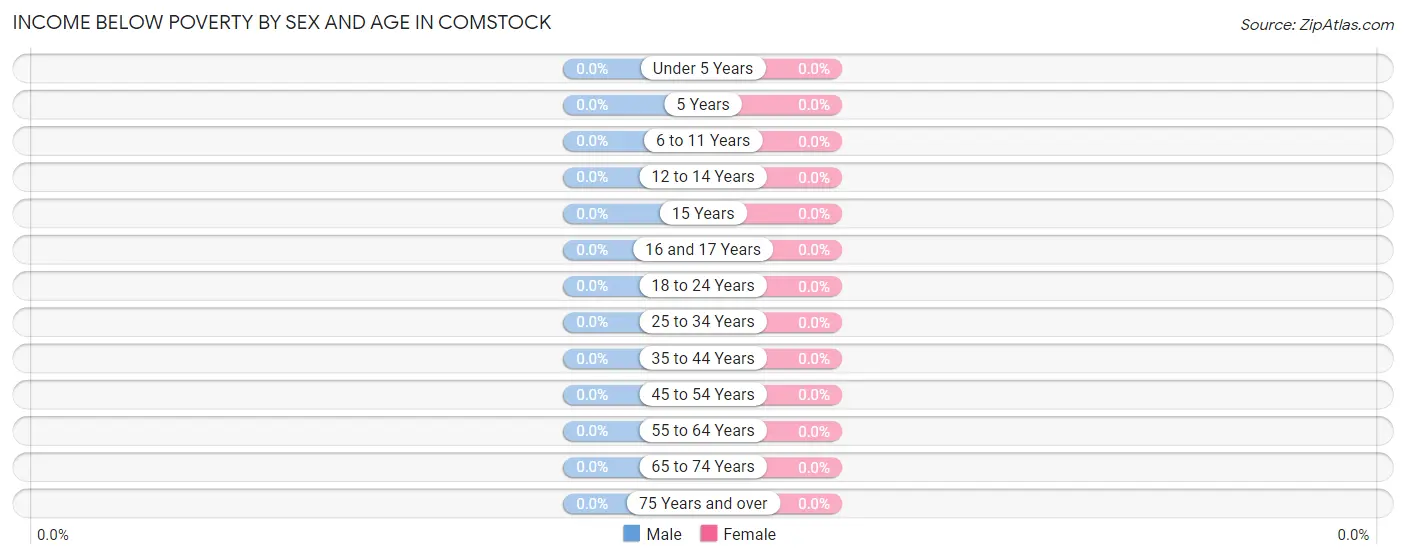
| Age Bracket | Male | Female |
| Under 5 Years | 0 (0.0%) | 0 (0.0%) |
| 5 Years | 0 (0.0%) | 0 (0.0%) |
| 6 to 11 Years | 0 (0.0%) | 0 (0.0%) |
| 12 to 14 Years | 0 (0.0%) | 0 (0.0%) |
| 15 Years | 0 (0.0%) | 0 (0.0%) |
| 16 and 17 Years | 0 (0.0%) | 0 (0.0%) |
| 18 to 24 Years | 0 (0.0%) | 0 (0.0%) |
| 25 to 34 Years | 0 (0.0%) | 0 (0.0%) |
| 35 to 44 Years | 0 (0.0%) | 0 (0.0%) |
| 45 to 54 Years | 0 (0.0%) | 0 (0.0%) |
| 55 to 64 Years | 0 (0.0%) | 0 (0.0%) |
| 65 to 74 Years | 0 (0.0%) | 0 (0.0%) |
| 75 Years and over | 0 (0.0%) | 0 (0.0%) |
| Total | 0 (0.0%) | 0 (0.0%) |
Income Above Poverty by Sex and Age in Comstock
According to the poverty statistics in Comstock, males aged 12 to 14 years and females aged under 5 years are the age groups that are most secure financially, with 100.0% of males and 100.0% of females in these age groups living above the poverty line.
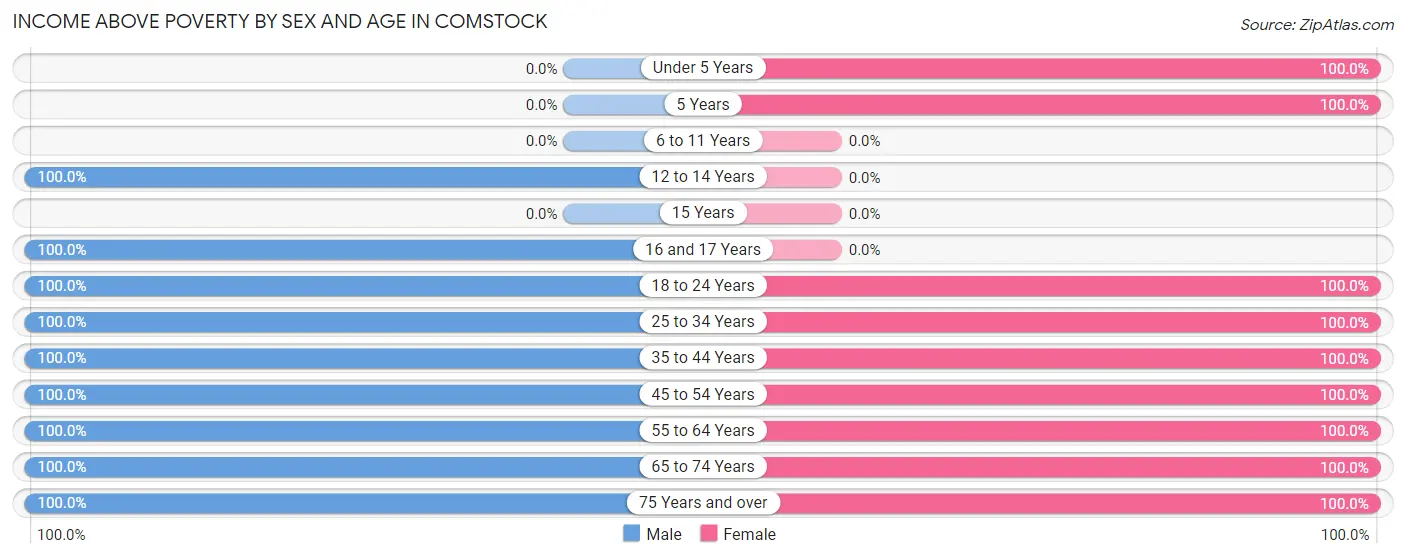
| Age Bracket | Male | Female |
| Under 5 Years | 0 (0.0%) | 1 (100.0%) |
| 5 Years | 0 (0.0%) | 2 (100.0%) |
| 6 to 11 Years | 0 (0.0%) | 0 (0.0%) |
| 12 to 14 Years | 1 (100.0%) | 0 (0.0%) |
| 15 Years | 0 (0.0%) | 0 (0.0%) |
| 16 and 17 Years | 1 (100.0%) | 0 (0.0%) |
| 18 to 24 Years | 5 (100.0%) | 1 (100.0%) |
| 25 to 34 Years | 8 (100.0%) | 2 (100.0%) |
| 35 to 44 Years | 3 (100.0%) | 3 (100.0%) |
| 45 to 54 Years | 2 (100.0%) | 1 (100.0%) |
| 55 to 64 Years | 8 (100.0%) | 8 (100.0%) |
| 65 to 74 Years | 4 (100.0%) | 3 (100.0%) |
| 75 Years and over | 8 (100.0%) | 14 (100.0%) |
| Total | 40 (100.0%) | 35 (100.0%) |
Income Below Poverty Among Married-Couple Families in Comstock
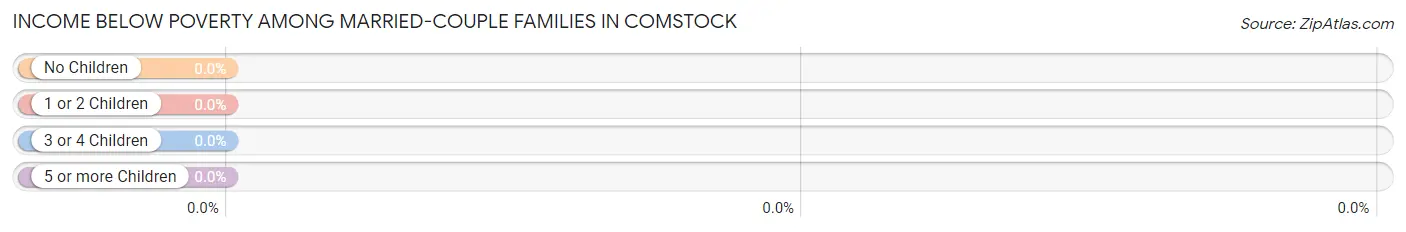
| Children | Above Poverty | Below Poverty |
| No Children | 18 (100.0%) | 0 (0.0%) |
| 1 or 2 Children | 4 (100.0%) | 0 (0.0%) |
| 3 or 4 Children | 0 (0.0%) | 0 (0.0%) |
| 5 or more Children | 0 (0.0%) | 0 (0.0%) |
| Total | 22 (100.0%) | 0 (0.0%) |
Income Below Poverty Among Single-Parent Households in Comstock
| Children | Single Father | Single Mother |
| No Children | 0 (0.0%) | 0 (0.0%) |
| 1 or 2 Children | 0 (0.0%) | 0 (0.0%) |
| 3 or 4 Children | 0 (0.0%) | 0 (0.0%) |
| 5 or more Children | 0 (0.0%) | 0 (0.0%) |
| Total | 0 (0.0%) | 0 (0.0%) |
Income Below Poverty Among Married-Couple vs Single-Parent Households in Comstock
| Children | Married-Couple Families | Single-Parent Households |
| No Children | 0 (0.0%) | 0 (0.0%) |
| 1 or 2 Children | 0 (0.0%) | 0 (0.0%) |
| 3 or 4 Children | 0 (0.0%) | 0 (0.0%) |
| 5 or more Children | 0 (0.0%) | 0 (0.0%) |
| Total | 0 (0.0%) | 0 (0.0%) |
Race in Comstock
The most populous races in Comstock are White / Caucasian (70 | 93.3%), Asian (4 | 5.3%), and Two or more Races (1 | 1.3%).
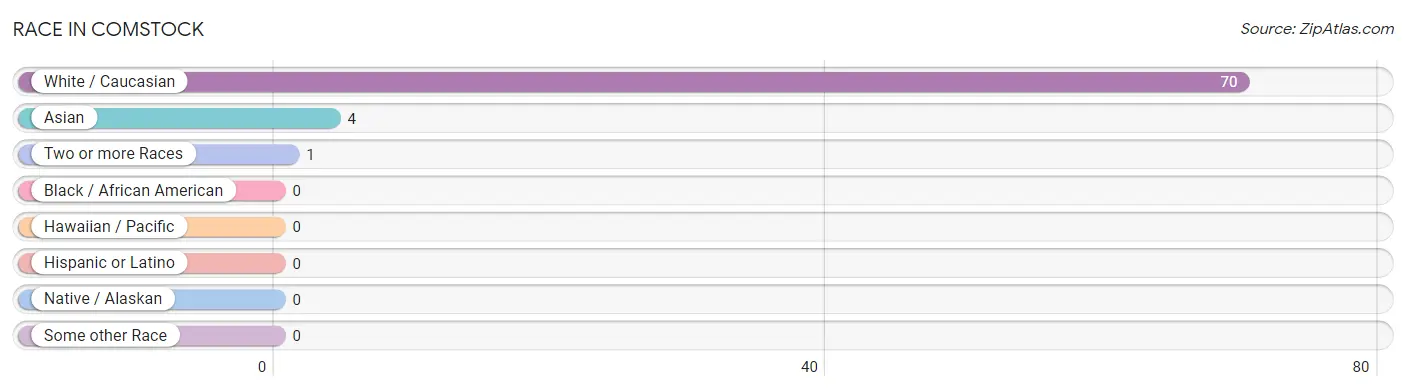
| Race | # Population | % Population |
| Asian | 4 | 5.3% |
| Black / African American | 0 | 0.0% |
| Hawaiian / Pacific | 0 | 0.0% |
| Hispanic or Latino | 0 | 0.0% |
| Native / Alaskan | 0 | 0.0% |
| White / Caucasian | 70 | 93.3% |
| Two or more Races | 1 | 1.3% |
| Some other Race | 0 | 0.0% |
| Total | 75 | 100.0% |
Ancestry in Comstock
The most populous ancestries reported in Comstock are Norwegian (44 | 58.7%), German (29 | 38.7%), American (8 | 10.7%), English (3 | 4.0%), and French (3 | 4.0%), together accounting for 116.0% of all Comstock residents.
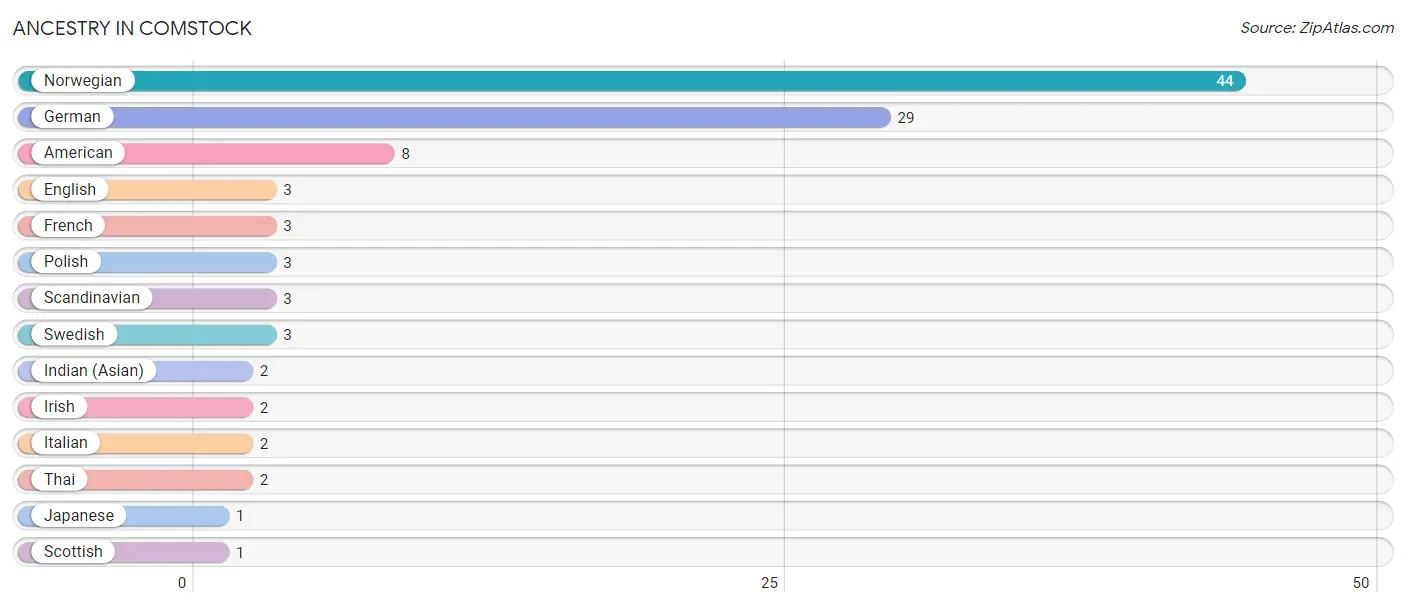
| Ancestry | # Population | % Population |
| American | 8 | 10.7% |
| English | 3 | 4.0% |
| French | 3 | 4.0% |
| German | 29 | 38.7% |
| Indian (Asian) | 2 | 2.7% |
| Irish | 2 | 2.7% |
| Italian | 2 | 2.7% |
| Japanese | 1 | 1.3% |
| Norwegian | 44 | 58.7% |
| Polish | 3 | 4.0% |
| Scandinavian | 3 | 4.0% |
| Scottish | 1 | 1.3% |
| Swedish | 3 | 4.0% |
| Thai | 2 | 2.7% | View All 14 Rows |
Immigrants in Comstock
The most numerous immigrant groups reported in Comstock came from Asia (4 | 5.3%), Pakistan (2 | 2.7%), South Central Asia (2 | 2.7%), Eastern Asia (1 | 1.3%), and Korea (1 | 1.3%), together accounting for 13.3% of all Comstock residents.
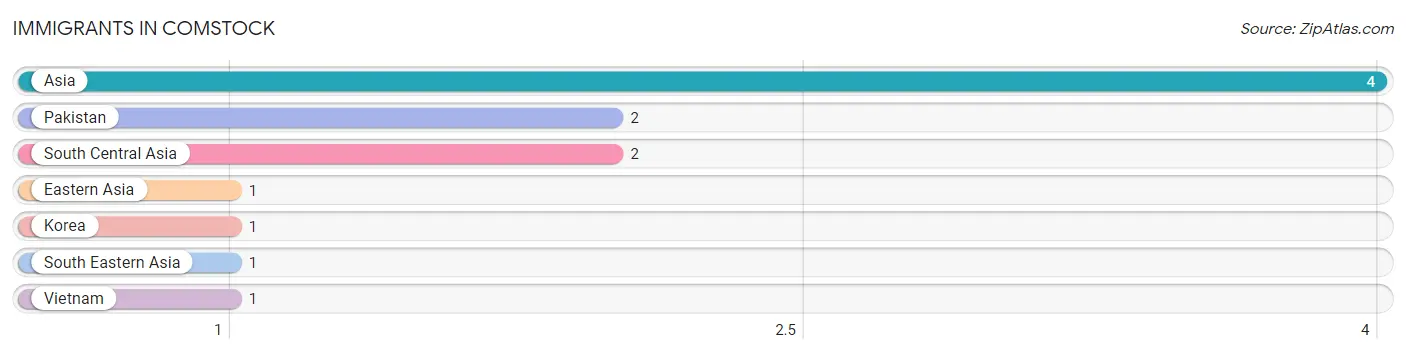
| Immigration Origin | # Population | % Population |
| Asia | 4 | 5.3% |
| Eastern Asia | 1 | 1.3% |
| Korea | 1 | 1.3% |
| Pakistan | 2 | 2.7% |
| South Central Asia | 2 | 2.7% |
| South Eastern Asia | 1 | 1.3% |
| Vietnam | 1 | 1.3% | View All 7 Rows |
Sex and Age in Comstock
Sex and Age in Comstock
The most populous age groups in Comstock are 85 Years and over (7 | 17.5%) for men and 85 Years and over (13 | 37.1%) for women.
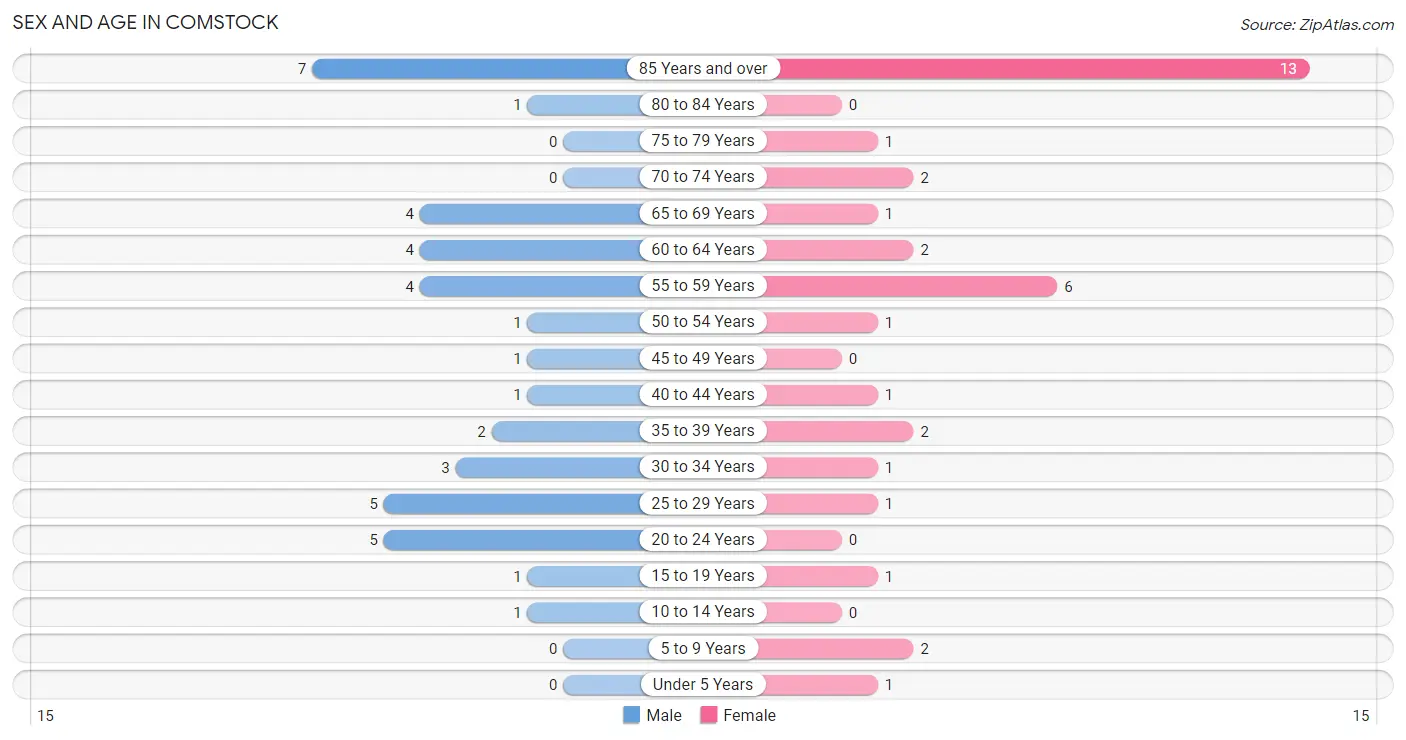
| Age Bracket | Male | Female |
| Under 5 Years | 0 (0.0%) | 1 (2.9%) |
| 5 to 9 Years | 0 (0.0%) | 2 (5.7%) |
| 10 to 14 Years | 1 (2.5%) | 0 (0.0%) |
| 15 to 19 Years | 1 (2.5%) | 1 (2.9%) |
| 20 to 24 Years | 5 (12.5%) | 0 (0.0%) |
| 25 to 29 Years | 5 (12.5%) | 1 (2.9%) |
| 30 to 34 Years | 3 (7.5%) | 1 (2.9%) |
| 35 to 39 Years | 2 (5.0%) | 2 (5.7%) |
| 40 to 44 Years | 1 (2.5%) | 1 (2.9%) |
| 45 to 49 Years | 1 (2.5%) | 0 (0.0%) |
| 50 to 54 Years | 1 (2.5%) | 1 (2.9%) |
| 55 to 59 Years | 4 (10.0%) | 6 (17.1%) |
| 60 to 64 Years | 4 (10.0%) | 2 (5.7%) |
| 65 to 69 Years | 4 (10.0%) | 1 (2.9%) |
| 70 to 74 Years | 0 (0.0%) | 2 (5.7%) |
| 75 to 79 Years | 0 (0.0%) | 1 (2.9%) |
| 80 to 84 Years | 1 (2.5%) | 0 (0.0%) |
| 85 Years and over | 7 (17.5%) | 13 (37.1%) |
| Total | 40 (100.0%) | 35 (100.0%) |
Families and Households in Comstock
Median Family Size in Comstock
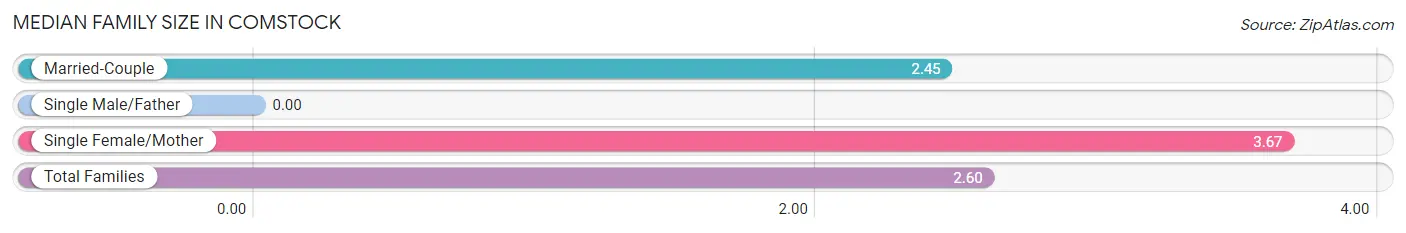
| Family Type | # Families | Family Size |
| Married-Couple | 22 (88.0%) | 2.45 |
| Single Male/Father | 0 (0.0%) | - |
| Single Female/Mother | 3 (12.0%) | 3.67 |
| Total Families | 25 (100.0%) | 2.60 |
Median Household Size in Comstock
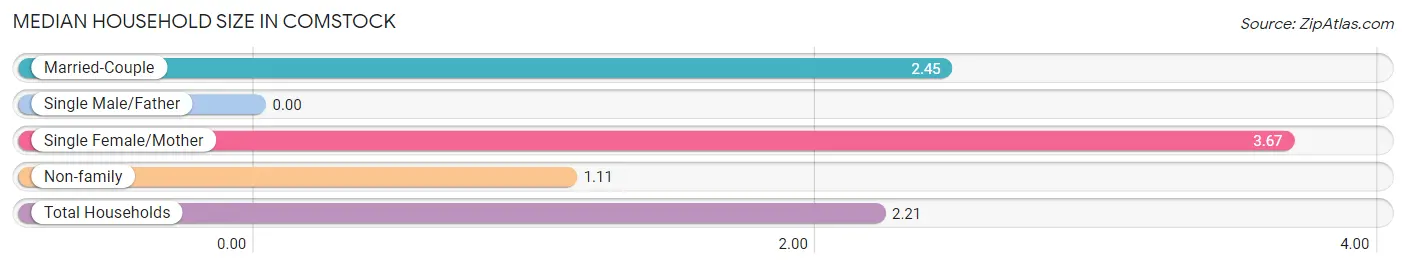
| Household Type | # Households | Household Size |
| Married-Couple | 22 (64.7%) | 2.45 |
| Single Male/Father | 0 (0.0%) | - |
| Single Female/Mother | 3 (8.8%) | 3.67 |
| Non-family | 9 (26.5%) | 1.11 |
| Total Households | 34 (100.0%) | 2.21 |
Household Size by Marriage Status in Comstock
Out of a total of 34 households in Comstock, 25 (73.5%) are family households, while 9 (26.5%) are nonfamily households. The most numerous type of family households are 2-person households, comprising 16, and the most common type of nonfamily households are 1-person households, comprising 8.
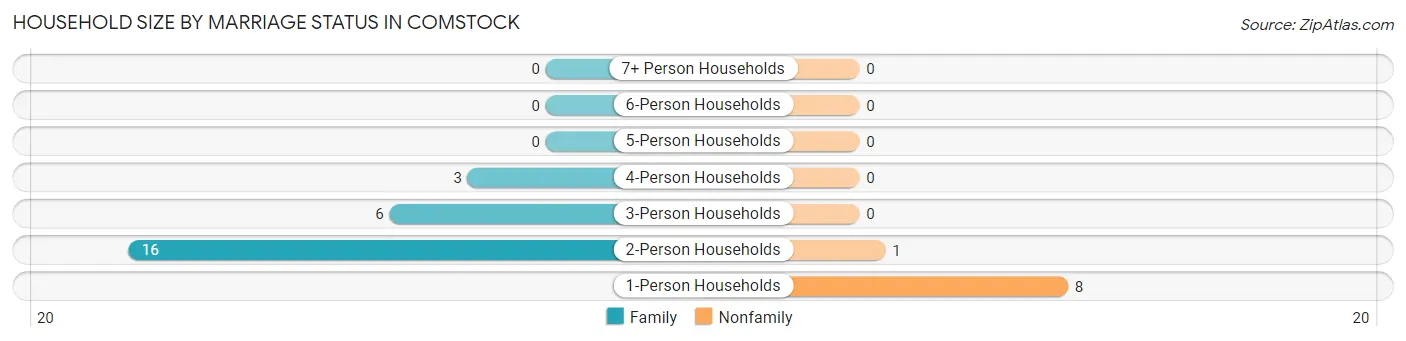
| Household Size | Family Households | Nonfamily Households |
| 1-Person Households | - | 8 (23.5%) |
| 2-Person Households | 16 (47.1%) | 1 (2.9%) |
| 3-Person Households | 6 (17.6%) | 0 (0.0%) |
| 4-Person Households | 3 (8.8%) | 0 (0.0%) |
| 5-Person Households | 0 (0.0%) | 0 (0.0%) |
| 6-Person Households | 0 (0.0%) | 0 (0.0%) |
| 7+ Person Households | 0 (0.0%) | 0 (0.0%) |
| Total | 25 (73.5%) | 9 (26.5%) |
Female Fertility in Comstock
Fertility by Age in Comstock
| Age Bracket | Women with Births | Births / 1,000 Women |
| 15 to 19 years | 0 (0.0%) | 0.0 |
| 20 to 34 years | 0 (0.0%) | 0.0 |
| 35 to 50 years | 0 (0.0%) | 0.0 |
| Total | 0 (0.0%) | 0.0 |
Fertility by Age by Marriage Status in Comstock
| Age Bracket | Married | Unmarried |
| 15 to 19 years | 0 (0.0%) | 0 (0.0%) |
| 20 to 34 years | 0 (0.0%) | 0 (0.0%) |
| 35 to 50 years | 0 (0.0%) | 0 (0.0%) |
| Total | 0 (0.0%) | 0 (0.0%) |
Fertility by Education in Comstock
| Educational Attainment | Women with Births | Births / 1,000 Women |
| Less than High School | 0 (0.0%) | 0.0 |
| High School Diploma | 0 (0.0%) | 0.0 |
| College or Associate's Degree | 0 (0.0%) | 0.0 |
| Bachelor's Degree | 0 (0.0%) | 0.0 |
| Graduate Degree | 0 (0.0%) | 0.0 |
| Total | 0 (0.0%) | 0.0 |
Fertility by Education by Marriage Status in Comstock
| Educational Attainment | Married | Unmarried |
| Less than High School | 0 (0.0%) | 0 (0.0%) |
| High School Diploma | 0 (0.0%) | 0 (0.0%) |
| College or Associate's Degree | 0 (0.0%) | 0 (0.0%) |
| Bachelor's Degree | 0 (0.0%) | 0 (0.0%) |
| Graduate Degree | 0 (0.0%) | 0 (0.0%) |
| Total | 0 (0.0%) | 0 (0.0%) |
Employment Characteristics in Comstock
Employment by Class of Employer in Comstock
Among the 39 employed individuals in Comstock, private company employees (28 | 71.8%), not-for-profit organizations (5 | 12.8%), and self-employed (incorporated) (2 | 5.1%) make up the most common classes of employment.
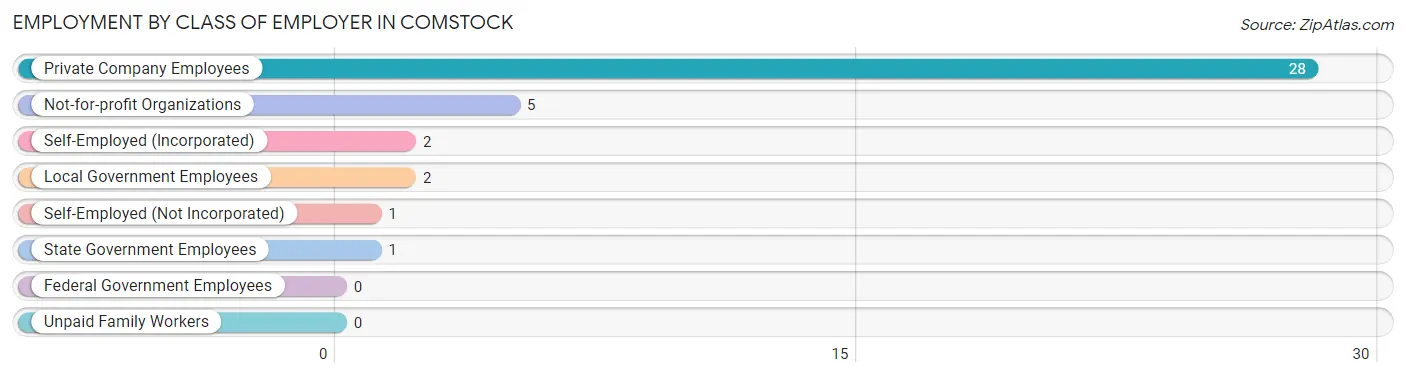
| Employer Class | # Employees | % Employees |
| Private Company Employees | 28 | 71.8% |
| Self-Employed (Incorporated) | 2 | 5.1% |
| Self-Employed (Not Incorporated) | 1 | 2.6% |
| Not-for-profit Organizations | 5 | 12.8% |
| Local Government Employees | 2 | 5.1% |
| State Government Employees | 1 | 2.6% |
| Federal Government Employees | 0 | 0.0% |
| Unpaid Family Workers | 0 | 0.0% |
| Total | 39 | 100.0% |
Employment Status by Age in Comstock
According to the labor force statistics for Comstock, out of the total population over 16 years of age (71), 60.6% or 43 individuals are in the labor force, with 9.3% or 4 of them unemployed. The age group with the highest labor force participation rate is 20 to 24 years, with 100.0% or 5 individuals in the labor force. Within the labor force, the 30 to 34 years age range has the highest percentage of unemployed individuals, with 50.0% or 2 of them being unemployed.
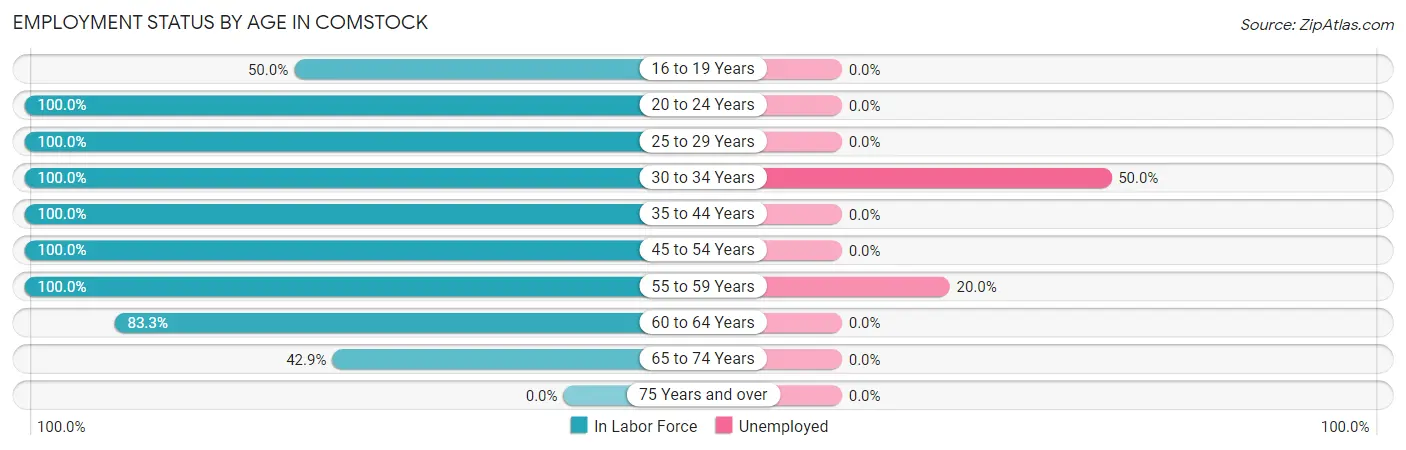
| Age Bracket | In Labor Force | Unemployed |
| 16 to 19 Years | 1 (50.0%) | 0 (0.0%) |
| 20 to 24 Years | 5 (100.0%) | 0 (0.0%) |
| 25 to 29 Years | 6 (100.0%) | 0 (0.0%) |
| 30 to 34 Years | 4 (100.0%) | 2 (50.0%) |
| 35 to 44 Years | 6 (100.0%) | 0 (0.0%) |
| 45 to 54 Years | 3 (100.0%) | 0 (0.0%) |
| 55 to 59 Years | 10 (100.0%) | 2 (20.0%) |
| 60 to 64 Years | 5 (83.3%) | 0 (0.0%) |
| 65 to 74 Years | 3 (42.9%) | 0 (0.0%) |
| 75 Years and over | 0 (0.0%) | 0 (0.0%) |
| Total | 43 (60.6%) | 4 (9.3%) |
Employment Status by Educational Attainment in Comstock
According to labor force statistics for Comstock, 97.1% of individuals (34) out of the total population between 25 and 64 years of age (35) are in the labor force, with 11.8% or 4 of them being unemployed. The group with the highest labor force participation rate are those with the educational attainment of less than high school, with 100.0% or 1 individuals in the labor force. Within the labor force, individuals with high school diploma education have the highest percentage of unemployment, with 28.6% or 2 of them being unemployed.
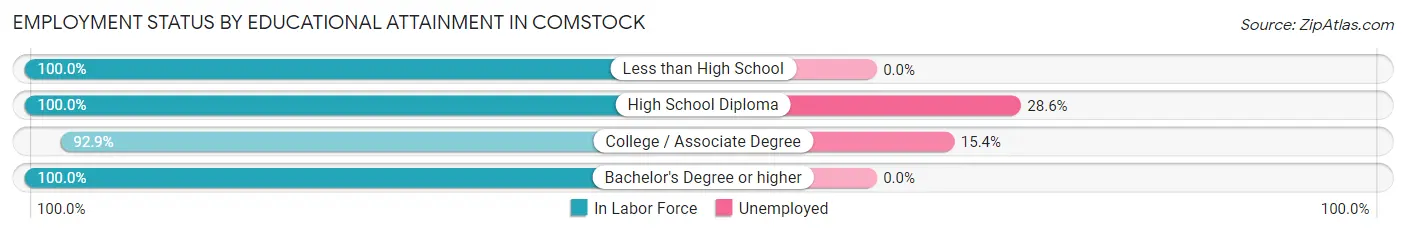
| Educational Attainment | In Labor Force | Unemployed |
| Less than High School | 1 (100.0%) | 0 (0.0%) |
| High School Diploma | 7 (100.0%) | 2 (28.6%) |
| College / Associate Degree | 13 (92.9%) | 2 (15.4%) |
| Bachelor's Degree or higher | 13 (100.0%) | 0 (0.0%) |
| Total | 34 (97.1%) | 4 (11.8%) |
Employment Occupations by Sex in Comstock
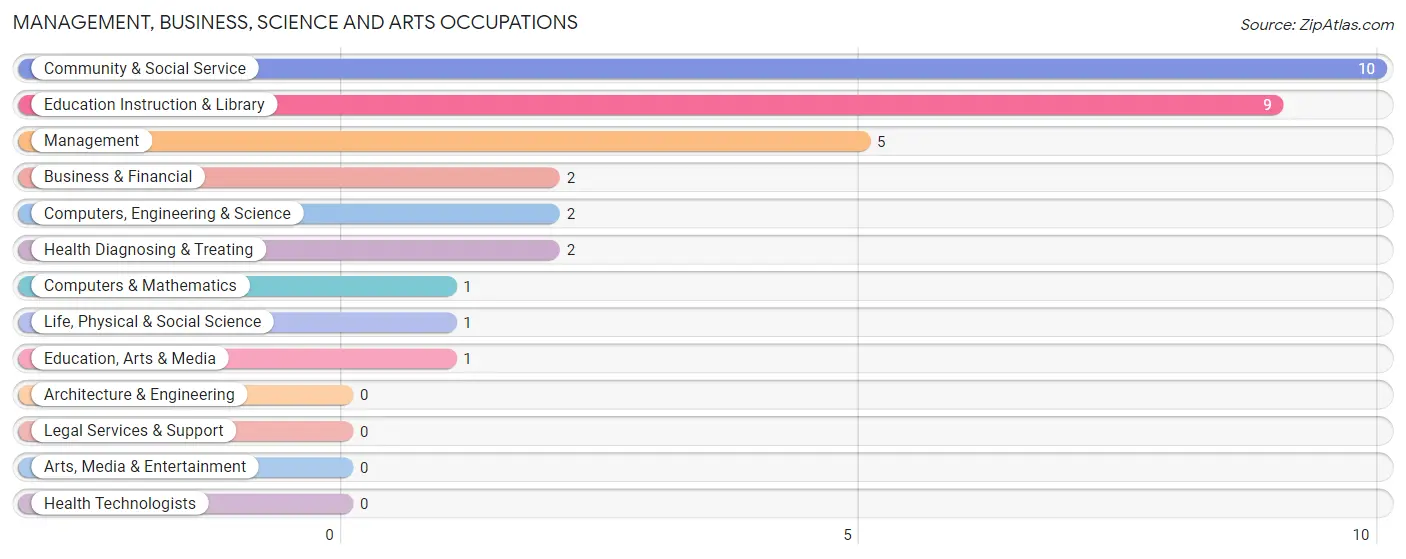
Management, Business, Science and Arts Occupations
The most common Management, Business, Science and Arts occupations in Comstock are Community & Social Service (10 | 25.6%), Education Instruction & Library (9 | 23.1%), Management (5 | 12.8%), Business & Financial (2 | 5.1%), and Computers, Engineering & Science (2 | 5.1%).
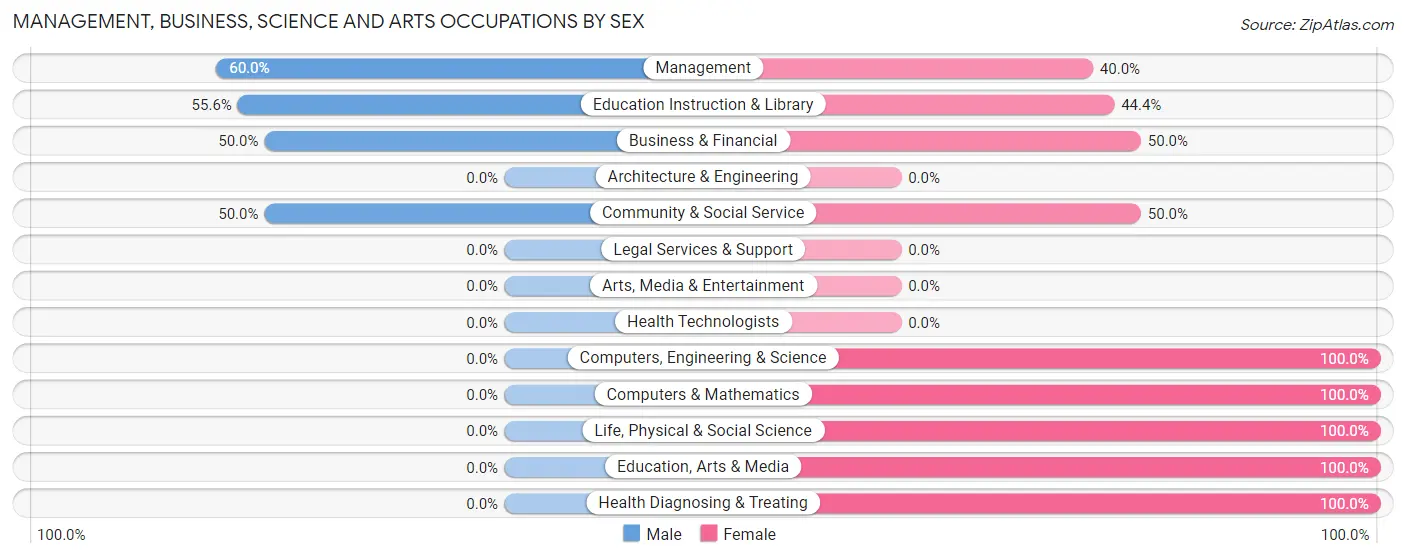
Management, Business, Science and Arts Occupations by Sex
Within the Management, Business, Science and Arts occupations in Comstock, the most male-oriented occupations are Management (60.0%), Education Instruction & Library (55.6%), and Business & Financial (50.0%), while the most female-oriented occupations are Computers, Engineering & Science (100.0%), Computers & Mathematics (100.0%), and Life, Physical & Social Science (100.0%).
| Occupation | Male | Female |
| Management | 3 (60.0%) | 2 (40.0%) |
| Business & Financial | 1 (50.0%) | 1 (50.0%) |
| Computers, Engineering & Science | 0 (0.0%) | 2 (100.0%) |
| Computers & Mathematics | 0 (0.0%) | 1 (100.0%) |
| Architecture & Engineering | 0 (0.0%) | 0 (0.0%) |
| Life, Physical & Social Science | 0 (0.0%) | 1 (100.0%) |
| Community & Social Service | 5 (50.0%) | 5 (50.0%) |
| Education, Arts & Media | 0 (0.0%) | 1 (100.0%) |
| Legal Services & Support | 0 (0.0%) | 0 (0.0%) |
| Education Instruction & Library | 5 (55.6%) | 4 (44.4%) |
| Arts, Media & Entertainment | 0 (0.0%) | 0 (0.0%) |
| Health Diagnosing & Treating | 0 (0.0%) | 2 (100.0%) |
| Health Technologists | 0 (0.0%) | 0 (0.0%) |
| Total (Category) | 9 (42.9%) | 12 (57.1%) |
| Total (Overall) | 24 (61.5%) | 15 (38.5%) |
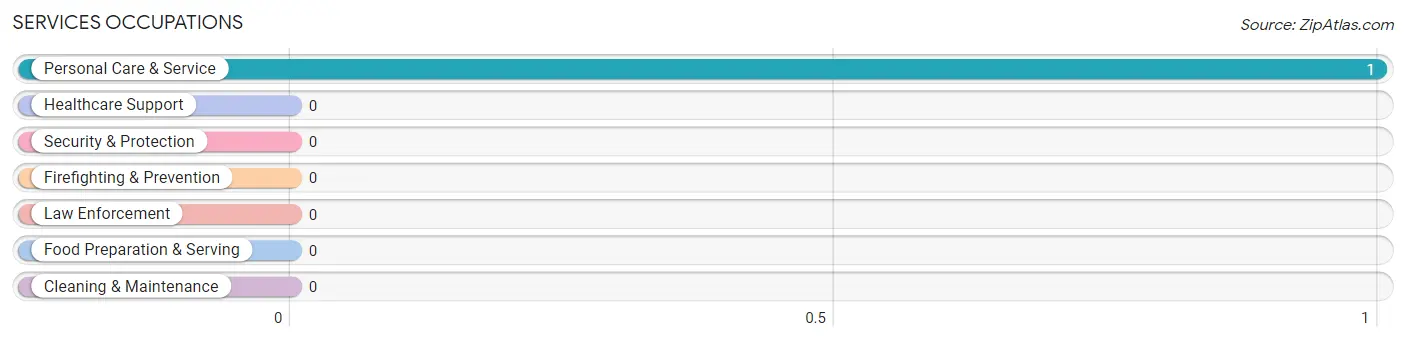
Services Occupations
The most common Services occupations in Comstock are , and Personal Care & Service (1 | 2.6%).
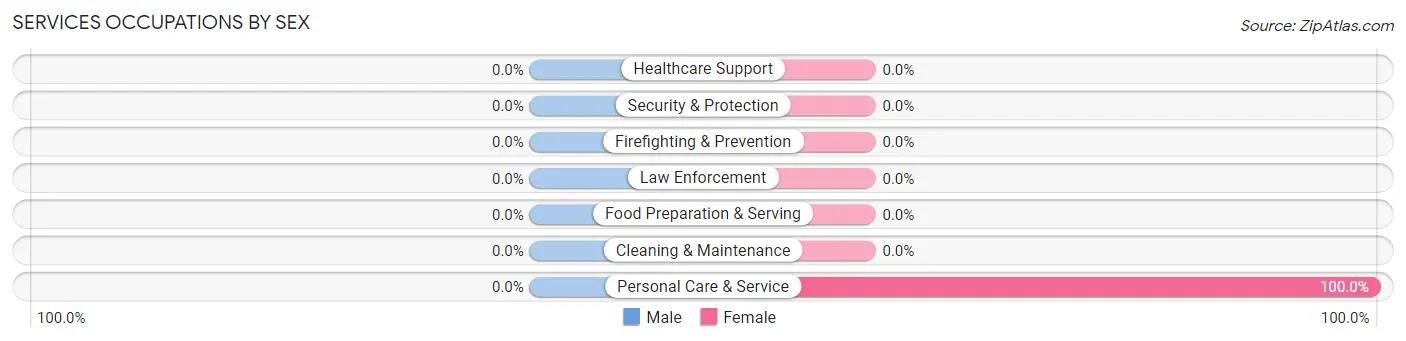
Services Occupations by Sex
| Occupation | Male | Female |
| Healthcare Support | 0 (0.0%) | 0 (0.0%) |
| Security & Protection | 0 (0.0%) | 0 (0.0%) |
| Firefighting & Prevention | 0 (0.0%) | 0 (0.0%) |
| Law Enforcement | 0 (0.0%) | 0 (0.0%) |
| Food Preparation & Serving | 0 (0.0%) | 0 (0.0%) |
| Cleaning & Maintenance | 0 (0.0%) | 0 (0.0%) |
| Personal Care & Service | 0 (0.0%) | 1 (100.0%) |
| Total (Category) | 0 (0.0%) | 1 (100.0%) |
| Total (Overall) | 24 (61.5%) | 15 (38.5%) |
Sales and Office Occupations
The most common Sales and Office occupations in Comstock are Office & Administration (4 | 10.3%), and Sales & Related (3 | 7.7%).
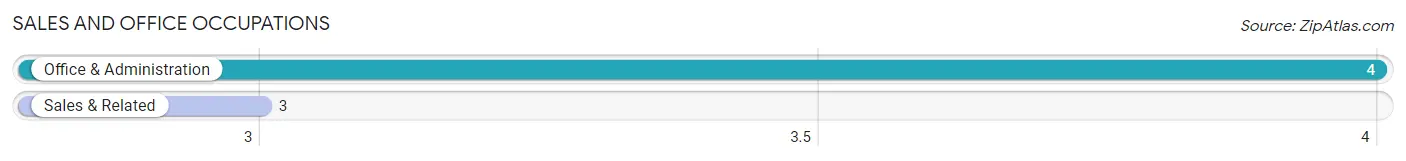
Sales and Office Occupations by Sex

| Occupation | Male | Female |
| Sales & Related | 3 (100.0%) | 0 (0.0%) |
| Office & Administration | 2 (50.0%) | 2 (50.0%) |
| Total (Category) | 5 (71.4%) | 2 (28.6%) |
| Total (Overall) | 24 (61.5%) | 15 (38.5%) |
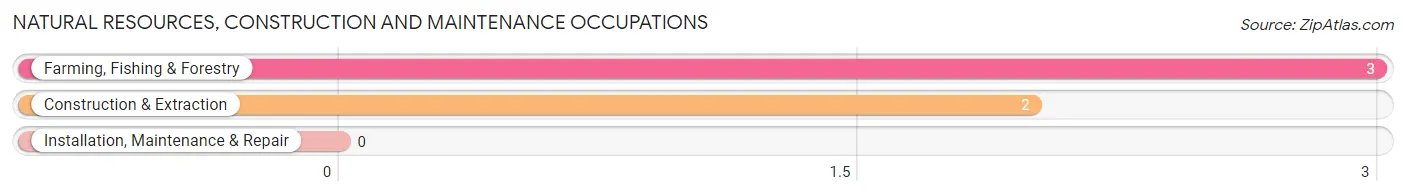
Natural Resources, Construction and Maintenance Occupations
The most common Natural Resources, Construction and Maintenance occupations in Comstock are Farming, Fishing & Forestry (3 | 7.7%), and Construction & Extraction (2 | 5.1%).
Natural Resources, Construction and Maintenance Occupations by Sex
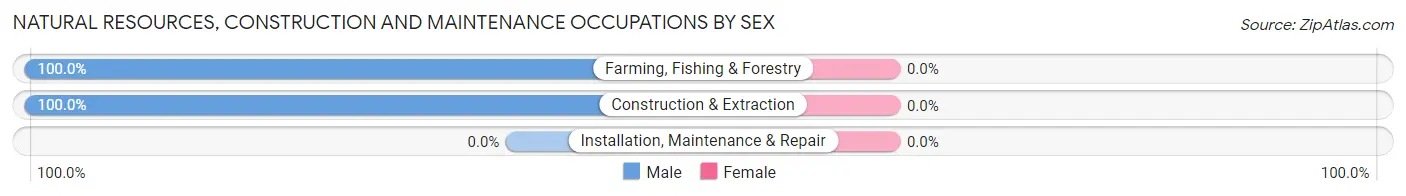
| Occupation | Male | Female |
| Farming, Fishing & Forestry | 3 (100.0%) | 0 (0.0%) |
| Construction & Extraction | 2 (100.0%) | 0 (0.0%) |
| Installation, Maintenance & Repair | 0 (0.0%) | 0 (0.0%) |
| Total (Category) | 5 (100.0%) | 0 (0.0%) |
| Total (Overall) | 24 (61.5%) | 15 (38.5%) |
Production, Transportation and Moving Occupations
The most common Production, Transportation and Moving occupations in Comstock are Transportation (3 | 7.7%), and Material Moving (2 | 5.1%).
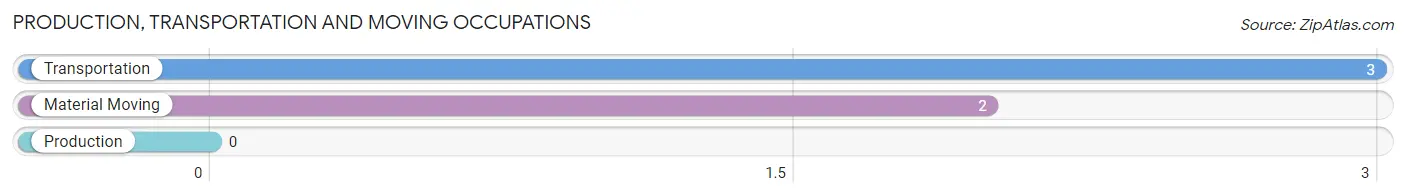
Production, Transportation and Moving Occupations by Sex
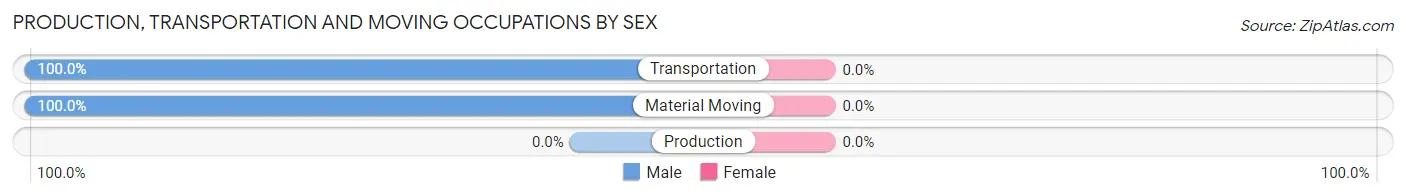
| Occupation | Male | Female |
| Production | 0 (0.0%) | 0 (0.0%) |
| Transportation | 3 (100.0%) | 0 (0.0%) |
| Material Moving | 2 (100.0%) | 0 (0.0%) |
| Total (Category) | 5 (100.0%) | 0 (0.0%) |
| Total (Overall) | 24 (61.5%) | 15 (38.5%) |
Employment Industries by Sex in Comstock
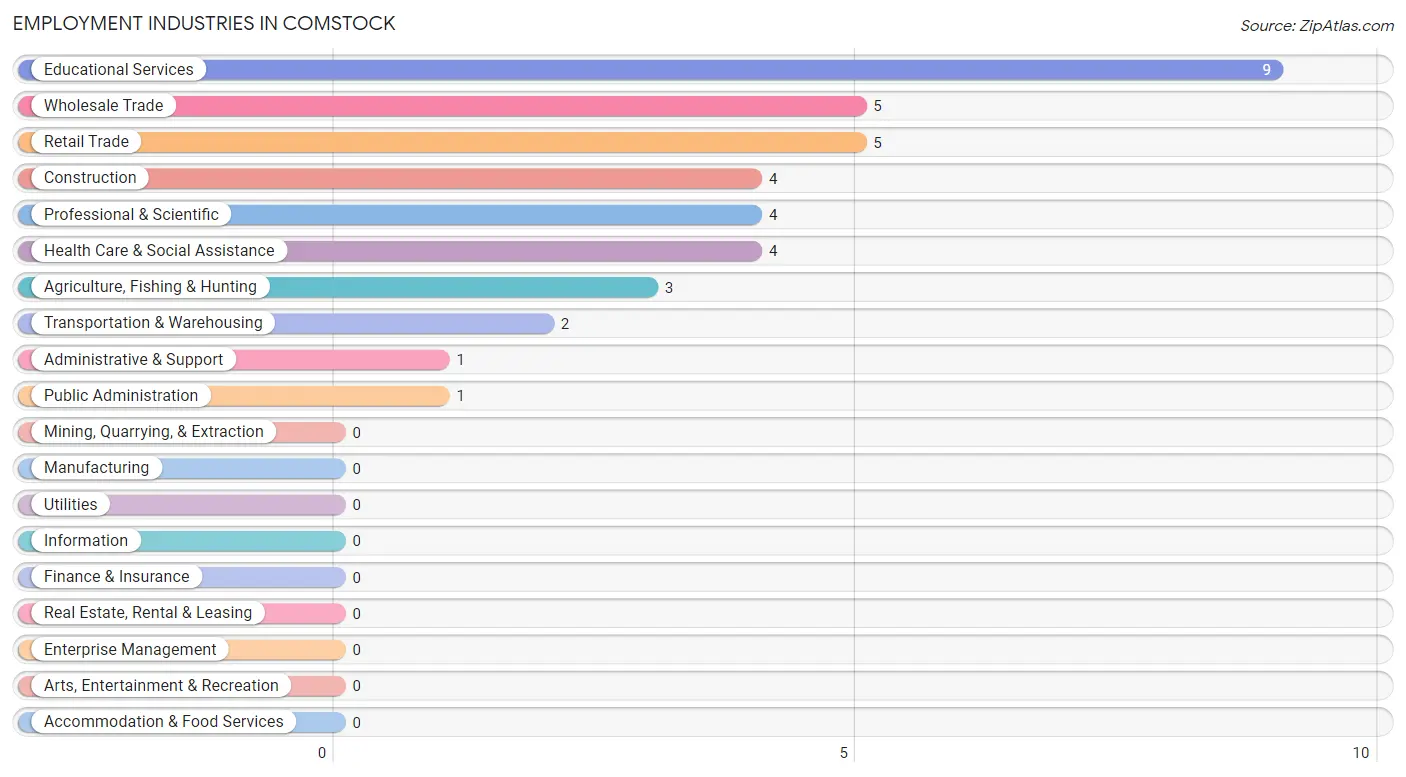
Employment Industries in Comstock
The major employment industries in Comstock include Educational Services (9 | 23.1%), Wholesale Trade (5 | 12.8%), Retail Trade (5 | 12.8%), Construction (4 | 10.3%), and Professional & Scientific (4 | 10.3%).
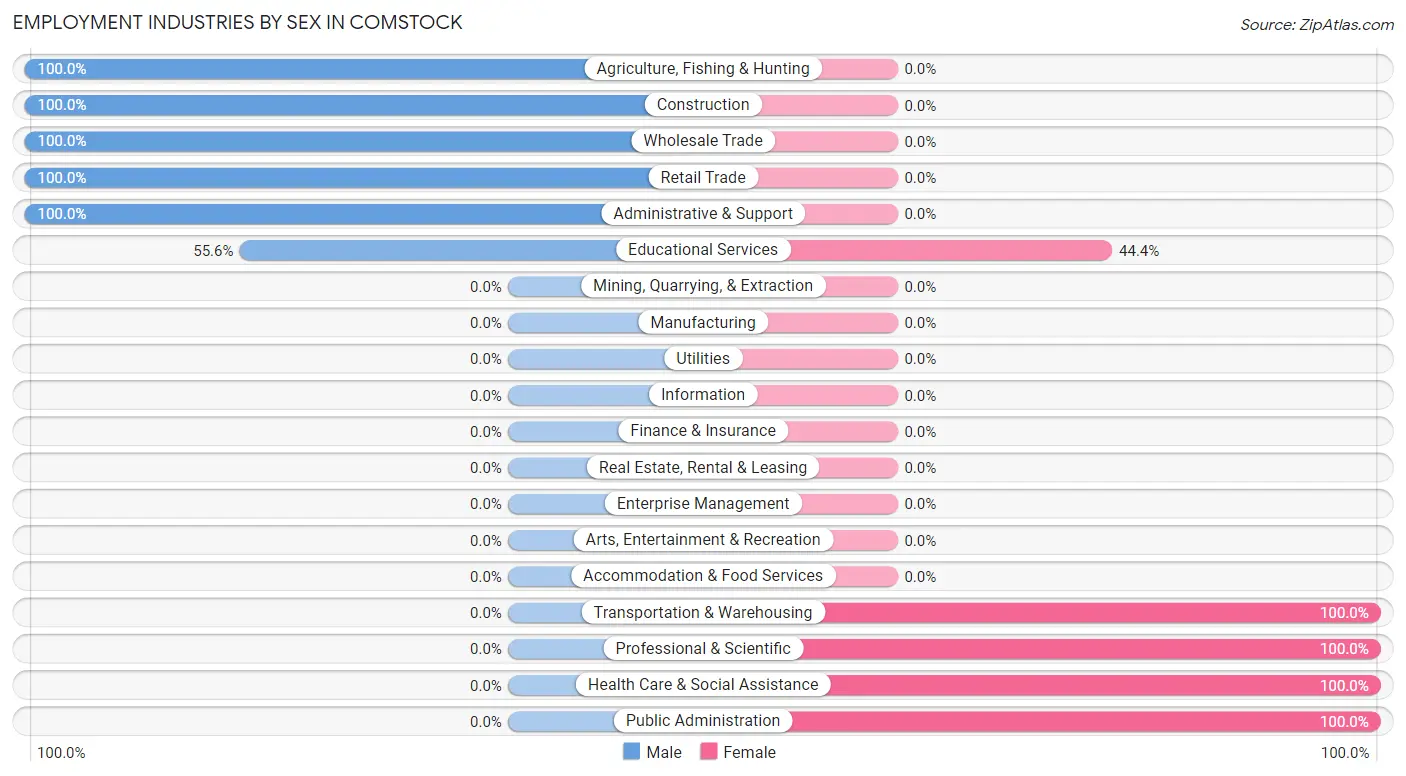
Employment Industries by Sex in Comstock
The Comstock industries that see more men than women are Agriculture, Fishing & Hunting (100.0%), Construction (100.0%), and Wholesale Trade (100.0%), whereas the industries that tend to have a higher number of women are Transportation & Warehousing (100.0%), Professional & Scientific (100.0%), and Health Care & Social Assistance (100.0%).
| Industry | Male | Female |
| Agriculture, Fishing & Hunting | 3 (100.0%) | 0 (0.0%) |
| Mining, Quarrying, & Extraction | 0 (0.0%) | 0 (0.0%) |
| Construction | 4 (100.0%) | 0 (0.0%) |
| Manufacturing | 0 (0.0%) | 0 (0.0%) |
| Wholesale Trade | 5 (100.0%) | 0 (0.0%) |
| Retail Trade | 5 (100.0%) | 0 (0.0%) |
| Transportation & Warehousing | 0 (0.0%) | 2 (100.0%) |
| Utilities | 0 (0.0%) | 0 (0.0%) |
| Information | 0 (0.0%) | 0 (0.0%) |
| Finance & Insurance | 0 (0.0%) | 0 (0.0%) |
| Real Estate, Rental & Leasing | 0 (0.0%) | 0 (0.0%) |
| Professional & Scientific | 0 (0.0%) | 4 (100.0%) |
| Enterprise Management | 0 (0.0%) | 0 (0.0%) |
| Administrative & Support | 1 (100.0%) | 0 (0.0%) |
| Educational Services | 5 (55.6%) | 4 (44.4%) |
| Health Care & Social Assistance | 0 (0.0%) | 4 (100.0%) |
| Arts, Entertainment & Recreation | 0 (0.0%) | 0 (0.0%) |
| Accommodation & Food Services | 0 (0.0%) | 0 (0.0%) |
| Public Administration | 0 (0.0%) | 1 (100.0%) |
| Total | 24 (61.5%) | 15 (38.5%) |
Education in Comstock
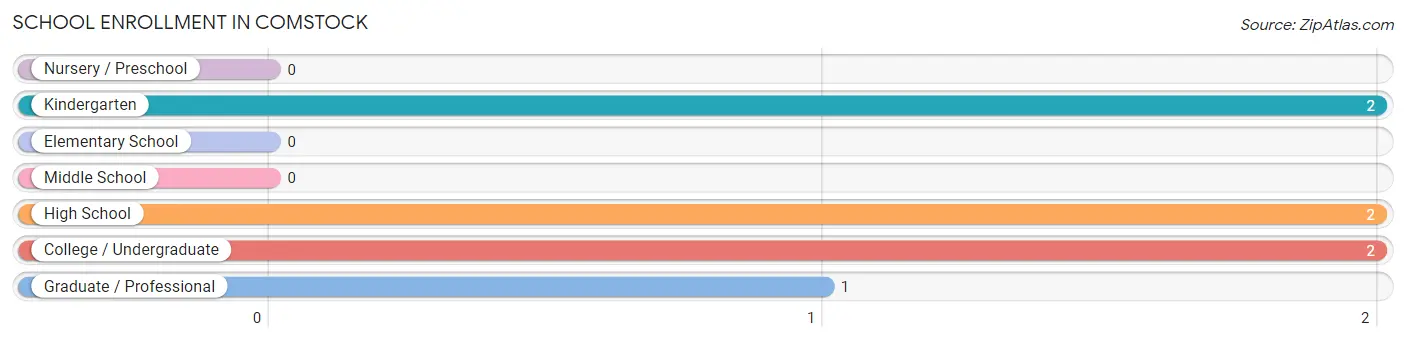
School Enrollment in Comstock
The most common levels of schooling among the 7 students in Comstock are kindergarten (2 | 28.6%), high school (2 | 28.6%), and college / undergraduate (2 | 28.6%).
| School Level | # Students | % Students |
| Nursery / Preschool | 0 | 0.0% |
| Kindergarten | 2 | 28.6% |
| Elementary School | 0 | 0.0% |
| Middle School | 0 | 0.0% |
| High School | 2 | 28.6% |
| College / Undergraduate | 2 | 28.6% |
| Graduate / Professional | 1 | 14.3% |
| Total | 7 | 100.0% |
School Enrollment by Age by Funding Source in Comstock
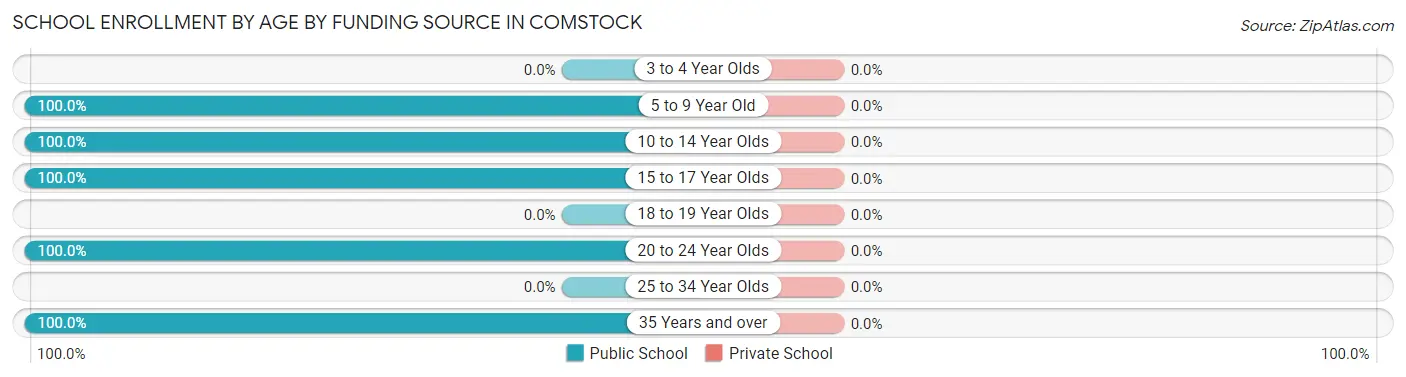
| Age Bracket | Public School | Private School |
| 3 to 4 Year Olds | 0 (0.0%) | 0 (0.0%) |
| 5 to 9 Year Old | 2 (100.0%) | 0 (0.0%) |
| 10 to 14 Year Olds | 1 (100.0%) | 0 (0.0%) |
| 15 to 17 Year Olds | 1 (100.0%) | 0 (0.0%) |
| 18 to 19 Year Olds | 0 (0.0%) | 0 (0.0%) |
| 20 to 24 Year Olds | 2 (100.0%) | 0 (0.0%) |
| 25 to 34 Year Olds | 0 (0.0%) | 0 (0.0%) |
| 35 Years and over | 1 (100.0%) | 0 (0.0%) |
| Total | 7 (100.0%) | 0 (0.0%) |
Educational Attainment by Field of Study in Comstock
Education (5 | 27.8%), social sciences (3 | 16.7%), business (3 | 16.7%), bio, nature & agricultural (2 | 11.1%), and arts & humanities (2 | 11.1%) are the most common fields of study among 18 individuals in Comstock who have obtained a bachelor's degree or higher.
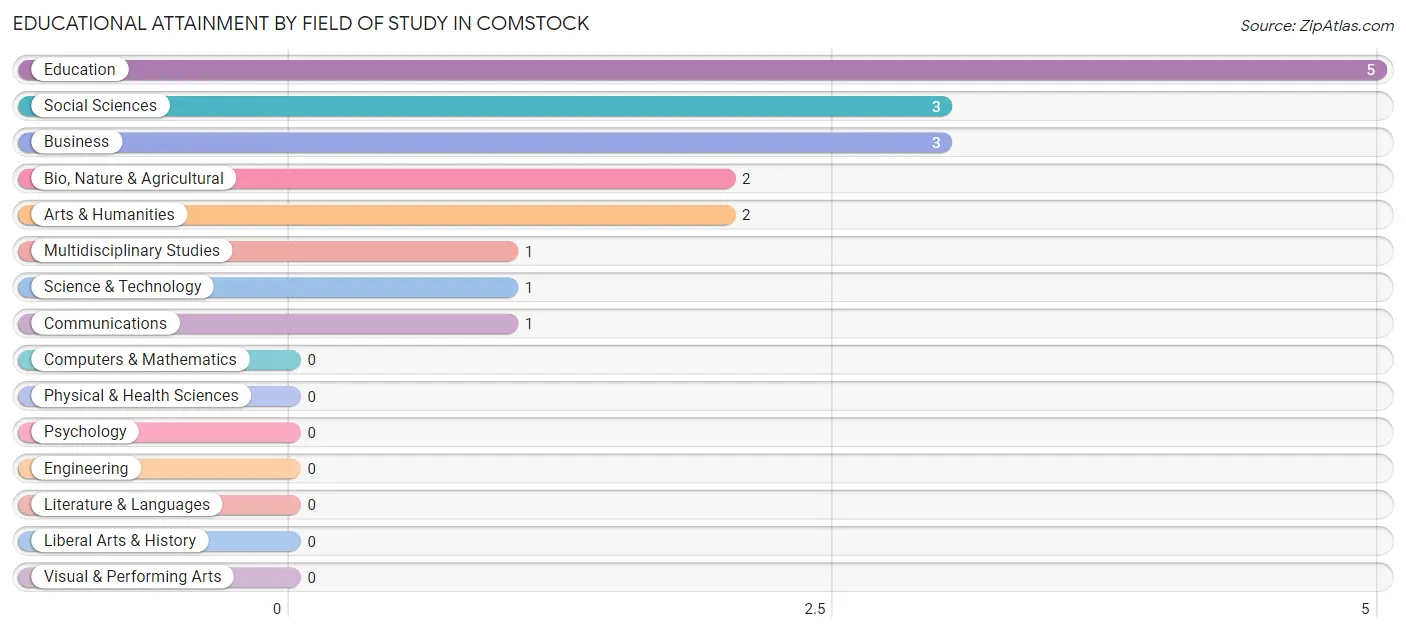
| Field of Study | # Graduates | % Graduates |
| Computers & Mathematics | 0 | 0.0% |
| Bio, Nature & Agricultural | 2 | 11.1% |
| Physical & Health Sciences | 0 | 0.0% |
| Psychology | 0 | 0.0% |
| Social Sciences | 3 | 16.7% |
| Engineering | 0 | 0.0% |
| Multidisciplinary Studies | 1 | 5.6% |
| Science & Technology | 1 | 5.6% |
| Business | 3 | 16.7% |
| Education | 5 | 27.8% |
| Literature & Languages | 0 | 0.0% |
| Liberal Arts & History | 0 | 0.0% |
| Visual & Performing Arts | 0 | 0.0% |
| Communications | 1 | 5.6% |
| Arts & Humanities | 2 | 11.1% |
| Total | 18 | 100.0% |
Transportation & Commute in Comstock
Vehicle Availability by Sex in Comstock
The most prevalent vehicle ownership categories in Comstock are males with 2 vehicles (10, accounting for 41.7%) and females with 2 vehicles (7, making up 66.7%).
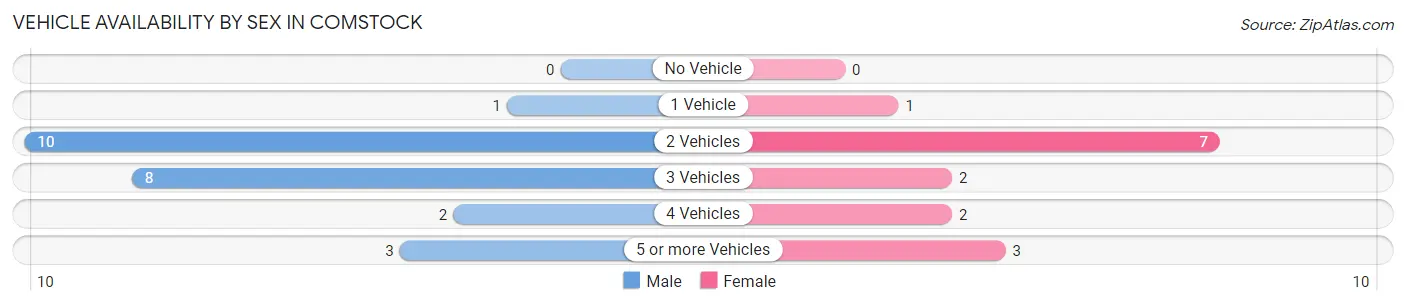
| Vehicles Available | Male | Female |
| No Vehicle | 0 (0.0%) | 0 (0.0%) |
| 1 Vehicle | 1 (4.2%) | 1 (6.7%) |
| 2 Vehicles | 10 (41.7%) | 7 (46.7%) |
| 3 Vehicles | 8 (33.3%) | 2 (13.3%) |
| 4 Vehicles | 2 (8.3%) | 2 (13.3%) |
| 5 or more Vehicles | 3 (12.5%) | 3 (20.0%) |
| Total | 24 (100.0%) | 15 (100.0%) |
Commute Time in Comstock
The most frequently occuring commute durations in Comstock are 15 to 19 minutes (10 commuters, 27.8%), 25 to 29 minutes (8 commuters, 22.2%), and 20 to 24 minutes (7 commuters, 19.4%).
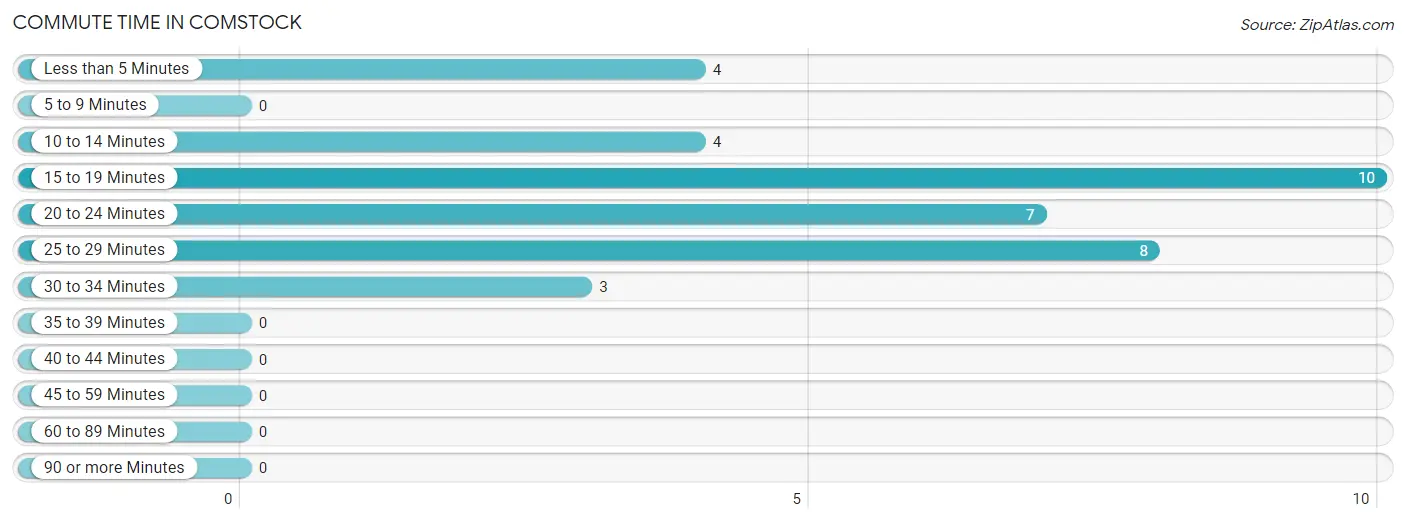
| Commute Time | # Commuters | % Commuters |
| Less than 5 Minutes | 4 | 11.1% |
| 5 to 9 Minutes | 0 | 0.0% |
| 10 to 14 Minutes | 4 | 11.1% |
| 15 to 19 Minutes | 10 | 27.8% |
| 20 to 24 Minutes | 7 | 19.4% |
| 25 to 29 Minutes | 8 | 22.2% |
| 30 to 34 Minutes | 3 | 8.3% |
| 35 to 39 Minutes | 0 | 0.0% |
| 40 to 44 Minutes | 0 | 0.0% |
| 45 to 59 Minutes | 0 | 0.0% |
| 60 to 89 Minutes | 0 | 0.0% |
| 90 or more Minutes | 0 | 0.0% |
Commute Time by Sex in Comstock
The most common commute times in Comstock are 15 to 19 minutes (7 commuters, 33.3%) for males and 25 to 29 minutes (5 commuters, 33.3%) for females.
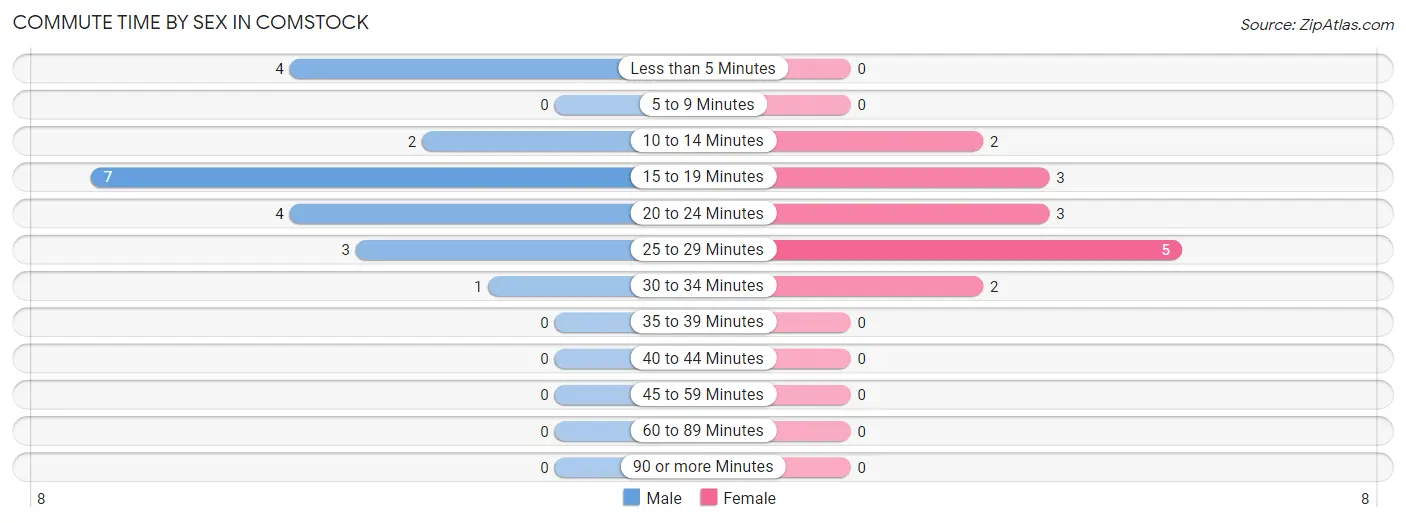
| Commute Time | Male | Female |
| Less than 5 Minutes | 4 (19.1%) | 0 (0.0%) |
| 5 to 9 Minutes | 0 (0.0%) | 0 (0.0%) |
| 10 to 14 Minutes | 2 (9.5%) | 2 (13.3%) |
| 15 to 19 Minutes | 7 (33.3%) | 3 (20.0%) |
| 20 to 24 Minutes | 4 (19.1%) | 3 (20.0%) |
| 25 to 29 Minutes | 3 (14.3%) | 5 (33.3%) |
| 30 to 34 Minutes | 1 (4.8%) | 2 (13.3%) |
| 35 to 39 Minutes | 0 (0.0%) | 0 (0.0%) |
| 40 to 44 Minutes | 0 (0.0%) | 0 (0.0%) |
| 45 to 59 Minutes | 0 (0.0%) | 0 (0.0%) |
| 60 to 89 Minutes | 0 (0.0%) | 0 (0.0%) |
| 90 or more Minutes | 0 (0.0%) | 0 (0.0%) |
Time of Departure to Work by Sex in Comstock
The most frequent times of departure to work in Comstock are 5:30 AM to 5:59 AM (4, 19.1%) for males and 7:00 AM to 7:29 AM (5, 33.3%) for females.
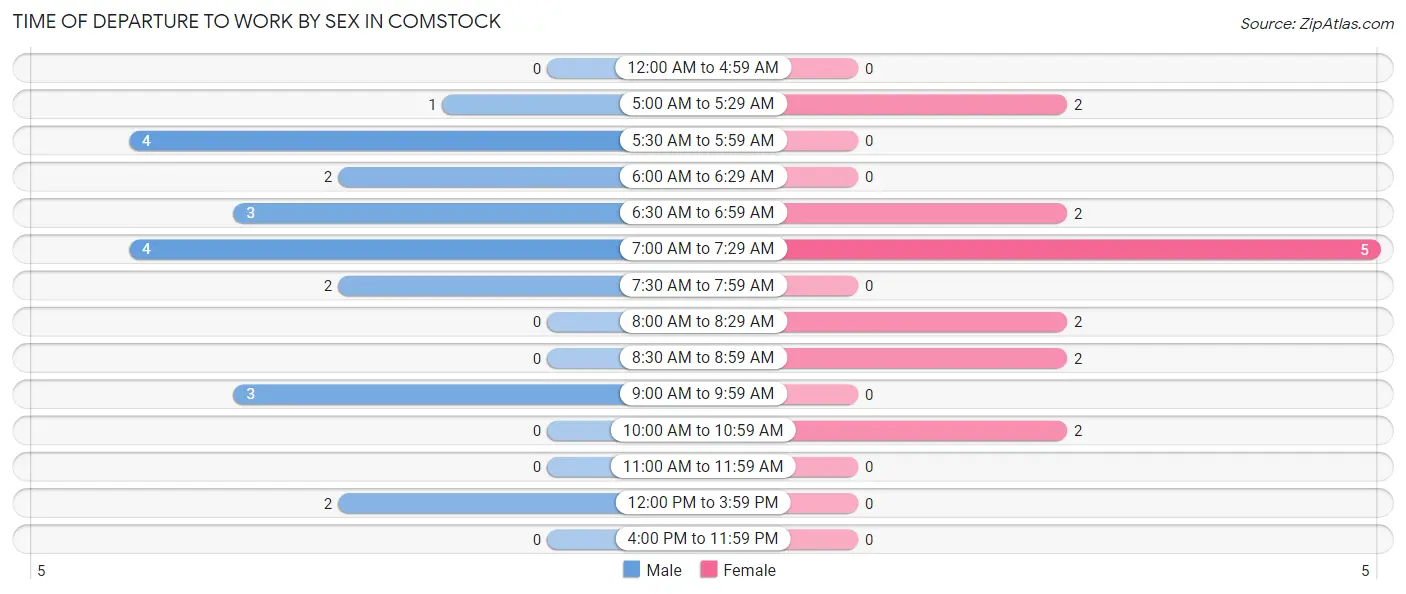
| Time of Departure | Male | Female |
| 12:00 AM to 4:59 AM | 0 (0.0%) | 0 (0.0%) |
| 5:00 AM to 5:29 AM | 1 (4.8%) | 2 (13.3%) |
| 5:30 AM to 5:59 AM | 4 (19.1%) | 0 (0.0%) |
| 6:00 AM to 6:29 AM | 2 (9.5%) | 0 (0.0%) |
| 6:30 AM to 6:59 AM | 3 (14.3%) | 2 (13.3%) |
| 7:00 AM to 7:29 AM | 4 (19.1%) | 5 (33.3%) |
| 7:30 AM to 7:59 AM | 2 (9.5%) | 0 (0.0%) |
| 8:00 AM to 8:29 AM | 0 (0.0%) | 2 (13.3%) |
| 8:30 AM to 8:59 AM | 0 (0.0%) | 2 (13.3%) |
| 9:00 AM to 9:59 AM | 3 (14.3%) | 0 (0.0%) |
| 10:00 AM to 10:59 AM | 0 (0.0%) | 2 (13.3%) |
| 11:00 AM to 11:59 AM | 0 (0.0%) | 0 (0.0%) |
| 12:00 PM to 3:59 PM | 2 (9.5%) | 0 (0.0%) |
| 4:00 PM to 11:59 PM | 0 (0.0%) | 0 (0.0%) |
| Total | 21 (100.0%) | 15 (100.0%) |
Housing Occupancy in Comstock
Occupancy by Ownership in Comstock
Of the total 34 dwellings in Comstock, owner-occupied units account for 34 (100.0%), while renter-occupied units make up 0 (0.0%).
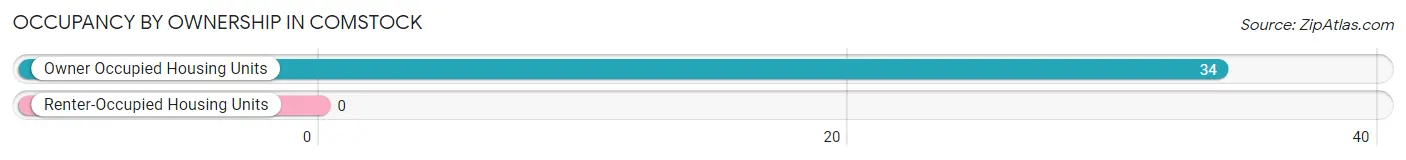
| Occupancy | # Housing Units | % Housing Units |
| Owner Occupied Housing Units | 34 | 100.0% |
| Renter-Occupied Housing Units | 0 | 0.0% |
| Total Occupied Housing Units | 34 | 100.0% |
Occupancy by Household Size in Comstock
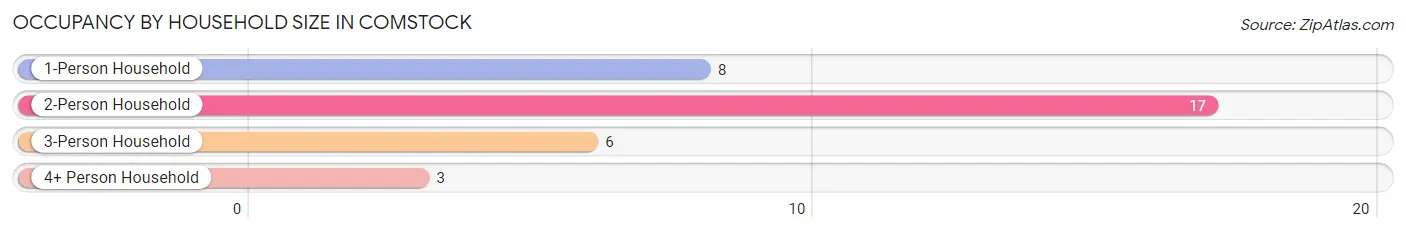
| Household Size | # Housing Units | % Housing Units |
| 1-Person Household | 8 | 23.5% |
| 2-Person Household | 17 | 50.0% |
| 3-Person Household | 6 | 17.6% |
| 4+ Person Household | 3 | 8.8% |
| Total Housing Units | 34 | 100.0% |
Occupancy by Ownership by Household Size in Comstock
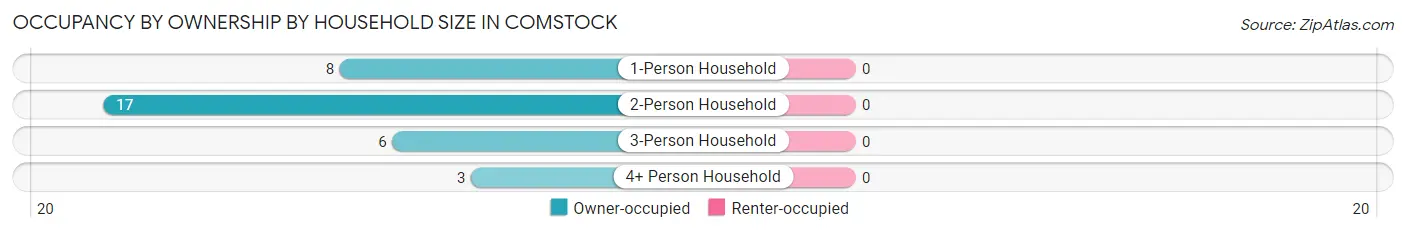
| Household Size | Owner-occupied | Renter-occupied |
| 1-Person Household | 8 (100.0%) | 0 (0.0%) |
| 2-Person Household | 17 (100.0%) | 0 (0.0%) |
| 3-Person Household | 6 (100.0%) | 0 (0.0%) |
| 4+ Person Household | 3 (100.0%) | 0 (0.0%) |
| Total Housing Units | 34 (100.0%) | 0 (0.0%) |
Occupancy by Educational Attainment in Comstock
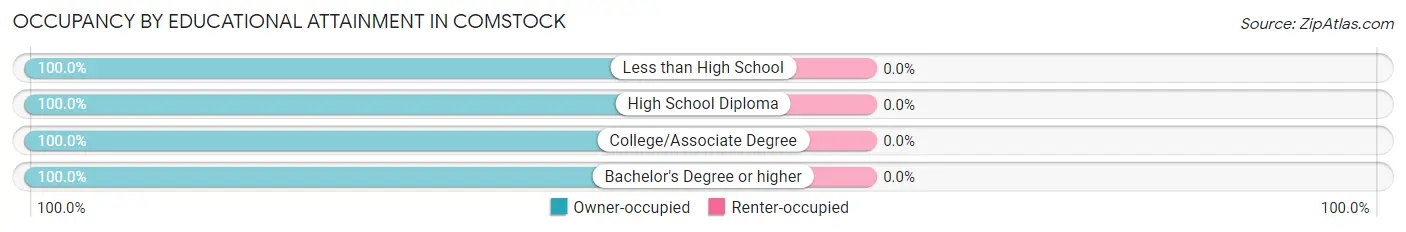
| Household Size | Owner-occupied | Renter-occupied |
| Less than High School | 7 (100.0%) | 0 (0.0%) |
| High School Diploma | 6 (100.0%) | 0 (0.0%) |
| College/Associate Degree | 12 (100.0%) | 0 (0.0%) |
| Bachelor's Degree or higher | 9 (100.0%) | 0 (0.0%) |
Occupancy by Age of Householder in Comstock
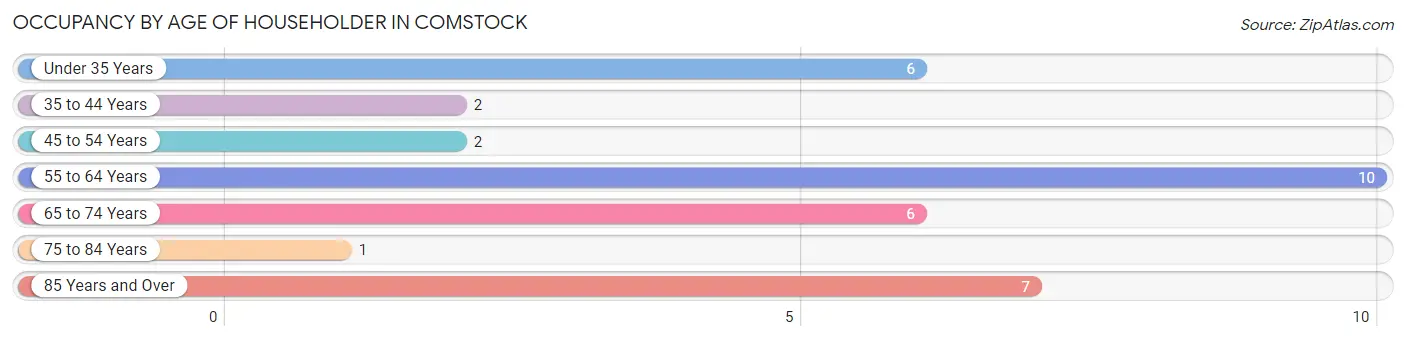
| Age Bracket | # Households | % Households |
| Under 35 Years | 6 | 17.6% |
| 35 to 44 Years | 2 | 5.9% |
| 45 to 54 Years | 2 | 5.9% |
| 55 to 64 Years | 10 | 29.4% |
| 65 to 74 Years | 6 | 17.6% |
| 75 to 84 Years | 1 | 2.9% |
| 85 Years and Over | 7 | 20.6% |
| Total | 34 | 100.0% |
Housing Finances in Comstock
Median Income by Occupancy in Comstock
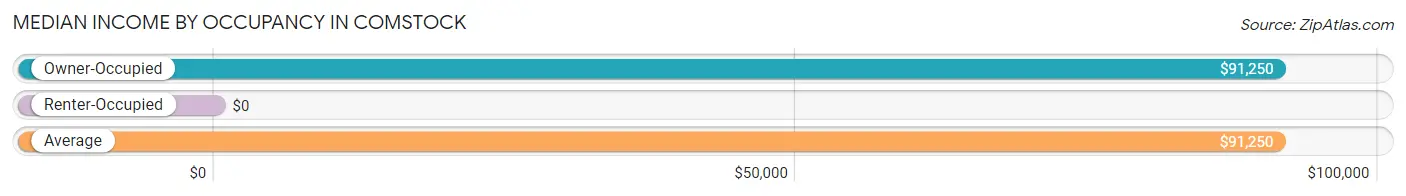
| Occupancy Type | # Households | Median Income |
| Owner-Occupied | 34 (100.0%) | $91,250 |
| Renter-Occupied | 0 (0.0%) | $0 |
| Average | 34 (100.0%) | $91,250 |
Occupancy by Householder Income Bracket in Comstock
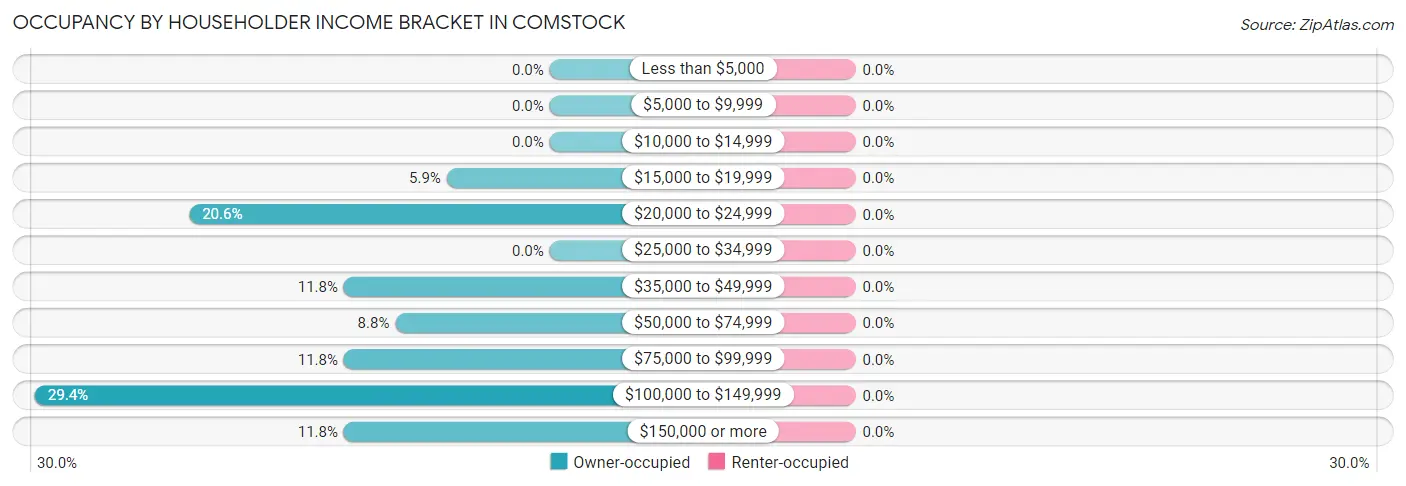
| Income Bracket | Owner-occupied | Renter-occupied |
| Less than $5,000 | 0 (0.0%) | 0 (0.0%) |
| $5,000 to $9,999 | 0 (0.0%) | 0 (0.0%) |
| $10,000 to $14,999 | 0 (0.0%) | 0 (0.0%) |
| $15,000 to $19,999 | 2 (5.9%) | 0 (0.0%) |
| $20,000 to $24,999 | 7 (20.6%) | 0 (0.0%) |
| $25,000 to $34,999 | 0 (0.0%) | 0 (0.0%) |
| $35,000 to $49,999 | 4 (11.8%) | 0 (0.0%) |
| $50,000 to $74,999 | 3 (8.8%) | 0 (0.0%) |
| $75,000 to $99,999 | 4 (11.8%) | 0 (0.0%) |
| $100,000 to $149,999 | 10 (29.4%) | 0 (0.0%) |
| $150,000 or more | 4 (11.8%) | 0 (0.0%) |
| Total | 34 (100.0%) | 0 (0.0%) |
Monthly Housing Cost Tiers in Comstock
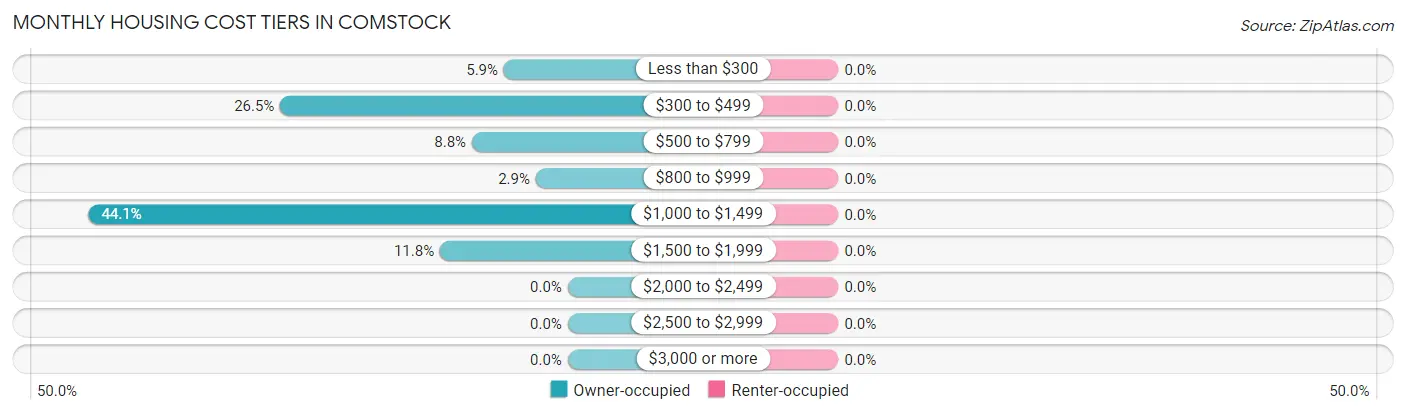
| Monthly Cost | Owner-occupied | Renter-occupied |
| Less than $300 | 2 (5.9%) | 0 (0.0%) |
| $300 to $499 | 9 (26.5%) | 0 (0.0%) |
| $500 to $799 | 3 (8.8%) | 0 (0.0%) |
| $800 to $999 | 1 (2.9%) | 0 (0.0%) |
| $1,000 to $1,499 | 15 (44.1%) | 0 (0.0%) |
| $1,500 to $1,999 | 4 (11.8%) | 0 (0.0%) |
| $2,000 to $2,499 | 0 (0.0%) | 0 (0.0%) |
| $2,500 to $2,999 | 0 (0.0%) | 0 (0.0%) |
| $3,000 or more | 0 (0.0%) | 0 (0.0%) |
| Total | 34 (100.0%) | 0 (0.0%) |
Physical Housing Characteristics in Comstock
Housing Structures in Comstock
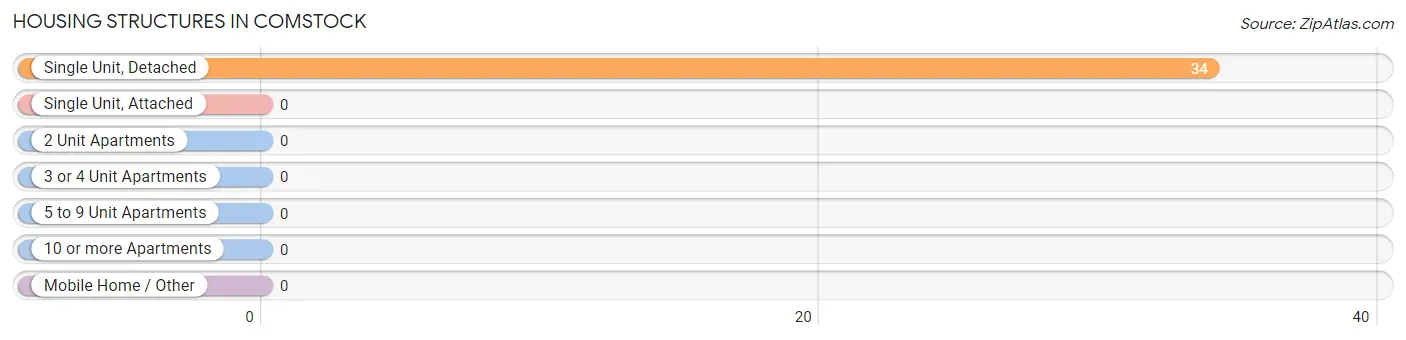
| Structure Type | # Housing Units | % Housing Units |
| Single Unit, Detached | 34 | 100.0% |
| Single Unit, Attached | 0 | 0.0% |
| 2 Unit Apartments | 0 | 0.0% |
| 3 or 4 Unit Apartments | 0 | 0.0% |
| 5 to 9 Unit Apartments | 0 | 0.0% |
| 10 or more Apartments | 0 | 0.0% |
| Mobile Home / Other | 0 | 0.0% |
| Total | 34 | 100.0% |
Housing Structures by Occupancy in Comstock
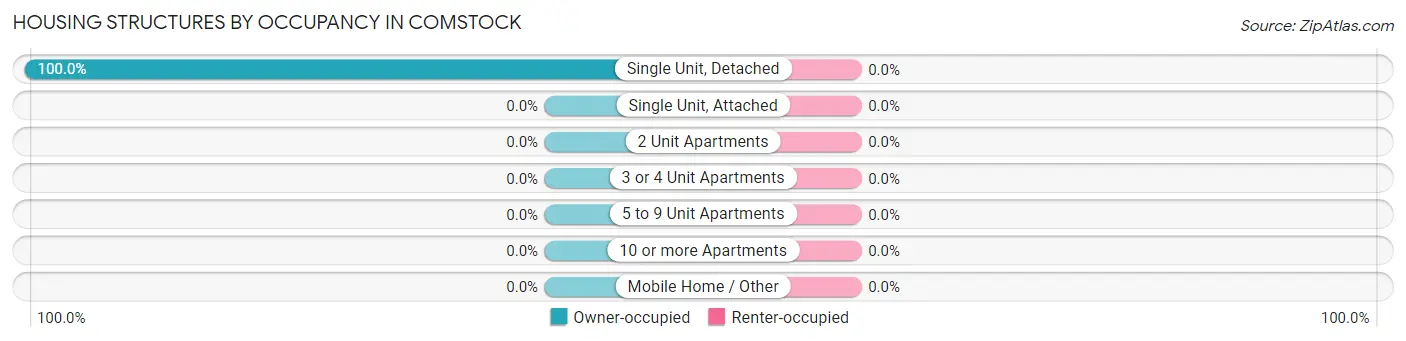
| Structure Type | Owner-occupied | Renter-occupied |
| Single Unit, Detached | 34 (100.0%) | 0 (0.0%) |
| Single Unit, Attached | 0 (0.0%) | 0 (0.0%) |
| 2 Unit Apartments | 0 (0.0%) | 0 (0.0%) |
| 3 or 4 Unit Apartments | 0 (0.0%) | 0 (0.0%) |
| 5 to 9 Unit Apartments | 0 (0.0%) | 0 (0.0%) |
| 10 or more Apartments | 0 (0.0%) | 0 (0.0%) |
| Mobile Home / Other | 0 (0.0%) | 0 (0.0%) |
| Total | 34 (100.0%) | 0 (0.0%) |
Housing Structures by Number of Rooms in Comstock
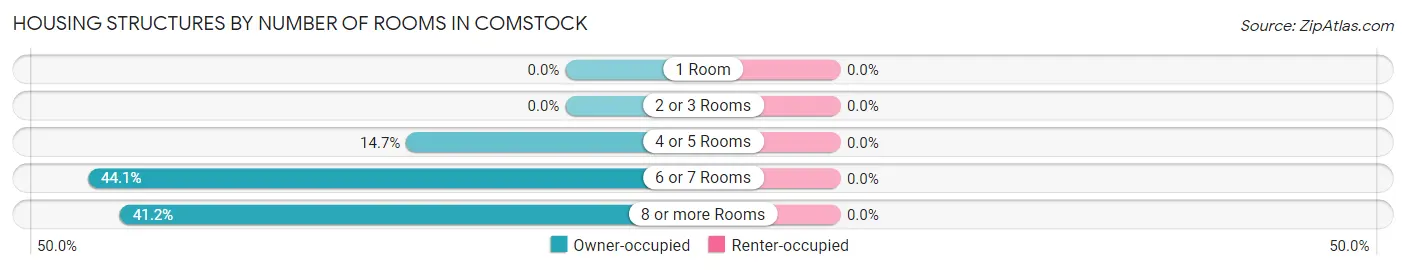
| Number of Rooms | Owner-occupied | Renter-occupied |
| 1 Room | 0 (0.0%) | 0 (0.0%) |
| 2 or 3 Rooms | 0 (0.0%) | 0 (0.0%) |
| 4 or 5 Rooms | 5 (14.7%) | 0 (0.0%) |
| 6 or 7 Rooms | 15 (44.1%) | 0 (0.0%) |
| 8 or more Rooms | 14 (41.2%) | 0 (0.0%) |
| Total | 34 (100.0%) | 0 (0.0%) |
Housing Structure by Heating Type in Comstock
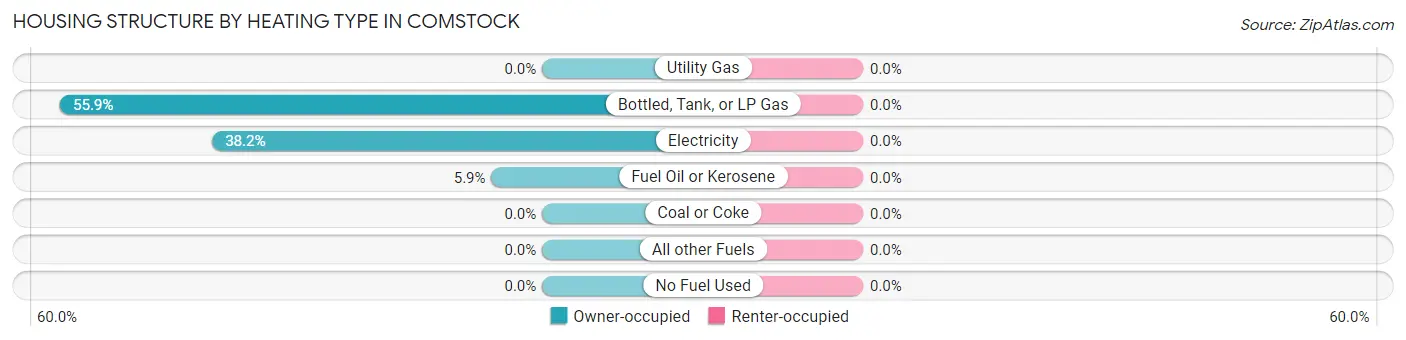
| Heating Type | Owner-occupied | Renter-occupied |
| Utility Gas | 0 (0.0%) | 0 (0.0%) |
| Bottled, Tank, or LP Gas | 19 (55.9%) | 0 (0.0%) |
| Electricity | 13 (38.2%) | 0 (0.0%) |
| Fuel Oil or Kerosene | 2 (5.9%) | 0 (0.0%) |
| Coal or Coke | 0 (0.0%) | 0 (0.0%) |
| All other Fuels | 0 (0.0%) | 0 (0.0%) |
| No Fuel Used | 0 (0.0%) | 0 (0.0%) |
| Total | 34 (100.0%) | 0 (0.0%) |
Household Vehicle Usage in Comstock
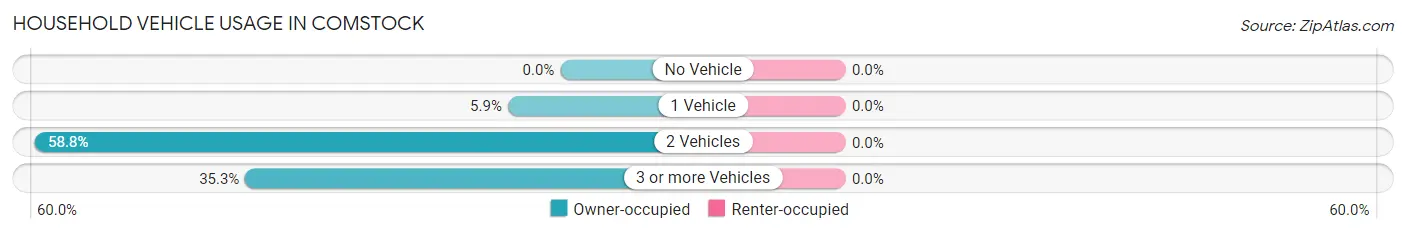
| Vehicles per Household | Owner-occupied | Renter-occupied |
| No Vehicle | 0 (0.0%) | 0 (0.0%) |
| 1 Vehicle | 2 (5.9%) | 0 (0.0%) |
| 2 Vehicles | 20 (58.8%) | 0 (0.0%) |
| 3 or more Vehicles | 12 (35.3%) | 0 (0.0%) |
| Total | 34 (100.0%) | 0 (0.0%) |
Real Estate & Mortgages in Comstock
Real Estate and Mortgage Overview in Comstock
| Characteristic | Without Mortgage | With Mortgage |
| Housing Units | 16 | 18 |
| Median Property Value | $97,000 | $216,700 |
| Median Household Income | - | - |
| Monthly Housing Costs | $388 | $0 |
| Real Estate Taxes | $1,300 | $0 |
Property Value by Mortgage Status in Comstock
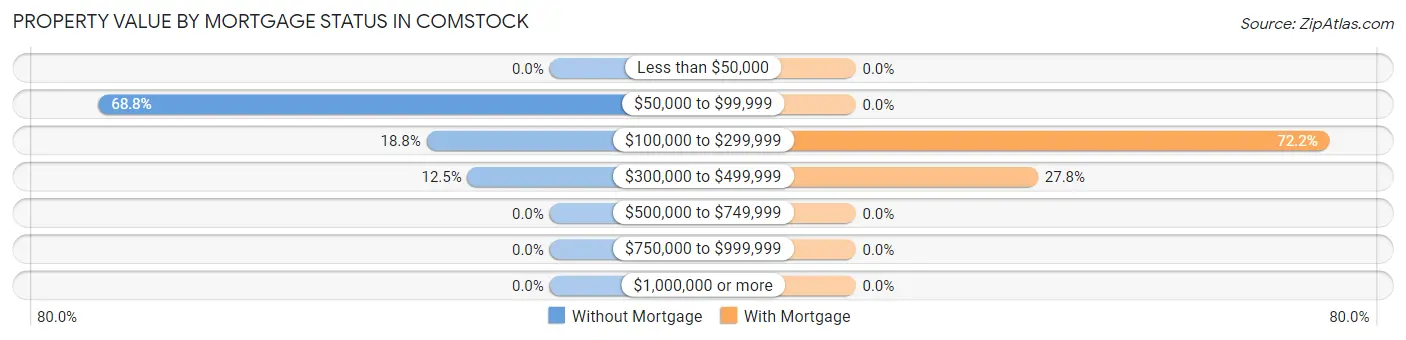
| Property Value | Without Mortgage | With Mortgage |
| Less than $50,000 | 0 (0.0%) | 0 (0.0%) |
| $50,000 to $99,999 | 11 (68.8%) | 0 (0.0%) |
| $100,000 to $299,999 | 3 (18.8%) | 13 (72.2%) |
| $300,000 to $499,999 | 2 (12.5%) | 5 (27.8%) |
| $500,000 to $749,999 | 0 (0.0%) | 0 (0.0%) |
| $750,000 to $999,999 | 0 (0.0%) | 0 (0.0%) |
| $1,000,000 or more | 0 (0.0%) | 0 (0.0%) |
| Total | 16 (100.0%) | 18 (100.0%) |
Household Income by Mortgage Status in Comstock
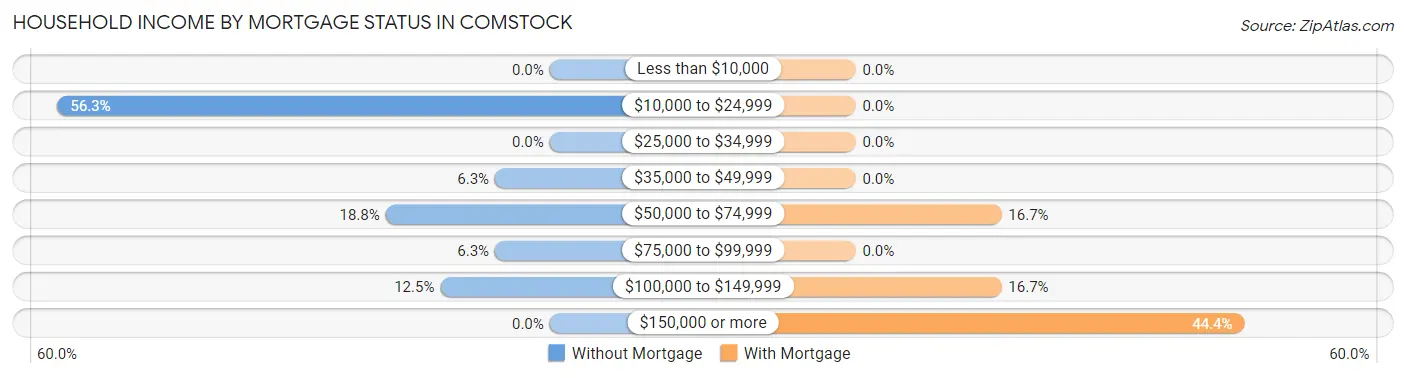
| Household Income | Without Mortgage | With Mortgage |
| Less than $10,000 | 0 (0.0%) | 0 (0.0%) |
| $10,000 to $24,999 | 9 (56.2%) | 0 (0.0%) |
| $25,000 to $34,999 | 0 (0.0%) | 0 (0.0%) |
| $35,000 to $49,999 | 1 (6.2%) | 0 (0.0%) |
| $50,000 to $74,999 | 3 (18.8%) | 3 (16.7%) |
| $75,000 to $99,999 | 1 (6.2%) | 0 (0.0%) |
| $100,000 to $149,999 | 2 (12.5%) | 3 (16.7%) |
| $150,000 or more | 0 (0.0%) | 8 (44.4%) |
| Total | 16 (100.0%) | 18 (100.0%) |
Property Value to Household Income Ratio in Comstock
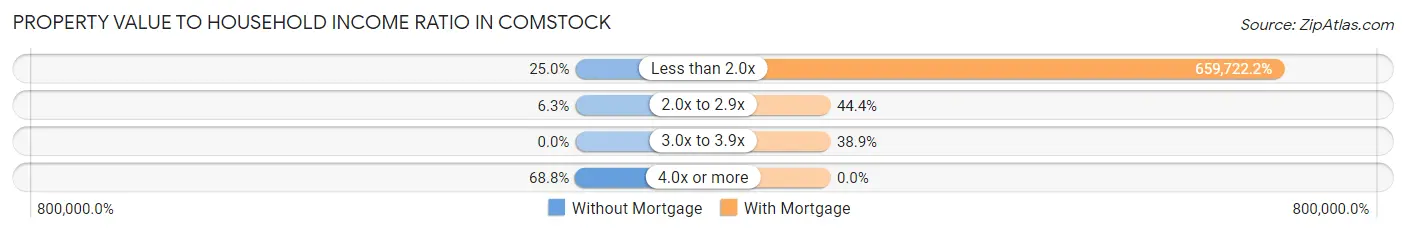
| Value-to-Income Ratio | Without Mortgage | With Mortgage |
| Less than 2.0x | 4 (25.0%) | 118,750 (659,722.2%) |
| 2.0x to 2.9x | 1 (6.2%) | 8 (44.4%) |
| 3.0x to 3.9x | 0 (0.0%) | 7 (38.9%) |
| 4.0x or more | 11 (68.8%) | 0 (0.0%) |
| Total | 16 (100.0%) | 18 (100.0%) |
Real Estate Taxes by Mortgage Status in Comstock
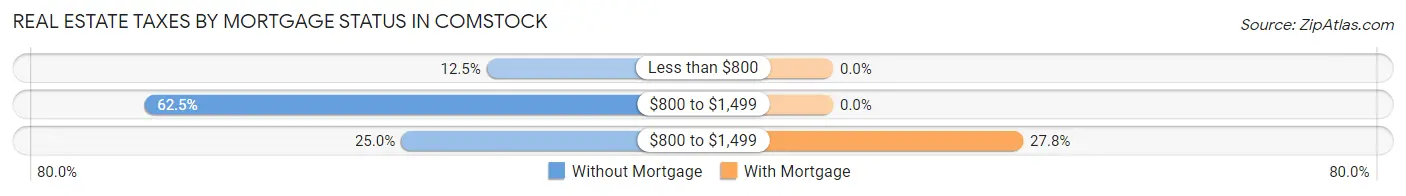
| Property Taxes | Without Mortgage | With Mortgage |
| Less than $800 | 2 (12.5%) | 0 (0.0%) |
| $800 to $1,499 | 10 (62.5%) | 0 (0.0%) |
| $800 to $1,499 | 4 (25.0%) | 5 (27.8%) |
| Total | 16 (100.0%) | 18 (100.0%) |
Health & Disability in Comstock
Health Insurance Coverage by Age in Comstock
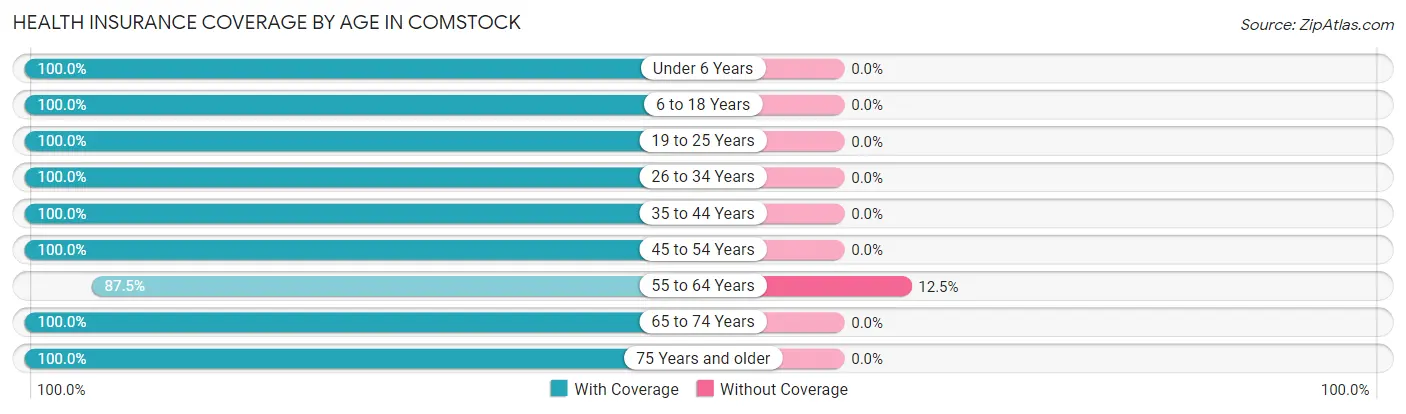
| Age Bracket | With Coverage | Without Coverage |
| Under 6 Years | 3 (100.0%) | 0 (0.0%) |
| 6 to 18 Years | 2 (100.0%) | 0 (0.0%) |
| 19 to 25 Years | 9 (100.0%) | 0 (0.0%) |
| 26 to 34 Years | 7 (100.0%) | 0 (0.0%) |
| 35 to 44 Years | 6 (100.0%) | 0 (0.0%) |
| 45 to 54 Years | 3 (100.0%) | 0 (0.0%) |
| 55 to 64 Years | 14 (87.5%) | 2 (12.5%) |
| 65 to 74 Years | 7 (100.0%) | 0 (0.0%) |
| 75 Years and older | 22 (100.0%) | 0 (0.0%) |
| Total | 73 (97.3%) | 2 (2.7%) |
Health Insurance Coverage by Citizenship Status in Comstock
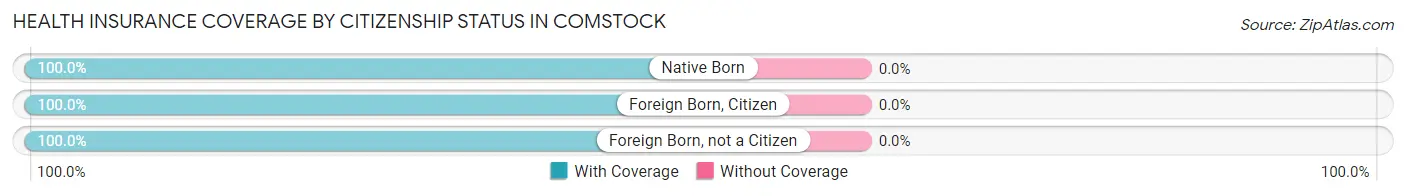
| Citizenship Status | With Coverage | Without Coverage |
| Native Born | 3 (100.0%) | 0 (0.0%) |
| Foreign Born, Citizen | 2 (100.0%) | 0 (0.0%) |
| Foreign Born, not a Citizen | 9 (100.0%) | 0 (0.0%) |
Health Insurance Coverage by Household Income in Comstock
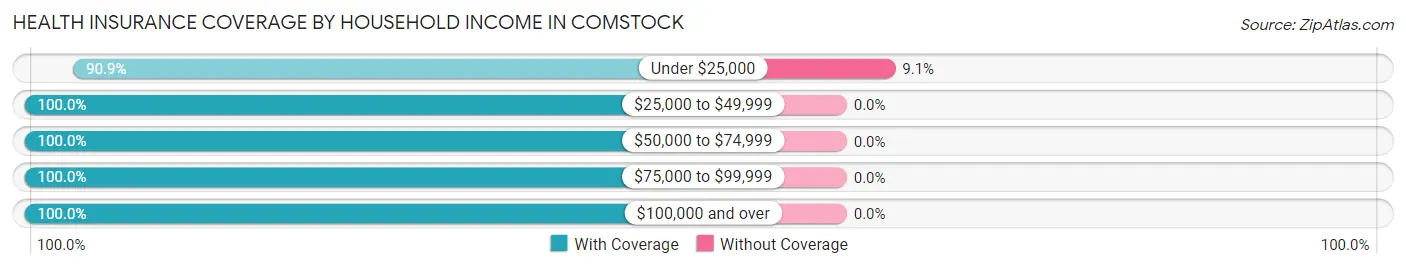
| Household Income | With Coverage | Without Coverage |
| Under $25,000 | 20 (90.9%) | 2 (9.1%) |
| $25,000 to $49,999 | 5 (100.0%) | 0 (0.0%) |
| $50,000 to $74,999 | 5 (100.0%) | 0 (0.0%) |
| $75,000 to $99,999 | 7 (100.0%) | 0 (0.0%) |
| $100,000 and over | 36 (100.0%) | 0 (0.0%) |
Public vs Private Health Insurance Coverage by Age in Comstock
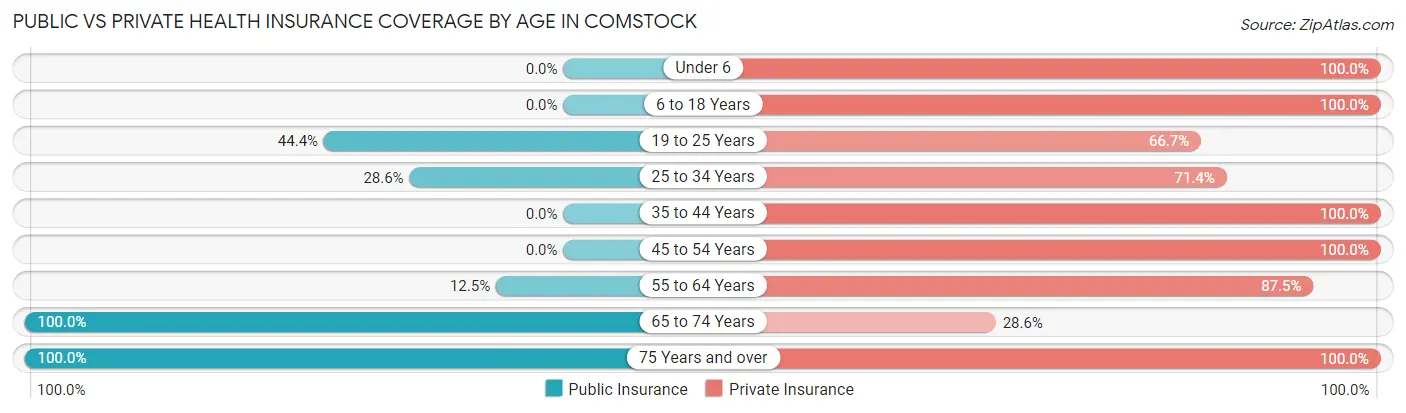
| Age Bracket | Public Insurance | Private Insurance |
| Under 6 | 0 (0.0%) | 3 (100.0%) |
| 6 to 18 Years | 0 (0.0%) | 2 (100.0%) |
| 19 to 25 Years | 4 (44.4%) | 6 (66.7%) |
| 25 to 34 Years | 2 (28.6%) | 5 (71.4%) |
| 35 to 44 Years | 0 (0.0%) | 6 (100.0%) |
| 45 to 54 Years | 0 (0.0%) | 3 (100.0%) |
| 55 to 64 Years | 2 (12.5%) | 14 (87.5%) |
| 65 to 74 Years | 7 (100.0%) | 2 (28.6%) |
| 75 Years and over | 22 (100.0%) | 22 (100.0%) |
| Total | 37 (49.3%) | 63 (84.0%) |
Disability Status by Sex by Age in Comstock
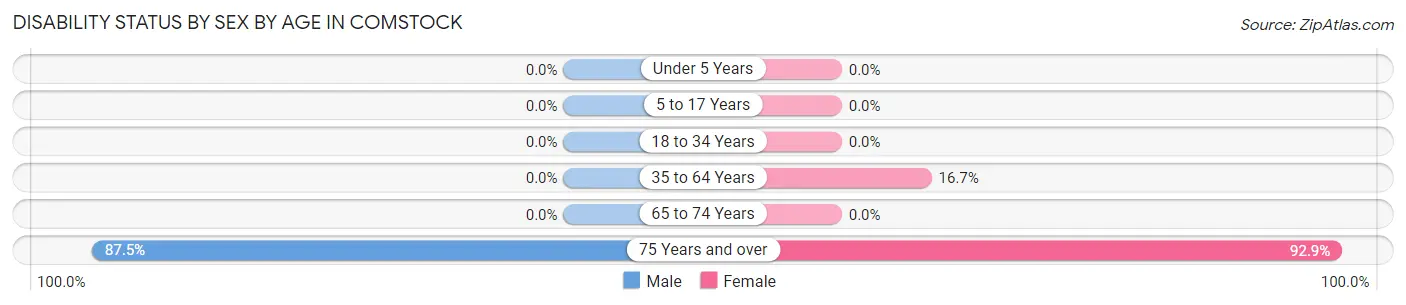
| Age Bracket | Male | Female |
| Under 5 Years | 0 (0.0%) | 0 (0.0%) |
| 5 to 17 Years | 0 (0.0%) | 0 (0.0%) |
| 18 to 34 Years | 0 (0.0%) | 0 (0.0%) |
| 35 to 64 Years | 0 (0.0%) | 2 (16.7%) |
| 65 to 74 Years | 0 (0.0%) | 0 (0.0%) |
| 75 Years and over | 7 (87.5%) | 13 (92.9%) |
Disability Class by Sex by Age in Comstock
Disability Class: Hearing Difficulty
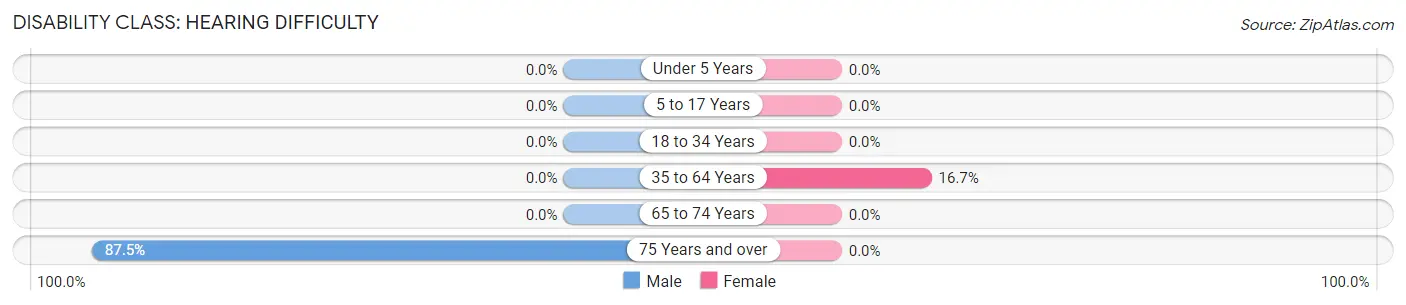
| Age Bracket | Male | Female |
| Under 5 Years | 0 (0.0%) | 0 (0.0%) |
| 5 to 17 Years | 0 (0.0%) | 0 (0.0%) |
| 18 to 34 Years | 0 (0.0%) | 0 (0.0%) |
| 35 to 64 Years | 0 (0.0%) | 2 (16.7%) |
| 65 to 74 Years | 0 (0.0%) | 0 (0.0%) |
| 75 Years and over | 7 (87.5%) | 0 (0.0%) |
Disability Class: Vision Difficulty
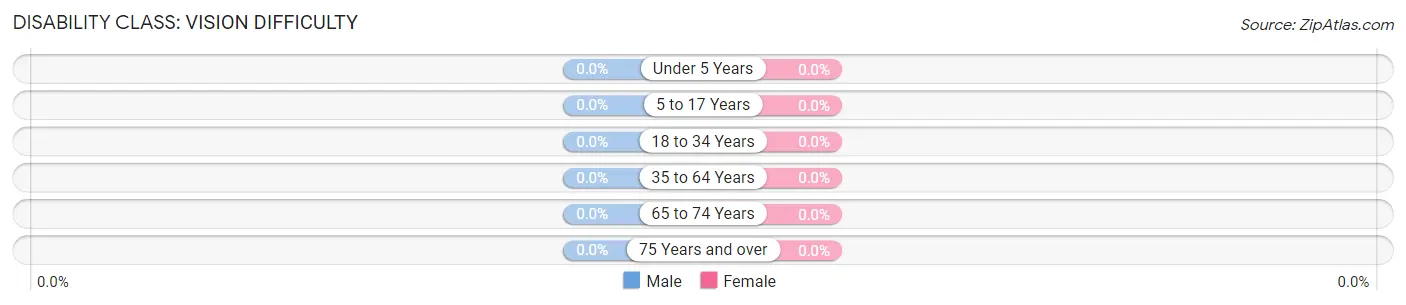
| Age Bracket | Male | Female |
| Under 5 Years | 0 (0.0%) | 0 (0.0%) |
| 5 to 17 Years | 0 (0.0%) | 0 (0.0%) |
| 18 to 34 Years | 0 (0.0%) | 0 (0.0%) |
| 35 to 64 Years | 0 (0.0%) | 0 (0.0%) |
| 65 to 74 Years | 0 (0.0%) | 0 (0.0%) |
| 75 Years and over | 0 (0.0%) | 0 (0.0%) |
Disability Class: Cognitive Difficulty
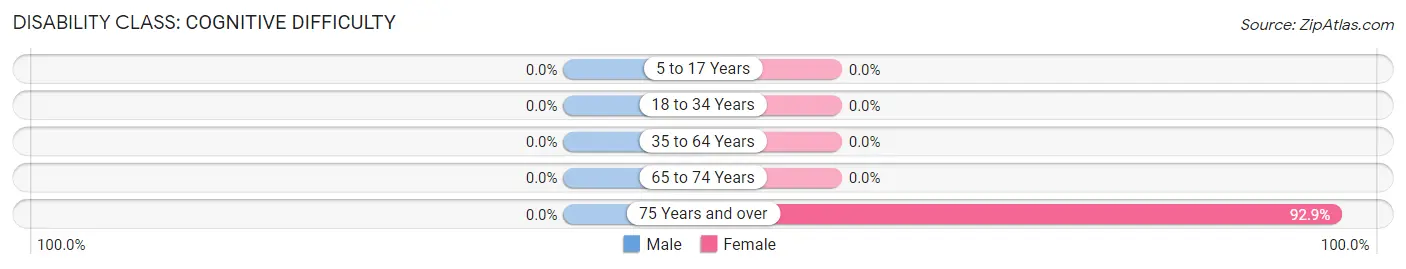
| Age Bracket | Male | Female |
| 5 to 17 Years | 0 (0.0%) | 0 (0.0%) |
| 18 to 34 Years | 0 (0.0%) | 0 (0.0%) |
| 35 to 64 Years | 0 (0.0%) | 0 (0.0%) |
| 65 to 74 Years | 0 (0.0%) | 0 (0.0%) |
| 75 Years and over | 0 (0.0%) | 13 (92.9%) |
Disability Class: Ambulatory Difficulty
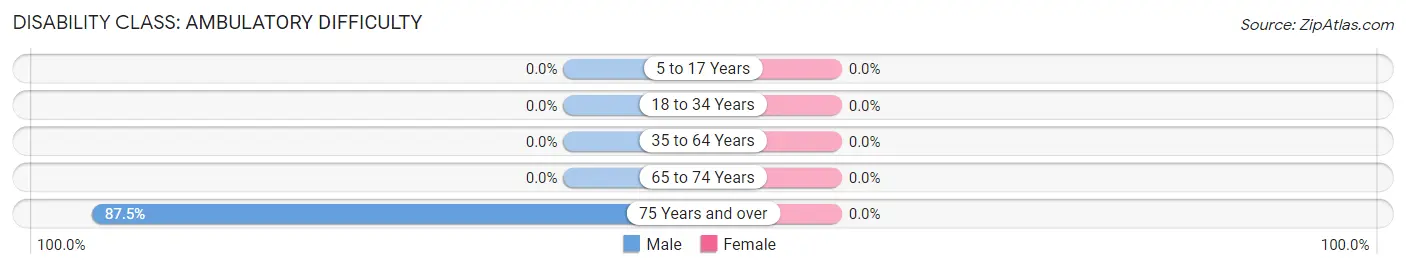
| Age Bracket | Male | Female |
| 5 to 17 Years | 0 (0.0%) | 0 (0.0%) |
| 18 to 34 Years | 0 (0.0%) | 0 (0.0%) |
| 35 to 64 Years | 0 (0.0%) | 0 (0.0%) |
| 65 to 74 Years | 0 (0.0%) | 0 (0.0%) |
| 75 Years and over | 7 (87.5%) | 0 (0.0%) |
Disability Class: Self-Care Difficulty
| Age Bracket | Male | Female |
| 5 to 17 Years | 0 (0.0%) | 0 (0.0%) |
| 18 to 34 Years | 0 (0.0%) | 0 (0.0%) |
| 35 to 64 Years | 0 (0.0%) | 0 (0.0%) |
| 65 to 74 Years | 0 (0.0%) | 0 (0.0%) |
| 75 Years and over | 0 (0.0%) | 0 (0.0%) |
Technology Access in Comstock
Computing Device Access in Comstock
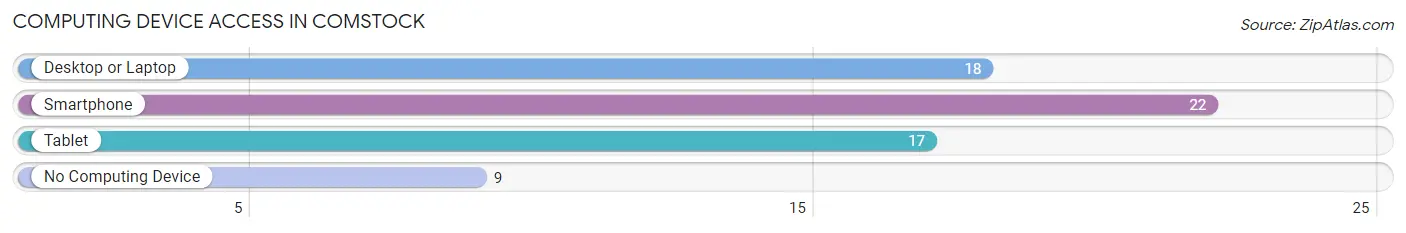
| Device Type | # Households | % Households |
| Desktop or Laptop | 18 | 52.9% |
| Smartphone | 22 | 64.7% |
| Tablet | 17 | 50.0% |
| No Computing Device | 9 | 26.5% |
| Total | 34 | 100.0% |
Internet Access in Comstock
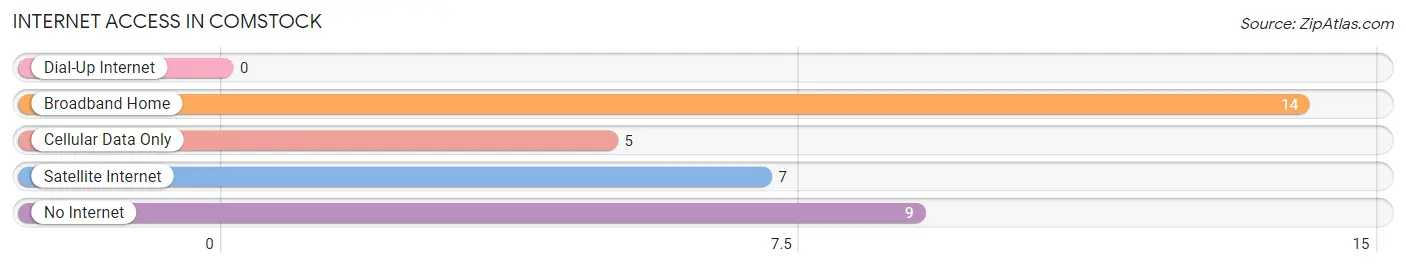
| Internet Type | # Households | % Households |
| Dial-Up Internet | 0 | 0.0% |
| Broadband Home | 14 | 41.2% |
| Cellular Data Only | 5 | 14.7% |
| Satellite Internet | 7 | 20.6% |
| No Internet | 9 | 26.5% |
| Total | 34 | 100.0% |
Comstock Summary
Comstock is a small town located in St. Louis County, Minnesota. It is situated on the western edge of the Mesabi Iron Range, a region known for its rich iron ore deposits. The town was founded in 1892 and has a population of approximately 500 people.
Geography
Comstock is located in the northern part of St. Louis County, Minnesota. It is situated on the western edge of the Mesabi Iron Range, a region known for its rich iron ore deposits. The town is located on the banks of the Embarrass River, which flows through the area. The town is surrounded by forests and lakes, providing a scenic backdrop for the town. The nearest major city is Duluth, which is located about 40 miles to the south.
Climate
Comstock has a humid continental climate, with cold winters and warm summers. The average temperature in the winter months is around 10°F, while the average temperature in the summer months is around 70°F. The town receives an average of 30 inches of precipitation per year, with most of it falling in the form of snow.
Demographics
As of the 2010 census, Comstock had a population of 498 people. The racial makeup of the town was 97.2% White, 0.2% African American, 0.4% Native American, 0.2% Asian, 0.2% from other races, and 1.8% from two or more races. Hispanic or Latino of any race were 0.6% of the population.
Economy
Comstock’s economy is largely based on the mining industry. The town is located on the western edge of the Mesabi Iron Range, a region known for its rich iron ore deposits. The town is home to several mining companies, including U.S. Steel, which operates a large iron ore mine in the area. The town also has a number of small businesses, including restaurants, bars, and retail stores.
History
Comstock was founded in 1892 by a group of settlers from Wisconsin. The town was named after the Comstock Lode, a large silver deposit discovered in Nevada in 1859. The town quickly grew as the mining industry in the area expanded. By the early 1900s, Comstock had become a bustling mining town, with a population of over 1,000 people.
In the early 20th century, Comstock was a major producer of iron ore. The town was home to several large iron ore mines, which provided employment for many of the town’s residents. The town also had a number of small businesses, including restaurants, bars, and retail stores.
In the late 20th century, the mining industry in the area began to decline. As a result, the population of Comstock began to decline as well. Today, the town has a population of approximately 500 people. Despite the decline in the mining industry, Comstock remains a vibrant community, with a number of small businesses and a strong sense of community.
Common Questions
What is Per Capita Income in Comstock?
Per Capita income in Comstock is $35,797.
What is the Median Family Income in Comstock?
Median Family Income in Comstock is $113,125.
What is the Median Household income in Comstock?
Median Household Income in Comstock is $91,250.
What is Inequality or Gini Index in Comstock?
Inequality or Gini Index in Comstock is 0.35.
What is the Total Population of Comstock?
Total Population of Comstock is 75.
What is the Total Male Population of Comstock?
Total Male Population of Comstock is 40.
What is the Total Female Population of Comstock?
Total Female Population of Comstock is 35.
What is the Ratio of Males per 100 Females in Comstock?
There are 114.29 Males per 100 Females in Comstock.
What is the Ratio of Females per 100 Males in Comstock?
There are 87.50 Females per 100 Males in Comstock.
What is the Median Population Age in Comstock?
Median Population Age in Comstock is 59.5 Years.
What is the Average Family Size in Comstock
Average Family Size in Comstock is 2.6 People.
What is the Average Household Size in Comstock
Average Household Size in Comstock is 2.2 People.
How Large is the Labor Force in Comstock?
There are 43 People in the Labor Forcein in Comstock.
What is the Percentage of People in the Labor Force in Comstock?
60.6% of People are in the Labor Force in Comstock.
What is the Unemployment Rate in Comstock?
Unemployment Rate in Comstock is 9.3%.