Stewartville, MN Map & Demographics
Stewartville Map
Stewartville Overview
$38,893
PER CAPITA INCOME
$108,750
AVG FAMILY INCOME
$92,961
AVG HOUSEHOLD INCOME
31.4%
WAGE / INCOME GAP [ % ]
68.6¢/ $1
WAGE / INCOME GAP [ $ ]
0.39
INEQUALITY / GINI INDEX
6,684
TOTAL POPULATION
2,946
MALE POPULATION
3,738
FEMALE POPULATION
78.81
MALES / 100 FEMALES
126.88
FEMALES / 100 MALES
33.9
MEDIAN AGE
3.1
AVG FAMILY SIZE
2.6
AVG HOUSEHOLD SIZE
3,531
LABOR FORCE [ PEOPLE ]
72.3%
PERCENT IN LABOR FORCE
1.2%
UNEMPLOYMENT RATE
Stewartville Zip Codes
Stewartville Area Codes
Income in Stewartville
Income Overview in Stewartville
Per Capita Income in Stewartville is $38,893, while median incomes of families and households are $108,750 and $92,961 respectively.
| Characteristic | Number | Measure |
| Per Capita Income | 6,684 | $38,893 |
| Median Family Income | 1,646 | $108,750 |
| Mean Family Income | 1,646 | $115,293 |
| Median Household Income | 2,515 | $92,961 |
| Mean Household Income | 2,515 | $101,522 |
| Income Deficit | 1,646 | $0 |
| Wage / Income Gap (%) | 6,684 | 31.35% |
| Wage / Income Gap ($) | 6,684 | 68.65¢ per $1 |
| Gini / Inequality Index | 6,684 | 0.39 |
Earnings by Sex in Stewartville
Average Earnings in Stewartville are $47,793, $59,871 for men and $41,101 for women, a difference of 31.4%.
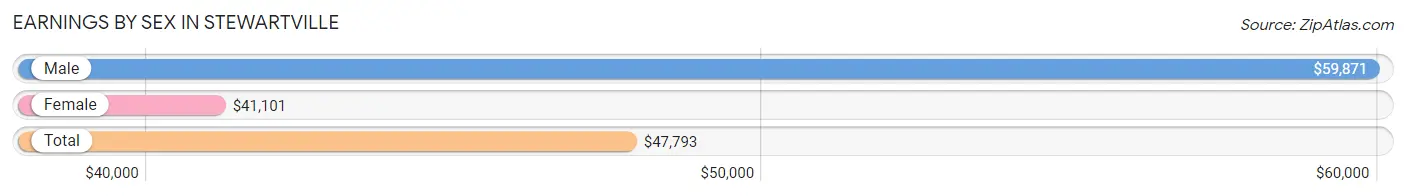
| Sex | Number | Average Earnings |
| Male | 1,711 (45.4%) | $59,871 |
| Female | 2,056 (54.6%) | $41,101 |
| Total | 3,767 (100.0%) | $47,793 |
Earnings by Sex by Income Bracket in Stewartville
The most common earnings brackets in Stewartville are $100,000+ for men (345 | 20.2%) and $55,000 to $64,999 for women (272 | 13.2%).
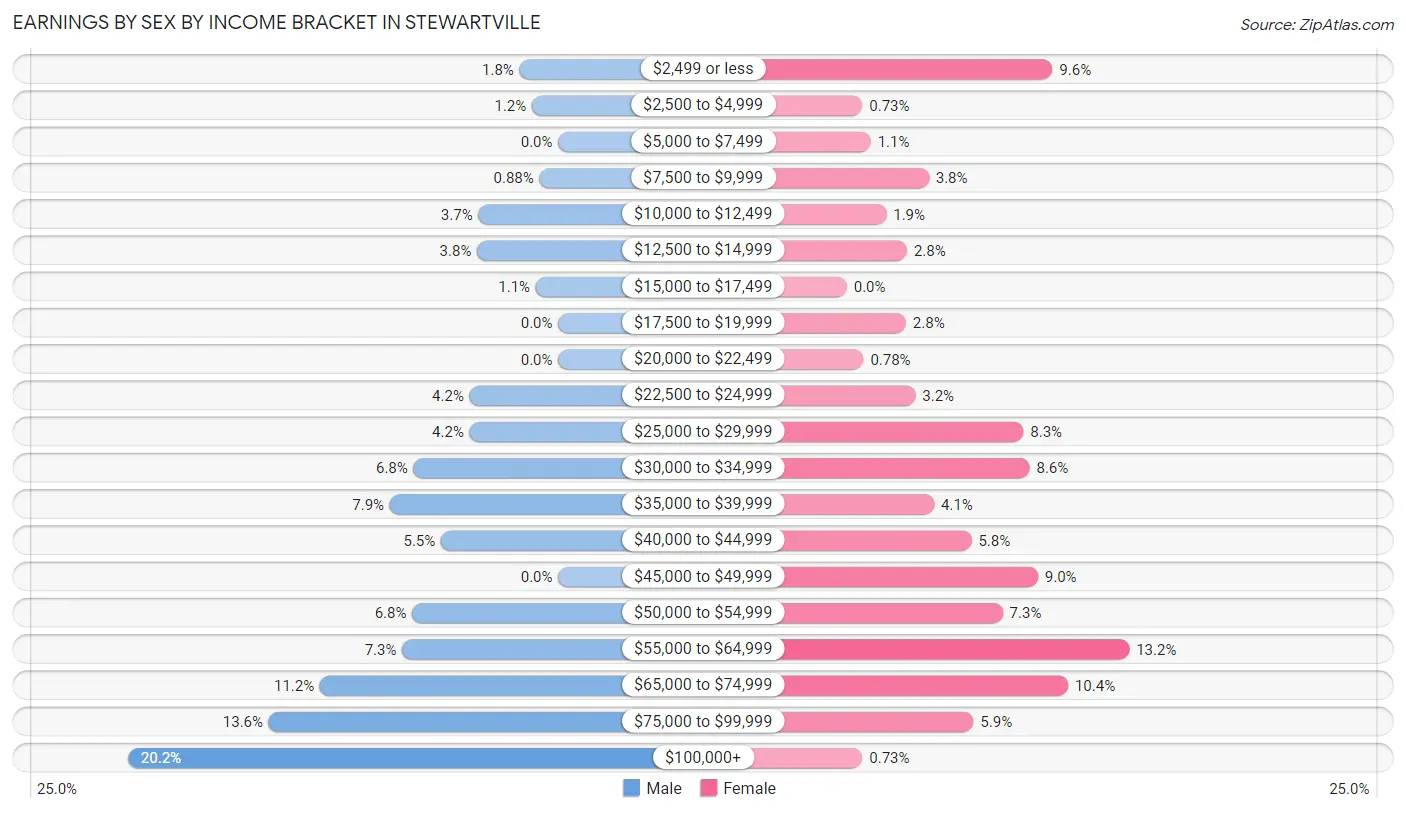
| Income | Male | Female |
| $2,499 or less | 31 (1.8%) | 198 (9.6%) |
| $2,500 to $4,999 | 21 (1.2%) | 15 (0.7%) |
| $5,000 to $7,499 | 0 (0.0%) | 23 (1.1%) |
| $7,500 to $9,999 | 15 (0.9%) | 79 (3.8%) |
| $10,000 to $12,499 | 64 (3.7%) | 38 (1.8%) |
| $12,500 to $14,999 | 65 (3.8%) | 58 (2.8%) |
| $15,000 to $17,499 | 18 (1.1%) | 0 (0.0%) |
| $17,500 to $19,999 | 0 (0.0%) | 57 (2.8%) |
| $20,000 to $22,499 | 0 (0.0%) | 16 (0.8%) |
| $22,500 to $24,999 | 71 (4.2%) | 66 (3.2%) |
| $25,000 to $29,999 | 71 (4.2%) | 170 (8.3%) |
| $30,000 to $34,999 | 116 (6.8%) | 176 (8.6%) |
| $35,000 to $39,999 | 135 (7.9%) | 84 (4.1%) |
| $40,000 to $44,999 | 94 (5.5%) | 120 (5.8%) |
| $45,000 to $49,999 | 0 (0.0%) | 184 (8.9%) |
| $50,000 to $54,999 | 117 (6.8%) | 150 (7.3%) |
| $55,000 to $64,999 | 125 (7.3%) | 272 (13.2%) |
| $65,000 to $74,999 | 191 (11.2%) | 213 (10.4%) |
| $75,000 to $99,999 | 232 (13.6%) | 122 (5.9%) |
| $100,000+ | 345 (20.2%) | 15 (0.7%) |
| Total | 1,711 (100.0%) | 2,056 (100.0%) |
Earnings by Sex by Educational Attainment in Stewartville
Average earnings in Stewartville are $63,529 for men and $49,261 for women, a difference of 22.5%. Men with an educational attainment of bachelor's degree enjoy the highest average annual earnings of $87,059, while those with less than high school education earn the least with $36,467. Women with an educational attainment of graduate degree earn the most with the average annual earnings of $68,182, while those with high school diploma education have the smallest earnings of $34,570.
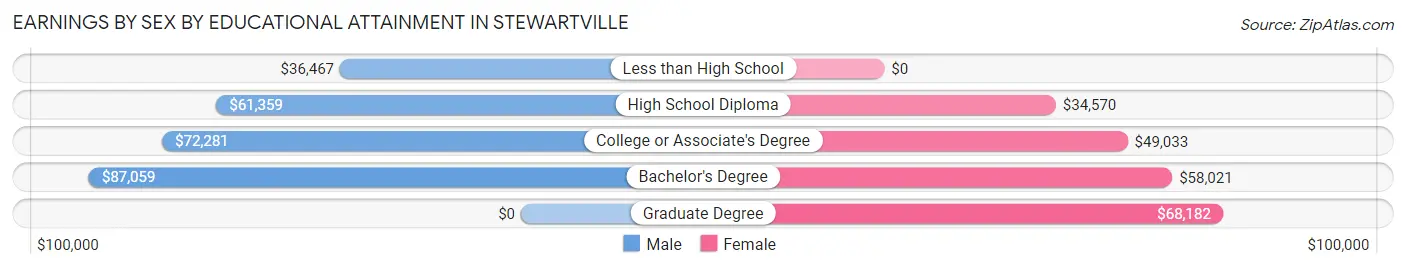
| Educational Attainment | Male Income | Female Income |
| Less than High School | $36,467 | $0 |
| High School Diploma | $61,359 | $34,570 |
| College or Associate's Degree | $72,281 | $49,033 |
| Bachelor's Degree | $87,059 | $58,021 |
| Graduate Degree | - | - |
| Total | $63,529 | $49,261 |
Family Income in Stewartville
Family Income Brackets in Stewartville
According to the Stewartville family income data, there are 565 families falling into the $100,000 to $149,999 income range, which is the most common income bracket and makes up 34.3% of all families.
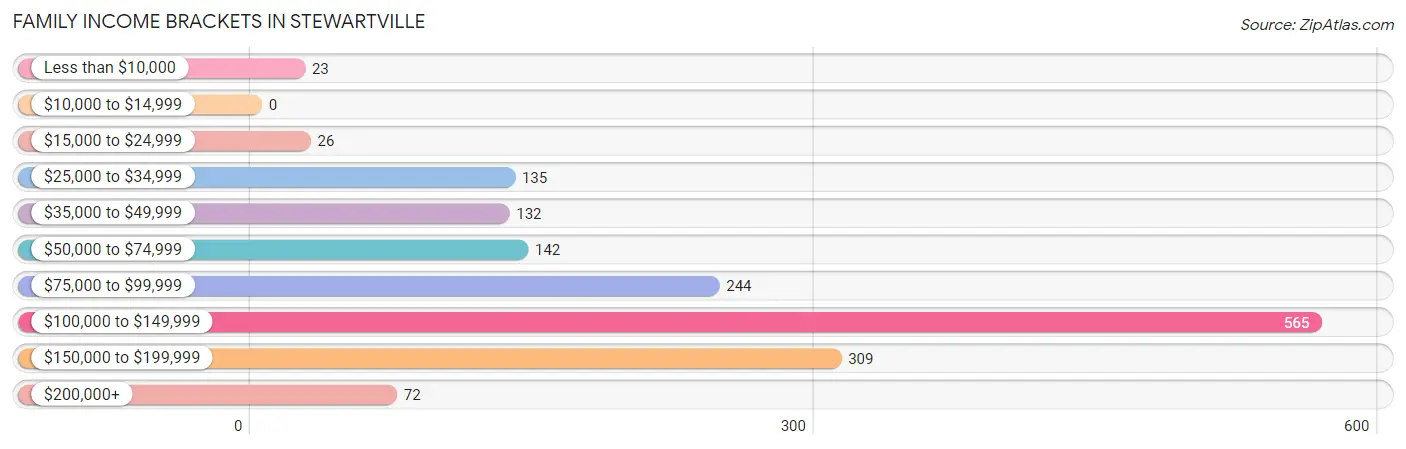
| Income Bracket | # Families | % Families |
| Less than $10,000 | 23 | 1.4% |
| $10,000 to $14,999 | 0 | 0.0% |
| $15,000 to $24,999 | 26 | 1.6% |
| $25,000 to $34,999 | 135 | 8.2% |
| $35,000 to $49,999 | 132 | 8.0% |
| $50,000 to $74,999 | 142 | 8.6% |
| $75,000 to $99,999 | 244 | 14.8% |
| $100,000 to $149,999 | 565 | 34.3% |
| $150,000 to $199,999 | 309 | 18.8% |
| $200,000+ | 72 | 4.4% |
Family Income by Famaliy Size in Stewartville
4-person families (503 | 30.6%) account for the highest median family income in Stewartville with $128,750 per family, while 2-person families (696 | 42.3%) have the highest median income of $49,620 per family member.
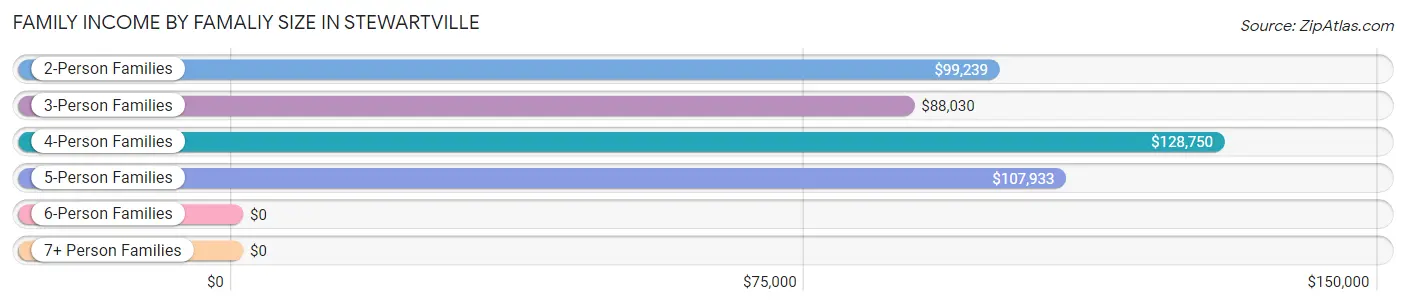
| Income Bracket | # Families | Median Income |
| 2-Person Families | 696 (42.3%) | $99,239 |
| 3-Person Families | 374 (22.7%) | $88,030 |
| 4-Person Families | 503 (30.6%) | $128,750 |
| 5-Person Families | 73 (4.4%) | $107,933 |
| 6-Person Families | 0 (0.0%) | $0 |
| 7+ Person Families | 0 (0.0%) | $0 |
| Total | 1,646 (100.0%) | $108,750 |
Family Income by Number of Earners in Stewartville
The median family income in Stewartville is $108,750, with families comprising 3+ earners (121) having the highest median family income of $136,023, while families with no earners (157) have the lowest median family income of $43,359, accounting for 7.3% and 9.5% of families, respectively.
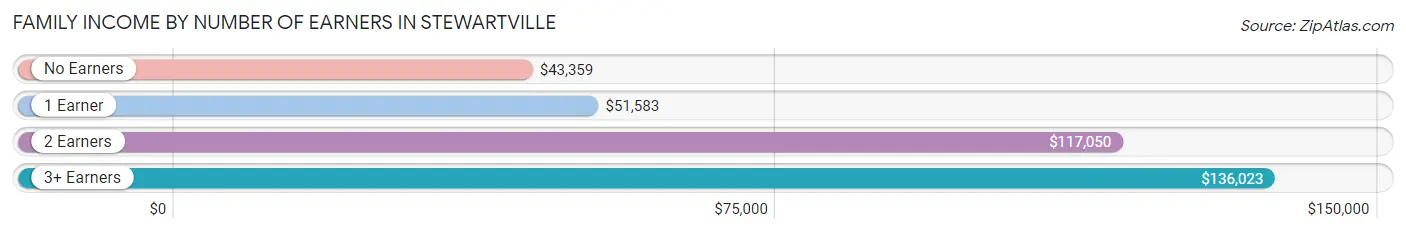
| Number of Earners | # Families | Median Income |
| No Earners | 157 (9.5%) | $43,359 |
| 1 Earner | 349 (21.2%) | $51,583 |
| 2 Earners | 1,019 (61.9%) | $117,050 |
| 3+ Earners | 121 (7.3%) | $136,023 |
| Total | 1,646 (100.0%) | $108,750 |
Household Income in Stewartville
Household Income Brackets in Stewartville
With 621 households falling in the category, the $100,000 to $149,999 income range is the most frequent in Stewartville, accounting for 24.7% of all households. In contrast, only 48 households (1.9%) fall into the $10,000 to $14,999 income bracket, making it the least populous group.
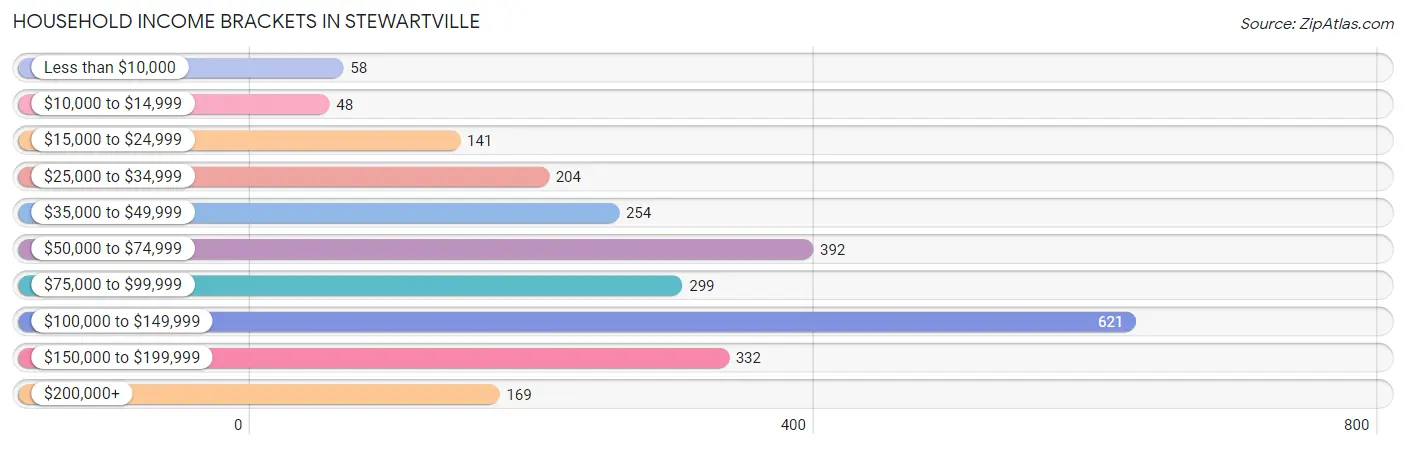
| Income Bracket | # Households | % Households |
| Less than $10,000 | 58 | 2.3% |
| $10,000 to $14,999 | 48 | 1.9% |
| $15,000 to $24,999 | 141 | 5.6% |
| $25,000 to $34,999 | 204 | 8.1% |
| $35,000 to $49,999 | 254 | 10.1% |
| $50,000 to $74,999 | 392 | 15.6% |
| $75,000 to $99,999 | 299 | 11.9% |
| $100,000 to $149,999 | 621 | 24.7% |
| $150,000 to $199,999 | 332 | 13.2% |
| $200,000+ | 169 | 6.7% |
Household Income by Householder Age in Stewartville
The median household income in Stewartville is $92,961, with the highest median household income of $116,183 found in the 25 to 44 years age bracket for the primary householder. A total of 935 households (37.2%) fall into this category. Meanwhile, the 65+ years age bracket for the primary householder has the lowest median household income of $43,203, with 561 households (22.3%) in this group.
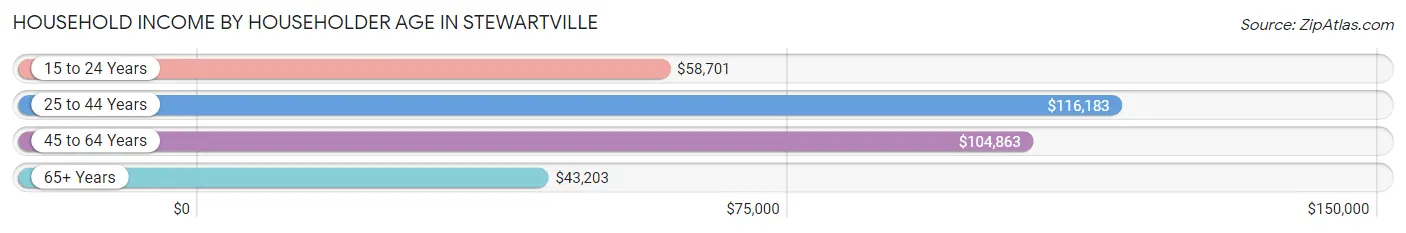
| Income Bracket | # Households | Median Income |
| 15 to 24 Years | 125 (5.0%) | $58,701 |
| 25 to 44 Years | 935 (37.2%) | $116,183 |
| 45 to 64 Years | 894 (35.5%) | $104,863 |
| 65+ Years | 561 (22.3%) | $43,203 |
| Total | 2,515 (100.0%) | $92,961 |
Poverty in Stewartville
Income Below Poverty by Sex and Age in Stewartville
With 1.8% poverty level for males and 9.5% for females among the residents of Stewartville, 18 to 24 year old males and 15 year old females are the most vulnerable to poverty, with 27 males (11.7%) and 68 females (100.0%) in their respective age groups living below the poverty level.
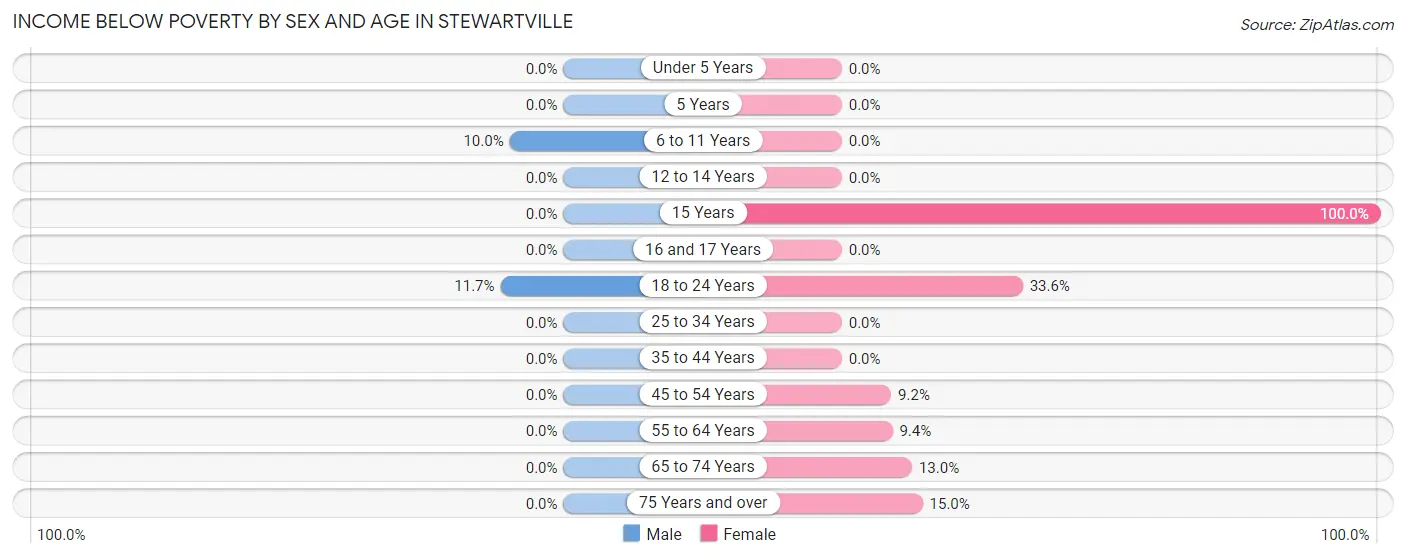
| Age Bracket | Male | Female |
| Under 5 Years | 0 (0.0%) | 0 (0.0%) |
| 5 Years | 0 (0.0%) | 0 (0.0%) |
| 6 to 11 Years | 23 (10.0%) | 0 (0.0%) |
| 12 to 14 Years | 0 (0.0%) | 0 (0.0%) |
| 15 Years | 0 (0.0%) | 68 (100.0%) |
| 16 and 17 Years | 0 (0.0%) | 0 (0.0%) |
| 18 to 24 Years | 27 (11.7%) | 134 (33.6%) |
| 25 to 34 Years | 0 (0.0%) | 0 (0.0%) |
| 35 to 44 Years | 0 (0.0%) | 0 (0.0%) |
| 45 to 54 Years | 0 (0.0%) | 36 (9.2%) |
| 55 to 64 Years | 0 (0.0%) | 38 (9.4%) |
| 65 to 74 Years | 0 (0.0%) | 31 (13.0%) |
| 75 Years and over | 0 (0.0%) | 36 (15.0%) |
| Total | 50 (1.8%) | 343 (9.5%) |
Income Above Poverty by Sex and Age in Stewartville
According to the poverty statistics in Stewartville, males aged under 5 years and females aged under 5 years are the age groups that are most secure financially, with 100.0% of males and 100.0% of females in these age groups living above the poverty line.
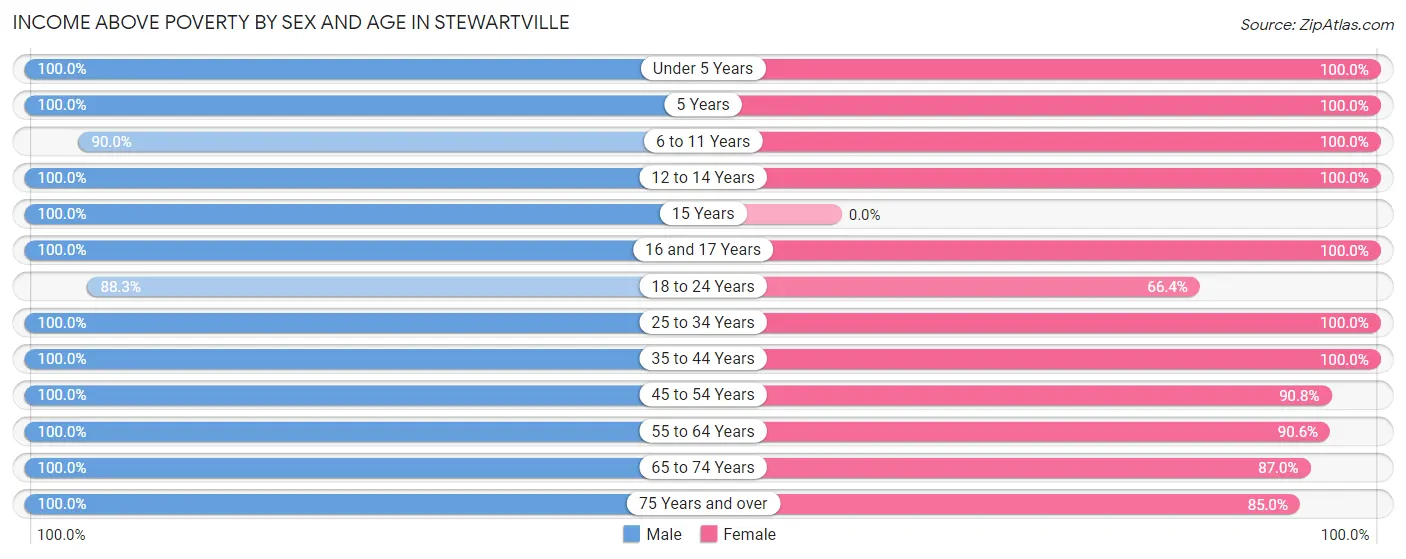
| Age Bracket | Male | Female |
| Under 5 Years | 201 (100.0%) | 273 (100.0%) |
| 5 Years | 23 (100.0%) | 61 (100.0%) |
| 6 to 11 Years | 207 (90.0%) | 379 (100.0%) |
| 12 to 14 Years | 243 (100.0%) | 105 (100.0%) |
| 15 Years | 53 (100.0%) | 0 (0.0%) |
| 16 and 17 Years | 71 (100.0%) | 94 (100.0%) |
| 18 to 24 Years | 204 (88.3%) | 265 (66.4%) |
| 25 to 34 Years | 375 (100.0%) | 426 (100.0%) |
| 35 to 44 Years | 443 (100.0%) | 515 (100.0%) |
| 45 to 54 Years | 403 (100.0%) | 357 (90.8%) |
| 55 to 64 Years | 272 (100.0%) | 366 (90.6%) |
| 65 to 74 Years | 130 (100.0%) | 207 (87.0%) |
| 75 Years and over | 166 (100.0%) | 204 (85.0%) |
| Total | 2,791 (98.2%) | 3,252 (90.5%) |
Income Below Poverty Among Married-Couple Families in Stewartville
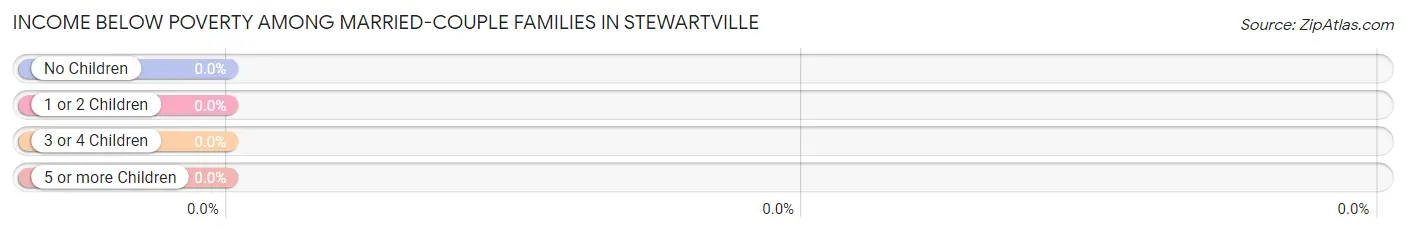
| Children | Above Poverty | Below Poverty |
| No Children | 592 (100.0%) | 0 (0.0%) |
| 1 or 2 Children | 658 (100.0%) | 0 (0.0%) |
| 3 or 4 Children | 73 (100.0%) | 0 (0.0%) |
| 5 or more Children | 0 (0.0%) | 0 (0.0%) |
| Total | 1,323 (100.0%) | 0 (0.0%) |
Income Below Poverty Among Single-Parent Households in Stewartville
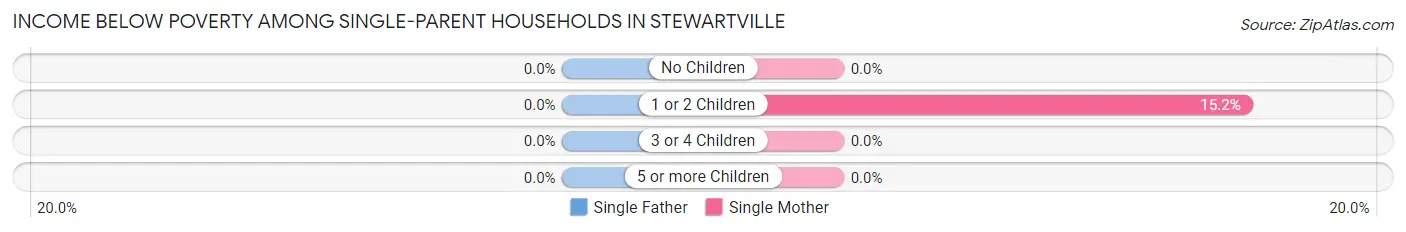
| Children | Single Father | Single Mother |
| No Children | 0 (0.0%) | 0 (0.0%) |
| 1 or 2 Children | 0 (0.0%) | 23 (15.2%) |
| 3 or 4 Children | 0 (0.0%) | 0 (0.0%) |
| 5 or more Children | 0 (0.0%) | 0 (0.0%) |
| Total | 0 (0.0%) | 23 (10.6%) |
Income Below Poverty Among Married-Couple vs Single-Parent Households in Stewartville
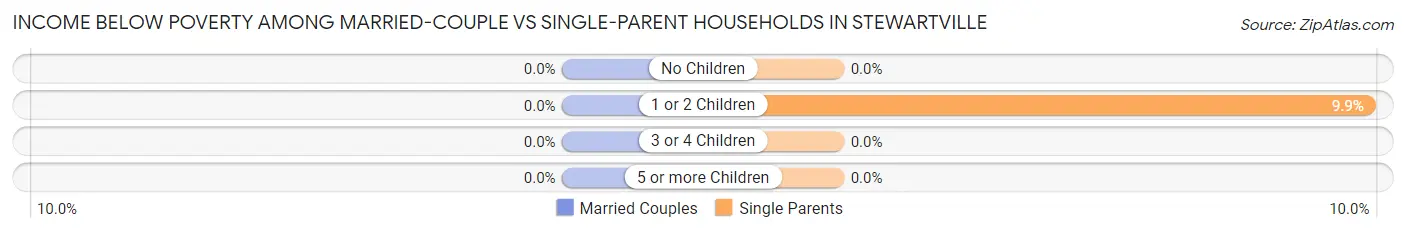
| Children | Married-Couple Families | Single-Parent Households |
| No Children | 0 (0.0%) | 0 (0.0%) |
| 1 or 2 Children | 0 (0.0%) | 23 (9.9%) |
| 3 or 4 Children | 0 (0.0%) | 0 (0.0%) |
| 5 or more Children | 0 (0.0%) | 0 (0.0%) |
| Total | 0 (0.0%) | 23 (7.1%) |
Race in Stewartville
The most populous races in Stewartville are White / Caucasian (6,249 | 93.5%), Two or more Races (324 | 4.9%), and Hispanic or Latino (232 | 3.5%).
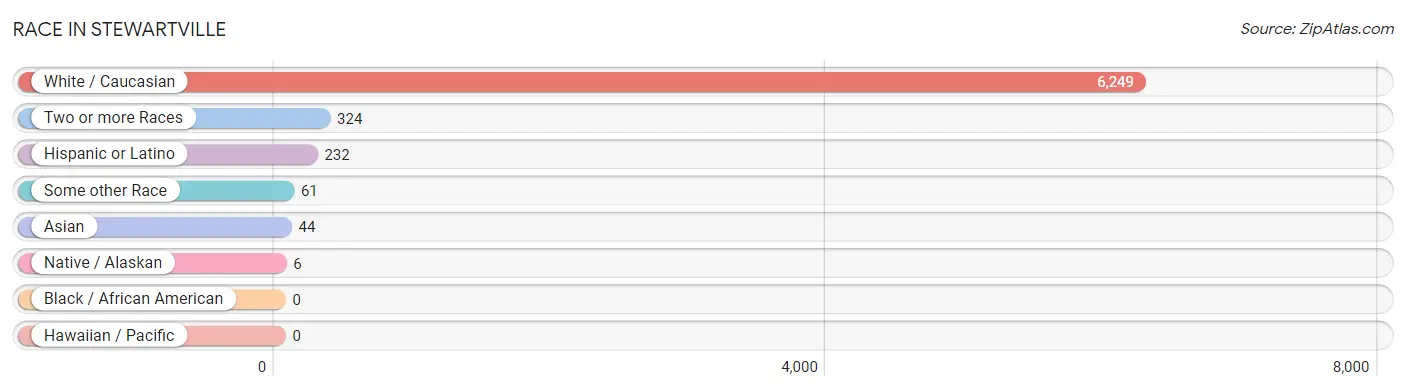
| Race | # Population | % Population |
| Asian | 44 | 0.7% |
| Black / African American | 0 | 0.0% |
| Hawaiian / Pacific | 0 | 0.0% |
| Hispanic or Latino | 232 | 3.5% |
| Native / Alaskan | 6 | 0.1% |
| White / Caucasian | 6,249 | 93.5% |
| Two or more Races | 324 | 4.9% |
| Some other Race | 61 | 0.9% |
| Total | 6,684 | 100.0% |
Ancestry in Stewartville
The most populous ancestries reported in Stewartville are German (2,978 | 44.6%), Norwegian (1,367 | 20.4%), Irish (698 | 10.4%), Swedish (530 | 7.9%), and English (273 | 4.1%), together accounting for 87.5% of all Stewartville residents.
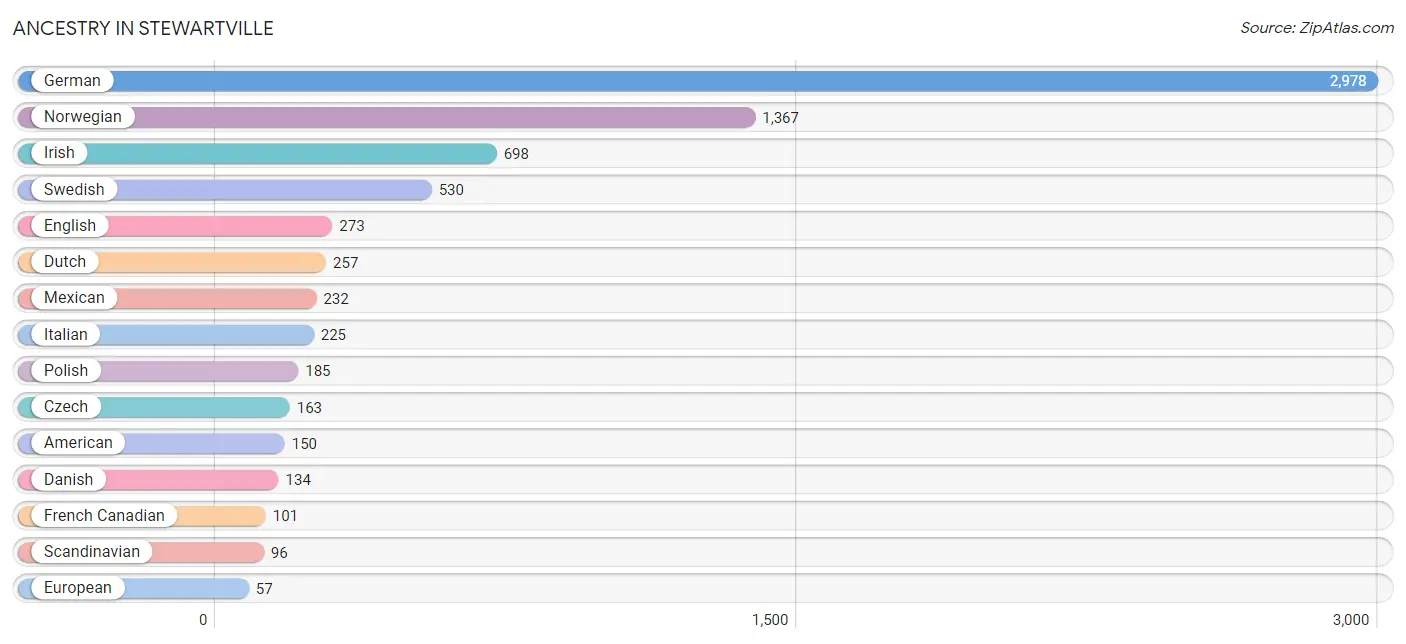
| Ancestry | # Population | % Population |
| American | 150 | 2.2% |
| Austrian | 15 | 0.2% |
| Brazilian | 10 | 0.2% |
| British | 54 | 0.8% |
| Canadian | 14 | 0.2% |
| Czech | 163 | 2.4% |
| Danish | 134 | 2.0% |
| Dutch | 257 | 3.8% |
| English | 273 | 4.1% |
| European | 57 | 0.9% |
| Finnish | 10 | 0.2% |
| French | 24 | 0.4% |
| French Canadian | 101 | 1.5% |
| German | 2,978 | 44.6% |
| Indian (Asian) | 35 | 0.5% |
| Irish | 698 | 10.4% |
| Italian | 225 | 3.4% |
| Japanese | 9 | 0.1% |
| Luxembourger | 45 | 0.7% |
| Mexican | 232 | 3.5% |
| Norwegian | 1,367 | 20.4% |
| Polish | 185 | 2.8% |
| Scandinavian | 96 | 1.4% |
| Scotch-Irish | 25 | 0.4% |
| Scottish | 57 | 0.9% |
| Sioux | 5 | 0.1% |
| Slovene | 29 | 0.4% |
| Swedish | 530 | 7.9% |
| Ukrainian | 36 | 0.5% |
| Welsh | 37 | 0.5% | View All 30 Rows |
Immigrants in Stewartville
The most numerous immigrant groups reported in Stewartville came from Latin America (49 | 0.7%), Asia (44 | 0.7%), Central America (39 | 0.6%), Mexico (39 | 0.6%), and China (35 | 0.5%), together accounting for 3.1% of all Stewartville residents.
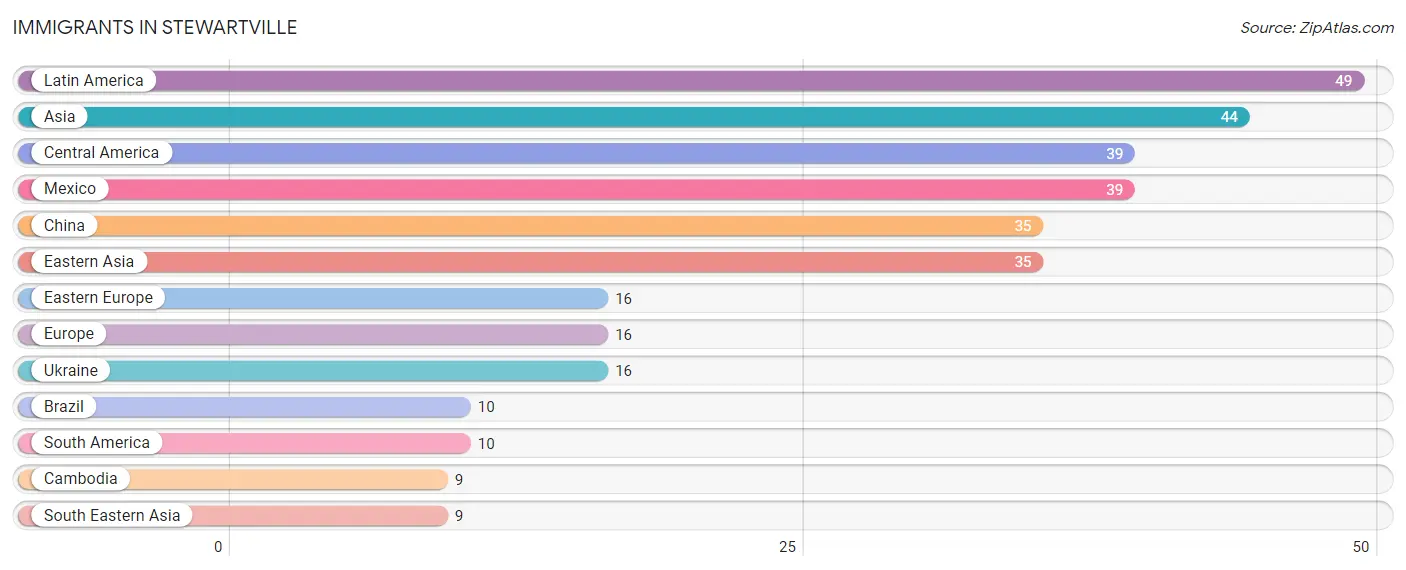
| Immigration Origin | # Population | % Population |
| Asia | 44 | 0.7% |
| Brazil | 10 | 0.2% |
| Cambodia | 9 | 0.1% |
| Central America | 39 | 0.6% |
| China | 35 | 0.5% |
| Eastern Asia | 35 | 0.5% |
| Eastern Europe | 16 | 0.2% |
| Europe | 16 | 0.2% |
| Latin America | 49 | 0.7% |
| Mexico | 39 | 0.6% |
| South America | 10 | 0.2% |
| South Eastern Asia | 9 | 0.1% |
| Ukraine | 16 | 0.2% | View All 13 Rows |
Sex and Age in Stewartville
Sex and Age in Stewartville
The most populous age groups in Stewartville are 10 to 14 Years (414 | 14.1%) for men and 35 to 39 Years (374 | 10.0%) for women.
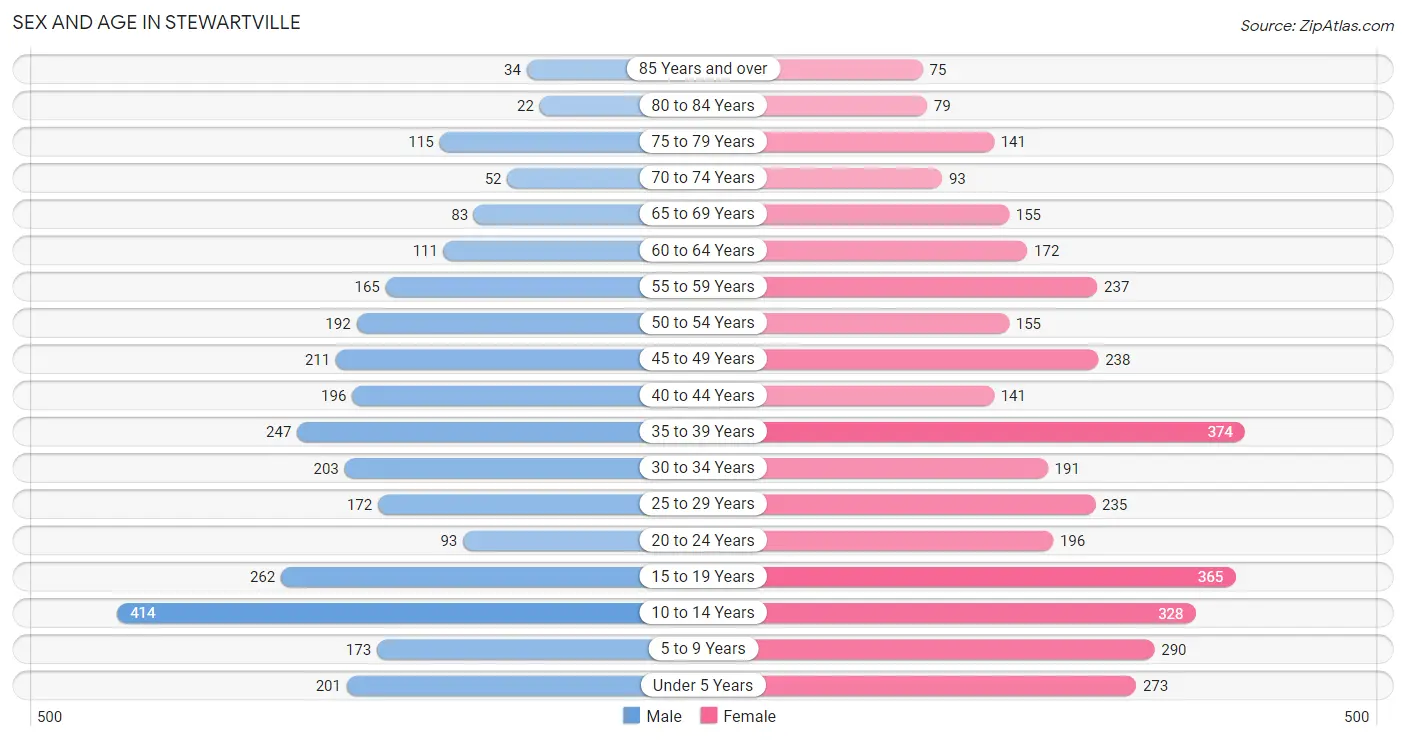
| Age Bracket | Male | Female |
| Under 5 Years | 201 (6.8%) | 273 (7.3%) |
| 5 to 9 Years | 173 (5.9%) | 290 (7.8%) |
| 10 to 14 Years | 414 (14.1%) | 328 (8.8%) |
| 15 to 19 Years | 262 (8.9%) | 365 (9.8%) |
| 20 to 24 Years | 93 (3.2%) | 196 (5.2%) |
| 25 to 29 Years | 172 (5.8%) | 235 (6.3%) |
| 30 to 34 Years | 203 (6.9%) | 191 (5.1%) |
| 35 to 39 Years | 247 (8.4%) | 374 (10.0%) |
| 40 to 44 Years | 196 (6.7%) | 141 (3.8%) |
| 45 to 49 Years | 211 (7.2%) | 238 (6.4%) |
| 50 to 54 Years | 192 (6.5%) | 155 (4.2%) |
| 55 to 59 Years | 165 (5.6%) | 237 (6.3%) |
| 60 to 64 Years | 111 (3.8%) | 172 (4.6%) |
| 65 to 69 Years | 83 (2.8%) | 155 (4.2%) |
| 70 to 74 Years | 52 (1.8%) | 93 (2.5%) |
| 75 to 79 Years | 115 (3.9%) | 141 (3.8%) |
| 80 to 84 Years | 22 (0.7%) | 79 (2.1%) |
| 85 Years and over | 34 (1.1%) | 75 (2.0%) |
| Total | 2,946 (100.0%) | 3,738 (100.0%) |
Families and Households in Stewartville
Median Family Size in Stewartville
The median family size in Stewartville is 3.06 persons per family, with married-couple families (1,323 | 80.4%) accounting for the largest median family size of 3.17 persons per family. On the other hand, single male/father families (107 | 6.5%) represent the smallest median family size with 2.58 persons per family.
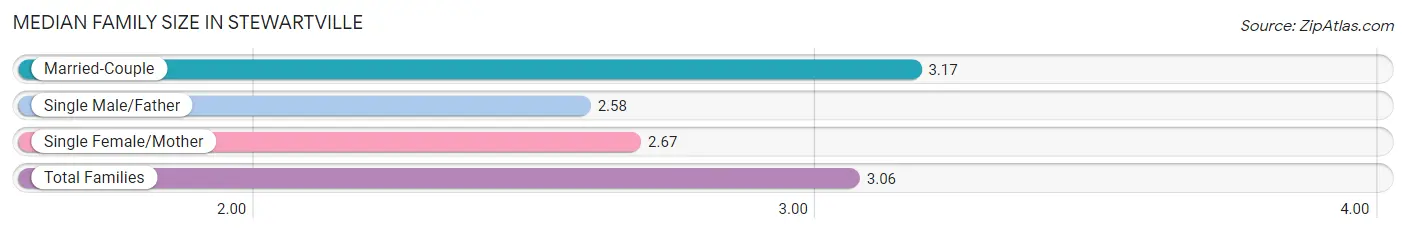
| Family Type | # Families | Family Size |
| Married-Couple | 1,323 (80.4%) | 3.17 |
| Single Male/Father | 107 (6.5%) | 2.58 |
| Single Female/Mother | 216 (13.1%) | 2.67 |
| Total Families | 1,646 (100.0%) | 3.06 |
Median Household Size in Stewartville
The median household size in Stewartville is 2.62 persons per household, with married-couple households (1,323 | 52.6%) accounting for the largest median household size of 3.18 persons per household. non-family households (869 | 34.5%) represent the smallest median household size with 1.62 persons per household.
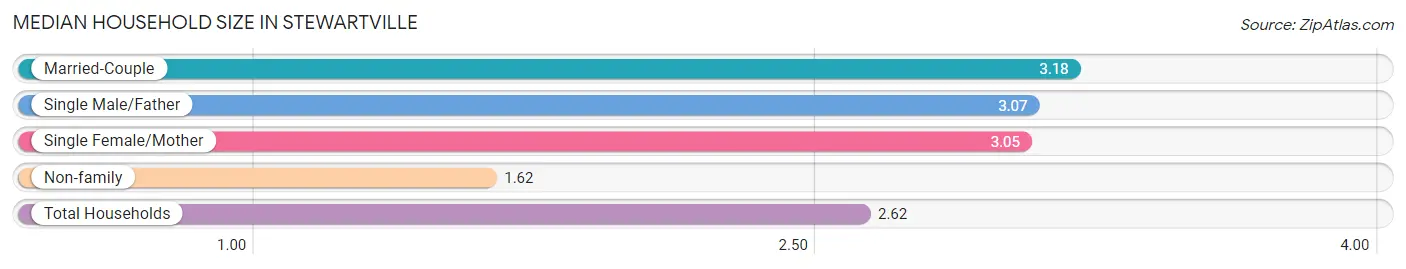
| Household Type | # Households | Household Size |
| Married-Couple | 1,323 (52.6%) | 3.18 |
| Single Male/Father | 107 (4.3%) | 3.07 |
| Single Female/Mother | 216 (8.6%) | 3.05 |
| Non-family | 869 (34.5%) | 1.62 |
| Total Households | 2,515 (100.0%) | 2.62 |
Household Size by Marriage Status in Stewartville
Out of a total of 2,515 households in Stewartville, 1,646 (65.4%) are family households, while 869 (34.5%) are nonfamily households. The most numerous type of family households are 2-person households, comprising 681, and the most common type of nonfamily households are 1-person households, comprising 608.
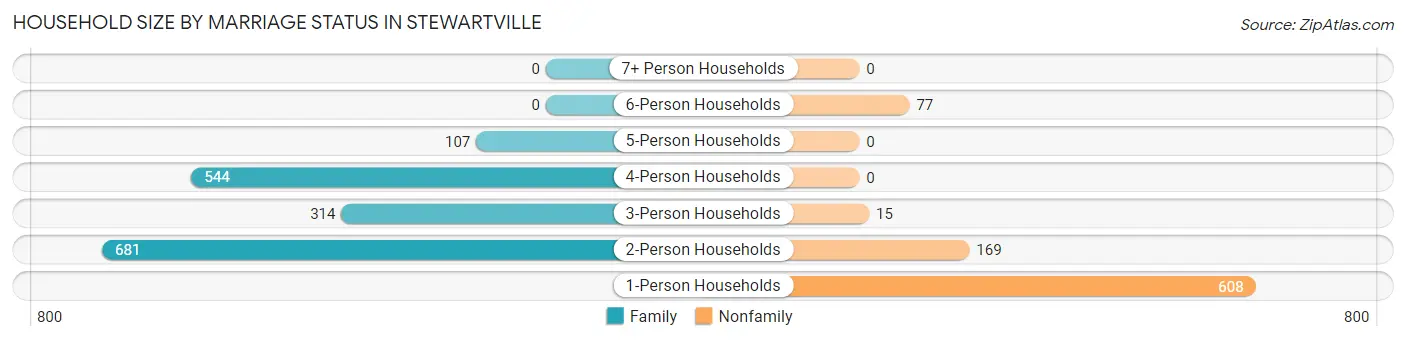
| Household Size | Family Households | Nonfamily Households |
| 1-Person Households | - | 608 (24.2%) |
| 2-Person Households | 681 (27.1%) | 169 (6.7%) |
| 3-Person Households | 314 (12.5%) | 15 (0.6%) |
| 4-Person Households | 544 (21.6%) | 0 (0.0%) |
| 5-Person Households | 107 (4.3%) | 0 (0.0%) |
| 6-Person Households | 0 (0.0%) | 77 (3.1%) |
| 7+ Person Households | 0 (0.0%) | 0 (0.0%) |
| Total | 1,646 (65.4%) | 869 (34.5%) |
Female Fertility in Stewartville
Fertility by Age in Stewartville
Average fertility rate in Stewartville is 133.0 births per 1,000 women. Women in the age bracket of 20 to 34 years have the highest fertility rate with 322.0 births per 1,000 women. Women in the age bracket of 20 to 34 years acount for 83.7% of all women with births.
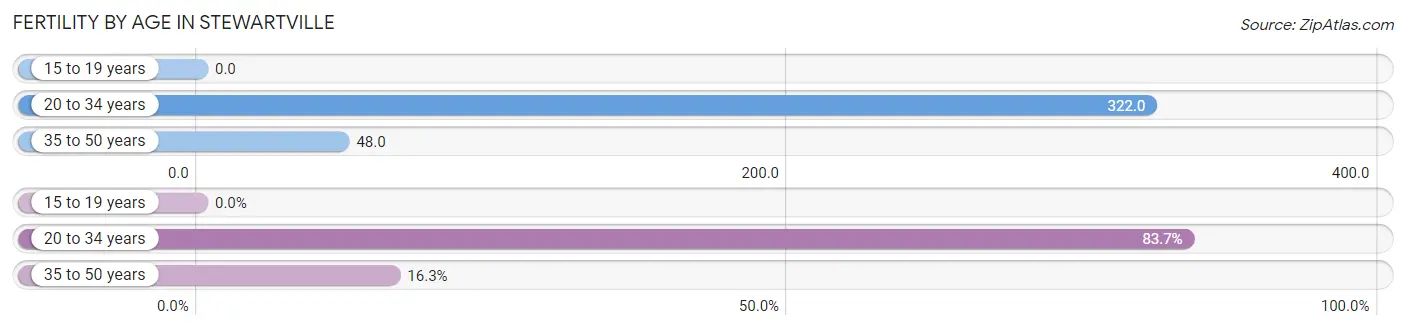
| Age Bracket | Women with Births | Births / 1,000 Women |
| 15 to 19 years | 0 (0.0%) | 0.0 |
| 20 to 34 years | 200 (83.7%) | 322.0 |
| 35 to 50 years | 39 (16.3%) | 48.0 |
| Total | 239 (100.0%) | 133.0 |
Fertility by Age by Marriage Status in Stewartville
53.1% of women with births (239) in Stewartville are married. The highest percentage of unmarried women with births falls into 20 to 34 years age bracket with 56.0% of them unmarried at the time of birth, while the lowest percentage of unmarried women with births belong to 35 to 50 years age bracket with 0.0% of them unmarried.
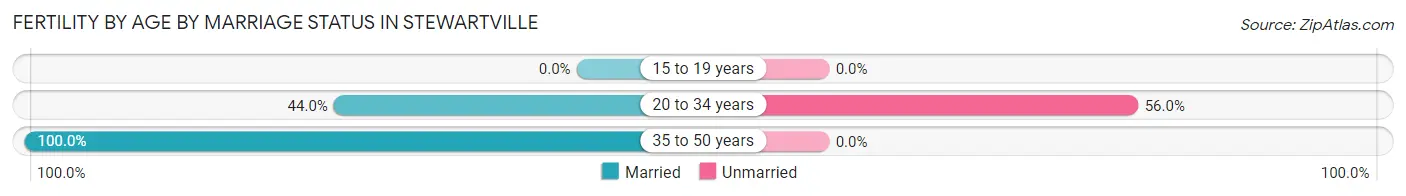
| Age Bracket | Married | Unmarried |
| 15 to 19 years | 0 (0.0%) | 0 (0.0%) |
| 20 to 34 years | 88 (44.0%) | 112 (56.0%) |
| 35 to 50 years | 39 (100.0%) | 0 (0.0%) |
| Total | 127 (53.1%) | 112 (46.9%) |
Fertility by Education in Stewartville
Average fertility rate in Stewartville is 133.0 births per 1,000 women. Women with the education attainment of high school diploma have the highest fertility rate of 297.0 births per 1,000 women, while women with the education attainment of bachelor's degree have the lowest fertility at 64.0 births per 1,000 women. Women with the education attainment of high school diploma represent 31.8% of all women with births.
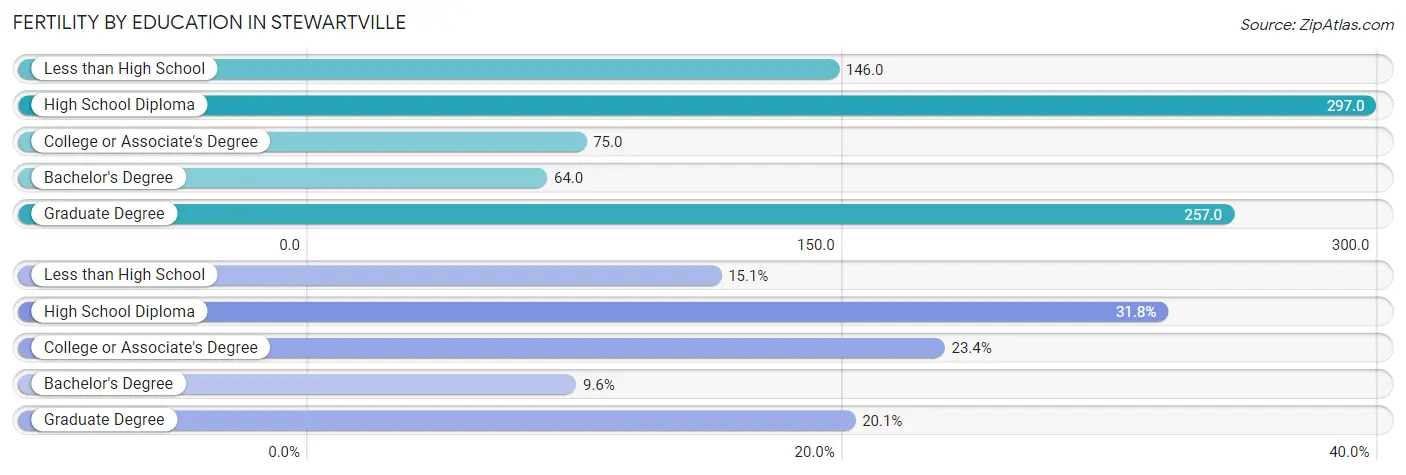
| Educational Attainment | Women with Births | Births / 1,000 Women |
| Less than High School | 36 (15.1%) | 146.0 |
| High School Diploma | 76 (31.8%) | 297.0 |
| College or Associate's Degree | 56 (23.4%) | 75.0 |
| Bachelor's Degree | 23 (9.6%) | 64.0 |
| Graduate Degree | 48 (20.1%) | 257.0 |
| Total | 239 (100.0%) | 133.0 |
Fertility by Education by Marriage Status in Stewartville
46.9% of women with births in Stewartville are unmarried. Women with the educational attainment of college or associate's degree are most likely to be married with 100.0% of them married at childbirth, while women with the educational attainment of less than high school are least likely to be married with 100.0% of them unmarried at childbirth.
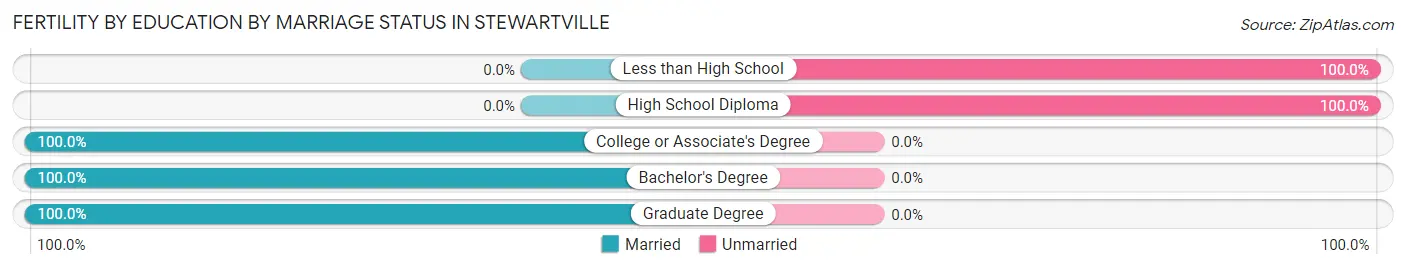
| Educational Attainment | Married | Unmarried |
| Less than High School | 0 (0.0%) | 36 (100.0%) |
| High School Diploma | 0 (0.0%) | 76 (100.0%) |
| College or Associate's Degree | 56 (100.0%) | 0 (0.0%) |
| Bachelor's Degree | 23 (100.0%) | 0 (0.0%) |
| Graduate Degree | 48 (100.0%) | 0 (0.0%) |
| Total | 127 (53.1%) | 112 (46.9%) |
Employment Characteristics in Stewartville
Employment by Class of Employer in Stewartville
Among the 3,375 employed individuals in Stewartville, private company employees (1,748 | 51.8%), not-for-profit organizations (676 | 20.0%), and local government employees (479 | 14.2%) make up the most common classes of employment.
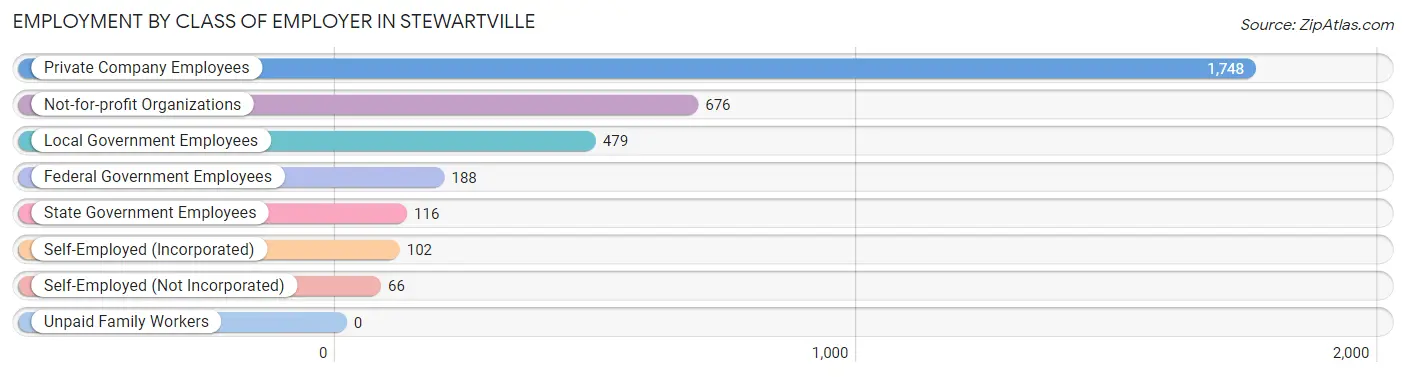
| Employer Class | # Employees | % Employees |
| Private Company Employees | 1,748 | 51.8% |
| Self-Employed (Incorporated) | 102 | 3.0% |
| Self-Employed (Not Incorporated) | 66 | 2.0% |
| Not-for-profit Organizations | 676 | 20.0% |
| Local Government Employees | 479 | 14.2% |
| State Government Employees | 116 | 3.4% |
| Federal Government Employees | 188 | 5.6% |
| Unpaid Family Workers | 0 | 0.0% |
| Total | 3,375 | 100.0% |
Employment Status by Age in Stewartville
According to the labor force statistics for Stewartville, out of the total population over 16 years of age (4,884), 72.3% or 3,531 individuals are in the labor force, with 1.2% or 42 of them unemployed. The age group with the highest labor force participation rate is 20 to 24 years, with 100.0% or 289 individuals in the labor force. Within the labor force, the 65 to 74 years age range has the highest percentage of unemployed individuals, with 15.0% or 16 of them being unemployed.
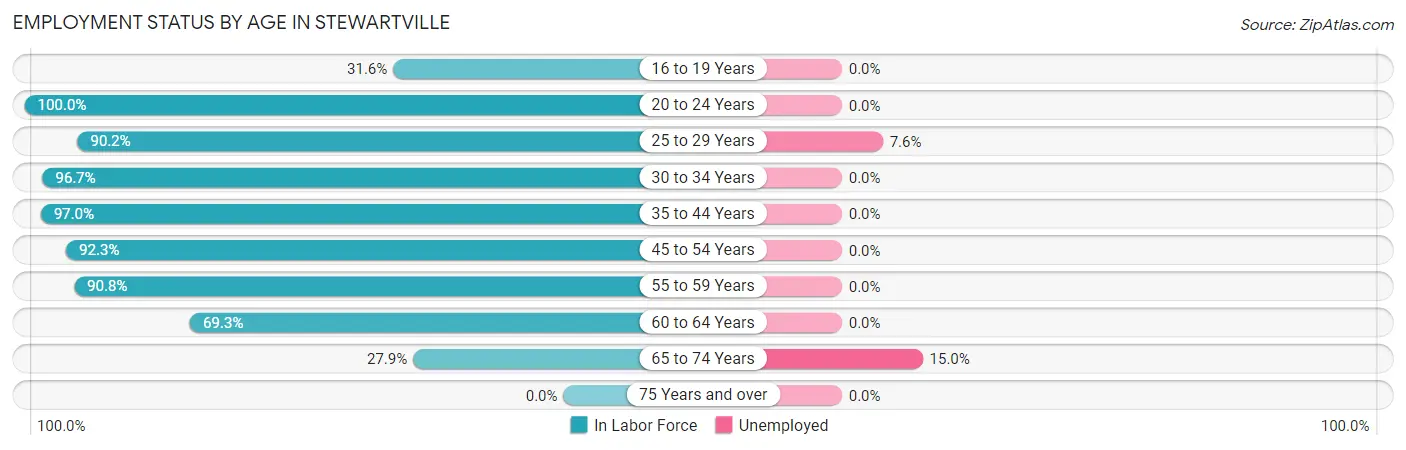
| Age Bracket | In Labor Force | Unemployed |
| 16 to 19 Years | 160 (31.6%) | 0 (0.0%) |
| 20 to 24 Years | 289 (100.0%) | 0 (0.0%) |
| 25 to 29 Years | 367 (90.2%) | 28 (7.6%) |
| 30 to 34 Years | 381 (96.7%) | 0 (0.0%) |
| 35 to 44 Years | 929 (97.0%) | 0 (0.0%) |
| 45 to 54 Years | 735 (92.3%) | 0 (0.0%) |
| 55 to 59 Years | 365 (90.8%) | 0 (0.0%) |
| 60 to 64 Years | 196 (69.3%) | 0 (0.0%) |
| 65 to 74 Years | 107 (27.9%) | 16 (15.0%) |
| 75 Years and over | 0 (0.0%) | 0 (0.0%) |
| Total | 3,531 (72.3%) | 42 (1.2%) |
Employment Status by Educational Attainment in Stewartville
According to labor force statistics for Stewartville, 91.8% of individuals (2,974) out of the total population between 25 and 64 years of age (3,240) are in the labor force, with 0.9% or 27 of them being unemployed. The group with the highest labor force participation rate are those with the educational attainment of high school diploma, with 98.6% or 763 individuals in the labor force. Within the labor force, individuals with college / associate degree education have the highest percentage of unemployment, with 2.5% or 28 of them being unemployed.
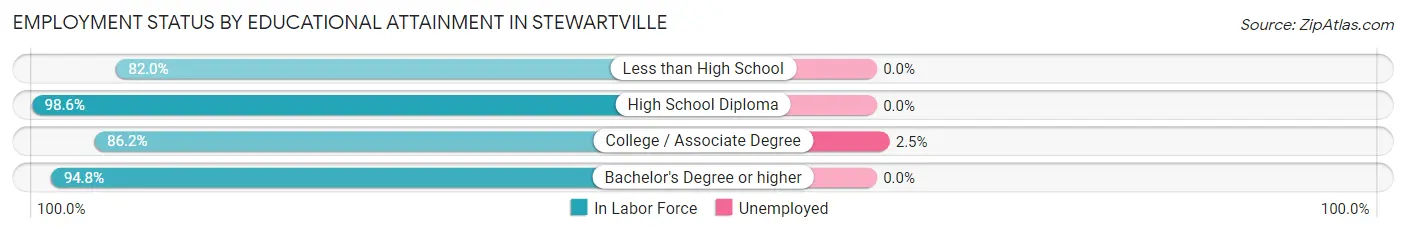
| Educational Attainment | In Labor Force | Unemployed |
| Less than High School | 105 (82.0%) | 0 (0.0%) |
| High School Diploma | 763 (98.6%) | 0 (0.0%) |
| College / Associate Degree | 1,111 (86.2%) | 32 (2.5%) |
| Bachelor's Degree or higher | 994 (94.8%) | 0 (0.0%) |
| Total | 2,974 (91.8%) | 29 (0.9%) |
Employment Occupations by Sex in Stewartville
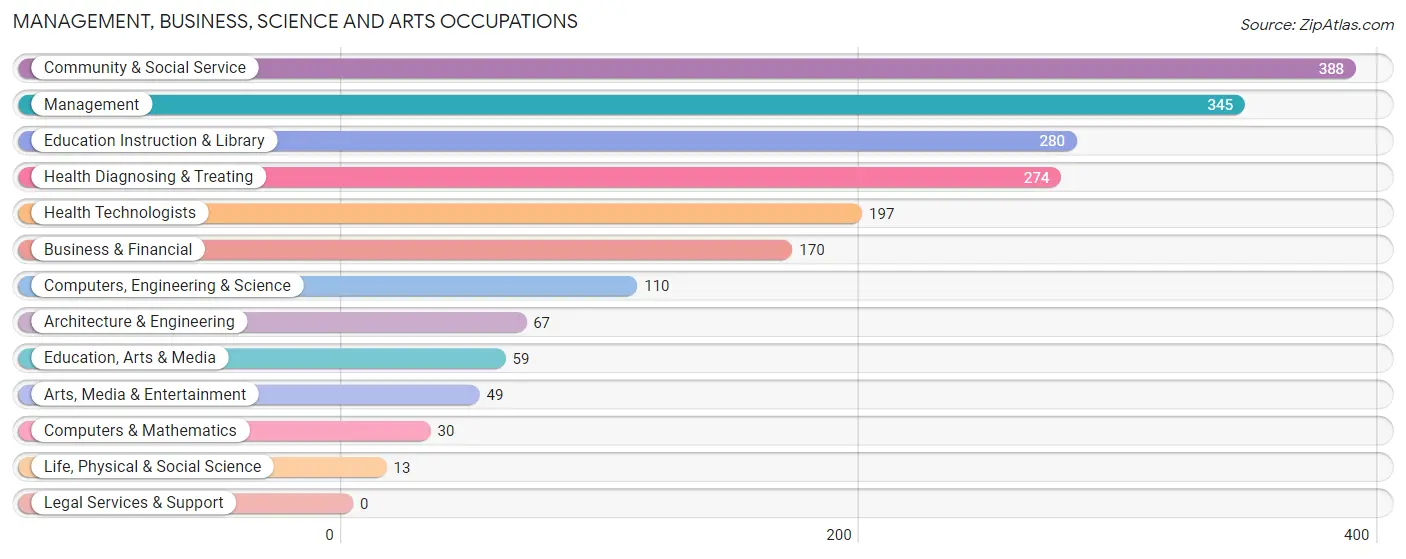
Management, Business, Science and Arts Occupations
The most common Management, Business, Science and Arts occupations in Stewartville are Community & Social Service (388 | 11.1%), Management (345 | 9.9%), Education Instruction & Library (280 | 8.0%), Health Diagnosing & Treating (274 | 7.9%), and Health Technologists (197 | 5.7%).
Management, Business, Science and Arts Occupations by Sex
Within the Management, Business, Science and Arts occupations in Stewartville, the most male-oriented occupations are Architecture & Engineering (100.0%), Life, Physical & Social Science (100.0%), and Arts, Media & Entertainment (100.0%), while the most female-oriented occupations are Health Diagnosing & Treating (90.5%), Health Technologists (86.8%), and Education Instruction & Library (85.0%).
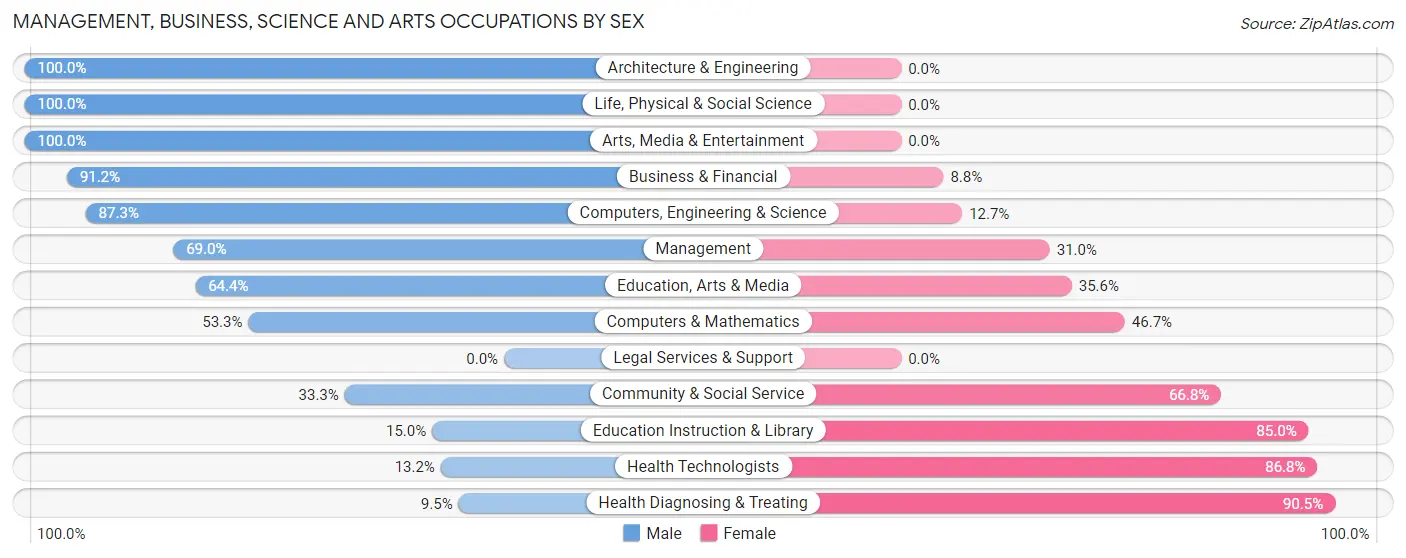
| Occupation | Male | Female |
| Management | 238 (69.0%) | 107 (31.0%) |
| Business & Financial | 155 (91.2%) | 15 (8.8%) |
| Computers, Engineering & Science | 96 (87.3%) | 14 (12.7%) |
| Computers & Mathematics | 16 (53.3%) | 14 (46.7%) |
| Architecture & Engineering | 67 (100.0%) | 0 (0.0%) |
| Life, Physical & Social Science | 13 (100.0%) | 0 (0.0%) |
| Community & Social Service | 129 (33.3%) | 259 (66.7%) |
| Education, Arts & Media | 38 (64.4%) | 21 (35.6%) |
| Legal Services & Support | 0 (0.0%) | 0 (0.0%) |
| Education Instruction & Library | 42 (15.0%) | 238 (85.0%) |
| Arts, Media & Entertainment | 49 (100.0%) | 0 (0.0%) |
| Health Diagnosing & Treating | 26 (9.5%) | 248 (90.5%) |
| Health Technologists | 26 (13.2%) | 171 (86.8%) |
| Total (Category) | 644 (50.0%) | 643 (50.0%) |
| Total (Overall) | 1,635 (46.9%) | 1,850 (53.1%) |
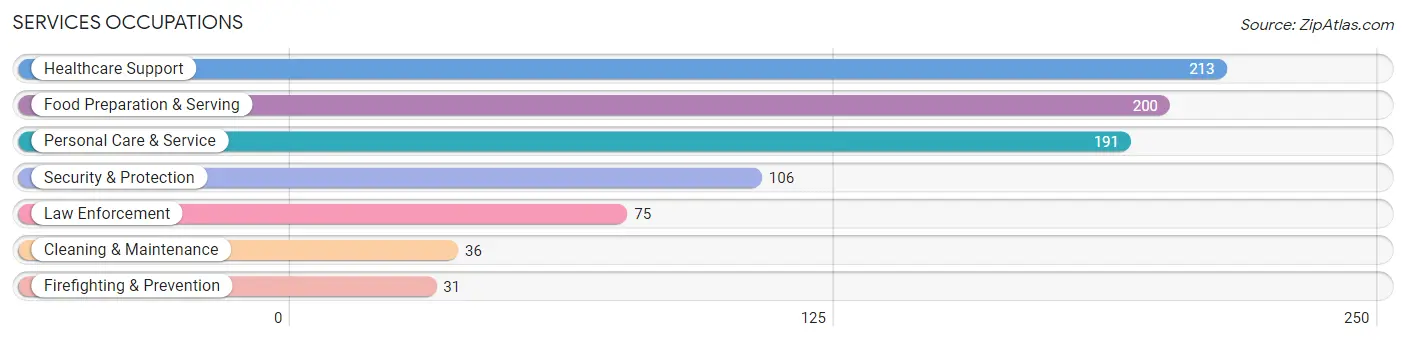
Services Occupations
The most common Services occupations in Stewartville are Healthcare Support (213 | 6.1%), Food Preparation & Serving (200 | 5.7%), Personal Care & Service (191 | 5.5%), Security & Protection (106 | 3.0%), and Law Enforcement (75 | 2.1%).
Services Occupations by Sex
Within the Services occupations in Stewartville, the most male-oriented occupations are Law Enforcement (100.0%), Cleaning & Maintenance (100.0%), and Security & Protection (84.9%), while the most female-oriented occupations are Personal Care & Service (100.0%), Healthcare Support (84.5%), and Food Preparation & Serving (78.5%).
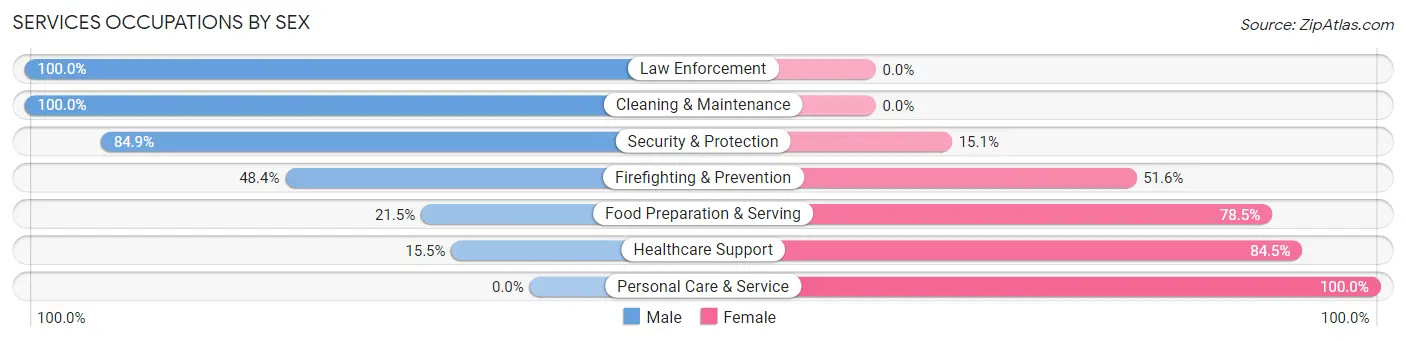
| Occupation | Male | Female |
| Healthcare Support | 33 (15.5%) | 180 (84.5%) |
| Security & Protection | 90 (84.9%) | 16 (15.1%) |
| Firefighting & Prevention | 15 (48.4%) | 16 (51.6%) |
| Law Enforcement | 75 (100.0%) | 0 (0.0%) |
| Food Preparation & Serving | 43 (21.5%) | 157 (78.5%) |
| Cleaning & Maintenance | 36 (100.0%) | 0 (0.0%) |
| Personal Care & Service | 0 (0.0%) | 191 (100.0%) |
| Total (Category) | 202 (27.1%) | 544 (72.9%) |
| Total (Overall) | 1,635 (46.9%) | 1,850 (53.1%) |
Sales and Office Occupations
The most common Sales and Office occupations in Stewartville are Office & Administration (461 | 13.2%), and Sales & Related (279 | 8.0%).

Sales and Office Occupations by Sex
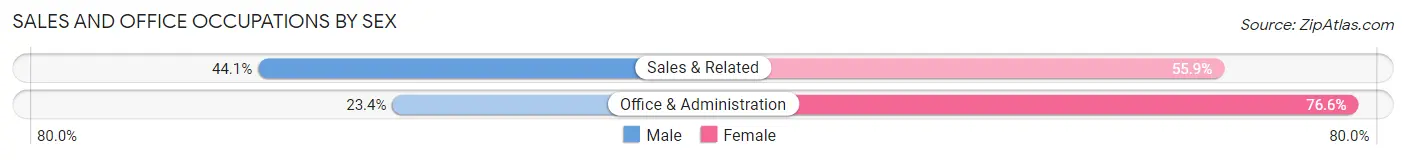
| Occupation | Male | Female |
| Sales & Related | 123 (44.1%) | 156 (55.9%) |
| Office & Administration | 108 (23.4%) | 353 (76.6%) |
| Total (Category) | 231 (31.2%) | 509 (68.8%) |
| Total (Overall) | 1,635 (46.9%) | 1,850 (53.1%) |
Natural Resources, Construction and Maintenance Occupations
The most common Natural Resources, Construction and Maintenance occupations in Stewartville are Construction & Extraction (217 | 6.2%), and Installation, Maintenance & Repair (76 | 2.2%).
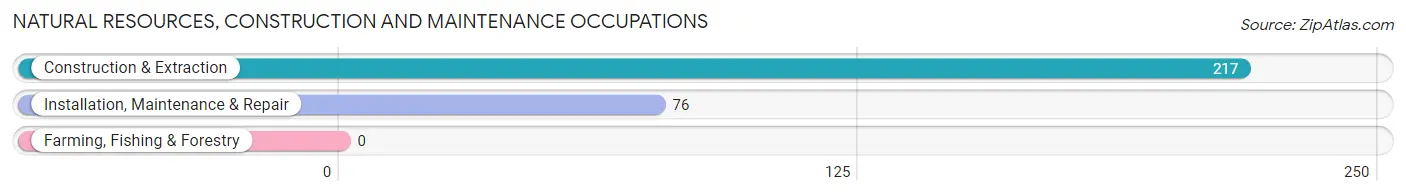
Natural Resources, Construction and Maintenance Occupations by Sex

| Occupation | Male | Female |
| Farming, Fishing & Forestry | 0 (0.0%) | 0 (0.0%) |
| Construction & Extraction | 217 (100.0%) | 0 (0.0%) |
| Installation, Maintenance & Repair | 22 (28.9%) | 54 (71.1%) |
| Total (Category) | 239 (81.6%) | 54 (18.4%) |
| Total (Overall) | 1,635 (46.9%) | 1,850 (53.1%) |
Production, Transportation and Moving Occupations
The most common Production, Transportation and Moving occupations in Stewartville are Production (229 | 6.6%), Transportation (125 | 3.6%), and Material Moving (65 | 1.9%).
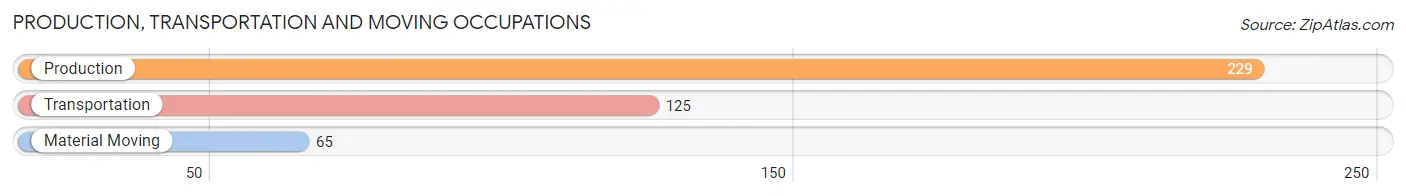
Production, Transportation and Moving Occupations by Sex
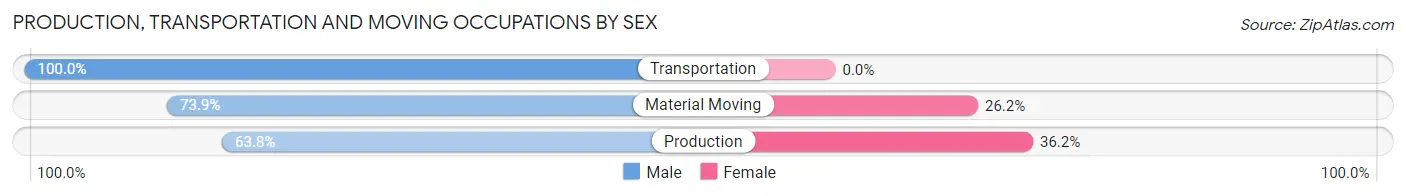
| Occupation | Male | Female |
| Production | 146 (63.8%) | 83 (36.2%) |
| Transportation | 125 (100.0%) | 0 (0.0%) |
| Material Moving | 48 (73.9%) | 17 (26.2%) |
| Total (Category) | 319 (76.1%) | 100 (23.9%) |
| Total (Overall) | 1,635 (46.9%) | 1,850 (53.1%) |
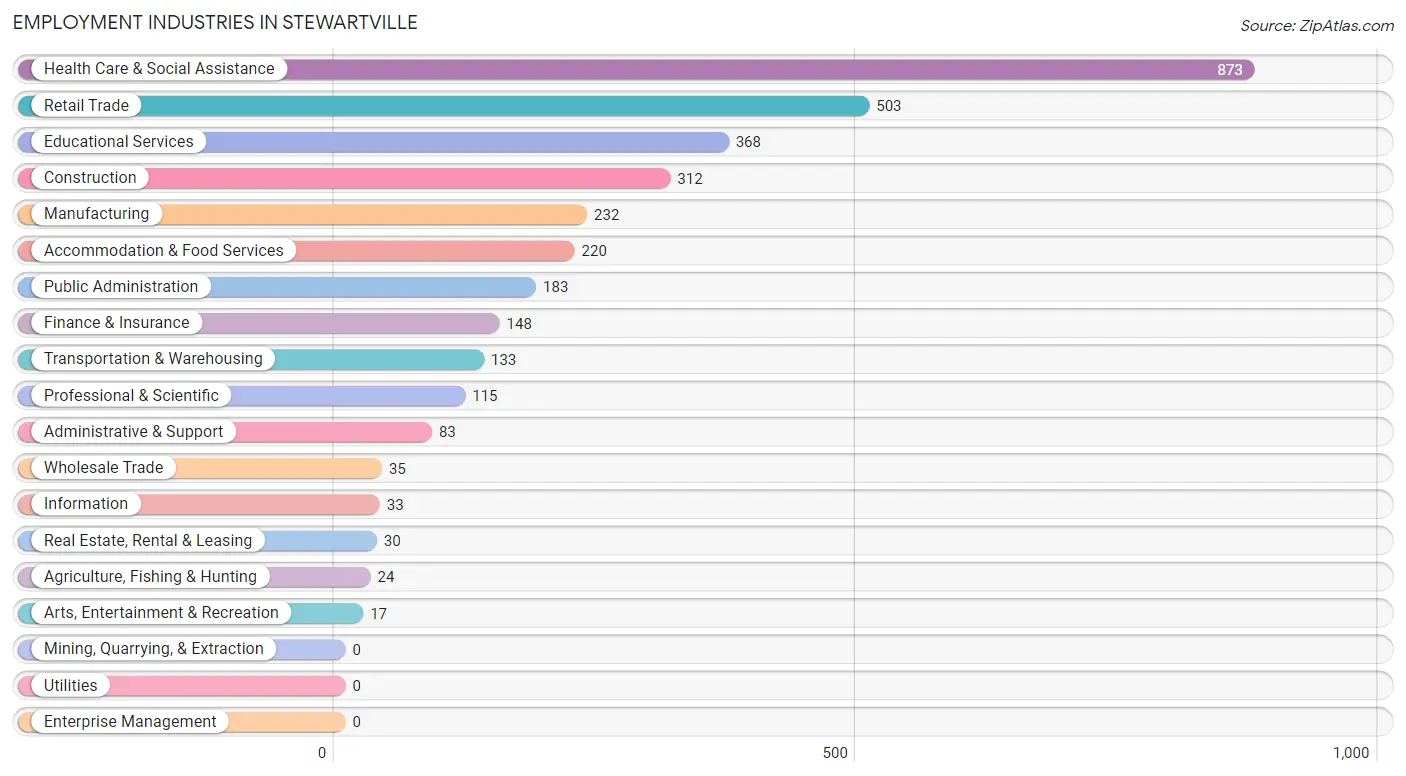
Employment Industries by Sex in Stewartville
Employment Industries in Stewartville
The major employment industries in Stewartville include Health Care & Social Assistance (873 | 25.1%), Retail Trade (503 | 14.4%), Educational Services (368 | 10.6%), Construction (312 | 8.9%), and Manufacturing (232 | 6.7%).
Employment Industries by Sex in Stewartville
The Stewartville industries that see more men than women are Agriculture, Fishing & Hunting (100.0%), Wholesale Trade (100.0%), and Transportation & Warehousing (100.0%), whereas the industries that tend to have a higher number of women are Health Care & Social Assistance (85.3%), Educational Services (85.1%), and Real Estate, Rental & Leasing (70.0%).
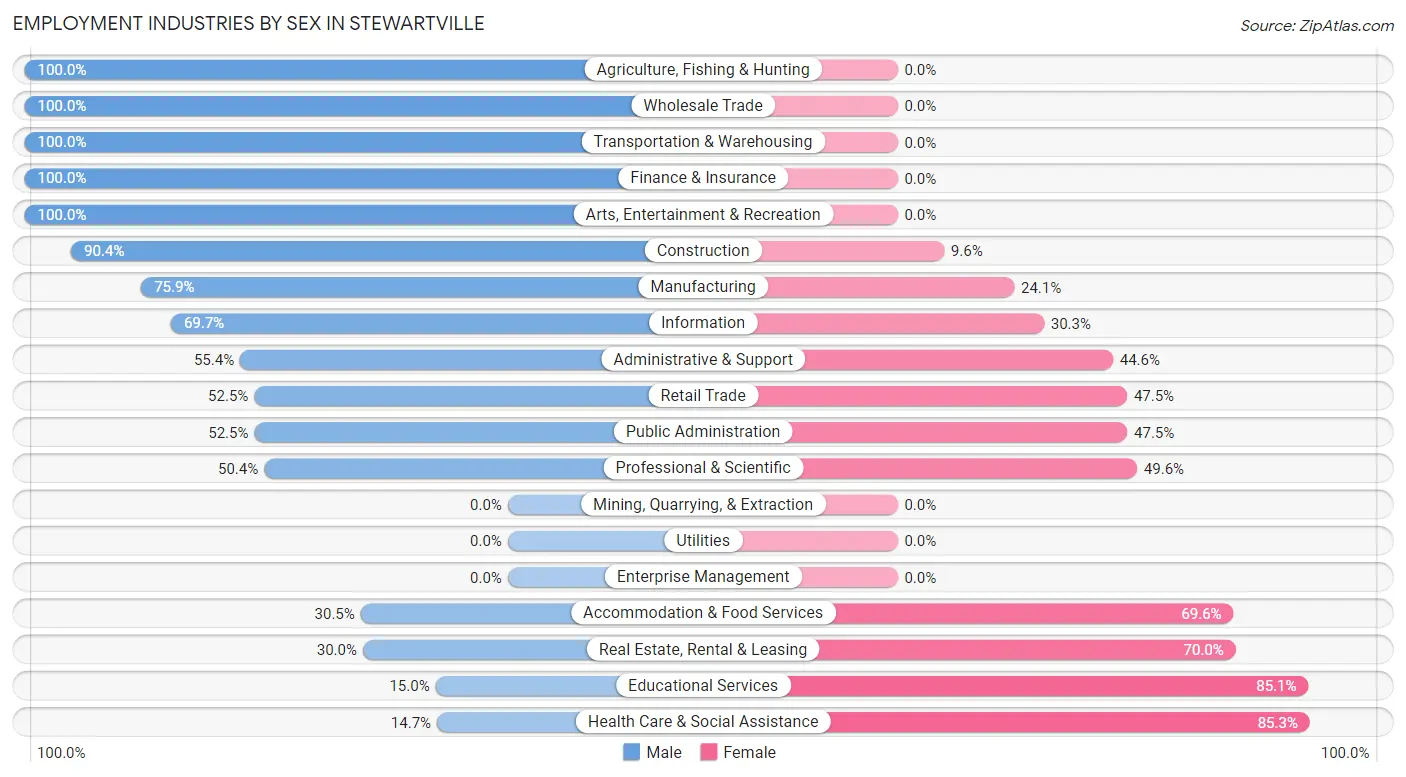
| Industry | Male | Female |
| Agriculture, Fishing & Hunting | 24 (100.0%) | 0 (0.0%) |
| Mining, Quarrying, & Extraction | 0 (0.0%) | 0 (0.0%) |
| Construction | 282 (90.4%) | 30 (9.6%) |
| Manufacturing | 176 (75.9%) | 56 (24.1%) |
| Wholesale Trade | 35 (100.0%) | 0 (0.0%) |
| Retail Trade | 264 (52.5%) | 239 (47.5%) |
| Transportation & Warehousing | 133 (100.0%) | 0 (0.0%) |
| Utilities | 0 (0.0%) | 0 (0.0%) |
| Information | 23 (69.7%) | 10 (30.3%) |
| Finance & Insurance | 148 (100.0%) | 0 (0.0%) |
| Real Estate, Rental & Leasing | 9 (30.0%) | 21 (70.0%) |
| Professional & Scientific | 58 (50.4%) | 57 (49.6%) |
| Enterprise Management | 0 (0.0%) | 0 (0.0%) |
| Administrative & Support | 46 (55.4%) | 37 (44.6%) |
| Educational Services | 55 (14.9%) | 313 (85.1%) |
| Health Care & Social Assistance | 128 (14.7%) | 745 (85.3%) |
| Arts, Entertainment & Recreation | 17 (100.0%) | 0 (0.0%) |
| Accommodation & Food Services | 67 (30.4%) | 153 (69.6%) |
| Public Administration | 96 (52.5%) | 87 (47.5%) |
| Total | 1,635 (46.9%) | 1,850 (53.1%) |
Education in Stewartville
School Enrollment in Stewartville
The most common levels of schooling among the 2,033 students in Stewartville are middle school (690 | 33.9%), high school (392 | 19.3%), and college / undergraduate (351 | 17.3%).
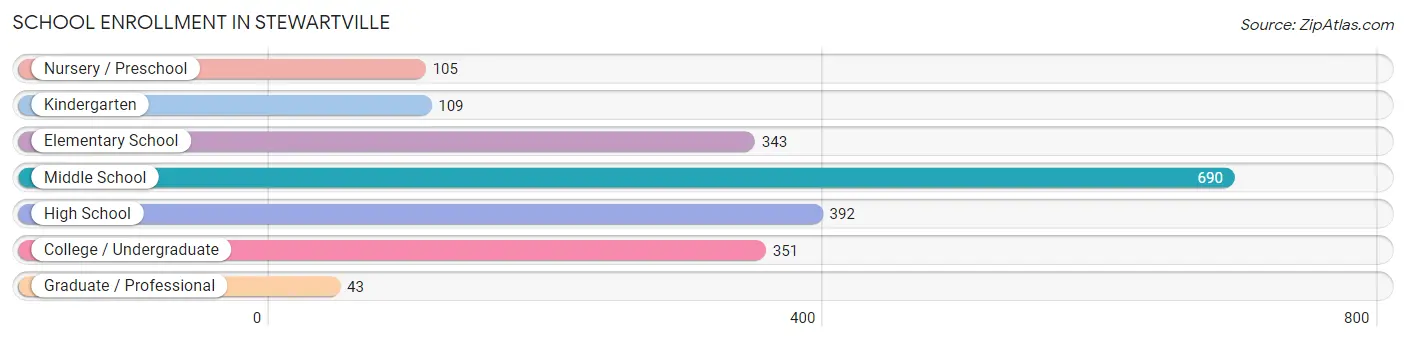
| School Level | # Students | % Students |
| Nursery / Preschool | 105 | 5.2% |
| Kindergarten | 109 | 5.4% |
| Elementary School | 343 | 16.9% |
| Middle School | 690 | 33.9% |
| High School | 392 | 19.3% |
| College / Undergraduate | 351 | 17.3% |
| Graduate / Professional | 43 | 2.1% |
| Total | 2,033 | 100.0% |
School Enrollment by Age by Funding Source in Stewartville
Out of a total of 2,033 students who are enrolled in schools in Stewartville, 55 (2.7%) attend a private institution, while the remaining 1,978 (97.3%) are enrolled in public schools. The age group of 3 to 4 year olds has the highest likelihood of being enrolled in private schools, with 25 (29.1% in the age bracket) enrolled. Conversely, the age group of 5 to 9 year old has the lowest likelihood of being enrolled in a private school, with 433 (100.0% in the age bracket) attending a public institution.
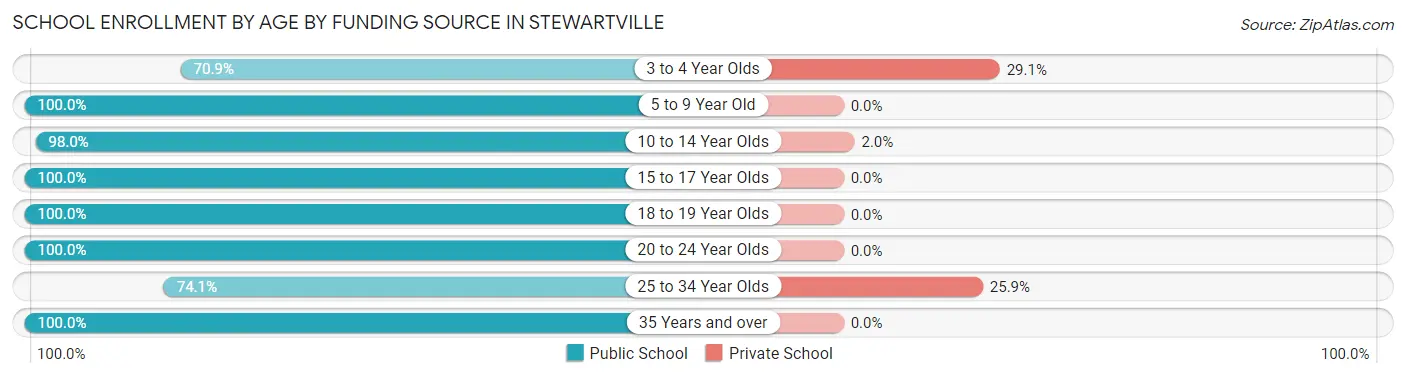
| Age Bracket | Public School | Private School |
| 3 to 4 Year Olds | 61 (70.9%) | 25 (29.1%) |
| 5 to 9 Year Old | 433 (100.0%) | 0 (0.0%) |
| 10 to 14 Year Olds | 727 (98.0%) | 15 (2.0%) |
| 15 to 17 Year Olds | 286 (100.0%) | 0 (0.0%) |
| 18 to 19 Year Olds | 304 (100.0%) | 0 (0.0%) |
| 20 to 24 Year Olds | 35 (100.0%) | 0 (0.0%) |
| 25 to 34 Year Olds | 40 (74.1%) | 14 (25.9%) |
| 35 Years and over | 93 (100.0%) | 0 (0.0%) |
| Total | 1,978 (97.3%) | 55 (2.7%) |
Educational Attainment by Field of Study in Stewartville
Education (266 | 21.0%), business (226 | 17.9%), science & technology (222 | 17.5%), bio, nature & agricultural (105 | 8.3%), and liberal arts & history (93 | 7.3%) are the most common fields of study among 1,265 individuals in Stewartville who have obtained a bachelor's degree or higher.
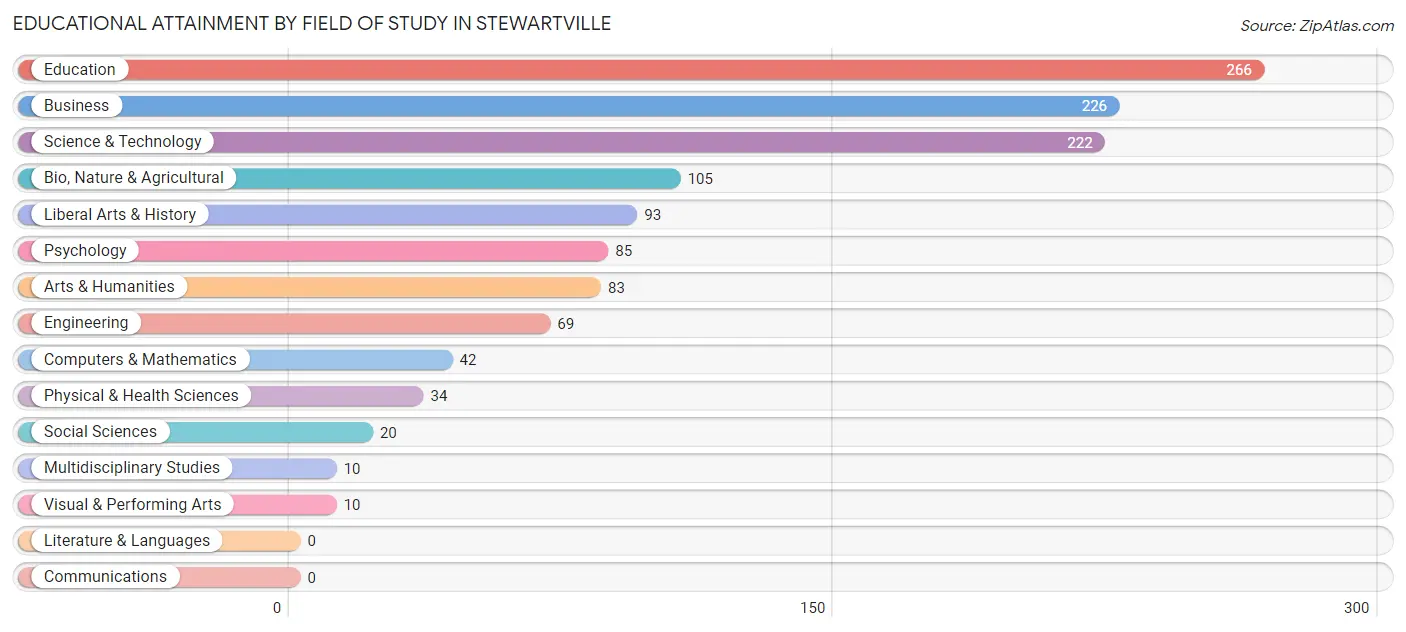
| Field of Study | # Graduates | % Graduates |
| Computers & Mathematics | 42 | 3.3% |
| Bio, Nature & Agricultural | 105 | 8.3% |
| Physical & Health Sciences | 34 | 2.7% |
| Psychology | 85 | 6.7% |
| Social Sciences | 20 | 1.6% |
| Engineering | 69 | 5.4% |
| Multidisciplinary Studies | 10 | 0.8% |
| Science & Technology | 222 | 17.5% |
| Business | 226 | 17.9% |
| Education | 266 | 21.0% |
| Literature & Languages | 0 | 0.0% |
| Liberal Arts & History | 93 | 7.3% |
| Visual & Performing Arts | 10 | 0.8% |
| Communications | 0 | 0.0% |
| Arts & Humanities | 83 | 6.6% |
| Total | 1,265 | 100.0% |
Transportation & Commute in Stewartville
Vehicle Availability by Sex in Stewartville
The most prevalent vehicle ownership categories in Stewartville are males with 2 vehicles (885, accounting for 54.5%) and females with 2 vehicles (928, making up 50.6%).
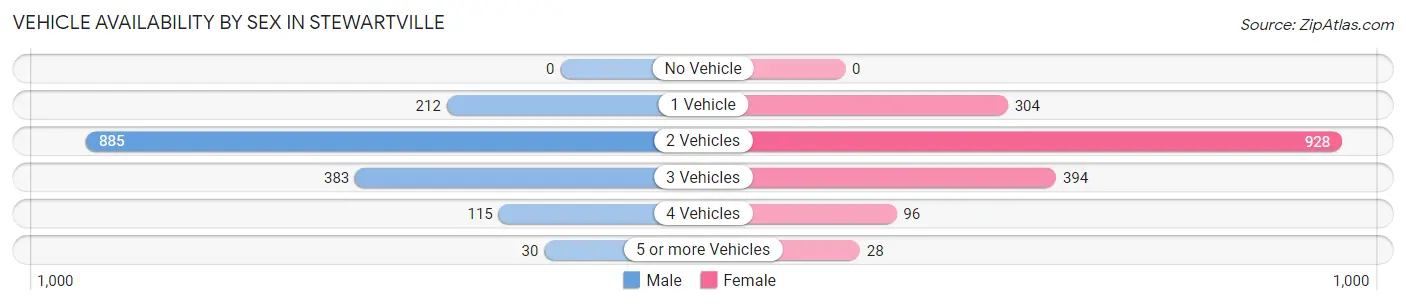
| Vehicles Available | Male | Female |
| No Vehicle | 0 (0.0%) | 0 (0.0%) |
| 1 Vehicle | 212 (13.1%) | 304 (17.4%) |
| 2 Vehicles | 885 (54.5%) | 928 (53.0%) |
| 3 Vehicles | 383 (23.6%) | 394 (22.5%) |
| 4 Vehicles | 115 (7.1%) | 96 (5.5%) |
| 5 or more Vehicles | 30 (1.8%) | 28 (1.6%) |
| Total | 1,625 (100.0%) | 1,750 (100.0%) |
Commute Time in Stewartville
The most frequently occuring commute durations in Stewartville are 20 to 24 minutes (658 commuters, 21.5%), 5 to 9 minutes (609 commuters, 19.9%), and 25 to 29 minutes (409 commuters, 13.4%).
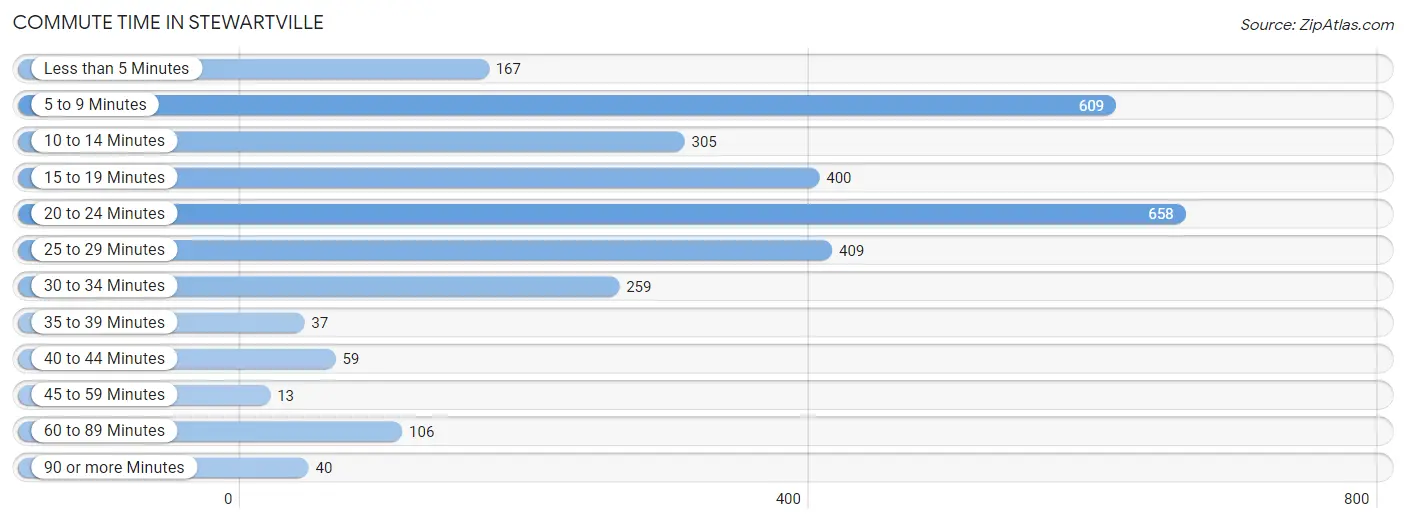
| Commute Time | # Commuters | % Commuters |
| Less than 5 Minutes | 167 | 5.4% |
| 5 to 9 Minutes | 609 | 19.9% |
| 10 to 14 Minutes | 305 | 10.0% |
| 15 to 19 Minutes | 400 | 13.1% |
| 20 to 24 Minutes | 658 | 21.5% |
| 25 to 29 Minutes | 409 | 13.4% |
| 30 to 34 Minutes | 259 | 8.5% |
| 35 to 39 Minutes | 37 | 1.2% |
| 40 to 44 Minutes | 59 | 1.9% |
| 45 to 59 Minutes | 13 | 0.4% |
| 60 to 89 Minutes | 106 | 3.5% |
| 90 or more Minutes | 40 | 1.3% |
Commute Time by Sex in Stewartville
The most common commute times in Stewartville are 20 to 24 minutes (389 commuters, 25.3%) for males and 25 to 29 minutes (343 commuters, 22.5%) for females.
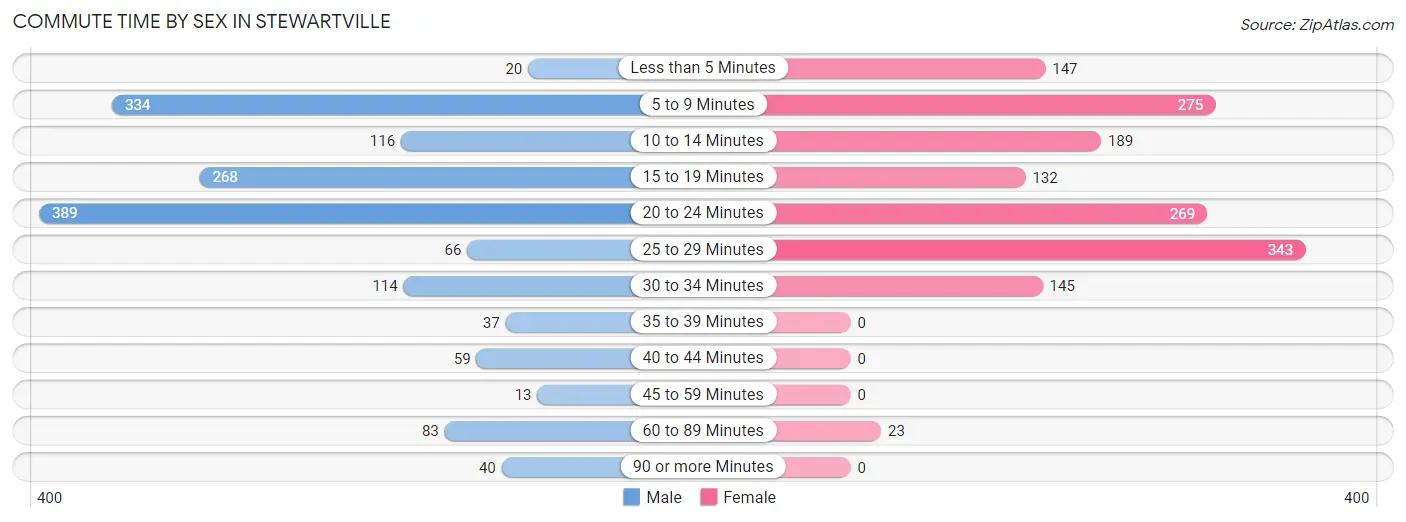
| Commute Time | Male | Female |
| Less than 5 Minutes | 20 (1.3%) | 147 (9.7%) |
| 5 to 9 Minutes | 334 (21.7%) | 275 (18.1%) |
| 10 to 14 Minutes | 116 (7.5%) | 189 (12.4%) |
| 15 to 19 Minutes | 268 (17.4%) | 132 (8.7%) |
| 20 to 24 Minutes | 389 (25.3%) | 269 (17.7%) |
| 25 to 29 Minutes | 66 (4.3%) | 343 (22.5%) |
| 30 to 34 Minutes | 114 (7.4%) | 145 (9.5%) |
| 35 to 39 Minutes | 37 (2.4%) | 0 (0.0%) |
| 40 to 44 Minutes | 59 (3.8%) | 0 (0.0%) |
| 45 to 59 Minutes | 13 (0.8%) | 0 (0.0%) |
| 60 to 89 Minutes | 83 (5.4%) | 23 (1.5%) |
| 90 or more Minutes | 40 (2.6%) | 0 (0.0%) |
Time of Departure to Work by Sex in Stewartville
The most frequent times of departure to work in Stewartville are 6:30 AM to 6:59 AM (355, 23.1%) for males and 7:00 AM to 7:29 AM (304, 20.0%) for females.
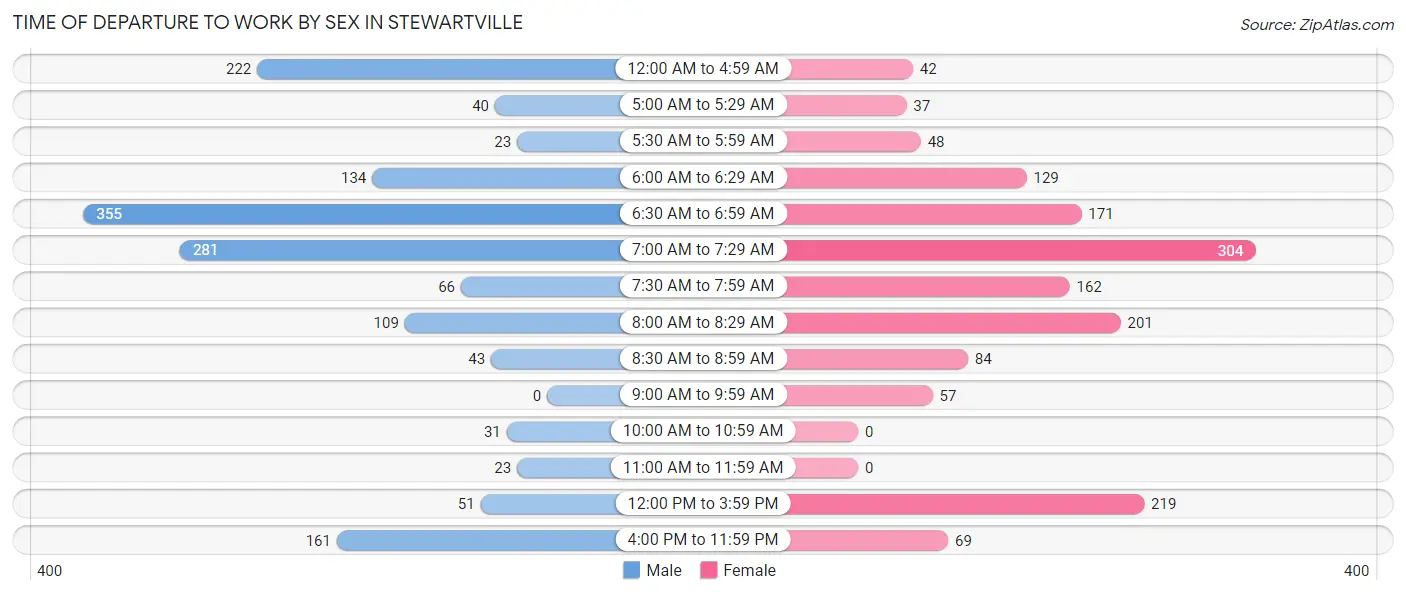
| Time of Departure | Male | Female |
| 12:00 AM to 4:59 AM | 222 (14.4%) | 42 (2.8%) |
| 5:00 AM to 5:29 AM | 40 (2.6%) | 37 (2.4%) |
| 5:30 AM to 5:59 AM | 23 (1.5%) | 48 (3.2%) |
| 6:00 AM to 6:29 AM | 134 (8.7%) | 129 (8.5%) |
| 6:30 AM to 6:59 AM | 355 (23.1%) | 171 (11.2%) |
| 7:00 AM to 7:29 AM | 281 (18.3%) | 304 (20.0%) |
| 7:30 AM to 7:59 AM | 66 (4.3%) | 162 (10.6%) |
| 8:00 AM to 8:29 AM | 109 (7.1%) | 201 (13.2%) |
| 8:30 AM to 8:59 AM | 43 (2.8%) | 84 (5.5%) |
| 9:00 AM to 9:59 AM | 0 (0.0%) | 57 (3.7%) |
| 10:00 AM to 10:59 AM | 31 (2.0%) | 0 (0.0%) |
| 11:00 AM to 11:59 AM | 23 (1.5%) | 0 (0.0%) |
| 12:00 PM to 3:59 PM | 51 (3.3%) | 219 (14.4%) |
| 4:00 PM to 11:59 PM | 161 (10.5%) | 69 (4.5%) |
| Total | 1,539 (100.0%) | 1,523 (100.0%) |
Housing Occupancy in Stewartville
Occupancy by Ownership in Stewartville
Of the total 2,515 dwellings in Stewartville, owner-occupied units account for 1,962 (78.0%), while renter-occupied units make up 553 (22.0%).
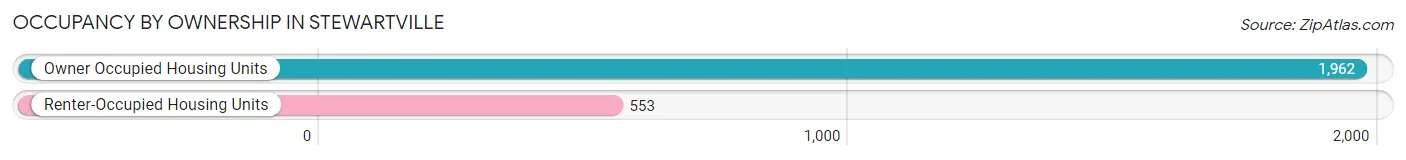
| Occupancy | # Housing Units | % Housing Units |
| Owner Occupied Housing Units | 1,962 | 78.0% |
| Renter-Occupied Housing Units | 553 | 22.0% |
| Total Occupied Housing Units | 2,515 | 100.0% |
Occupancy by Household Size in Stewartville
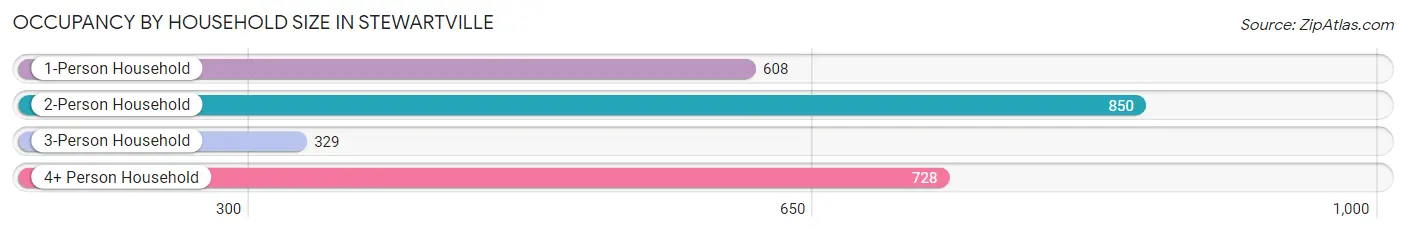
| Household Size | # Housing Units | % Housing Units |
| 1-Person Household | 608 | 24.2% |
| 2-Person Household | 850 | 33.8% |
| 3-Person Household | 329 | 13.1% |
| 4+ Person Household | 728 | 28.9% |
| Total Housing Units | 2,515 | 100.0% |
Occupancy by Ownership by Household Size in Stewartville
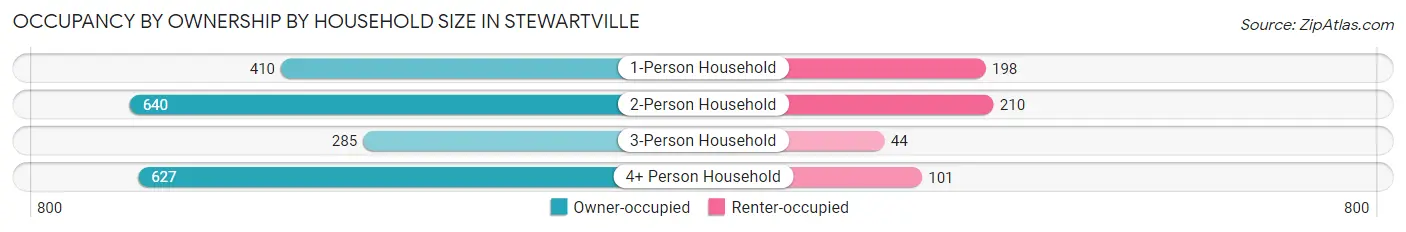
| Household Size | Owner-occupied | Renter-occupied |
| 1-Person Household | 410 (67.4%) | 198 (32.6%) |
| 2-Person Household | 640 (75.3%) | 210 (24.7%) |
| 3-Person Household | 285 (86.6%) | 44 (13.4%) |
| 4+ Person Household | 627 (86.1%) | 101 (13.9%) |
| Total Housing Units | 1,962 (78.0%) | 553 (22.0%) |
Occupancy by Educational Attainment in Stewartville
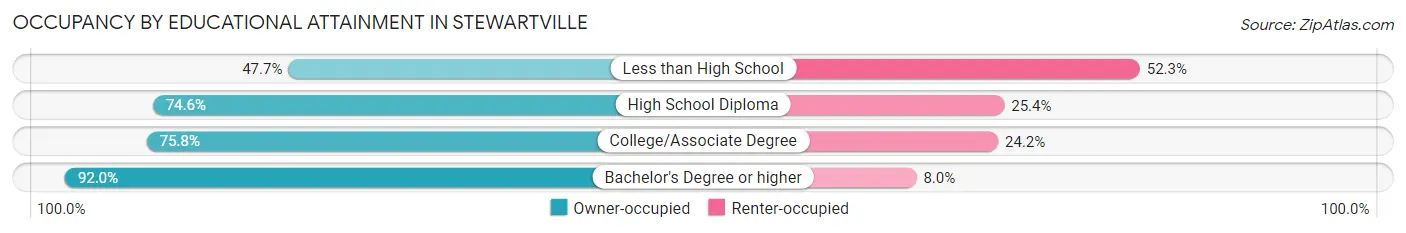
| Household Size | Owner-occupied | Renter-occupied |
| Less than High School | 63 (47.7%) | 69 (52.3%) |
| High School Diploma | 561 (74.6%) | 191 (25.4%) |
| College/Associate Degree | 762 (75.8%) | 243 (24.2%) |
| Bachelor's Degree or higher | 576 (92.0%) | 50 (8.0%) |
Occupancy by Age of Householder in Stewartville
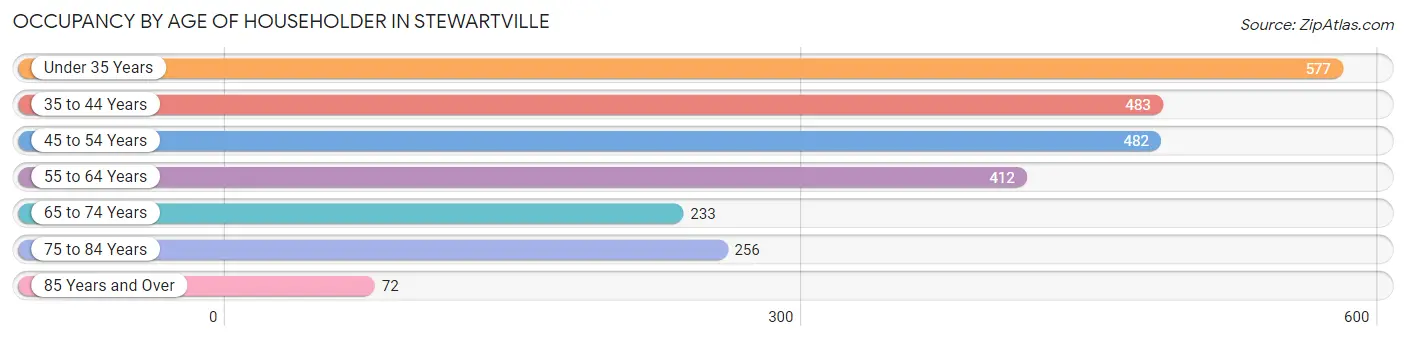
| Age Bracket | # Households | % Households |
| Under 35 Years | 577 | 22.9% |
| 35 to 44 Years | 483 | 19.2% |
| 45 to 54 Years | 482 | 19.2% |
| 55 to 64 Years | 412 | 16.4% |
| 65 to 74 Years | 233 | 9.3% |
| 75 to 84 Years | 256 | 10.2% |
| 85 Years and Over | 72 | 2.9% |
| Total | 2,515 | 100.0% |
Housing Finances in Stewartville
Median Income by Occupancy in Stewartville
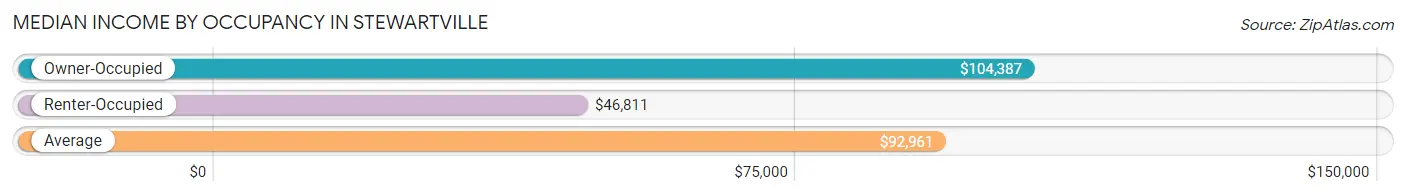
| Occupancy Type | # Households | Median Income |
| Owner-Occupied | 1,962 (78.0%) | $104,387 |
| Renter-Occupied | 553 (22.0%) | $46,811 |
| Average | 2,515 (100.0%) | $92,961 |
Occupancy by Householder Income Bracket in Stewartville
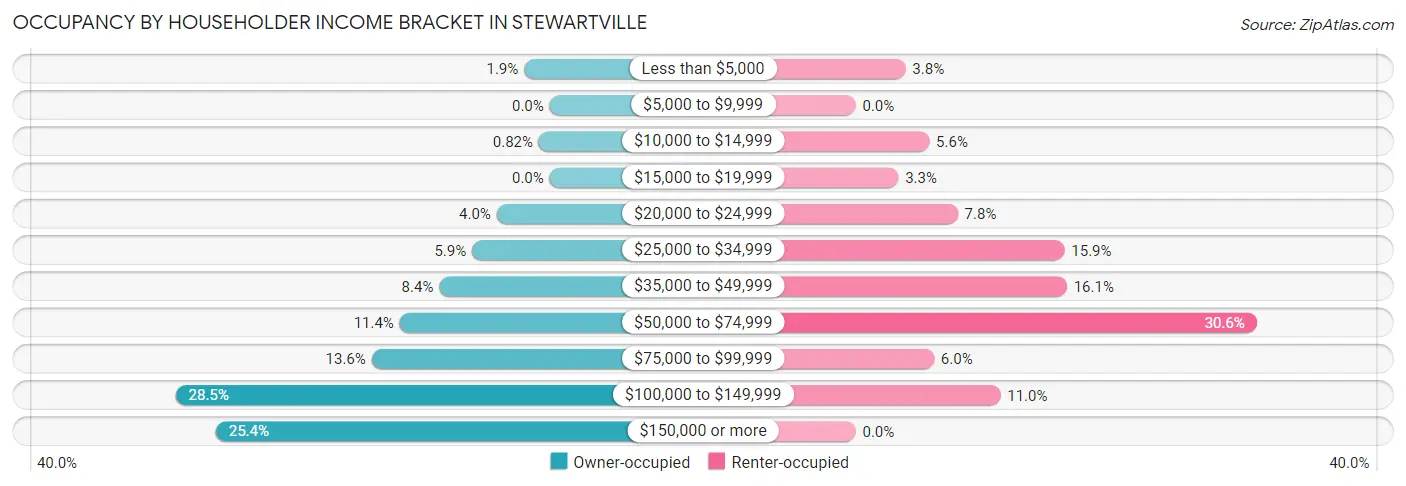
| Income Bracket | Owner-occupied | Renter-occupied |
| Less than $5,000 | 38 (1.9%) | 21 (3.8%) |
| $5,000 to $9,999 | 0 (0.0%) | 0 (0.0%) |
| $10,000 to $14,999 | 16 (0.8%) | 31 (5.6%) |
| $15,000 to $19,999 | 0 (0.0%) | 18 (3.3%) |
| $20,000 to $24,999 | 79 (4.0%) | 43 (7.8%) |
| $25,000 to $34,999 | 116 (5.9%) | 88 (15.9%) |
| $35,000 to $49,999 | 165 (8.4%) | 89 (16.1%) |
| $50,000 to $74,999 | 224 (11.4%) | 169 (30.6%) |
| $75,000 to $99,999 | 266 (13.6%) | 33 (6.0%) |
| $100,000 to $149,999 | 559 (28.5%) | 61 (11.0%) |
| $150,000 or more | 499 (25.4%) | 0 (0.0%) |
| Total | 1,962 (100.0%) | 553 (100.0%) |
Monthly Housing Cost Tiers in Stewartville
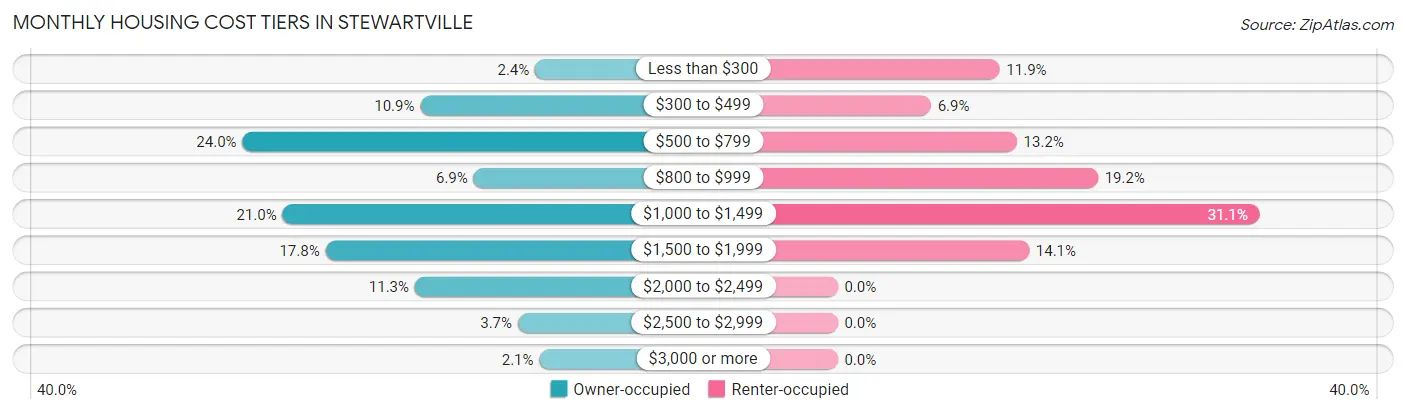
| Monthly Cost | Owner-occupied | Renter-occupied |
| Less than $300 | 47 (2.4%) | 66 (11.9%) |
| $300 to $499 | 213 (10.9%) | 38 (6.9%) |
| $500 to $799 | 470 (24.0%) | 73 (13.2%) |
| $800 to $999 | 136 (6.9%) | 106 (19.2%) |
| $1,000 to $1,499 | 412 (21.0%) | 172 (31.1%) |
| $1,500 to $1,999 | 350 (17.8%) | 78 (14.1%) |
| $2,000 to $2,499 | 221 (11.3%) | 0 (0.0%) |
| $2,500 to $2,999 | 72 (3.7%) | 0 (0.0%) |
| $3,000 or more | 41 (2.1%) | 0 (0.0%) |
| Total | 1,962 (100.0%) | 553 (100.0%) |
Physical Housing Characteristics in Stewartville
Housing Structures in Stewartville
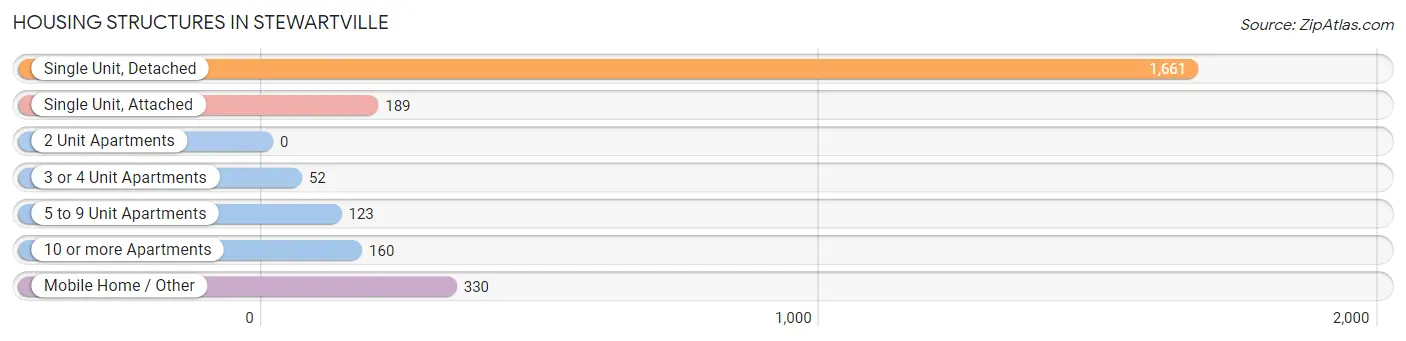
| Structure Type | # Housing Units | % Housing Units |
| Single Unit, Detached | 1,661 | 66.0% |
| Single Unit, Attached | 189 | 7.5% |
| 2 Unit Apartments | 0 | 0.0% |
| 3 or 4 Unit Apartments | 52 | 2.1% |
| 5 to 9 Unit Apartments | 123 | 4.9% |
| 10 or more Apartments | 160 | 6.4% |
| Mobile Home / Other | 330 | 13.1% |
| Total | 2,515 | 100.0% |
Housing Structures by Occupancy in Stewartville
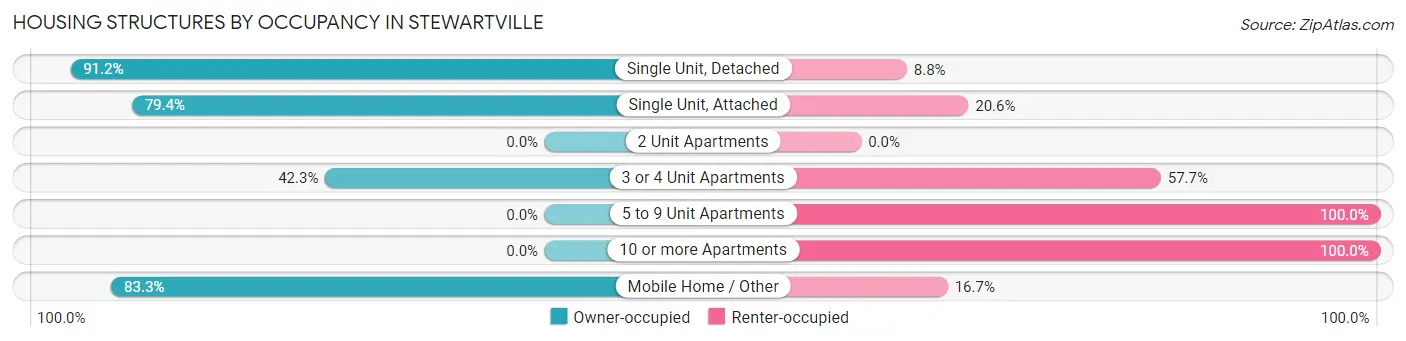
| Structure Type | Owner-occupied | Renter-occupied |
| Single Unit, Detached | 1,515 (91.2%) | 146 (8.8%) |
| Single Unit, Attached | 150 (79.4%) | 39 (20.6%) |
| 2 Unit Apartments | 0 (0.0%) | 0 (0.0%) |
| 3 or 4 Unit Apartments | 22 (42.3%) | 30 (57.7%) |
| 5 to 9 Unit Apartments | 0 (0.0%) | 123 (100.0%) |
| 10 or more Apartments | 0 (0.0%) | 160 (100.0%) |
| Mobile Home / Other | 275 (83.3%) | 55 (16.7%) |
| Total | 1,962 (78.0%) | 553 (22.0%) |
Housing Structures by Number of Rooms in Stewartville
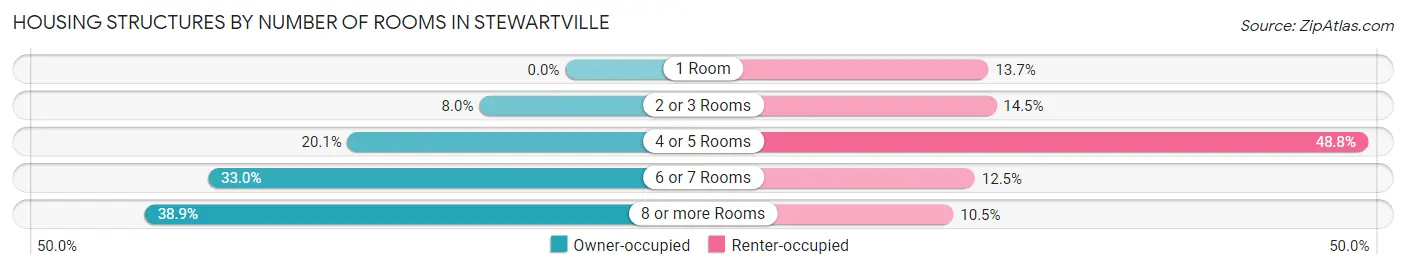
| Number of Rooms | Owner-occupied | Renter-occupied |
| 1 Room | 0 (0.0%) | 76 (13.7%) |
| 2 or 3 Rooms | 156 (8.0%) | 80 (14.5%) |
| 4 or 5 Rooms | 395 (20.1%) | 270 (48.8%) |
| 6 or 7 Rooms | 648 (33.0%) | 69 (12.5%) |
| 8 or more Rooms | 763 (38.9%) | 58 (10.5%) |
| Total | 1,962 (100.0%) | 553 (100.0%) |
Housing Structure by Heating Type in Stewartville
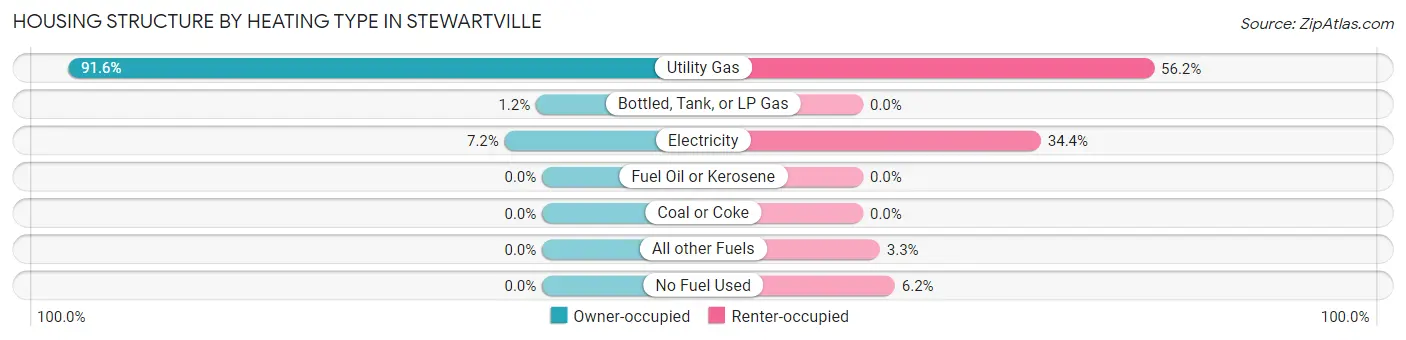
| Heating Type | Owner-occupied | Renter-occupied |
| Utility Gas | 1,797 (91.6%) | 311 (56.2%) |
| Bottled, Tank, or LP Gas | 23 (1.2%) | 0 (0.0%) |
| Electricity | 142 (7.2%) | 190 (34.4%) |
| Fuel Oil or Kerosene | 0 (0.0%) | 0 (0.0%) |
| Coal or Coke | 0 (0.0%) | 0 (0.0%) |
| All other Fuels | 0 (0.0%) | 18 (3.3%) |
| No Fuel Used | 0 (0.0%) | 34 (6.1%) |
| Total | 1,962 (100.0%) | 553 (100.0%) |
Household Vehicle Usage in Stewartville
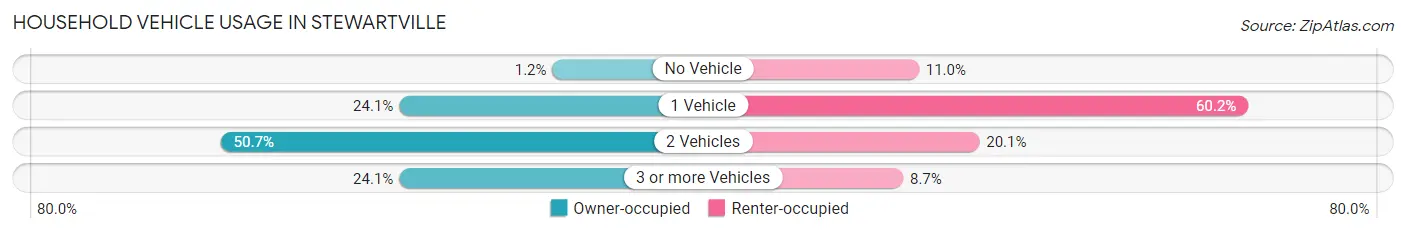
| Vehicles per Household | Owner-occupied | Renter-occupied |
| No Vehicle | 23 (1.2%) | 61 (11.0%) |
| 1 Vehicle | 472 (24.1%) | 333 (60.2%) |
| 2 Vehicles | 995 (50.7%) | 111 (20.1%) |
| 3 or more Vehicles | 472 (24.1%) | 48 (8.7%) |
| Total | 1,962 (100.0%) | 553 (100.0%) |
Real Estate & Mortgages in Stewartville
Real Estate and Mortgage Overview in Stewartville
| Characteristic | Without Mortgage | With Mortgage |
| Housing Units | 767 | 1,195 |
| Median Property Value | $210,700 | $281,500 |
| Median Household Income | $55,409 | $441 |
| Monthly Housing Costs | $575 | $41 |
| Real Estate Taxes | $2,608 | $107 |
Property Value by Mortgage Status in Stewartville
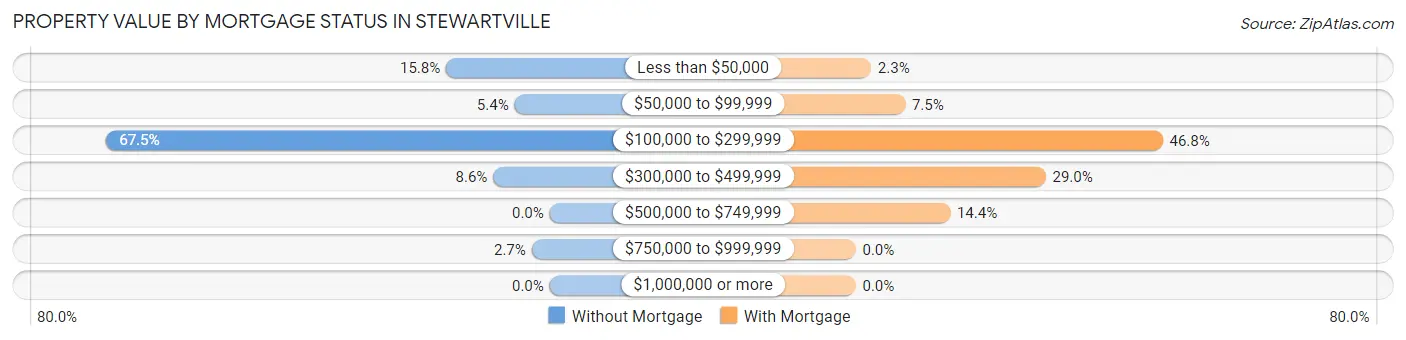
| Property Value | Without Mortgage | With Mortgage |
| Less than $50,000 | 121 (15.8%) | 28 (2.3%) |
| $50,000 to $99,999 | 41 (5.3%) | 90 (7.5%) |
| $100,000 to $299,999 | 518 (67.5%) | 559 (46.8%) |
| $300,000 to $499,999 | 66 (8.6%) | 346 (28.9%) |
| $500,000 to $749,999 | 0 (0.0%) | 172 (14.4%) |
| $750,000 to $999,999 | 21 (2.7%) | 0 (0.0%) |
| $1,000,000 or more | 0 (0.0%) | 0 (0.0%) |
| Total | 767 (100.0%) | 1,195 (100.0%) |
Household Income by Mortgage Status in Stewartville
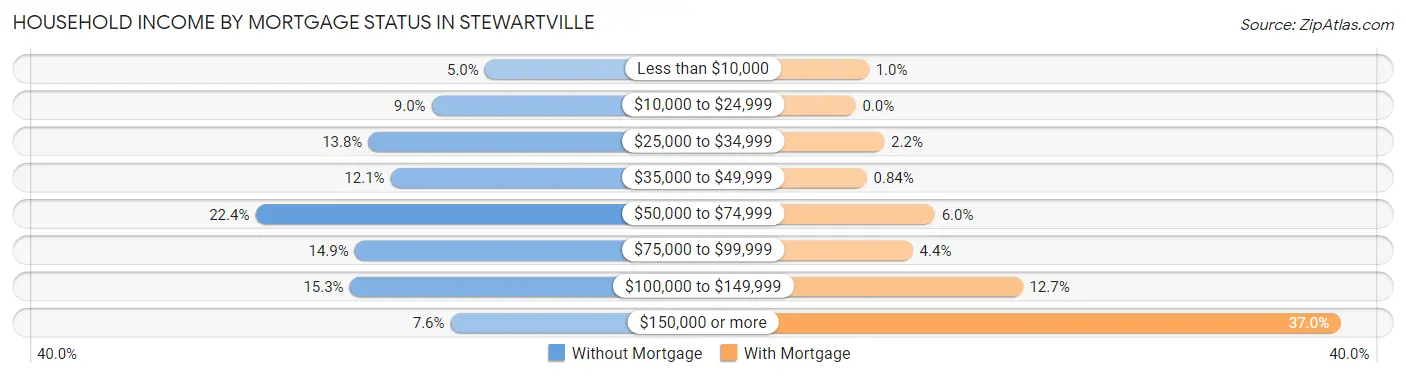
| Household Income | Without Mortgage | With Mortgage |
| Less than $10,000 | 38 (5.0%) | 12 (1.0%) |
| $10,000 to $24,999 | 69 (9.0%) | 0 (0.0%) |
| $25,000 to $34,999 | 106 (13.8%) | 26 (2.2%) |
| $35,000 to $49,999 | 93 (12.1%) | 10 (0.8%) |
| $50,000 to $74,999 | 172 (22.4%) | 72 (6.0%) |
| $75,000 to $99,999 | 114 (14.9%) | 52 (4.3%) |
| $100,000 to $149,999 | 117 (15.2%) | 152 (12.7%) |
| $150,000 or more | 58 (7.6%) | 442 (37.0%) |
| Total | 767 (100.0%) | 1,195 (100.0%) |
Property Value to Household Income Ratio in Stewartville
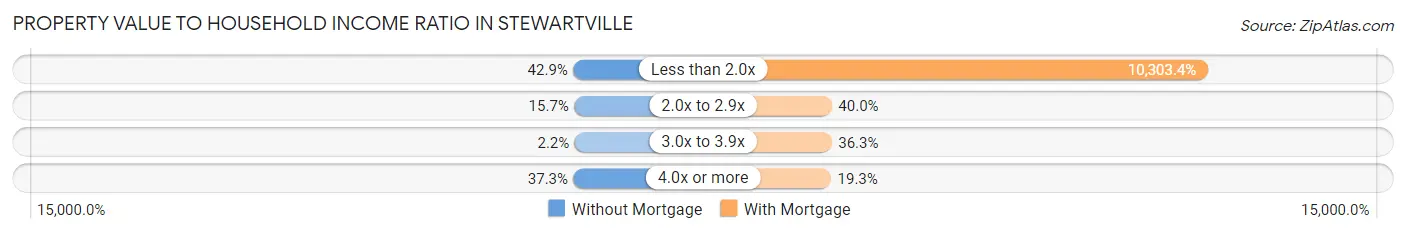
| Value-to-Income Ratio | Without Mortgage | With Mortgage |
| Less than 2.0x | 329 (42.9%) | 123,125 (10,303.4%) |
| 2.0x to 2.9x | 120 (15.7%) | 478 (40.0%) |
| 3.0x to 3.9x | 17 (2.2%) | 434 (36.3%) |
| 4.0x or more | 286 (37.3%) | 230 (19.3%) |
| Total | 767 (100.0%) | 1,195 (100.0%) |
Real Estate Taxes by Mortgage Status in Stewartville
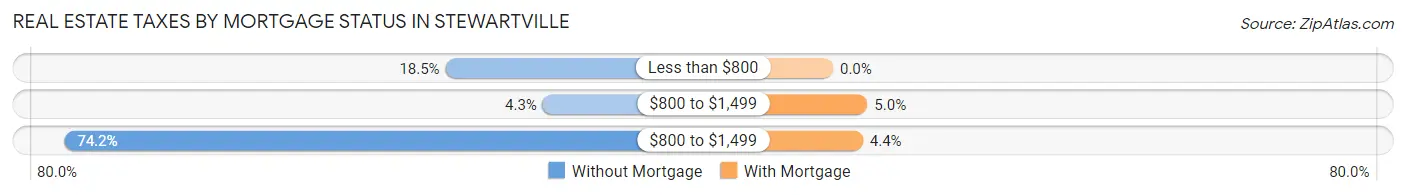
| Property Taxes | Without Mortgage | With Mortgage |
| Less than $800 | 142 (18.5%) | 0 (0.0%) |
| $800 to $1,499 | 33 (4.3%) | 60 (5.0%) |
| $800 to $1,499 | 569 (74.2%) | 52 (4.3%) |
| Total | 767 (100.0%) | 1,195 (100.0%) |
Health & Disability in Stewartville
Health Insurance Coverage by Age in Stewartville
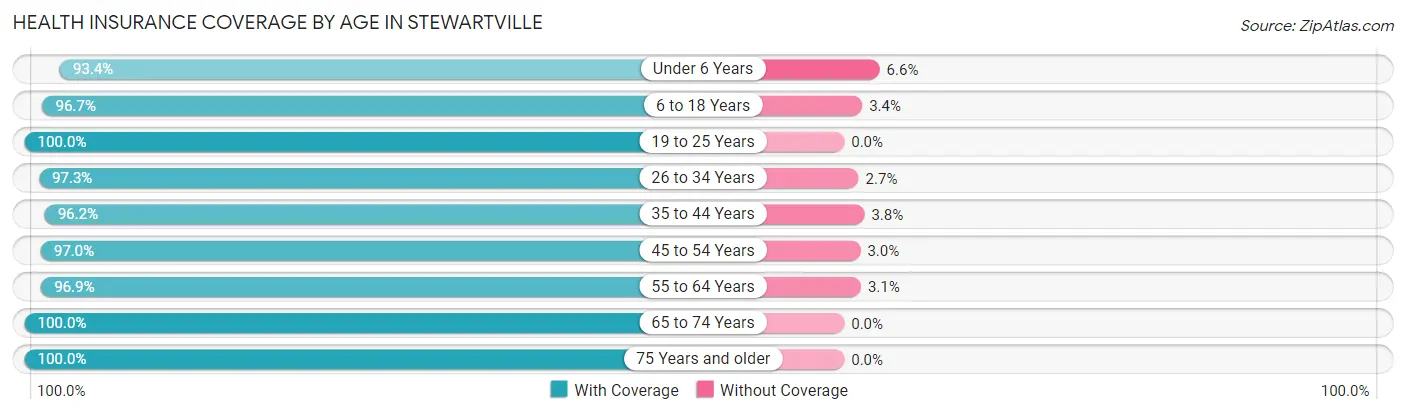
| Age Bracket | With Coverage | Without Coverage |
| Under 6 Years | 539 (93.4%) | 38 (6.6%) |
| 6 to 18 Years | 1,498 (96.7%) | 52 (3.4%) |
| 19 to 25 Years | 485 (100.0%) | 0 (0.0%) |
| 26 to 34 Years | 763 (97.3%) | 21 (2.7%) |
| 35 to 44 Years | 922 (96.2%) | 36 (3.8%) |
| 45 to 54 Years | 772 (97.0%) | 24 (3.0%) |
| 55 to 64 Years | 655 (96.9%) | 21 (3.1%) |
| 65 to 74 Years | 368 (100.0%) | 0 (0.0%) |
| 75 Years and older | 406 (100.0%) | 0 (0.0%) |
| Total | 6,408 (97.1%) | 192 (2.9%) |
Health Insurance Coverage by Citizenship Status in Stewartville
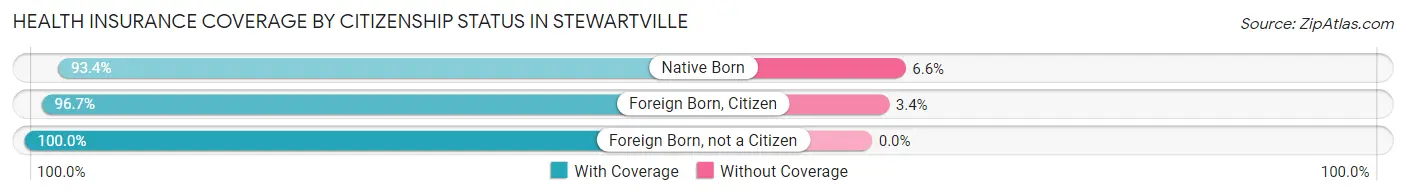
| Citizenship Status | With Coverage | Without Coverage |
| Native Born | 539 (93.4%) | 38 (6.6%) |
| Foreign Born, Citizen | 1,498 (96.7%) | 52 (3.4%) |
| Foreign Born, not a Citizen | 485 (100.0%) | 0 (0.0%) |
Health Insurance Coverage by Household Income in Stewartville
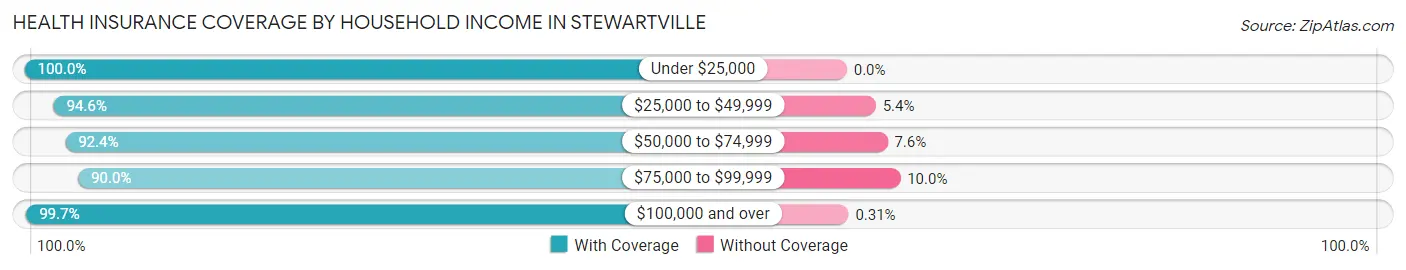
| Household Income | With Coverage | Without Coverage |
| Under $25,000 | 350 (100.0%) | 0 (0.0%) |
| $25,000 to $49,999 | 820 (94.6%) | 47 (5.4%) |
| $50,000 to $74,999 | 715 (92.4%) | 59 (7.6%) |
| $75,000 to $99,999 | 665 (90.0%) | 74 (10.0%) |
| $100,000 and over | 3,858 (99.7%) | 12 (0.3%) |
Public vs Private Health Insurance Coverage by Age in Stewartville
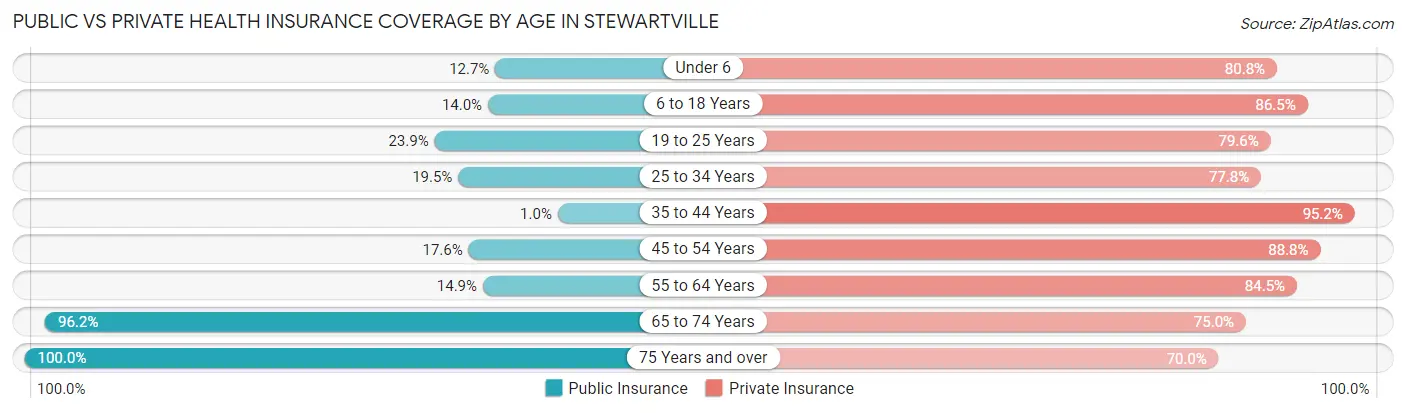
| Age Bracket | Public Insurance | Private Insurance |
| Under 6 | 73 (12.7%) | 466 (80.8%) |
| 6 to 18 Years | 217 (14.0%) | 1,340 (86.5%) |
| 19 to 25 Years | 116 (23.9%) | 386 (79.6%) |
| 25 to 34 Years | 153 (19.5%) | 610 (77.8%) |
| 35 to 44 Years | 10 (1.0%) | 912 (95.2%) |
| 45 to 54 Years | 140 (17.6%) | 707 (88.8%) |
| 55 to 64 Years | 101 (14.9%) | 571 (84.5%) |
| 65 to 74 Years | 354 (96.2%) | 276 (75.0%) |
| 75 Years and over | 406 (100.0%) | 284 (70.0%) |
| Total | 1,570 (23.8%) | 5,552 (84.1%) |
Disability Status by Sex by Age in Stewartville
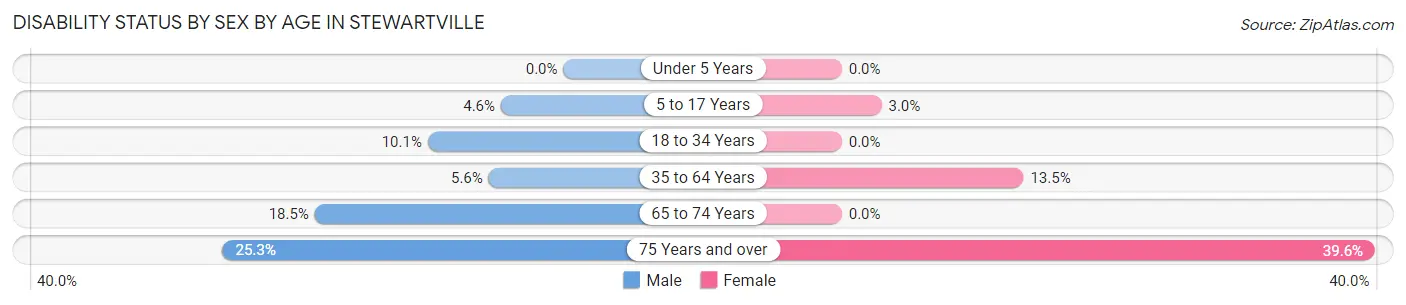
| Age Bracket | Male | Female |
| Under 5 Years | 0 (0.0%) | 0 (0.0%) |
| 5 to 17 Years | 33 (4.6%) | 23 (2.9%) |
| 18 to 34 Years | 61 (10.1%) | 0 (0.0%) |
| 35 to 64 Years | 62 (5.6%) | 177 (13.5%) |
| 65 to 74 Years | 24 (18.5%) | 0 (0.0%) |
| 75 Years and over | 42 (25.3%) | 95 (39.6%) |
Disability Class by Sex by Age in Stewartville
Disability Class: Hearing Difficulty
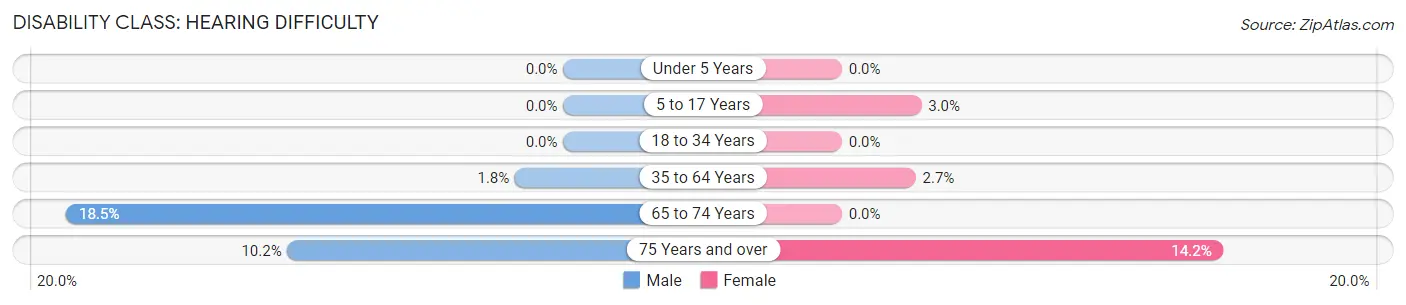
| Age Bracket | Male | Female |
| Under 5 Years | 0 (0.0%) | 0 (0.0%) |
| 5 to 17 Years | 0 (0.0%) | 23 (2.9%) |
| 18 to 34 Years | 0 (0.0%) | 0 (0.0%) |
| 35 to 64 Years | 20 (1.8%) | 36 (2.7%) |
| 65 to 74 Years | 24 (18.5%) | 0 (0.0%) |
| 75 Years and over | 17 (10.2%) | 34 (14.2%) |
Disability Class: Vision Difficulty
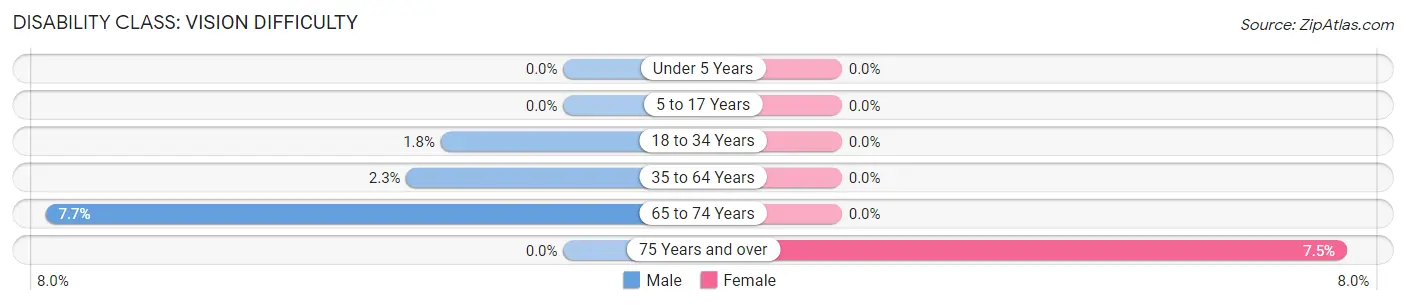
| Age Bracket | Male | Female |
| Under 5 Years | 0 (0.0%) | 0 (0.0%) |
| 5 to 17 Years | 0 (0.0%) | 0 (0.0%) |
| 18 to 34 Years | 11 (1.8%) | 0 (0.0%) |
| 35 to 64 Years | 26 (2.3%) | 0 (0.0%) |
| 65 to 74 Years | 10 (7.7%) | 0 (0.0%) |
| 75 Years and over | 0 (0.0%) | 18 (7.5%) |
Disability Class: Cognitive Difficulty
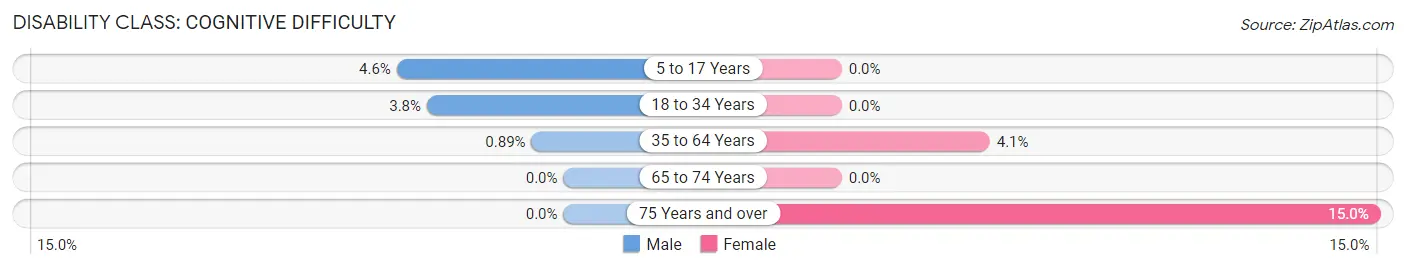
| Age Bracket | Male | Female |
| 5 to 17 Years | 33 (4.6%) | 0 (0.0%) |
| 18 to 34 Years | 23 (3.8%) | 0 (0.0%) |
| 35 to 64 Years | 10 (0.9%) | 54 (4.1%) |
| 65 to 74 Years | 0 (0.0%) | 0 (0.0%) |
| 75 Years and over | 0 (0.0%) | 36 (15.0%) |
Disability Class: Ambulatory Difficulty
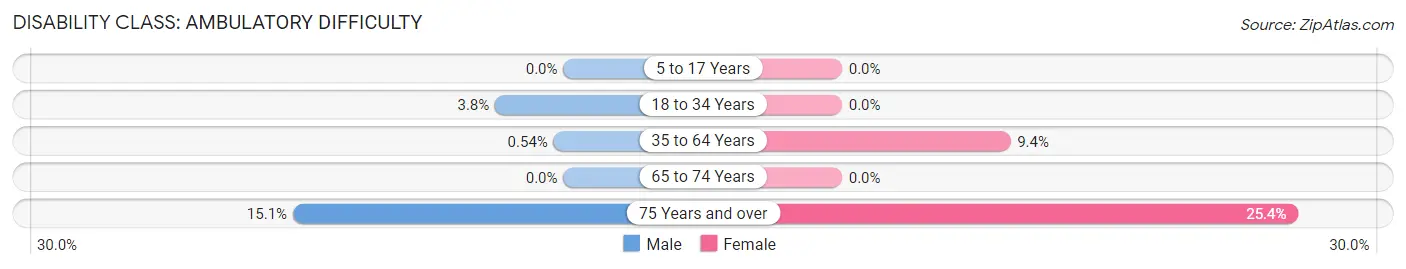
| Age Bracket | Male | Female |
| 5 to 17 Years | 0 (0.0%) | 0 (0.0%) |
| 18 to 34 Years | 23 (3.8%) | 0 (0.0%) |
| 35 to 64 Years | 6 (0.5%) | 123 (9.4%) |
| 65 to 74 Years | 0 (0.0%) | 0 (0.0%) |
| 75 Years and over | 25 (15.1%) | 61 (25.4%) |
Disability Class: Self-Care Difficulty
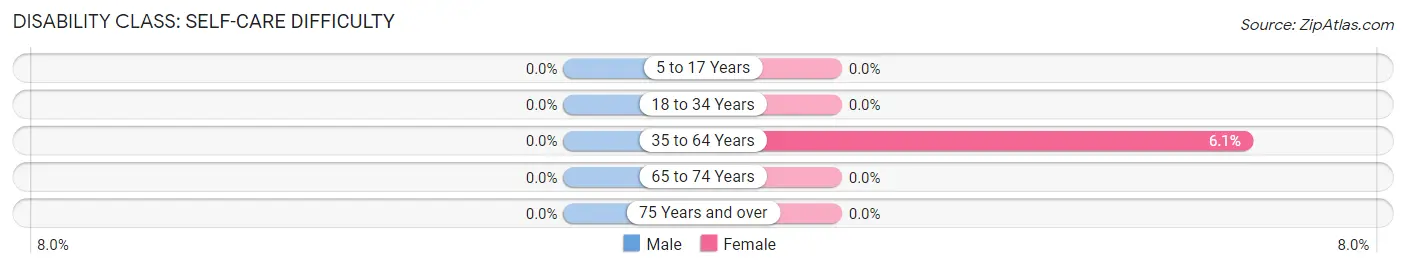
| Age Bracket | Male | Female |
| 5 to 17 Years | 0 (0.0%) | 0 (0.0%) |
| 18 to 34 Years | 0 (0.0%) | 0 (0.0%) |
| 35 to 64 Years | 0 (0.0%) | 80 (6.1%) |
| 65 to 74 Years | 0 (0.0%) | 0 (0.0%) |
| 75 Years and over | 0 (0.0%) | 0 (0.0%) |
Technology Access in Stewartville
Computing Device Access in Stewartville
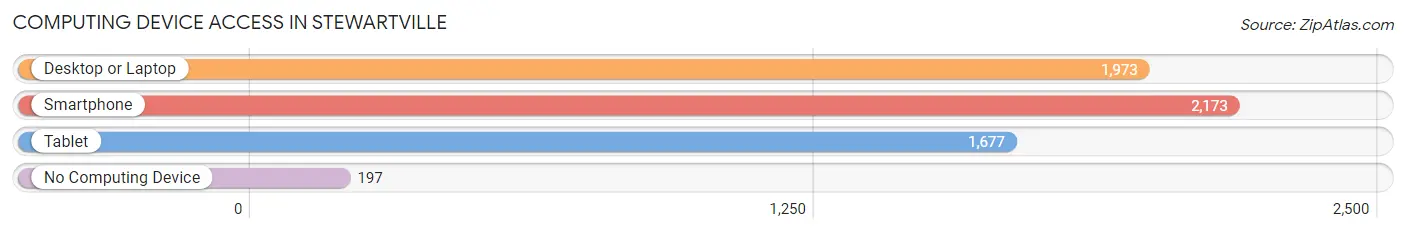
| Device Type | # Households | % Households |
| Desktop or Laptop | 1,973 | 78.4% |
| Smartphone | 2,173 | 86.4% |
| Tablet | 1,677 | 66.7% |
| No Computing Device | 197 | 7.8% |
| Total | 2,515 | 100.0% |
Internet Access in Stewartville
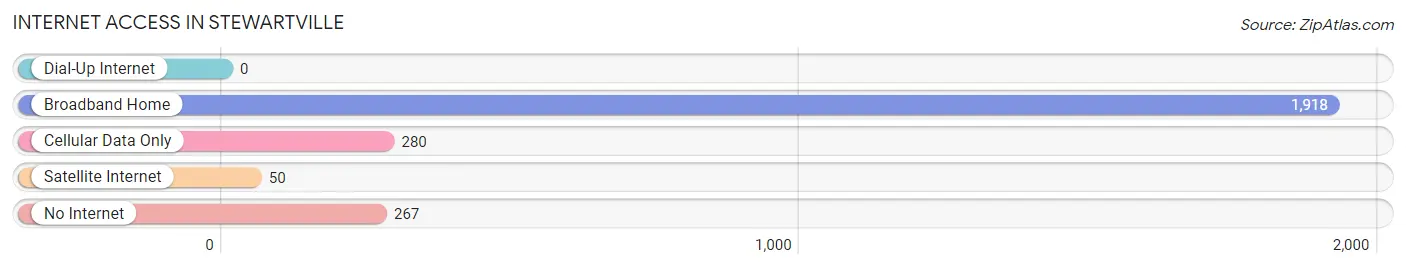
| Internet Type | # Households | % Households |
| Dial-Up Internet | 0 | 0.0% |
| Broadband Home | 1,918 | 76.3% |
| Cellular Data Only | 280 | 11.1% |
| Satellite Internet | 50 | 2.0% |
| No Internet | 267 | 10.6% |
| Total | 2,515 | 100.0% |
Stewartville Summary
Stewartville, Minnesota is a small city located in Olmsted County, in the southeastern part of the state. It is situated on the banks of the Root River, and is part of the Rochester Metropolitan Statistical Area. The city has a population of 4,719, according to the 2010 census.
History
The area that is now Stewartville was first settled in 1854 by a group of settlers from New York. The settlement was originally known as Root Prairie, and was later renamed Stewartville after the first postmaster, William Stewart. The city was officially incorporated in 1876.
In the late 19th century, Stewartville was a thriving agricultural community, with a variety of crops being grown in the area. The city was also home to a number of businesses, including a flour mill, a creamery, and a brickyard.
In the early 20th century, Stewartville experienced a period of growth and development. The city was connected to the rest of the state by the Chicago, Milwaukee, St. Paul and Pacific Railroad, and the population increased from 1,000 in 1900 to 2,000 in 1920.
Geography
Stewartville is located in southeastern Minnesota, in Olmsted County. It is situated on the banks of the Root River, and is part of the Rochester Metropolitan Statistical Area. The city has a total area of 2.3 square miles, all of which is land.
The city is located in a hilly region, with the highest point being the summit of Stewartville Hill, which is located in the northern part of the city. The city is also home to a number of parks and recreational areas, including Stewartville Park, which features a playground, picnic area, and walking trails.
Economy
The economy of Stewartville is largely based on agriculture and manufacturing. The city is home to a number of agricultural businesses, including a dairy farm, a feed mill, and a grain elevator. The city is also home to a number of manufacturing businesses, including a plastics manufacturer, a metal fabricator, and a printing company.
The city is also home to a number of retail businesses, including a grocery store, a hardware store, and a variety of restaurants. The city is also home to a number of service businesses, including a bank, a post office, and a number of medical and dental offices.
Demographics
According to the 2010 census, the population of Stewartville was 4,719. The racial makeup of the city was 97.2% White, 0.7% African American, 0.3% Native American, 0.4% Asian, 0.1% Pacific Islander, 0.3% from other races, and 1.0% from two or more races. Hispanic or Latino of any race were 1.3% of the population.
The median household income in Stewartville was $50,945, and the median family income was $60,917. The per capita income for the city was $23,845. About 5.2% of families and 6.7% of the population were below the poverty line, including 8.2% of those under age 18 and 5.3% of those age 65 or over.
Common Questions
What is Per Capita Income in Stewartville?
Per Capita income in Stewartville is $38,893.
What is the Median Family Income in Stewartville?
Median Family Income in Stewartville is $108,750.
What is the Median Household income in Stewartville?
Median Household Income in Stewartville is $92,961.
What is Income or Wage Gap in Stewartville?
Income or Wage Gap in Stewartville is 31.4%.
Women in Stewartville earn 68.6 cents for every dollar earned by a man.
What is Inequality or Gini Index in Stewartville?
Inequality or Gini Index in Stewartville is 0.39.
What is the Total Population of Stewartville?
Total Population of Stewartville is 6,684.
What is the Total Male Population of Stewartville?
Total Male Population of Stewartville is 2,946.
What is the Total Female Population of Stewartville?
Total Female Population of Stewartville is 3,738.
What is the Ratio of Males per 100 Females in Stewartville?
There are 78.81 Males per 100 Females in Stewartville.
What is the Ratio of Females per 100 Males in Stewartville?
There are 126.88 Females per 100 Males in Stewartville.
What is the Median Population Age in Stewartville?
Median Population Age in Stewartville is 33.9 Years.
What is the Average Family Size in Stewartville
Average Family Size in Stewartville is 3.1 People.
What is the Average Household Size in Stewartville
Average Household Size in Stewartville is 2.6 People.
How Large is the Labor Force in Stewartville?
There are 3,531 People in the Labor Forcein in Stewartville.
What is the Percentage of People in the Labor Force in Stewartville?
72.3% of People are in the Labor Force in Stewartville.
What is the Unemployment Rate in Stewartville?
Unemployment Rate in Stewartville is 1.2%.