Lewiston, MN Map & Demographics
Lewiston Map
Lewiston Overview
$36,250
PER CAPITA INCOME
$103,264
AVG FAMILY INCOME
$89,219
AVG HOUSEHOLD INCOME
24.7%
WAGE / INCOME GAP [ % ]
75.3¢/ $1
WAGE / INCOME GAP [ $ ]
0.39
INEQUALITY / GINI INDEX
1,768
TOTAL POPULATION
957
MALE POPULATION
811
FEMALE POPULATION
118.00
MALES / 100 FEMALES
84.74
FEMALES / 100 MALES
35.7
MEDIAN AGE
3.5
AVG FAMILY SIZE
3.0
AVG HOUSEHOLD SIZE
1,018
LABOR FORCE [ PEOPLE ]
73.8%
PERCENT IN LABOR FORCE
3.6%
UNEMPLOYMENT RATE
Lewiston Zip Codes
Lewiston Area Codes
Income in Lewiston
Income Overview in Lewiston
Per Capita Income in Lewiston is $36,250, while median incomes of families and households are $103,264 and $89,219 respectively.
| Characteristic | Number | Measure |
| Per Capita Income | 1,768 | $36,250 |
| Median Family Income | 426 | $103,264 |
| Mean Family Income | 426 | $111,722 |
| Median Household Income | 579 | $89,219 |
| Mean Household Income | 579 | $99,969 |
| Income Deficit | 426 | $0 |
| Wage / Income Gap (%) | 1,768 | 24.72% |
| Wage / Income Gap ($) | 1,768 | 75.28¢ per $1 |
| Gini / Inequality Index | 1,768 | 0.39 |
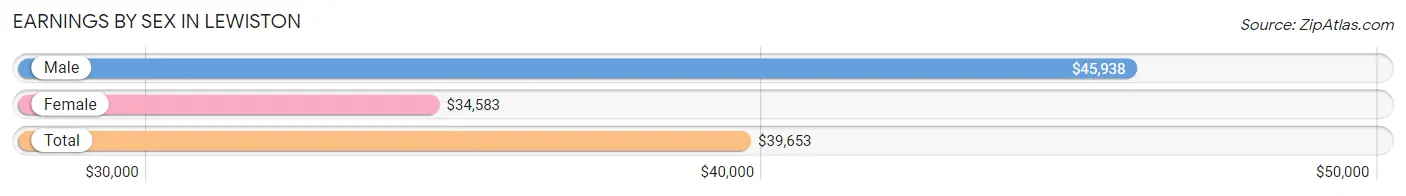
Earnings by Sex in Lewiston
Average Earnings in Lewiston are $39,653, $45,938 for men and $34,583 for women, a difference of 24.7%.
| Sex | Number | Average Earnings |
| Male | 645 (59.3%) | $45,938 |
| Female | 442 (40.7%) | $34,583 |
| Total | 1,087 (100.0%) | $39,653 |
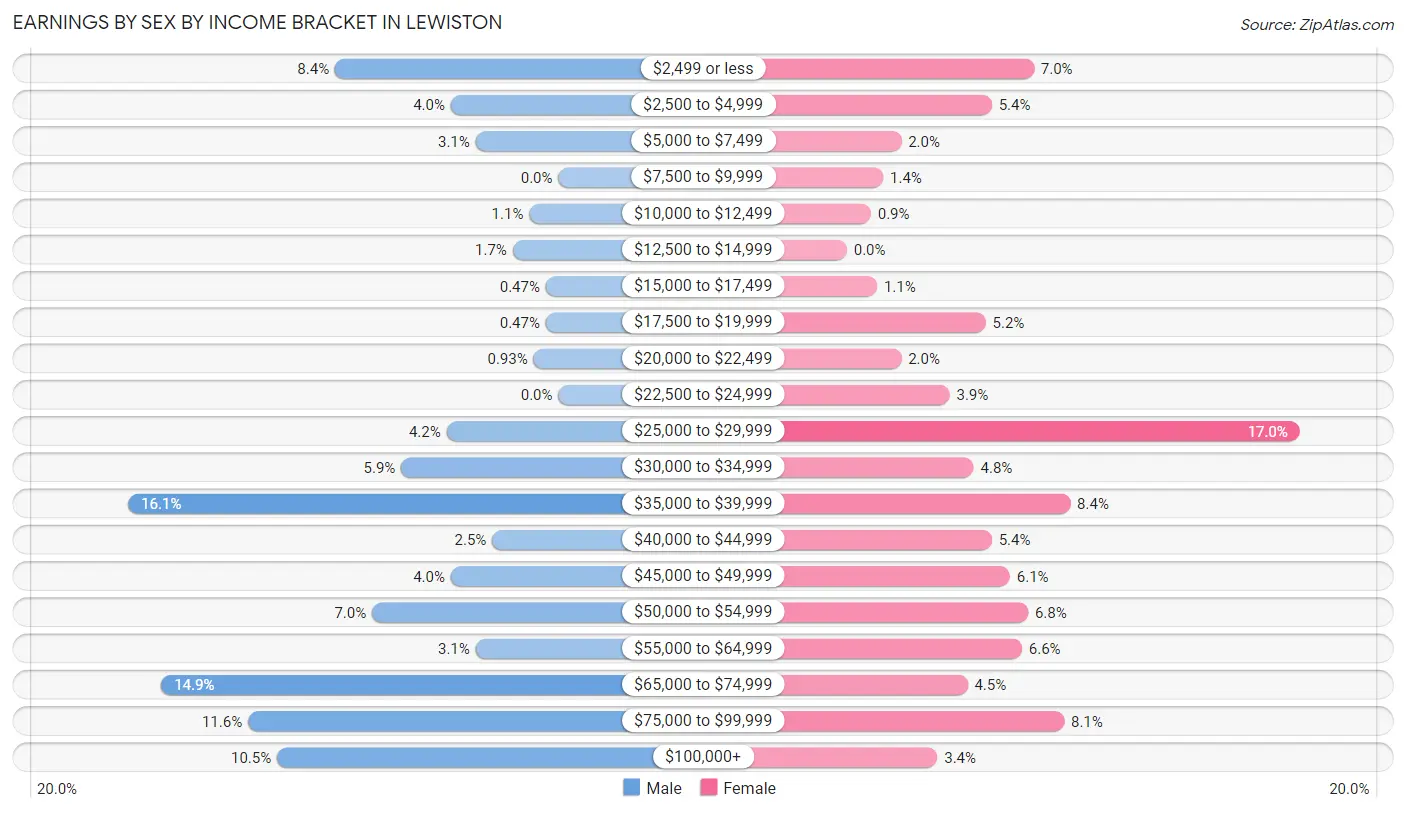
Earnings by Sex by Income Bracket in Lewiston
The most common earnings brackets in Lewiston are $35,000 to $39,999 for men (104 | 16.1%) and $25,000 to $29,999 for women (75 | 17.0%).
| Income | Male | Female |
| $2,499 or less | 54 (8.4%) | 31 (7.0%) |
| $2,500 to $4,999 | 26 (4.0%) | 24 (5.4%) |
| $5,000 to $7,499 | 20 (3.1%) | 9 (2.0%) |
| $7,500 to $9,999 | 0 (0.0%) | 6 (1.4%) |
| $10,000 to $12,499 | 7 (1.1%) | 4 (0.9%) |
| $12,500 to $14,999 | 11 (1.7%) | 0 (0.0%) |
| $15,000 to $17,499 | 3 (0.5%) | 5 (1.1%) |
| $17,500 to $19,999 | 3 (0.5%) | 23 (5.2%) |
| $20,000 to $22,499 | 6 (0.9%) | 9 (2.0%) |
| $22,500 to $24,999 | 0 (0.0%) | 17 (3.8%) |
| $25,000 to $29,999 | 27 (4.2%) | 75 (17.0%) |
| $30,000 to $34,999 | 38 (5.9%) | 21 (4.8%) |
| $35,000 to $39,999 | 104 (16.1%) | 37 (8.4%) |
| $40,000 to $44,999 | 16 (2.5%) | 24 (5.4%) |
| $45,000 to $49,999 | 26 (4.0%) | 27 (6.1%) |
| $50,000 to $54,999 | 45 (7.0%) | 30 (6.8%) |
| $55,000 to $64,999 | 20 (3.1%) | 29 (6.6%) |
| $65,000 to $74,999 | 96 (14.9%) | 20 (4.5%) |
| $75,000 to $99,999 | 75 (11.6%) | 36 (8.1%) |
| $100,000+ | 68 (10.5%) | 15 (3.4%) |
| Total | 645 (100.0%) | 442 (100.0%) |
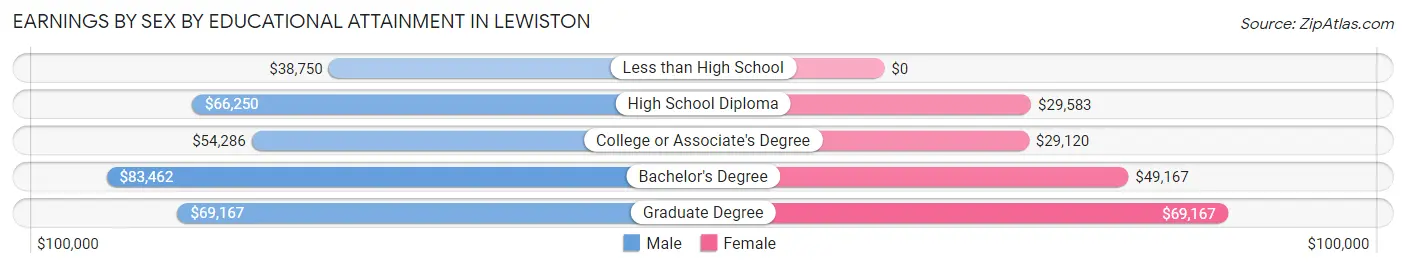
Earnings by Sex by Educational Attainment in Lewiston
Average earnings in Lewiston are $58,125 for men and $38,859 for women, a difference of 33.2%. Men with an educational attainment of bachelor's degree enjoy the highest average annual earnings of $83,462, while those with less than high school education earn the least with $38,750. Women with an educational attainment of graduate degree earn the most with the average annual earnings of $69,167, while those with college or associate's degree education have the smallest earnings of $29,120.
| Educational Attainment | Male Income | Female Income |
| Less than High School | $38,750 | $0 |
| High School Diploma | $66,250 | $29,583 |
| College or Associate's Degree | $54,286 | $29,120 |
| Bachelor's Degree | $83,462 | $49,167 |
| Graduate Degree | $69,167 | $69,167 |
| Total | $58,125 | $38,859 |
Family Income in Lewiston
Family Income Brackets in Lewiston
According to the Lewiston family income data, there are 143 families falling into the $100,000 to $149,999 income range, which is the most common income bracket and makes up 33.6% of all families.
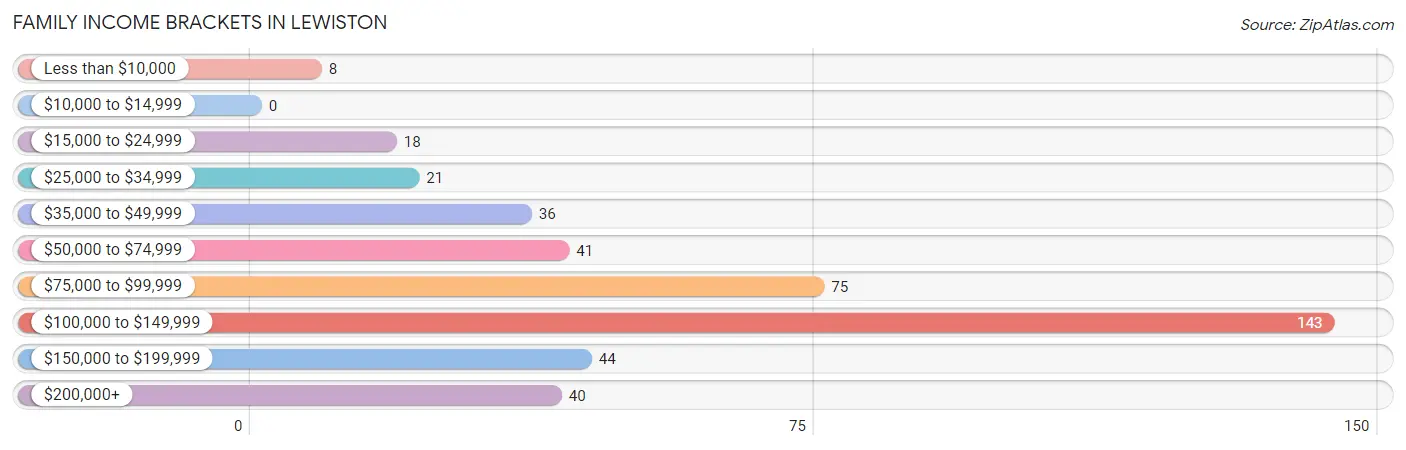
| Income Bracket | # Families | % Families |
| Less than $10,000 | 8 | 1.9% |
| $10,000 to $14,999 | 0 | 0.0% |
| $15,000 to $24,999 | 18 | 4.2% |
| $25,000 to $34,999 | 21 | 4.9% |
| $35,000 to $49,999 | 36 | 8.5% |
| $50,000 to $74,999 | 41 | 9.6% |
| $75,000 to $99,999 | 75 | 17.6% |
| $100,000 to $149,999 | 143 | 33.6% |
| $150,000 to $199,999 | 44 | 10.3% |
| $200,000+ | 40 | 9.4% |
Family Income by Famaliy Size in Lewiston
4-person families (102 | 23.9%) account for the highest median family income in Lewiston with $124,375 per family, while 2-person families (186 | 43.7%) have the highest median income of $44,375 per family member.
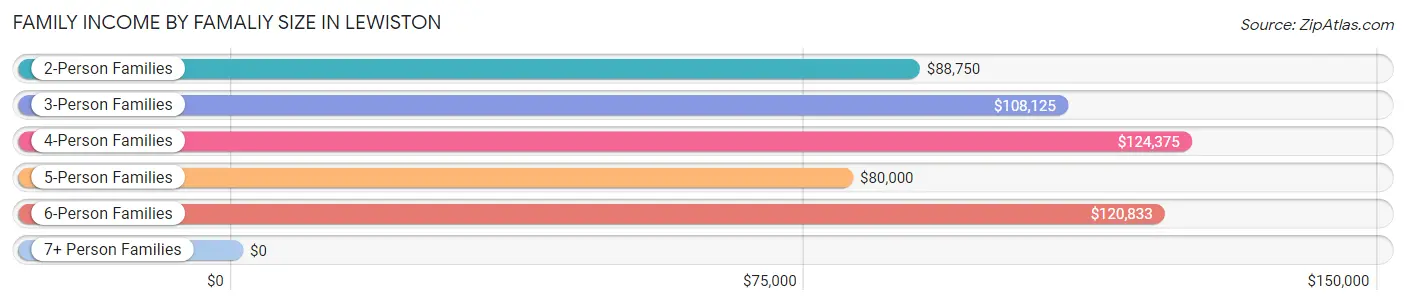
| Income Bracket | # Families | Median Income |
| 2-Person Families | 186 (43.7%) | $88,750 |
| 3-Person Families | 76 (17.8%) | $108,125 |
| 4-Person Families | 102 (23.9%) | $124,375 |
| 5-Person Families | 50 (11.7%) | $80,000 |
| 6-Person Families | 12 (2.8%) | $120,833 |
| 7+ Person Families | 0 (0.0%) | $0 |
| Total | 426 (100.0%) | $103,264 |
Family Income by Number of Earners in Lewiston
The median family income in Lewiston is $103,264, with families comprising 3+ earners (90) having the highest median family income of $175,250, while families with 1 earner (70) have the lowest median family income of $44,167, accounting for 21.1% and 16.4% of families, respectively.
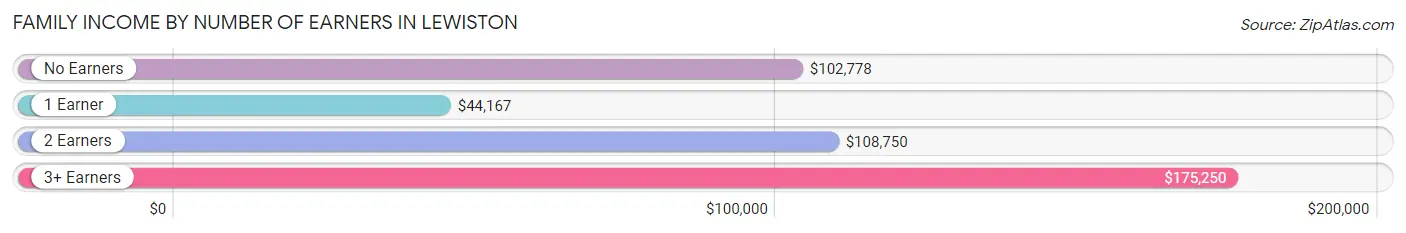
| Number of Earners | # Families | Median Income |
| No Earners | 70 (16.4%) | $102,778 |
| 1 Earner | 70 (16.4%) | $44,167 |
| 2 Earners | 196 (46.0%) | $108,750 |
| 3+ Earners | 90 (21.1%) | $175,250 |
| Total | 426 (100.0%) | $103,264 |
Household Income in Lewiston
Household Income Brackets in Lewiston
With 164 households falling in the category, the $100,000 to $149,999 income range is the most frequent in Lewiston, accounting for 28.3% of all households. In contrast, only 14 households (2.4%) fall into the $10,000 to $14,999 income bracket, making it the least populous group.
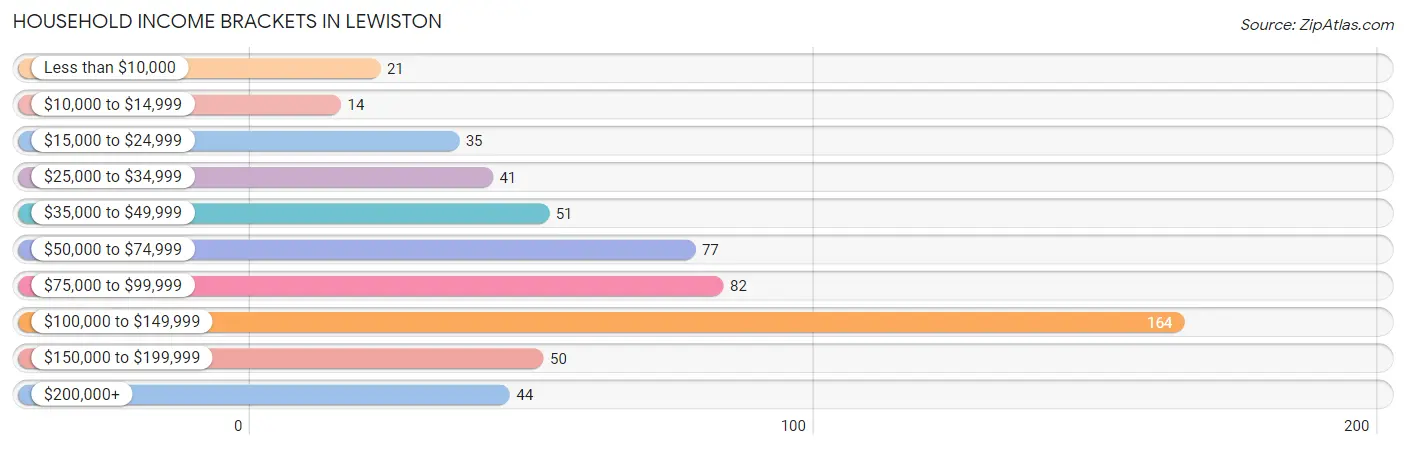
| Income Bracket | # Households | % Households |
| Less than $10,000 | 21 | 3.6% |
| $10,000 to $14,999 | 14 | 2.4% |
| $15,000 to $24,999 | 35 | 6.0% |
| $25,000 to $34,999 | 41 | 7.1% |
| $35,000 to $49,999 | 51 | 8.8% |
| $50,000 to $74,999 | 77 | 13.3% |
| $75,000 to $99,999 | 82 | 14.2% |
| $100,000 to $149,999 | 164 | 28.3% |
| $150,000 to $199,999 | 50 | 8.6% |
| $200,000+ | 44 | 7.6% |
Household Income by Householder Age in Lewiston
The median household income in Lewiston is $89,219, with the highest median household income of $105,625 found in the 45 to 64 years age bracket for the primary householder. A total of 225 households (38.9%) fall into this category. Meanwhile, the 15 to 24 years age bracket for the primary householder has the lowest median household income of $55,577, with 20 households (3.5%) in this group.
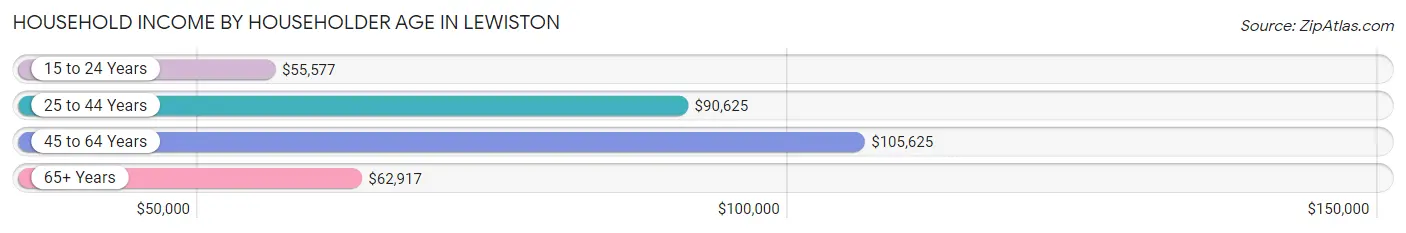
| Income Bracket | # Households | Median Income |
| 15 to 24 Years | 20 (3.5%) | $55,577 |
| 25 to 44 Years | 211 (36.4%) | $90,625 |
| 45 to 64 Years | 225 (38.9%) | $105,625 |
| 65+ Years | 123 (21.2%) | $62,917 |
| Total | 579 (100.0%) | $89,219 |
Poverty in Lewiston
Income Below Poverty by Sex and Age in Lewiston
With 4.3% poverty level for males and 12.0% for females among the residents of Lewiston, 15 year old males and 15 year old females are the most vulnerable to poverty, with 5 males (50.0%) and 4 females (26.7%) in their respective age groups living below the poverty level.
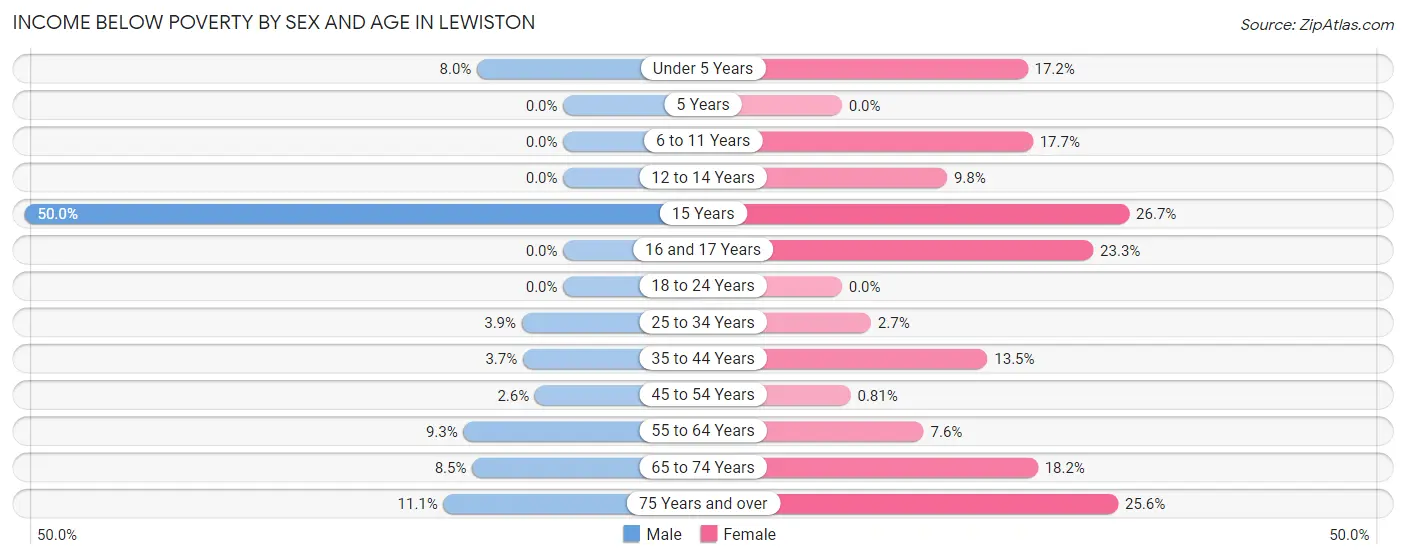
| Age Bracket | Male | Female |
| Under 5 Years | 2 (8.0%) | 10 (17.2%) |
| 5 Years | 0 (0.0%) | 0 (0.0%) |
| 6 to 11 Years | 0 (0.0%) | 14 (17.7%) |
| 12 to 14 Years | 0 (0.0%) | 4 (9.8%) |
| 15 Years | 5 (50.0%) | 4 (26.7%) |
| 16 and 17 Years | 0 (0.0%) | 14 (23.3%) |
| 18 to 24 Years | 0 (0.0%) | 0 (0.0%) |
| 25 to 34 Years | 7 (3.8%) | 2 (2.7%) |
| 35 to 44 Years | 4 (3.7%) | 15 (13.5%) |
| 45 to 54 Years | 3 (2.6%) | 1 (0.8%) |
| 55 to 64 Years | 10 (9.3%) | 6 (7.6%) |
| 65 to 74 Years | 6 (8.5%) | 16 (18.2%) |
| 75 Years and over | 3 (11.1%) | 10 (25.6%) |
| Total | 40 (4.3%) | 96 (12.0%) |
Income Above Poverty by Sex and Age in Lewiston
According to the poverty statistics in Lewiston, males aged 5 years and females aged 5 years are the age groups that are most secure financially, with 100.0% of males and 100.0% of females in these age groups living above the poverty line.
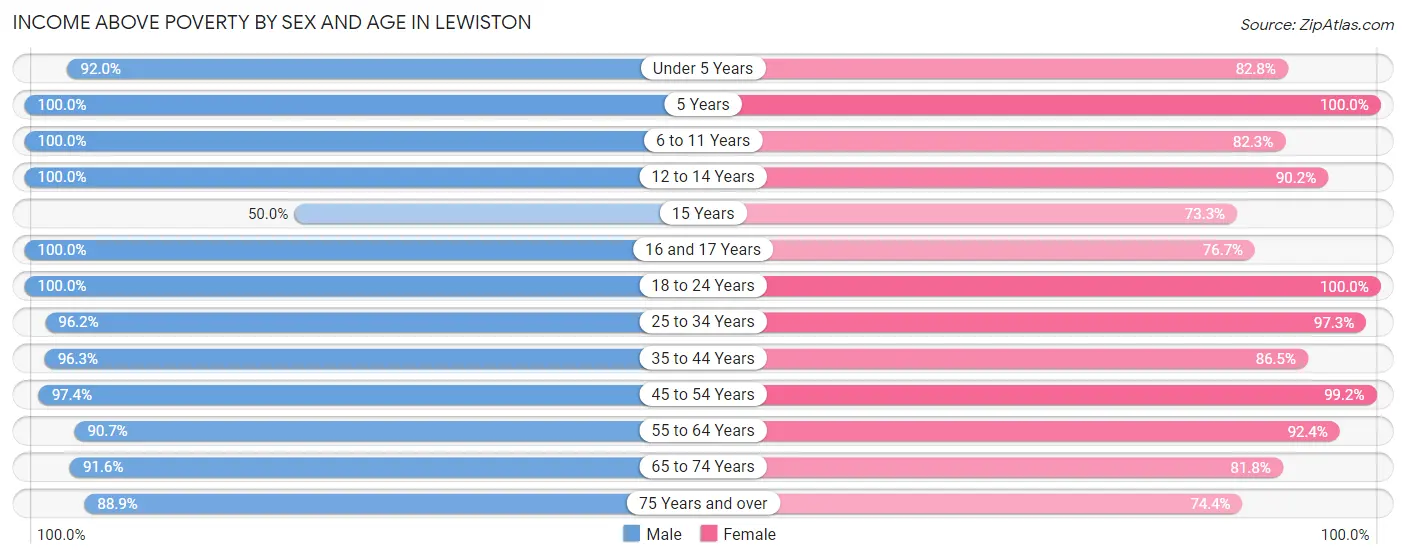
| Age Bracket | Male | Female |
| Under 5 Years | 23 (92.0%) | 48 (82.8%) |
| 5 Years | 9 (100.0%) | 9 (100.0%) |
| 6 to 11 Years | 39 (100.0%) | 65 (82.3%) |
| 12 to 14 Years | 97 (100.0%) | 37 (90.2%) |
| 15 Years | 5 (50.0%) | 11 (73.3%) |
| 16 and 17 Years | 38 (100.0%) | 46 (76.7%) |
| 18 to 24 Years | 102 (100.0%) | 25 (100.0%) |
| 25 to 34 Years | 175 (96.2%) | 72 (97.3%) |
| 35 to 44 Years | 103 (96.3%) | 96 (86.5%) |
| 45 to 54 Years | 111 (97.4%) | 122 (99.2%) |
| 55 to 64 Years | 98 (90.7%) | 73 (92.4%) |
| 65 to 74 Years | 65 (91.5%) | 72 (81.8%) |
| 75 Years and over | 24 (88.9%) | 29 (74.4%) |
| Total | 889 (95.7%) | 705 (88.0%) |
Income Below Poverty Among Married-Couple Families in Lewiston
The poverty statistics for married-couple families in Lewiston show that 2.3% or 8 of the total 351 families live below the poverty line. Families with no children have the highest poverty rate of 4.3%, comprising of 8 families. On the other hand, families with 1 or 2 children have the lowest poverty rate of 0.0%, which includes 0 families.
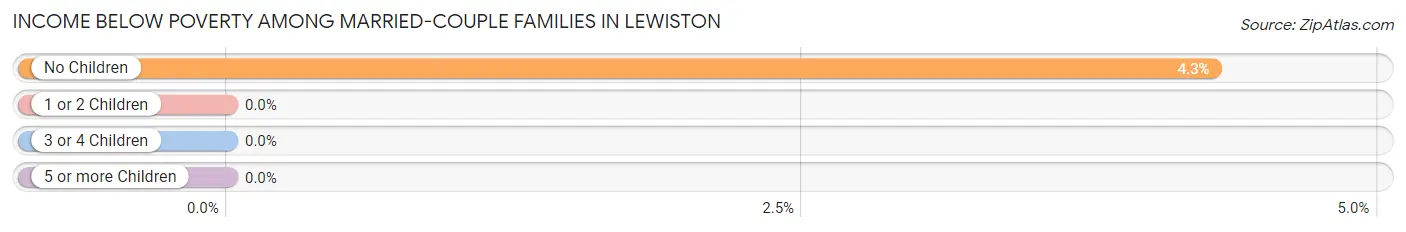
| Children | Above Poverty | Below Poverty |
| No Children | 179 (95.7%) | 8 (4.3%) |
| 1 or 2 Children | 139 (100.0%) | 0 (0.0%) |
| 3 or 4 Children | 25 (100.0%) | 0 (0.0%) |
| 5 or more Children | 0 (0.0%) | 0 (0.0%) |
| Total | 343 (97.7%) | 8 (2.3%) |
Income Below Poverty Among Single-Parent Households in Lewiston
According to the poverty data in Lewiston, 10.0% or 2 single-father households and 32.7% or 18 single-mother households are living below the poverty line. Among single-father households, those with 1 or 2 children have the highest poverty rate, with 2 households (20.0%) experiencing poverty. Likewise, among single-mother households, those with 3 or 4 children have the highest poverty rate, with 15 households (83.3%) falling below the poverty line.
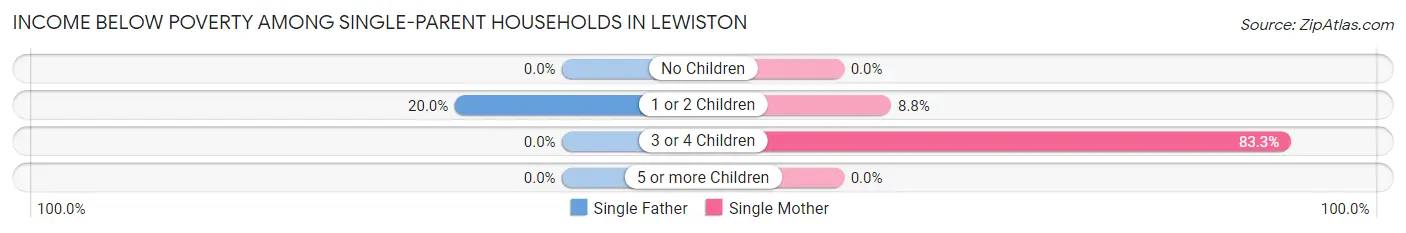
| Children | Single Father | Single Mother |
| No Children | 0 (0.0%) | 0 (0.0%) |
| 1 or 2 Children | 2 (20.0%) | 3 (8.8%) |
| 3 or 4 Children | 0 (0.0%) | 15 (83.3%) |
| 5 or more Children | 0 (0.0%) | 0 (0.0%) |
| Total | 2 (10.0%) | 18 (32.7%) |
Income Below Poverty Among Married-Couple vs Single-Parent Households in Lewiston
The poverty data for Lewiston shows that 8 of the married-couple family households (2.3%) and 20 of the single-parent households (26.7%) are living below the poverty level. Within the married-couple family households, those with no children have the highest poverty rate, with 8 households (4.3%) falling below the poverty line. Among the single-parent households, those with 3 or 4 children have the highest poverty rate, with 15 household (53.6%) living below poverty.
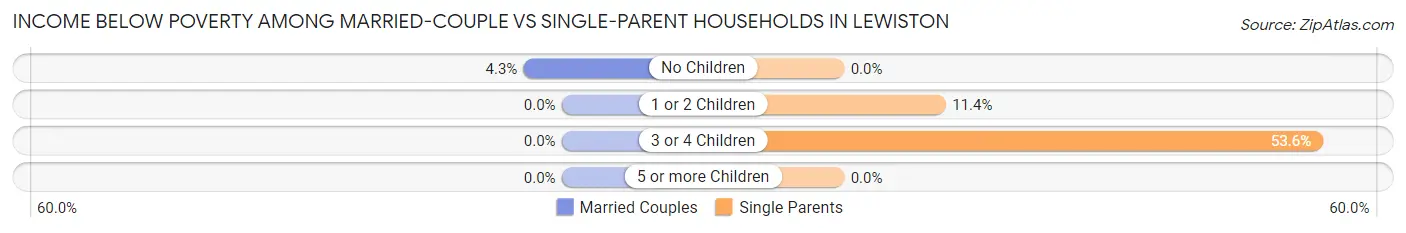
| Children | Married-Couple Families | Single-Parent Households |
| No Children | 8 (4.3%) | 0 (0.0%) |
| 1 or 2 Children | 0 (0.0%) | 5 (11.4%) |
| 3 or 4 Children | 0 (0.0%) | 15 (53.6%) |
| 5 or more Children | 0 (0.0%) | 0 (0.0%) |
| Total | 8 (2.3%) | 20 (26.7%) |
Race in Lewiston
The most populous races in Lewiston are White / Caucasian (1,561 | 88.3%), Hispanic or Latino (160 | 9.0%), and Two or more Races (138 | 7.8%).
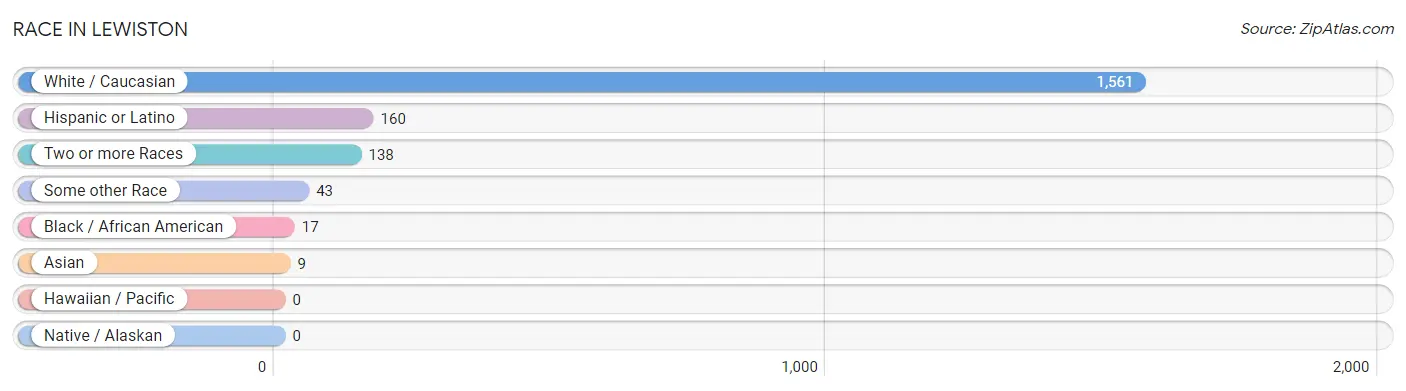
| Race | # Population | % Population |
| Asian | 9 | 0.5% |
| Black / African American | 17 | 1.0% |
| Hawaiian / Pacific | 0 | 0.0% |
| Hispanic or Latino | 160 | 9.0% |
| Native / Alaskan | 0 | 0.0% |
| White / Caucasian | 1,561 | 88.3% |
| Two or more Races | 138 | 7.8% |
| Some other Race | 43 | 2.4% |
| Total | 1,768 | 100.0% |
Ancestry in Lewiston
The most populous ancestries reported in Lewiston are German (843 | 47.7%), Norwegian (293 | 16.6%), Irish (196 | 11.1%), English (147 | 8.3%), and Polish (146 | 8.3%), together accounting for 91.9% of all Lewiston residents.
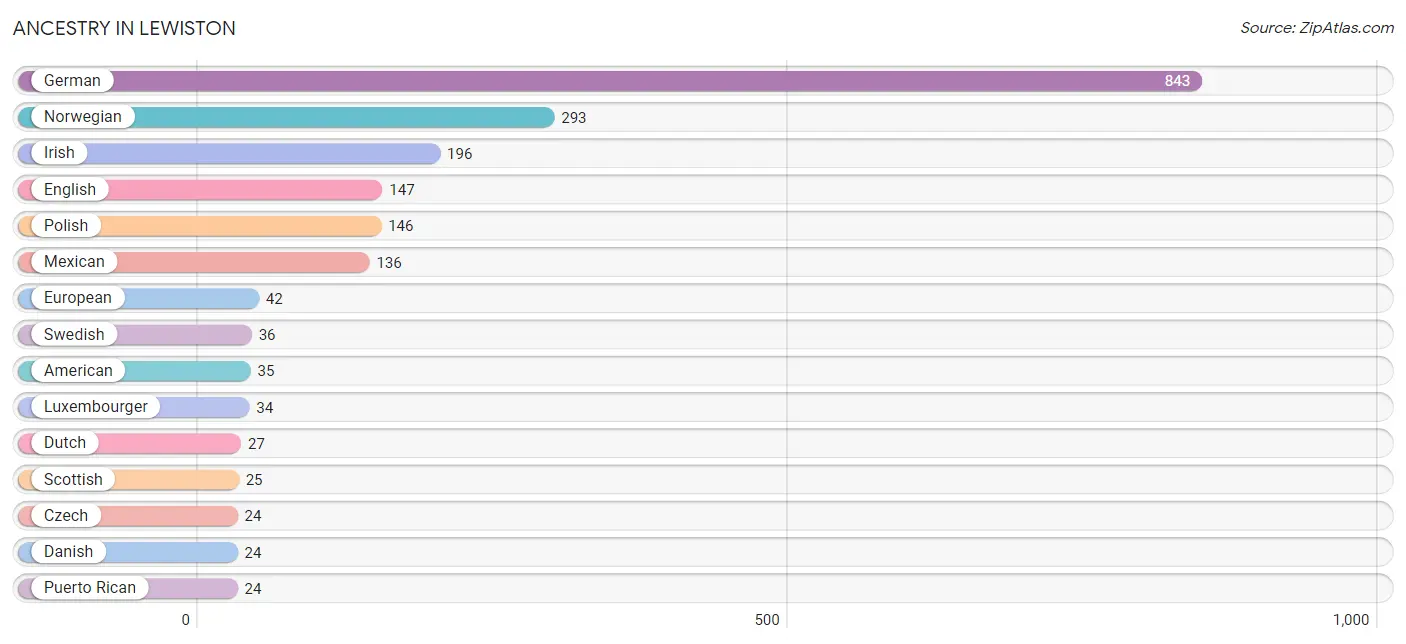
| Ancestry | # Population | % Population |
| American | 35 | 2.0% |
| Armenian | 15 | 0.9% |
| Bhutanese | 19 | 1.1% |
| British | 3 | 0.2% |
| Burmese | 6 | 0.3% |
| Czech | 24 | 1.4% |
| Danish | 24 | 1.4% |
| Dutch | 27 | 1.5% |
| English | 147 | 8.3% |
| European | 42 | 2.4% |
| Finnish | 17 | 1.0% |
| French | 15 | 0.9% |
| French Canadian | 3 | 0.2% |
| German | 843 | 47.7% |
| Indian (Asian) | 7 | 0.4% |
| Irish | 196 | 11.1% |
| Italian | 19 | 1.1% |
| Japanese | 8 | 0.4% |
| Luxembourger | 34 | 1.9% |
| Mexican | 136 | 7.7% |
| Norwegian | 293 | 16.6% |
| Pakistani | 8 | 0.4% |
| Polish | 146 | 8.3% |
| Puerto Rican | 24 | 1.4% |
| Scandinavian | 14 | 0.8% |
| Scotch-Irish | 6 | 0.3% |
| Scottish | 25 | 1.4% |
| Swedish | 36 | 2.0% |
| Swiss | 7 | 0.4% | View All 29 Rows |
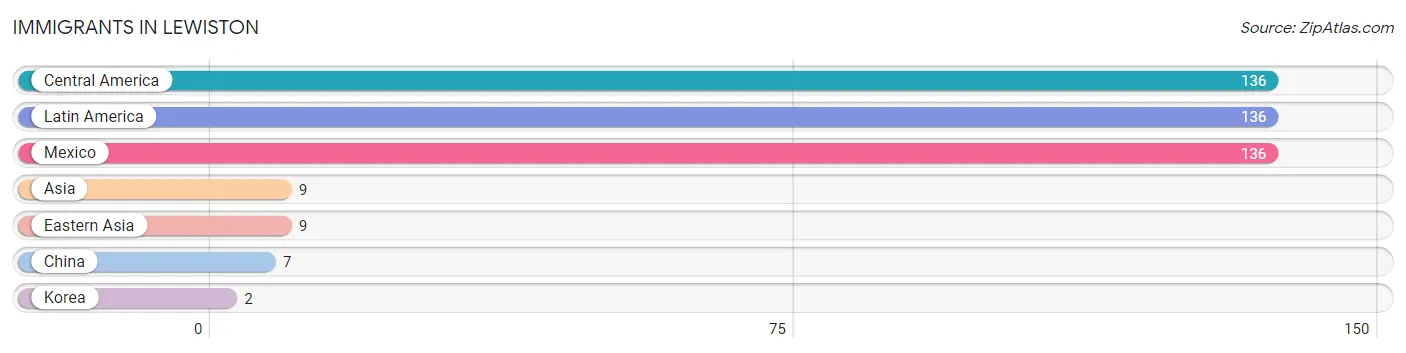
Immigrants in Lewiston
The most numerous immigrant groups reported in Lewiston came from Central America (136 | 7.7%), Latin America (136 | 7.7%), Mexico (136 | 7.7%), Asia (9 | 0.5%), and Eastern Asia (9 | 0.5%), together accounting for 24.1% of all Lewiston residents.
| Immigration Origin | # Population | % Population |
| Asia | 9 | 0.5% |
| Central America | 136 | 7.7% |
| China | 7 | 0.4% |
| Eastern Asia | 9 | 0.5% |
| Korea | 2 | 0.1% |
| Latin America | 136 | 7.7% |
| Mexico | 136 | 7.7% | View All 7 Rows |
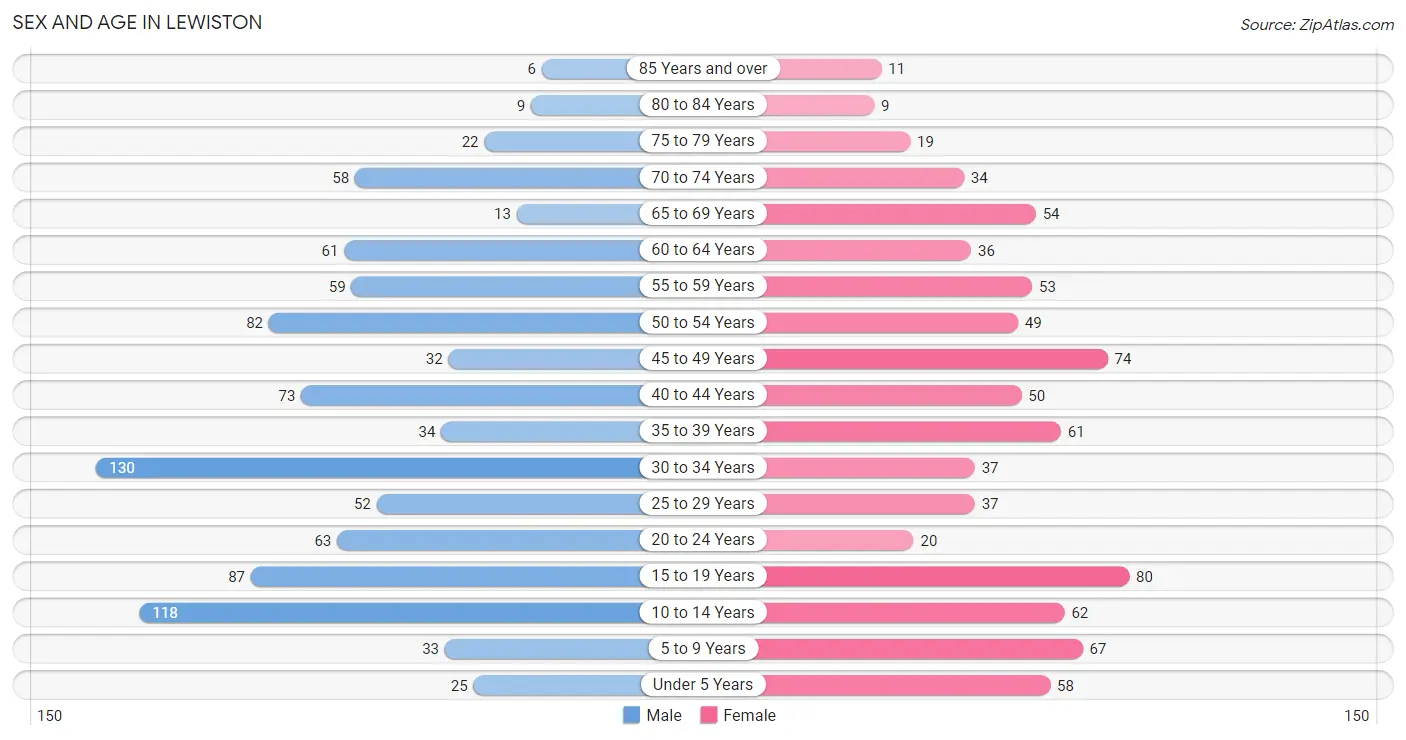
Sex and Age in Lewiston
Sex and Age in Lewiston
The most populous age groups in Lewiston are 30 to 34 Years (130 | 13.6%) for men and 15 to 19 Years (80 | 9.9%) for women.
| Age Bracket | Male | Female |
| Under 5 Years | 25 (2.6%) | 58 (7.1%) |
| 5 to 9 Years | 33 (3.5%) | 67 (8.3%) |
| 10 to 14 Years | 118 (12.3%) | 62 (7.6%) |
| 15 to 19 Years | 87 (9.1%) | 80 (9.9%) |
| 20 to 24 Years | 63 (6.6%) | 20 (2.5%) |
| 25 to 29 Years | 52 (5.4%) | 37 (4.6%) |
| 30 to 34 Years | 130 (13.6%) | 37 (4.6%) |
| 35 to 39 Years | 34 (3.5%) | 61 (7.5%) |
| 40 to 44 Years | 73 (7.6%) | 50 (6.2%) |
| 45 to 49 Years | 32 (3.3%) | 74 (9.1%) |
| 50 to 54 Years | 82 (8.6%) | 49 (6.0%) |
| 55 to 59 Years | 59 (6.2%) | 53 (6.5%) |
| 60 to 64 Years | 61 (6.4%) | 36 (4.4%) |
| 65 to 69 Years | 13 (1.4%) | 54 (6.7%) |
| 70 to 74 Years | 58 (6.1%) | 34 (4.2%) |
| 75 to 79 Years | 22 (2.3%) | 19 (2.3%) |
| 80 to 84 Years | 9 (0.9%) | 9 (1.1%) |
| 85 Years and over | 6 (0.6%) | 11 (1.4%) |
| Total | 957 (100.0%) | 811 (100.0%) |
Families and Households in Lewiston
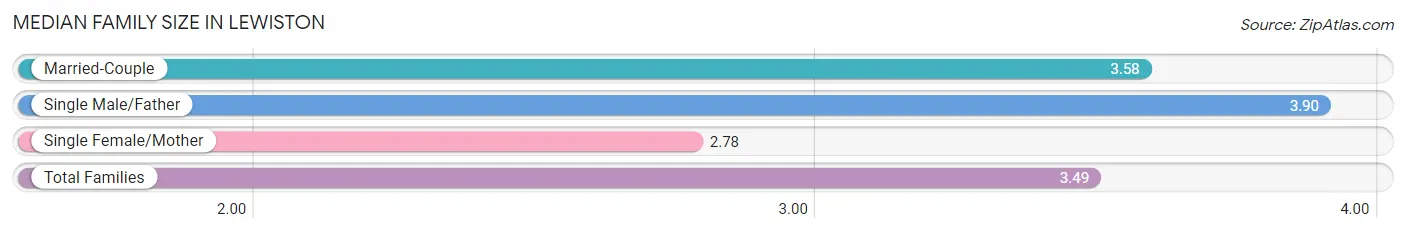
Median Family Size in Lewiston
The median family size in Lewiston is 3.49 persons per family, with single male/father families (20 | 4.7%) accounting for the largest median family size of 3.9 persons per family. On the other hand, single female/mother families (55 | 12.9%) represent the smallest median family size with 2.78 persons per family.
| Family Type | # Families | Family Size |
| Married-Couple | 351 (82.4%) | 3.58 |
| Single Male/Father | 20 (4.7%) | 3.90 |
| Single Female/Mother | 55 (12.9%) | 2.78 |
| Total Families | 426 (100.0%) | 3.49 |
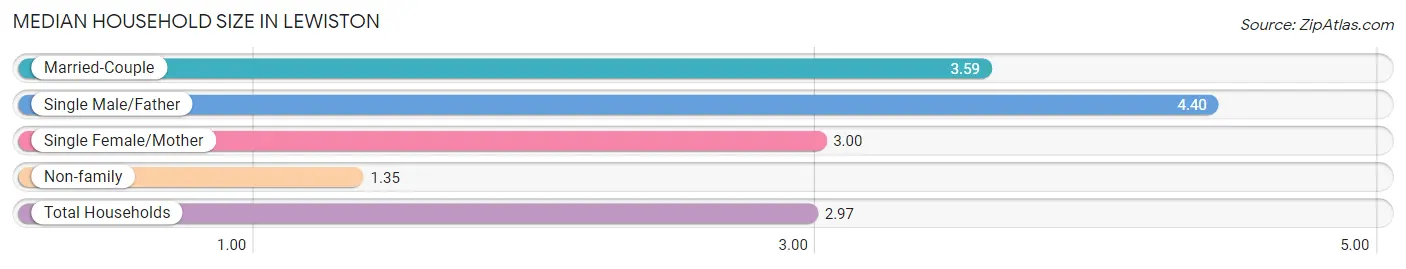
Median Household Size in Lewiston
The median household size in Lewiston is 2.97 persons per household, with single male/father households (20 | 3.5%) accounting for the largest median household size of 4.4 persons per household. non-family households (153 | 26.4%) represent the smallest median household size with 1.35 persons per household.
| Household Type | # Households | Household Size |
| Married-Couple | 351 (60.6%) | 3.59 |
| Single Male/Father | 20 (3.5%) | 4.40 |
| Single Female/Mother | 55 (9.5%) | 3.00 |
| Non-family | 153 (26.4%) | 1.35 |
| Total Households | 579 (100.0%) | 2.97 |
Household Size by Marriage Status in Lewiston
Out of a total of 579 households in Lewiston, 426 (73.6%) are family households, while 153 (26.4%) are nonfamily households. The most numerous type of family households are 2-person households, comprising 176, and the most common type of nonfamily households are 1-person households, comprising 114.
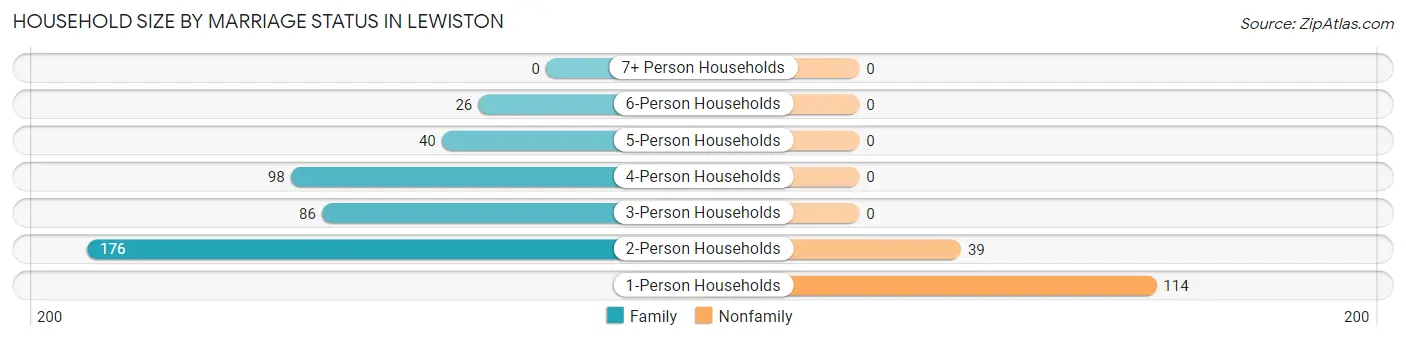
| Household Size | Family Households | Nonfamily Households |
| 1-Person Households | - | 114 (19.7%) |
| 2-Person Households | 176 (30.4%) | 39 (6.7%) |
| 3-Person Households | 86 (14.8%) | 0 (0.0%) |
| 4-Person Households | 98 (16.9%) | 0 (0.0%) |
| 5-Person Households | 40 (6.9%) | 0 (0.0%) |
| 6-Person Households | 26 (4.5%) | 0 (0.0%) |
| 7+ Person Households | 0 (0.0%) | 0 (0.0%) |
| Total | 426 (73.6%) | 153 (26.4%) |
Female Fertility in Lewiston
Fertility by Age in Lewiston
Average fertility rate in Lewiston is 62.0 births per 1,000 women. Women in the age bracket of 20 to 34 years have the highest fertility rate with 191.0 births per 1,000 women. Women in the age bracket of 20 to 34 years acount for 78.3% of all women with births.
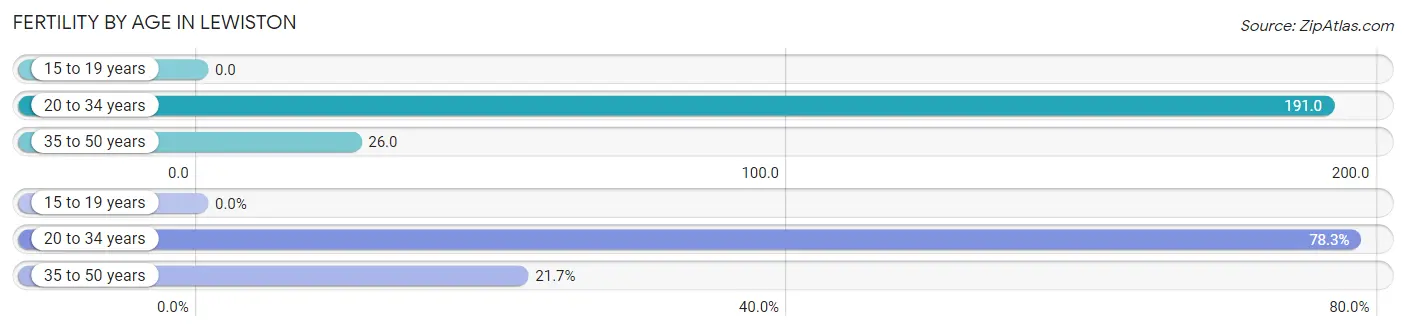
| Age Bracket | Women with Births | Births / 1,000 Women |
| 15 to 19 years | 0 (0.0%) | 0.0 |
| 20 to 34 years | 18 (78.3%) | 191.0 |
| 35 to 50 years | 5 (21.7%) | 26.0 |
| Total | 23 (100.0%) | 62.0 |
Fertility by Age by Marriage Status in Lewiston
56.5% of women with births (23) in Lewiston are married. The highest percentage of unmarried women with births falls into 20 to 34 years age bracket with 55.6% of them unmarried at the time of birth, while the lowest percentage of unmarried women with births belong to 35 to 50 years age bracket with 0.0% of them unmarried.
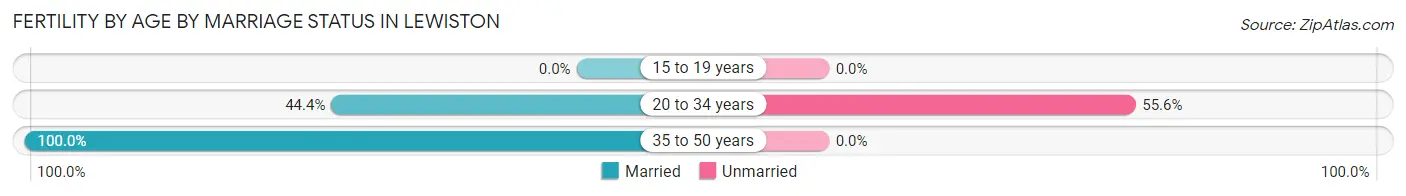
| Age Bracket | Married | Unmarried |
| 15 to 19 years | 0 (0.0%) | 0 (0.0%) |
| 20 to 34 years | 8 (44.4%) | 10 (55.6%) |
| 35 to 50 years | 5 (100.0%) | 0 (0.0%) |
| Total | 13 (56.5%) | 10 (43.5%) |
Fertility by Education in Lewiston
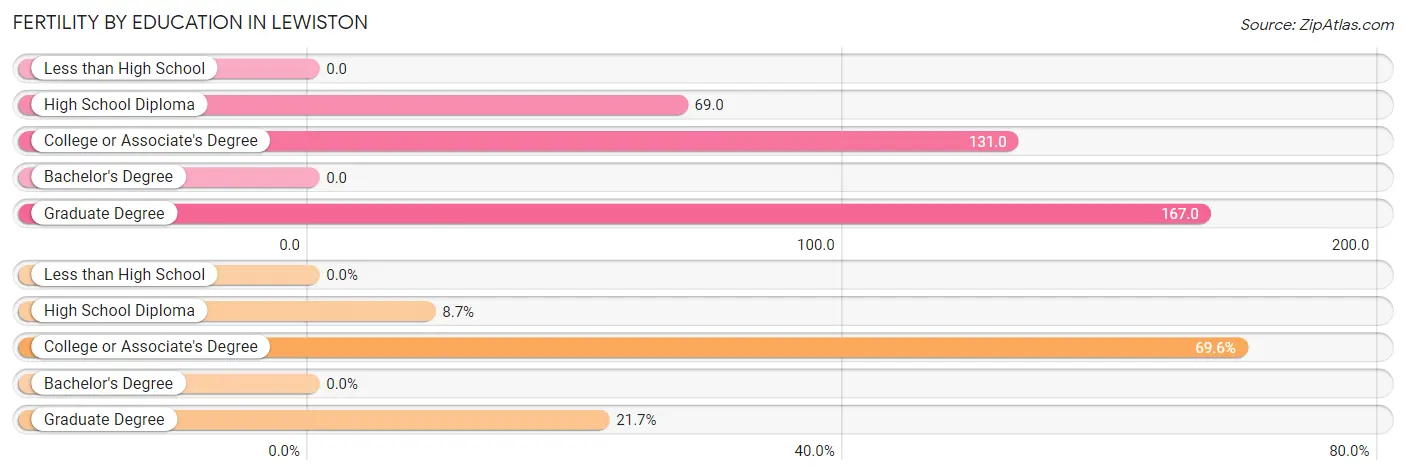
| Educational Attainment | Women with Births | Births / 1,000 Women |
| Less than High School | 0 (0.0%) | 0.0 |
| High School Diploma | 2 (8.7%) | 69.0 |
| College or Associate's Degree | 16 (69.6%) | 131.0 |
| Bachelor's Degree | 0 (0.0%) | 0.0 |
| Graduate Degree | 5 (21.7%) | 167.0 |
| Total | 23 (100.0%) | 62.0 |
Fertility by Education by Marriage Status in Lewiston
43.5% of women with births in Lewiston are unmarried. Women with the educational attainment of high school diploma are most likely to be married with 100.0% of them married at childbirth, while women with the educational attainment of college or associate's degree are least likely to be married with 62.5% of them unmarried at childbirth.
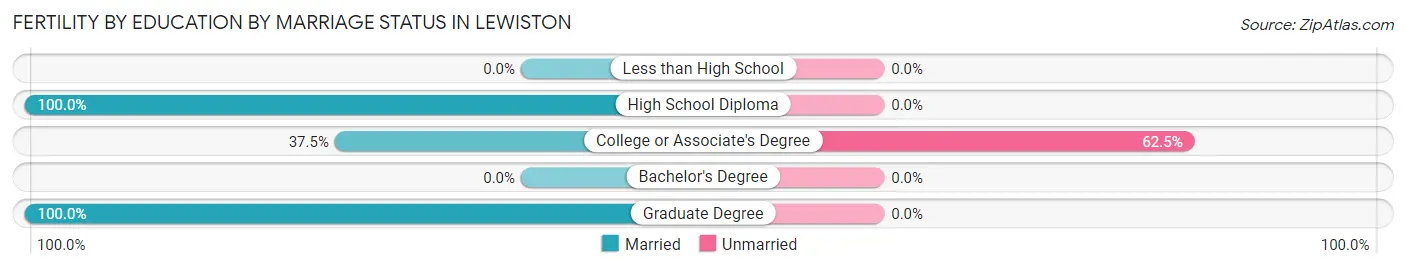
| Educational Attainment | Married | Unmarried |
| Less than High School | 0 (0.0%) | 0 (0.0%) |
| High School Diploma | 2 (100.0%) | 0 (0.0%) |
| College or Associate's Degree | 6 (37.5%) | 10 (62.5%) |
| Bachelor's Degree | 0 (0.0%) | 0 (0.0%) |
| Graduate Degree | 5 (100.0%) | 0 (0.0%) |
| Total | 13 (56.5%) | 10 (43.5%) |
Employment Characteristics in Lewiston
Employment by Class of Employer in Lewiston
Among the 982 employed individuals in Lewiston, private company employees (617 | 62.8%), not-for-profit organizations (144 | 14.7%), and local government employees (72 | 7.3%) make up the most common classes of employment.
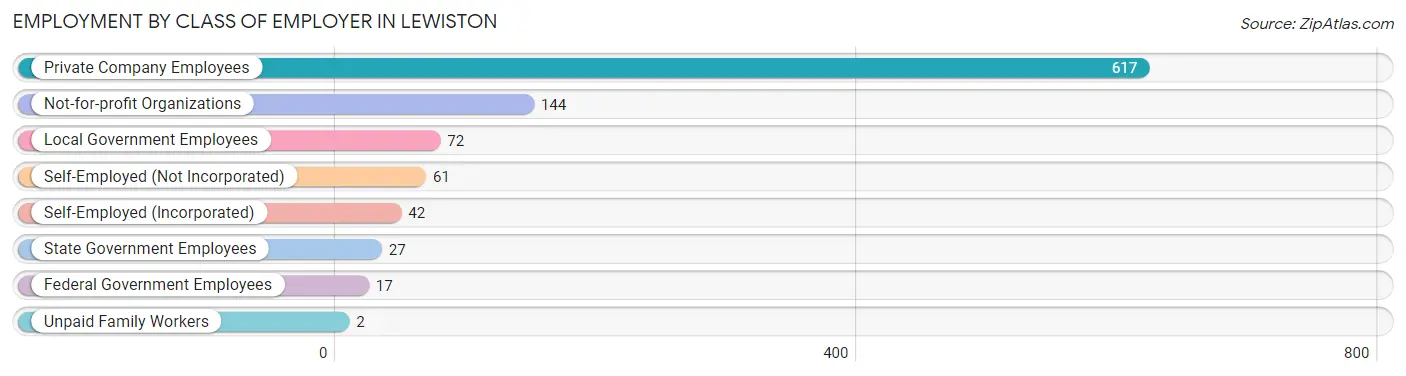
| Employer Class | # Employees | % Employees |
| Private Company Employees | 617 | 62.8% |
| Self-Employed (Incorporated) | 42 | 4.3% |
| Self-Employed (Not Incorporated) | 61 | 6.2% |
| Not-for-profit Organizations | 144 | 14.7% |
| Local Government Employees | 72 | 7.3% |
| State Government Employees | 27 | 2.8% |
| Federal Government Employees | 17 | 1.7% |
| Unpaid Family Workers | 2 | 0.2% |
| Total | 982 | 100.0% |
Employment Status by Age in Lewiston
According to the labor force statistics for Lewiston, out of the total population over 16 years of age (1,380), 73.8% or 1,018 individuals are in the labor force, with 3.6% or 37 of them unemployed. The age group with the highest labor force participation rate is 20 to 24 years, with 100.0% or 83 individuals in the labor force. Within the labor force, the 16 to 19 years age range has the highest percentage of unemployed individuals, with 17.2% or 11 of them being unemployed.
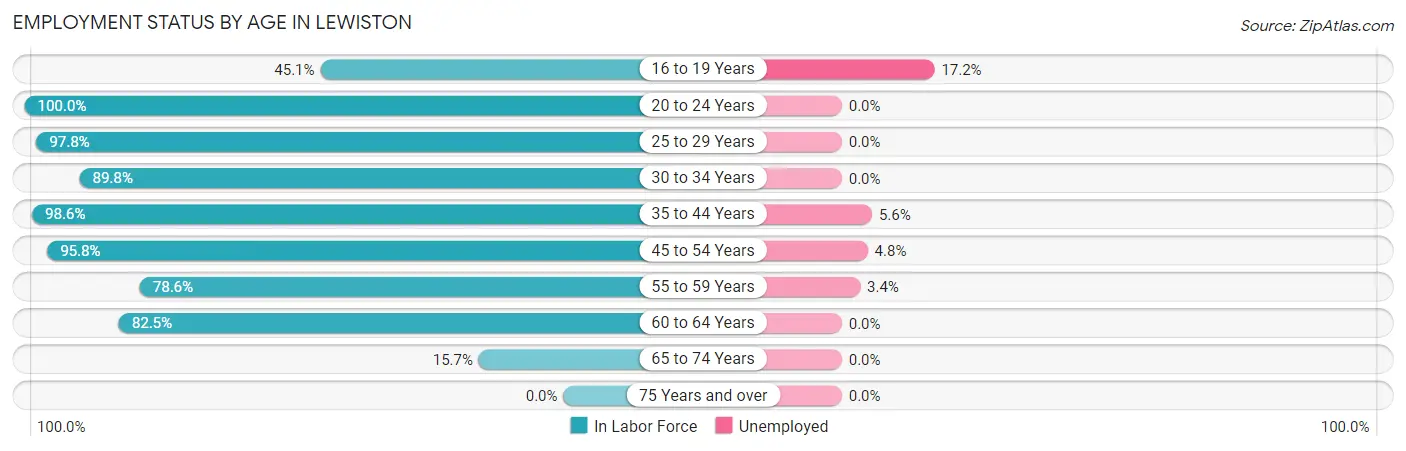
| Age Bracket | In Labor Force | Unemployed |
| 16 to 19 Years | 64 (45.1%) | 11 (17.2%) |
| 20 to 24 Years | 83 (100.0%) | 0 (0.0%) |
| 25 to 29 Years | 87 (97.8%) | 0 (0.0%) |
| 30 to 34 Years | 150 (89.8%) | 0 (0.0%) |
| 35 to 44 Years | 215 (98.6%) | 12 (5.6%) |
| 45 to 54 Years | 227 (95.8%) | 11 (4.8%) |
| 55 to 59 Years | 88 (78.6%) | 3 (3.4%) |
| 60 to 64 Years | 80 (82.5%) | 0 (0.0%) |
| 65 to 74 Years | 25 (15.7%) | 0 (0.0%) |
| 75 Years and over | 0 (0.0%) | 0 (0.0%) |
| Total | 1,018 (73.8%) | 37 (3.6%) |
Employment Status by Educational Attainment in Lewiston
According to labor force statistics for Lewiston, 92.1% of individuals (847) out of the total population between 25 and 64 years of age (920) are in the labor force, with 3.1% or 26 of them being unemployed. The group with the highest labor force participation rate are those with the educational attainment of bachelor's degree or higher, with 98.6% or 273 individuals in the labor force. Within the labor force, individuals with less than high school education have the highest percentage of unemployment, with 9.8% or 12 of them being unemployed.
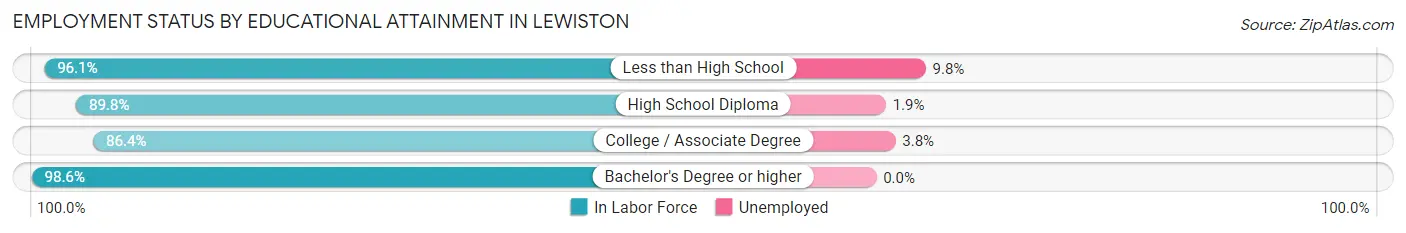
| Educational Attainment | In Labor Force | Unemployed |
| Less than High School | 123 (96.1%) | 13 (9.8%) |
| High School Diploma | 158 (89.8%) | 3 (1.9%) |
| College / Associate Degree | 293 (86.4%) | 13 (3.8%) |
| Bachelor's Degree or higher | 273 (98.6%) | 0 (0.0%) |
| Total | 847 (92.1%) | 29 (3.1%) |
Employment Occupations by Sex in Lewiston
Management, Business, Science and Arts Occupations
The most common Management, Business, Science and Arts occupations in Lewiston are Management (98 | 10.0%), Health Diagnosing & Treating (76 | 7.7%), Community & Social Service (75 | 7.6%), Business & Financial (54 | 5.5%), and Education Instruction & Library (43 | 4.4%).
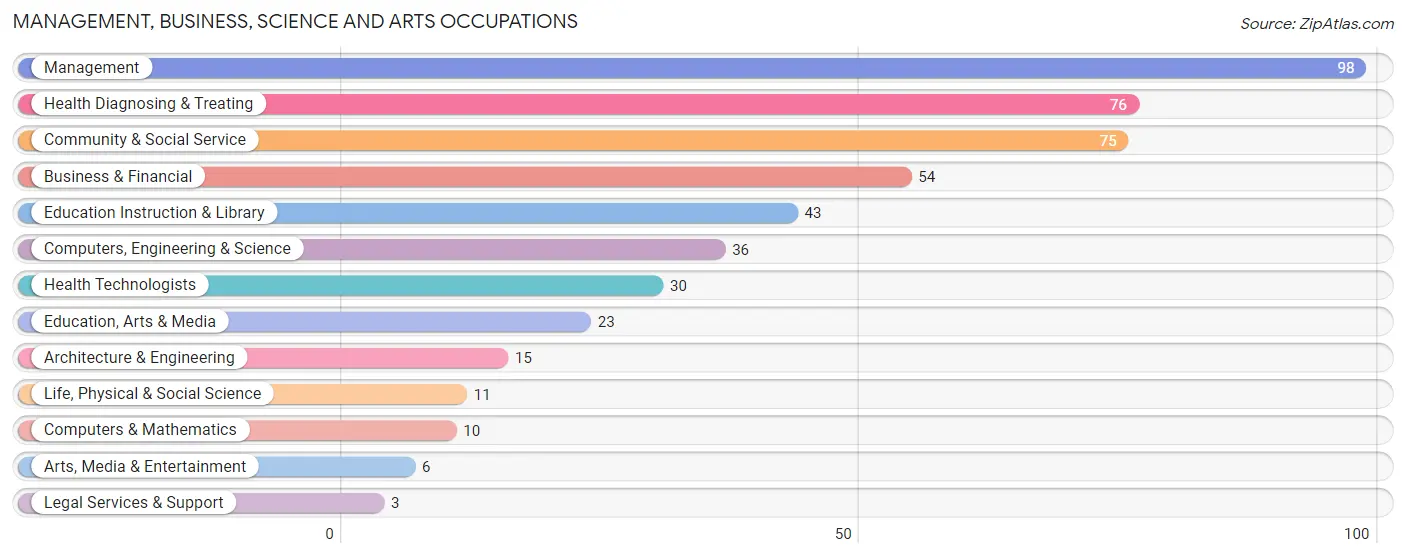
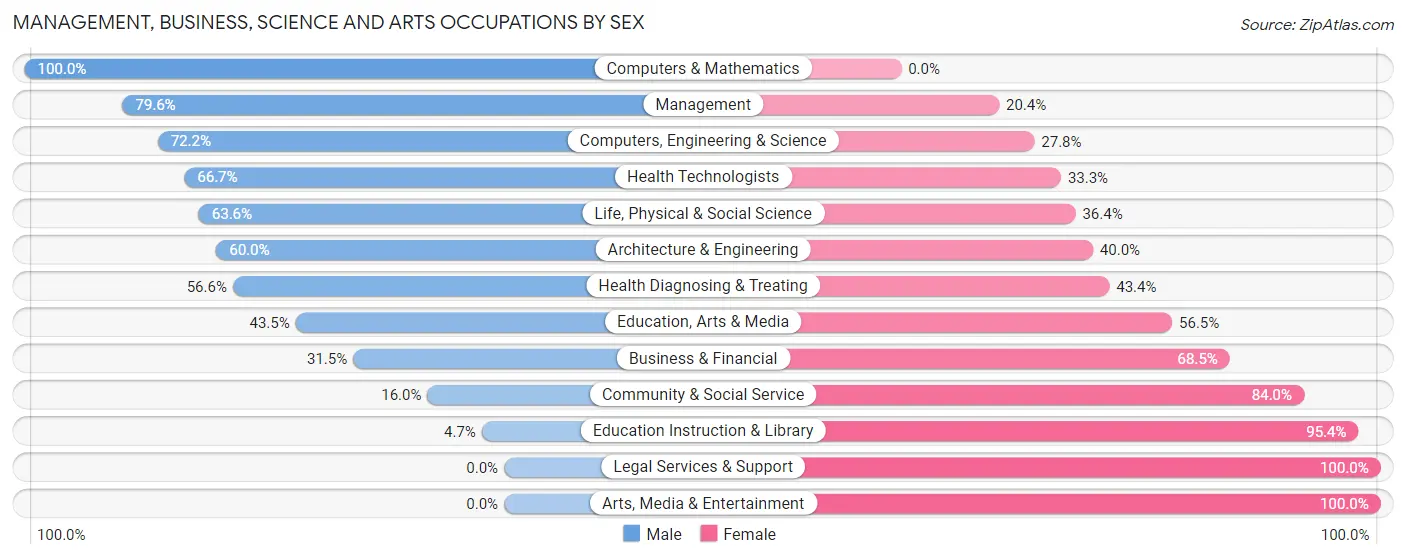
Management, Business, Science and Arts Occupations by Sex
Within the Management, Business, Science and Arts occupations in Lewiston, the most male-oriented occupations are Computers & Mathematics (100.0%), Management (79.6%), and Computers, Engineering & Science (72.2%), while the most female-oriented occupations are Legal Services & Support (100.0%), Arts, Media & Entertainment (100.0%), and Education Instruction & Library (95.4%).
| Occupation | Male | Female |
| Management | 78 (79.6%) | 20 (20.4%) |
| Business & Financial | 17 (31.5%) | 37 (68.5%) |
| Computers, Engineering & Science | 26 (72.2%) | 10 (27.8%) |
| Computers & Mathematics | 10 (100.0%) | 0 (0.0%) |
| Architecture & Engineering | 9 (60.0%) | 6 (40.0%) |
| Life, Physical & Social Science | 7 (63.6%) | 4 (36.4%) |
| Community & Social Service | 12 (16.0%) | 63 (84.0%) |
| Education, Arts & Media | 10 (43.5%) | 13 (56.5%) |
| Legal Services & Support | 0 (0.0%) | 3 (100.0%) |
| Education Instruction & Library | 2 (4.6%) | 41 (95.4%) |
| Arts, Media & Entertainment | 0 (0.0%) | 6 (100.0%) |
| Health Diagnosing & Treating | 43 (56.6%) | 33 (43.4%) |
| Health Technologists | 20 (66.7%) | 10 (33.3%) |
| Total (Category) | 176 (51.9%) | 163 (48.1%) |
| Total (Overall) | 598 (60.9%) | 384 (39.1%) |
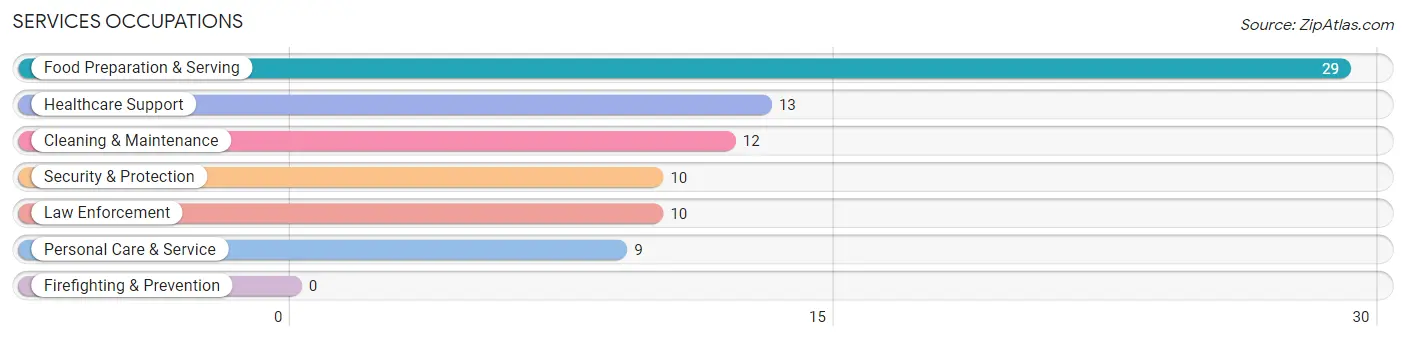
Services Occupations
The most common Services occupations in Lewiston are Food Preparation & Serving (29 | 2.9%), Healthcare Support (13 | 1.3%), Cleaning & Maintenance (12 | 1.2%), Security & Protection (10 | 1.0%), and Law Enforcement (10 | 1.0%).
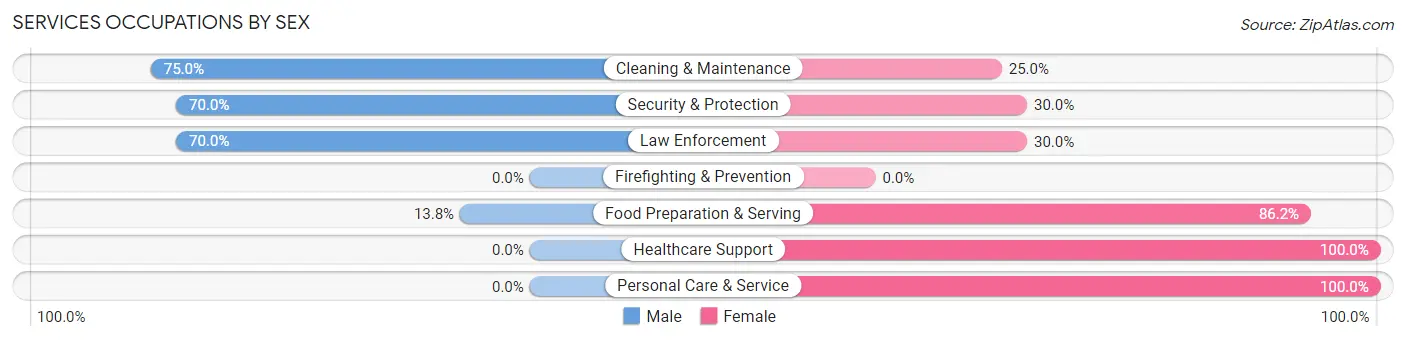
Services Occupations by Sex
Within the Services occupations in Lewiston, the most male-oriented occupations are Cleaning & Maintenance (75.0%), Security & Protection (70.0%), and Law Enforcement (70.0%), while the most female-oriented occupations are Healthcare Support (100.0%), Personal Care & Service (100.0%), and Food Preparation & Serving (86.2%).
| Occupation | Male | Female |
| Healthcare Support | 0 (0.0%) | 13 (100.0%) |
| Security & Protection | 7 (70.0%) | 3 (30.0%) |
| Firefighting & Prevention | 0 (0.0%) | 0 (0.0%) |
| Law Enforcement | 7 (70.0%) | 3 (30.0%) |
| Food Preparation & Serving | 4 (13.8%) | 25 (86.2%) |
| Cleaning & Maintenance | 9 (75.0%) | 3 (25.0%) |
| Personal Care & Service | 0 (0.0%) | 9 (100.0%) |
| Total (Category) | 20 (27.4%) | 53 (72.6%) |
| Total (Overall) | 598 (60.9%) | 384 (39.1%) |
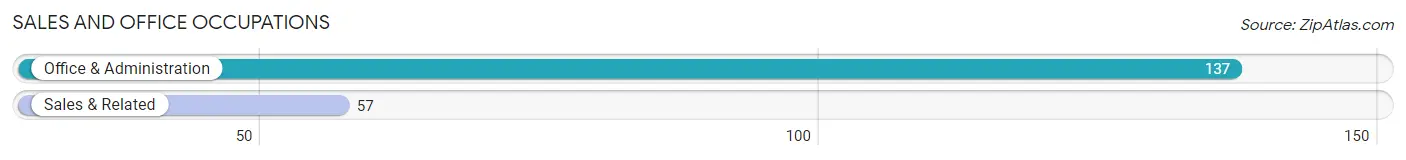
Sales and Office Occupations
The most common Sales and Office occupations in Lewiston are Office & Administration (137 | 14.0%), and Sales & Related (57 | 5.8%).
Sales and Office Occupations by Sex
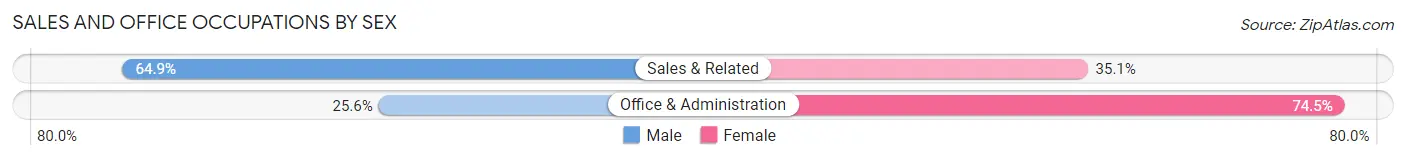
| Occupation | Male | Female |
| Sales & Related | 37 (64.9%) | 20 (35.1%) |
| Office & Administration | 35 (25.6%) | 102 (74.5%) |
| Total (Category) | 72 (37.1%) | 122 (62.9%) |
| Total (Overall) | 598 (60.9%) | 384 (39.1%) |
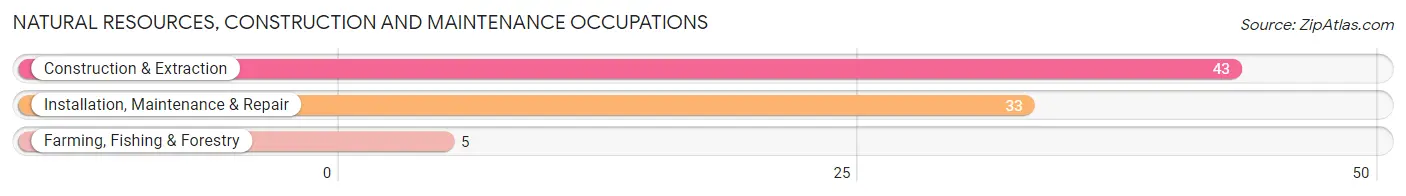
Natural Resources, Construction and Maintenance Occupations
The most common Natural Resources, Construction and Maintenance occupations in Lewiston are Construction & Extraction (43 | 4.4%), Installation, Maintenance & Repair (33 | 3.4%), and Farming, Fishing & Forestry (5 | 0.5%).
Natural Resources, Construction and Maintenance Occupations by Sex
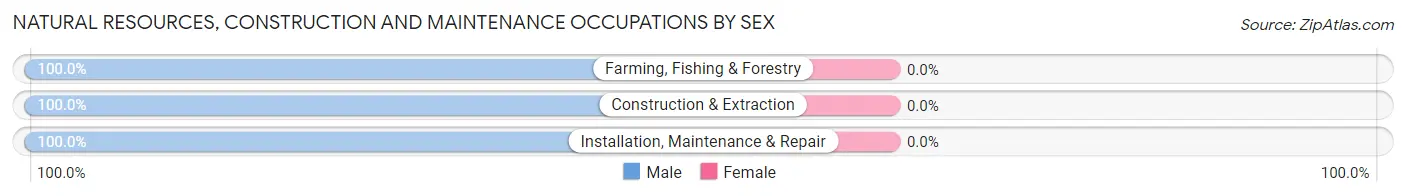
| Occupation | Male | Female |
| Farming, Fishing & Forestry | 5 (100.0%) | 0 (0.0%) |
| Construction & Extraction | 43 (100.0%) | 0 (0.0%) |
| Installation, Maintenance & Repair | 33 (100.0%) | 0 (0.0%) |
| Total (Category) | 81 (100.0%) | 0 (0.0%) |
| Total (Overall) | 598 (60.9%) | 384 (39.1%) |
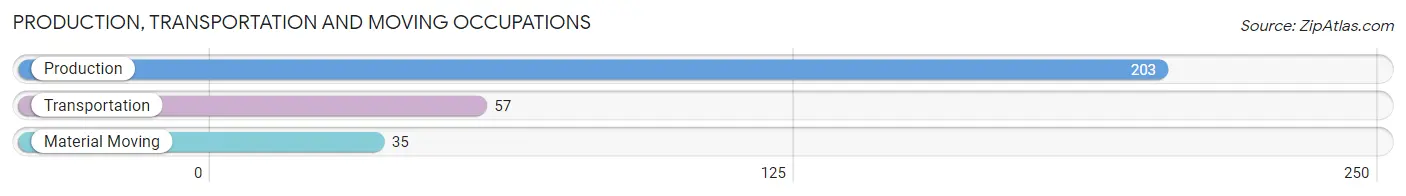
Production, Transportation and Moving Occupations
The most common Production, Transportation and Moving occupations in Lewiston are Production (203 | 20.7%), Transportation (57 | 5.8%), and Material Moving (35 | 3.6%).
Production, Transportation and Moving Occupations by Sex
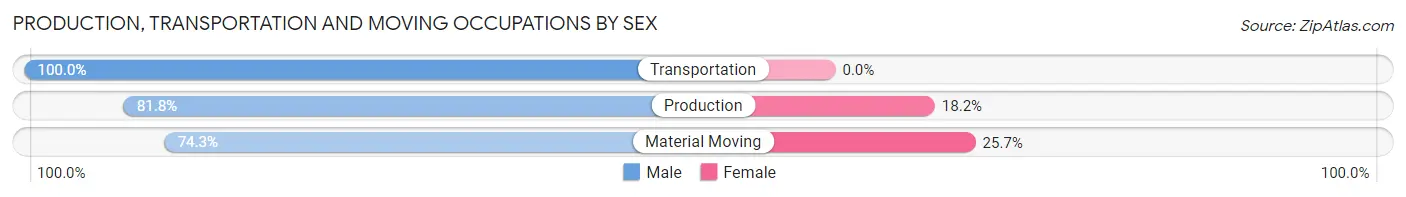
| Occupation | Male | Female |
| Production | 166 (81.8%) | 37 (18.2%) |
| Transportation | 57 (100.0%) | 0 (0.0%) |
| Material Moving | 26 (74.3%) | 9 (25.7%) |
| Total (Category) | 249 (84.4%) | 46 (15.6%) |
| Total (Overall) | 598 (60.9%) | 384 (39.1%) |
Employment Industries by Sex in Lewiston
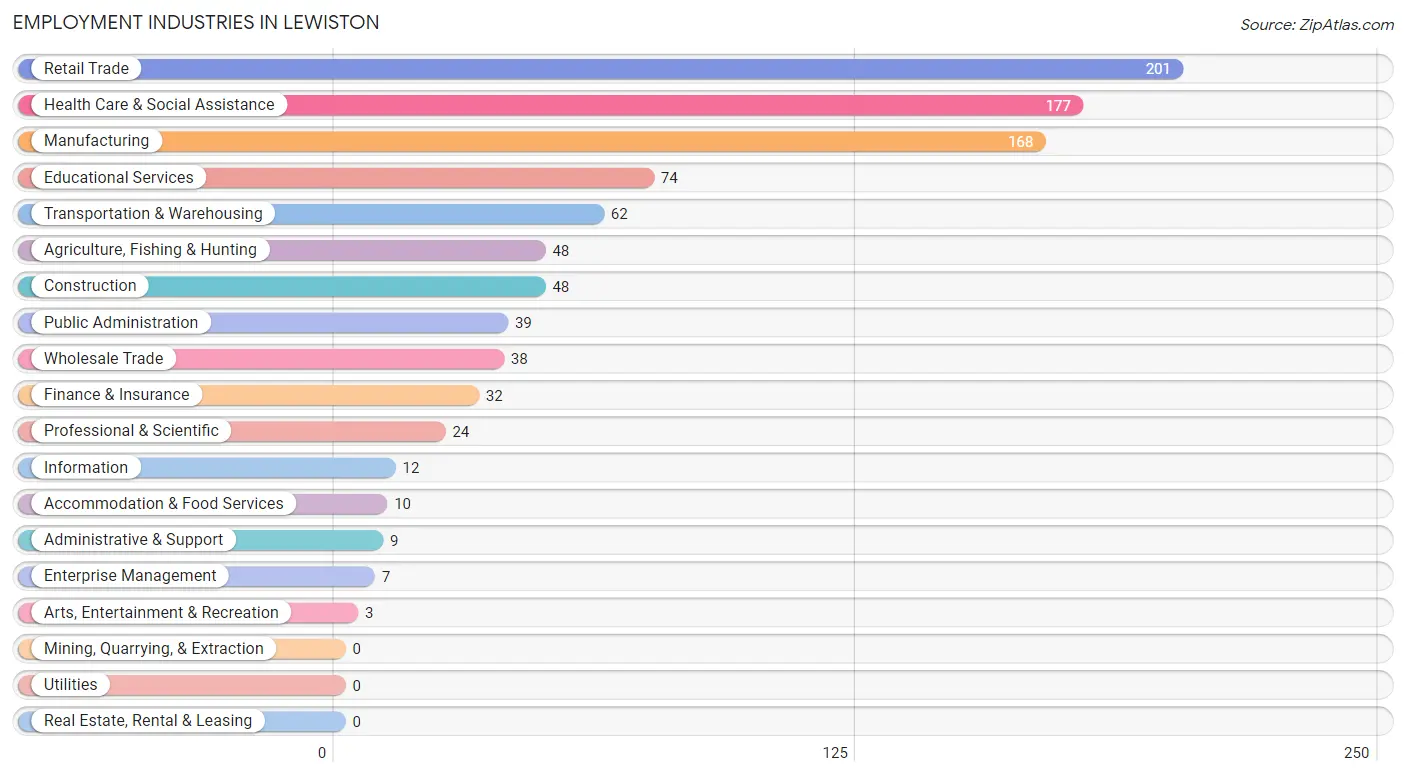
Employment Industries in Lewiston
The major employment industries in Lewiston include Retail Trade (201 | 20.5%), Health Care & Social Assistance (177 | 18.0%), Manufacturing (168 | 17.1%), Educational Services (74 | 7.5%), and Transportation & Warehousing (62 | 6.3%).
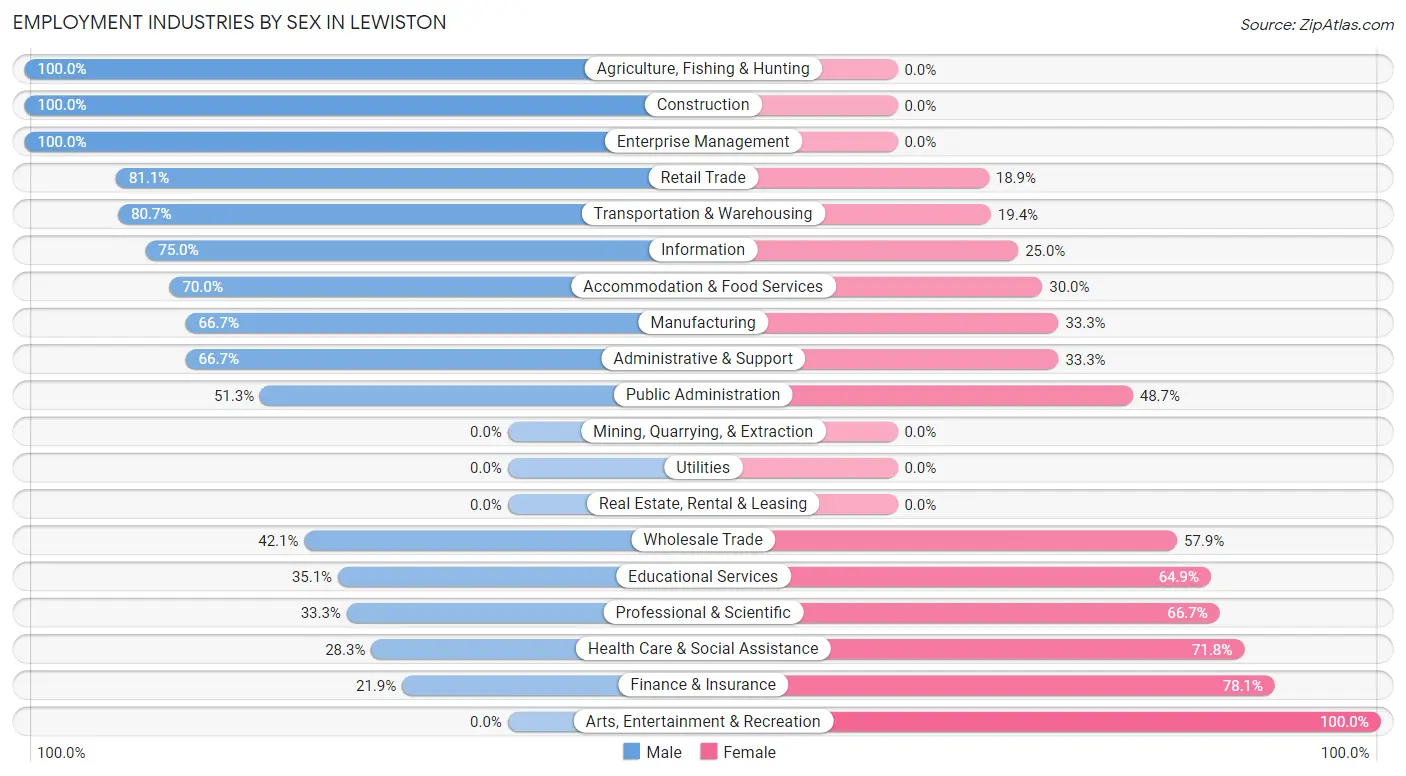
Employment Industries by Sex in Lewiston
The Lewiston industries that see more men than women are Agriculture, Fishing & Hunting (100.0%), Construction (100.0%), and Enterprise Management (100.0%), whereas the industries that tend to have a higher number of women are Arts, Entertainment & Recreation (100.0%), Finance & Insurance (78.1%), and Health Care & Social Assistance (71.8%).
| Industry | Male | Female |
| Agriculture, Fishing & Hunting | 48 (100.0%) | 0 (0.0%) |
| Mining, Quarrying, & Extraction | 0 (0.0%) | 0 (0.0%) |
| Construction | 48 (100.0%) | 0 (0.0%) |
| Manufacturing | 112 (66.7%) | 56 (33.3%) |
| Wholesale Trade | 16 (42.1%) | 22 (57.9%) |
| Retail Trade | 163 (81.1%) | 38 (18.9%) |
| Transportation & Warehousing | 50 (80.6%) | 12 (19.4%) |
| Utilities | 0 (0.0%) | 0 (0.0%) |
| Information | 9 (75.0%) | 3 (25.0%) |
| Finance & Insurance | 7 (21.9%) | 25 (78.1%) |
| Real Estate, Rental & Leasing | 0 (0.0%) | 0 (0.0%) |
| Professional & Scientific | 8 (33.3%) | 16 (66.7%) |
| Enterprise Management | 7 (100.0%) | 0 (0.0%) |
| Administrative & Support | 6 (66.7%) | 3 (33.3%) |
| Educational Services | 26 (35.1%) | 48 (64.9%) |
| Health Care & Social Assistance | 50 (28.2%) | 127 (71.8%) |
| Arts, Entertainment & Recreation | 0 (0.0%) | 3 (100.0%) |
| Accommodation & Food Services | 7 (70.0%) | 3 (30.0%) |
| Public Administration | 20 (51.3%) | 19 (48.7%) |
| Total | 598 (60.9%) | 384 (39.1%) |
Education in Lewiston
School Enrollment in Lewiston
The most common levels of schooling among the 496 students in Lewiston are high school (185 | 37.3%), middle school (138 | 27.8%), and elementary school (90 | 18.1%).
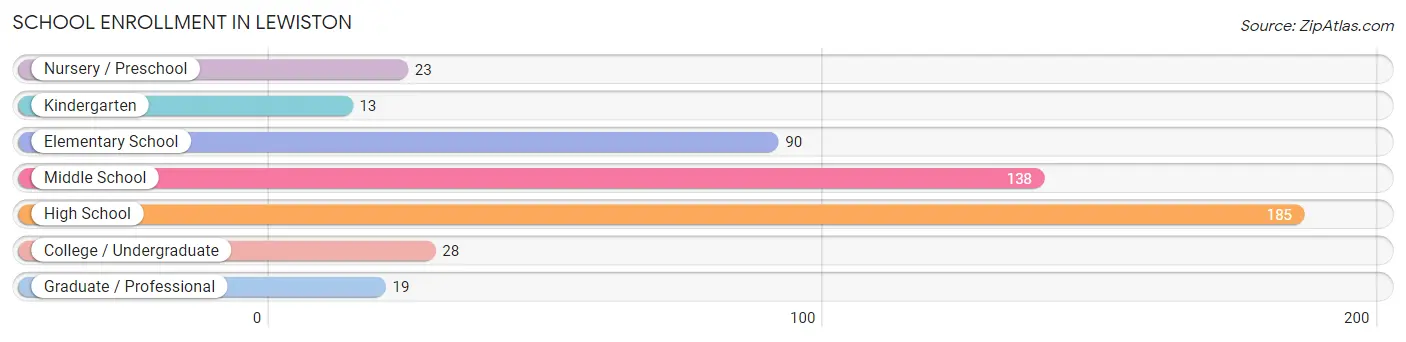
| School Level | # Students | % Students |
| Nursery / Preschool | 23 | 4.6% |
| Kindergarten | 13 | 2.6% |
| Elementary School | 90 | 18.1% |
| Middle School | 138 | 27.8% |
| High School | 185 | 37.3% |
| College / Undergraduate | 28 | 5.7% |
| Graduate / Professional | 19 | 3.8% |
| Total | 496 | 100.0% |
School Enrollment by Age by Funding Source in Lewiston
Out of a total of 496 students who are enrolled in schools in Lewiston, 62 (12.5%) attend a private institution, while the remaining 434 (87.5%) are enrolled in public schools. The age group of 20 to 24 year olds has the highest likelihood of being enrolled in private schools, with 7 (25.0% in the age bracket) enrolled. Conversely, the age group of 18 to 19 year olds has the lowest likelihood of being enrolled in a private school, with 44 (100.0% in the age bracket) attending a public institution.
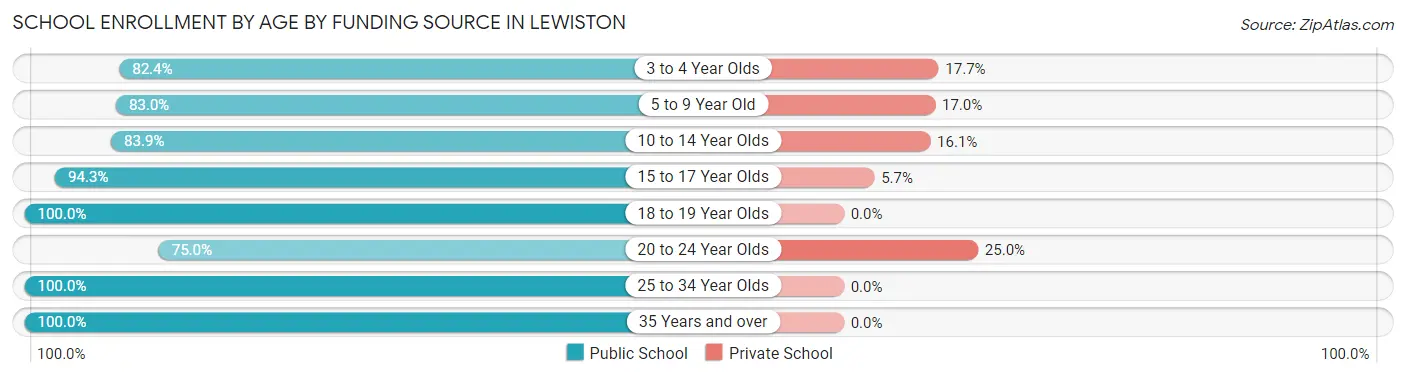
| Age Bracket | Public School | Private School |
| 3 to 4 Year Olds | 14 (82.4%) | 3 (17.6%) |
| 5 to 9 Year Old | 78 (83.0%) | 16 (17.0%) |
| 10 to 14 Year Olds | 151 (83.9%) | 29 (16.1%) |
| 15 to 17 Year Olds | 116 (94.3%) | 7 (5.7%) |
| 18 to 19 Year Olds | 44 (100.0%) | 0 (0.0%) |
| 20 to 24 Year Olds | 21 (75.0%) | 7 (25.0%) |
| 25 to 34 Year Olds | 2 (100.0%) | 0 (0.0%) |
| 35 Years and over | 8 (100.0%) | 0 (0.0%) |
| Total | 434 (87.5%) | 62 (12.5%) |
Educational Attainment by Field of Study in Lewiston
Education (81 | 19.5%), arts & humanities (70 | 16.9%), business (50 | 12.0%), liberal arts & history (45 | 10.8%), and science & technology (37 | 8.9%) are the most common fields of study among 415 individuals in Lewiston who have obtained a bachelor's degree or higher.
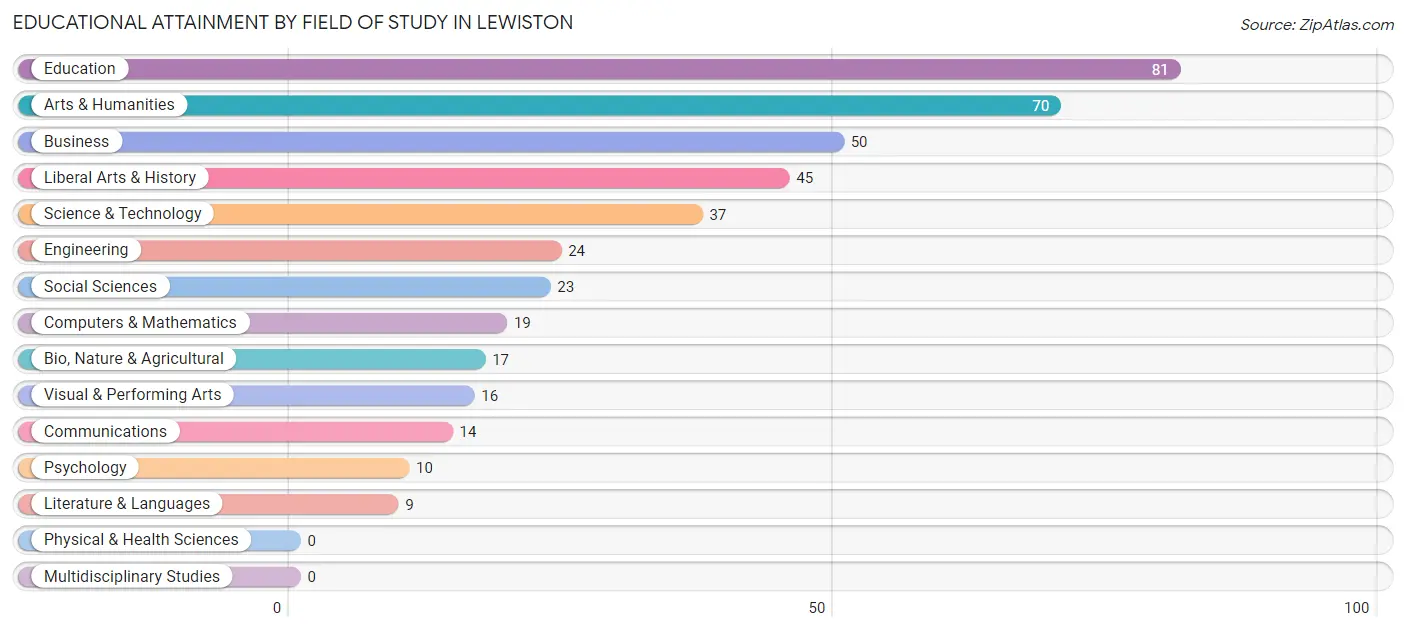
| Field of Study | # Graduates | % Graduates |
| Computers & Mathematics | 19 | 4.6% |
| Bio, Nature & Agricultural | 17 | 4.1% |
| Physical & Health Sciences | 0 | 0.0% |
| Psychology | 10 | 2.4% |
| Social Sciences | 23 | 5.5% |
| Engineering | 24 | 5.8% |
| Multidisciplinary Studies | 0 | 0.0% |
| Science & Technology | 37 | 8.9% |
| Business | 50 | 12.0% |
| Education | 81 | 19.5% |
| Literature & Languages | 9 | 2.2% |
| Liberal Arts & History | 45 | 10.8% |
| Visual & Performing Arts | 16 | 3.9% |
| Communications | 14 | 3.4% |
| Arts & Humanities | 70 | 16.9% |
| Total | 415 | 100.0% |
Transportation & Commute in Lewiston
Vehicle Availability by Sex in Lewiston
The most prevalent vehicle ownership categories in Lewiston are males with 2 vehicles (265, accounting for 44.3%) and females with 2 vehicles (144, making up 69.7%).
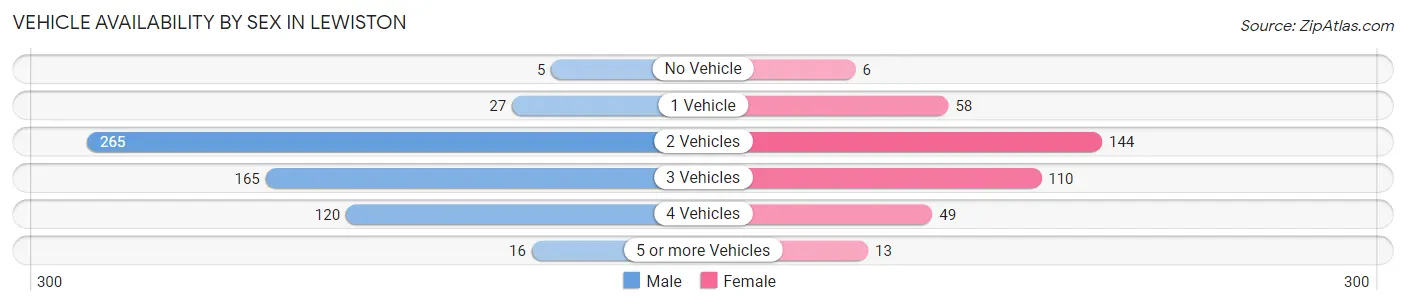
| Vehicles Available | Male | Female |
| No Vehicle | 5 (0.8%) | 6 (1.6%) |
| 1 Vehicle | 27 (4.5%) | 58 (15.3%) |
| 2 Vehicles | 265 (44.3%) | 144 (37.9%) |
| 3 Vehicles | 165 (27.6%) | 110 (28.9%) |
| 4 Vehicles | 120 (20.1%) | 49 (12.9%) |
| 5 or more Vehicles | 16 (2.7%) | 13 (3.4%) |
| Total | 598 (100.0%) | 380 (100.0%) |
Commute Time in Lewiston
The most frequently occuring commute durations in Lewiston are 5 to 9 minutes (211 commuters, 23.8%), 20 to 24 minutes (134 commuters, 15.1%), and less than 5 minutes (90 commuters, 10.2%).
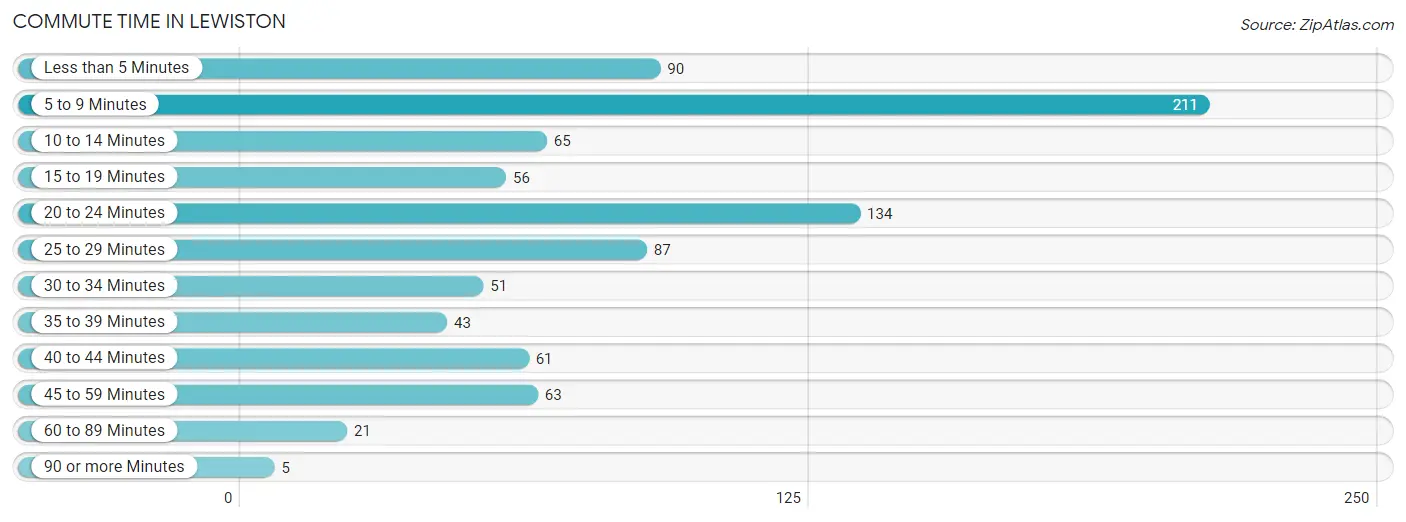
| Commute Time | # Commuters | % Commuters |
| Less than 5 Minutes | 90 | 10.2% |
| 5 to 9 Minutes | 211 | 23.8% |
| 10 to 14 Minutes | 65 | 7.3% |
| 15 to 19 Minutes | 56 | 6.3% |
| 20 to 24 Minutes | 134 | 15.1% |
| 25 to 29 Minutes | 87 | 9.8% |
| 30 to 34 Minutes | 51 | 5.8% |
| 35 to 39 Minutes | 43 | 4.9% |
| 40 to 44 Minutes | 61 | 6.9% |
| 45 to 59 Minutes | 63 | 7.1% |
| 60 to 89 Minutes | 21 | 2.4% |
| 90 or more Minutes | 5 | 0.6% |
Commute Time by Sex in Lewiston
The most common commute times in Lewiston are 5 to 9 minutes (154 commuters, 26.9%) for males and 5 to 9 minutes (57 commuters, 18.1%) for females.
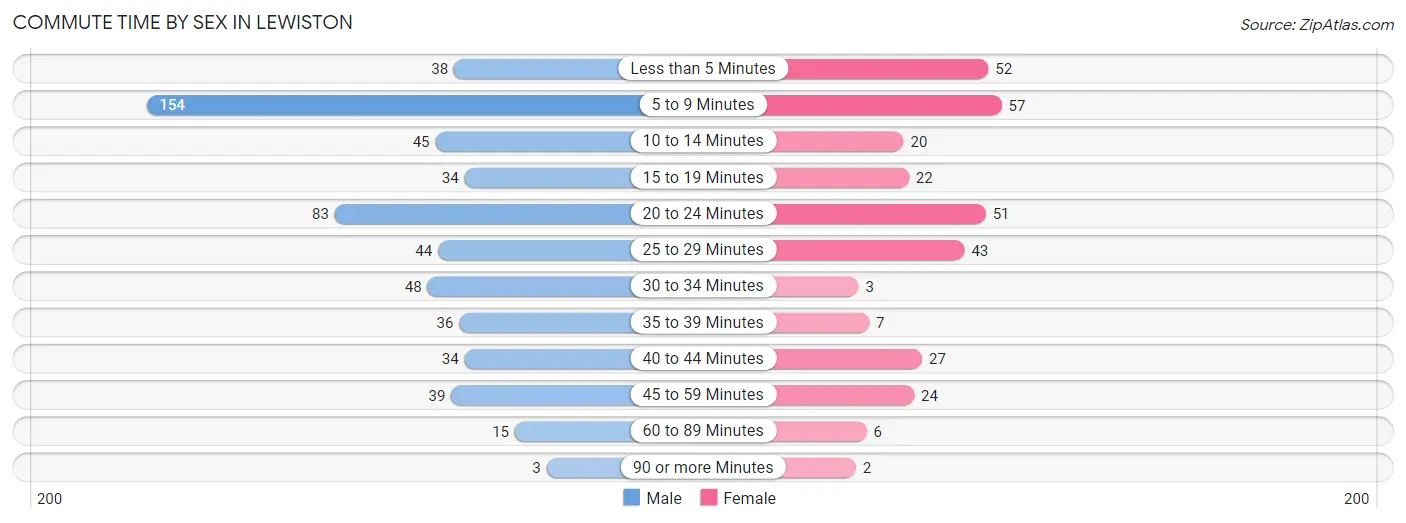
| Commute Time | Male | Female |
| Less than 5 Minutes | 38 (6.6%) | 52 (16.6%) |
| 5 to 9 Minutes | 154 (26.9%) | 57 (18.1%) |
| 10 to 14 Minutes | 45 (7.9%) | 20 (6.4%) |
| 15 to 19 Minutes | 34 (5.9%) | 22 (7.0%) |
| 20 to 24 Minutes | 83 (14.5%) | 51 (16.2%) |
| 25 to 29 Minutes | 44 (7.7%) | 43 (13.7%) |
| 30 to 34 Minutes | 48 (8.4%) | 3 (1.0%) |
| 35 to 39 Minutes | 36 (6.3%) | 7 (2.2%) |
| 40 to 44 Minutes | 34 (5.9%) | 27 (8.6%) |
| 45 to 59 Minutes | 39 (6.8%) | 24 (7.6%) |
| 60 to 89 Minutes | 15 (2.6%) | 6 (1.9%) |
| 90 or more Minutes | 3 (0.5%) | 2 (0.6%) |
Time of Departure to Work by Sex in Lewiston
The most frequent times of departure to work in Lewiston are 6:30 AM to 6:59 AM (157, 27.4%) for males and 7:00 AM to 7:29 AM (74, 23.6%) for females.
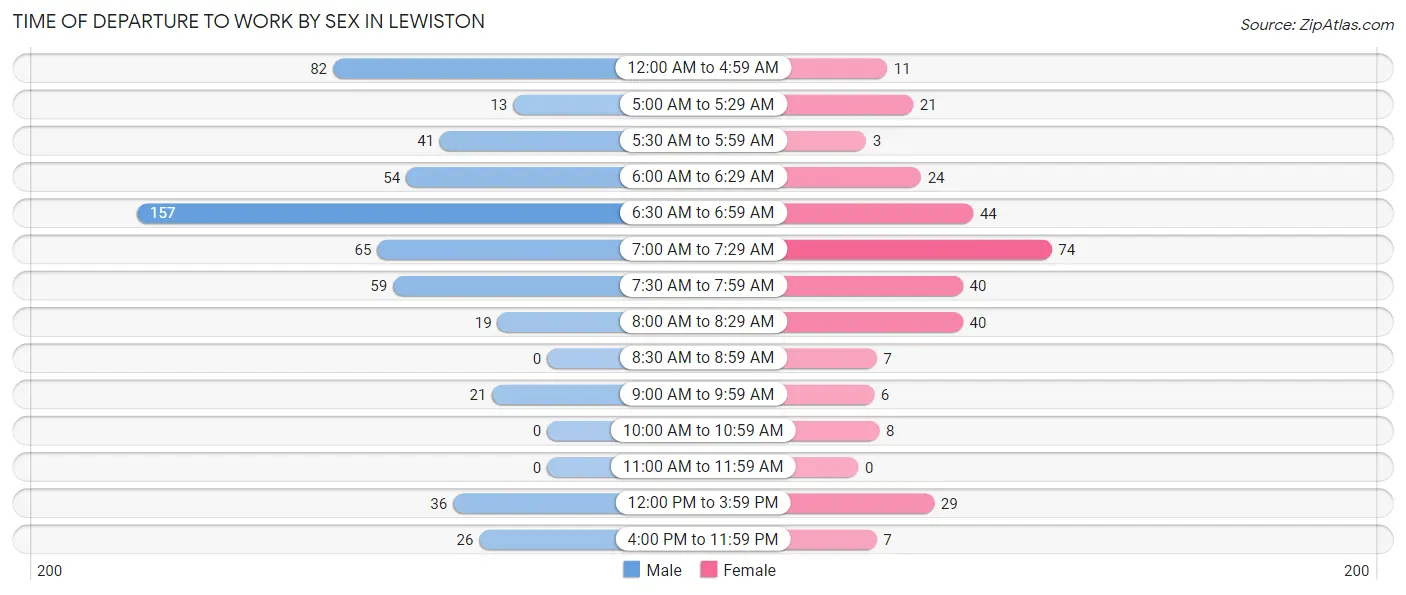
| Time of Departure | Male | Female |
| 12:00 AM to 4:59 AM | 82 (14.3%) | 11 (3.5%) |
| 5:00 AM to 5:29 AM | 13 (2.3%) | 21 (6.7%) |
| 5:30 AM to 5:59 AM | 41 (7.2%) | 3 (1.0%) |
| 6:00 AM to 6:29 AM | 54 (9.4%) | 24 (7.6%) |
| 6:30 AM to 6:59 AM | 157 (27.4%) | 44 (14.0%) |
| 7:00 AM to 7:29 AM | 65 (11.3%) | 74 (23.6%) |
| 7:30 AM to 7:59 AM | 59 (10.3%) | 40 (12.7%) |
| 8:00 AM to 8:29 AM | 19 (3.3%) | 40 (12.7%) |
| 8:30 AM to 8:59 AM | 0 (0.0%) | 7 (2.2%) |
| 9:00 AM to 9:59 AM | 21 (3.7%) | 6 (1.9%) |
| 10:00 AM to 10:59 AM | 0 (0.0%) | 8 (2.5%) |
| 11:00 AM to 11:59 AM | 0 (0.0%) | 0 (0.0%) |
| 12:00 PM to 3:59 PM | 36 (6.3%) | 29 (9.2%) |
| 4:00 PM to 11:59 PM | 26 (4.5%) | 7 (2.2%) |
| Total | 573 (100.0%) | 314 (100.0%) |
Housing Occupancy in Lewiston
Occupancy by Ownership in Lewiston
Of the total 579 dwellings in Lewiston, owner-occupied units account for 436 (75.3%), while renter-occupied units make up 143 (24.7%).
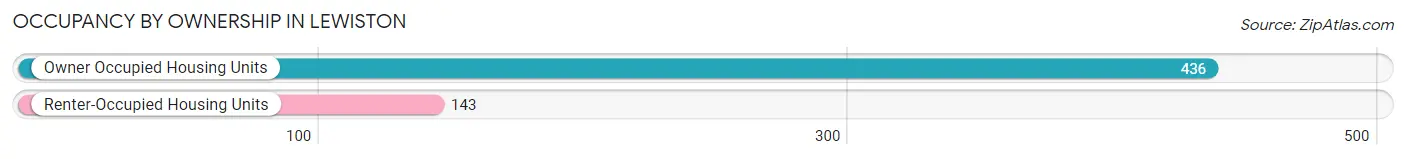
| Occupancy | # Housing Units | % Housing Units |
| Owner Occupied Housing Units | 436 | 75.3% |
| Renter-Occupied Housing Units | 143 | 24.7% |
| Total Occupied Housing Units | 579 | 100.0% |
Occupancy by Household Size in Lewiston
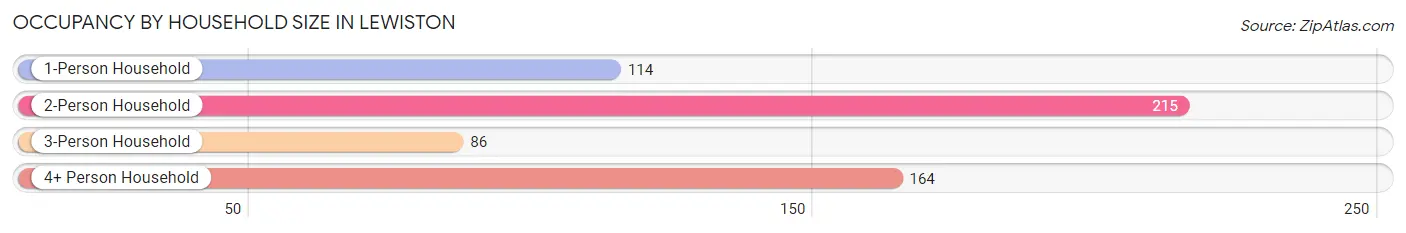
| Household Size | # Housing Units | % Housing Units |
| 1-Person Household | 114 | 19.7% |
| 2-Person Household | 215 | 37.1% |
| 3-Person Household | 86 | 14.8% |
| 4+ Person Household | 164 | 28.3% |
| Total Housing Units | 579 | 100.0% |
Occupancy by Ownership by Household Size in Lewiston
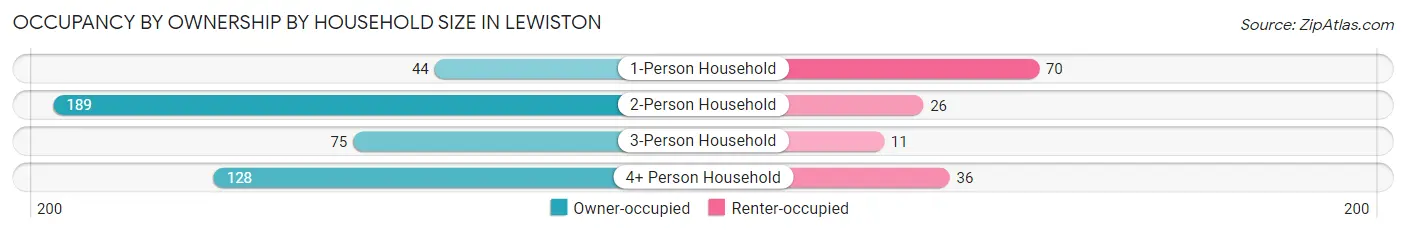
| Household Size | Owner-occupied | Renter-occupied |
| 1-Person Household | 44 (38.6%) | 70 (61.4%) |
| 2-Person Household | 189 (87.9%) | 26 (12.1%) |
| 3-Person Household | 75 (87.2%) | 11 (12.8%) |
| 4+ Person Household | 128 (78.0%) | 36 (22.0%) |
| Total Housing Units | 436 (75.3%) | 143 (24.7%) |
Occupancy by Educational Attainment in Lewiston
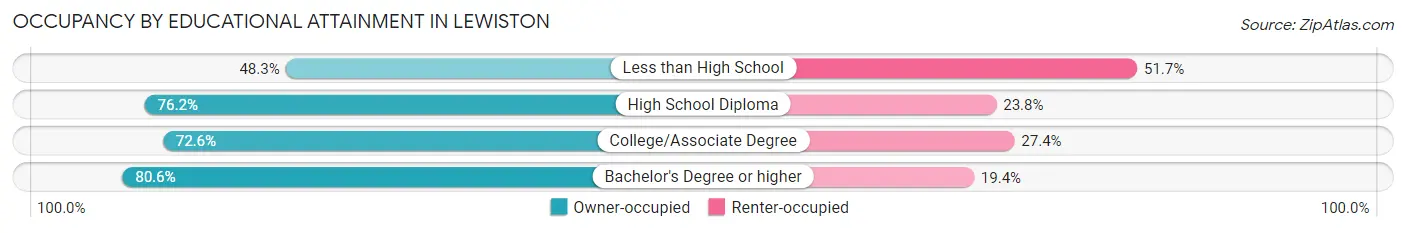
| Household Size | Owner-occupied | Renter-occupied |
| Less than High School | 14 (48.3%) | 15 (51.7%) |
| High School Diploma | 96 (76.2%) | 30 (23.8%) |
| College/Associate Degree | 143 (72.6%) | 54 (27.4%) |
| Bachelor's Degree or higher | 183 (80.6%) | 44 (19.4%) |
Occupancy by Age of Householder in Lewiston
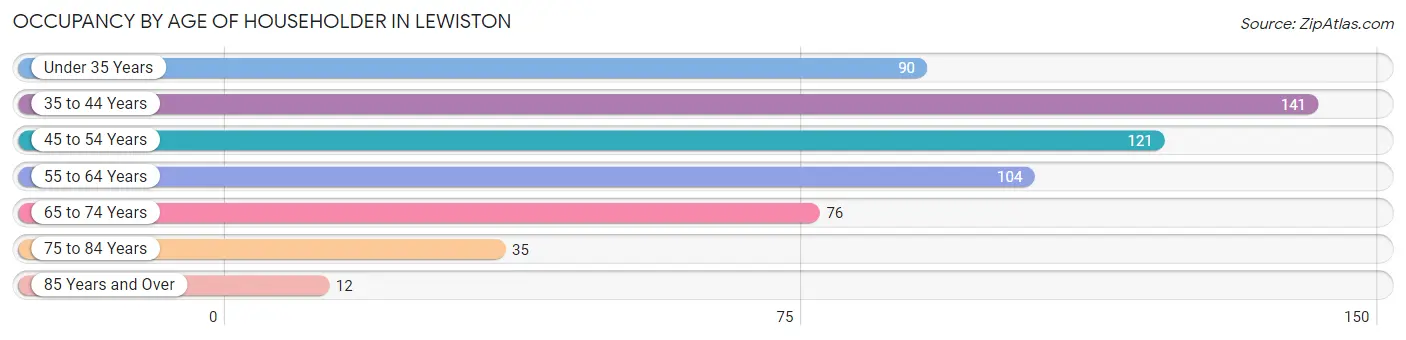
| Age Bracket | # Households | % Households |
| Under 35 Years | 90 | 15.5% |
| 35 to 44 Years | 141 | 24.3% |
| 45 to 54 Years | 121 | 20.9% |
| 55 to 64 Years | 104 | 18.0% |
| 65 to 74 Years | 76 | 13.1% |
| 75 to 84 Years | 35 | 6.0% |
| 85 Years and Over | 12 | 2.1% |
| Total | 579 | 100.0% |
Housing Finances in Lewiston
Median Income by Occupancy in Lewiston
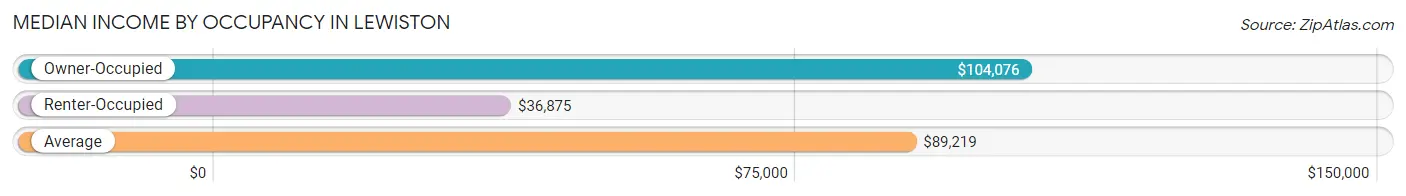
| Occupancy Type | # Households | Median Income |
| Owner-Occupied | 436 (75.3%) | $104,076 |
| Renter-Occupied | 143 (24.7%) | $36,875 |
| Average | 579 (100.0%) | $89,219 |
Occupancy by Householder Income Bracket in Lewiston
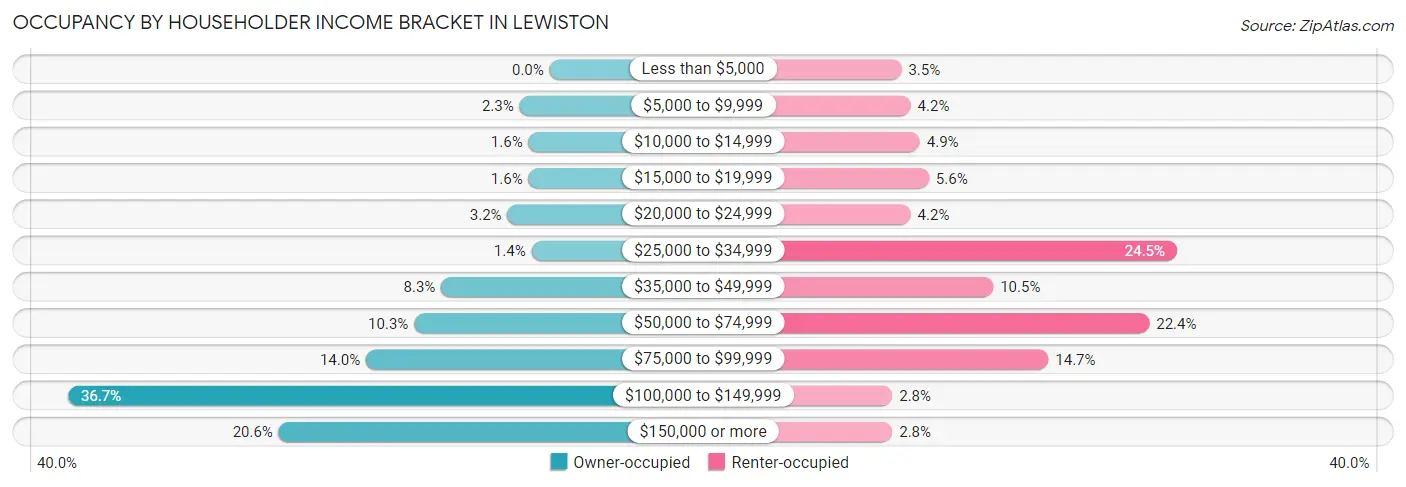
| Income Bracket | Owner-occupied | Renter-occupied |
| Less than $5,000 | 0 (0.0%) | 5 (3.5%) |
| $5,000 to $9,999 | 10 (2.3%) | 6 (4.2%) |
| $10,000 to $14,999 | 7 (1.6%) | 7 (4.9%) |
| $15,000 to $19,999 | 7 (1.6%) | 8 (5.6%) |
| $20,000 to $24,999 | 14 (3.2%) | 6 (4.2%) |
| $25,000 to $34,999 | 6 (1.4%) | 35 (24.5%) |
| $35,000 to $49,999 | 36 (8.3%) | 15 (10.5%) |
| $50,000 to $74,999 | 45 (10.3%) | 32 (22.4%) |
| $75,000 to $99,999 | 61 (14.0%) | 21 (14.7%) |
| $100,000 to $149,999 | 160 (36.7%) | 4 (2.8%) |
| $150,000 or more | 90 (20.6%) | 4 (2.8%) |
| Total | 436 (100.0%) | 143 (100.0%) |
Monthly Housing Cost Tiers in Lewiston
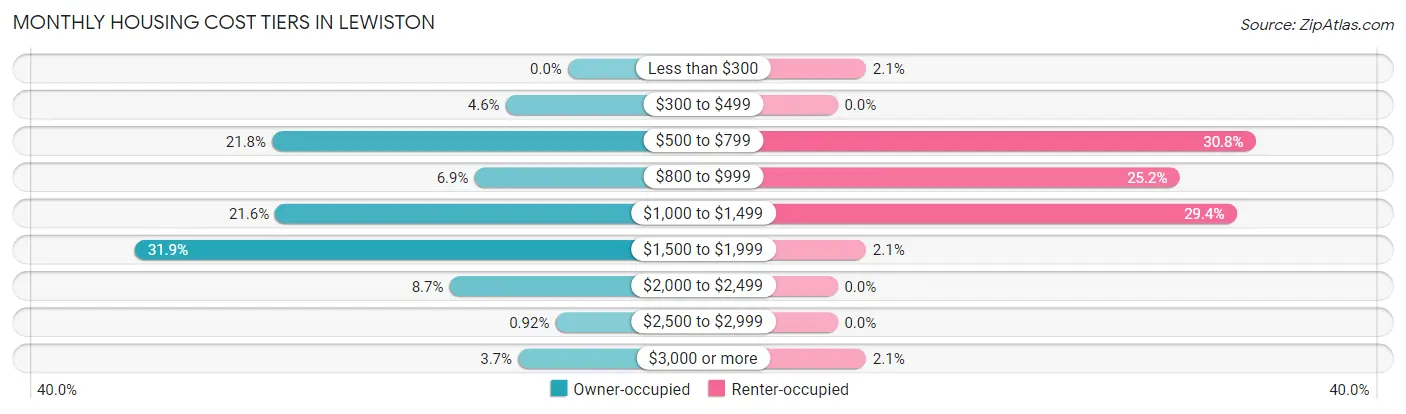
| Monthly Cost | Owner-occupied | Renter-occupied |
| Less than $300 | 0 (0.0%) | 3 (2.1%) |
| $300 to $499 | 20 (4.6%) | 0 (0.0%) |
| $500 to $799 | 95 (21.8%) | 44 (30.8%) |
| $800 to $999 | 30 (6.9%) | 36 (25.2%) |
| $1,000 to $1,499 | 94 (21.6%) | 42 (29.4%) |
| $1,500 to $1,999 | 139 (31.9%) | 3 (2.1%) |
| $2,000 to $2,499 | 38 (8.7%) | 0 (0.0%) |
| $2,500 to $2,999 | 4 (0.9%) | 0 (0.0%) |
| $3,000 or more | 16 (3.7%) | 3 (2.1%) |
| Total | 436 (100.0%) | 143 (100.0%) |
Physical Housing Characteristics in Lewiston
Housing Structures in Lewiston
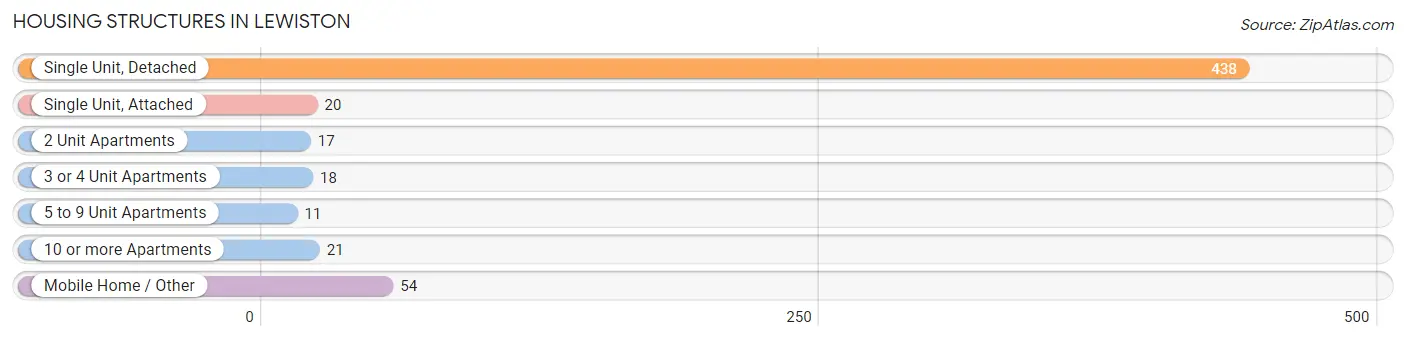
| Structure Type | # Housing Units | % Housing Units |
| Single Unit, Detached | 438 | 75.6% |
| Single Unit, Attached | 20 | 3.5% |
| 2 Unit Apartments | 17 | 2.9% |
| 3 or 4 Unit Apartments | 18 | 3.1% |
| 5 to 9 Unit Apartments | 11 | 1.9% |
| 10 or more Apartments | 21 | 3.6% |
| Mobile Home / Other | 54 | 9.3% |
| Total | 579 | 100.0% |
Housing Structures by Occupancy in Lewiston
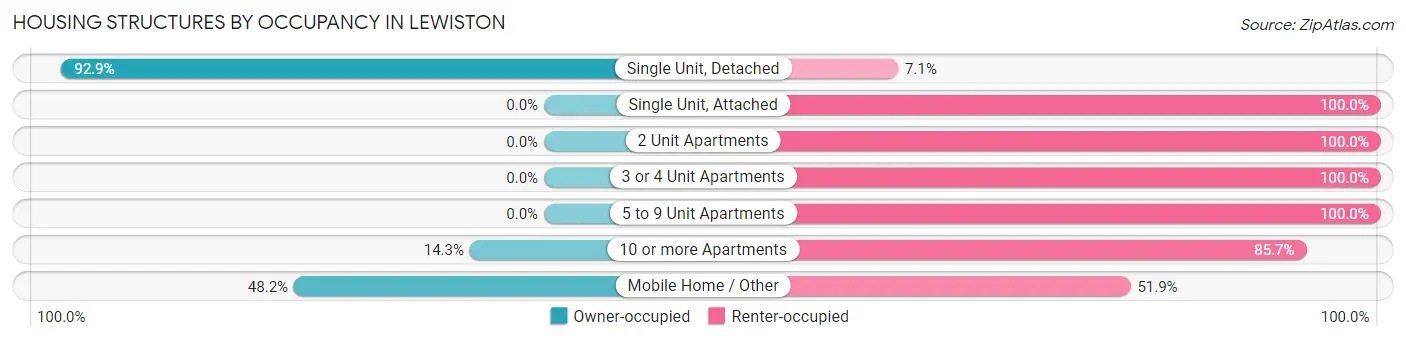
| Structure Type | Owner-occupied | Renter-occupied |
| Single Unit, Detached | 407 (92.9%) | 31 (7.1%) |
| Single Unit, Attached | 0 (0.0%) | 20 (100.0%) |
| 2 Unit Apartments | 0 (0.0%) | 17 (100.0%) |
| 3 or 4 Unit Apartments | 0 (0.0%) | 18 (100.0%) |
| 5 to 9 Unit Apartments | 0 (0.0%) | 11 (100.0%) |
| 10 or more Apartments | 3 (14.3%) | 18 (85.7%) |
| Mobile Home / Other | 26 (48.1%) | 28 (51.8%) |
| Total | 436 (75.3%) | 143 (24.7%) |
Housing Structures by Number of Rooms in Lewiston
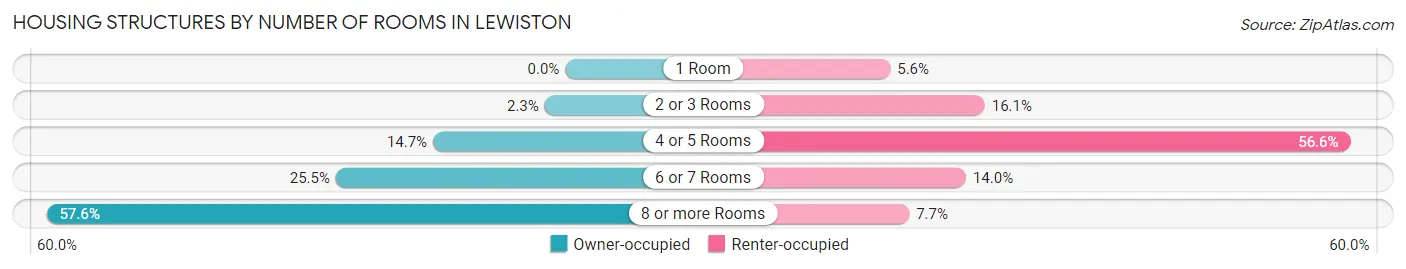
| Number of Rooms | Owner-occupied | Renter-occupied |
| 1 Room | 0 (0.0%) | 8 (5.6%) |
| 2 or 3 Rooms | 10 (2.3%) | 23 (16.1%) |
| 4 or 5 Rooms | 64 (14.7%) | 81 (56.6%) |
| 6 or 7 Rooms | 111 (25.5%) | 20 (14.0%) |
| 8 or more Rooms | 251 (57.6%) | 11 (7.7%) |
| Total | 436 (100.0%) | 143 (100.0%) |
Housing Structure by Heating Type in Lewiston
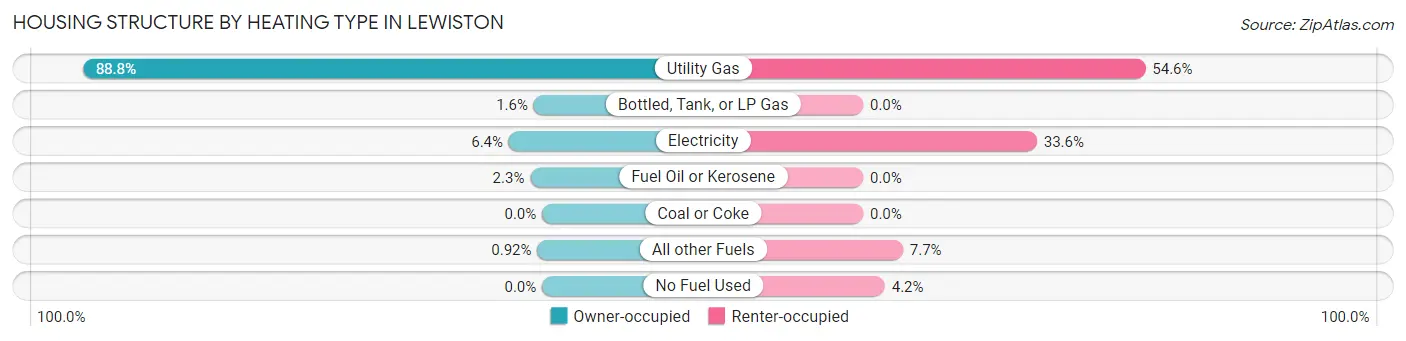
| Heating Type | Owner-occupied | Renter-occupied |
| Utility Gas | 387 (88.8%) | 78 (54.5%) |
| Bottled, Tank, or LP Gas | 7 (1.6%) | 0 (0.0%) |
| Electricity | 28 (6.4%) | 48 (33.6%) |
| Fuel Oil or Kerosene | 10 (2.3%) | 0 (0.0%) |
| Coal or Coke | 0 (0.0%) | 0 (0.0%) |
| All other Fuels | 4 (0.9%) | 11 (7.7%) |
| No Fuel Used | 0 (0.0%) | 6 (4.2%) |
| Total | 436 (100.0%) | 143 (100.0%) |
Household Vehicle Usage in Lewiston
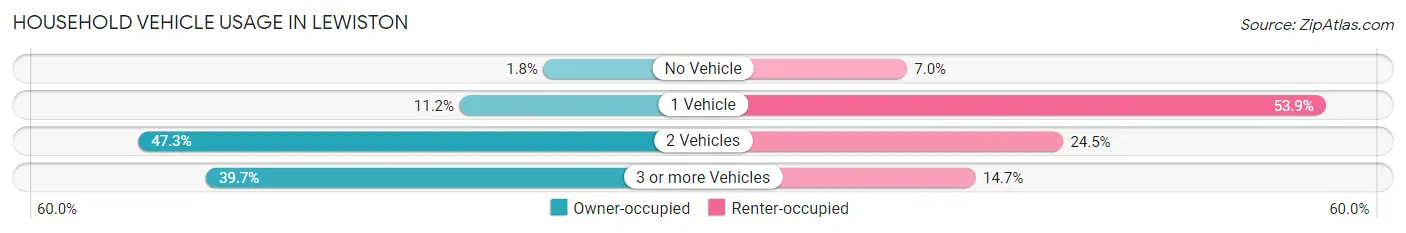
| Vehicles per Household | Owner-occupied | Renter-occupied |
| No Vehicle | 8 (1.8%) | 10 (7.0%) |
| 1 Vehicle | 49 (11.2%) | 77 (53.8%) |
| 2 Vehicles | 206 (47.2%) | 35 (24.5%) |
| 3 or more Vehicles | 173 (39.7%) | 21 (14.7%) |
| Total | 436 (100.0%) | 143 (100.0%) |
Real Estate & Mortgages in Lewiston
Real Estate and Mortgage Overview in Lewiston
| Characteristic | Without Mortgage | With Mortgage |
| Housing Units | 127 | 309 |
| Median Property Value | $178,000 | $209,400 |
| Median Household Income | $75,417 | $82 |
| Monthly Housing Costs | $593 | $13 |
| Real Estate Taxes | $2,189 | $6 |
Property Value by Mortgage Status in Lewiston
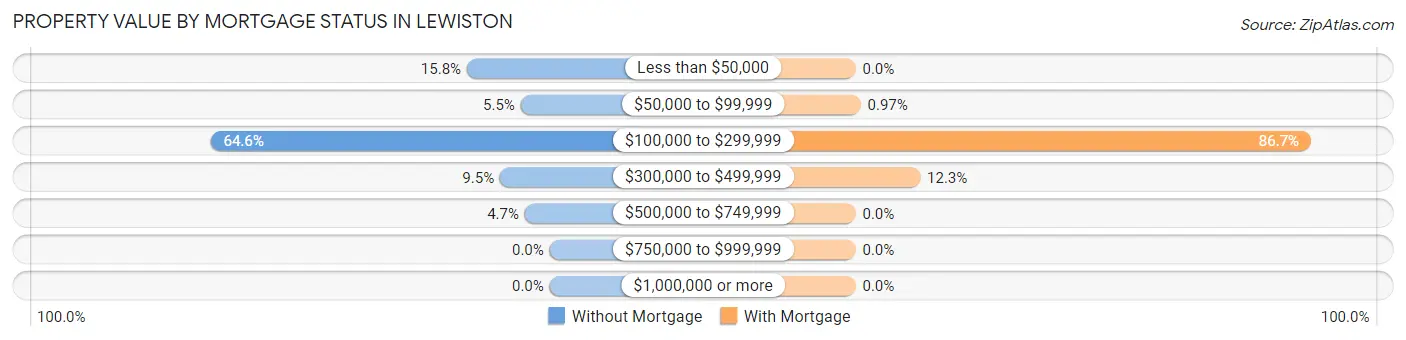
| Property Value | Without Mortgage | With Mortgage |
| Less than $50,000 | 20 (15.8%) | 0 (0.0%) |
| $50,000 to $99,999 | 7 (5.5%) | 3 (1.0%) |
| $100,000 to $299,999 | 82 (64.6%) | 268 (86.7%) |
| $300,000 to $499,999 | 12 (9.5%) | 38 (12.3%) |
| $500,000 to $749,999 | 6 (4.7%) | 0 (0.0%) |
| $750,000 to $999,999 | 0 (0.0%) | 0 (0.0%) |
| $1,000,000 or more | 0 (0.0%) | 0 (0.0%) |
| Total | 127 (100.0%) | 309 (100.0%) |
Household Income by Mortgage Status in Lewiston
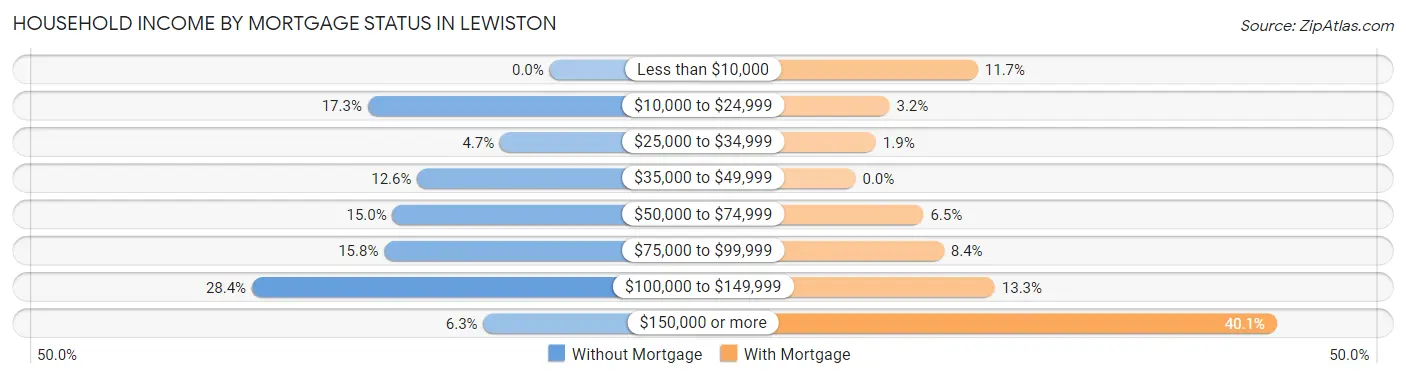
| Household Income | Without Mortgage | With Mortgage |
| Less than $10,000 | 0 (0.0%) | 36 (11.7%) |
| $10,000 to $24,999 | 22 (17.3%) | 10 (3.2%) |
| $25,000 to $34,999 | 6 (4.7%) | 6 (1.9%) |
| $35,000 to $49,999 | 16 (12.6%) | 0 (0.0%) |
| $50,000 to $74,999 | 19 (15.0%) | 20 (6.5%) |
| $75,000 to $99,999 | 20 (15.8%) | 26 (8.4%) |
| $100,000 to $149,999 | 36 (28.3%) | 41 (13.3%) |
| $150,000 or more | 8 (6.3%) | 124 (40.1%) |
| Total | 127 (100.0%) | 309 (100.0%) |
Property Value to Household Income Ratio in Lewiston
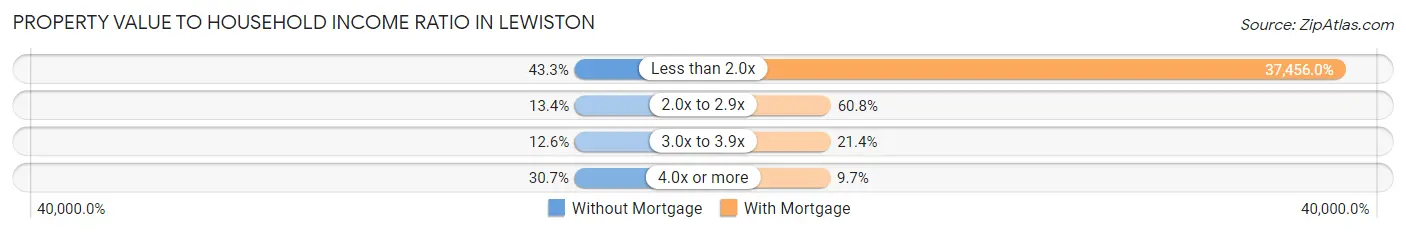
| Value-to-Income Ratio | Without Mortgage | With Mortgage |
| Less than 2.0x | 55 (43.3%) | 115,739 (37,456.0%) |
| 2.0x to 2.9x | 17 (13.4%) | 188 (60.8%) |
| 3.0x to 3.9x | 16 (12.6%) | 66 (21.4%) |
| 4.0x or more | 39 (30.7%) | 30 (9.7%) |
| Total | 127 (100.0%) | 309 (100.0%) |
Real Estate Taxes by Mortgage Status in Lewiston
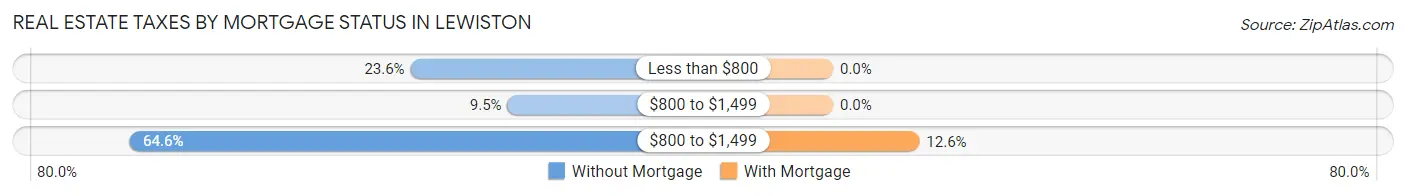
| Property Taxes | Without Mortgage | With Mortgage |
| Less than $800 | 30 (23.6%) | 0 (0.0%) |
| $800 to $1,499 | 12 (9.5%) | 0 (0.0%) |
| $800 to $1,499 | 82 (64.6%) | 39 (12.6%) |
| Total | 127 (100.0%) | 309 (100.0%) |
Health & Disability in Lewiston
Health Insurance Coverage by Age in Lewiston
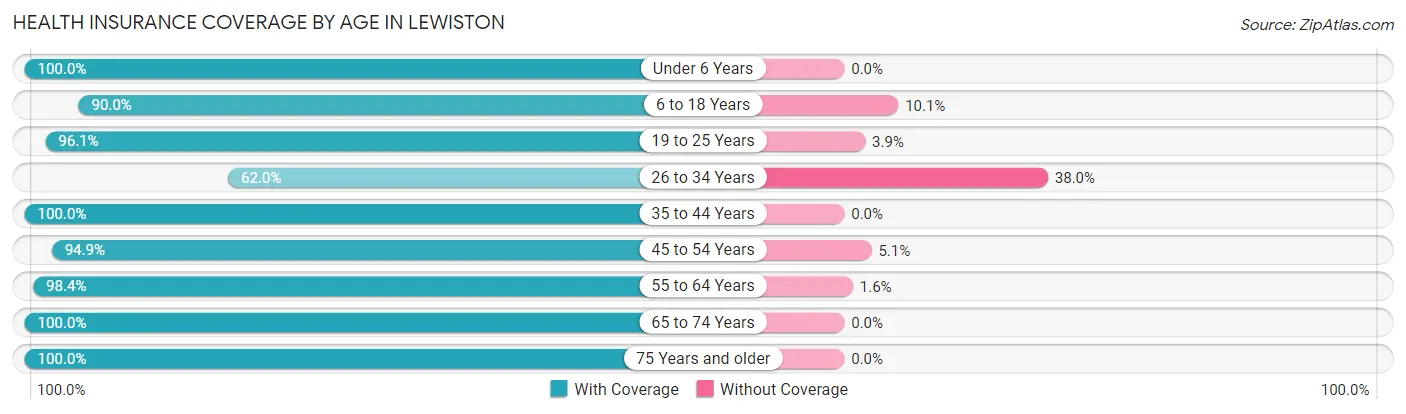
| Age Bracket | With Coverage | Without Coverage |
| Under 6 Years | 101 (100.0%) | 0 (0.0%) |
| 6 to 18 Years | 376 (89.9%) | 42 (10.1%) |
| 19 to 25 Years | 99 (96.1%) | 4 (3.9%) |
| 26 to 34 Years | 152 (62.0%) | 93 (38.0%) |
| 35 to 44 Years | 218 (100.0%) | 0 (0.0%) |
| 45 to 54 Years | 225 (94.9%) | 12 (5.1%) |
| 55 to 64 Years | 184 (98.4%) | 3 (1.6%) |
| 65 to 74 Years | 159 (100.0%) | 0 (0.0%) |
| 75 Years and older | 66 (100.0%) | 0 (0.0%) |
| Total | 1,580 (91.1%) | 154 (8.9%) |
Health Insurance Coverage by Citizenship Status in Lewiston
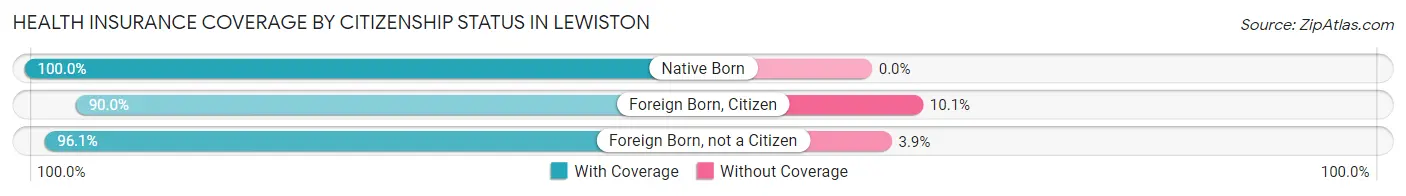
| Citizenship Status | With Coverage | Without Coverage |
| Native Born | 101 (100.0%) | 0 (0.0%) |
| Foreign Born, Citizen | 376 (89.9%) | 42 (10.1%) |
| Foreign Born, not a Citizen | 99 (96.1%) | 4 (3.9%) |
Health Insurance Coverage by Household Income in Lewiston
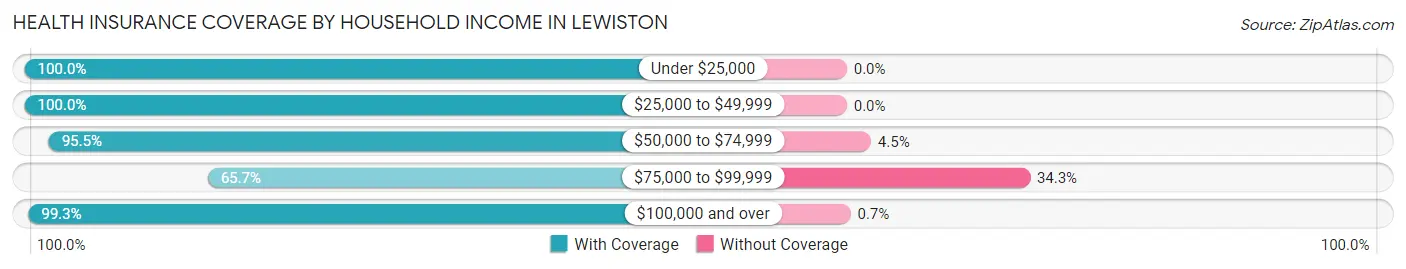
| Household Income | With Coverage | Without Coverage |
| Under $25,000 | 98 (100.0%) | 0 (0.0%) |
| $25,000 to $49,999 | 198 (100.0%) | 0 (0.0%) |
| $50,000 to $74,999 | 148 (95.5%) | 7 (4.5%) |
| $75,000 to $99,999 | 270 (65.7%) | 141 (34.3%) |
| $100,000 and over | 852 (99.3%) | 6 (0.7%) |
Public vs Private Health Insurance Coverage by Age in Lewiston
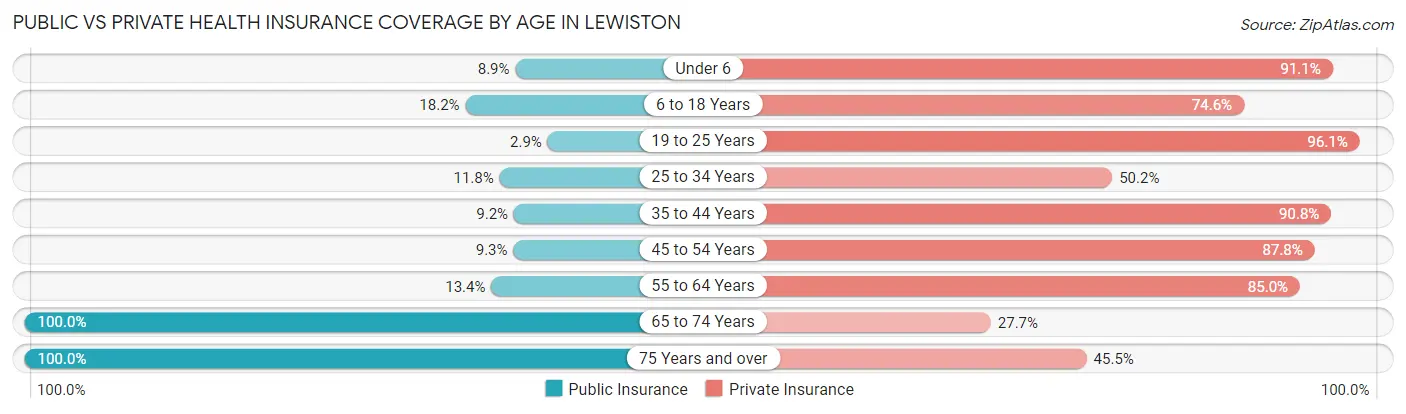
| Age Bracket | Public Insurance | Private Insurance |
| Under 6 | 9 (8.9%) | 92 (91.1%) |
| 6 to 18 Years | 76 (18.2%) | 312 (74.6%) |
| 19 to 25 Years | 3 (2.9%) | 99 (96.1%) |
| 25 to 34 Years | 29 (11.8%) | 123 (50.2%) |
| 35 to 44 Years | 20 (9.2%) | 198 (90.8%) |
| 45 to 54 Years | 22 (9.3%) | 208 (87.8%) |
| 55 to 64 Years | 25 (13.4%) | 159 (85.0%) |
| 65 to 74 Years | 159 (100.0%) | 44 (27.7%) |
| 75 Years and over | 66 (100.0%) | 30 (45.5%) |
| Total | 409 (23.6%) | 1,265 (73.0%) |
Disability Status by Sex by Age in Lewiston
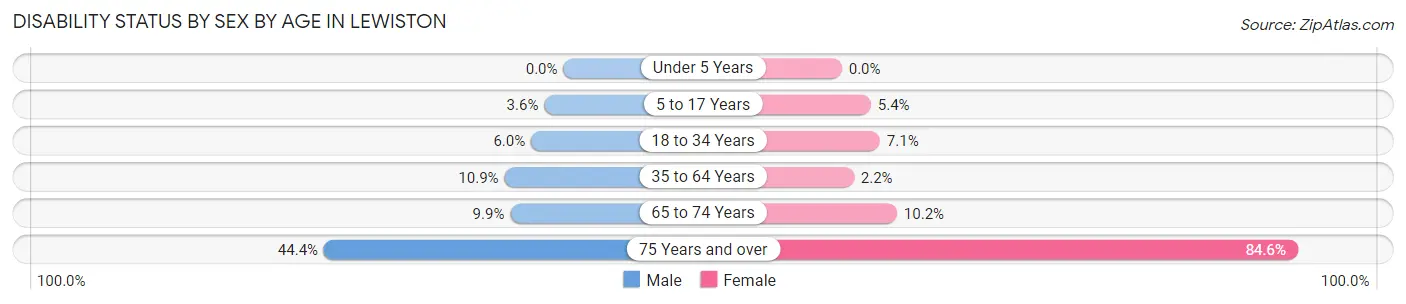
| Age Bracket | Male | Female |
| Under 5 Years | 0 (0.0%) | 0 (0.0%) |
| 5 to 17 Years | 7 (3.5%) | 11 (5.4%) |
| 18 to 34 Years | 17 (6.0%) | 7 (7.1%) |
| 35 to 64 Years | 36 (10.9%) | 7 (2.2%) |
| 65 to 74 Years | 7 (9.9%) | 9 (10.2%) |
| 75 Years and over | 12 (44.4%) | 33 (84.6%) |
Disability Class by Sex by Age in Lewiston
Disability Class: Hearing Difficulty
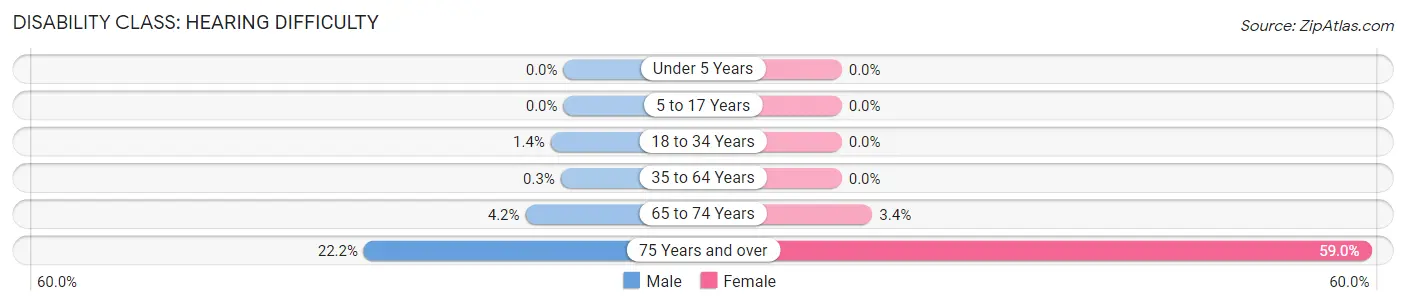
| Age Bracket | Male | Female |
| Under 5 Years | 0 (0.0%) | 0 (0.0%) |
| 5 to 17 Years | 0 (0.0%) | 0 (0.0%) |
| 18 to 34 Years | 4 (1.4%) | 0 (0.0%) |
| 35 to 64 Years | 1 (0.3%) | 0 (0.0%) |
| 65 to 74 Years | 3 (4.2%) | 3 (3.4%) |
| 75 Years and over | 6 (22.2%) | 23 (59.0%) |
Disability Class: Vision Difficulty
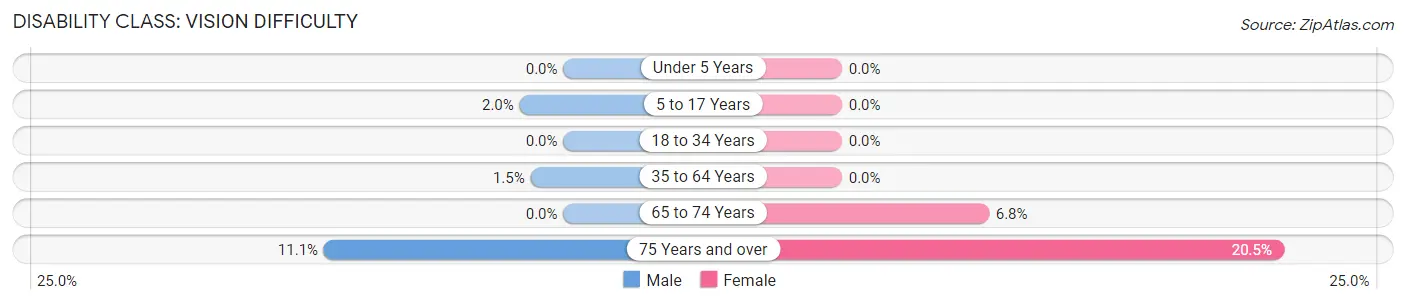
| Age Bracket | Male | Female |
| Under 5 Years | 0 (0.0%) | 0 (0.0%) |
| 5 to 17 Years | 4 (2.0%) | 0 (0.0%) |
| 18 to 34 Years | 0 (0.0%) | 0 (0.0%) |
| 35 to 64 Years | 5 (1.5%) | 0 (0.0%) |
| 65 to 74 Years | 0 (0.0%) | 6 (6.8%) |
| 75 Years and over | 3 (11.1%) | 8 (20.5%) |
Disability Class: Cognitive Difficulty
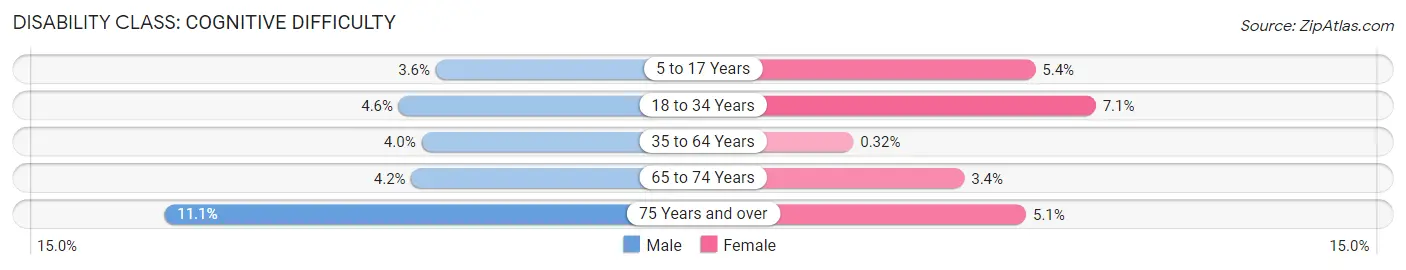
| Age Bracket | Male | Female |
| 5 to 17 Years | 7 (3.5%) | 11 (5.4%) |
| 18 to 34 Years | 13 (4.6%) | 7 (7.1%) |
| 35 to 64 Years | 13 (4.0%) | 1 (0.3%) |
| 65 to 74 Years | 3 (4.2%) | 3 (3.4%) |
| 75 Years and over | 3 (11.1%) | 2 (5.1%) |
Disability Class: Ambulatory Difficulty
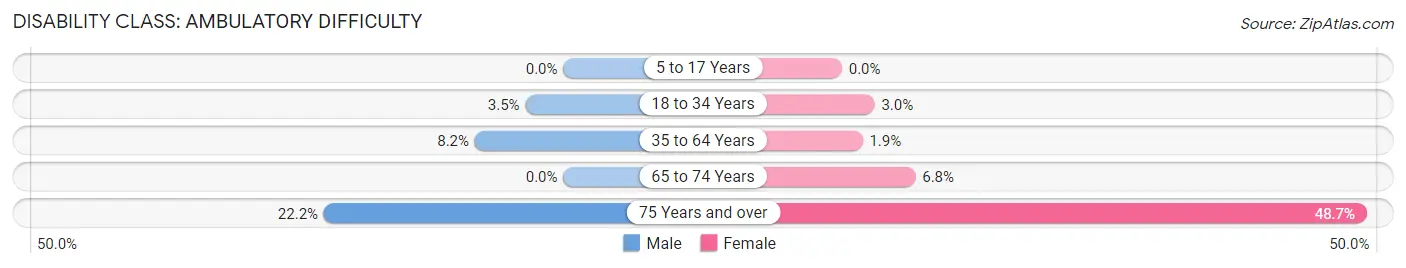
| Age Bracket | Male | Female |
| 5 to 17 Years | 0 (0.0%) | 0 (0.0%) |
| 18 to 34 Years | 10 (3.5%) | 3 (3.0%) |
| 35 to 64 Years | 27 (8.2%) | 6 (1.9%) |
| 65 to 74 Years | 0 (0.0%) | 6 (6.8%) |
| 75 Years and over | 6 (22.2%) | 19 (48.7%) |
Disability Class: Self-Care Difficulty
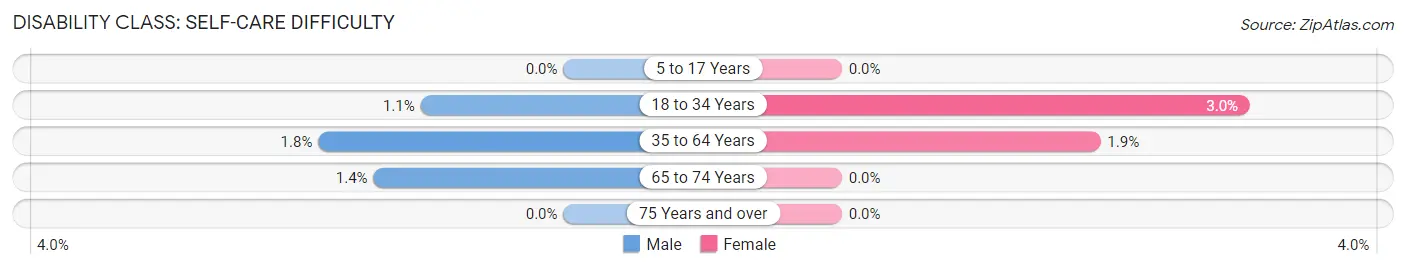
| Age Bracket | Male | Female |
| 5 to 17 Years | 0 (0.0%) | 0 (0.0%) |
| 18 to 34 Years | 3 (1.1%) | 3 (3.0%) |
| 35 to 64 Years | 6 (1.8%) | 6 (1.9%) |
| 65 to 74 Years | 1 (1.4%) | 0 (0.0%) |
| 75 Years and over | 0 (0.0%) | 0 (0.0%) |
Technology Access in Lewiston
Computing Device Access in Lewiston
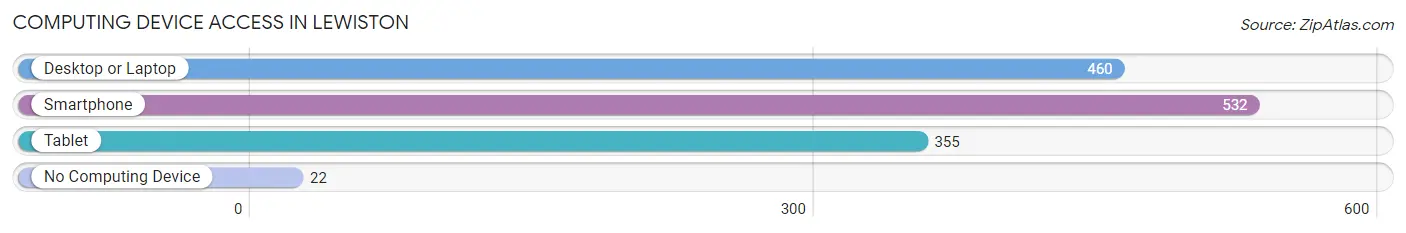
| Device Type | # Households | % Households |
| Desktop or Laptop | 460 | 79.4% |
| Smartphone | 532 | 91.9% |
| Tablet | 355 | 61.3% |
| No Computing Device | 22 | 3.8% |
| Total | 579 | 100.0% |
Internet Access in Lewiston
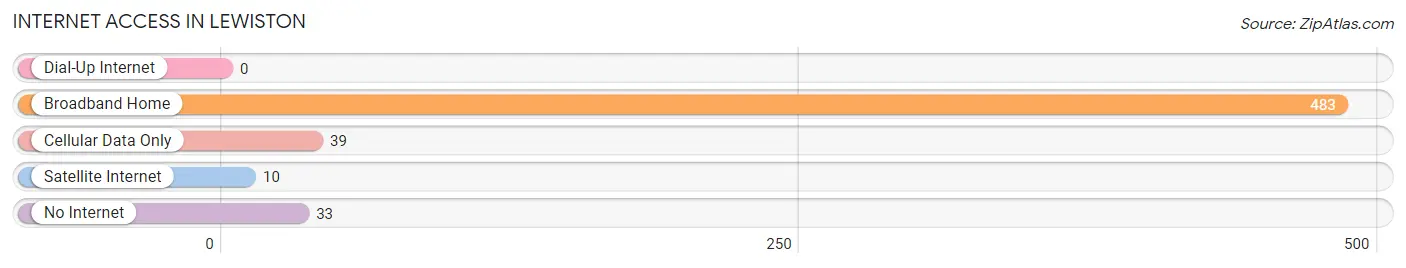
| Internet Type | # Households | % Households |
| Dial-Up Internet | 0 | 0.0% |
| Broadband Home | 483 | 83.4% |
| Cellular Data Only | 39 | 6.7% |
| Satellite Internet | 10 | 1.7% |
| No Internet | 33 | 5.7% |
| Total | 579 | 100.0% |
Lewiston Summary
Lewiston, Minnesota is a small city located in Winona County in the southeastern corner of the state. It is situated on the banks of the Mississippi River, just north of the city of Winona. The city has a population of approximately 1,800 people and is part of the larger Winona-Rochester metropolitan area.
History
The area that is now Lewiston was first settled in 1854 by a group of German immigrants. The town was originally called “New Germany” and was later renamed Lewiston in honor of the first settler, Lewis Schmieder. The town was officially incorporated in 1872.
In the late 19th century, Lewiston was a thriving agricultural community. The town was home to several grain mills, a sawmill, a flour mill, and a creamery. The town also had a brickyard, a blacksmith shop, and a general store.
In the early 20th century, Lewiston experienced a period of growth and prosperity. The town was home to several businesses, including a bank, a hotel, a movie theater, and a variety of stores. The town also had a public library, a post office, and a fire department.
Geography
Lewiston is located in the southeastern corner of Minnesota, on the banks of the Mississippi River. The city is situated in a valley between two hills, and is surrounded by rolling hills and farmland. The city is located approximately 25 miles north of the city of Winona, and is part of the larger Winona-Rochester metropolitan area.
The climate in Lewiston is typical of the Upper Midwest, with cold winters and hot, humid summers. The average annual temperature is around 50 degrees Fahrenheit, and the average annual precipitation is around 30 inches.
Economy
The economy of Lewiston is largely based on agriculture and tourism. The town is home to several farms, and the surrounding area is known for its fertile soil and abundant wildlife. The town is also home to several wineries, and is a popular destination for wine-tasting tours.
The town is also home to several small businesses, including restaurants, shops, and a variety of services. The town is also home to a small manufacturing plant, which produces a variety of products.
Demographics
As of the 2010 census, the population of Lewiston was 1,811. The racial makeup of the town was 97.3% White, 0.7% African American, 0.3% Native American, 0.2% Asian, 0.1% Pacific Islander, and 1.4% from other races. The median household income was $41,944, and the median family income was $50,917.
The town is home to a variety of religious denominations, including Catholic, Lutheran, Methodist, and Baptist. The town is also home to a variety of cultural and recreational activities, including a public library, a movie theater, and a variety of parks and trails.
Conclusion
Lewiston, Minnesota is a small city located in Winona County in the southeastern corner of the state. It is situated on the banks of the Mississippi River, just north of the city of Winona. The city has a population of approximately 1,800 people and is part of the larger Winona-Rochester metropolitan area. The economy of Lewiston is largely based on agriculture and tourism, and the town is home to several small businesses, including restaurants, shops, and a variety of services. The town is also home to a variety of religious denominations, and a variety of cultural and recreational activities.
Common Questions
What is Per Capita Income in Lewiston?
Per Capita income in Lewiston is $36,250.
What is the Median Family Income in Lewiston?
Median Family Income in Lewiston is $103,264.
What is the Median Household income in Lewiston?
Median Household Income in Lewiston is $89,219.
What is Income or Wage Gap in Lewiston?
Income or Wage Gap in Lewiston is 24.7%.
Women in Lewiston earn 75.3 cents for every dollar earned by a man.
What is Inequality or Gini Index in Lewiston?
Inequality or Gini Index in Lewiston is 0.39.
What is the Total Population of Lewiston?
Total Population of Lewiston is 1,768.
What is the Total Male Population of Lewiston?
Total Male Population of Lewiston is 957.
What is the Total Female Population of Lewiston?
Total Female Population of Lewiston is 811.
What is the Ratio of Males per 100 Females in Lewiston?
There are 118.00 Males per 100 Females in Lewiston.
What is the Ratio of Females per 100 Males in Lewiston?
There are 84.74 Females per 100 Males in Lewiston.
What is the Median Population Age in Lewiston?
Median Population Age in Lewiston is 35.7 Years.
What is the Average Family Size in Lewiston
Average Family Size in Lewiston is 3.5 People.
What is the Average Household Size in Lewiston
Average Household Size in Lewiston is 3.0 People.
How Large is the Labor Force in Lewiston?
There are 1,018 People in the Labor Forcein in Lewiston.
What is the Percentage of People in the Labor Force in Lewiston?
73.8% of People are in the Labor Force in Lewiston.
What is the Unemployment Rate in Lewiston?
Unemployment Rate in Lewiston is 3.6%.