Onamia, MN Map & Demographics
Onamia Map
Onamia Overview
$21,296
PER CAPITA INCOME
$47,105
AVG FAMILY INCOME
$25,417
AVG HOUSEHOLD INCOME
23.3%
WAGE / INCOME GAP [ % ]
76.7¢/ $1
WAGE / INCOME GAP [ $ ]
0.49
INEQUALITY / GINI INDEX
796
TOTAL POPULATION
372
MALE POPULATION
424
FEMALE POPULATION
87.74
MALES / 100 FEMALES
113.98
FEMALES / 100 MALES
44.4
MEDIAN AGE
2.9
AVG FAMILY SIZE
1.9
AVG HOUSEHOLD SIZE
254
LABOR FORCE [ PEOPLE ]
41.5%
PERCENT IN LABOR FORCE
3.5%
UNEMPLOYMENT RATE
Onamia Zip Codes
Onamia Area Codes
Income in Onamia
Income Overview in Onamia
Per Capita Income in Onamia is $21,296, while median incomes of families and households are $47,105 and $25,417 respectively.
| Characteristic | Number | Measure |
| Per Capita Income | 796 | $21,296 |
| Median Family Income | 152 | $47,105 |
| Mean Family Income | 152 | $60,155 |
| Median Household Income | 344 | $25,417 |
| Mean Household Income | 344 | $44,815 |
| Income Deficit | 152 | $0 |
| Wage / Income Gap (%) | 796 | 23.34% |
| Wage / Income Gap ($) | 796 | 76.66¢ per $1 |
| Gini / Inequality Index | 796 | 0.49 |
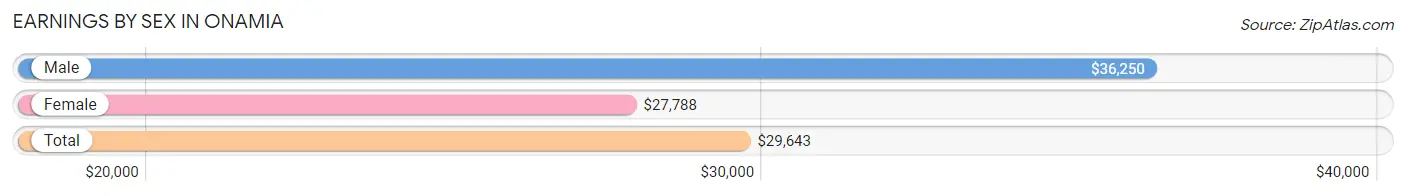
Earnings by Sex in Onamia
Average Earnings in Onamia are $29,643, $36,250 for men and $27,788 for women, a difference of 23.3%.
| Sex | Number | Average Earnings |
| Male | 129 (48.9%) | $36,250 |
| Female | 135 (51.1%) | $27,788 |
| Total | 264 (100.0%) | $29,643 |
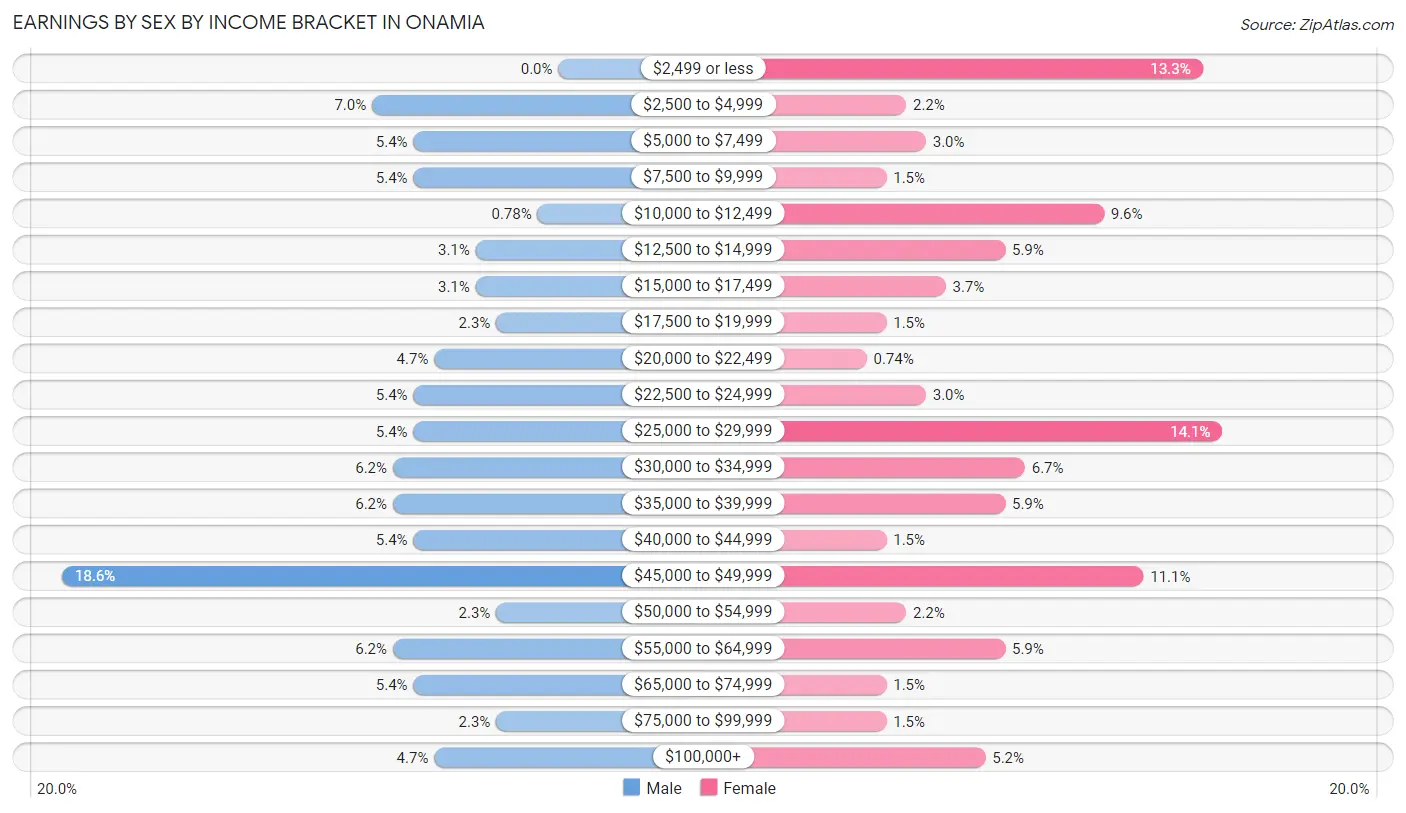
Earnings by Sex by Income Bracket in Onamia
The most common earnings brackets in Onamia are $45,000 to $49,999 for men (24 | 18.6%) and $25,000 to $29,999 for women (19 | 14.1%).
| Income | Male | Female |
| $2,499 or less | 0 (0.0%) | 18 (13.3%) |
| $2,500 to $4,999 | 9 (7.0%) | 3 (2.2%) |
| $5,000 to $7,499 | 7 (5.4%) | 4 (3.0%) |
| $7,500 to $9,999 | 7 (5.4%) | 2 (1.5%) |
| $10,000 to $12,499 | 1 (0.8%) | 13 (9.6%) |
| $12,500 to $14,999 | 4 (3.1%) | 8 (5.9%) |
| $15,000 to $17,499 | 4 (3.1%) | 5 (3.7%) |
| $17,500 to $19,999 | 3 (2.3%) | 2 (1.5%) |
| $20,000 to $22,499 | 6 (4.6%) | 1 (0.7%) |
| $22,500 to $24,999 | 7 (5.4%) | 4 (3.0%) |
| $25,000 to $29,999 | 7 (5.4%) | 19 (14.1%) |
| $30,000 to $34,999 | 8 (6.2%) | 9 (6.7%) |
| $35,000 to $39,999 | 8 (6.2%) | 8 (5.9%) |
| $40,000 to $44,999 | 7 (5.4%) | 2 (1.5%) |
| $45,000 to $49,999 | 24 (18.6%) | 15 (11.1%) |
| $50,000 to $54,999 | 3 (2.3%) | 3 (2.2%) |
| $55,000 to $64,999 | 8 (6.2%) | 8 (5.9%) |
| $65,000 to $74,999 | 7 (5.4%) | 2 (1.5%) |
| $75,000 to $99,999 | 3 (2.3%) | 2 (1.5%) |
| $100,000+ | 6 (4.6%) | 7 (5.2%) |
| Total | 129 (100.0%) | 135 (100.0%) |
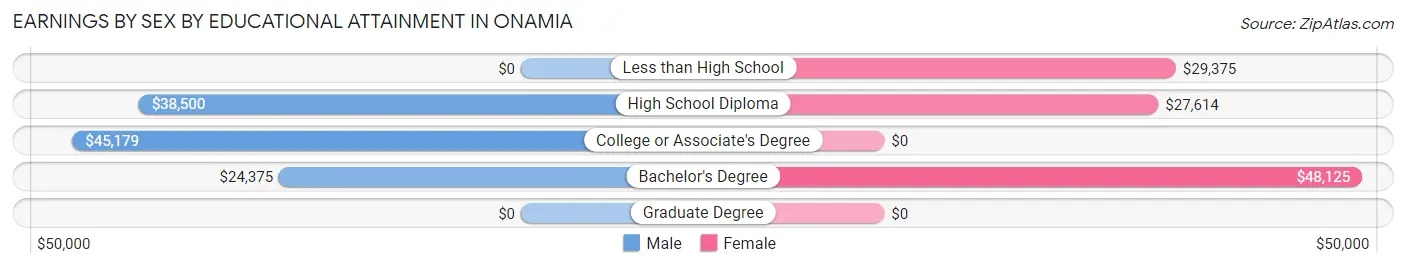
Earnings by Sex by Educational Attainment in Onamia
Average earnings in Onamia are $40,417 for men and $28,654 for women, a difference of 29.1%. Men with an educational attainment of college or associate's degree enjoy the highest average annual earnings of $45,179, while those with bachelor's degree education earn the least with $24,375. Women with an educational attainment of bachelor's degree earn the most with the average annual earnings of $48,125, while those with high school diploma education have the smallest earnings of $27,614.
| Educational Attainment | Male Income | Female Income |
| Less than High School | - | - |
| High School Diploma | $38,500 | $27,614 |
| College or Associate's Degree | $45,179 | $0 |
| Bachelor's Degree | $24,375 | $48,125 |
| Graduate Degree | - | - |
| Total | $40,417 | $28,654 |
Family Income in Onamia
Family Income Brackets in Onamia
According to the Onamia family income data, there are 31 families falling into the $50,000 to $74,999 income range, which is the most common income bracket and makes up 20.4% of all families. Conversely, the $150,000 to $199,999 income bracket is the least frequent group with only 4 families (2.6%) belonging to this category.
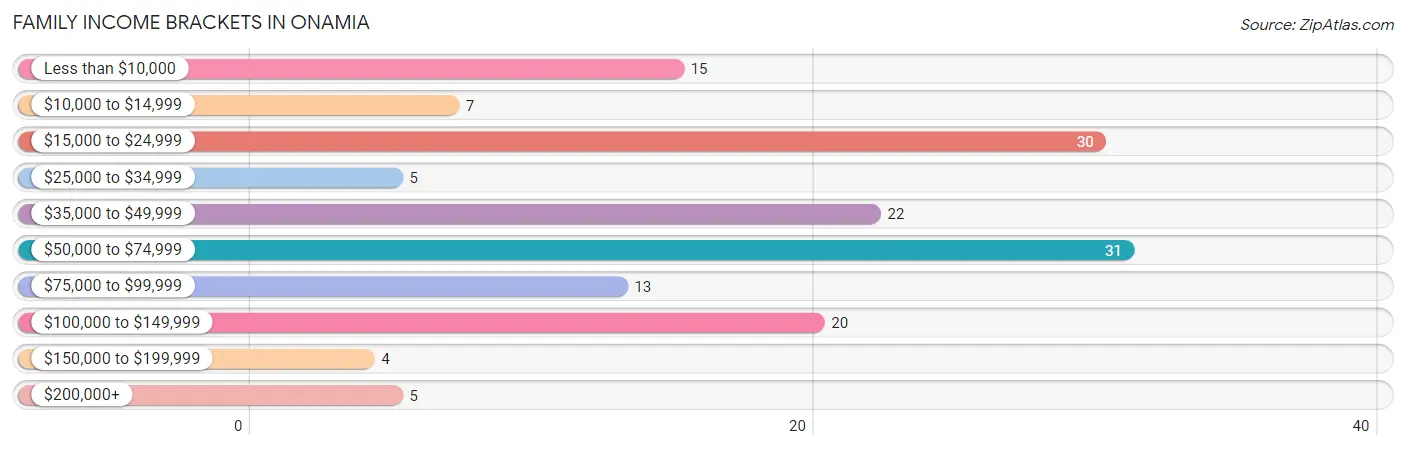
| Income Bracket | # Families | % Families |
| Less than $10,000 | 15 | 9.9% |
| $10,000 to $14,999 | 7 | 4.6% |
| $15,000 to $24,999 | 30 | 19.7% |
| $25,000 to $34,999 | 5 | 3.3% |
| $35,000 to $49,999 | 22 | 14.5% |
| $50,000 to $74,999 | 31 | 20.4% |
| $75,000 to $99,999 | 13 | 8.6% |
| $100,000 to $149,999 | 20 | 13.2% |
| $150,000 to $199,999 | 4 | 2.6% |
| $200,000+ | 5 | 3.3% |
Family Income by Famaliy Size in Onamia
4-person families (5 | 3.3%) account for the highest median family income in Onamia with $83,125 per family, while 2-person families (82 | 53.9%) have the highest median income of $22,916 per family member.
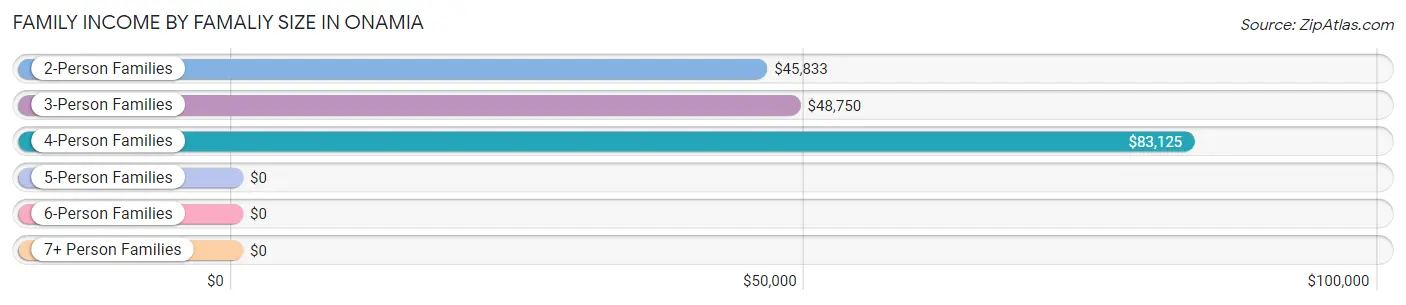
| Income Bracket | # Families | Median Income |
| 2-Person Families | 82 (53.9%) | $45,833 |
| 3-Person Families | 44 (28.9%) | $48,750 |
| 4-Person Families | 5 (3.3%) | $83,125 |
| 5-Person Families | 7 (4.6%) | $0 |
| 6-Person Families | 11 (7.2%) | $0 |
| 7+ Person Families | 3 (2.0%) | $0 |
| Total | 152 (100.0%) | $47,105 |
Family Income by Number of Earners in Onamia
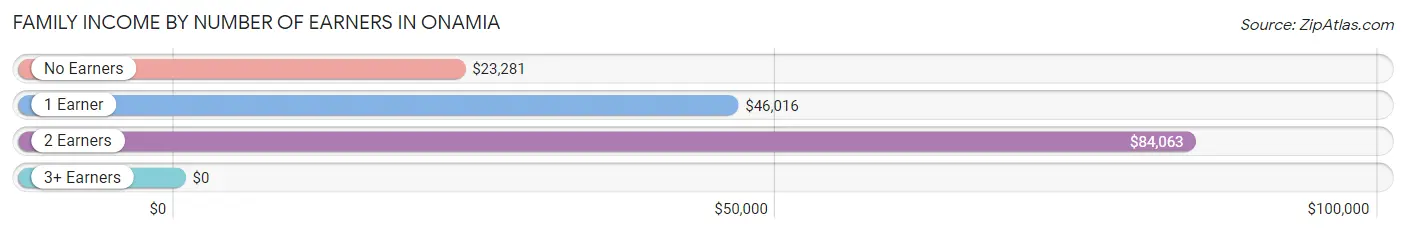
| Number of Earners | # Families | Median Income |
| No Earners | 39 (25.7%) | $23,281 |
| 1 Earner | 63 (41.4%) | $46,016 |
| 2 Earners | 45 (29.6%) | $84,063 |
| 3+ Earners | 5 (3.3%) | $0 |
| Total | 152 (100.0%) | $47,105 |
Household Income in Onamia
Household Income Brackets in Onamia
With 76 households falling in the category, the $15,000 to $24,999 income range is the most frequent in Onamia, accounting for 22.1% of all households. In contrast, only 6 households (1.7%) fall into the $150,000 to $199,999 income bracket, making it the least populous group.
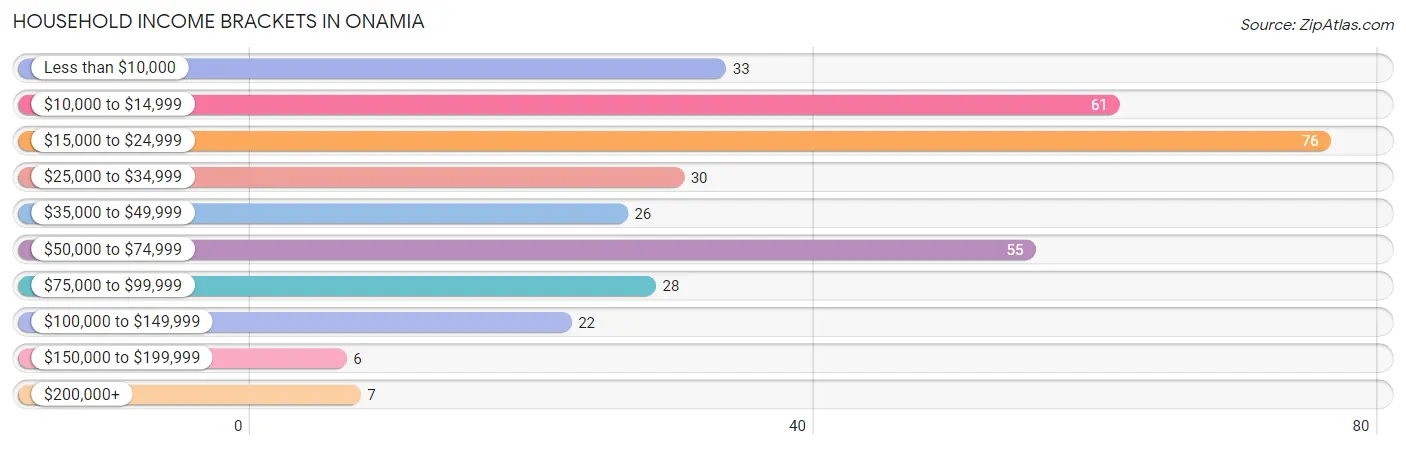
| Income Bracket | # Households | % Households |
| Less than $10,000 | 33 | 9.6% |
| $10,000 to $14,999 | 61 | 17.7% |
| $15,000 to $24,999 | 76 | 22.1% |
| $25,000 to $34,999 | 30 | 8.7% |
| $35,000 to $49,999 | 26 | 7.6% |
| $50,000 to $74,999 | 55 | 16.0% |
| $75,000 to $99,999 | 28 | 8.1% |
| $100,000 to $149,999 | 22 | 6.4% |
| $150,000 to $199,999 | 6 | 1.7% |
| $200,000+ | 7 | 2.0% |
Household Income by Householder Age in Onamia
The median household income in Onamia is $25,417, with the highest median household income of $33,281 found in the 25 to 44 years age bracket for the primary householder. A total of 105 households (30.5%) fall into this category. Meanwhile, the 15 to 24 years age bracket for the primary householder has the lowest median household income of $0, with 13 households (3.8%) in this group.
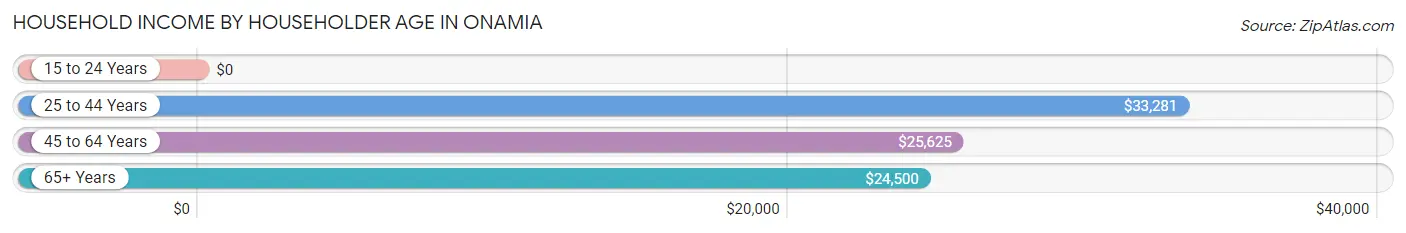
| Income Bracket | # Households | Median Income |
| 15 to 24 Years | 13 (3.8%) | $0 |
| 25 to 44 Years | 105 (30.5%) | $33,281 |
| 45 to 64 Years | 100 (29.1%) | $25,625 |
| 65+ Years | 126 (36.6%) | $24,500 |
| Total | 344 (100.0%) | $25,417 |
Poverty in Onamia
Income Below Poverty by Sex and Age in Onamia
With 18.8% poverty level for males and 32.2% for females among the residents of Onamia, 5 year old males and 16 and 17 year old females are the most vulnerable to poverty, with 6 males (100.0%) and 3 females (100.0%) in their respective age groups living below the poverty level.
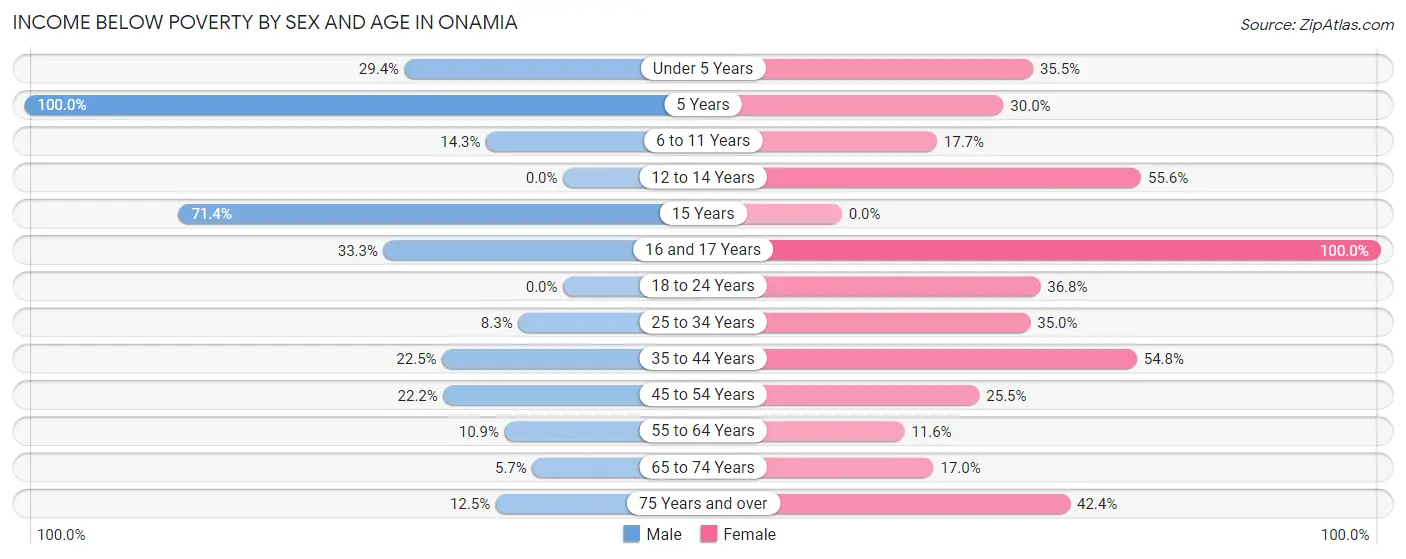
| Age Bracket | Male | Female |
| Under 5 Years | 10 (29.4%) | 11 (35.5%) |
| 5 Years | 6 (100.0%) | 3 (30.0%) |
| 6 to 11 Years | 3 (14.3%) | 3 (17.6%) |
| 12 to 14 Years | 0 (0.0%) | 5 (55.6%) |
| 15 Years | 5 (71.4%) | 0 (0.0%) |
| 16 and 17 Years | 4 (33.3%) | 3 (100.0%) |
| 18 to 24 Years | 0 (0.0%) | 7 (36.8%) |
| 25 to 34 Years | 2 (8.3%) | 14 (35.0%) |
| 35 to 44 Years | 11 (22.5%) | 23 (54.8%) |
| 45 to 54 Years | 4 (22.2%) | 12 (25.5%) |
| 55 to 64 Years | 5 (10.9%) | 5 (11.6%) |
| 65 to 74 Years | 2 (5.7%) | 8 (17.0%) |
| 75 Years and over | 3 (12.5%) | 25 (42.4%) |
| Total | 55 (18.8%) | 119 (32.2%) |
Income Above Poverty by Sex and Age in Onamia
According to the poverty statistics in Onamia, males aged 12 to 14 years and females aged 15 years are the age groups that are most secure financially, with 100.0% of males and 100.0% of females in these age groups living above the poverty line.
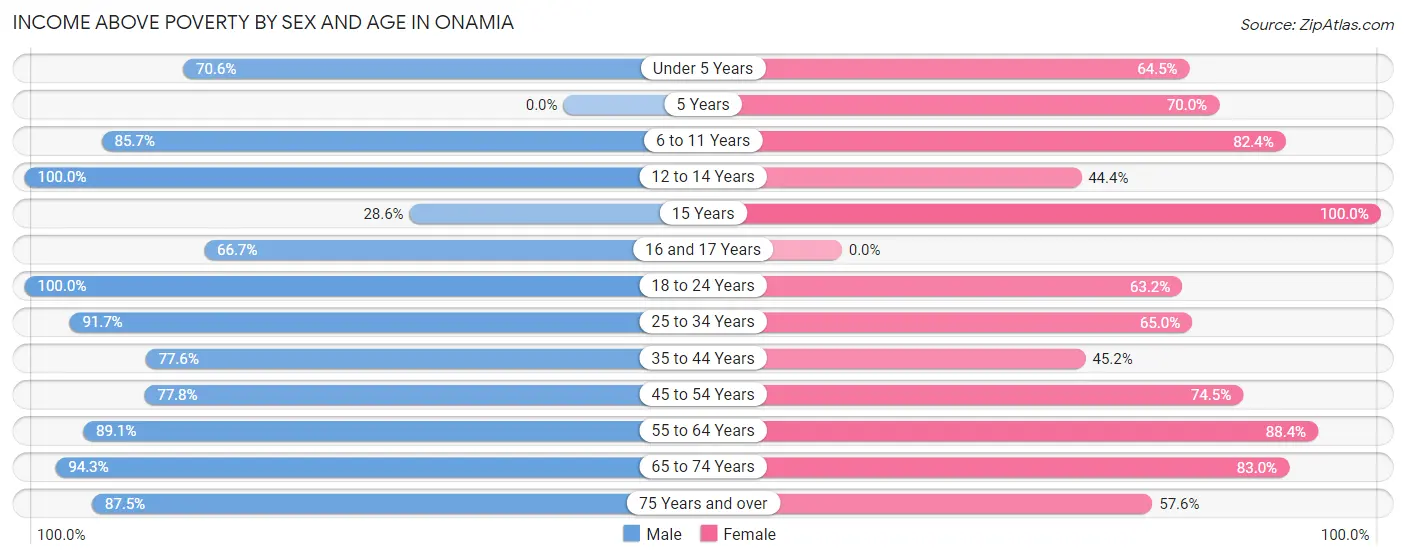
| Age Bracket | Male | Female |
| Under 5 Years | 24 (70.6%) | 20 (64.5%) |
| 5 Years | 0 (0.0%) | 7 (70.0%) |
| 6 to 11 Years | 18 (85.7%) | 14 (82.4%) |
| 12 to 14 Years | 7 (100.0%) | 4 (44.4%) |
| 15 Years | 2 (28.6%) | 3 (100.0%) |
| 16 and 17 Years | 8 (66.7%) | 0 (0.0%) |
| 18 to 24 Years | 9 (100.0%) | 12 (63.2%) |
| 25 to 34 Years | 22 (91.7%) | 26 (65.0%) |
| 35 to 44 Years | 38 (77.5%) | 19 (45.2%) |
| 45 to 54 Years | 14 (77.8%) | 35 (74.5%) |
| 55 to 64 Years | 41 (89.1%) | 38 (88.4%) |
| 65 to 74 Years | 33 (94.3%) | 39 (83.0%) |
| 75 Years and over | 21 (87.5%) | 34 (57.6%) |
| Total | 237 (81.2%) | 251 (67.8%) |
Income Below Poverty Among Married-Couple Families in Onamia
The poverty statistics for married-couple families in Onamia show that 6.9% or 5 of the total 72 families live below the poverty line. Families with no children have the highest poverty rate of 8.8%, comprising of 5 families. On the other hand, families with 1 or 2 children have the lowest poverty rate of 0.0%, which includes 0 families.
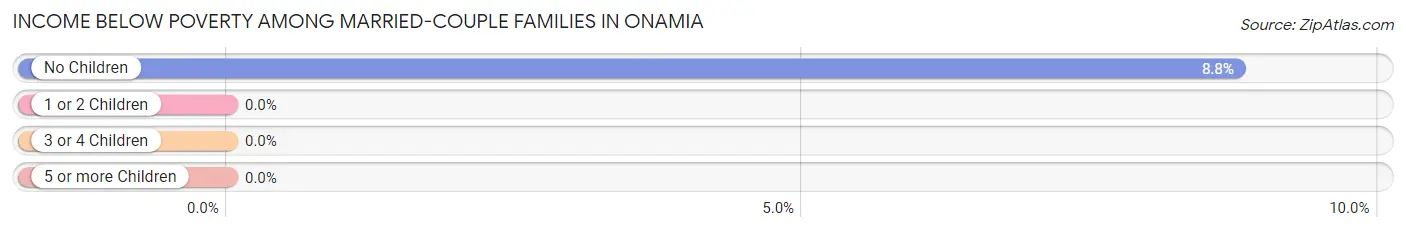
| Children | Above Poverty | Below Poverty |
| No Children | 52 (91.2%) | 5 (8.8%) |
| 1 or 2 Children | 12 (100.0%) | 0 (0.0%) |
| 3 or 4 Children | 3 (100.0%) | 0 (0.0%) |
| 5 or more Children | 0 (0.0%) | 0 (0.0%) |
| Total | 67 (93.1%) | 5 (6.9%) |
Income Below Poverty Among Single-Parent Households in Onamia
According to the poverty data in Onamia, 8.3% or 2 single-father households and 53.6% or 30 single-mother households are living below the poverty line. Among single-father households, those with 1 or 2 children have the highest poverty rate, with 2 households (10.0%) experiencing poverty. Likewise, among single-mother households, those with 1 or 2 children have the highest poverty rate, with 25 households (69.4%) falling below the poverty line.
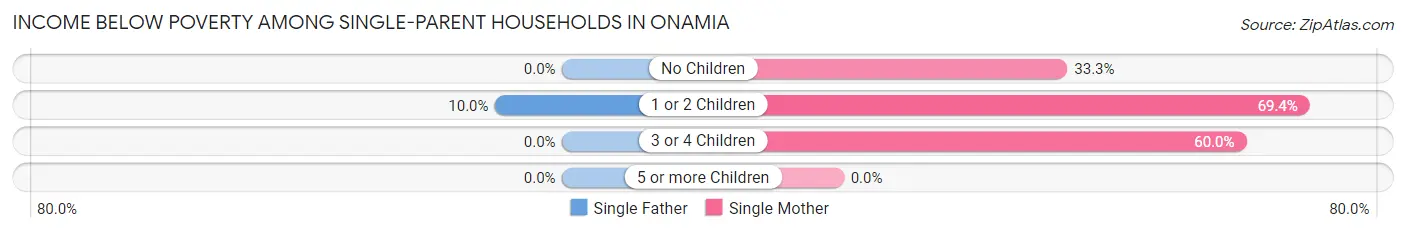
| Children | Single Father | Single Mother |
| No Children | 0 (0.0%) | 2 (33.3%) |
| 1 or 2 Children | 2 (10.0%) | 25 (69.4%) |
| 3 or 4 Children | 0 (0.0%) | 3 (60.0%) |
| 5 or more Children | 0 (0.0%) | 0 (0.0%) |
| Total | 2 (8.3%) | 30 (53.6%) |
Income Below Poverty Among Married-Couple vs Single-Parent Households in Onamia
The poverty data for Onamia shows that 5 of the married-couple family households (6.9%) and 32 of the single-parent households (40.0%) are living below the poverty level. Within the married-couple family households, those with no children have the highest poverty rate, with 5 households (8.8%) falling below the poverty line. Among the single-parent households, those with 3 or 4 children have the highest poverty rate, with 3 household (60.0%) living below poverty.
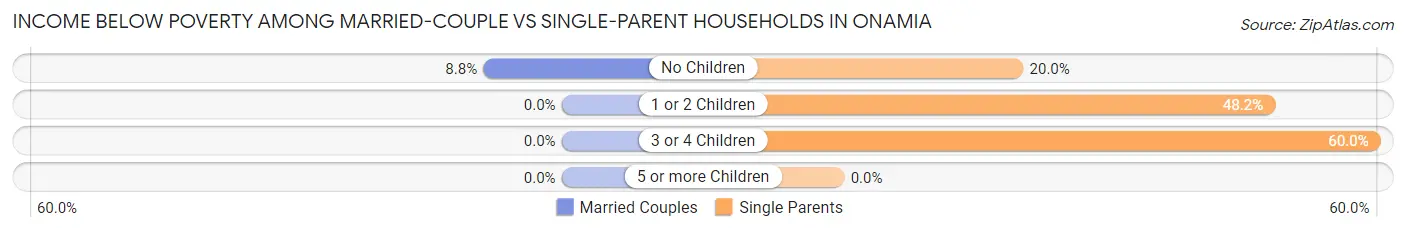
| Children | Married-Couple Families | Single-Parent Households |
| No Children | 5 (8.8%) | 2 (20.0%) |
| 1 or 2 Children | 0 (0.0%) | 27 (48.2%) |
| 3 or 4 Children | 0 (0.0%) | 3 (60.0%) |
| 5 or more Children | 0 (0.0%) | 0 (0.0%) |
| Total | 5 (6.9%) | 32 (40.0%) |
Race in Onamia
The most populous races in Onamia are White / Caucasian (619 | 77.8%), Two or more Races (102 | 12.8%), and Native / Alaskan (48 | 6.0%).
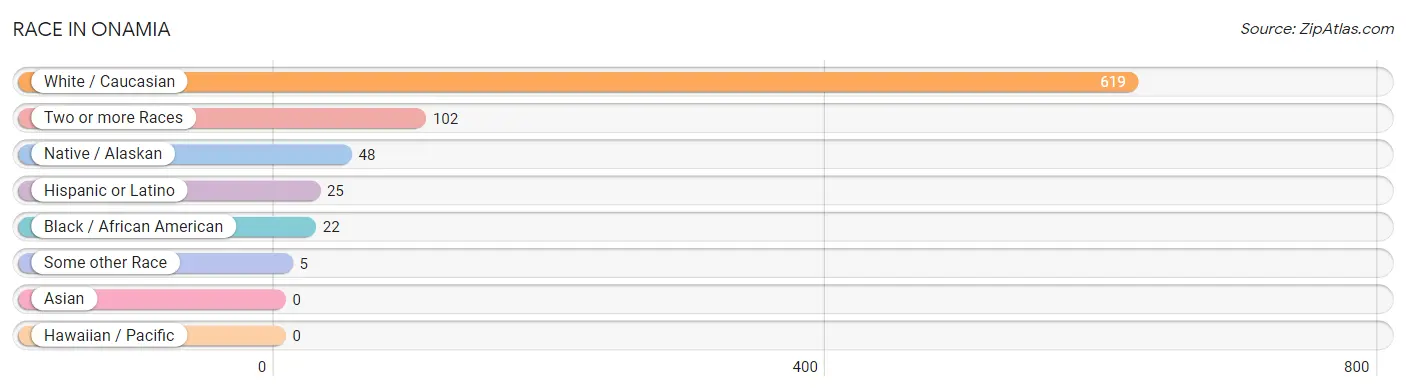
| Race | # Population | % Population |
| Asian | 0 | 0.0% |
| Black / African American | 22 | 2.8% |
| Hawaiian / Pacific | 0 | 0.0% |
| Hispanic or Latino | 25 | 3.1% |
| Native / Alaskan | 48 | 6.0% |
| White / Caucasian | 619 | 77.8% |
| Two or more Races | 102 | 12.8% |
| Some other Race | 5 | 0.6% |
| Total | 796 | 100.0% |
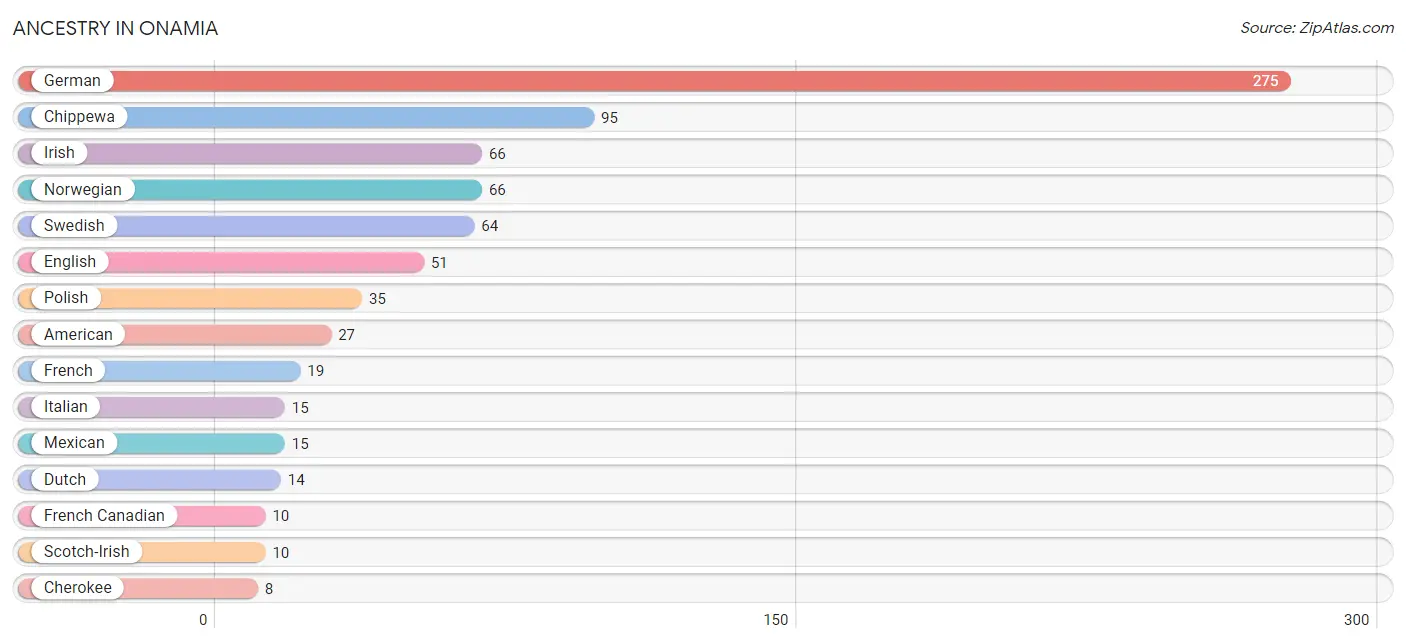
Ancestry in Onamia
The most populous ancestries reported in Onamia are German (275 | 34.5%), Chippewa (95 | 11.9%), Irish (66 | 8.3%), Norwegian (66 | 8.3%), and Swedish (64 | 8.0%), together accounting for 71.1% of all Onamia residents.
| Ancestry | # Population | % Population |
| American | 27 | 3.4% |
| Bhutanese | 1 | 0.1% |
| British | 3 | 0.4% |
| Cherokee | 8 | 1.0% |
| Chippewa | 95 | 11.9% |
| Colombian | 4 | 0.5% |
| Czech | 8 | 1.0% |
| Danish | 5 | 0.6% |
| Dutch | 14 | 1.8% |
| English | 51 | 6.4% |
| European | 5 | 0.6% |
| Finnish | 2 | 0.3% |
| French | 19 | 2.4% |
| French American Indian | 3 | 0.4% |
| French Canadian | 10 | 1.3% |
| German | 275 | 34.5% |
| Irish | 66 | 8.3% |
| Italian | 15 | 1.9% |
| Mexican | 15 | 1.9% |
| Norwegian | 66 | 8.3% |
| Polish | 35 | 4.4% |
| Puerto Rican | 4 | 0.5% |
| Russian | 3 | 0.4% |
| Scandinavian | 4 | 0.5% |
| Scotch-Irish | 10 | 1.3% |
| Scottish | 2 | 0.3% |
| Seminole | 5 | 0.6% |
| Sioux | 1 | 0.1% |
| Slovak | 2 | 0.3% |
| Somali | 2 | 0.3% |
| South American | 4 | 0.5% |
| Sri Lankan | 3 | 0.4% |
| Subsaharan African | 2 | 0.3% |
| Swedish | 64 | 8.0% | View All 34 Rows |
Immigrants in Onamia
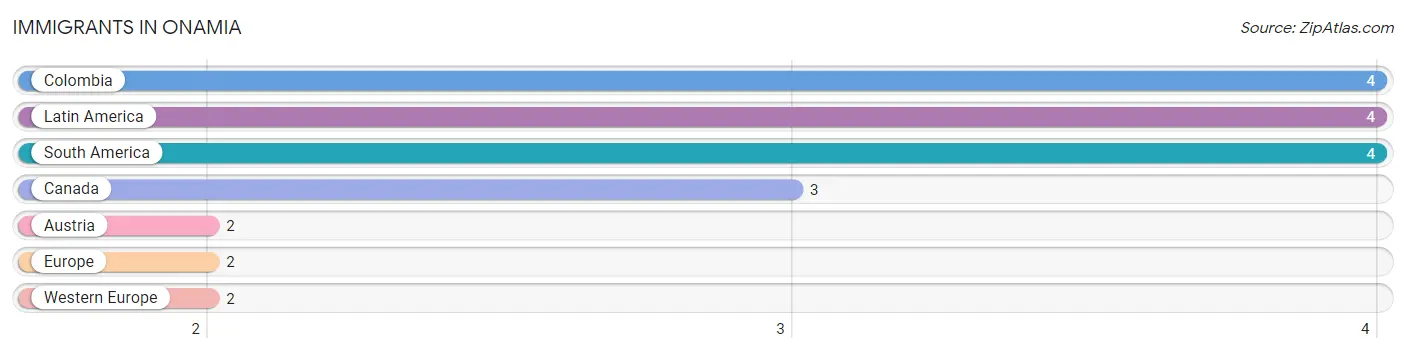
The most numerous immigrant groups reported in Onamia came from Colombia (4 | 0.5%), Latin America (4 | 0.5%), South America (4 | 0.5%), Canada (3 | 0.4%), and Austria (2 | 0.3%), together accounting for 2.1% of all Onamia residents.
| Immigration Origin | # Population | % Population |
| Austria | 2 | 0.3% |
| Canada | 3 | 0.4% |
| Colombia | 4 | 0.5% |
| Europe | 2 | 0.3% |
| Latin America | 4 | 0.5% |
| South America | 4 | 0.5% |
| Western Europe | 2 | 0.3% | View All 7 Rows |
Sex and Age in Onamia
Sex and Age in Onamia
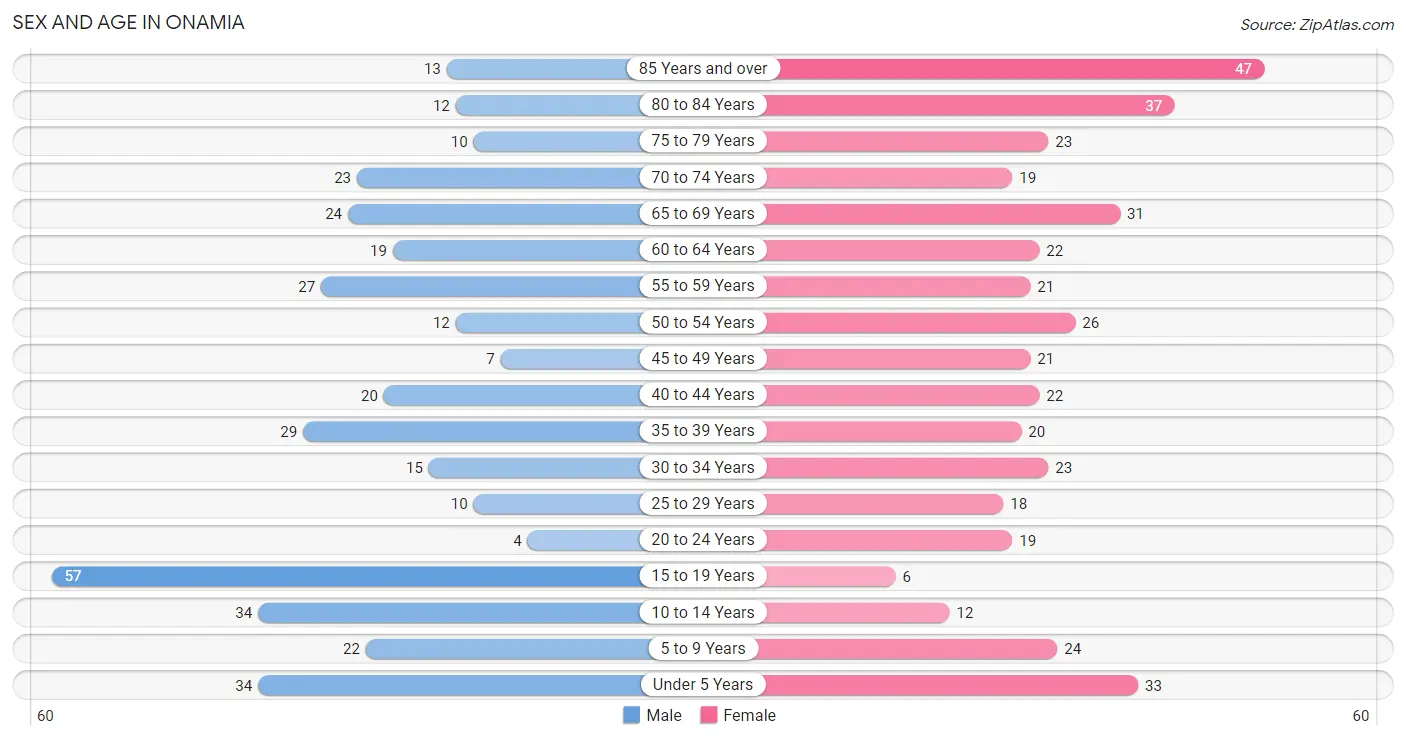
The most populous age groups in Onamia are 15 to 19 Years (57 | 15.3%) for men and 85 Years and over (47 | 11.1%) for women.
| Age Bracket | Male | Female |
| Under 5 Years | 34 (9.1%) | 33 (7.8%) |
| 5 to 9 Years | 22 (5.9%) | 24 (5.7%) |
| 10 to 14 Years | 34 (9.1%) | 12 (2.8%) |
| 15 to 19 Years | 57 (15.3%) | 6 (1.4%) |
| 20 to 24 Years | 4 (1.1%) | 19 (4.5%) |
| 25 to 29 Years | 10 (2.7%) | 18 (4.3%) |
| 30 to 34 Years | 15 (4.0%) | 23 (5.4%) |
| 35 to 39 Years | 29 (7.8%) | 20 (4.7%) |
| 40 to 44 Years | 20 (5.4%) | 22 (5.2%) |
| 45 to 49 Years | 7 (1.9%) | 21 (5.0%) |
| 50 to 54 Years | 12 (3.2%) | 26 (6.1%) |
| 55 to 59 Years | 27 (7.3%) | 21 (5.0%) |
| 60 to 64 Years | 19 (5.1%) | 22 (5.2%) |
| 65 to 69 Years | 24 (6.5%) | 31 (7.3%) |
| 70 to 74 Years | 23 (6.2%) | 19 (4.5%) |
| 75 to 79 Years | 10 (2.7%) | 23 (5.4%) |
| 80 to 84 Years | 12 (3.2%) | 37 (8.7%) |
| 85 Years and over | 13 (3.5%) | 47 (11.1%) |
| Total | 372 (100.0%) | 424 (100.0%) |
Families and Households in Onamia
Median Family Size in Onamia
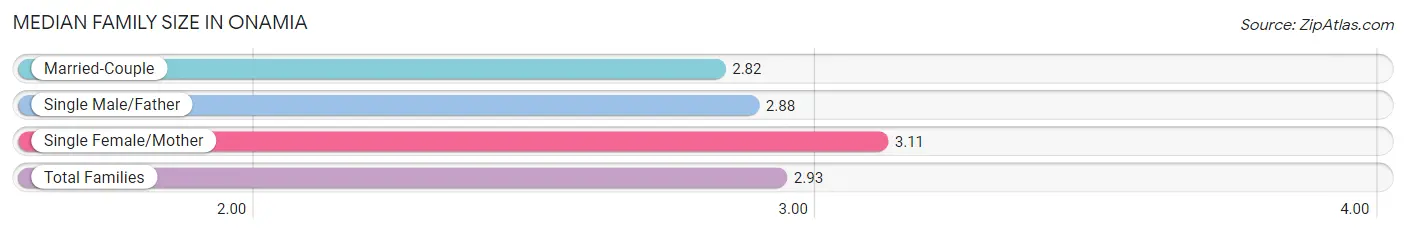
The median family size in Onamia is 2.93 persons per family, with single female/mother families (56 | 36.8%) accounting for the largest median family size of 3.11 persons per family. On the other hand, married-couple families (72 | 47.4%) represent the smallest median family size with 2.82 persons per family.
| Family Type | # Families | Family Size |
| Married-Couple | 72 (47.4%) | 2.82 |
| Single Male/Father | 24 (15.8%) | 2.88 |
| Single Female/Mother | 56 (36.8%) | 3.11 |
| Total Families | 152 (100.0%) | 2.93 |
Median Household Size in Onamia
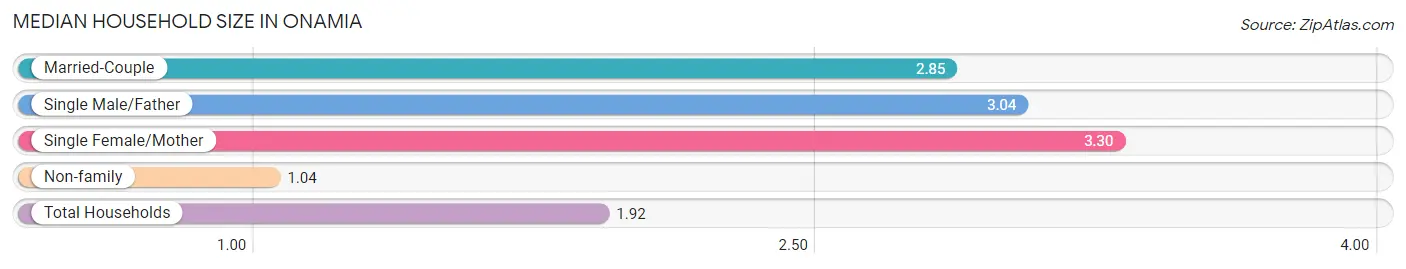
The median household size in Onamia is 1.92 persons per household, with single female/mother households (56 | 16.3%) accounting for the largest median household size of 3.3 persons per household. non-family households (192 | 55.8%) represent the smallest median household size with 1.04 persons per household.
| Household Type | # Households | Household Size |
| Married-Couple | 72 (20.9%) | 2.85 |
| Single Male/Father | 24 (7.0%) | 3.04 |
| Single Female/Mother | 56 (16.3%) | 3.30 |
| Non-family | 192 (55.8%) | 1.04 |
| Total Households | 344 (100.0%) | 1.92 |
Household Size by Marriage Status in Onamia
Out of a total of 344 households in Onamia, 152 (44.2%) are family households, while 192 (55.8%) are nonfamily households. The most numerous type of family households are 2-person households, comprising 74, and the most common type of nonfamily households are 1-person households, comprising 183.
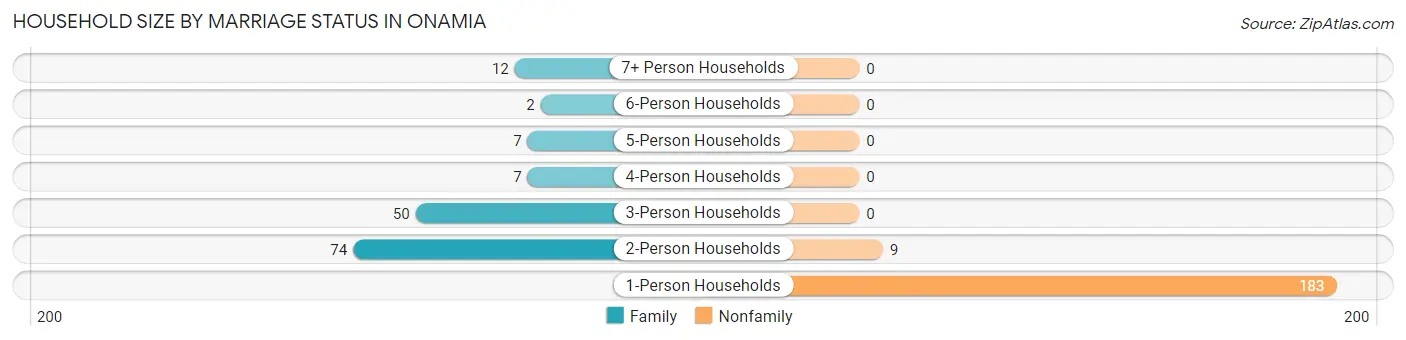
| Household Size | Family Households | Nonfamily Households |
| 1-Person Households | - | 183 (53.2%) |
| 2-Person Households | 74 (21.5%) | 9 (2.6%) |
| 3-Person Households | 50 (14.5%) | 0 (0.0%) |
| 4-Person Households | 7 (2.0%) | 0 (0.0%) |
| 5-Person Households | 7 (2.0%) | 0 (0.0%) |
| 6-Person Households | 2 (0.6%) | 0 (0.0%) |
| 7+ Person Households | 12 (3.5%) | 0 (0.0%) |
| Total | 152 (44.2%) | 192 (55.8%) |
Female Fertility in Onamia
Fertility by Age in Onamia
Average fertility rate in Onamia is 23.0 births per 1,000 women. Women in the age bracket of 20 to 34 years have the highest fertility rate with 50.0 births per 1,000 women. Women in the age bracket of 20 to 34 years acount for 100.0% of all women with births.
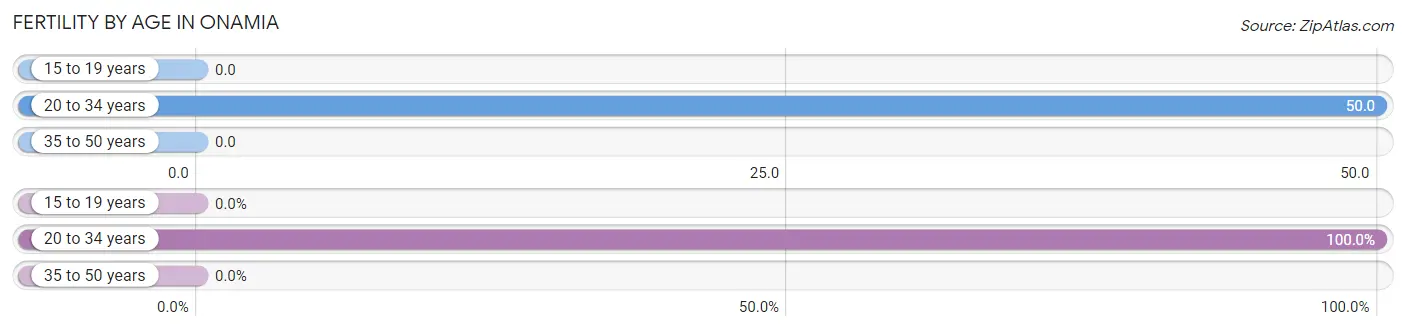
| Age Bracket | Women with Births | Births / 1,000 Women |
| 15 to 19 years | 0 (0.0%) | 0.0 |
| 20 to 34 years | 3 (100.0%) | 50.0 |
| 35 to 50 years | 0 (0.0%) | 0.0 |
| Total | 3 (100.0%) | 23.0 |
Fertility by Age by Marriage Status in Onamia
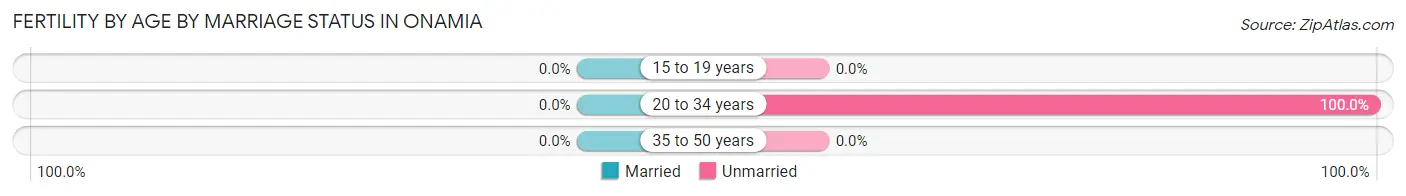
| Age Bracket | Married | Unmarried |
| 15 to 19 years | 0 (0.0%) | 0 (0.0%) |
| 20 to 34 years | 0 (0.0%) | 3 (100.0%) |
| 35 to 50 years | 0 (0.0%) | 0 (0.0%) |
| Total | 0 (0.0%) | 3 (100.0%) |
Fertility by Education in Onamia
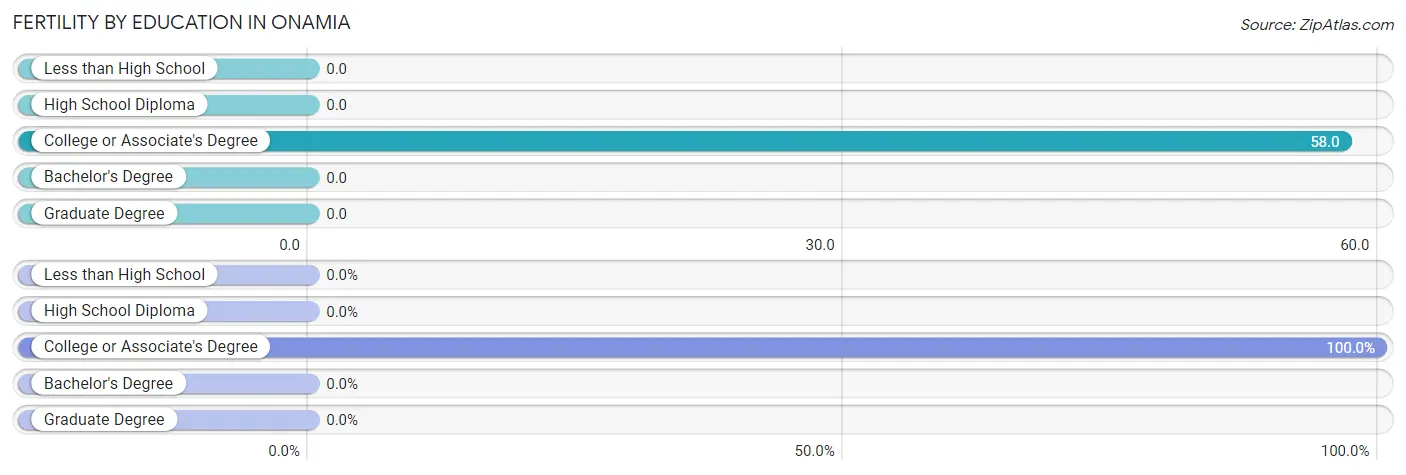
| Educational Attainment | Women with Births | Births / 1,000 Women |
| Less than High School | 0 (0.0%) | 0.0 |
| High School Diploma | 0 (0.0%) | 0.0 |
| College or Associate's Degree | 3 (100.0%) | 58.0 |
| Bachelor's Degree | 0 (0.0%) | 0.0 |
| Graduate Degree | 0 (0.0%) | 0.0 |
| Total | 3 (100.0%) | 23.0 |
Fertility by Education by Marriage Status in Onamia
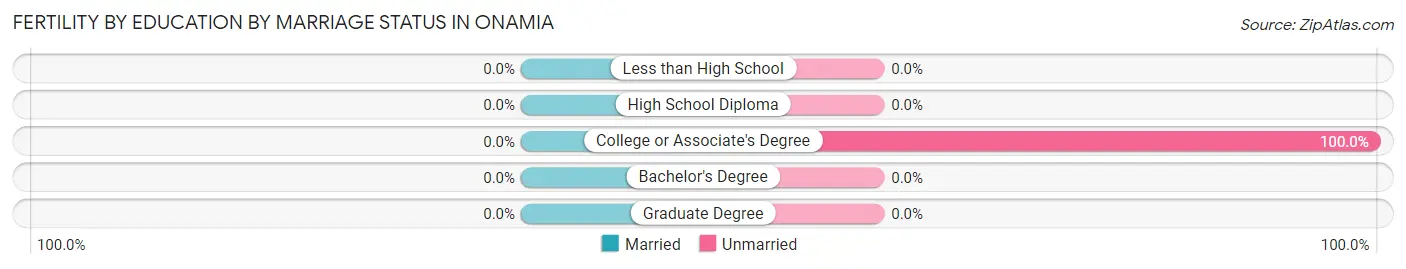
| Educational Attainment | Married | Unmarried |
| Less than High School | 0 (0.0%) | 0 (0.0%) |
| High School Diploma | 0 (0.0%) | 0 (0.0%) |
| College or Associate's Degree | 0 (0.0%) | 3 (100.0%) |
| Bachelor's Degree | 0 (0.0%) | 0 (0.0%) |
| Graduate Degree | 0 (0.0%) | 0 (0.0%) |
| Total | 0 (0.0%) | 3 (100.0%) |
Employment Characteristics in Onamia
Employment by Class of Employer in Onamia
Among the 242 employed individuals in Onamia, private company employees (147 | 60.7%), not-for-profit organizations (39 | 16.1%), and local government employees (31 | 12.8%) make up the most common classes of employment.
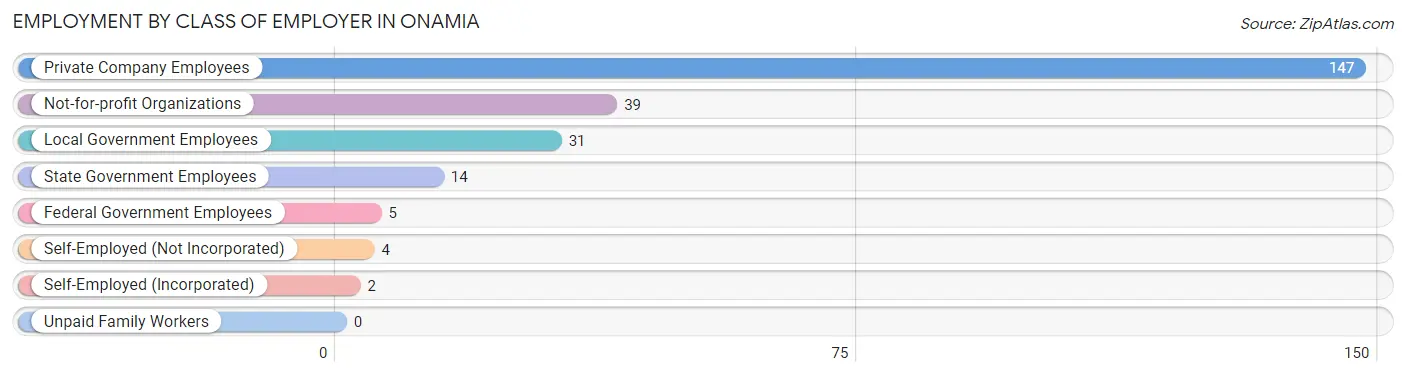
| Employer Class | # Employees | % Employees |
| Private Company Employees | 147 | 60.7% |
| Self-Employed (Incorporated) | 2 | 0.8% |
| Self-Employed (Not Incorporated) | 4 | 1.7% |
| Not-for-profit Organizations | 39 | 16.1% |
| Local Government Employees | 31 | 12.8% |
| State Government Employees | 14 | 5.8% |
| Federal Government Employees | 5 | 2.1% |
| Unpaid Family Workers | 0 | 0.0% |
| Total | 242 | 100.0% |
Employment Status by Age in Onamia
According to the labor force statistics for Onamia, out of the total population over 16 years of age (612), 41.5% or 254 individuals are in the labor force, with 3.5% or 9 of them unemployed. The age group with the highest labor force participation rate is 20 to 24 years, with 100.0% or 23 individuals in the labor force. Within the labor force, the 16 to 19 years age range has the highest percentage of unemployed individuals, with 27.3% or 3 of them being unemployed.
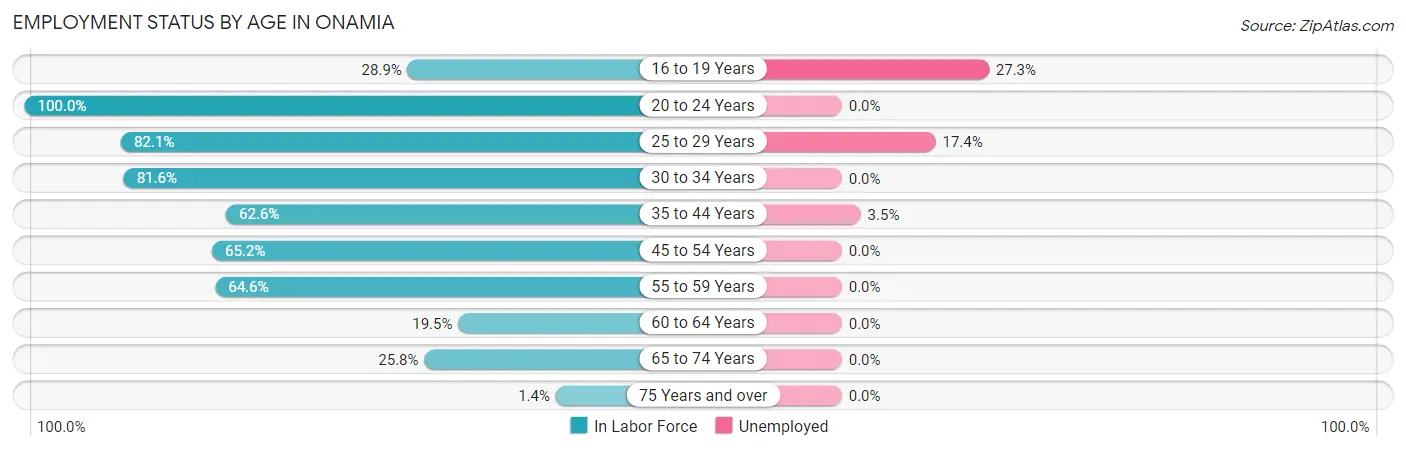
| Age Bracket | In Labor Force | Unemployed |
| 16 to 19 Years | 11 (28.9%) | 3 (27.3%) |
| 20 to 24 Years | 23 (100.0%) | 0 (0.0%) |
| 25 to 29 Years | 23 (82.1%) | 4 (17.4%) |
| 30 to 34 Years | 31 (81.6%) | 0 (0.0%) |
| 35 to 44 Years | 57 (62.6%) | 2 (3.5%) |
| 45 to 54 Years | 43 (65.2%) | 0 (0.0%) |
| 55 to 59 Years | 31 (64.6%) | 0 (0.0%) |
| 60 to 64 Years | 8 (19.5%) | 0 (0.0%) |
| 65 to 74 Years | 25 (25.8%) | 0 (0.0%) |
| 75 Years and over | 2 (1.4%) | 0 (0.0%) |
| Total | 254 (41.5%) | 9 (3.5%) |
Employment Status by Educational Attainment in Onamia
According to labor force statistics for Onamia, 61.9% of individuals (193) out of the total population between 25 and 64 years of age (312) are in the labor force, with 3.1% or 6 of them being unemployed. The group with the highest labor force participation rate are those with the educational attainment of college / associate degree, with 73.5% or 83 individuals in the labor force. Within the labor force, individuals with high school diploma education have the highest percentage of unemployment, with 9.7% or 6 of them being unemployed.
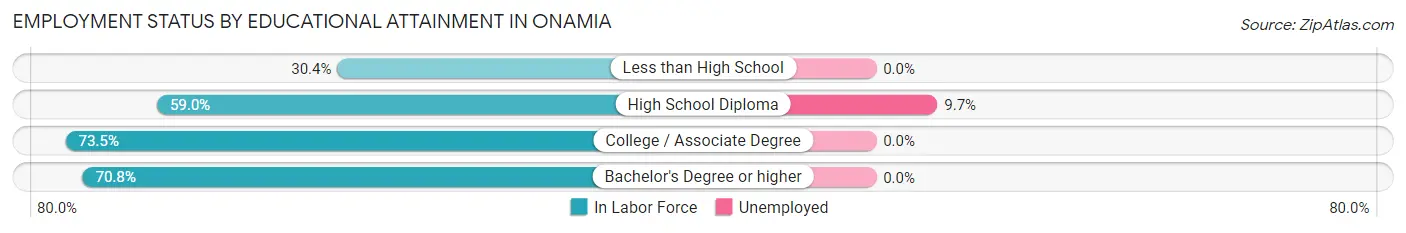
| Educational Attainment | In Labor Force | Unemployed |
| Less than High School | 14 (30.4%) | 0 (0.0%) |
| High School Diploma | 62 (59.0%) | 10 (9.7%) |
| College / Associate Degree | 83 (73.5%) | 0 (0.0%) |
| Bachelor's Degree or higher | 34 (70.8%) | 0 (0.0%) |
| Total | 193 (61.9%) | 10 (3.1%) |
Employment Occupations by Sex in Onamia
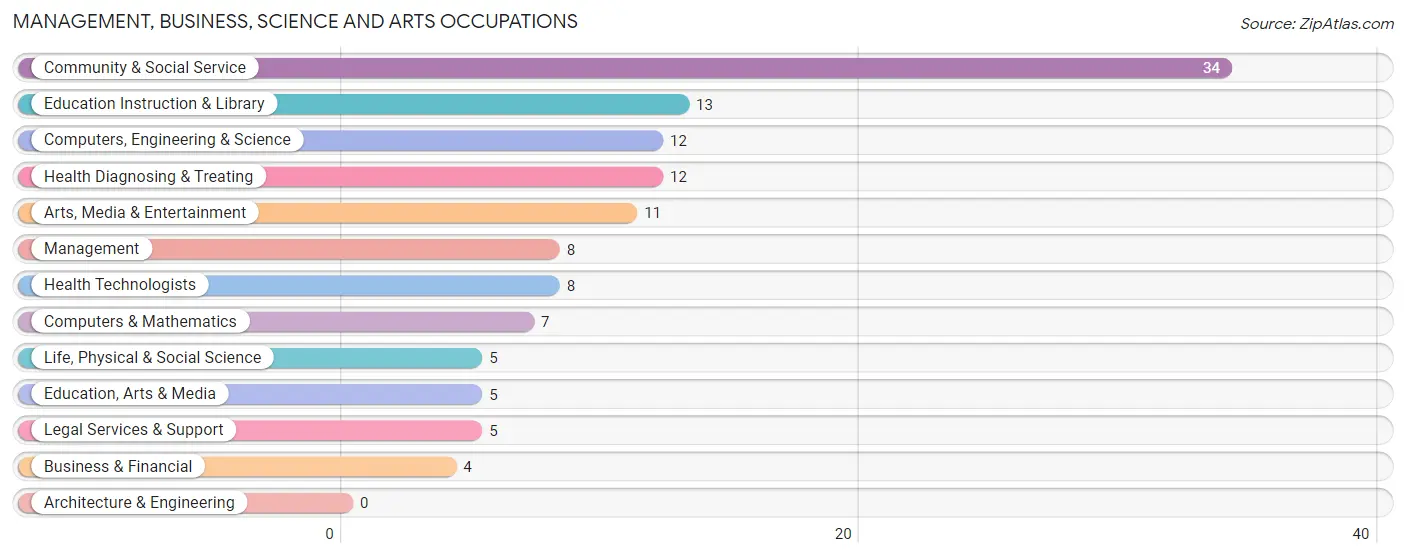
Management, Business, Science and Arts Occupations
The most common Management, Business, Science and Arts occupations in Onamia are Community & Social Service (34 | 13.9%), Education Instruction & Library (13 | 5.3%), Computers, Engineering & Science (12 | 4.9%), Health Diagnosing & Treating (12 | 4.9%), and Arts, Media & Entertainment (11 | 4.5%).
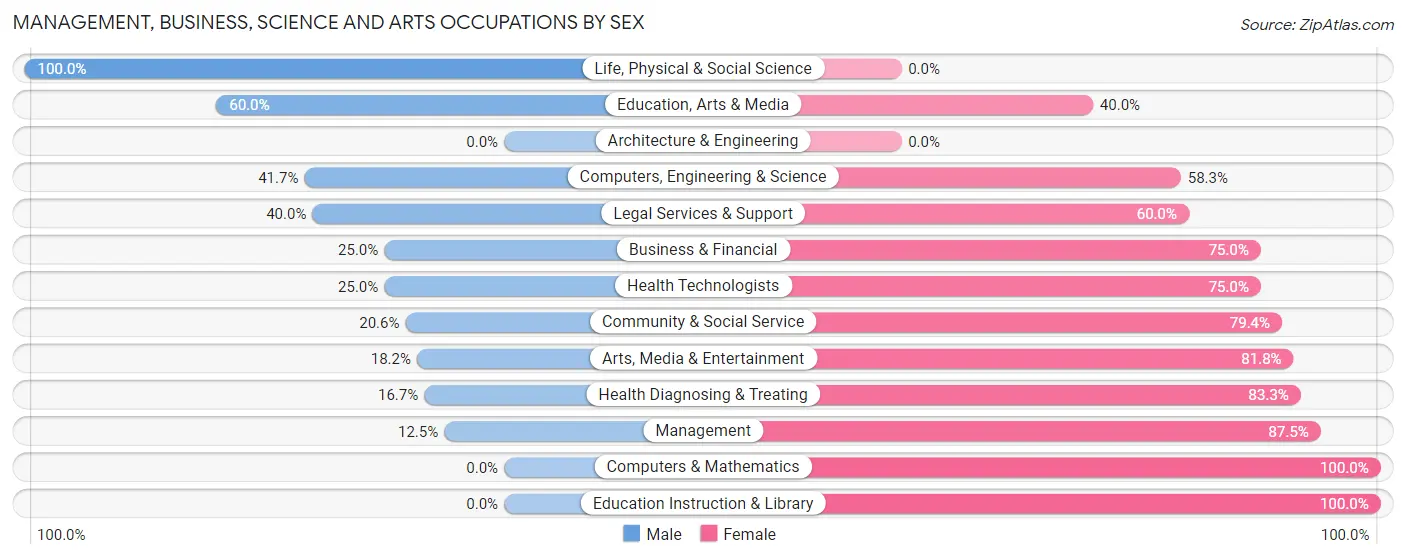
Management, Business, Science and Arts Occupations by Sex
Within the Management, Business, Science and Arts occupations in Onamia, the most male-oriented occupations are Life, Physical & Social Science (100.0%), Education, Arts & Media (60.0%), and Computers, Engineering & Science (41.7%), while the most female-oriented occupations are Computers & Mathematics (100.0%), Education Instruction & Library (100.0%), and Management (87.5%).
| Occupation | Male | Female |
| Management | 1 (12.5%) | 7 (87.5%) |
| Business & Financial | 1 (25.0%) | 3 (75.0%) |
| Computers, Engineering & Science | 5 (41.7%) | 7 (58.3%) |
| Computers & Mathematics | 0 (0.0%) | 7 (100.0%) |
| Architecture & Engineering | 0 (0.0%) | 0 (0.0%) |
| Life, Physical & Social Science | 5 (100.0%) | 0 (0.0%) |
| Community & Social Service | 7 (20.6%) | 27 (79.4%) |
| Education, Arts & Media | 3 (60.0%) | 2 (40.0%) |
| Legal Services & Support | 2 (40.0%) | 3 (60.0%) |
| Education Instruction & Library | 0 (0.0%) | 13 (100.0%) |
| Arts, Media & Entertainment | 2 (18.2%) | 9 (81.8%) |
| Health Diagnosing & Treating | 2 (16.7%) | 10 (83.3%) |
| Health Technologists | 2 (25.0%) | 6 (75.0%) |
| Total (Category) | 16 (22.9%) | 54 (77.1%) |
| Total (Overall) | 115 (46.9%) | 130 (53.1%) |
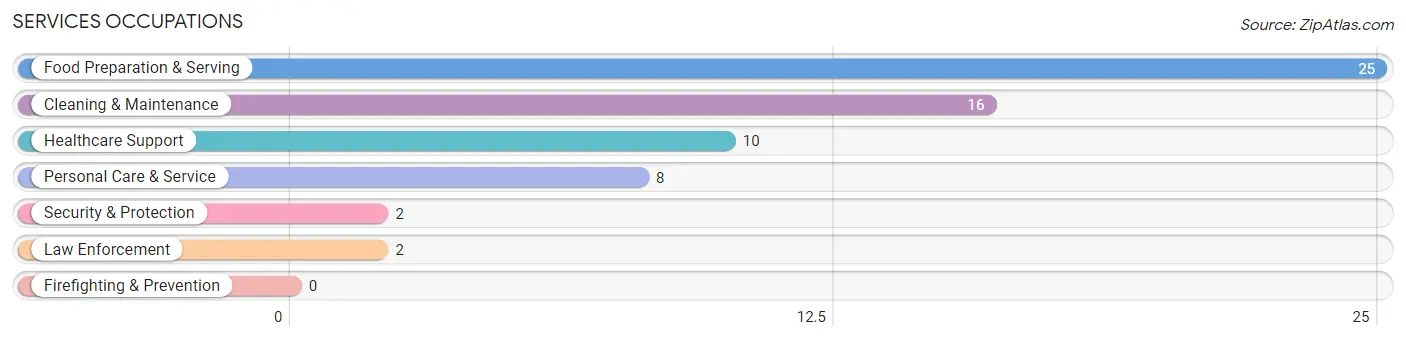
Services Occupations
The most common Services occupations in Onamia are Food Preparation & Serving (25 | 10.2%), Cleaning & Maintenance (16 | 6.5%), Healthcare Support (10 | 4.1%), Personal Care & Service (8 | 3.3%), and Security & Protection (2 | 0.8%).
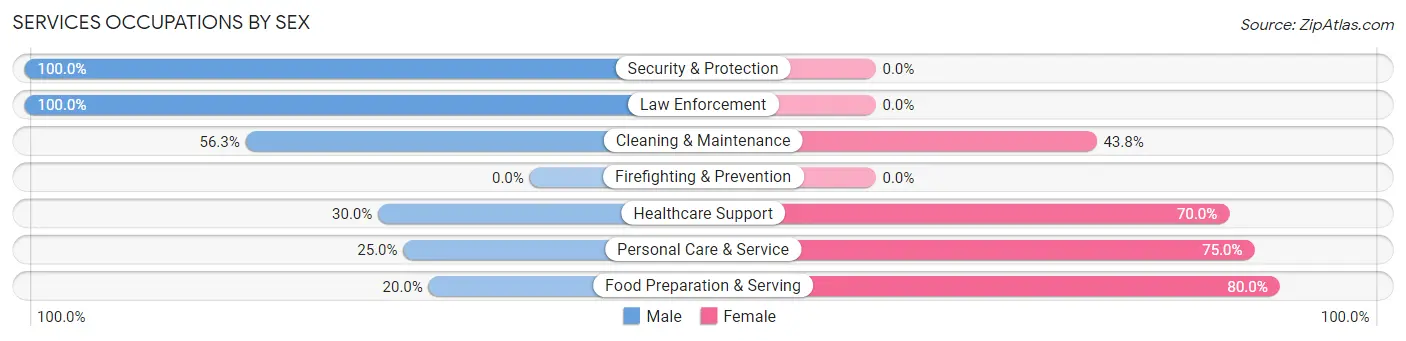
Services Occupations by Sex
Within the Services occupations in Onamia, the most male-oriented occupations are Security & Protection (100.0%), Law Enforcement (100.0%), and Cleaning & Maintenance (56.2%), while the most female-oriented occupations are Food Preparation & Serving (80.0%), Personal Care & Service (75.0%), and Healthcare Support (70.0%).
| Occupation | Male | Female |
| Healthcare Support | 3 (30.0%) | 7 (70.0%) |
| Security & Protection | 2 (100.0%) | 0 (0.0%) |
| Firefighting & Prevention | 0 (0.0%) | 0 (0.0%) |
| Law Enforcement | 2 (100.0%) | 0 (0.0%) |
| Food Preparation & Serving | 5 (20.0%) | 20 (80.0%) |
| Cleaning & Maintenance | 9 (56.2%) | 7 (43.8%) |
| Personal Care & Service | 2 (25.0%) | 6 (75.0%) |
| Total (Category) | 21 (34.4%) | 40 (65.6%) |
| Total (Overall) | 115 (46.9%) | 130 (53.1%) |
Sales and Office Occupations
The most common Sales and Office occupations in Onamia are Sales & Related (26 | 10.6%), and Office & Administration (16 | 6.5%).
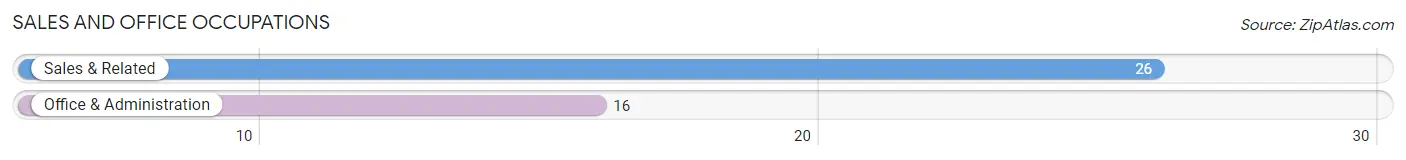
Sales and Office Occupations by Sex
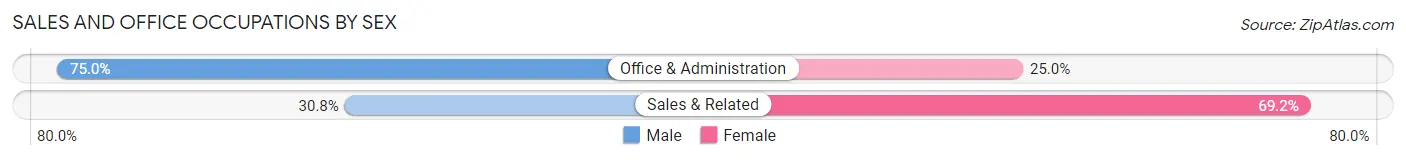
| Occupation | Male | Female |
| Sales & Related | 8 (30.8%) | 18 (69.2%) |
| Office & Administration | 12 (75.0%) | 4 (25.0%) |
| Total (Category) | 20 (47.6%) | 22 (52.4%) |
| Total (Overall) | 115 (46.9%) | 130 (53.1%) |
Natural Resources, Construction and Maintenance Occupations
The most common Natural Resources, Construction and Maintenance occupations in Onamia are Construction & Extraction (24 | 9.8%), and Farming, Fishing & Forestry (4 | 1.6%).
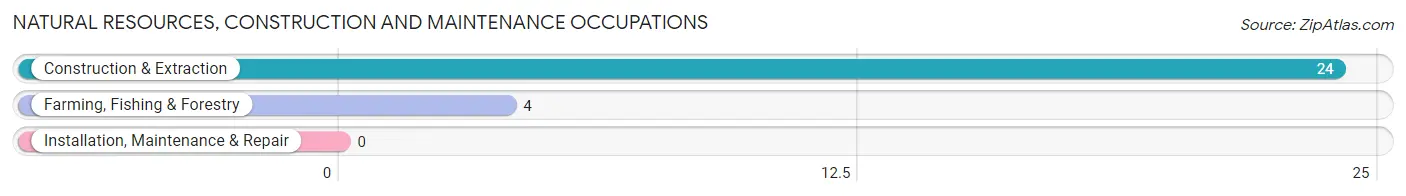
Natural Resources, Construction and Maintenance Occupations by Sex

| Occupation | Male | Female |
| Farming, Fishing & Forestry | 4 (100.0%) | 0 (0.0%) |
| Construction & Extraction | 24 (100.0%) | 0 (0.0%) |
| Installation, Maintenance & Repair | 0 (0.0%) | 0 (0.0%) |
| Total (Category) | 28 (100.0%) | 0 (0.0%) |
| Total (Overall) | 115 (46.9%) | 130 (53.1%) |
Production, Transportation and Moving Occupations
The most common Production, Transportation and Moving occupations in Onamia are Production (22 | 9.0%), Material Moving (13 | 5.3%), and Transportation (9 | 3.7%).
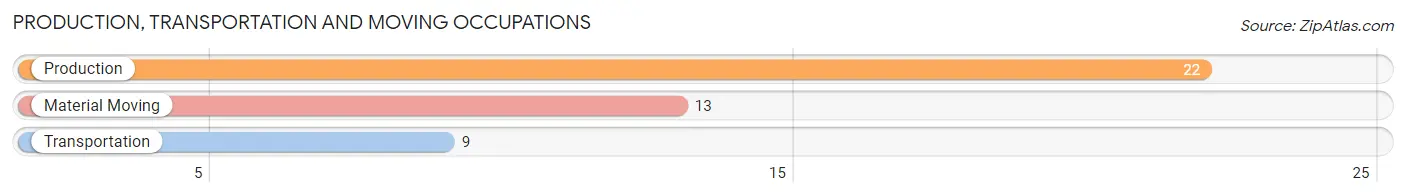
Production, Transportation and Moving Occupations by Sex
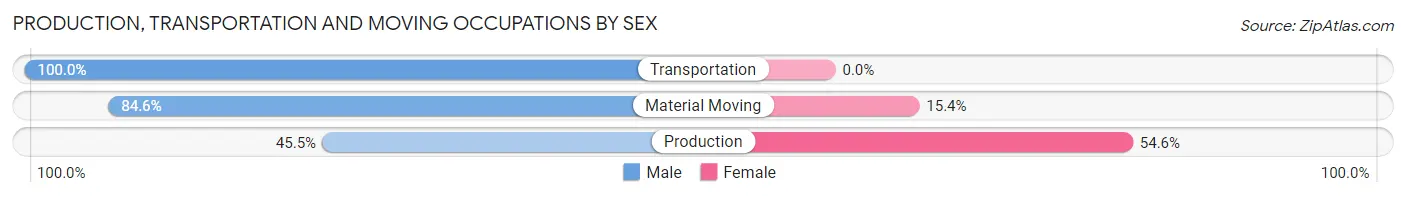
| Occupation | Male | Female |
| Production | 10 (45.5%) | 12 (54.5%) |
| Transportation | 9 (100.0%) | 0 (0.0%) |
| Material Moving | 11 (84.6%) | 2 (15.4%) |
| Total (Category) | 30 (68.2%) | 14 (31.8%) |
| Total (Overall) | 115 (46.9%) | 130 (53.1%) |
Employment Industries by Sex in Onamia
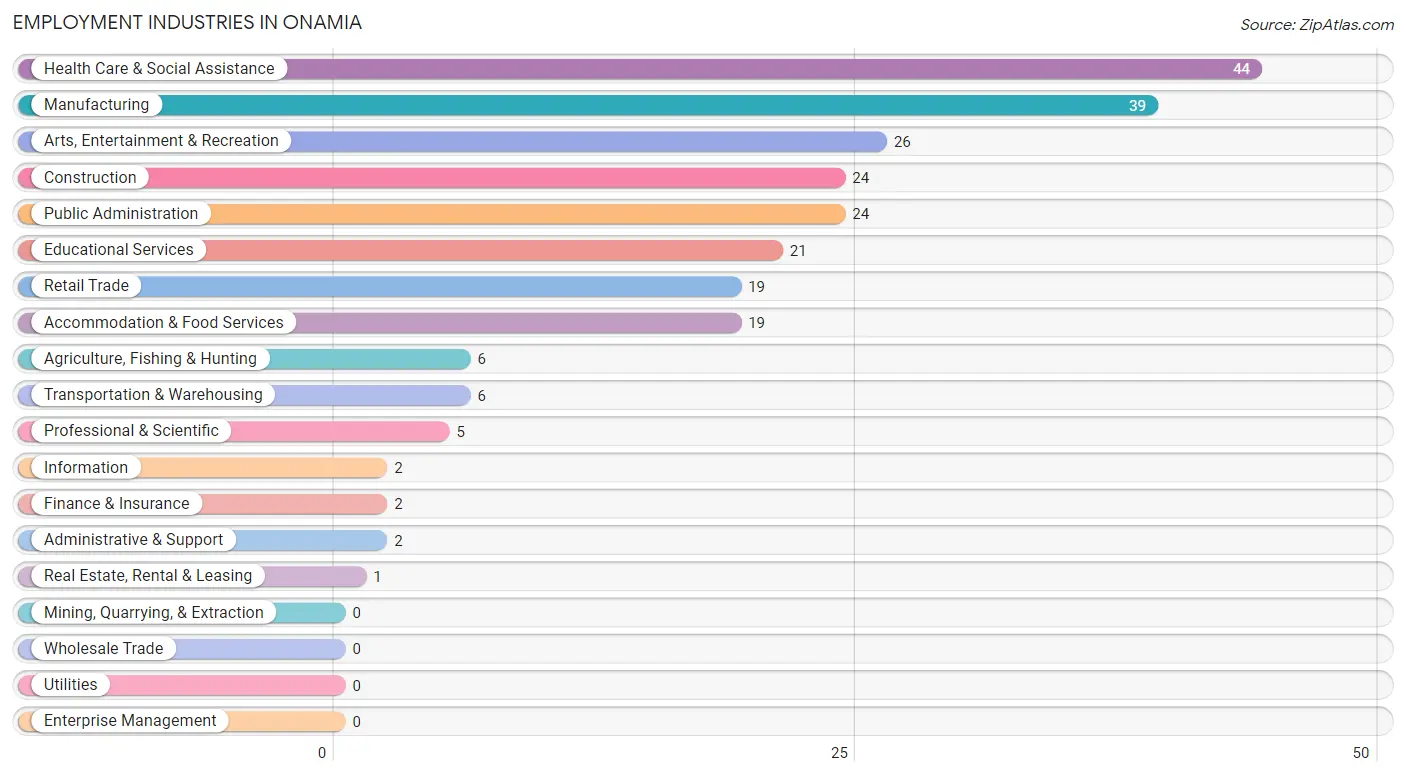
Employment Industries in Onamia
The major employment industries in Onamia include Health Care & Social Assistance (44 | 18.0%), Manufacturing (39 | 15.9%), Arts, Entertainment & Recreation (26 | 10.6%), Construction (24 | 9.8%), and Public Administration (24 | 9.8%).
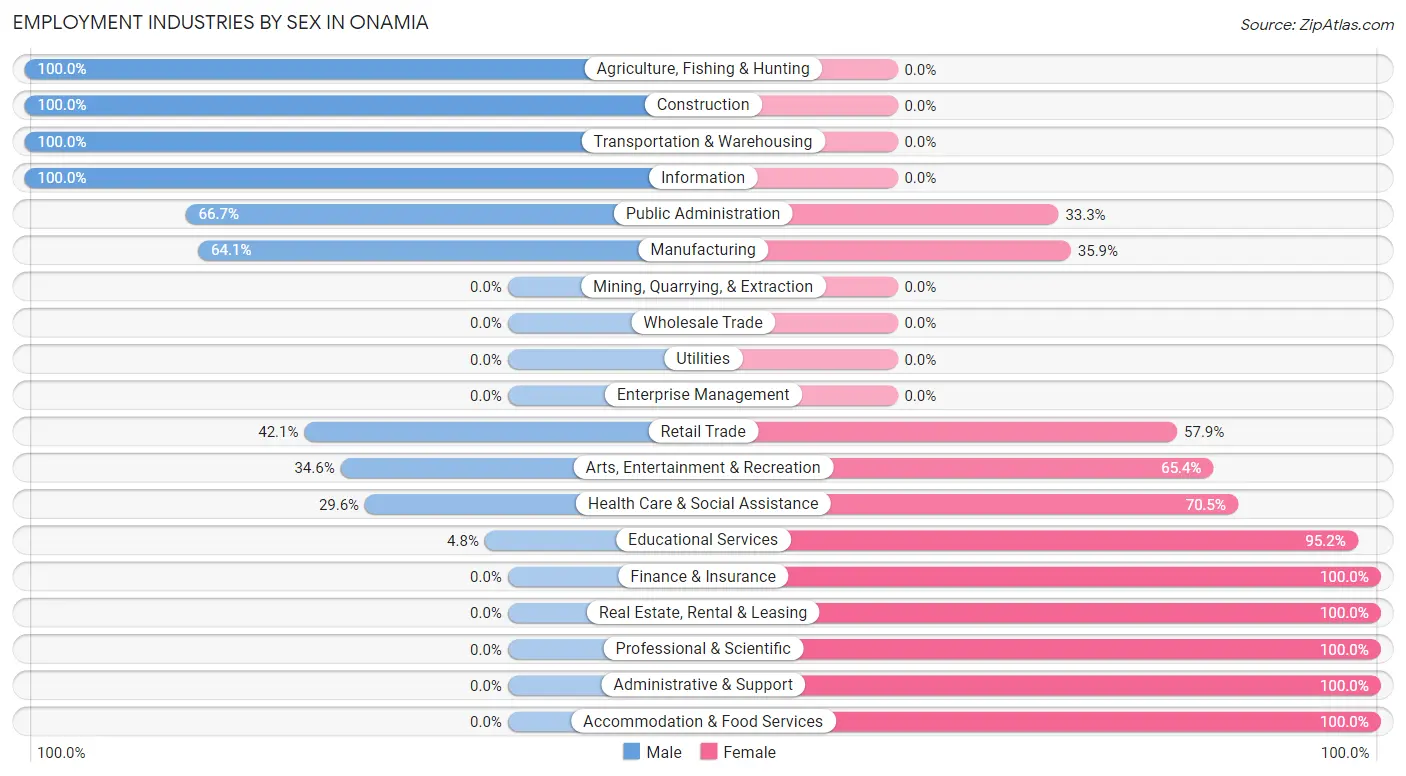
Employment Industries by Sex in Onamia
The Onamia industries that see more men than women are Agriculture, Fishing & Hunting (100.0%), Construction (100.0%), and Transportation & Warehousing (100.0%), whereas the industries that tend to have a higher number of women are Finance & Insurance (100.0%), Real Estate, Rental & Leasing (100.0%), and Professional & Scientific (100.0%).
| Industry | Male | Female |
| Agriculture, Fishing & Hunting | 6 (100.0%) | 0 (0.0%) |
| Mining, Quarrying, & Extraction | 0 (0.0%) | 0 (0.0%) |
| Construction | 24 (100.0%) | 0 (0.0%) |
| Manufacturing | 25 (64.1%) | 14 (35.9%) |
| Wholesale Trade | 0 (0.0%) | 0 (0.0%) |
| Retail Trade | 8 (42.1%) | 11 (57.9%) |
| Transportation & Warehousing | 6 (100.0%) | 0 (0.0%) |
| Utilities | 0 (0.0%) | 0 (0.0%) |
| Information | 2 (100.0%) | 0 (0.0%) |
| Finance & Insurance | 0 (0.0%) | 2 (100.0%) |
| Real Estate, Rental & Leasing | 0 (0.0%) | 1 (100.0%) |
| Professional & Scientific | 0 (0.0%) | 5 (100.0%) |
| Enterprise Management | 0 (0.0%) | 0 (0.0%) |
| Administrative & Support | 0 (0.0%) | 2 (100.0%) |
| Educational Services | 1 (4.8%) | 20 (95.2%) |
| Health Care & Social Assistance | 13 (29.5%) | 31 (70.5%) |
| Arts, Entertainment & Recreation | 9 (34.6%) | 17 (65.4%) |
| Accommodation & Food Services | 0 (0.0%) | 19 (100.0%) |
| Public Administration | 16 (66.7%) | 8 (33.3%) |
| Total | 115 (46.9%) | 130 (53.1%) |
Education in Onamia
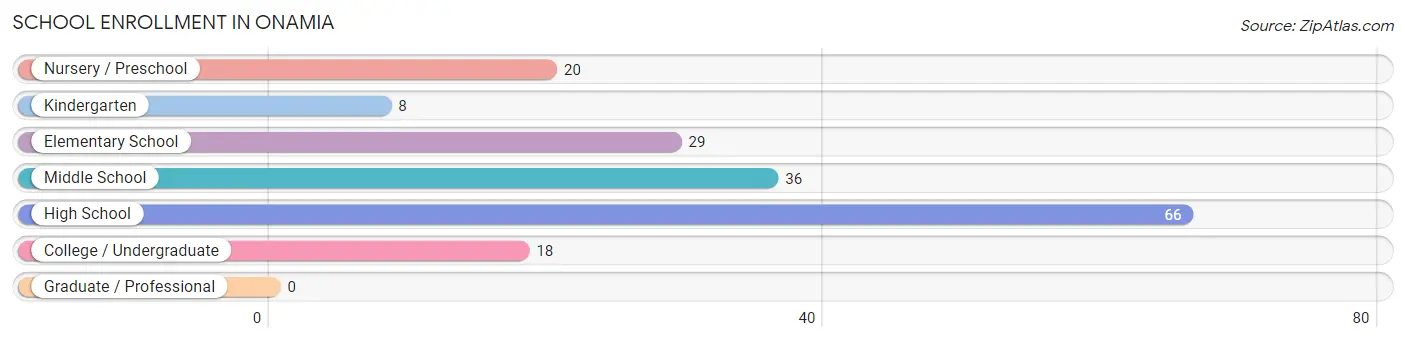
School Enrollment in Onamia
The most common levels of schooling among the 177 students in Onamia are high school (66 | 37.3%), middle school (36 | 20.3%), and elementary school (29 | 16.4%).
| School Level | # Students | % Students |
| Nursery / Preschool | 20 | 11.3% |
| Kindergarten | 8 | 4.5% |
| Elementary School | 29 | 16.4% |
| Middle School | 36 | 20.3% |
| High School | 66 | 37.3% |
| College / Undergraduate | 18 | 10.2% |
| Graduate / Professional | 0 | 0.0% |
| Total | 177 | 100.0% |
School Enrollment by Age by Funding Source in Onamia
Out of a total of 177 students who are enrolled in schools in Onamia, 37 (20.9%) attend a private institution, while the remaining 140 (79.1%) are enrolled in public schools. The age group of 18 to 19 year olds has the highest likelihood of being enrolled in private schools, with 2 (40.0% in the age bracket) enrolled. Conversely, the age group of 3 to 4 year olds has the lowest likelihood of being enrolled in a private school, with 8 (100.0% in the age bracket) attending a public institution.
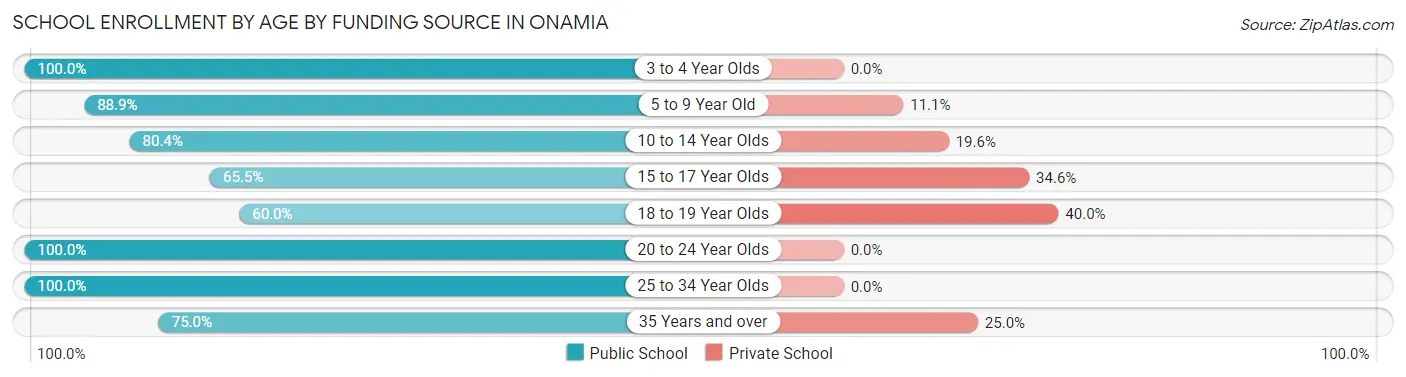
| Age Bracket | Public School | Private School |
| 3 to 4 Year Olds | 8 (100.0%) | 0 (0.0%) |
| 5 to 9 Year Old | 40 (88.9%) | 5 (11.1%) |
| 10 to 14 Year Olds | 37 (80.4%) | 9 (19.6%) |
| 15 to 17 Year Olds | 36 (65.4%) | 19 (34.5%) |
| 18 to 19 Year Olds | 3 (60.0%) | 2 (40.0%) |
| 20 to 24 Year Olds | 4 (100.0%) | 0 (0.0%) |
| 25 to 34 Year Olds | 6 (100.0%) | 0 (0.0%) |
| 35 Years and over | 6 (75.0%) | 2 (25.0%) |
| Total | 140 (79.1%) | 37 (20.9%) |
Educational Attainment by Field of Study in Onamia
Education (30 | 29.4%), psychology (15 | 14.7%), bio, nature & agricultural (13 | 12.8%), business (10 | 9.8%), and science & technology (7 | 6.9%) are the most common fields of study among 102 individuals in Onamia who have obtained a bachelor's degree or higher.
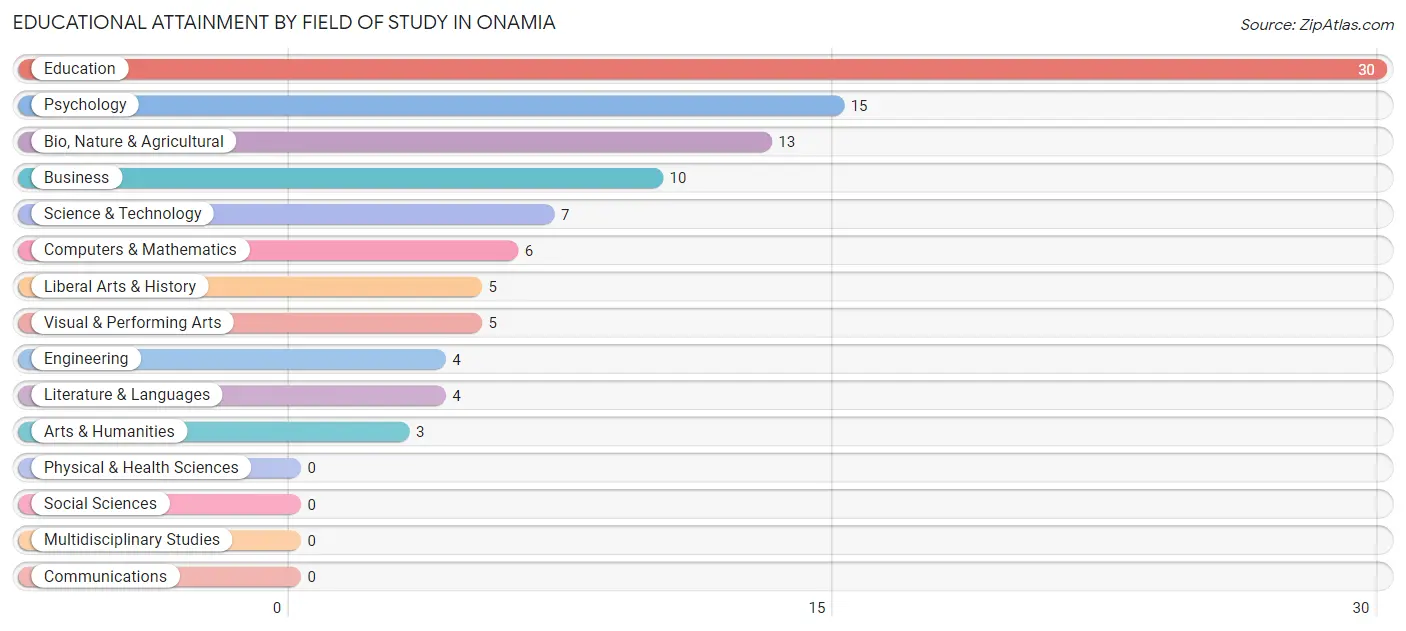
| Field of Study | # Graduates | % Graduates |
| Computers & Mathematics | 6 | 5.9% |
| Bio, Nature & Agricultural | 13 | 12.8% |
| Physical & Health Sciences | 0 | 0.0% |
| Psychology | 15 | 14.7% |
| Social Sciences | 0 | 0.0% |
| Engineering | 4 | 3.9% |
| Multidisciplinary Studies | 0 | 0.0% |
| Science & Technology | 7 | 6.9% |
| Business | 10 | 9.8% |
| Education | 30 | 29.4% |
| Literature & Languages | 4 | 3.9% |
| Liberal Arts & History | 5 | 4.9% |
| Visual & Performing Arts | 5 | 4.9% |
| Communications | 0 | 0.0% |
| Arts & Humanities | 3 | 2.9% |
| Total | 102 | 100.0% |
Transportation & Commute in Onamia
Vehicle Availability by Sex in Onamia
The most prevalent vehicle ownership categories in Onamia are males with 2 vehicles (51, accounting for 44.4%) and females with 2 vehicles (46, making up 40.2%).
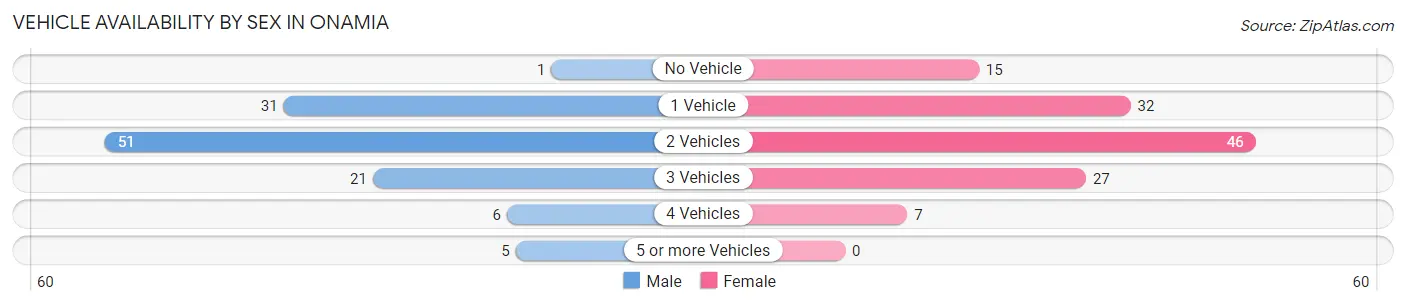
| Vehicles Available | Male | Female |
| No Vehicle | 1 (0.9%) | 15 (11.8%) |
| 1 Vehicle | 31 (27.0%) | 32 (25.2%) |
| 2 Vehicles | 51 (44.4%) | 46 (36.2%) |
| 3 Vehicles | 21 (18.3%) | 27 (21.3%) |
| 4 Vehicles | 6 (5.2%) | 7 (5.5%) |
| 5 or more Vehicles | 5 (4.3%) | 0 (0.0%) |
| Total | 115 (100.0%) | 127 (100.0%) |
Commute Time in Onamia
The most frequently occuring commute durations in Onamia are 5 to 9 minutes (58 commuters, 25.6%), 15 to 19 minutes (42 commuters, 18.5%), and less than 5 minutes (33 commuters, 14.5%).
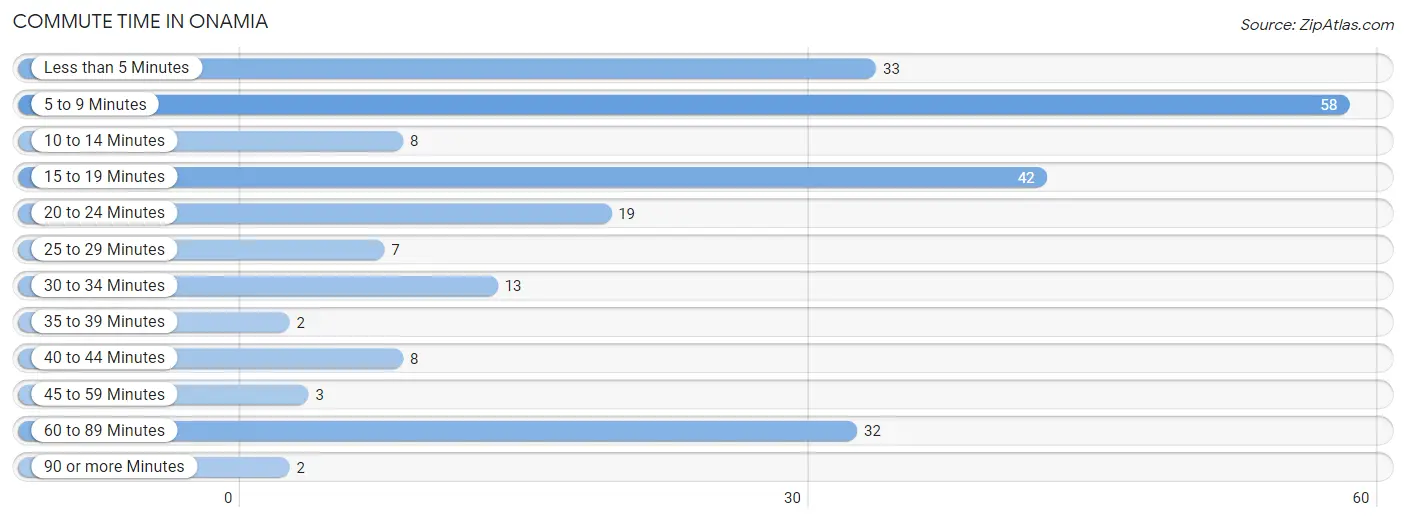
| Commute Time | # Commuters | % Commuters |
| Less than 5 Minutes | 33 | 14.5% |
| 5 to 9 Minutes | 58 | 25.6% |
| 10 to 14 Minutes | 8 | 3.5% |
| 15 to 19 Minutes | 42 | 18.5% |
| 20 to 24 Minutes | 19 | 8.4% |
| 25 to 29 Minutes | 7 | 3.1% |
| 30 to 34 Minutes | 13 | 5.7% |
| 35 to 39 Minutes | 2 | 0.9% |
| 40 to 44 Minutes | 8 | 3.5% |
| 45 to 59 Minutes | 3 | 1.3% |
| 60 to 89 Minutes | 32 | 14.1% |
| 90 or more Minutes | 2 | 0.9% |
Commute Time by Sex in Onamia
The most common commute times in Onamia are 60 to 89 minutes (25 commuters, 23.6%) for males and 5 to 9 minutes (40 commuters, 33.1%) for females.
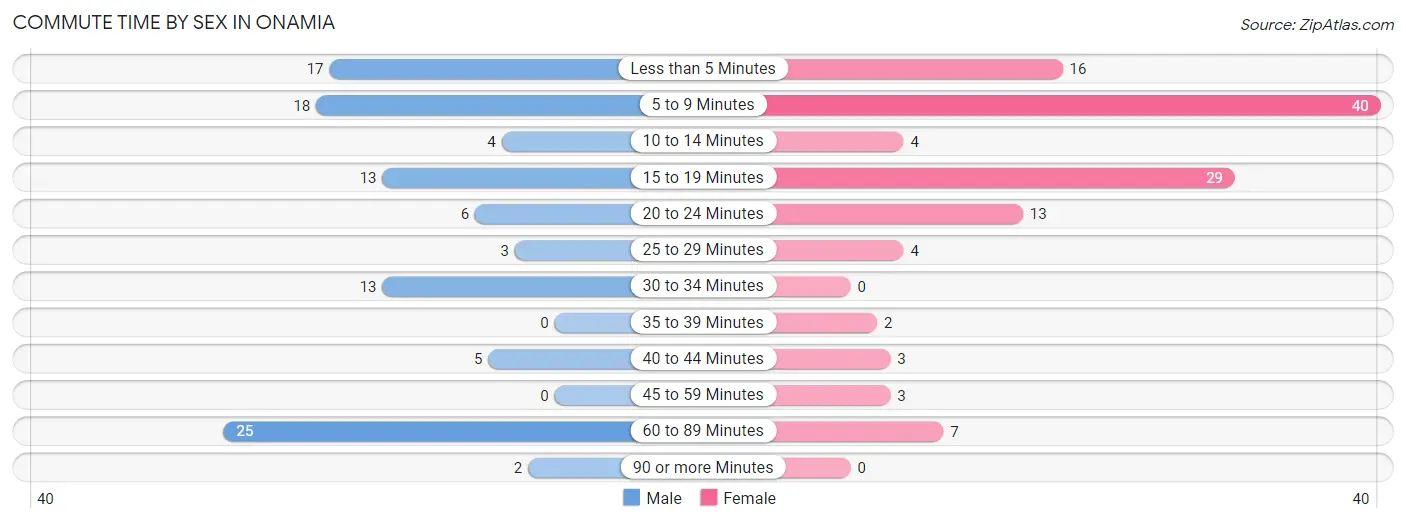
| Commute Time | Male | Female |
| Less than 5 Minutes | 17 (16.0%) | 16 (13.2%) |
| 5 to 9 Minutes | 18 (17.0%) | 40 (33.1%) |
| 10 to 14 Minutes | 4 (3.8%) | 4 (3.3%) |
| 15 to 19 Minutes | 13 (12.3%) | 29 (24.0%) |
| 20 to 24 Minutes | 6 (5.7%) | 13 (10.7%) |
| 25 to 29 Minutes | 3 (2.8%) | 4 (3.3%) |
| 30 to 34 Minutes | 13 (12.3%) | 0 (0.0%) |
| 35 to 39 Minutes | 0 (0.0%) | 2 (1.7%) |
| 40 to 44 Minutes | 5 (4.7%) | 3 (2.5%) |
| 45 to 59 Minutes | 0 (0.0%) | 3 (2.5%) |
| 60 to 89 Minutes | 25 (23.6%) | 7 (5.8%) |
| 90 or more Minutes | 2 (1.9%) | 0 (0.0%) |
Time of Departure to Work by Sex in Onamia
The most frequent times of departure to work in Onamia are 5:30 AM to 5:59 AM (25, 23.6%) for males and 6:00 AM to 6:29 AM (20, 16.5%) for females.
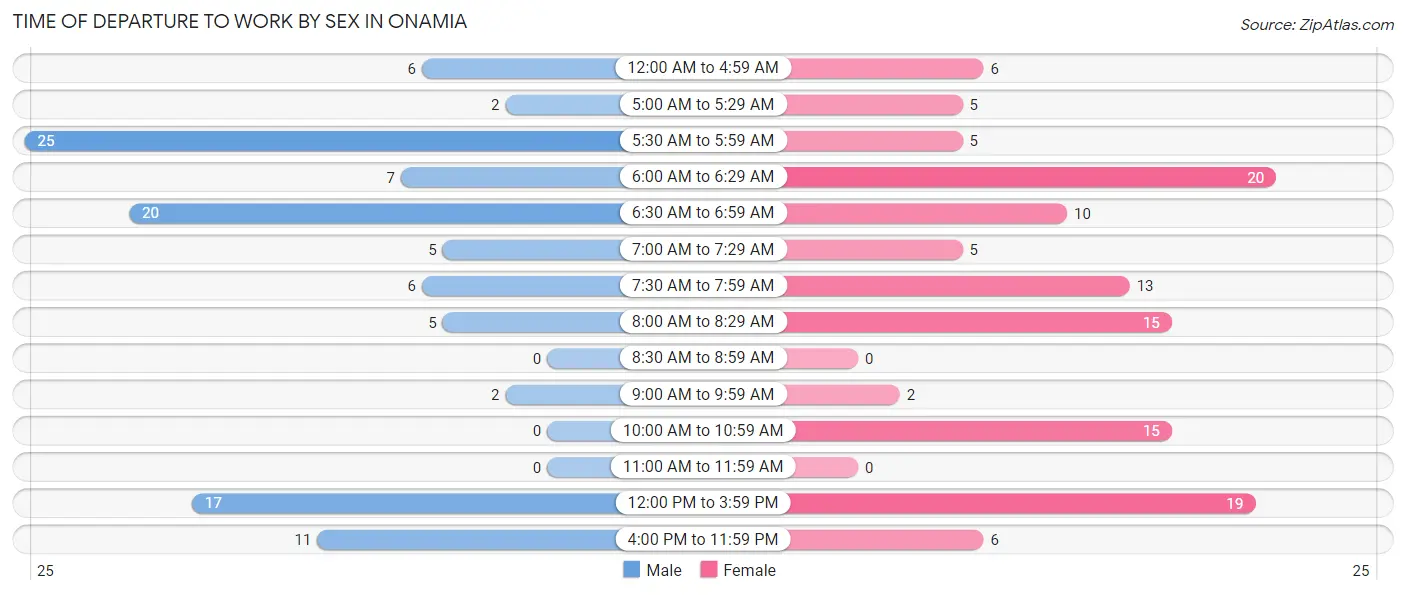
| Time of Departure | Male | Female |
| 12:00 AM to 4:59 AM | 6 (5.7%) | 6 (5.0%) |
| 5:00 AM to 5:29 AM | 2 (1.9%) | 5 (4.1%) |
| 5:30 AM to 5:59 AM | 25 (23.6%) | 5 (4.1%) |
| 6:00 AM to 6:29 AM | 7 (6.6%) | 20 (16.5%) |
| 6:30 AM to 6:59 AM | 20 (18.9%) | 10 (8.3%) |
| 7:00 AM to 7:29 AM | 5 (4.7%) | 5 (4.1%) |
| 7:30 AM to 7:59 AM | 6 (5.7%) | 13 (10.7%) |
| 8:00 AM to 8:29 AM | 5 (4.7%) | 15 (12.4%) |
| 8:30 AM to 8:59 AM | 0 (0.0%) | 0 (0.0%) |
| 9:00 AM to 9:59 AM | 2 (1.9%) | 2 (1.7%) |
| 10:00 AM to 10:59 AM | 0 (0.0%) | 15 (12.4%) |
| 11:00 AM to 11:59 AM | 0 (0.0%) | 0 (0.0%) |
| 12:00 PM to 3:59 PM | 17 (16.0%) | 19 (15.7%) |
| 4:00 PM to 11:59 PM | 11 (10.4%) | 6 (5.0%) |
| Total | 106 (100.0%) | 121 (100.0%) |
Housing Occupancy in Onamia
Occupancy by Ownership in Onamia
Of the total 344 dwellings in Onamia, owner-occupied units account for 161 (46.8%), while renter-occupied units make up 183 (53.2%).
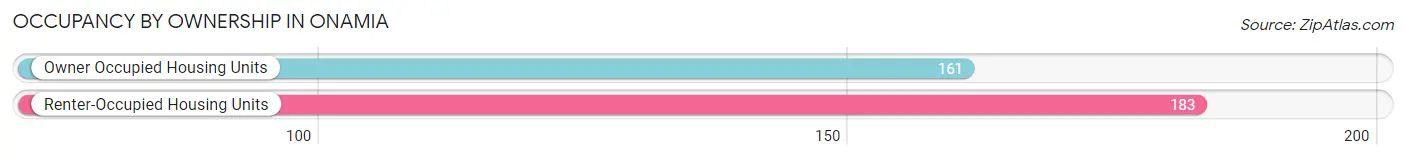
| Occupancy | # Housing Units | % Housing Units |
| Owner Occupied Housing Units | 161 | 46.8% |
| Renter-Occupied Housing Units | 183 | 53.2% |
| Total Occupied Housing Units | 344 | 100.0% |
Occupancy by Household Size in Onamia
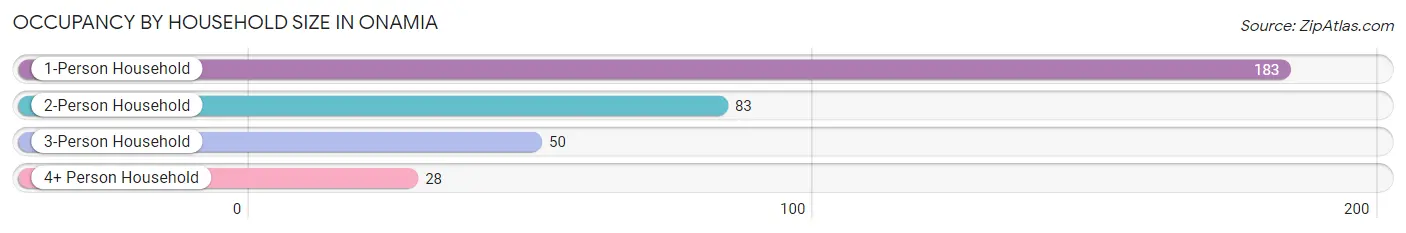
| Household Size | # Housing Units | % Housing Units |
| 1-Person Household | 183 | 53.2% |
| 2-Person Household | 83 | 24.1% |
| 3-Person Household | 50 | 14.5% |
| 4+ Person Household | 28 | 8.1% |
| Total Housing Units | 344 | 100.0% |
Occupancy by Ownership by Household Size in Onamia
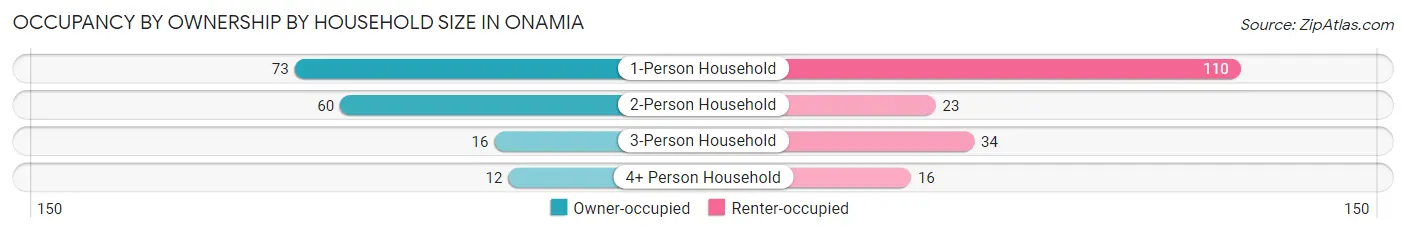
| Household Size | Owner-occupied | Renter-occupied |
| 1-Person Household | 73 (39.9%) | 110 (60.1%) |
| 2-Person Household | 60 (72.3%) | 23 (27.7%) |
| 3-Person Household | 16 (32.0%) | 34 (68.0%) |
| 4+ Person Household | 12 (42.9%) | 16 (57.1%) |
| Total Housing Units | 161 (46.8%) | 183 (53.2%) |
Occupancy by Educational Attainment in Onamia
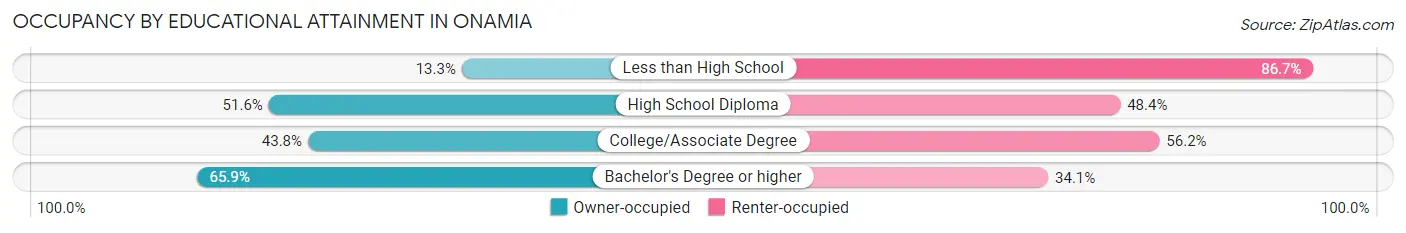
| Household Size | Owner-occupied | Renter-occupied |
| Less than High School | 4 (13.3%) | 26 (86.7%) |
| High School Diploma | 64 (51.6%) | 60 (48.4%) |
| College/Associate Degree | 64 (43.8%) | 82 (56.2%) |
| Bachelor's Degree or higher | 29 (65.9%) | 15 (34.1%) |
Occupancy by Age of Householder in Onamia
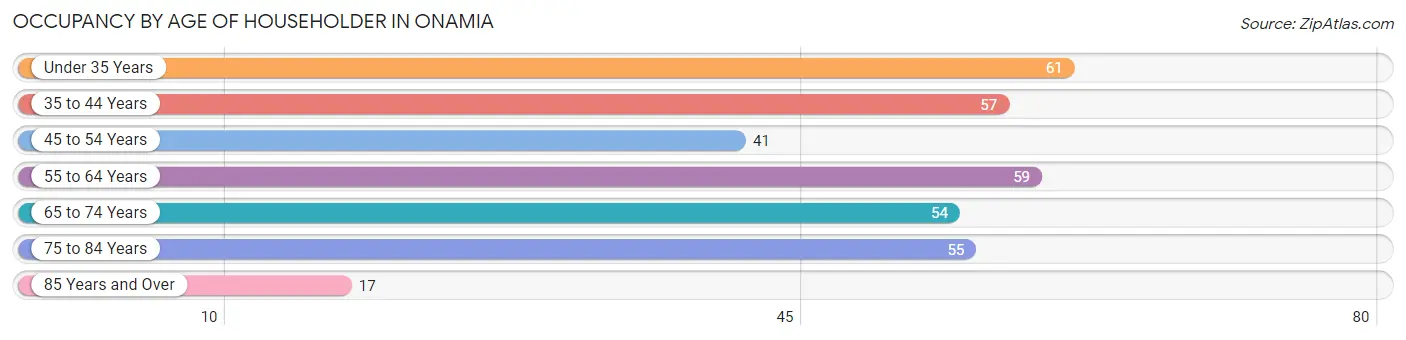
| Age Bracket | # Households | % Households |
| Under 35 Years | 61 | 17.7% |
| 35 to 44 Years | 57 | 16.6% |
| 45 to 54 Years | 41 | 11.9% |
| 55 to 64 Years | 59 | 17.2% |
| 65 to 74 Years | 54 | 15.7% |
| 75 to 84 Years | 55 | 16.0% |
| 85 Years and Over | 17 | 4.9% |
| Total | 344 | 100.0% |
Housing Finances in Onamia
Median Income by Occupancy in Onamia
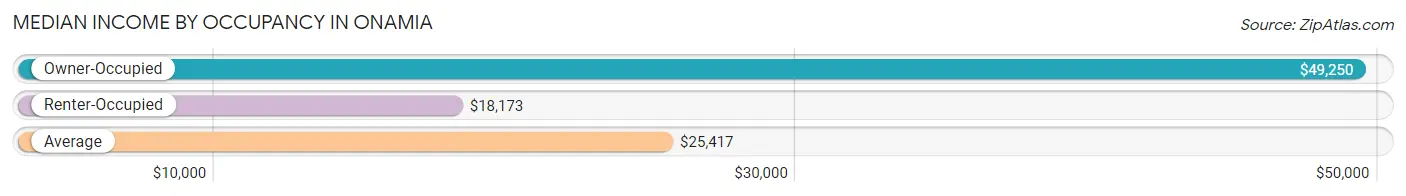
| Occupancy Type | # Households | Median Income |
| Owner-Occupied | 161 (46.8%) | $49,250 |
| Renter-Occupied | 183 (53.2%) | $18,173 |
| Average | 344 (100.0%) | $25,417 |
Occupancy by Householder Income Bracket in Onamia
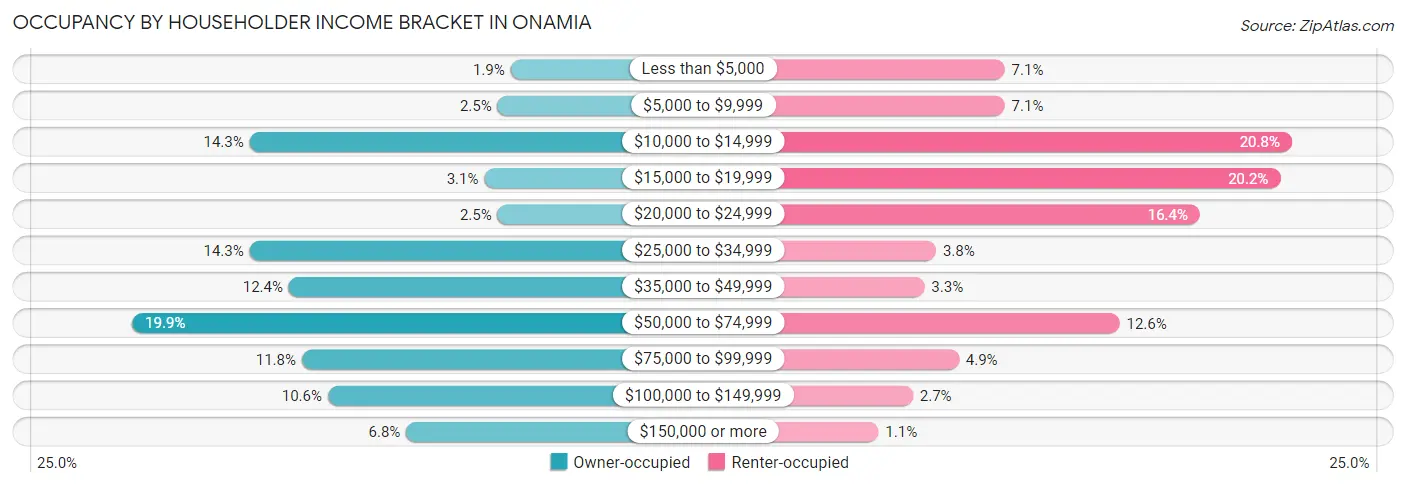
| Income Bracket | Owner-occupied | Renter-occupied |
| Less than $5,000 | 3 (1.9%) | 13 (7.1%) |
| $5,000 to $9,999 | 4 (2.5%) | 13 (7.1%) |
| $10,000 to $14,999 | 23 (14.3%) | 38 (20.8%) |
| $15,000 to $19,999 | 5 (3.1%) | 37 (20.2%) |
| $20,000 to $24,999 | 4 (2.5%) | 30 (16.4%) |
| $25,000 to $34,999 | 23 (14.3%) | 7 (3.8%) |
| $35,000 to $49,999 | 20 (12.4%) | 6 (3.3%) |
| $50,000 to $74,999 | 32 (19.9%) | 23 (12.6%) |
| $75,000 to $99,999 | 19 (11.8%) | 9 (4.9%) |
| $100,000 to $149,999 | 17 (10.6%) | 5 (2.7%) |
| $150,000 or more | 11 (6.8%) | 2 (1.1%) |
| Total | 161 (100.0%) | 183 (100.0%) |
Monthly Housing Cost Tiers in Onamia
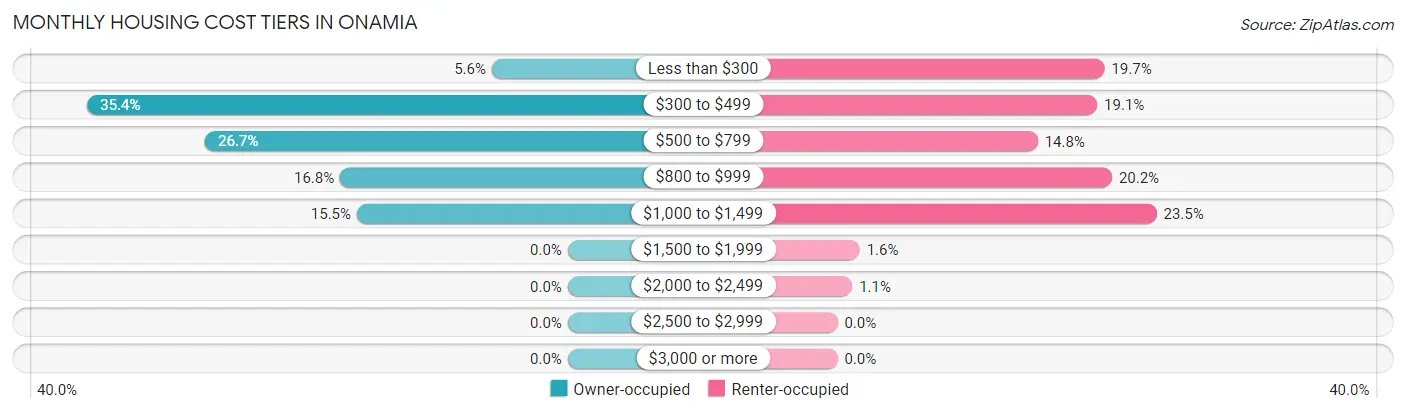
| Monthly Cost | Owner-occupied | Renter-occupied |
| Less than $300 | 9 (5.6%) | 36 (19.7%) |
| $300 to $499 | 57 (35.4%) | 35 (19.1%) |
| $500 to $799 | 43 (26.7%) | 27 (14.7%) |
| $800 to $999 | 27 (16.8%) | 37 (20.2%) |
| $1,000 to $1,499 | 25 (15.5%) | 43 (23.5%) |
| $1,500 to $1,999 | 0 (0.0%) | 3 (1.6%) |
| $2,000 to $2,499 | 0 (0.0%) | 2 (1.1%) |
| $2,500 to $2,999 | 0 (0.0%) | 0 (0.0%) |
| $3,000 or more | 0 (0.0%) | 0 (0.0%) |
| Total | 161 (100.0%) | 183 (100.0%) |
Physical Housing Characteristics in Onamia
Housing Structures in Onamia
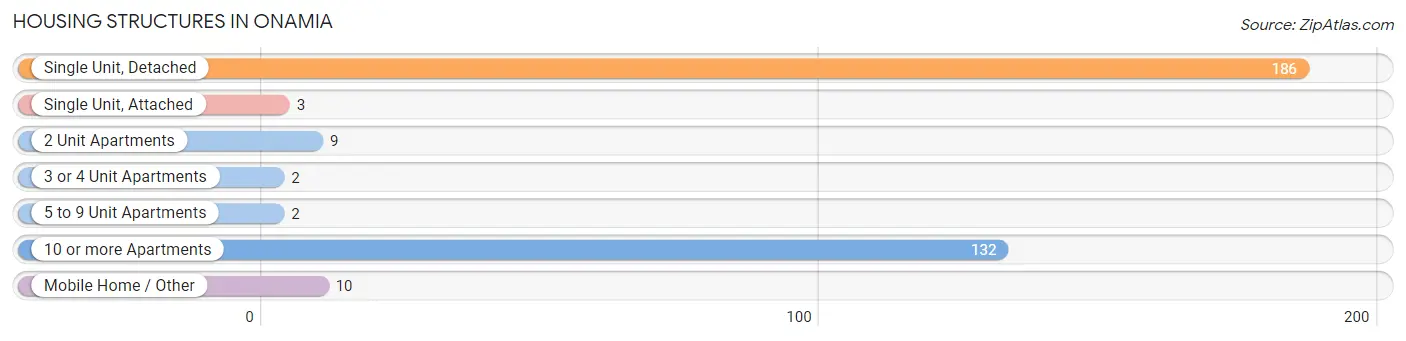
| Structure Type | # Housing Units | % Housing Units |
| Single Unit, Detached | 186 | 54.1% |
| Single Unit, Attached | 3 | 0.9% |
| 2 Unit Apartments | 9 | 2.6% |
| 3 or 4 Unit Apartments | 2 | 0.6% |
| 5 to 9 Unit Apartments | 2 | 0.6% |
| 10 or more Apartments | 132 | 38.4% |
| Mobile Home / Other | 10 | 2.9% |
| Total | 344 | 100.0% |
Housing Structures by Occupancy in Onamia
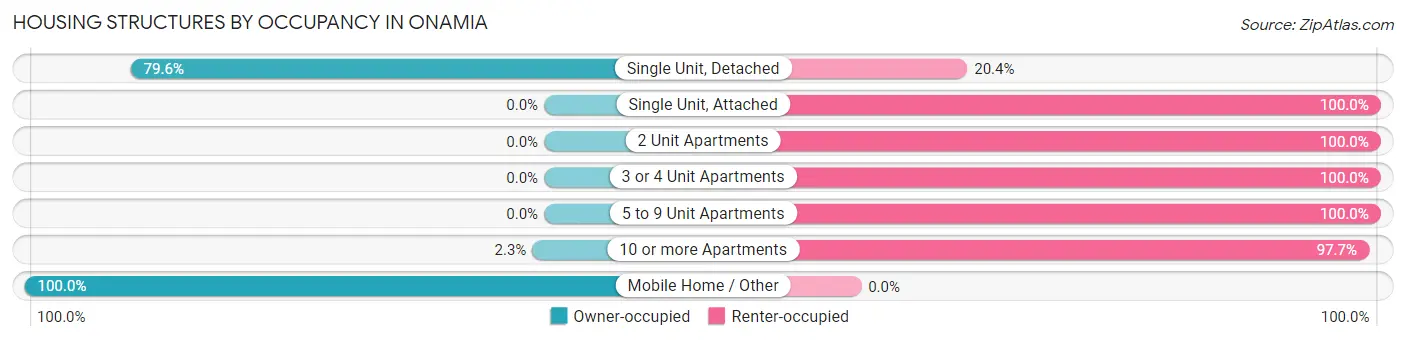
| Structure Type | Owner-occupied | Renter-occupied |
| Single Unit, Detached | 148 (79.6%) | 38 (20.4%) |
| Single Unit, Attached | 0 (0.0%) | 3 (100.0%) |
| 2 Unit Apartments | 0 (0.0%) | 9 (100.0%) |
| 3 or 4 Unit Apartments | 0 (0.0%) | 2 (100.0%) |
| 5 to 9 Unit Apartments | 0 (0.0%) | 2 (100.0%) |
| 10 or more Apartments | 3 (2.3%) | 129 (97.7%) |
| Mobile Home / Other | 10 (100.0%) | 0 (0.0%) |
| Total | 161 (46.8%) | 183 (53.2%) |
Housing Structures by Number of Rooms in Onamia
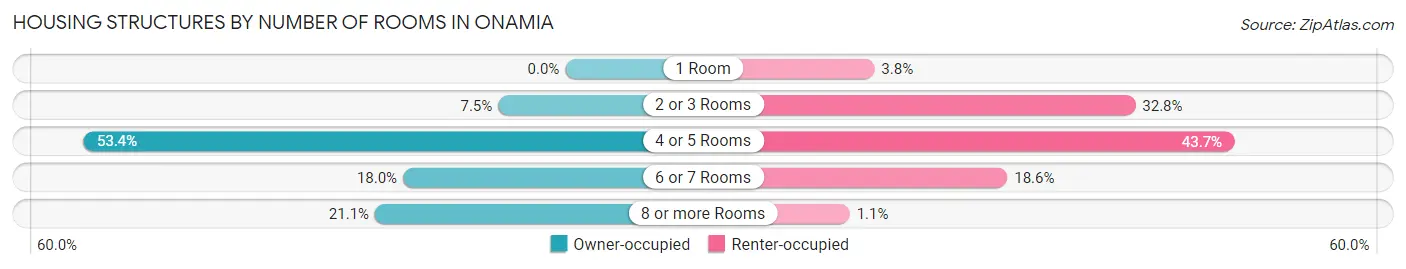
| Number of Rooms | Owner-occupied | Renter-occupied |
| 1 Room | 0 (0.0%) | 7 (3.8%) |
| 2 or 3 Rooms | 12 (7.4%) | 60 (32.8%) |
| 4 or 5 Rooms | 86 (53.4%) | 80 (43.7%) |
| 6 or 7 Rooms | 29 (18.0%) | 34 (18.6%) |
| 8 or more Rooms | 34 (21.1%) | 2 (1.1%) |
| Total | 161 (100.0%) | 183 (100.0%) |
Housing Structure by Heating Type in Onamia
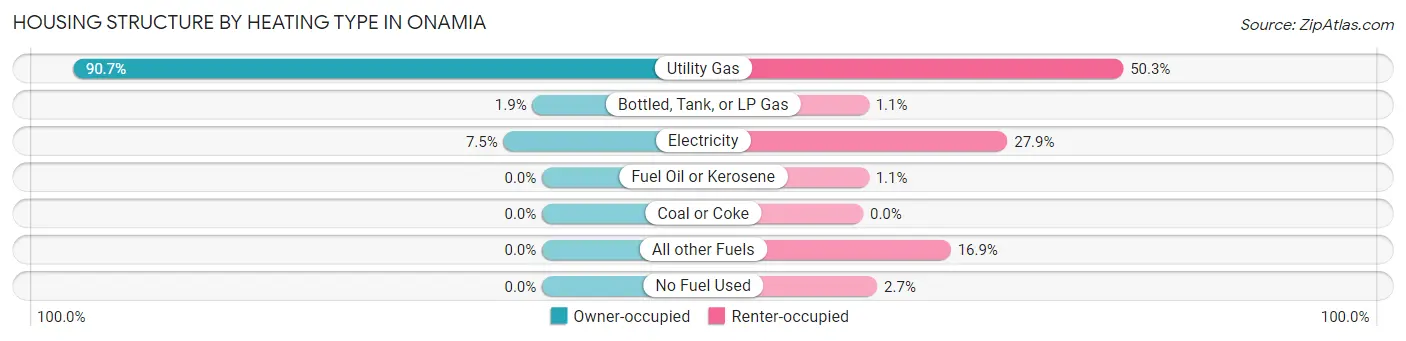
| Heating Type | Owner-occupied | Renter-occupied |
| Utility Gas | 146 (90.7%) | 92 (50.3%) |
| Bottled, Tank, or LP Gas | 3 (1.9%) | 2 (1.1%) |
| Electricity | 12 (7.4%) | 51 (27.9%) |
| Fuel Oil or Kerosene | 0 (0.0%) | 2 (1.1%) |
| Coal or Coke | 0 (0.0%) | 0 (0.0%) |
| All other Fuels | 0 (0.0%) | 31 (16.9%) |
| No Fuel Used | 0 (0.0%) | 5 (2.7%) |
| Total | 161 (100.0%) | 183 (100.0%) |
Household Vehicle Usage in Onamia
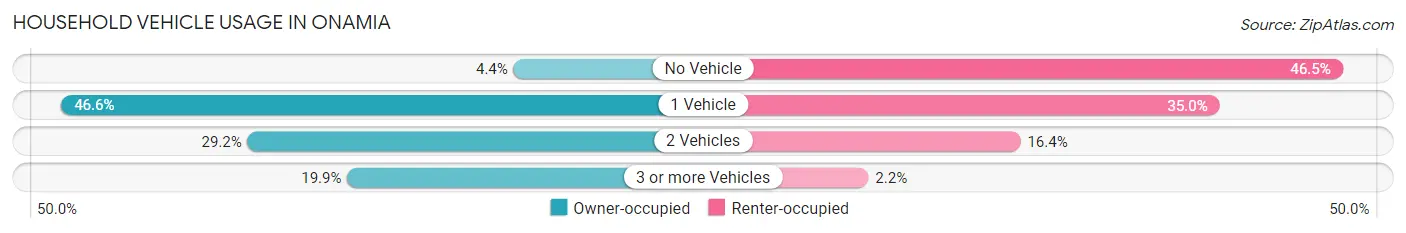
| Vehicles per Household | Owner-occupied | Renter-occupied |
| No Vehicle | 7 (4.3%) | 85 (46.5%) |
| 1 Vehicle | 75 (46.6%) | 64 (35.0%) |
| 2 Vehicles | 47 (29.2%) | 30 (16.4%) |
| 3 or more Vehicles | 32 (19.9%) | 4 (2.2%) |
| Total | 161 (100.0%) | 183 (100.0%) |
Real Estate & Mortgages in Onamia
Real Estate and Mortgage Overview in Onamia
| Characteristic | Without Mortgage | With Mortgage |
| Housing Units | 77 | 84 |
| Median Property Value | $128,900 | $105,200 |
| Median Household Income | $36,250 | $7 |
| Monthly Housing Costs | $436 | $0 |
| Real Estate Taxes | $1,209 | $4 |
Property Value by Mortgage Status in Onamia
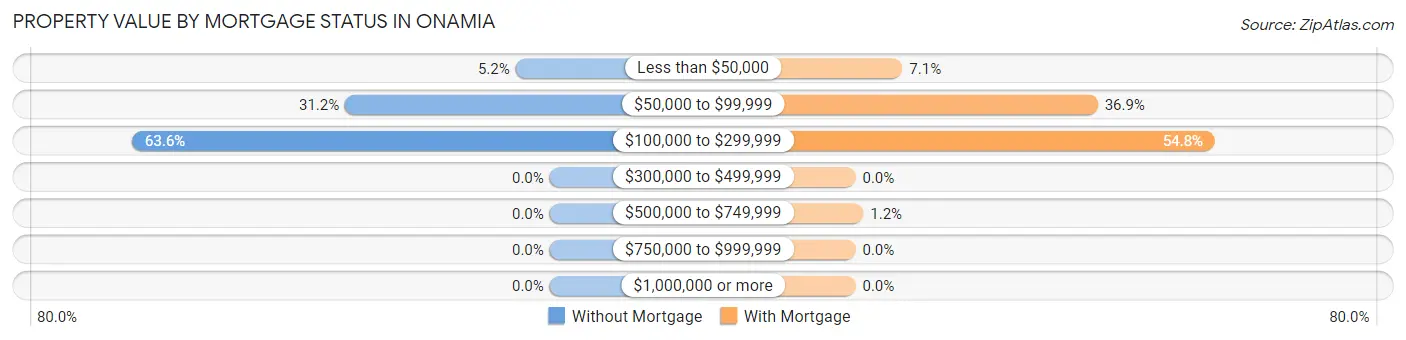
| Property Value | Without Mortgage | With Mortgage |
| Less than $50,000 | 4 (5.2%) | 6 (7.1%) |
| $50,000 to $99,999 | 24 (31.2%) | 31 (36.9%) |
| $100,000 to $299,999 | 49 (63.6%) | 46 (54.8%) |
| $300,000 to $499,999 | 0 (0.0%) | 0 (0.0%) |
| $500,000 to $749,999 | 0 (0.0%) | 1 (1.2%) |
| $750,000 to $999,999 | 0 (0.0%) | 0 (0.0%) |
| $1,000,000 or more | 0 (0.0%) | 0 (0.0%) |
| Total | 77 (100.0%) | 84 (100.0%) |
Household Income by Mortgage Status in Onamia
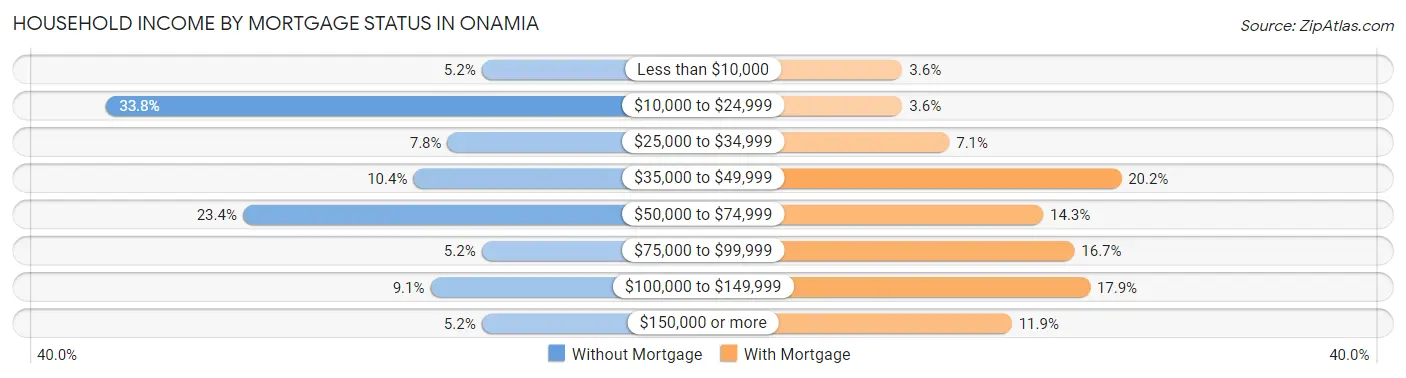
| Household Income | Without Mortgage | With Mortgage |
| Less than $10,000 | 4 (5.2%) | 3 (3.6%) |
| $10,000 to $24,999 | 26 (33.8%) | 3 (3.6%) |
| $25,000 to $34,999 | 6 (7.8%) | 6 (7.1%) |
| $35,000 to $49,999 | 8 (10.4%) | 17 (20.2%) |
| $50,000 to $74,999 | 18 (23.4%) | 12 (14.3%) |
| $75,000 to $99,999 | 4 (5.2%) | 14 (16.7%) |
| $100,000 to $149,999 | 7 (9.1%) | 15 (17.9%) |
| $150,000 or more | 4 (5.2%) | 10 (11.9%) |
| Total | 77 (100.0%) | 84 (100.0%) |
Property Value to Household Income Ratio in Onamia
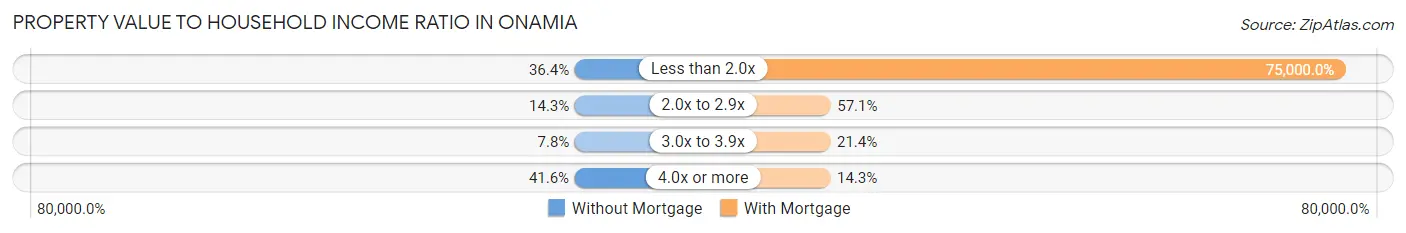
| Value-to-Income Ratio | Without Mortgage | With Mortgage |
| Less than 2.0x | 28 (36.4%) | 63,000 (75,000.0%) |
| 2.0x to 2.9x | 11 (14.3%) | 48 (57.1%) |
| 3.0x to 3.9x | 6 (7.8%) | 18 (21.4%) |
| 4.0x or more | 32 (41.6%) | 12 (14.3%) |
| Total | 77 (100.0%) | 84 (100.0%) |
Real Estate Taxes by Mortgage Status in Onamia
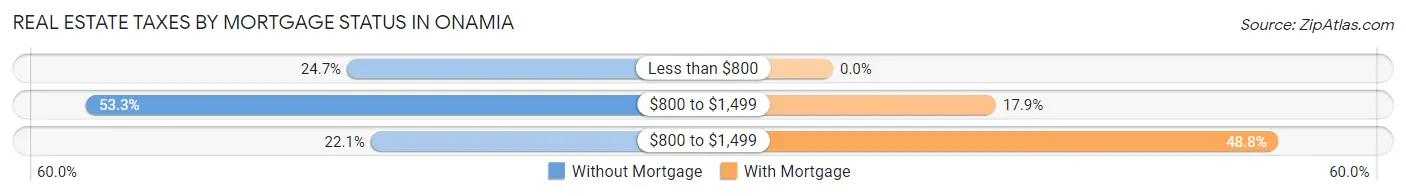
| Property Taxes | Without Mortgage | With Mortgage |
| Less than $800 | 19 (24.7%) | 0 (0.0%) |
| $800 to $1,499 | 41 (53.2%) | 15 (17.9%) |
| $800 to $1,499 | 17 (22.1%) | 41 (48.8%) |
| Total | 77 (100.0%) | 84 (100.0%) |
Health & Disability in Onamia
Health Insurance Coverage by Age in Onamia
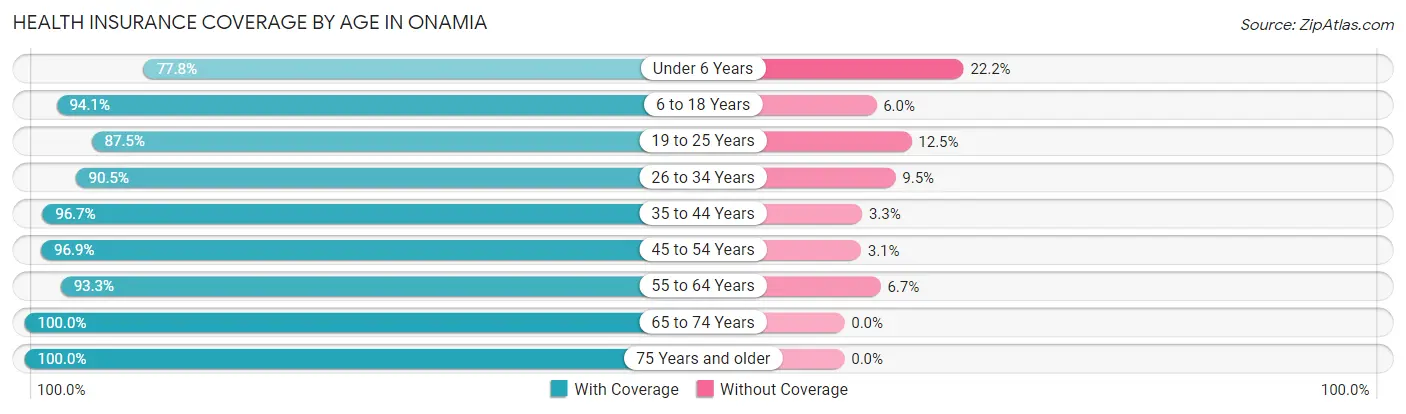
| Age Bracket | With Coverage | Without Coverage |
| Under 6 Years | 63 (77.8%) | 18 (22.2%) |
| 6 to 18 Years | 79 (94.1%) | 5 (5.9%) |
| 19 to 25 Years | 21 (87.5%) | 3 (12.5%) |
| 26 to 34 Years | 57 (90.5%) | 6 (9.5%) |
| 35 to 44 Years | 88 (96.7%) | 3 (3.3%) |
| 45 to 54 Years | 63 (96.9%) | 2 (3.1%) |
| 55 to 64 Years | 83 (93.3%) | 6 (6.7%) |
| 65 to 74 Years | 82 (100.0%) | 0 (0.0%) |
| 75 Years and older | 83 (100.0%) | 0 (0.0%) |
| Total | 619 (93.5%) | 43 (6.5%) |
Health Insurance Coverage by Citizenship Status in Onamia
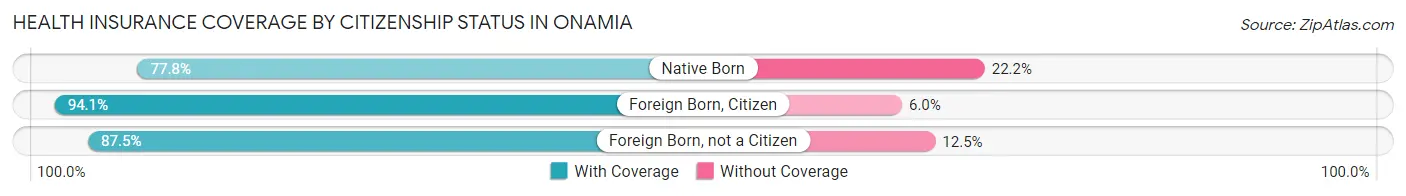
| Citizenship Status | With Coverage | Without Coverage |
| Native Born | 63 (77.8%) | 18 (22.2%) |
| Foreign Born, Citizen | 79 (94.1%) | 5 (5.9%) |
| Foreign Born, not a Citizen | 21 (87.5%) | 3 (12.5%) |
Health Insurance Coverage by Household Income in Onamia
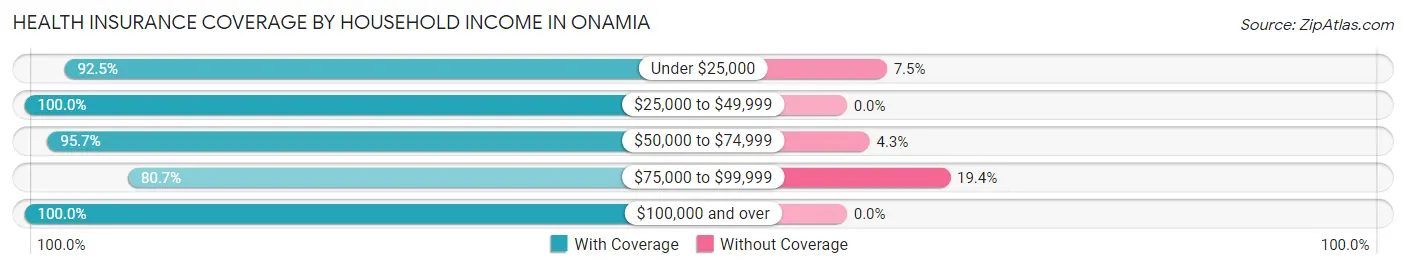
| Household Income | With Coverage | Without Coverage |
| Under $25,000 | 235 (92.5%) | 19 (7.5%) |
| $25,000 to $49,999 | 82 (100.0%) | 0 (0.0%) |
| $50,000 to $74,999 | 135 (95.7%) | 6 (4.3%) |
| $75,000 to $99,999 | 75 (80.6%) | 18 (19.4%) |
| $100,000 and over | 92 (100.0%) | 0 (0.0%) |
Public vs Private Health Insurance Coverage by Age in Onamia
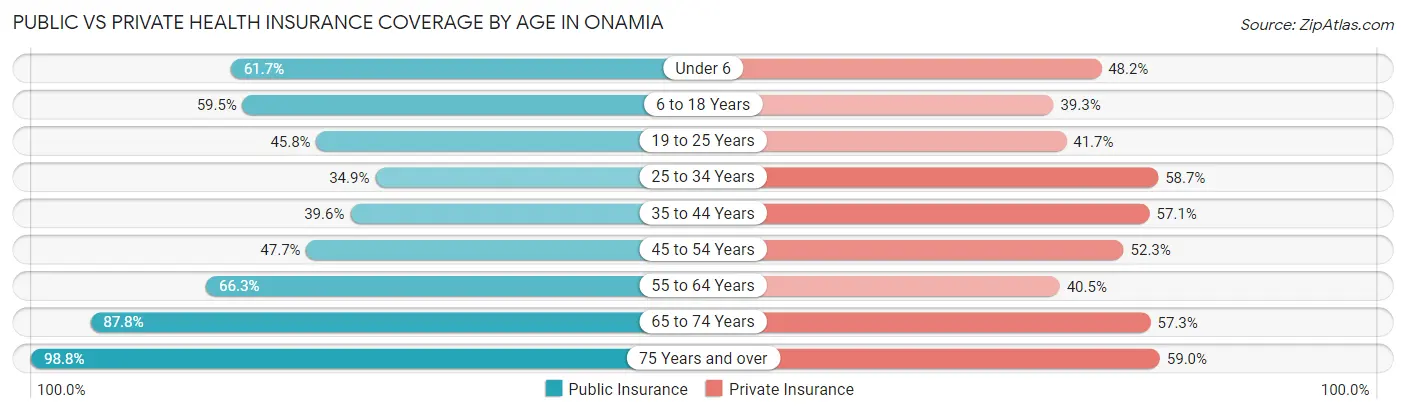
| Age Bracket | Public Insurance | Private Insurance |
| Under 6 | 50 (61.7%) | 39 (48.1%) |
| 6 to 18 Years | 50 (59.5%) | 33 (39.3%) |
| 19 to 25 Years | 11 (45.8%) | 10 (41.7%) |
| 25 to 34 Years | 22 (34.9%) | 37 (58.7%) |
| 35 to 44 Years | 36 (39.6%) | 52 (57.1%) |
| 45 to 54 Years | 31 (47.7%) | 34 (52.3%) |
| 55 to 64 Years | 59 (66.3%) | 36 (40.5%) |
| 65 to 74 Years | 72 (87.8%) | 47 (57.3%) |
| 75 Years and over | 82 (98.8%) | 49 (59.0%) |
| Total | 413 (62.4%) | 337 (50.9%) |
Disability Status by Sex by Age in Onamia
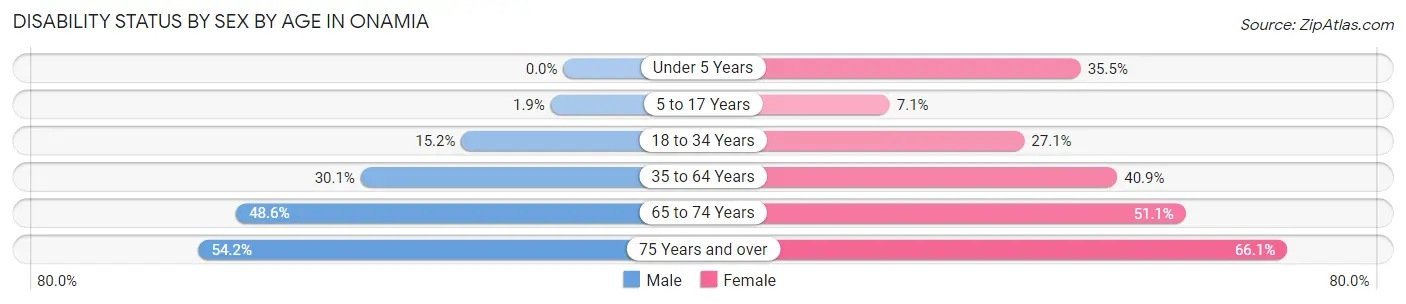
| Age Bracket | Male | Female |
| Under 5 Years | 0 (0.0%) | 11 (35.5%) |
| 5 to 17 Years | 1 (1.9%) | 3 (7.1%) |
| 18 to 34 Years | 5 (15.1%) | 16 (27.1%) |
| 35 to 64 Years | 34 (30.1%) | 54 (40.9%) |
| 65 to 74 Years | 17 (48.6%) | 24 (51.1%) |
| 75 Years and over | 13 (54.2%) | 39 (66.1%) |
Disability Class by Sex by Age in Onamia
Disability Class: Hearing Difficulty
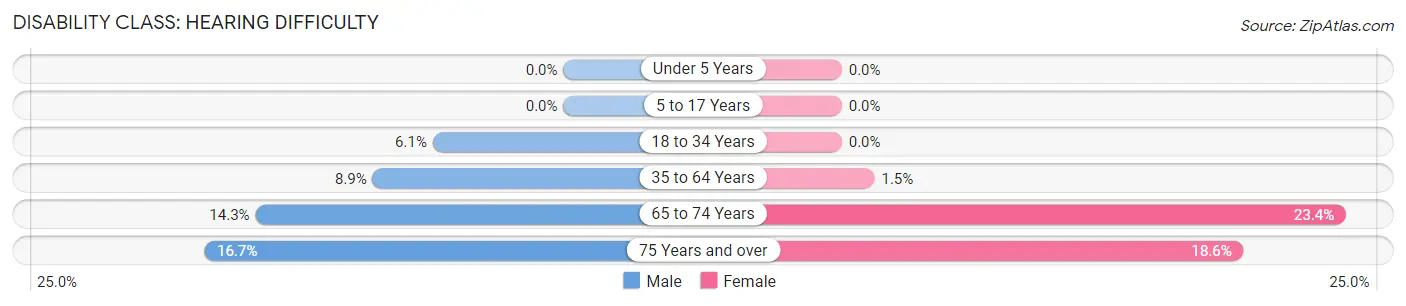
| Age Bracket | Male | Female |
| Under 5 Years | 0 (0.0%) | 0 (0.0%) |
| 5 to 17 Years | 0 (0.0%) | 0 (0.0%) |
| 18 to 34 Years | 2 (6.1%) | 0 (0.0%) |
| 35 to 64 Years | 10 (8.8%) | 2 (1.5%) |
| 65 to 74 Years | 5 (14.3%) | 11 (23.4%) |
| 75 Years and over | 4 (16.7%) | 11 (18.6%) |
Disability Class: Vision Difficulty
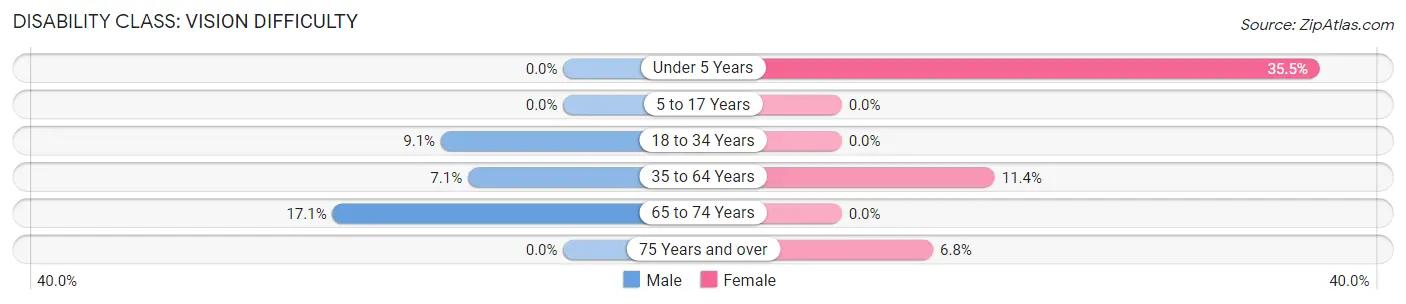
| Age Bracket | Male | Female |
| Under 5 Years | 0 (0.0%) | 11 (35.5%) |
| 5 to 17 Years | 0 (0.0%) | 0 (0.0%) |
| 18 to 34 Years | 3 (9.1%) | 0 (0.0%) |
| 35 to 64 Years | 8 (7.1%) | 15 (11.4%) |
| 65 to 74 Years | 6 (17.1%) | 0 (0.0%) |
| 75 Years and over | 0 (0.0%) | 4 (6.8%) |
Disability Class: Cognitive Difficulty
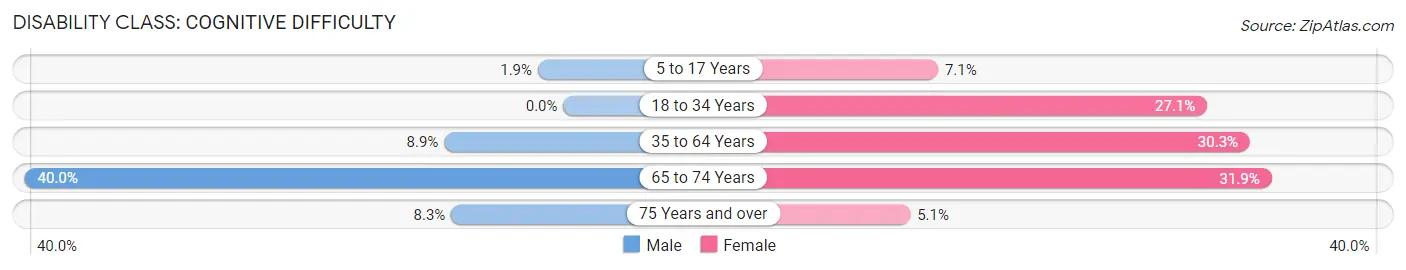
| Age Bracket | Male | Female |
| 5 to 17 Years | 1 (1.9%) | 3 (7.1%) |
| 18 to 34 Years | 0 (0.0%) | 16 (27.1%) |
| 35 to 64 Years | 10 (8.8%) | 40 (30.3%) |
| 65 to 74 Years | 14 (40.0%) | 15 (31.9%) |
| 75 Years and over | 2 (8.3%) | 3 (5.1%) |
Disability Class: Ambulatory Difficulty
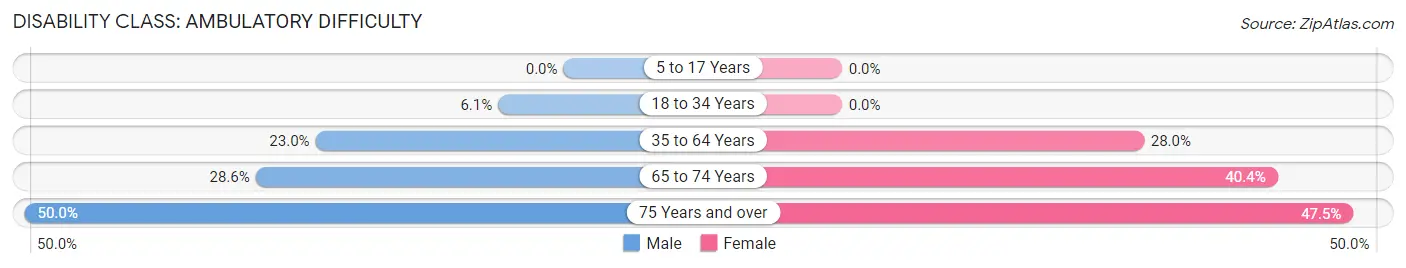
| Age Bracket | Male | Female |
| 5 to 17 Years | 0 (0.0%) | 0 (0.0%) |
| 18 to 34 Years | 2 (6.1%) | 0 (0.0%) |
| 35 to 64 Years | 26 (23.0%) | 37 (28.0%) |
| 65 to 74 Years | 10 (28.6%) | 19 (40.4%) |
| 75 Years and over | 12 (50.0%) | 28 (47.5%) |
Disability Class: Self-Care Difficulty
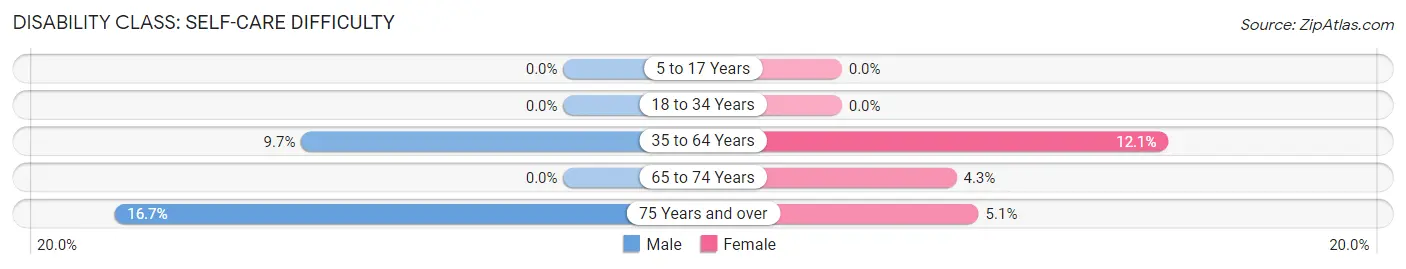
| Age Bracket | Male | Female |
| 5 to 17 Years | 0 (0.0%) | 0 (0.0%) |
| 18 to 34 Years | 0 (0.0%) | 0 (0.0%) |
| 35 to 64 Years | 11 (9.7%) | 16 (12.1%) |
| 65 to 74 Years | 0 (0.0%) | 2 (4.3%) |
| 75 Years and over | 4 (16.7%) | 3 (5.1%) |
Technology Access in Onamia
Computing Device Access in Onamia
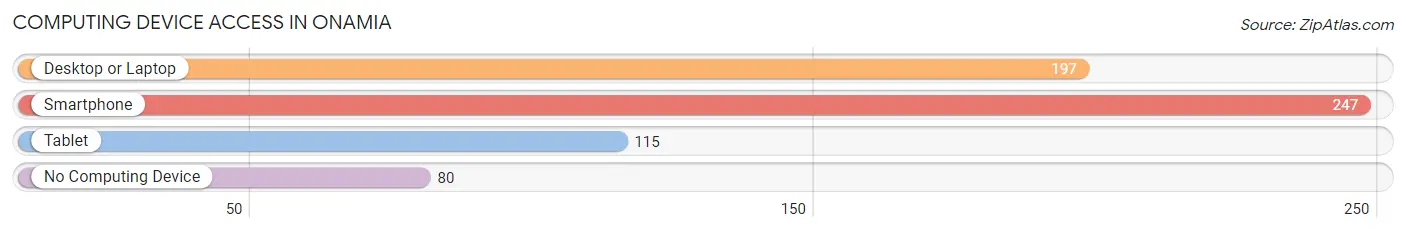
| Device Type | # Households | % Households |
| Desktop or Laptop | 197 | 57.3% |
| Smartphone | 247 | 71.8% |
| Tablet | 115 | 33.4% |
| No Computing Device | 80 | 23.3% |
| Total | 344 | 100.0% |
Internet Access in Onamia
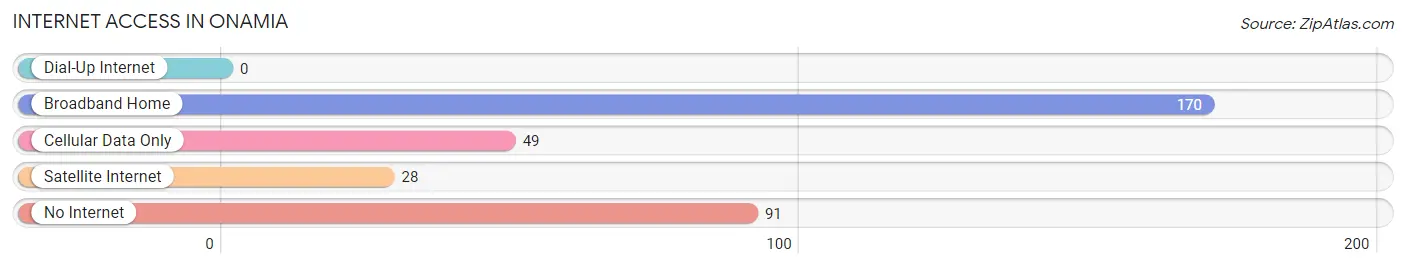
| Internet Type | # Households | % Households |
| Dial-Up Internet | 0 | 0.0% |
| Broadband Home | 170 | 49.4% |
| Cellular Data Only | 49 | 14.2% |
| Satellite Internet | 28 | 8.1% |
| No Internet | 91 | 26.5% |
| Total | 344 | 100.0% |
Onamia Summary
Onamia is a small city located in Mille Lacs County, Minnesota. It is situated on the south shore of Mille Lacs Lake, the second largest lake in the state. The city has a population of 1,521 as of the 2010 census.
History
The area around Onamia was first settled in the late 1800s by European immigrants. The first permanent settlers were a group of German and Swedish immigrants who arrived in 1856. The town was originally known as "Mille Lacs Station" and was a stop on the Great Northern Railway. In 1887, the town was renamed Onamia, after the Ojibwe word for "meeting place".
The city was officially incorporated in 1901. In the early 1900s, Onamia was a thriving logging and farming community. The city was also home to a number of businesses, including a sawmill, a creamery, a hotel, and a general store.
In the 1950s, the city began to experience a decline in population as people moved away to larger cities. In the 1970s, the city began to experience a resurgence as people began to move back to the area. The city has since become a popular tourist destination, with a number of resorts and campgrounds located in the area.
Geography
Onamia is located in Mille Lacs County, Minnesota. It is situated on the south shore of Mille Lacs Lake, the second largest lake in the state. The city is located approximately 75 miles north of Minneapolis and St. Paul.
The city has a total area of 1.2 square miles, all of which is land. The city is located in a heavily forested area, with a number of lakes and rivers in the vicinity.
Economy
Onamia's economy is largely based on tourism. The city is home to a number of resorts and campgrounds, as well as a number of restaurants and other businesses catering to tourists. The city is also home to a number of manufacturing businesses, including a wood products plant and a plastics plant.
The city is also home to a number of government offices, including the Mille Lacs County Courthouse and the Mille Lacs County Sheriff's Office.
Demographics
As of the 2010 census, the city had a population of 1,521. The racial makeup of the city was 94.2% White, 0.7% African American, 0.7% Native American, 0.3% Asian, 0.1% Pacific Islander, and 3.1% from two or more races. Hispanic or Latino of any race were 1.3% of the population.
The median household income in the city was $37,917, and the median family income was $45,625. The per capita income for the city was $19,945. About 11.2% of families and 14.2% of the population were below the poverty line, including 19.2% of those under age 18 and 8.3% of those age 65 or over.
Common Questions
What is Per Capita Income in Onamia?
Per Capita income in Onamia is $21,296.
What is the Median Family Income in Onamia?
Median Family Income in Onamia is $47,105.
What is the Median Household income in Onamia?
Median Household Income in Onamia is $25,417.
What is Income or Wage Gap in Onamia?
Income or Wage Gap in Onamia is 23.3%.
Women in Onamia earn 76.7 cents for every dollar earned by a man.
What is Inequality or Gini Index in Onamia?
Inequality or Gini Index in Onamia is 0.49.
What is the Total Population of Onamia?
Total Population of Onamia is 796.
What is the Total Male Population of Onamia?
Total Male Population of Onamia is 372.
What is the Total Female Population of Onamia?
Total Female Population of Onamia is 424.
What is the Ratio of Males per 100 Females in Onamia?
There are 87.74 Males per 100 Females in Onamia.
What is the Ratio of Females per 100 Males in Onamia?
There are 113.98 Females per 100 Males in Onamia.
What is the Median Population Age in Onamia?
Median Population Age in Onamia is 44.4 Years.
What is the Average Family Size in Onamia
Average Family Size in Onamia is 2.9 People.
What is the Average Household Size in Onamia
Average Household Size in Onamia is 1.9 People.
How Large is the Labor Force in Onamia?
There are 254 People in the Labor Forcein in Onamia.
What is the Percentage of People in the Labor Force in Onamia?
41.5% of People are in the Labor Force in Onamia.
What is the Unemployment Rate in Onamia?
Unemployment Rate in Onamia is 3.5%.