La Crescent, MN Map & Demographics
La Crescent Map
La Crescent Overview
$41,455
PER CAPITA INCOME
$103,221
AVG FAMILY INCOME
$70,813
AVG HOUSEHOLD INCOME
13.2%
WAGE / INCOME GAP [ % ]
86.8¢/ $1
WAGE / INCOME GAP [ $ ]
0.36
INEQUALITY / GINI INDEX
5,352
TOTAL POPULATION
2,765
MALE POPULATION
2,587
FEMALE POPULATION
106.88
MALES / 100 FEMALES
93.56
FEMALES / 100 MALES
42.8
MEDIAN AGE
2.9
AVG FAMILY SIZE
2.2
AVG HOUSEHOLD SIZE
3,118
LABOR FORCE [ PEOPLE ]
71.1%
PERCENT IN LABOR FORCE
La Crescent Zip Codes
La Crescent Area Codes
Income in La Crescent
Income Overview in La Crescent
Per Capita Income in La Crescent is $41,455, while median incomes of families and households are $103,221 and $70,813 respectively.
| Characteristic | Number | Measure |
| Per Capita Income | 5,352 | $41,455 |
| Median Family Income | 1,383 | $103,221 |
| Mean Family Income | 1,383 | $112,042 |
| Median Household Income | 2,345 | $70,813 |
| Mean Household Income | 2,345 | $91,431 |
| Income Deficit | 1,383 | $0 |
| Wage / Income Gap (%) | 5,352 | 13.19% |
| Wage / Income Gap ($) | 5,352 | 86.81¢ per $1 |
| Gini / Inequality Index | 5,352 | 0.36 |
Earnings by Sex in La Crescent
Average Earnings in La Crescent are $48,467, $52,228 for men and $45,338 for women, a difference of 13.2%.
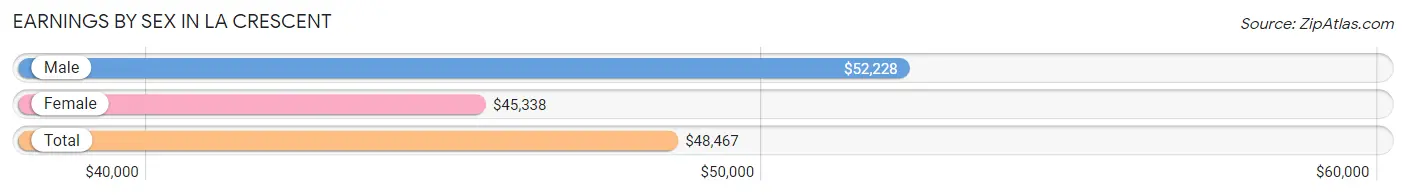
| Sex | Number | Average Earnings |
| Male | 1,760 (53.4%) | $52,228 |
| Female | 1,538 (46.6%) | $45,338 |
| Total | 3,298 (100.0%) | $48,467 |
Earnings by Sex by Income Bracket in La Crescent
The most common earnings brackets in La Crescent are $100,000+ for men (292 | 16.6%) and $55,000 to $64,999 for women (191 | 12.4%).
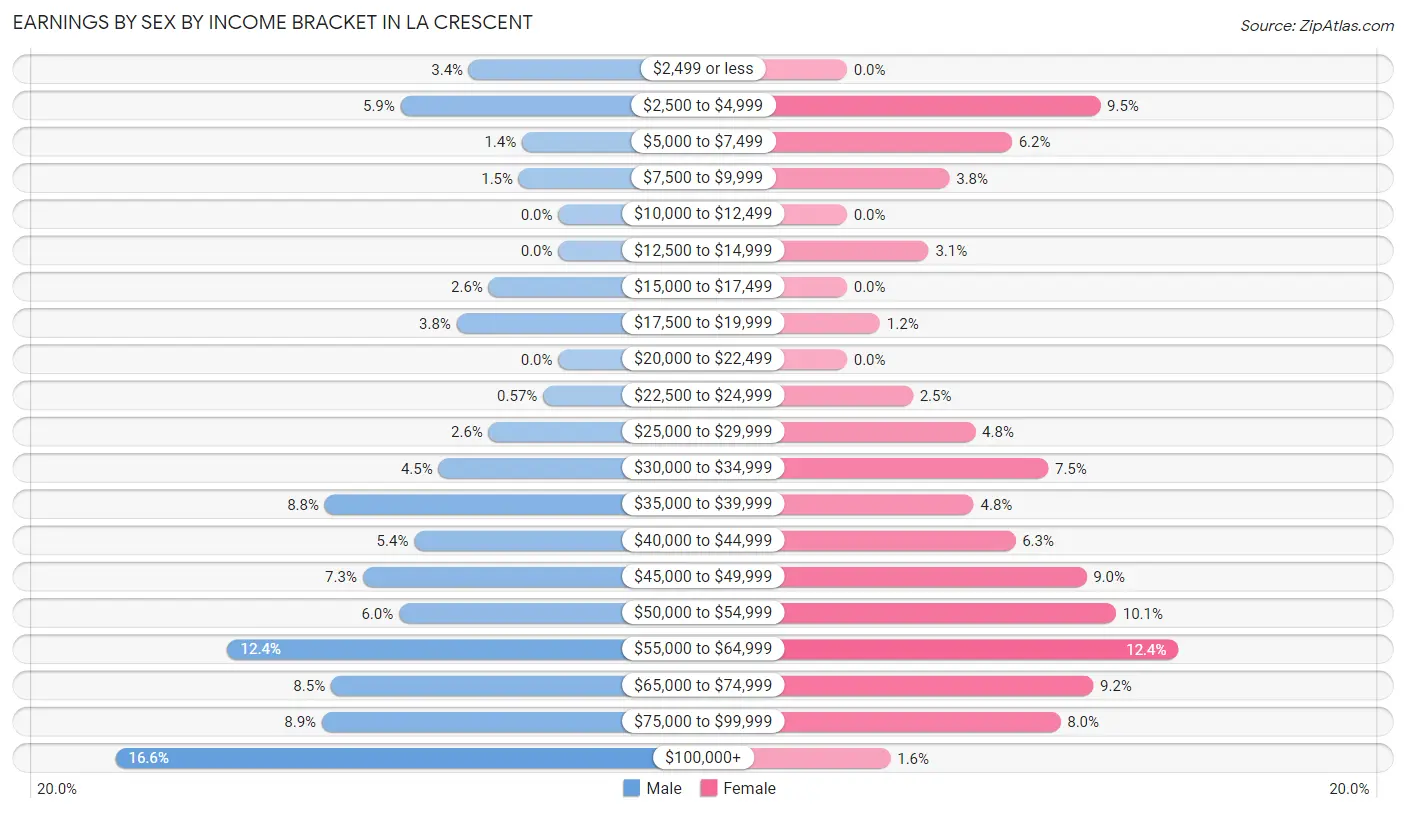
| Income | Male | Female |
| $2,499 or less | 59 (3.4%) | 0 (0.0%) |
| $2,500 to $4,999 | 104 (5.9%) | 146 (9.5%) |
| $5,000 to $7,499 | 24 (1.4%) | 95 (6.2%) |
| $7,500 to $9,999 | 26 (1.5%) | 59 (3.8%) |
| $10,000 to $12,499 | 0 (0.0%) | 0 (0.0%) |
| $12,500 to $14,999 | 0 (0.0%) | 47 (3.1%) |
| $15,000 to $17,499 | 46 (2.6%) | 0 (0.0%) |
| $17,500 to $19,999 | 67 (3.8%) | 19 (1.2%) |
| $20,000 to $22,499 | 0 (0.0%) | 0 (0.0%) |
| $22,500 to $24,999 | 10 (0.6%) | 38 (2.5%) |
| $25,000 to $29,999 | 46 (2.6%) | 74 (4.8%) |
| $30,000 to $34,999 | 79 (4.5%) | 116 (7.5%) |
| $35,000 to $39,999 | 154 (8.7%) | 73 (4.8%) |
| $40,000 to $44,999 | 95 (5.4%) | 97 (6.3%) |
| $45,000 to $49,999 | 129 (7.3%) | 138 (9.0%) |
| $50,000 to $54,999 | 105 (6.0%) | 155 (10.1%) |
| $55,000 to $64,999 | 218 (12.4%) | 191 (12.4%) |
| $65,000 to $74,999 | 150 (8.5%) | 142 (9.2%) |
| $75,000 to $99,999 | 156 (8.9%) | 123 (8.0%) |
| $100,000+ | 292 (16.6%) | 25 (1.6%) |
| Total | 1,760 (100.0%) | 1,538 (100.0%) |
Earnings by Sex by Educational Attainment in La Crescent
Average earnings in La Crescent are $56,002 for men and $48,106 for women, a difference of 14.1%. Men with an educational attainment of graduate degree enjoy the highest average annual earnings of $121,300, while those with college or associate's degree education earn the least with $53,071. Women with an educational attainment of bachelor's degree earn the most with the average annual earnings of $55,625, while those with high school diploma education have the smallest earnings of $31,442.
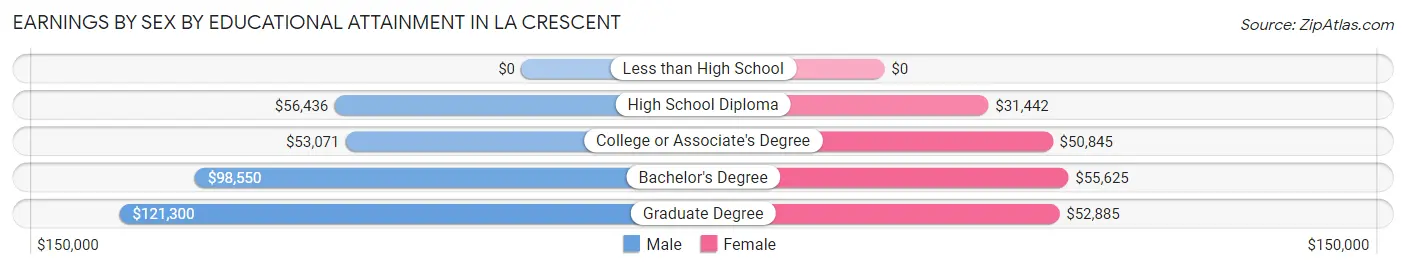
| Educational Attainment | Male Income | Female Income |
| Less than High School | - | - |
| High School Diploma | $56,436 | $31,442 |
| College or Associate's Degree | $53,071 | $50,845 |
| Bachelor's Degree | $98,550 | $55,625 |
| Graduate Degree | $121,300 | $52,885 |
| Total | $56,002 | $48,106 |
Family Income in La Crescent
Family Income Brackets in La Crescent
According to the La Crescent family income data, there are 463 families falling into the $100,000 to $149,999 income range, which is the most common income bracket and makes up 33.5% of all families.
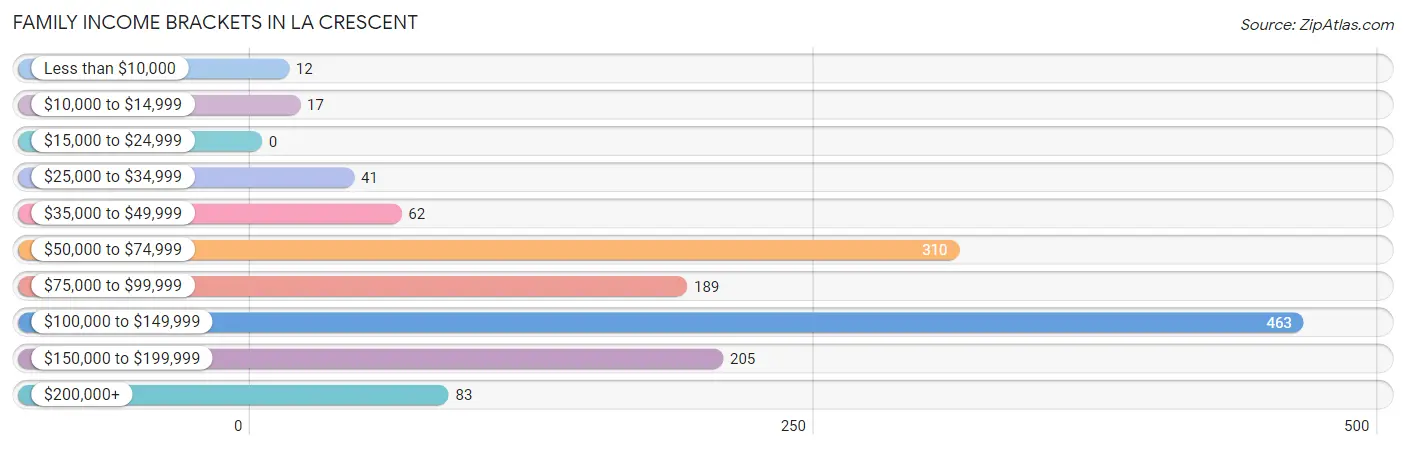
| Income Bracket | # Families | % Families |
| Less than $10,000 | 12 | 0.9% |
| $10,000 to $14,999 | 17 | 1.2% |
| $15,000 to $24,999 | 0 | 0.0% |
| $25,000 to $34,999 | 41 | 3.0% |
| $35,000 to $49,999 | 62 | 4.5% |
| $50,000 to $74,999 | 310 | 22.4% |
| $75,000 to $99,999 | 189 | 13.7% |
| $100,000 to $149,999 | 463 | 33.5% |
| $150,000 to $199,999 | 205 | 14.8% |
| $200,000+ | 83 | 6.0% |
Family Income by Famaliy Size in La Crescent
5-person families (146 | 10.6%) account for the highest median family income in La Crescent with $166,186 per family, while 2-person families (747 | 54.0%) have the highest median income of $44,950 per family member.
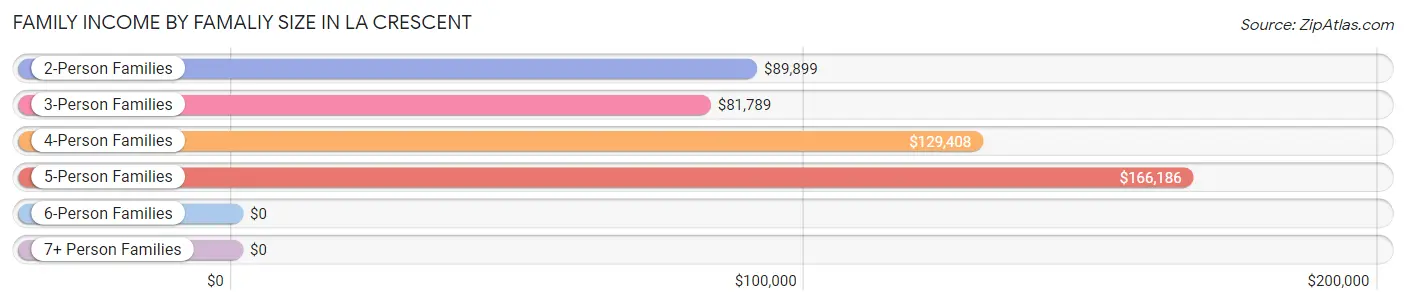
| Income Bracket | # Families | Median Income |
| 2-Person Families | 747 (54.0%) | $89,899 |
| 3-Person Families | 331 (23.9%) | $81,789 |
| 4-Person Families | 159 (11.5%) | $129,408 |
| 5-Person Families | 146 (10.6%) | $166,186 |
| 6-Person Families | 0 (0.0%) | $0 |
| 7+ Person Families | 0 (0.0%) | $0 |
| Total | 1,383 (100.0%) | $103,221 |
Family Income by Number of Earners in La Crescent
The median family income in La Crescent is $103,221, with families comprising 3+ earners (167) having the highest median family income of $125,231, while families with no earners (252) have the lowest median family income of $65,283, accounting for 12.1% and 18.2% of families, respectively.
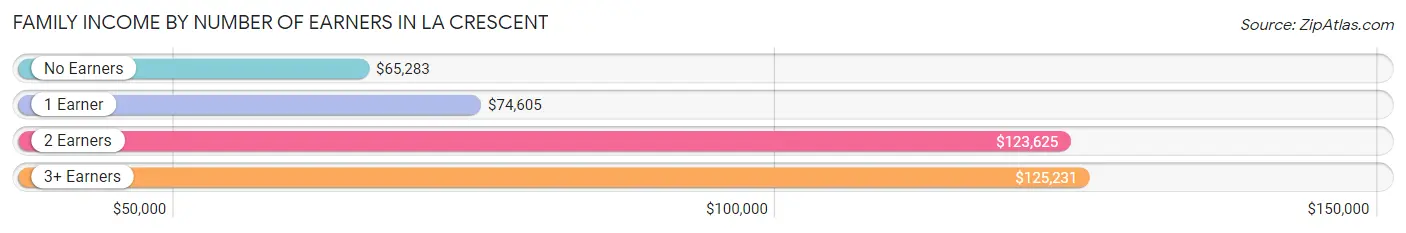
| Number of Earners | # Families | Median Income |
| No Earners | 252 (18.2%) | $65,283 |
| 1 Earner | 290 (21.0%) | $74,605 |
| 2 Earners | 674 (48.7%) | $123,625 |
| 3+ Earners | 167 (12.1%) | $125,231 |
| Total | 1,383 (100.0%) | $103,221 |
Household Income in La Crescent
Household Income Brackets in La Crescent
With 638 households falling in the category, the $50,000 to $74,999 income range is the most frequent in La Crescent, accounting for 27.2% of all households. In contrast, only 35 households (1.5%) fall into the $10,000 to $14,999 income bracket, making it the least populous group.
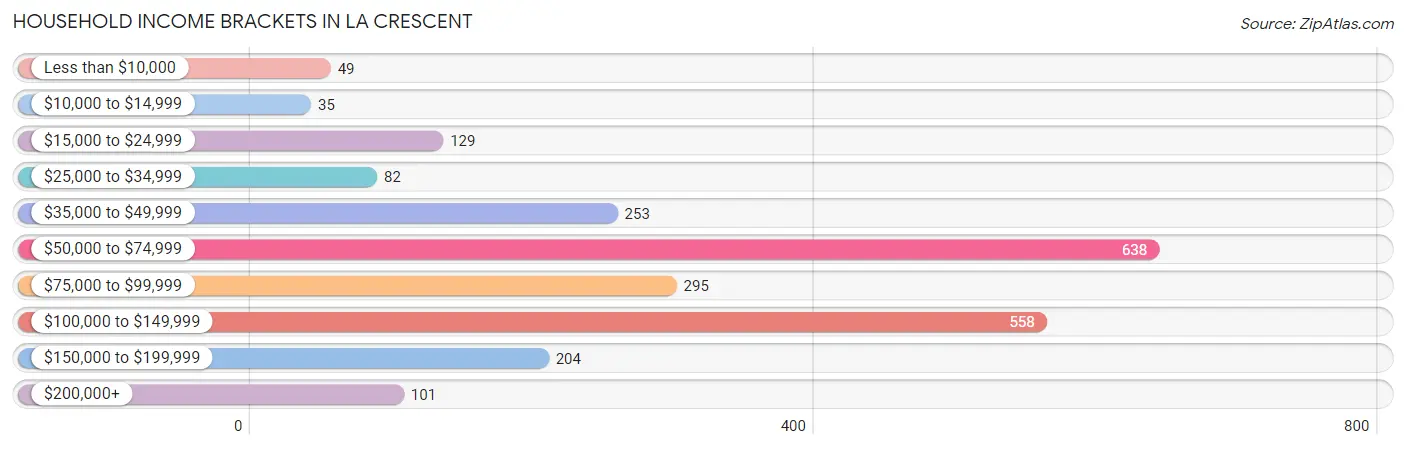
| Income Bracket | # Households | % Households |
| Less than $10,000 | 49 | 2.1% |
| $10,000 to $14,999 | 35 | 1.5% |
| $15,000 to $24,999 | 129 | 5.5% |
| $25,000 to $34,999 | 82 | 3.5% |
| $35,000 to $49,999 | 253 | 10.8% |
| $50,000 to $74,999 | 638 | 27.2% |
| $75,000 to $99,999 | 295 | 12.6% |
| $100,000 to $149,999 | 558 | 23.8% |
| $150,000 to $199,999 | 204 | 8.7% |
| $200,000+ | 101 | 4.3% |
Household Income by Householder Age in La Crescent
The median household income in La Crescent is $70,813, with the highest median household income of $102,669 found in the 45 to 64 years age bracket for the primary householder. A total of 920 households (39.2%) fall into this category. Meanwhile, the 15 to 24 years age bracket for the primary householder has the lowest median household income of $0, with 41 households (1.8%) in this group.
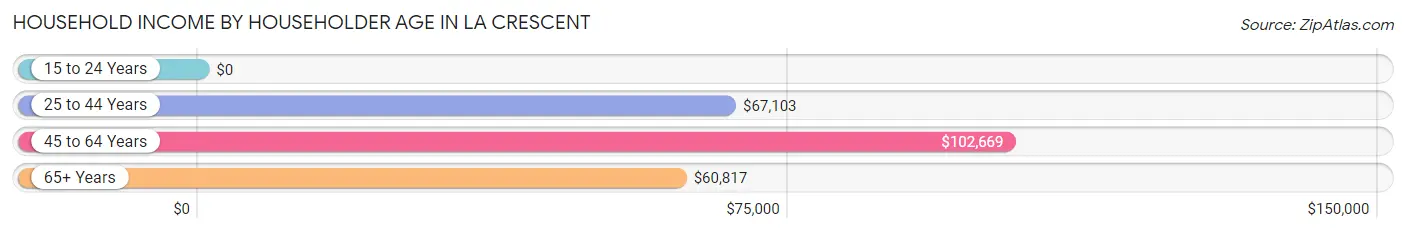
| Income Bracket | # Households | Median Income |
| 15 to 24 Years | 41 (1.8%) | $0 |
| 25 to 44 Years | 775 (33.1%) | $67,103 |
| 45 to 64 Years | 920 (39.2%) | $102,669 |
| 65+ Years | 609 (26.0%) | $60,817 |
| Total | 2,345 (100.0%) | $70,813 |
Poverty in La Crescent
Income Below Poverty by Sex and Age in La Crescent
With 4.1% poverty level for males and 6.5% for females among the residents of La Crescent, under 5 year old males and 45 to 54 year old females are the most vulnerable to poverty, with 21 males (34.4%) and 56 females (21.0%) in their respective age groups living below the poverty level.
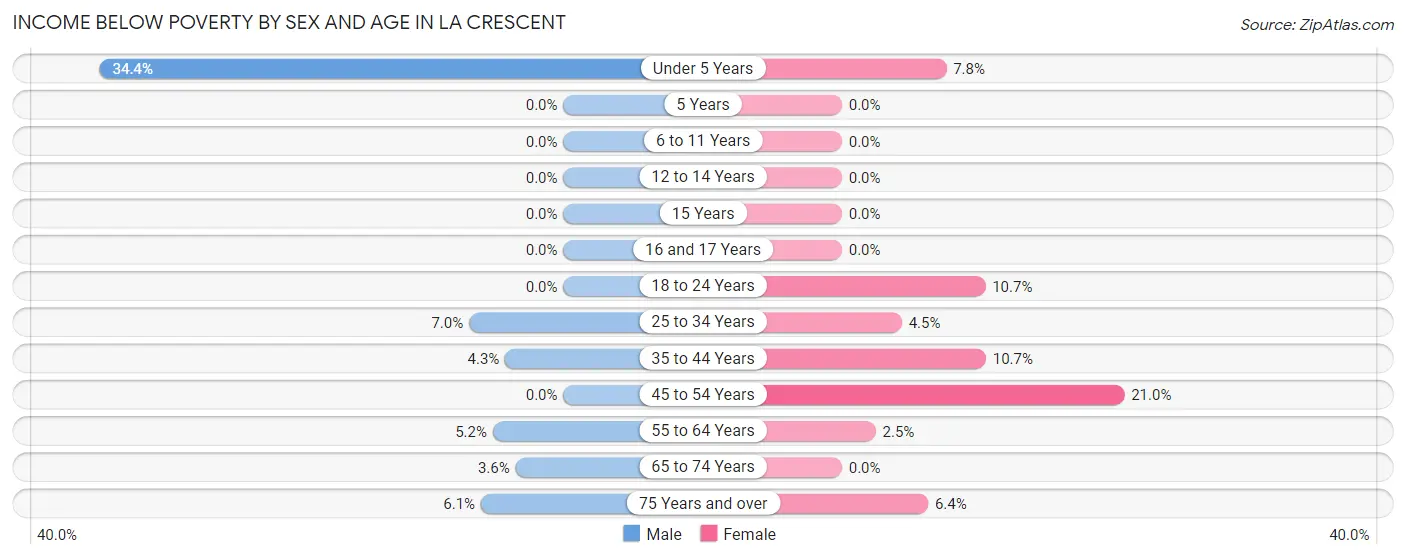
| Age Bracket | Male | Female |
| Under 5 Years | 21 (34.4%) | 11 (7.7%) |
| 5 Years | 0 (0.0%) | 0 (0.0%) |
| 6 to 11 Years | 0 (0.0%) | 0 (0.0%) |
| 12 to 14 Years | 0 (0.0%) | 0 (0.0%) |
| 15 Years | 0 (0.0%) | 0 (0.0%) |
| 16 and 17 Years | 0 (0.0%) | 0 (0.0%) |
| 18 to 24 Years | 0 (0.0%) | 18 (10.6%) |
| 25 to 34 Years | 25 (7.0%) | 13 (4.4%) |
| 35 to 44 Years | 15 (4.3%) | 42 (10.7%) |
| 45 to 54 Years | 0 (0.0%) | 56 (21.0%) |
| 55 to 64 Years | 25 (5.2%) | 12 (2.5%) |
| 65 to 74 Years | 10 (3.5%) | 0 (0.0%) |
| 75 Years and over | 17 (6.1%) | 16 (6.4%) |
| Total | 113 (4.1%) | 168 (6.5%) |
Income Above Poverty by Sex and Age in La Crescent
According to the poverty statistics in La Crescent, males aged 5 years and females aged 5 years are the age groups that are most secure financially, with 100.0% of males and 100.0% of females in these age groups living above the poverty line.
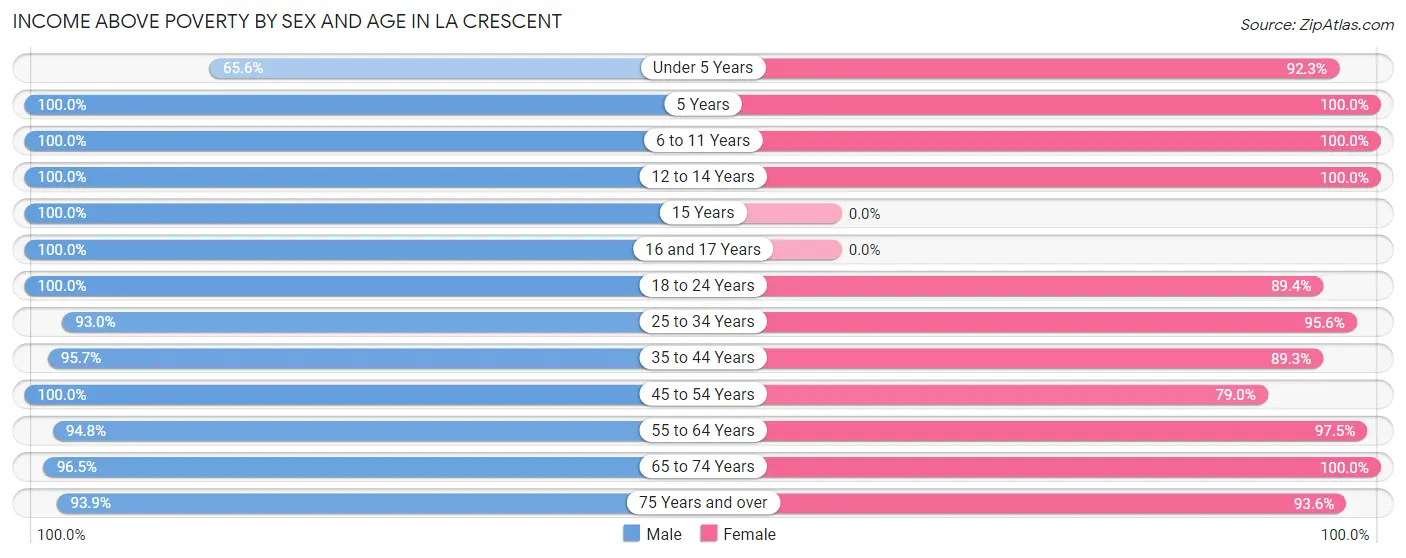
| Age Bracket | Male | Female |
| Under 5 Years | 40 (65.6%) | 131 (92.2%) |
| 5 Years | 70 (100.0%) | 18 (100.0%) |
| 6 to 11 Years | 255 (100.0%) | 230 (100.0%) |
| 12 to 14 Years | 53 (100.0%) | 105 (100.0%) |
| 15 Years | 15 (100.0%) | 0 (0.0%) |
| 16 and 17 Years | 95 (100.0%) | 0 (0.0%) |
| 18 to 24 Years | 171 (100.0%) | 151 (89.3%) |
| 25 to 34 Years | 332 (93.0%) | 279 (95.6%) |
| 35 to 44 Years | 332 (95.7%) | 351 (89.3%) |
| 45 to 54 Years | 271 (100.0%) | 211 (79.0%) |
| 55 to 64 Years | 452 (94.8%) | 466 (97.5%) |
| 65 to 74 Years | 272 (96.5%) | 226 (100.0%) |
| 75 Years and over | 261 (93.9%) | 234 (93.6%) |
| Total | 2,619 (95.9%) | 2,402 (93.5%) |
Income Below Poverty Among Married-Couple Families in La Crescent
The poverty statistics for married-couple families in La Crescent show that 1.6% or 17 of the total 1,077 families live below the poverty line. Families with no children have the highest poverty rate of 2.5%, comprising of 17 families. On the other hand, families with 1 or 2 children have the lowest poverty rate of 0.0%, which includes 0 families.
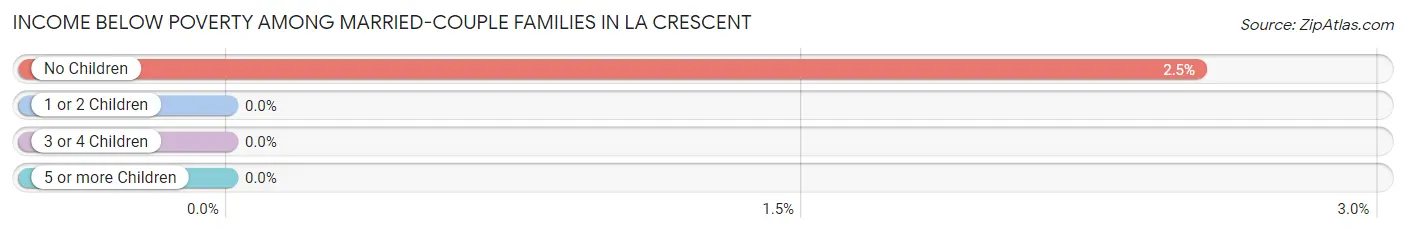
| Children | Above Poverty | Below Poverty |
| No Children | 656 (97.5%) | 17 (2.5%) |
| 1 or 2 Children | 263 (100.0%) | 0 (0.0%) |
| 3 or 4 Children | 141 (100.0%) | 0 (0.0%) |
| 5 or more Children | 0 (0.0%) | 0 (0.0%) |
| Total | 1,060 (98.4%) | 17 (1.6%) |
Income Below Poverty Among Single-Parent Households in La Crescent
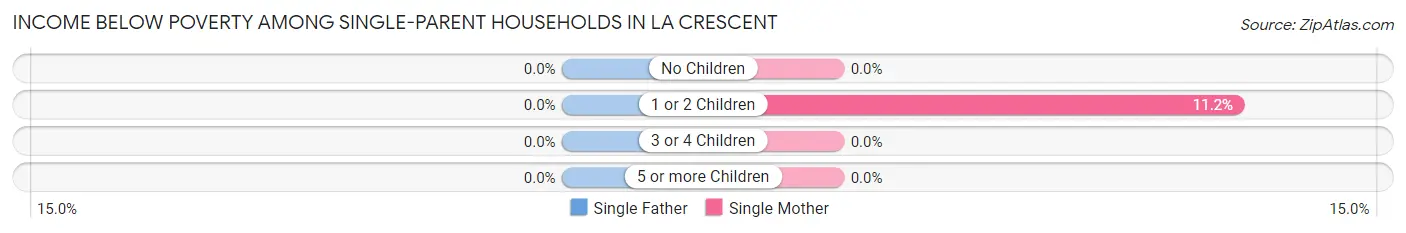
| Children | Single Father | Single Mother |
| No Children | 0 (0.0%) | 0 (0.0%) |
| 1 or 2 Children | 0 (0.0%) | 13 (11.2%) |
| 3 or 4 Children | 0 (0.0%) | 0 (0.0%) |
| 5 or more Children | 0 (0.0%) | 0 (0.0%) |
| Total | 0 (0.0%) | 13 (7.0%) |
Income Below Poverty Among Married-Couple vs Single-Parent Households in La Crescent
The poverty data for La Crescent shows that 17 of the married-couple family households (1.6%) and 13 of the single-parent households (4.3%) are living below the poverty level. Within the married-couple family households, those with no children have the highest poverty rate, with 17 households (2.5%) falling below the poverty line. Among the single-parent households, those with 1 or 2 children have the highest poverty rate, with 13 household (9.3%) living below poverty.
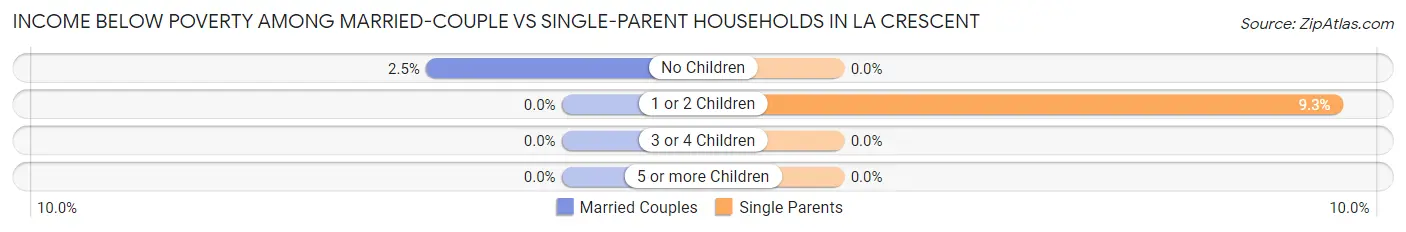
| Children | Married-Couple Families | Single-Parent Households |
| No Children | 17 (2.5%) | 0 (0.0%) |
| 1 or 2 Children | 0 (0.0%) | 13 (9.3%) |
| 3 or 4 Children | 0 (0.0%) | 0 (0.0%) |
| 5 or more Children | 0 (0.0%) | 0 (0.0%) |
| Total | 17 (1.6%) | 13 (4.3%) |
Race in La Crescent
The most populous races in La Crescent are White / Caucasian (4,915 | 91.8%), Two or more Races (397 | 7.4%), and Hispanic or Latino (67 | 1.3%).
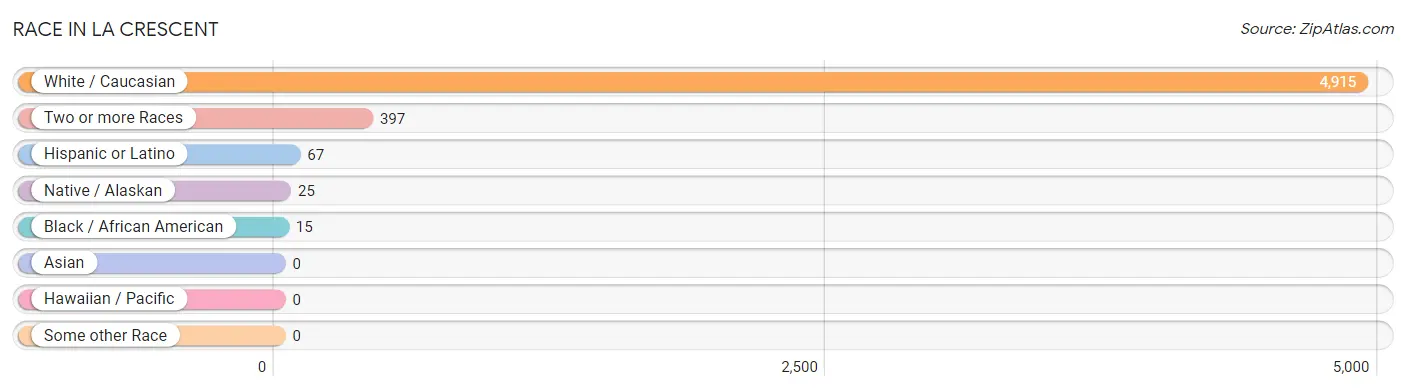
| Race | # Population | % Population |
| Asian | 0 | 0.0% |
| Black / African American | 15 | 0.3% |
| Hawaiian / Pacific | 0 | 0.0% |
| Hispanic or Latino | 67 | 1.3% |
| Native / Alaskan | 25 | 0.5% |
| White / Caucasian | 4,915 | 91.8% |
| Two or more Races | 397 | 7.4% |
| Some other Race | 0 | 0.0% |
| Total | 5,352 | 100.0% |
Ancestry in La Crescent
The most populous ancestries reported in La Crescent are German (2,043 | 38.2%), Norwegian (1,220 | 22.8%), Irish (690 | 12.9%), American (352 | 6.6%), and Polish (274 | 5.1%), together accounting for 85.6% of all La Crescent residents.
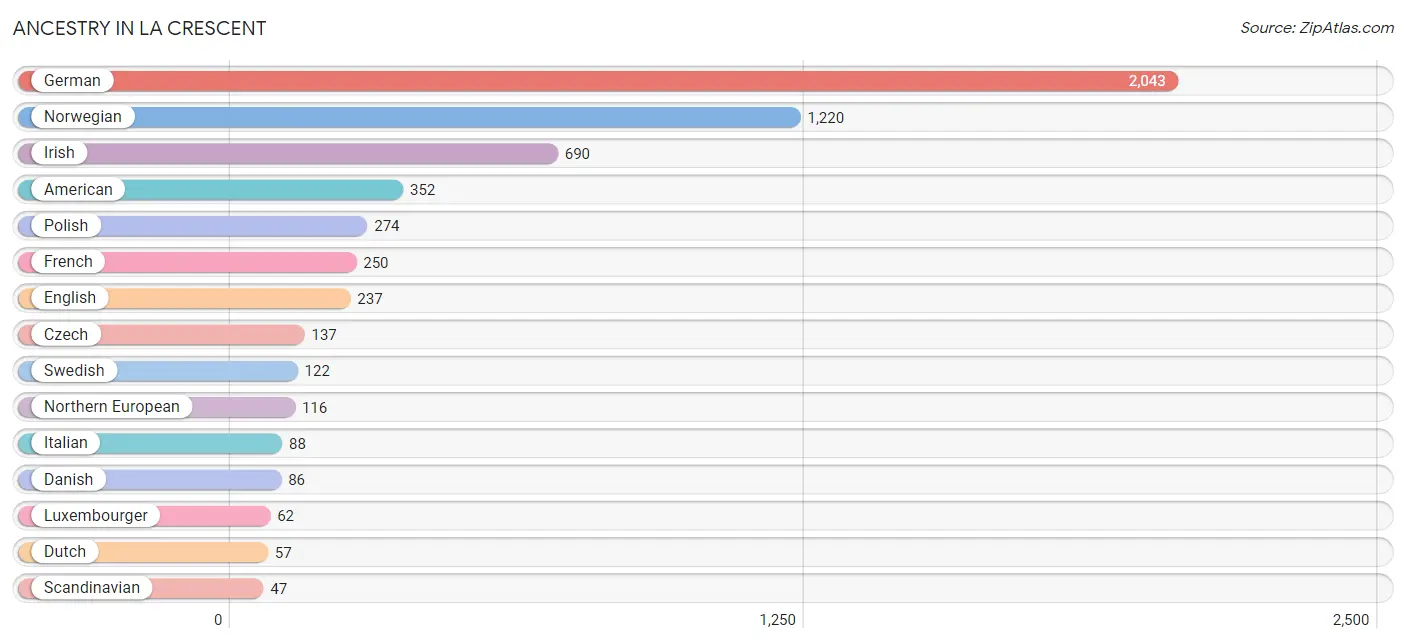
| Ancestry | # Population | % Population |
| American | 352 | 6.6% |
| Arab | 10 | 0.2% |
| Canadian | 20 | 0.4% |
| Chippewa | 25 | 0.5% |
| Comanche | 1 | 0.0% |
| Czech | 137 | 2.6% |
| Czechoslovakian | 16 | 0.3% |
| Danish | 86 | 1.6% |
| Dutch | 57 | 1.1% |
| Eastern European | 20 | 0.4% |
| English | 237 | 4.4% |
| Finnish | 23 | 0.4% |
| French | 250 | 4.7% |
| French Canadian | 18 | 0.3% |
| German | 2,043 | 38.2% |
| Irish | 690 | 12.9% |
| Italian | 88 | 1.6% |
| Lebanese | 10 | 0.2% |
| Lithuanian | 13 | 0.2% |
| Luxembourger | 62 | 1.2% |
| Mexican | 1 | 0.0% |
| Northern European | 116 | 2.2% |
| Norwegian | 1,220 | 22.8% |
| Peruvian | 34 | 0.6% |
| Polish | 274 | 5.1% |
| Scandinavian | 47 | 0.9% |
| Sioux | 18 | 0.3% |
| South American | 34 | 0.6% |
| Swedish | 122 | 2.3% | View All 29 Rows |
Immigrants in La Crescent
The most numerous immigrant groups reported in La Crescent came from Canada (46 | 0.9%), Latin America (34 | 0.6%), Peru (34 | 0.6%), South America (34 | 0.6%), and Europe (18 | 0.3%), together accounting for 3.1% of all La Crescent residents.
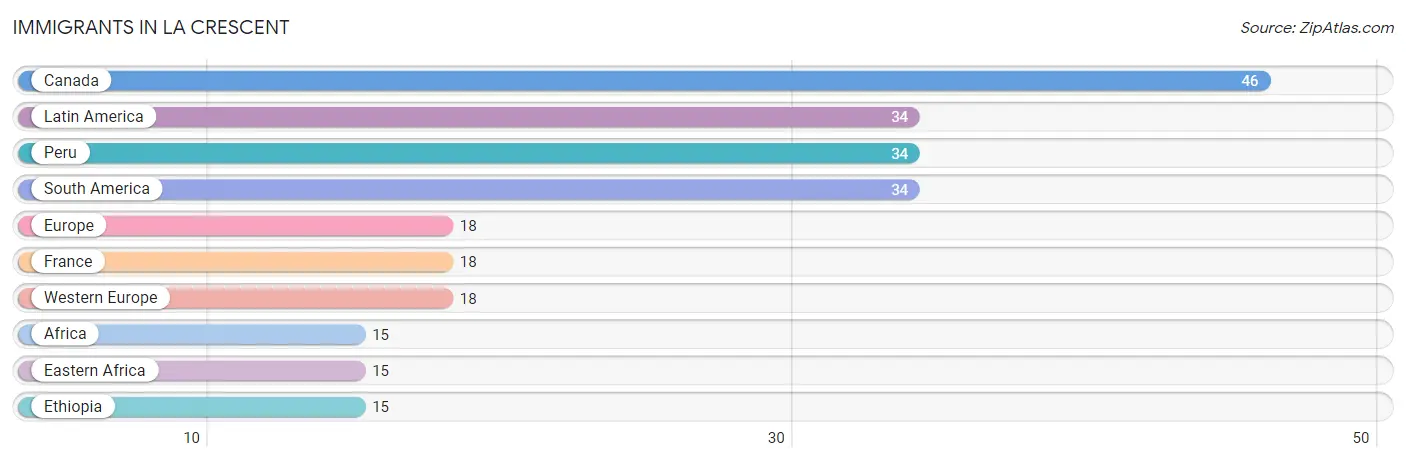
| Immigration Origin | # Population | % Population |
| Africa | 15 | 0.3% |
| Canada | 46 | 0.9% |
| Eastern Africa | 15 | 0.3% |
| Ethiopia | 15 | 0.3% |
| Europe | 18 | 0.3% |
| France | 18 | 0.3% |
| Latin America | 34 | 0.6% |
| Peru | 34 | 0.6% |
| South America | 34 | 0.6% |
| Western Europe | 18 | 0.3% | View All 10 Rows |
Sex and Age in La Crescent
Sex and Age in La Crescent
The most populous age groups in La Crescent are 5 to 9 Years (305 | 11.0%) for men and 55 to 59 Years (297 | 11.5%) for women.
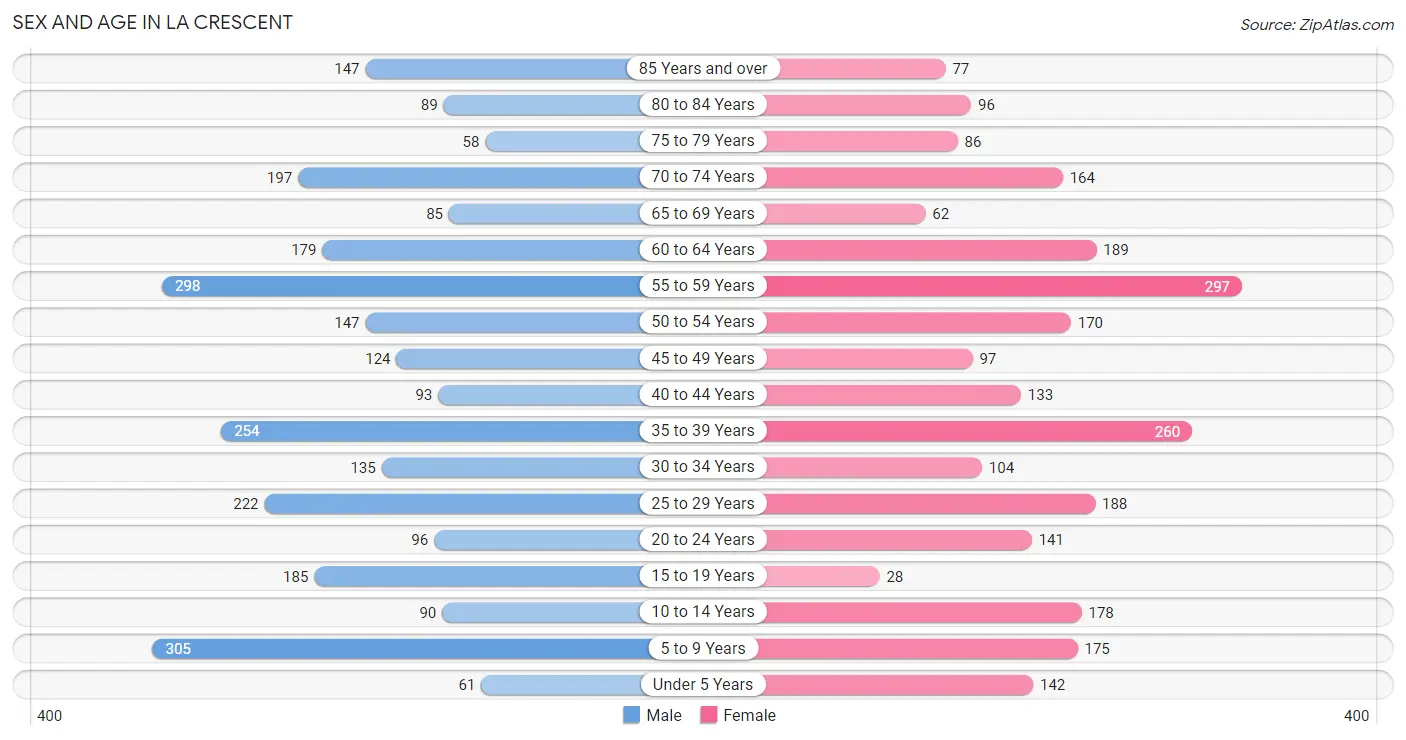
| Age Bracket | Male | Female |
| Under 5 Years | 61 (2.2%) | 142 (5.5%) |
| 5 to 9 Years | 305 (11.0%) | 175 (6.8%) |
| 10 to 14 Years | 90 (3.3%) | 178 (6.9%) |
| 15 to 19 Years | 185 (6.7%) | 28 (1.1%) |
| 20 to 24 Years | 96 (3.5%) | 141 (5.4%) |
| 25 to 29 Years | 222 (8.0%) | 188 (7.3%) |
| 30 to 34 Years | 135 (4.9%) | 104 (4.0%) |
| 35 to 39 Years | 254 (9.2%) | 260 (10.1%) |
| 40 to 44 Years | 93 (3.4%) | 133 (5.1%) |
| 45 to 49 Years | 124 (4.5%) | 97 (3.7%) |
| 50 to 54 Years | 147 (5.3%) | 170 (6.6%) |
| 55 to 59 Years | 298 (10.8%) | 297 (11.5%) |
| 60 to 64 Years | 179 (6.5%) | 189 (7.3%) |
| 65 to 69 Years | 85 (3.1%) | 62 (2.4%) |
| 70 to 74 Years | 197 (7.1%) | 164 (6.3%) |
| 75 to 79 Years | 58 (2.1%) | 86 (3.3%) |
| 80 to 84 Years | 89 (3.2%) | 96 (3.7%) |
| 85 Years and over | 147 (5.3%) | 77 (3.0%) |
| Total | 2,765 (100.0%) | 2,587 (100.0%) |
Families and Households in La Crescent
Median Family Size in La Crescent
The median family size in La Crescent is 2.90 persons per family, with married-couple families (1,077 | 77.9%) accounting for the largest median family size of 2.97 persons per family. On the other hand, single male/father families (121 | 8.7%) represent the smallest median family size with 2.40 persons per family.
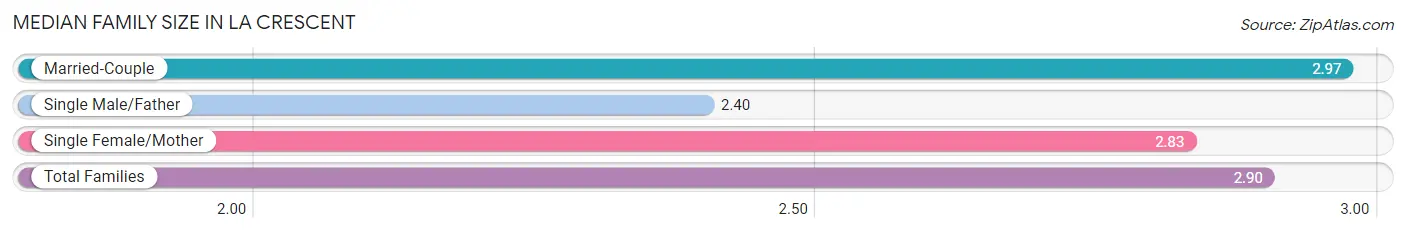
| Family Type | # Families | Family Size |
| Married-Couple | 1,077 (77.9%) | 2.97 |
| Single Male/Father | 121 (8.7%) | 2.40 |
| Single Female/Mother | 185 (13.4%) | 2.83 |
| Total Families | 1,383 (100.0%) | 2.90 |
Median Household Size in La Crescent
The median household size in La Crescent is 2.25 persons per household, with single female/mother households (185 | 7.9%) accounting for the largest median household size of 3.19 persons per household. non-family households (962 | 41.0%) represent the smallest median household size with 1.24 persons per household.
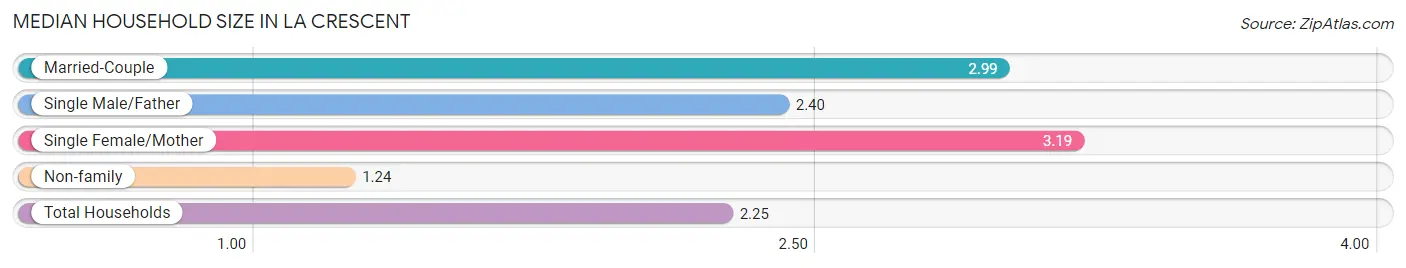
| Household Type | # Households | Household Size |
| Married-Couple | 1,077 (45.9%) | 2.99 |
| Single Male/Father | 121 (5.2%) | 2.40 |
| Single Female/Mother | 185 (7.9%) | 3.19 |
| Non-family | 962 (41.0%) | 1.24 |
| Total Households | 2,345 (100.0%) | 2.25 |
Household Size by Marriage Status in La Crescent
Out of a total of 2,345 households in La Crescent, 1,383 (59.0%) are family households, while 962 (41.0%) are nonfamily households. The most numerous type of family households are 2-person households, comprising 726, and the most common type of nonfamily households are 1-person households, comprising 716.
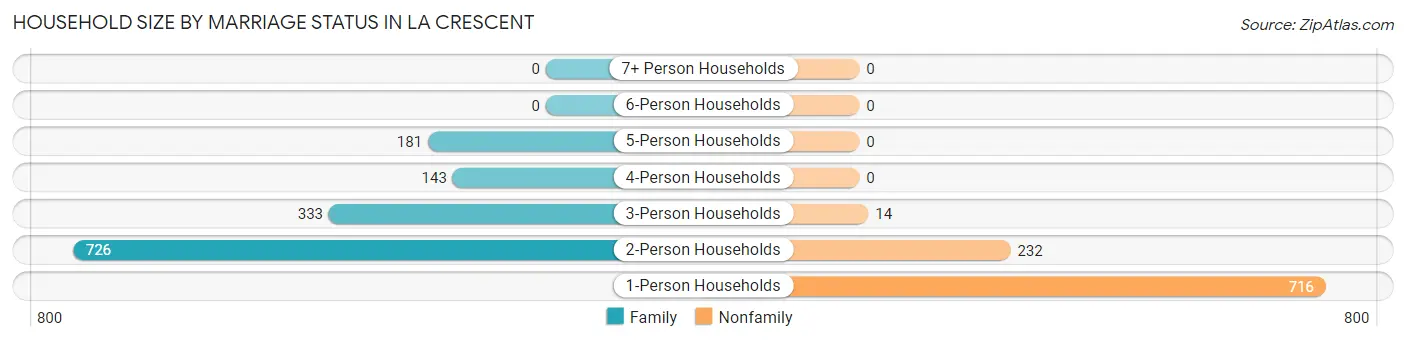
| Household Size | Family Households | Nonfamily Households |
| 1-Person Households | - | 716 (30.5%) |
| 2-Person Households | 726 (31.0%) | 232 (9.9%) |
| 3-Person Households | 333 (14.2%) | 14 (0.6%) |
| 4-Person Households | 143 (6.1%) | 0 (0.0%) |
| 5-Person Households | 181 (7.7%) | 0 (0.0%) |
| 6-Person Households | 0 (0.0%) | 0 (0.0%) |
| 7+ Person Households | 0 (0.0%) | 0 (0.0%) |
| Total | 1,383 (59.0%) | 962 (41.0%) |
Female Fertility in La Crescent
Fertility by Age in La Crescent
Average fertility rate in La Crescent is 34.0 births per 1,000 women. Women in the age bracket of 20 to 34 years have the highest fertility rate with 81.0 births per 1,000 women. Women in the age bracket of 20 to 34 years acount for 100.0% of all women with births.
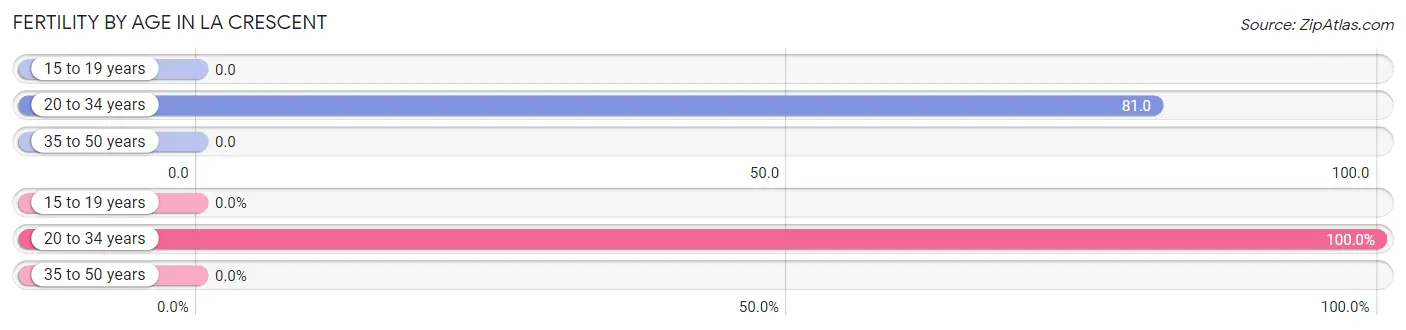
| Age Bracket | Women with Births | Births / 1,000 Women |
| 15 to 19 years | 0 (0.0%) | 0.0 |
| 20 to 34 years | 35 (100.0%) | 81.0 |
| 35 to 50 years | 0 (0.0%) | 0.0 |
| Total | 35 (100.0%) | 34.0 |
Fertility by Age by Marriage Status in La Crescent
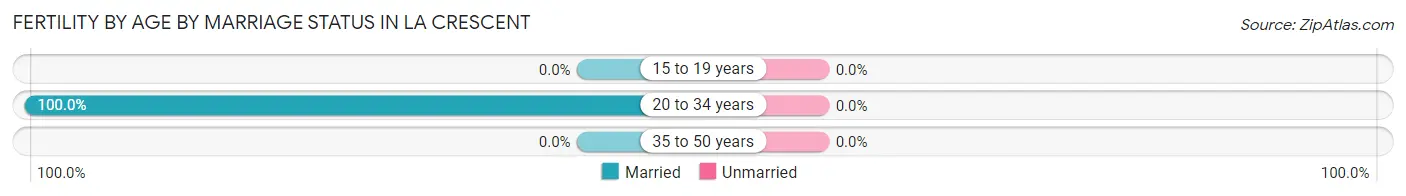
| Age Bracket | Married | Unmarried |
| 15 to 19 years | 0 (0.0%) | 0 (0.0%) |
| 20 to 34 years | 35 (100.0%) | 0 (0.0%) |
| 35 to 50 years | 0 (0.0%) | 0 (0.0%) |
| Total | 35 (100.0%) | 0 (0.0%) |
Fertility by Education in La Crescent
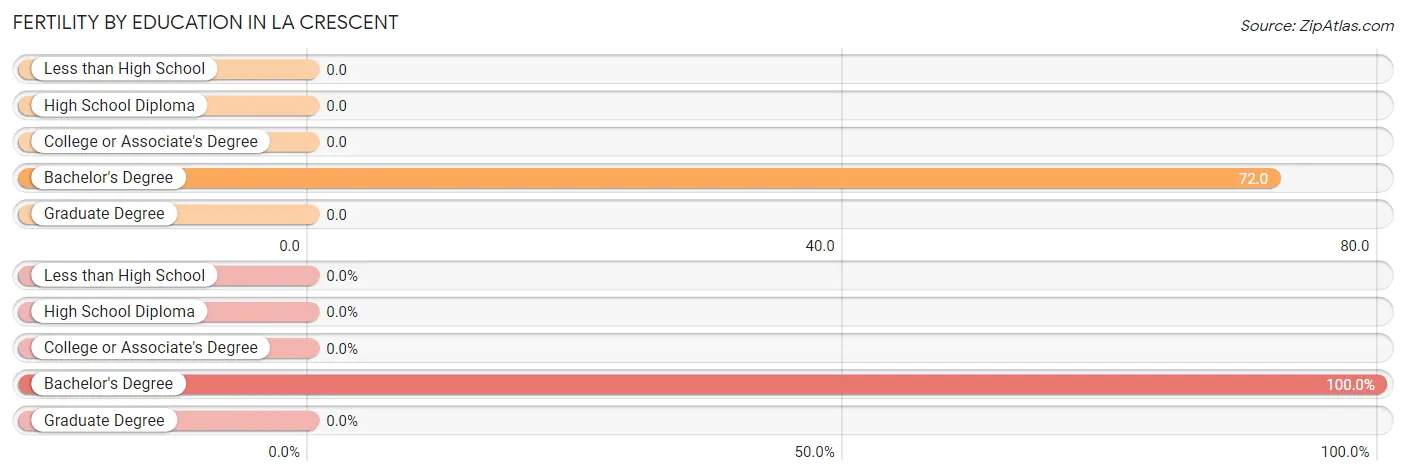
| Educational Attainment | Women with Births | Births / 1,000 Women |
| Less than High School | 0 (0.0%) | 0.0 |
| High School Diploma | 0 (0.0%) | 0.0 |
| College or Associate's Degree | 0 (0.0%) | 0.0 |
| Bachelor's Degree | 35 (100.0%) | 72.0 |
| Graduate Degree | 0 (0.0%) | 0.0 |
| Total | 35 (100.0%) | 34.0 |
Fertility by Education by Marriage Status in La Crescent
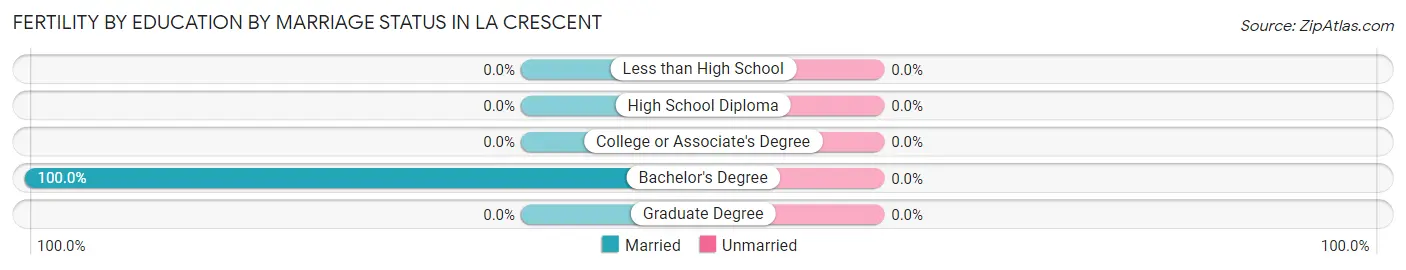
| Educational Attainment | Married | Unmarried |
| Less than High School | 0 (0.0%) | 0 (0.0%) |
| High School Diploma | 0 (0.0%) | 0 (0.0%) |
| College or Associate's Degree | 0 (0.0%) | 0 (0.0%) |
| Bachelor's Degree | 35 (100.0%) | 0 (0.0%) |
| Graduate Degree | 0 (0.0%) | 0 (0.0%) |
| Total | 35 (100.0%) | 0 (0.0%) |
Employment Characteristics in La Crescent
Employment by Class of Employer in La Crescent
Among the 3,028 employed individuals in La Crescent, private company employees (2,196 | 72.5%), not-for-profit organizations (339 | 11.2%), and state government employees (150 | 5.0%) make up the most common classes of employment.
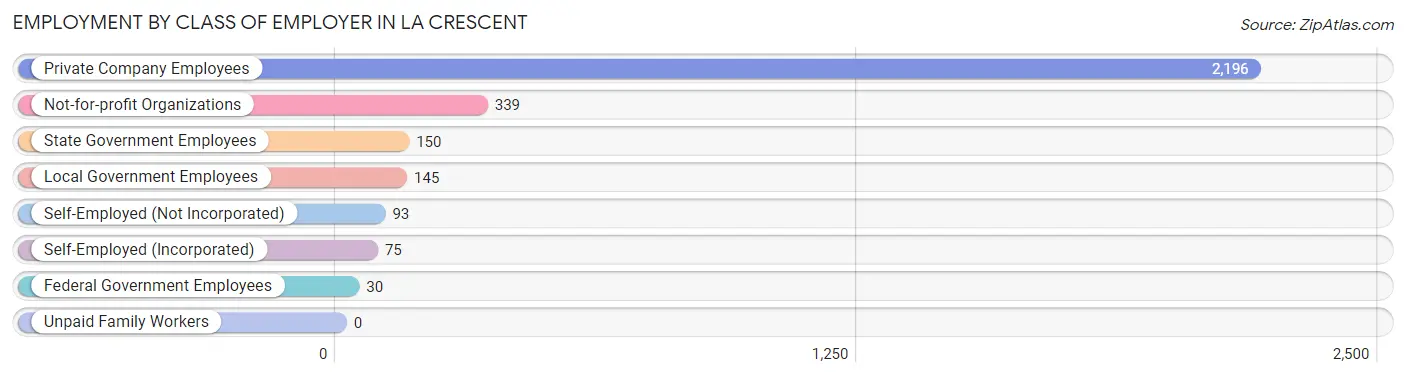
| Employer Class | # Employees | % Employees |
| Private Company Employees | 2,196 | 72.5% |
| Self-Employed (Incorporated) | 75 | 2.5% |
| Self-Employed (Not Incorporated) | 93 | 3.1% |
| Not-for-profit Organizations | 339 | 11.2% |
| Local Government Employees | 145 | 4.8% |
| State Government Employees | 150 | 5.0% |
| Federal Government Employees | 30 | 1.0% |
| Unpaid Family Workers | 0 | 0.0% |
| Total | 3,028 | 100.0% |
Employment Status by Age in La Crescent
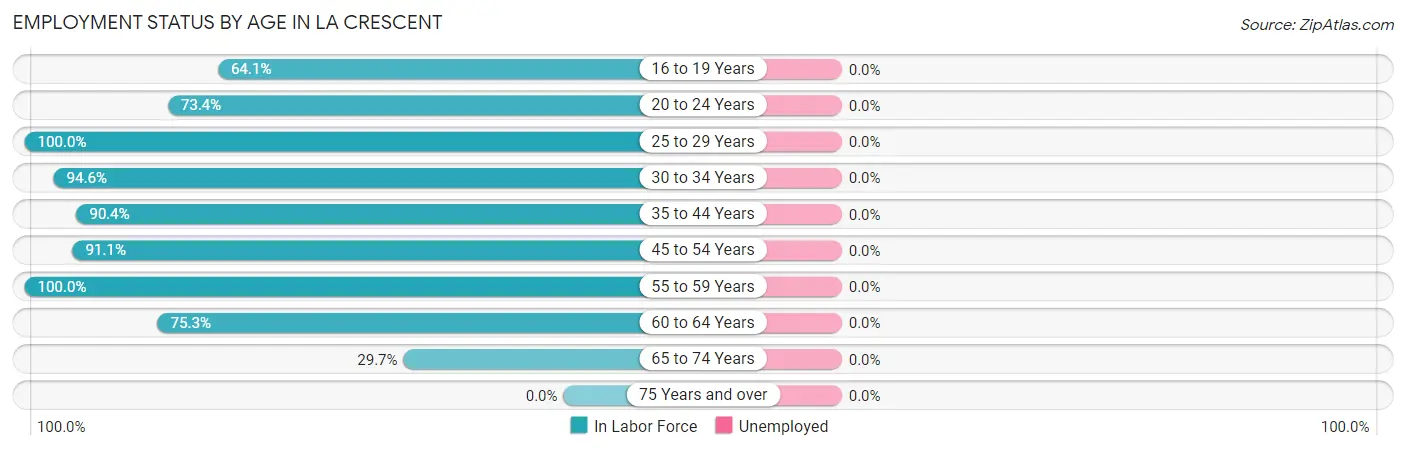
| Age Bracket | In Labor Force | Unemployed |
| 16 to 19 Years | 127 (64.1%) | 0 (0.0%) |
| 20 to 24 Years | 174 (73.4%) | 0 (0.0%) |
| 25 to 29 Years | 410 (100.0%) | 0 (0.0%) |
| 30 to 34 Years | 226 (94.6%) | 0 (0.0%) |
| 35 to 44 Years | 669 (90.4%) | 0 (0.0%) |
| 45 to 54 Years | 490 (91.1%) | 0 (0.0%) |
| 55 to 59 Years | 595 (100.0%) | 0 (0.0%) |
| 60 to 64 Years | 277 (75.3%) | 0 (0.0%) |
| 65 to 74 Years | 151 (29.7%) | 0 (0.0%) |
| 75 Years and over | 0 (0.0%) | 0 (0.0%) |
| Total | 3,118 (71.1%) | 0 (0.0%) |
Employment Status by Educational Attainment in La Crescent
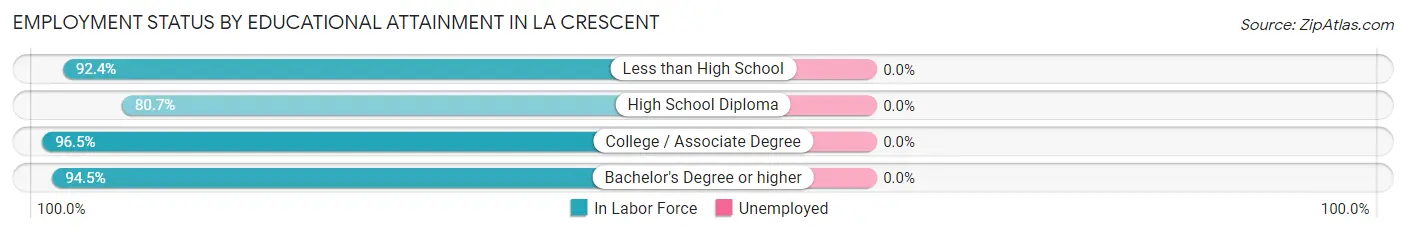
| Educational Attainment | In Labor Force | Unemployed |
| Less than High School | 109 (92.4%) | 0 (0.0%) |
| High School Diploma | 492 (80.7%) | 0 (0.0%) |
| College / Associate Degree | 1,060 (96.5%) | 0 (0.0%) |
| Bachelor's Degree or higher | 1,005 (94.5%) | 0 (0.0%) |
| Total | 2,667 (92.3%) | 0 (0.0%) |
Employment Occupations by Sex in La Crescent
Management, Business, Science and Arts Occupations
The most common Management, Business, Science and Arts occupations in La Crescent are Health Diagnosing & Treating (339 | 10.9%), Health Technologists (299 | 9.6%), Management (290 | 9.3%), Business & Financial (281 | 9.0%), and Computers, Engineering & Science (160 | 5.1%).
Management, Business, Science and Arts Occupations by Sex
Within the Management, Business, Science and Arts occupations in La Crescent, the most male-oriented occupations are Architecture & Engineering (100.0%), Arts, Media & Entertainment (100.0%), and Management (56.9%), while the most female-oriented occupations are Life, Physical & Social Science (100.0%), Education, Arts & Media (100.0%), and Education Instruction & Library (100.0%).
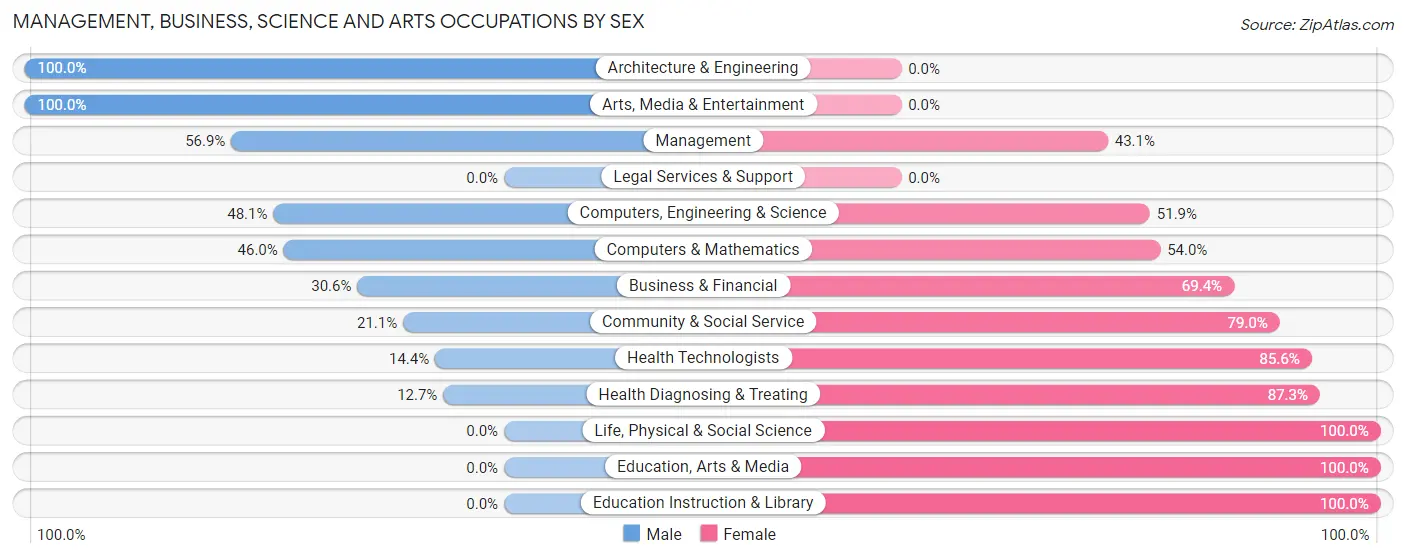
| Occupation | Male | Female |
| Management | 165 (56.9%) | 125 (43.1%) |
| Business & Financial | 86 (30.6%) | 195 (69.4%) |
| Computers, Engineering & Science | 77 (48.1%) | 83 (51.9%) |
| Computers & Mathematics | 57 (46.0%) | 67 (54.0%) |
| Architecture & Engineering | 20 (100.0%) | 0 (0.0%) |
| Life, Physical & Social Science | 0 (0.0%) | 16 (100.0%) |
| Community & Social Service | 20 (21.0%) | 75 (78.9%) |
| Education, Arts & Media | 0 (0.0%) | 28 (100.0%) |
| Legal Services & Support | 0 (0.0%) | 0 (0.0%) |
| Education Instruction & Library | 0 (0.0%) | 47 (100.0%) |
| Arts, Media & Entertainment | 20 (100.0%) | 0 (0.0%) |
| Health Diagnosing & Treating | 43 (12.7%) | 296 (87.3%) |
| Health Technologists | 43 (14.4%) | 256 (85.6%) |
| Total (Category) | 391 (33.6%) | 774 (66.4%) |
| Total (Overall) | 1,701 (54.5%) | 1,418 (45.5%) |
Services Occupations
The most common Services occupations in La Crescent are Food Preparation & Serving (143 | 4.6%), Security & Protection (134 | 4.3%), Law Enforcement (119 | 3.8%), Personal Care & Service (64 | 2.1%), and Healthcare Support (35 | 1.1%).
Services Occupations by Sex
Within the Services occupations in La Crescent, the most male-oriented occupations are Firefighting & Prevention (100.0%), Cleaning & Maintenance (100.0%), and Security & Protection (87.3%), while the most female-oriented occupations are Personal Care & Service (100.0%), Healthcare Support (82.9%), and Food Preparation & Serving (81.8%).
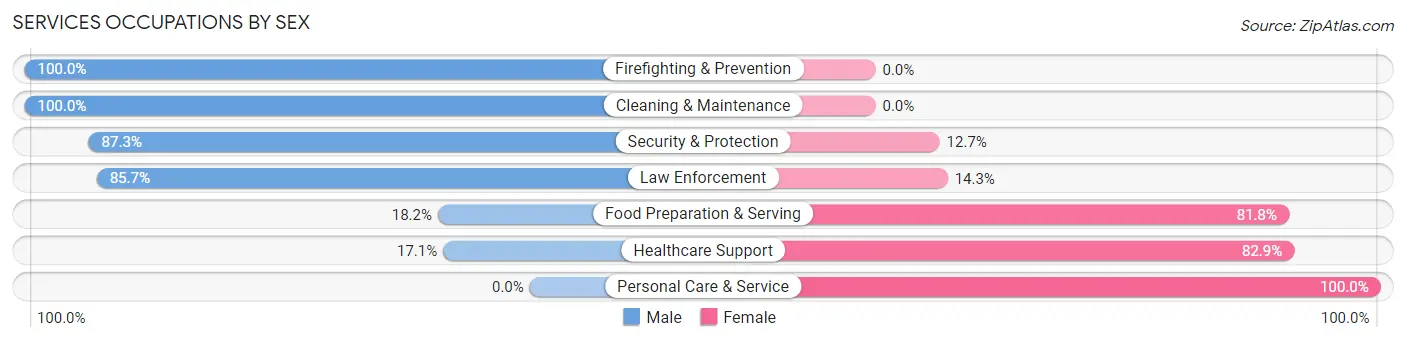
| Occupation | Male | Female |
| Healthcare Support | 6 (17.1%) | 29 (82.9%) |
| Security & Protection | 117 (87.3%) | 17 (12.7%) |
| Firefighting & Prevention | 15 (100.0%) | 0 (0.0%) |
| Law Enforcement | 102 (85.7%) | 17 (14.3%) |
| Food Preparation & Serving | 26 (18.2%) | 117 (81.8%) |
| Cleaning & Maintenance | 27 (100.0%) | 0 (0.0%) |
| Personal Care & Service | 0 (0.0%) | 64 (100.0%) |
| Total (Category) | 176 (43.7%) | 227 (56.3%) |
| Total (Overall) | 1,701 (54.5%) | 1,418 (45.5%) |
Sales and Office Occupations
The most common Sales and Office occupations in La Crescent are Office & Administration (341 | 10.9%), and Sales & Related (338 | 10.8%).

Sales and Office Occupations by Sex
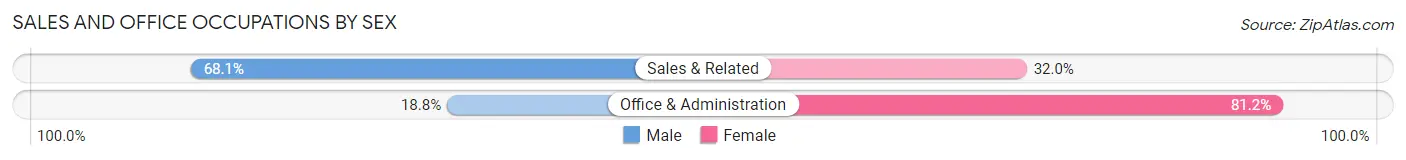
| Occupation | Male | Female |
| Sales & Related | 230 (68.0%) | 108 (32.0%) |
| Office & Administration | 64 (18.8%) | 277 (81.2%) |
| Total (Category) | 294 (43.3%) | 385 (56.7%) |
| Total (Overall) | 1,701 (54.5%) | 1,418 (45.5%) |
Natural Resources, Construction and Maintenance Occupations
The most common Natural Resources, Construction and Maintenance occupations in La Crescent are Construction & Extraction (201 | 6.4%), Installation, Maintenance & Repair (95 | 3.0%), and Farming, Fishing & Forestry (10 | 0.3%).

Natural Resources, Construction and Maintenance Occupations by Sex
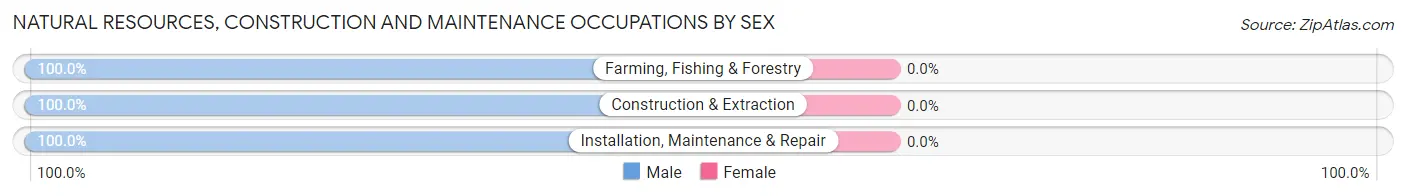
| Occupation | Male | Female |
| Farming, Fishing & Forestry | 10 (100.0%) | 0 (0.0%) |
| Construction & Extraction | 201 (100.0%) | 0 (0.0%) |
| Installation, Maintenance & Repair | 95 (100.0%) | 0 (0.0%) |
| Total (Category) | 306 (100.0%) | 0 (0.0%) |
| Total (Overall) | 1,701 (54.5%) | 1,418 (45.5%) |
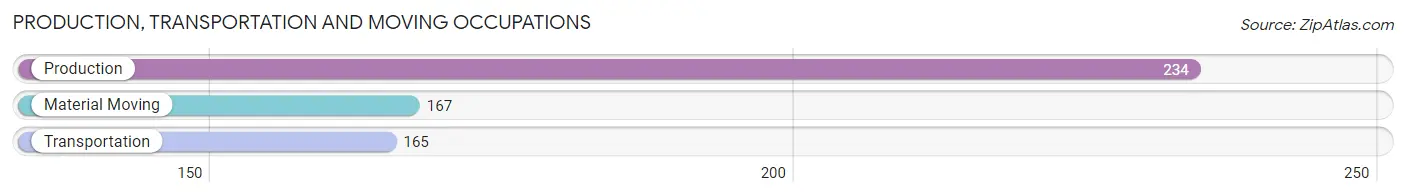
Production, Transportation and Moving Occupations
The most common Production, Transportation and Moving occupations in La Crescent are Production (234 | 7.5%), Material Moving (167 | 5.3%), and Transportation (165 | 5.3%).
Production, Transportation and Moving Occupations by Sex
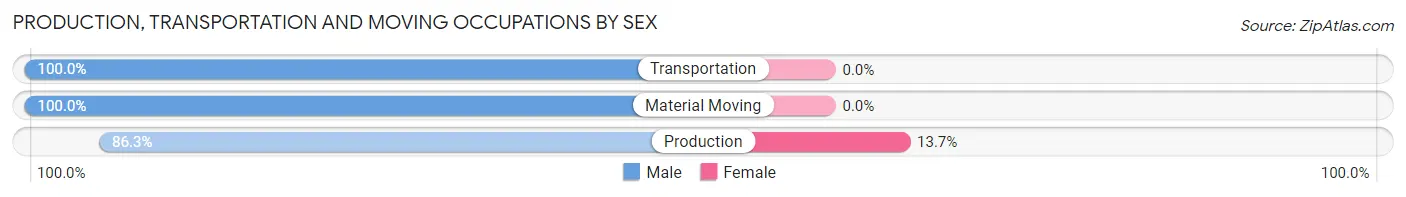
| Occupation | Male | Female |
| Production | 202 (86.3%) | 32 (13.7%) |
| Transportation | 165 (100.0%) | 0 (0.0%) |
| Material Moving | 167 (100.0%) | 0 (0.0%) |
| Total (Category) | 534 (94.4%) | 32 (5.7%) |
| Total (Overall) | 1,701 (54.5%) | 1,418 (45.5%) |
Employment Industries by Sex in La Crescent
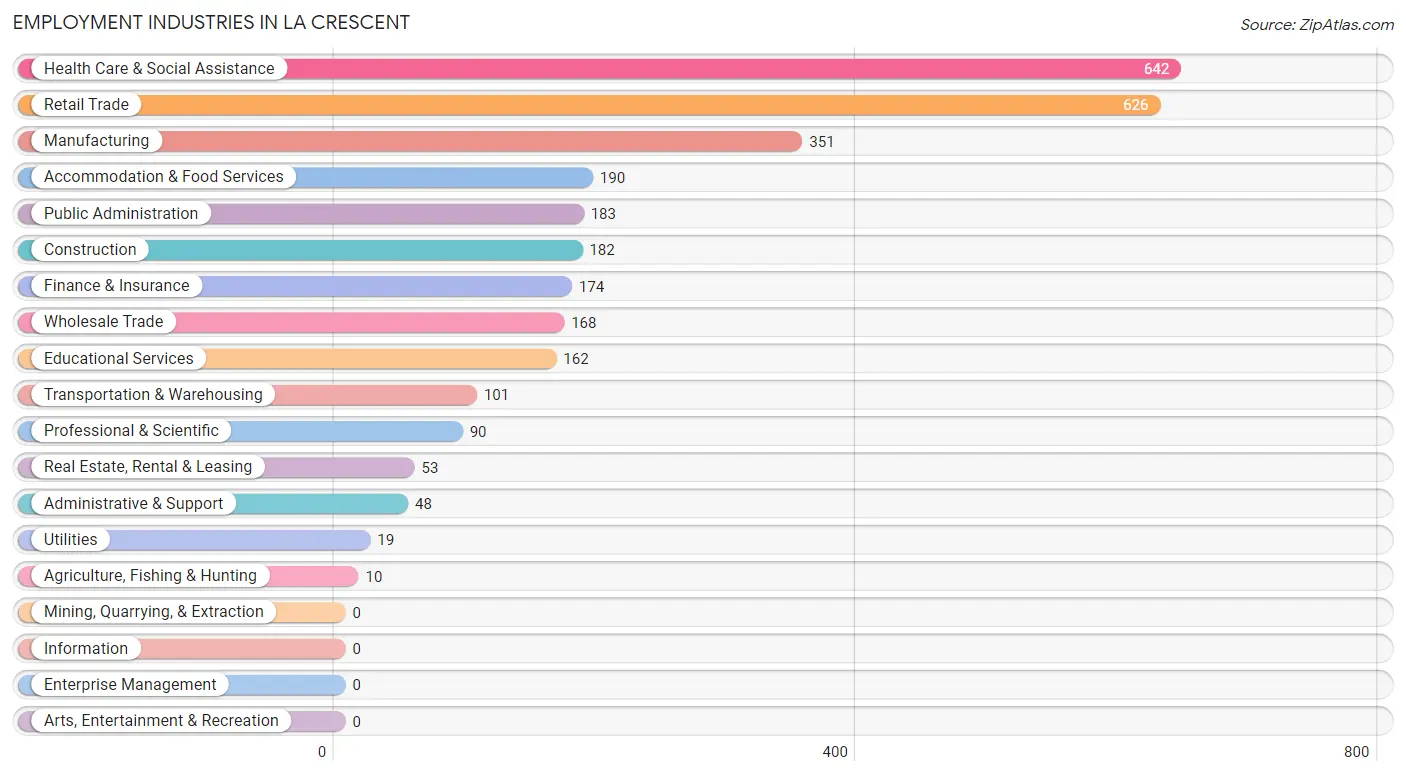
Employment Industries in La Crescent
The major employment industries in La Crescent include Health Care & Social Assistance (642 | 20.6%), Retail Trade (626 | 20.1%), Manufacturing (351 | 11.3%), Accommodation & Food Services (190 | 6.1%), and Public Administration (183 | 5.9%).
Employment Industries by Sex in La Crescent
The La Crescent industries that see more men than women are Agriculture, Fishing & Hunting (100.0%), Construction (100.0%), and Wholesale Trade (100.0%), whereas the industries that tend to have a higher number of women are Utilities (100.0%), Educational Services (90.7%), and Finance & Insurance (88.5%).
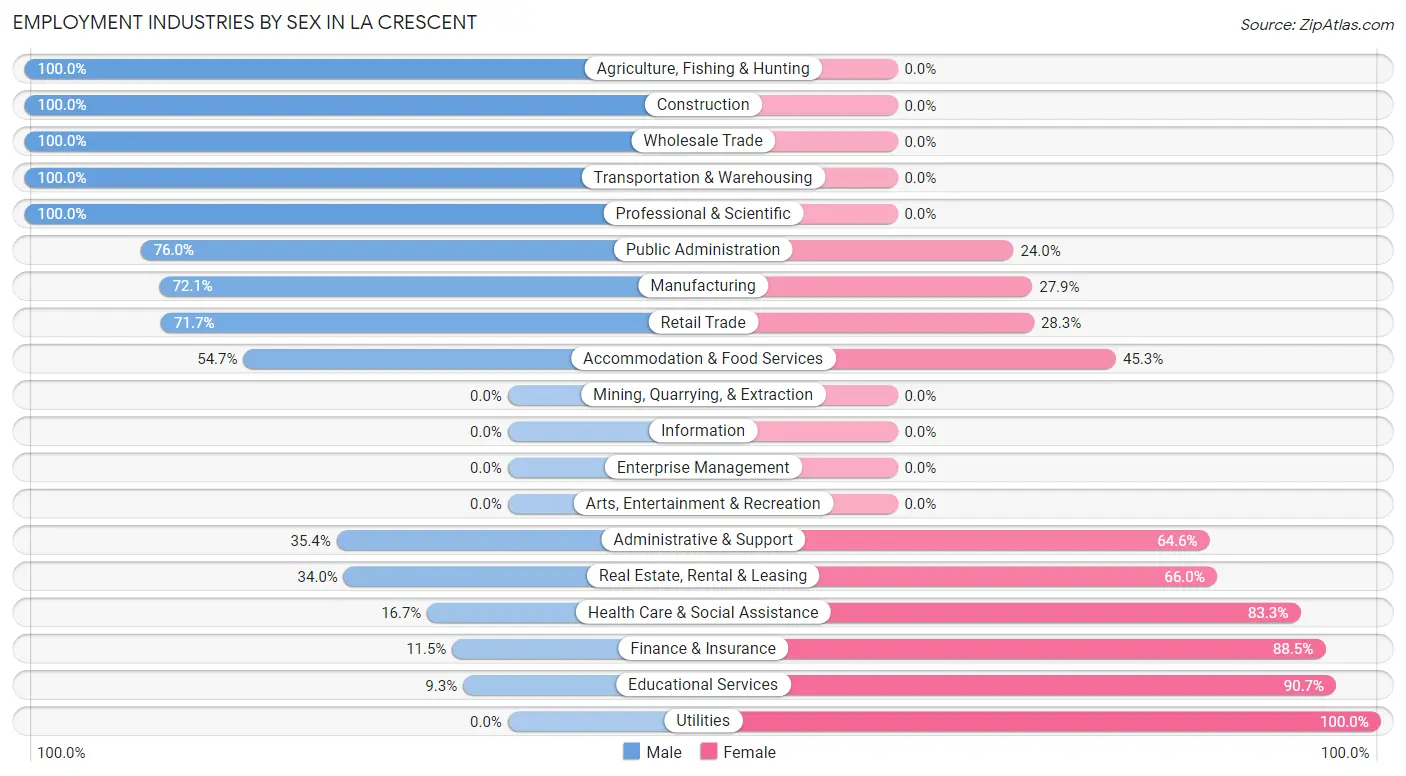
| Industry | Male | Female |
| Agriculture, Fishing & Hunting | 10 (100.0%) | 0 (0.0%) |
| Mining, Quarrying, & Extraction | 0 (0.0%) | 0 (0.0%) |
| Construction | 182 (100.0%) | 0 (0.0%) |
| Manufacturing | 253 (72.1%) | 98 (27.9%) |
| Wholesale Trade | 168 (100.0%) | 0 (0.0%) |
| Retail Trade | 449 (71.7%) | 177 (28.3%) |
| Transportation & Warehousing | 101 (100.0%) | 0 (0.0%) |
| Utilities | 0 (0.0%) | 19 (100.0%) |
| Information | 0 (0.0%) | 0 (0.0%) |
| Finance & Insurance | 20 (11.5%) | 154 (88.5%) |
| Real Estate, Rental & Leasing | 18 (34.0%) | 35 (66.0%) |
| Professional & Scientific | 90 (100.0%) | 0 (0.0%) |
| Enterprise Management | 0 (0.0%) | 0 (0.0%) |
| Administrative & Support | 17 (35.4%) | 31 (64.6%) |
| Educational Services | 15 (9.3%) | 147 (90.7%) |
| Health Care & Social Assistance | 107 (16.7%) | 535 (83.3%) |
| Arts, Entertainment & Recreation | 0 (0.0%) | 0 (0.0%) |
| Accommodation & Food Services | 104 (54.7%) | 86 (45.3%) |
| Public Administration | 139 (76.0%) | 44 (24.0%) |
| Total | 1,701 (54.5%) | 1,418 (45.5%) |
Education in La Crescent
School Enrollment in La Crescent
The most common levels of schooling among the 1,042 students in La Crescent are elementary school (384 | 36.8%), middle school (213 | 20.4%), and high school (188 | 18.0%).
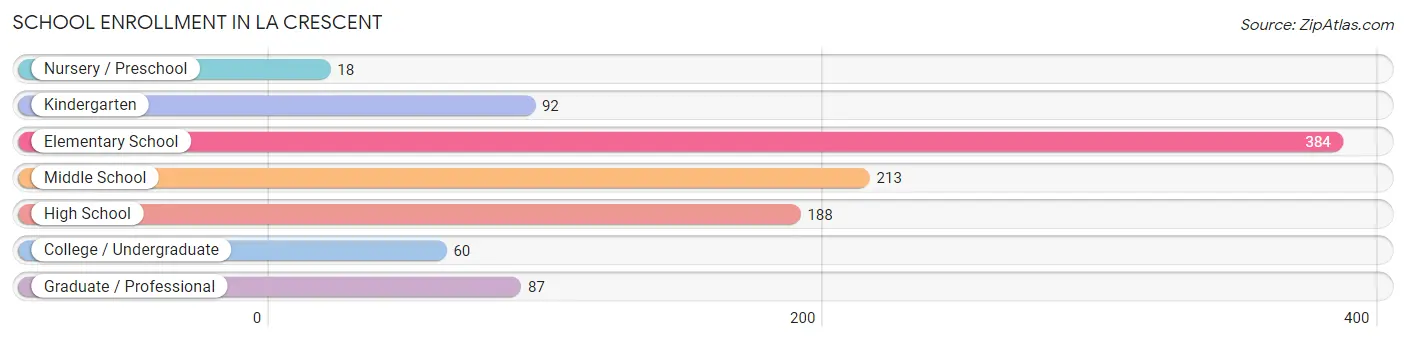
| School Level | # Students | % Students |
| Nursery / Preschool | 18 | 1.7% |
| Kindergarten | 92 | 8.8% |
| Elementary School | 384 | 36.8% |
| Middle School | 213 | 20.4% |
| High School | 188 | 18.0% |
| College / Undergraduate | 60 | 5.8% |
| Graduate / Professional | 87 | 8.4% |
| Total | 1,042 | 100.0% |
School Enrollment by Age by Funding Source in La Crescent
Out of a total of 1,042 students who are enrolled in schools in La Crescent, 172 (16.5%) attend a private institution, while the remaining 870 (83.5%) are enrolled in public schools. The age group of 25 to 34 year olds has the highest likelihood of being enrolled in private schools, with 16 (100.0% in the age bracket) enrolled. Conversely, the age group of 15 to 17 year olds has the lowest likelihood of being enrolled in a private school, with 110 (100.0% in the age bracket) attending a public institution.
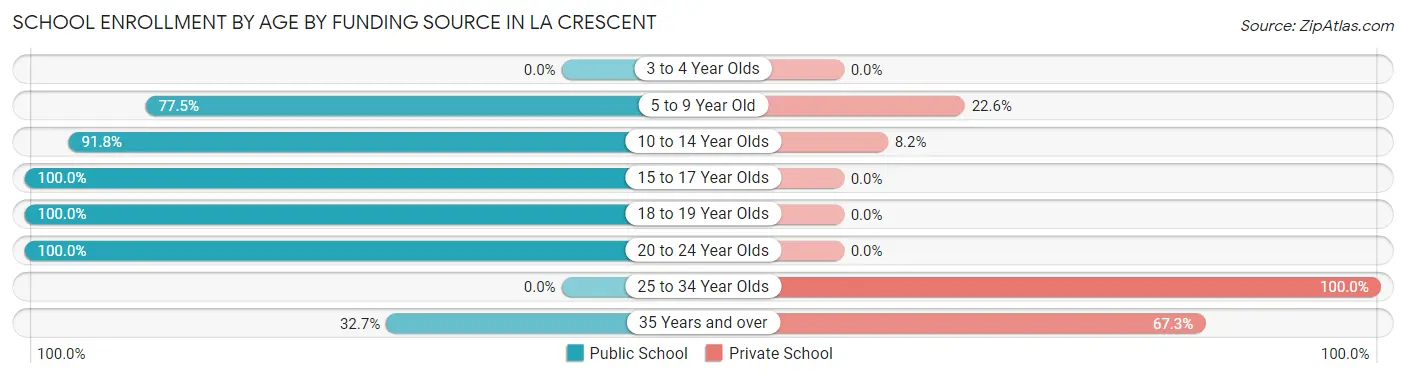
| Age Bracket | Public School | Private School |
| 3 to 4 Year Olds | 0 (0.0%) | 0 (0.0%) |
| 5 to 9 Year Old | 340 (77.4%) | 99 (22.6%) |
| 10 to 14 Year Olds | 246 (91.8%) | 22 (8.2%) |
| 15 to 17 Year Olds | 110 (100.0%) | 0 (0.0%) |
| 18 to 19 Year Olds | 78 (100.0%) | 0 (0.0%) |
| 20 to 24 Year Olds | 79 (100.0%) | 0 (0.0%) |
| 25 to 34 Year Olds | 0 (0.0%) | 16 (100.0%) |
| 35 Years and over | 17 (32.7%) | 35 (67.3%) |
| Total | 870 (83.5%) | 172 (16.5%) |
Educational Attainment by Field of Study in La Crescent
Education (302 | 20.1%), business (266 | 17.7%), science & technology (252 | 16.8%), bio, nature & agricultural (136 | 9.1%), and social sciences (113 | 7.5%) are the most common fields of study among 1,501 individuals in La Crescent who have obtained a bachelor's degree or higher.
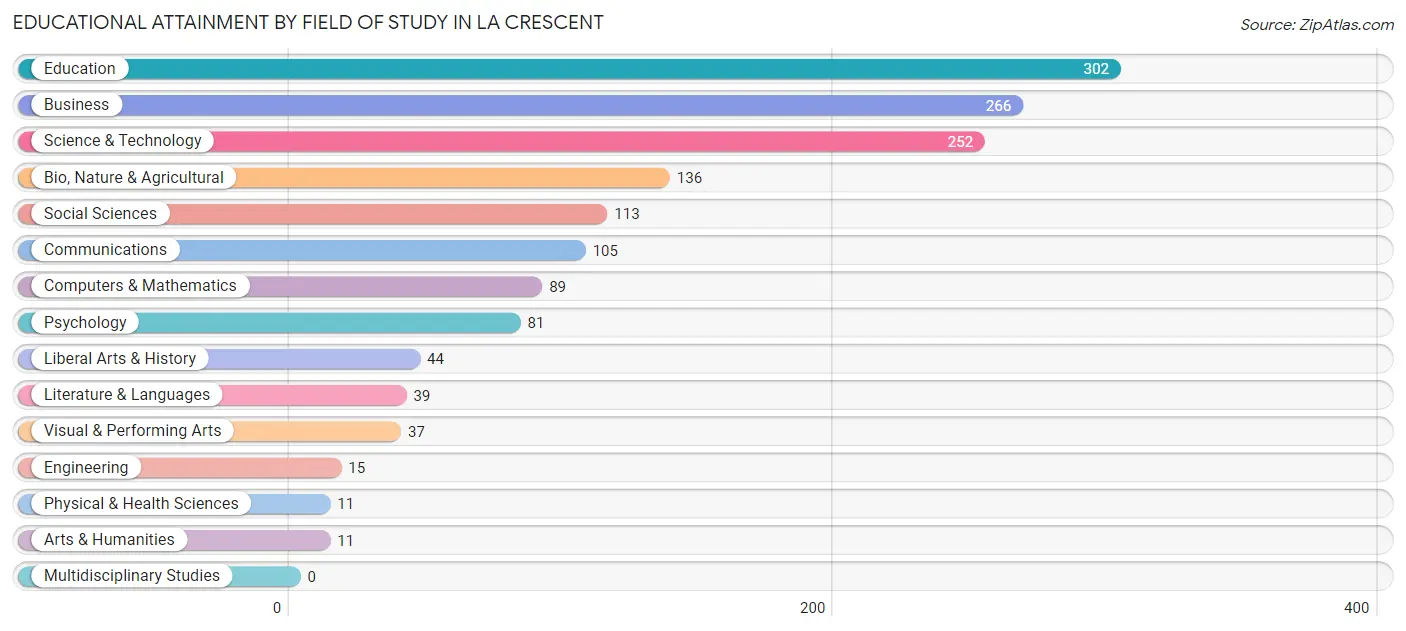
| Field of Study | # Graduates | % Graduates |
| Computers & Mathematics | 89 | 5.9% |
| Bio, Nature & Agricultural | 136 | 9.1% |
| Physical & Health Sciences | 11 | 0.7% |
| Psychology | 81 | 5.4% |
| Social Sciences | 113 | 7.5% |
| Engineering | 15 | 1.0% |
| Multidisciplinary Studies | 0 | 0.0% |
| Science & Technology | 252 | 16.8% |
| Business | 266 | 17.7% |
| Education | 302 | 20.1% |
| Literature & Languages | 39 | 2.6% |
| Liberal Arts & History | 44 | 2.9% |
| Visual & Performing Arts | 37 | 2.5% |
| Communications | 105 | 7.0% |
| Arts & Humanities | 11 | 0.7% |
| Total | 1,501 | 100.0% |
Transportation & Commute in La Crescent
Vehicle Availability by Sex in La Crescent
The most prevalent vehicle ownership categories in La Crescent are males with 2 vehicles (656, accounting for 39.5%) and females with 2 vehicles (628, making up 48.4%).
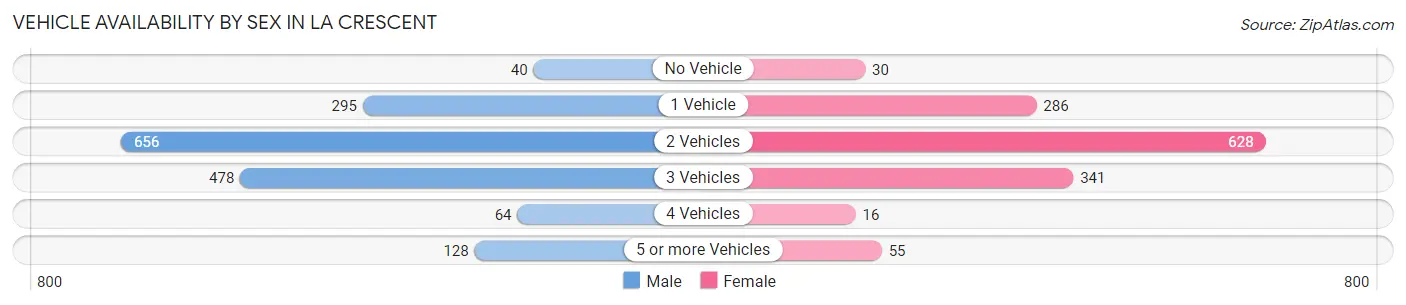
| Vehicles Available | Male | Female |
| No Vehicle | 40 (2.4%) | 30 (2.2%) |
| 1 Vehicle | 295 (17.8%) | 286 (21.1%) |
| 2 Vehicles | 656 (39.5%) | 628 (46.3%) |
| 3 Vehicles | 478 (28.8%) | 341 (25.2%) |
| 4 Vehicles | 64 (3.8%) | 16 (1.2%) |
| 5 or more Vehicles | 128 (7.7%) | 55 (4.1%) |
| Total | 1,661 (100.0%) | 1,356 (100.0%) |
Commute Time in La Crescent
The most frequently occuring commute durations in La Crescent are 15 to 19 minutes (717 commuters, 27.0%), 10 to 14 minutes (690 commuters, 26.0%), and 30 to 34 minutes (335 commuters, 12.6%).
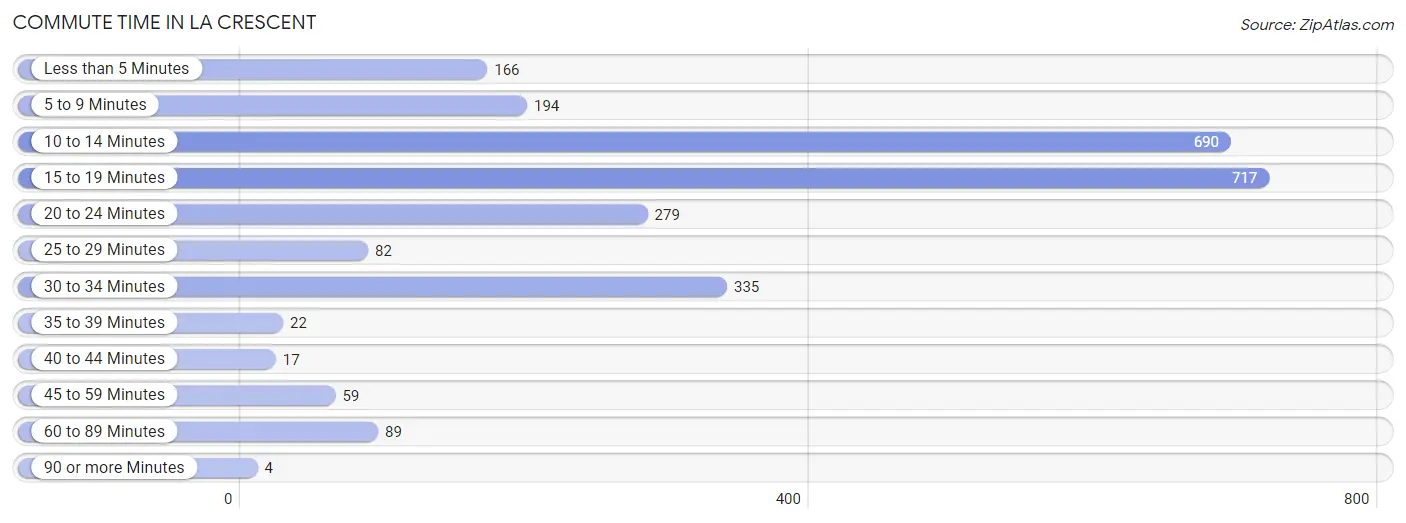
| Commute Time | # Commuters | % Commuters |
| Less than 5 Minutes | 166 | 6.2% |
| 5 to 9 Minutes | 194 | 7.3% |
| 10 to 14 Minutes | 690 | 26.0% |
| 15 to 19 Minutes | 717 | 27.0% |
| 20 to 24 Minutes | 279 | 10.5% |
| 25 to 29 Minutes | 82 | 3.1% |
| 30 to 34 Minutes | 335 | 12.6% |
| 35 to 39 Minutes | 22 | 0.8% |
| 40 to 44 Minutes | 17 | 0.6% |
| 45 to 59 Minutes | 59 | 2.2% |
| 60 to 89 Minutes | 89 | 3.4% |
| 90 or more Minutes | 4 | 0.2% |
Commute Time by Sex in La Crescent
The most common commute times in La Crescent are 15 to 19 minutes (501 commuters, 32.1%) for males and 10 to 14 minutes (386 commuters, 35.4%) for females.
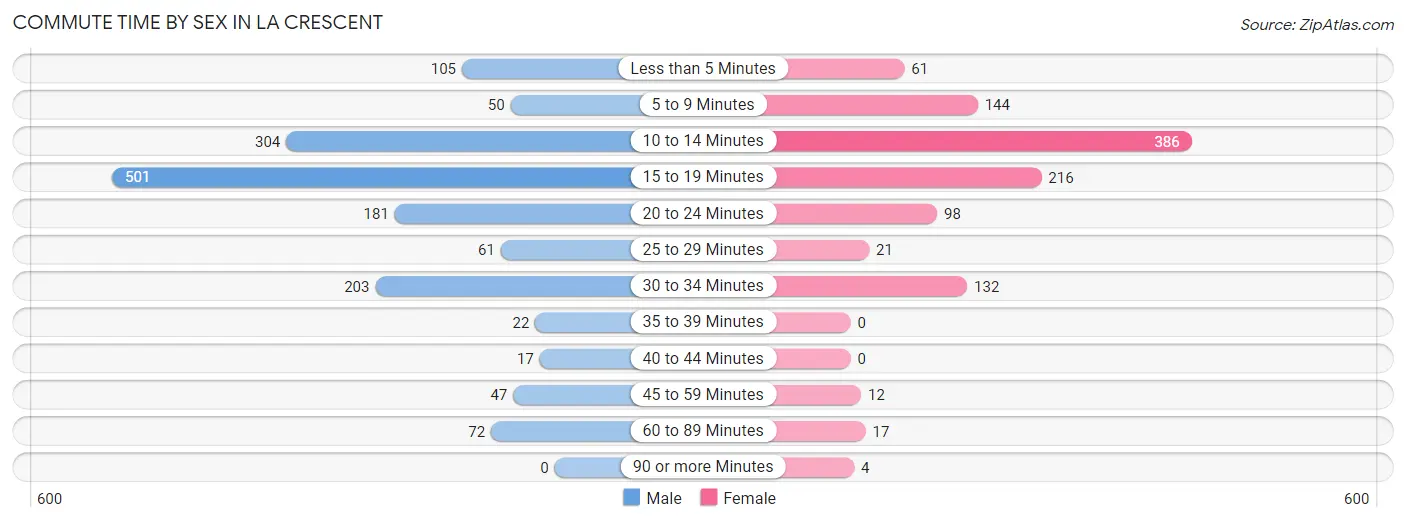
| Commute Time | Male | Female |
| Less than 5 Minutes | 105 (6.7%) | 61 (5.6%) |
| 5 to 9 Minutes | 50 (3.2%) | 144 (13.2%) |
| 10 to 14 Minutes | 304 (19.5%) | 386 (35.4%) |
| 15 to 19 Minutes | 501 (32.1%) | 216 (19.8%) |
| 20 to 24 Minutes | 181 (11.6%) | 98 (9.0%) |
| 25 to 29 Minutes | 61 (3.9%) | 21 (1.9%) |
| 30 to 34 Minutes | 203 (13.0%) | 132 (12.1%) |
| 35 to 39 Minutes | 22 (1.4%) | 0 (0.0%) |
| 40 to 44 Minutes | 17 (1.1%) | 0 (0.0%) |
| 45 to 59 Minutes | 47 (3.0%) | 12 (1.1%) |
| 60 to 89 Minutes | 72 (4.6%) | 17 (1.6%) |
| 90 or more Minutes | 0 (0.0%) | 4 (0.4%) |
Time of Departure to Work by Sex in La Crescent
The most frequent times of departure to work in La Crescent are 12:00 AM to 4:59 AM (237, 15.2%) for males and 7:30 AM to 7:59 AM (250, 22.9%) for females.
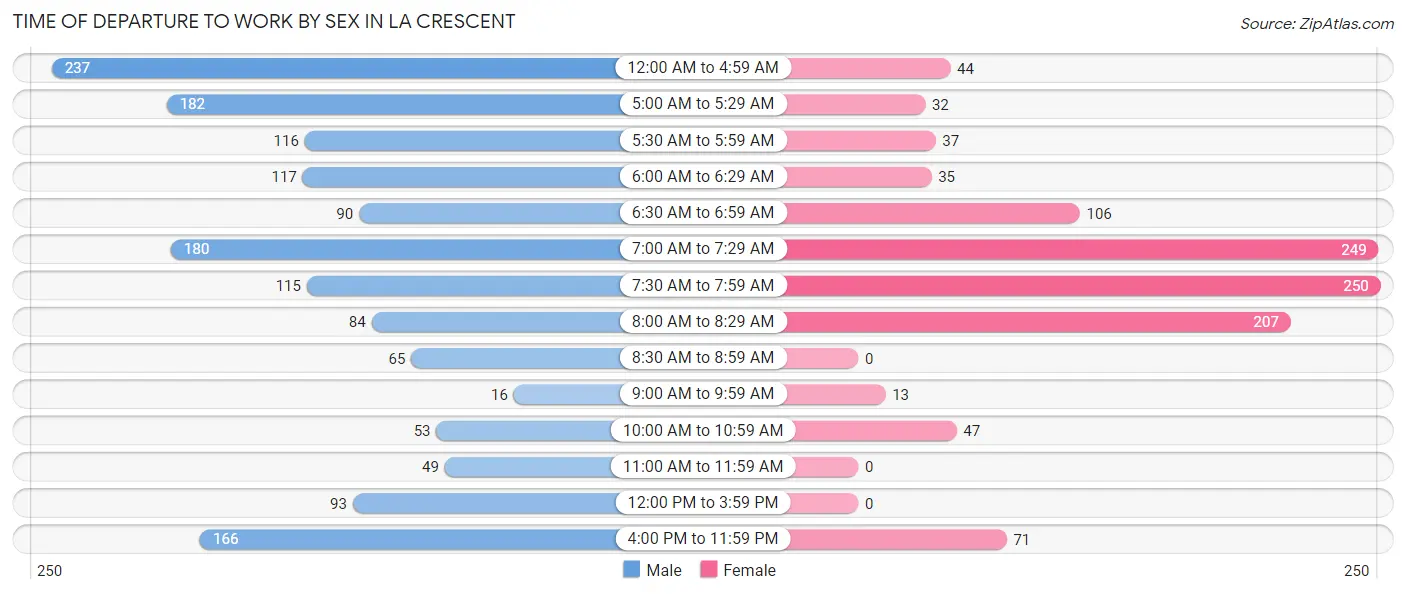
| Time of Departure | Male | Female |
| 12:00 AM to 4:59 AM | 237 (15.2%) | 44 (4.0%) |
| 5:00 AM to 5:29 AM | 182 (11.6%) | 32 (2.9%) |
| 5:30 AM to 5:59 AM | 116 (7.4%) | 37 (3.4%) |
| 6:00 AM to 6:29 AM | 117 (7.5%) | 35 (3.2%) |
| 6:30 AM to 6:59 AM | 90 (5.8%) | 106 (9.7%) |
| 7:00 AM to 7:29 AM | 180 (11.5%) | 249 (22.8%) |
| 7:30 AM to 7:59 AM | 115 (7.4%) | 250 (22.9%) |
| 8:00 AM to 8:29 AM | 84 (5.4%) | 207 (19.0%) |
| 8:30 AM to 8:59 AM | 65 (4.2%) | 0 (0.0%) |
| 9:00 AM to 9:59 AM | 16 (1.0%) | 13 (1.2%) |
| 10:00 AM to 10:59 AM | 53 (3.4%) | 47 (4.3%) |
| 11:00 AM to 11:59 AM | 49 (3.1%) | 0 (0.0%) |
| 12:00 PM to 3:59 PM | 93 (5.9%) | 0 (0.0%) |
| 4:00 PM to 11:59 PM | 166 (10.6%) | 71 (6.5%) |
| Total | 1,563 (100.0%) | 1,091 (100.0%) |
Housing Occupancy in La Crescent
Occupancy by Ownership in La Crescent
Of the total 2,345 dwellings in La Crescent, owner-occupied units account for 2,008 (85.6%), while renter-occupied units make up 337 (14.4%).
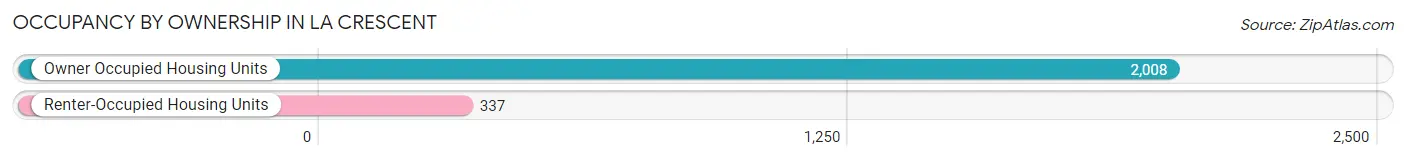
| Occupancy | # Housing Units | % Housing Units |
| Owner Occupied Housing Units | 2,008 | 85.6% |
| Renter-Occupied Housing Units | 337 | 14.4% |
| Total Occupied Housing Units | 2,345 | 100.0% |
Occupancy by Household Size in La Crescent
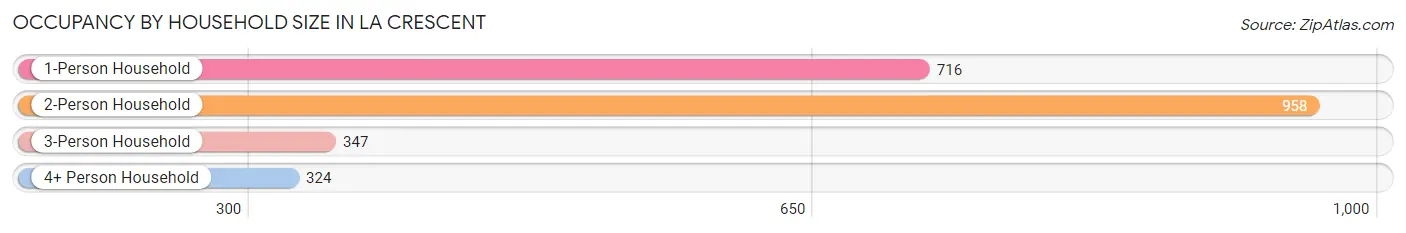
| Household Size | # Housing Units | % Housing Units |
| 1-Person Household | 716 | 30.5% |
| 2-Person Household | 958 | 40.8% |
| 3-Person Household | 347 | 14.8% |
| 4+ Person Household | 324 | 13.8% |
| Total Housing Units | 2,345 | 100.0% |
Occupancy by Ownership by Household Size in La Crescent
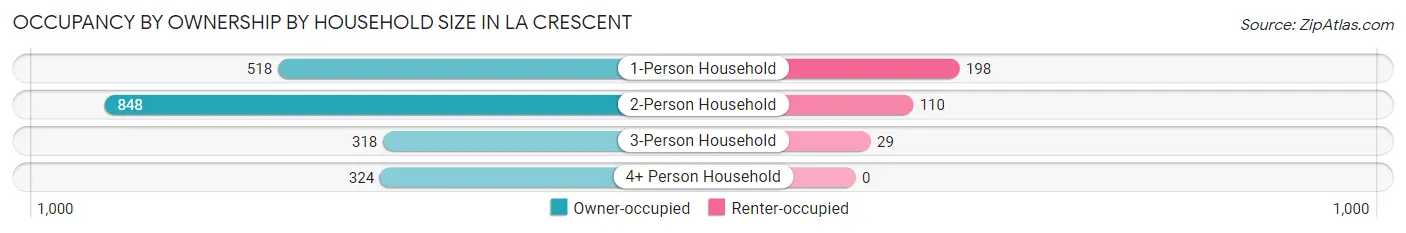
| Household Size | Owner-occupied | Renter-occupied |
| 1-Person Household | 518 (72.4%) | 198 (27.7%) |
| 2-Person Household | 848 (88.5%) | 110 (11.5%) |
| 3-Person Household | 318 (91.6%) | 29 (8.4%) |
| 4+ Person Household | 324 (100.0%) | 0 (0.0%) |
| Total Housing Units | 2,008 (85.6%) | 337 (14.4%) |
Occupancy by Educational Attainment in La Crescent

| Household Size | Owner-occupied | Renter-occupied |
| Less than High School | 12 (100.0%) | 0 (0.0%) |
| High School Diploma | 522 (95.6%) | 24 (4.4%) |
| College/Associate Degree | 701 (78.3%) | 194 (21.7%) |
| Bachelor's Degree or higher | 773 (86.7%) | 119 (13.3%) |
Occupancy by Age of Householder in La Crescent
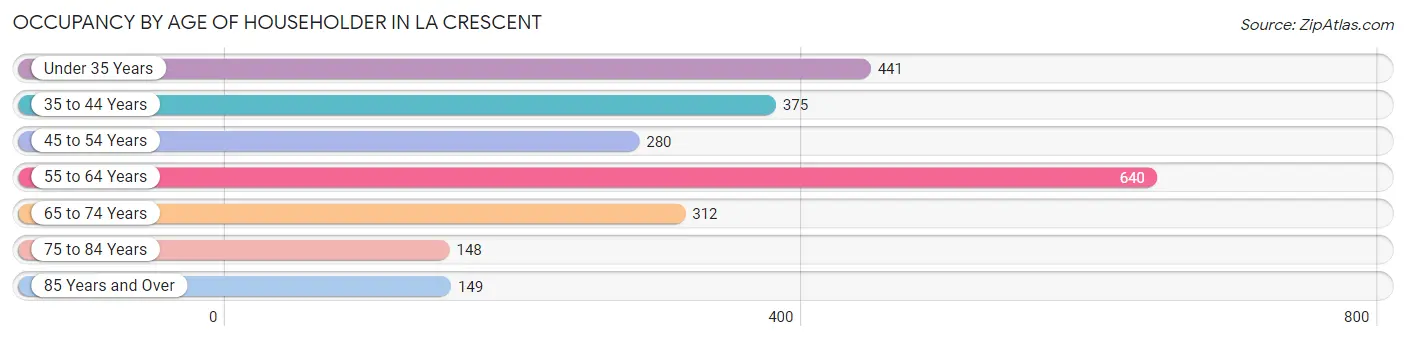
| Age Bracket | # Households | % Households |
| Under 35 Years | 441 | 18.8% |
| 35 to 44 Years | 375 | 16.0% |
| 45 to 54 Years | 280 | 11.9% |
| 55 to 64 Years | 640 | 27.3% |
| 65 to 74 Years | 312 | 13.3% |
| 75 to 84 Years | 148 | 6.3% |
| 85 Years and Over | 149 | 6.4% |
| Total | 2,345 | 100.0% |
Housing Finances in La Crescent
Median Income by Occupancy in La Crescent
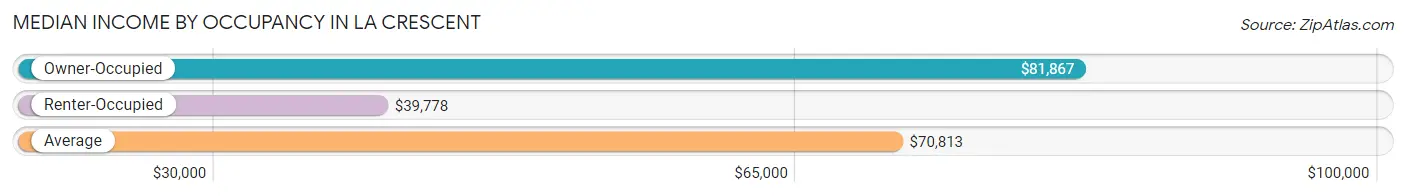
| Occupancy Type | # Households | Median Income |
| Owner-Occupied | 2,008 (85.6%) | $81,867 |
| Renter-Occupied | 337 (14.4%) | $39,778 |
| Average | 2,345 (100.0%) | $70,813 |
Occupancy by Householder Income Bracket in La Crescent
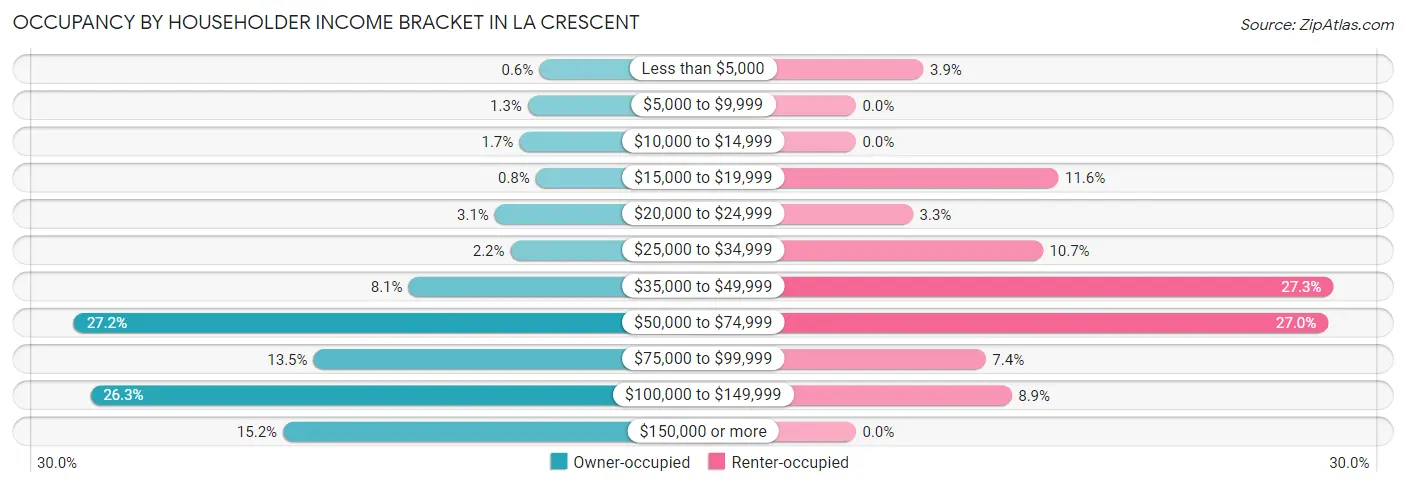
| Income Bracket | Owner-occupied | Renter-occupied |
| Less than $5,000 | 12 (0.6%) | 13 (3.9%) |
| $5,000 to $9,999 | 25 (1.3%) | 0 (0.0%) |
| $10,000 to $14,999 | 35 (1.7%) | 0 (0.0%) |
| $15,000 to $19,999 | 16 (0.8%) | 39 (11.6%) |
| $20,000 to $24,999 | 63 (3.1%) | 11 (3.3%) |
| $25,000 to $34,999 | 45 (2.2%) | 36 (10.7%) |
| $35,000 to $49,999 | 162 (8.1%) | 92 (27.3%) |
| $50,000 to $74,999 | 546 (27.2%) | 91 (27.0%) |
| $75,000 to $99,999 | 271 (13.5%) | 25 (7.4%) |
| $100,000 to $149,999 | 527 (26.3%) | 30 (8.9%) |
| $150,000 or more | 306 (15.2%) | 0 (0.0%) |
| Total | 2,008 (100.0%) | 337 (100.0%) |
Monthly Housing Cost Tiers in La Crescent
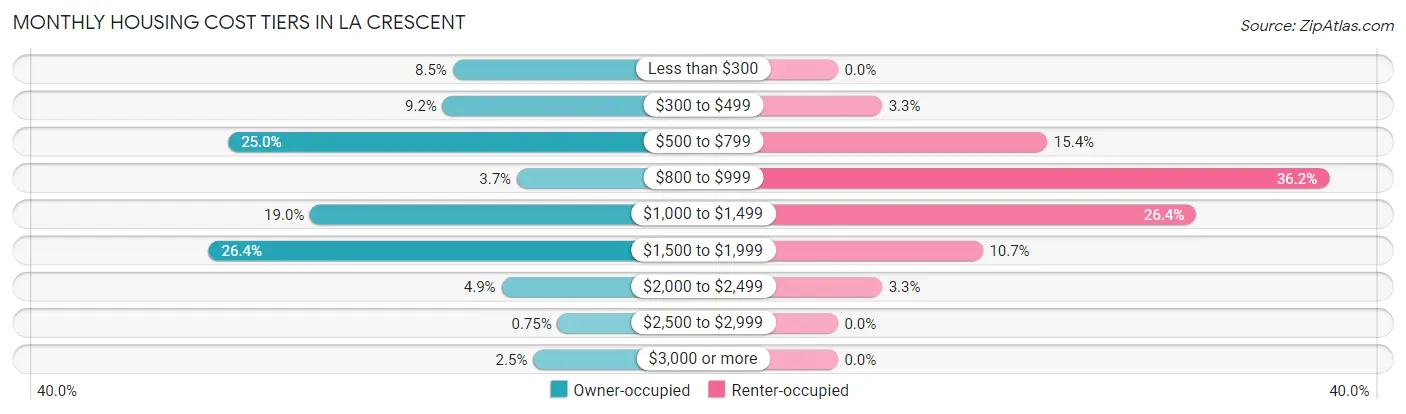
| Monthly Cost | Owner-occupied | Renter-occupied |
| Less than $300 | 170 (8.5%) | 0 (0.0%) |
| $300 to $499 | 185 (9.2%) | 11 (3.3%) |
| $500 to $799 | 502 (25.0%) | 52 (15.4%) |
| $800 to $999 | 75 (3.7%) | 122 (36.2%) |
| $1,000 to $1,499 | 381 (19.0%) | 89 (26.4%) |
| $1,500 to $1,999 | 531 (26.4%) | 36 (10.7%) |
| $2,000 to $2,499 | 98 (4.9%) | 11 (3.3%) |
| $2,500 to $2,999 | 15 (0.7%) | 0 (0.0%) |
| $3,000 or more | 51 (2.5%) | 0 (0.0%) |
| Total | 2,008 (100.0%) | 337 (100.0%) |
Physical Housing Characteristics in La Crescent
Housing Structures in La Crescent
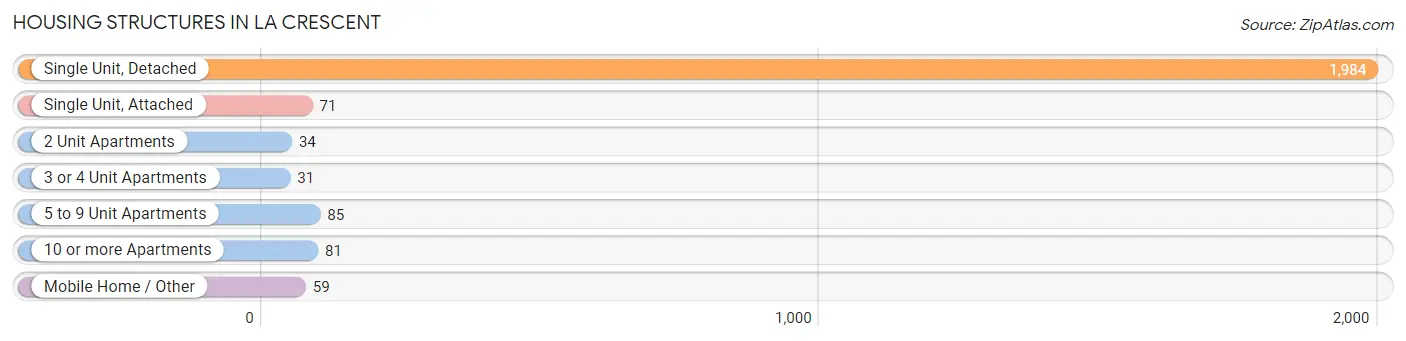
| Structure Type | # Housing Units | % Housing Units |
| Single Unit, Detached | 1,984 | 84.6% |
| Single Unit, Attached | 71 | 3.0% |
| 2 Unit Apartments | 34 | 1.5% |
| 3 or 4 Unit Apartments | 31 | 1.3% |
| 5 to 9 Unit Apartments | 85 | 3.6% |
| 10 or more Apartments | 81 | 3.5% |
| Mobile Home / Other | 59 | 2.5% |
| Total | 2,345 | 100.0% |
Housing Structures by Occupancy in La Crescent
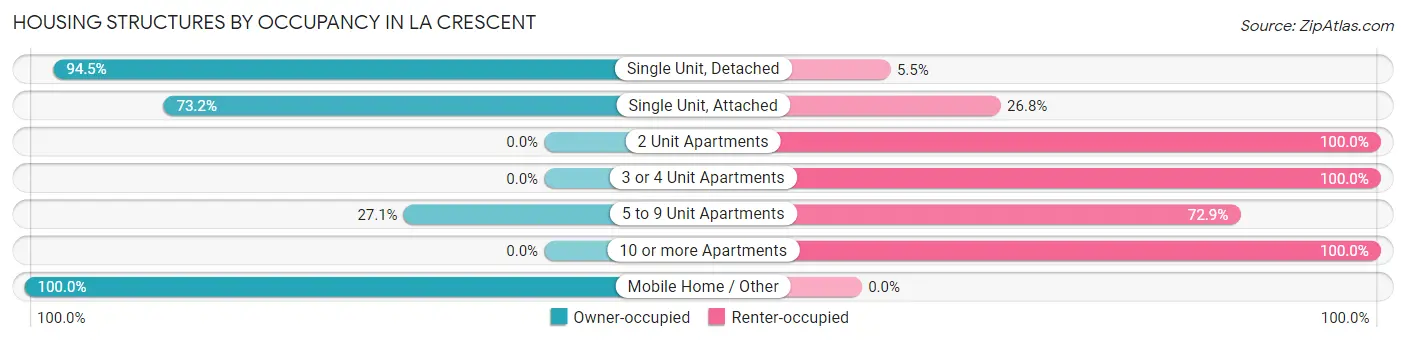
| Structure Type | Owner-occupied | Renter-occupied |
| Single Unit, Detached | 1,874 (94.5%) | 110 (5.5%) |
| Single Unit, Attached | 52 (73.2%) | 19 (26.8%) |
| 2 Unit Apartments | 0 (0.0%) | 34 (100.0%) |
| 3 or 4 Unit Apartments | 0 (0.0%) | 31 (100.0%) |
| 5 to 9 Unit Apartments | 23 (27.1%) | 62 (72.9%) |
| 10 or more Apartments | 0 (0.0%) | 81 (100.0%) |
| Mobile Home / Other | 59 (100.0%) | 0 (0.0%) |
| Total | 2,008 (85.6%) | 337 (14.4%) |
Housing Structures by Number of Rooms in La Crescent
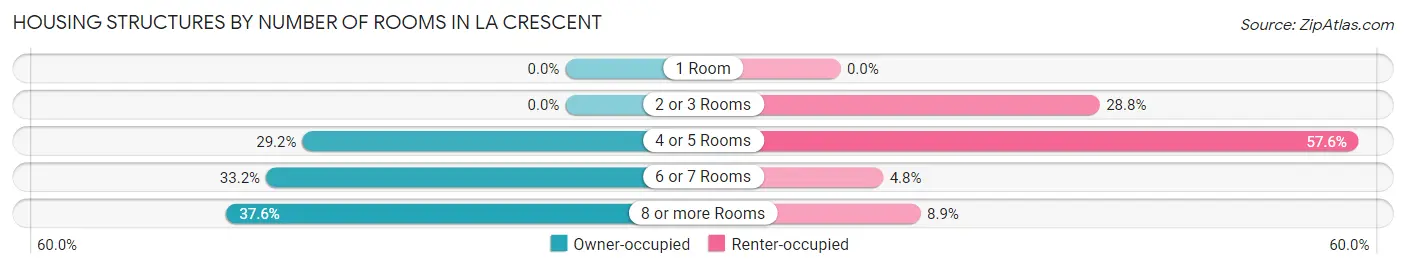
| Number of Rooms | Owner-occupied | Renter-occupied |
| 1 Room | 0 (0.0%) | 0 (0.0%) |
| 2 or 3 Rooms | 0 (0.0%) | 97 (28.8%) |
| 4 or 5 Rooms | 586 (29.2%) | 194 (57.6%) |
| 6 or 7 Rooms | 667 (33.2%) | 16 (4.8%) |
| 8 or more Rooms | 755 (37.6%) | 30 (8.9%) |
| Total | 2,008 (100.0%) | 337 (100.0%) |
Housing Structure by Heating Type in La Crescent
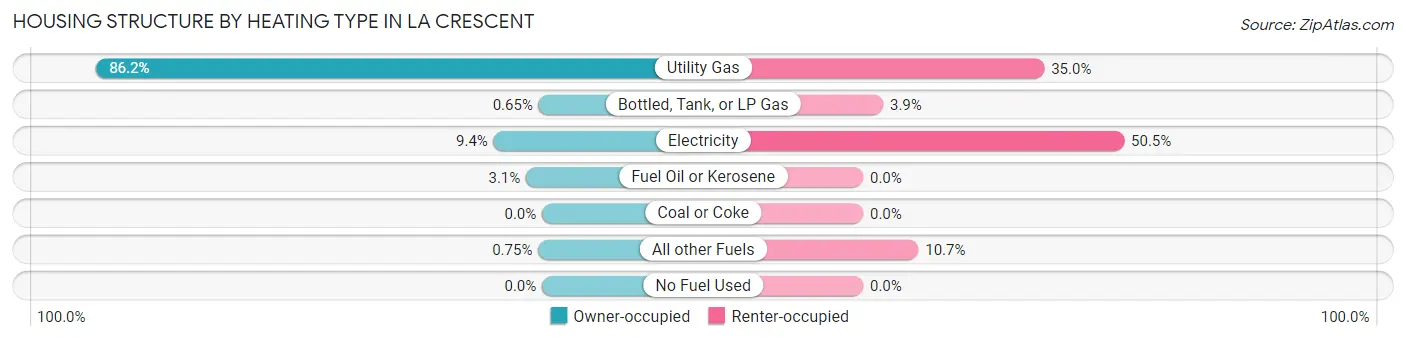
| Heating Type | Owner-occupied | Renter-occupied |
| Utility Gas | 1,730 (86.2%) | 118 (35.0%) |
| Bottled, Tank, or LP Gas | 13 (0.6%) | 13 (3.9%) |
| Electricity | 188 (9.4%) | 170 (50.4%) |
| Fuel Oil or Kerosene | 62 (3.1%) | 0 (0.0%) |
| Coal or Coke | 0 (0.0%) | 0 (0.0%) |
| All other Fuels | 15 (0.7%) | 36 (10.7%) |
| No Fuel Used | 0 (0.0%) | 0 (0.0%) |
| Total | 2,008 (100.0%) | 337 (100.0%) |
Household Vehicle Usage in La Crescent
| Vehicles per Household | Owner-occupied | Renter-occupied |
| No Vehicle | 54 (2.7%) | 11 (3.3%) |
| 1 Vehicle | 518 (25.8%) | 260 (77.1%) |
| 2 Vehicles | 869 (43.3%) | 66 (19.6%) |
| 3 or more Vehicles | 567 (28.2%) | 0 (0.0%) |
| Total | 2,008 (100.0%) | 337 (100.0%) |
Real Estate & Mortgages in La Crescent
Real Estate and Mortgage Overview in La Crescent
| Characteristic | Without Mortgage | With Mortgage |
| Housing Units | 931 | 1,077 |
| Median Property Value | $207,000 | $274,100 |
| Median Household Income | $64,617 | $287 |
| Monthly Housing Costs | $552 | $51 |
| Real Estate Taxes | $2,868 | $0 |
Property Value by Mortgage Status in La Crescent
| Property Value | Without Mortgage | With Mortgage |
| Less than $50,000 | 62 (6.7%) | 0 (0.0%) |
| $50,000 to $99,999 | 93 (10.0%) | 0 (0.0%) |
| $100,000 to $299,999 | 695 (74.7%) | 655 (60.8%) |
| $300,000 to $499,999 | 81 (8.7%) | 321 (29.8%) |
| $500,000 to $749,999 | 0 (0.0%) | 101 (9.4%) |
| $750,000 to $999,999 | 0 (0.0%) | 0 (0.0%) |
| $1,000,000 or more | 0 (0.0%) | 0 (0.0%) |
| Total | 931 (100.0%) | 1,077 (100.0%) |
Household Income by Mortgage Status in La Crescent
| Household Income | Without Mortgage | With Mortgage |
| Less than $10,000 | 37 (4.0%) | 17 (1.6%) |
| $10,000 to $24,999 | 82 (8.8%) | 0 (0.0%) |
| $25,000 to $34,999 | 36 (3.9%) | 32 (3.0%) |
| $35,000 to $49,999 | 137 (14.7%) | 9 (0.8%) |
| $50,000 to $74,999 | 238 (25.6%) | 25 (2.3%) |
| $75,000 to $99,999 | 176 (18.9%) | 308 (28.6%) |
| $100,000 to $149,999 | 206 (22.1%) | 95 (8.8%) |
| $150,000 or more | 19 (2.0%) | 321 (29.8%) |
| Total | 931 (100.0%) | 1,077 (100.0%) |
Property Value to Household Income Ratio in La Crescent
| Value-to-Income Ratio | Without Mortgage | With Mortgage |
| Less than 2.0x | 287 (30.8%) | 108,554 (10,079.3%) |
| 2.0x to 2.9x | 207 (22.2%) | 327 (30.4%) |
| 3.0x to 3.9x | 149 (16.0%) | 361 (33.5%) |
| 4.0x or more | 288 (30.9%) | 160 (14.9%) |
| Total | 931 (100.0%) | 1,077 (100.0%) |
Real Estate Taxes by Mortgage Status in La Crescent
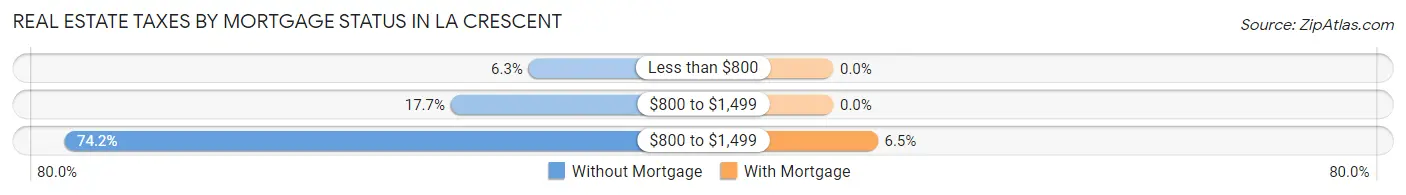
| Property Taxes | Without Mortgage | With Mortgage |
| Less than $800 | 59 (6.3%) | 0 (0.0%) |
| $800 to $1,499 | 165 (17.7%) | 0 (0.0%) |
| $800 to $1,499 | 691 (74.2%) | 70 (6.5%) |
| Total | 931 (100.0%) | 1,077 (100.0%) |
Health & Disability in La Crescent
Health Insurance Coverage by Age in La Crescent
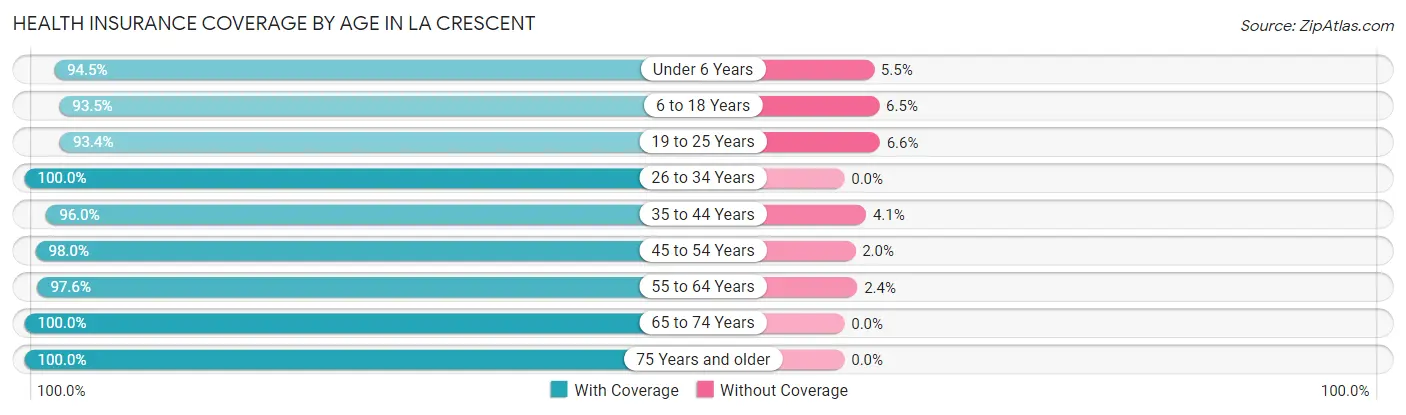
| Age Bracket | With Coverage | Without Coverage |
| Under 6 Years | 291 (94.5%) | 17 (5.5%) |
| 6 to 18 Years | 777 (93.5%) | 54 (6.5%) |
| 19 to 25 Years | 353 (93.4%) | 25 (6.6%) |
| 26 to 34 Years | 533 (100.0%) | 0 (0.0%) |
| 35 to 44 Years | 710 (96.0%) | 30 (4.1%) |
| 45 to 54 Years | 527 (98.0%) | 11 (2.0%) |
| 55 to 64 Years | 932 (97.6%) | 23 (2.4%) |
| 65 to 74 Years | 508 (100.0%) | 0 (0.0%) |
| 75 Years and older | 528 (100.0%) | 0 (0.0%) |
| Total | 5,159 (97.0%) | 160 (3.0%) |
Health Insurance Coverage by Citizenship Status in La Crescent
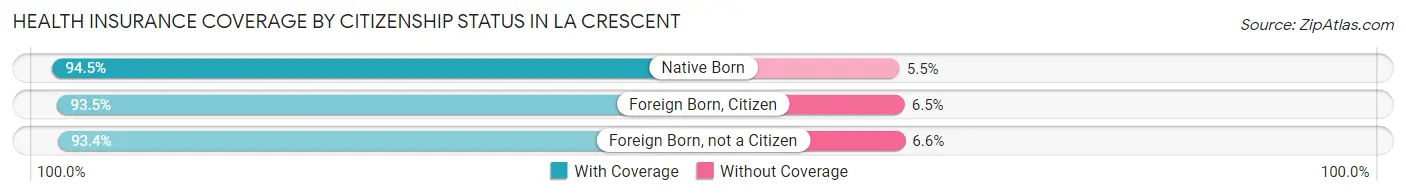
| Citizenship Status | With Coverage | Without Coverage |
| Native Born | 291 (94.5%) | 17 (5.5%) |
| Foreign Born, Citizen | 777 (93.5%) | 54 (6.5%) |
| Foreign Born, not a Citizen | 353 (93.4%) | 25 (6.6%) |
Health Insurance Coverage by Household Income in La Crescent
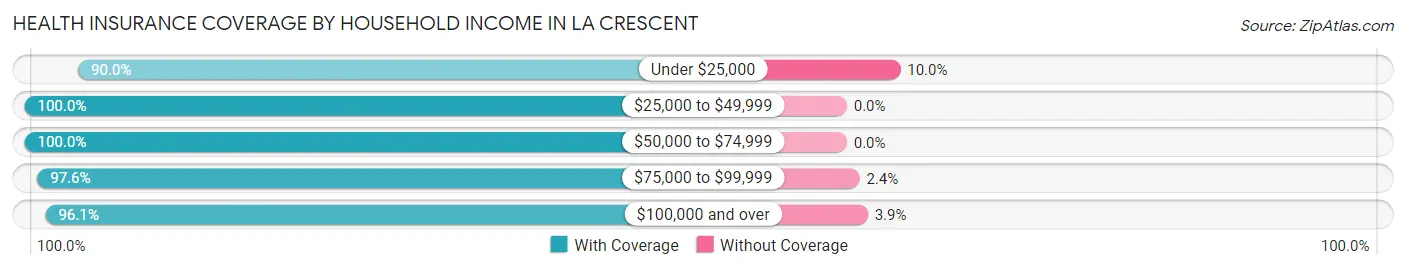
| Household Income | With Coverage | Without Coverage |
| Under $25,000 | 269 (90.0%) | 30 (10.0%) |
| $25,000 to $49,999 | 535 (100.0%) | 0 (0.0%) |
| $50,000 to $74,999 | 1,141 (100.0%) | 0 (0.0%) |
| $75,000 to $99,999 | 694 (97.6%) | 17 (2.4%) |
| $100,000 and over | 2,499 (96.1%) | 102 (3.9%) |
Public vs Private Health Insurance Coverage by Age in La Crescent
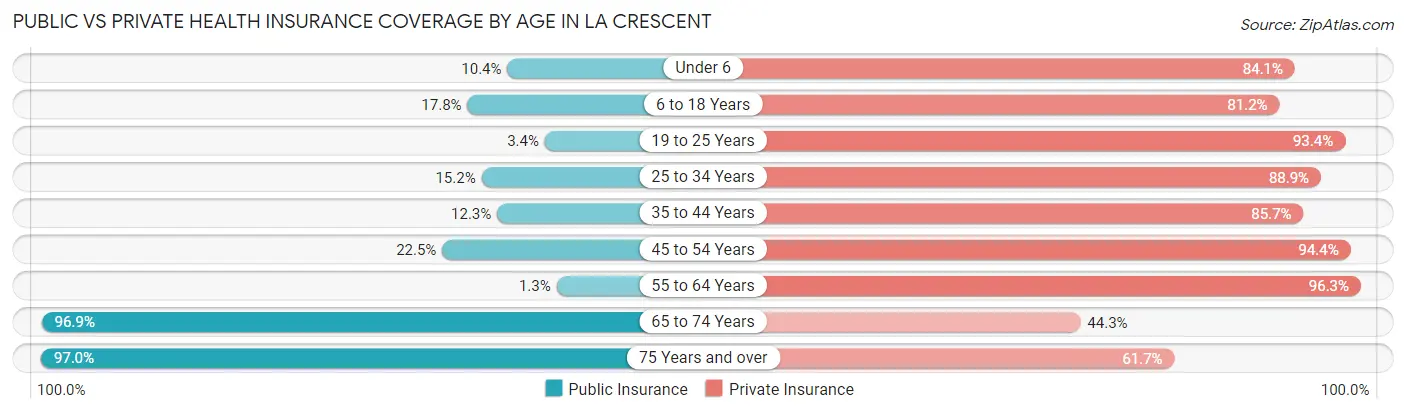
| Age Bracket | Public Insurance | Private Insurance |
| Under 6 | 32 (10.4%) | 259 (84.1%) |
| 6 to 18 Years | 148 (17.8%) | 675 (81.2%) |
| 19 to 25 Years | 13 (3.4%) | 353 (93.4%) |
| 25 to 34 Years | 81 (15.2%) | 474 (88.9%) |
| 35 to 44 Years | 91 (12.3%) | 634 (85.7%) |
| 45 to 54 Years | 121 (22.5%) | 508 (94.4%) |
| 55 to 64 Years | 12 (1.3%) | 920 (96.3%) |
| 65 to 74 Years | 492 (96.9%) | 225 (44.3%) |
| 75 Years and over | 512 (97.0%) | 326 (61.7%) |
| Total | 1,502 (28.2%) | 4,374 (82.2%) |
Disability Status by Sex by Age in La Crescent
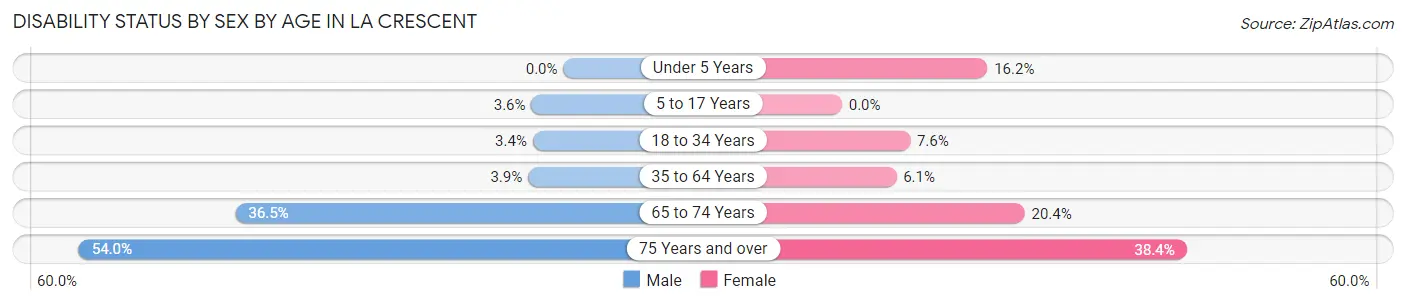
| Age Bracket | Male | Female |
| Under 5 Years | 0 (0.0%) | 23 (16.2%) |
| 5 to 17 Years | 18 (3.6%) | 0 (0.0%) |
| 18 to 34 Years | 18 (3.4%) | 35 (7.6%) |
| 35 to 64 Years | 43 (3.9%) | 69 (6.1%) |
| 65 to 74 Years | 103 (36.5%) | 46 (20.3%) |
| 75 Years and over | 150 (54.0%) | 96 (38.4%) |
Disability Class by Sex by Age in La Crescent
Disability Class: Hearing Difficulty
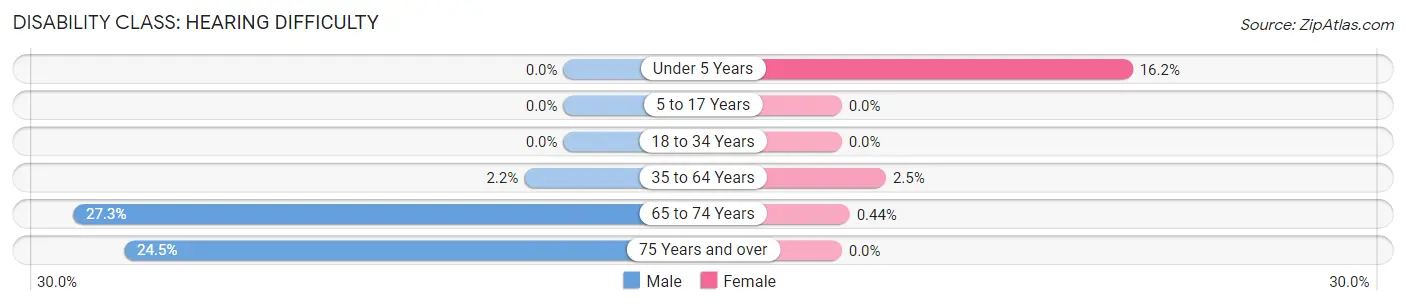
| Age Bracket | Male | Female |
| Under 5 Years | 0 (0.0%) | 23 (16.2%) |
| 5 to 17 Years | 0 (0.0%) | 0 (0.0%) |
| 18 to 34 Years | 0 (0.0%) | 0 (0.0%) |
| 35 to 64 Years | 24 (2.2%) | 28 (2.5%) |
| 65 to 74 Years | 77 (27.3%) | 1 (0.4%) |
| 75 Years and over | 68 (24.5%) | 0 (0.0%) |
Disability Class: Vision Difficulty
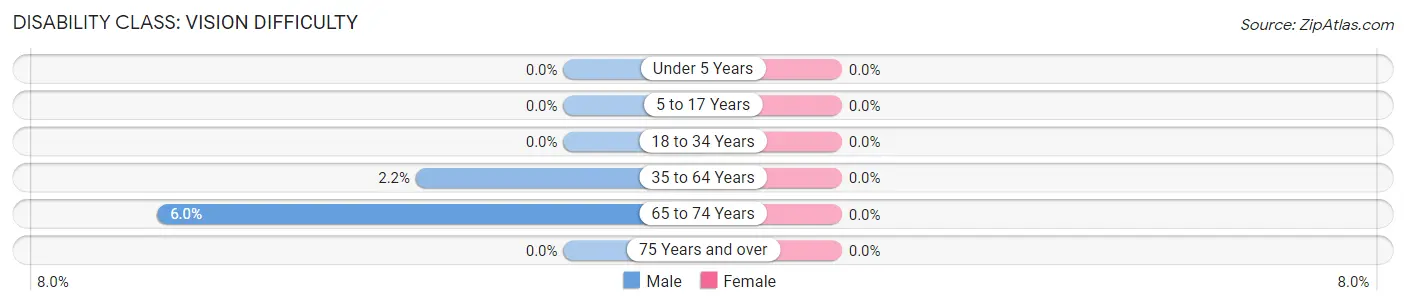
| Age Bracket | Male | Female |
| Under 5 Years | 0 (0.0%) | 0 (0.0%) |
| 5 to 17 Years | 0 (0.0%) | 0 (0.0%) |
| 18 to 34 Years | 0 (0.0%) | 0 (0.0%) |
| 35 to 64 Years | 24 (2.2%) | 0 (0.0%) |
| 65 to 74 Years | 17 (6.0%) | 0 (0.0%) |
| 75 Years and over | 0 (0.0%) | 0 (0.0%) |
Disability Class: Cognitive Difficulty
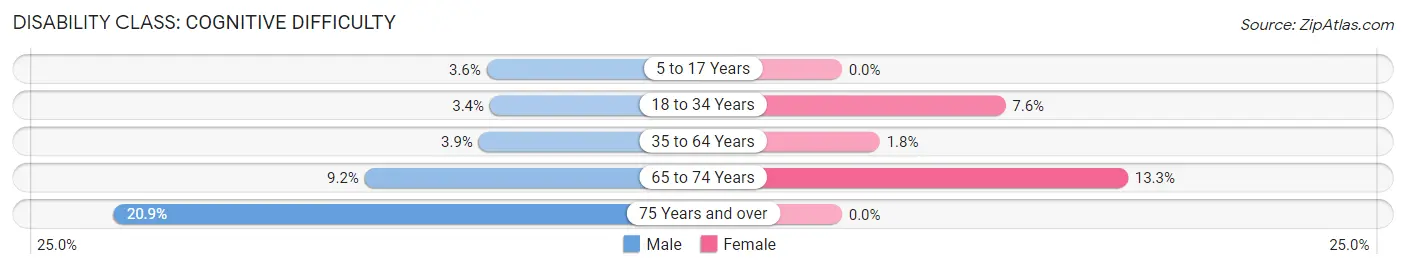
| Age Bracket | Male | Female |
| 5 to 17 Years | 18 (3.6%) | 0 (0.0%) |
| 18 to 34 Years | 18 (3.4%) | 35 (7.6%) |
| 35 to 64 Years | 43 (3.9%) | 20 (1.8%) |
| 65 to 74 Years | 26 (9.2%) | 30 (13.3%) |
| 75 Years and over | 58 (20.9%) | 0 (0.0%) |
Disability Class: Ambulatory Difficulty
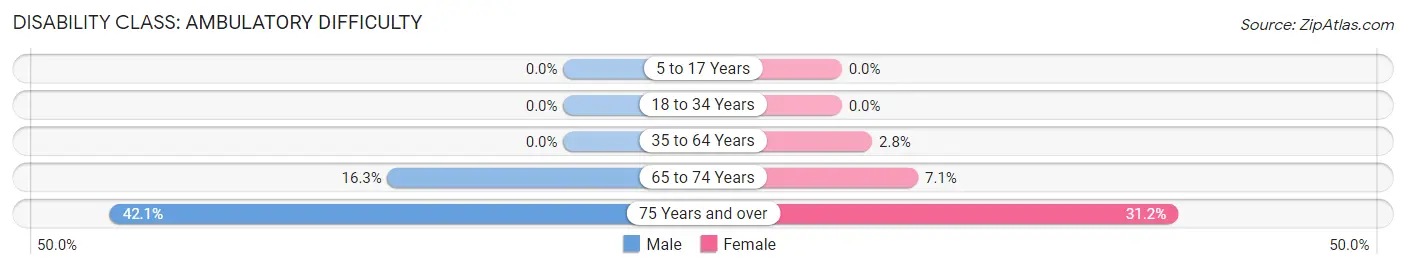
| Age Bracket | Male | Female |
| 5 to 17 Years | 0 (0.0%) | 0 (0.0%) |
| 18 to 34 Years | 0 (0.0%) | 0 (0.0%) |
| 35 to 64 Years | 0 (0.0%) | 32 (2.8%) |
| 65 to 74 Years | 46 (16.3%) | 16 (7.1%) |
| 75 Years and over | 117 (42.1%) | 78 (31.2%) |
Disability Class: Self-Care Difficulty
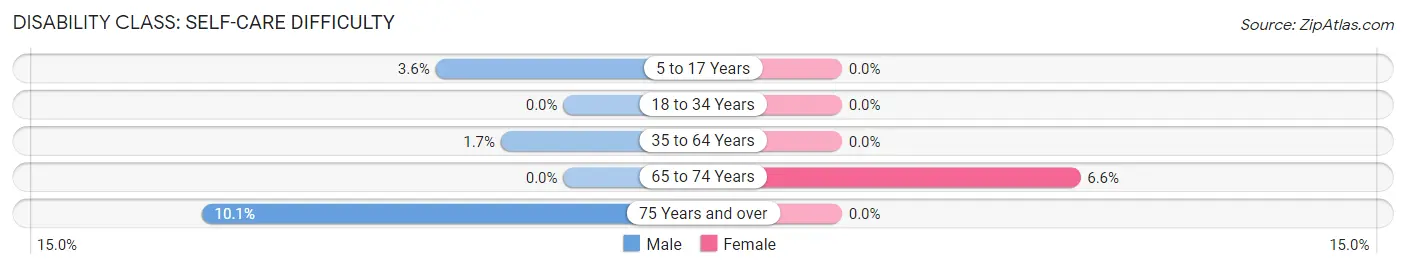
| Age Bracket | Male | Female |
| 5 to 17 Years | 18 (3.6%) | 0 (0.0%) |
| 18 to 34 Years | 0 (0.0%) | 0 (0.0%) |
| 35 to 64 Years | 19 (1.7%) | 0 (0.0%) |
| 65 to 74 Years | 0 (0.0%) | 15 (6.6%) |
| 75 Years and over | 28 (10.1%) | 0 (0.0%) |
Technology Access in La Crescent
Computing Device Access in La Crescent
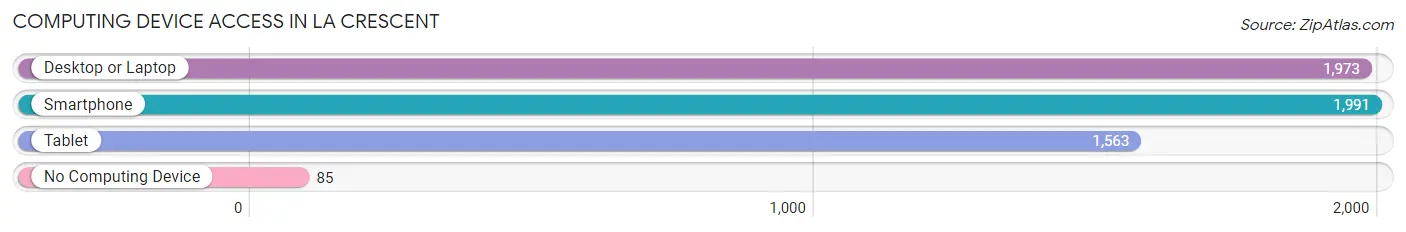
| Device Type | # Households | % Households |
| Desktop or Laptop | 1,973 | 84.1% |
| Smartphone | 1,991 | 84.9% |
| Tablet | 1,563 | 66.6% |
| No Computing Device | 85 | 3.6% |
| Total | 2,345 | 100.0% |
Internet Access in La Crescent
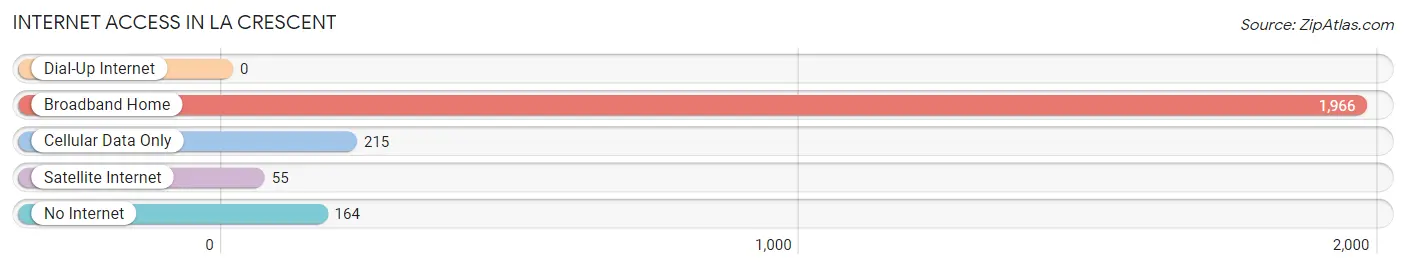
| Internet Type | # Households | % Households |
| Dial-Up Internet | 0 | 0.0% |
| Broadband Home | 1,966 | 83.8% |
| Cellular Data Only | 215 | 9.2% |
| Satellite Internet | 55 | 2.4% |
| No Internet | 164 | 7.0% |
| Total | 2,345 | 100.0% |
La Crescent Summary
La Crescent is a city located in Houston County, Minnesota, United States. The population was 4,851 at the 2010 census. It is part of the La Crosse-Onalaska, WI-MN Metropolitan Statistical Area.
History
La Crescent was founded in 1854 by a group of German immigrants led by John La Crosse. The city was named after the nearby La Crosse River, which was named by French explorers in the late 17th century. The city was incorporated in 1858.
In the late 19th century, La Crescent was a major center for the lumber industry. The city was home to several sawmills and lumberyards, and the city's economy was largely dependent on the lumber industry.
Geography
La Crescent is located at the junction of the Mississippi and La Crosse Rivers. The city is situated on the western edge of the Driftless Area, a region of the Upper Midwest that was not glaciated during the last ice age. The city is located in the southeastern corner of Houston County, and is bordered by the cities of La Crosse, Wisconsin to the east and Hokah, Minnesota to the south.
The city has a total area of 4.2 square miles, of which 4.1 square miles is land and 0.1 square miles is water.
Economy
The economy of La Crescent is largely based on agriculture and tourism. The city is home to several farms, and the surrounding area is known for its dairy production. The city is also home to several wineries, and is a popular destination for wine tours.
The city is also home to several manufacturing companies, including a paper mill and a plastics factory.
Demographics
As of the 2010 census, there were 4,851 people, 1,945 households, and 1,232 families residing in the city. The population density was 1,179.2 people per square mile. The racial makeup of the city was 95.2% White, 0.7% African American, 0.3% Native American, 0.7% Asian, 0.1% Pacific Islander, 1.3% from other races, and 1.7% from two or more races. Hispanic or Latino of any race were 3.2% of the population.
There were 1,945 households, out of which 30.2% had children under the age of 18 living with them, 48.2% were married couples living together, 10.7% had a female householder with no husband present, and 36.2% were non-families. 30.2% of all households were made up of individuals, and 13.2% had someone living alone who was 65 years of age or older. The average household size was 2.45 and the average family size was 3.06.
The median age in the city was 38.2 years. 24.2% of residents were under the age of 18; 8.2% were between the ages of 18 and 24; 25.2% were from 25 to 44; 25.7% were from 45 to 64; and 16.7% were 65 years of age or older. The gender makeup of the city was 48.7% male and 51.3% female.
Conclusion
La Crescent is a city located in Houston County, Minnesota, United States. The city was founded in 1854 by a group of German immigrants and was incorporated in 1858. The city is situated on the western edge of the Driftless Area, and is bordered by the cities of La Crosse, Wisconsin to the east and Hokah, Minnesota to the south. The economy of La Crescent is largely based on agriculture and tourism, and the city is home to several manufacturing companies. As of the 2010 census, the population of La Crescent was 4,851, with a median age of 38.2 years. The city is a popular destination for wine tours, and is home to several wineries.
Common Questions
What is Per Capita Income in La Crescent?
Per Capita income in La Crescent is $41,455.
What is the Median Family Income in La Crescent?
Median Family Income in La Crescent is $103,221.
What is the Median Household income in La Crescent?
Median Household Income in La Crescent is $70,813.
What is Income or Wage Gap in La Crescent?
Income or Wage Gap in La Crescent is 13.2%.
Women in La Crescent earn 86.8 cents for every dollar earned by a man.
What is Inequality or Gini Index in La Crescent?
Inequality or Gini Index in La Crescent is 0.36.
What is the Total Population of La Crescent?
Total Population of La Crescent is 5,352.
What is the Total Male Population of La Crescent?
Total Male Population of La Crescent is 2,765.
What is the Total Female Population of La Crescent?
Total Female Population of La Crescent is 2,587.
What is the Ratio of Males per 100 Females in La Crescent?
There are 106.88 Males per 100 Females in La Crescent.
What is the Ratio of Females per 100 Males in La Crescent?
There are 93.56 Females per 100 Males in La Crescent.
What is the Median Population Age in La Crescent?
Median Population Age in La Crescent is 42.8 Years.
What is the Average Family Size in La Crescent
Average Family Size in La Crescent is 2.9 People.
What is the Average Household Size in La Crescent
Average Household Size in La Crescent is 2.2 People.
How Large is the Labor Force in La Crescent?
There are 3,118 People in the Labor Forcein in La Crescent.
What is the Percentage of People in the Labor Force in La Crescent?
71.1% of People are in the Labor Force in La Crescent.