Dayton, MN Map & Demographics
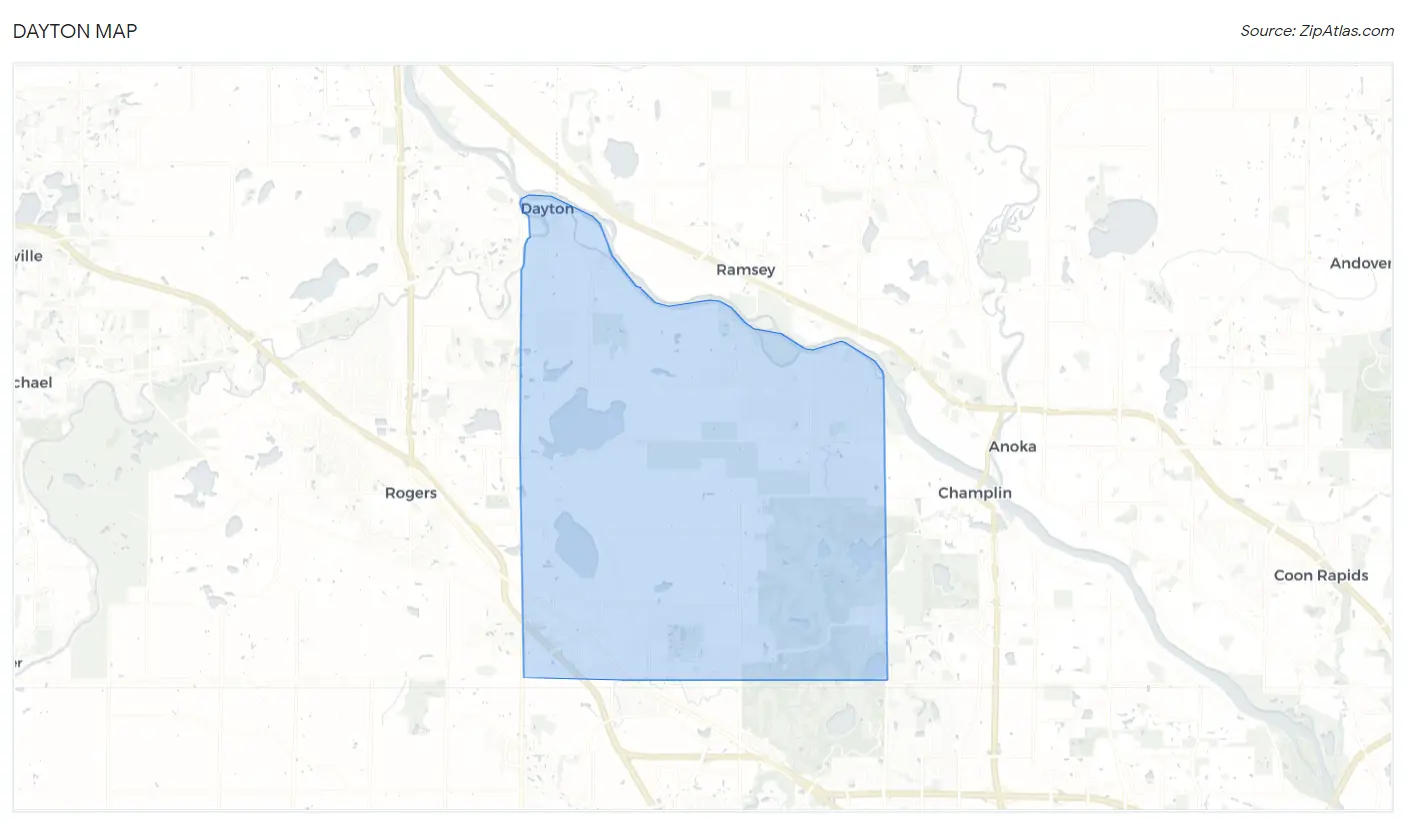
Dayton Map
Dayton Overview
$65,289
PER CAPITA INCOME
$168,897
AVG FAMILY INCOME
$138,654
AVG HOUSEHOLD INCOME
23.6%
WAGE / INCOME GAP [ % ]
76.4¢/ $1
WAGE / INCOME GAP [ $ ]
0.43
INEQUALITY / GINI INDEX
7,745
TOTAL POPULATION
4,130
MALE POPULATION
3,615
FEMALE POPULATION
114.25
MALES / 100 FEMALES
87.53
FEMALES / 100 MALES
41.1
MEDIAN AGE
3.1
AVG FAMILY SIZE
2.8
AVG HOUSEHOLD SIZE
4,473
LABOR FORCE [ PEOPLE ]
76.0%
PERCENT IN LABOR FORCE
2.2%
UNEMPLOYMENT RATE
Dayton Zip Codes
Income in Dayton
Income Overview in Dayton
Per Capita Income in Dayton is $65,289, while median incomes of families and households are $168,897 and $138,654 respectively.
| Characteristic | Number | Measure |
| Per Capita Income | 7,745 | $65,289 |
| Median Family Income | 2,263 | $168,897 |
| Mean Family Income | 2,263 | $205,905 |
| Median Household Income | 2,744 | $138,654 |
| Mean Household Income | 2,744 | $183,696 |
| Income Deficit | 2,263 | $0 |
| Wage / Income Gap (%) | 7,745 | 23.60% |
| Wage / Income Gap ($) | 7,745 | 76.40¢ per $1 |
| Gini / Inequality Index | 7,745 | 0.43 |
Earnings by Sex in Dayton
Average Earnings in Dayton are $68,250, $78,980 for men and $60,339 for women, a difference of 23.6%.
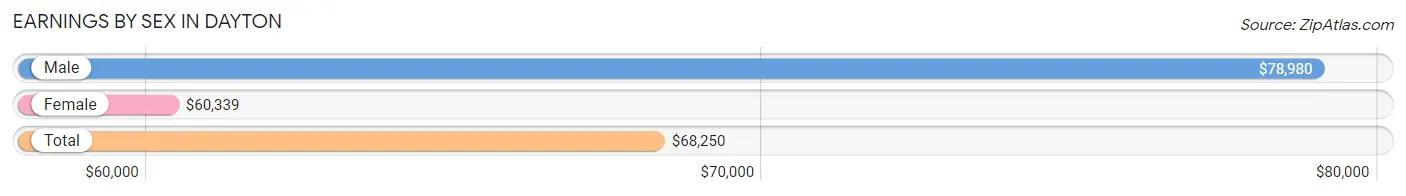
| Sex | Number | Average Earnings |
| Male | 2,519 (54.8%) | $78,980 |
| Female | 2,078 (45.2%) | $60,339 |
| Total | 4,597 (100.0%) | $68,250 |
Earnings by Sex by Income Bracket in Dayton
The most common earnings brackets in Dayton are $100,000+ for men (1,033 | 41.0%) and $100,000+ for women (564 | 27.1%).
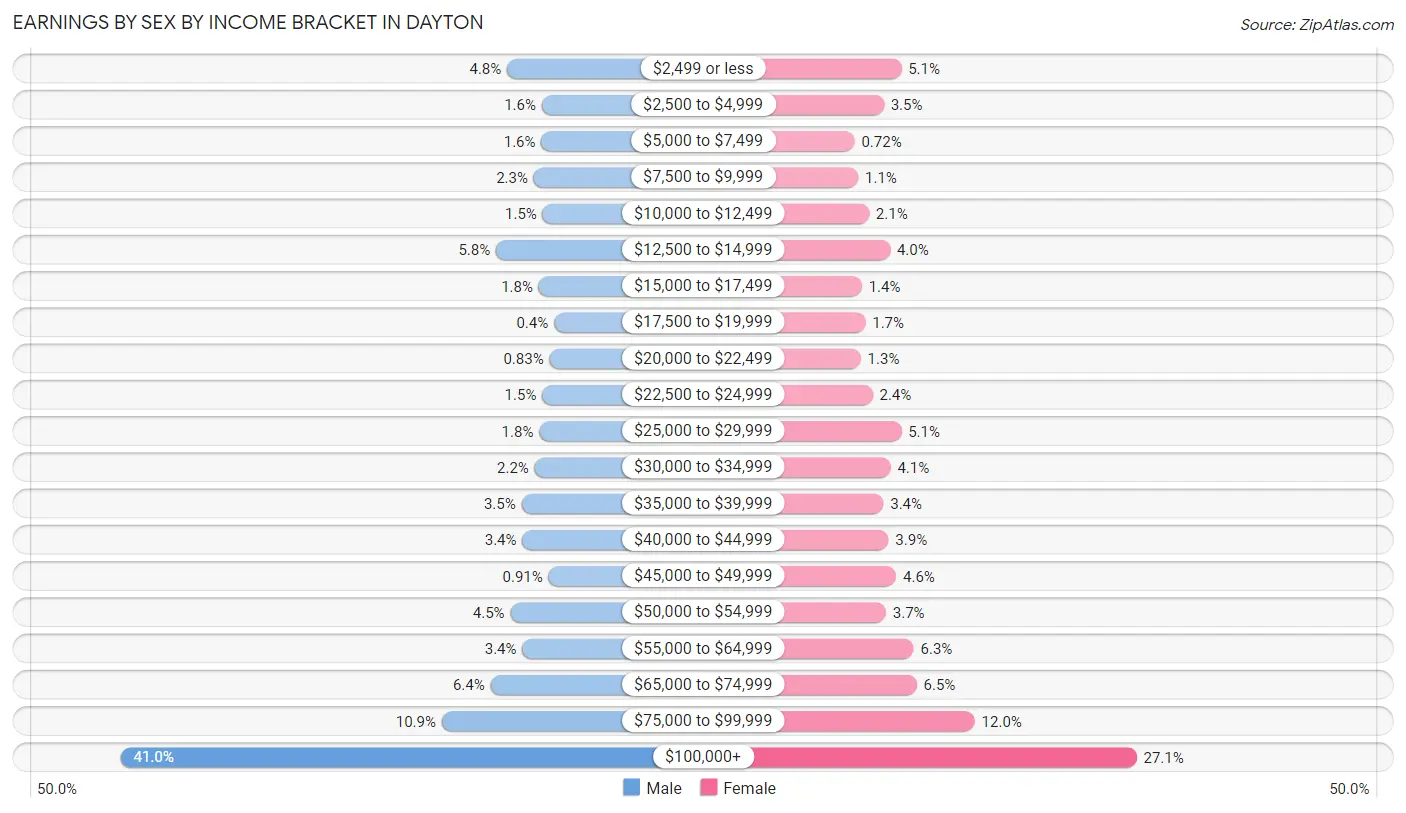
| Income | Male | Female |
| $2,499 or less | 121 (4.8%) | 106 (5.1%) |
| $2,500 to $4,999 | 39 (1.5%) | 72 (3.5%) |
| $5,000 to $7,499 | 40 (1.6%) | 15 (0.7%) |
| $7,500 to $9,999 | 58 (2.3%) | 22 (1.1%) |
| $10,000 to $12,499 | 37 (1.5%) | 43 (2.1%) |
| $12,500 to $14,999 | 147 (5.8%) | 84 (4.0%) |
| $15,000 to $17,499 | 46 (1.8%) | 29 (1.4%) |
| $17,500 to $19,999 | 10 (0.4%) | 36 (1.7%) |
| $20,000 to $22,499 | 21 (0.8%) | 27 (1.3%) |
| $22,500 to $24,999 | 38 (1.5%) | 50 (2.4%) |
| $25,000 to $29,999 | 45 (1.8%) | 106 (5.1%) |
| $30,000 to $34,999 | 56 (2.2%) | 85 (4.1%) |
| $35,000 to $39,999 | 87 (3.5%) | 71 (3.4%) |
| $40,000 to $44,999 | 85 (3.4%) | 81 (3.9%) |
| $45,000 to $49,999 | 23 (0.9%) | 96 (4.6%) |
| $50,000 to $54,999 | 113 (4.5%) | 76 (3.7%) |
| $55,000 to $64,999 | 85 (3.4%) | 130 (6.3%) |
| $65,000 to $74,999 | 160 (6.4%) | 136 (6.5%) |
| $75,000 to $99,999 | 275 (10.9%) | 249 (12.0%) |
| $100,000+ | 1,033 (41.0%) | 564 (27.1%) |
| Total | 2,519 (100.0%) | 2,078 (100.0%) |
Earnings by Sex by Educational Attainment in Dayton
Average earnings in Dayton are $90,964 for men and $62,981 for women, a difference of 30.8%. Men with an educational attainment of graduate degree enjoy the highest average annual earnings of $164,219, while those with less than high school education earn the least with $42,250. Women with an educational attainment of graduate degree earn the most with the average annual earnings of $83,354, while those with high school diploma education have the smallest earnings of $27,786.
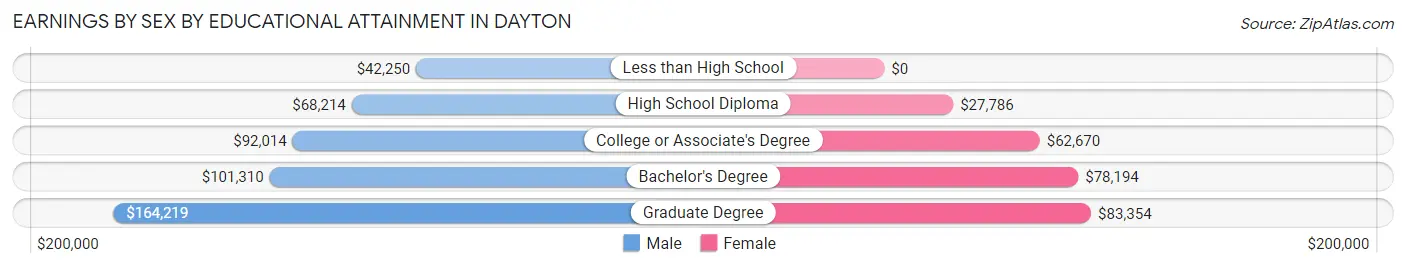
| Educational Attainment | Male Income | Female Income |
| Less than High School | $42,250 | $0 |
| High School Diploma | $68,214 | $27,786 |
| College or Associate's Degree | $92,014 | $62,670 |
| Bachelor's Degree | $101,310 | $78,194 |
| Graduate Degree | $164,219 | $83,354 |
| Total | $90,964 | $62,981 |
Family Income in Dayton
Family Income Brackets in Dayton
According to the Dayton family income data, there are 869 families falling into the $200,000+ income range, which is the most common income bracket and makes up 38.4% of all families.
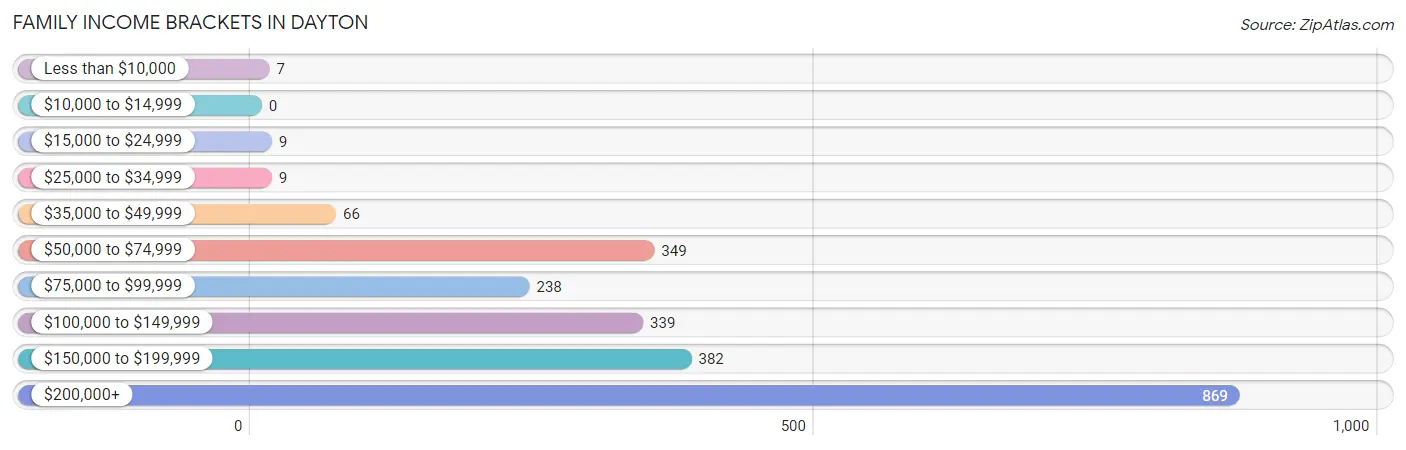
| Income Bracket | # Families | % Families |
| Less than $10,000 | 7 | 0.3% |
| $10,000 to $14,999 | 0 | 0.0% |
| $15,000 to $24,999 | 9 | 0.4% |
| $25,000 to $34,999 | 9 | 0.4% |
| $35,000 to $49,999 | 66 | 2.9% |
| $50,000 to $74,999 | 349 | 15.4% |
| $75,000 to $99,999 | 238 | 10.5% |
| $100,000 to $149,999 | 339 | 15.0% |
| $150,000 to $199,999 | 382 | 16.9% |
| $200,000+ | 869 | 38.4% |
Family Income by Famaliy Size in Dayton
4-person families (573 | 25.3%) account for the highest median family income in Dayton with $196,938 per family, while 2-person families (1,060 | 46.8%) have the highest median income of $71,806 per family member.
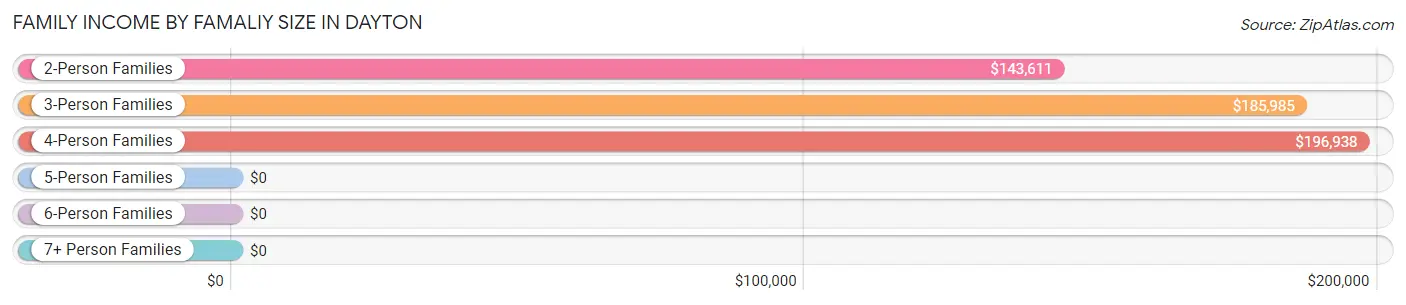
| Income Bracket | # Families | Median Income |
| 2-Person Families | 1,060 (46.8%) | $143,611 |
| 3-Person Families | 360 (15.9%) | $185,985 |
| 4-Person Families | 573 (25.3%) | $196,938 |
| 5-Person Families | 159 (7.0%) | $0 |
| 6-Person Families | 94 (4.2%) | $0 |
| 7+ Person Families | 17 (0.7%) | $0 |
| Total | 2,263 (100.0%) | $168,897 |
Family Income by Number of Earners in Dayton
The median family income in Dayton is $168,897, with families comprising 2 earners (1,256) having the highest median family income of $224,265, while families with 1 earner (398) have the lowest median family income of $77,308, accounting for 55.5% and 17.6% of families, respectively.
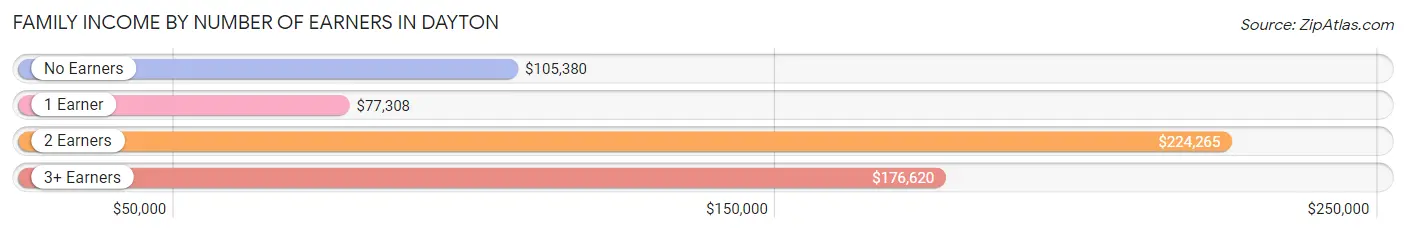
| Number of Earners | # Families | Median Income |
| No Earners | 229 (10.1%) | $105,380 |
| 1 Earner | 398 (17.6%) | $77,308 |
| 2 Earners | 1,256 (55.5%) | $224,265 |
| 3+ Earners | 380 (16.8%) | $176,620 |
| Total | 2,263 (100.0%) | $168,897 |
Household Income in Dayton
Household Income Brackets in Dayton
With 867 households falling in the category, the $200,000+ income range is the most frequent in Dayton, accounting for 31.6% of all households. In contrast, only 8 households (0.3%) fall into the $15,000 to $24,999 income bracket, making it the least populous group.
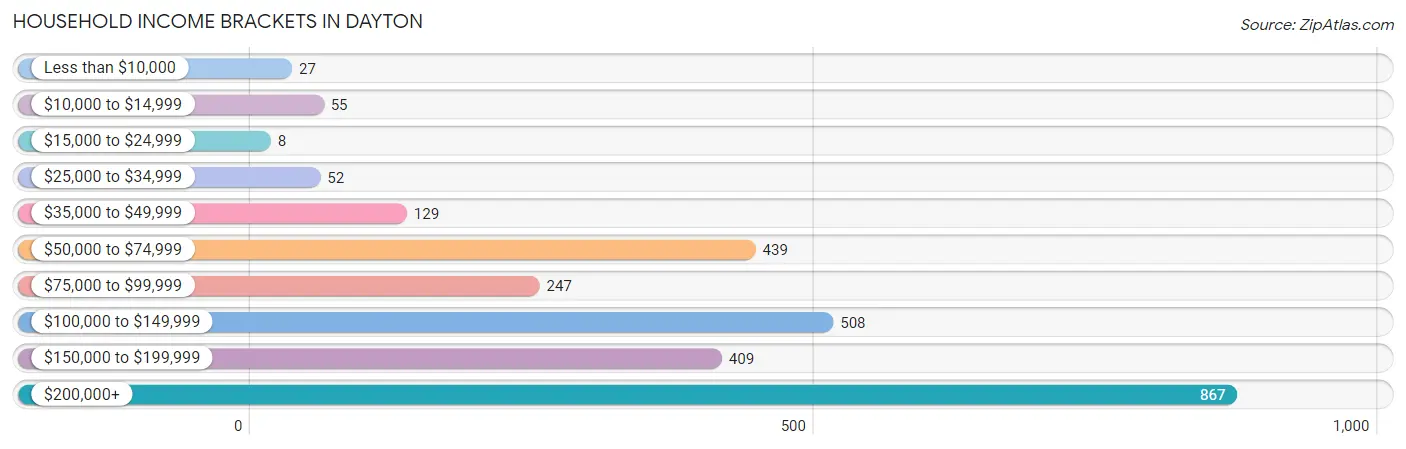
| Income Bracket | # Households | % Households |
| Less than $10,000 | 27 | 1.0% |
| $10,000 to $14,999 | 55 | 2.0% |
| $15,000 to $24,999 | 8 | 0.3% |
| $25,000 to $34,999 | 52 | 1.9% |
| $35,000 to $49,999 | 129 | 4.7% |
| $50,000 to $74,999 | 439 | 16.0% |
| $75,000 to $99,999 | 247 | 9.0% |
| $100,000 to $149,999 | 508 | 18.5% |
| $150,000 to $199,999 | 409 | 14.9% |
| $200,000+ | 867 | 31.6% |
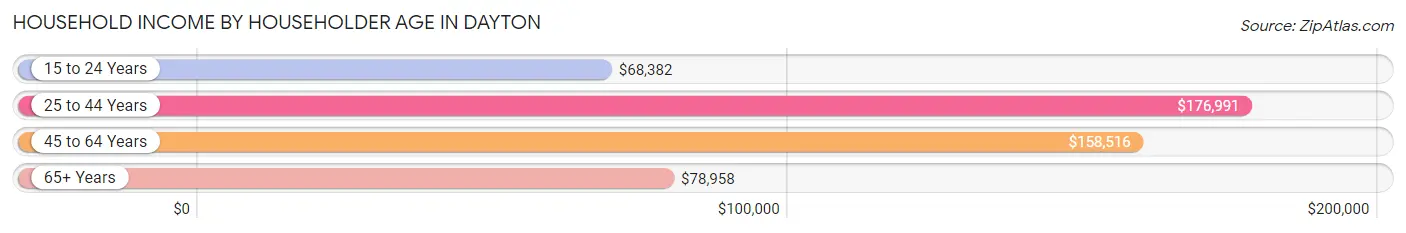
Household Income by Householder Age in Dayton
The median household income in Dayton is $138,654, with the highest median household income of $176,991 found in the 25 to 44 years age bracket for the primary householder. A total of 902 households (32.9%) fall into this category. Meanwhile, the 15 to 24 years age bracket for the primary householder has the lowest median household income of $68,382, with 34 households (1.2%) in this group.
| Income Bracket | # Households | Median Income |
| 15 to 24 Years | 34 (1.2%) | $68,382 |
| 25 to 44 Years | 902 (32.9%) | $176,991 |
| 45 to 64 Years | 1,199 (43.7%) | $158,516 |
| 65+ Years | 609 (22.2%) | $78,958 |
| Total | 2,744 (100.0%) | $138,654 |
Poverty in Dayton
Income Below Poverty by Sex and Age in Dayton
With 1.6% poverty level for males and 2.3% for females among the residents of Dayton, 75 year old and over males and 15 year old females are the most vulnerable to poverty, with 10 males (7.4%) and 6 females (8.0%) in their respective age groups living below the poverty level.
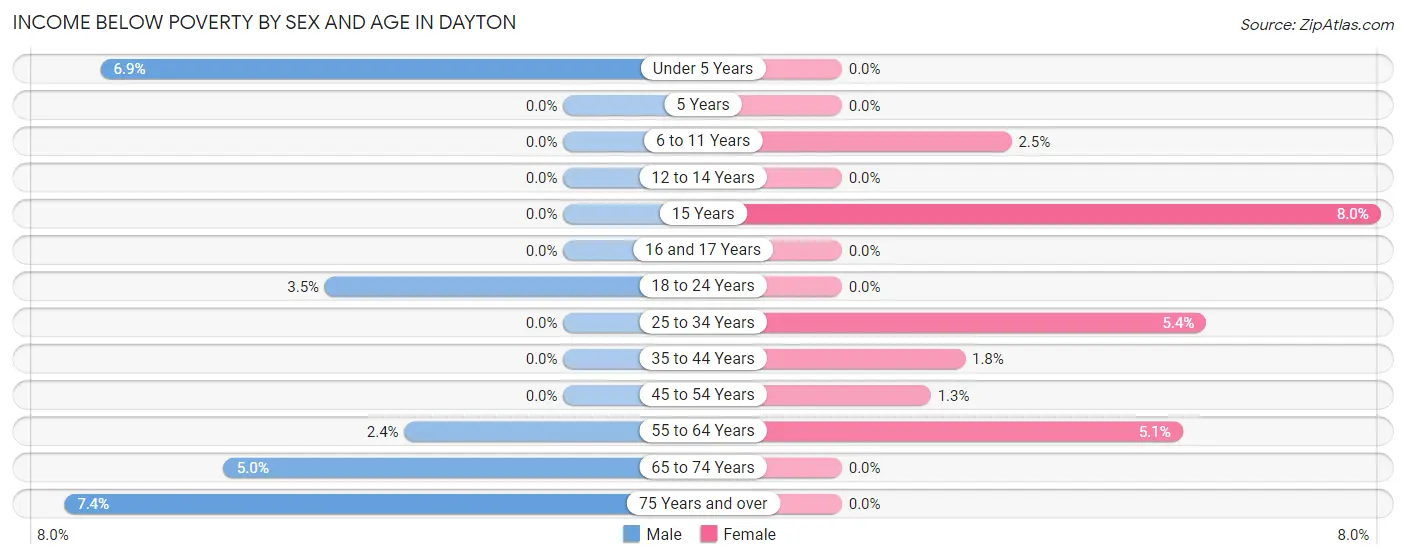
| Age Bracket | Male | Female |
| Under 5 Years | 9 (6.9%) | 0 (0.0%) |
| 5 Years | 0 (0.0%) | 0 (0.0%) |
| 6 to 11 Years | 0 (0.0%) | 8 (2.5%) |
| 12 to 14 Years | 0 (0.0%) | 0 (0.0%) |
| 15 Years | 0 (0.0%) | 6 (8.0%) |
| 16 and 17 Years | 0 (0.0%) | 0 (0.0%) |
| 18 to 24 Years | 8 (3.5%) | 0 (0.0%) |
| 25 to 34 Years | 0 (0.0%) | 20 (5.4%) |
| 35 to 44 Years | 0 (0.0%) | 13 (1.8%) |
| 45 to 54 Years | 0 (0.0%) | 6 (1.3%) |
| 55 to 64 Years | 18 (2.4%) | 31 (5.1%) |
| 65 to 74 Years | 21 (5.0%) | 0 (0.0%) |
| 75 Years and over | 10 (7.4%) | 0 (0.0%) |
| Total | 66 (1.6%) | 84 (2.3%) |
Income Above Poverty by Sex and Age in Dayton
According to the poverty statistics in Dayton, males aged 5 years and females aged under 5 years are the age groups that are most secure financially, with 100.0% of males and 100.0% of females in these age groups living above the poverty line.
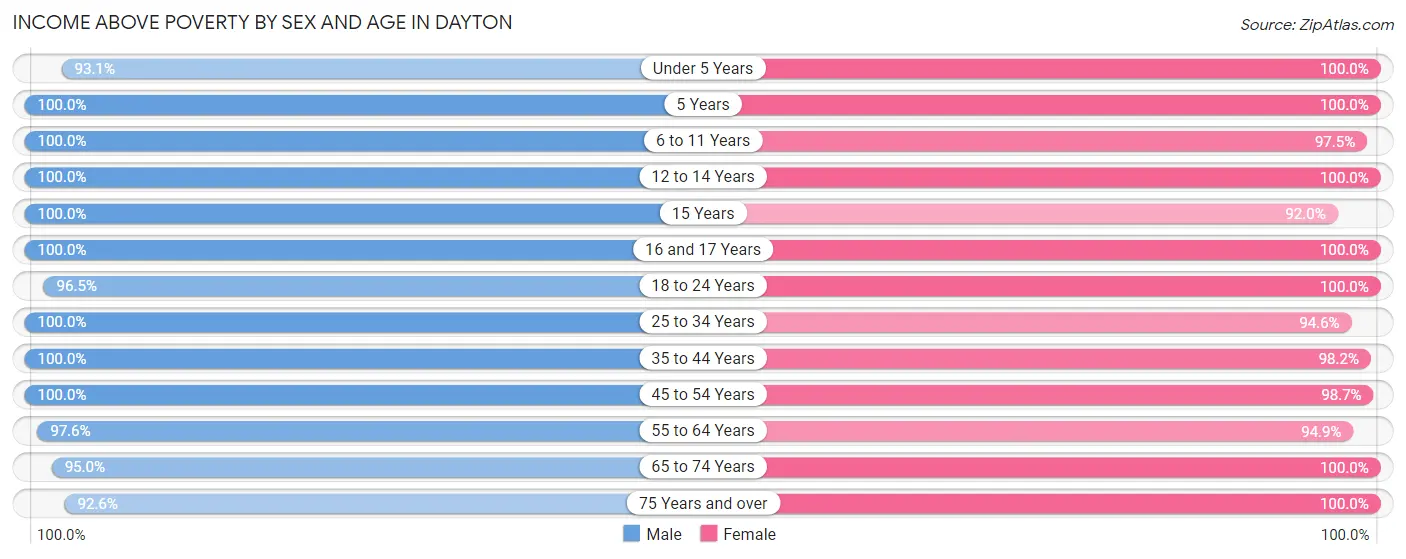
| Age Bracket | Male | Female |
| Under 5 Years | 122 (93.1%) | 174 (100.0%) |
| 5 Years | 39 (100.0%) | 64 (100.0%) |
| 6 to 11 Years | 447 (100.0%) | 310 (97.5%) |
| 12 to 14 Years | 282 (100.0%) | 237 (100.0%) |
| 15 Years | 93 (100.0%) | 69 (92.0%) |
| 16 and 17 Years | 172 (100.0%) | 66 (100.0%) |
| 18 to 24 Years | 218 (96.5%) | 67 (100.0%) |
| 25 to 34 Years | 377 (100.0%) | 350 (94.6%) |
| 35 to 44 Years | 591 (100.0%) | 698 (98.2%) |
| 45 to 54 Years | 458 (100.0%) | 450 (98.7%) |
| 55 to 64 Years | 744 (97.6%) | 582 (94.9%) |
| 65 to 74 Years | 396 (95.0%) | 367 (100.0%) |
| 75 Years and over | 125 (92.6%) | 97 (100.0%) |
| Total | 4,064 (98.4%) | 3,531 (97.7%) |
Income Below Poverty Among Married-Couple Families in Dayton
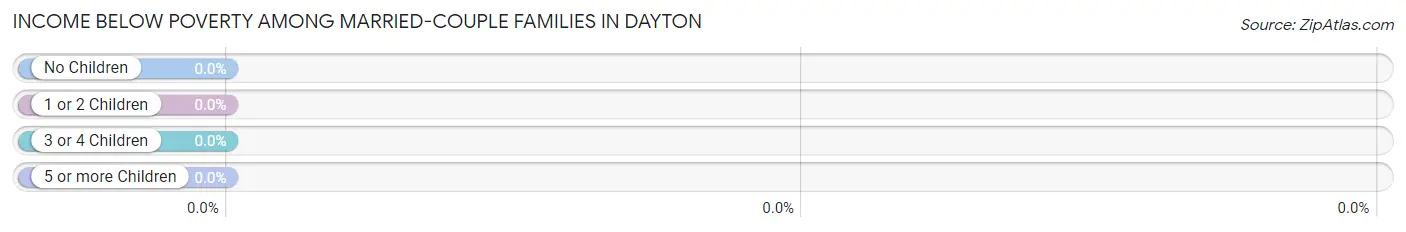
| Children | Above Poverty | Below Poverty |
| No Children | 1,101 (100.0%) | 0 (0.0%) |
| 1 or 2 Children | 728 (100.0%) | 0 (0.0%) |
| 3 or 4 Children | 156 (100.0%) | 0 (0.0%) |
| 5 or more Children | 0 (0.0%) | 0 (0.0%) |
| Total | 1,985 (100.0%) | 0 (0.0%) |
Income Below Poverty Among Single-Parent Households in Dayton
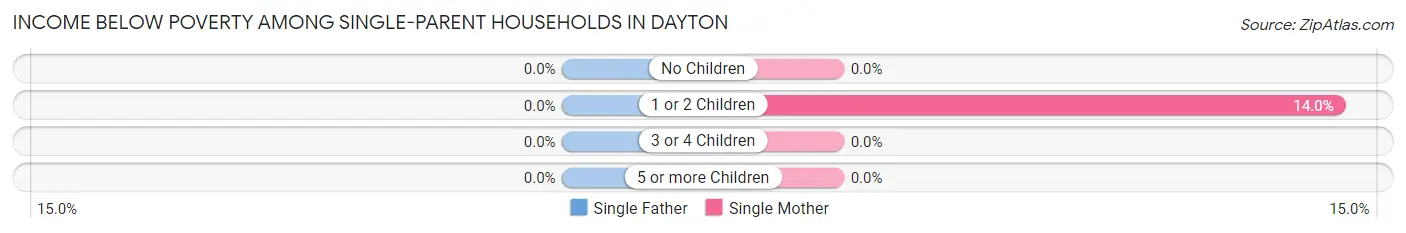
| Children | Single Father | Single Mother |
| No Children | 0 (0.0%) | 0 (0.0%) |
| 1 or 2 Children | 0 (0.0%) | 15 (14.0%) |
| 3 or 4 Children | 0 (0.0%) | 0 (0.0%) |
| 5 or more Children | 0 (0.0%) | 0 (0.0%) |
| Total | 0 (0.0%) | 15 (7.6%) |
Income Below Poverty Among Married-Couple vs Single-Parent Households in Dayton
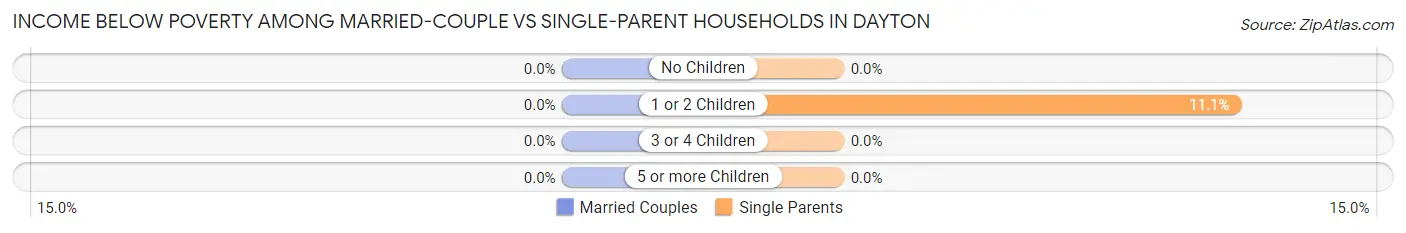
| Children | Married-Couple Families | Single-Parent Households |
| No Children | 0 (0.0%) | 0 (0.0%) |
| 1 or 2 Children | 0 (0.0%) | 15 (11.1%) |
| 3 or 4 Children | 0 (0.0%) | 0 (0.0%) |
| 5 or more Children | 0 (0.0%) | 0 (0.0%) |
| Total | 0 (0.0%) | 15 (5.4%) |
Race in Dayton
The most populous races in Dayton are White / Caucasian (6,387 | 82.5%), Two or more Races (548 | 7.1%), and Hispanic or Latino (472 | 6.1%).
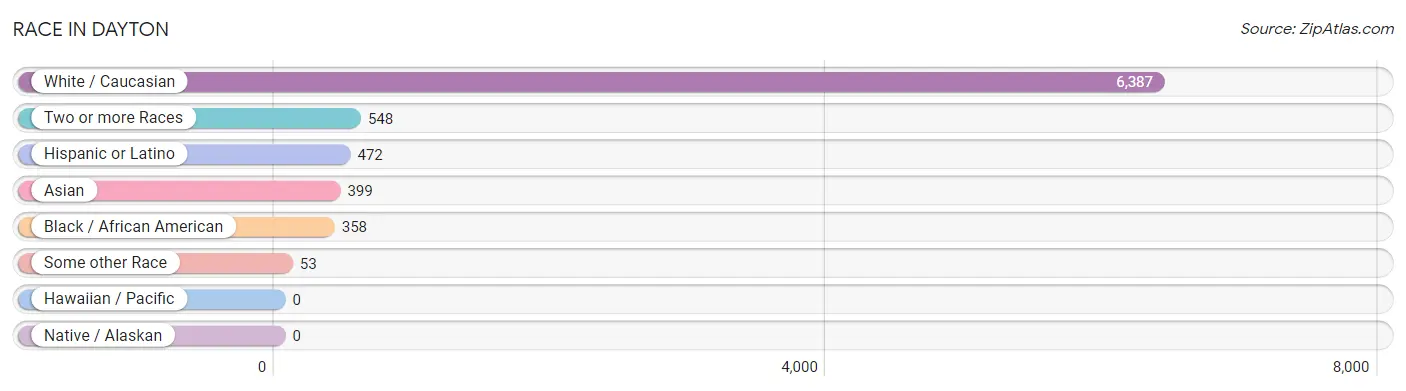
| Race | # Population | % Population |
| Asian | 399 | 5.1% |
| Black / African American | 358 | 4.6% |
| Hawaiian / Pacific | 0 | 0.0% |
| Hispanic or Latino | 472 | 6.1% |
| Native / Alaskan | 0 | 0.0% |
| White / Caucasian | 6,387 | 82.5% |
| Two or more Races | 548 | 7.1% |
| Some other Race | 53 | 0.7% |
| Total | 7,745 | 100.0% |
Ancestry in Dayton
The most populous ancestries reported in Dayton are German (2,293 | 29.6%), Norwegian (788 | 10.2%), Swedish (698 | 9.0%), English (629 | 8.1%), and Polish (612 | 7.9%), together accounting for 64.8% of all Dayton residents.
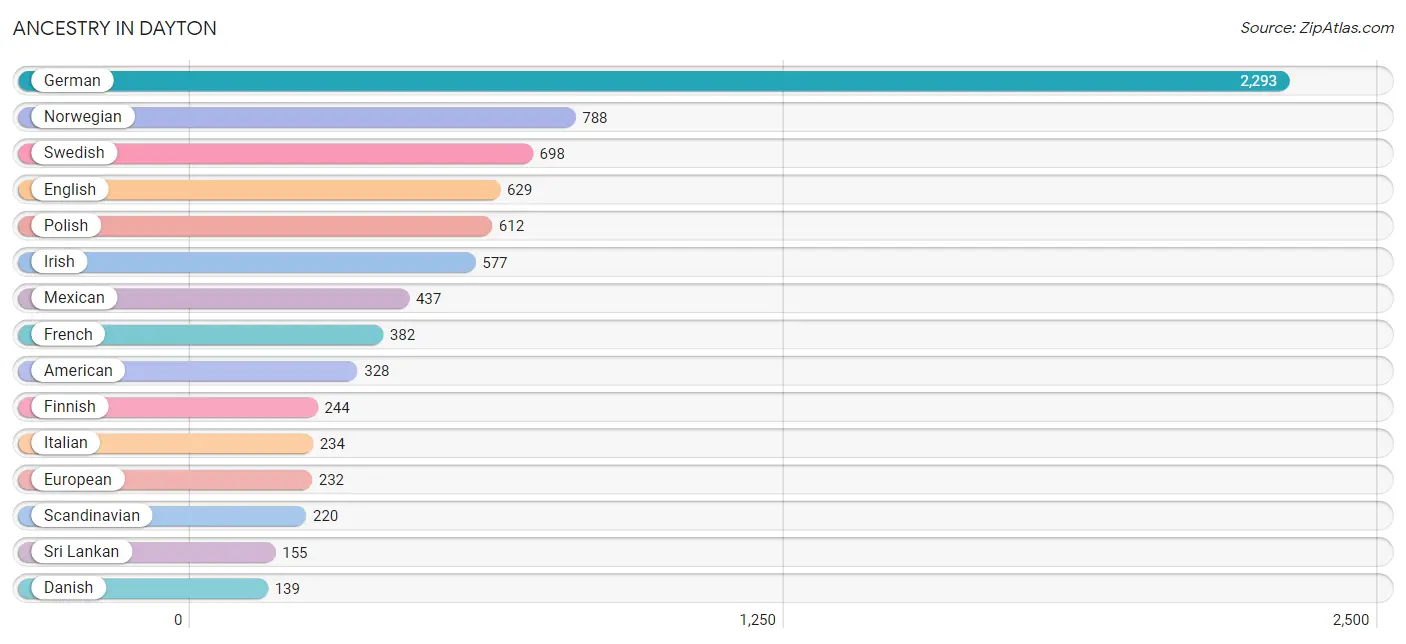
| Ancestry | # Population | % Population |
| American | 328 | 4.2% |
| Arab | 11 | 0.1% |
| Bangladeshi | 59 | 0.8% |
| Bhutanese | 30 | 0.4% |
| British | 28 | 0.4% |
| Burmese | 101 | 1.3% |
| Canadian | 9 | 0.1% |
| Central American | 14 | 0.2% |
| Chippewa | 29 | 0.4% |
| Croatian | 18 | 0.2% |
| Czech | 80 | 1.0% |
| Czechoslovakian | 91 | 1.2% |
| Danish | 139 | 1.8% |
| Dutch | 115 | 1.5% |
| Eastern European | 20 | 0.3% |
| English | 629 | 8.1% |
| European | 232 | 3.0% |
| Finnish | 244 | 3.2% |
| French | 382 | 4.9% |
| French Canadian | 23 | 0.3% |
| German | 2,293 | 29.6% |
| Greek | 9 | 0.1% |
| Guatemalan | 14 | 0.2% |
| Hungarian | 19 | 0.3% |
| Indian (Asian) | 47 | 0.6% |
| Irish | 577 | 7.4% |
| Italian | 234 | 3.0% |
| Jamaican | 6 | 0.1% |
| Kenyan | 86 | 1.1% |
| Lebanese | 11 | 0.1% |
| Malaysian | 92 | 1.2% |
| Mexican | 437 | 5.6% |
| Norwegian | 788 | 10.2% |
| Polish | 612 | 7.9% |
| Russian | 10 | 0.1% |
| Scandinavian | 220 | 2.8% |
| Scotch-Irish | 16 | 0.2% |
| Scottish | 11 | 0.1% |
| Slovene | 10 | 0.1% |
| Sri Lankan | 155 | 2.0% |
| Subsaharan African | 104 | 1.3% |
| Swedish | 698 | 9.0% |
| Swiss | 16 | 0.2% |
| Ugandan | 18 | 0.2% |
| Ukrainian | 45 | 0.6% |
| Welsh | 11 | 0.1% | View All 46 Rows |
Immigrants in Dayton
The most numerous immigrant groups reported in Dayton came from Asia (333 | 4.3%), South Eastern Asia (305 | 3.9%), Vietnam (222 | 2.9%), Latin America (164 | 2.1%), and Central America (119 | 1.5%), together accounting for 14.8% of all Dayton residents.
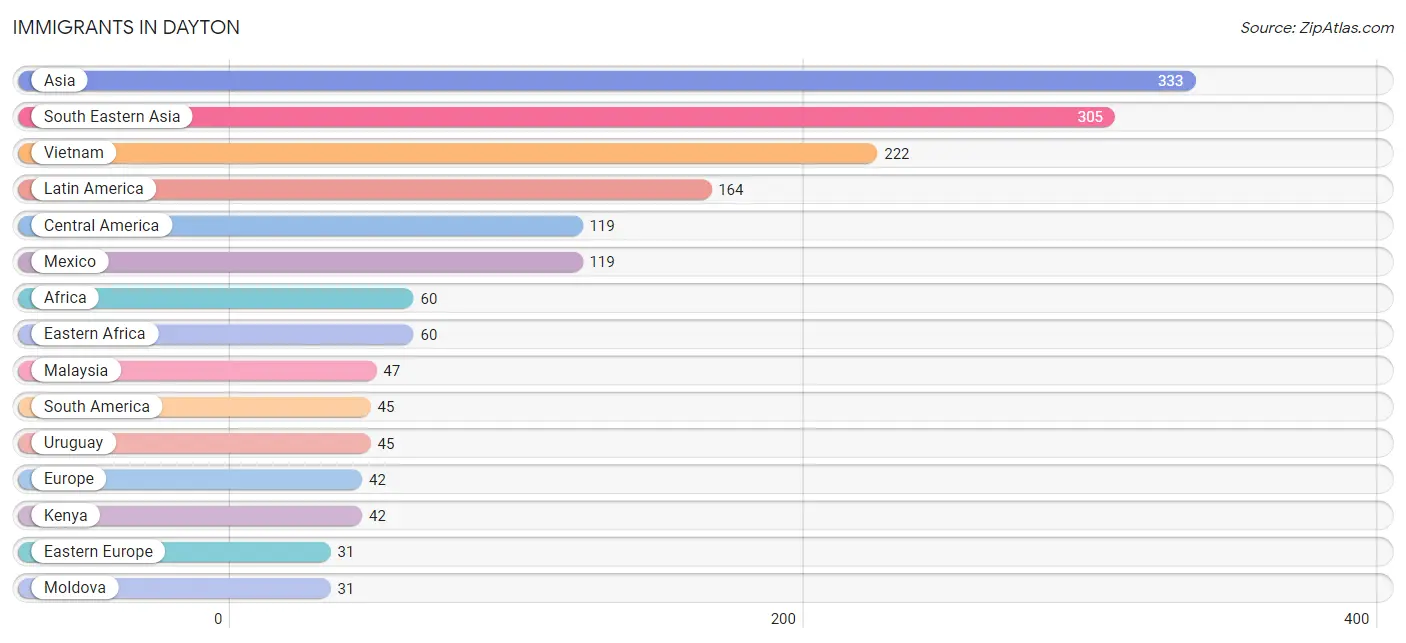
| Immigration Origin | # Population | % Population |
| Africa | 60 | 0.8% |
| Asia | 333 | 4.3% |
| Central America | 119 | 1.5% |
| Eastern Africa | 60 | 0.8% |
| Eastern Asia | 28 | 0.4% |
| Eastern Europe | 31 | 0.4% |
| Europe | 42 | 0.5% |
| Germany | 11 | 0.1% |
| Kenya | 42 | 0.5% |
| Korea | 28 | 0.4% |
| Laos | 25 | 0.3% |
| Latin America | 164 | 2.1% |
| Malaysia | 47 | 0.6% |
| Mexico | 119 | 1.5% |
| Moldova | 31 | 0.4% |
| South America | 45 | 0.6% |
| South Eastern Asia | 305 | 3.9% |
| Thailand | 11 | 0.1% |
| Uganda | 18 | 0.2% |
| Uruguay | 45 | 0.6% |
| Vietnam | 222 | 2.9% |
| Western Europe | 11 | 0.1% | View All 22 Rows |
Sex and Age in Dayton
Sex and Age in Dayton
The most populous age groups in Dayton are 60 to 64 Years (495 | 12.0%) for men and 40 to 44 Years (388 | 10.7%) for women.
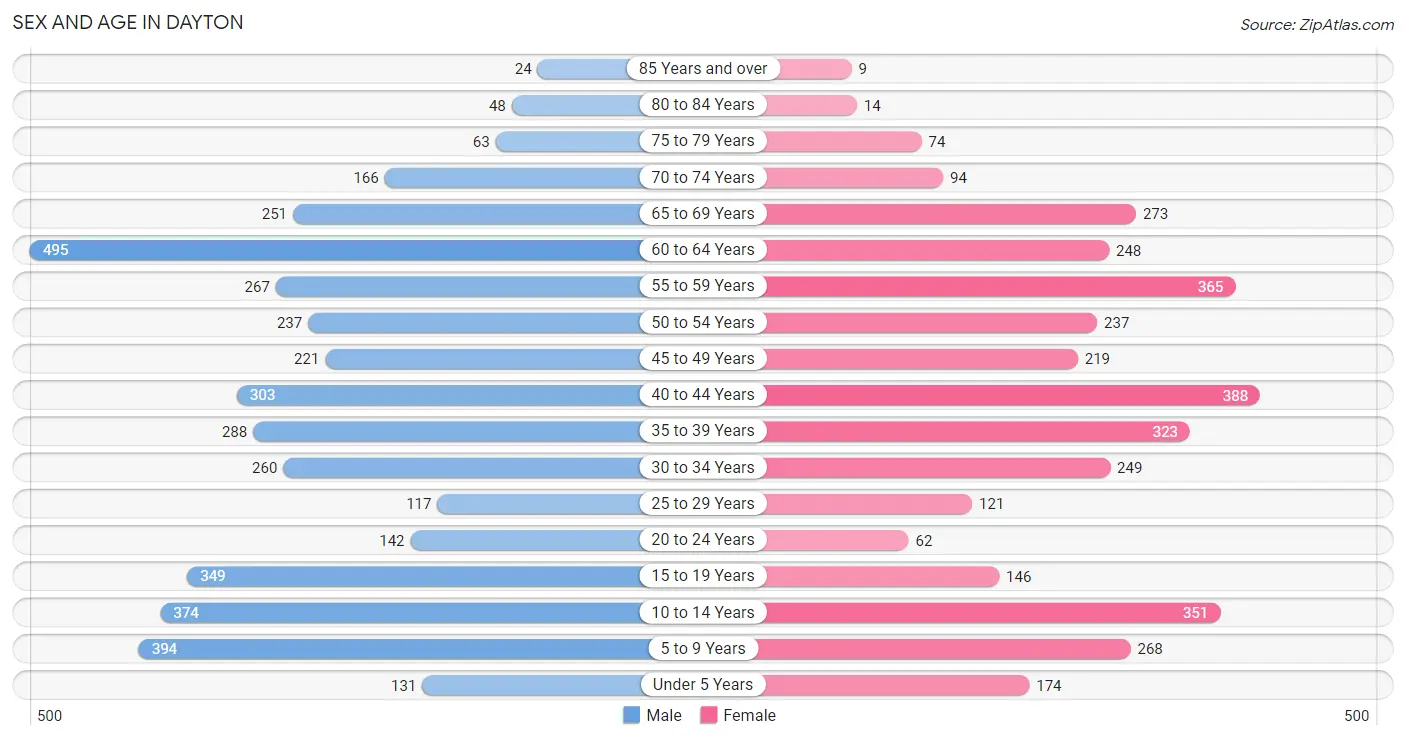
| Age Bracket | Male | Female |
| Under 5 Years | 131 (3.2%) | 174 (4.8%) |
| 5 to 9 Years | 394 (9.5%) | 268 (7.4%) |
| 10 to 14 Years | 374 (9.1%) | 351 (9.7%) |
| 15 to 19 Years | 349 (8.5%) | 146 (4.0%) |
| 20 to 24 Years | 142 (3.4%) | 62 (1.7%) |
| 25 to 29 Years | 117 (2.8%) | 121 (3.4%) |
| 30 to 34 Years | 260 (6.3%) | 249 (6.9%) |
| 35 to 39 Years | 288 (7.0%) | 323 (8.9%) |
| 40 to 44 Years | 303 (7.3%) | 388 (10.7%) |
| 45 to 49 Years | 221 (5.3%) | 219 (6.1%) |
| 50 to 54 Years | 237 (5.7%) | 237 (6.6%) |
| 55 to 59 Years | 267 (6.5%) | 365 (10.1%) |
| 60 to 64 Years | 495 (12.0%) | 248 (6.9%) |
| 65 to 69 Years | 251 (6.1%) | 273 (7.5%) |
| 70 to 74 Years | 166 (4.0%) | 94 (2.6%) |
| 75 to 79 Years | 63 (1.5%) | 74 (2.1%) |
| 80 to 84 Years | 48 (1.2%) | 14 (0.4%) |
| 85 Years and over | 24 (0.6%) | 9 (0.3%) |
| Total | 4,130 (100.0%) | 3,615 (100.0%) |
Families and Households in Dayton
Median Family Size in Dayton
The median family size in Dayton is 3.12 persons per family, with married-couple families (1,985 | 87.7%) accounting for the largest median family size of 3.17 persons per family. On the other hand, single female/mother families (197 | 8.7%) represent the smallest median family size with 2.70 persons per family.
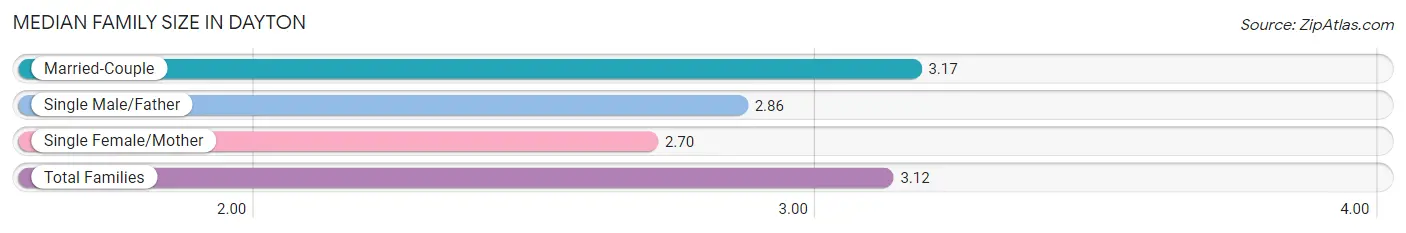
| Family Type | # Families | Family Size |
| Married-Couple | 1,985 (87.7%) | 3.17 |
| Single Male/Father | 81 (3.6%) | 2.86 |
| Single Female/Mother | 197 (8.7%) | 2.70 |
| Total Families | 2,263 (100.0%) | 3.12 |
Median Household Size in Dayton
The median household size in Dayton is 2.82 persons per household, with married-couple households (1,985 | 72.3%) accounting for the largest median household size of 3.18 persons per household. non-family households (481 | 17.5%) represent the smallest median household size with 1.24 persons per household.
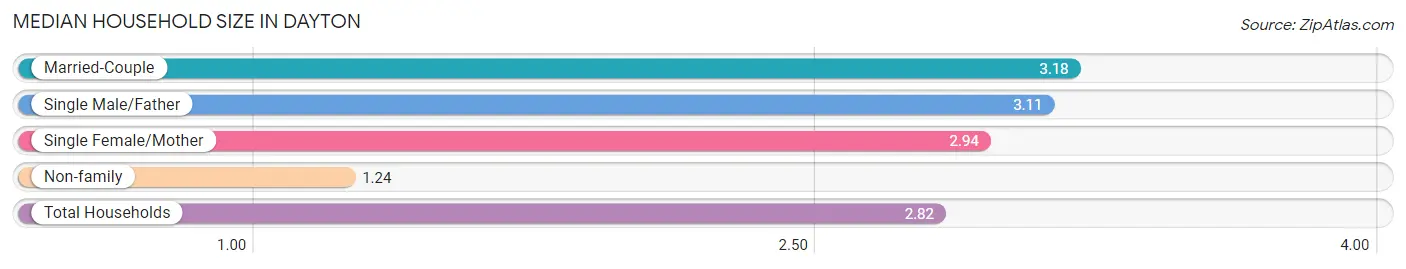
| Household Type | # Households | Household Size |
| Married-Couple | 1,985 (72.3%) | 3.18 |
| Single Male/Father | 81 (2.9%) | 3.11 |
| Single Female/Mother | 197 (7.2%) | 2.94 |
| Non-family | 481 (17.5%) | 1.24 |
| Total Households | 2,744 (100.0%) | 2.82 |
Household Size by Marriage Status in Dayton
Out of a total of 2,744 households in Dayton, 2,263 (82.5%) are family households, while 481 (17.5%) are nonfamily households. The most numerous type of family households are 2-person households, comprising 1,020, and the most common type of nonfamily households are 1-person households, comprising 395.
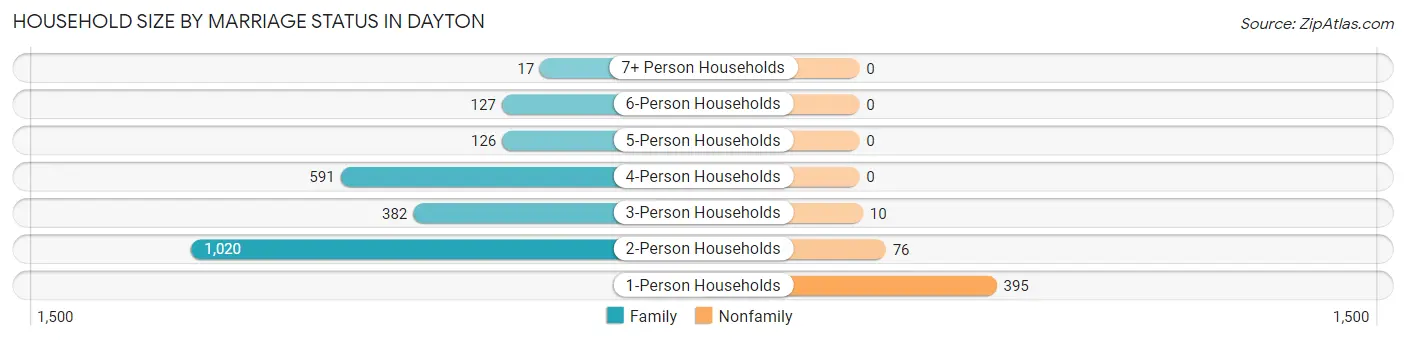
| Household Size | Family Households | Nonfamily Households |
| 1-Person Households | - | 395 (14.4%) |
| 2-Person Households | 1,020 (37.2%) | 76 (2.8%) |
| 3-Person Households | 382 (13.9%) | 10 (0.4%) |
| 4-Person Households | 591 (21.5%) | 0 (0.0%) |
| 5-Person Households | 126 (4.6%) | 0 (0.0%) |
| 6-Person Households | 127 (4.6%) | 0 (0.0%) |
| 7+ Person Households | 17 (0.6%) | 0 (0.0%) |
| Total | 2,263 (82.5%) | 481 (17.5%) |
Female Fertility in Dayton
Fertility by Age in Dayton
Average fertility rate in Dayton is 34.0 births per 1,000 women. Women in the age bracket of 20 to 34 years have the highest fertility rate with 123.0 births per 1,000 women. Women in the age bracket of 20 to 34 years acount for 100.0% of all women with births.
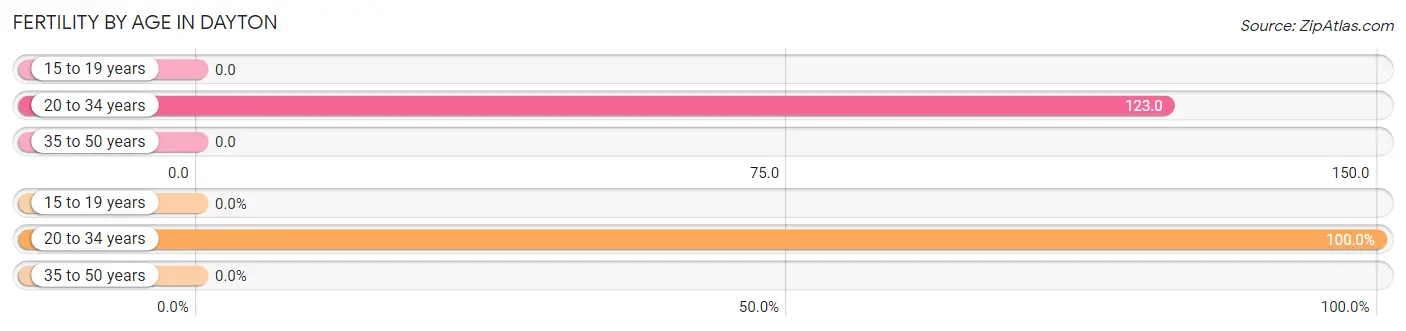
| Age Bracket | Women with Births | Births / 1,000 Women |
| 15 to 19 years | 0 (0.0%) | 0.0 |
| 20 to 34 years | 53 (100.0%) | 123.0 |
| 35 to 50 years | 0 (0.0%) | 0.0 |
| Total | 53 (100.0%) | 34.0 |
Fertility by Age by Marriage Status in Dayton
64.2% of women with births (53) in Dayton are married. The highest percentage of unmarried women with births falls into 20 to 34 years age bracket with 35.8% of them unmarried at the time of birth, while the lowest percentage of unmarried women with births belong to 20 to 34 years age bracket with 35.9% of them unmarried.
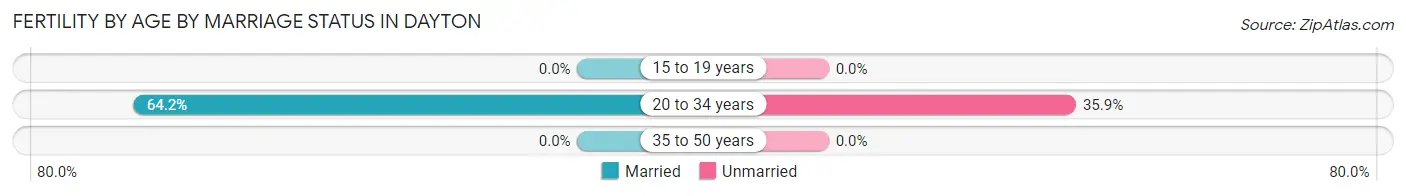
| Age Bracket | Married | Unmarried |
| 15 to 19 years | 0 (0.0%) | 0 (0.0%) |
| 20 to 34 years | 34 (64.1%) | 19 (35.8%) |
| 35 to 50 years | 0 (0.0%) | 0 (0.0%) |
| Total | 34 (64.1%) | 19 (35.8%) |
Fertility by Education in Dayton
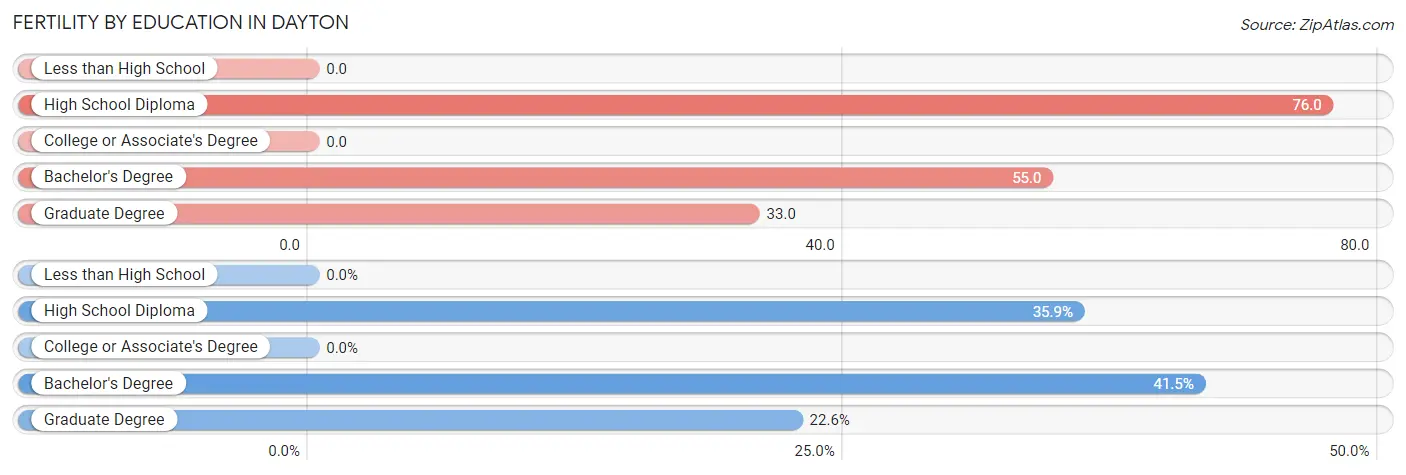
| Educational Attainment | Women with Births | Births / 1,000 Women |
| Less than High School | 0 (0.0%) | 0.0 |
| High School Diploma | 19 (35.8%) | 76.0 |
| College or Associate's Degree | 0 (0.0%) | 0.0 |
| Bachelor's Degree | 22 (41.5%) | 55.0 |
| Graduate Degree | 12 (22.6%) | 33.0 |
| Total | 53 (100.0%) | 34.0 |
Fertility by Education by Marriage Status in Dayton
35.8% of women with births in Dayton are unmarried. Women with the educational attainment of bachelor's degree are most likely to be married with 100.0% of them married at childbirth, while women with the educational attainment of high school diploma are least likely to be married with 100.0% of them unmarried at childbirth.
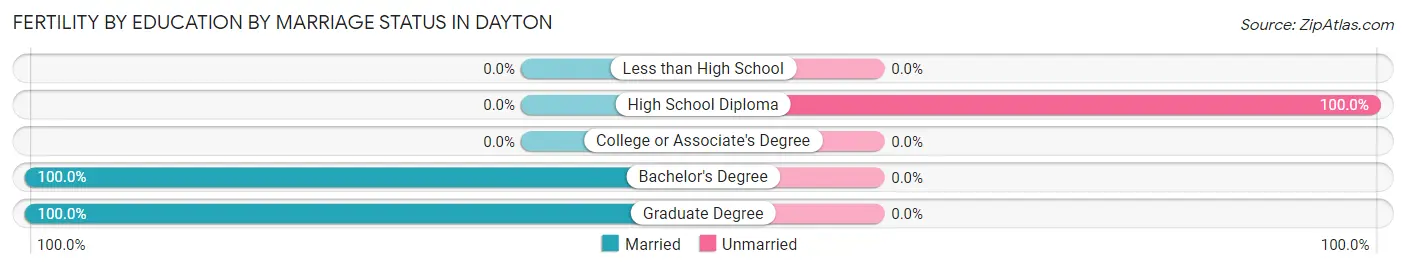
| Educational Attainment | Married | Unmarried |
| Less than High School | 0 (0.0%) | 0 (0.0%) |
| High School Diploma | 0 (0.0%) | 19 (100.0%) |
| College or Associate's Degree | 0 (0.0%) | 0 (0.0%) |
| Bachelor's Degree | 22 (100.0%) | 0 (0.0%) |
| Graduate Degree | 12 (100.0%) | 0 (0.0%) |
| Total | 34 (64.1%) | 19 (35.8%) |
Employment Characteristics in Dayton
Employment by Class of Employer in Dayton
Among the 4,358 employed individuals in Dayton, private company employees (3,196 | 73.3%), self-employed (incorporated) (290 | 6.7%), and local government employees (289 | 6.6%) make up the most common classes of employment.
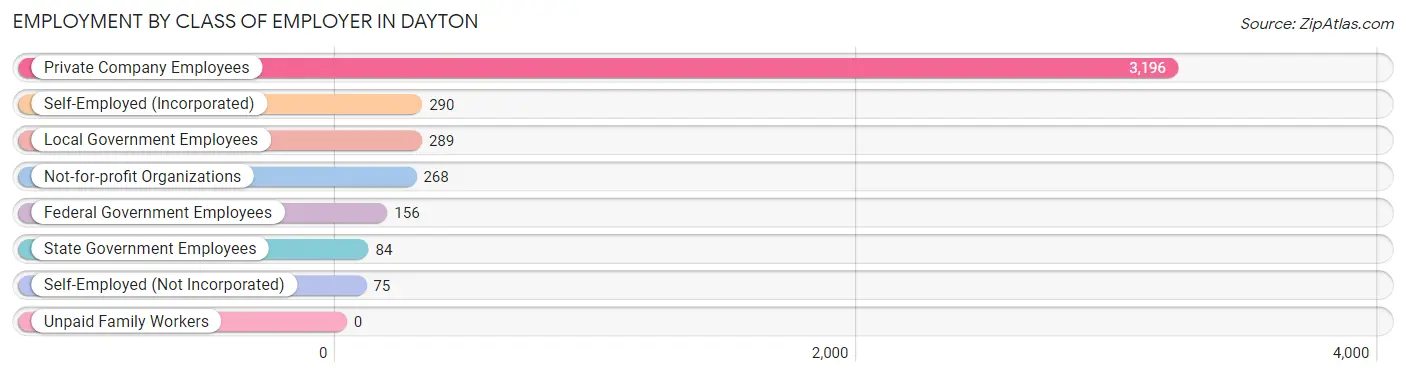
| Employer Class | # Employees | % Employees |
| Private Company Employees | 3,196 | 73.3% |
| Self-Employed (Incorporated) | 290 | 6.7% |
| Self-Employed (Not Incorporated) | 75 | 1.7% |
| Not-for-profit Organizations | 268 | 6.1% |
| Local Government Employees | 289 | 6.6% |
| State Government Employees | 84 | 1.9% |
| Federal Government Employees | 156 | 3.6% |
| Unpaid Family Workers | 0 | 0.0% |
| Total | 4,358 | 100.0% |
Employment Status by Age in Dayton
According to the labor force statistics for Dayton, out of the total population over 16 years of age (5,885), 76.0% or 4,473 individuals are in the labor force, with 2.2% or 98 of them unemployed. The age group with the highest labor force participation rate is 25 to 29 years, with 100.0% or 238 individuals in the labor force. Within the labor force, the 30 to 34 years age range has the highest percentage of unemployed individuals, with 11.2% or 53 of them being unemployed.
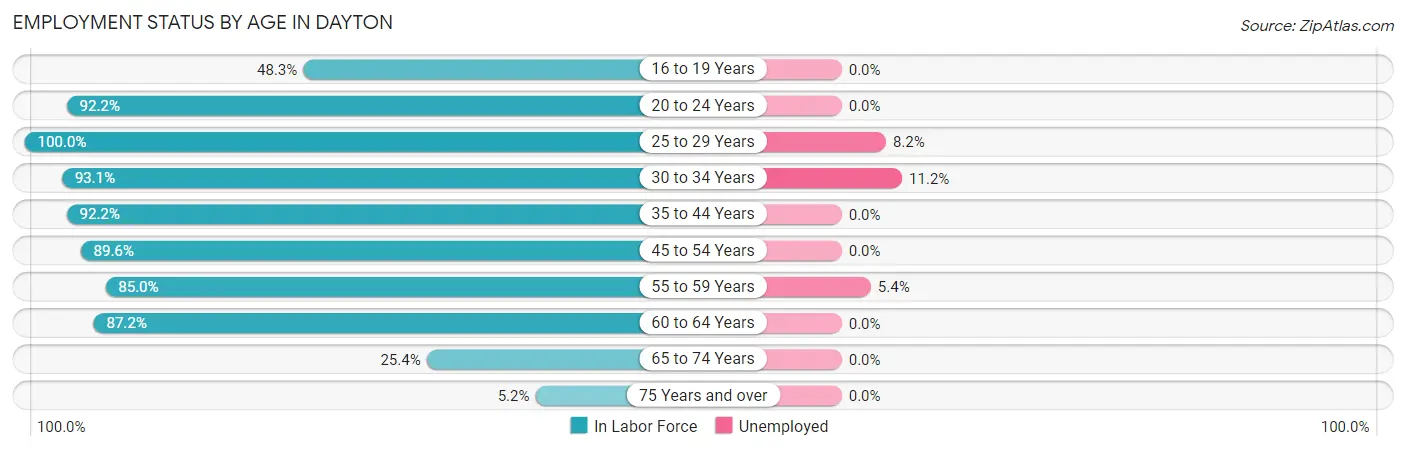
| Age Bracket | In Labor Force | Unemployed |
| 16 to 19 Years | 158 (48.3%) | 0 (0.0%) |
| 20 to 24 Years | 188 (92.2%) | 0 (0.0%) |
| 25 to 29 Years | 238 (100.0%) | 20 (8.2%) |
| 30 to 34 Years | 474 (93.1%) | 53 (11.2%) |
| 35 to 44 Years | 1,200 (92.2%) | 0 (0.0%) |
| 45 to 54 Years | 819 (89.6%) | 0 (0.0%) |
| 55 to 59 Years | 537 (85.0%) | 29 (5.4%) |
| 60 to 64 Years | 648 (87.2%) | 0 (0.0%) |
| 65 to 74 Years | 199 (25.4%) | 0 (0.0%) |
| 75 Years and over | 12 (5.2%) | 0 (0.0%) |
| Total | 4,473 (76.0%) | 98 (2.2%) |
Employment Status by Educational Attainment in Dayton
According to labor force statistics for Dayton, 90.3% of individuals (3,917) out of the total population between 25 and 64 years of age (4,338) are in the labor force, with 2.6% or 102 of them being unemployed. The group with the highest labor force participation rate are those with the educational attainment of bachelor's degree or higher, with 96.7% or 1,917 individuals in the labor force. Within the labor force, individuals with college / associate degree education have the highest percentage of unemployment, with 7.6% or 84 of them being unemployed.
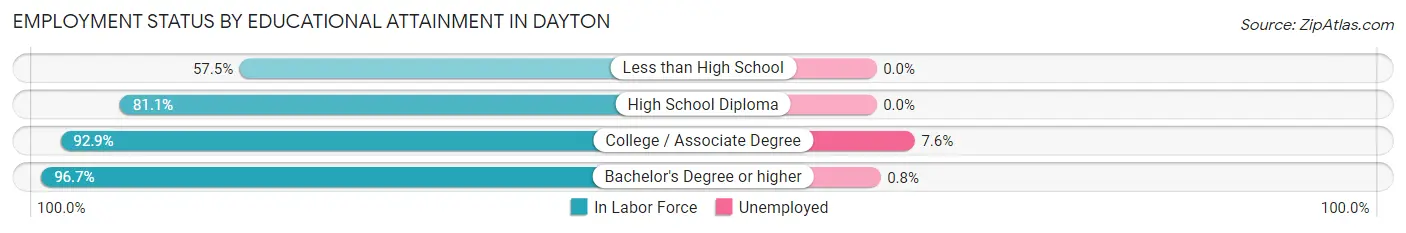
| Educational Attainment | In Labor Force | Unemployed |
| Less than High School | 123 (57.5%) | 0 (0.0%) |
| High School Diploma | 767 (81.1%) | 0 (0.0%) |
| College / Associate Degree | 1,111 (92.9%) | 91 (7.6%) |
| Bachelor's Degree or higher | 1,917 (96.7%) | 16 (0.8%) |
| Total | 3,917 (90.3%) | 113 (2.6%) |
Employment Occupations by Sex in Dayton
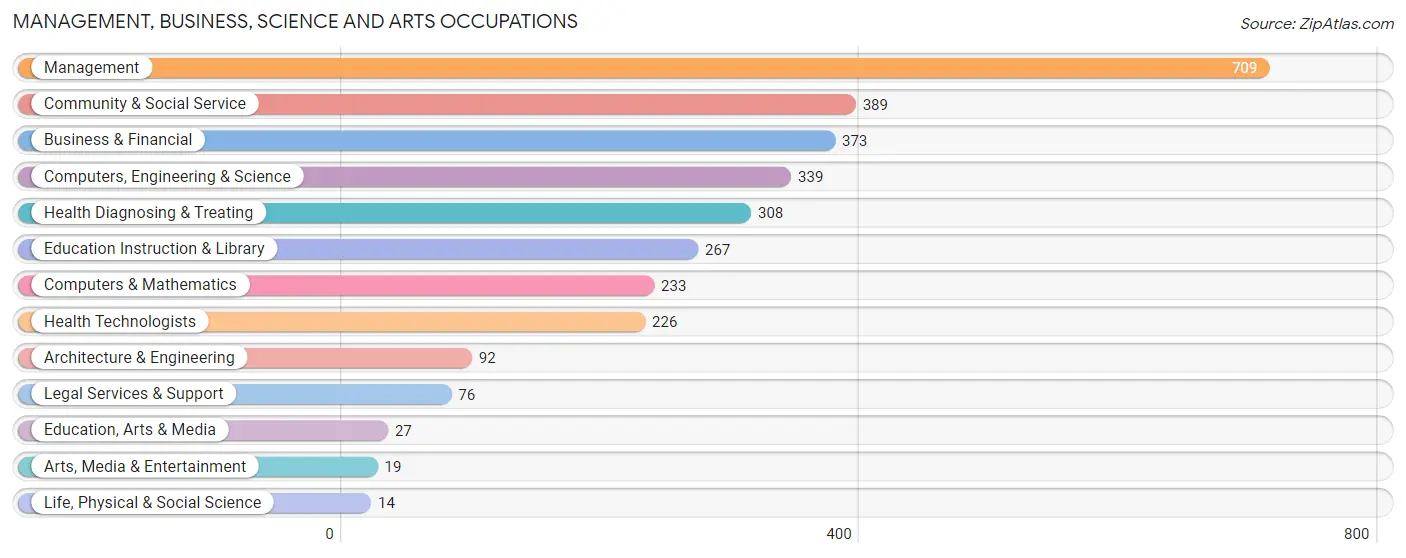
Management, Business, Science and Arts Occupations
The most common Management, Business, Science and Arts occupations in Dayton are Management (709 | 16.3%), Community & Social Service (389 | 8.9%), Business & Financial (373 | 8.6%), Computers, Engineering & Science (339 | 7.8%), and Health Diagnosing & Treating (308 | 7.1%).
Management, Business, Science and Arts Occupations by Sex
Within the Management, Business, Science and Arts occupations in Dayton, the most male-oriented occupations are Architecture & Engineering (82.6%), Computers, Engineering & Science (65.8%), and Computers & Mathematics (63.1%), while the most female-oriented occupations are Life, Physical & Social Science (100.0%), Legal Services & Support (100.0%), and Arts, Media & Entertainment (100.0%).
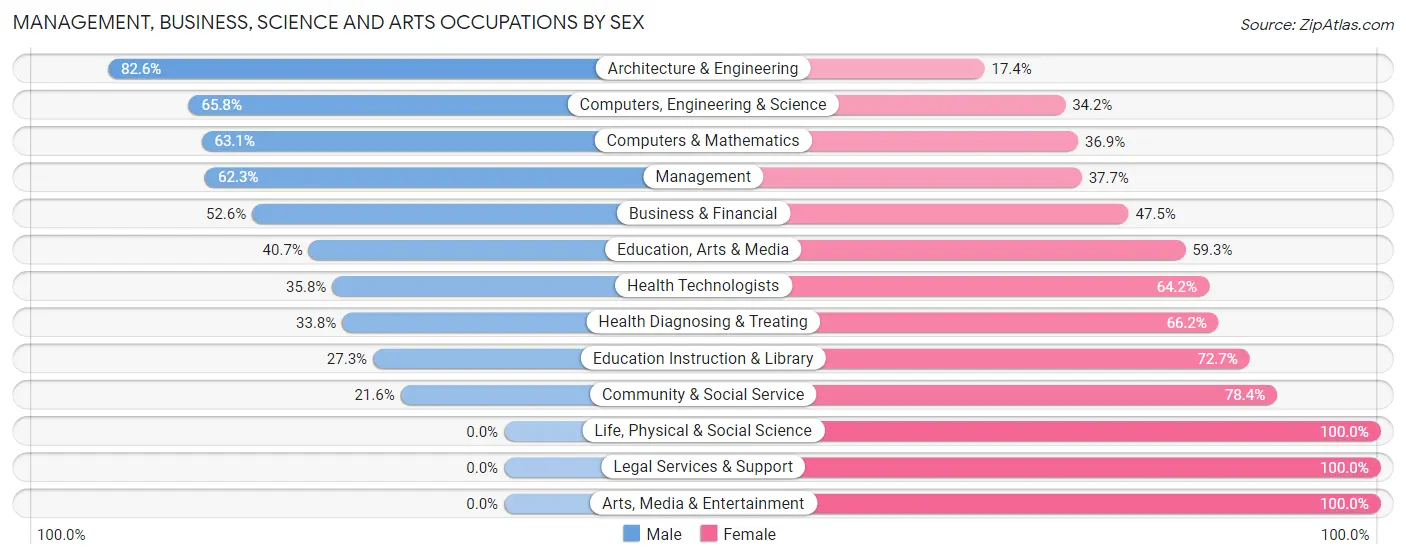
| Occupation | Male | Female |
| Management | 442 (62.3%) | 267 (37.7%) |
| Business & Financial | 196 (52.5%) | 177 (47.4%) |
| Computers, Engineering & Science | 223 (65.8%) | 116 (34.2%) |
| Computers & Mathematics | 147 (63.1%) | 86 (36.9%) |
| Architecture & Engineering | 76 (82.6%) | 16 (17.4%) |
| Life, Physical & Social Science | 0 (0.0%) | 14 (100.0%) |
| Community & Social Service | 84 (21.6%) | 305 (78.4%) |
| Education, Arts & Media | 11 (40.7%) | 16 (59.3%) |
| Legal Services & Support | 0 (0.0%) | 76 (100.0%) |
| Education Instruction & Library | 73 (27.3%) | 194 (72.7%) |
| Arts, Media & Entertainment | 0 (0.0%) | 19 (100.0%) |
| Health Diagnosing & Treating | 104 (33.8%) | 204 (66.2%) |
| Health Technologists | 81 (35.8%) | 145 (64.2%) |
| Total (Category) | 1,049 (49.5%) | 1,069 (50.5%) |
| Total (Overall) | 2,362 (54.2%) | 1,993 (45.8%) |
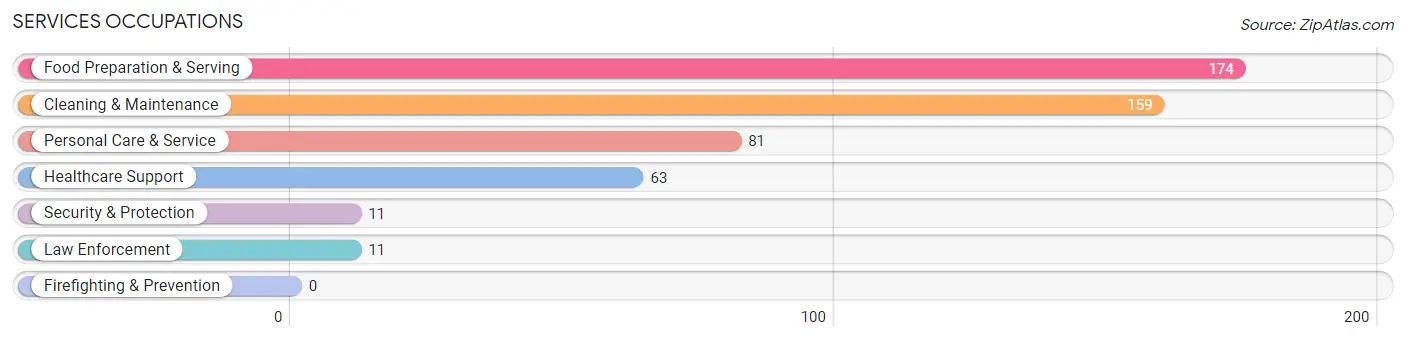
Services Occupations
The most common Services occupations in Dayton are Food Preparation & Serving (174 | 4.0%), Cleaning & Maintenance (159 | 3.6%), Personal Care & Service (81 | 1.9%), Healthcare Support (63 | 1.5%), and Security & Protection (11 | 0.3%).
Services Occupations by Sex
Within the Services occupations in Dayton, the most male-oriented occupations are Security & Protection (100.0%), Law Enforcement (100.0%), and Cleaning & Maintenance (64.8%), while the most female-oriented occupations are Personal Care & Service (100.0%), Food Preparation & Serving (83.9%), and Healthcare Support (71.4%).
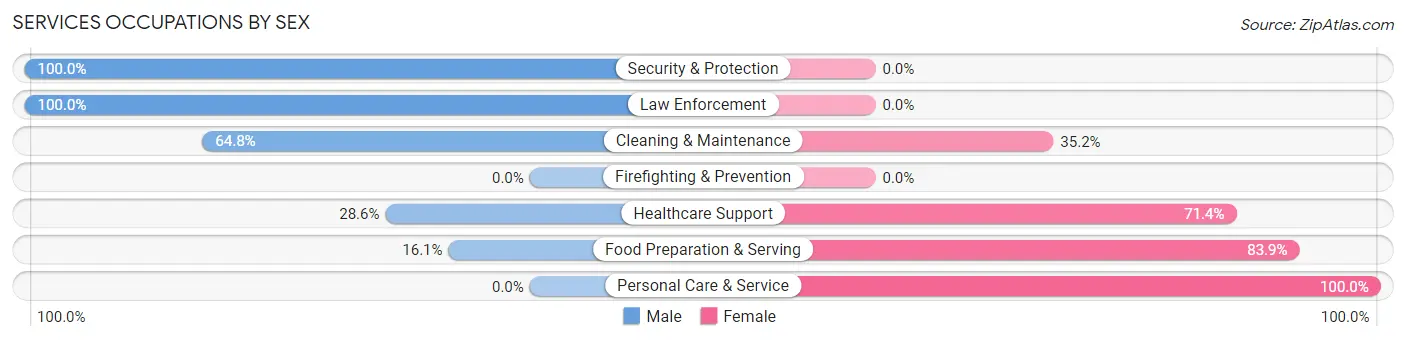
| Occupation | Male | Female |
| Healthcare Support | 18 (28.6%) | 45 (71.4%) |
| Security & Protection | 11 (100.0%) | 0 (0.0%) |
| Firefighting & Prevention | 0 (0.0%) | 0 (0.0%) |
| Law Enforcement | 11 (100.0%) | 0 (0.0%) |
| Food Preparation & Serving | 28 (16.1%) | 146 (83.9%) |
| Cleaning & Maintenance | 103 (64.8%) | 56 (35.2%) |
| Personal Care & Service | 0 (0.0%) | 81 (100.0%) |
| Total (Category) | 160 (32.8%) | 328 (67.2%) |
| Total (Overall) | 2,362 (54.2%) | 1,993 (45.8%) |
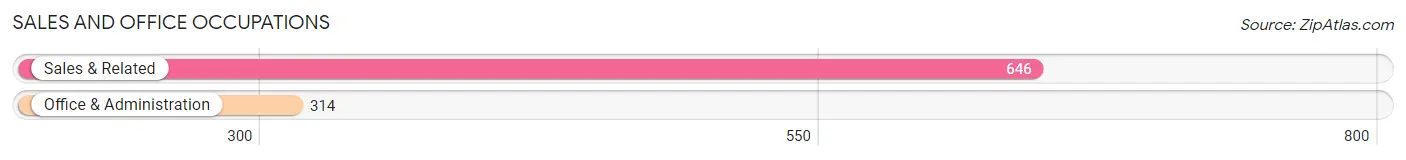
Sales and Office Occupations
The most common Sales and Office occupations in Dayton are Sales & Related (646 | 14.8%), and Office & Administration (314 | 7.2%).
Sales and Office Occupations by Sex
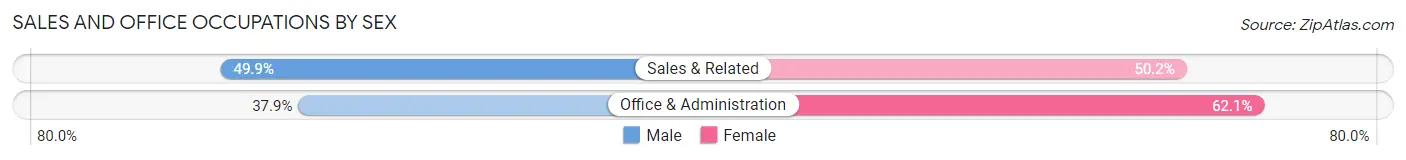
| Occupation | Male | Female |
| Sales & Related | 322 (49.8%) | 324 (50.1%) |
| Office & Administration | 119 (37.9%) | 195 (62.1%) |
| Total (Category) | 441 (45.9%) | 519 (54.1%) |
| Total (Overall) | 2,362 (54.2%) | 1,993 (45.8%) |
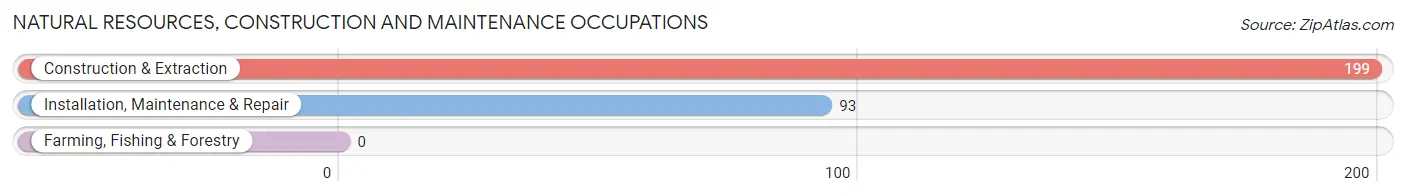
Natural Resources, Construction and Maintenance Occupations
The most common Natural Resources, Construction and Maintenance occupations in Dayton are Construction & Extraction (199 | 4.6%), and Installation, Maintenance & Repair (93 | 2.1%).
Natural Resources, Construction and Maintenance Occupations by Sex
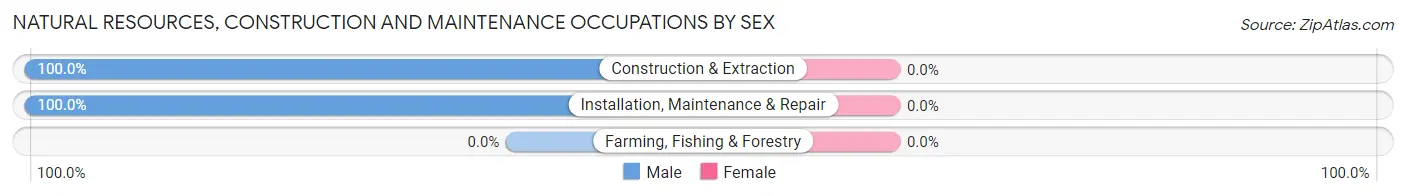
| Occupation | Male | Female |
| Farming, Fishing & Forestry | 0 (0.0%) | 0 (0.0%) |
| Construction & Extraction | 199 (100.0%) | 0 (0.0%) |
| Installation, Maintenance & Repair | 93 (100.0%) | 0 (0.0%) |
| Total (Category) | 292 (100.0%) | 0 (0.0%) |
| Total (Overall) | 2,362 (54.2%) | 1,993 (45.8%) |
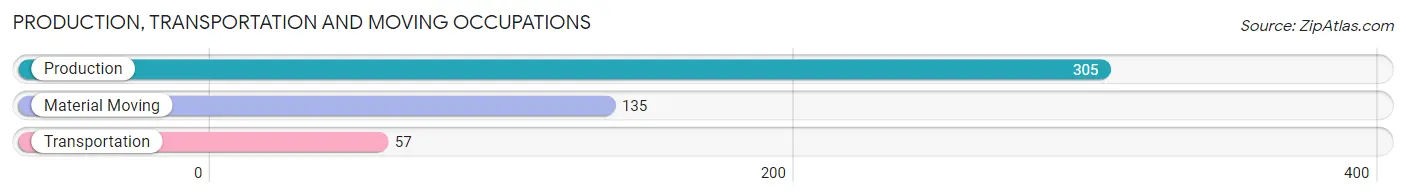
Production, Transportation and Moving Occupations
The most common Production, Transportation and Moving occupations in Dayton are Production (305 | 7.0%), Material Moving (135 | 3.1%), and Transportation (57 | 1.3%).
Production, Transportation and Moving Occupations by Sex
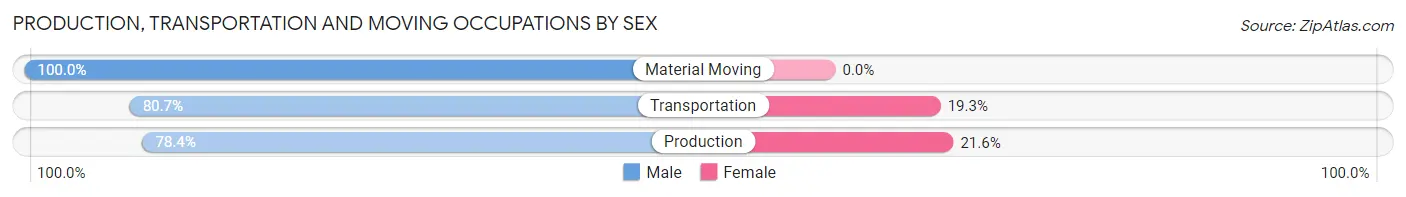
| Occupation | Male | Female |
| Production | 239 (78.4%) | 66 (21.6%) |
| Transportation | 46 (80.7%) | 11 (19.3%) |
| Material Moving | 135 (100.0%) | 0 (0.0%) |
| Total (Category) | 420 (84.5%) | 77 (15.5%) |
| Total (Overall) | 2,362 (54.2%) | 1,993 (45.8%) |
Employment Industries by Sex in Dayton
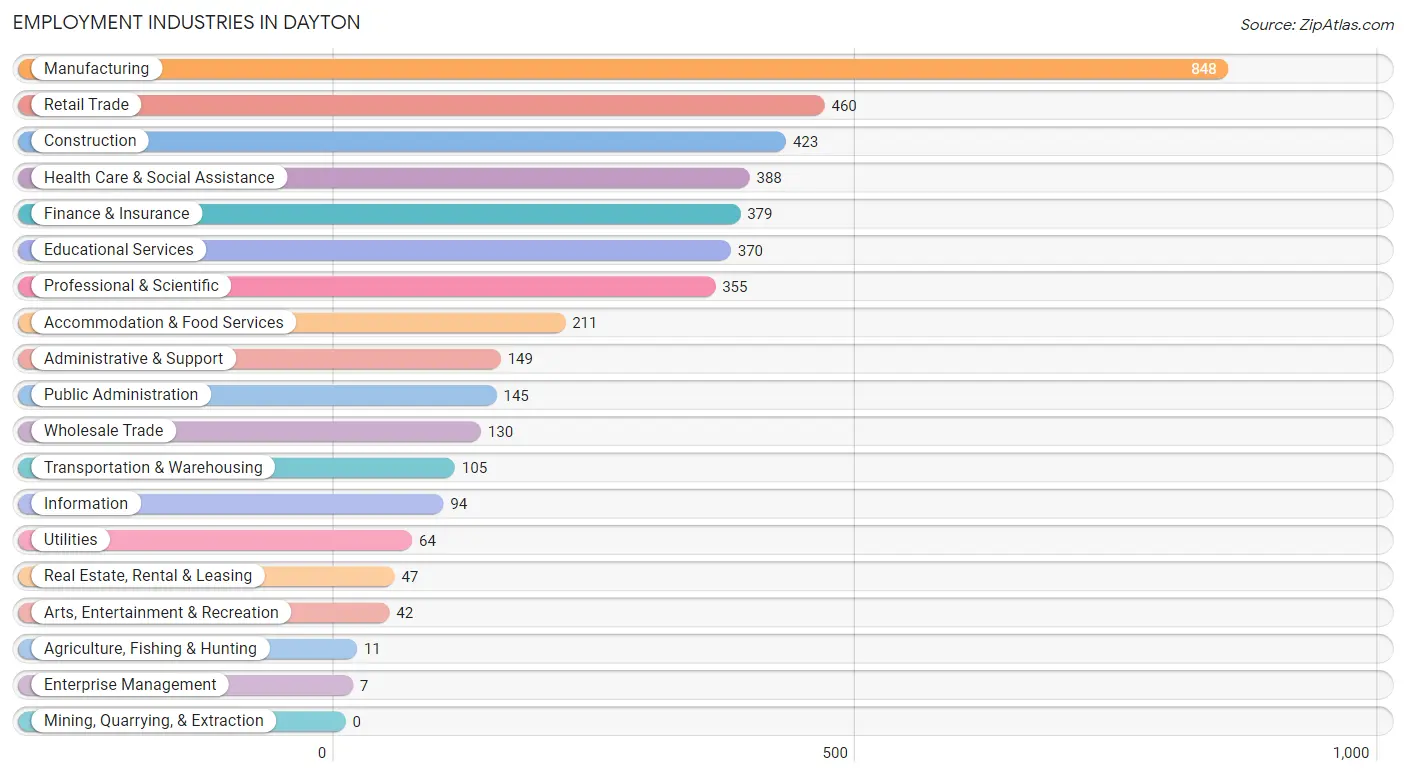
Employment Industries in Dayton
The major employment industries in Dayton include Manufacturing (848 | 19.5%), Retail Trade (460 | 10.6%), Construction (423 | 9.7%), Health Care & Social Assistance (388 | 8.9%), and Finance & Insurance (379 | 8.7%).
Employment Industries by Sex in Dayton
The Dayton industries that see more men than women are Utilities (100.0%), Information (100.0%), and Enterprise Management (100.0%), whereas the industries that tend to have a higher number of women are Agriculture, Fishing & Hunting (100.0%), Arts, Entertainment & Recreation (100.0%), and Accommodation & Food Services (86.7%).
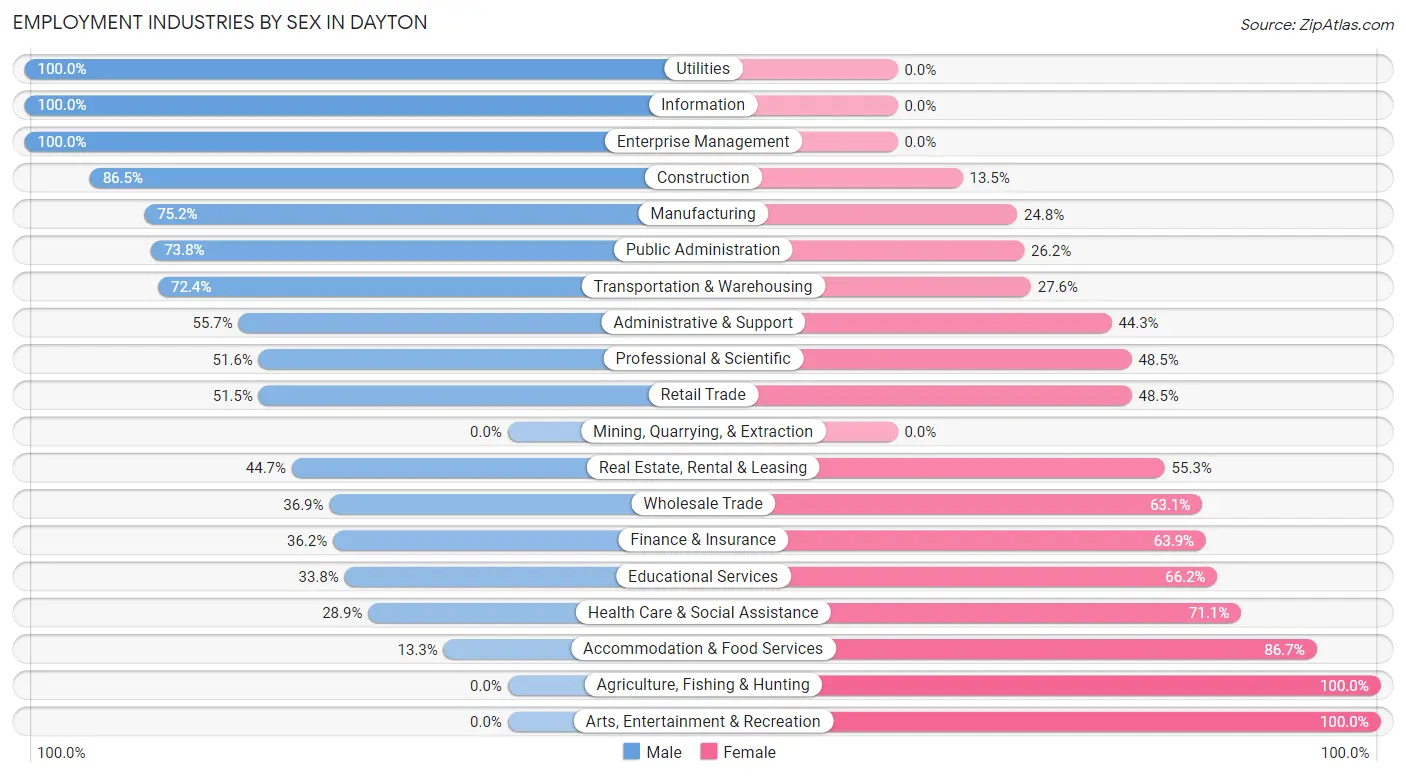
| Industry | Male | Female |
| Agriculture, Fishing & Hunting | 0 (0.0%) | 11 (100.0%) |
| Mining, Quarrying, & Extraction | 0 (0.0%) | 0 (0.0%) |
| Construction | 366 (86.5%) | 57 (13.5%) |
| Manufacturing | 638 (75.2%) | 210 (24.8%) |
| Wholesale Trade | 48 (36.9%) | 82 (63.1%) |
| Retail Trade | 237 (51.5%) | 223 (48.5%) |
| Transportation & Warehousing | 76 (72.4%) | 29 (27.6%) |
| Utilities | 64 (100.0%) | 0 (0.0%) |
| Information | 94 (100.0%) | 0 (0.0%) |
| Finance & Insurance | 137 (36.1%) | 242 (63.8%) |
| Real Estate, Rental & Leasing | 21 (44.7%) | 26 (55.3%) |
| Professional & Scientific | 183 (51.5%) | 172 (48.4%) |
| Enterprise Management | 7 (100.0%) | 0 (0.0%) |
| Administrative & Support | 83 (55.7%) | 66 (44.3%) |
| Educational Services | 125 (33.8%) | 245 (66.2%) |
| Health Care & Social Assistance | 112 (28.9%) | 276 (71.1%) |
| Arts, Entertainment & Recreation | 0 (0.0%) | 42 (100.0%) |
| Accommodation & Food Services | 28 (13.3%) | 183 (86.7%) |
| Public Administration | 107 (73.8%) | 38 (26.2%) |
| Total | 2,362 (54.2%) | 1,993 (45.8%) |
Education in Dayton
School Enrollment in Dayton
The most common levels of schooling among the 2,082 students in Dayton are middle school (583 | 28.0%), elementary school (572 | 27.5%), and high school (470 | 22.6%).
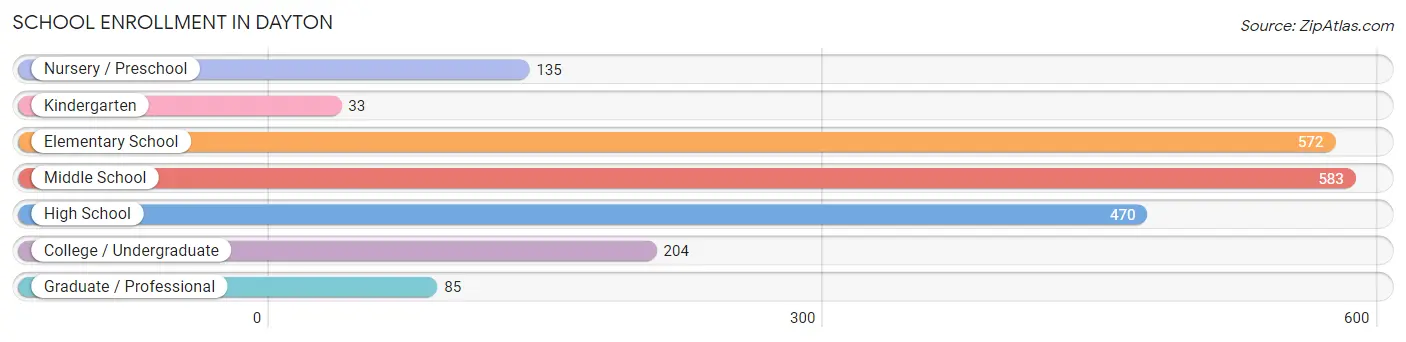
| School Level | # Students | % Students |
| Nursery / Preschool | 135 | 6.5% |
| Kindergarten | 33 | 1.6% |
| Elementary School | 572 | 27.5% |
| Middle School | 583 | 28.0% |
| High School | 470 | 22.6% |
| College / Undergraduate | 204 | 9.8% |
| Graduate / Professional | 85 | 4.1% |
| Total | 2,082 | 100.0% |
School Enrollment by Age by Funding Source in Dayton
Out of a total of 2,082 students who are enrolled in schools in Dayton, 277 (13.3%) attend a private institution, while the remaining 1,805 (86.7%) are enrolled in public schools. The age group of 20 to 24 year olds has the highest likelihood of being enrolled in private schools, with 38 (50.7% in the age bracket) enrolled. Conversely, the age group of 18 to 19 year olds has the lowest likelihood of being enrolled in a private school, with 56 (100.0% in the age bracket) attending a public institution.
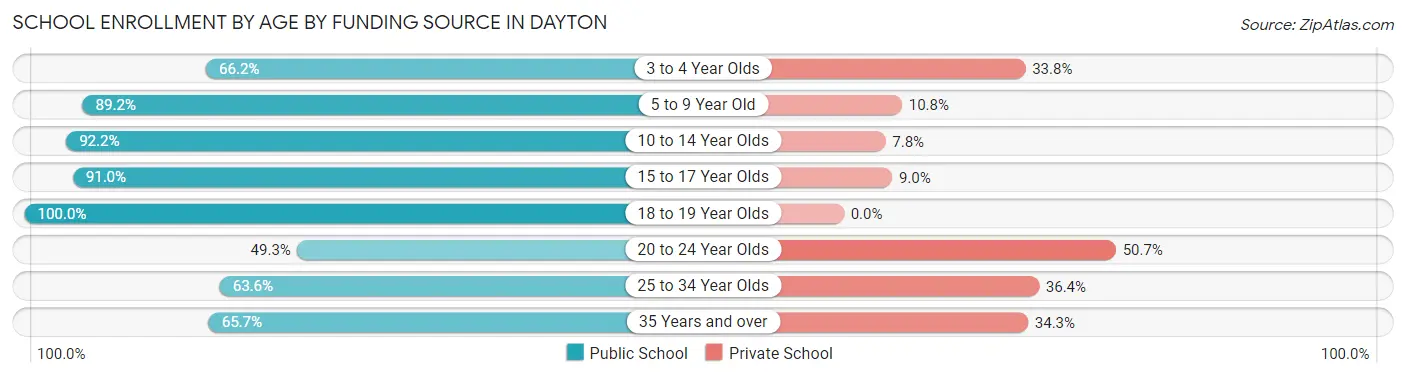
| Age Bracket | Public School | Private School |
| 3 to 4 Year Olds | 45 (66.2%) | 23 (33.8%) |
| 5 to 9 Year Old | 552 (89.2%) | 67 (10.8%) |
| 10 to 14 Year Olds | 642 (92.2%) | 54 (7.8%) |
| 15 to 17 Year Olds | 364 (91.0%) | 36 (9.0%) |
| 18 to 19 Year Olds | 56 (100.0%) | 0 (0.0%) |
| 20 to 24 Year Olds | 37 (49.3%) | 38 (50.7%) |
| 25 to 34 Year Olds | 42 (63.6%) | 24 (36.4%) |
| 35 Years and over | 67 (65.7%) | 35 (34.3%) |
| Total | 1,805 (86.7%) | 277 (13.3%) |
Educational Attainment by Field of Study in Dayton
Business (683 | 27.5%), education (383 | 15.4%), engineering (290 | 11.7%), science & technology (248 | 10.0%), and bio, nature & agricultural (152 | 6.1%) are the most common fields of study among 2,481 individuals in Dayton who have obtained a bachelor's degree or higher.
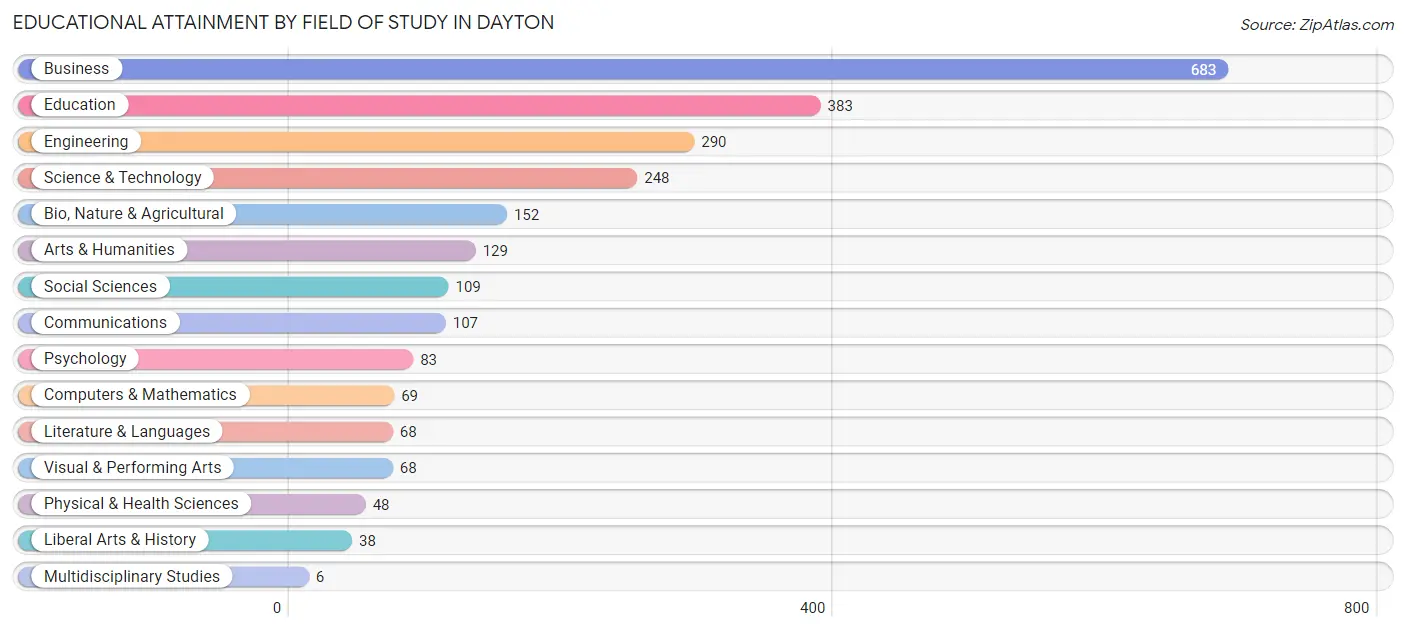
| Field of Study | # Graduates | % Graduates |
| Computers & Mathematics | 69 | 2.8% |
| Bio, Nature & Agricultural | 152 | 6.1% |
| Physical & Health Sciences | 48 | 1.9% |
| Psychology | 83 | 3.4% |
| Social Sciences | 109 | 4.4% |
| Engineering | 290 | 11.7% |
| Multidisciplinary Studies | 6 | 0.2% |
| Science & Technology | 248 | 10.0% |
| Business | 683 | 27.5% |
| Education | 383 | 15.4% |
| Literature & Languages | 68 | 2.7% |
| Liberal Arts & History | 38 | 1.5% |
| Visual & Performing Arts | 68 | 2.7% |
| Communications | 107 | 4.3% |
| Arts & Humanities | 129 | 5.2% |
| Total | 2,481 | 100.0% |
Transportation & Commute in Dayton
Vehicle Availability by Sex in Dayton
The most prevalent vehicle ownership categories in Dayton are males with 2 vehicles (1,225, accounting for 51.4%) and females with 2 vehicles (1,068, making up 62.0%).
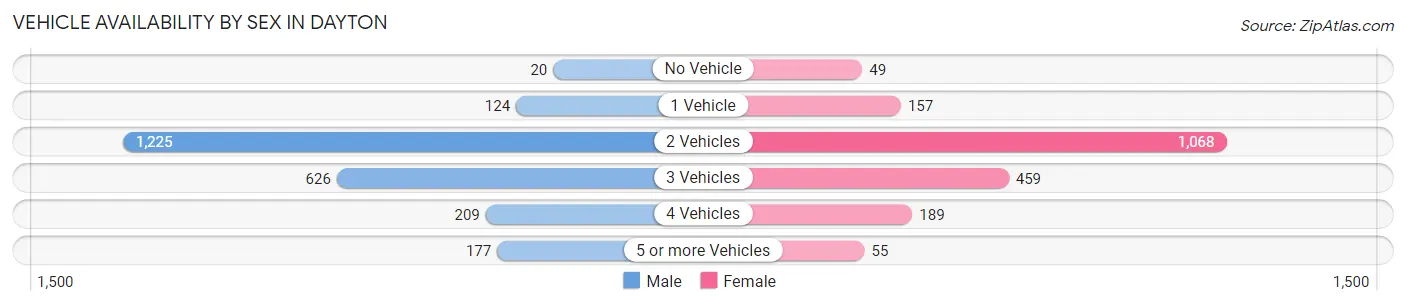
| Vehicles Available | Male | Female |
| No Vehicle | 20 (0.8%) | 49 (2.5%) |
| 1 Vehicle | 124 (5.2%) | 157 (7.9%) |
| 2 Vehicles | 1,225 (51.4%) | 1,068 (54.0%) |
| 3 Vehicles | 626 (26.3%) | 459 (23.2%) |
| 4 Vehicles | 209 (8.8%) | 189 (9.6%) |
| 5 or more Vehicles | 177 (7.4%) | 55 (2.8%) |
| Total | 2,381 (100.0%) | 1,977 (100.0%) |
Commute Time in Dayton
The most frequently occuring commute durations in Dayton are 15 to 19 minutes (823 commuters, 23.7%), 30 to 34 minutes (588 commuters, 16.9%), and 25 to 29 minutes (412 commuters, 11.9%).
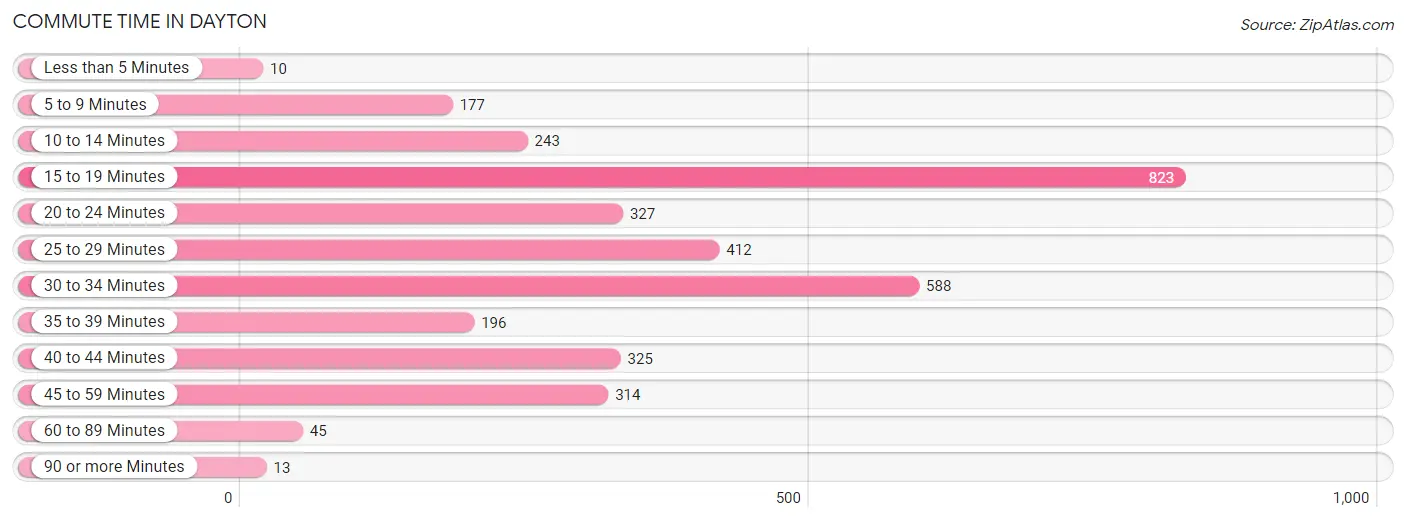
| Commute Time | # Commuters | % Commuters |
| Less than 5 Minutes | 10 | 0.3% |
| 5 to 9 Minutes | 177 | 5.1% |
| 10 to 14 Minutes | 243 | 7.0% |
| 15 to 19 Minutes | 823 | 23.7% |
| 20 to 24 Minutes | 327 | 9.4% |
| 25 to 29 Minutes | 412 | 11.9% |
| 30 to 34 Minutes | 588 | 16.9% |
| 35 to 39 Minutes | 196 | 5.6% |
| 40 to 44 Minutes | 325 | 9.4% |
| 45 to 59 Minutes | 314 | 9.0% |
| 60 to 89 Minutes | 45 | 1.3% |
| 90 or more Minutes | 13 | 0.4% |
Commute Time by Sex in Dayton
The most common commute times in Dayton are 15 to 19 minutes (522 commuters, 27.7%) for males and 15 to 19 minutes (301 commuters, 19.0%) for females.
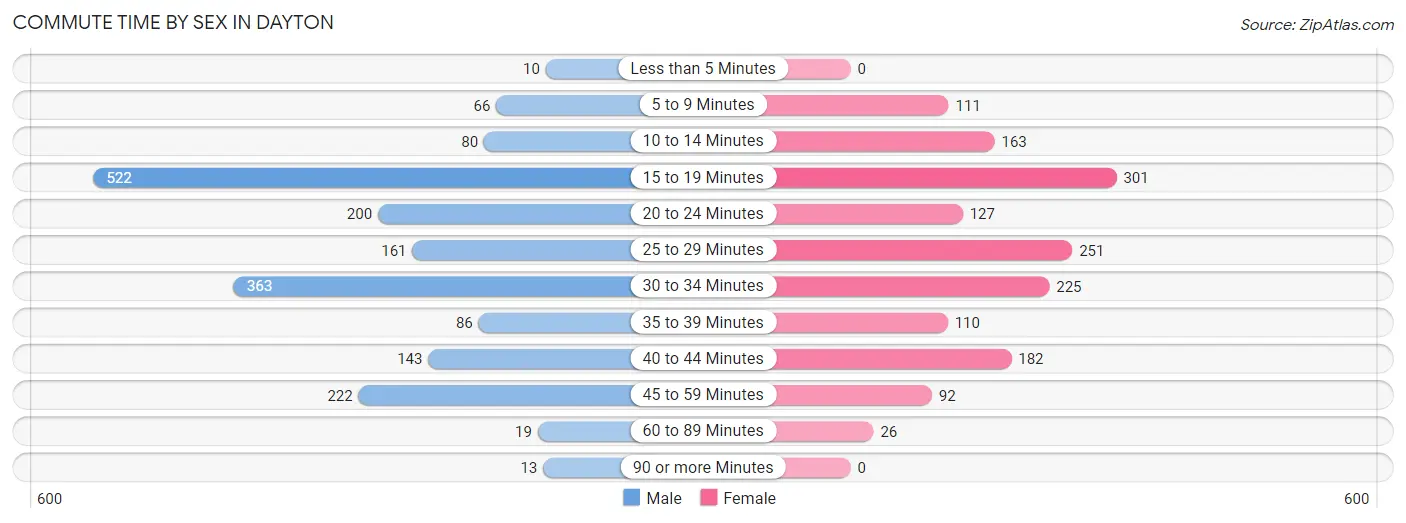
| Commute Time | Male | Female |
| Less than 5 Minutes | 10 (0.5%) | 0 (0.0%) |
| 5 to 9 Minutes | 66 (3.5%) | 111 (7.0%) |
| 10 to 14 Minutes | 80 (4.2%) | 163 (10.3%) |
| 15 to 19 Minutes | 522 (27.7%) | 301 (19.0%) |
| 20 to 24 Minutes | 200 (10.6%) | 127 (8.0%) |
| 25 to 29 Minutes | 161 (8.5%) | 251 (15.8%) |
| 30 to 34 Minutes | 363 (19.3%) | 225 (14.2%) |
| 35 to 39 Minutes | 86 (4.6%) | 110 (6.9%) |
| 40 to 44 Minutes | 143 (7.6%) | 182 (11.5%) |
| 45 to 59 Minutes | 222 (11.8%) | 92 (5.8%) |
| 60 to 89 Minutes | 19 (1.0%) | 26 (1.6%) |
| 90 or more Minutes | 13 (0.7%) | 0 (0.0%) |
Time of Departure to Work by Sex in Dayton
The most frequent times of departure to work in Dayton are 7:00 AM to 7:29 AM (354, 18.8%) for males and 7:00 AM to 7:29 AM (315, 19.8%) for females.
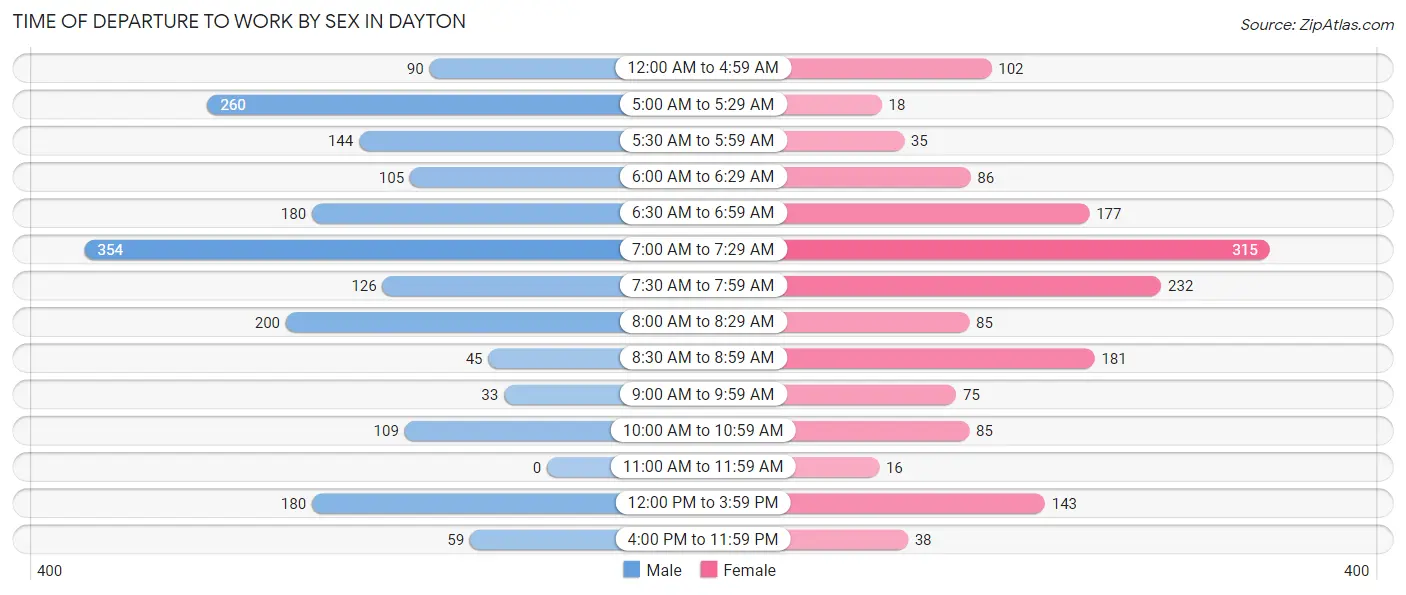
| Time of Departure | Male | Female |
| 12:00 AM to 4:59 AM | 90 (4.8%) | 102 (6.4%) |
| 5:00 AM to 5:29 AM | 260 (13.8%) | 18 (1.1%) |
| 5:30 AM to 5:59 AM | 144 (7.6%) | 35 (2.2%) |
| 6:00 AM to 6:29 AM | 105 (5.6%) | 86 (5.4%) |
| 6:30 AM to 6:59 AM | 180 (9.6%) | 177 (11.2%) |
| 7:00 AM to 7:29 AM | 354 (18.8%) | 315 (19.8%) |
| 7:30 AM to 7:59 AM | 126 (6.7%) | 232 (14.6%) |
| 8:00 AM to 8:29 AM | 200 (10.6%) | 85 (5.3%) |
| 8:30 AM to 8:59 AM | 45 (2.4%) | 181 (11.4%) |
| 9:00 AM to 9:59 AM | 33 (1.8%) | 75 (4.7%) |
| 10:00 AM to 10:59 AM | 109 (5.8%) | 85 (5.3%) |
| 11:00 AM to 11:59 AM | 0 (0.0%) | 16 (1.0%) |
| 12:00 PM to 3:59 PM | 180 (9.6%) | 143 (9.0%) |
| 4:00 PM to 11:59 PM | 59 (3.1%) | 38 (2.4%) |
| Total | 1,885 (100.0%) | 1,588 (100.0%) |
Housing Occupancy in Dayton
Occupancy by Ownership in Dayton
Of the total 2,744 dwellings in Dayton, owner-occupied units account for 2,602 (94.8%), while renter-occupied units make up 142 (5.2%).
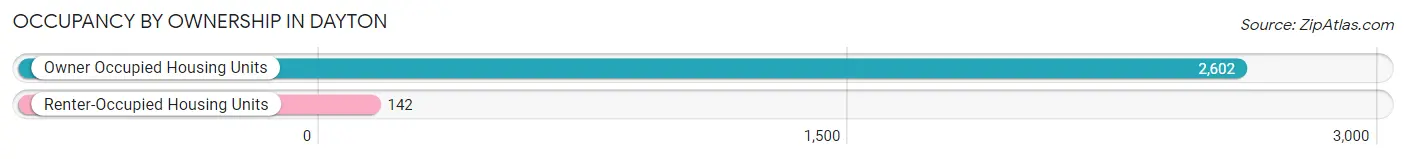
| Occupancy | # Housing Units | % Housing Units |
| Owner Occupied Housing Units | 2,602 | 94.8% |
| Renter-Occupied Housing Units | 142 | 5.2% |
| Total Occupied Housing Units | 2,744 | 100.0% |
Occupancy by Household Size in Dayton
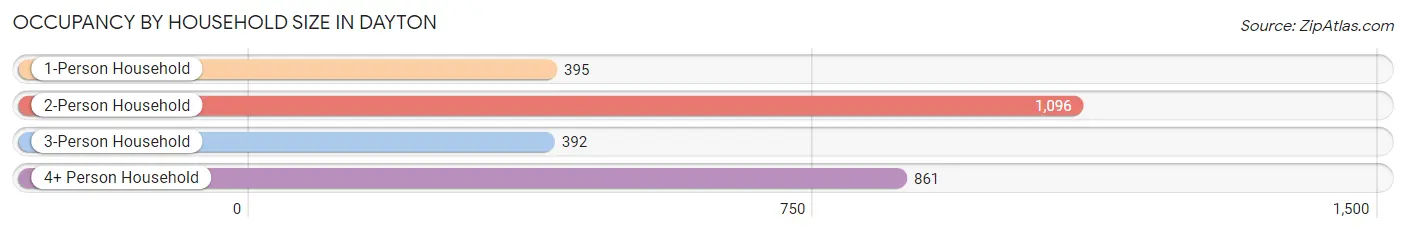
| Household Size | # Housing Units | % Housing Units |
| 1-Person Household | 395 | 14.4% |
| 2-Person Household | 1,096 | 39.9% |
| 3-Person Household | 392 | 14.3% |
| 4+ Person Household | 861 | 31.4% |
| Total Housing Units | 2,744 | 100.0% |
Occupancy by Ownership by Household Size in Dayton
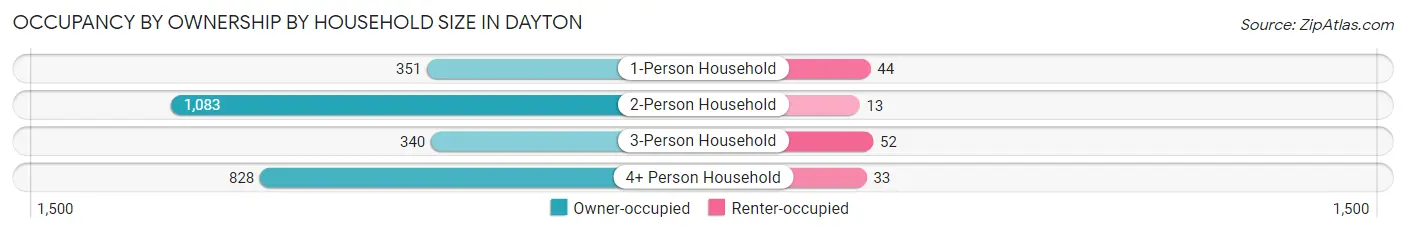
| Household Size | Owner-occupied | Renter-occupied |
| 1-Person Household | 351 (88.9%) | 44 (11.1%) |
| 2-Person Household | 1,083 (98.8%) | 13 (1.2%) |
| 3-Person Household | 340 (86.7%) | 52 (13.3%) |
| 4+ Person Household | 828 (96.2%) | 33 (3.8%) |
| Total Housing Units | 2,602 (94.8%) | 142 (5.2%) |
Occupancy by Educational Attainment in Dayton
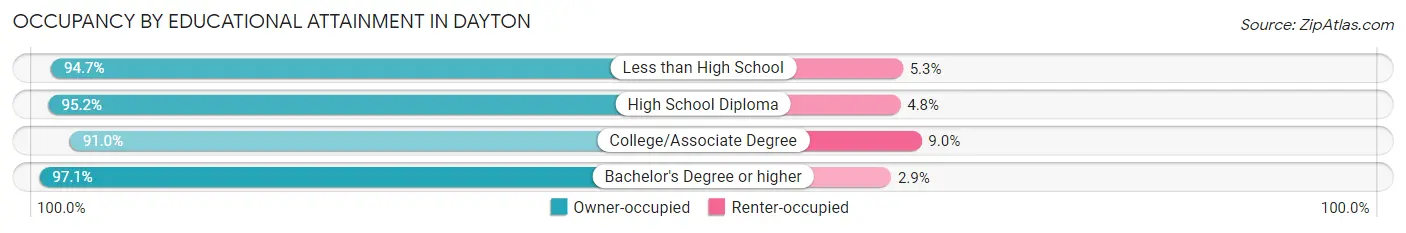
| Household Size | Owner-occupied | Renter-occupied |
| Less than High School | 180 (94.7%) | 10 (5.3%) |
| High School Diploma | 438 (95.2%) | 22 (4.8%) |
| College/Associate Degree | 731 (91.0%) | 72 (9.0%) |
| Bachelor's Degree or higher | 1,253 (97.1%) | 38 (2.9%) |
Occupancy by Age of Householder in Dayton
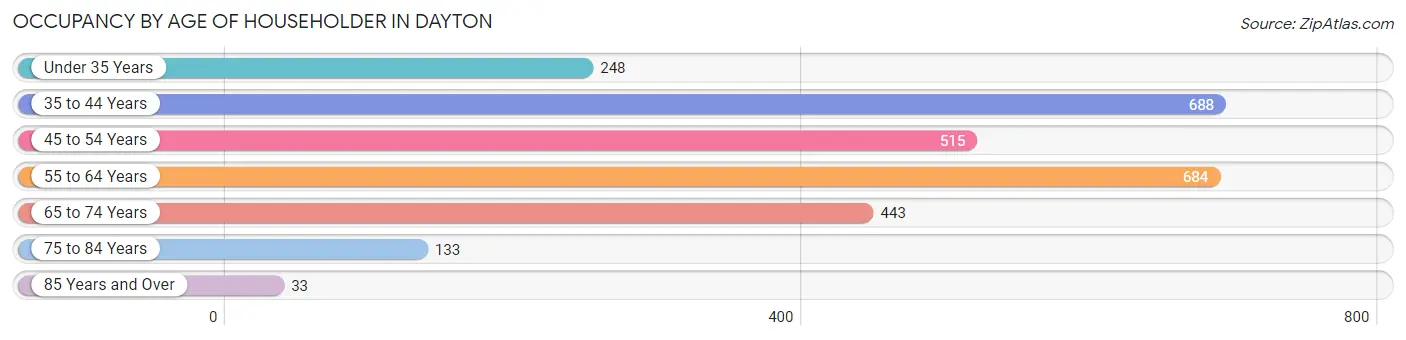
| Age Bracket | # Households | % Households |
| Under 35 Years | 248 | 9.0% |
| 35 to 44 Years | 688 | 25.1% |
| 45 to 54 Years | 515 | 18.8% |
| 55 to 64 Years | 684 | 24.9% |
| 65 to 74 Years | 443 | 16.1% |
| 75 to 84 Years | 133 | 4.9% |
| 85 Years and Over | 33 | 1.2% |
| Total | 2,744 | 100.0% |
Housing Finances in Dayton
Median Income by Occupancy in Dayton
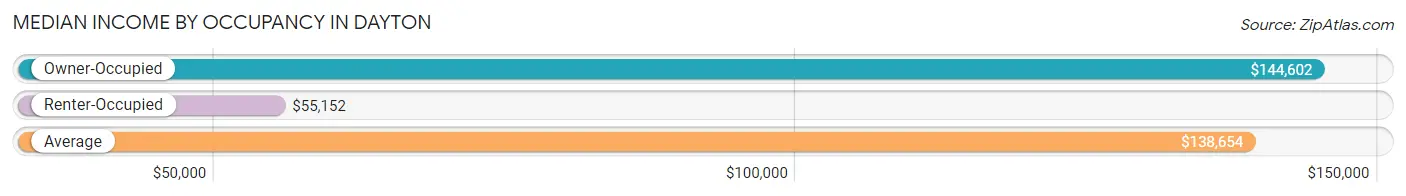
| Occupancy Type | # Households | Median Income |
| Owner-Occupied | 2,602 (94.8%) | $144,602 |
| Renter-Occupied | 142 (5.2%) | $55,152 |
| Average | 2,744 (100.0%) | $138,654 |
Occupancy by Householder Income Bracket in Dayton
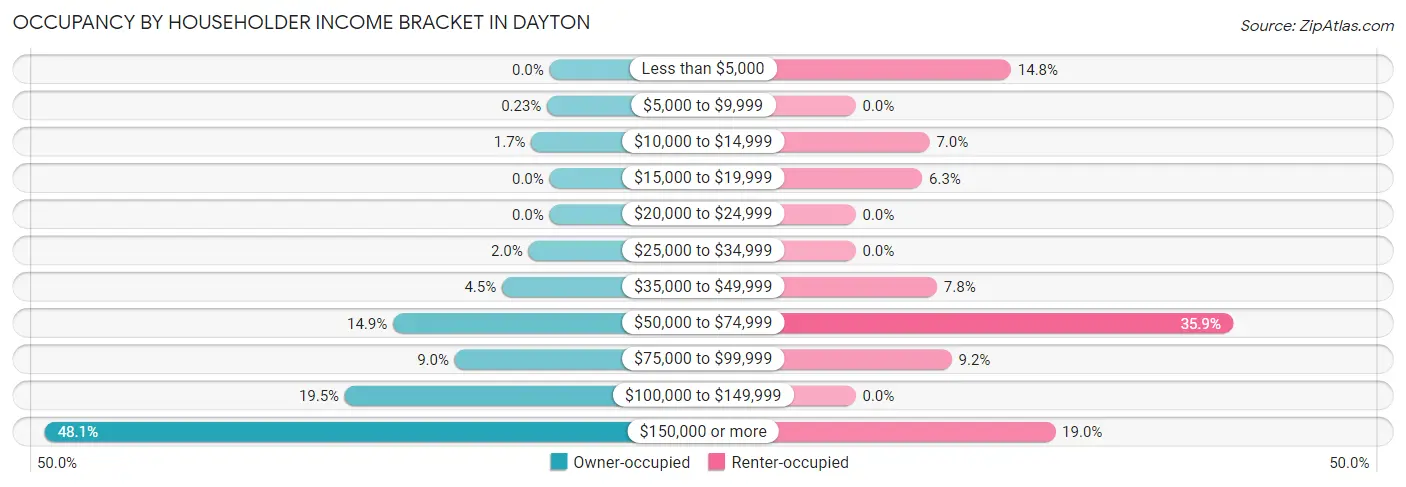
| Income Bracket | Owner-occupied | Renter-occupied |
| Less than $5,000 | 0 (0.0%) | 21 (14.8%) |
| $5,000 to $9,999 | 6 (0.2%) | 0 (0.0%) |
| $10,000 to $14,999 | 45 (1.7%) | 10 (7.0%) |
| $15,000 to $19,999 | 0 (0.0%) | 9 (6.3%) |
| $20,000 to $24,999 | 0 (0.0%) | 0 (0.0%) |
| $25,000 to $34,999 | 52 (2.0%) | 0 (0.0%) |
| $35,000 to $49,999 | 118 (4.5%) | 11 (7.7%) |
| $50,000 to $74,999 | 388 (14.9%) | 51 (35.9%) |
| $75,000 to $99,999 | 235 (9.0%) | 13 (9.1%) |
| $100,000 to $149,999 | 507 (19.5%) | 0 (0.0%) |
| $150,000 or more | 1,251 (48.1%) | 27 (19.0%) |
| Total | 2,602 (100.0%) | 142 (100.0%) |
Monthly Housing Cost Tiers in Dayton
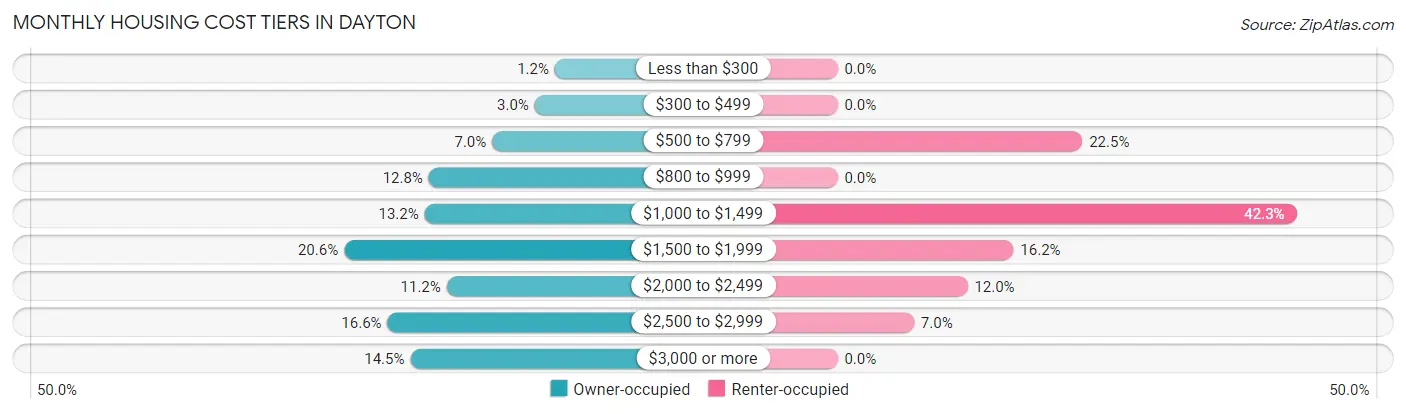
| Monthly Cost | Owner-occupied | Renter-occupied |
| Less than $300 | 31 (1.2%) | 0 (0.0%) |
| $300 to $499 | 79 (3.0%) | 0 (0.0%) |
| $500 to $799 | 181 (7.0%) | 32 (22.5%) |
| $800 to $999 | 333 (12.8%) | 0 (0.0%) |
| $1,000 to $1,499 | 343 (13.2%) | 60 (42.2%) |
| $1,500 to $1,999 | 536 (20.6%) | 23 (16.2%) |
| $2,000 to $2,499 | 290 (11.2%) | 17 (12.0%) |
| $2,500 to $2,999 | 432 (16.6%) | 10 (7.0%) |
| $3,000 or more | 377 (14.5%) | 0 (0.0%) |
| Total | 2,602 (100.0%) | 142 (100.0%) |
Physical Housing Characteristics in Dayton
Housing Structures in Dayton
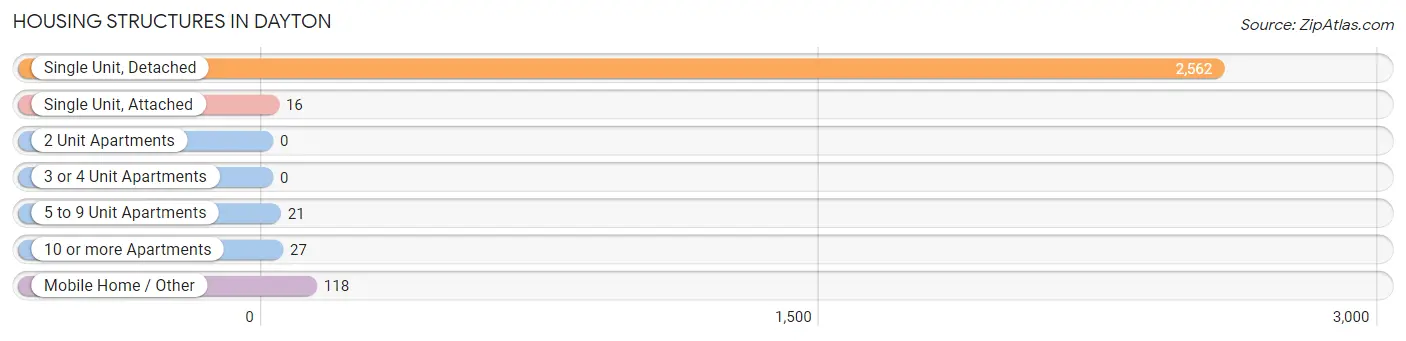
| Structure Type | # Housing Units | % Housing Units |
| Single Unit, Detached | 2,562 | 93.4% |
| Single Unit, Attached | 16 | 0.6% |
| 2 Unit Apartments | 0 | 0.0% |
| 3 or 4 Unit Apartments | 0 | 0.0% |
| 5 to 9 Unit Apartments | 21 | 0.8% |
| 10 or more Apartments | 27 | 1.0% |
| Mobile Home / Other | 118 | 4.3% |
| Total | 2,744 | 100.0% |
Housing Structures by Occupancy in Dayton
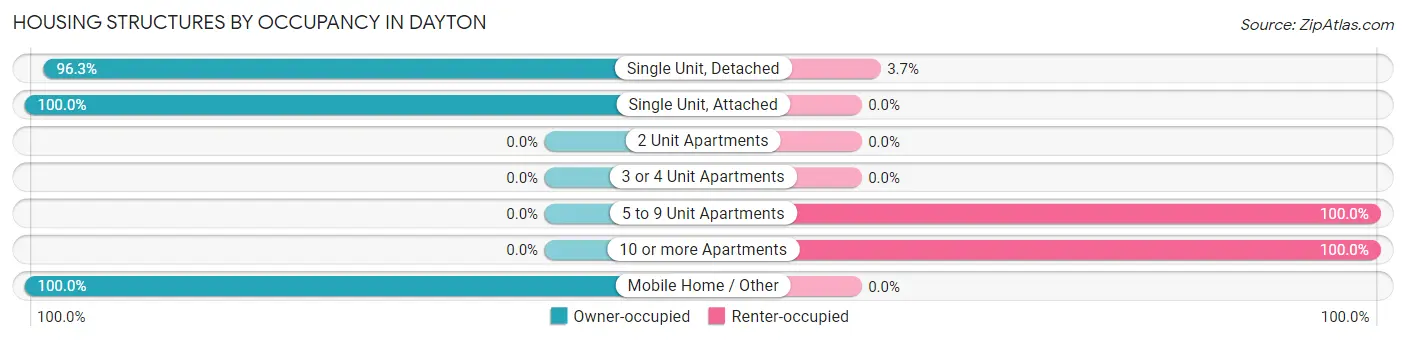
| Structure Type | Owner-occupied | Renter-occupied |
| Single Unit, Detached | 2,468 (96.3%) | 94 (3.7%) |
| Single Unit, Attached | 16 (100.0%) | 0 (0.0%) |
| 2 Unit Apartments | 0 (0.0%) | 0 (0.0%) |
| 3 or 4 Unit Apartments | 0 (0.0%) | 0 (0.0%) |
| 5 to 9 Unit Apartments | 0 (0.0%) | 21 (100.0%) |
| 10 or more Apartments | 0 (0.0%) | 27 (100.0%) |
| Mobile Home / Other | 118 (100.0%) | 0 (0.0%) |
| Total | 2,602 (94.8%) | 142 (5.2%) |
Housing Structures by Number of Rooms in Dayton
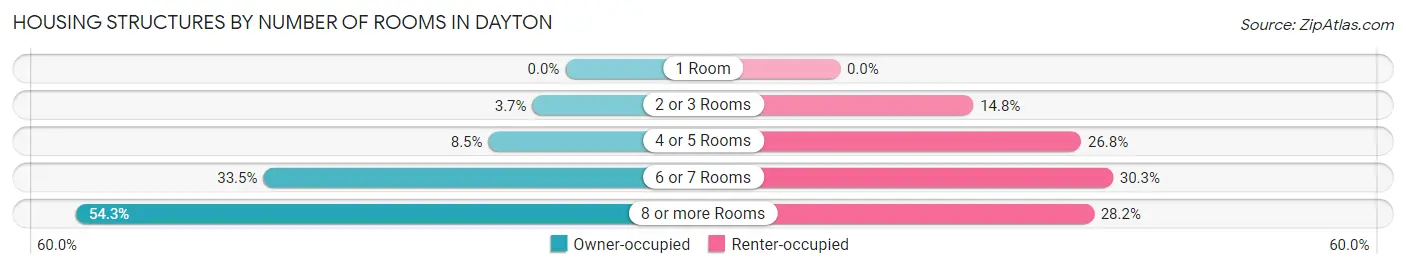
| Number of Rooms | Owner-occupied | Renter-occupied |
| 1 Room | 0 (0.0%) | 0 (0.0%) |
| 2 or 3 Rooms | 95 (3.6%) | 21 (14.8%) |
| 4 or 5 Rooms | 222 (8.5%) | 38 (26.8%) |
| 6 or 7 Rooms | 872 (33.5%) | 43 (30.3%) |
| 8 or more Rooms | 1,413 (54.3%) | 40 (28.2%) |
| Total | 2,602 (100.0%) | 142 (100.0%) |
Housing Structure by Heating Type in Dayton
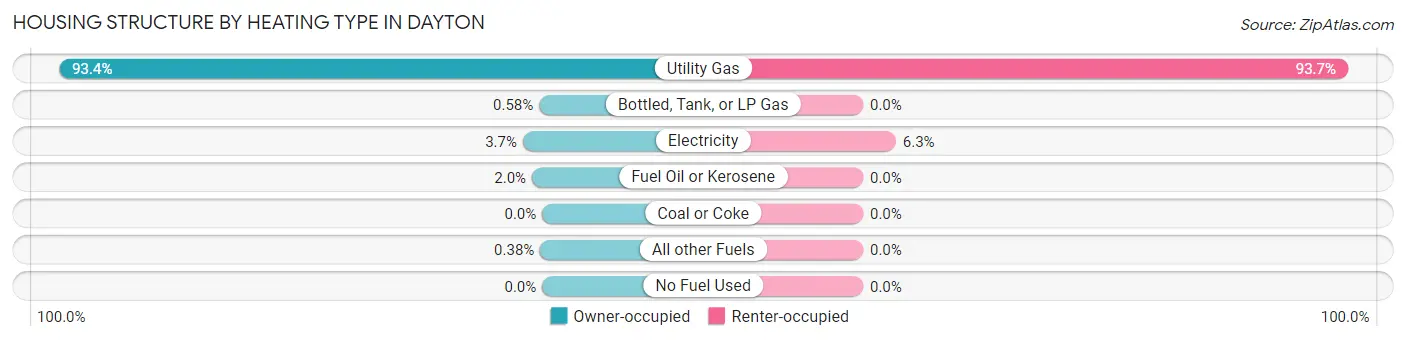
| Heating Type | Owner-occupied | Renter-occupied |
| Utility Gas | 2,429 (93.3%) | 133 (93.7%) |
| Bottled, Tank, or LP Gas | 15 (0.6%) | 0 (0.0%) |
| Electricity | 97 (3.7%) | 9 (6.3%) |
| Fuel Oil or Kerosene | 51 (2.0%) | 0 (0.0%) |
| Coal or Coke | 0 (0.0%) | 0 (0.0%) |
| All other Fuels | 10 (0.4%) | 0 (0.0%) |
| No Fuel Used | 0 (0.0%) | 0 (0.0%) |
| Total | 2,602 (100.0%) | 142 (100.0%) |
Household Vehicle Usage in Dayton
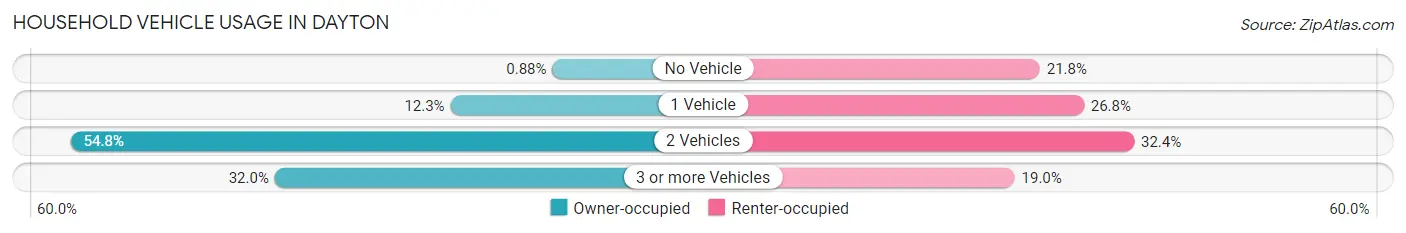
| Vehicles per Household | Owner-occupied | Renter-occupied |
| No Vehicle | 23 (0.9%) | 31 (21.8%) |
| 1 Vehicle | 320 (12.3%) | 38 (26.8%) |
| 2 Vehicles | 1,427 (54.8%) | 46 (32.4%) |
| 3 or more Vehicles | 832 (32.0%) | 27 (19.0%) |
| Total | 2,602 (100.0%) | 142 (100.0%) |
Real Estate & Mortgages in Dayton
Real Estate and Mortgage Overview in Dayton
| Characteristic | Without Mortgage | With Mortgage |
| Housing Units | 673 | 1,929 |
| Median Property Value | $456,200 | $460,100 |
| Median Household Income | $90,063 | $1,110 |
| Monthly Housing Costs | $857 | $377 |
| Real Estate Taxes | $4,831 | $0 |
Property Value by Mortgage Status in Dayton
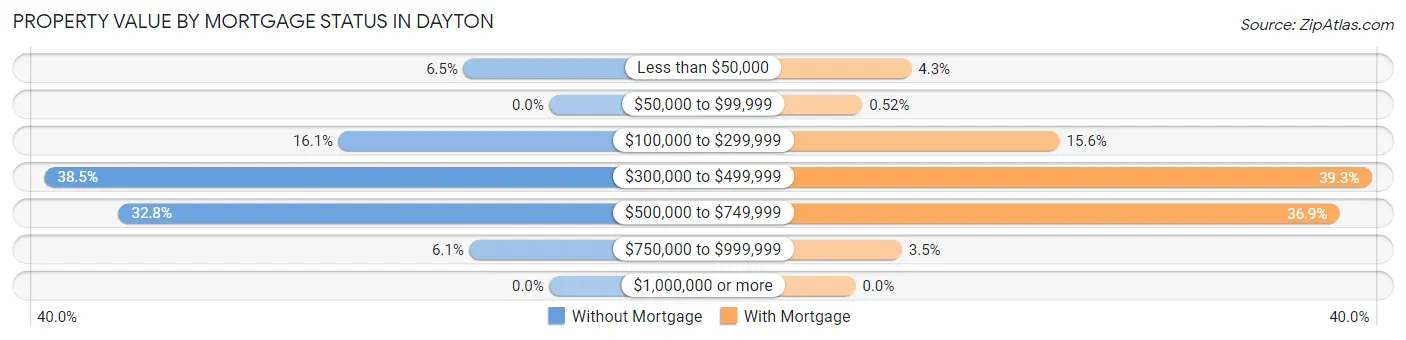
| Property Value | Without Mortgage | With Mortgage |
| Less than $50,000 | 44 (6.5%) | 82 (4.3%) |
| $50,000 to $99,999 | 0 (0.0%) | 10 (0.5%) |
| $100,000 to $299,999 | 108 (16.1%) | 300 (15.5%) |
| $300,000 to $499,999 | 259 (38.5%) | 758 (39.3%) |
| $500,000 to $749,999 | 221 (32.8%) | 711 (36.9%) |
| $750,000 to $999,999 | 41 (6.1%) | 68 (3.5%) |
| $1,000,000 or more | 0 (0.0%) | 0 (0.0%) |
| Total | 673 (100.0%) | 1,929 (100.0%) |
Household Income by Mortgage Status in Dayton
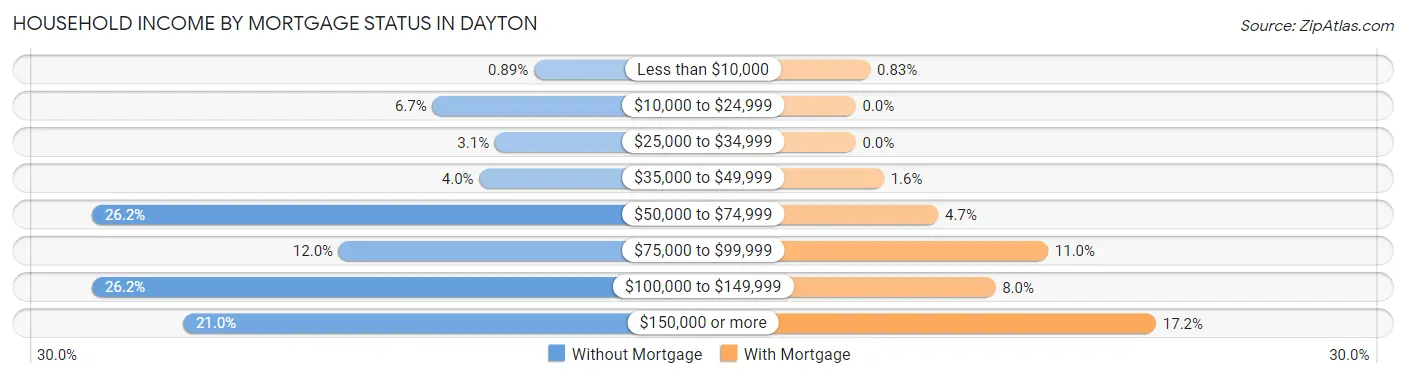
| Household Income | Without Mortgage | With Mortgage |
| Less than $10,000 | 6 (0.9%) | 16 (0.8%) |
| $10,000 to $24,999 | 45 (6.7%) | 0 (0.0%) |
| $25,000 to $34,999 | 21 (3.1%) | 0 (0.0%) |
| $35,000 to $49,999 | 27 (4.0%) | 31 (1.6%) |
| $50,000 to $74,999 | 176 (26.2%) | 91 (4.7%) |
| $75,000 to $99,999 | 81 (12.0%) | 212 (11.0%) |
| $100,000 to $149,999 | 176 (26.2%) | 154 (8.0%) |
| $150,000 or more | 141 (20.9%) | 331 (17.2%) |
| Total | 673 (100.0%) | 1,929 (100.0%) |
Property Value to Household Income Ratio in Dayton
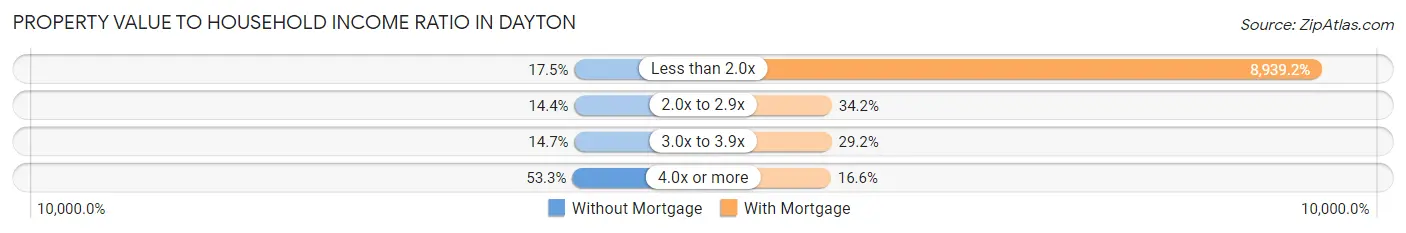
| Value-to-Income Ratio | Without Mortgage | With Mortgage |
| Less than 2.0x | 118 (17.5%) | 172,438 (8,939.2%) |
| 2.0x to 2.9x | 97 (14.4%) | 660 (34.2%) |
| 3.0x to 3.9x | 99 (14.7%) | 563 (29.2%) |
| 4.0x or more | 359 (53.3%) | 321 (16.6%) |
| Total | 673 (100.0%) | 1,929 (100.0%) |
Real Estate Taxes by Mortgage Status in Dayton
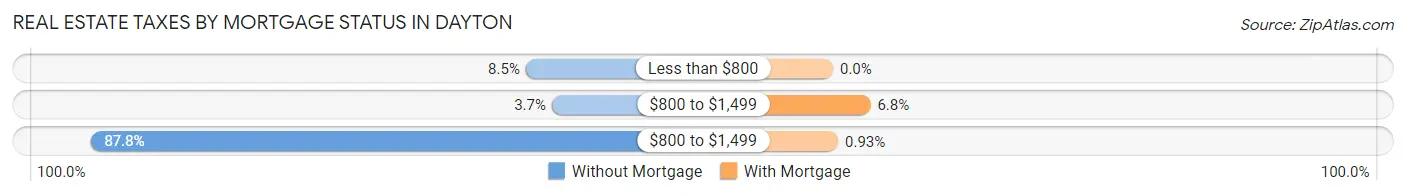
| Property Taxes | Without Mortgage | With Mortgage |
| Less than $800 | 57 (8.5%) | 0 (0.0%) |
| $800 to $1,499 | 25 (3.7%) | 132 (6.8%) |
| $800 to $1,499 | 591 (87.8%) | 18 (0.9%) |
| Total | 673 (100.0%) | 1,929 (100.0%) |
Health & Disability in Dayton
Health Insurance Coverage by Age in Dayton
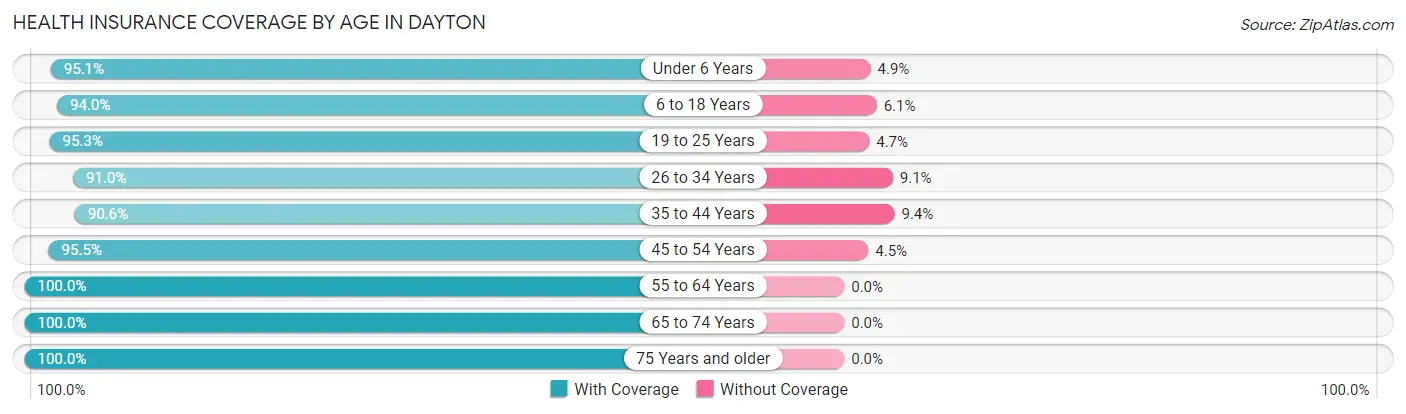
| Age Bracket | With Coverage | Without Coverage |
| Under 6 Years | 388 (95.1%) | 20 (4.9%) |
| 6 to 18 Years | 1,631 (94.0%) | 105 (6.0%) |
| 19 to 25 Years | 266 (95.3%) | 13 (4.7%) |
| 26 to 34 Years | 633 (90.9%) | 63 (9.0%) |
| 35 to 44 Years | 1,180 (90.6%) | 122 (9.4%) |
| 45 to 54 Years | 873 (95.5%) | 41 (4.5%) |
| 55 to 64 Years | 1,375 (100.0%) | 0 (0.0%) |
| 65 to 74 Years | 784 (100.0%) | 0 (0.0%) |
| 75 Years and older | 232 (100.0%) | 0 (0.0%) |
| Total | 7,362 (95.3%) | 364 (4.7%) |
Health Insurance Coverage by Citizenship Status in Dayton
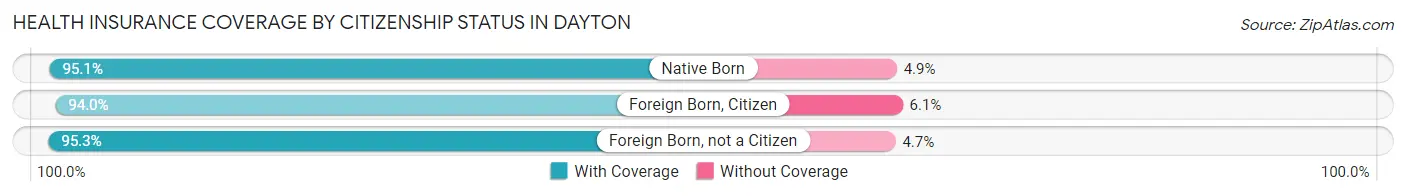
| Citizenship Status | With Coverage | Without Coverage |
| Native Born | 388 (95.1%) | 20 (4.9%) |
| Foreign Born, Citizen | 1,631 (94.0%) | 105 (6.0%) |
| Foreign Born, not a Citizen | 266 (95.3%) | 13 (4.7%) |
Health Insurance Coverage by Household Income in Dayton
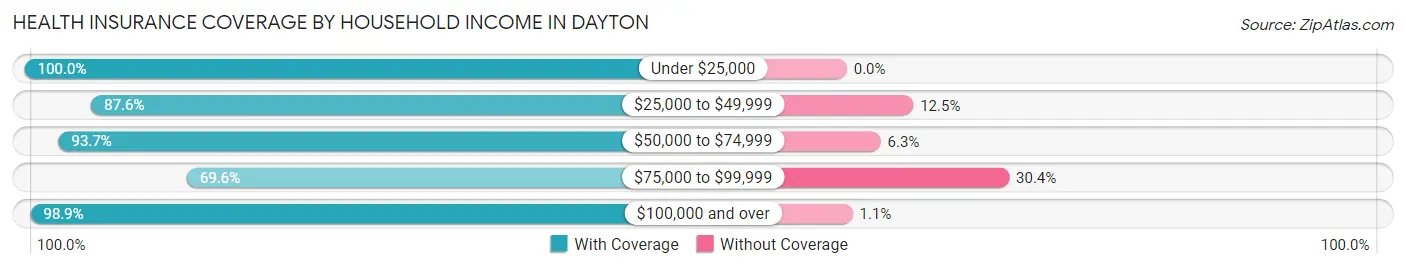
| Household Income | With Coverage | Without Coverage |
| Under $25,000 | 132 (100.0%) | 0 (0.0%) |
| $25,000 to $49,999 | 218 (87.5%) | 31 (12.4%) |
| $50,000 to $74,999 | 1,286 (93.7%) | 87 (6.3%) |
| $75,000 to $99,999 | 421 (69.6%) | 184 (30.4%) |
| $100,000 and over | 5,305 (98.9%) | 58 (1.1%) |
Public vs Private Health Insurance Coverage by Age in Dayton
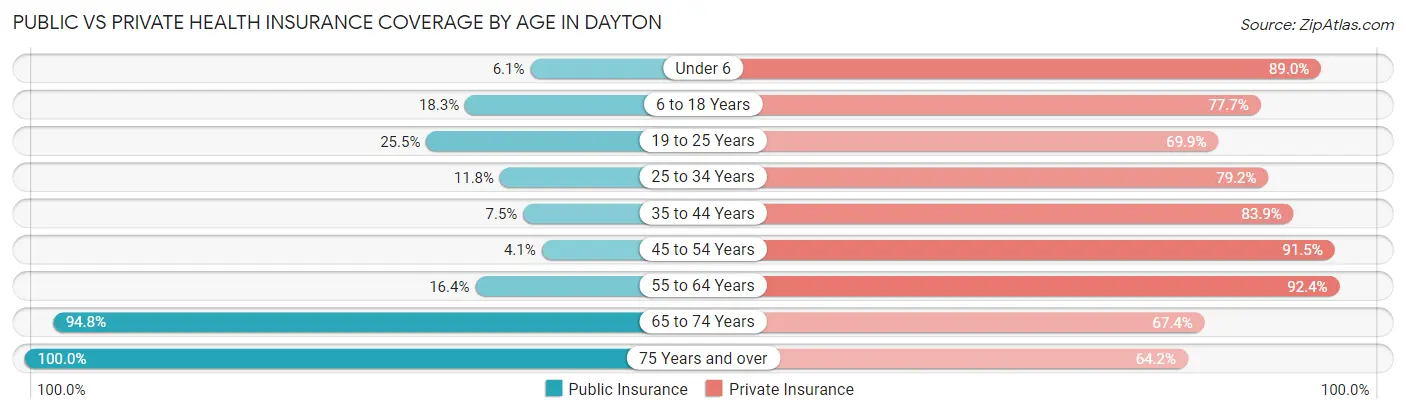
| Age Bracket | Public Insurance | Private Insurance |
| Under 6 | 25 (6.1%) | 363 (89.0%) |
| 6 to 18 Years | 317 (18.3%) | 1,349 (77.7%) |
| 19 to 25 Years | 71 (25.5%) | 195 (69.9%) |
| 25 to 34 Years | 82 (11.8%) | 551 (79.2%) |
| 35 to 44 Years | 97 (7.4%) | 1,092 (83.9%) |
| 45 to 54 Years | 37 (4.1%) | 836 (91.5%) |
| 55 to 64 Years | 225 (16.4%) | 1,270 (92.4%) |
| 65 to 74 Years | 743 (94.8%) | 528 (67.3%) |
| 75 Years and over | 232 (100.0%) | 149 (64.2%) |
| Total | 1,829 (23.7%) | 6,333 (82.0%) |
Disability Status by Sex by Age in Dayton
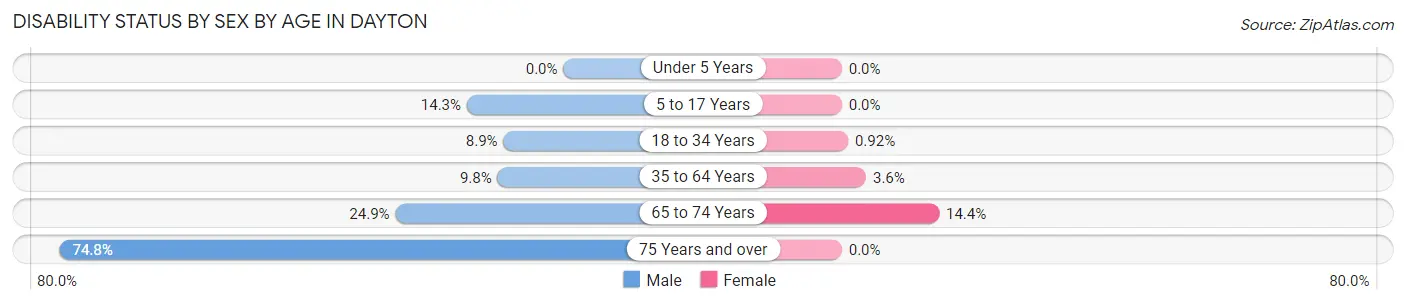
| Age Bracket | Male | Female |
| Under 5 Years | 0 (0.0%) | 0 (0.0%) |
| 5 to 17 Years | 148 (14.3%) | 0 (0.0%) |
| 18 to 34 Years | 52 (8.9%) | 4 (0.9%) |
| 35 to 64 Years | 177 (9.8%) | 64 (3.6%) |
| 65 to 74 Years | 104 (24.9%) | 53 (14.4%) |
| 75 Years and over | 101 (74.8%) | 0 (0.0%) |
Disability Class by Sex by Age in Dayton
Disability Class: Hearing Difficulty
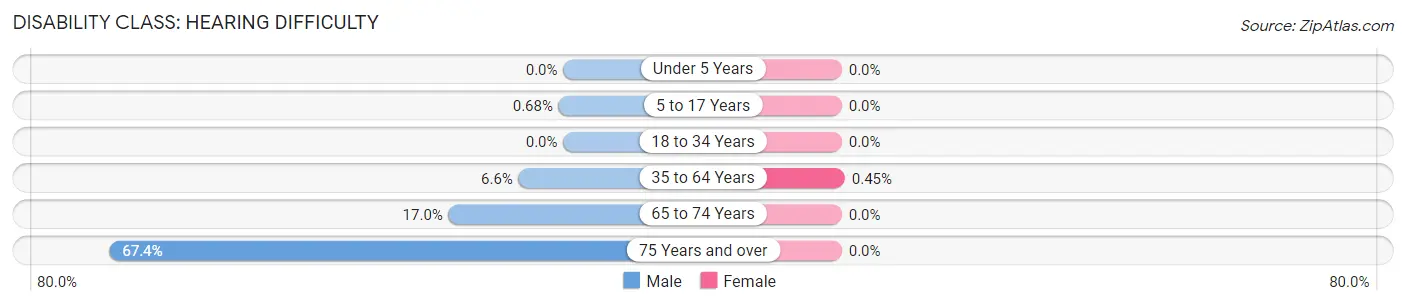
| Age Bracket | Male | Female |
| Under 5 Years | 0 (0.0%) | 0 (0.0%) |
| 5 to 17 Years | 7 (0.7%) | 0 (0.0%) |
| 18 to 34 Years | 0 (0.0%) | 0 (0.0%) |
| 35 to 64 Years | 120 (6.6%) | 8 (0.4%) |
| 65 to 74 Years | 71 (17.0%) | 0 (0.0%) |
| 75 Years and over | 91 (67.4%) | 0 (0.0%) |
Disability Class: Vision Difficulty
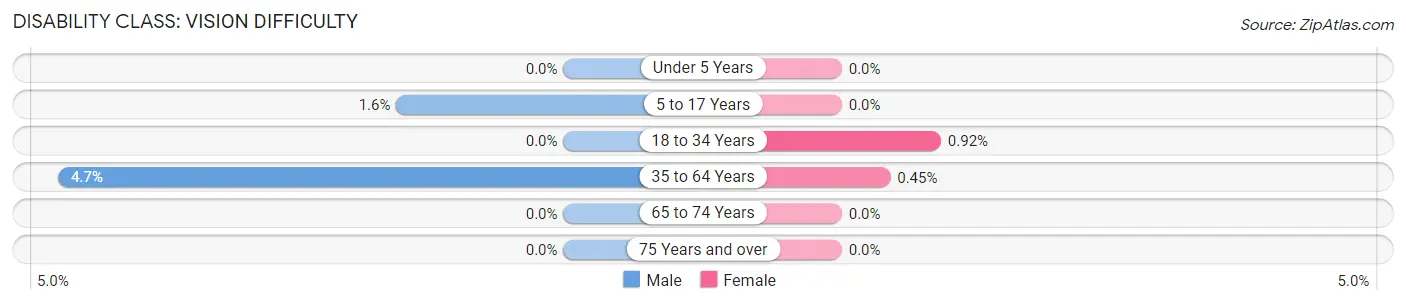
| Age Bracket | Male | Female |
| Under 5 Years | 0 (0.0%) | 0 (0.0%) |
| 5 to 17 Years | 16 (1.5%) | 0 (0.0%) |
| 18 to 34 Years | 0 (0.0%) | 4 (0.9%) |
| 35 to 64 Years | 85 (4.7%) | 8 (0.4%) |
| 65 to 74 Years | 0 (0.0%) | 0 (0.0%) |
| 75 Years and over | 0 (0.0%) | 0 (0.0%) |
Disability Class: Cognitive Difficulty
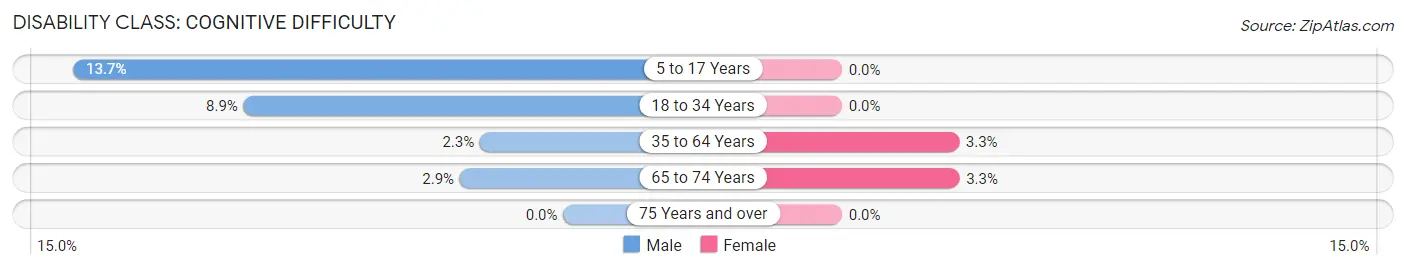
| Age Bracket | Male | Female |
| 5 to 17 Years | 141 (13.7%) | 0 (0.0%) |
| 18 to 34 Years | 52 (8.9%) | 0 (0.0%) |
| 35 to 64 Years | 42 (2.3%) | 58 (3.3%) |
| 65 to 74 Years | 12 (2.9%) | 12 (3.3%) |
| 75 Years and over | 0 (0.0%) | 0 (0.0%) |
Disability Class: Ambulatory Difficulty
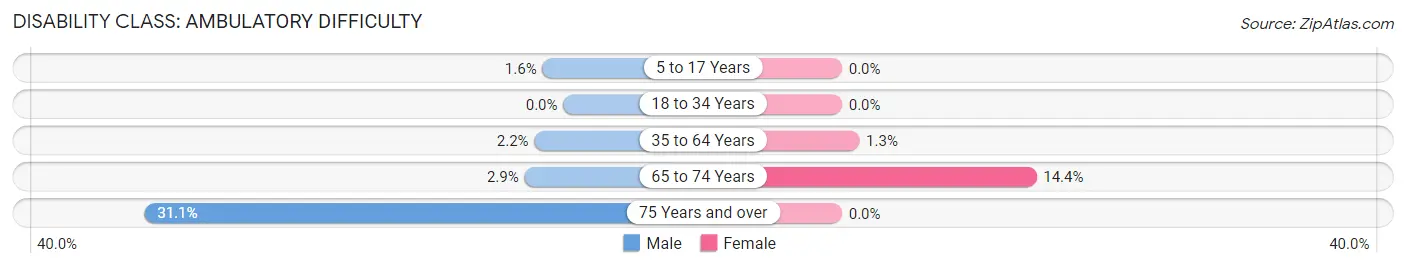
| Age Bracket | Male | Female |
| 5 to 17 Years | 16 (1.5%) | 0 (0.0%) |
| 18 to 34 Years | 0 (0.0%) | 0 (0.0%) |
| 35 to 64 Years | 39 (2.1%) | 23 (1.3%) |
| 65 to 74 Years | 12 (2.9%) | 53 (14.4%) |
| 75 Years and over | 42 (31.1%) | 0 (0.0%) |
Disability Class: Self-Care Difficulty
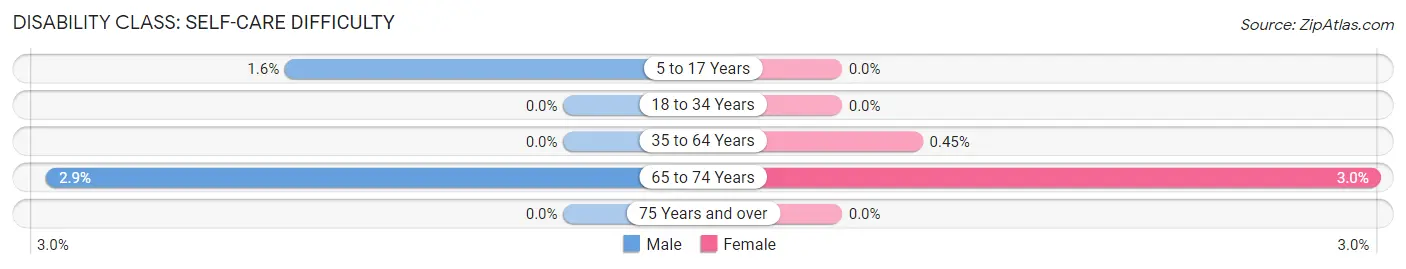
| Age Bracket | Male | Female |
| 5 to 17 Years | 16 (1.5%) | 0 (0.0%) |
| 18 to 34 Years | 0 (0.0%) | 0 (0.0%) |
| 35 to 64 Years | 0 (0.0%) | 8 (0.4%) |
| 65 to 74 Years | 12 (2.9%) | 11 (3.0%) |
| 75 Years and over | 0 (0.0%) | 0 (0.0%) |
Technology Access in Dayton
Computing Device Access in Dayton
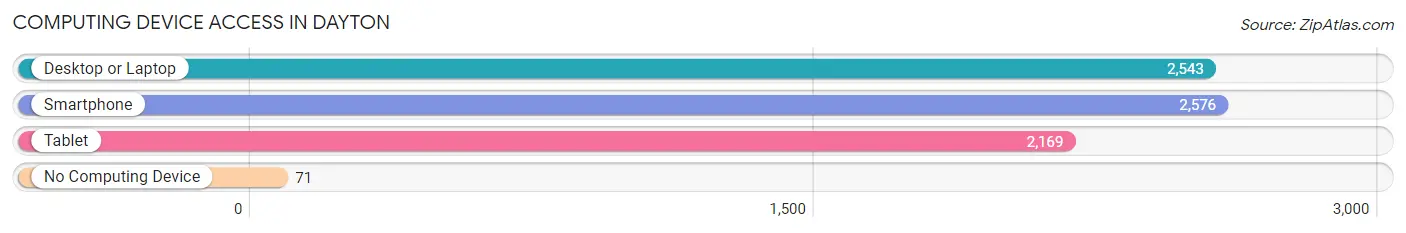
| Device Type | # Households | % Households |
| Desktop or Laptop | 2,543 | 92.7% |
| Smartphone | 2,576 | 93.9% |
| Tablet | 2,169 | 79.0% |
| No Computing Device | 71 | 2.6% |
| Total | 2,744 | 100.0% |
Internet Access in Dayton
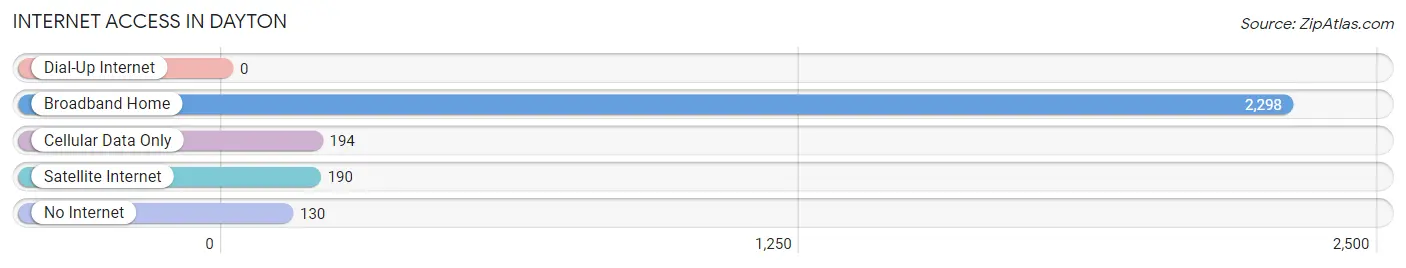
| Internet Type | # Households | % Households |
| Dial-Up Internet | 0 | 0.0% |
| Broadband Home | 2,298 | 83.8% |
| Cellular Data Only | 194 | 7.1% |
| Satellite Internet | 190 | 6.9% |
| No Internet | 130 | 4.7% |
| Total | 2,744 | 100.0% |
Dayton Summary
Dayton, Minnesota is a small city located in Hennepin County, Minnesota. It is situated on the west bank of the Mississippi River, about 25 miles northwest of Minneapolis. The city has a population of about 4,000 people and is part of the Twin Cities metropolitan area.
History
Dayton was first settled in 1855 by a group of settlers from New York. The town was named after William L. Dayton, a prominent politician from New York. The town was incorporated in 1858 and was the first city in Hennepin County.
In the late 19th century, Dayton was a thriving agricultural community. The town was home to several grain mills, a sawmill, and a flour mill. The town also had a brickyard, a creamery, and a cheese factory.
In the early 20th century, Dayton began to experience a population boom. The town was home to several factories, including a paper mill, a canning factory, and a furniture factory. The town also had a number of stores, including a hardware store, a grocery store, and a drug store.
Geography
Dayton is located in Hennepin County, Minnesota. It is situated on the west bank of the Mississippi River, about 25 miles northwest of Minneapolis. The city has a total area of 2.2 square miles, all of which is land.
The city is located in a flat, low-lying area. The terrain is mostly flat, with some rolling hills. The city is located in a temperate climate, with hot summers and cold winters.
Economy
Dayton’s economy is largely based on agriculture and manufacturing. The city is home to several grain mills, a sawmill, and a flour mill. The town also has a brickyard, a creamery, and a cheese factory.
The city is also home to several factories, including a paper mill, a canning factory, and a furniture factory. The town also has a number of stores, including a hardware store, a grocery store, and a drug store.
Demographics
As of the 2010 census, Dayton had a population of 4,000 people. The racial makeup of the city was 94.2% White, 1.2% African American, 0.2% Native American, 0.8% Asian, 0.1% Pacific Islander, 1.2% from other races, and 2.3% from two or more races. Hispanic or Latino of any race were 3.2% of the population.
The median income for a household in the city was $50,000, and the median income for a family was $60,000. The per capita income for the city was $25,000. About 8.2% of families and 10.2% of the population were below the poverty line, including 14.2% of those under age 18 and 6.2% of those age 65 or over.
Common Questions
What is Per Capita Income in Dayton?
Per Capita income in Dayton is $65,289.
What is the Median Family Income in Dayton?
Median Family Income in Dayton is $168,897.
What is the Median Household income in Dayton?
Median Household Income in Dayton is $138,654.
What is Income or Wage Gap in Dayton?
Income or Wage Gap in Dayton is 23.6%.
Women in Dayton earn 76.4 cents for every dollar earned by a man.
What is Inequality or Gini Index in Dayton?
Inequality or Gini Index in Dayton is 0.43.
What is the Total Population of Dayton?
Total Population of Dayton is 7,745.
What is the Total Male Population of Dayton?
Total Male Population of Dayton is 4,130.
What is the Total Female Population of Dayton?
Total Female Population of Dayton is 3,615.
What is the Ratio of Males per 100 Females in Dayton?
There are 114.25 Males per 100 Females in Dayton.
What is the Ratio of Females per 100 Males in Dayton?
There are 87.53 Females per 100 Males in Dayton.
What is the Median Population Age in Dayton?
Median Population Age in Dayton is 41.1 Years.
What is the Average Family Size in Dayton
Average Family Size in Dayton is 3.1 People.
What is the Average Household Size in Dayton
Average Household Size in Dayton is 2.8 People.
How Large is the Labor Force in Dayton?
There are 4,473 People in the Labor Forcein in Dayton.
What is the Percentage of People in the Labor Force in Dayton?
76.0% of People are in the Labor Force in Dayton.
What is the Unemployment Rate in Dayton?
Unemployment Rate in Dayton is 2.2%.