Long Lake, MN Map & Demographics
Long Lake Map
Long Lake Overview
$48,384
PER CAPITA INCOME
$123,500
AVG FAMILY INCOME
$83,750
AVG HOUSEHOLD INCOME
17.4%
WAGE / INCOME GAP [ % ]
82.6¢/ $1
WAGE / INCOME GAP [ $ ]
$10,210
FAMILY INCOME DEFICIT
0.51
INEQUALITY / GINI INDEX
1,712
TOTAL POPULATION
866
MALE POPULATION
846
FEMALE POPULATION
102.36
MALES / 100 FEMALES
97.69
FEMALES / 100 MALES
42.1
MEDIAN AGE
3.2
AVG FAMILY SIZE
2.5
AVG HOUSEHOLD SIZE
937
LABOR FORCE [ PEOPLE ]
69.9%
PERCENT IN LABOR FORCE
6.0%
UNEMPLOYMENT RATE
Long Lake Zip Codes
Income in Long Lake
Income Overview in Long Lake
Per Capita Income in Long Lake is $48,384, while median incomes of families and households are $123,500 and $83,750 respectively.
| Characteristic | Number | Measure |
| Per Capita Income | 1,712 | $48,384 |
| Median Family Income | 390 | $123,500 |
| Mean Family Income | 390 | $153,340 |
| Median Household Income | 684 | $83,750 |
| Mean Household Income | 684 | $117,331 |
| Income Deficit | 390 | $10,210 |
| Wage / Income Gap (%) | 1,712 | 17.35% |
| Wage / Income Gap ($) | 1,712 | 82.65¢ per $1 |
| Gini / Inequality Index | 1,712 | 0.51 |
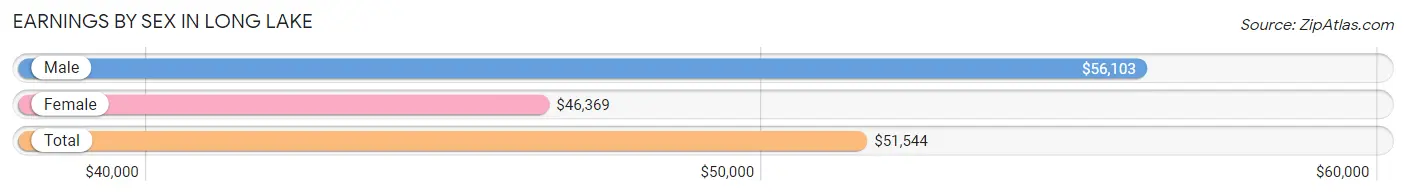
Earnings by Sex in Long Lake
Average Earnings in Long Lake are $51,544, $56,103 for men and $46,369 for women, a difference of 17.3%.
| Sex | Number | Average Earnings |
| Male | 478 (49.8%) | $56,103 |
| Female | 481 (50.2%) | $46,369 |
| Total | 959 (100.0%) | $51,544 |
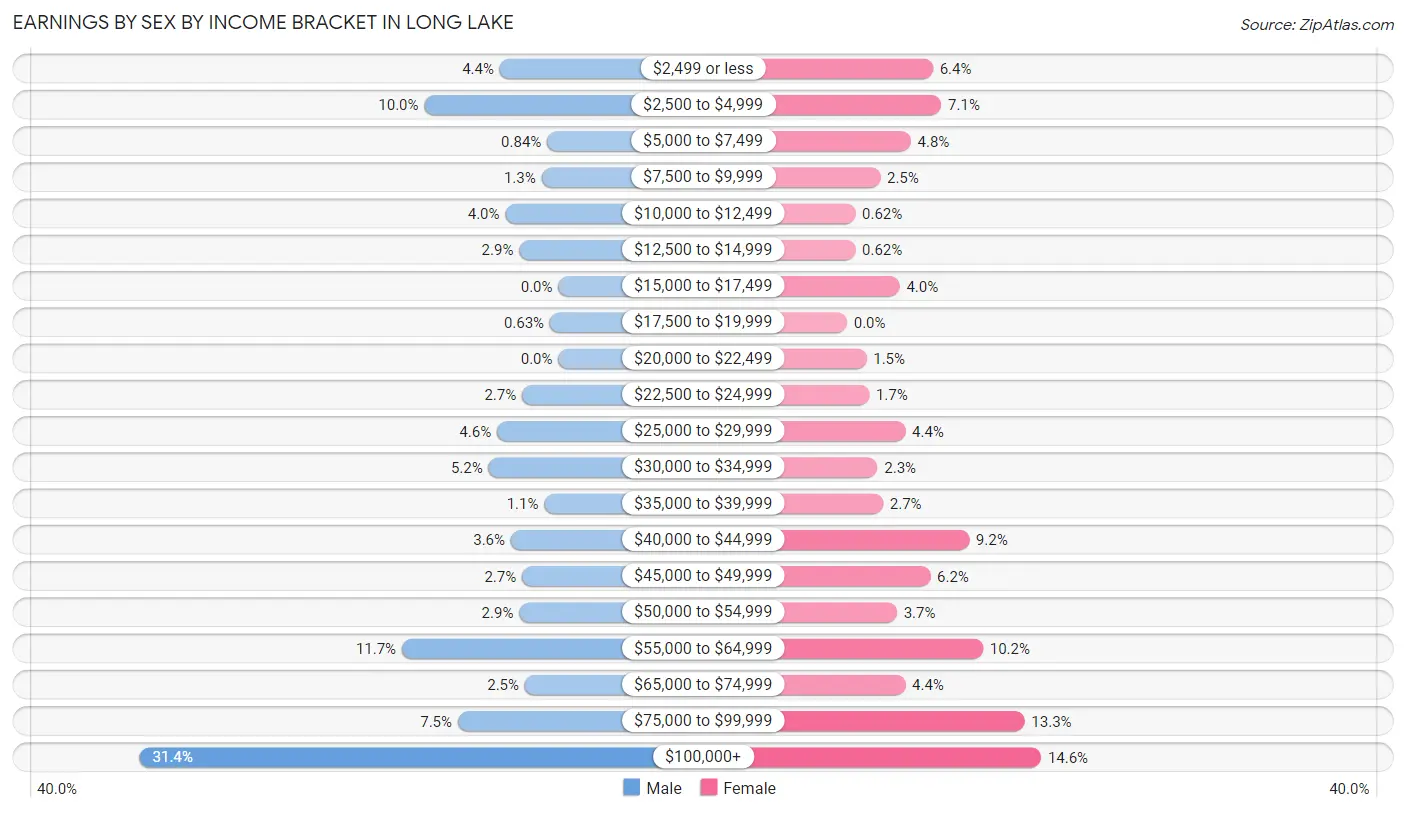
Earnings by Sex by Income Bracket in Long Lake
The most common earnings brackets in Long Lake are $100,000+ for men (150 | 31.4%) and $100,000+ for women (70 | 14.5%).
| Income | Male | Female |
| $2,499 or less | 21 (4.4%) | 31 (6.4%) |
| $2,500 to $4,999 | 48 (10.0%) | 34 (7.1%) |
| $5,000 to $7,499 | 4 (0.8%) | 23 (4.8%) |
| $7,500 to $9,999 | 6 (1.3%) | 12 (2.5%) |
| $10,000 to $12,499 | 19 (4.0%) | 3 (0.6%) |
| $12,500 to $14,999 | 14 (2.9%) | 3 (0.6%) |
| $15,000 to $17,499 | 0 (0.0%) | 19 (4.0%) |
| $17,500 to $19,999 | 3 (0.6%) | 0 (0.0%) |
| $20,000 to $22,499 | 0 (0.0%) | 7 (1.5%) |
| $22,500 to $24,999 | 13 (2.7%) | 8 (1.7%) |
| $25,000 to $29,999 | 22 (4.6%) | 21 (4.4%) |
| $30,000 to $34,999 | 25 (5.2%) | 11 (2.3%) |
| $35,000 to $39,999 | 5 (1.1%) | 13 (2.7%) |
| $40,000 to $44,999 | 17 (3.6%) | 44 (9.1%) |
| $45,000 to $49,999 | 13 (2.7%) | 30 (6.2%) |
| $50,000 to $54,999 | 14 (2.9%) | 18 (3.7%) |
| $55,000 to $64,999 | 56 (11.7%) | 49 (10.2%) |
| $65,000 to $74,999 | 12 (2.5%) | 21 (4.4%) |
| $75,000 to $99,999 | 36 (7.5%) | 64 (13.3%) |
| $100,000+ | 150 (31.4%) | 70 (14.5%) |
| Total | 478 (100.0%) | 481 (100.0%) |
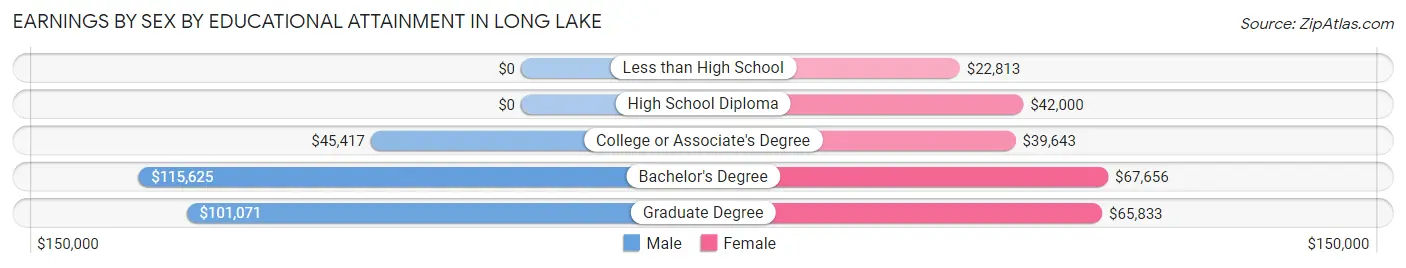
Earnings by Sex by Educational Attainment in Long Lake
Average earnings in Long Lake are $57,969 for men and $50,333 for women, a difference of 13.2%. Men with an educational attainment of bachelor's degree enjoy the highest average annual earnings of $115,625, while those with college or associate's degree education earn the least with $45,417. Women with an educational attainment of bachelor's degree earn the most with the average annual earnings of $67,656, while those with less than high school education have the smallest earnings of $22,813.
| Educational Attainment | Male Income | Female Income |
| Less than High School | - | - |
| High School Diploma | - | - |
| College or Associate's Degree | $45,417 | $39,643 |
| Bachelor's Degree | $115,625 | $67,656 |
| Graduate Degree | $101,071 | $65,833 |
| Total | $57,969 | $50,333 |
Family Income in Long Lake
Family Income Brackets in Long Lake
According to the Long Lake family income data, there are 101 families falling into the $100,000 to $149,999 income range, which is the most common income bracket and makes up 25.9% of all families. Conversely, the less than $10,000 income bracket is the least frequent group with only 4 families (1.0%) belonging to this category.
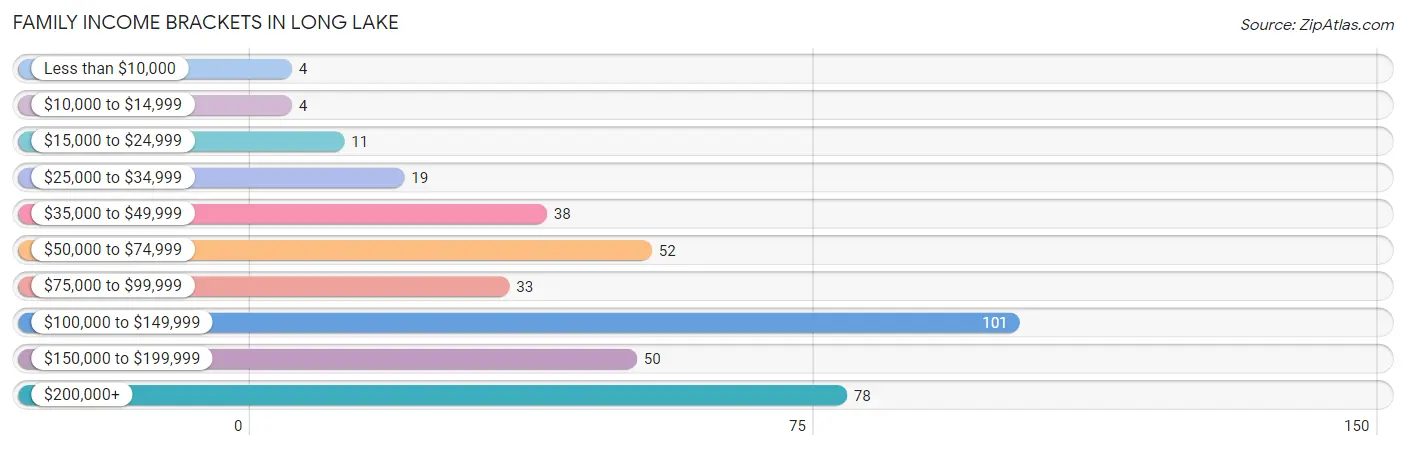
| Income Bracket | # Families | % Families |
| Less than $10,000 | 4 | 1.0% |
| $10,000 to $14,999 | 4 | 1.0% |
| $15,000 to $24,999 | 11 | 2.8% |
| $25,000 to $34,999 | 19 | 4.9% |
| $35,000 to $49,999 | 38 | 9.7% |
| $50,000 to $74,999 | 52 | 13.3% |
| $75,000 to $99,999 | 33 | 8.5% |
| $100,000 to $149,999 | 101 | 25.9% |
| $150,000 to $199,999 | 50 | 12.8% |
| $200,000+ | 78 | 20.0% |
Family Income by Famaliy Size in Long Lake
4-person families (60 | 15.4%) account for the highest median family income in Long Lake with $230,000 per family, while 4-person families (60 | 15.4%) have the highest median income of $57,500 per family member.
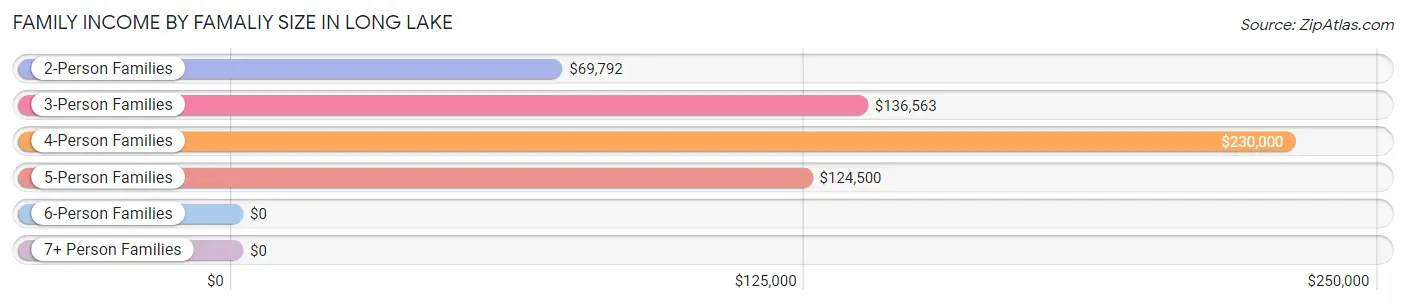
| Income Bracket | # Families | Median Income |
| 2-Person Families | 175 (44.9%) | $69,792 |
| 3-Person Families | 76 (19.5%) | $136,563 |
| 4-Person Families | 60 (15.4%) | $230,000 |
| 5-Person Families | 62 (15.9%) | $124,500 |
| 6-Person Families | 14 (3.6%) | $0 |
| 7+ Person Families | 3 (0.8%) | $0 |
| Total | 390 (100.0%) | $123,500 |
Family Income by Number of Earners in Long Lake
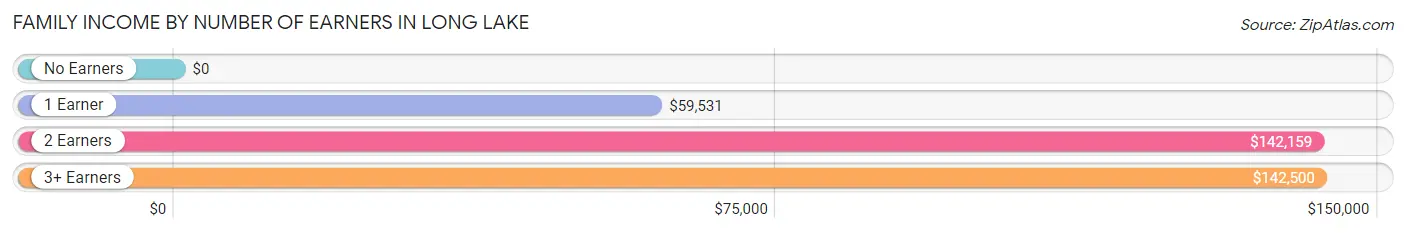
| Number of Earners | # Families | Median Income |
| No Earners | 30 (7.7%) | $0 |
| 1 Earner | 91 (23.3%) | $59,531 |
| 2 Earners | 235 (60.3%) | $142,159 |
| 3+ Earners | 34 (8.7%) | $142,500 |
| Total | 390 (100.0%) | $123,500 |
Household Income in Long Lake
Household Income Brackets in Long Lake
With 129 households falling in the category, the $100,000 to $149,999 income range is the most frequent in Long Lake, accounting for 18.9% of all households. In contrast, only 28 households (4.1%) fall into the $15,000 to $24,999 income bracket, making it the least populous group.
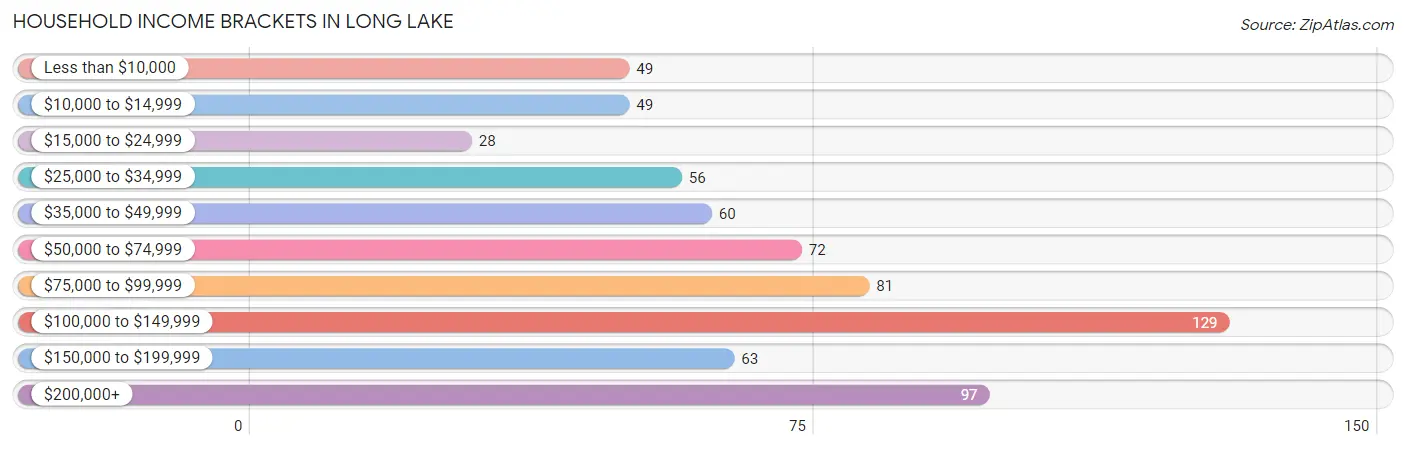
| Income Bracket | # Households | % Households |
| Less than $10,000 | 49 | 7.2% |
| $10,000 to $14,999 | 49 | 7.2% |
| $15,000 to $24,999 | 28 | 4.1% |
| $25,000 to $34,999 | 56 | 8.2% |
| $35,000 to $49,999 | 60 | 8.8% |
| $50,000 to $74,999 | 72 | 10.5% |
| $75,000 to $99,999 | 81 | 11.8% |
| $100,000 to $149,999 | 129 | 18.9% |
| $150,000 to $199,999 | 63 | 9.2% |
| $200,000+ | 97 | 14.2% |
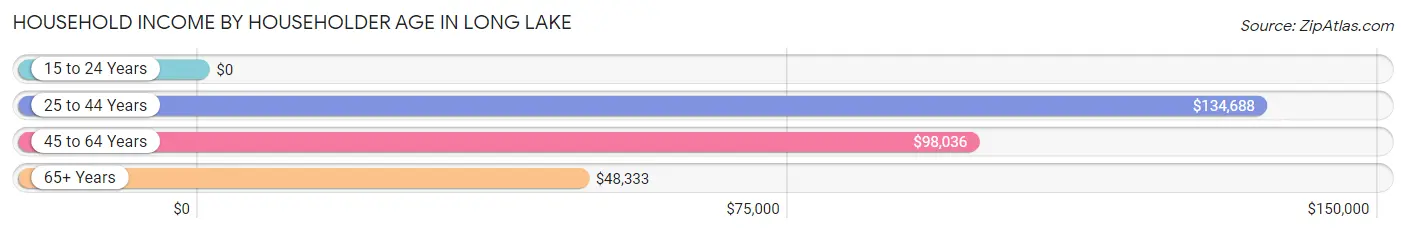
Household Income by Householder Age in Long Lake
The median household income in Long Lake is $83,750, with the highest median household income of $134,688 found in the 25 to 44 years age bracket for the primary householder. A total of 185 households (27.1%) fall into this category. Meanwhile, the 15 to 24 years age bracket for the primary householder has the lowest median household income of $0, with 1 households (0.2%) in this group.
| Income Bracket | # Households | Median Income |
| 15 to 24 Years | 1 (0.2%) | $0 |
| 25 to 44 Years | 185 (27.1%) | $134,688 |
| 45 to 64 Years | 324 (47.4%) | $98,036 |
| 65+ Years | 174 (25.4%) | $48,333 |
| Total | 684 (100.0%) | $83,750 |
Poverty in Long Lake
Income Below Poverty by Sex and Age in Long Lake
With 10.5% poverty level for males and 7.8% for females among the residents of Long Lake, 18 to 24 year old males and 55 to 64 year old females are the most vulnerable to poverty, with 15 males (30.6%) and 36 females (22.9%) in their respective age groups living below the poverty level.
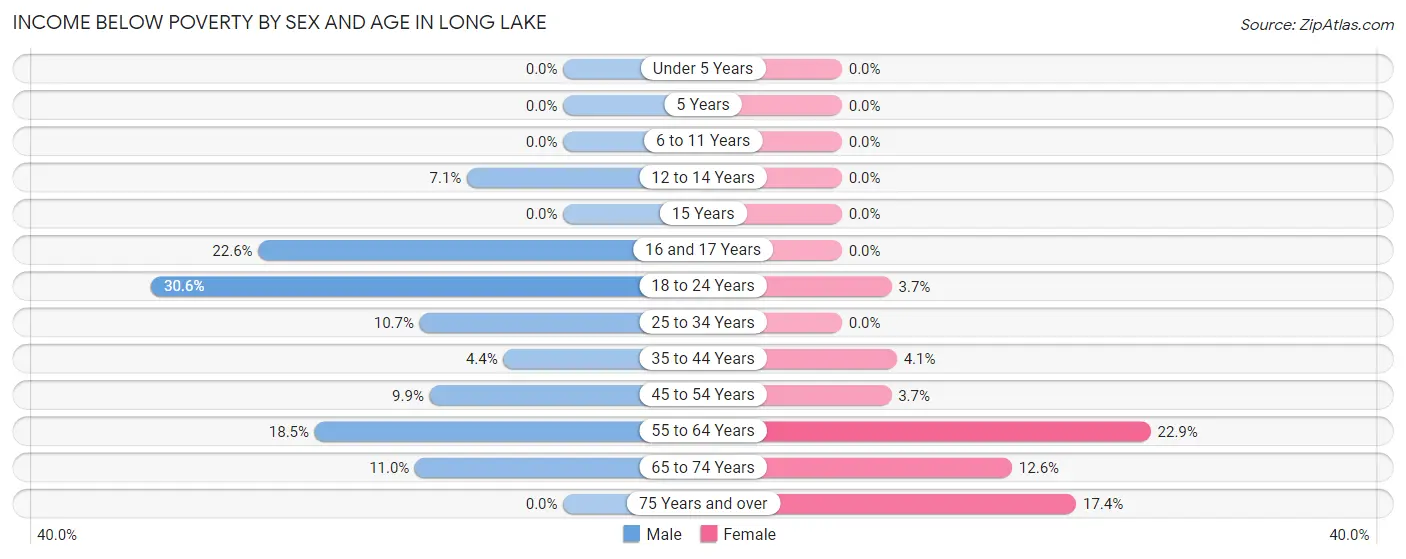
| Age Bracket | Male | Female |
| Under 5 Years | 0 (0.0%) | 0 (0.0%) |
| 5 Years | 0 (0.0%) | 0 (0.0%) |
| 6 to 11 Years | 0 (0.0%) | 0 (0.0%) |
| 12 to 14 Years | 3 (7.1%) | 0 (0.0%) |
| 15 Years | 0 (0.0%) | 0 (0.0%) |
| 16 and 17 Years | 12 (22.6%) | 0 (0.0%) |
| 18 to 24 Years | 15 (30.6%) | 1 (3.7%) |
| 25 to 34 Years | 13 (10.7%) | 0 (0.0%) |
| 35 to 44 Years | 4 (4.4%) | 4 (4.1%) |
| 45 to 54 Years | 12 (9.9%) | 4 (3.7%) |
| 55 to 64 Years | 19 (18.4%) | 36 (22.9%) |
| 65 to 74 Years | 11 (11.0%) | 12 (12.6%) |
| 75 Years and over | 0 (0.0%) | 8 (17.4%) |
| Total | 89 (10.5%) | 65 (7.8%) |
Income Above Poverty by Sex and Age in Long Lake
According to the poverty statistics in Long Lake, males aged under 5 years and females aged under 5 years are the age groups that are most secure financially, with 100.0% of males and 100.0% of females in these age groups living above the poverty line.
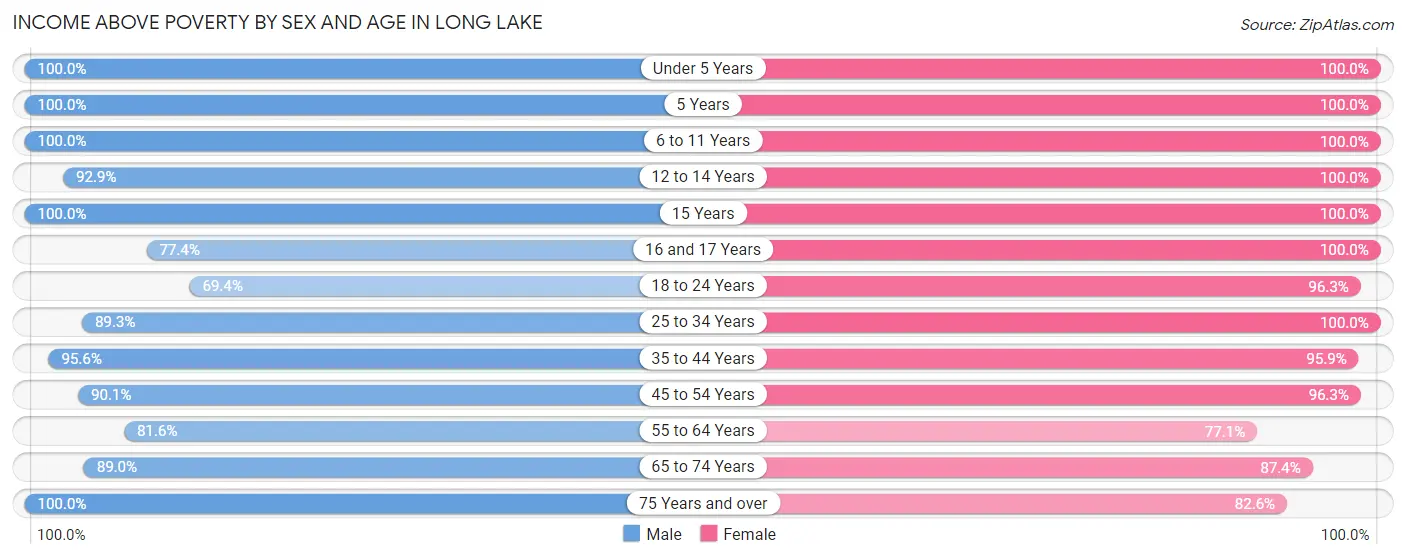
| Age Bracket | Male | Female |
| Under 5 Years | 46 (100.0%) | 37 (100.0%) |
| 5 Years | 8 (100.0%) | 10 (100.0%) |
| 6 to 11 Years | 67 (100.0%) | 92 (100.0%) |
| 12 to 14 Years | 39 (92.9%) | 32 (100.0%) |
| 15 Years | 15 (100.0%) | 15 (100.0%) |
| 16 and 17 Years | 41 (77.4%) | 21 (100.0%) |
| 18 to 24 Years | 34 (69.4%) | 26 (96.3%) |
| 25 to 34 Years | 109 (89.3%) | 92 (100.0%) |
| 35 to 44 Years | 86 (95.6%) | 94 (95.9%) |
| 45 to 54 Years | 109 (90.1%) | 105 (96.3%) |
| 55 to 64 Years | 84 (81.6%) | 121 (77.1%) |
| 65 to 74 Years | 89 (89.0%) | 83 (87.4%) |
| 75 Years and over | 33 (100.0%) | 38 (82.6%) |
| Total | 760 (89.5%) | 766 (92.2%) |
Income Below Poverty Among Married-Couple Families in Long Lake
The poverty statistics for married-couple families in Long Lake show that 3.4% or 10 of the total 293 families live below the poverty line. Families with 1 or 2 children have the highest poverty rate of 4.4%, comprising of 4 families. On the other hand, families with 3 or 4 children have the lowest poverty rate of 0.0%, which includes 0 families.
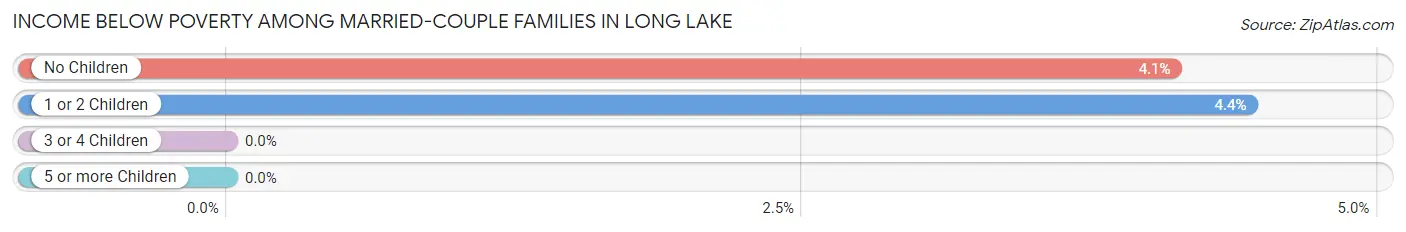
| Children | Above Poverty | Below Poverty |
| No Children | 140 (95.9%) | 6 (4.1%) |
| 1 or 2 Children | 86 (95.6%) | 4 (4.4%) |
| 3 or 4 Children | 54 (100.0%) | 0 (0.0%) |
| 5 or more Children | 3 (100.0%) | 0 (0.0%) |
| Total | 283 (96.6%) | 10 (3.4%) |
Income Below Poverty Among Single-Parent Households in Long Lake
| Children | Single Father | Single Mother |
| No Children | 0 (0.0%) | 0 (0.0%) |
| 1 or 2 Children | 0 (0.0%) | 0 (0.0%) |
| 3 or 4 Children | 0 (0.0%) | 0 (0.0%) |
| 5 or more Children | 0 (0.0%) | 0 (0.0%) |
| Total | 0 (0.0%) | 0 (0.0%) |
Income Below Poverty Among Married-Couple vs Single-Parent Households in Long Lake
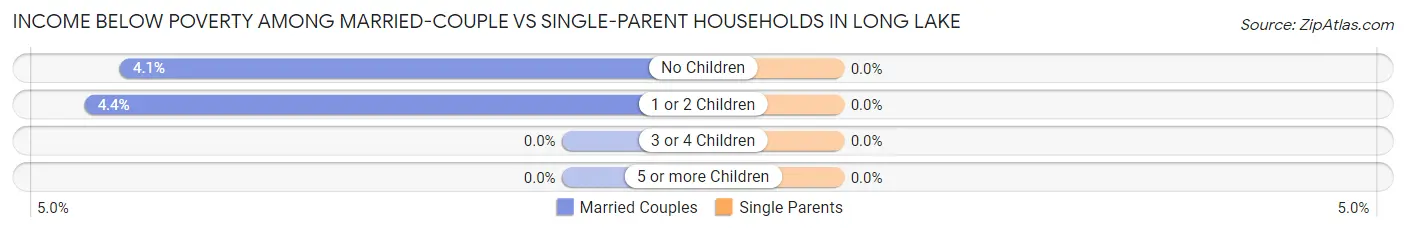
| Children | Married-Couple Families | Single-Parent Households |
| No Children | 6 (4.1%) | 0 (0.0%) |
| 1 or 2 Children | 4 (4.4%) | 0 (0.0%) |
| 3 or 4 Children | 0 (0.0%) | 0 (0.0%) |
| 5 or more Children | 0 (0.0%) | 0 (0.0%) |
| Total | 10 (3.4%) | 0 (0.0%) |
Race in Long Lake
The most populous races in Long Lake are White / Caucasian (1,448 | 84.6%), Two or more Races (137 | 8.0%), and Black / African American (76 | 4.4%).
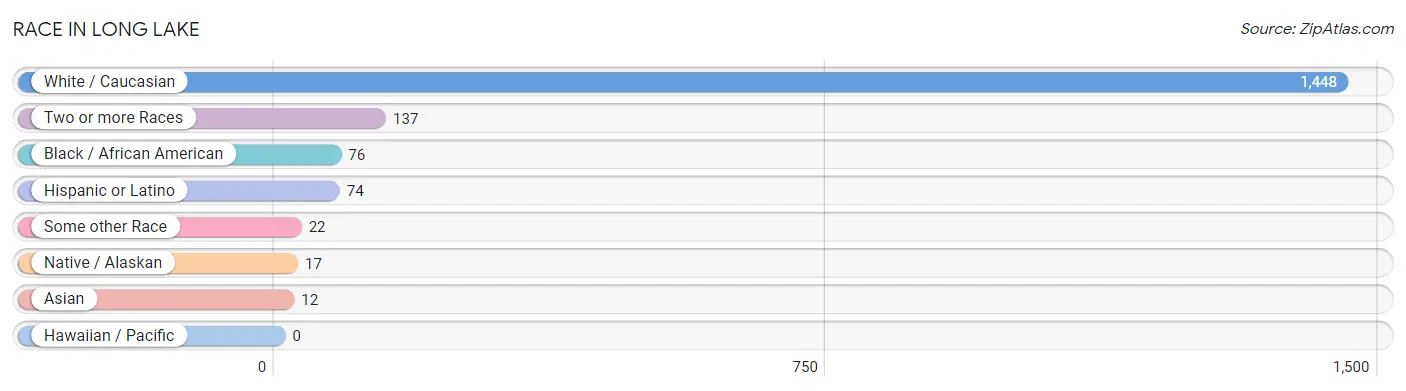
| Race | # Population | % Population |
| Asian | 12 | 0.7% |
| Black / African American | 76 | 4.4% |
| Hawaiian / Pacific | 0 | 0.0% |
| Hispanic or Latino | 74 | 4.3% |
| Native / Alaskan | 17 | 1.0% |
| White / Caucasian | 1,448 | 84.6% |
| Two or more Races | 137 | 8.0% |
| Some other Race | 22 | 1.3% |
| Total | 1,712 | 100.0% |
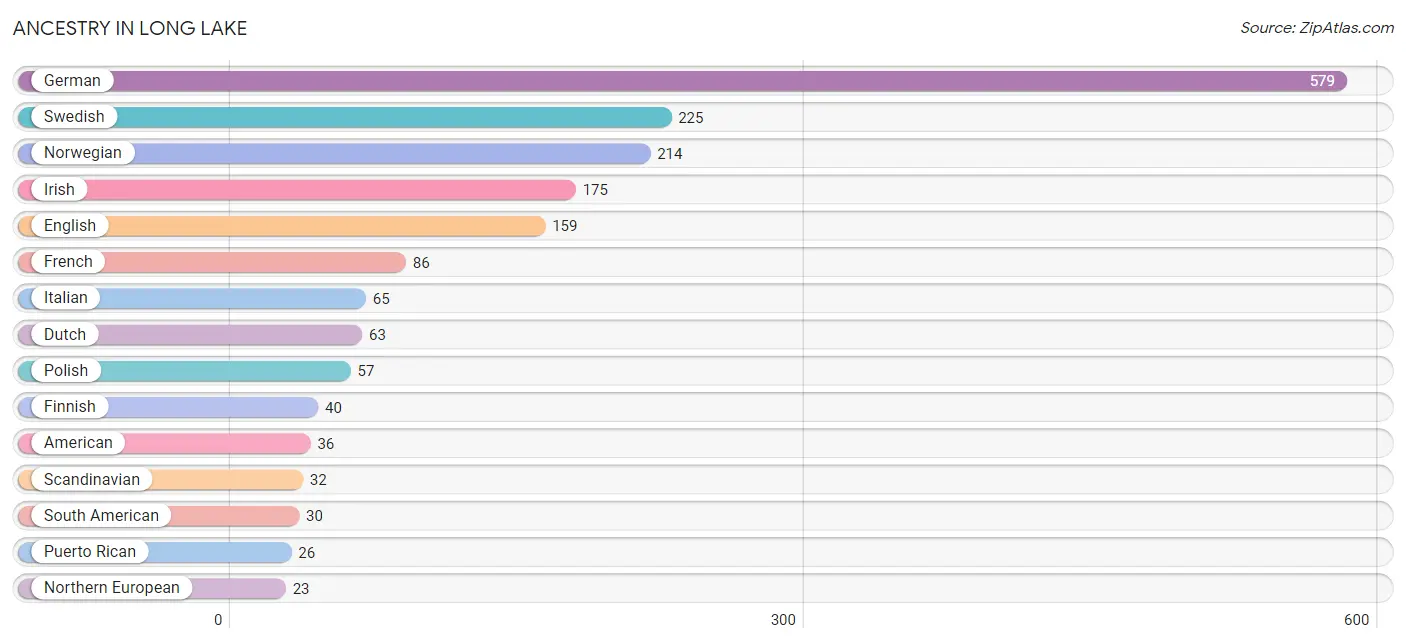
Ancestry in Long Lake
The most populous ancestries reported in Long Lake are German (579 | 33.8%), Swedish (225 | 13.1%), Norwegian (214 | 12.5%), Irish (175 | 10.2%), and English (159 | 9.3%), together accounting for 79.0% of all Long Lake residents.
| Ancestry | # Population | % Population |
| African | 3 | 0.2% |
| American | 36 | 2.1% |
| British | 9 | 0.5% |
| Central American Indian | 17 | 1.0% |
| Chilean | 10 | 0.6% |
| Creek | 4 | 0.2% |
| Czech | 11 | 0.6% |
| Danish | 7 | 0.4% |
| Dutch | 63 | 3.7% |
| Ecuadorian | 20 | 1.2% |
| English | 159 | 9.3% |
| European | 12 | 0.7% |
| Finnish | 40 | 2.3% |
| French | 86 | 5.0% |
| French Canadian | 21 | 1.2% |
| German | 579 | 33.8% |
| Iranian | 4 | 0.2% |
| Irish | 175 | 10.2% |
| Israeli | 3 | 0.2% |
| Italian | 65 | 3.8% |
| Korean | 8 | 0.5% |
| Latvian | 10 | 0.6% |
| Liberian | 6 | 0.4% |
| Lithuanian | 6 | 0.4% |
| Mexican | 15 | 0.9% |
| Northern European | 23 | 1.3% |
| Norwegian | 214 | 12.5% |
| Polish | 57 | 3.3% |
| Puerto Rican | 26 | 1.5% |
| Romanian | 4 | 0.2% |
| Russian | 22 | 1.3% |
| Scandinavian | 32 | 1.9% |
| Scotch-Irish | 9 | 0.5% |
| Scottish | 21 | 1.2% |
| Slovak | 2 | 0.1% |
| Somali | 3 | 0.2% |
| South American | 30 | 1.8% |
| Spanish | 3 | 0.2% |
| Subsaharan African | 12 | 0.7% |
| Swedish | 225 | 13.1% |
| Swiss | 12 | 0.7% |
| Thai | 16 | 0.9% |
| Ukrainian | 14 | 0.8% |
| Welsh | 8 | 0.5% | View All 44 Rows |
Immigrants in Long Lake
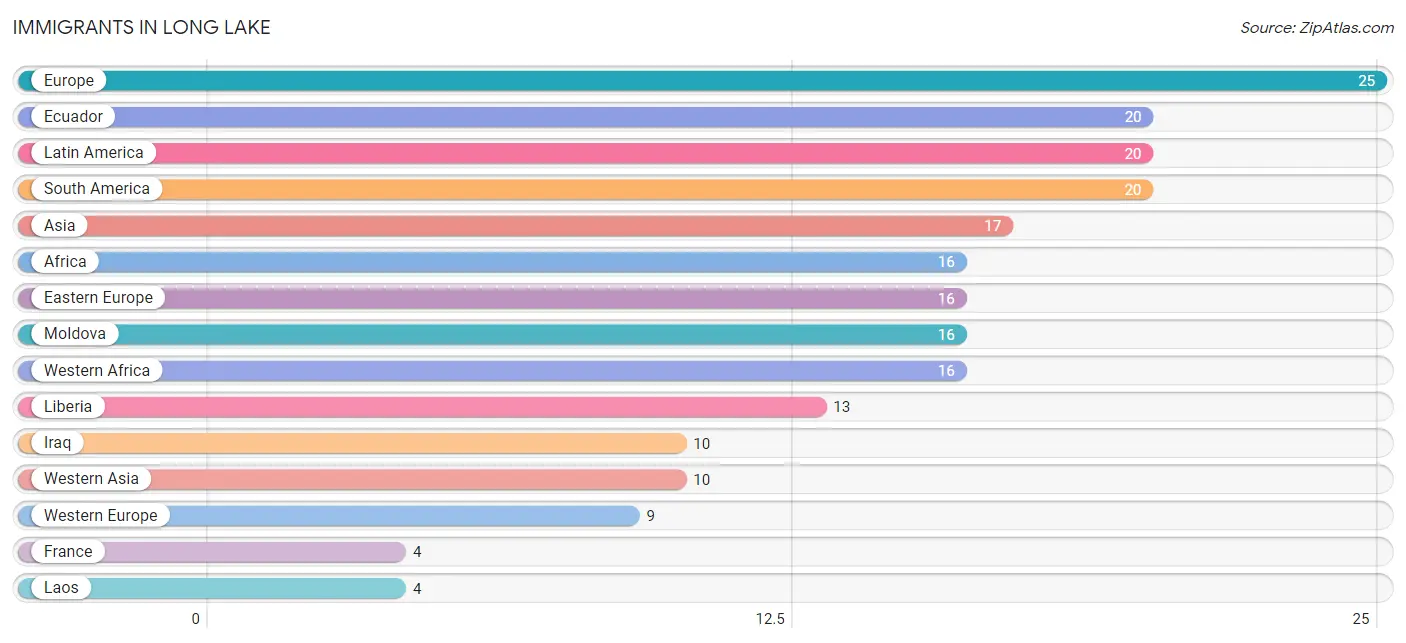
The most numerous immigrant groups reported in Long Lake came from Europe (25 | 1.5%), Ecuador (20 | 1.2%), Latin America (20 | 1.2%), South America (20 | 1.2%), and Asia (17 | 1.0%), together accounting for 6.0% of all Long Lake residents.
| Immigration Origin | # Population | % Population |
| Africa | 16 | 0.9% |
| Asia | 17 | 1.0% |
| Canada | 2 | 0.1% |
| Eastern Europe | 16 | 0.9% |
| Ecuador | 20 | 1.2% |
| Europe | 25 | 1.5% |
| France | 4 | 0.2% |
| Germany | 3 | 0.2% |
| India | 3 | 0.2% |
| Iraq | 10 | 0.6% |
| Laos | 4 | 0.2% |
| Latin America | 20 | 1.2% |
| Liberia | 13 | 0.8% |
| Moldova | 16 | 0.9% |
| Netherlands | 2 | 0.1% |
| Nigeria | 3 | 0.2% |
| South America | 20 | 1.2% |
| South Central Asia | 3 | 0.2% |
| South Eastern Asia | 4 | 0.2% |
| Western Africa | 16 | 0.9% |
| Western Asia | 10 | 0.6% |
| Western Europe | 9 | 0.5% | View All 22 Rows |
Sex and Age in Long Lake
Sex and Age in Long Lake
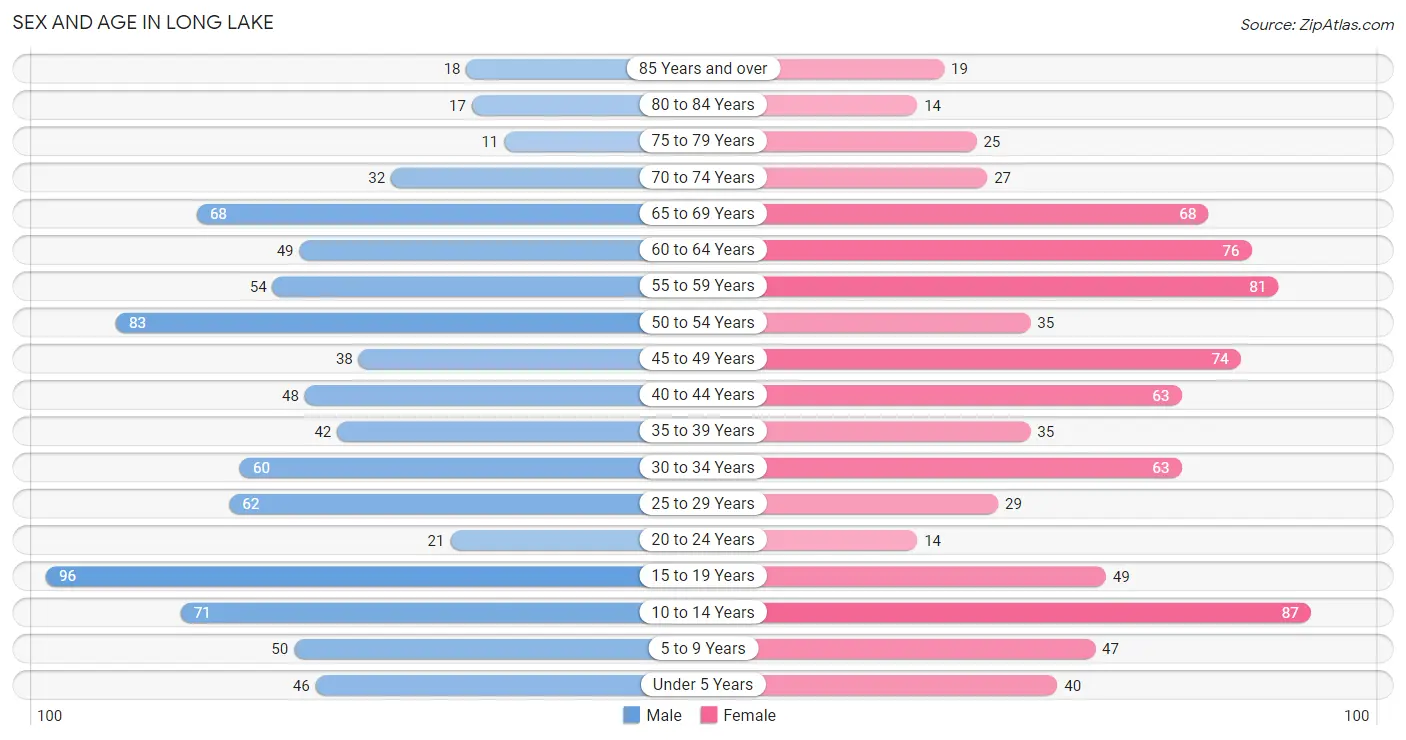
The most populous age groups in Long Lake are 15 to 19 Years (96 | 11.1%) for men and 10 to 14 Years (87 | 10.3%) for women.
| Age Bracket | Male | Female |
| Under 5 Years | 46 (5.3%) | 40 (4.7%) |
| 5 to 9 Years | 50 (5.8%) | 47 (5.6%) |
| 10 to 14 Years | 71 (8.2%) | 87 (10.3%) |
| 15 to 19 Years | 96 (11.1%) | 49 (5.8%) |
| 20 to 24 Years | 21 (2.4%) | 14 (1.7%) |
| 25 to 29 Years | 62 (7.2%) | 29 (3.4%) |
| 30 to 34 Years | 60 (6.9%) | 63 (7.4%) |
| 35 to 39 Years | 42 (4.9%) | 35 (4.1%) |
| 40 to 44 Years | 48 (5.5%) | 63 (7.4%) |
| 45 to 49 Years | 38 (4.4%) | 74 (8.7%) |
| 50 to 54 Years | 83 (9.6%) | 35 (4.1%) |
| 55 to 59 Years | 54 (6.2%) | 81 (9.6%) |
| 60 to 64 Years | 49 (5.7%) | 76 (9.0%) |
| 65 to 69 Years | 68 (7.9%) | 68 (8.0%) |
| 70 to 74 Years | 32 (3.7%) | 27 (3.2%) |
| 75 to 79 Years | 11 (1.3%) | 25 (3.0%) |
| 80 to 84 Years | 17 (2.0%) | 14 (1.7%) |
| 85 Years and over | 18 (2.1%) | 19 (2.2%) |
| Total | 866 (100.0%) | 846 (100.0%) |
Families and Households in Long Lake
Median Family Size in Long Lake
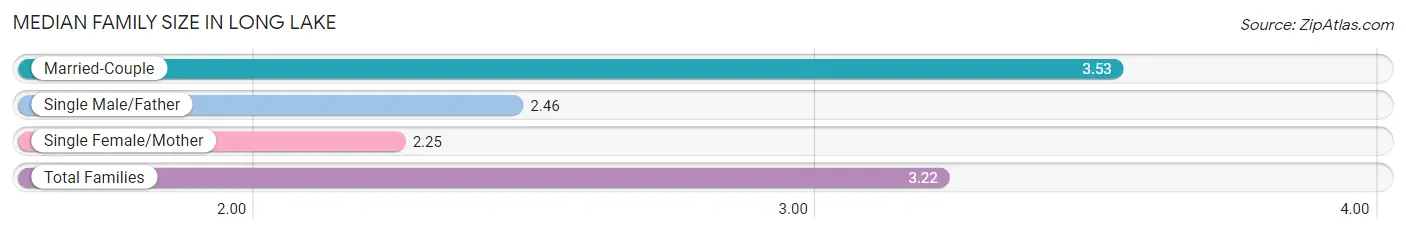
The median family size in Long Lake is 3.22 persons per family, with married-couple families (293 | 75.1%) accounting for the largest median family size of 3.53 persons per family. On the other hand, single female/mother families (73 | 18.7%) represent the smallest median family size with 2.25 persons per family.
| Family Type | # Families | Family Size |
| Married-Couple | 293 (75.1%) | 3.53 |
| Single Male/Father | 24 (6.1%) | 2.46 |
| Single Female/Mother | 73 (18.7%) | 2.25 |
| Total Families | 390 (100.0%) | 3.22 |
Median Household Size in Long Lake
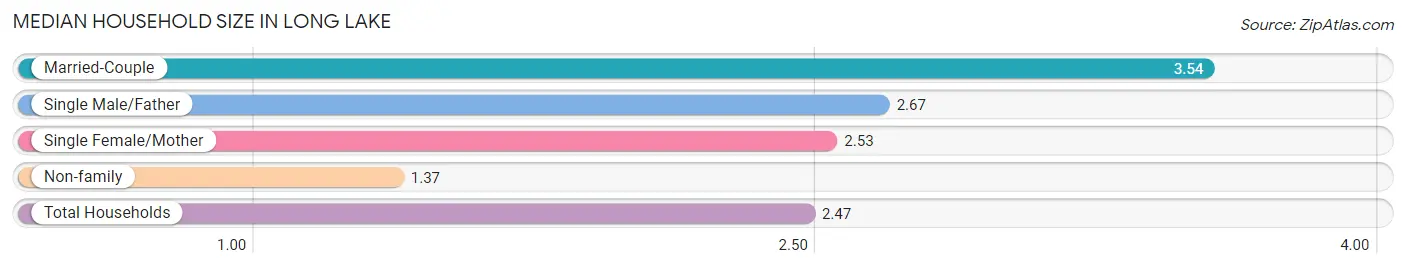
The median household size in Long Lake is 2.47 persons per household, with married-couple households (293 | 42.8%) accounting for the largest median household size of 3.54 persons per household. non-family households (294 | 43.0%) represent the smallest median household size with 1.37 persons per household.
| Household Type | # Households | Household Size |
| Married-Couple | 293 (42.8%) | 3.54 |
| Single Male/Father | 24 (3.5%) | 2.67 |
| Single Female/Mother | 73 (10.7%) | 2.53 |
| Non-family | 294 (43.0%) | 1.37 |
| Total Households | 684 (100.0%) | 2.47 |
Household Size by Marriage Status in Long Lake
Out of a total of 684 households in Long Lake, 390 (57.0%) are family households, while 294 (43.0%) are nonfamily households. The most numerous type of family households are 2-person households, comprising 164, and the most common type of nonfamily households are 1-person households, comprising 225.
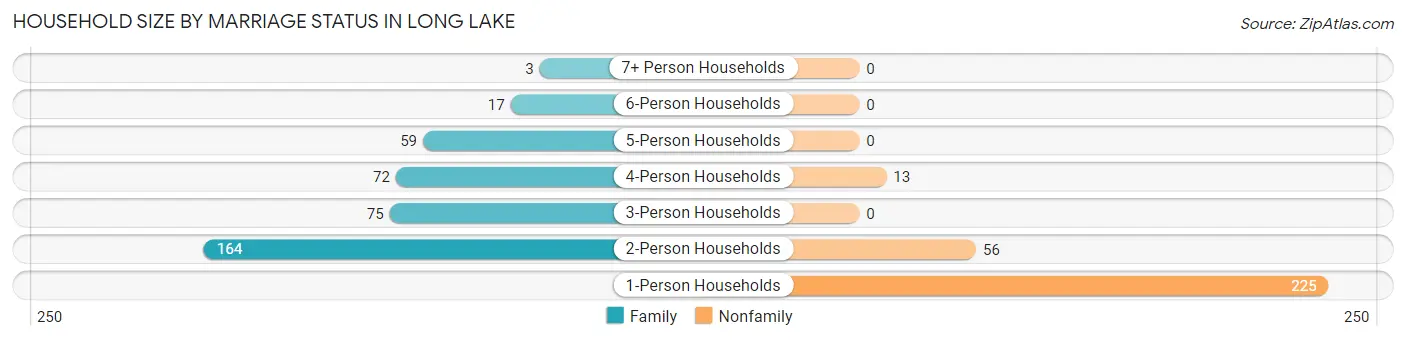
| Household Size | Family Households | Nonfamily Households |
| 1-Person Households | - | 225 (32.9%) |
| 2-Person Households | 164 (24.0%) | 56 (8.2%) |
| 3-Person Households | 75 (11.0%) | 0 (0.0%) |
| 4-Person Households | 72 (10.5%) | 13 (1.9%) |
| 5-Person Households | 59 (8.6%) | 0 (0.0%) |
| 6-Person Households | 17 (2.5%) | 0 (0.0%) |
| 7+ Person Households | 3 (0.4%) | 0 (0.0%) |
| Total | 390 (57.0%) | 294 (43.0%) |
Female Fertility in Long Lake
Fertility by Age in Long Lake
Average fertility rate in Long Lake is 36.0 births per 1,000 women. Women in the age bracket of 20 to 34 years have the highest fertility rate with 94.0 births per 1,000 women. Women in the age bracket of 20 to 34 years acount for 83.3% of all women with births.
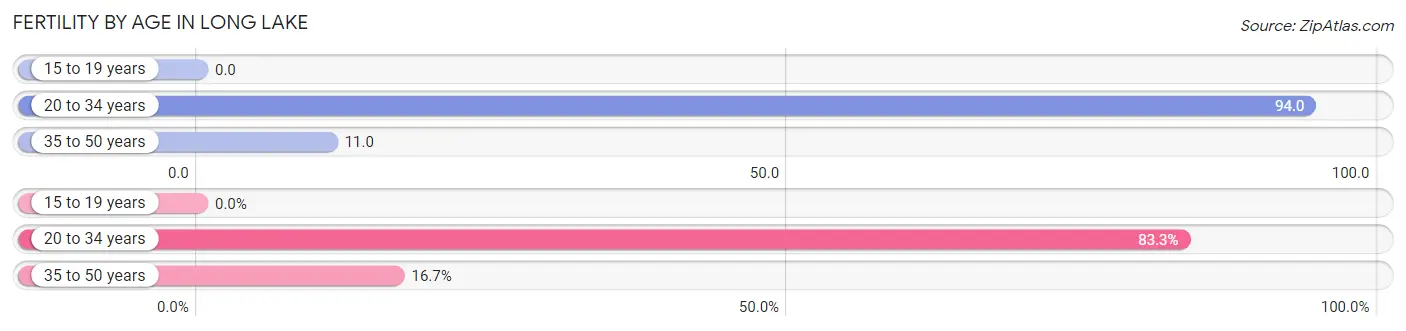
| Age Bracket | Women with Births | Births / 1,000 Women |
| 15 to 19 years | 0 (0.0%) | 0.0 |
| 20 to 34 years | 10 (83.3%) | 94.0 |
| 35 to 50 years | 2 (16.7%) | 11.0 |
| Total | 12 (100.0%) | 36.0 |
Fertility by Age by Marriage Status in Long Lake
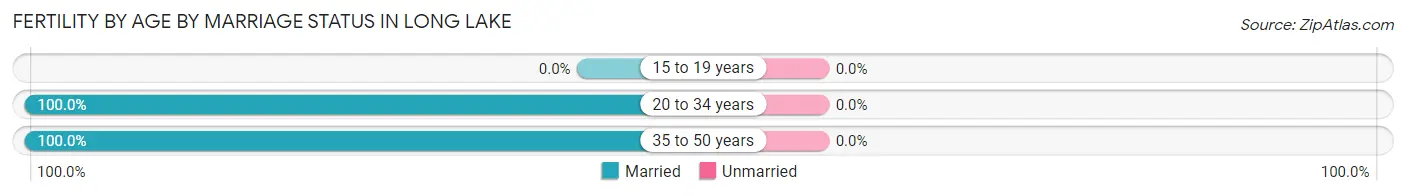
| Age Bracket | Married | Unmarried |
| 15 to 19 years | 0 (0.0%) | 0 (0.0%) |
| 20 to 34 years | 10 (100.0%) | 0 (0.0%) |
| 35 to 50 years | 2 (100.0%) | 0 (0.0%) |
| Total | 12 (100.0%) | 0 (0.0%) |
Fertility by Education in Long Lake
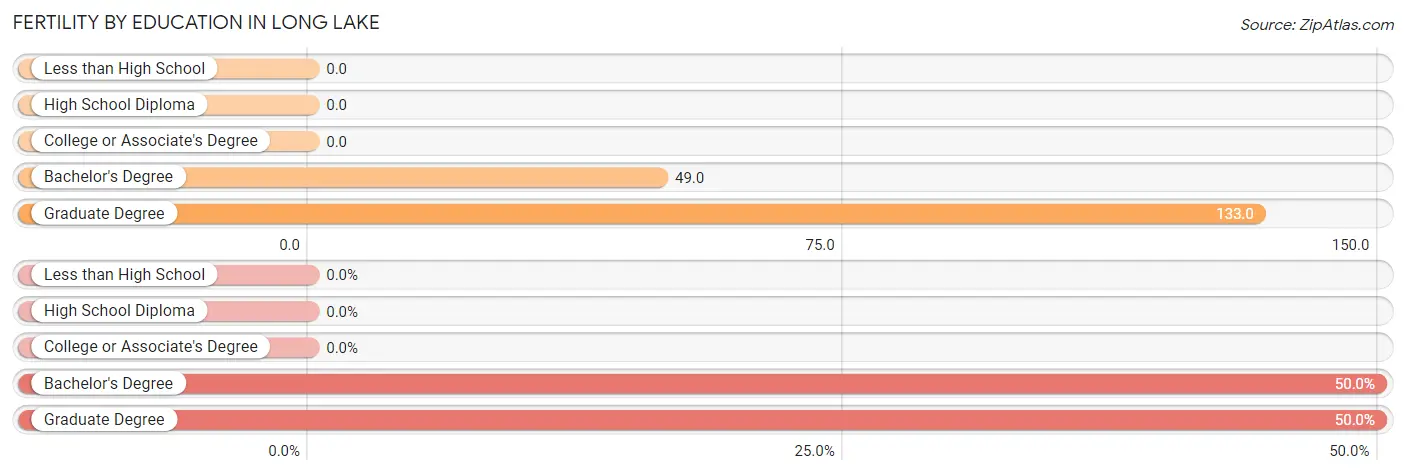
| Educational Attainment | Women with Births | Births / 1,000 Women |
| Less than High School | 0 (0.0%) | 0.0 |
| High School Diploma | 0 (0.0%) | 0.0 |
| College or Associate's Degree | 0 (0.0%) | 0.0 |
| Bachelor's Degree | 6 (50.0%) | 49.0 |
| Graduate Degree | 6 (50.0%) | 133.0 |
| Total | 12 (100.0%) | 36.0 |
Fertility by Education by Marriage Status in Long Lake
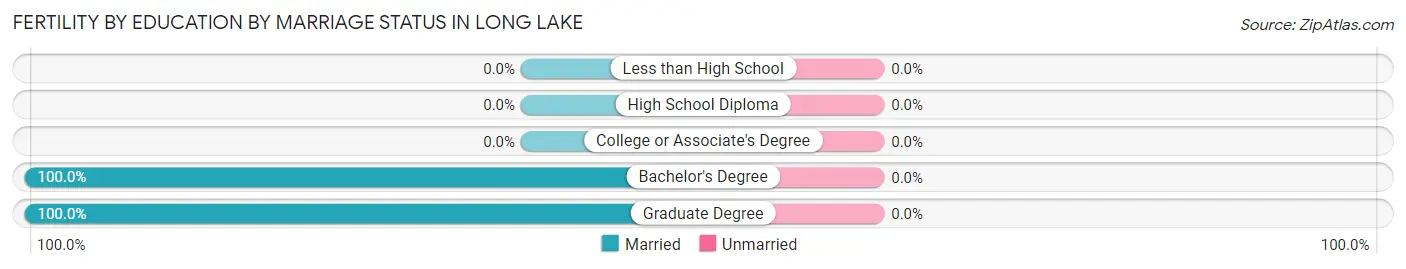
| Educational Attainment | Married | Unmarried |
| Less than High School | 0 (0.0%) | 0 (0.0%) |
| High School Diploma | 0 (0.0%) | 0 (0.0%) |
| College or Associate's Degree | 0 (0.0%) | 0 (0.0%) |
| Bachelor's Degree | 6 (100.0%) | 0 (0.0%) |
| Graduate Degree | 6 (100.0%) | 0 (0.0%) |
| Total | 12 (100.0%) | 0 (0.0%) |
Employment Characteristics in Long Lake
Employment by Class of Employer in Long Lake
Among the 855 employed individuals in Long Lake, private company employees (610 | 71.4%), not-for-profit organizations (91 | 10.6%), and self-employed (not incorporated) (61 | 7.1%) make up the most common classes of employment.
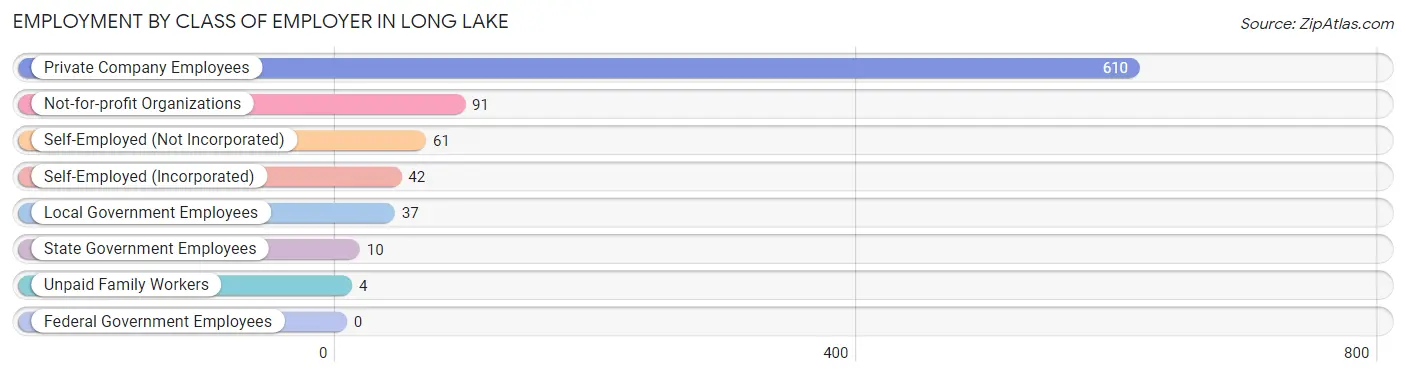
| Employer Class | # Employees | % Employees |
| Private Company Employees | 610 | 71.4% |
| Self-Employed (Incorporated) | 42 | 4.9% |
| Self-Employed (Not Incorporated) | 61 | 7.1% |
| Not-for-profit Organizations | 91 | 10.6% |
| Local Government Employees | 37 | 4.3% |
| State Government Employees | 10 | 1.2% |
| Federal Government Employees | 0 | 0.0% |
| Unpaid Family Workers | 4 | 0.5% |
| Total | 855 | 100.0% |
Employment Status by Age in Long Lake
According to the labor force statistics for Long Lake, out of the total population over 16 years of age (1,341), 69.9% or 937 individuals are in the labor force, with 6.0% or 56 of them unemployed. The age group with the highest labor force participation rate is 55 to 59 years, with 94.1% or 127 individuals in the labor force. Within the labor force, the 20 to 24 years age range has the highest percentage of unemployed individuals, with 31.0% or 9 of them being unemployed.
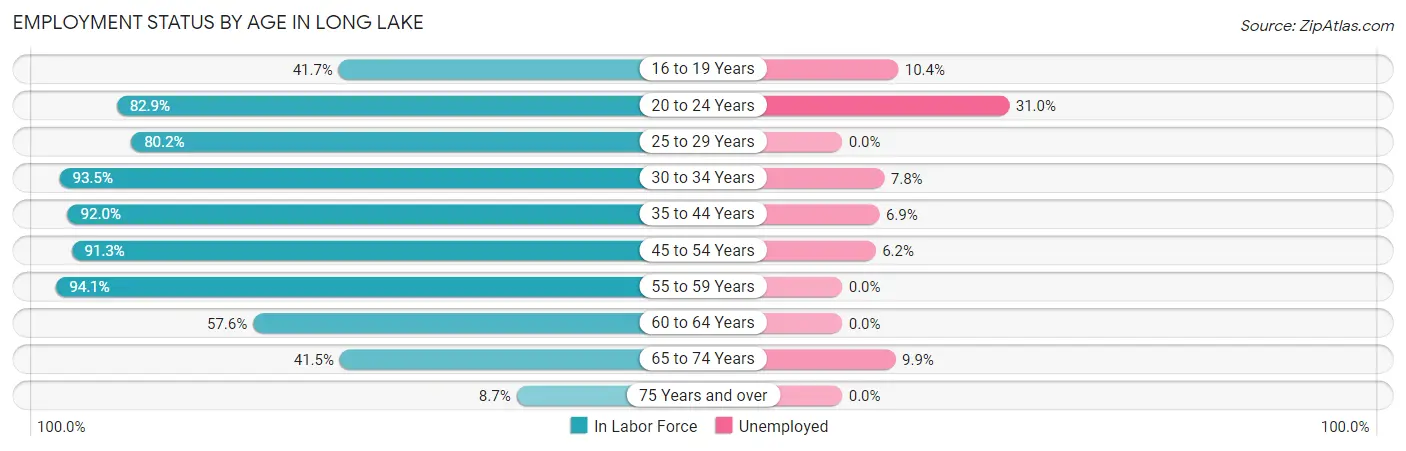
| Age Bracket | In Labor Force | Unemployed |
| 16 to 19 Years | 48 (41.7%) | 5 (10.4%) |
| 20 to 24 Years | 29 (82.9%) | 9 (31.0%) |
| 25 to 29 Years | 73 (80.2%) | 0 (0.0%) |
| 30 to 34 Years | 115 (93.5%) | 9 (7.8%) |
| 35 to 44 Years | 173 (92.0%) | 12 (6.9%) |
| 45 to 54 Years | 210 (91.3%) | 13 (6.2%) |
| 55 to 59 Years | 127 (94.1%) | 0 (0.0%) |
| 60 to 64 Years | 72 (57.6%) | 0 (0.0%) |
| 65 to 74 Years | 81 (41.5%) | 8 (9.9%) |
| 75 Years and over | 9 (8.7%) | 0 (0.0%) |
| Total | 937 (69.9%) | 56 (6.0%) |
Employment Status by Educational Attainment in Long Lake
According to labor force statistics for Long Lake, 86.3% of individuals (770) out of the total population between 25 and 64 years of age (892) are in the labor force, with 4.4% or 34 of them being unemployed. The group with the highest labor force participation rate are those with the educational attainment of bachelor's degree or higher, with 93.2% or 440 individuals in the labor force. Within the labor force, individuals with high school diploma education have the highest percentage of unemployment, with 9.8% or 16 of them being unemployed.
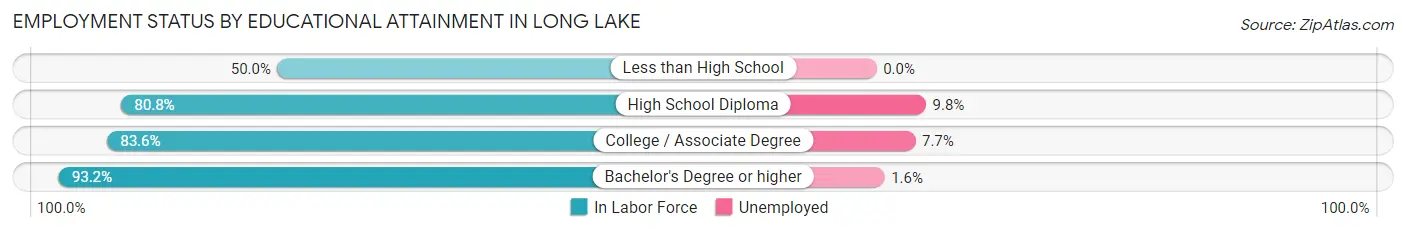
| Educational Attainment | In Labor Force | Unemployed |
| Less than High School | 23 (50.0%) | 0 (0.0%) |
| High School Diploma | 164 (80.8%) | 20 (9.8%) |
| College / Associate Degree | 143 (83.6%) | 13 (7.7%) |
| Bachelor's Degree or higher | 440 (93.2%) | 8 (1.6%) |
| Total | 770 (86.3%) | 39 (4.4%) |
Employment Occupations by Sex in Long Lake
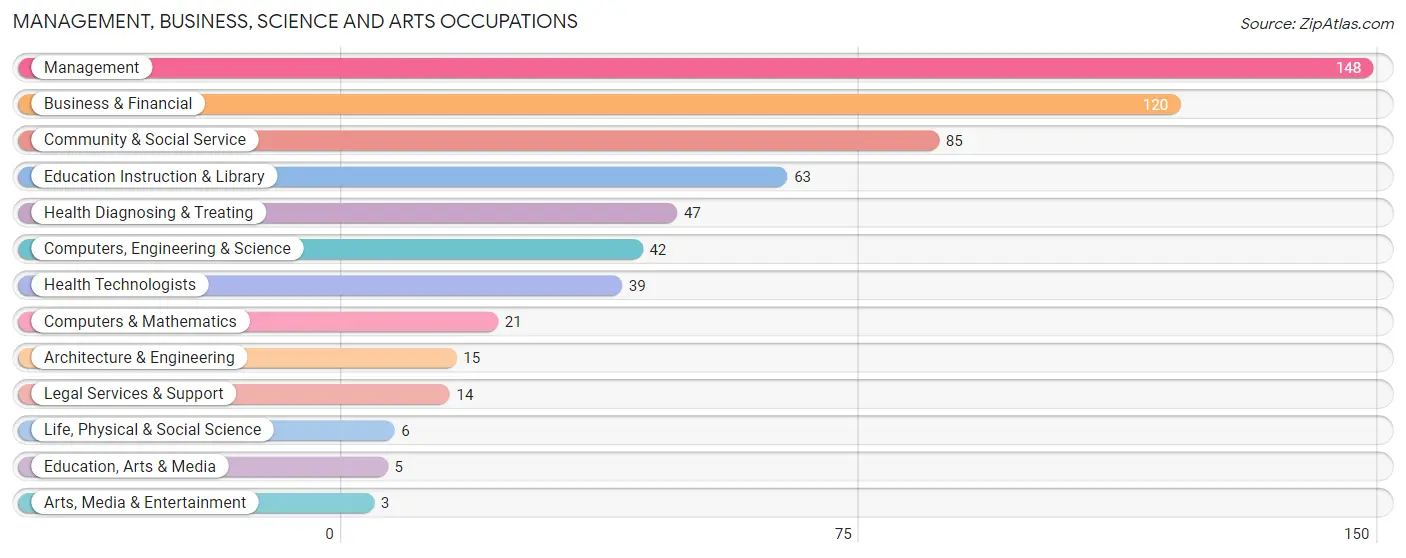
Management, Business, Science and Arts Occupations
The most common Management, Business, Science and Arts occupations in Long Lake are Management (148 | 16.8%), Business & Financial (120 | 13.6%), Community & Social Service (85 | 9.7%), Education Instruction & Library (63 | 7.1%), and Health Diagnosing & Treating (47 | 5.3%).
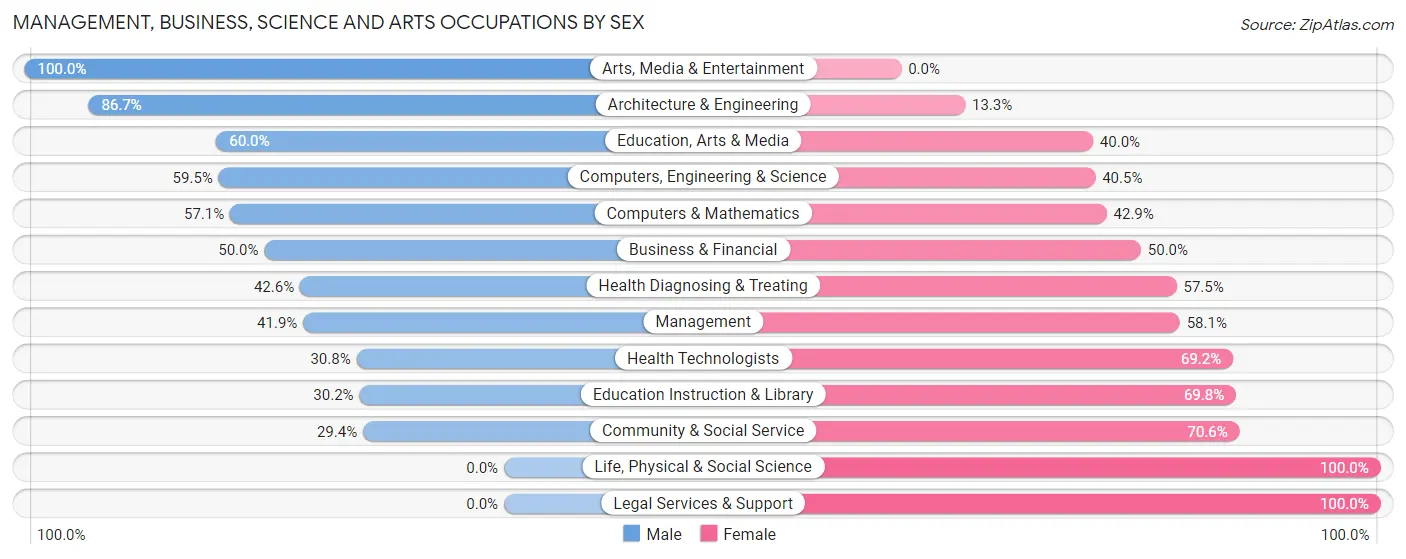
Management, Business, Science and Arts Occupations by Sex
Within the Management, Business, Science and Arts occupations in Long Lake, the most male-oriented occupations are Arts, Media & Entertainment (100.0%), Architecture & Engineering (86.7%), and Education, Arts & Media (60.0%), while the most female-oriented occupations are Life, Physical & Social Science (100.0%), Legal Services & Support (100.0%), and Community & Social Service (70.6%).
| Occupation | Male | Female |
| Management | 62 (41.9%) | 86 (58.1%) |
| Business & Financial | 60 (50.0%) | 60 (50.0%) |
| Computers, Engineering & Science | 25 (59.5%) | 17 (40.5%) |
| Computers & Mathematics | 12 (57.1%) | 9 (42.9%) |
| Architecture & Engineering | 13 (86.7%) | 2 (13.3%) |
| Life, Physical & Social Science | 0 (0.0%) | 6 (100.0%) |
| Community & Social Service | 25 (29.4%) | 60 (70.6%) |
| Education, Arts & Media | 3 (60.0%) | 2 (40.0%) |
| Legal Services & Support | 0 (0.0%) | 14 (100.0%) |
| Education Instruction & Library | 19 (30.2%) | 44 (69.8%) |
| Arts, Media & Entertainment | 3 (100.0%) | 0 (0.0%) |
| Health Diagnosing & Treating | 20 (42.5%) | 27 (57.5%) |
| Health Technologists | 12 (30.8%) | 27 (69.2%) |
| Total (Category) | 192 (43.4%) | 250 (56.6%) |
| Total (Overall) | 444 (50.4%) | 437 (49.6%) |
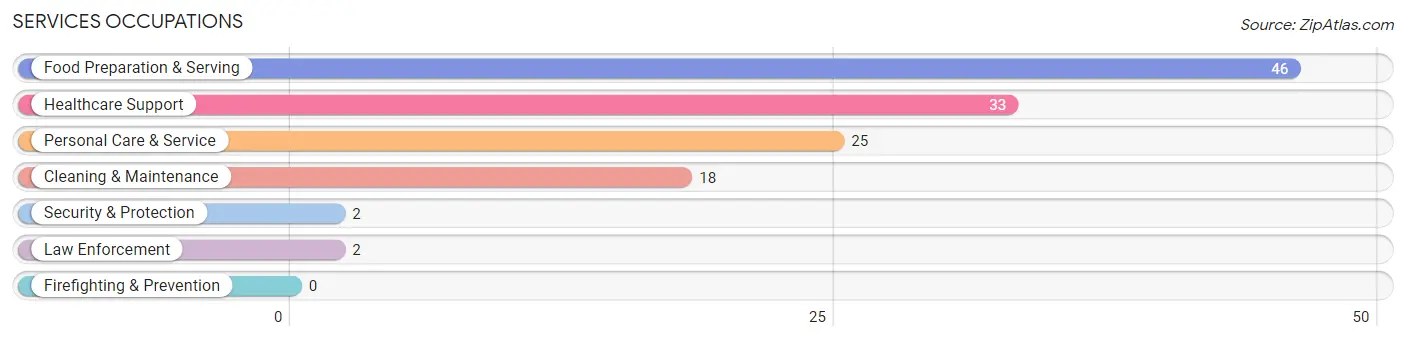
Services Occupations
The most common Services occupations in Long Lake are Food Preparation & Serving (46 | 5.2%), Healthcare Support (33 | 3.7%), Personal Care & Service (25 | 2.8%), Cleaning & Maintenance (18 | 2.0%), and Security & Protection (2 | 0.2%).
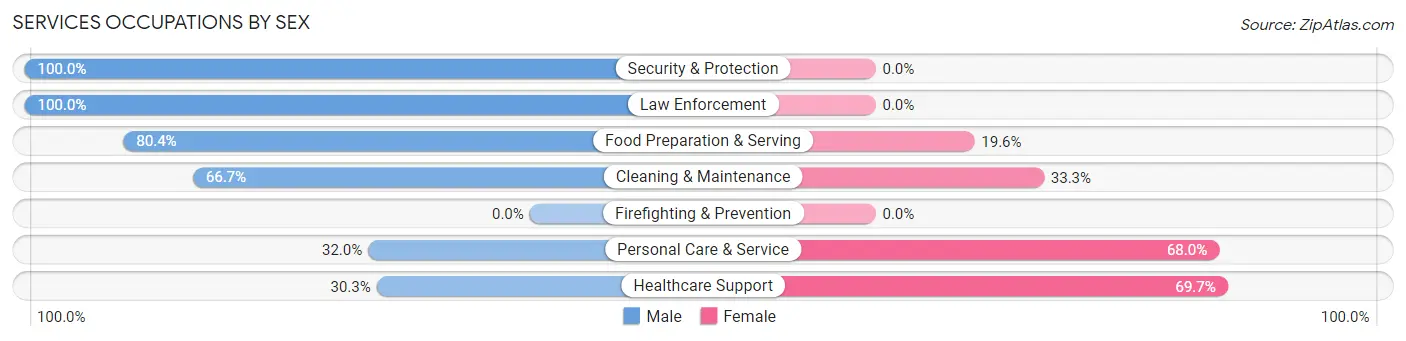
Services Occupations by Sex
Within the Services occupations in Long Lake, the most male-oriented occupations are Security & Protection (100.0%), Law Enforcement (100.0%), and Food Preparation & Serving (80.4%), while the most female-oriented occupations are Healthcare Support (69.7%), Personal Care & Service (68.0%), and Cleaning & Maintenance (33.3%).
| Occupation | Male | Female |
| Healthcare Support | 10 (30.3%) | 23 (69.7%) |
| Security & Protection | 2 (100.0%) | 0 (0.0%) |
| Firefighting & Prevention | 0 (0.0%) | 0 (0.0%) |
| Law Enforcement | 2 (100.0%) | 0 (0.0%) |
| Food Preparation & Serving | 37 (80.4%) | 9 (19.6%) |
| Cleaning & Maintenance | 12 (66.7%) | 6 (33.3%) |
| Personal Care & Service | 8 (32.0%) | 17 (68.0%) |
| Total (Category) | 69 (55.6%) | 55 (44.4%) |
| Total (Overall) | 444 (50.4%) | 437 (49.6%) |
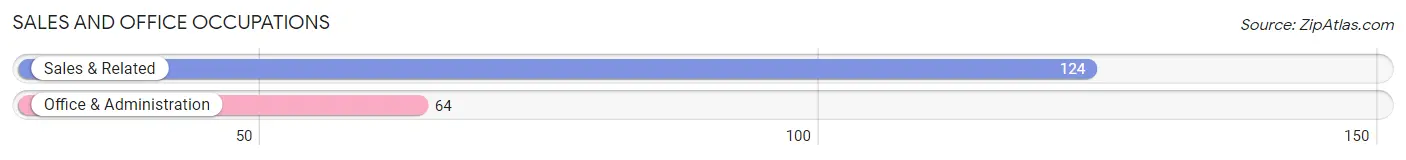
Sales and Office Occupations
The most common Sales and Office occupations in Long Lake are Sales & Related (124 | 14.1%), and Office & Administration (64 | 7.3%).
Sales and Office Occupations by Sex
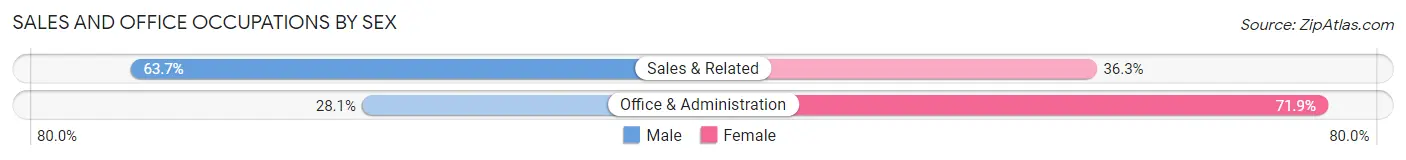
| Occupation | Male | Female |
| Sales & Related | 79 (63.7%) | 45 (36.3%) |
| Office & Administration | 18 (28.1%) | 46 (71.9%) |
| Total (Category) | 97 (51.6%) | 91 (48.4%) |
| Total (Overall) | 444 (50.4%) | 437 (49.6%) |
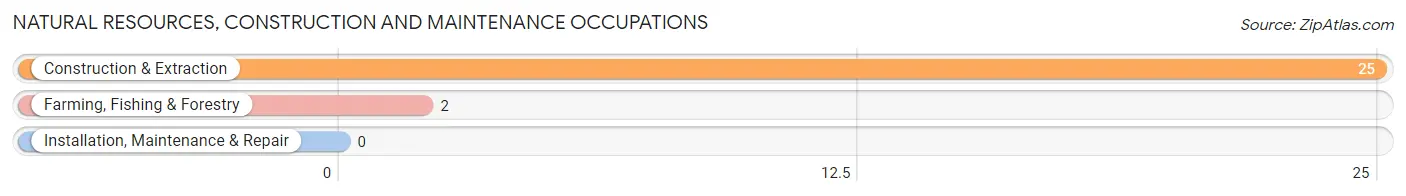
Natural Resources, Construction and Maintenance Occupations
The most common Natural Resources, Construction and Maintenance occupations in Long Lake are Construction & Extraction (25 | 2.8%), and Farming, Fishing & Forestry (2 | 0.2%).
Natural Resources, Construction and Maintenance Occupations by Sex
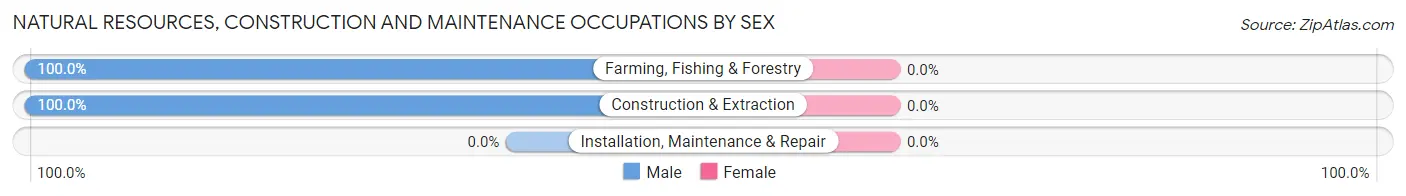
| Occupation | Male | Female |
| Farming, Fishing & Forestry | 2 (100.0%) | 0 (0.0%) |
| Construction & Extraction | 25 (100.0%) | 0 (0.0%) |
| Installation, Maintenance & Repair | 0 (0.0%) | 0 (0.0%) |
| Total (Category) | 27 (100.0%) | 0 (0.0%) |
| Total (Overall) | 444 (50.4%) | 437 (49.6%) |
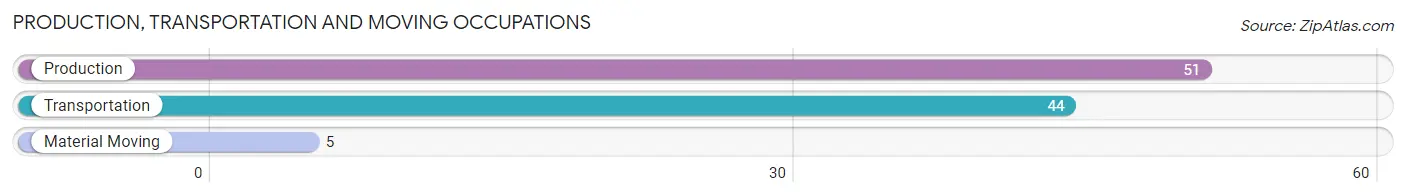
Production, Transportation and Moving Occupations
The most common Production, Transportation and Moving occupations in Long Lake are Production (51 | 5.8%), Transportation (44 | 5.0%), and Material Moving (5 | 0.6%).
Production, Transportation and Moving Occupations by Sex
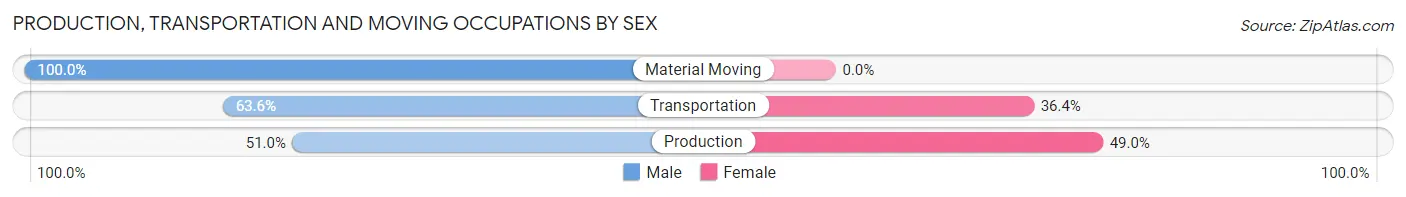
| Occupation | Male | Female |
| Production | 26 (51.0%) | 25 (49.0%) |
| Transportation | 28 (63.6%) | 16 (36.4%) |
| Material Moving | 5 (100.0%) | 0 (0.0%) |
| Total (Category) | 59 (59.0%) | 41 (41.0%) |
| Total (Overall) | 444 (50.4%) | 437 (49.6%) |
Employment Industries by Sex in Long Lake
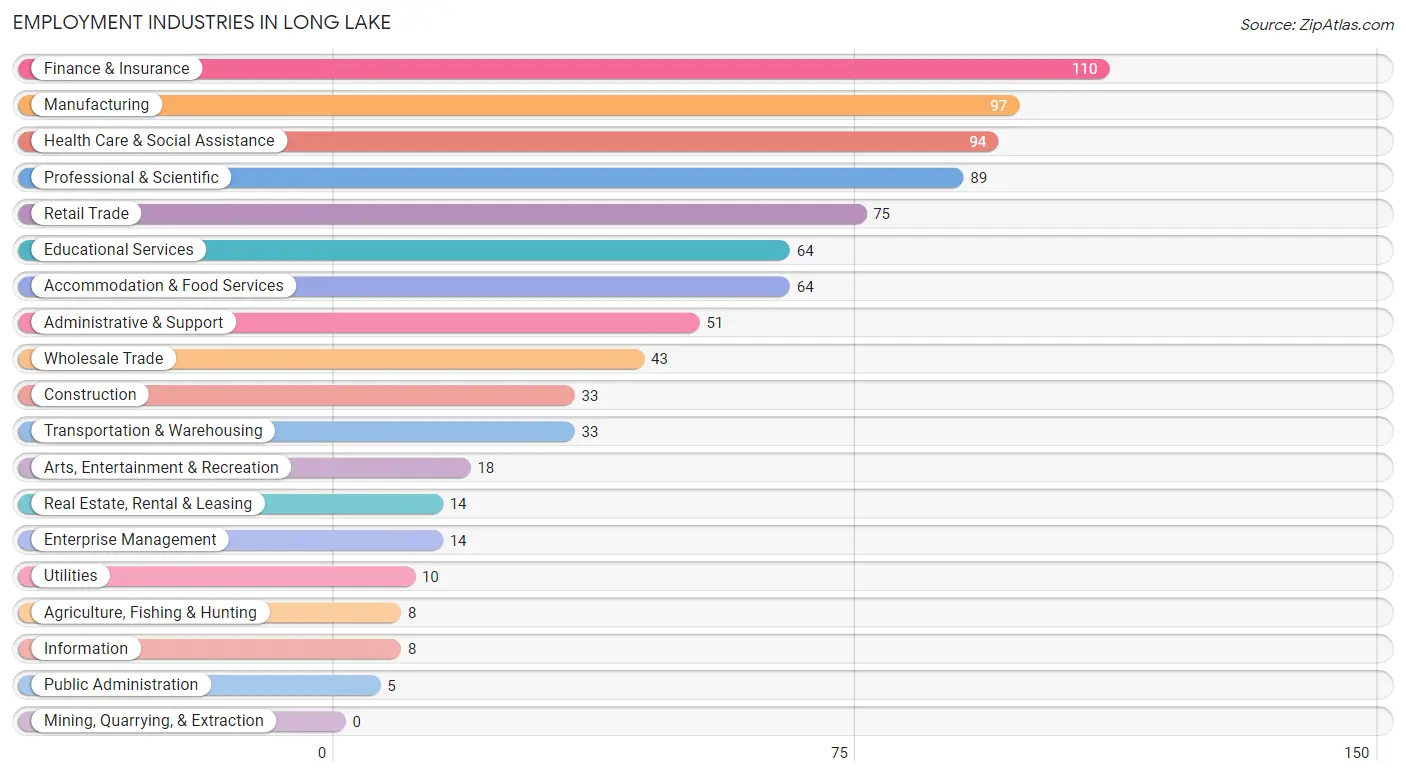
Employment Industries in Long Lake
The major employment industries in Long Lake include Finance & Insurance (110 | 12.5%), Manufacturing (97 | 11.0%), Health Care & Social Assistance (94 | 10.7%), Professional & Scientific (89 | 10.1%), and Retail Trade (75 | 8.5%).
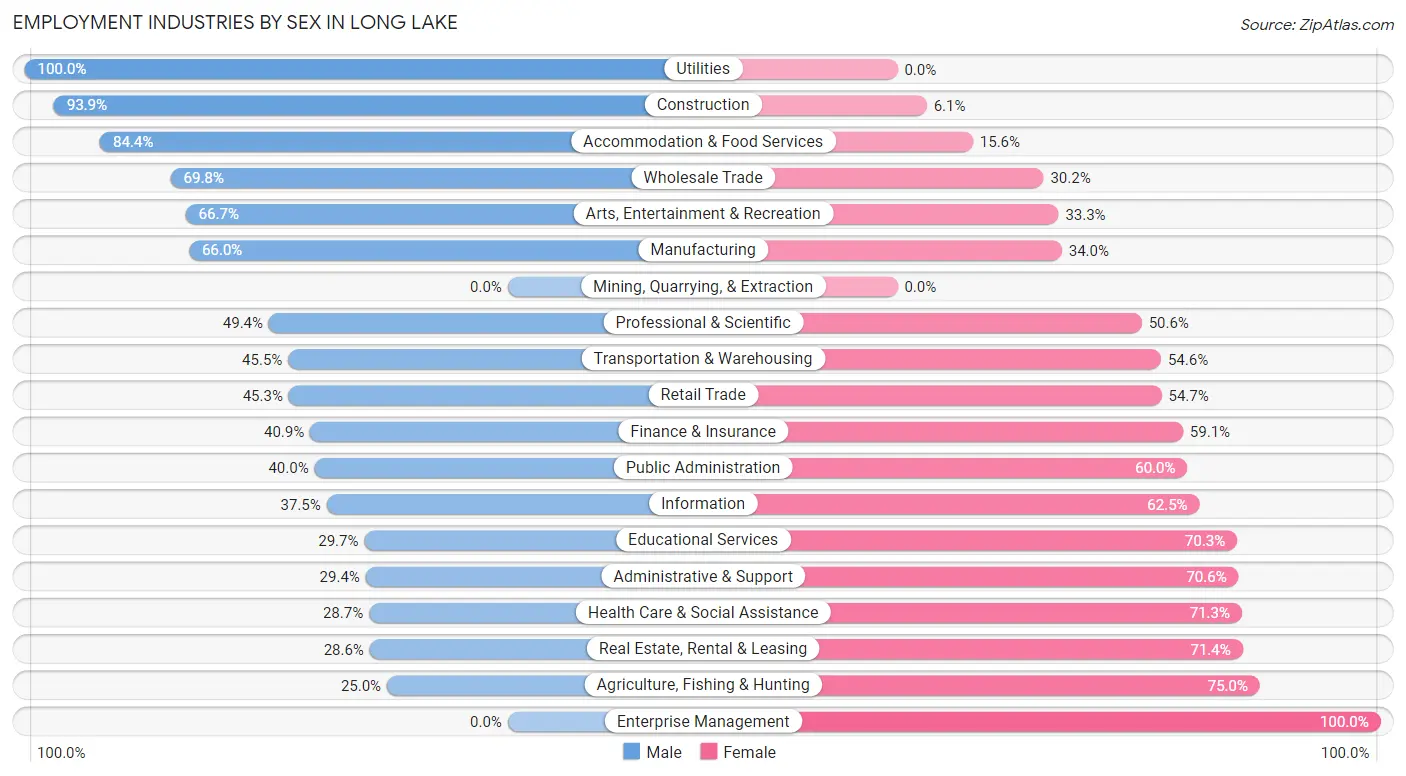
Employment Industries by Sex in Long Lake
The Long Lake industries that see more men than women are Utilities (100.0%), Construction (93.9%), and Accommodation & Food Services (84.4%), whereas the industries that tend to have a higher number of women are Enterprise Management (100.0%), Agriculture, Fishing & Hunting (75.0%), and Real Estate, Rental & Leasing (71.4%).
| Industry | Male | Female |
| Agriculture, Fishing & Hunting | 2 (25.0%) | 6 (75.0%) |
| Mining, Quarrying, & Extraction | 0 (0.0%) | 0 (0.0%) |
| Construction | 31 (93.9%) | 2 (6.1%) |
| Manufacturing | 64 (66.0%) | 33 (34.0%) |
| Wholesale Trade | 30 (69.8%) | 13 (30.2%) |
| Retail Trade | 34 (45.3%) | 41 (54.7%) |
| Transportation & Warehousing | 15 (45.5%) | 18 (54.5%) |
| Utilities | 10 (100.0%) | 0 (0.0%) |
| Information | 3 (37.5%) | 5 (62.5%) |
| Finance & Insurance | 45 (40.9%) | 65 (59.1%) |
| Real Estate, Rental & Leasing | 4 (28.6%) | 10 (71.4%) |
| Professional & Scientific | 44 (49.4%) | 45 (50.6%) |
| Enterprise Management | 0 (0.0%) | 14 (100.0%) |
| Administrative & Support | 15 (29.4%) | 36 (70.6%) |
| Educational Services | 19 (29.7%) | 45 (70.3%) |
| Health Care & Social Assistance | 27 (28.7%) | 67 (71.3%) |
| Arts, Entertainment & Recreation | 12 (66.7%) | 6 (33.3%) |
| Accommodation & Food Services | 54 (84.4%) | 10 (15.6%) |
| Public Administration | 2 (40.0%) | 3 (60.0%) |
| Total | 444 (50.4%) | 437 (49.6%) |
Education in Long Lake
School Enrollment in Long Lake
The most common levels of schooling among the 452 students in Long Lake are high school (148 | 32.7%), elementary school (98 | 21.7%), and middle school (96 | 21.2%).
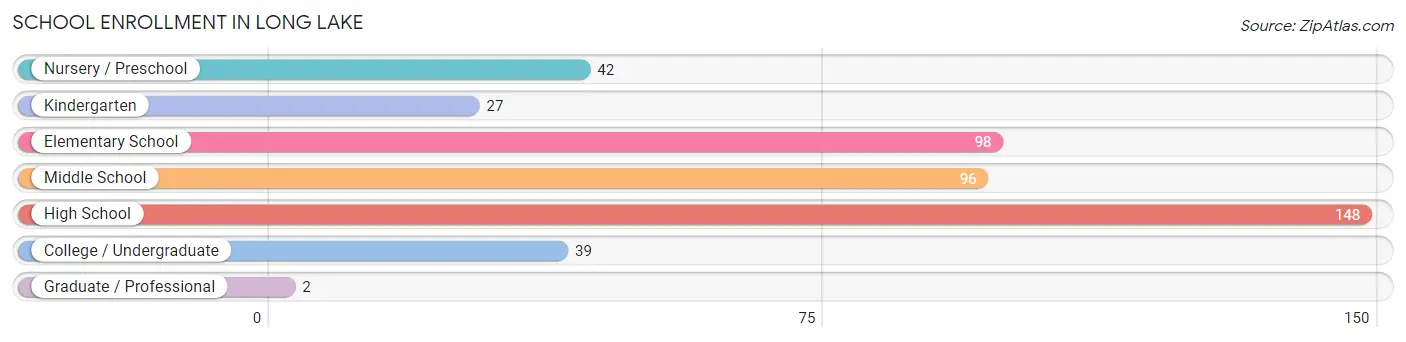
| School Level | # Students | % Students |
| Nursery / Preschool | 42 | 9.3% |
| Kindergarten | 27 | 6.0% |
| Elementary School | 98 | 21.7% |
| Middle School | 96 | 21.2% |
| High School | 148 | 32.7% |
| College / Undergraduate | 39 | 8.6% |
| Graduate / Professional | 2 | 0.4% |
| Total | 452 | 100.0% |
School Enrollment by Age by Funding Source in Long Lake
Out of a total of 452 students who are enrolled in schools in Long Lake, 80 (17.7%) attend a private institution, while the remaining 372 (82.3%) are enrolled in public schools. The age group of 35 years and over has the highest likelihood of being enrolled in private schools, with 9 (69.2% in the age bracket) enrolled. Conversely, the age group of 15 to 17 year olds has the lowest likelihood of being enrolled in a private school, with 102 (100.0% in the age bracket) attending a public institution.
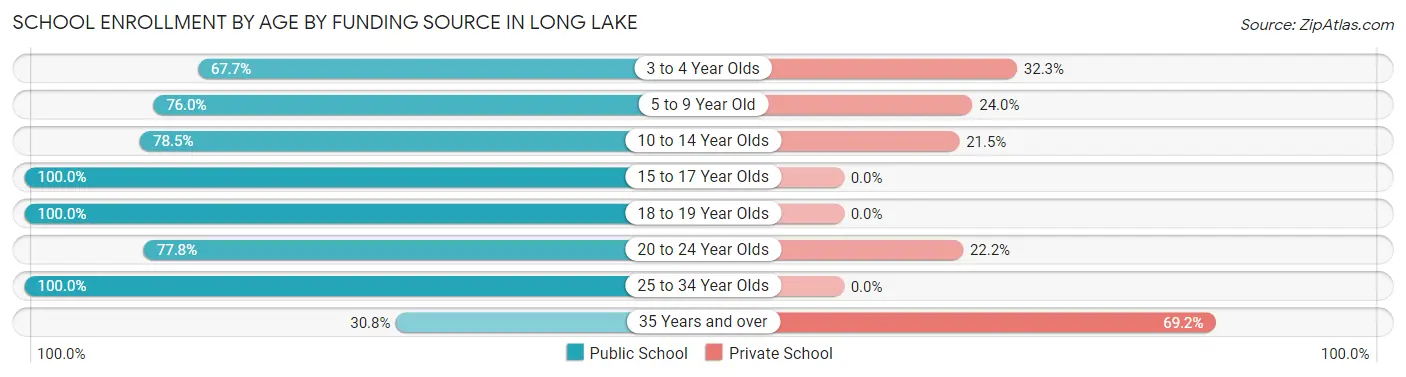
| Age Bracket | Public School | Private School |
| 3 to 4 Year Olds | 21 (67.7%) | 10 (32.3%) |
| 5 to 9 Year Old | 73 (76.0%) | 23 (24.0%) |
| 10 to 14 Year Olds | 124 (78.5%) | 34 (21.5%) |
| 15 to 17 Year Olds | 102 (100.0%) | 0 (0.0%) |
| 18 to 19 Year Olds | 24 (100.0%) | 0 (0.0%) |
| 20 to 24 Year Olds | 14 (77.8%) | 4 (22.2%) |
| 25 to 34 Year Olds | 10 (100.0%) | 0 (0.0%) |
| 35 Years and over | 4 (30.8%) | 9 (69.2%) |
| Total | 372 (82.3%) | 80 (17.7%) |
Educational Attainment by Field of Study in Long Lake
Business (148 | 22.8%), communications (60 | 9.2%), engineering (53 | 8.2%), social sciences (49 | 7.5%), and visual & performing arts (47 | 7.2%) are the most common fields of study among 649 individuals in Long Lake who have obtained a bachelor's degree or higher.
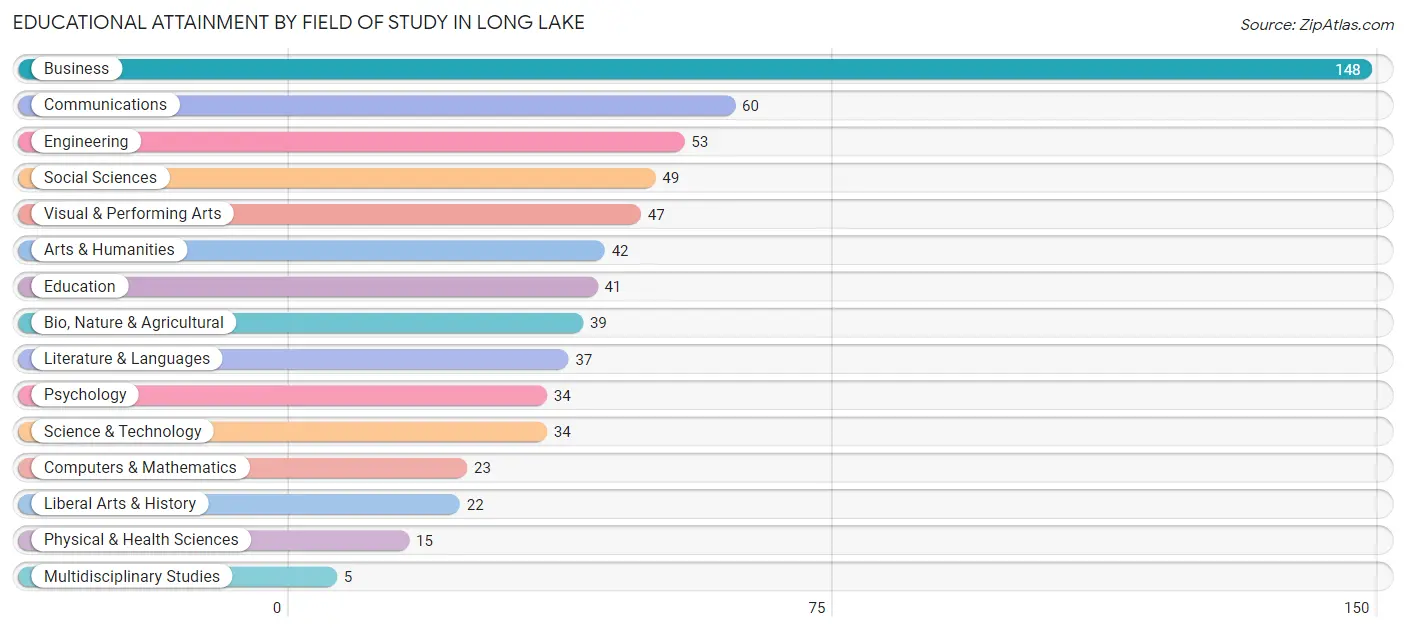
| Field of Study | # Graduates | % Graduates |
| Computers & Mathematics | 23 | 3.5% |
| Bio, Nature & Agricultural | 39 | 6.0% |
| Physical & Health Sciences | 15 | 2.3% |
| Psychology | 34 | 5.2% |
| Social Sciences | 49 | 7.5% |
| Engineering | 53 | 8.2% |
| Multidisciplinary Studies | 5 | 0.8% |
| Science & Technology | 34 | 5.2% |
| Business | 148 | 22.8% |
| Education | 41 | 6.3% |
| Literature & Languages | 37 | 5.7% |
| Liberal Arts & History | 22 | 3.4% |
| Visual & Performing Arts | 47 | 7.2% |
| Communications | 60 | 9.2% |
| Arts & Humanities | 42 | 6.5% |
| Total | 649 | 100.0% |
Transportation & Commute in Long Lake
Vehicle Availability by Sex in Long Lake
The most prevalent vehicle ownership categories in Long Lake are males with 2 vehicles (183, accounting for 43.4%) and females with 2 vehicles (168, making up 42.3%).
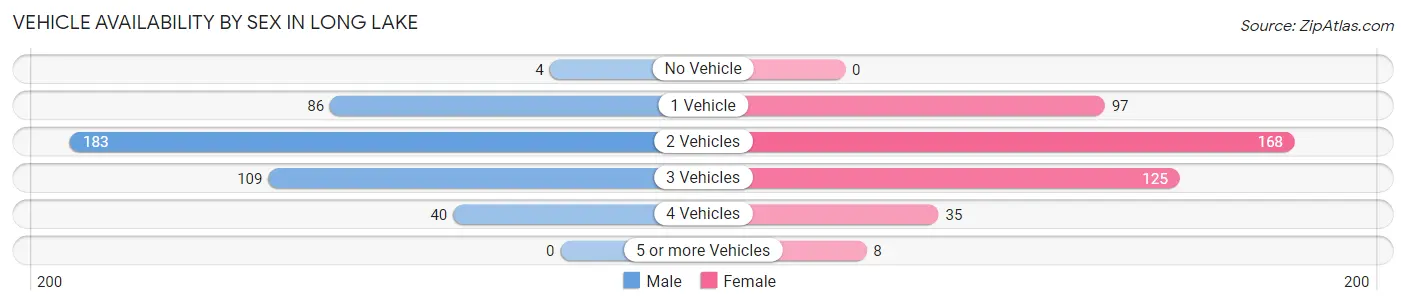
| Vehicles Available | Male | Female |
| No Vehicle | 4 (0.9%) | 0 (0.0%) |
| 1 Vehicle | 86 (20.4%) | 97 (22.4%) |
| 2 Vehicles | 183 (43.4%) | 168 (38.8%) |
| 3 Vehicles | 109 (25.8%) | 125 (28.9%) |
| 4 Vehicles | 40 (9.5%) | 35 (8.1%) |
| 5 or more Vehicles | 0 (0.0%) | 8 (1.8%) |
| Total | 422 (100.0%) | 433 (100.0%) |
Commute Time in Long Lake
The most frequently occuring commute durations in Long Lake are 30 to 34 minutes (117 commuters, 17.0%), 15 to 19 minutes (116 commuters, 16.8%), and 20 to 24 minutes (104 commuters, 15.1%).
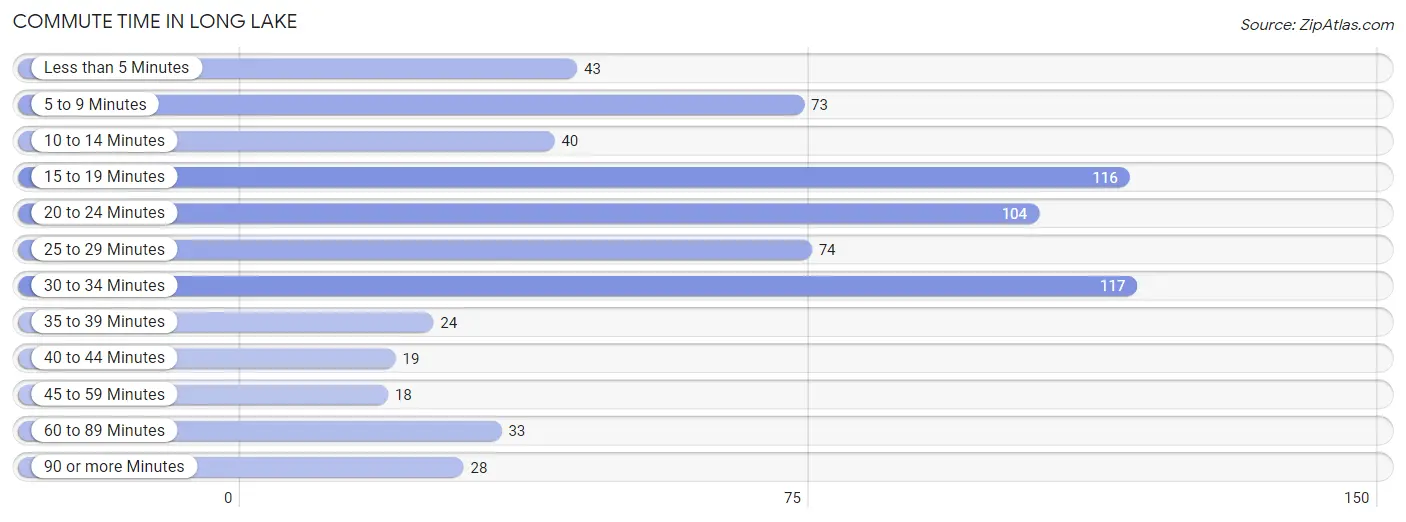
| Commute Time | # Commuters | % Commuters |
| Less than 5 Minutes | 43 | 6.2% |
| 5 to 9 Minutes | 73 | 10.6% |
| 10 to 14 Minutes | 40 | 5.8% |
| 15 to 19 Minutes | 116 | 16.8% |
| 20 to 24 Minutes | 104 | 15.1% |
| 25 to 29 Minutes | 74 | 10.7% |
| 30 to 34 Minutes | 117 | 17.0% |
| 35 to 39 Minutes | 24 | 3.5% |
| 40 to 44 Minutes | 19 | 2.8% |
| 45 to 59 Minutes | 18 | 2.6% |
| 60 to 89 Minutes | 33 | 4.8% |
| 90 or more Minutes | 28 | 4.1% |
Commute Time by Sex in Long Lake
The most common commute times in Long Lake are 20 to 24 minutes (70 commuters, 19.1%) for males and 15 to 19 minutes (60 commuters, 18.6%) for females.
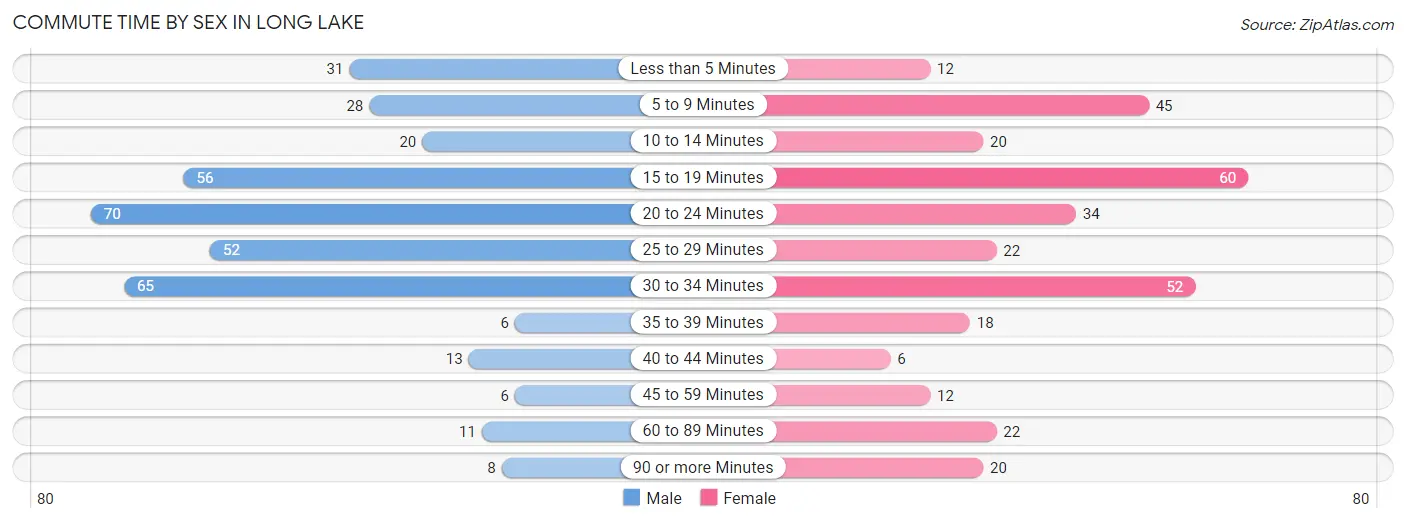
| Commute Time | Male | Female |
| Less than 5 Minutes | 31 (8.5%) | 12 (3.7%) |
| 5 to 9 Minutes | 28 (7.6%) | 45 (13.9%) |
| 10 to 14 Minutes | 20 (5.5%) | 20 (6.2%) |
| 15 to 19 Minutes | 56 (15.3%) | 60 (18.6%) |
| 20 to 24 Minutes | 70 (19.1%) | 34 (10.5%) |
| 25 to 29 Minutes | 52 (14.2%) | 22 (6.8%) |
| 30 to 34 Minutes | 65 (17.8%) | 52 (16.1%) |
| 35 to 39 Minutes | 6 (1.6%) | 18 (5.6%) |
| 40 to 44 Minutes | 13 (3.5%) | 6 (1.9%) |
| 45 to 59 Minutes | 6 (1.6%) | 12 (3.7%) |
| 60 to 89 Minutes | 11 (3.0%) | 22 (6.8%) |
| 90 or more Minutes | 8 (2.2%) | 20 (6.2%) |
Time of Departure to Work by Sex in Long Lake
The most frequent times of departure to work in Long Lake are 7:00 AM to 7:29 AM (58, 15.9%) for males and 8:00 AM to 8:29 AM (63, 19.5%) for females.
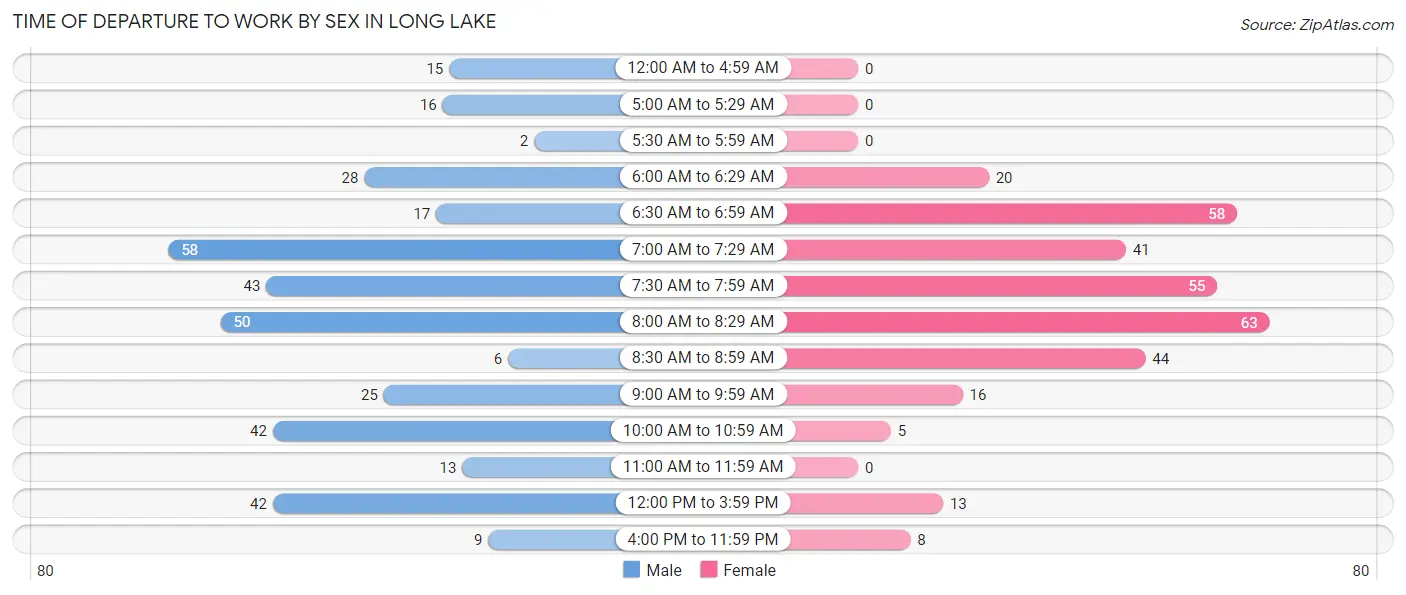
| Time of Departure | Male | Female |
| 12:00 AM to 4:59 AM | 15 (4.1%) | 0 (0.0%) |
| 5:00 AM to 5:29 AM | 16 (4.4%) | 0 (0.0%) |
| 5:30 AM to 5:59 AM | 2 (0.5%) | 0 (0.0%) |
| 6:00 AM to 6:29 AM | 28 (7.6%) | 20 (6.2%) |
| 6:30 AM to 6:59 AM | 17 (4.6%) | 58 (18.0%) |
| 7:00 AM to 7:29 AM | 58 (15.9%) | 41 (12.7%) |
| 7:30 AM to 7:59 AM | 43 (11.7%) | 55 (17.0%) |
| 8:00 AM to 8:29 AM | 50 (13.7%) | 63 (19.5%) |
| 8:30 AM to 8:59 AM | 6 (1.6%) | 44 (13.6%) |
| 9:00 AM to 9:59 AM | 25 (6.8%) | 16 (5.0%) |
| 10:00 AM to 10:59 AM | 42 (11.5%) | 5 (1.5%) |
| 11:00 AM to 11:59 AM | 13 (3.5%) | 0 (0.0%) |
| 12:00 PM to 3:59 PM | 42 (11.5%) | 13 (4.0%) |
| 4:00 PM to 11:59 PM | 9 (2.5%) | 8 (2.5%) |
| Total | 366 (100.0%) | 323 (100.0%) |
Housing Occupancy in Long Lake
Occupancy by Ownership in Long Lake
Of the total 684 dwellings in Long Lake, owner-occupied units account for 445 (65.1%), while renter-occupied units make up 239 (34.9%).
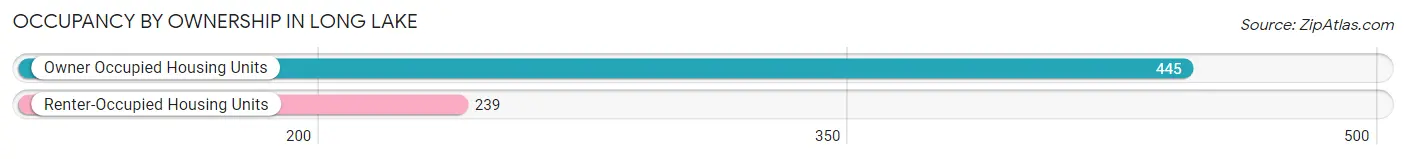
| Occupancy | # Housing Units | % Housing Units |
| Owner Occupied Housing Units | 445 | 65.1% |
| Renter-Occupied Housing Units | 239 | 34.9% |
| Total Occupied Housing Units | 684 | 100.0% |
Occupancy by Household Size in Long Lake
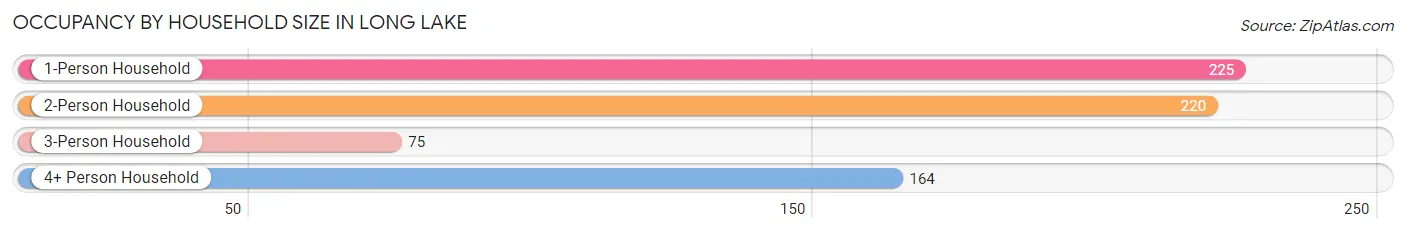
| Household Size | # Housing Units | % Housing Units |
| 1-Person Household | 225 | 32.9% |
| 2-Person Household | 220 | 32.2% |
| 3-Person Household | 75 | 11.0% |
| 4+ Person Household | 164 | 24.0% |
| Total Housing Units | 684 | 100.0% |
Occupancy by Ownership by Household Size in Long Lake
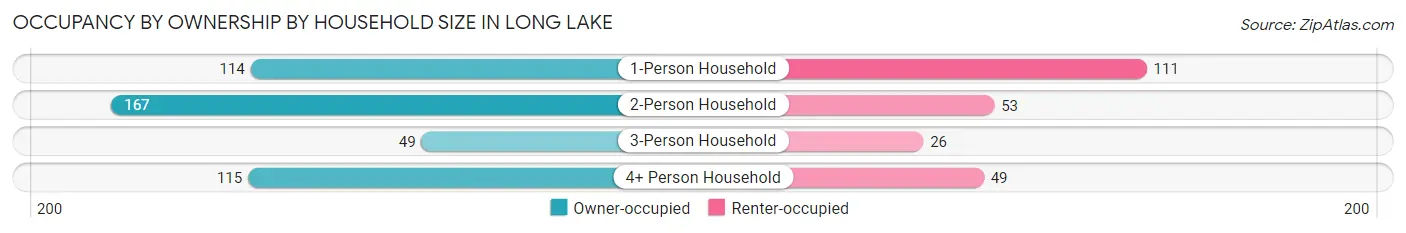
| Household Size | Owner-occupied | Renter-occupied |
| 1-Person Household | 114 (50.7%) | 111 (49.3%) |
| 2-Person Household | 167 (75.9%) | 53 (24.1%) |
| 3-Person Household | 49 (65.3%) | 26 (34.7%) |
| 4+ Person Household | 115 (70.1%) | 49 (29.9%) |
| Total Housing Units | 445 (65.1%) | 239 (34.9%) |
Occupancy by Educational Attainment in Long Lake
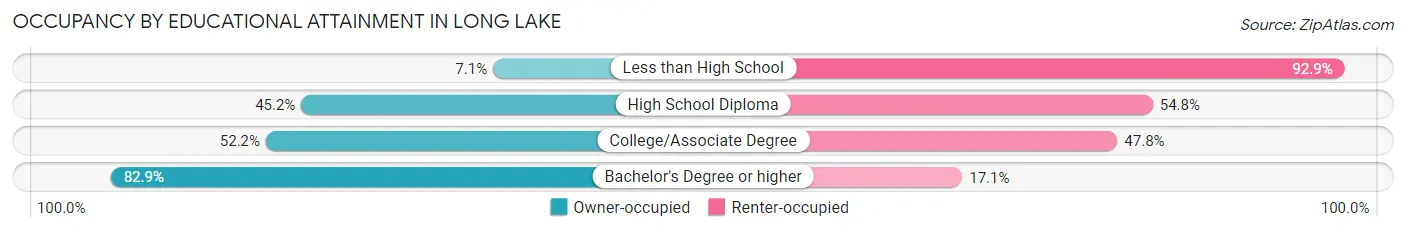
| Household Size | Owner-occupied | Renter-occupied |
| Less than High School | 2 (7.1%) | 26 (92.9%) |
| High School Diploma | 70 (45.2%) | 85 (54.8%) |
| College/Associate Degree | 72 (52.2%) | 66 (47.8%) |
| Bachelor's Degree or higher | 301 (82.9%) | 62 (17.1%) |
Occupancy by Age of Householder in Long Lake
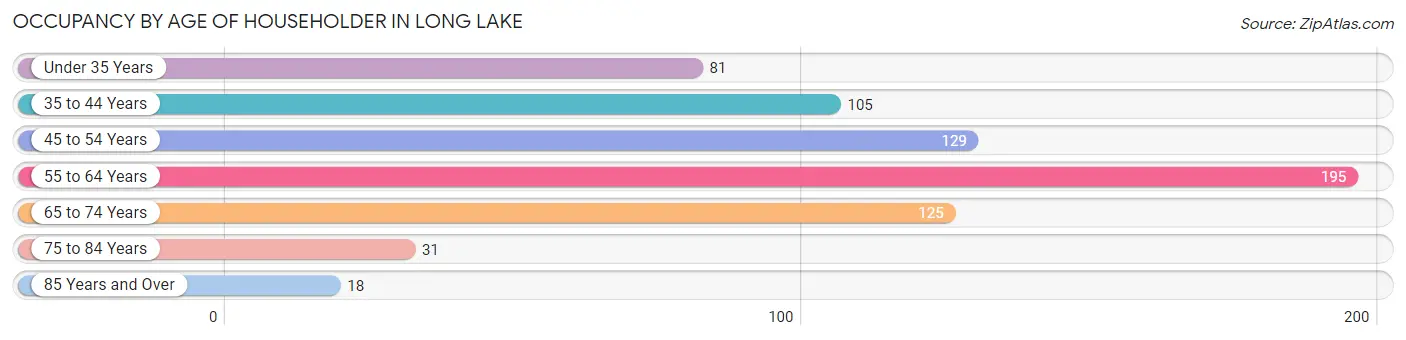
| Age Bracket | # Households | % Households |
| Under 35 Years | 81 | 11.8% |
| 35 to 44 Years | 105 | 15.3% |
| 45 to 54 Years | 129 | 18.9% |
| 55 to 64 Years | 195 | 28.5% |
| 65 to 74 Years | 125 | 18.3% |
| 75 to 84 Years | 31 | 4.5% |
| 85 Years and Over | 18 | 2.6% |
| Total | 684 | 100.0% |
Housing Finances in Long Lake
Median Income by Occupancy in Long Lake
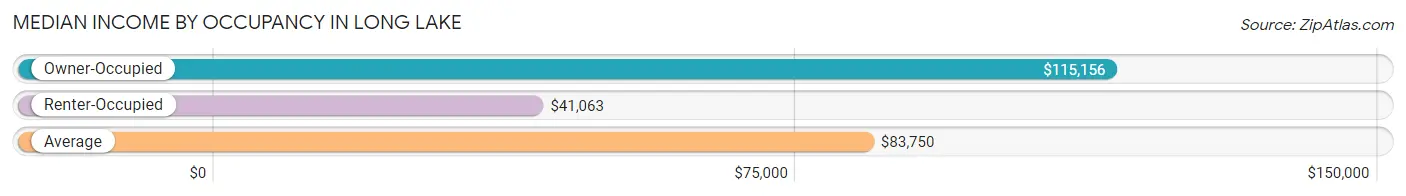
| Occupancy Type | # Households | Median Income |
| Owner-Occupied | 445 (65.1%) | $115,156 |
| Renter-Occupied | 239 (34.9%) | $41,063 |
| Average | 684 (100.0%) | $83,750 |
Occupancy by Householder Income Bracket in Long Lake
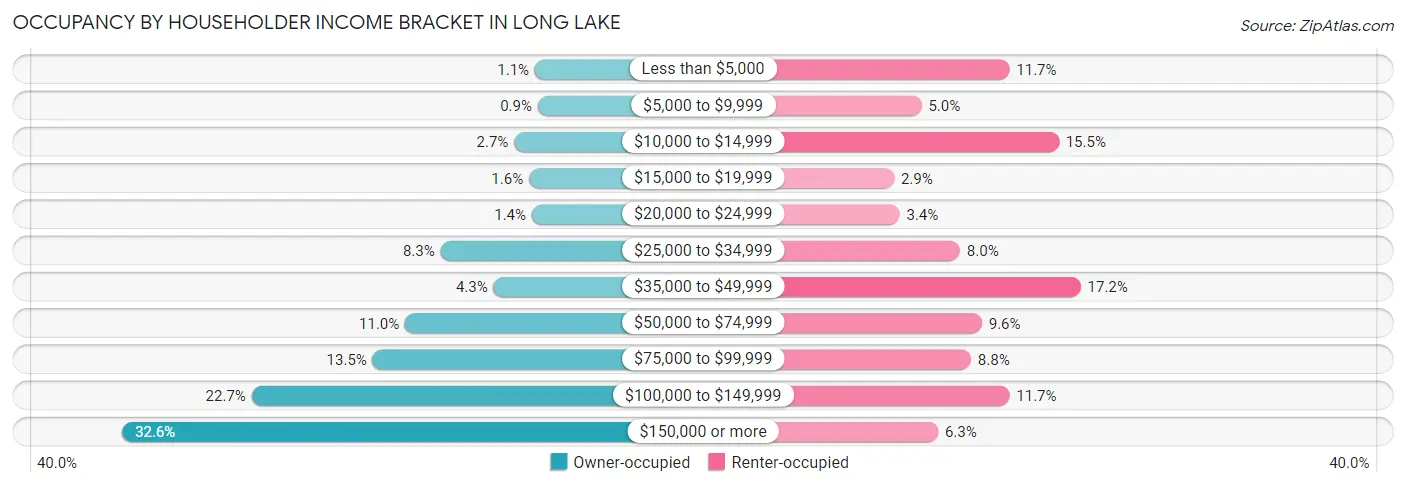
| Income Bracket | Owner-occupied | Renter-occupied |
| Less than $5,000 | 5 (1.1%) | 28 (11.7%) |
| $5,000 to $9,999 | 4 (0.9%) | 12 (5.0%) |
| $10,000 to $14,999 | 12 (2.7%) | 37 (15.5%) |
| $15,000 to $19,999 | 7 (1.6%) | 7 (2.9%) |
| $20,000 to $24,999 | 6 (1.3%) | 8 (3.4%) |
| $25,000 to $34,999 | 37 (8.3%) | 19 (8.0%) |
| $35,000 to $49,999 | 19 (4.3%) | 41 (17.2%) |
| $50,000 to $74,999 | 49 (11.0%) | 23 (9.6%) |
| $75,000 to $99,999 | 60 (13.5%) | 21 (8.8%) |
| $100,000 to $149,999 | 101 (22.7%) | 28 (11.7%) |
| $150,000 or more | 145 (32.6%) | 15 (6.3%) |
| Total | 445 (100.0%) | 239 (100.0%) |
Monthly Housing Cost Tiers in Long Lake
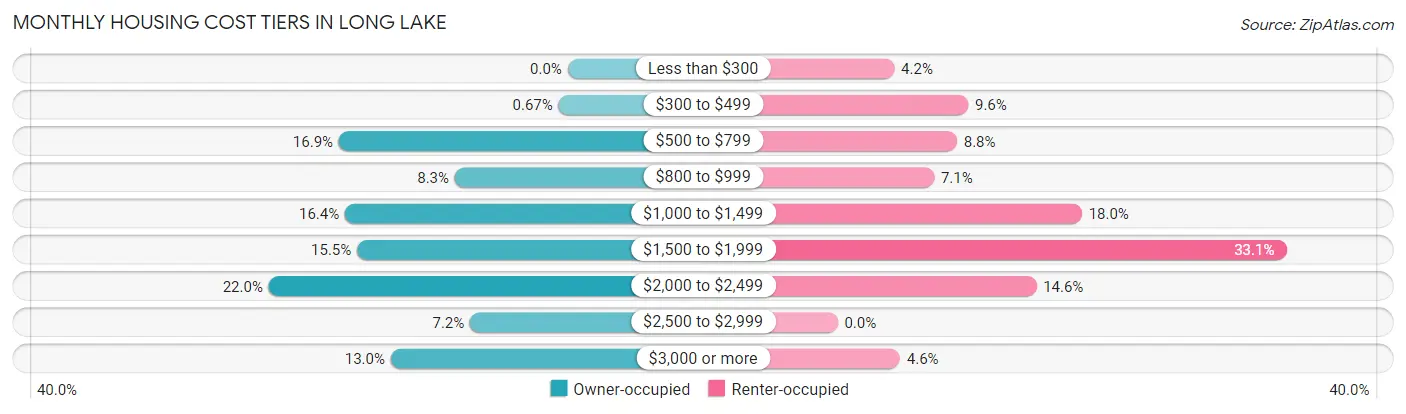
| Monthly Cost | Owner-occupied | Renter-occupied |
| Less than $300 | 0 (0.0%) | 10 (4.2%) |
| $300 to $499 | 3 (0.7%) | 23 (9.6%) |
| $500 to $799 | 75 (16.9%) | 21 (8.8%) |
| $800 to $999 | 37 (8.3%) | 17 (7.1%) |
| $1,000 to $1,499 | 73 (16.4%) | 43 (18.0%) |
| $1,500 to $1,999 | 69 (15.5%) | 79 (33.1%) |
| $2,000 to $2,499 | 98 (22.0%) | 35 (14.6%) |
| $2,500 to $2,999 | 32 (7.2%) | 0 (0.0%) |
| $3,000 or more | 58 (13.0%) | 11 (4.6%) |
| Total | 445 (100.0%) | 239 (100.0%) |
Physical Housing Characteristics in Long Lake
Housing Structures in Long Lake
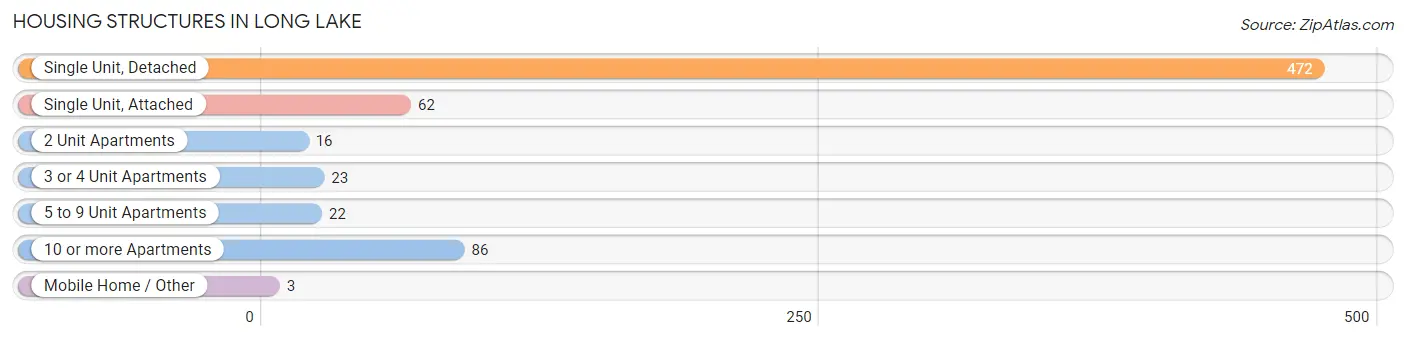
| Structure Type | # Housing Units | % Housing Units |
| Single Unit, Detached | 472 | 69.0% |
| Single Unit, Attached | 62 | 9.1% |
| 2 Unit Apartments | 16 | 2.3% |
| 3 or 4 Unit Apartments | 23 | 3.4% |
| 5 to 9 Unit Apartments | 22 | 3.2% |
| 10 or more Apartments | 86 | 12.6% |
| Mobile Home / Other | 3 | 0.4% |
| Total | 684 | 100.0% |
Housing Structures by Occupancy in Long Lake
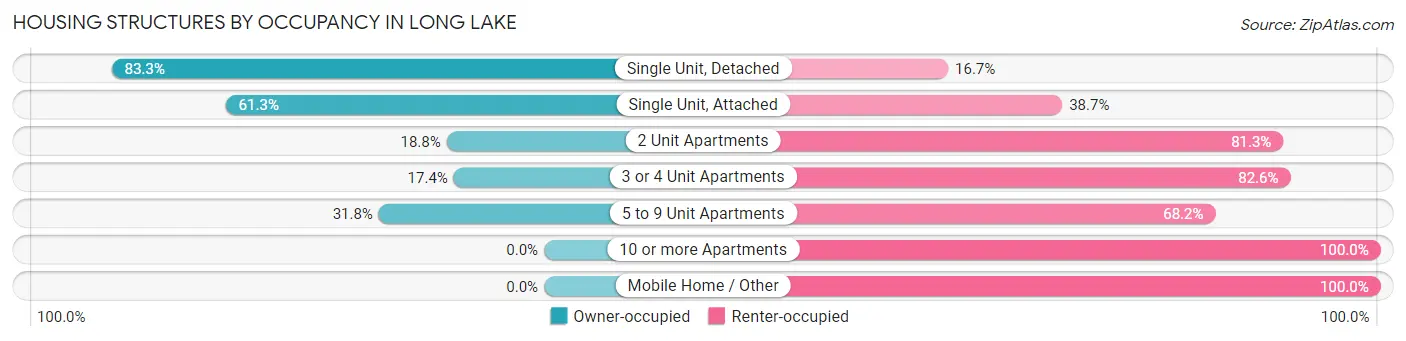
| Structure Type | Owner-occupied | Renter-occupied |
| Single Unit, Detached | 393 (83.3%) | 79 (16.7%) |
| Single Unit, Attached | 38 (61.3%) | 24 (38.7%) |
| 2 Unit Apartments | 3 (18.8%) | 13 (81.2%) |
| 3 or 4 Unit Apartments | 4 (17.4%) | 19 (82.6%) |
| 5 to 9 Unit Apartments | 7 (31.8%) | 15 (68.2%) |
| 10 or more Apartments | 0 (0.0%) | 86 (100.0%) |
| Mobile Home / Other | 0 (0.0%) | 3 (100.0%) |
| Total | 445 (65.1%) | 239 (34.9%) |
Housing Structures by Number of Rooms in Long Lake
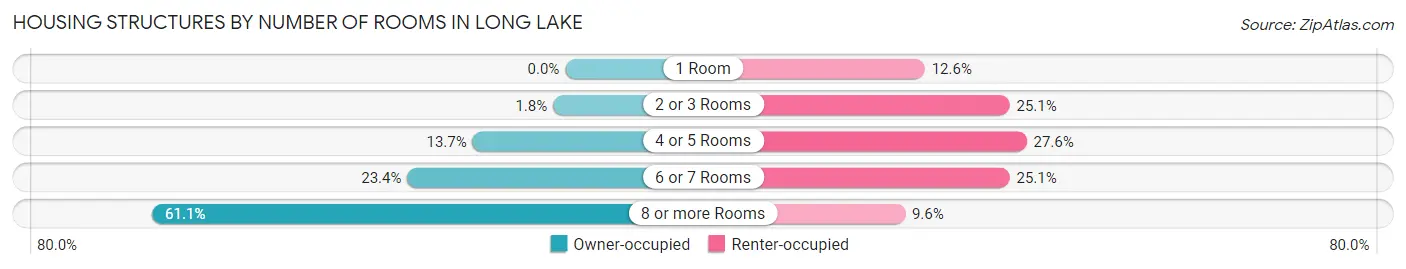
| Number of Rooms | Owner-occupied | Renter-occupied |
| 1 Room | 0 (0.0%) | 30 (12.6%) |
| 2 or 3 Rooms | 8 (1.8%) | 60 (25.1%) |
| 4 or 5 Rooms | 61 (13.7%) | 66 (27.6%) |
| 6 or 7 Rooms | 104 (23.4%) | 60 (25.1%) |
| 8 or more Rooms | 272 (61.1%) | 23 (9.6%) |
| Total | 445 (100.0%) | 239 (100.0%) |
Housing Structure by Heating Type in Long Lake
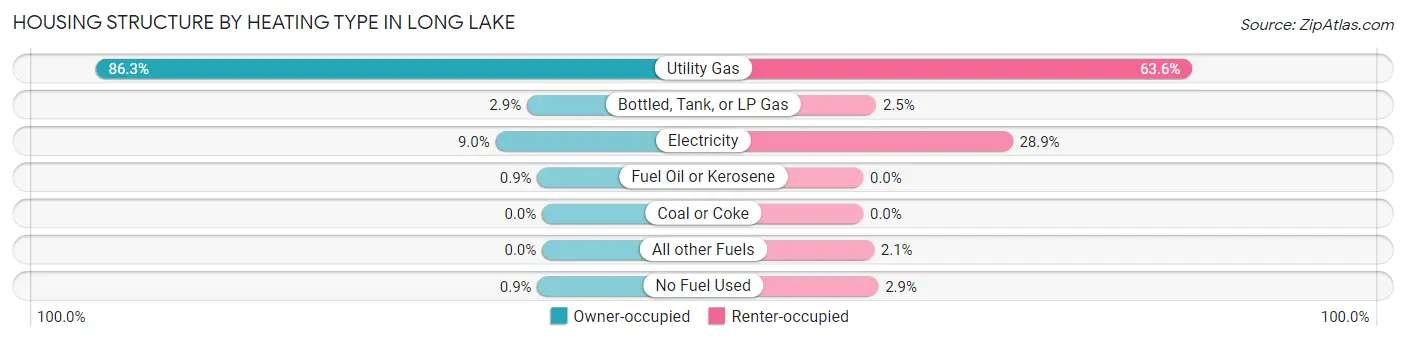
| Heating Type | Owner-occupied | Renter-occupied |
| Utility Gas | 384 (86.3%) | 152 (63.6%) |
| Bottled, Tank, or LP Gas | 13 (2.9%) | 6 (2.5%) |
| Electricity | 40 (9.0%) | 69 (28.9%) |
| Fuel Oil or Kerosene | 4 (0.9%) | 0 (0.0%) |
| Coal or Coke | 0 (0.0%) | 0 (0.0%) |
| All other Fuels | 0 (0.0%) | 5 (2.1%) |
| No Fuel Used | 4 (0.9%) | 7 (2.9%) |
| Total | 445 (100.0%) | 239 (100.0%) |
Household Vehicle Usage in Long Lake
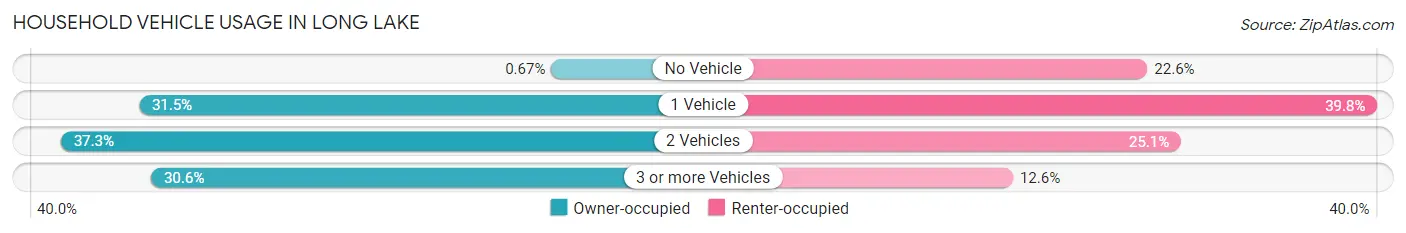
| Vehicles per Household | Owner-occupied | Renter-occupied |
| No Vehicle | 3 (0.7%) | 54 (22.6%) |
| 1 Vehicle | 140 (31.5%) | 95 (39.8%) |
| 2 Vehicles | 166 (37.3%) | 60 (25.1%) |
| 3 or more Vehicles | 136 (30.6%) | 30 (12.6%) |
| Total | 445 (100.0%) | 239 (100.0%) |
Real Estate & Mortgages in Long Lake
Real Estate and Mortgage Overview in Long Lake
| Characteristic | Without Mortgage | With Mortgage |
| Housing Units | 137 | 308 |
| Median Property Value | $321,600 | $400,000 |
| Median Household Income | $68,438 | $129 |
| Monthly Housing Costs | $762 | $58 |
| Real Estate Taxes | $3,818 | $3 |
Property Value by Mortgage Status in Long Lake
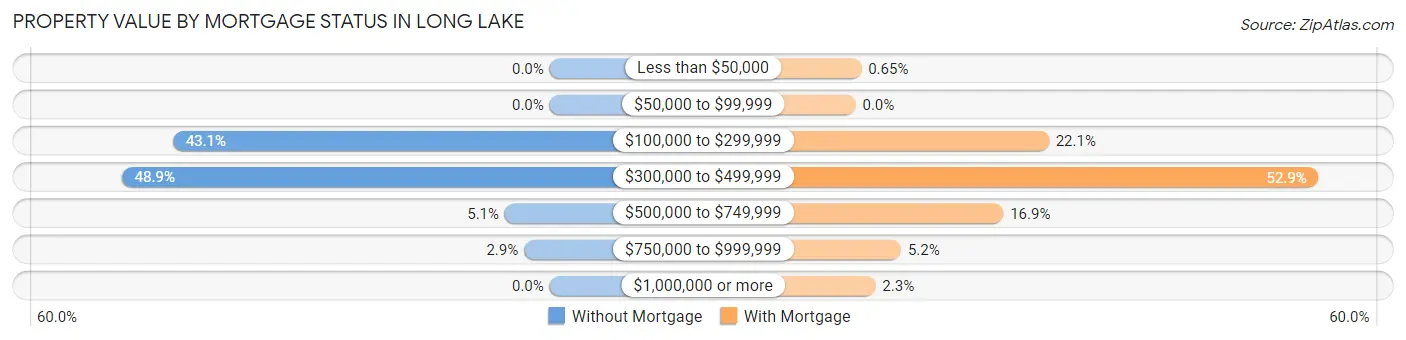
| Property Value | Without Mortgage | With Mortgage |
| Less than $50,000 | 0 (0.0%) | 2 (0.6%) |
| $50,000 to $99,999 | 0 (0.0%) | 0 (0.0%) |
| $100,000 to $299,999 | 59 (43.1%) | 68 (22.1%) |
| $300,000 to $499,999 | 67 (48.9%) | 163 (52.9%) |
| $500,000 to $749,999 | 7 (5.1%) | 52 (16.9%) |
| $750,000 to $999,999 | 4 (2.9%) | 16 (5.2%) |
| $1,000,000 or more | 0 (0.0%) | 7 (2.3%) |
| Total | 137 (100.0%) | 308 (100.0%) |
Household Income by Mortgage Status in Long Lake
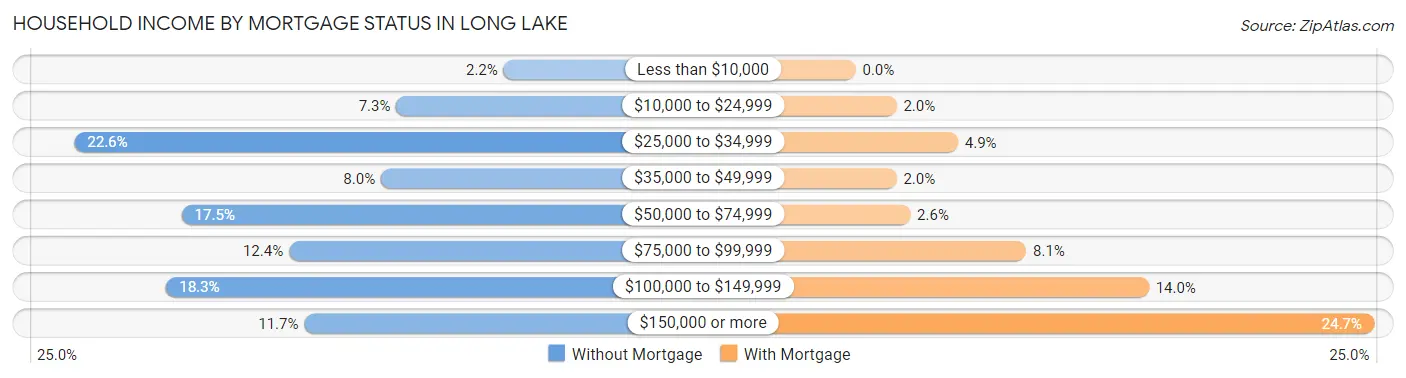
| Household Income | Without Mortgage | With Mortgage |
| Less than $10,000 | 3 (2.2%) | 0 (0.0%) |
| $10,000 to $24,999 | 10 (7.3%) | 6 (1.9%) |
| $25,000 to $34,999 | 31 (22.6%) | 15 (4.9%) |
| $35,000 to $49,999 | 11 (8.0%) | 6 (1.9%) |
| $50,000 to $74,999 | 24 (17.5%) | 8 (2.6%) |
| $75,000 to $99,999 | 17 (12.4%) | 25 (8.1%) |
| $100,000 to $149,999 | 25 (18.2%) | 43 (14.0%) |
| $150,000 or more | 16 (11.7%) | 76 (24.7%) |
| Total | 137 (100.0%) | 308 (100.0%) |
Property Value to Household Income Ratio in Long Lake
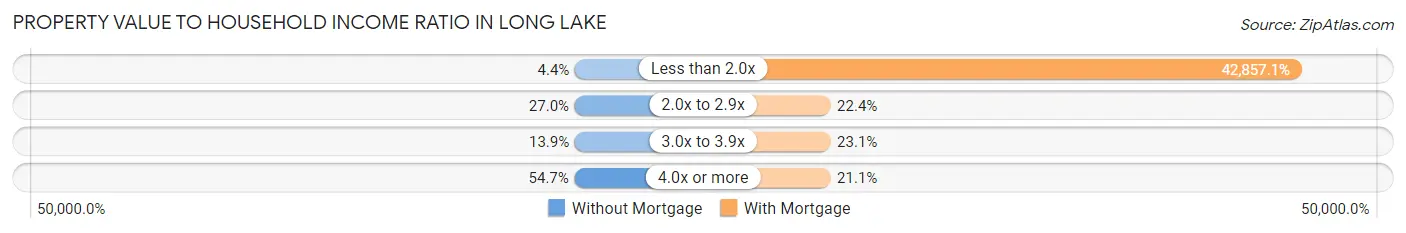
| Value-to-Income Ratio | Without Mortgage | With Mortgage |
| Less than 2.0x | 6 (4.4%) | 132,000 (42,857.1%) |
| 2.0x to 2.9x | 37 (27.0%) | 69 (22.4%) |
| 3.0x to 3.9x | 19 (13.9%) | 71 (23.1%) |
| 4.0x or more | 75 (54.7%) | 65 (21.1%) |
| Total | 137 (100.0%) | 308 (100.0%) |
Real Estate Taxes by Mortgage Status in Long Lake
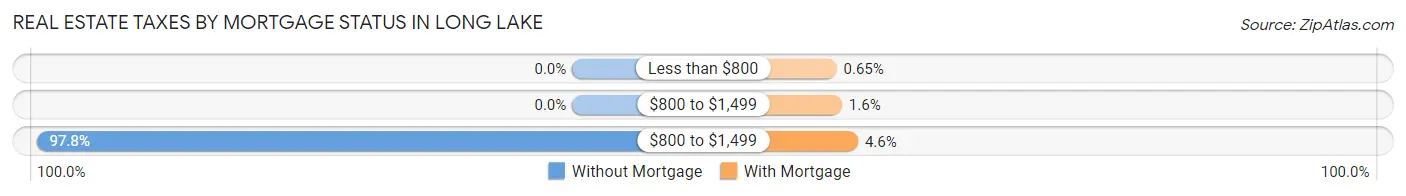
| Property Taxes | Without Mortgage | With Mortgage |
| Less than $800 | 0 (0.0%) | 2 (0.6%) |
| $800 to $1,499 | 0 (0.0%) | 5 (1.6%) |
| $800 to $1,499 | 134 (97.8%) | 14 (4.5%) |
| Total | 137 (100.0%) | 308 (100.0%) |
Health & Disability in Long Lake
Health Insurance Coverage by Age in Long Lake
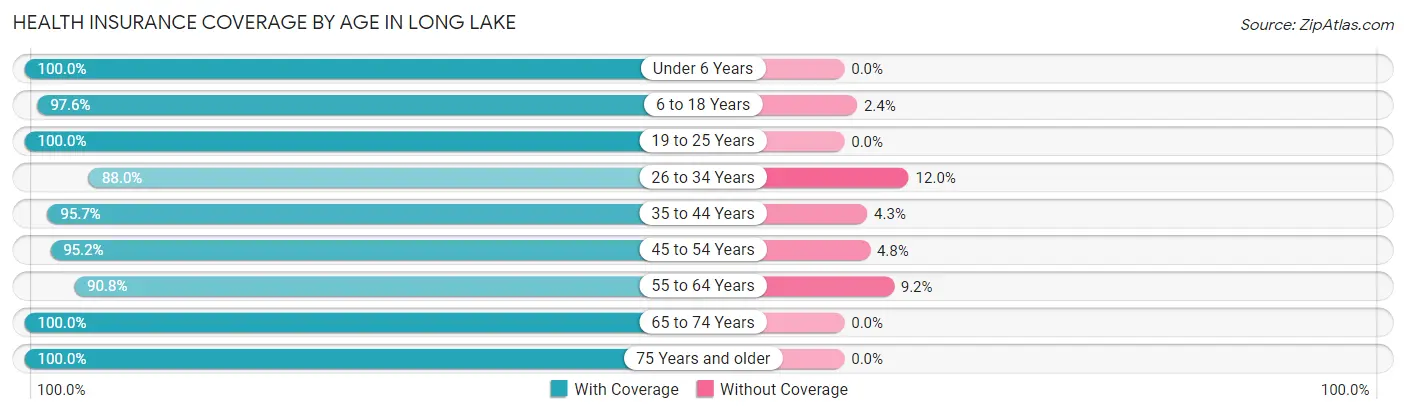
| Age Bracket | With Coverage | Without Coverage |
| Under 6 Years | 104 (100.0%) | 0 (0.0%) |
| 6 to 18 Years | 373 (97.6%) | 9 (2.4%) |
| 19 to 25 Years | 49 (100.0%) | 0 (0.0%) |
| 26 to 34 Years | 176 (88.0%) | 24 (12.0%) |
| 35 to 44 Years | 180 (95.7%) | 8 (4.3%) |
| 45 to 54 Years | 219 (95.2%) | 11 (4.8%) |
| 55 to 64 Years | 236 (90.8%) | 24 (9.2%) |
| 65 to 74 Years | 195 (100.0%) | 0 (0.0%) |
| 75 Years and older | 79 (100.0%) | 0 (0.0%) |
| Total | 1,611 (95.5%) | 76 (4.5%) |
Health Insurance Coverage by Citizenship Status in Long Lake
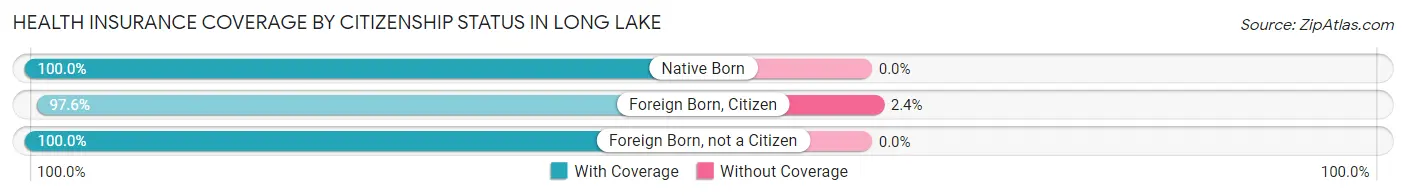
| Citizenship Status | With Coverage | Without Coverage |
| Native Born | 104 (100.0%) | 0 (0.0%) |
| Foreign Born, Citizen | 373 (97.6%) | 9 (2.4%) |
| Foreign Born, not a Citizen | 49 (100.0%) | 0 (0.0%) |
Health Insurance Coverage by Household Income in Long Lake
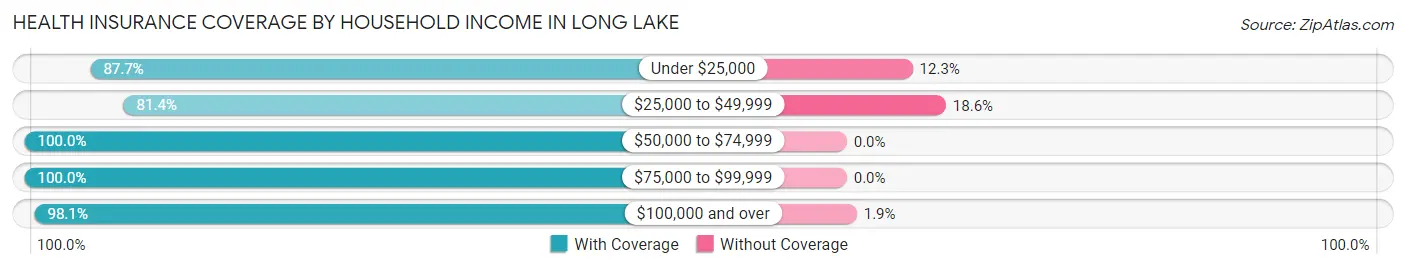
| Household Income | With Coverage | Without Coverage |
| Under $25,000 | 135 (87.7%) | 19 (12.3%) |
| $25,000 to $49,999 | 171 (81.4%) | 39 (18.6%) |
| $50,000 to $74,999 | 187 (100.0%) | 0 (0.0%) |
| $75,000 to $99,999 | 172 (100.0%) | 0 (0.0%) |
| $100,000 and over | 946 (98.1%) | 18 (1.9%) |
Public vs Private Health Insurance Coverage by Age in Long Lake
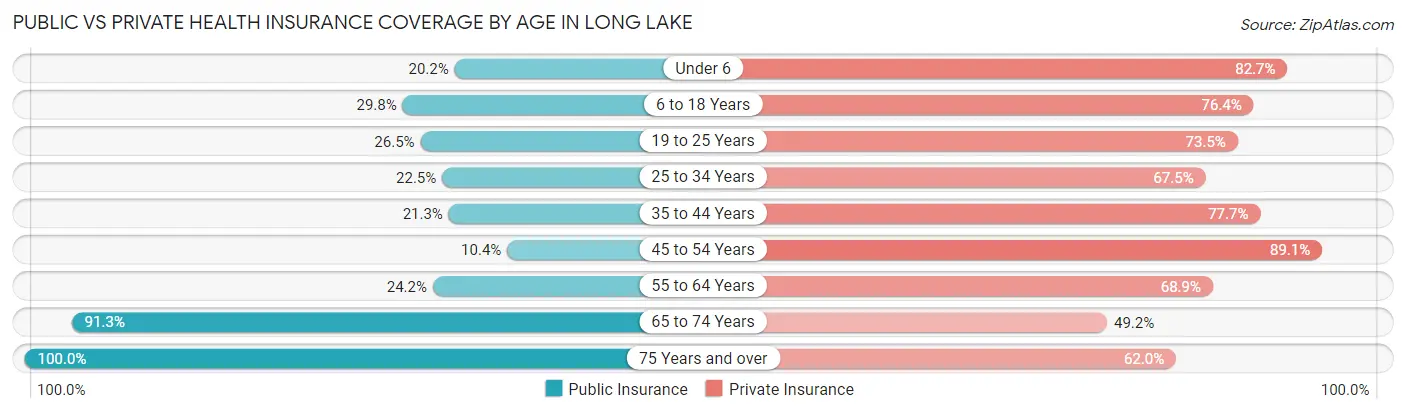
| Age Bracket | Public Insurance | Private Insurance |
| Under 6 | 21 (20.2%) | 86 (82.7%) |
| 6 to 18 Years | 114 (29.8%) | 292 (76.4%) |
| 19 to 25 Years | 13 (26.5%) | 36 (73.5%) |
| 25 to 34 Years | 45 (22.5%) | 135 (67.5%) |
| 35 to 44 Years | 40 (21.3%) | 146 (77.7%) |
| 45 to 54 Years | 24 (10.4%) | 205 (89.1%) |
| 55 to 64 Years | 63 (24.2%) | 179 (68.9%) |
| 65 to 74 Years | 178 (91.3%) | 96 (49.2%) |
| 75 Years and over | 79 (100.0%) | 49 (62.0%) |
| Total | 577 (34.2%) | 1,224 (72.6%) |
Disability Status by Sex by Age in Long Lake
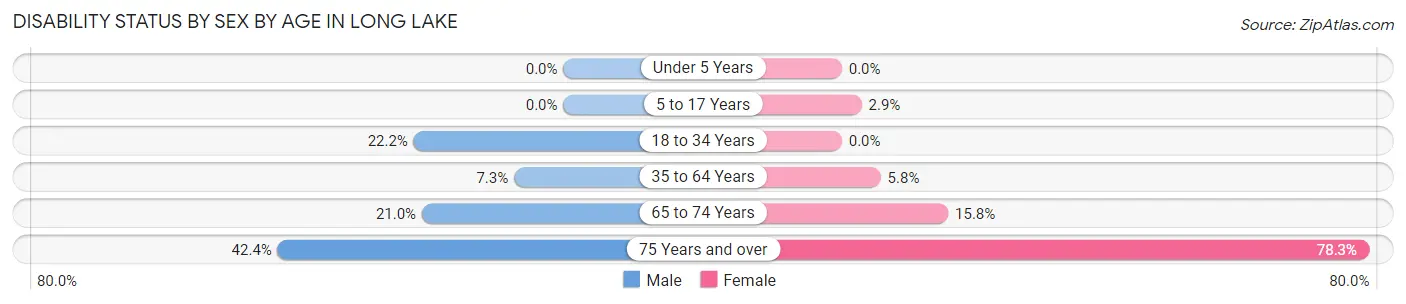
| Age Bracket | Male | Female |
| Under 5 Years | 0 (0.0%) | 0 (0.0%) |
| 5 to 17 Years | 0 (0.0%) | 5 (2.9%) |
| 18 to 34 Years | 38 (22.2%) | 0 (0.0%) |
| 35 to 64 Years | 23 (7.3%) | 21 (5.8%) |
| 65 to 74 Years | 21 (21.0%) | 15 (15.8%) |
| 75 Years and over | 14 (42.4%) | 36 (78.3%) |
Disability Class by Sex by Age in Long Lake
Disability Class: Hearing Difficulty
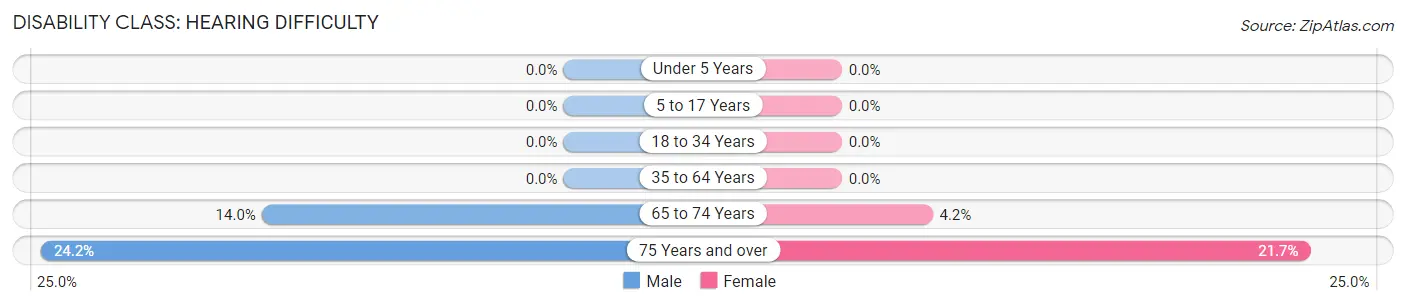
| Age Bracket | Male | Female |
| Under 5 Years | 0 (0.0%) | 0 (0.0%) |
| 5 to 17 Years | 0 (0.0%) | 0 (0.0%) |
| 18 to 34 Years | 0 (0.0%) | 0 (0.0%) |
| 35 to 64 Years | 0 (0.0%) | 0 (0.0%) |
| 65 to 74 Years | 14 (14.0%) | 4 (4.2%) |
| 75 Years and over | 8 (24.2%) | 10 (21.7%) |
Disability Class: Vision Difficulty
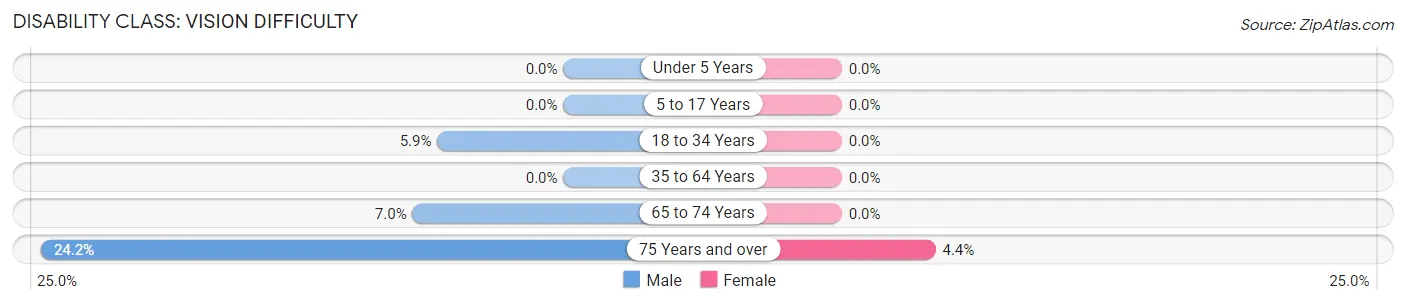
| Age Bracket | Male | Female |
| Under 5 Years | 0 (0.0%) | 0 (0.0%) |
| 5 to 17 Years | 0 (0.0%) | 0 (0.0%) |
| 18 to 34 Years | 10 (5.9%) | 0 (0.0%) |
| 35 to 64 Years | 0 (0.0%) | 0 (0.0%) |
| 65 to 74 Years | 7 (7.0%) | 0 (0.0%) |
| 75 Years and over | 8 (24.2%) | 2 (4.3%) |
Disability Class: Cognitive Difficulty
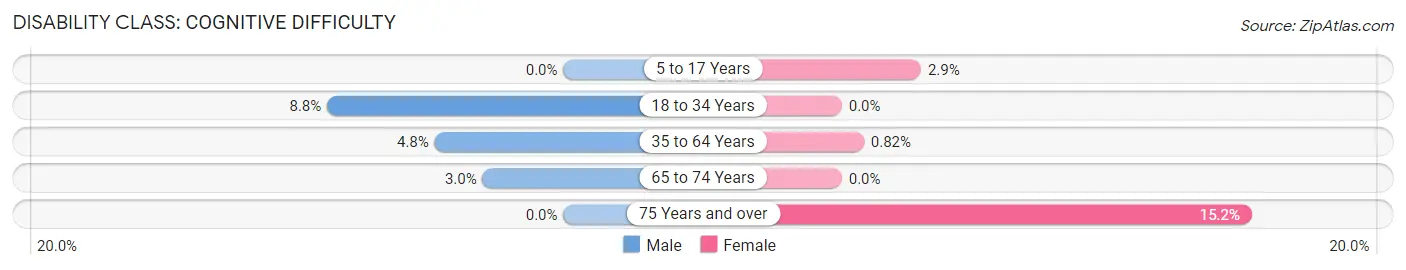
| Age Bracket | Male | Female |
| 5 to 17 Years | 0 (0.0%) | 5 (2.9%) |
| 18 to 34 Years | 15 (8.8%) | 0 (0.0%) |
| 35 to 64 Years | 15 (4.8%) | 3 (0.8%) |
| 65 to 74 Years | 3 (3.0%) | 0 (0.0%) |
| 75 Years and over | 0 (0.0%) | 7 (15.2%) |
Disability Class: Ambulatory Difficulty
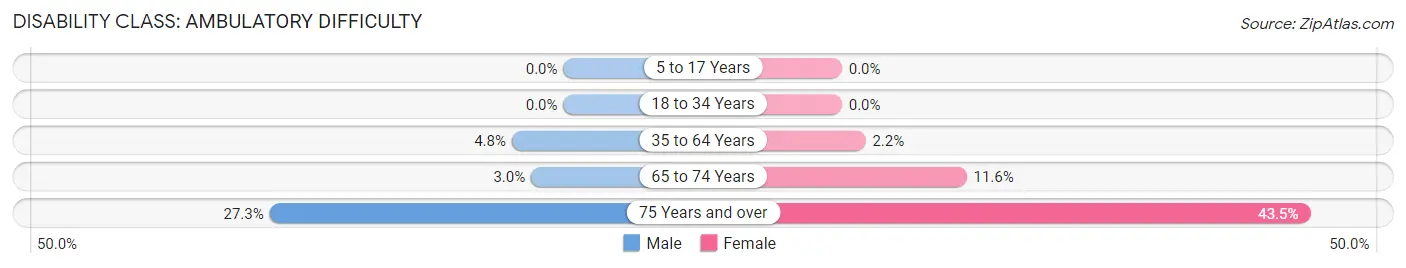
| Age Bracket | Male | Female |
| 5 to 17 Years | 0 (0.0%) | 0 (0.0%) |
| 18 to 34 Years | 0 (0.0%) | 0 (0.0%) |
| 35 to 64 Years | 15 (4.8%) | 8 (2.2%) |
| 65 to 74 Years | 3 (3.0%) | 11 (11.6%) |
| 75 Years and over | 9 (27.3%) | 20 (43.5%) |
Disability Class: Self-Care Difficulty
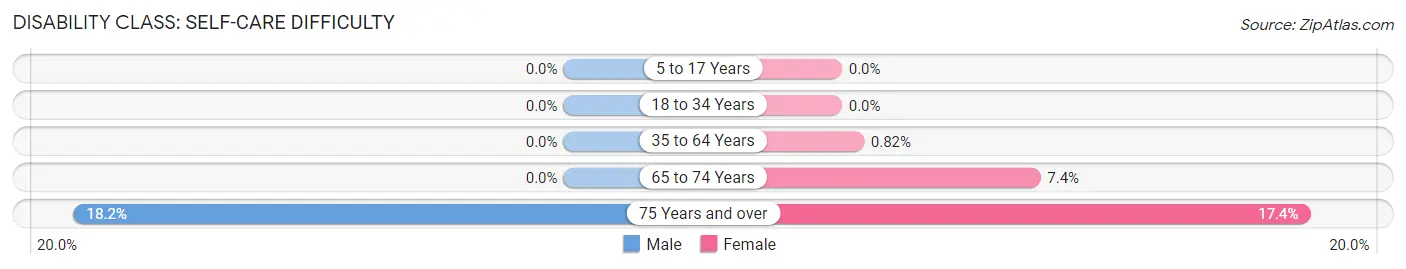
| Age Bracket | Male | Female |
| 5 to 17 Years | 0 (0.0%) | 0 (0.0%) |
| 18 to 34 Years | 0 (0.0%) | 0 (0.0%) |
| 35 to 64 Years | 0 (0.0%) | 3 (0.8%) |
| 65 to 74 Years | 0 (0.0%) | 7 (7.4%) |
| 75 Years and over | 6 (18.2%) | 8 (17.4%) |
Technology Access in Long Lake
Computing Device Access in Long Lake
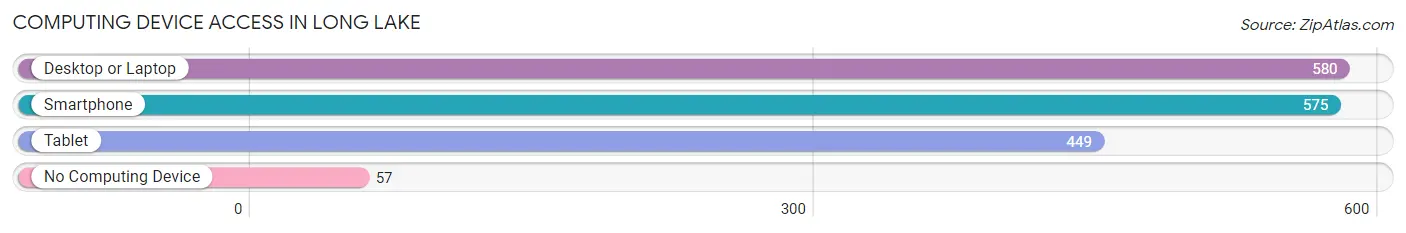
| Device Type | # Households | % Households |
| Desktop or Laptop | 580 | 84.8% |
| Smartphone | 575 | 84.1% |
| Tablet | 449 | 65.6% |
| No Computing Device | 57 | 8.3% |
| Total | 684 | 100.0% |
Internet Access in Long Lake
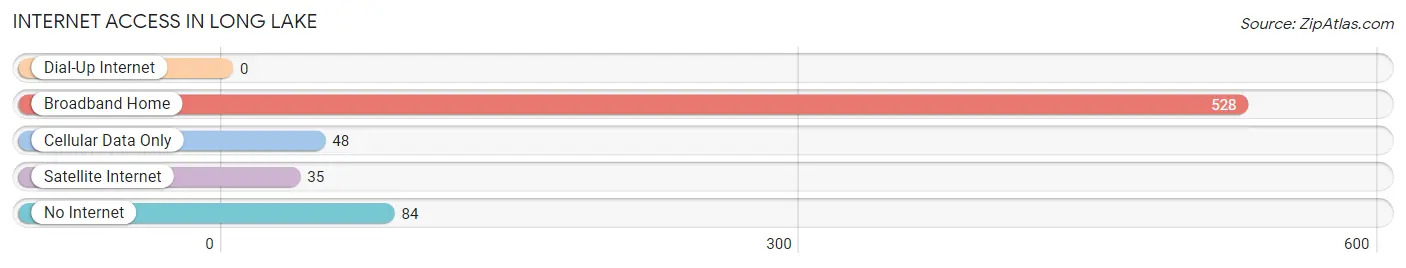
| Internet Type | # Households | % Households |
| Dial-Up Internet | 0 | 0.0% |
| Broadband Home | 528 | 77.2% |
| Cellular Data Only | 48 | 7.0% |
| Satellite Internet | 35 | 5.1% |
| No Internet | 84 | 12.3% |
| Total | 684 | 100.0% |
Long Lake Summary
Long Lake is a city located in Hennepin County, Minnesota, United States. The population was 2,945 at the 2010 census. It is located on the shores of Long Lake, a lake of the same name.
History
Long Lake was first settled in 1855 by a group of settlers from New York. The settlers were attracted to the area by the abundance of natural resources, including the lake, which was named after its long, narrow shape. The first post office was established in 1856, and the town was officially incorporated in 1887.
In the early 1900s, Long Lake was a popular summer resort destination, with many wealthy families from the Twin Cities area building summer homes on the lake. The town also had a thriving commercial fishing industry, with many of the local fishermen selling their catch to the local restaurants.
In the 1950s, Long Lake began to experience a population boom, as many people moved to the area to take advantage of the lake's recreational opportunities. The town also experienced a period of economic growth, as many businesses opened up in the area.
Geography
Long Lake is located at 45°6'17" North, 93°30'45" West (45.104722, -93.5125). According to the United States Census Bureau, the city has a total area of 4.2 square miles (10.8 km2), of which 3.9 square miles (10.1 km2) is land and 0.3 square miles (0.7 km2) is water.
Economy
Long Lake's economy is largely based on tourism and recreation. The city is home to several resorts, marinas, and campgrounds, as well as a variety of restaurants and shops. The city also has a thriving arts and culture scene, with many galleries, museums, and theaters.
Demographics
As of the census of 2010, there were 2,945 people, 1,093 households, and 790 families residing in the city. The population density was 754.3 people per square mile (291.2/km2). There were 1,164 housing units at an average density of 298.3 per square mile (115.2/km2). The racial makeup of the city was 94.2% White, 0.7% African American, 0.3% Native American, 1.2% Asian, 0.1% Pacific Islander, 1.7% from other races, and 1.9% from two or more races. Hispanic or Latino of any race were 4.2% of the population.
There were 1,093 households, out of which 33.2% had children under the age of 18 living with them, 57.2% were married couples living together, 9.2% had a female householder with no husband present, and 29.2% were non-families. 24.2% of all households were made up of individuals, and 8.2% had someone living alone who was 65 years of age or older. The average household size was 2.68 and the average family size was 3.20.
In the city, the population was spread out, with 25.7% under the age of 18, 6.7% from 18 to 24, 28.2% from 25 to 44, 28.2% from 45 to 64, and 11.2% who were 65 years of age or older. The median age was 39 years. For every 100 females, there were 97.2 males. For every 100 females age 18 and over, there were 94.2 males.
The median income for a household in the city was $60,938, and the median income for a family was $71,917. Males had a median income of $45,938 versus $35,000 for females. The per capita income for the city was $27,917. About 3.2% of families and 4.7% of the population were below the poverty line, including 5.2% of those under age 18 and 4.2% of those age 65 or over.
Common Questions
What is Per Capita Income in Long Lake?
Per Capita income in Long Lake is $48,384.
What is the Median Family Income in Long Lake?
Median Family Income in Long Lake is $123,500.
What is the Median Household income in Long Lake?
Median Household Income in Long Lake is $83,750.
What is Income or Wage Gap in Long Lake?
Income or Wage Gap in Long Lake is 17.4%.
Women in Long Lake earn 82.6 cents for every dollar earned by a man.
What is Family Income Deficit in Long Lake?
Family Income Deficit in Long Lake is $10,210.
Families that are below poverty line in Long Lake earn $10,210 less on average than the poverty threshold level.
What is Inequality or Gini Index in Long Lake?
Inequality or Gini Index in Long Lake is 0.51.
What is the Total Population of Long Lake?
Total Population of Long Lake is 1,712.
What is the Total Male Population of Long Lake?
Total Male Population of Long Lake is 866.
What is the Total Female Population of Long Lake?
Total Female Population of Long Lake is 846.
What is the Ratio of Males per 100 Females in Long Lake?
There are 102.36 Males per 100 Females in Long Lake.
What is the Ratio of Females per 100 Males in Long Lake?
There are 97.69 Females per 100 Males in Long Lake.
What is the Median Population Age in Long Lake?
Median Population Age in Long Lake is 42.1 Years.
What is the Average Family Size in Long Lake
Average Family Size in Long Lake is 3.2 People.
What is the Average Household Size in Long Lake
Average Household Size in Long Lake is 2.5 People.
How Large is the Labor Force in Long Lake?
There are 937 People in the Labor Forcein in Long Lake.
What is the Percentage of People in the Labor Force in Long Lake?
69.9% of People are in the Labor Force in Long Lake.
What is the Unemployment Rate in Long Lake?
Unemployment Rate in Long Lake is 6.0%.