Montgomery, MN Map & Demographics
Montgomery Map
Montgomery Overview
$31,757
PER CAPITA INCOME
$78,826
AVG FAMILY INCOME
$61,677
AVG HOUSEHOLD INCOME
21.7%
WAGE / INCOME GAP [ % ]
78.3¢/ $1
WAGE / INCOME GAP [ $ ]
0.40
INEQUALITY / GINI INDEX
3,326
TOTAL POPULATION
1,625
MALE POPULATION
1,701
FEMALE POPULATION
95.53
MALES / 100 FEMALES
104.68
FEMALES / 100 MALES
37.9
MEDIAN AGE
3.0
AVG FAMILY SIZE
2.4
AVG HOUSEHOLD SIZE
1,756
LABOR FORCE [ PEOPLE ]
70.4%
PERCENT IN LABOR FORCE
2.8%
UNEMPLOYMENT RATE
Montgomery Zip Codes
Montgomery Area Codes
Income in Montgomery
Income Overview in Montgomery
Per Capita Income in Montgomery is $31,757, while median incomes of families and households are $78,826 and $61,677 respectively.
| Characteristic | Number | Measure |
| Per Capita Income | 3,326 | $31,757 |
| Median Family Income | 810 | $78,826 |
| Mean Family Income | 810 | $96,326 |
| Median Household Income | 1,301 | $61,677 |
| Mean Household Income | 1,301 | $78,378 |
| Income Deficit | 810 | $0 |
| Wage / Income Gap (%) | 3,326 | 21.70% |
| Wage / Income Gap ($) | 3,326 | 78.30¢ per $1 |
| Gini / Inequality Index | 3,326 | 0.40 |
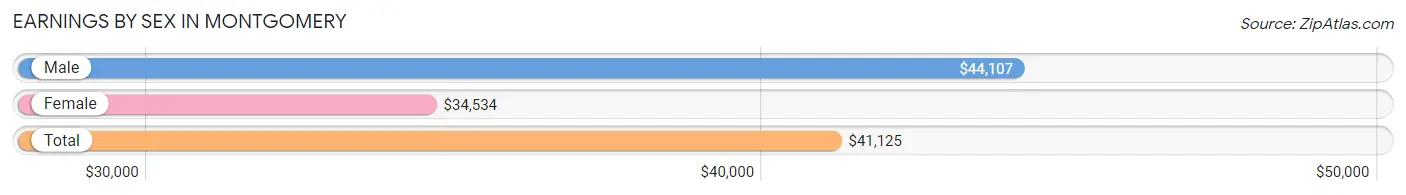
Earnings by Sex in Montgomery
Average Earnings in Montgomery are $41,125, $44,107 for men and $34,534 for women, a difference of 21.7%.
| Sex | Number | Average Earnings |
| Male | 990 (51.6%) | $44,107 |
| Female | 929 (48.4%) | $34,534 |
| Total | 1,919 (100.0%) | $41,125 |
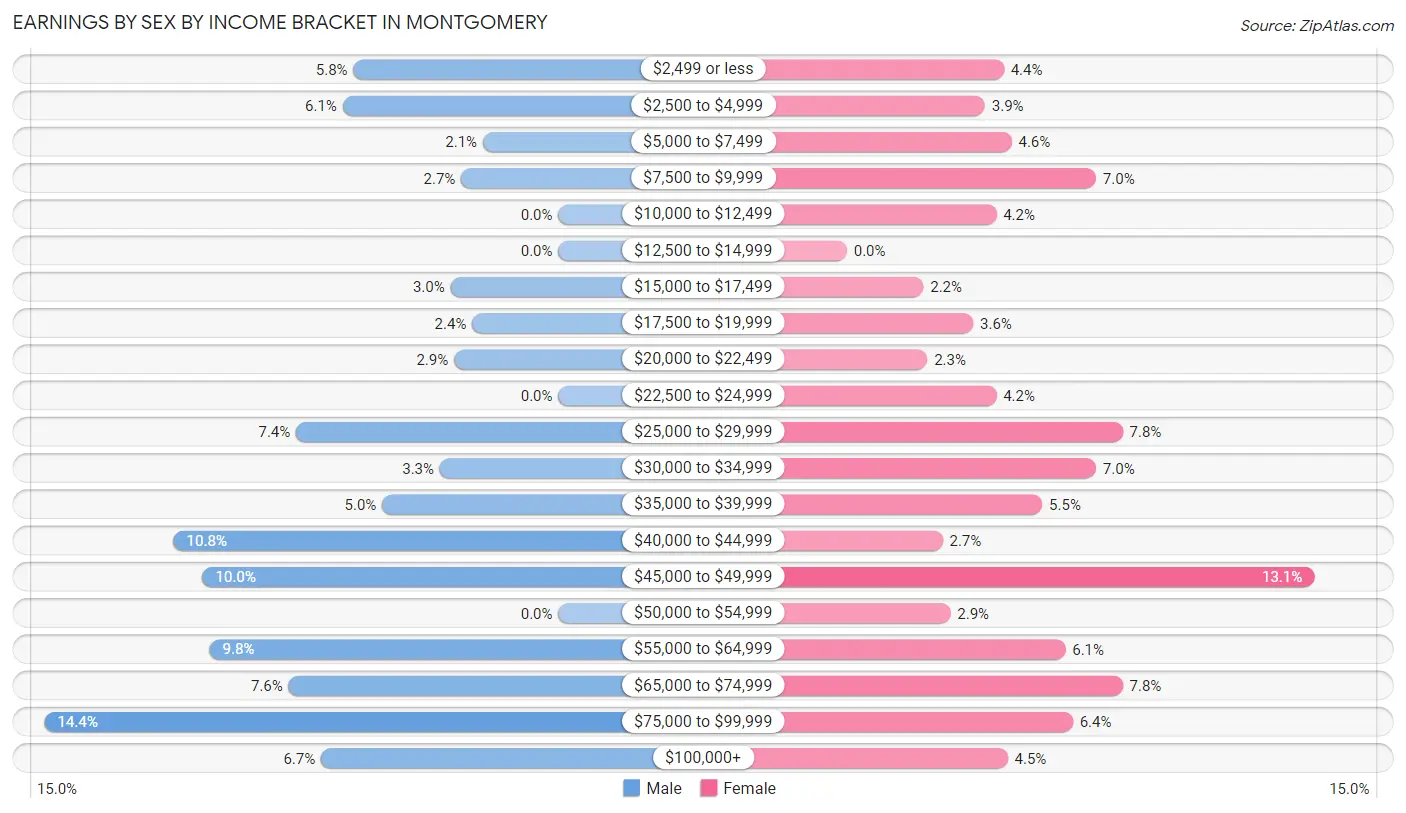
Earnings by Sex by Income Bracket in Montgomery
The most common earnings brackets in Montgomery are $75,000 to $99,999 for men (143 | 14.4%) and $45,000 to $49,999 for women (122 | 13.1%).
| Income | Male | Female |
| $2,499 or less | 57 (5.8%) | 41 (4.4%) |
| $2,500 to $4,999 | 60 (6.1%) | 36 (3.9%) |
| $5,000 to $7,499 | 21 (2.1%) | 43 (4.6%) |
| $7,500 to $9,999 | 27 (2.7%) | 65 (7.0%) |
| $10,000 to $12,499 | 0 (0.0%) | 39 (4.2%) |
| $12,500 to $14,999 | 0 (0.0%) | 0 (0.0%) |
| $15,000 to $17,499 | 30 (3.0%) | 20 (2.1%) |
| $17,500 to $19,999 | 24 (2.4%) | 33 (3.5%) |
| $20,000 to $22,499 | 29 (2.9%) | 21 (2.3%) |
| $22,500 to $24,999 | 0 (0.0%) | 39 (4.2%) |
| $25,000 to $29,999 | 73 (7.4%) | 72 (7.7%) |
| $30,000 to $34,999 | 33 (3.3%) | 65 (7.0%) |
| $35,000 to $39,999 | 49 (5.0%) | 51 (5.5%) |
| $40,000 to $44,999 | 107 (10.8%) | 25 (2.7%) |
| $45,000 to $49,999 | 99 (10.0%) | 122 (13.1%) |
| $50,000 to $54,999 | 0 (0.0%) | 27 (2.9%) |
| $55,000 to $64,999 | 97 (9.8%) | 57 (6.1%) |
| $65,000 to $74,999 | 75 (7.6%) | 72 (7.7%) |
| $75,000 to $99,999 | 143 (14.4%) | 59 (6.4%) |
| $100,000+ | 66 (6.7%) | 42 (4.5%) |
| Total | 990 (100.0%) | 929 (100.0%) |
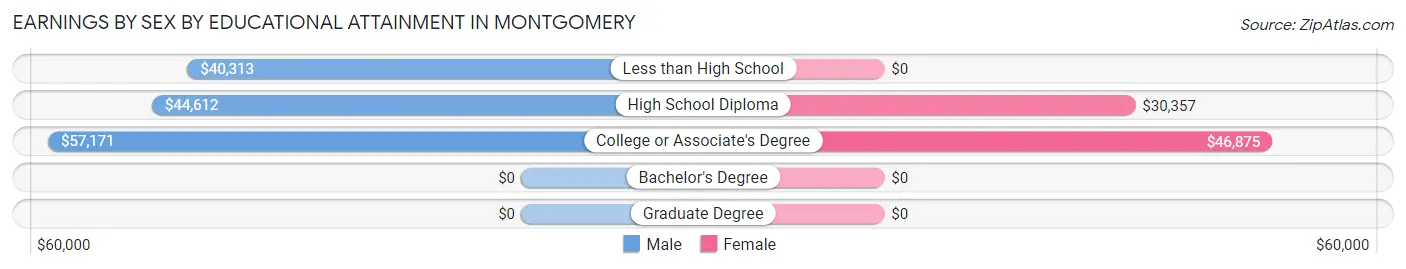
Earnings by Sex by Educational Attainment in Montgomery
Average earnings in Montgomery are $46,401 for men and $36,679 for women, a difference of 20.9%. Men with an educational attainment of college or associate's degree enjoy the highest average annual earnings of $57,171, while those with less than high school education earn the least with $40,313. Women with an educational attainment of college or associate's degree earn the most with the average annual earnings of $46,875, while those with high school diploma education have the smallest earnings of $30,357.
| Educational Attainment | Male Income | Female Income |
| Less than High School | $40,313 | $0 |
| High School Diploma | $44,612 | $30,357 |
| College or Associate's Degree | $57,171 | $46,875 |
| Bachelor's Degree | - | - |
| Graduate Degree | - | - |
| Total | $46,401 | $36,679 |
Family Income in Montgomery
Family Income Brackets in Montgomery
According to the Montgomery family income data, there are 180 families falling into the $100,000 to $149,999 income range, which is the most common income bracket and makes up 22.2% of all families.
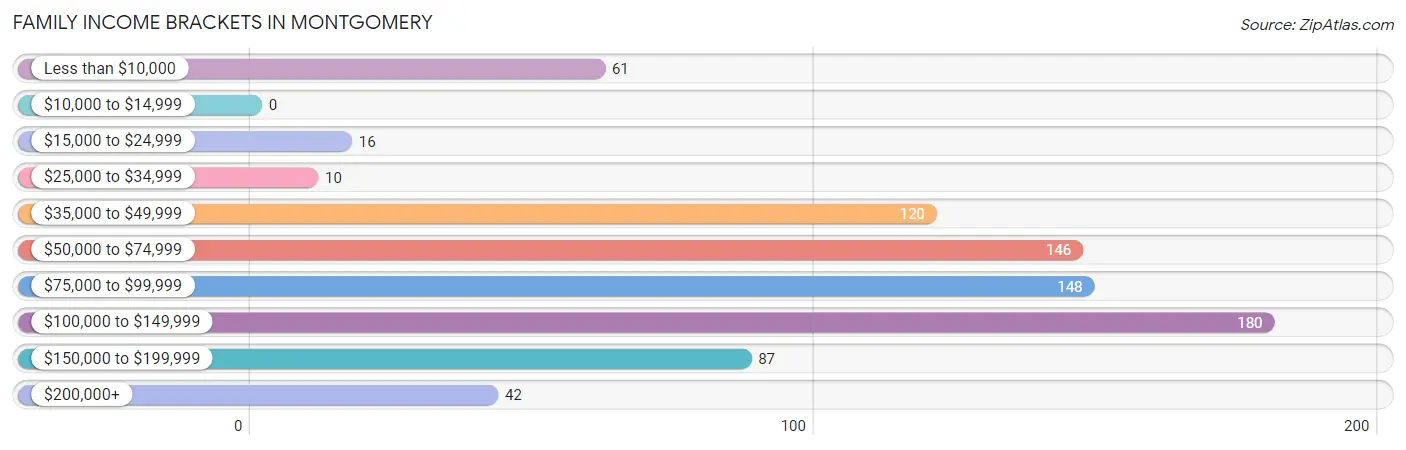
| Income Bracket | # Families | % Families |
| Less than $10,000 | 61 | 7.5% |
| $10,000 to $14,999 | 0 | 0.0% |
| $15,000 to $24,999 | 16 | 2.0% |
| $25,000 to $34,999 | 10 | 1.2% |
| $35,000 to $49,999 | 120 | 14.8% |
| $50,000 to $74,999 | 146 | 18.0% |
| $75,000 to $99,999 | 148 | 18.3% |
| $100,000 to $149,999 | 180 | 22.2% |
| $150,000 to $199,999 | 87 | 10.7% |
| $200,000+ | 42 | 5.2% |
Family Income by Famaliy Size in Montgomery
4-person families (77 | 9.5%) account for the highest median family income in Montgomery with $87,344 per family, while 2-person families (405 | 50.0%) have the highest median income of $39,662 per family member.
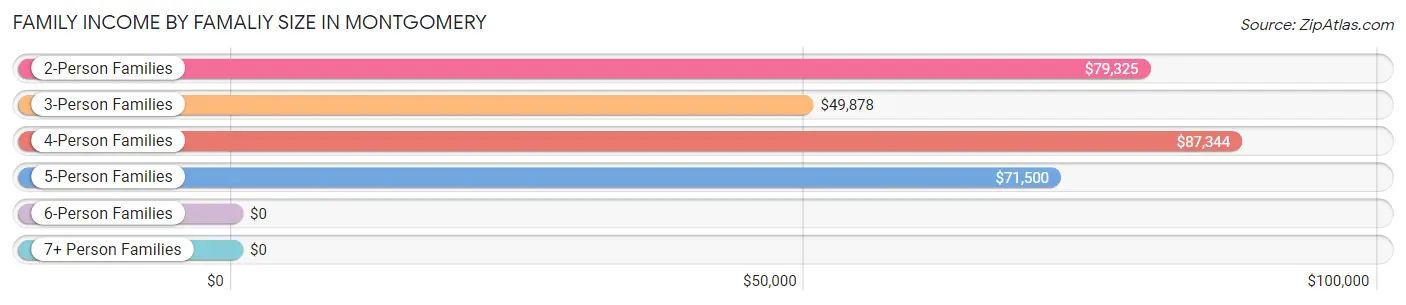
| Income Bracket | # Families | Median Income |
| 2-Person Families | 405 (50.0%) | $79,325 |
| 3-Person Families | 176 (21.7%) | $49,878 |
| 4-Person Families | 77 (9.5%) | $87,344 |
| 5-Person Families | 106 (13.1%) | $71,500 |
| 6-Person Families | 0 (0.0%) | $0 |
| 7+ Person Families | 46 (5.7%) | $0 |
| Total | 810 (100.0%) | $78,826 |
Family Income by Number of Earners in Montgomery
The median family income in Montgomery is $78,826, with families comprising 3+ earners (148) having the highest median family income of $165,489, while families with 1 earner (244) have the lowest median family income of $49,085, accounting for 18.3% and 30.1% of families, respectively.
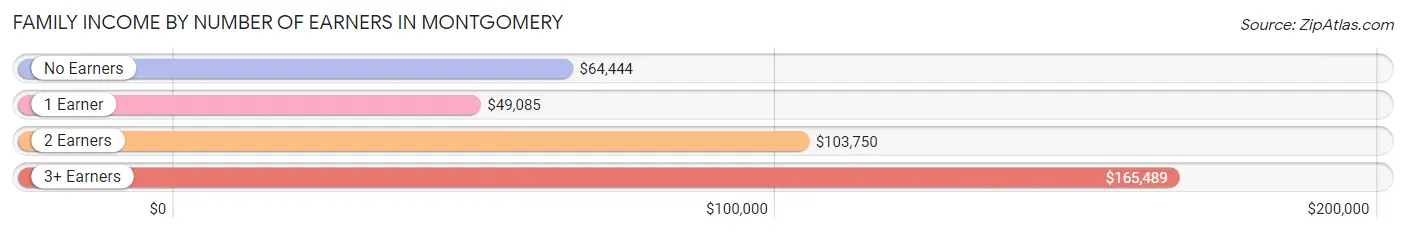
| Number of Earners | # Families | Median Income |
| No Earners | 72 (8.9%) | $64,444 |
| 1 Earner | 244 (30.1%) | $49,085 |
| 2 Earners | 346 (42.7%) | $103,750 |
| 3+ Earners | 148 (18.3%) | $165,489 |
| Total | 810 (100.0%) | $78,826 |
Household Income in Montgomery
Household Income Brackets in Montgomery
With 247 households falling in the category, the $50,000 to $74,999 income range is the most frequent in Montgomery, accounting for 19.0% of all households. In contrast, only 7 households (0.5%) fall into the $10,000 to $14,999 income bracket, making it the least populous group.
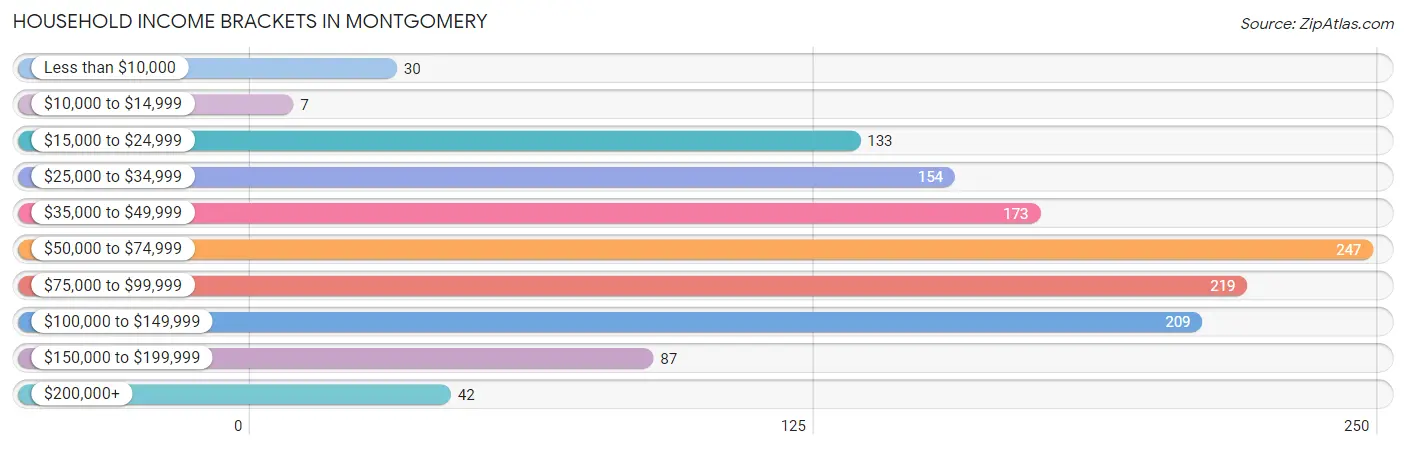
| Income Bracket | # Households | % Households |
| Less than $10,000 | 30 | 2.3% |
| $10,000 to $14,999 | 7 | 0.5% |
| $15,000 to $24,999 | 133 | 10.2% |
| $25,000 to $34,999 | 154 | 11.8% |
| $35,000 to $49,999 | 173 | 13.3% |
| $50,000 to $74,999 | 247 | 19.0% |
| $75,000 to $99,999 | 219 | 16.8% |
| $100,000 to $149,999 | 209 | 16.1% |
| $150,000 to $199,999 | 87 | 6.7% |
| $200,000+ | 42 | 3.2% |
Household Income by Householder Age in Montgomery
The median household income in Montgomery is $61,677, with the highest median household income of $81,250 found in the 15 to 24 years age bracket for the primary householder. A total of 74 households (5.7%) fall into this category. Meanwhile, the 45 to 64 years age bracket for the primary householder has the lowest median household income of $48,542, with 332 households (25.5%) in this group.
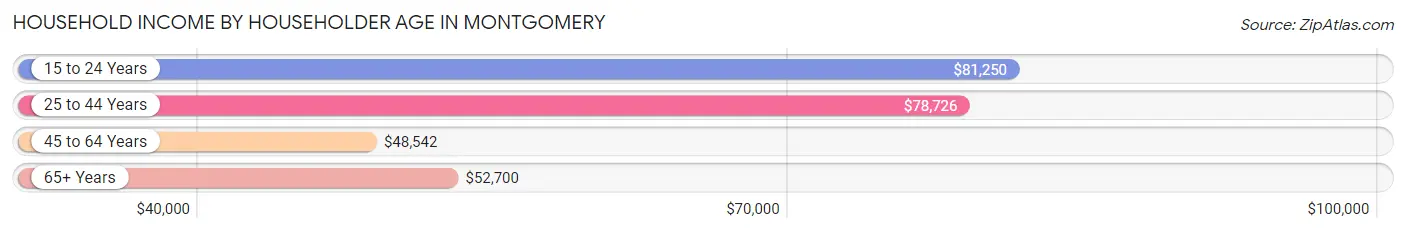
| Income Bracket | # Households | Median Income |
| 15 to 24 Years | 74 (5.7%) | $81,250 |
| 25 to 44 Years | 479 (36.8%) | $78,726 |
| 45 to 64 Years | 332 (25.5%) | $48,542 |
| 65+ Years | 416 (32.0%) | $52,700 |
| Total | 1,301 (100.0%) | $61,677 |
Poverty in Montgomery
Income Below Poverty by Sex and Age in Montgomery
With 5.1% poverty level for males and 17.6% for females among the residents of Montgomery, 55 to 64 year old males and 12 to 14 year old females are the most vulnerable to poverty, with 22 males (22.7%) and 59 females (62.1%) in their respective age groups living below the poverty level.
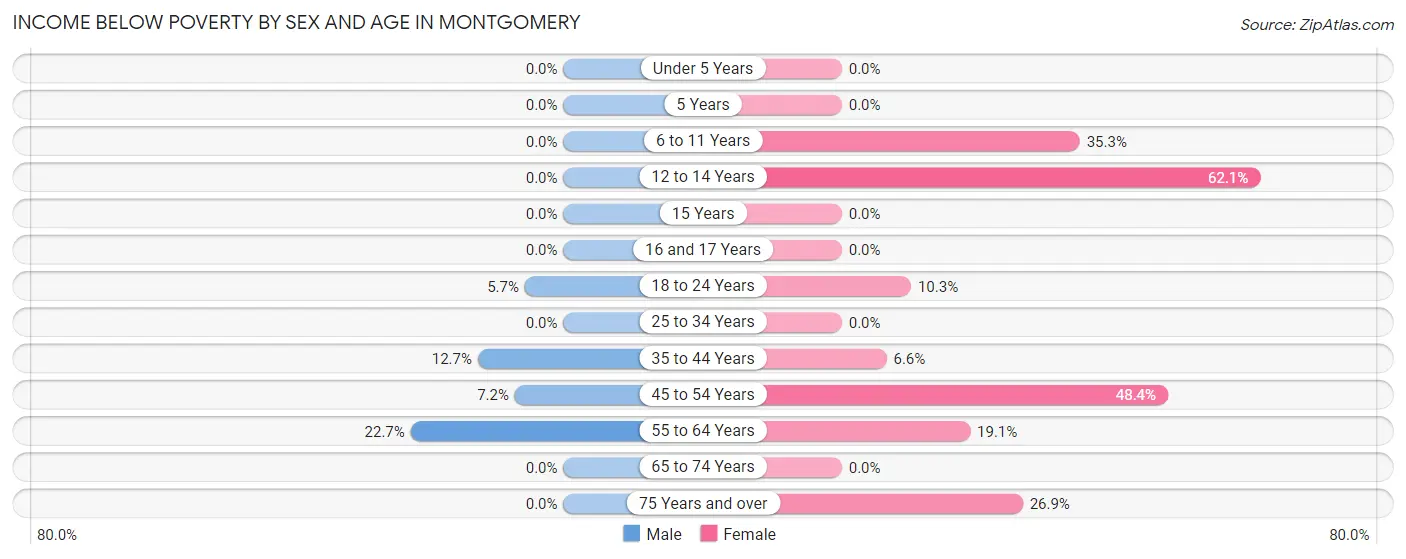
| Age Bracket | Male | Female |
| Under 5 Years | 0 (0.0%) | 0 (0.0%) |
| 5 Years | 0 (0.0%) | 0 (0.0%) |
| 6 to 11 Years | 0 (0.0%) | 59 (35.3%) |
| 12 to 14 Years | 0 (0.0%) | 59 (62.1%) |
| 15 Years | 0 (0.0%) | 0 (0.0%) |
| 16 and 17 Years | 0 (0.0%) | 0 (0.0%) |
| 18 to 24 Years | 9 (5.7%) | 15 (10.3%) |
| 25 to 34 Years | 0 (0.0%) | 0 (0.0%) |
| 35 to 44 Years | 32 (12.7%) | 16 (6.6%) |
| 45 to 54 Years | 16 (7.2%) | 76 (48.4%) |
| 55 to 64 Years | 22 (22.7%) | 28 (19.1%) |
| 65 to 74 Years | 0 (0.0%) | 0 (0.0%) |
| 75 Years and over | 0 (0.0%) | 47 (26.9%) |
| Total | 79 (5.1%) | 300 (17.6%) |
Income Above Poverty by Sex and Age in Montgomery
According to the poverty statistics in Montgomery, males aged under 5 years and females aged under 5 years are the age groups that are most secure financially, with 100.0% of males and 100.0% of females in these age groups living above the poverty line.
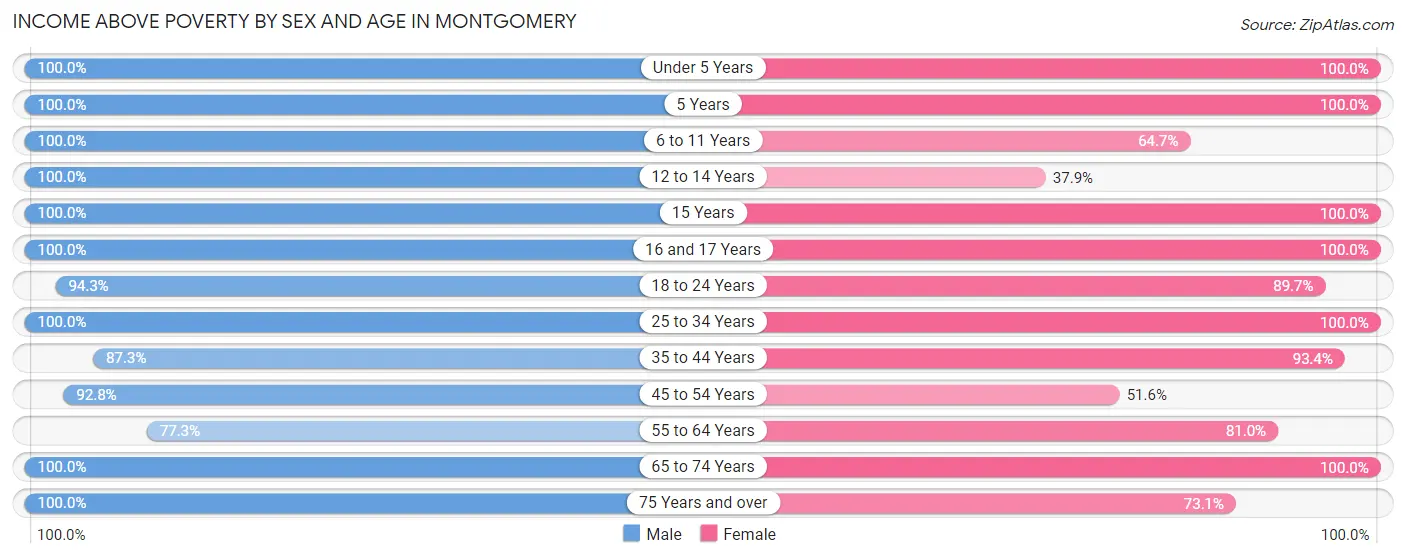
| Age Bracket | Male | Female |
| Under 5 Years | 43 (100.0%) | 89 (100.0%) |
| 5 Years | 12 (100.0%) | 6 (100.0%) |
| 6 to 11 Years | 212 (100.0%) | 108 (64.7%) |
| 12 to 14 Years | 72 (100.0%) | 36 (37.9%) |
| 15 Years | 53 (100.0%) | 21 (100.0%) |
| 16 and 17 Years | 60 (100.0%) | 48 (100.0%) |
| 18 to 24 Years | 148 (94.3%) | 131 (89.7%) |
| 25 to 34 Years | 180 (100.0%) | 166 (100.0%) |
| 35 to 44 Years | 220 (87.3%) | 225 (93.4%) |
| 45 to 54 Years | 206 (92.8%) | 81 (51.6%) |
| 55 to 64 Years | 75 (77.3%) | 119 (80.9%) |
| 65 to 74 Years | 125 (100.0%) | 243 (100.0%) |
| 75 Years and over | 78 (100.0%) | 128 (73.1%) |
| Total | 1,484 (95.0%) | 1,401 (82.4%) |
Income Below Poverty Among Married-Couple Families in Montgomery
The poverty statistics for married-couple families in Montgomery show that 3.5% or 20 of the total 574 families live below the poverty line. Families with no children have the highest poverty rate of 5.8%, comprising of 20 families. On the other hand, families with 1 or 2 children have the lowest poverty rate of 0.0%, which includes 0 families.
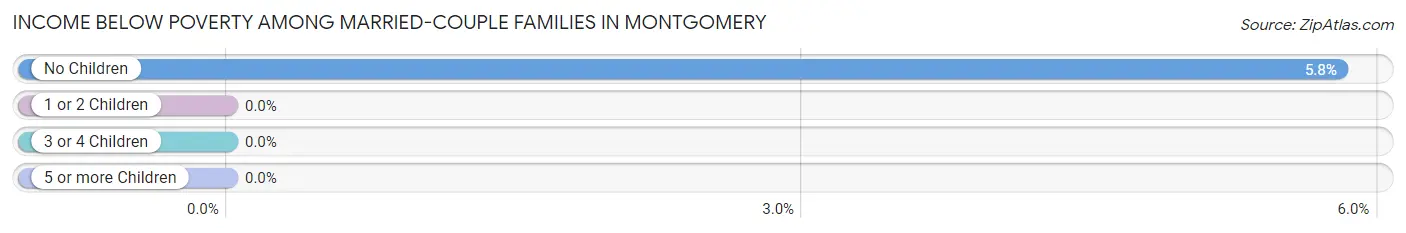
| Children | Above Poverty | Below Poverty |
| No Children | 325 (94.2%) | 20 (5.8%) |
| 1 or 2 Children | 86 (100.0%) | 0 (0.0%) |
| 3 or 4 Children | 143 (100.0%) | 0 (0.0%) |
| 5 or more Children | 0 (0.0%) | 0 (0.0%) |
| Total | 554 (96.5%) | 20 (3.5%) |
Income Below Poverty Among Single-Parent Households in Montgomery
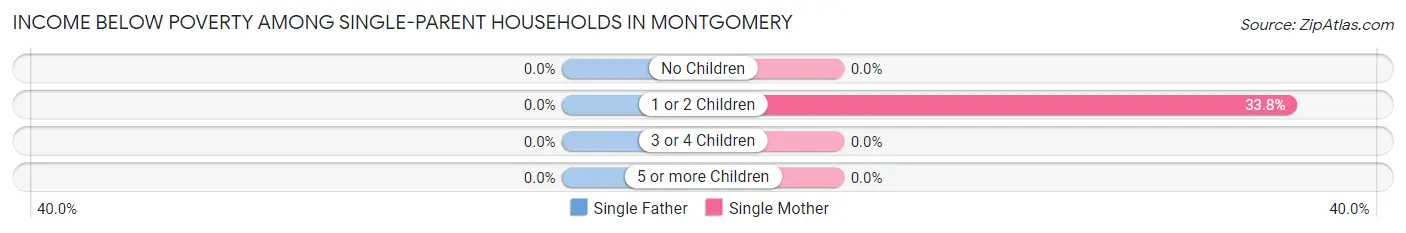
| Children | Single Father | Single Mother |
| No Children | 0 (0.0%) | 0 (0.0%) |
| 1 or 2 Children | 0 (0.0%) | 49 (33.8%) |
| 3 or 4 Children | 0 (0.0%) | 0 (0.0%) |
| 5 or more Children | 0 (0.0%) | 0 (0.0%) |
| Total | 0 (0.0%) | 49 (29.0%) |
Income Below Poverty Among Married-Couple vs Single-Parent Households in Montgomery
The poverty data for Montgomery shows that 20 of the married-couple family households (3.5%) and 49 of the single-parent households (20.8%) are living below the poverty level. Within the married-couple family households, those with no children have the highest poverty rate, with 20 households (5.8%) falling below the poverty line. Among the single-parent households, those with 1 or 2 children have the highest poverty rate, with 49 household (27.1%) living below poverty.
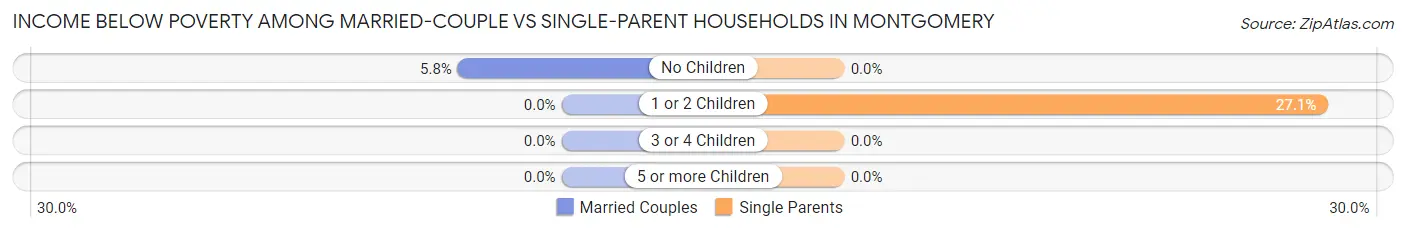
| Children | Married-Couple Families | Single-Parent Households |
| No Children | 20 (5.8%) | 0 (0.0%) |
| 1 or 2 Children | 0 (0.0%) | 49 (27.1%) |
| 3 or 4 Children | 0 (0.0%) | 0 (0.0%) |
| 5 or more Children | 0 (0.0%) | 0 (0.0%) |
| Total | 20 (3.5%) | 49 (20.8%) |
Race in Montgomery
The most populous races in Montgomery are White / Caucasian (3,001 | 90.2%), Hispanic or Latino (323 | 9.7%), and Two or more Races (162 | 4.9%).
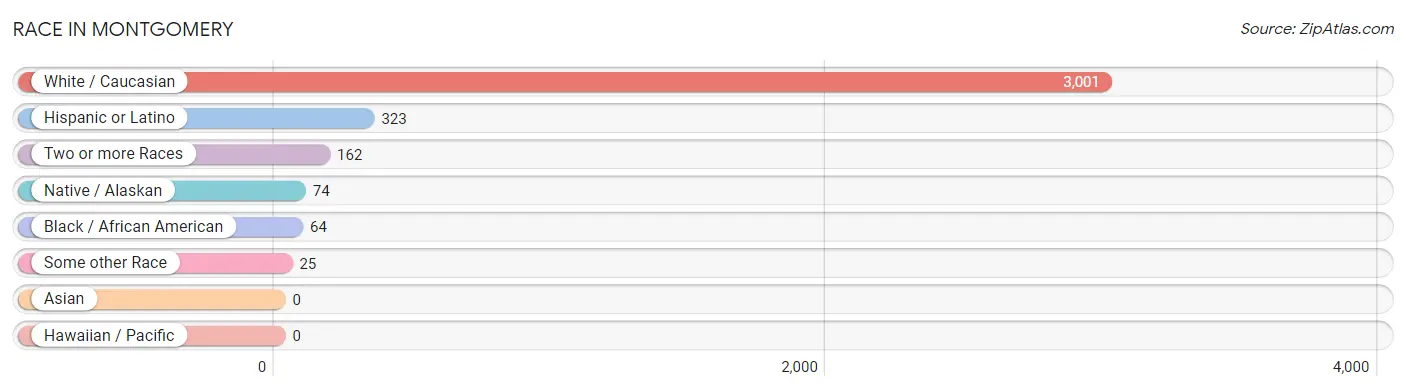
| Race | # Population | % Population |
| Asian | 0 | 0.0% |
| Black / African American | 64 | 1.9% |
| Hawaiian / Pacific | 0 | 0.0% |
| Hispanic or Latino | 323 | 9.7% |
| Native / Alaskan | 74 | 2.2% |
| White / Caucasian | 3,001 | 90.2% |
| Two or more Races | 162 | 4.9% |
| Some other Race | 25 | 0.7% |
| Total | 3,326 | 100.0% |
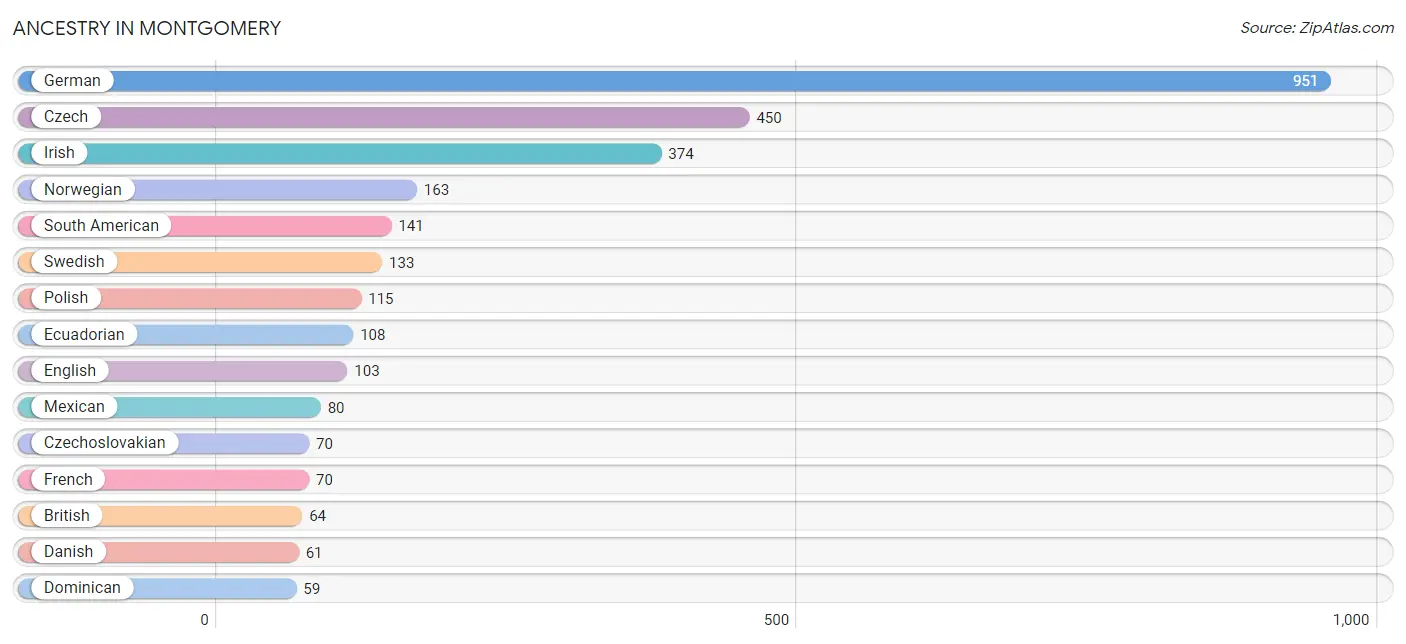
Ancestry in Montgomery
The most populous ancestries reported in Montgomery are German (951 | 28.6%), Czech (450 | 13.5%), Irish (374 | 11.2%), Norwegian (163 | 4.9%), and South American (141 | 4.2%), together accounting for 62.5% of all Montgomery residents.
| Ancestry | # Population | % Population |
| British | 64 | 1.9% |
| Chippewa | 28 | 0.8% |
| Colombian | 33 | 1.0% |
| Czech | 450 | 13.5% |
| Czechoslovakian | 70 | 2.1% |
| Danish | 61 | 1.8% |
| Dominican | 59 | 1.8% |
| Ecuadorian | 108 | 3.3% |
| English | 103 | 3.1% |
| Filipino | 5 | 0.2% |
| Finnish | 33 | 1.0% |
| French | 70 | 2.1% |
| French Canadian | 8 | 0.2% |
| German | 951 | 28.6% |
| Haitian | 16 | 0.5% |
| Hungarian | 8 | 0.2% |
| Irish | 374 | 11.2% |
| Italian | 24 | 0.7% |
| Mexican | 80 | 2.4% |
| Mexican American Indian | 2 | 0.1% |
| Northern European | 10 | 0.3% |
| Norwegian | 163 | 4.9% |
| Polish | 115 | 3.5% |
| Puerto Rican | 43 | 1.3% |
| Scandinavian | 11 | 0.3% |
| Scottish | 18 | 0.5% |
| Sioux | 16 | 0.5% |
| Somali | 14 | 0.4% |
| South American | 141 | 4.2% |
| Subsaharan African | 14 | 0.4% |
| Swedish | 133 | 4.0% |
| Ukrainian | 16 | 0.5% |
| Welsh | 10 | 0.3% | View All 33 Rows |
Immigrants in Montgomery
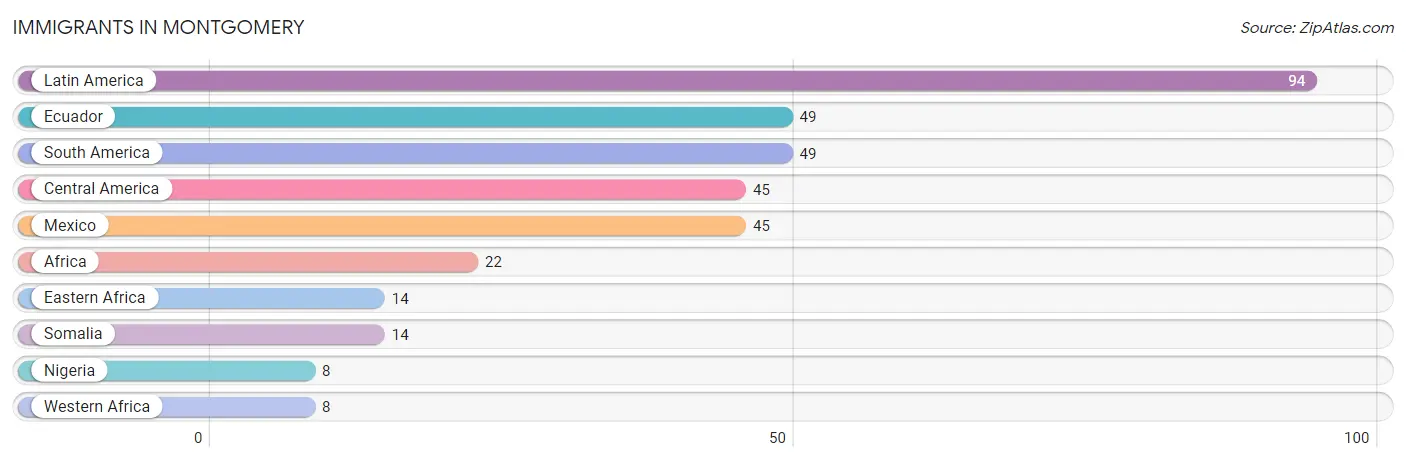
The most numerous immigrant groups reported in Montgomery came from Latin America (94 | 2.8%), Ecuador (49 | 1.5%), South America (49 | 1.5%), Central America (45 | 1.3%), and Mexico (45 | 1.3%), together accounting for 8.5% of all Montgomery residents.
| Immigration Origin | # Population | % Population |
| Africa | 22 | 0.7% |
| Central America | 45 | 1.3% |
| Eastern Africa | 14 | 0.4% |
| Ecuador | 49 | 1.5% |
| Latin America | 94 | 2.8% |
| Mexico | 45 | 1.3% |
| Nigeria | 8 | 0.2% |
| Somalia | 14 | 0.4% |
| South America | 49 | 1.5% |
| Western Africa | 8 | 0.2% | View All 10 Rows |
Sex and Age in Montgomery
Sex and Age in Montgomery
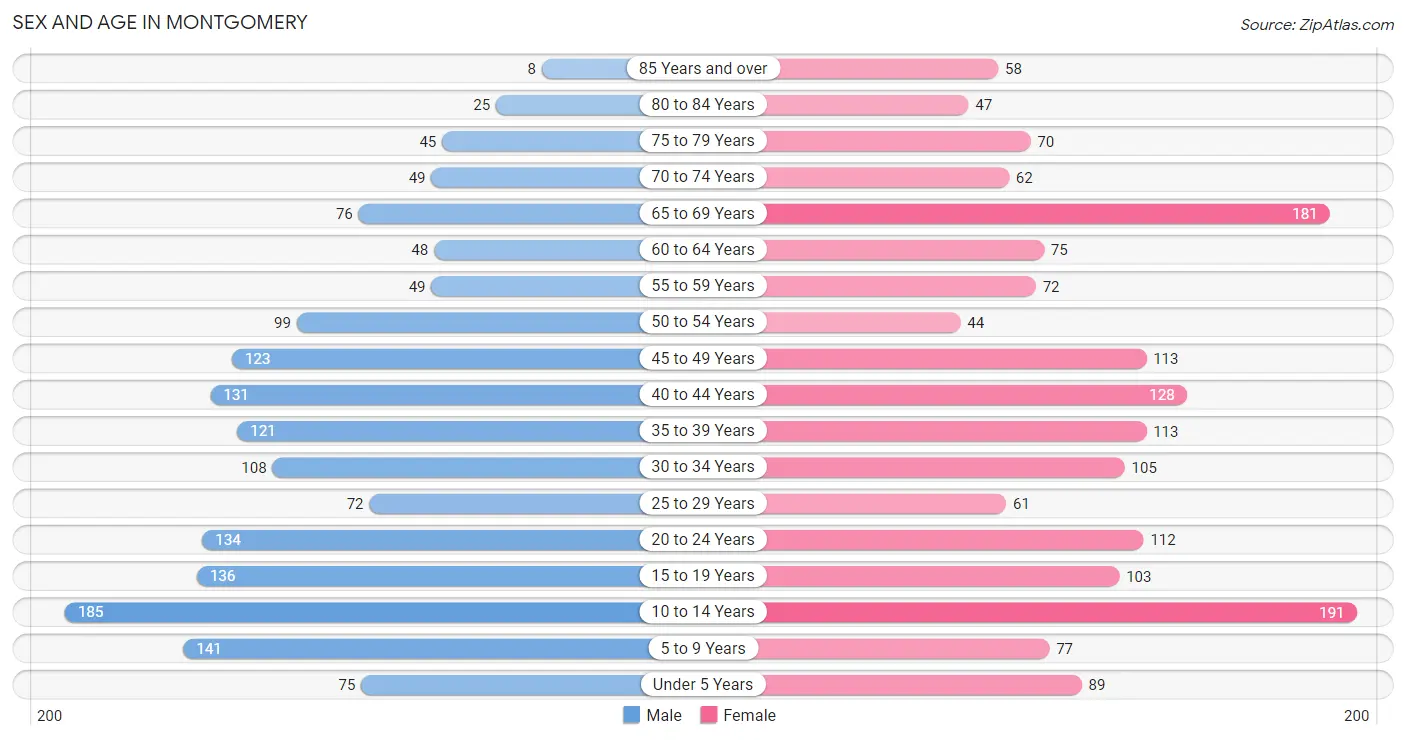
The most populous age groups in Montgomery are 10 to 14 Years (185 | 11.4%) for men and 10 to 14 Years (191 | 11.2%) for women.
| Age Bracket | Male | Female |
| Under 5 Years | 75 (4.6%) | 89 (5.2%) |
| 5 to 9 Years | 141 (8.7%) | 77 (4.5%) |
| 10 to 14 Years | 185 (11.4%) | 191 (11.2%) |
| 15 to 19 Years | 136 (8.4%) | 103 (6.1%) |
| 20 to 24 Years | 134 (8.3%) | 112 (6.6%) |
| 25 to 29 Years | 72 (4.4%) | 61 (3.6%) |
| 30 to 34 Years | 108 (6.7%) | 105 (6.2%) |
| 35 to 39 Years | 121 (7.4%) | 113 (6.6%) |
| 40 to 44 Years | 131 (8.1%) | 128 (7.5%) |
| 45 to 49 Years | 123 (7.6%) | 113 (6.6%) |
| 50 to 54 Years | 99 (6.1%) | 44 (2.6%) |
| 55 to 59 Years | 49 (3.0%) | 72 (4.2%) |
| 60 to 64 Years | 48 (2.9%) | 75 (4.4%) |
| 65 to 69 Years | 76 (4.7%) | 181 (10.6%) |
| 70 to 74 Years | 49 (3.0%) | 62 (3.6%) |
| 75 to 79 Years | 45 (2.8%) | 70 (4.1%) |
| 80 to 84 Years | 25 (1.5%) | 47 (2.8%) |
| 85 Years and over | 8 (0.5%) | 58 (3.4%) |
| Total | 1,625 (100.0%) | 1,701 (100.0%) |
Families and Households in Montgomery
Median Family Size in Montgomery
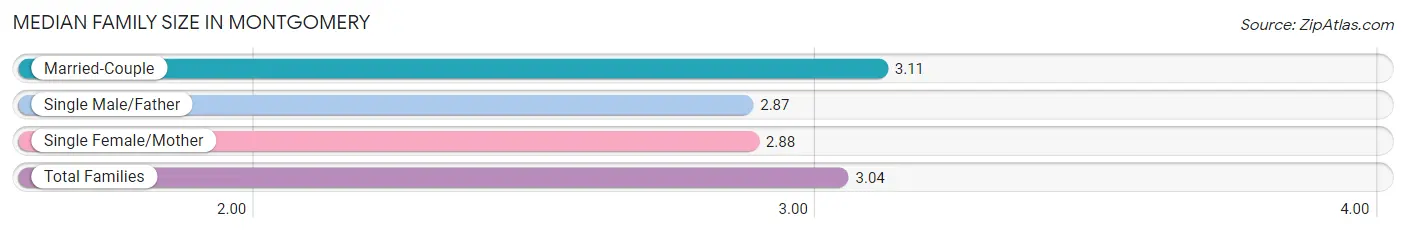
The median family size in Montgomery is 3.04 persons per family, with married-couple families (574 | 70.9%) accounting for the largest median family size of 3.11 persons per family. On the other hand, single male/father families (67 | 8.3%) represent the smallest median family size with 2.87 persons per family.
| Family Type | # Families | Family Size |
| Married-Couple | 574 (70.9%) | 3.11 |
| Single Male/Father | 67 (8.3%) | 2.87 |
| Single Female/Mother | 169 (20.9%) | 2.88 |
| Total Families | 810 (100.0%) | 3.04 |
Median Household Size in Montgomery
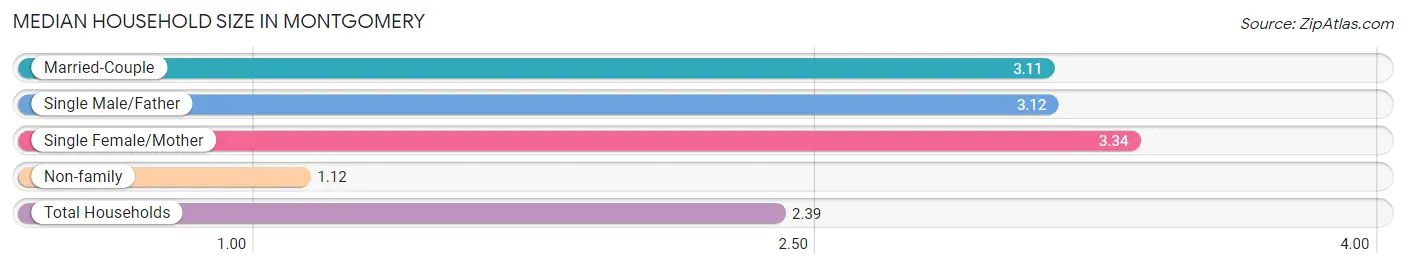
The median household size in Montgomery is 2.39 persons per household, with single female/mother households (169 | 13.0%) accounting for the largest median household size of 3.34 persons per household. non-family households (491 | 37.7%) represent the smallest median household size with 1.12 persons per household.
| Household Type | # Households | Household Size |
| Married-Couple | 574 (44.1%) | 3.11 |
| Single Male/Father | 67 (5.1%) | 3.12 |
| Single Female/Mother | 169 (13.0%) | 3.34 |
| Non-family | 491 (37.7%) | 1.12 |
| Total Households | 1,301 (100.0%) | 2.39 |
Household Size by Marriage Status in Montgomery
Out of a total of 1,301 households in Montgomery, 810 (62.3%) are family households, while 491 (37.7%) are nonfamily households. The most numerous type of family households are 2-person households, comprising 392, and the most common type of nonfamily households are 1-person households, comprising 430.
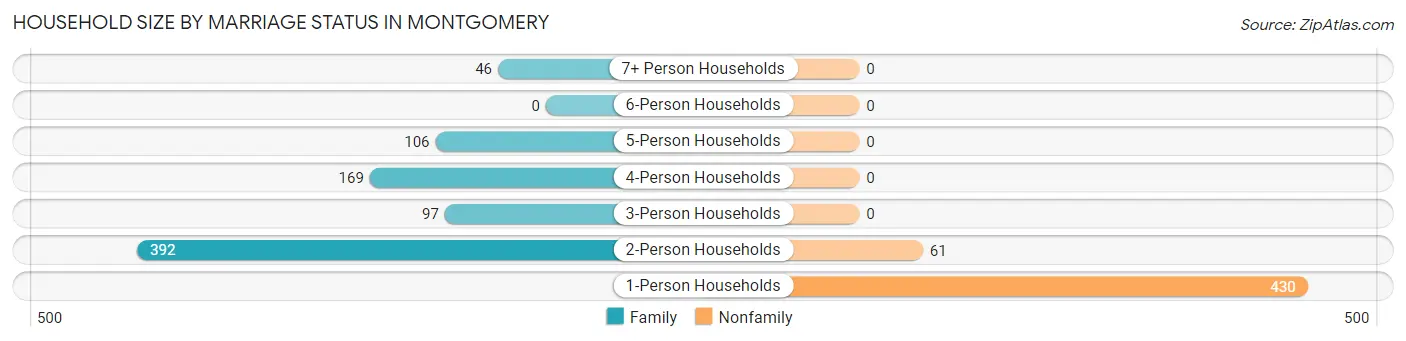
| Household Size | Family Households | Nonfamily Households |
| 1-Person Households | - | 430 (33.1%) |
| 2-Person Households | 392 (30.1%) | 61 (4.7%) |
| 3-Person Households | 97 (7.5%) | 0 (0.0%) |
| 4-Person Households | 169 (13.0%) | 0 (0.0%) |
| 5-Person Households | 106 (8.2%) | 0 (0.0%) |
| 6-Person Households | 0 (0.0%) | 0 (0.0%) |
| 7+ Person Households | 46 (3.5%) | 0 (0.0%) |
| Total | 810 (62.3%) | 491 (37.7%) |
Female Fertility in Montgomery
Fertility by Age in Montgomery
Average fertility rate in Montgomery is 106.0 births per 1,000 women. Women in the age bracket of 20 to 34 years have the highest fertility rate with 234.0 births per 1,000 women. Women in the age bracket of 20 to 34 years acount for 81.2% of all women with births.
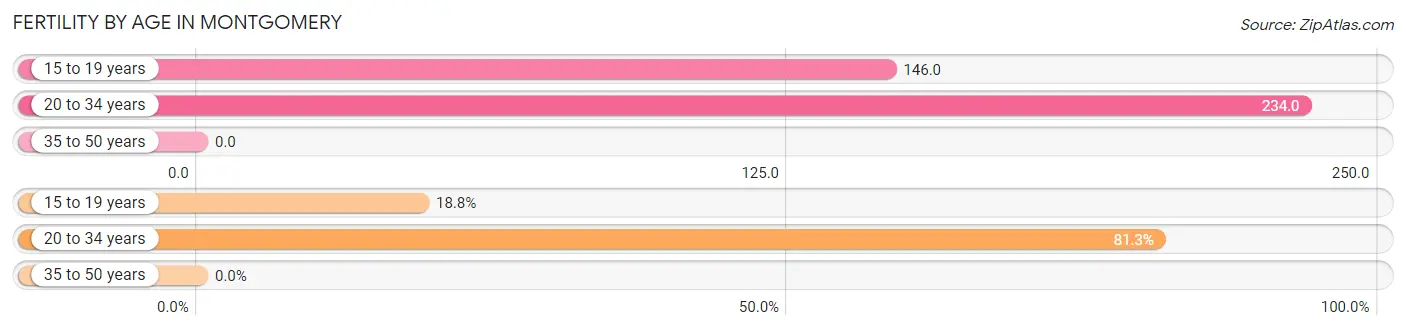
| Age Bracket | Women with Births | Births / 1,000 Women |
| 15 to 19 years | 15 (18.8%) | 146.0 |
| 20 to 34 years | 65 (81.2%) | 234.0 |
| 35 to 50 years | 0 (0.0%) | 0.0 |
| Total | 80 (100.0%) | 106.0 |
Fertility by Age by Marriage Status in Montgomery
71.3% of women with births (80) in Montgomery are married. The highest percentage of unmarried women with births falls into 15 to 19 years age bracket with 100.0% of them unmarried at the time of birth, while the lowest percentage of unmarried women with births belong to 20 to 34 years age bracket with 12.3% of them unmarried.
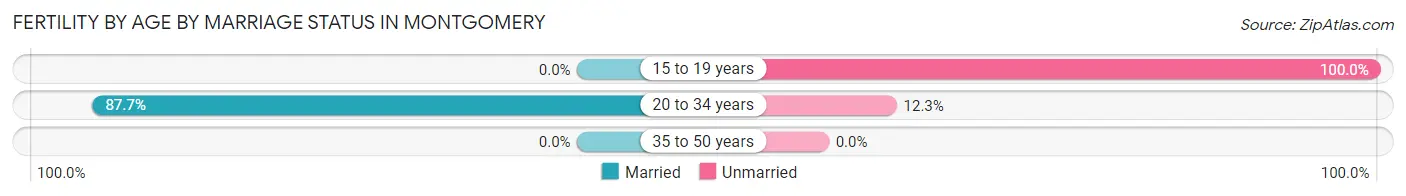
| Age Bracket | Married | Unmarried |
| 15 to 19 years | 0 (0.0%) | 15 (100.0%) |
| 20 to 34 years | 57 (87.7%) | 8 (12.3%) |
| 35 to 50 years | 0 (0.0%) | 0 (0.0%) |
| Total | 57 (71.3%) | 23 (28.7%) |
Fertility by Education in Montgomery
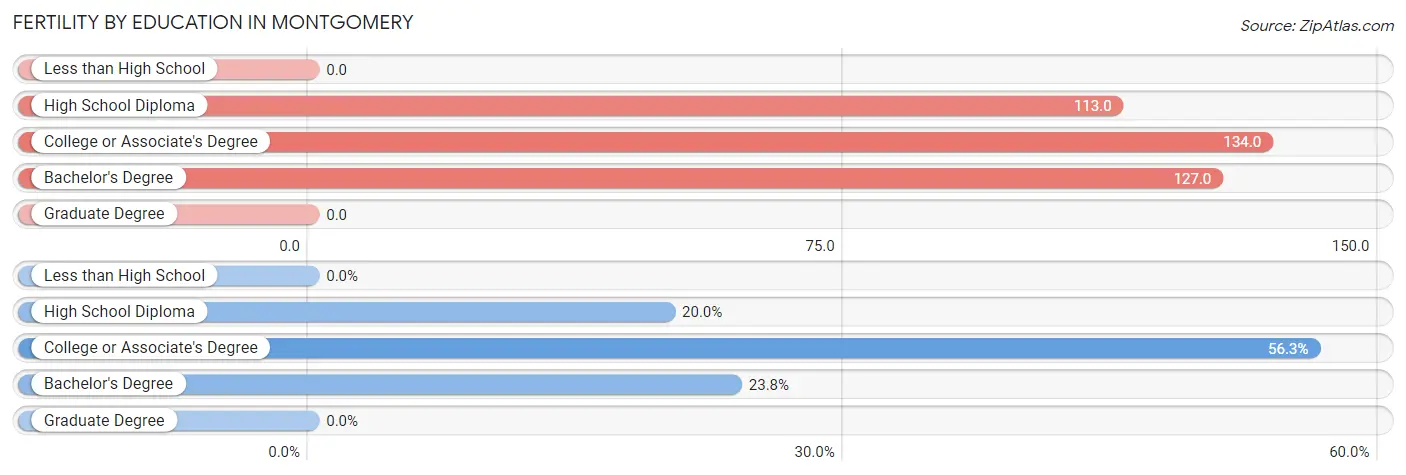
| Educational Attainment | Women with Births | Births / 1,000 Women |
| Less than High School | 0 (0.0%) | 0.0 |
| High School Diploma | 16 (20.0%) | 113.0 |
| College or Associate's Degree | 45 (56.2%) | 134.0 |
| Bachelor's Degree | 19 (23.7%) | 127.0 |
| Graduate Degree | 0 (0.0%) | 0.0 |
| Total | 80 (100.0%) | 106.0 |
Fertility by Education by Marriage Status in Montgomery
28.7% of women with births in Montgomery are unmarried. Women with the educational attainment of high school diploma are most likely to be married with 100.0% of them married at childbirth, while women with the educational attainment of bachelor's degree are least likely to be married with 42.1% of them unmarried at childbirth.
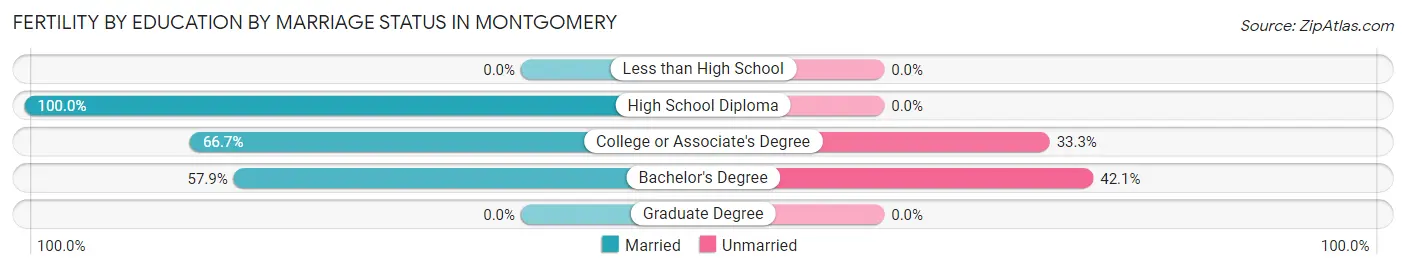
| Educational Attainment | Married | Unmarried |
| Less than High School | 0 (0.0%) | 0 (0.0%) |
| High School Diploma | 16 (100.0%) | 0 (0.0%) |
| College or Associate's Degree | 30 (66.7%) | 15 (33.3%) |
| Bachelor's Degree | 11 (57.9%) | 8 (42.1%) |
| Graduate Degree | 0 (0.0%) | 0 (0.0%) |
| Total | 57 (71.3%) | 23 (28.7%) |
Employment Characteristics in Montgomery
Employment by Class of Employer in Montgomery
Among the 1,611 employed individuals in Montgomery, private company employees (1,101 | 68.3%), local government employees (140 | 8.7%), and not-for-profit organizations (122 | 7.6%) make up the most common classes of employment.
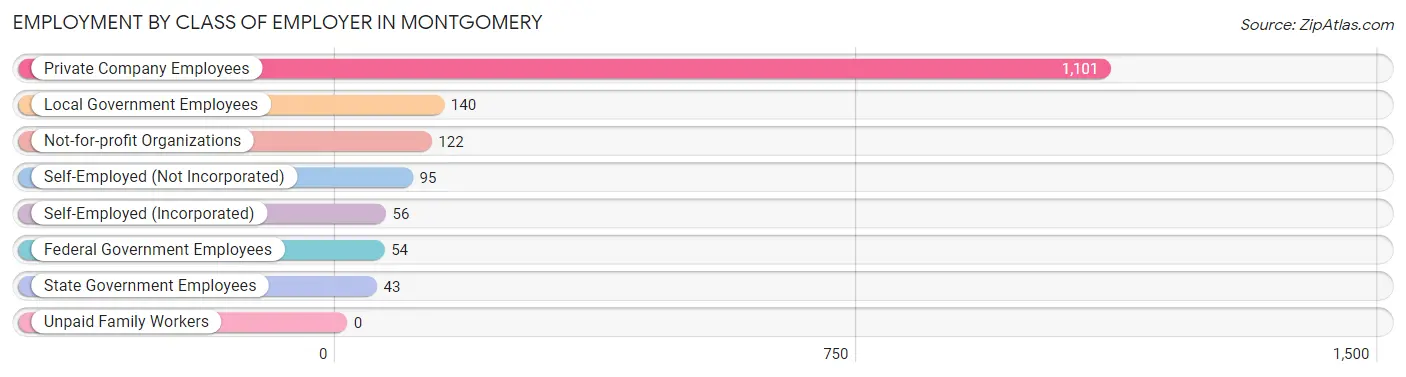
| Employer Class | # Employees | % Employees |
| Private Company Employees | 1,101 | 68.3% |
| Self-Employed (Incorporated) | 56 | 3.5% |
| Self-Employed (Not Incorporated) | 95 | 5.9% |
| Not-for-profit Organizations | 122 | 7.6% |
| Local Government Employees | 140 | 8.7% |
| State Government Employees | 43 | 2.7% |
| Federal Government Employees | 54 | 3.4% |
| Unpaid Family Workers | 0 | 0.0% |
| Total | 1,611 | 100.0% |
Employment Status by Age in Montgomery
According to the labor force statistics for Montgomery, out of the total population over 16 years of age (2,494), 70.4% or 1,756 individuals are in the labor force, with 2.8% or 49 of them unemployed. The age group with the highest labor force participation rate is 20 to 24 years, with 100.0% or 246 individuals in the labor force. Within the labor force, the 16 to 19 years age range has the highest percentage of unemployed individuals, with 21.4% or 15 of them being unemployed.
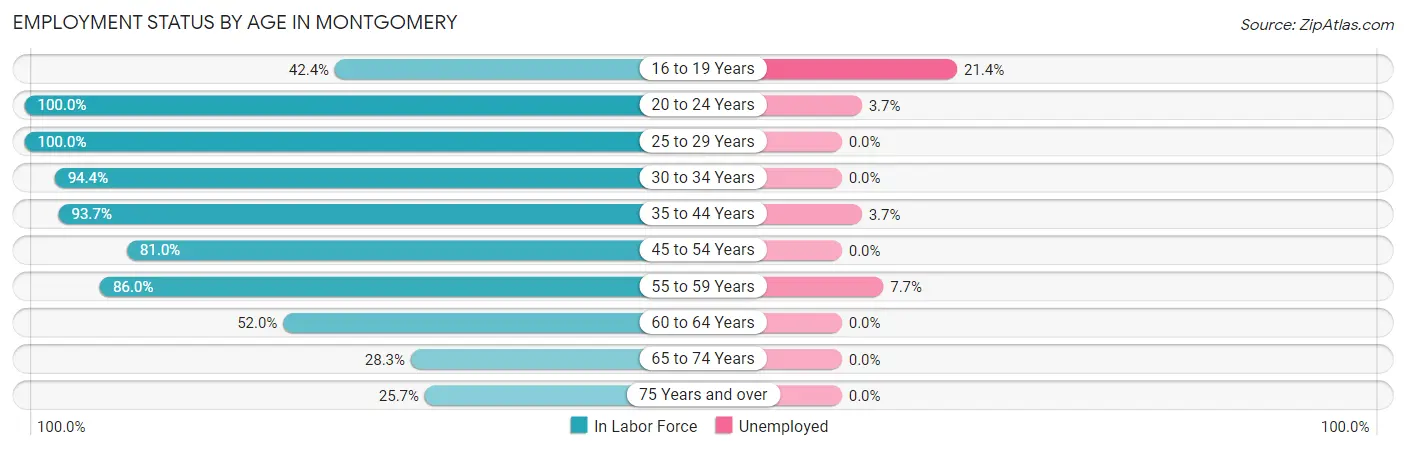
| Age Bracket | In Labor Force | Unemployed |
| 16 to 19 Years | 70 (42.4%) | 15 (21.4%) |
| 20 to 24 Years | 246 (100.0%) | 9 (3.7%) |
| 25 to 29 Years | 133 (100.0%) | 0 (0.0%) |
| 30 to 34 Years | 201 (94.4%) | 0 (0.0%) |
| 35 to 44 Years | 462 (93.7%) | 17 (3.7%) |
| 45 to 54 Years | 307 (81.0%) | 0 (0.0%) |
| 55 to 59 Years | 104 (86.0%) | 8 (7.7%) |
| 60 to 64 Years | 64 (52.0%) | 0 (0.0%) |
| 65 to 74 Years | 104 (28.3%) | 0 (0.0%) |
| 75 Years and over | 65 (25.7%) | 0 (0.0%) |
| Total | 1,756 (70.4%) | 49 (2.8%) |
Employment Status by Educational Attainment in Montgomery
According to labor force statistics for Montgomery, 86.9% of individuals (1,270) out of the total population between 25 and 64 years of age (1,462) are in the labor force, with 2.0% or 25 of them being unemployed. The group with the highest labor force participation rate are those with the educational attainment of high school diploma, with 90.0% or 459 individuals in the labor force. Within the labor force, individuals with less than high school education have the highest percentage of unemployment, with 20.0% or 17 of them being unemployed.
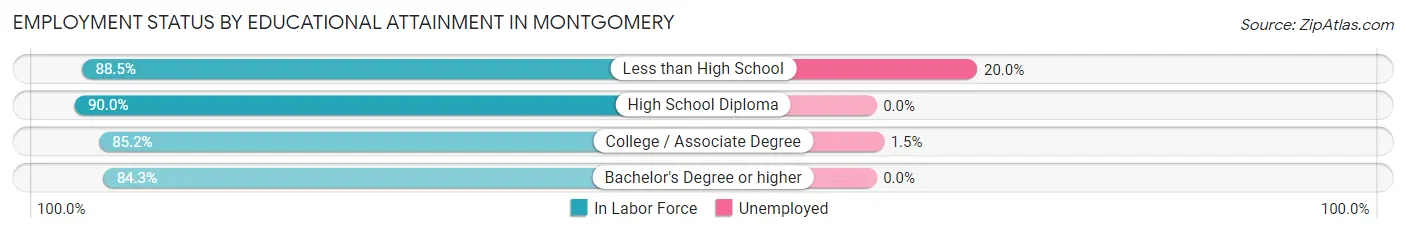
| Educational Attainment | In Labor Force | Unemployed |
| Less than High School | 85 (88.5%) | 19 (20.0%) |
| High School Diploma | 459 (90.0%) | 0 (0.0%) |
| College / Associate Degree | 517 (85.2%) | 9 (1.5%) |
| Bachelor's Degree or higher | 210 (84.3%) | 0 (0.0%) |
| Total | 1,270 (86.9%) | 29 (2.0%) |
Employment Occupations by Sex in Montgomery
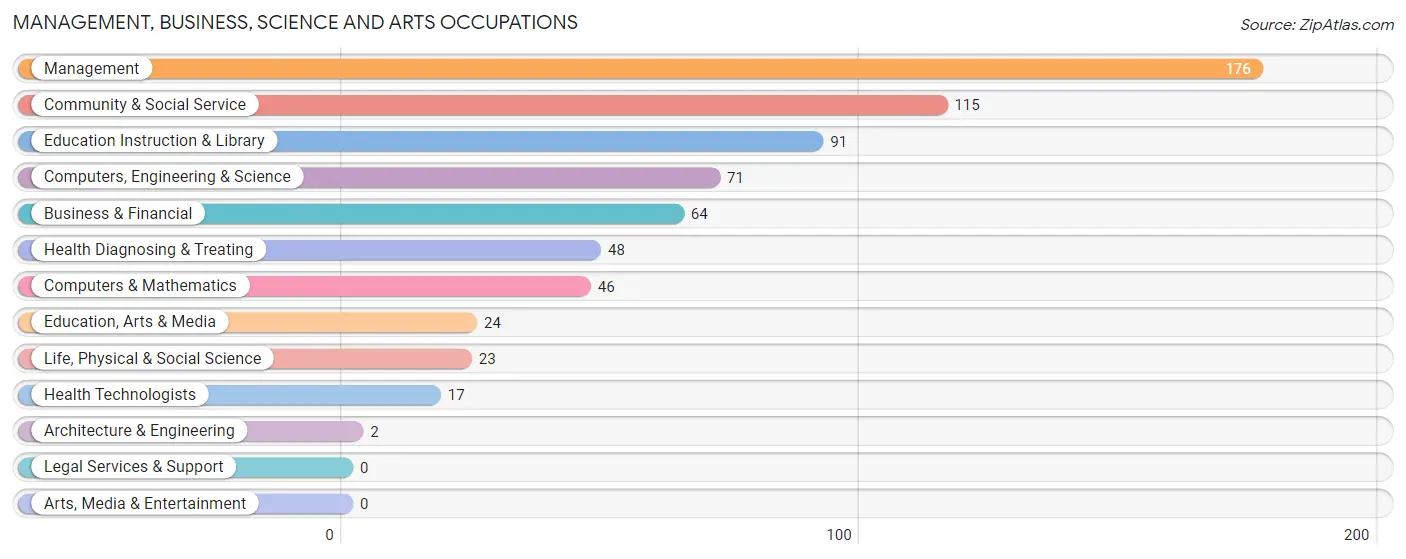
Management, Business, Science and Arts Occupations
The most common Management, Business, Science and Arts occupations in Montgomery are Management (176 | 10.4%), Community & Social Service (115 | 6.8%), Education Instruction & Library (91 | 5.4%), Computers, Engineering & Science (71 | 4.2%), and Business & Financial (64 | 3.8%).
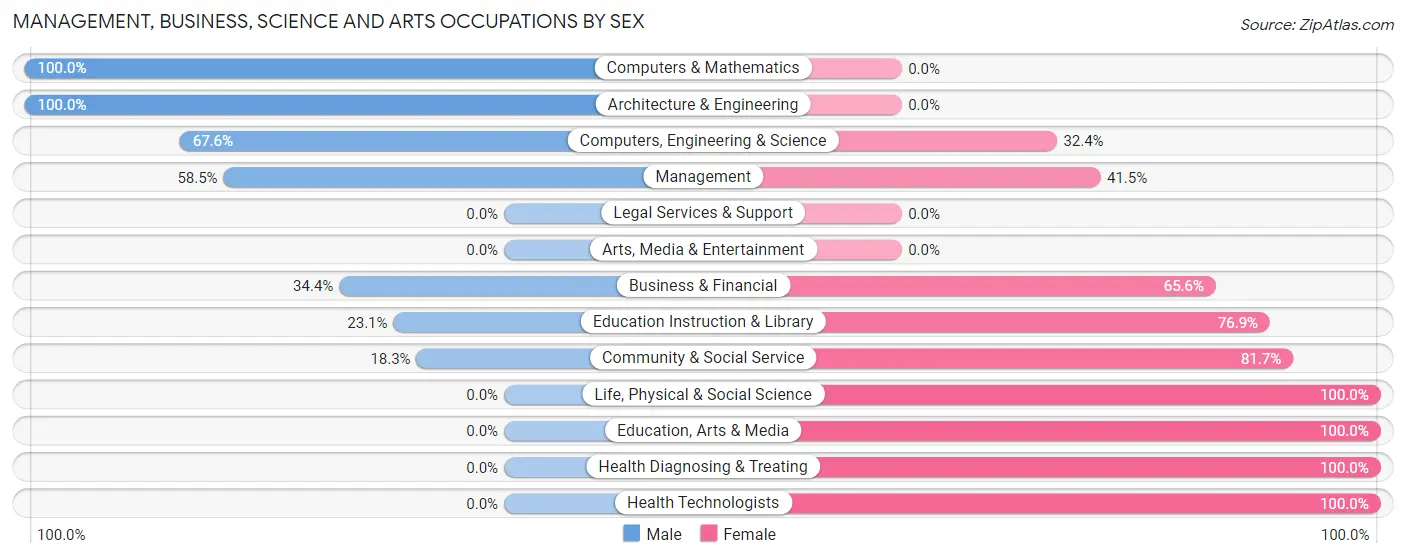
Management, Business, Science and Arts Occupations by Sex
Within the Management, Business, Science and Arts occupations in Montgomery, the most male-oriented occupations are Computers & Mathematics (100.0%), Architecture & Engineering (100.0%), and Computers, Engineering & Science (67.6%), while the most female-oriented occupations are Life, Physical & Social Science (100.0%), Education, Arts & Media (100.0%), and Health Diagnosing & Treating (100.0%).
| Occupation | Male | Female |
| Management | 103 (58.5%) | 73 (41.5%) |
| Business & Financial | 22 (34.4%) | 42 (65.6%) |
| Computers, Engineering & Science | 48 (67.6%) | 23 (32.4%) |
| Computers & Mathematics | 46 (100.0%) | 0 (0.0%) |
| Architecture & Engineering | 2 (100.0%) | 0 (0.0%) |
| Life, Physical & Social Science | 0 (0.0%) | 23 (100.0%) |
| Community & Social Service | 21 (18.3%) | 94 (81.7%) |
| Education, Arts & Media | 0 (0.0%) | 24 (100.0%) |
| Legal Services & Support | 0 (0.0%) | 0 (0.0%) |
| Education Instruction & Library | 21 (23.1%) | 70 (76.9%) |
| Arts, Media & Entertainment | 0 (0.0%) | 0 (0.0%) |
| Health Diagnosing & Treating | 0 (0.0%) | 48 (100.0%) |
| Health Technologists | 0 (0.0%) | 17 (100.0%) |
| Total (Category) | 194 (40.9%) | 280 (59.1%) |
| Total (Overall) | 892 (52.7%) | 801 (47.3%) |
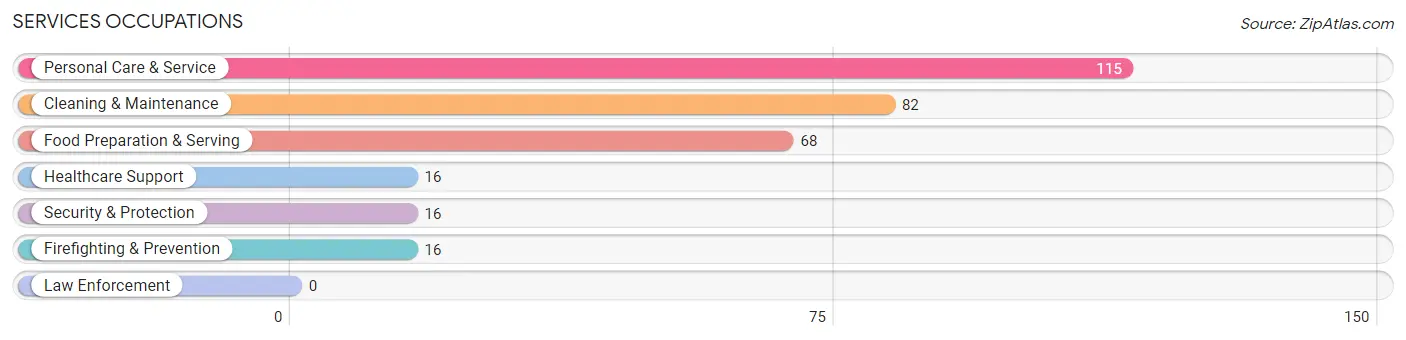
Services Occupations
The most common Services occupations in Montgomery are Personal Care & Service (115 | 6.8%), Cleaning & Maintenance (82 | 4.8%), Food Preparation & Serving (68 | 4.0%), Healthcare Support (16 | 0.9%), and Security & Protection (16 | 0.9%).
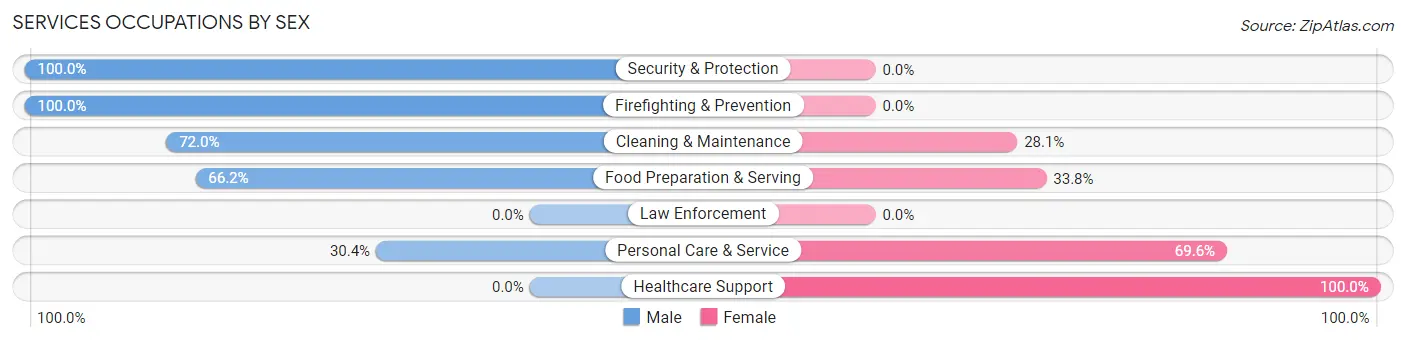
Services Occupations by Sex
Within the Services occupations in Montgomery, the most male-oriented occupations are Security & Protection (100.0%), Firefighting & Prevention (100.0%), and Cleaning & Maintenance (72.0%), while the most female-oriented occupations are Healthcare Support (100.0%), Personal Care & Service (69.6%), and Food Preparation & Serving (33.8%).
| Occupation | Male | Female |
| Healthcare Support | 0 (0.0%) | 16 (100.0%) |
| Security & Protection | 16 (100.0%) | 0 (0.0%) |
| Firefighting & Prevention | 16 (100.0%) | 0 (0.0%) |
| Law Enforcement | 0 (0.0%) | 0 (0.0%) |
| Food Preparation & Serving | 45 (66.2%) | 23 (33.8%) |
| Cleaning & Maintenance | 59 (72.0%) | 23 (28.1%) |
| Personal Care & Service | 35 (30.4%) | 80 (69.6%) |
| Total (Category) | 155 (52.2%) | 142 (47.8%) |
| Total (Overall) | 892 (52.7%) | 801 (47.3%) |
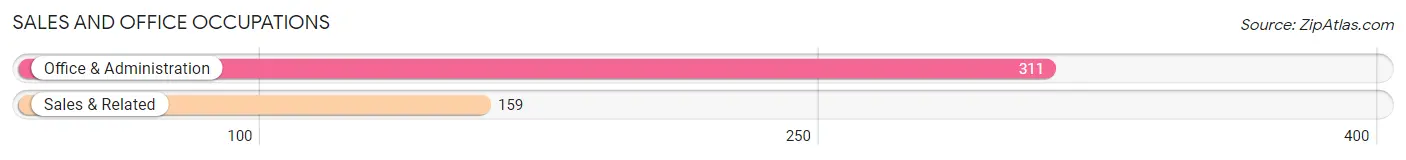
Sales and Office Occupations
The most common Sales and Office occupations in Montgomery are Office & Administration (311 | 18.4%), and Sales & Related (159 | 9.4%).
Sales and Office Occupations by Sex
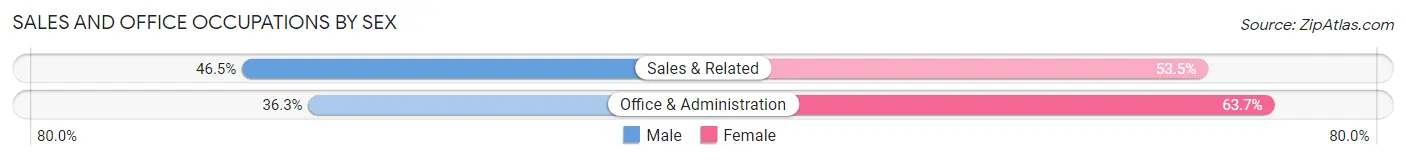
| Occupation | Male | Female |
| Sales & Related | 74 (46.5%) | 85 (53.5%) |
| Office & Administration | 113 (36.3%) | 198 (63.7%) |
| Total (Category) | 187 (39.8%) | 283 (60.2%) |
| Total (Overall) | 892 (52.7%) | 801 (47.3%) |
Natural Resources, Construction and Maintenance Occupations
The most common Natural Resources, Construction and Maintenance occupations in Montgomery are Construction & Extraction (96 | 5.7%), Installation, Maintenance & Repair (80 | 4.7%), and Farming, Fishing & Forestry (9 | 0.5%).

Natural Resources, Construction and Maintenance Occupations by Sex
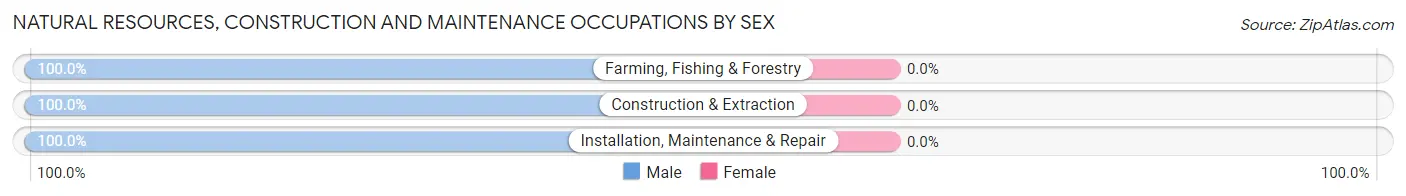
| Occupation | Male | Female |
| Farming, Fishing & Forestry | 9 (100.0%) | 0 (0.0%) |
| Construction & Extraction | 96 (100.0%) | 0 (0.0%) |
| Installation, Maintenance & Repair | 80 (100.0%) | 0 (0.0%) |
| Total (Category) | 185 (100.0%) | 0 (0.0%) |
| Total (Overall) | 892 (52.7%) | 801 (47.3%) |
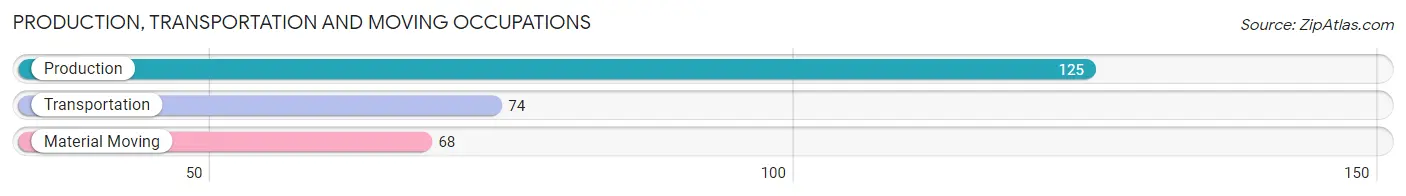
Production, Transportation and Moving Occupations
The most common Production, Transportation and Moving occupations in Montgomery are Production (125 | 7.4%), Transportation (74 | 4.4%), and Material Moving (68 | 4.0%).
Production, Transportation and Moving Occupations by Sex
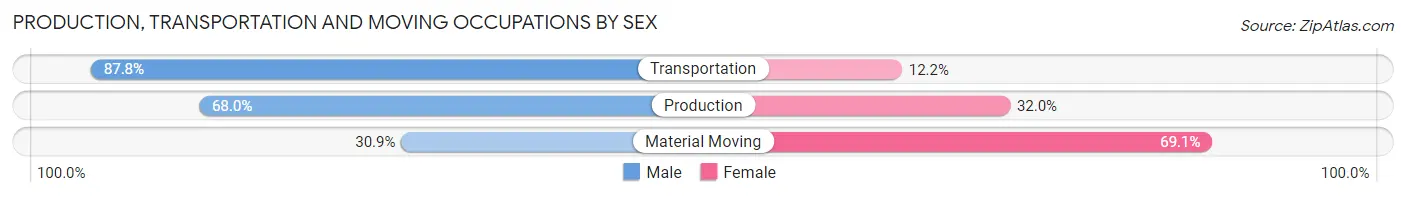
| Occupation | Male | Female |
| Production | 85 (68.0%) | 40 (32.0%) |
| Transportation | 65 (87.8%) | 9 (12.2%) |
| Material Moving | 21 (30.9%) | 47 (69.1%) |
| Total (Category) | 171 (64.0%) | 96 (36.0%) |
| Total (Overall) | 892 (52.7%) | 801 (47.3%) |
Employment Industries by Sex in Montgomery
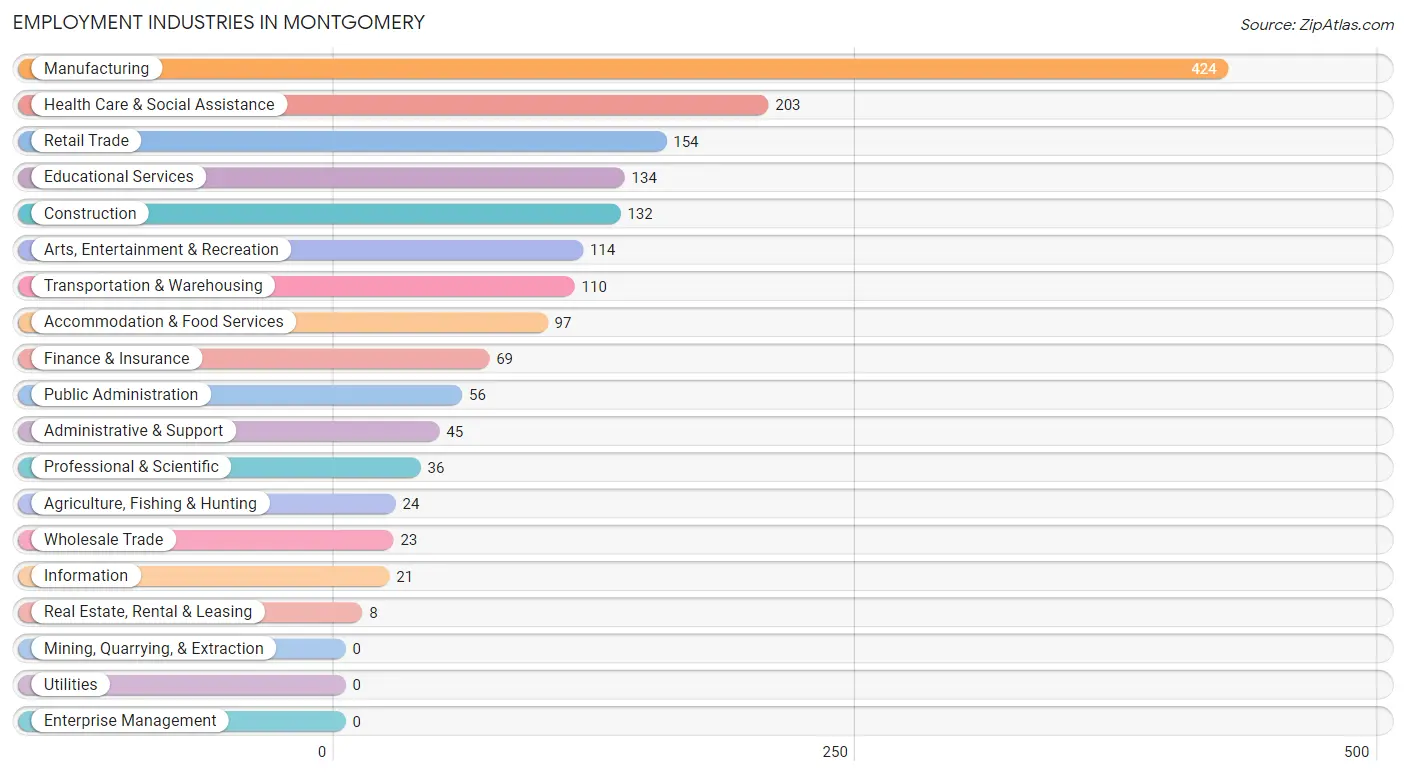
Employment Industries in Montgomery
The major employment industries in Montgomery include Manufacturing (424 | 25.0%), Health Care & Social Assistance (203 | 12.0%), Retail Trade (154 | 9.1%), Educational Services (134 | 7.9%), and Construction (132 | 7.8%).
Employment Industries by Sex in Montgomery
The Montgomery industries that see more men than women are Information (100.0%), Real Estate, Rental & Leasing (100.0%), and Administrative & Support (100.0%), whereas the industries that tend to have a higher number of women are Finance & Insurance (100.0%), Health Care & Social Assistance (100.0%), and Retail Trade (72.7%).
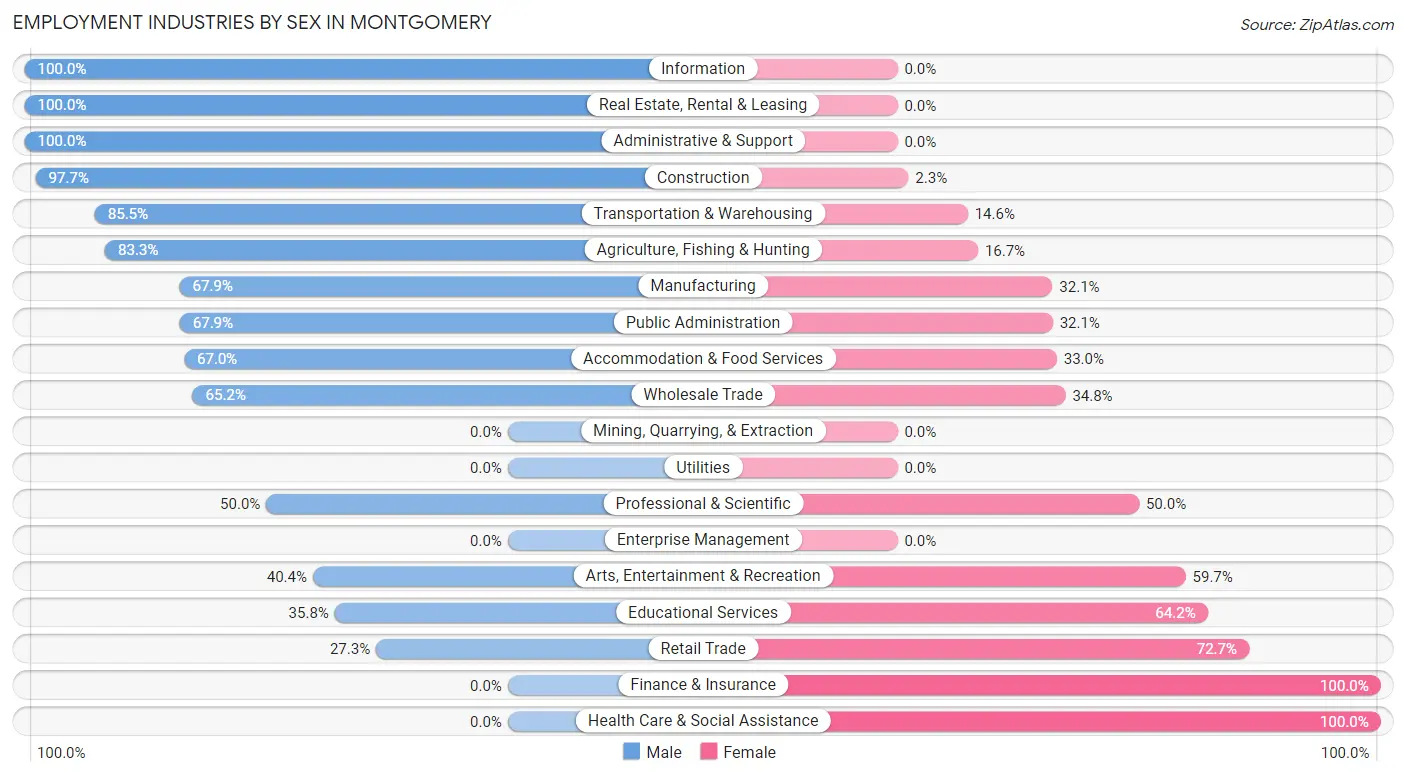
| Industry | Male | Female |
| Agriculture, Fishing & Hunting | 20 (83.3%) | 4 (16.7%) |
| Mining, Quarrying, & Extraction | 0 (0.0%) | 0 (0.0%) |
| Construction | 129 (97.7%) | 3 (2.3%) |
| Manufacturing | 288 (67.9%) | 136 (32.1%) |
| Wholesale Trade | 15 (65.2%) | 8 (34.8%) |
| Retail Trade | 42 (27.3%) | 112 (72.7%) |
| Transportation & Warehousing | 94 (85.5%) | 16 (14.5%) |
| Utilities | 0 (0.0%) | 0 (0.0%) |
| Information | 21 (100.0%) | 0 (0.0%) |
| Finance & Insurance | 0 (0.0%) | 69 (100.0%) |
| Real Estate, Rental & Leasing | 8 (100.0%) | 0 (0.0%) |
| Professional & Scientific | 18 (50.0%) | 18 (50.0%) |
| Enterprise Management | 0 (0.0%) | 0 (0.0%) |
| Administrative & Support | 45 (100.0%) | 0 (0.0%) |
| Educational Services | 48 (35.8%) | 86 (64.2%) |
| Health Care & Social Assistance | 0 (0.0%) | 203 (100.0%) |
| Arts, Entertainment & Recreation | 46 (40.4%) | 68 (59.7%) |
| Accommodation & Food Services | 65 (67.0%) | 32 (33.0%) |
| Public Administration | 38 (67.9%) | 18 (32.1%) |
| Total | 892 (52.7%) | 801 (47.3%) |
Education in Montgomery
School Enrollment in Montgomery
The most common levels of schooling among the 988 students in Montgomery are middle school (353 | 35.7%), high school (199 | 20.1%), and elementary school (190 | 19.2%).
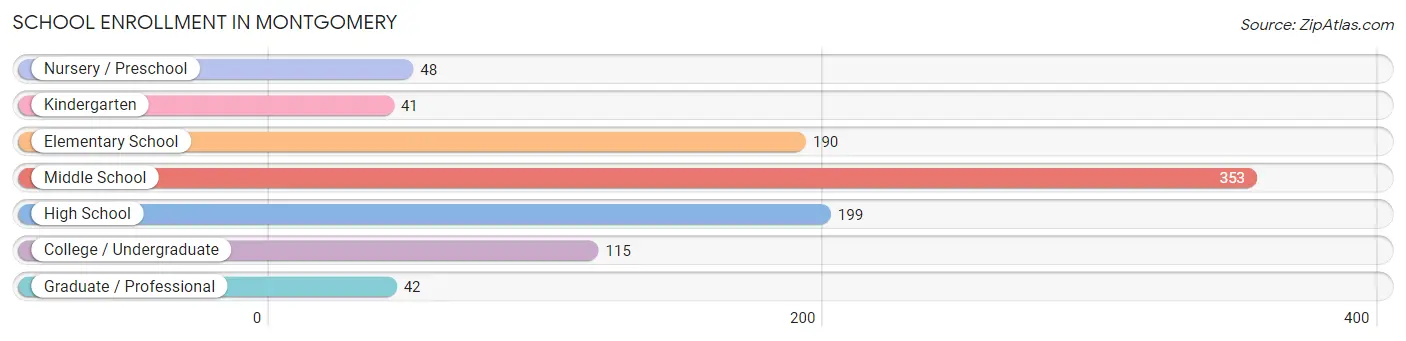
| School Level | # Students | % Students |
| Nursery / Preschool | 48 | 4.9% |
| Kindergarten | 41 | 4.2% |
| Elementary School | 190 | 19.2% |
| Middle School | 353 | 35.7% |
| High School | 199 | 20.1% |
| College / Undergraduate | 115 | 11.6% |
| Graduate / Professional | 42 | 4.3% |
| Total | 988 | 100.0% |
School Enrollment by Age by Funding Source in Montgomery
Out of a total of 988 students who are enrolled in schools in Montgomery, 78 (7.9%) attend a private institution, while the remaining 910 (92.1%) are enrolled in public schools. The age group of 10 to 14 year olds has the highest likelihood of being enrolled in private schools, with 78 (20.7% in the age bracket) enrolled. Conversely, the age group of 3 to 4 year olds has the lowest likelihood of being enrolled in a private school, with 30 (100.0% in the age bracket) attending a public institution.
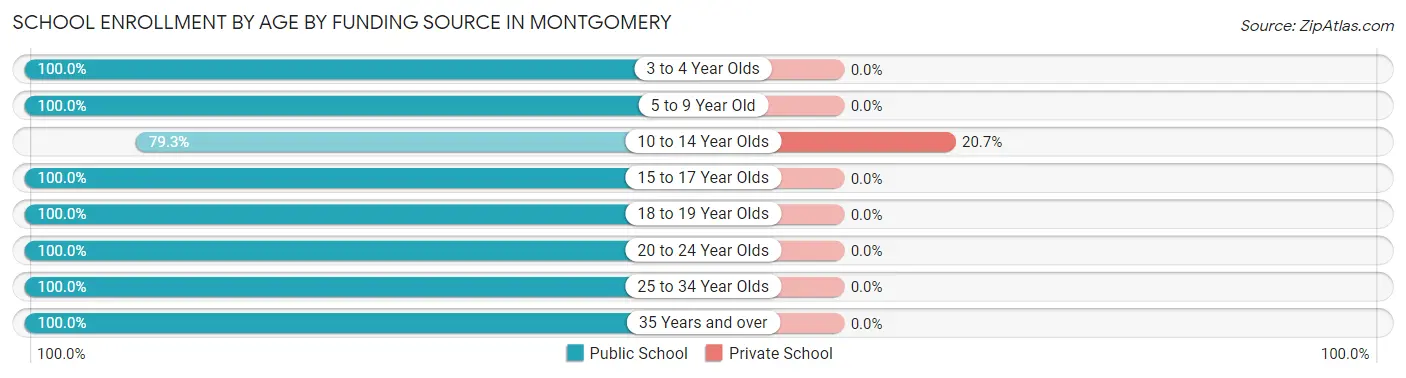
| Age Bracket | Public School | Private School |
| 3 to 4 Year Olds | 30 (100.0%) | 0 (0.0%) |
| 5 to 9 Year Old | 218 (100.0%) | 0 (0.0%) |
| 10 to 14 Year Olds | 298 (79.3%) | 78 (20.7%) |
| 15 to 17 Year Olds | 176 (100.0%) | 0 (0.0%) |
| 18 to 19 Year Olds | 30 (100.0%) | 0 (0.0%) |
| 20 to 24 Year Olds | 66 (100.0%) | 0 (0.0%) |
| 25 to 34 Year Olds | 27 (100.0%) | 0 (0.0%) |
| 35 Years and over | 65 (100.0%) | 0 (0.0%) |
| Total | 910 (92.1%) | 78 (7.9%) |
Educational Attainment by Field of Study in Montgomery
Education (103 | 26.6%), business (73 | 18.9%), bio, nature & agricultural (43 | 11.1%), social sciences (36 | 9.3%), and computers & mathematics (27 | 7.0%) are the most common fields of study among 387 individuals in Montgomery who have obtained a bachelor's degree or higher.
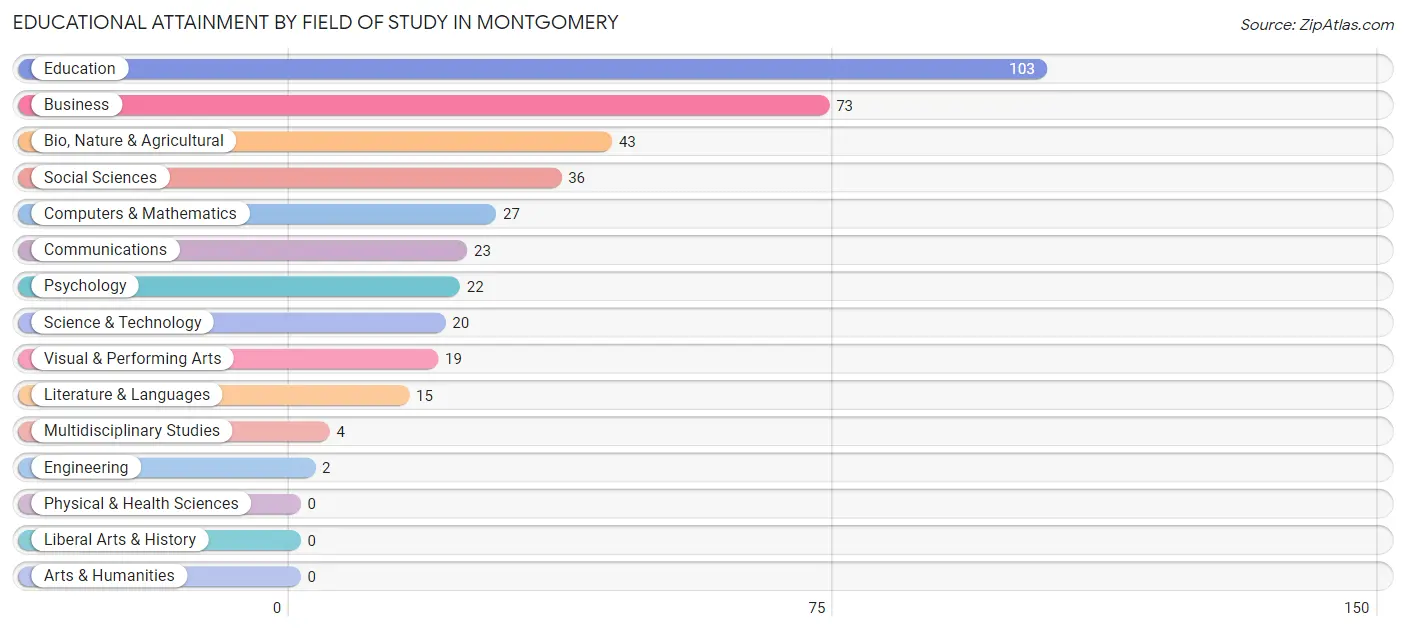
| Field of Study | # Graduates | % Graduates |
| Computers & Mathematics | 27 | 7.0% |
| Bio, Nature & Agricultural | 43 | 11.1% |
| Physical & Health Sciences | 0 | 0.0% |
| Psychology | 22 | 5.7% |
| Social Sciences | 36 | 9.3% |
| Engineering | 2 | 0.5% |
| Multidisciplinary Studies | 4 | 1.0% |
| Science & Technology | 20 | 5.2% |
| Business | 73 | 18.9% |
| Education | 103 | 26.6% |
| Literature & Languages | 15 | 3.9% |
| Liberal Arts & History | 0 | 0.0% |
| Visual & Performing Arts | 19 | 4.9% |
| Communications | 23 | 5.9% |
| Arts & Humanities | 0 | 0.0% |
| Total | 387 | 100.0% |
Transportation & Commute in Montgomery
Vehicle Availability by Sex in Montgomery
The most prevalent vehicle ownership categories in Montgomery are males with 3 vehicles (302, accounting for 35.5%) and females with 3 vehicles (305, making up 42.2%).
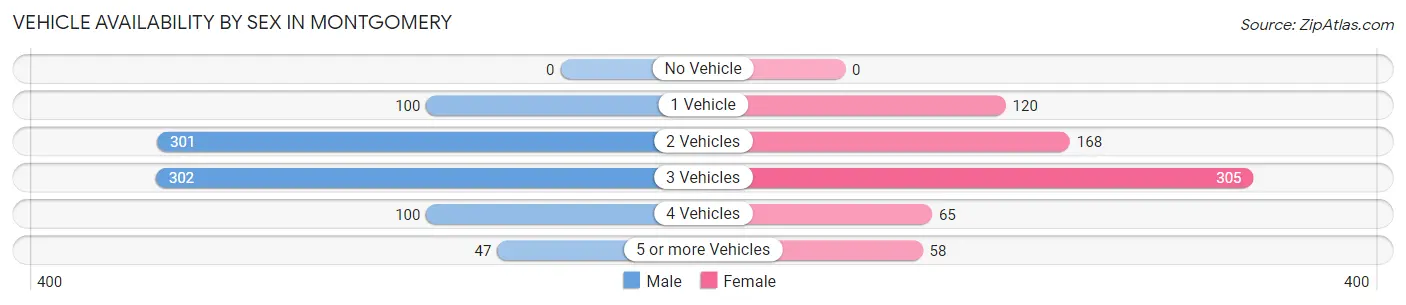
| Vehicles Available | Male | Female |
| No Vehicle | 0 (0.0%) | 0 (0.0%) |
| 1 Vehicle | 100 (11.8%) | 120 (16.8%) |
| 2 Vehicles | 301 (35.4%) | 168 (23.5%) |
| 3 Vehicles | 302 (35.5%) | 305 (42.6%) |
| 4 Vehicles | 100 (11.8%) | 65 (9.1%) |
| 5 or more Vehicles | 47 (5.5%) | 58 (8.1%) |
| Total | 850 (100.0%) | 716 (100.0%) |
Commute Time in Montgomery
The most frequently occuring commute durations in Montgomery are 10 to 14 minutes (253 commuters, 17.8%), 30 to 34 minutes (212 commuters, 14.9%), and 45 to 59 minutes (164 commuters, 11.6%).
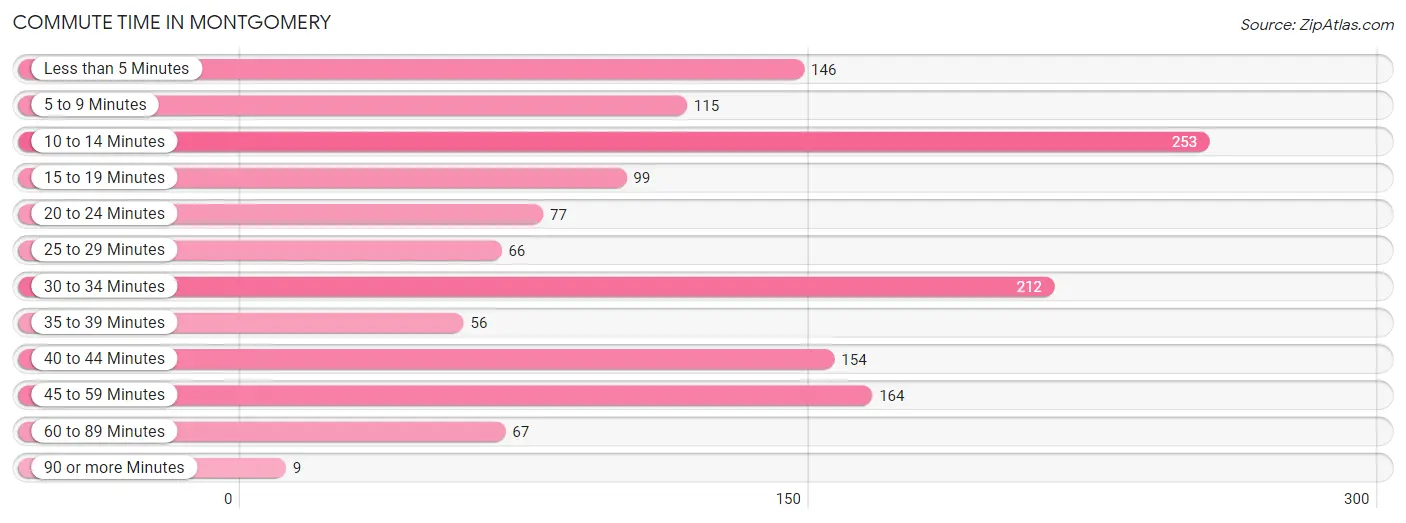
| Commute Time | # Commuters | % Commuters |
| Less than 5 Minutes | 146 | 10.3% |
| 5 to 9 Minutes | 115 | 8.1% |
| 10 to 14 Minutes | 253 | 17.8% |
| 15 to 19 Minutes | 99 | 7.0% |
| 20 to 24 Minutes | 77 | 5.4% |
| 25 to 29 Minutes | 66 | 4.6% |
| 30 to 34 Minutes | 212 | 14.9% |
| 35 to 39 Minutes | 56 | 4.0% |
| 40 to 44 Minutes | 154 | 10.9% |
| 45 to 59 Minutes | 164 | 11.6% |
| 60 to 89 Minutes | 67 | 4.7% |
| 90 or more Minutes | 9 | 0.6% |
Commute Time by Sex in Montgomery
The most common commute times in Montgomery are 30 to 34 minutes (177 commuters, 23.4%) for males and 10 to 14 minutes (181 commuters, 27.4%) for females.
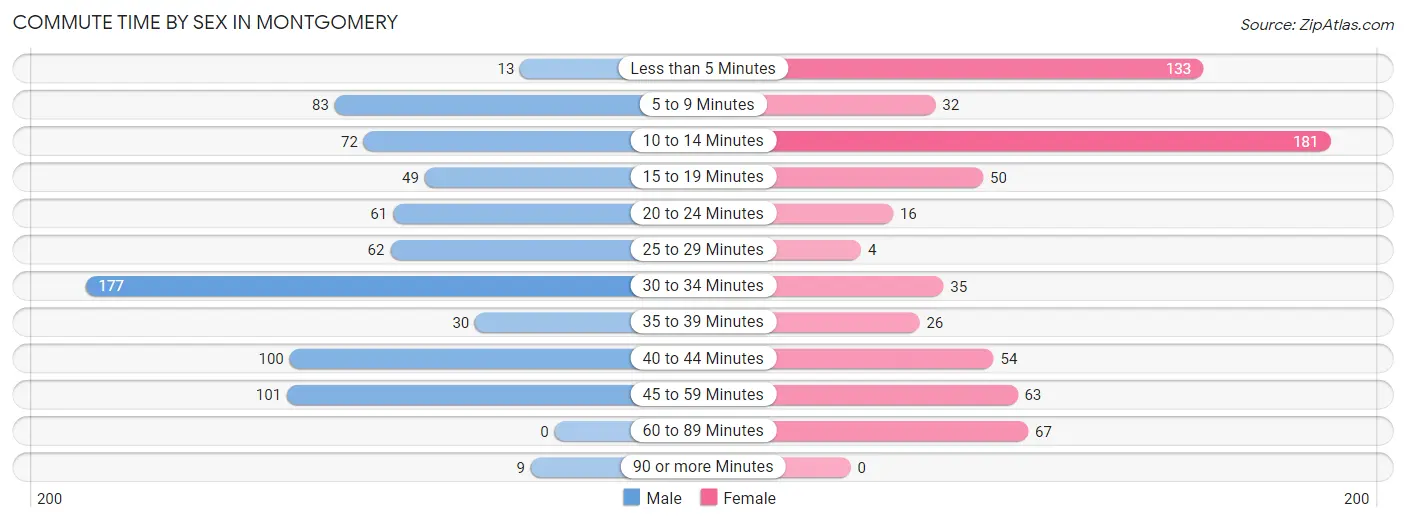
| Commute Time | Male | Female |
| Less than 5 Minutes | 13 (1.7%) | 133 (20.1%) |
| 5 to 9 Minutes | 83 (11.0%) | 32 (4.8%) |
| 10 to 14 Minutes | 72 (9.5%) | 181 (27.4%) |
| 15 to 19 Minutes | 49 (6.5%) | 50 (7.6%) |
| 20 to 24 Minutes | 61 (8.1%) | 16 (2.4%) |
| 25 to 29 Minutes | 62 (8.2%) | 4 (0.6%) |
| 30 to 34 Minutes | 177 (23.4%) | 35 (5.3%) |
| 35 to 39 Minutes | 30 (4.0%) | 26 (3.9%) |
| 40 to 44 Minutes | 100 (13.2%) | 54 (8.2%) |
| 45 to 59 Minutes | 101 (13.3%) | 63 (9.5%) |
| 60 to 89 Minutes | 0 (0.0%) | 67 (10.1%) |
| 90 or more Minutes | 9 (1.2%) | 0 (0.0%) |
Time of Departure to Work by Sex in Montgomery
The most frequent times of departure to work in Montgomery are 8:00 AM to 8:29 AM (129, 17.0%) for males and 7:30 AM to 7:59 AM (217, 32.8%) for females.
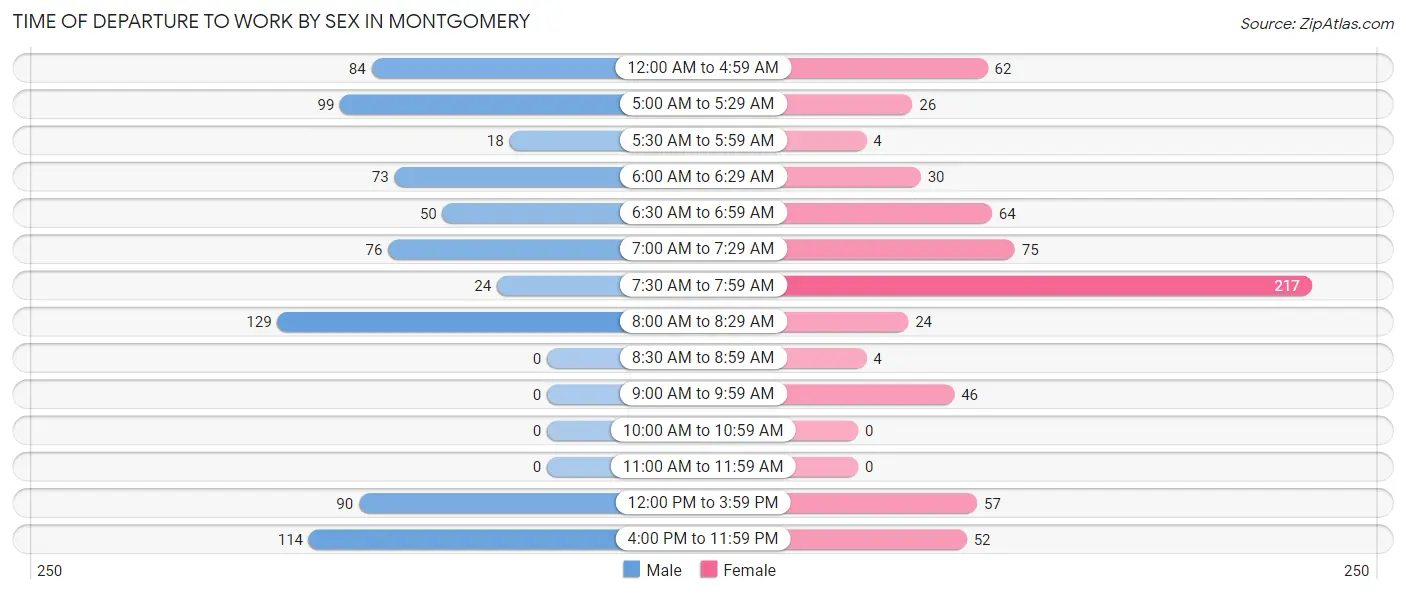
| Time of Departure | Male | Female |
| 12:00 AM to 4:59 AM | 84 (11.1%) | 62 (9.4%) |
| 5:00 AM to 5:29 AM | 99 (13.1%) | 26 (3.9%) |
| 5:30 AM to 5:59 AM | 18 (2.4%) | 4 (0.6%) |
| 6:00 AM to 6:29 AM | 73 (9.6%) | 30 (4.5%) |
| 6:30 AM to 6:59 AM | 50 (6.6%) | 64 (9.7%) |
| 7:00 AM to 7:29 AM | 76 (10.0%) | 75 (11.4%) |
| 7:30 AM to 7:59 AM | 24 (3.2%) | 217 (32.8%) |
| 8:00 AM to 8:29 AM | 129 (17.0%) | 24 (3.6%) |
| 8:30 AM to 8:59 AM | 0 (0.0%) | 4 (0.6%) |
| 9:00 AM to 9:59 AM | 0 (0.0%) | 46 (7.0%) |
| 10:00 AM to 10:59 AM | 0 (0.0%) | 0 (0.0%) |
| 11:00 AM to 11:59 AM | 0 (0.0%) | 0 (0.0%) |
| 12:00 PM to 3:59 PM | 90 (11.9%) | 57 (8.6%) |
| 4:00 PM to 11:59 PM | 114 (15.1%) | 52 (7.9%) |
| Total | 757 (100.0%) | 661 (100.0%) |
Housing Occupancy in Montgomery
Occupancy by Ownership in Montgomery
Of the total 1,301 dwellings in Montgomery, owner-occupied units account for 1,015 (78.0%), while renter-occupied units make up 286 (22.0%).
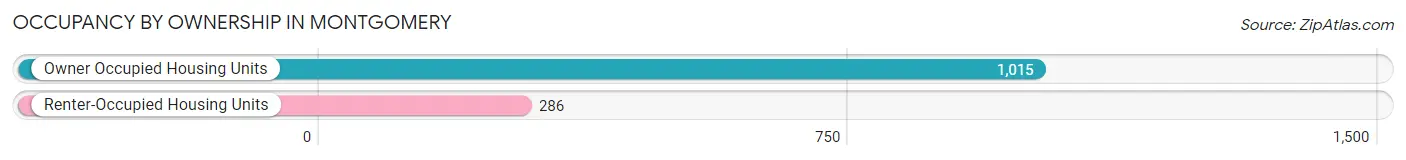
| Occupancy | # Housing Units | % Housing Units |
| Owner Occupied Housing Units | 1,015 | 78.0% |
| Renter-Occupied Housing Units | 286 | 22.0% |
| Total Occupied Housing Units | 1,301 | 100.0% |
Occupancy by Household Size in Montgomery
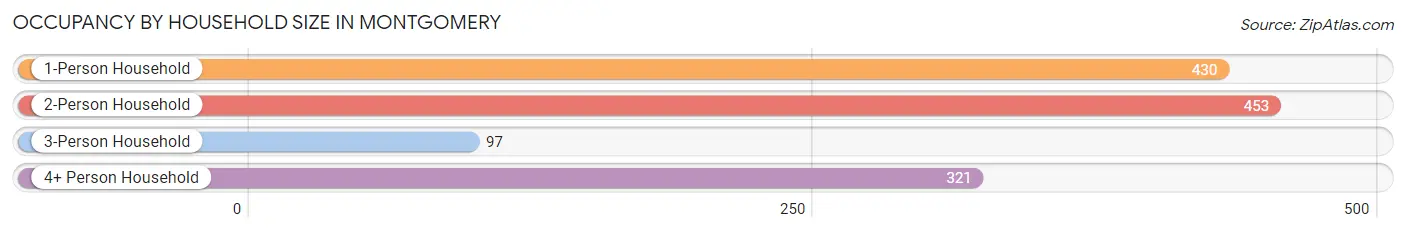
| Household Size | # Housing Units | % Housing Units |
| 1-Person Household | 430 | 33.1% |
| 2-Person Household | 453 | 34.8% |
| 3-Person Household | 97 | 7.5% |
| 4+ Person Household | 321 | 24.7% |
| Total Housing Units | 1,301 | 100.0% |
Occupancy by Ownership by Household Size in Montgomery
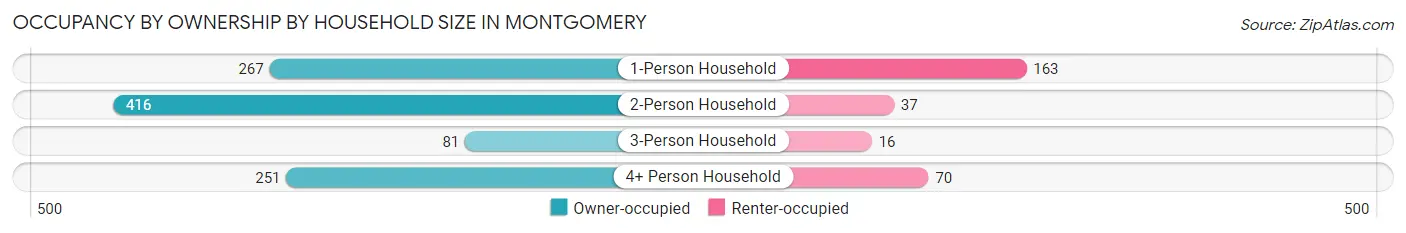
| Household Size | Owner-occupied | Renter-occupied |
| 1-Person Household | 267 (62.1%) | 163 (37.9%) |
| 2-Person Household | 416 (91.8%) | 37 (8.2%) |
| 3-Person Household | 81 (83.5%) | 16 (16.5%) |
| 4+ Person Household | 251 (78.2%) | 70 (21.8%) |
| Total Housing Units | 1,015 (78.0%) | 286 (22.0%) |
Occupancy by Educational Attainment in Montgomery
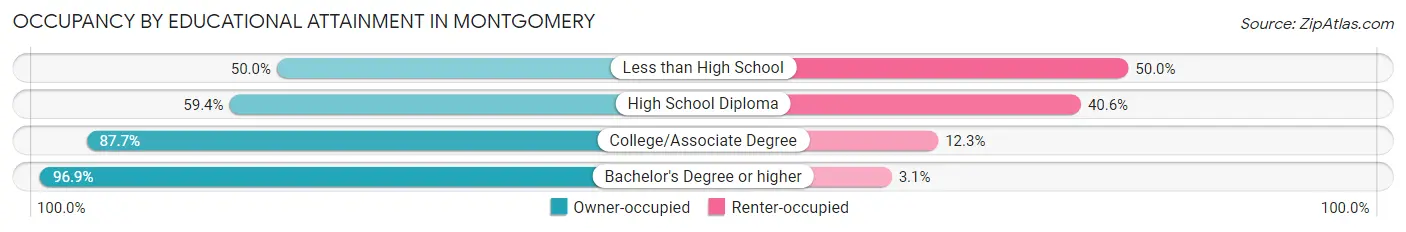
| Household Size | Owner-occupied | Renter-occupied |
| Less than High School | 33 (50.0%) | 33 (50.0%) |
| High School Diploma | 256 (59.4%) | 175 (40.6%) |
| College/Associate Degree | 506 (87.7%) | 71 (12.3%) |
| Bachelor's Degree or higher | 220 (96.9%) | 7 (3.1%) |
Occupancy by Age of Householder in Montgomery
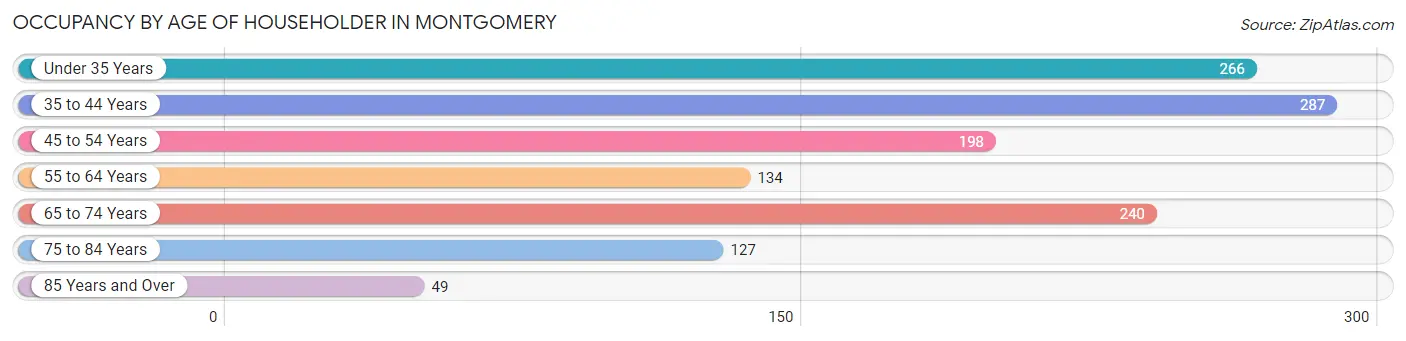
| Age Bracket | # Households | % Households |
| Under 35 Years | 266 | 20.4% |
| 35 to 44 Years | 287 | 22.1% |
| 45 to 54 Years | 198 | 15.2% |
| 55 to 64 Years | 134 | 10.3% |
| 65 to 74 Years | 240 | 18.4% |
| 75 to 84 Years | 127 | 9.8% |
| 85 Years and Over | 49 | 3.8% |
| Total | 1,301 | 100.0% |
Housing Finances in Montgomery
Median Income by Occupancy in Montgomery
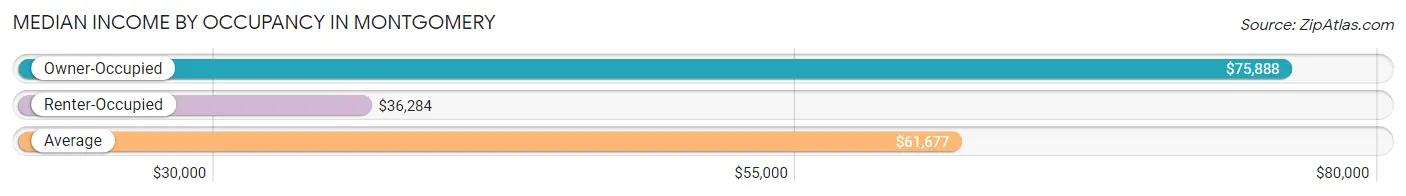
| Occupancy Type | # Households | Median Income |
| Owner-Occupied | 1,015 (78.0%) | $75,888 |
| Renter-Occupied | 286 (22.0%) | $36,284 |
| Average | 1,301 (100.0%) | $61,677 |
Occupancy by Householder Income Bracket in Montgomery
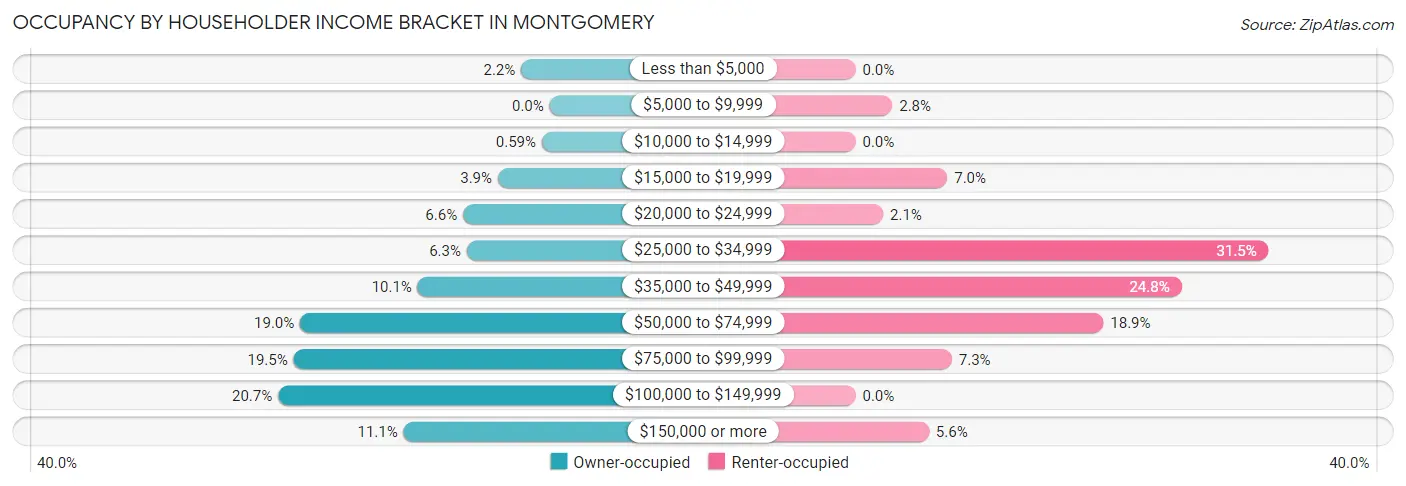
| Income Bracket | Owner-occupied | Renter-occupied |
| Less than $5,000 | 22 (2.2%) | 0 (0.0%) |
| $5,000 to $9,999 | 0 (0.0%) | 8 (2.8%) |
| $10,000 to $14,999 | 6 (0.6%) | 0 (0.0%) |
| $15,000 to $19,999 | 40 (3.9%) | 20 (7.0%) |
| $20,000 to $24,999 | 67 (6.6%) | 6 (2.1%) |
| $25,000 to $34,999 | 64 (6.3%) | 90 (31.5%) |
| $35,000 to $49,999 | 102 (10.1%) | 71 (24.8%) |
| $50,000 to $74,999 | 193 (19.0%) | 54 (18.9%) |
| $75,000 to $99,999 | 198 (19.5%) | 21 (7.3%) |
| $100,000 to $149,999 | 210 (20.7%) | 0 (0.0%) |
| $150,000 or more | 113 (11.1%) | 16 (5.6%) |
| Total | 1,015 (100.0%) | 286 (100.0%) |
Monthly Housing Cost Tiers in Montgomery
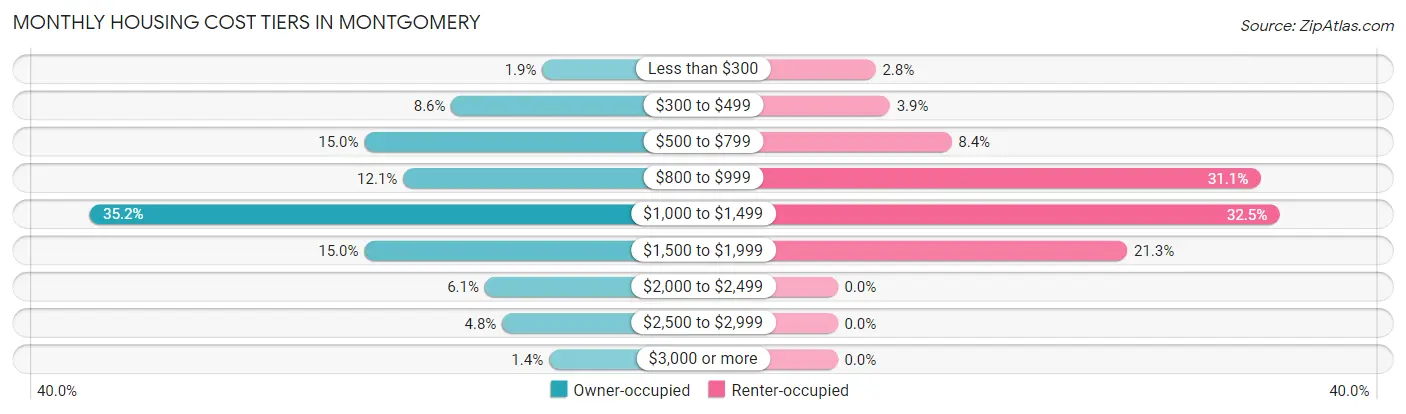
| Monthly Cost | Owner-occupied | Renter-occupied |
| Less than $300 | 19 (1.9%) | 8 (2.8%) |
| $300 to $499 | 87 (8.6%) | 11 (3.8%) |
| $500 to $799 | 152 (15.0%) | 24 (8.4%) |
| $800 to $999 | 123 (12.1%) | 89 (31.1%) |
| $1,000 to $1,499 | 357 (35.2%) | 93 (32.5%) |
| $1,500 to $1,999 | 152 (15.0%) | 61 (21.3%) |
| $2,000 to $2,499 | 62 (6.1%) | 0 (0.0%) |
| $2,500 to $2,999 | 49 (4.8%) | 0 (0.0%) |
| $3,000 or more | 14 (1.4%) | 0 (0.0%) |
| Total | 1,015 (100.0%) | 286 (100.0%) |
Physical Housing Characteristics in Montgomery
Housing Structures in Montgomery
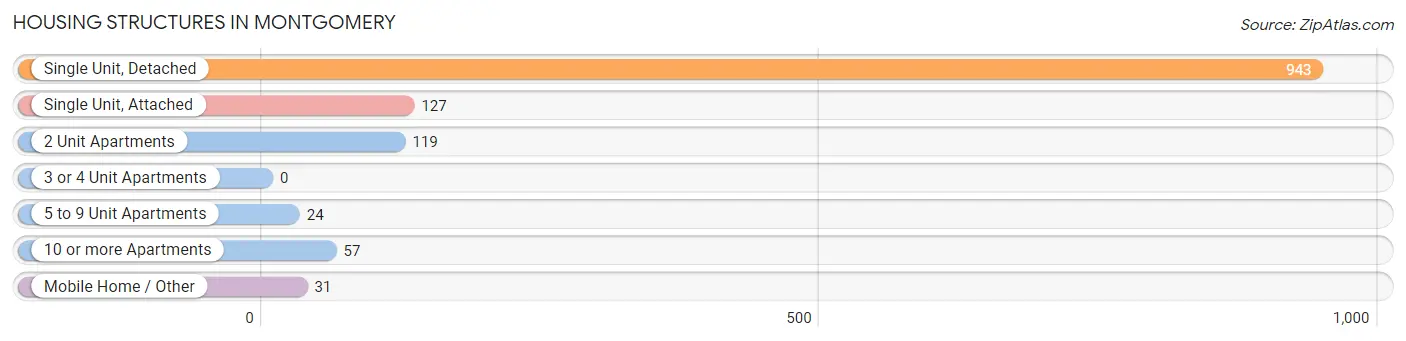
| Structure Type | # Housing Units | % Housing Units |
| Single Unit, Detached | 943 | 72.5% |
| Single Unit, Attached | 127 | 9.8% |
| 2 Unit Apartments | 119 | 9.1% |
| 3 or 4 Unit Apartments | 0 | 0.0% |
| 5 to 9 Unit Apartments | 24 | 1.8% |
| 10 or more Apartments | 57 | 4.4% |
| Mobile Home / Other | 31 | 2.4% |
| Total | 1,301 | 100.0% |
Housing Structures by Occupancy in Montgomery
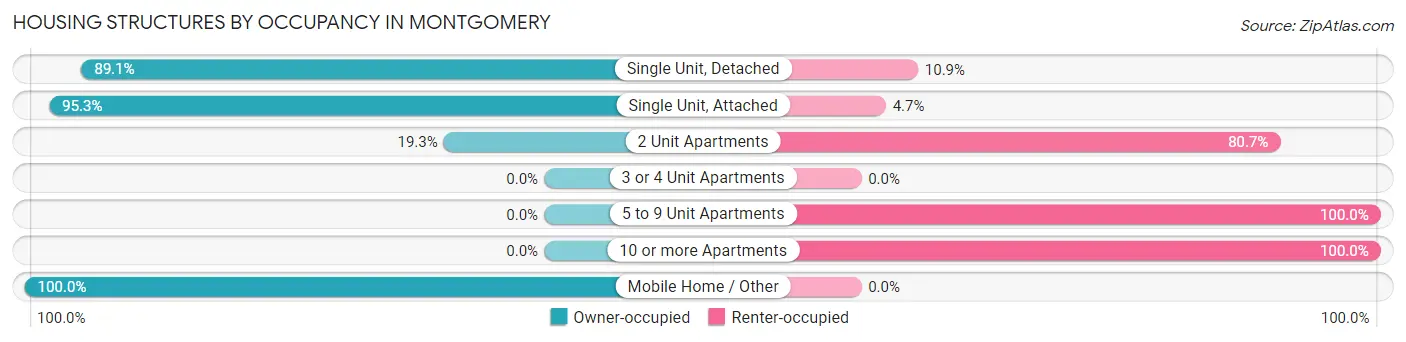
| Structure Type | Owner-occupied | Renter-occupied |
| Single Unit, Detached | 840 (89.1%) | 103 (10.9%) |
| Single Unit, Attached | 121 (95.3%) | 6 (4.7%) |
| 2 Unit Apartments | 23 (19.3%) | 96 (80.7%) |
| 3 or 4 Unit Apartments | 0 (0.0%) | 0 (0.0%) |
| 5 to 9 Unit Apartments | 0 (0.0%) | 24 (100.0%) |
| 10 or more Apartments | 0 (0.0%) | 57 (100.0%) |
| Mobile Home / Other | 31 (100.0%) | 0 (0.0%) |
| Total | 1,015 (78.0%) | 286 (22.0%) |
Housing Structures by Number of Rooms in Montgomery
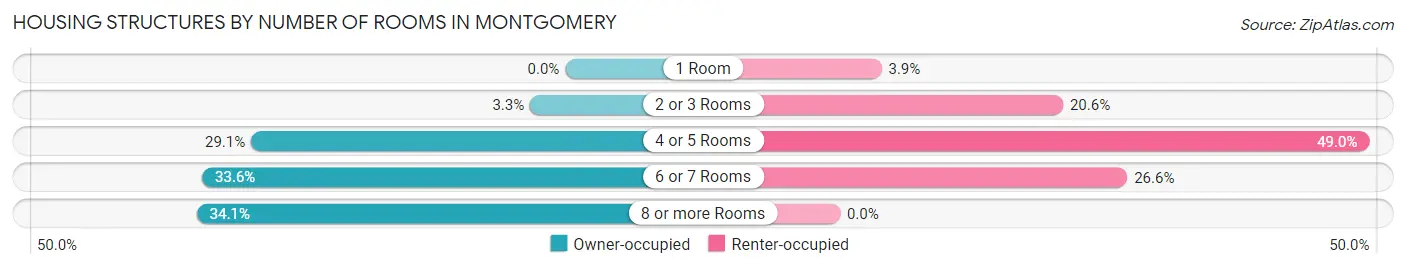
| Number of Rooms | Owner-occupied | Renter-occupied |
| 1 Room | 0 (0.0%) | 11 (3.8%) |
| 2 or 3 Rooms | 33 (3.3%) | 59 (20.6%) |
| 4 or 5 Rooms | 295 (29.1%) | 140 (48.9%) |
| 6 or 7 Rooms | 341 (33.6%) | 76 (26.6%) |
| 8 or more Rooms | 346 (34.1%) | 0 (0.0%) |
| Total | 1,015 (100.0%) | 286 (100.0%) |
Housing Structure by Heating Type in Montgomery
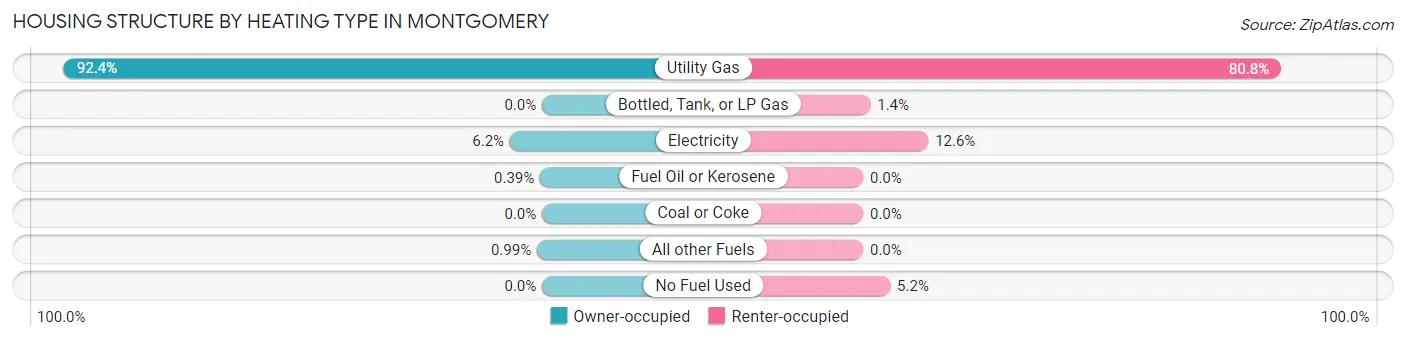
| Heating Type | Owner-occupied | Renter-occupied |
| Utility Gas | 938 (92.4%) | 231 (80.8%) |
| Bottled, Tank, or LP Gas | 0 (0.0%) | 4 (1.4%) |
| Electricity | 63 (6.2%) | 36 (12.6%) |
| Fuel Oil or Kerosene | 4 (0.4%) | 0 (0.0%) |
| Coal or Coke | 0 (0.0%) | 0 (0.0%) |
| All other Fuels | 10 (1.0%) | 0 (0.0%) |
| No Fuel Used | 0 (0.0%) | 15 (5.2%) |
| Total | 1,015 (100.0%) | 286 (100.0%) |
Household Vehicle Usage in Montgomery
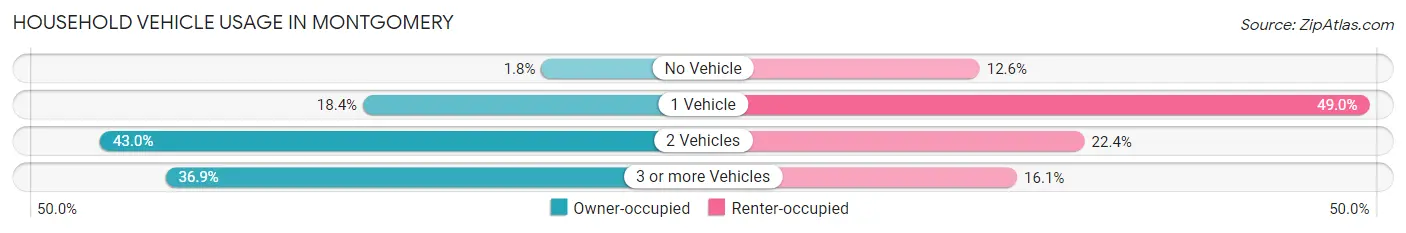
| Vehicles per Household | Owner-occupied | Renter-occupied |
| No Vehicle | 18 (1.8%) | 36 (12.6%) |
| 1 Vehicle | 187 (18.4%) | 140 (48.9%) |
| 2 Vehicles | 436 (43.0%) | 64 (22.4%) |
| 3 or more Vehicles | 374 (36.8%) | 46 (16.1%) |
| Total | 1,015 (100.0%) | 286 (100.0%) |
Real Estate & Mortgages in Montgomery
Real Estate and Mortgage Overview in Montgomery
| Characteristic | Without Mortgage | With Mortgage |
| Housing Units | 302 | 713 |
| Median Property Value | $205,600 | $207,000 |
| Median Household Income | $45,909 | $105 |
| Monthly Housing Costs | $583 | $14 |
| Real Estate Taxes | $2,708 | $16 |
Property Value by Mortgage Status in Montgomery
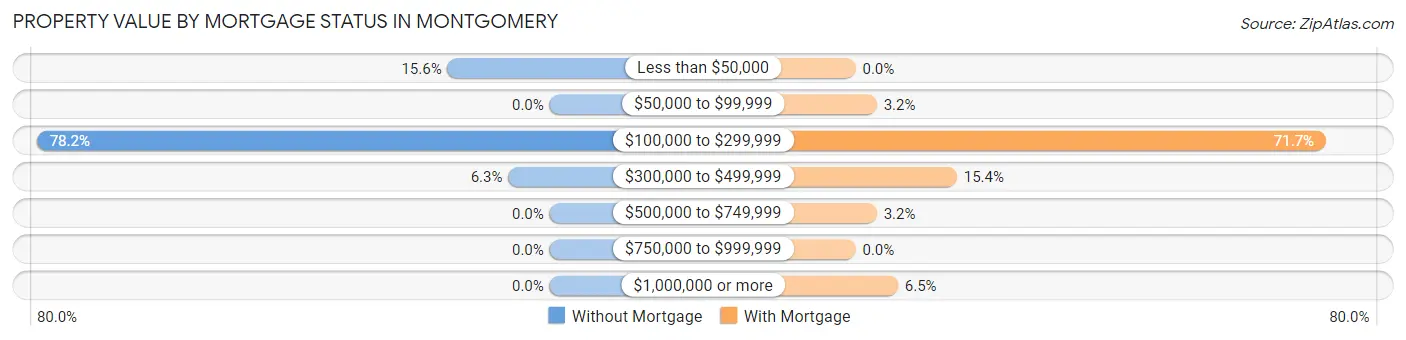
| Property Value | Without Mortgage | With Mortgage |
| Less than $50,000 | 47 (15.6%) | 0 (0.0%) |
| $50,000 to $99,999 | 0 (0.0%) | 23 (3.2%) |
| $100,000 to $299,999 | 236 (78.1%) | 511 (71.7%) |
| $300,000 to $499,999 | 19 (6.3%) | 110 (15.4%) |
| $500,000 to $749,999 | 0 (0.0%) | 23 (3.2%) |
| $750,000 to $999,999 | 0 (0.0%) | 0 (0.0%) |
| $1,000,000 or more | 0 (0.0%) | 46 (6.5%) |
| Total | 302 (100.0%) | 713 (100.0%) |
Household Income by Mortgage Status in Montgomery
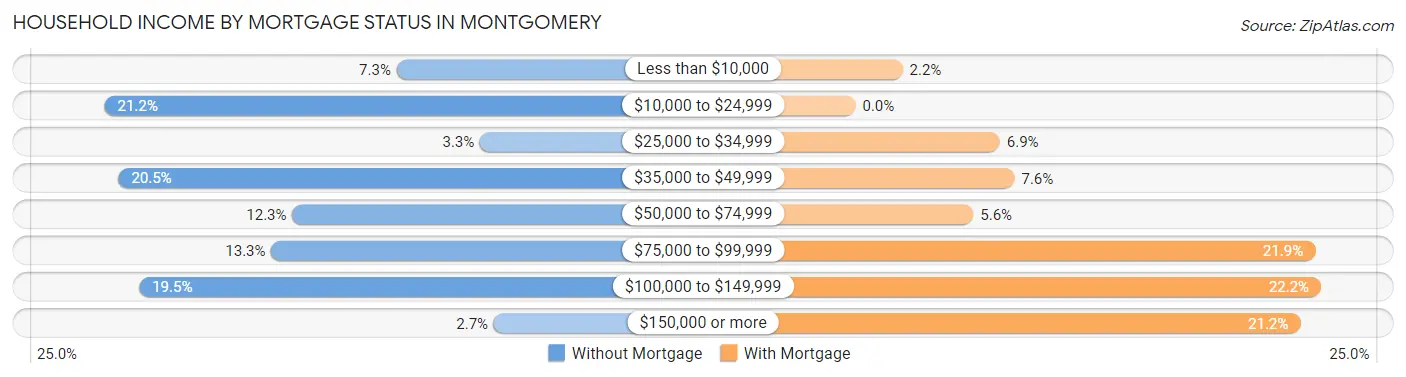
| Household Income | Without Mortgage | With Mortgage |
| Less than $10,000 | 22 (7.3%) | 16 (2.2%) |
| $10,000 to $24,999 | 64 (21.2%) | 0 (0.0%) |
| $25,000 to $34,999 | 10 (3.3%) | 49 (6.9%) |
| $35,000 to $49,999 | 62 (20.5%) | 54 (7.6%) |
| $50,000 to $74,999 | 37 (12.2%) | 40 (5.6%) |
| $75,000 to $99,999 | 40 (13.3%) | 156 (21.9%) |
| $100,000 to $149,999 | 59 (19.5%) | 158 (22.2%) |
| $150,000 or more | 8 (2.6%) | 151 (21.2%) |
| Total | 302 (100.0%) | 713 (100.0%) |
Property Value to Household Income Ratio in Montgomery
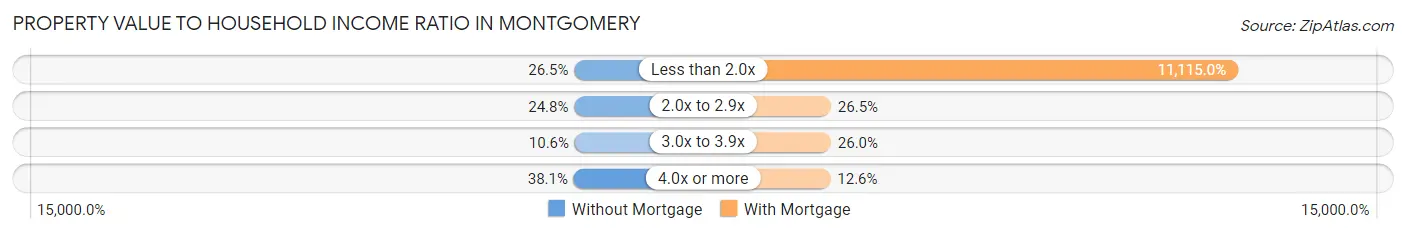
| Value-to-Income Ratio | Without Mortgage | With Mortgage |
| Less than 2.0x | 80 (26.5%) | 79,250 (11,115.0%) |
| 2.0x to 2.9x | 75 (24.8%) | 189 (26.5%) |
| 3.0x to 3.9x | 32 (10.6%) | 185 (26.0%) |
| 4.0x or more | 115 (38.1%) | 90 (12.6%) |
| Total | 302 (100.0%) | 713 (100.0%) |
Real Estate Taxes by Mortgage Status in Montgomery
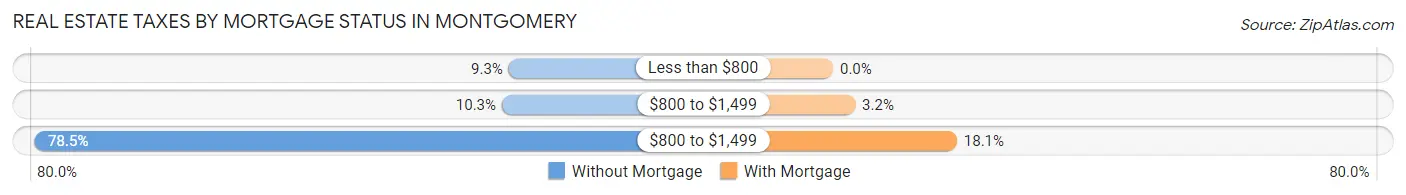
| Property Taxes | Without Mortgage | With Mortgage |
| Less than $800 | 28 (9.3%) | 0 (0.0%) |
| $800 to $1,499 | 31 (10.3%) | 23 (3.2%) |
| $800 to $1,499 | 237 (78.5%) | 129 (18.1%) |
| Total | 302 (100.0%) | 713 (100.0%) |
Health & Disability in Montgomery
Health Insurance Coverage by Age in Montgomery
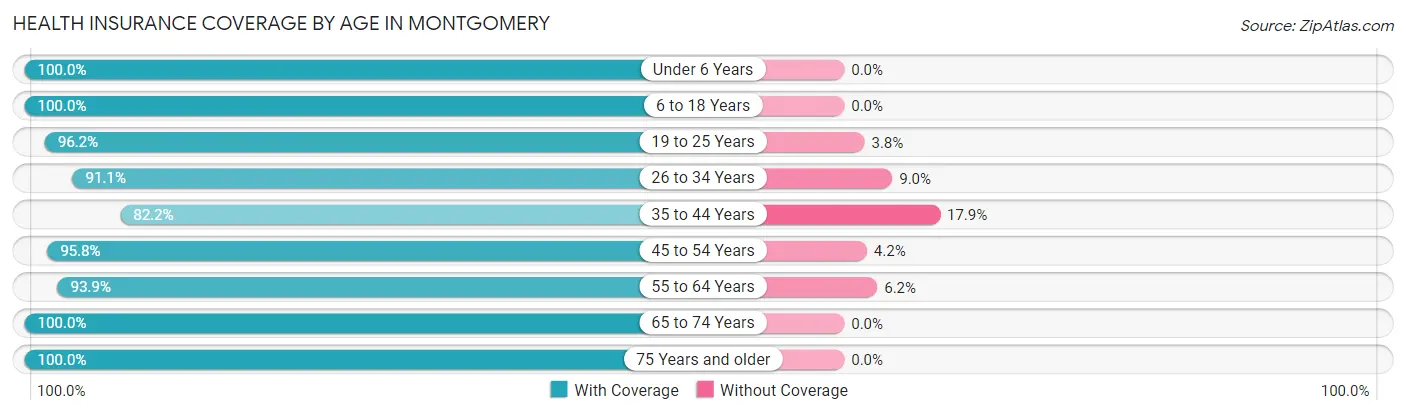
| Age Bracket | With Coverage | Without Coverage |
| Under 6 Years | 198 (100.0%) | 0 (0.0%) |
| 6 to 18 Years | 761 (100.0%) | 0 (0.0%) |
| 19 to 25 Years | 281 (96.2%) | 11 (3.8%) |
| 26 to 34 Years | 295 (91.0%) | 29 (8.9%) |
| 35 to 44 Years | 405 (82.2%) | 88 (17.8%) |
| 45 to 54 Years | 363 (95.8%) | 16 (4.2%) |
| 55 to 64 Years | 229 (93.9%) | 15 (6.1%) |
| 65 to 74 Years | 368 (100.0%) | 0 (0.0%) |
| 75 Years and older | 253 (100.0%) | 0 (0.0%) |
| Total | 3,153 (95.2%) | 159 (4.8%) |
Health Insurance Coverage by Citizenship Status in Montgomery
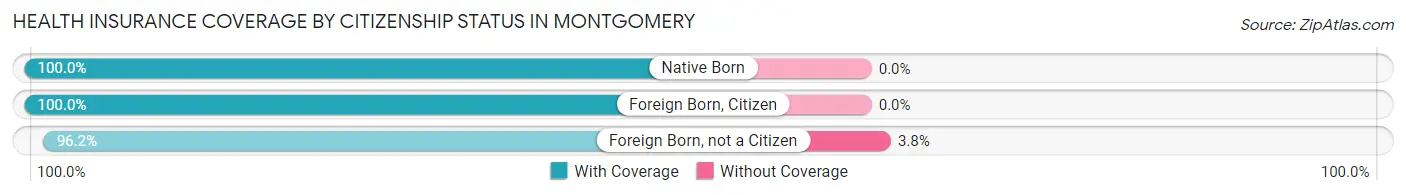
| Citizenship Status | With Coverage | Without Coverage |
| Native Born | 198 (100.0%) | 0 (0.0%) |
| Foreign Born, Citizen | 761 (100.0%) | 0 (0.0%) |
| Foreign Born, not a Citizen | 281 (96.2%) | 11 (3.8%) |
Health Insurance Coverage by Household Income in Montgomery
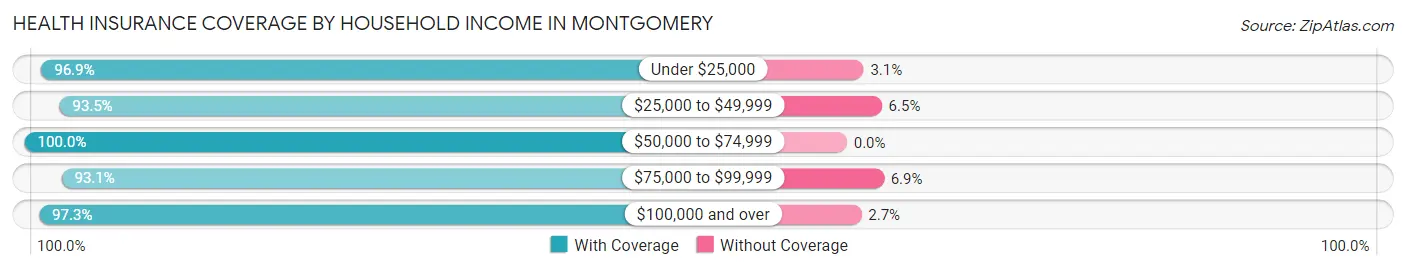
| Household Income | With Coverage | Without Coverage |
| Under $25,000 | 340 (96.9%) | 11 (3.1%) |
| $25,000 to $49,999 | 458 (93.5%) | 32 (6.5%) |
| $50,000 to $74,999 | 591 (100.0%) | 0 (0.0%) |
| $75,000 to $99,999 | 552 (93.1%) | 41 (6.9%) |
| $100,000 and over | 1,039 (97.3%) | 29 (2.7%) |
Public vs Private Health Insurance Coverage by Age in Montgomery
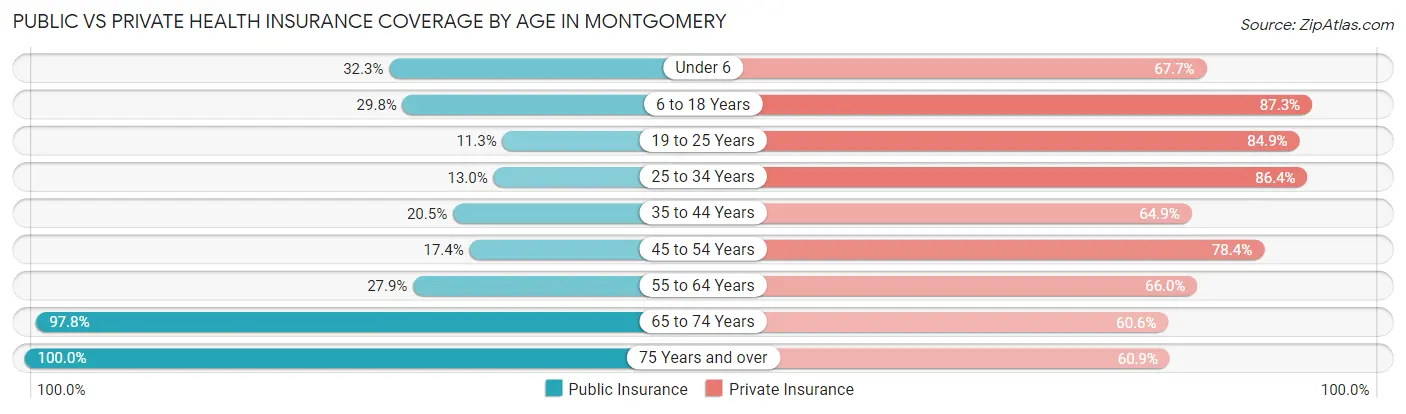
| Age Bracket | Public Insurance | Private Insurance |
| Under 6 | 64 (32.3%) | 134 (67.7%) |
| 6 to 18 Years | 227 (29.8%) | 664 (87.3%) |
| 19 to 25 Years | 33 (11.3%) | 248 (84.9%) |
| 25 to 34 Years | 42 (13.0%) | 280 (86.4%) |
| 35 to 44 Years | 101 (20.5%) | 320 (64.9%) |
| 45 to 54 Years | 66 (17.4%) | 297 (78.4%) |
| 55 to 64 Years | 68 (27.9%) | 161 (66.0%) |
| 65 to 74 Years | 360 (97.8%) | 223 (60.6%) |
| 75 Years and over | 253 (100.0%) | 154 (60.9%) |
| Total | 1,214 (36.6%) | 2,481 (74.9%) |
Disability Status by Sex by Age in Montgomery
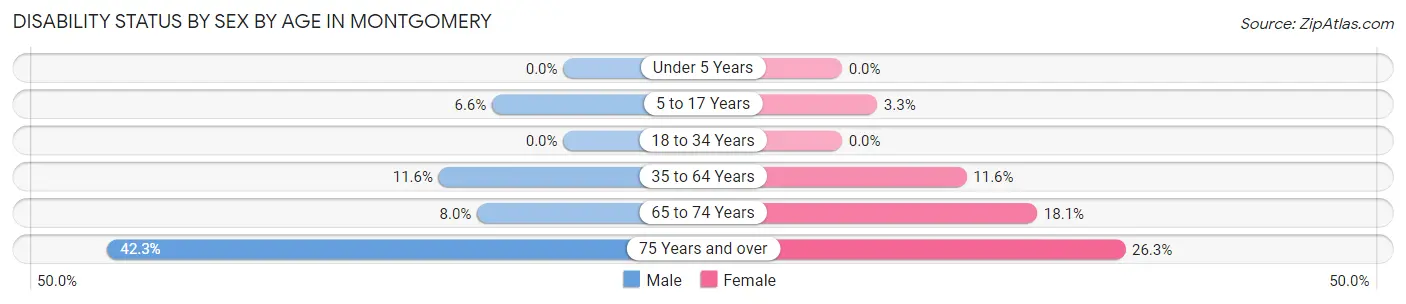
| Age Bracket | Male | Female |
| Under 5 Years | 0 (0.0%) | 0 (0.0%) |
| 5 to 17 Years | 29 (6.6%) | 11 (3.3%) |
| 18 to 34 Years | 0 (0.0%) | 0 (0.0%) |
| 35 to 64 Years | 66 (11.6%) | 63 (11.6%) |
| 65 to 74 Years | 10 (8.0%) | 44 (18.1%) |
| 75 Years and over | 33 (42.3%) | 46 (26.3%) |
Disability Class by Sex by Age in Montgomery
Disability Class: Hearing Difficulty
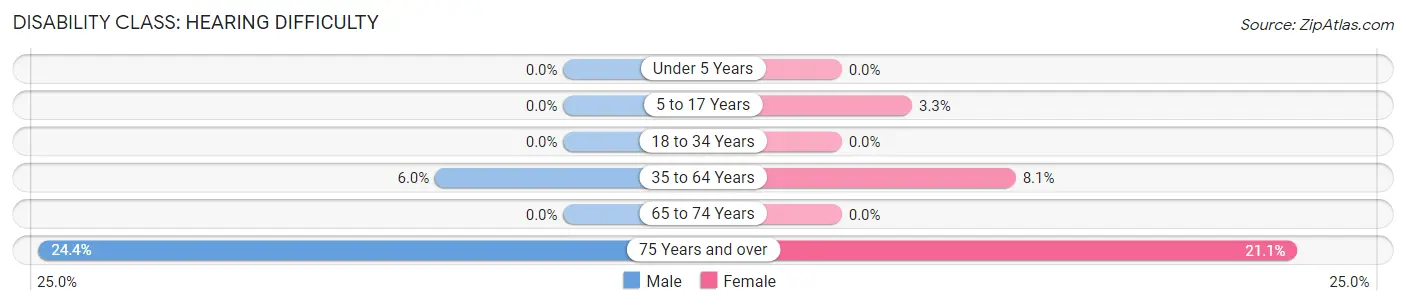
| Age Bracket | Male | Female |
| Under 5 Years | 0 (0.0%) | 0 (0.0%) |
| 5 to 17 Years | 0 (0.0%) | 11 (3.3%) |
| 18 to 34 Years | 0 (0.0%) | 0 (0.0%) |
| 35 to 64 Years | 34 (5.9%) | 44 (8.1%) |
| 65 to 74 Years | 0 (0.0%) | 0 (0.0%) |
| 75 Years and over | 19 (24.4%) | 37 (21.1%) |
Disability Class: Vision Difficulty
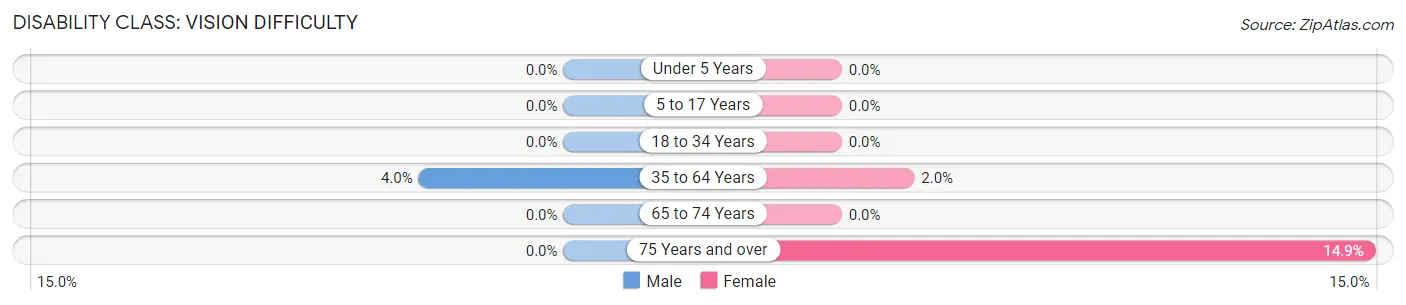
| Age Bracket | Male | Female |
| Under 5 Years | 0 (0.0%) | 0 (0.0%) |
| 5 to 17 Years | 0 (0.0%) | 0 (0.0%) |
| 18 to 34 Years | 0 (0.0%) | 0 (0.0%) |
| 35 to 64 Years | 23 (4.0%) | 11 (2.0%) |
| 65 to 74 Years | 0 (0.0%) | 0 (0.0%) |
| 75 Years and over | 0 (0.0%) | 26 (14.9%) |
Disability Class: Cognitive Difficulty
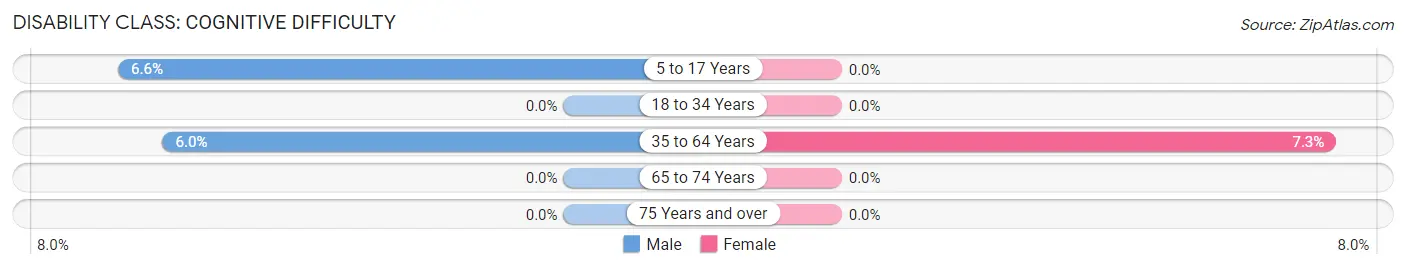
| Age Bracket | Male | Female |
| 5 to 17 Years | 29 (6.6%) | 0 (0.0%) |
| 18 to 34 Years | 0 (0.0%) | 0 (0.0%) |
| 35 to 64 Years | 34 (5.9%) | 40 (7.3%) |
| 65 to 74 Years | 0 (0.0%) | 0 (0.0%) |
| 75 Years and over | 0 (0.0%) | 0 (0.0%) |
Disability Class: Ambulatory Difficulty
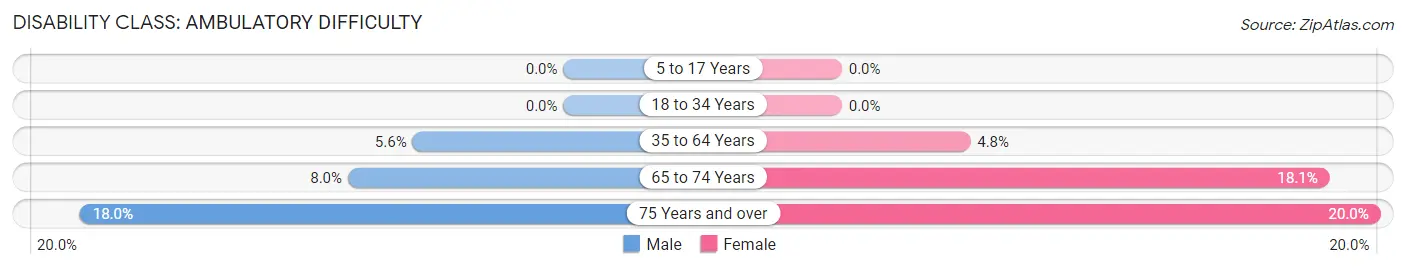
| Age Bracket | Male | Female |
| 5 to 17 Years | 0 (0.0%) | 0 (0.0%) |
| 18 to 34 Years | 0 (0.0%) | 0 (0.0%) |
| 35 to 64 Years | 32 (5.6%) | 26 (4.8%) |
| 65 to 74 Years | 10 (8.0%) | 44 (18.1%) |
| 75 Years and over | 14 (17.9%) | 35 (20.0%) |
Disability Class: Self-Care Difficulty
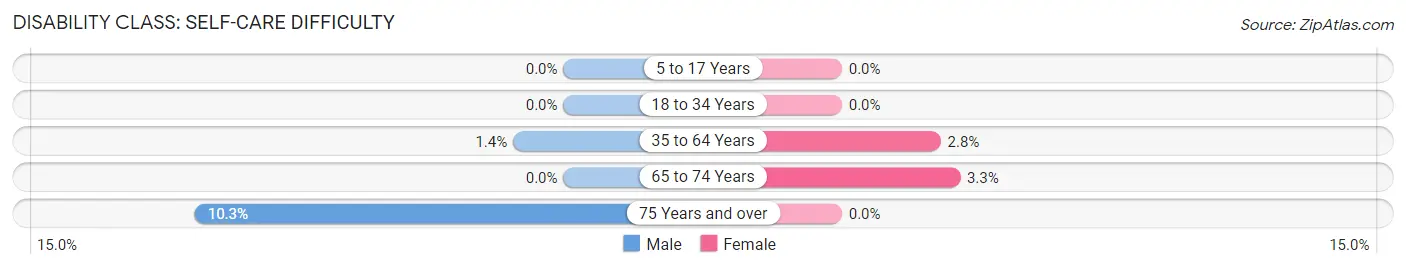
| Age Bracket | Male | Female |
| 5 to 17 Years | 0 (0.0%) | 0 (0.0%) |
| 18 to 34 Years | 0 (0.0%) | 0 (0.0%) |
| 35 to 64 Years | 8 (1.4%) | 15 (2.8%) |
| 65 to 74 Years | 0 (0.0%) | 8 (3.3%) |
| 75 Years and over | 8 (10.3%) | 0 (0.0%) |
Technology Access in Montgomery
Computing Device Access in Montgomery
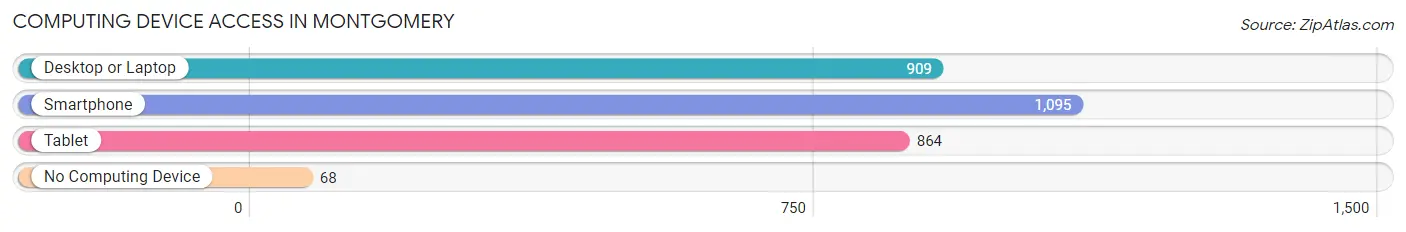
| Device Type | # Households | % Households |
| Desktop or Laptop | 909 | 69.9% |
| Smartphone | 1,095 | 84.2% |
| Tablet | 864 | 66.4% |
| No Computing Device | 68 | 5.2% |
| Total | 1,301 | 100.0% |
Internet Access in Montgomery
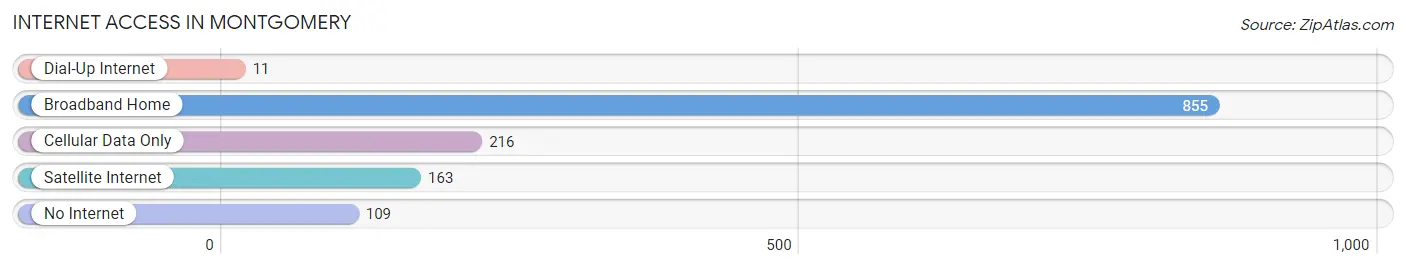
| Internet Type | # Households | % Households |
| Dial-Up Internet | 11 | 0.9% |
| Broadband Home | 855 | 65.7% |
| Cellular Data Only | 216 | 16.6% |
| Satellite Internet | 163 | 12.5% |
| No Internet | 109 | 8.4% |
| Total | 1,301 | 100.0% |
Montgomery Summary
Montgomery, Minnesota is a small city located in Le Sueur County, Minnesota. It is situated on the banks of the Minnesota River, approximately 40 miles southwest of Minneapolis. The city has a population of approximately 4,000 people and is part of the Twin Cities metropolitan area.
History
Montgomery was founded in 1856 by a group of settlers from the East Coast. The city was named after Montgomery County, Pennsylvania, where many of the settlers had previously lived. The city was incorporated in 1872 and quickly became a thriving agricultural center. The city was home to a number of mills, including a flour mill, a sawmill, and a woolen mill.
In the late 19th century, Montgomery was a major stop on the Minneapolis and St. Louis Railway. The railway brought new economic opportunities to the city, and it quickly became a hub for trade and commerce. The city also became a popular destination for tourists, who came to enjoy the city’s natural beauty and recreational activities.
Geography
Montgomery is located in the Minnesota River Valley, which is part of the Central Lowland region of the United States. The city is situated on the banks of the Minnesota River, which is a major tributary of the Mississippi River. The city is surrounded by rolling hills and wooded areas, and it is located approximately 40 miles southwest of Minneapolis.
The climate in Montgomery is typical of the Upper Midwest, with cold winters and hot summers. The average annual temperature is around 40 degrees Fahrenheit, and the average annual precipitation is around 30 inches.
Economy
Montgomery’s economy is largely based on agriculture and manufacturing. The city is home to a number of agricultural businesses, including dairy farms, grain elevators, and feed mills. The city is also home to a number of manufacturing businesses, including a paper mill, a printing company, and a plastics factory.
The city is also home to a number of retail businesses, including grocery stores, clothing stores, and restaurants. The city is also home to a number of professional services, including medical offices, law firms, and accounting firms.
Demographics
As of the 2010 census, the population of Montgomery was 4,000. The racial makeup of the city was 97.2% White, 0.7% African American, 0.3% Native American, 0.3% Asian, 0.1% Pacific Islander, and 1.4% from other races. The median household income was $50,000, and the median family income was $60,000.
The city is home to a number of churches, including Catholic, Lutheran, and Methodist churches. The city is also home to a number of schools, including a public elementary school, a public middle school, and a public high school. The city is also home to a number of parks, including a city park, a county park, and a state park.
Conclusion
Montgomery, Minnesota is a small city located in Le Sueur County, Minnesota. It is situated on the banks of the Minnesota River, approximately 40 miles southwest of Minneapolis. The city has a population of approximately 4,000 people and is part of the Twin Cities metropolitan area. The city’s economy is largely based on agriculture and manufacturing, and it is home to a number of retail businesses, professional services, churches, and schools. The city is also home to a number of parks, and it is a popular destination for tourists who come to enjoy the city’s natural beauty and recreational activities.
Common Questions
What is Per Capita Income in Montgomery?
Per Capita income in Montgomery is $31,757.
What is the Median Family Income in Montgomery?
Median Family Income in Montgomery is $78,826.
What is the Median Household income in Montgomery?
Median Household Income in Montgomery is $61,677.
What is Income or Wage Gap in Montgomery?
Income or Wage Gap in Montgomery is 21.7%.
Women in Montgomery earn 78.3 cents for every dollar earned by a man.
What is Inequality or Gini Index in Montgomery?
Inequality or Gini Index in Montgomery is 0.40.
What is the Total Population of Montgomery?
Total Population of Montgomery is 3,326.
What is the Total Male Population of Montgomery?
Total Male Population of Montgomery is 1,625.
What is the Total Female Population of Montgomery?
Total Female Population of Montgomery is 1,701.
What is the Ratio of Males per 100 Females in Montgomery?
There are 95.53 Males per 100 Females in Montgomery.
What is the Ratio of Females per 100 Males in Montgomery?
There are 104.68 Females per 100 Males in Montgomery.
What is the Median Population Age in Montgomery?
Median Population Age in Montgomery is 37.9 Years.
What is the Average Family Size in Montgomery
Average Family Size in Montgomery is 3.0 People.
What is the Average Household Size in Montgomery
Average Household Size in Montgomery is 2.4 People.
How Large is the Labor Force in Montgomery?
There are 1,756 People in the Labor Forcein in Montgomery.
What is the Percentage of People in the Labor Force in Montgomery?
70.4% of People are in the Labor Force in Montgomery.
What is the Unemployment Rate in Montgomery?
Unemployment Rate in Montgomery is 2.8%.