Motley, MN Map & Demographics
Motley Map
Motley Overview
$26,664
PER CAPITA INCOME
$61,471
AVG FAMILY INCOME
$46,563
AVG HOUSEHOLD INCOME
25.0%
WAGE / INCOME GAP [ % ]
75.0¢/ $1
WAGE / INCOME GAP [ $ ]
0.35
INEQUALITY / GINI INDEX
647
TOTAL POPULATION
317
MALE POPULATION
330
FEMALE POPULATION
96.06
MALES / 100 FEMALES
104.10
FEMALES / 100 MALES
50.5
MEDIAN AGE
2.8
AVG FAMILY SIZE
2.0
AVG HOUSEHOLD SIZE
314
LABOR FORCE [ PEOPLE ]
56.9%
PERCENT IN LABOR FORCE
4.8%
UNEMPLOYMENT RATE
Motley Zip Codes
Motley Area Codes
Income in Motley
Income Overview in Motley
Per Capita Income in Motley is $26,664, while median incomes of families and households are $61,471 and $46,563 respectively.
| Characteristic | Number | Measure |
| Per Capita Income | 647 | $26,664 |
| Median Family Income | 144 | $61,471 |
| Mean Family Income | 144 | $66,426 |
| Median Household Income | 316 | $46,563 |
| Mean Household Income | 316 | $52,708 |
| Income Deficit | 144 | $0 |
| Wage / Income Gap (%) | 647 | 24.97% |
| Wage / Income Gap ($) | 647 | 75.03¢ per $1 |
| Gini / Inequality Index | 647 | 0.35 |
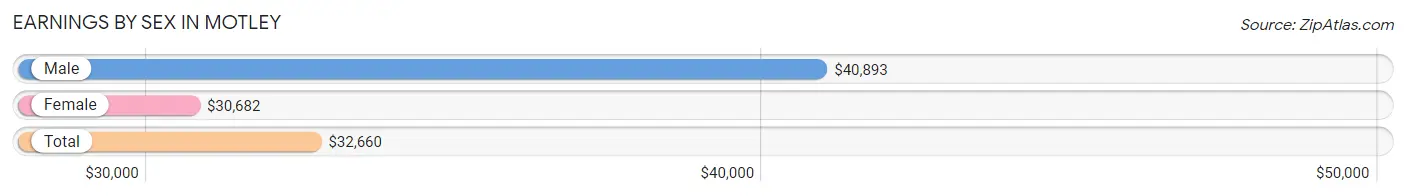
Earnings by Sex in Motley
Average Earnings in Motley are $32,660, $40,893 for men and $30,682 for women, a difference of 25.0%.
| Sex | Number | Average Earnings |
| Male | 129 (40.4%) | $40,893 |
| Female | 190 (59.6%) | $30,682 |
| Total | 319 (100.0%) | $32,660 |
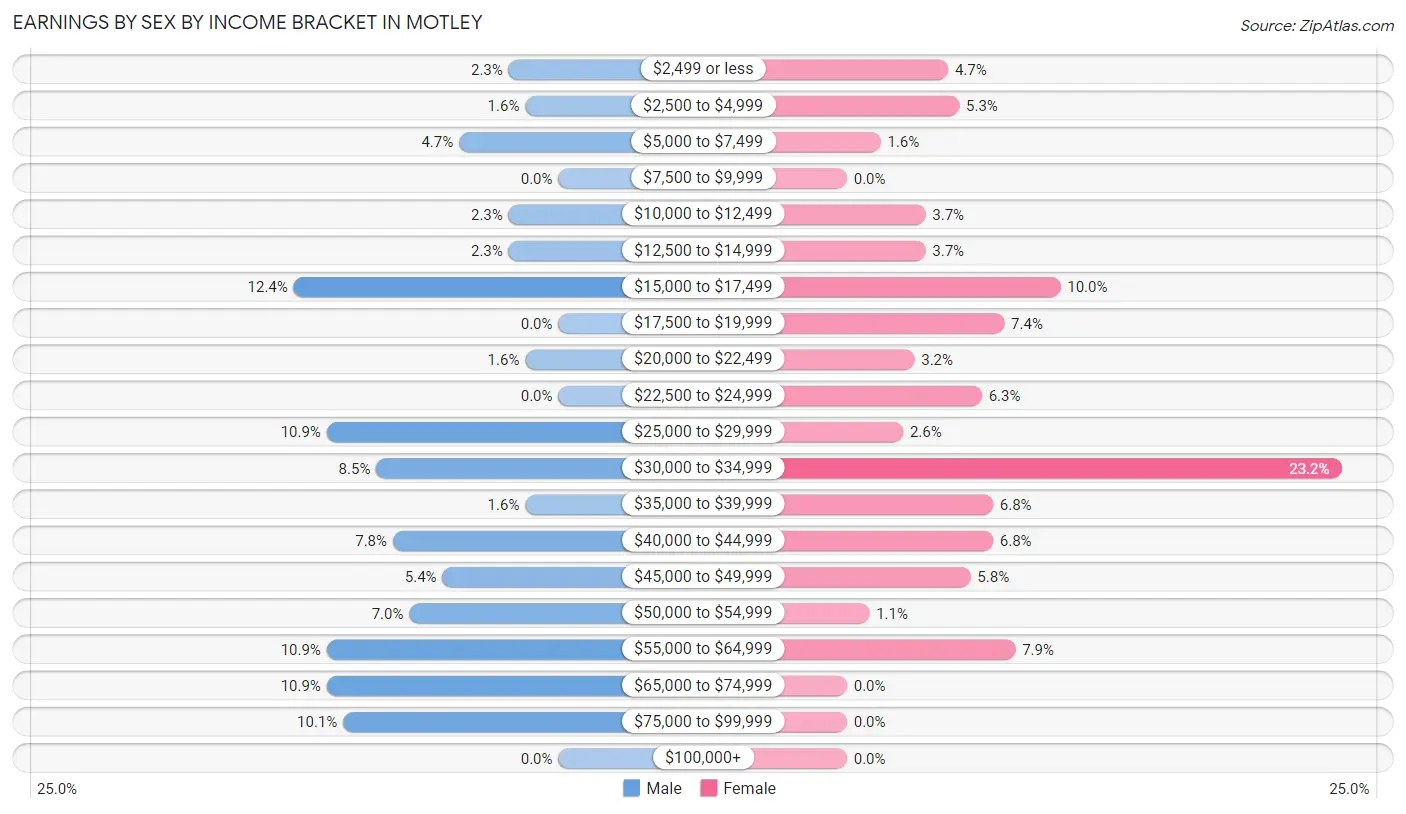
Earnings by Sex by Income Bracket in Motley
The most common earnings brackets in Motley are $15,000 to $17,499 for men (16 | 12.4%) and $30,000 to $34,999 for women (44 | 23.2%).
| Income | Male | Female |
| $2,499 or less | 3 (2.3%) | 9 (4.7%) |
| $2,500 to $4,999 | 2 (1.5%) | 10 (5.3%) |
| $5,000 to $7,499 | 6 (4.6%) | 3 (1.6%) |
| $7,500 to $9,999 | 0 (0.0%) | 0 (0.0%) |
| $10,000 to $12,499 | 3 (2.3%) | 7 (3.7%) |
| $12,500 to $14,999 | 3 (2.3%) | 7 (3.7%) |
| $15,000 to $17,499 | 16 (12.4%) | 19 (10.0%) |
| $17,500 to $19,999 | 0 (0.0%) | 14 (7.4%) |
| $20,000 to $22,499 | 2 (1.5%) | 6 (3.2%) |
| $22,500 to $24,999 | 0 (0.0%) | 12 (6.3%) |
| $25,000 to $29,999 | 14 (10.8%) | 5 (2.6%) |
| $30,000 to $34,999 | 11 (8.5%) | 44 (23.2%) |
| $35,000 to $39,999 | 2 (1.5%) | 13 (6.8%) |
| $40,000 to $44,999 | 10 (7.7%) | 13 (6.8%) |
| $45,000 to $49,999 | 7 (5.4%) | 11 (5.8%) |
| $50,000 to $54,999 | 9 (7.0%) | 2 (1.1%) |
| $55,000 to $64,999 | 14 (10.8%) | 15 (7.9%) |
| $65,000 to $74,999 | 14 (10.8%) | 0 (0.0%) |
| $75,000 to $99,999 | 13 (10.1%) | 0 (0.0%) |
| $100,000+ | 0 (0.0%) | 0 (0.0%) |
| Total | 129 (100.0%) | 190 (100.0%) |
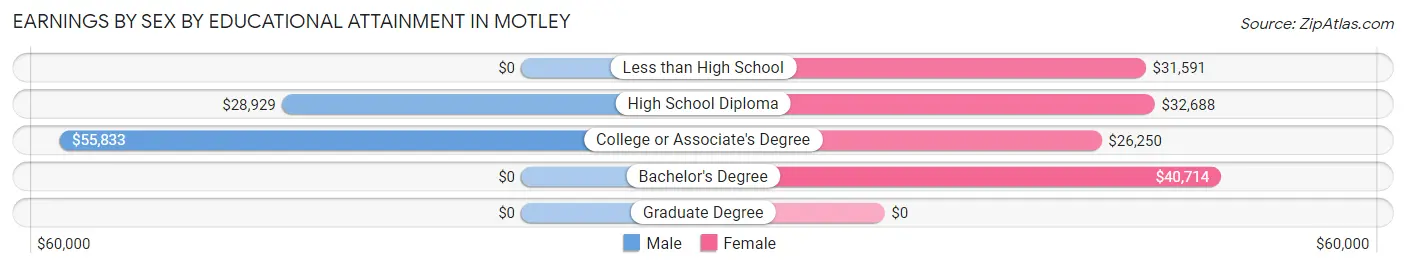
Earnings by Sex by Educational Attainment in Motley
Average earnings in Motley are $46,563 for men and $31,477 for women, a difference of 32.4%. Men with an educational attainment of college or associate's degree enjoy the highest average annual earnings of $55,833, while those with high school diploma education earn the least with $28,929. Women with an educational attainment of bachelor's degree earn the most with the average annual earnings of $40,714, while those with college or associate's degree education have the smallest earnings of $26,250.
| Educational Attainment | Male Income | Female Income |
| Less than High School | - | - |
| High School Diploma | $28,929 | $32,688 |
| College or Associate's Degree | $55,833 | $26,250 |
| Bachelor's Degree | - | - |
| Graduate Degree | - | - |
| Total | $46,563 | $31,477 |
Family Income in Motley
Family Income Brackets in Motley
According to the Motley family income data, there are 46 families falling into the $50,000 to $74,999 income range, which is the most common income bracket and makes up 31.9% of all families.
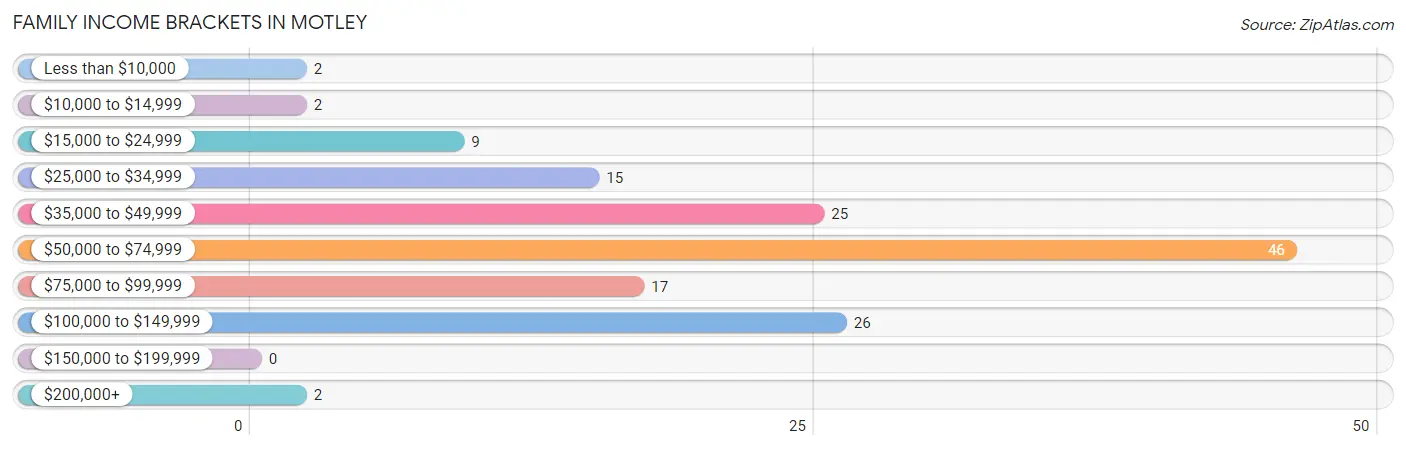
| Income Bracket | # Families | % Families |
| Less than $10,000 | 2 | 1.4% |
| $10,000 to $14,999 | 2 | 1.4% |
| $15,000 to $24,999 | 9 | 6.3% |
| $25,000 to $34,999 | 15 | 10.4% |
| $35,000 to $49,999 | 25 | 17.4% |
| $50,000 to $74,999 | 46 | 31.9% |
| $75,000 to $99,999 | 17 | 11.8% |
| $100,000 to $149,999 | 26 | 18.1% |
| $150,000 to $199,999 | 0 | 0.0% |
| $200,000+ | 2 | 1.4% |
Family Income by Famaliy Size in Motley
4-person families (21 | 14.6%) account for the highest median family income in Motley with $88,125 per family, while 2-person families (93 | 64.6%) have the highest median income of $30,184 per family member.
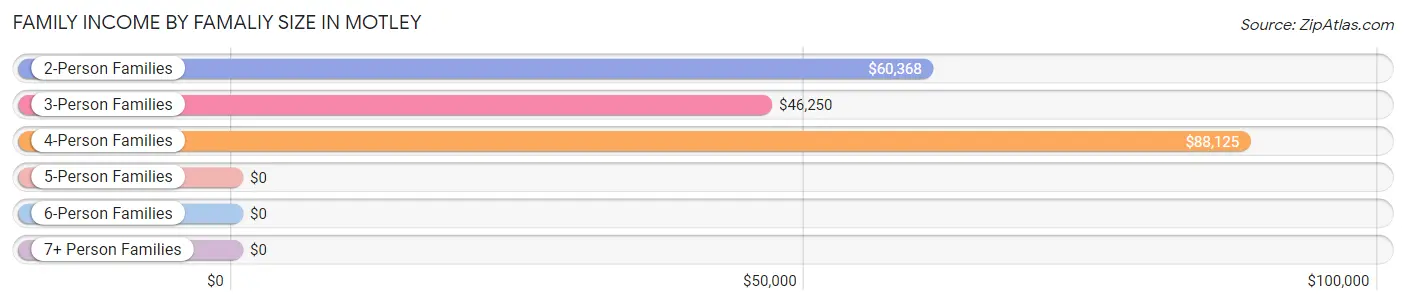
| Income Bracket | # Families | Median Income |
| 2-Person Families | 93 (64.6%) | $60,368 |
| 3-Person Families | 20 (13.9%) | $46,250 |
| 4-Person Families | 21 (14.6%) | $88,125 |
| 5-Person Families | 7 (4.9%) | $0 |
| 6-Person Families | 3 (2.1%) | $0 |
| 7+ Person Families | 0 (0.0%) | $0 |
| Total | 144 (100.0%) | $61,471 |
Family Income by Number of Earners in Motley
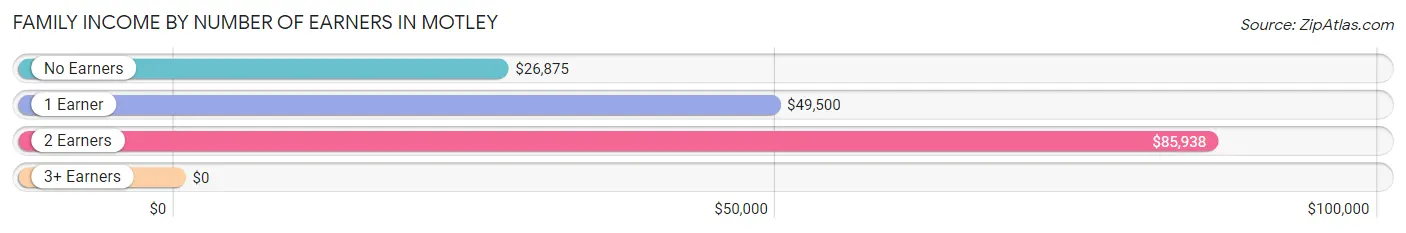
| Number of Earners | # Families | Median Income |
| No Earners | 15 (10.4%) | $26,875 |
| 1 Earner | 70 (48.6%) | $49,500 |
| 2 Earners | 59 (41.0%) | $85,938 |
| 3+ Earners | 0 (0.0%) | $0 |
| Total | 144 (100.0%) | $61,471 |
Household Income in Motley
Household Income Brackets in Motley
With 74 households falling in the category, the $50,000 to $74,999 income range is the most frequent in Motley, accounting for 23.4% of all households.
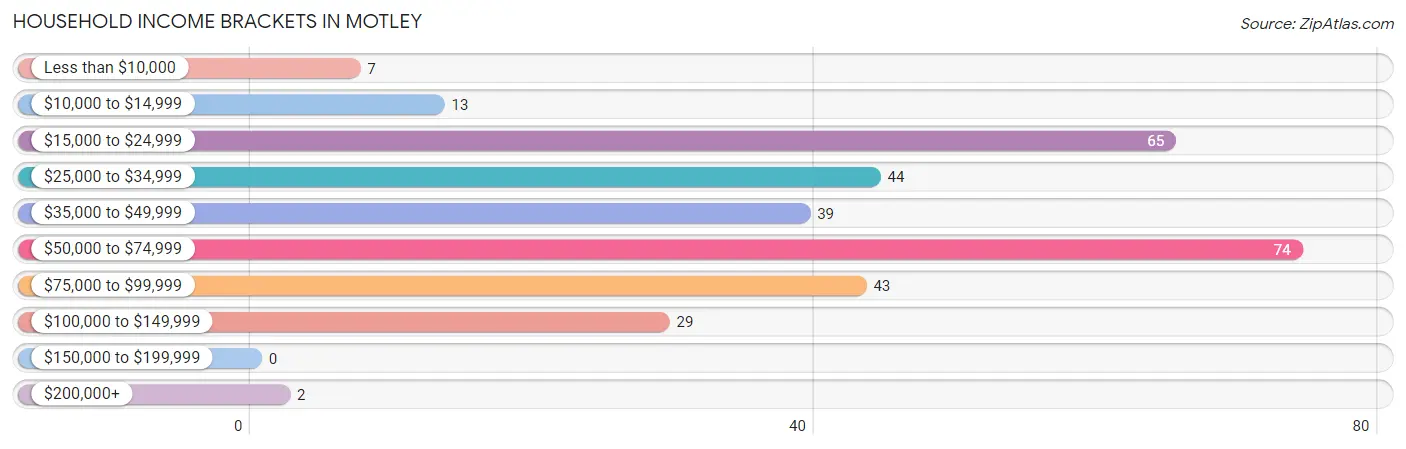
| Income Bracket | # Households | % Households |
| Less than $10,000 | 7 | 2.2% |
| $10,000 to $14,999 | 13 | 4.1% |
| $15,000 to $24,999 | 65 | 20.6% |
| $25,000 to $34,999 | 44 | 13.9% |
| $35,000 to $49,999 | 39 | 12.3% |
| $50,000 to $74,999 | 74 | 23.4% |
| $75,000 to $99,999 | 43 | 13.6% |
| $100,000 to $149,999 | 29 | 9.2% |
| $150,000 to $199,999 | 0 | 0.0% |
| $200,000+ | 2 | 0.6% |
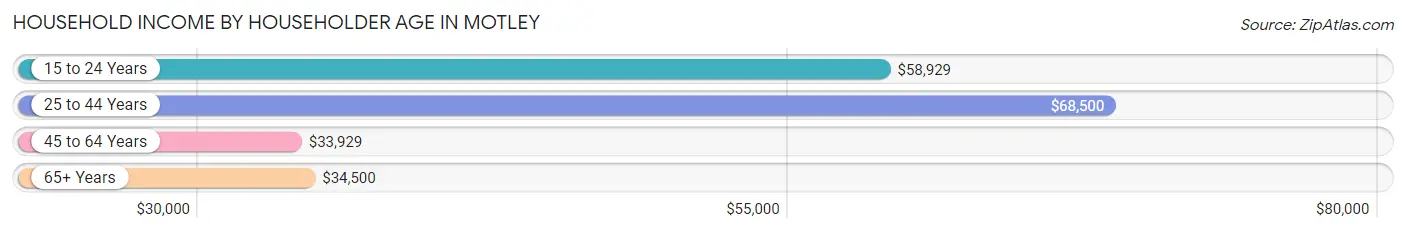
Household Income by Householder Age in Motley
The median household income in Motley is $46,563, with the highest median household income of $68,500 found in the 25 to 44 years age bracket for the primary householder. A total of 54 households (17.1%) fall into this category. Meanwhile, the 45 to 64 years age bracket for the primary householder has the lowest median household income of $33,929, with 102 households (32.3%) in this group.
| Income Bracket | # Households | Median Income |
| 15 to 24 Years | 20 (6.3%) | $58,929 |
| 25 to 44 Years | 54 (17.1%) | $68,500 |
| 45 to 64 Years | 102 (32.3%) | $33,929 |
| 65+ Years | 140 (44.3%) | $34,500 |
| Total | 316 (100.0%) | $46,563 |
Poverty in Motley
Income Below Poverty by Sex and Age in Motley
With 8.0% poverty level for males and 12.6% for females among the residents of Motley, under 5 year old males and 75 year old and over females are the most vulnerable to poverty, with 4 males (26.7%) and 24 females (40.7%) in their respective age groups living below the poverty level.
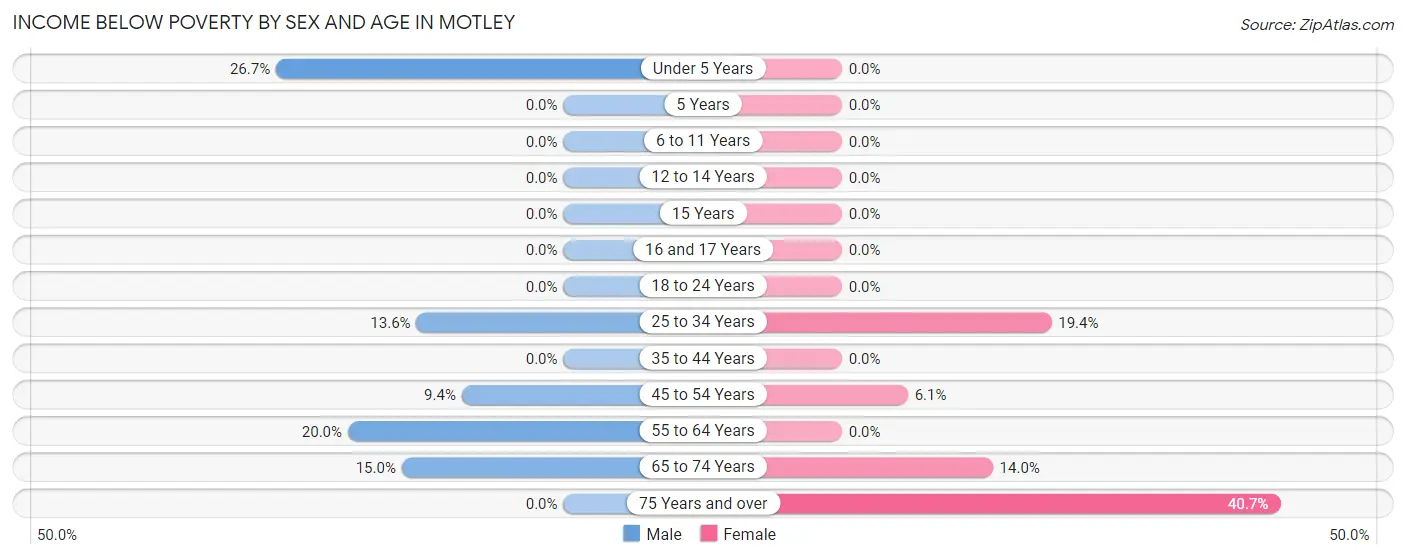
| Age Bracket | Male | Female |
| Under 5 Years | 4 (26.7%) | 0 (0.0%) |
| 5 Years | 0 (0.0%) | 0 (0.0%) |
| 6 to 11 Years | 0 (0.0%) | 0 (0.0%) |
| 12 to 14 Years | 0 (0.0%) | 0 (0.0%) |
| 15 Years | 0 (0.0%) | 0 (0.0%) |
| 16 and 17 Years | 0 (0.0%) | 0 (0.0%) |
| 18 to 24 Years | 0 (0.0%) | 0 (0.0%) |
| 25 to 34 Years | 3 (13.6%) | 7 (19.4%) |
| 35 to 44 Years | 0 (0.0%) | 0 (0.0%) |
| 45 to 54 Years | 5 (9.4%) | 3 (6.1%) |
| 55 to 64 Years | 4 (20.0%) | 0 (0.0%) |
| 65 to 74 Years | 9 (15.0%) | 7 (14.0%) |
| 75 Years and over | 0 (0.0%) | 24 (40.7%) |
| Total | 25 (8.0%) | 41 (12.6%) |
Income Above Poverty by Sex and Age in Motley
According to the poverty statistics in Motley, males aged 6 to 11 years and females aged under 5 years are the age groups that are most secure financially, with 100.0% of males and 100.0% of females in these age groups living above the poverty line.
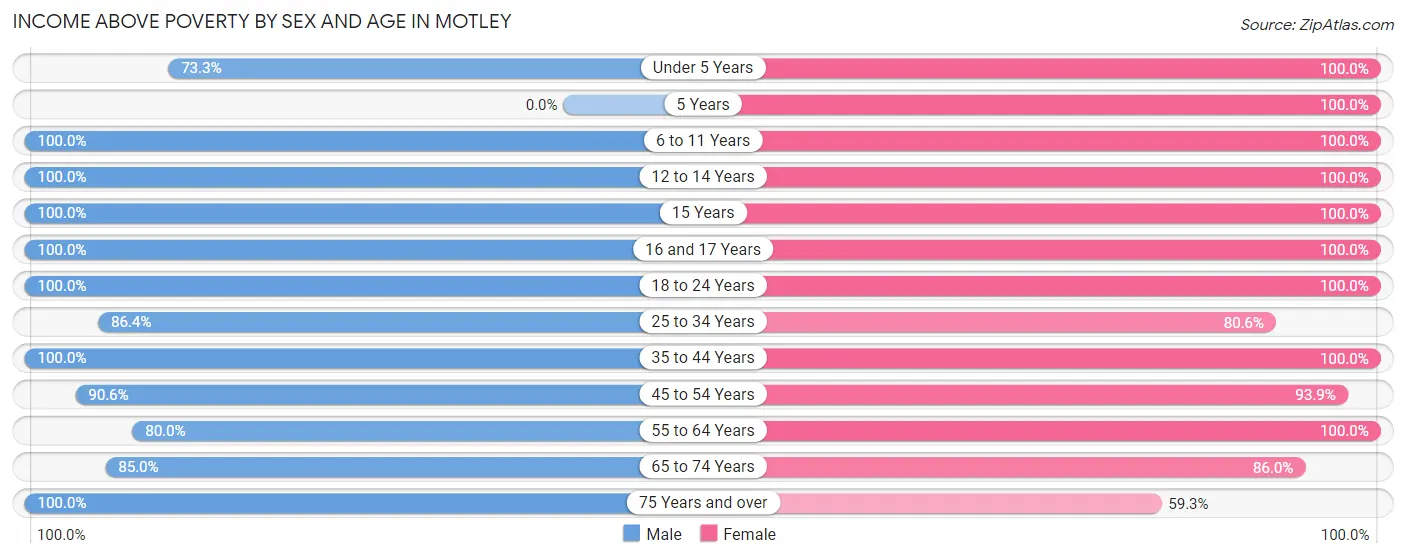
| Age Bracket | Male | Female |
| Under 5 Years | 11 (73.3%) | 9 (100.0%) |
| 5 Years | 0 (0.0%) | 7 (100.0%) |
| 6 to 11 Years | 21 (100.0%) | 17 (100.0%) |
| 12 to 14 Years | 15 (100.0%) | 1 (100.0%) |
| 15 Years | 6 (100.0%) | 1 (100.0%) |
| 16 and 17 Years | 18 (100.0%) | 7 (100.0%) |
| 18 to 24 Years | 31 (100.0%) | 15 (100.0%) |
| 25 to 34 Years | 19 (86.4%) | 29 (80.6%) |
| 35 to 44 Years | 20 (100.0%) | 25 (100.0%) |
| 45 to 54 Years | 48 (90.6%) | 46 (93.9%) |
| 55 to 64 Years | 16 (80.0%) | 50 (100.0%) |
| 65 to 74 Years | 51 (85.0%) | 43 (86.0%) |
| 75 Years and over | 33 (100.0%) | 35 (59.3%) |
| Total | 289 (92.0%) | 285 (87.4%) |
Income Below Poverty Among Married-Couple Families in Motley
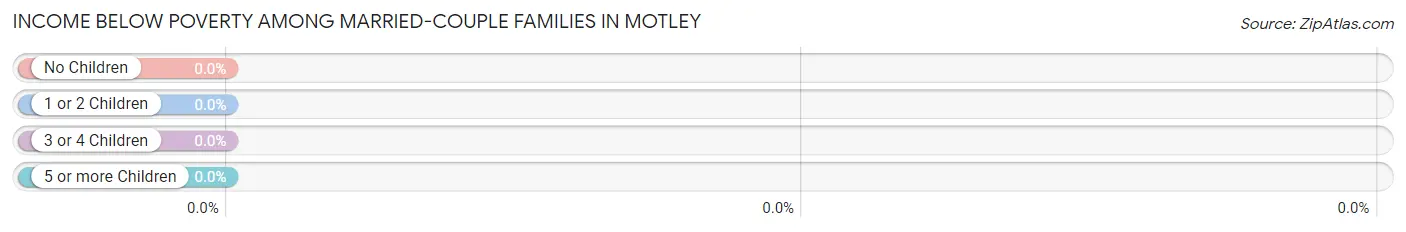
| Children | Above Poverty | Below Poverty |
| No Children | 75 (100.0%) | 0 (0.0%) |
| 1 or 2 Children | 32 (100.0%) | 0 (0.0%) |
| 3 or 4 Children | 4 (100.0%) | 0 (0.0%) |
| 5 or more Children | 0 (0.0%) | 0 (0.0%) |
| Total | 111 (100.0%) | 0 (0.0%) |
Income Below Poverty Among Single-Parent Households in Motley
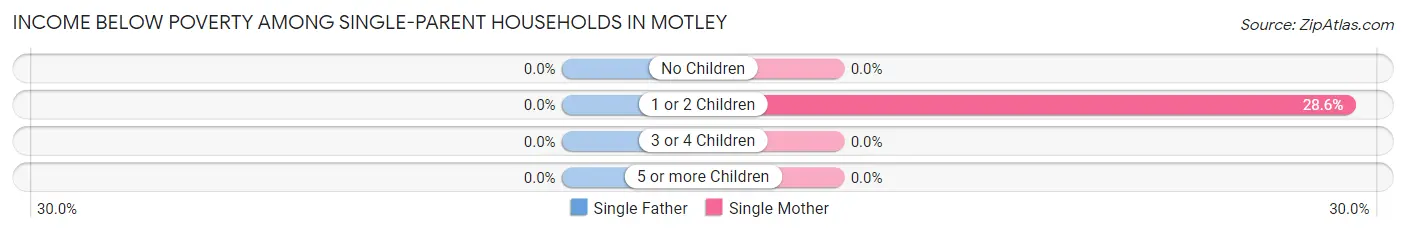
| Children | Single Father | Single Mother |
| No Children | 0 (0.0%) | 0 (0.0%) |
| 1 or 2 Children | 0 (0.0%) | 4 (28.6%) |
| 3 or 4 Children | 0 (0.0%) | 0 (0.0%) |
| 5 or more Children | 0 (0.0%) | 0 (0.0%) |
| Total | 0 (0.0%) | 4 (23.5%) |
Income Below Poverty Among Married-Couple vs Single-Parent Households in Motley
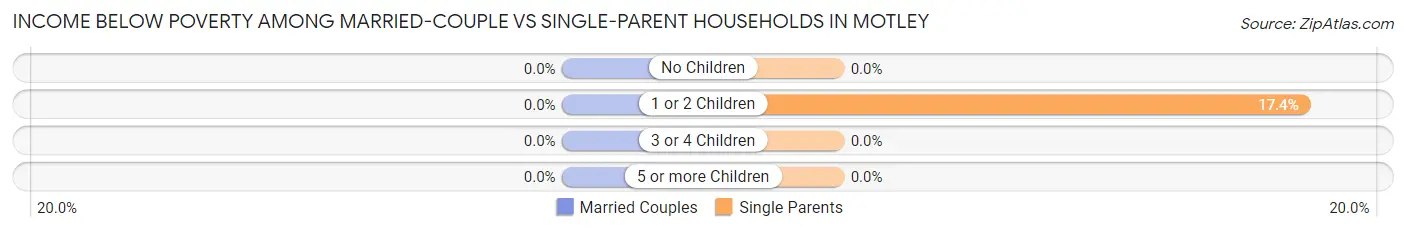
| Children | Married-Couple Families | Single-Parent Households |
| No Children | 0 (0.0%) | 0 (0.0%) |
| 1 or 2 Children | 0 (0.0%) | 4 (17.4%) |
| 3 or 4 Children | 0 (0.0%) | 0 (0.0%) |
| 5 or more Children | 0 (0.0%) | 0 (0.0%) |
| Total | 0 (0.0%) | 4 (12.1%) |
Race in Motley
The most populous races in Motley are White / Caucasian (603 | 93.2%), Hispanic or Latino (32 | 5.0%), and Two or more Races (32 | 5.0%).
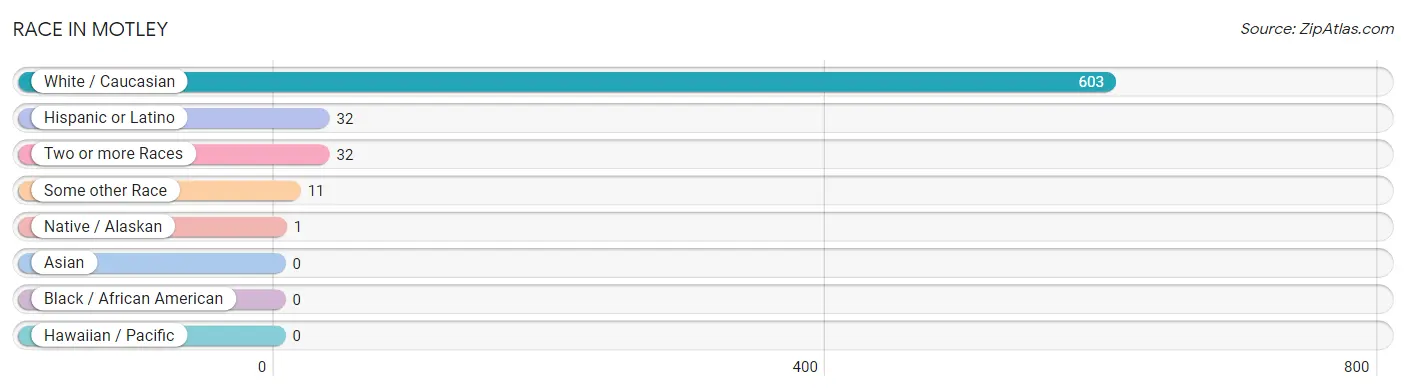
| Race | # Population | % Population |
| Asian | 0 | 0.0% |
| Black / African American | 0 | 0.0% |
| Hawaiian / Pacific | 0 | 0.0% |
| Hispanic or Latino | 32 | 5.0% |
| Native / Alaskan | 1 | 0.2% |
| White / Caucasian | 603 | 93.2% |
| Two or more Races | 32 | 5.0% |
| Some other Race | 11 | 1.7% |
| Total | 647 | 100.0% |
Ancestry in Motley
The most populous ancestries reported in Motley are German (196 | 30.3%), Norwegian (74 | 11.4%), Irish (60 | 9.3%), English (58 | 9.0%), and Swedish (51 | 7.9%), together accounting for 67.8% of all Motley residents.
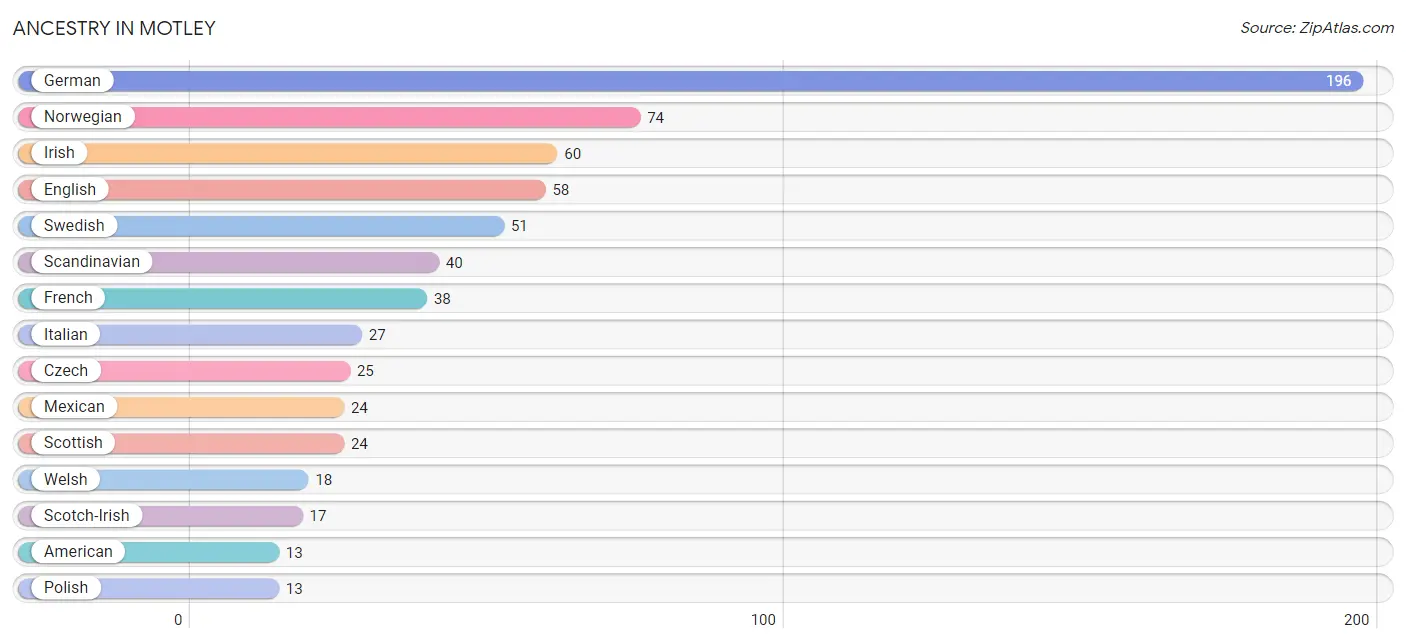
| Ancestry | # Population | % Population |
| American | 13 | 2.0% |
| British | 3 | 0.5% |
| Chilean | 8 | 1.2% |
| Chippewa | 5 | 0.8% |
| Czech | 25 | 3.9% |
| Danish | 7 | 1.1% |
| Dutch | 10 | 1.5% |
| Eastern European | 2 | 0.3% |
| English | 58 | 9.0% |
| Finnish | 5 | 0.8% |
| French | 38 | 5.9% |
| French Canadian | 4 | 0.6% |
| German | 196 | 30.3% |
| Irish | 60 | 9.3% |
| Italian | 27 | 4.2% |
| Mexican | 24 | 3.7% |
| Norwegian | 74 | 11.4% |
| Polish | 13 | 2.0% |
| Scandinavian | 40 | 6.2% |
| Scotch-Irish | 17 | 2.6% |
| Scottish | 24 | 3.7% |
| Sioux | 1 | 0.2% |
| Slovene | 2 | 0.3% |
| South American | 8 | 1.2% |
| Swedish | 51 | 7.9% |
| Welsh | 18 | 2.8% | View All 26 Rows |
Immigrants in Motley
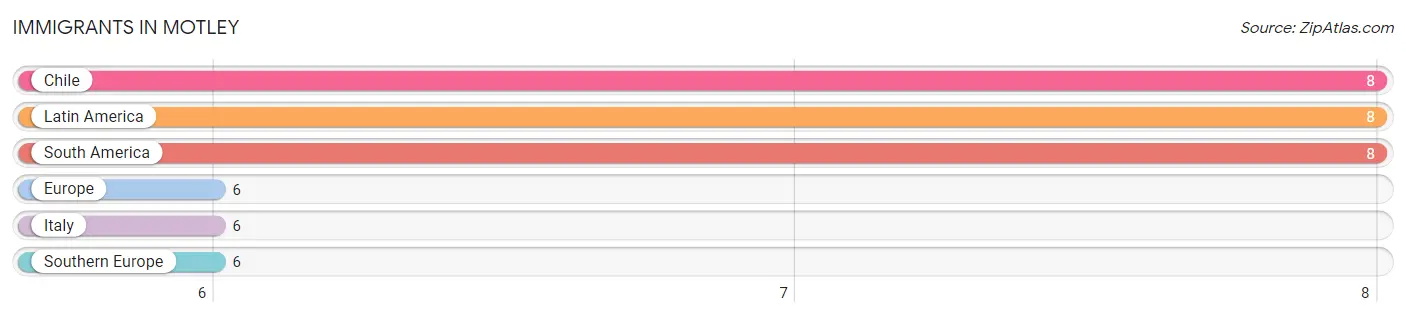
The most numerous immigrant groups reported in Motley came from Chile (8 | 1.2%), Latin America (8 | 1.2%), South America (8 | 1.2%), Europe (6 | 0.9%), and Italy (6 | 0.9%), together accounting for 5.6% of all Motley residents.
| Immigration Origin | # Population | % Population |
| Chile | 8 | 1.2% |
| Europe | 6 | 0.9% |
| Italy | 6 | 0.9% |
| Latin America | 8 | 1.2% |
| South America | 8 | 1.2% |
| Southern Europe | 6 | 0.9% | View All 6 Rows |
Sex and Age in Motley
Sex and Age in Motley
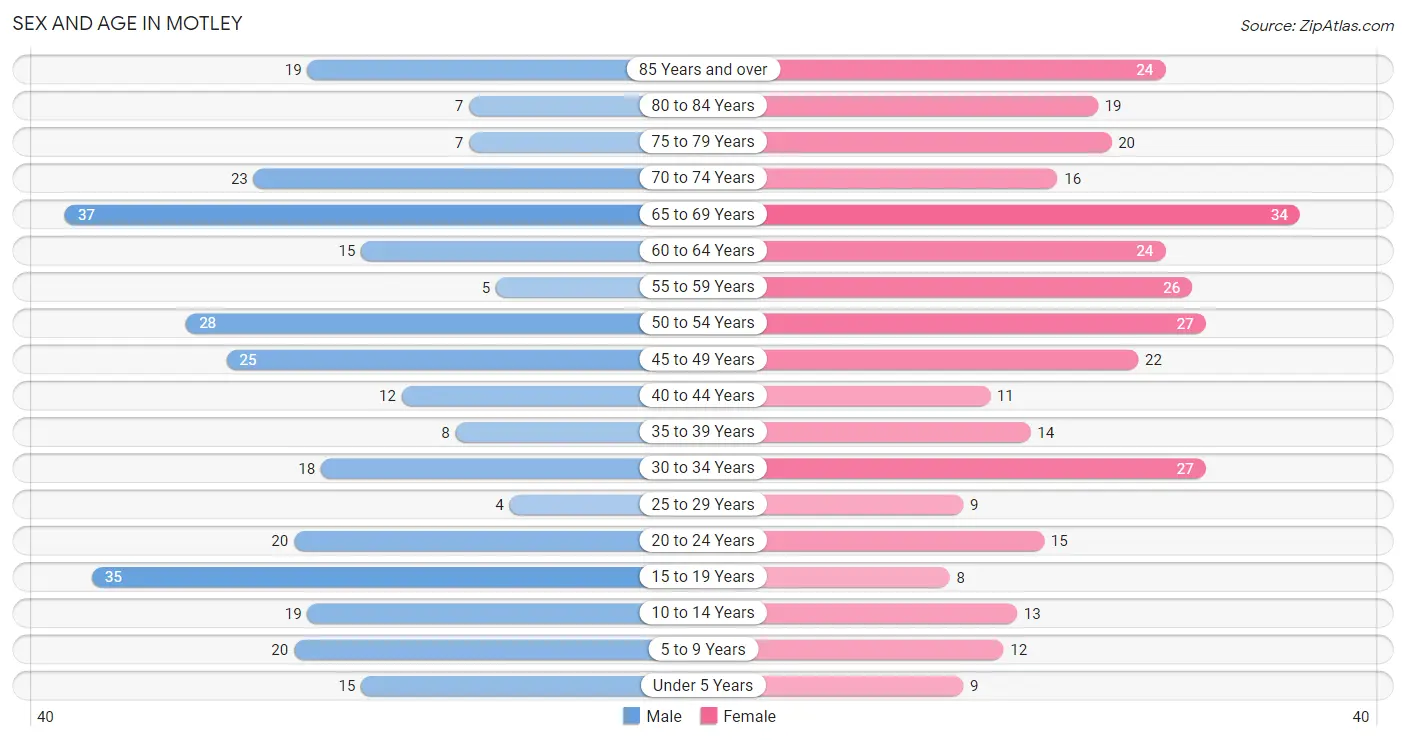
The most populous age groups in Motley are 65 to 69 Years (37 | 11.7%) for men and 65 to 69 Years (34 | 10.3%) for women.
| Age Bracket | Male | Female |
| Under 5 Years | 15 (4.7%) | 9 (2.7%) |
| 5 to 9 Years | 20 (6.3%) | 12 (3.6%) |
| 10 to 14 Years | 19 (6.0%) | 13 (3.9%) |
| 15 to 19 Years | 35 (11.0%) | 8 (2.4%) |
| 20 to 24 Years | 20 (6.3%) | 15 (4.5%) |
| 25 to 29 Years | 4 (1.3%) | 9 (2.7%) |
| 30 to 34 Years | 18 (5.7%) | 27 (8.2%) |
| 35 to 39 Years | 8 (2.5%) | 14 (4.2%) |
| 40 to 44 Years | 12 (3.8%) | 11 (3.3%) |
| 45 to 49 Years | 25 (7.9%) | 22 (6.7%) |
| 50 to 54 Years | 28 (8.8%) | 27 (8.2%) |
| 55 to 59 Years | 5 (1.6%) | 26 (7.9%) |
| 60 to 64 Years | 15 (4.7%) | 24 (7.3%) |
| 65 to 69 Years | 37 (11.7%) | 34 (10.3%) |
| 70 to 74 Years | 23 (7.3%) | 16 (4.9%) |
| 75 to 79 Years | 7 (2.2%) | 20 (6.1%) |
| 80 to 84 Years | 7 (2.2%) | 19 (5.8%) |
| 85 Years and over | 19 (6.0%) | 24 (7.3%) |
| Total | 317 (100.0%) | 330 (100.0%) |
Families and Households in Motley
Median Family Size in Motley
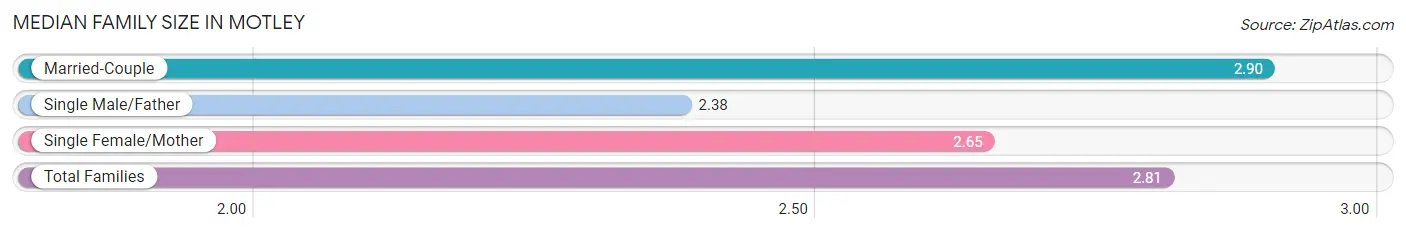
The median family size in Motley is 2.81 persons per family, with married-couple families (111 | 77.1%) accounting for the largest median family size of 2.9 persons per family. On the other hand, single male/father families (16 | 11.1%) represent the smallest median family size with 2.38 persons per family.
| Family Type | # Families | Family Size |
| Married-Couple | 111 (77.1%) | 2.90 |
| Single Male/Father | 16 (11.1%) | 2.38 |
| Single Female/Mother | 17 (11.8%) | 2.65 |
| Total Families | 144 (100.0%) | 2.81 |
Median Household Size in Motley
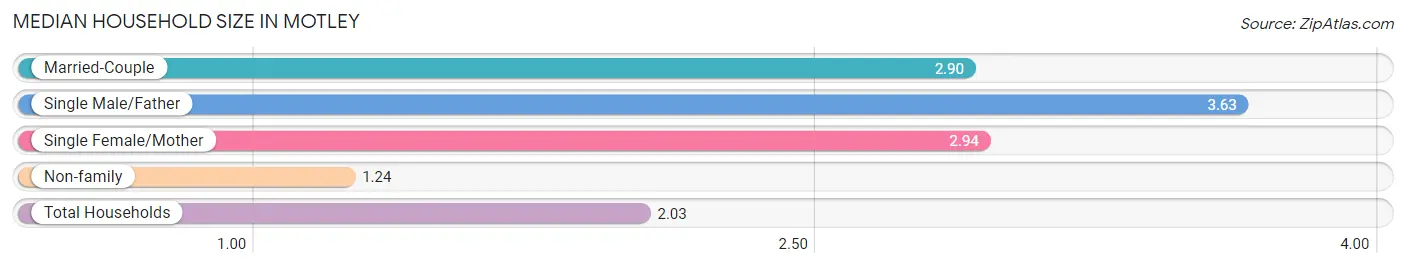
The median household size in Motley is 2.03 persons per household, with single male/father households (16 | 5.1%) accounting for the largest median household size of 3.63 persons per household. non-family households (172 | 54.4%) represent the smallest median household size with 1.24 persons per household.
| Household Type | # Households | Household Size |
| Married-Couple | 111 (35.1%) | 2.90 |
| Single Male/Father | 16 (5.1%) | 3.63 |
| Single Female/Mother | 17 (5.4%) | 2.94 |
| Non-family | 172 (54.4%) | 1.24 |
| Total Households | 316 (100.0%) | 2.03 |
Household Size by Marriage Status in Motley
Out of a total of 316 households in Motley, 144 (45.6%) are family households, while 172 (54.4%) are nonfamily households. The most numerous type of family households are 2-person households, comprising 81, and the most common type of nonfamily households are 1-person households, comprising 150.
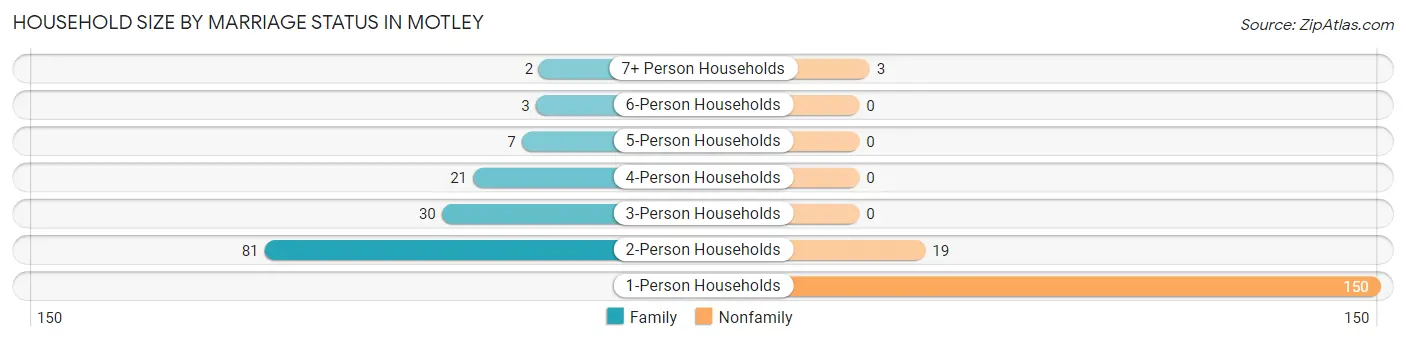
| Household Size | Family Households | Nonfamily Households |
| 1-Person Households | - | 150 (47.5%) |
| 2-Person Households | 81 (25.6%) | 19 (6.0%) |
| 3-Person Households | 30 (9.5%) | 0 (0.0%) |
| 4-Person Households | 21 (6.7%) | 0 (0.0%) |
| 5-Person Households | 7 (2.2%) | 0 (0.0%) |
| 6-Person Households | 3 (0.9%) | 0 (0.0%) |
| 7+ Person Households | 2 (0.6%) | 3 (0.9%) |
| Total | 144 (45.6%) | 172 (54.4%) |
Female Fertility in Motley
Fertility by Age in Motley
| Age Bracket | Women with Births | Births / 1,000 Women |
| 15 to 19 years | 0 (0.0%) | 0.0 |
| 20 to 34 years | 0 (0.0%) | 0.0 |
| 35 to 50 years | 0 (0.0%) | 0.0 |
| Total | 0 (0.0%) | 0.0 |
Fertility by Age by Marriage Status in Motley
| Age Bracket | Married | Unmarried |
| 15 to 19 years | 0 (0.0%) | 0 (0.0%) |
| 20 to 34 years | 0 (0.0%) | 0 (0.0%) |
| 35 to 50 years | 0 (0.0%) | 0 (0.0%) |
| Total | 0 (0.0%) | 0 (0.0%) |
Fertility by Education in Motley
| Educational Attainment | Women with Births | Births / 1,000 Women |
| Less than High School | 0 (0.0%) | 0.0 |
| High School Diploma | 0 (0.0%) | 0.0 |
| College or Associate's Degree | 0 (0.0%) | 0.0 |
| Bachelor's Degree | 0 (0.0%) | 0.0 |
| Graduate Degree | 0 (0.0%) | 0.0 |
| Total | 0 (0.0%) | 0.0 |
Fertility by Education by Marriage Status in Motley
| Educational Attainment | Married | Unmarried |
| Less than High School | 0 (0.0%) | 0 (0.0%) |
| High School Diploma | 0 (0.0%) | 0 (0.0%) |
| College or Associate's Degree | 0 (0.0%) | 0 (0.0%) |
| Bachelor's Degree | 0 (0.0%) | 0 (0.0%) |
| Graduate Degree | 0 (0.0%) | 0 (0.0%) |
| Total | 0 (0.0%) | 0 (0.0%) |
Employment Characteristics in Motley
Employment by Class of Employer in Motley
Among the 291 employed individuals in Motley, private company employees (240 | 82.5%), not-for-profit organizations (28 | 9.6%), and local government employees (11 | 3.8%) make up the most common classes of employment.
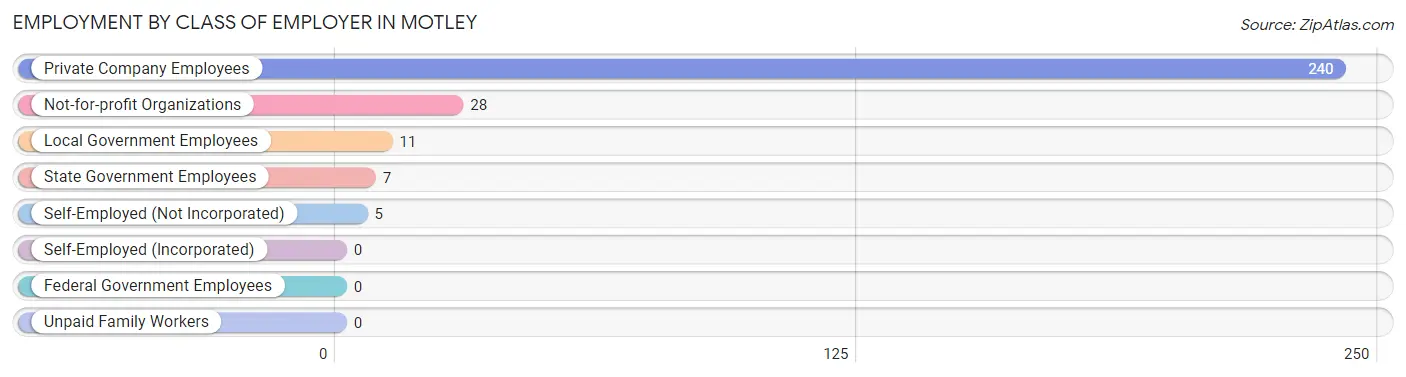
| Employer Class | # Employees | % Employees |
| Private Company Employees | 240 | 82.5% |
| Self-Employed (Incorporated) | 0 | 0.0% |
| Self-Employed (Not Incorporated) | 5 | 1.7% |
| Not-for-profit Organizations | 28 | 9.6% |
| Local Government Employees | 11 | 3.8% |
| State Government Employees | 7 | 2.4% |
| Federal Government Employees | 0 | 0.0% |
| Unpaid Family Workers | 0 | 0.0% |
| Total | 291 | 100.0% |
Employment Status by Age in Motley
According to the labor force statistics for Motley, out of the total population over 16 years of age (552), 56.9% or 314 individuals are in the labor force, with 4.8% or 15 of them unemployed. The age group with the highest labor force participation rate is 20 to 24 years, with 100.0% or 35 individuals in the labor force. Within the labor force, the 30 to 34 years age range has the highest percentage of unemployed individuals, with 11.6% or 5 of them being unemployed.
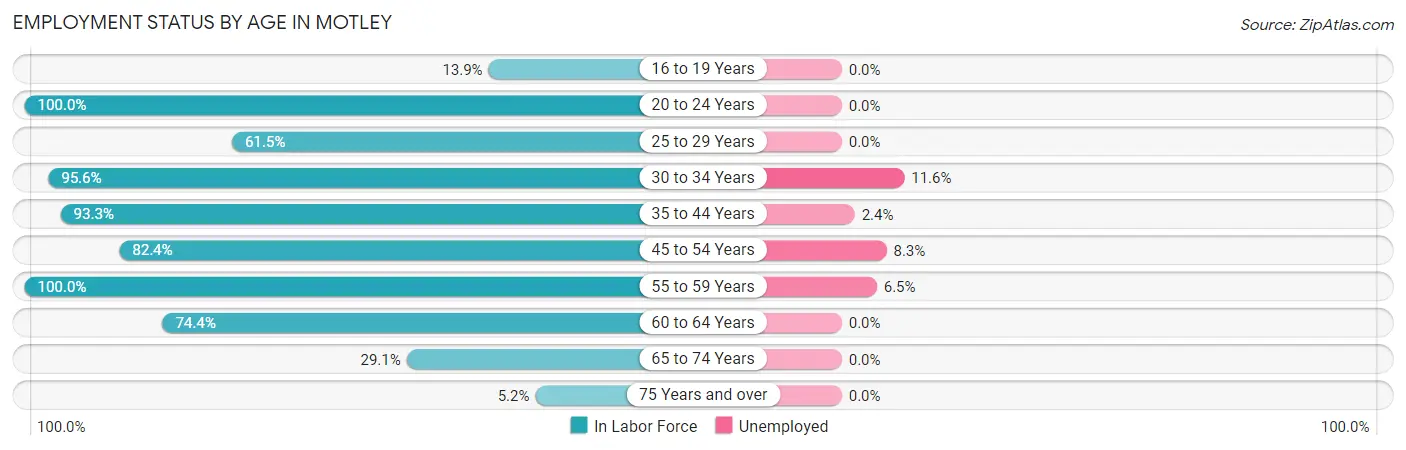
| Age Bracket | In Labor Force | Unemployed |
| 16 to 19 Years | 5 (13.9%) | 0 (0.0%) |
| 20 to 24 Years | 35 (100.0%) | 0 (0.0%) |
| 25 to 29 Years | 8 (61.5%) | 0 (0.0%) |
| 30 to 34 Years | 43 (95.6%) | 5 (11.6%) |
| 35 to 44 Years | 42 (93.3%) | 1 (2.4%) |
| 45 to 54 Years | 84 (82.4%) | 7 (8.3%) |
| 55 to 59 Years | 31 (100.0%) | 2 (6.5%) |
| 60 to 64 Years | 29 (74.4%) | 0 (0.0%) |
| 65 to 74 Years | 32 (29.1%) | 0 (0.0%) |
| 75 Years and over | 5 (5.2%) | 0 (0.0%) |
| Total | 314 (56.9%) | 15 (4.8%) |
Employment Status by Educational Attainment in Motley
According to labor force statistics for Motley, 86.2% of individuals (237) out of the total population between 25 and 64 years of age (275) are in the labor force, with 6.3% or 15 of them being unemployed. The group with the highest labor force participation rate are those with the educational attainment of college / associate degree, with 89.6% or 121 individuals in the labor force. Within the labor force, individuals with high school diploma education have the highest percentage of unemployment, with 9.9% or 8 of them being unemployed.
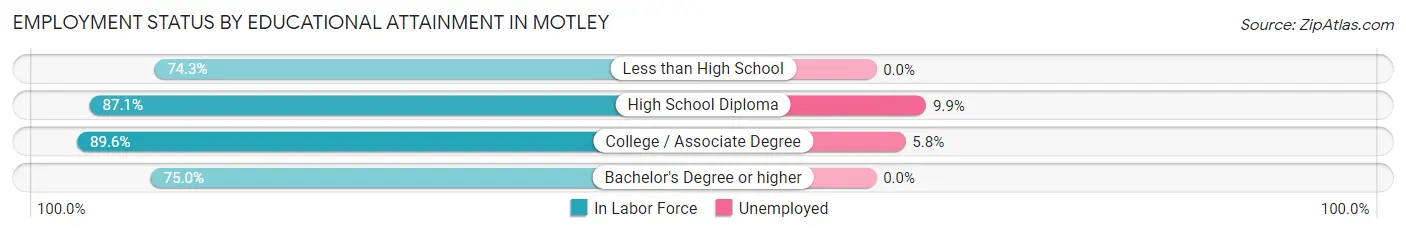
| Educational Attainment | In Labor Force | Unemployed |
| Less than High School | 26 (74.3%) | 0 (0.0%) |
| High School Diploma | 81 (87.1%) | 9 (9.9%) |
| College / Associate Degree | 121 (89.6%) | 8 (5.8%) |
| Bachelor's Degree or higher | 9 (75.0%) | 0 (0.0%) |
| Total | 237 (86.2%) | 17 (6.3%) |
Employment Occupations by Sex in Motley
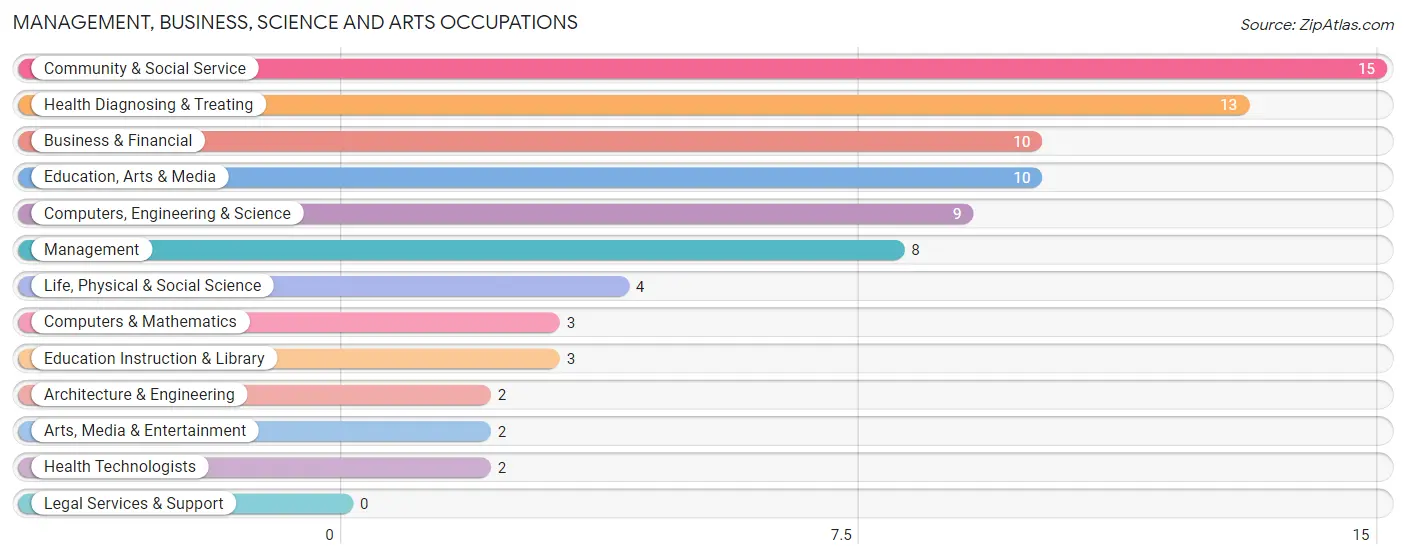
Management, Business, Science and Arts Occupations
The most common Management, Business, Science and Arts occupations in Motley are Community & Social Service (15 | 5.0%), Health Diagnosing & Treating (13 | 4.3%), Business & Financial (10 | 3.3%), Education, Arts & Media (10 | 3.3%), and Computers, Engineering & Science (9 | 3.0%).
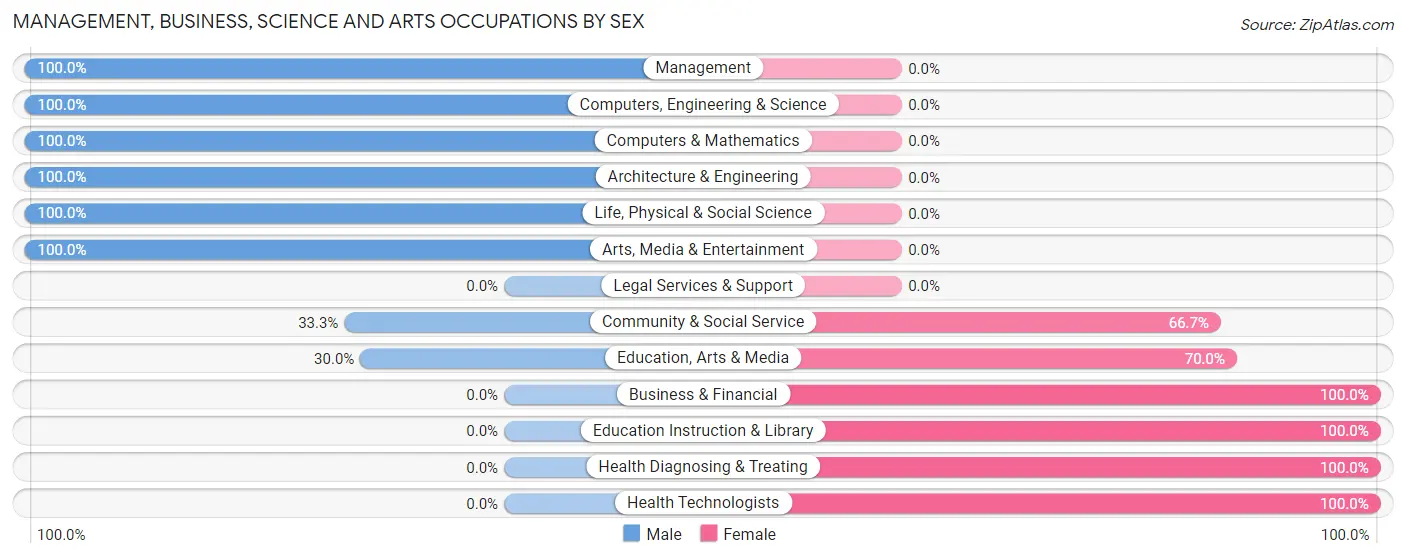
Management, Business, Science and Arts Occupations by Sex
Within the Management, Business, Science and Arts occupations in Motley, the most male-oriented occupations are Management (100.0%), Computers, Engineering & Science (100.0%), and Computers & Mathematics (100.0%), while the most female-oriented occupations are Business & Financial (100.0%), Education Instruction & Library (100.0%), and Health Diagnosing & Treating (100.0%).
| Occupation | Male | Female |
| Management | 8 (100.0%) | 0 (0.0%) |
| Business & Financial | 0 (0.0%) | 10 (100.0%) |
| Computers, Engineering & Science | 9 (100.0%) | 0 (0.0%) |
| Computers & Mathematics | 3 (100.0%) | 0 (0.0%) |
| Architecture & Engineering | 2 (100.0%) | 0 (0.0%) |
| Life, Physical & Social Science | 4 (100.0%) | 0 (0.0%) |
| Community & Social Service | 5 (33.3%) | 10 (66.7%) |
| Education, Arts & Media | 3 (30.0%) | 7 (70.0%) |
| Legal Services & Support | 0 (0.0%) | 0 (0.0%) |
| Education Instruction & Library | 0 (0.0%) | 3 (100.0%) |
| Arts, Media & Entertainment | 2 (100.0%) | 0 (0.0%) |
| Health Diagnosing & Treating | 0 (0.0%) | 13 (100.0%) |
| Health Technologists | 0 (0.0%) | 2 (100.0%) |
| Total (Category) | 22 (40.0%) | 33 (60.0%) |
| Total (Overall) | 116 (38.8%) | 183 (61.2%) |
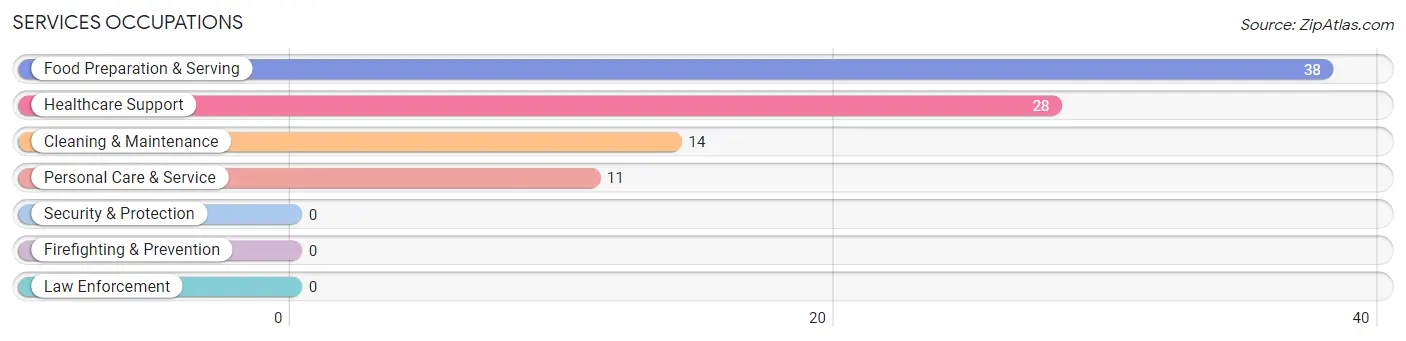
Services Occupations
The most common Services occupations in Motley are Food Preparation & Serving (38 | 12.7%), Healthcare Support (28 | 9.4%), Cleaning & Maintenance (14 | 4.7%), and Personal Care & Service (11 | 3.7%).
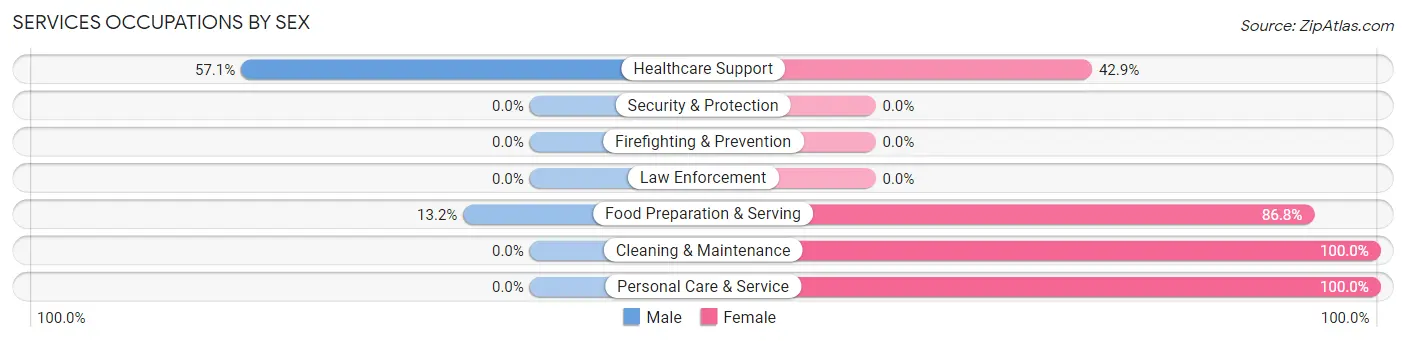
Services Occupations by Sex
Within the Services occupations in Motley, the most male-oriented occupations are Healthcare Support (57.1%), and Food Preparation & Serving (13.2%), while the most female-oriented occupations are Cleaning & Maintenance (100.0%), Personal Care & Service (100.0%), and Food Preparation & Serving (86.8%).
| Occupation | Male | Female |
| Healthcare Support | 16 (57.1%) | 12 (42.9%) |
| Security & Protection | 0 (0.0%) | 0 (0.0%) |
| Firefighting & Prevention | 0 (0.0%) | 0 (0.0%) |
| Law Enforcement | 0 (0.0%) | 0 (0.0%) |
| Food Preparation & Serving | 5 (13.2%) | 33 (86.8%) |
| Cleaning & Maintenance | 0 (0.0%) | 14 (100.0%) |
| Personal Care & Service | 0 (0.0%) | 11 (100.0%) |
| Total (Category) | 21 (23.1%) | 70 (76.9%) |
| Total (Overall) | 116 (38.8%) | 183 (61.2%) |
Sales and Office Occupations
The most common Sales and Office occupations in Motley are Sales & Related (42 | 14.1%), and Office & Administration (40 | 13.4%).
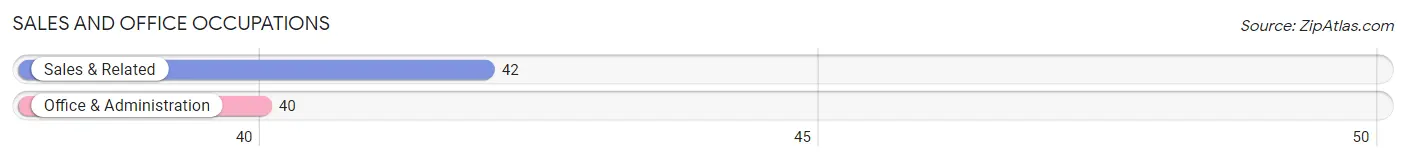
Sales and Office Occupations by Sex
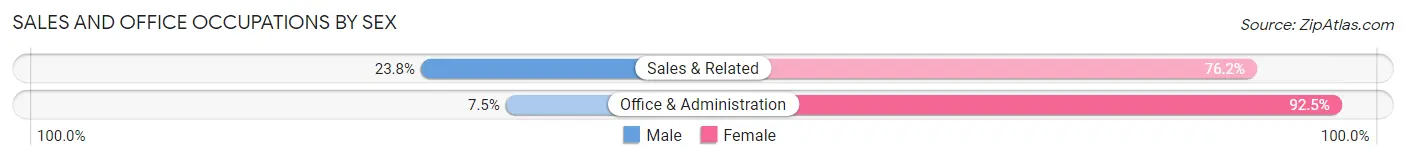
| Occupation | Male | Female |
| Sales & Related | 10 (23.8%) | 32 (76.2%) |
| Office & Administration | 3 (7.5%) | 37 (92.5%) |
| Total (Category) | 13 (15.9%) | 69 (84.2%) |
| Total (Overall) | 116 (38.8%) | 183 (61.2%) |
Natural Resources, Construction and Maintenance Occupations
The most common Natural Resources, Construction and Maintenance occupations in Motley are Construction & Extraction (16 | 5.3%), Installation, Maintenance & Repair (16 | 5.3%), and Farming, Fishing & Forestry (2 | 0.7%).
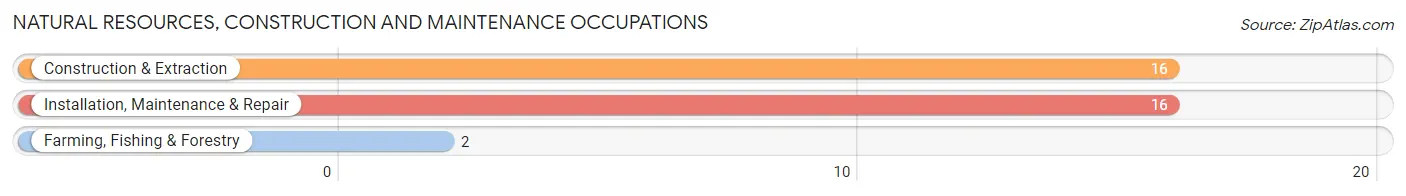
Natural Resources, Construction and Maintenance Occupations by Sex
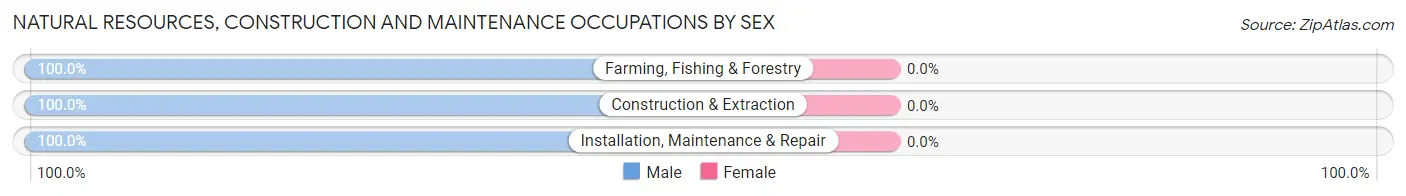
| Occupation | Male | Female |
| Farming, Fishing & Forestry | 2 (100.0%) | 0 (0.0%) |
| Construction & Extraction | 16 (100.0%) | 0 (0.0%) |
| Installation, Maintenance & Repair | 16 (100.0%) | 0 (0.0%) |
| Total (Category) | 34 (100.0%) | 0 (0.0%) |
| Total (Overall) | 116 (38.8%) | 183 (61.2%) |
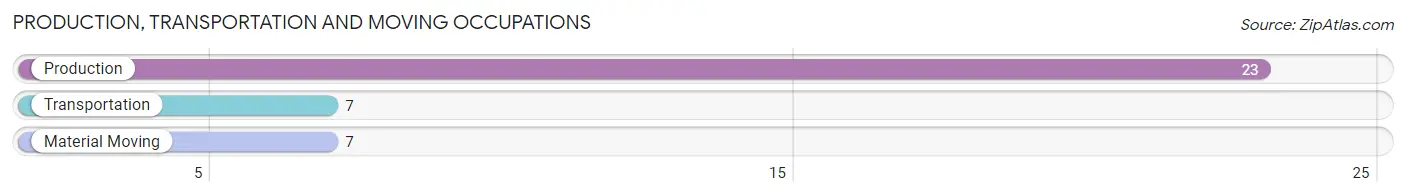
Production, Transportation and Moving Occupations
The most common Production, Transportation and Moving occupations in Motley are Production (23 | 7.7%), Transportation (7 | 2.3%), and Material Moving (7 | 2.3%).
Production, Transportation and Moving Occupations by Sex
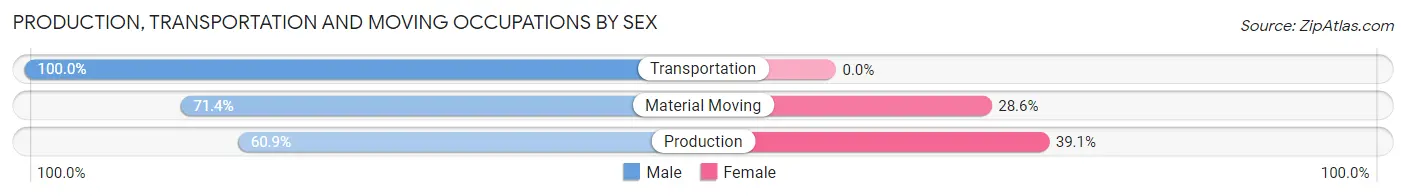
| Occupation | Male | Female |
| Production | 14 (60.9%) | 9 (39.1%) |
| Transportation | 7 (100.0%) | 0 (0.0%) |
| Material Moving | 5 (71.4%) | 2 (28.6%) |
| Total (Category) | 26 (70.3%) | 11 (29.7%) |
| Total (Overall) | 116 (38.8%) | 183 (61.2%) |
Employment Industries by Sex in Motley
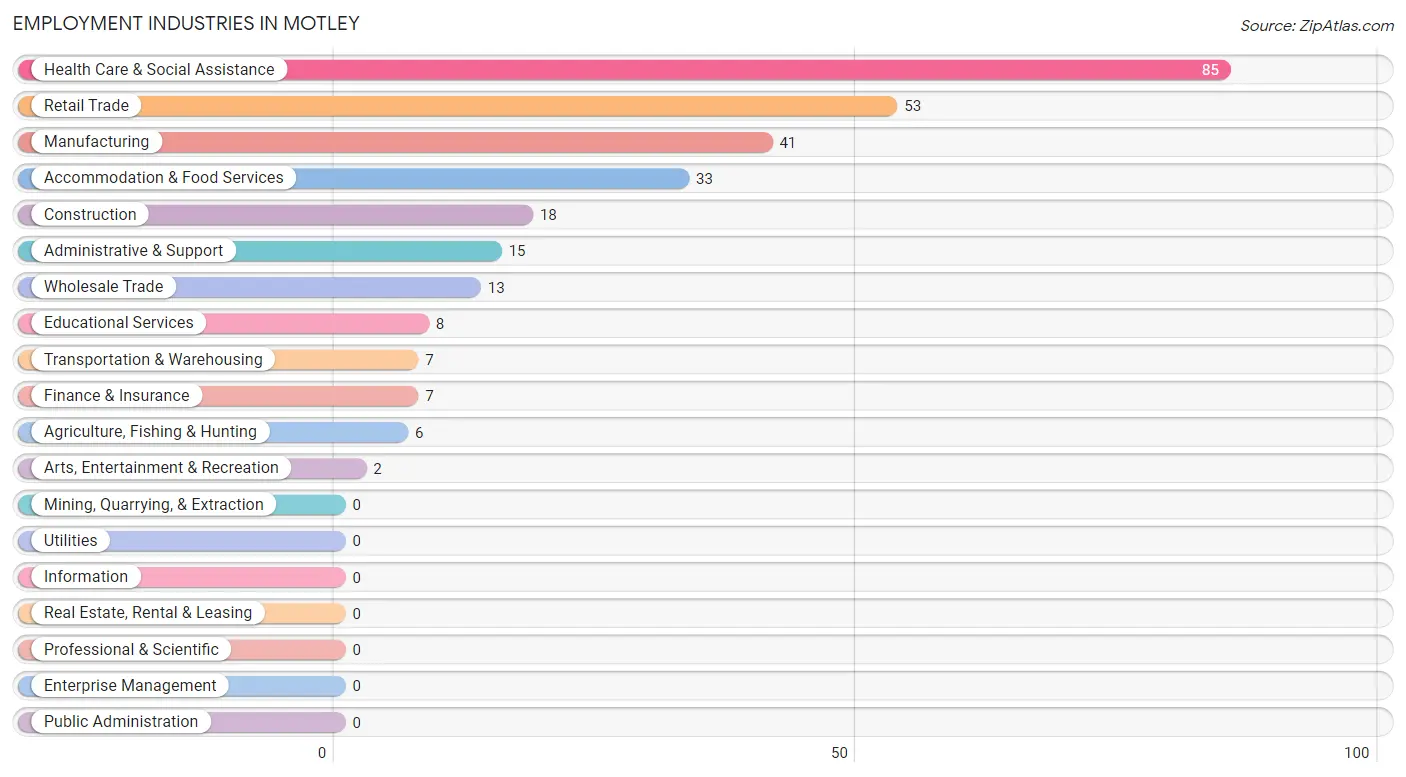
Employment Industries in Motley
The major employment industries in Motley include Health Care & Social Assistance (85 | 28.4%), Retail Trade (53 | 17.7%), Manufacturing (41 | 13.7%), Accommodation & Food Services (33 | 11.0%), and Construction (18 | 6.0%).
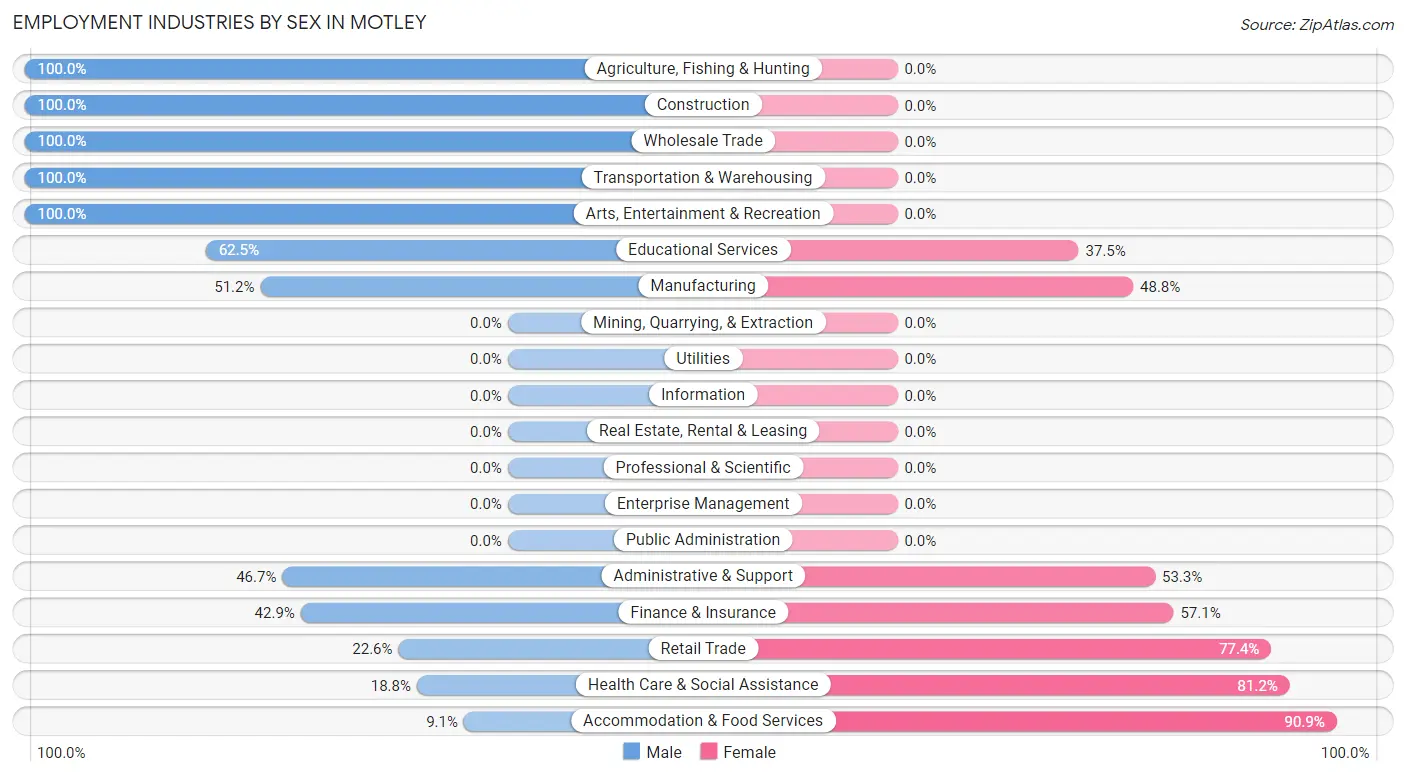
Employment Industries by Sex in Motley
The Motley industries that see more men than women are Agriculture, Fishing & Hunting (100.0%), Construction (100.0%), and Wholesale Trade (100.0%), whereas the industries that tend to have a higher number of women are Accommodation & Food Services (90.9%), Health Care & Social Assistance (81.2%), and Retail Trade (77.4%).
| Industry | Male | Female |
| Agriculture, Fishing & Hunting | 6 (100.0%) | 0 (0.0%) |
| Mining, Quarrying, & Extraction | 0 (0.0%) | 0 (0.0%) |
| Construction | 18 (100.0%) | 0 (0.0%) |
| Manufacturing | 21 (51.2%) | 20 (48.8%) |
| Wholesale Trade | 13 (100.0%) | 0 (0.0%) |
| Retail Trade | 12 (22.6%) | 41 (77.4%) |
| Transportation & Warehousing | 7 (100.0%) | 0 (0.0%) |
| Utilities | 0 (0.0%) | 0 (0.0%) |
| Information | 0 (0.0%) | 0 (0.0%) |
| Finance & Insurance | 3 (42.9%) | 4 (57.1%) |
| Real Estate, Rental & Leasing | 0 (0.0%) | 0 (0.0%) |
| Professional & Scientific | 0 (0.0%) | 0 (0.0%) |
| Enterprise Management | 0 (0.0%) | 0 (0.0%) |
| Administrative & Support | 7 (46.7%) | 8 (53.3%) |
| Educational Services | 5 (62.5%) | 3 (37.5%) |
| Health Care & Social Assistance | 16 (18.8%) | 69 (81.2%) |
| Arts, Entertainment & Recreation | 2 (100.0%) | 0 (0.0%) |
| Accommodation & Food Services | 3 (9.1%) | 30 (90.9%) |
| Public Administration | 0 (0.0%) | 0 (0.0%) |
| Total | 116 (38.8%) | 183 (61.2%) |
Education in Motley
School Enrollment in Motley
The most common levels of schooling among the 139 students in Motley are high school (41 | 29.5%), middle school (32 | 23.0%), and college / undergraduate (29 | 20.9%).
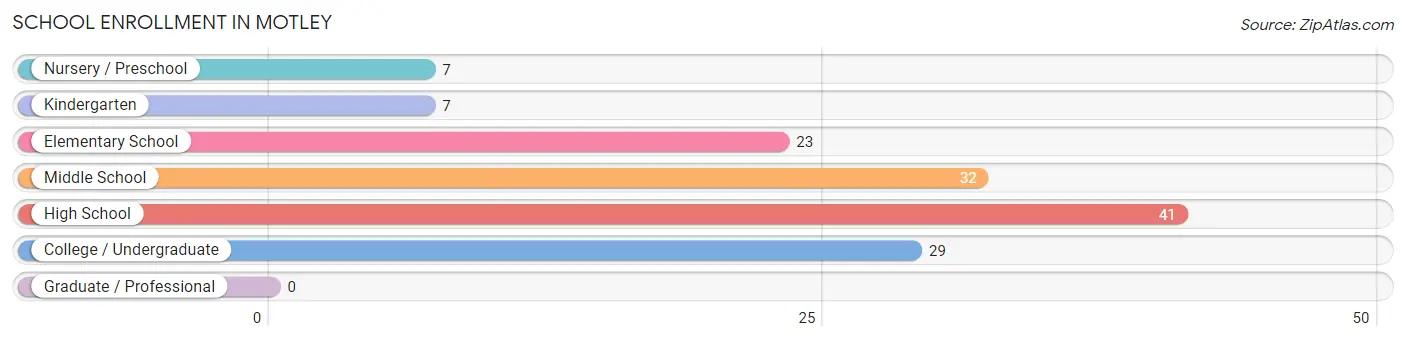
| School Level | # Students | % Students |
| Nursery / Preschool | 7 | 5.0% |
| Kindergarten | 7 | 5.0% |
| Elementary School | 23 | 16.6% |
| Middle School | 32 | 23.0% |
| High School | 41 | 29.5% |
| College / Undergraduate | 29 | 20.9% |
| Graduate / Professional | 0 | 0.0% |
| Total | 139 | 100.0% |
School Enrollment by Age by Funding Source in Motley
Out of a total of 139 students who are enrolled in schools in Motley, 28 (20.1%) attend a private institution, while the remaining 111 (79.9%) are enrolled in public schools. The age group of 35 years and over has the highest likelihood of being enrolled in private schools, with 6 (66.7% in the age bracket) enrolled. Conversely, the age group of 3 to 4 year olds has the lowest likelihood of being enrolled in a private school, with 7 (100.0% in the age bracket) attending a public institution.
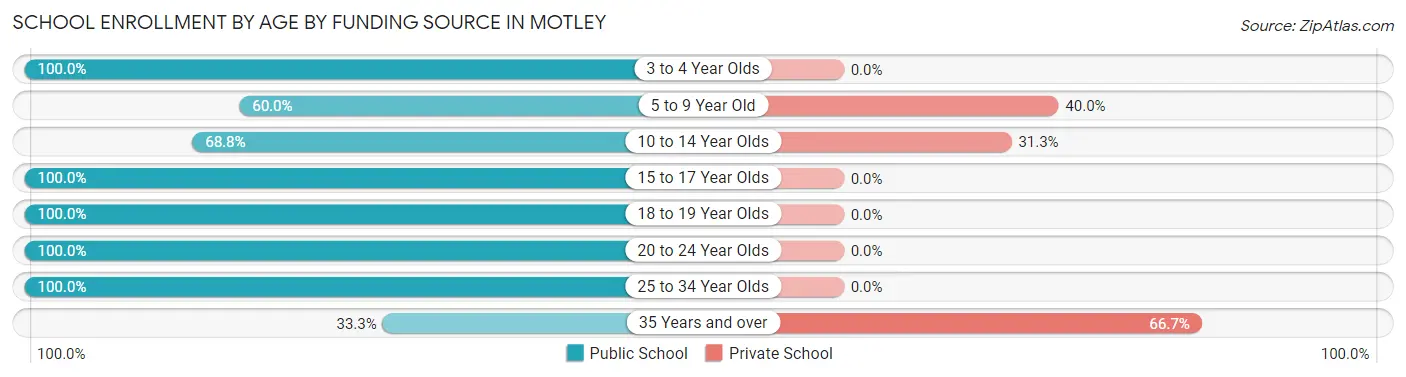
| Age Bracket | Public School | Private School |
| 3 to 4 Year Olds | 7 (100.0%) | 0 (0.0%) |
| 5 to 9 Year Old | 18 (60.0%) | 12 (40.0%) |
| 10 to 14 Year Olds | 22 (68.8%) | 10 (31.2%) |
| 15 to 17 Year Olds | 32 (100.0%) | 0 (0.0%) |
| 18 to 19 Year Olds | 9 (100.0%) | 0 (0.0%) |
| 20 to 24 Year Olds | 14 (100.0%) | 0 (0.0%) |
| 25 to 34 Year Olds | 6 (100.0%) | 0 (0.0%) |
| 35 Years and over | 3 (33.3%) | 6 (66.7%) |
| Total | 111 (79.9%) | 28 (20.1%) |
Educational Attainment by Field of Study in Motley
Psychology (14 | 63.6%), education (5 | 22.7%), and business (3 | 13.6%) are the most common fields of study among 22 individuals in Motley who have obtained a bachelor's degree or higher.
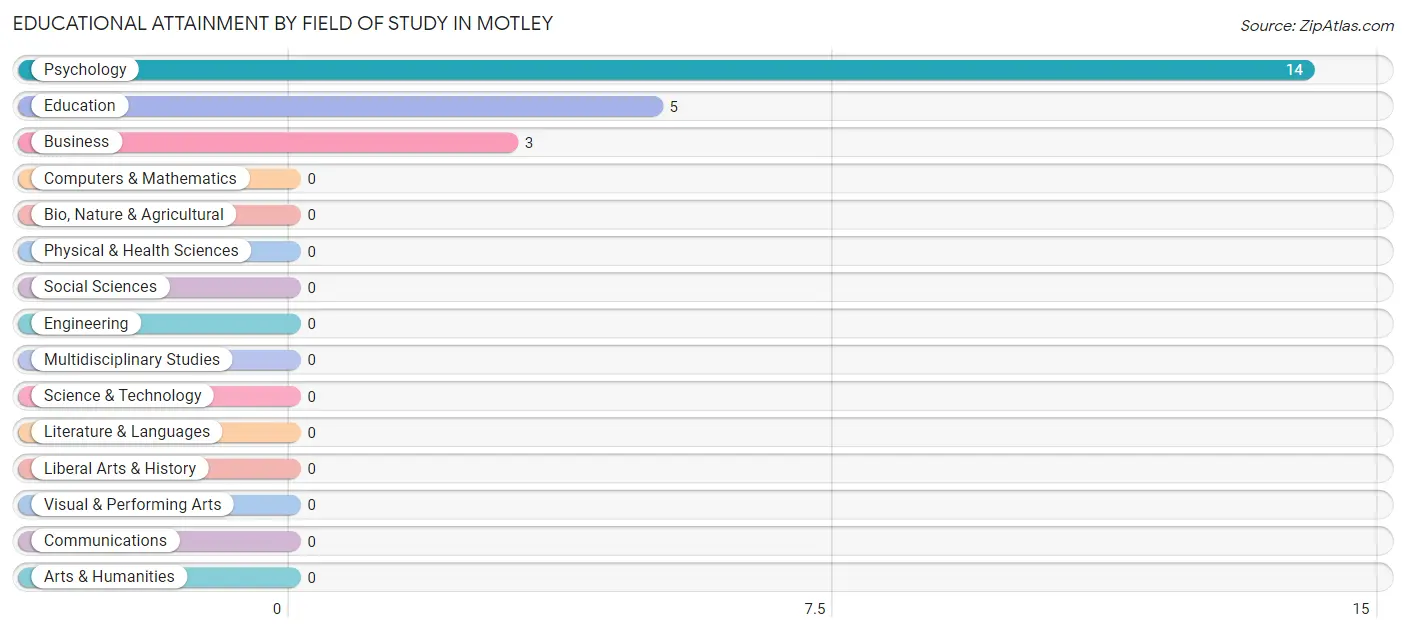
| Field of Study | # Graduates | % Graduates |
| Computers & Mathematics | 0 | 0.0% |
| Bio, Nature & Agricultural | 0 | 0.0% |
| Physical & Health Sciences | 0 | 0.0% |
| Psychology | 14 | 63.6% |
| Social Sciences | 0 | 0.0% |
| Engineering | 0 | 0.0% |
| Multidisciplinary Studies | 0 | 0.0% |
| Science & Technology | 0 | 0.0% |
| Business | 3 | 13.6% |
| Education | 5 | 22.7% |
| Literature & Languages | 0 | 0.0% |
| Liberal Arts & History | 0 | 0.0% |
| Visual & Performing Arts | 0 | 0.0% |
| Communications | 0 | 0.0% |
| Arts & Humanities | 0 | 0.0% |
| Total | 22 | 100.0% |
Transportation & Commute in Motley
Vehicle Availability by Sex in Motley
The most prevalent vehicle ownership categories in Motley are males with 3 vehicles (43, accounting for 39.8%) and females with 3 vehicles (49, making up 23.5%).
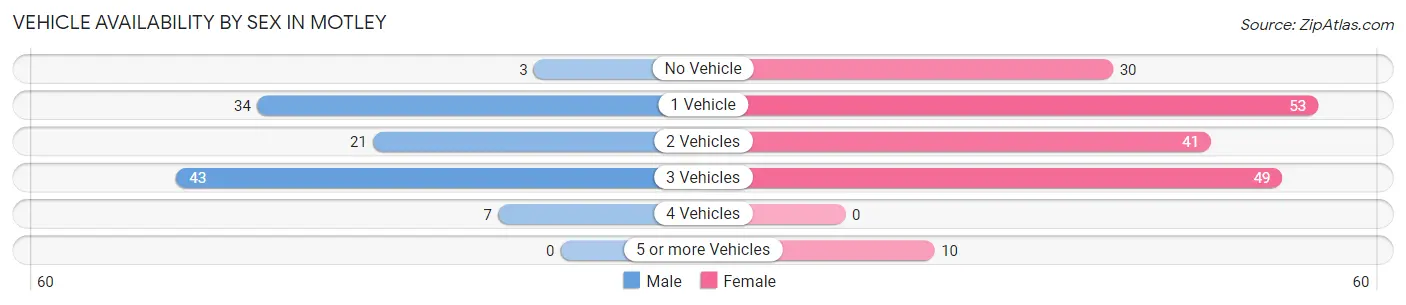
| Vehicles Available | Male | Female |
| No Vehicle | 3 (2.8%) | 30 (16.4%) |
| 1 Vehicle | 34 (31.5%) | 53 (29.0%) |
| 2 Vehicles | 21 (19.4%) | 41 (22.4%) |
| 3 Vehicles | 43 (39.8%) | 49 (26.8%) |
| 4 Vehicles | 7 (6.5%) | 0 (0.0%) |
| 5 or more Vehicles | 0 (0.0%) | 10 (5.5%) |
| Total | 108 (100.0%) | 183 (100.0%) |
Commute Time in Motley
The most frequently occuring commute durations in Motley are 5 to 9 minutes (61 commuters, 21.8%), 20 to 24 minutes (50 commuters, 17.9%), and less than 5 minutes (42 commuters, 15.0%).
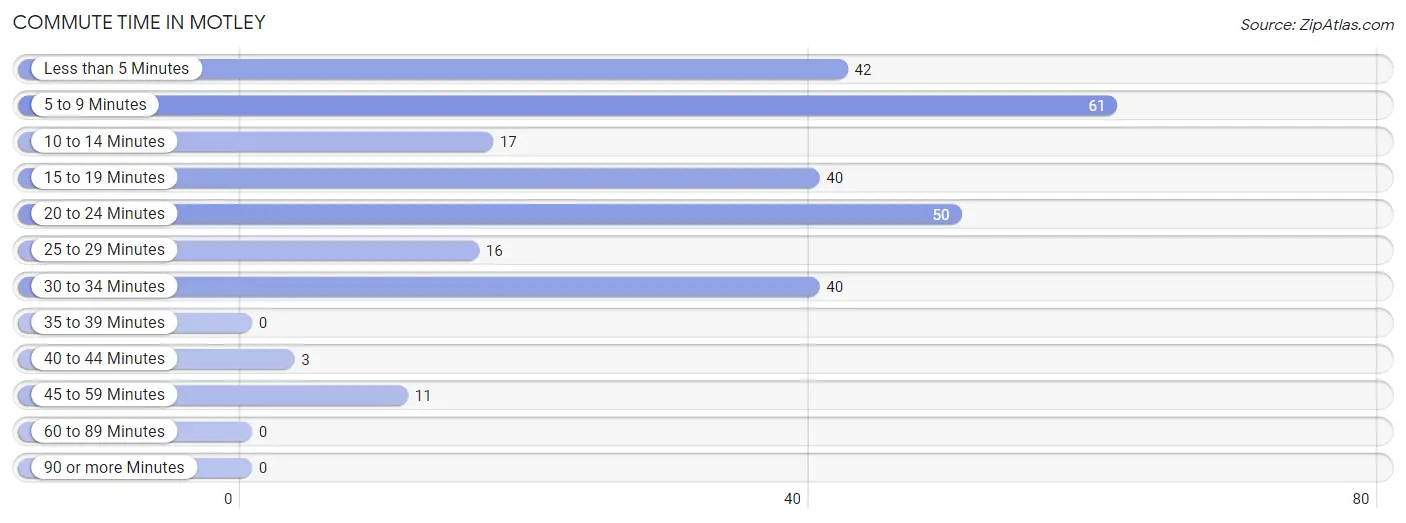
| Commute Time | # Commuters | % Commuters |
| Less than 5 Minutes | 42 | 15.0% |
| 5 to 9 Minutes | 61 | 21.8% |
| 10 to 14 Minutes | 17 | 6.1% |
| 15 to 19 Minutes | 40 | 14.3% |
| 20 to 24 Minutes | 50 | 17.9% |
| 25 to 29 Minutes | 16 | 5.7% |
| 30 to 34 Minutes | 40 | 14.3% |
| 35 to 39 Minutes | 0 | 0.0% |
| 40 to 44 Minutes | 3 | 1.1% |
| 45 to 59 Minutes | 11 | 3.9% |
| 60 to 89 Minutes | 0 | 0.0% |
| 90 or more Minutes | 0 | 0.0% |
Commute Time by Sex in Motley
The most common commute times in Motley are 15 to 19 minutes (21 commuters, 20.6%) for males and 5 to 9 minutes (47 commuters, 26.4%) for females.
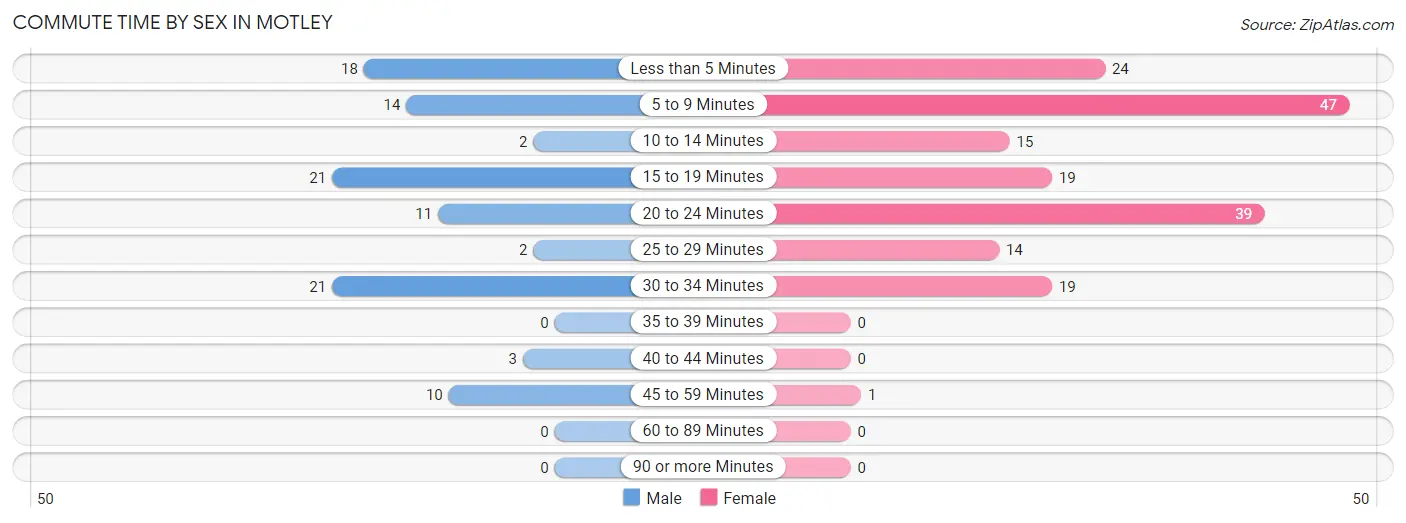
| Commute Time | Male | Female |
| Less than 5 Minutes | 18 (17.6%) | 24 (13.5%) |
| 5 to 9 Minutes | 14 (13.7%) | 47 (26.4%) |
| 10 to 14 Minutes | 2 (2.0%) | 15 (8.4%) |
| 15 to 19 Minutes | 21 (20.6%) | 19 (10.7%) |
| 20 to 24 Minutes | 11 (10.8%) | 39 (21.9%) |
| 25 to 29 Minutes | 2 (2.0%) | 14 (7.9%) |
| 30 to 34 Minutes | 21 (20.6%) | 19 (10.7%) |
| 35 to 39 Minutes | 0 (0.0%) | 0 (0.0%) |
| 40 to 44 Minutes | 3 (2.9%) | 0 (0.0%) |
| 45 to 59 Minutes | 10 (9.8%) | 1 (0.6%) |
| 60 to 89 Minutes | 0 (0.0%) | 0 (0.0%) |
| 90 or more Minutes | 0 (0.0%) | 0 (0.0%) |
Time of Departure to Work by Sex in Motley
The most frequent times of departure to work in Motley are 12:00 PM to 3:59 PM (20, 19.6%) for males and 7:00 AM to 7:29 AM (43, 24.2%) for females.
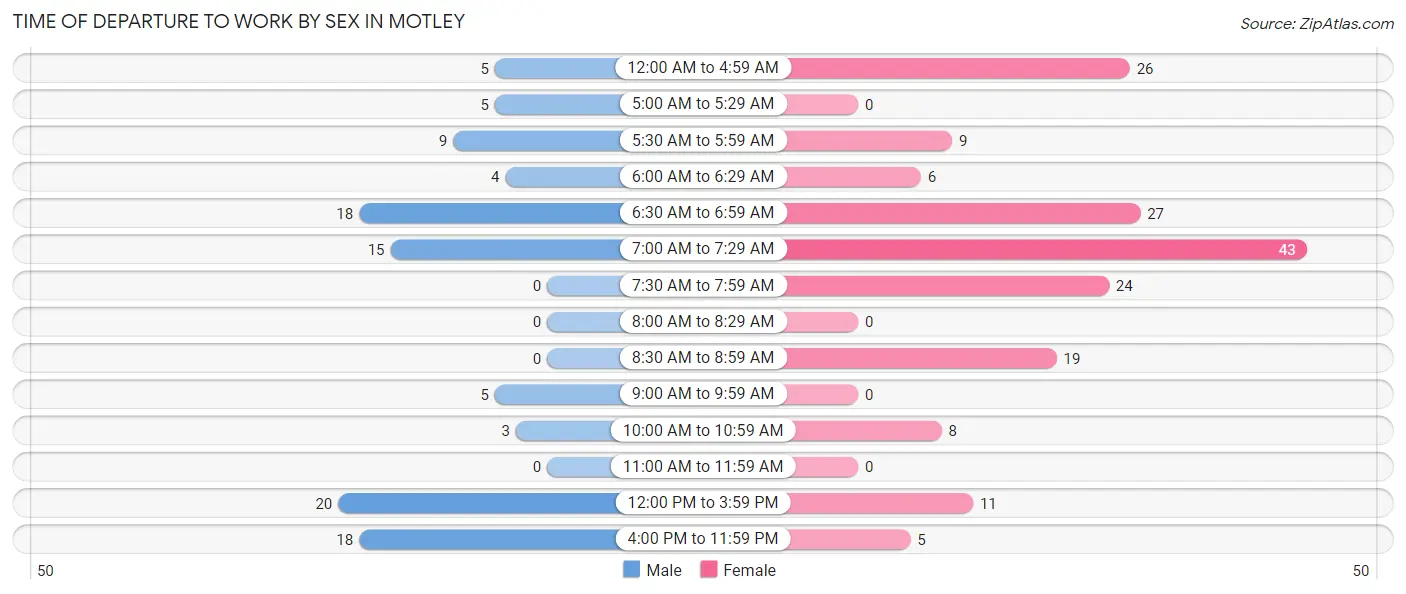
| Time of Departure | Male | Female |
| 12:00 AM to 4:59 AM | 5 (4.9%) | 26 (14.6%) |
| 5:00 AM to 5:29 AM | 5 (4.9%) | 0 (0.0%) |
| 5:30 AM to 5:59 AM | 9 (8.8%) | 9 (5.1%) |
| 6:00 AM to 6:29 AM | 4 (3.9%) | 6 (3.4%) |
| 6:30 AM to 6:59 AM | 18 (17.6%) | 27 (15.2%) |
| 7:00 AM to 7:29 AM | 15 (14.7%) | 43 (24.2%) |
| 7:30 AM to 7:59 AM | 0 (0.0%) | 24 (13.5%) |
| 8:00 AM to 8:29 AM | 0 (0.0%) | 0 (0.0%) |
| 8:30 AM to 8:59 AM | 0 (0.0%) | 19 (10.7%) |
| 9:00 AM to 9:59 AM | 5 (4.9%) | 0 (0.0%) |
| 10:00 AM to 10:59 AM | 3 (2.9%) | 8 (4.5%) |
| 11:00 AM to 11:59 AM | 0 (0.0%) | 0 (0.0%) |
| 12:00 PM to 3:59 PM | 20 (19.6%) | 11 (6.2%) |
| 4:00 PM to 11:59 PM | 18 (17.6%) | 5 (2.8%) |
| Total | 102 (100.0%) | 178 (100.0%) |
Housing Occupancy in Motley
Occupancy by Ownership in Motley
Of the total 316 dwellings in Motley, owner-occupied units account for 189 (59.8%), while renter-occupied units make up 127 (40.2%).
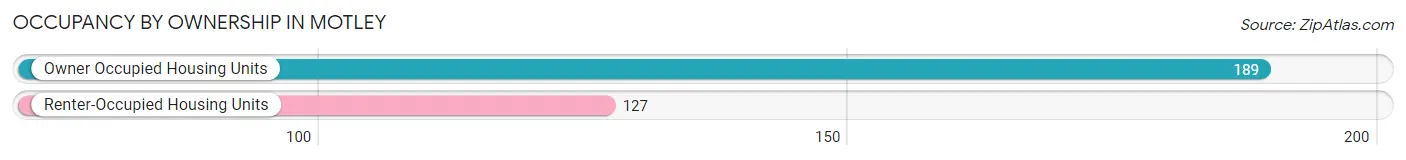
| Occupancy | # Housing Units | % Housing Units |
| Owner Occupied Housing Units | 189 | 59.8% |
| Renter-Occupied Housing Units | 127 | 40.2% |
| Total Occupied Housing Units | 316 | 100.0% |
Occupancy by Household Size in Motley
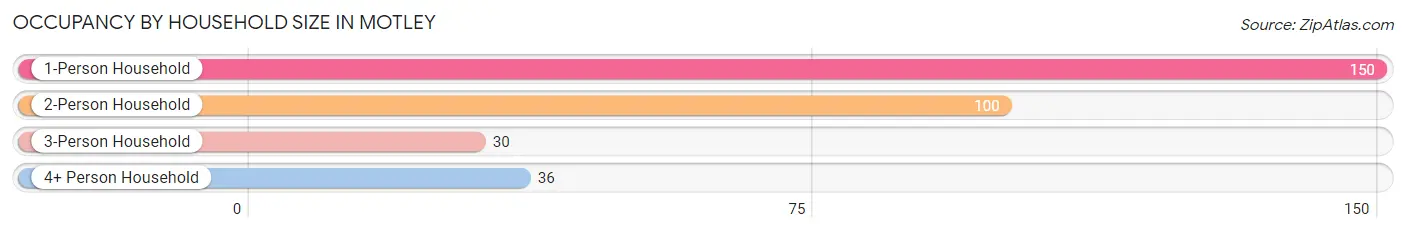
| Household Size | # Housing Units | % Housing Units |
| 1-Person Household | 150 | 47.5% |
| 2-Person Household | 100 | 31.7% |
| 3-Person Household | 30 | 9.5% |
| 4+ Person Household | 36 | 11.4% |
| Total Housing Units | 316 | 100.0% |
Occupancy by Ownership by Household Size in Motley
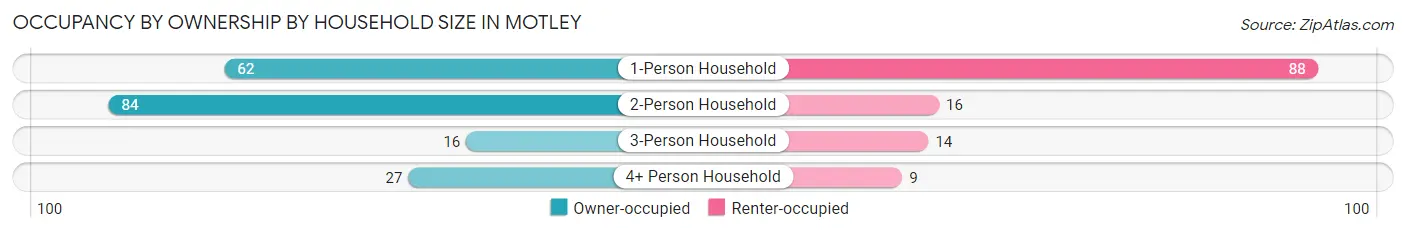
| Household Size | Owner-occupied | Renter-occupied |
| 1-Person Household | 62 (41.3%) | 88 (58.7%) |
| 2-Person Household | 84 (84.0%) | 16 (16.0%) |
| 3-Person Household | 16 (53.3%) | 14 (46.7%) |
| 4+ Person Household | 27 (75.0%) | 9 (25.0%) |
| Total Housing Units | 189 (59.8%) | 127 (40.2%) |
Occupancy by Educational Attainment in Motley
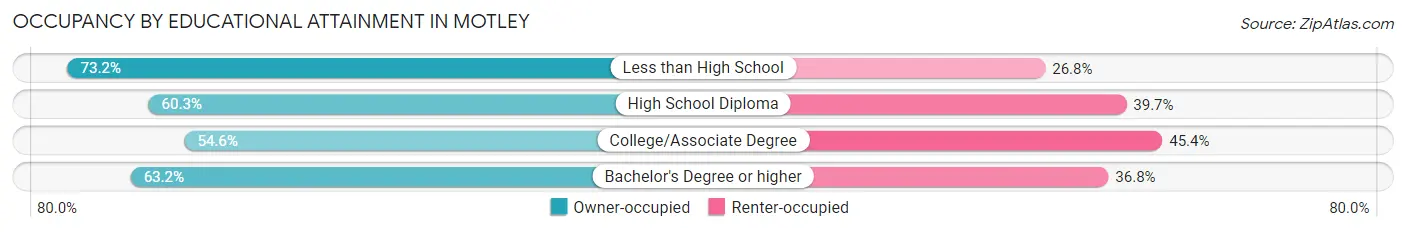
| Household Size | Owner-occupied | Renter-occupied |
| Less than High School | 30 (73.2%) | 11 (26.8%) |
| High School Diploma | 76 (60.3%) | 50 (39.7%) |
| College/Associate Degree | 71 (54.6%) | 59 (45.4%) |
| Bachelor's Degree or higher | 12 (63.2%) | 7 (36.8%) |
Occupancy by Age of Householder in Motley
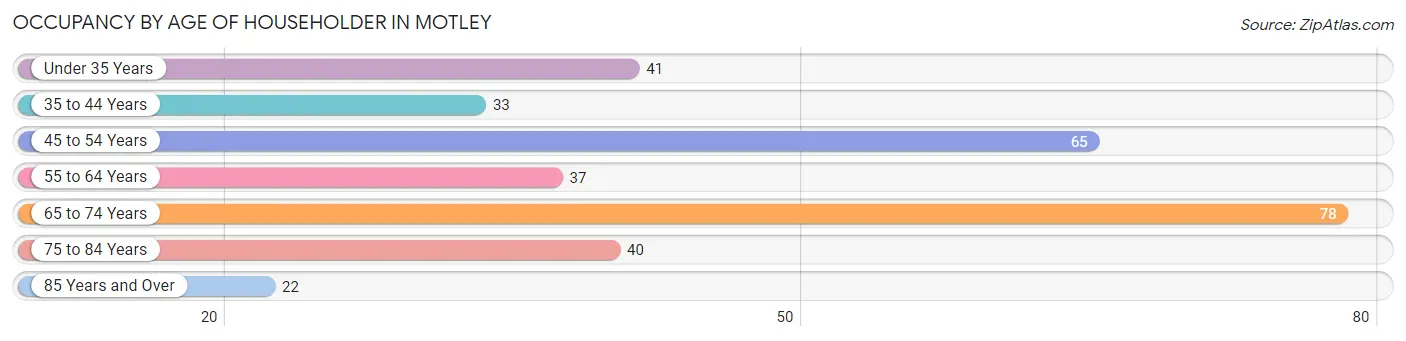
| Age Bracket | # Households | % Households |
| Under 35 Years | 41 | 13.0% |
| 35 to 44 Years | 33 | 10.4% |
| 45 to 54 Years | 65 | 20.6% |
| 55 to 64 Years | 37 | 11.7% |
| 65 to 74 Years | 78 | 24.7% |
| 75 to 84 Years | 40 | 12.7% |
| 85 Years and Over | 22 | 7.0% |
| Total | 316 | 100.0% |
Housing Finances in Motley
Median Income by Occupancy in Motley
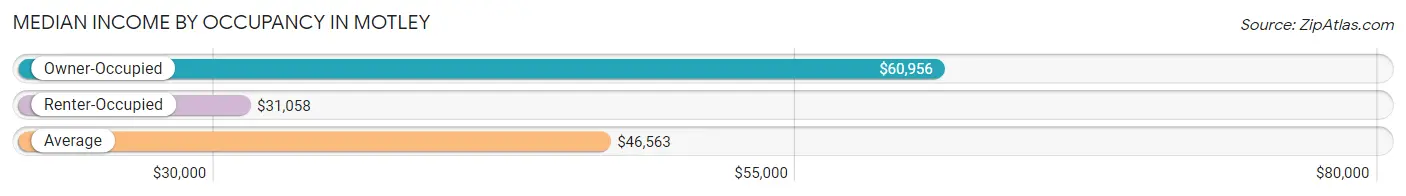
| Occupancy Type | # Households | Median Income |
| Owner-Occupied | 189 (59.8%) | $60,956 |
| Renter-Occupied | 127 (40.2%) | $31,058 |
| Average | 316 (100.0%) | $46,563 |
Occupancy by Householder Income Bracket in Motley
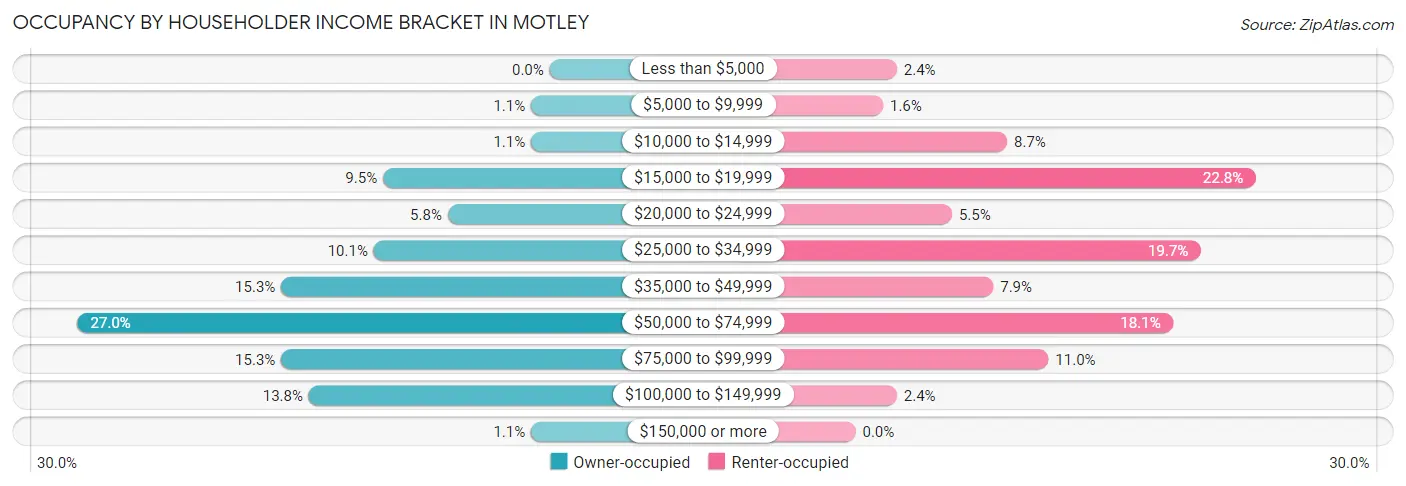
| Income Bracket | Owner-occupied | Renter-occupied |
| Less than $5,000 | 0 (0.0%) | 3 (2.4%) |
| $5,000 to $9,999 | 2 (1.1%) | 2 (1.6%) |
| $10,000 to $14,999 | 2 (1.1%) | 11 (8.7%) |
| $15,000 to $19,999 | 18 (9.5%) | 29 (22.8%) |
| $20,000 to $24,999 | 11 (5.8%) | 7 (5.5%) |
| $25,000 to $34,999 | 19 (10.1%) | 25 (19.7%) |
| $35,000 to $49,999 | 29 (15.3%) | 10 (7.9%) |
| $50,000 to $74,999 | 51 (27.0%) | 23 (18.1%) |
| $75,000 to $99,999 | 29 (15.3%) | 14 (11.0%) |
| $100,000 to $149,999 | 26 (13.8%) | 3 (2.4%) |
| $150,000 or more | 2 (1.1%) | 0 (0.0%) |
| Total | 189 (100.0%) | 127 (100.0%) |
Monthly Housing Cost Tiers in Motley
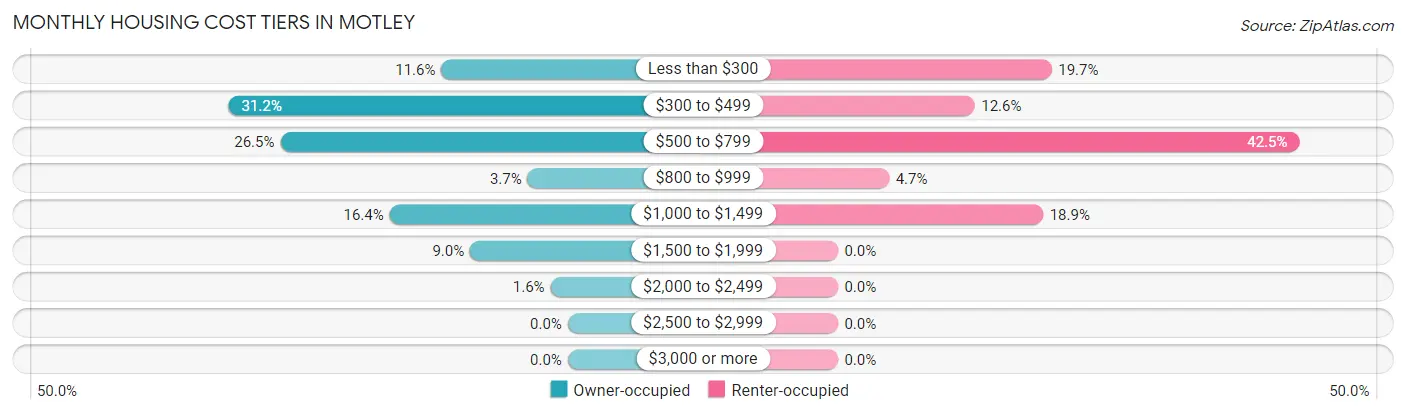
| Monthly Cost | Owner-occupied | Renter-occupied |
| Less than $300 | 22 (11.6%) | 25 (19.7%) |
| $300 to $499 | 59 (31.2%) | 16 (12.6%) |
| $500 to $799 | 50 (26.5%) | 54 (42.5%) |
| $800 to $999 | 7 (3.7%) | 6 (4.7%) |
| $1,000 to $1,499 | 31 (16.4%) | 24 (18.9%) |
| $1,500 to $1,999 | 17 (9.0%) | 0 (0.0%) |
| $2,000 to $2,499 | 3 (1.6%) | 0 (0.0%) |
| $2,500 to $2,999 | 0 (0.0%) | 0 (0.0%) |
| $3,000 or more | 0 (0.0%) | 0 (0.0%) |
| Total | 189 (100.0%) | 127 (100.0%) |
Physical Housing Characteristics in Motley
Housing Structures in Motley
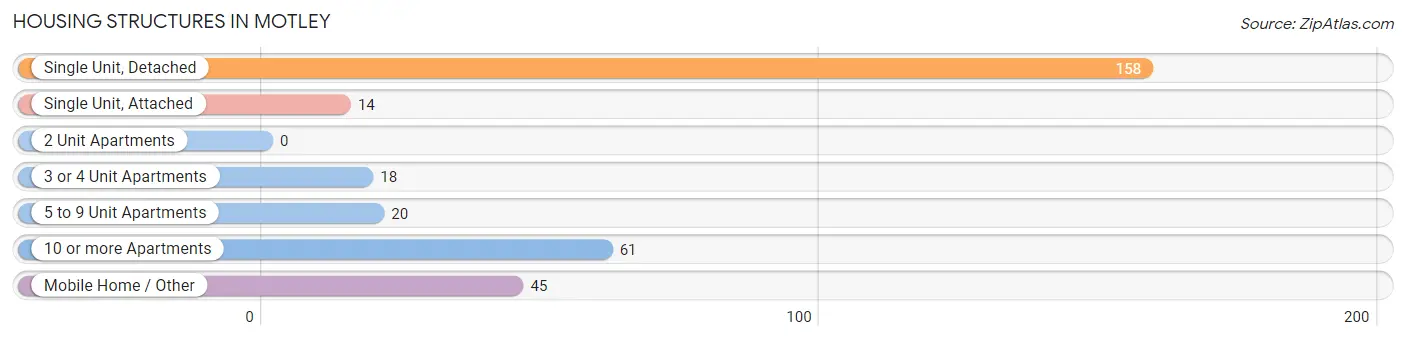
| Structure Type | # Housing Units | % Housing Units |
| Single Unit, Detached | 158 | 50.0% |
| Single Unit, Attached | 14 | 4.4% |
| 2 Unit Apartments | 0 | 0.0% |
| 3 or 4 Unit Apartments | 18 | 5.7% |
| 5 to 9 Unit Apartments | 20 | 6.3% |
| 10 or more Apartments | 61 | 19.3% |
| Mobile Home / Other | 45 | 14.2% |
| Total | 316 | 100.0% |
Housing Structures by Occupancy in Motley
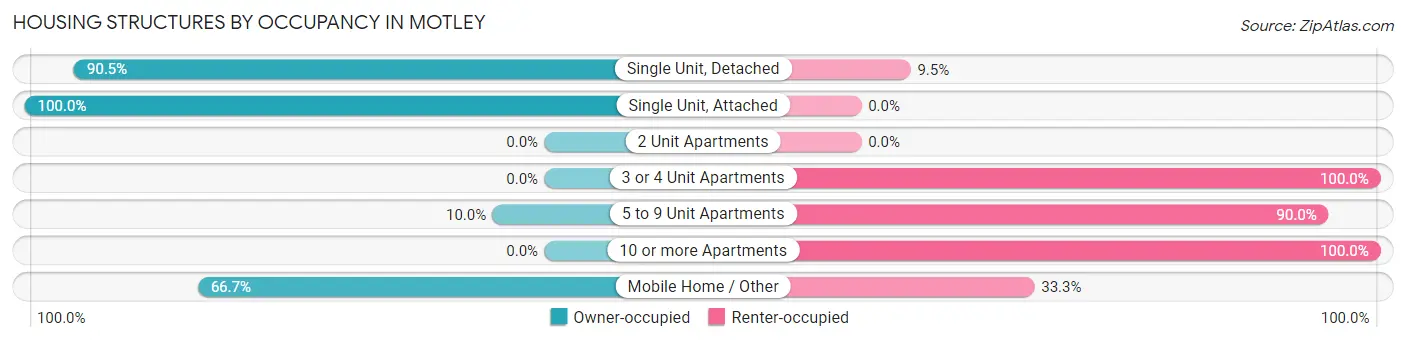
| Structure Type | Owner-occupied | Renter-occupied |
| Single Unit, Detached | 143 (90.5%) | 15 (9.5%) |
| Single Unit, Attached | 14 (100.0%) | 0 (0.0%) |
| 2 Unit Apartments | 0 (0.0%) | 0 (0.0%) |
| 3 or 4 Unit Apartments | 0 (0.0%) | 18 (100.0%) |
| 5 to 9 Unit Apartments | 2 (10.0%) | 18 (90.0%) |
| 10 or more Apartments | 0 (0.0%) | 61 (100.0%) |
| Mobile Home / Other | 30 (66.7%) | 15 (33.3%) |
| Total | 189 (59.8%) | 127 (40.2%) |
Housing Structures by Number of Rooms in Motley
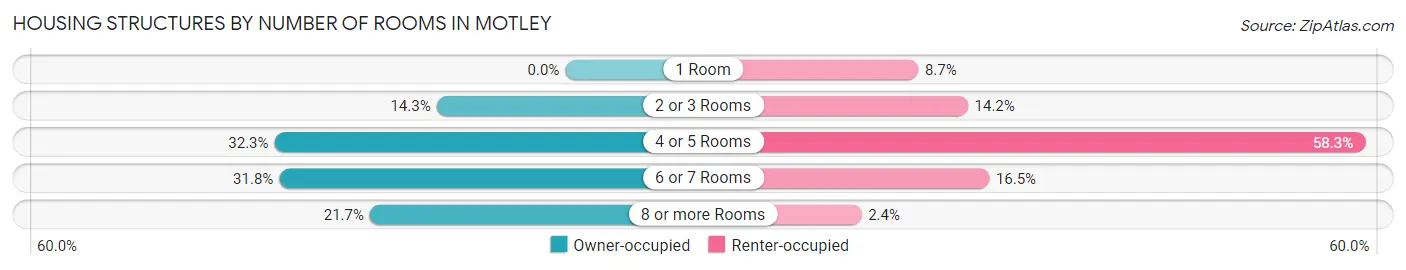
| Number of Rooms | Owner-occupied | Renter-occupied |
| 1 Room | 0 (0.0%) | 11 (8.7%) |
| 2 or 3 Rooms | 27 (14.3%) | 18 (14.2%) |
| 4 or 5 Rooms | 61 (32.3%) | 74 (58.3%) |
| 6 or 7 Rooms | 60 (31.8%) | 21 (16.5%) |
| 8 or more Rooms | 41 (21.7%) | 3 (2.4%) |
| Total | 189 (100.0%) | 127 (100.0%) |
Housing Structure by Heating Type in Motley
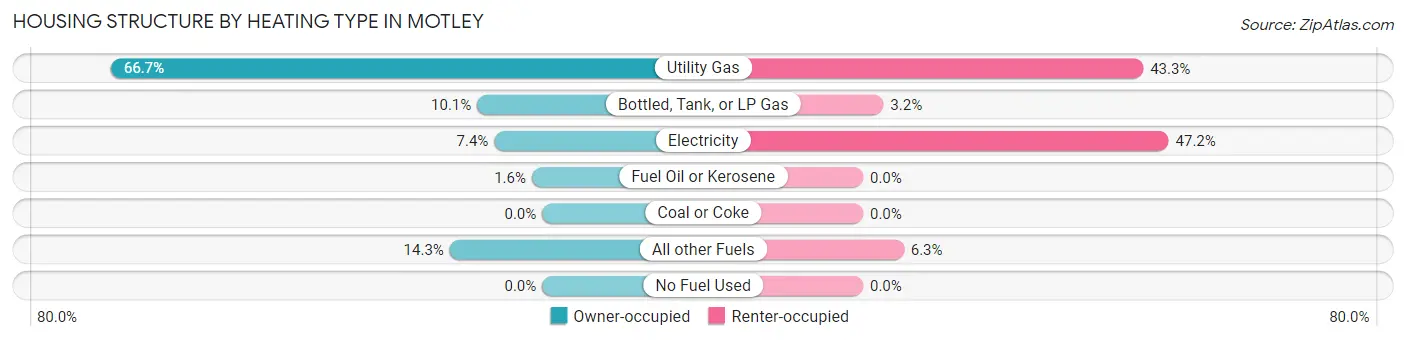
| Heating Type | Owner-occupied | Renter-occupied |
| Utility Gas | 126 (66.7%) | 55 (43.3%) |
| Bottled, Tank, or LP Gas | 19 (10.1%) | 4 (3.2%) |
| Electricity | 14 (7.4%) | 60 (47.2%) |
| Fuel Oil or Kerosene | 3 (1.6%) | 0 (0.0%) |
| Coal or Coke | 0 (0.0%) | 0 (0.0%) |
| All other Fuels | 27 (14.3%) | 8 (6.3%) |
| No Fuel Used | 0 (0.0%) | 0 (0.0%) |
| Total | 189 (100.0%) | 127 (100.0%) |
Household Vehicle Usage in Motley
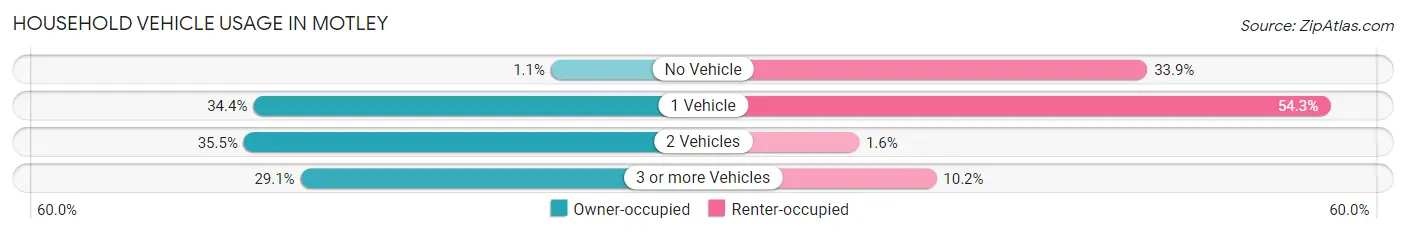
| Vehicles per Household | Owner-occupied | Renter-occupied |
| No Vehicle | 2 (1.1%) | 43 (33.9%) |
| 1 Vehicle | 65 (34.4%) | 69 (54.3%) |
| 2 Vehicles | 67 (35.4%) | 2 (1.6%) |
| 3 or more Vehicles | 55 (29.1%) | 13 (10.2%) |
| Total | 189 (100.0%) | 127 (100.0%) |
Real Estate & Mortgages in Motley
Real Estate and Mortgage Overview in Motley
| Characteristic | Without Mortgage | With Mortgage |
| Housing Units | 94 | 95 |
| Median Property Value | $128,600 | $142,400 |
| Median Household Income | $40,000 | $0 |
| Monthly Housing Costs | $354 | $0 |
| Real Estate Taxes | $1,050 | $0 |
Property Value by Mortgage Status in Motley
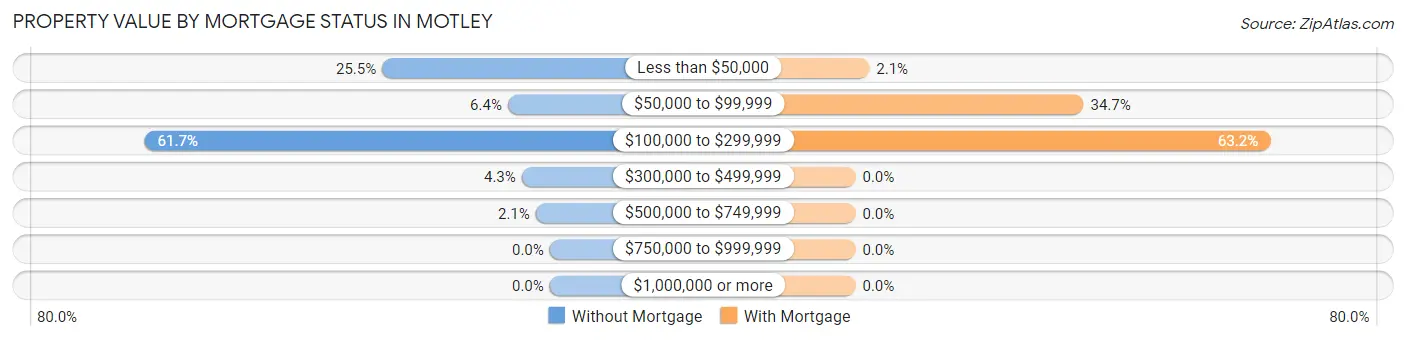
| Property Value | Without Mortgage | With Mortgage |
| Less than $50,000 | 24 (25.5%) | 2 (2.1%) |
| $50,000 to $99,999 | 6 (6.4%) | 33 (34.7%) |
| $100,000 to $299,999 | 58 (61.7%) | 60 (63.2%) |
| $300,000 to $499,999 | 4 (4.3%) | 0 (0.0%) |
| $500,000 to $749,999 | 2 (2.1%) | 0 (0.0%) |
| $750,000 to $999,999 | 0 (0.0%) | 0 (0.0%) |
| $1,000,000 or more | 0 (0.0%) | 0 (0.0%) |
| Total | 94 (100.0%) | 95 (100.0%) |
Household Income by Mortgage Status in Motley
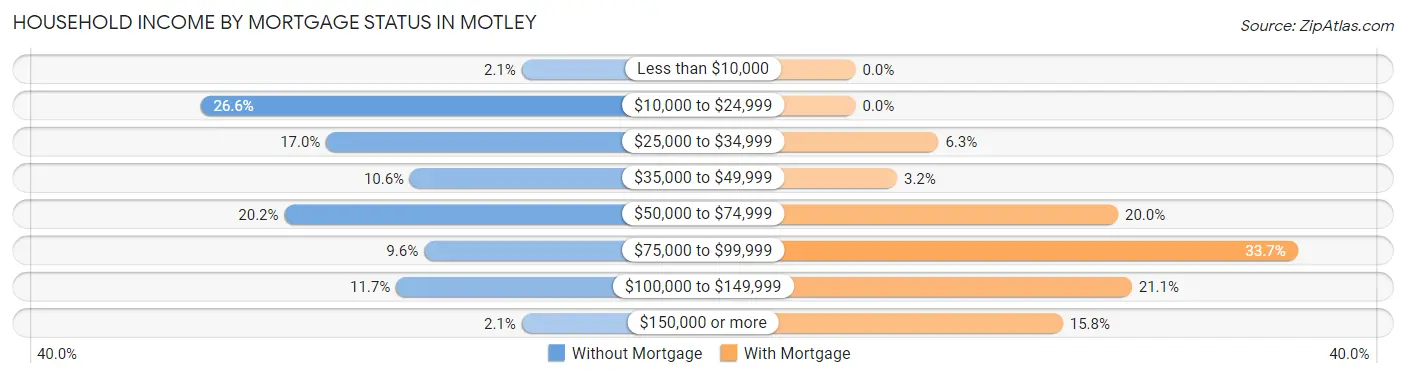
| Household Income | Without Mortgage | With Mortgage |
| Less than $10,000 | 2 (2.1%) | 0 (0.0%) |
| $10,000 to $24,999 | 25 (26.6%) | 0 (0.0%) |
| $25,000 to $34,999 | 16 (17.0%) | 6 (6.3%) |
| $35,000 to $49,999 | 10 (10.6%) | 3 (3.2%) |
| $50,000 to $74,999 | 19 (20.2%) | 19 (20.0%) |
| $75,000 to $99,999 | 9 (9.6%) | 32 (33.7%) |
| $100,000 to $149,999 | 11 (11.7%) | 20 (21.0%) |
| $150,000 or more | 2 (2.1%) | 15 (15.8%) |
| Total | 94 (100.0%) | 95 (100.0%) |
Property Value to Household Income Ratio in Motley
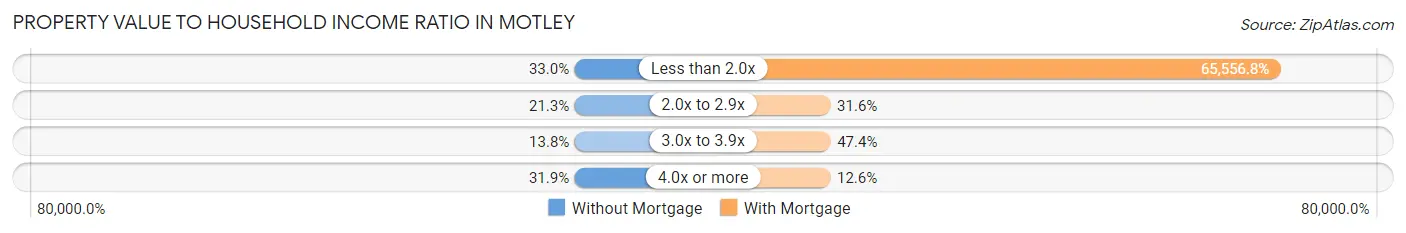
| Value-to-Income Ratio | Without Mortgage | With Mortgage |
| Less than 2.0x | 31 (33.0%) | 62,279 (65,556.8%) |
| 2.0x to 2.9x | 20 (21.3%) | 30 (31.6%) |
| 3.0x to 3.9x | 13 (13.8%) | 45 (47.4%) |
| 4.0x or more | 30 (31.9%) | 12 (12.6%) |
| Total | 94 (100.0%) | 95 (100.0%) |
Real Estate Taxes by Mortgage Status in Motley
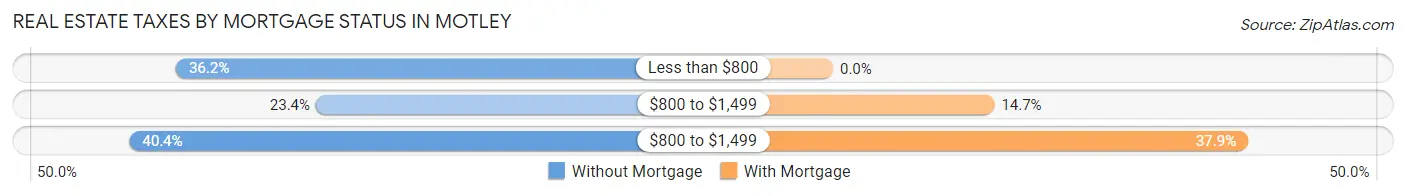
| Property Taxes | Without Mortgage | With Mortgage |
| Less than $800 | 34 (36.2%) | 0 (0.0%) |
| $800 to $1,499 | 22 (23.4%) | 14 (14.7%) |
| $800 to $1,499 | 38 (40.4%) | 36 (37.9%) |
| Total | 94 (100.0%) | 95 (100.0%) |
Health & Disability in Motley
Health Insurance Coverage by Age in Motley
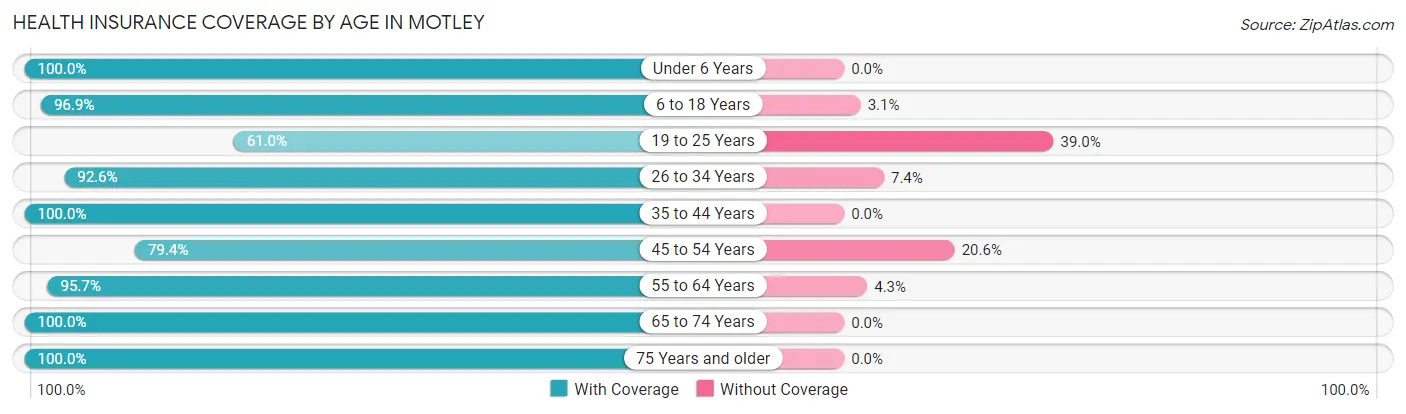
| Age Bracket | With Coverage | Without Coverage |
| Under 6 Years | 31 (100.0%) | 0 (0.0%) |
| 6 to 18 Years | 95 (96.9%) | 3 (3.1%) |
| 19 to 25 Years | 25 (61.0%) | 16 (39.0%) |
| 26 to 34 Years | 50 (92.6%) | 4 (7.4%) |
| 35 to 44 Years | 45 (100.0%) | 0 (0.0%) |
| 45 to 54 Years | 81 (79.4%) | 21 (20.6%) |
| 55 to 64 Years | 67 (95.7%) | 3 (4.3%) |
| 65 to 74 Years | 110 (100.0%) | 0 (0.0%) |
| 75 Years and older | 92 (100.0%) | 0 (0.0%) |
| Total | 596 (92.7%) | 47 (7.3%) |
Health Insurance Coverage by Citizenship Status in Motley
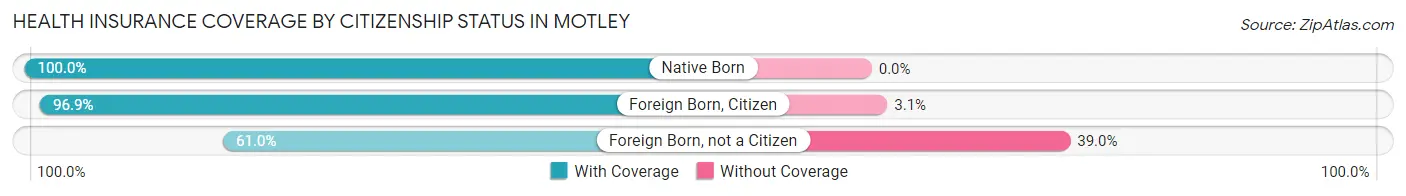
| Citizenship Status | With Coverage | Without Coverage |
| Native Born | 31 (100.0%) | 0 (0.0%) |
| Foreign Born, Citizen | 95 (96.9%) | 3 (3.1%) |
| Foreign Born, not a Citizen | 25 (61.0%) | 16 (39.0%) |
Health Insurance Coverage by Household Income in Motley
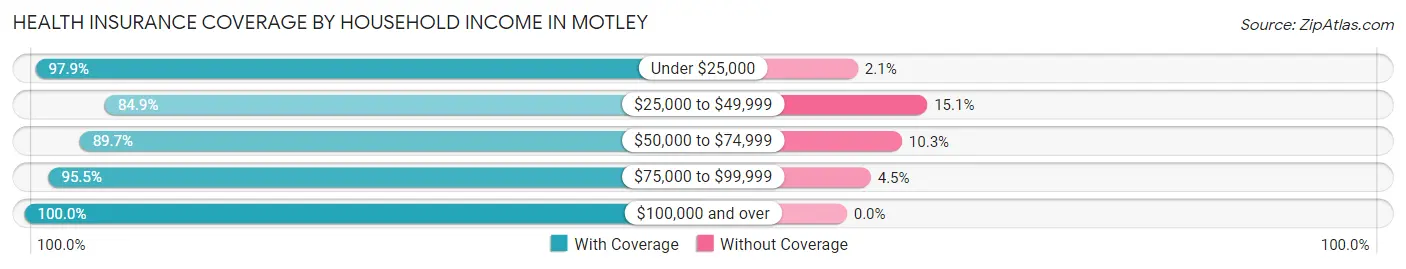
| Household Income | With Coverage | Without Coverage |
| Under $25,000 | 94 (97.9%) | 2 (2.1%) |
| $25,000 to $49,999 | 124 (84.9%) | 22 (15.1%) |
| $50,000 to $74,999 | 165 (89.7%) | 19 (10.3%) |
| $75,000 to $99,999 | 85 (95.5%) | 4 (4.5%) |
| $100,000 and over | 128 (100.0%) | 0 (0.0%) |
Public vs Private Health Insurance Coverage by Age in Motley
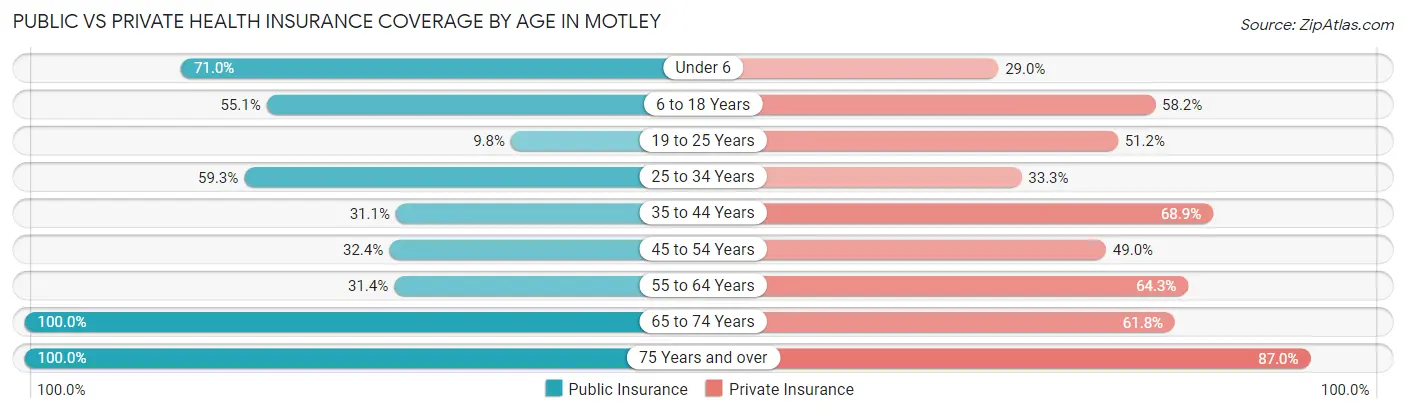
| Age Bracket | Public Insurance | Private Insurance |
| Under 6 | 22 (71.0%) | 9 (29.0%) |
| 6 to 18 Years | 54 (55.1%) | 57 (58.2%) |
| 19 to 25 Years | 4 (9.8%) | 21 (51.2%) |
| 25 to 34 Years | 32 (59.3%) | 18 (33.3%) |
| 35 to 44 Years | 14 (31.1%) | 31 (68.9%) |
| 45 to 54 Years | 33 (32.4%) | 50 (49.0%) |
| 55 to 64 Years | 22 (31.4%) | 45 (64.3%) |
| 65 to 74 Years | 110 (100.0%) | 68 (61.8%) |
| 75 Years and over | 92 (100.0%) | 80 (87.0%) |
| Total | 383 (59.6%) | 379 (58.9%) |
Disability Status by Sex by Age in Motley
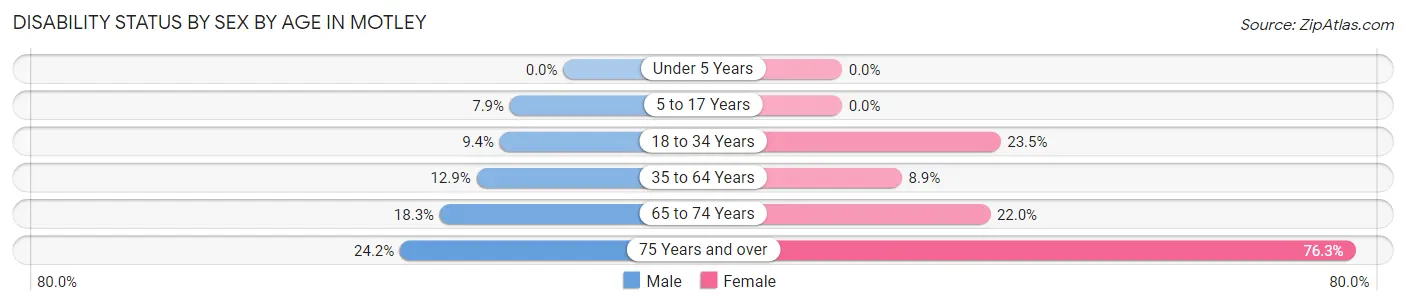
| Age Bracket | Male | Female |
| Under 5 Years | 0 (0.0%) | 0 (0.0%) |
| 5 to 17 Years | 5 (7.9%) | 0 (0.0%) |
| 18 to 34 Years | 5 (9.4%) | 12 (23.5%) |
| 35 to 64 Years | 12 (12.9%) | 11 (8.9%) |
| 65 to 74 Years | 11 (18.3%) | 11 (22.0%) |
| 75 Years and over | 8 (24.2%) | 45 (76.3%) |
Disability Class by Sex by Age in Motley
Disability Class: Hearing Difficulty
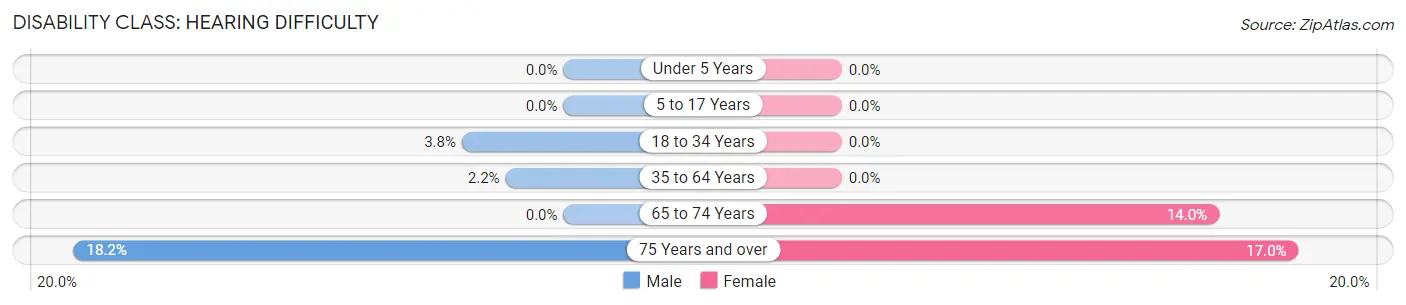
| Age Bracket | Male | Female |
| Under 5 Years | 0 (0.0%) | 0 (0.0%) |
| 5 to 17 Years | 0 (0.0%) | 0 (0.0%) |
| 18 to 34 Years | 2 (3.8%) | 0 (0.0%) |
| 35 to 64 Years | 2 (2.1%) | 0 (0.0%) |
| 65 to 74 Years | 0 (0.0%) | 7 (14.0%) |
| 75 Years and over | 6 (18.2%) | 10 (17.0%) |
Disability Class: Vision Difficulty
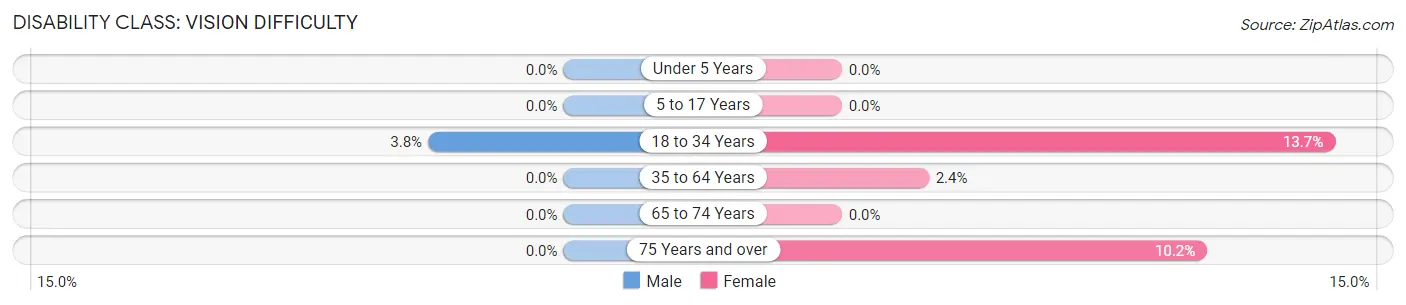
| Age Bracket | Male | Female |
| Under 5 Years | 0 (0.0%) | 0 (0.0%) |
| 5 to 17 Years | 0 (0.0%) | 0 (0.0%) |
| 18 to 34 Years | 2 (3.8%) | 7 (13.7%) |
| 35 to 64 Years | 0 (0.0%) | 3 (2.4%) |
| 65 to 74 Years | 0 (0.0%) | 0 (0.0%) |
| 75 Years and over | 0 (0.0%) | 6 (10.2%) |
Disability Class: Cognitive Difficulty
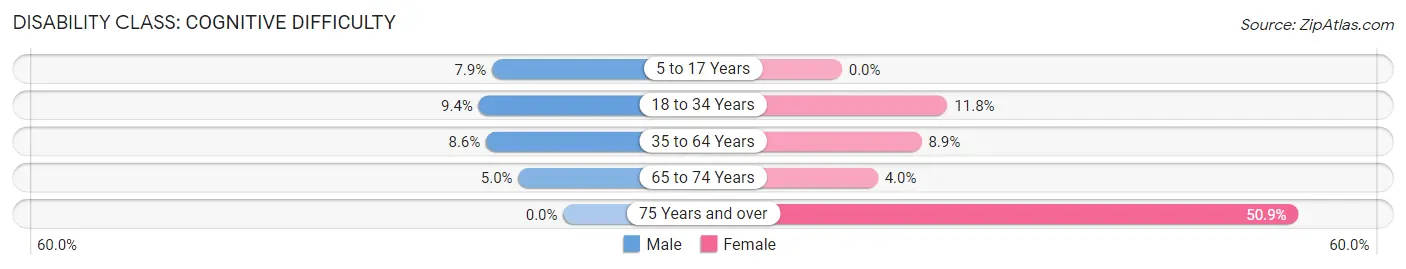
| Age Bracket | Male | Female |
| 5 to 17 Years | 5 (7.9%) | 0 (0.0%) |
| 18 to 34 Years | 5 (9.4%) | 6 (11.8%) |
| 35 to 64 Years | 8 (8.6%) | 11 (8.9%) |
| 65 to 74 Years | 3 (5.0%) | 2 (4.0%) |
| 75 Years and over | 0 (0.0%) | 30 (50.8%) |
Disability Class: Ambulatory Difficulty
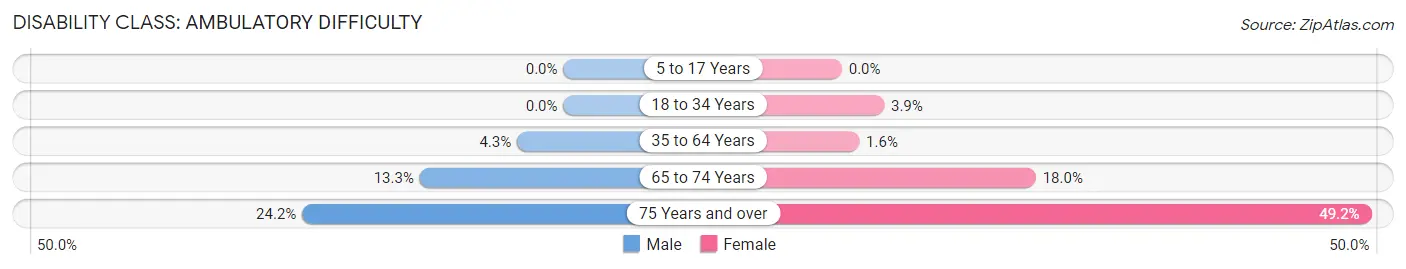
| Age Bracket | Male | Female |
| 5 to 17 Years | 0 (0.0%) | 0 (0.0%) |
| 18 to 34 Years | 0 (0.0%) | 2 (3.9%) |
| 35 to 64 Years | 4 (4.3%) | 2 (1.6%) |
| 65 to 74 Years | 8 (13.3%) | 9 (18.0%) |
| 75 Years and over | 8 (24.2%) | 29 (49.1%) |
Disability Class: Self-Care Difficulty
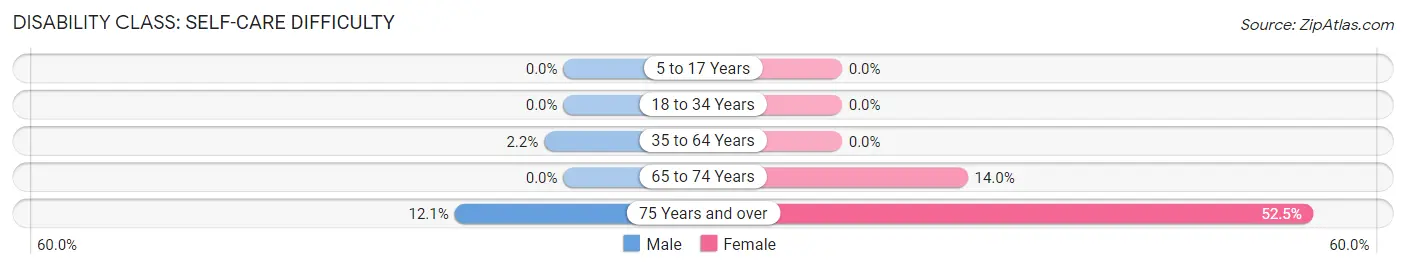
| Age Bracket | Male | Female |
| 5 to 17 Years | 0 (0.0%) | 0 (0.0%) |
| 18 to 34 Years | 0 (0.0%) | 0 (0.0%) |
| 35 to 64 Years | 2 (2.1%) | 0 (0.0%) |
| 65 to 74 Years | 0 (0.0%) | 7 (14.0%) |
| 75 Years and over | 4 (12.1%) | 31 (52.5%) |
Technology Access in Motley
Computing Device Access in Motley
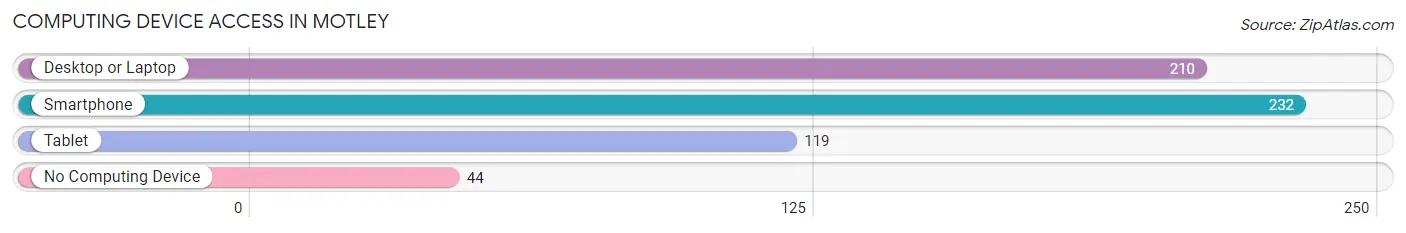
| Device Type | # Households | % Households |
| Desktop or Laptop | 210 | 66.5% |
| Smartphone | 232 | 73.4% |
| Tablet | 119 | 37.7% |
| No Computing Device | 44 | 13.9% |
| Total | 316 | 100.0% |
Internet Access in Motley
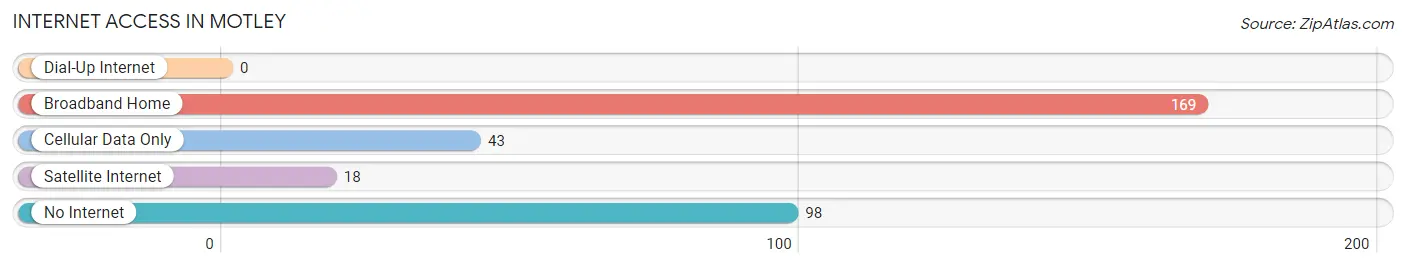
| Internet Type | # Households | % Households |
| Dial-Up Internet | 0 | 0.0% |
| Broadband Home | 169 | 53.5% |
| Cellular Data Only | 43 | 13.6% |
| Satellite Internet | 18 | 5.7% |
| No Internet | 98 | 31.0% |
| Total | 316 | 100.0% |
Motley Summary
MOTLEY MINNESOTA
Motley, Minnesota is a small city located in Cass County, in the north-central part of the state. It is situated on the banks of the Pine River, and is surrounded by the Chippewa National Forest. The city has a population of approximately 1,000 people, and is part of the Brainerd Micropolitan Statistical Area.
History
The area that is now Motley was first settled in the late 1800s by a group of Scandinavian immigrants. The town was originally known as “Pine River”, but was later renamed “Motley” after a local settler, John Motley. The town was officially incorporated in 1902.
In the early 1900s, Motley was a thriving logging and farming community. The town was home to several sawmills, a flour mill, and a creamery. The town also had a hotel, a bank, and several stores.
In the 1950s, the logging industry began to decline, and the town’s economy shifted to tourism. The town is now home to several resorts, campgrounds, and other recreational facilities.
Geography
Motley is located in Cass County, in the north-central part of Minnesota. It is situated on the banks of the Pine River, and is surrounded by the Chippewa National Forest. The city has a total area of 1.2 square miles, all of which is land.
The climate in Motley is classified as humid continental, with cold winters and warm summers. The average annual temperature is 37°F, and the average annual precipitation is 28 inches.
Economy
The economy of Motley is largely based on tourism. The town is home to several resorts, campgrounds, and other recreational facilities. The town also has a few small businesses, including a grocery store, a hardware store, and a restaurant.
The town is also home to a few manufacturing companies, including a wood products company and a metal fabrication company.
Demographics
As of the 2010 census, the population of Motley was 1,000 people. The racial makeup of the town was 97.2% White, 0.7% Native American, 0.3% Asian, 0.2% from other races, and 1.6% from two or more races.
The median household income in Motley was $37,500, and the median family income was $45,000. The per capita income was $19,000. About 11.2% of the population was below the poverty line.
Motley is served by the Cass County School District. The town has one elementary school, one middle school, and one high school. The town also has a public library.
Common Questions
What is Per Capita Income in Motley?
Per Capita income in Motley is $26,664.
What is the Median Family Income in Motley?
Median Family Income in Motley is $61,471.
What is the Median Household income in Motley?
Median Household Income in Motley is $46,563.
What is Income or Wage Gap in Motley?
Income or Wage Gap in Motley is 25.0%.
Women in Motley earn 75.0 cents for every dollar earned by a man.
What is Inequality or Gini Index in Motley?
Inequality or Gini Index in Motley is 0.35.
What is the Total Population of Motley?
Total Population of Motley is 647.
What is the Total Male Population of Motley?
Total Male Population of Motley is 317.
What is the Total Female Population of Motley?
Total Female Population of Motley is 330.
What is the Ratio of Males per 100 Females in Motley?
There are 96.06 Males per 100 Females in Motley.
What is the Ratio of Females per 100 Males in Motley?
There are 104.10 Females per 100 Males in Motley.
What is the Median Population Age in Motley?
Median Population Age in Motley is 50.5 Years.
What is the Average Family Size in Motley
Average Family Size in Motley is 2.8 People.
What is the Average Household Size in Motley
Average Household Size in Motley is 2.0 People.
How Large is the Labor Force in Motley?
There are 314 People in the Labor Forcein in Motley.
What is the Percentage of People in the Labor Force in Motley?
56.9% of People are in the Labor Force in Motley.
What is the Unemployment Rate in Motley?
Unemployment Rate in Motley is 4.8%.