Milaca, MN Map & Demographics
Milaca Map
Milaca Overview
$33,236
PER CAPITA INCOME
$65,807
AVG FAMILY INCOME
$46,218
AVG HOUSEHOLD INCOME
33.3%
WAGE / INCOME GAP [ % ]
66.7¢/ $1
WAGE / INCOME GAP [ $ ]
$5,593
FAMILY INCOME DEFICIT
0.46
INEQUALITY / GINI INDEX
3,031
TOTAL POPULATION
1,487
MALE POPULATION
1,544
FEMALE POPULATION
96.31
MALES / 100 FEMALES
103.83
FEMALES / 100 MALES
43.5
MEDIAN AGE
2.7
AVG FAMILY SIZE
1.9
AVG HOUSEHOLD SIZE
1,575
LABOR FORCE [ PEOPLE ]
62.9%
PERCENT IN LABOR FORCE
0.9%
UNEMPLOYMENT RATE
Milaca Zip Codes
Milaca Area Codes
Income in Milaca
Income Overview in Milaca
Per Capita Income in Milaca is $33,236, while median incomes of families and households are $65,807 and $46,218 respectively.
| Characteristic | Number | Measure |
| Per Capita Income | 3,031 | $33,236 |
| Median Family Income | 709 | $65,807 |
| Mean Family Income | 709 | $71,930 |
| Median Household Income | 1,533 | $46,218 |
| Mean Household Income | 1,533 | $63,363 |
| Income Deficit | 709 | $5,593 |
| Wage / Income Gap (%) | 3,031 | 33.34% |
| Wage / Income Gap ($) | 3,031 | 66.66¢ per $1 |
| Gini / Inequality Index | 3,031 | 0.46 |
Earnings by Sex in Milaca
Average Earnings in Milaca are $28,972, $36,675 for men and $24,449 for women, a difference of 33.3%.
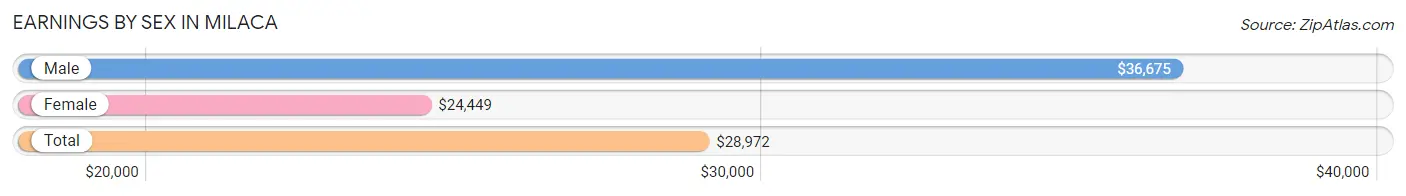
| Sex | Number | Average Earnings |
| Male | 939 (54.1%) | $36,675 |
| Female | 795 (45.9%) | $24,449 |
| Total | 1,734 (100.0%) | $28,972 |
Earnings by Sex by Income Bracket in Milaca
The most common earnings brackets in Milaca are $2,499 or less for men (145 | 15.4%) and $25,000 to $29,999 for women (111 | 14.0%).
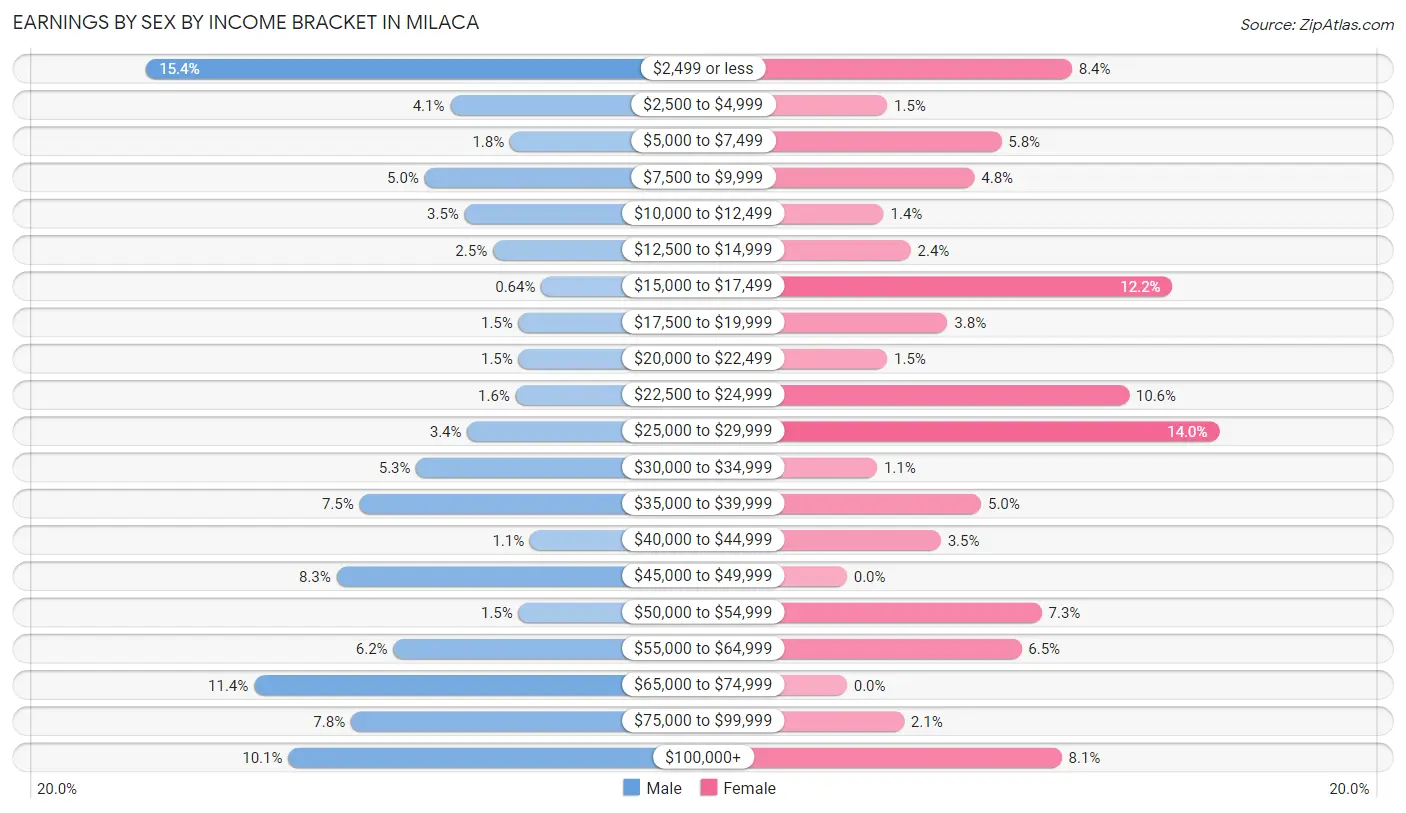
| Income | Male | Female |
| $2,499 or less | 145 (15.4%) | 67 (8.4%) |
| $2,500 to $4,999 | 38 (4.1%) | 12 (1.5%) |
| $5,000 to $7,499 | 17 (1.8%) | 46 (5.8%) |
| $7,500 to $9,999 | 47 (5.0%) | 38 (4.8%) |
| $10,000 to $12,499 | 33 (3.5%) | 11 (1.4%) |
| $12,500 to $14,999 | 23 (2.5%) | 19 (2.4%) |
| $15,000 to $17,499 | 6 (0.6%) | 97 (12.2%) |
| $17,500 to $19,999 | 14 (1.5%) | 30 (3.8%) |
| $20,000 to $22,499 | 14 (1.5%) | 12 (1.5%) |
| $22,500 to $24,999 | 15 (1.6%) | 84 (10.6%) |
| $25,000 to $29,999 | 32 (3.4%) | 111 (14.0%) |
| $30,000 to $34,999 | 50 (5.3%) | 9 (1.1%) |
| $35,000 to $39,999 | 70 (7.4%) | 40 (5.0%) |
| $40,000 to $44,999 | 10 (1.1%) | 28 (3.5%) |
| $45,000 to $49,999 | 78 (8.3%) | 0 (0.0%) |
| $50,000 to $54,999 | 14 (1.5%) | 58 (7.3%) |
| $55,000 to $64,999 | 58 (6.2%) | 52 (6.5%) |
| $65,000 to $74,999 | 107 (11.4%) | 0 (0.0%) |
| $75,000 to $99,999 | 73 (7.8%) | 17 (2.1%) |
| $100,000+ | 95 (10.1%) | 64 (8.1%) |
| Total | 939 (100.0%) | 795 (100.0%) |
Earnings by Sex by Educational Attainment in Milaca
Average earnings in Milaca are $43,375 for men and $25,817 for women, a difference of 40.5%. Men with an educational attainment of college or associate's degree enjoy the highest average annual earnings of $70,580, while those with bachelor's degree education earn the least with $2,499. Women with an educational attainment of bachelor's degree earn the most with the average annual earnings of $103,625, while those with college or associate's degree education have the smallest earnings of $22,991.
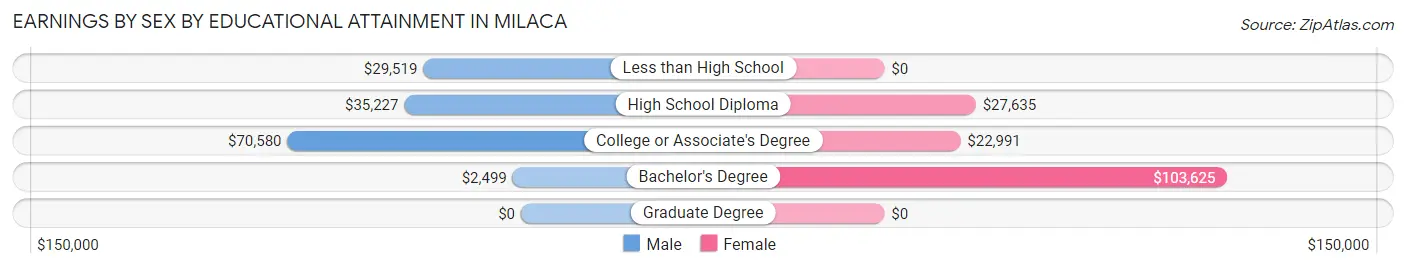
| Educational Attainment | Male Income | Female Income |
| Less than High School | $29,519 | $0 |
| High School Diploma | $35,227 | $27,635 |
| College or Associate's Degree | $70,580 | $22,991 |
| Bachelor's Degree | $2,499 | $103,625 |
| Graduate Degree | - | - |
| Total | $43,375 | $25,817 |
Family Income in Milaca
Family Income Brackets in Milaca
According to the Milaca family income data, there are 172 families falling into the $50,000 to $74,999 income range, which is the most common income bracket and makes up 24.3% of all families. Conversely, the less than $10,000 income bracket is the least frequent group with only 8 families (1.1%) belonging to this category.
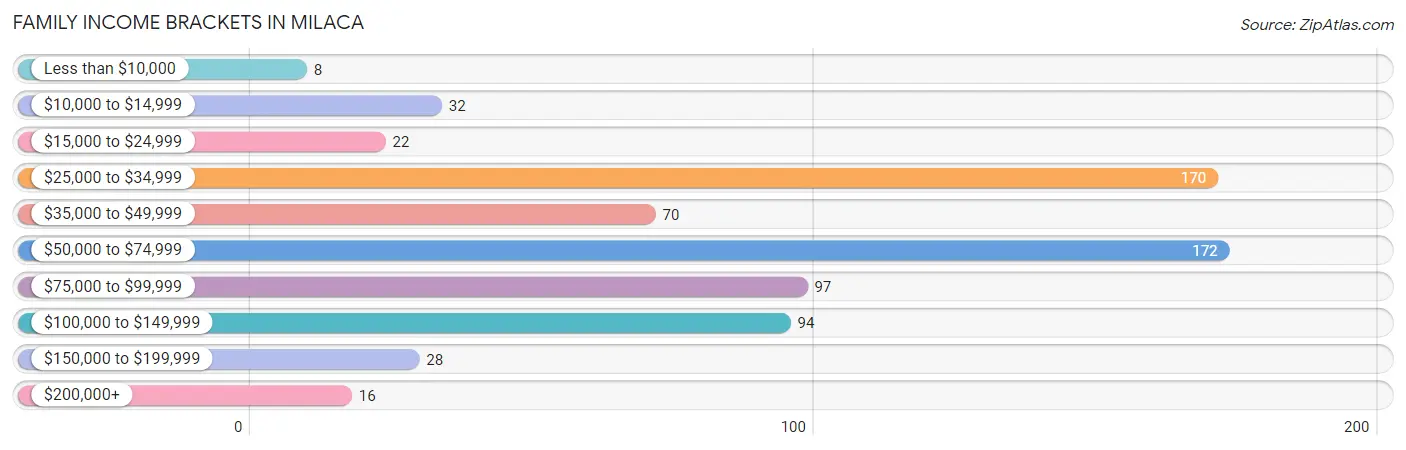
| Income Bracket | # Families | % Families |
| Less than $10,000 | 8 | 1.1% |
| $10,000 to $14,999 | 32 | 4.5% |
| $15,000 to $24,999 | 22 | 3.1% |
| $25,000 to $34,999 | 170 | 24.0% |
| $35,000 to $49,999 | 70 | 9.9% |
| $50,000 to $74,999 | 172 | 24.3% |
| $75,000 to $99,999 | 97 | 13.7% |
| $100,000 to $149,999 | 94 | 13.3% |
| $150,000 to $199,999 | 28 | 3.9% |
| $200,000+ | 16 | 2.3% |
Family Income by Famaliy Size in Milaca
2-person families (422 | 59.5%) account for the highest median family income in Milaca with $65,625 per family, while 2-person families (422 | 59.5%) have the highest median income of $32,812 per family member.
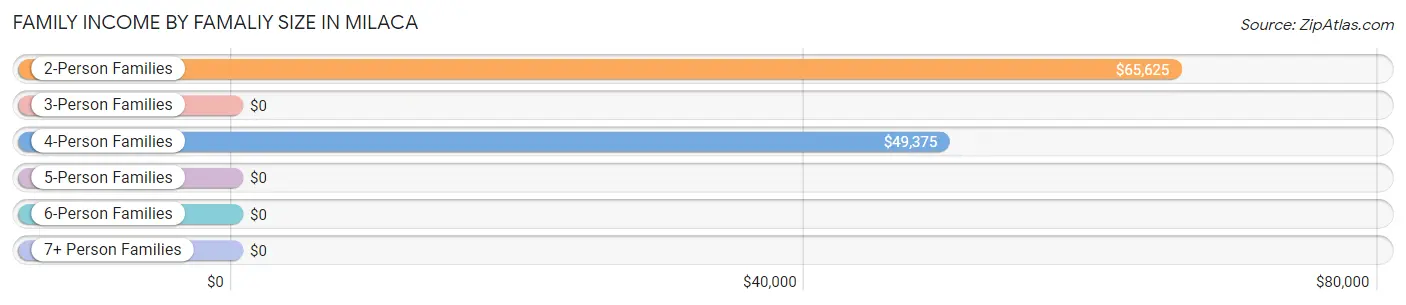
| Income Bracket | # Families | Median Income |
| 2-Person Families | 422 (59.5%) | $65,625 |
| 3-Person Families | 144 (20.3%) | $0 |
| 4-Person Families | 118 (16.6%) | $49,375 |
| 5-Person Families | 0 (0.0%) | $0 |
| 6-Person Families | 17 (2.4%) | $0 |
| 7+ Person Families | 8 (1.1%) | $0 |
| Total | 709 (100.0%) | $65,807 |
Family Income by Number of Earners in Milaca
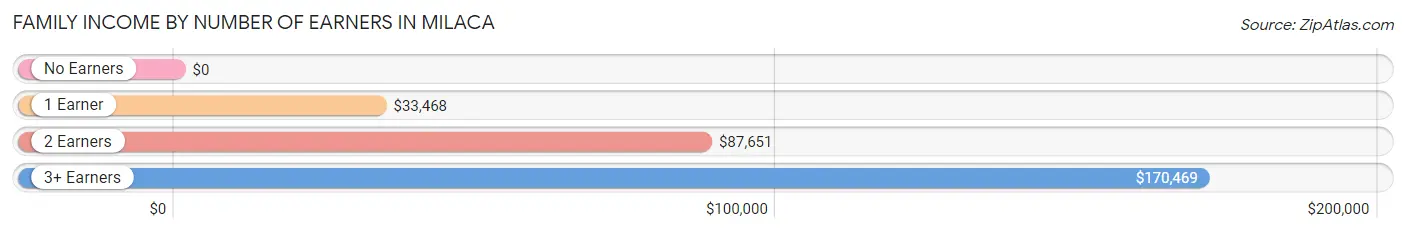
| Number of Earners | # Families | Median Income |
| No Earners | 64 (9.0%) | $0 |
| 1 Earner | 253 (35.7%) | $33,468 |
| 2 Earners | 363 (51.2%) | $87,651 |
| 3+ Earners | 29 (4.1%) | $170,469 |
| Total | 709 (100.0%) | $65,807 |
Household Income in Milaca
Household Income Brackets in Milaca
With 279 households falling in the category, the $25,000 to $34,999 income range is the most frequent in Milaca, accounting for 18.2% of all households. In contrast, only 44 households (2.9%) fall into the $200,000+ income bracket, making it the least populous group.
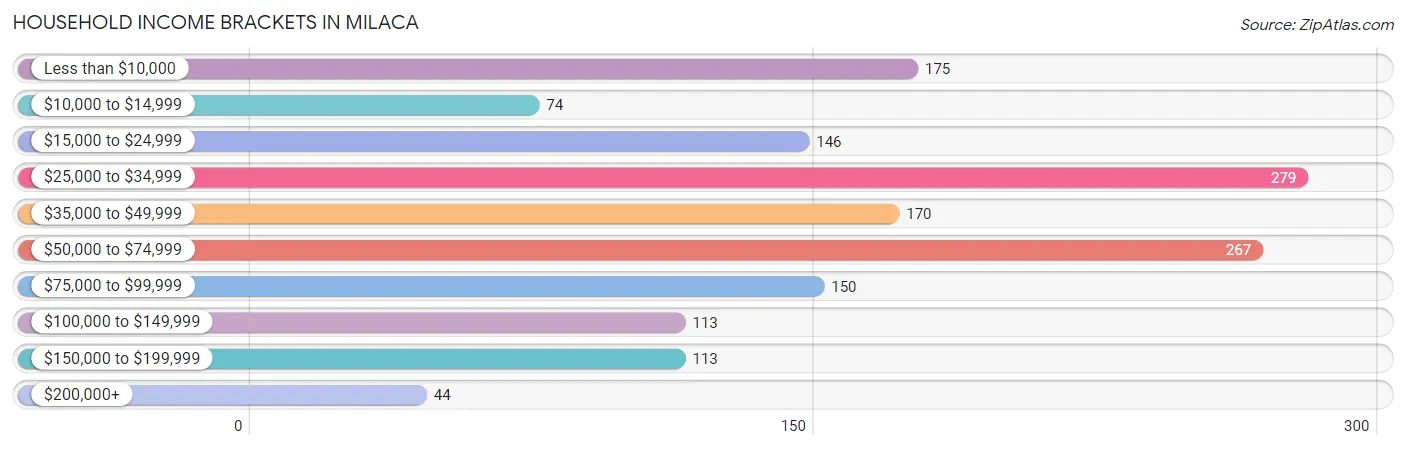
| Income Bracket | # Households | % Households |
| Less than $10,000 | 175 | 11.4% |
| $10,000 to $14,999 | 74 | 4.8% |
| $15,000 to $24,999 | 146 | 9.5% |
| $25,000 to $34,999 | 279 | 18.2% |
| $35,000 to $49,999 | 170 | 11.1% |
| $50,000 to $74,999 | 267 | 17.4% |
| $75,000 to $99,999 | 150 | 9.8% |
| $100,000 to $149,999 | 113 | 7.4% |
| $150,000 to $199,999 | 113 | 7.4% |
| $200,000+ | 44 | 2.9% |
Household Income by Householder Age in Milaca
The median household income in Milaca is $46,218, with the highest median household income of $64,000 found in the 45 to 64 years age bracket for the primary householder. A total of 504 households (32.9%) fall into this category. Meanwhile, the 15 to 24 years age bracket for the primary householder has the lowest median household income of $0, with 84 households (5.5%) in this group.
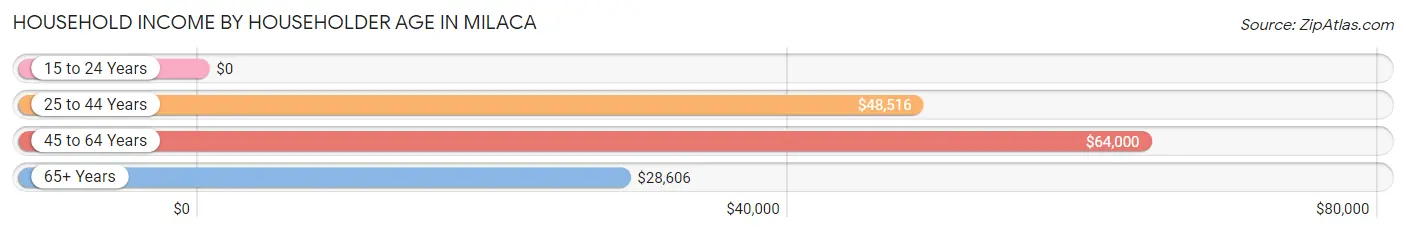
| Income Bracket | # Households | Median Income |
| 15 to 24 Years | 84 (5.5%) | $0 |
| 25 to 44 Years | 505 (32.9%) | $48,516 |
| 45 to 64 Years | 504 (32.9%) | $64,000 |
| 65+ Years | 440 (28.7%) | $28,606 |
| Total | 1,533 (100.0%) | $46,218 |
Poverty in Milaca
Income Below Poverty by Sex and Age in Milaca
With 15.2% poverty level for males and 20.2% for females among the residents of Milaca, under 5 year old males and under 5 year old females are the most vulnerable to poverty, with 55 males (50.9%) and 38 females (60.3%) in their respective age groups living below the poverty level.
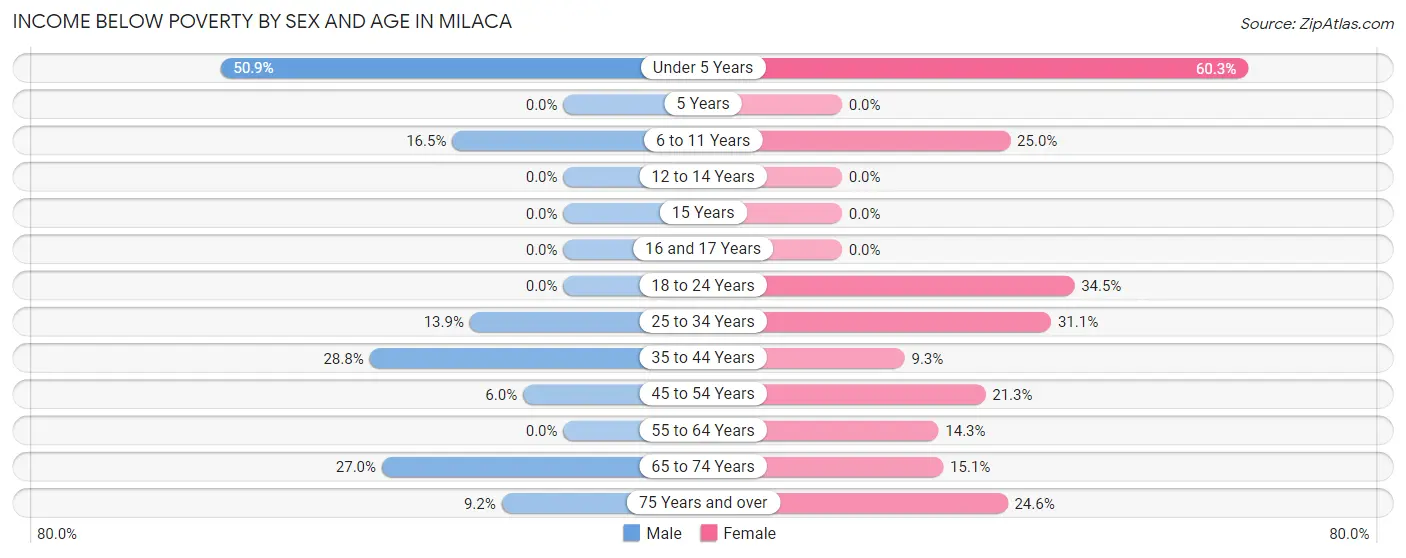
| Age Bracket | Male | Female |
| Under 5 Years | 55 (50.9%) | 38 (60.3%) |
| 5 Years | 0 (0.0%) | 0 (0.0%) |
| 6 to 11 Years | 17 (16.5%) | 14 (25.0%) |
| 12 to 14 Years | 0 (0.0%) | 0 (0.0%) |
| 15 Years | 0 (0.0%) | 0 (0.0%) |
| 16 and 17 Years | 0 (0.0%) | 0 (0.0%) |
| 18 to 24 Years | 0 (0.0%) | 49 (34.5%) |
| 25 to 34 Years | 26 (13.9%) | 50 (31.1%) |
| 35 to 44 Years | 57 (28.8%) | 15 (9.3%) |
| 45 to 54 Years | 10 (6.0%) | 39 (21.3%) |
| 55 to 64 Years | 0 (0.0%) | 36 (14.3%) |
| 65 to 74 Years | 38 (27.0%) | 28 (15.0%) |
| 75 Years and over | 9 (9.2%) | 31 (24.6%) |
| Total | 212 (15.2%) | 300 (20.2%) |
Income Above Poverty by Sex and Age in Milaca
According to the poverty statistics in Milaca, males aged 12 to 14 years and females aged 5 years are the age groups that are most secure financially, with 100.0% of males and 100.0% of females in these age groups living above the poverty line.
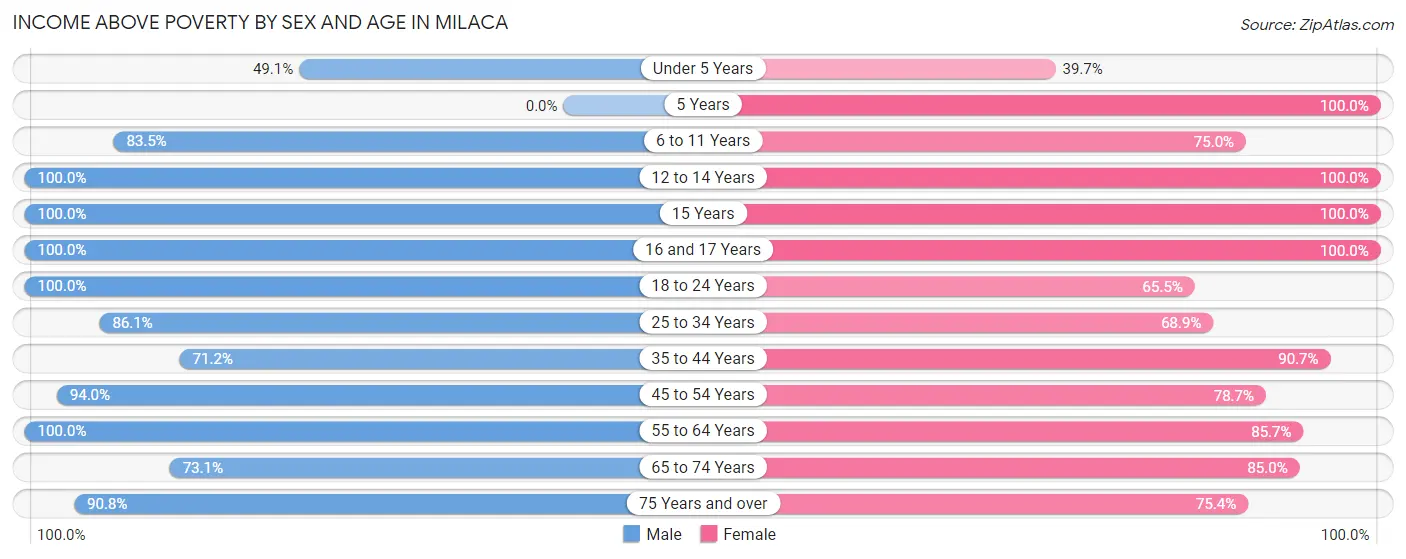
| Age Bracket | Male | Female |
| Under 5 Years | 53 (49.1%) | 25 (39.7%) |
| 5 Years | 0 (0.0%) | 17 (100.0%) |
| 6 to 11 Years | 86 (83.5%) | 42 (75.0%) |
| 12 to 14 Years | 11 (100.0%) | 99 (100.0%) |
| 15 Years | 54 (100.0%) | 16 (100.0%) |
| 16 and 17 Years | 23 (100.0%) | 21 (100.0%) |
| 18 to 24 Years | 82 (100.0%) | 93 (65.5%) |
| 25 to 34 Years | 161 (86.1%) | 111 (68.9%) |
| 35 to 44 Years | 141 (71.2%) | 146 (90.7%) |
| 45 to 54 Years | 157 (94.0%) | 144 (78.7%) |
| 55 to 64 Years | 218 (100.0%) | 215 (85.7%) |
| 65 to 74 Years | 103 (73.1%) | 158 (85.0%) |
| 75 Years and over | 89 (90.8%) | 95 (75.4%) |
| Total | 1,178 (84.8%) | 1,182 (79.8%) |
Income Below Poverty Among Married-Couple Families in Milaca
The poverty statistics for married-couple families in Milaca show that 7.0% or 34 of the total 489 families live below the poverty line. Families with 1 or 2 children have the highest poverty rate of 13.7%, comprising of 18 families. On the other hand, families with 3 or 4 children have the lowest poverty rate of 0.0%, which includes 0 families.
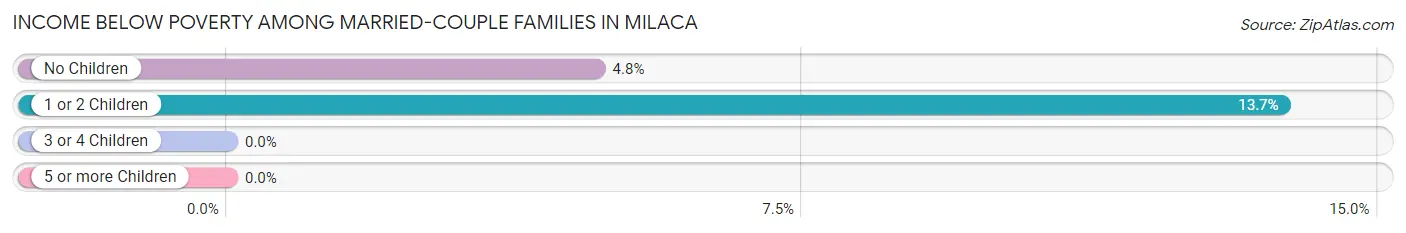
| Children | Above Poverty | Below Poverty |
| No Children | 317 (95.2%) | 16 (4.8%) |
| 1 or 2 Children | 113 (86.3%) | 18 (13.7%) |
| 3 or 4 Children | 25 (100.0%) | 0 (0.0%) |
| 5 or more Children | 0 (0.0%) | 0 (0.0%) |
| Total | 455 (93.0%) | 34 (7.0%) |
Income Below Poverty Among Single-Parent Households in Milaca
| Children | Single Father | Single Mother |
| No Children | 0 (0.0%) | 3 (9.7%) |
| 1 or 2 Children | 0 (0.0%) | 36 (26.7%) |
| 3 or 4 Children | 0 (0.0%) | 12 (100.0%) |
| 5 or more Children | 0 (0.0%) | 0 (0.0%) |
| Total | 0 (0.0%) | 51 (28.6%) |
Income Below Poverty Among Married-Couple vs Single-Parent Households in Milaca
The poverty data for Milaca shows that 34 of the married-couple family households (7.0%) and 51 of the single-parent households (23.2%) are living below the poverty level. Within the married-couple family households, those with 1 or 2 children have the highest poverty rate, with 18 households (13.7%) falling below the poverty line. Among the single-parent households, those with 3 or 4 children have the highest poverty rate, with 12 household (100.0%) living below poverty.
| Children | Married-Couple Families | Single-Parent Households |
| No Children | 16 (4.8%) | 3 (6.5%) |
| 1 or 2 Children | 18 (13.7%) | 36 (22.2%) |
| 3 or 4 Children | 0 (0.0%) | 12 (100.0%) |
| 5 or more Children | 0 (0.0%) | 0 (0.0%) |
| Total | 34 (7.0%) | 51 (23.2%) |
Race in Milaca
The most populous races in Milaca are White / Caucasian (2,798 | 92.3%), Two or more Races (128 | 4.2%), and Hispanic or Latino (87 | 2.9%).
| Race | # Population | % Population |
| Asian | 22 | 0.7% |
| Black / African American | 28 | 0.9% |
| Hawaiian / Pacific | 12 | 0.4% |
| Hispanic or Latino | 87 | 2.9% |
| Native / Alaskan | 20 | 0.7% |
| White / Caucasian | 2,798 | 92.3% |
| Two or more Races | 128 | 4.2% |
| Some other Race | 23 | 0.8% |
| Total | 3,031 | 100.0% |
Ancestry in Milaca
The most populous ancestries reported in Milaca are German (788 | 26.0%), Swedish (440 | 14.5%), Norwegian (396 | 13.1%), Irish (381 | 12.6%), and Dutch (254 | 8.4%), together accounting for 74.5% of all Milaca residents.
| Ancestry | # Population | % Population |
| African | 21 | 0.7% |
| Alaska Native | 4 | 0.1% |
| American | 124 | 4.1% |
| Carpatho Rusyn | 39 | 1.3% |
| Chippewa | 40 | 1.3% |
| Czech | 18 | 0.6% |
| Danish | 37 | 1.2% |
| Dutch | 254 | 8.4% |
| Eastern European | 9 | 0.3% |
| English | 234 | 7.7% |
| European | 56 | 1.8% |
| French | 96 | 3.2% |
| French Canadian | 25 | 0.8% |
| German | 788 | 26.0% |
| Hungarian | 17 | 0.6% |
| Irish | 381 | 12.6% |
| Italian | 46 | 1.5% |
| Liberian | 8 | 0.3% |
| Menominee | 12 | 0.4% |
| Mexican | 77 | 2.5% |
| Native Hawaiian | 12 | 0.4% |
| Norwegian | 396 | 13.1% |
| Polish | 76 | 2.5% |
| Russian | 55 | 1.8% |
| Scandinavian | 9 | 0.3% |
| Scotch-Irish | 37 | 1.2% |
| Sri Lankan | 22 | 0.7% |
| Subsaharan African | 29 | 1.0% |
| Swedish | 440 | 14.5% |
| Ukrainian | 20 | 0.7% |
| Welsh | 5 | 0.2% |
| Yugoslavian | 9 | 0.3% | View All 32 Rows |
Immigrants in Milaca
The most numerous immigrant groups reported in Milaca came from Eastern Europe (20 | 0.7%), Europe (20 | 0.7%), Ukraine (20 | 0.7%), Latin America (15 | 0.5%), and South America (15 | 0.5%), together accounting for 3.0% of all Milaca residents.
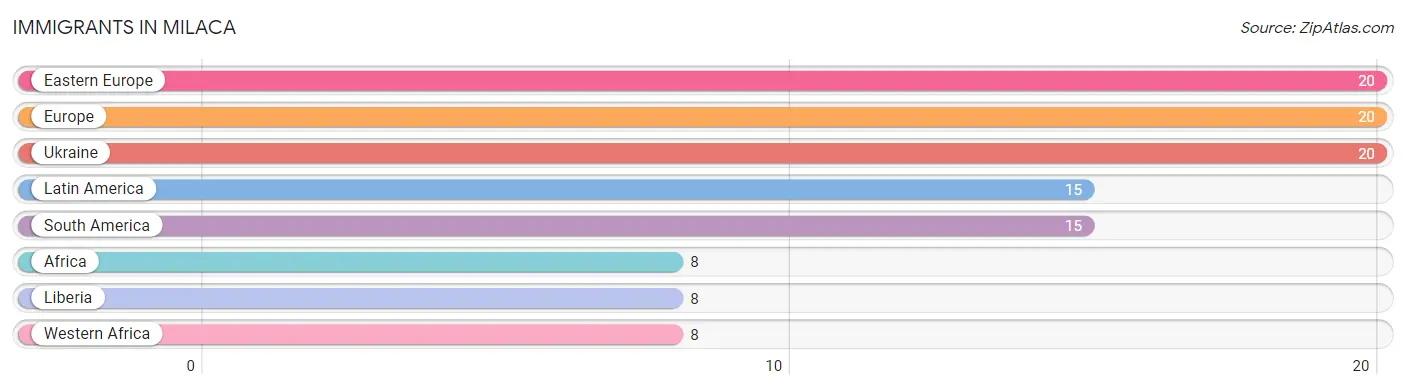
| Immigration Origin | # Population | % Population |
| Africa | 8 | 0.3% |
| Eastern Europe | 20 | 0.7% |
| Europe | 20 | 0.7% |
| Latin America | 15 | 0.5% |
| Liberia | 8 | 0.3% |
| South America | 15 | 0.5% |
| Ukraine | 20 | 0.7% |
| Western Africa | 8 | 0.3% | View All 8 Rows |
Sex and Age in Milaca
Sex and Age in Milaca
The most populous age groups in Milaca are 45 to 49 Years (149 | 10.0%) for men and 60 to 64 Years (208 | 13.5%) for women.
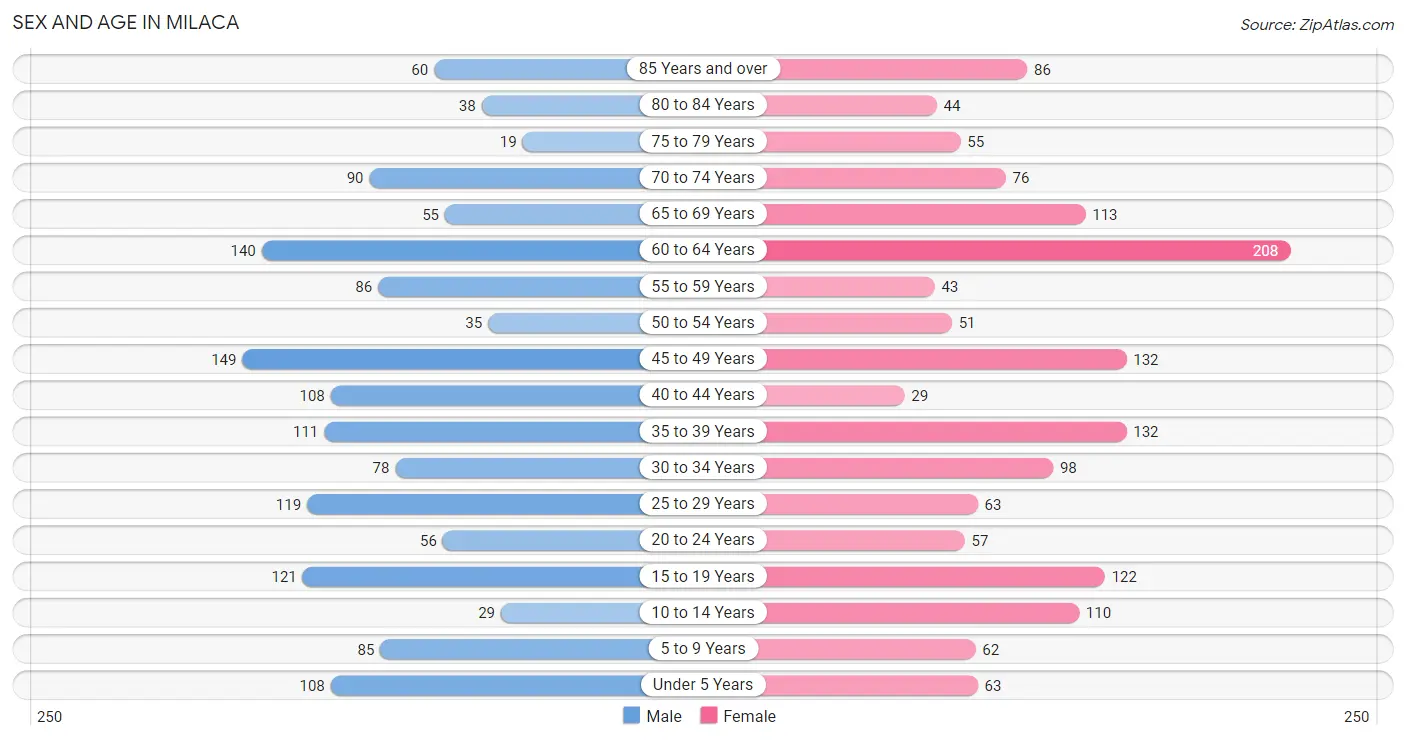
| Age Bracket | Male | Female |
| Under 5 Years | 108 (7.3%) | 63 (4.1%) |
| 5 to 9 Years | 85 (5.7%) | 62 (4.0%) |
| 10 to 14 Years | 29 (1.9%) | 110 (7.1%) |
| 15 to 19 Years | 121 (8.1%) | 122 (7.9%) |
| 20 to 24 Years | 56 (3.8%) | 57 (3.7%) |
| 25 to 29 Years | 119 (8.0%) | 63 (4.1%) |
| 30 to 34 Years | 78 (5.2%) | 98 (6.4%) |
| 35 to 39 Years | 111 (7.5%) | 132 (8.6%) |
| 40 to 44 Years | 108 (7.3%) | 29 (1.9%) |
| 45 to 49 Years | 149 (10.0%) | 132 (8.6%) |
| 50 to 54 Years | 35 (2.4%) | 51 (3.3%) |
| 55 to 59 Years | 86 (5.8%) | 43 (2.8%) |
| 60 to 64 Years | 140 (9.4%) | 208 (13.5%) |
| 65 to 69 Years | 55 (3.7%) | 113 (7.3%) |
| 70 to 74 Years | 90 (6.0%) | 76 (4.9%) |
| 75 to 79 Years | 19 (1.3%) | 55 (3.6%) |
| 80 to 84 Years | 38 (2.6%) | 44 (2.9%) |
| 85 Years and over | 60 (4.0%) | 86 (5.6%) |
| Total | 1,487 (100.0%) | 1,544 (100.0%) |
Families and Households in Milaca
Median Family Size in Milaca
The median family size in Milaca is 2.71 persons per family, with married-couple families (489 | 69.0%) accounting for the largest median family size of 2.79 persons per family. On the other hand, single male/father families (42 | 5.9%) represent the smallest median family size with 2.45 persons per family.
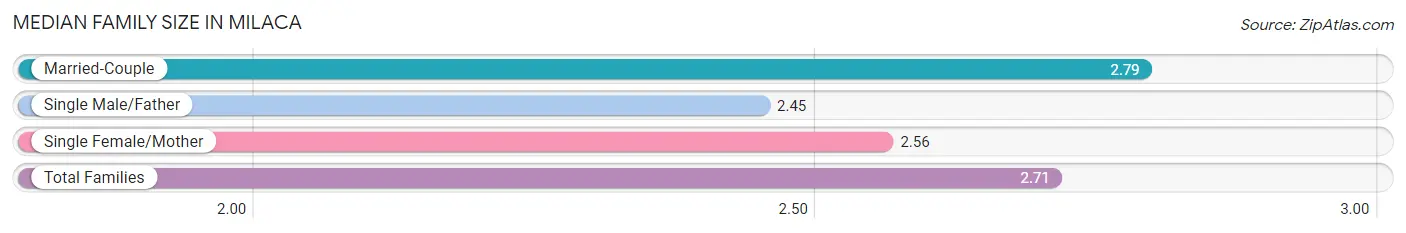
| Family Type | # Families | Family Size |
| Married-Couple | 489 (69.0%) | 2.79 |
| Single Male/Father | 42 (5.9%) | 2.45 |
| Single Female/Mother | 178 (25.1%) | 2.56 |
| Total Families | 709 (100.0%) | 2.71 |
Median Household Size in Milaca
The median household size in Milaca is 1.86 persons per household, with married-couple households (489 | 31.9%) accounting for the largest median household size of 2.79 persons per household. non-family households (824 | 53.7%) represent the smallest median household size with 1.08 persons per household.
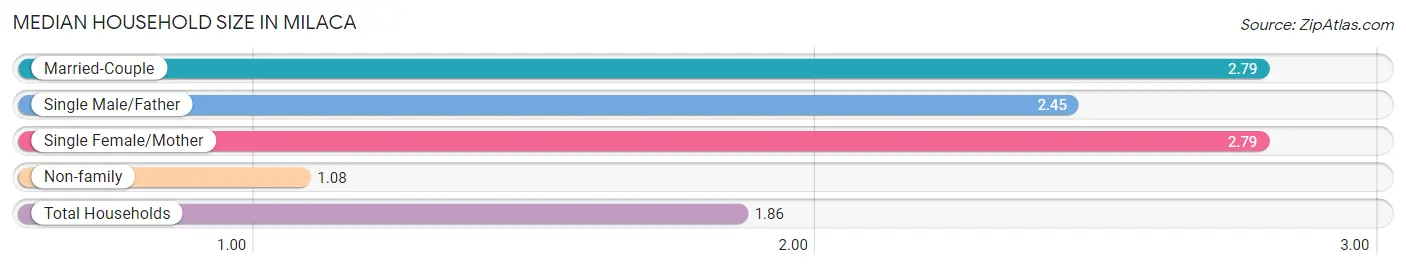
| Household Type | # Households | Household Size |
| Married-Couple | 489 (31.9%) | 2.79 |
| Single Male/Father | 42 (2.7%) | 2.45 |
| Single Female/Mother | 178 (11.6%) | 2.79 |
| Non-family | 824 (53.7%) | 1.08 |
| Total Households | 1,533 (100.0%) | 1.86 |
Household Size by Marriage Status in Milaca
Out of a total of 1,533 households in Milaca, 709 (46.3%) are family households, while 824 (53.7%) are nonfamily households. The most numerous type of family households are 2-person households, comprising 422, and the most common type of nonfamily households are 1-person households, comprising 761.
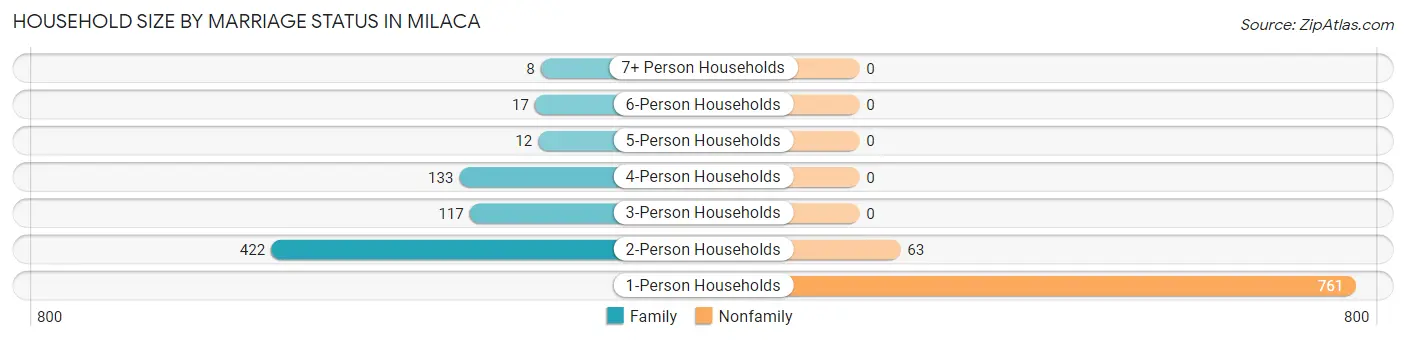
| Household Size | Family Households | Nonfamily Households |
| 1-Person Households | - | 761 (49.6%) |
| 2-Person Households | 422 (27.5%) | 63 (4.1%) |
| 3-Person Households | 117 (7.6%) | 0 (0.0%) |
| 4-Person Households | 133 (8.7%) | 0 (0.0%) |
| 5-Person Households | 12 (0.8%) | 0 (0.0%) |
| 6-Person Households | 17 (1.1%) | 0 (0.0%) |
| 7+ Person Households | 8 (0.5%) | 0 (0.0%) |
| Total | 709 (46.3%) | 824 (53.7%) |
Female Fertility in Milaca
Fertility by Age in Milaca
Average fertility rate in Milaca is 73.0 births per 1,000 women. Women in the age bracket of 20 to 34 years have the highest fertility rate with 211.0 births per 1,000 women. Women in the age bracket of 20 to 34 years acount for 100.0% of all women with births.
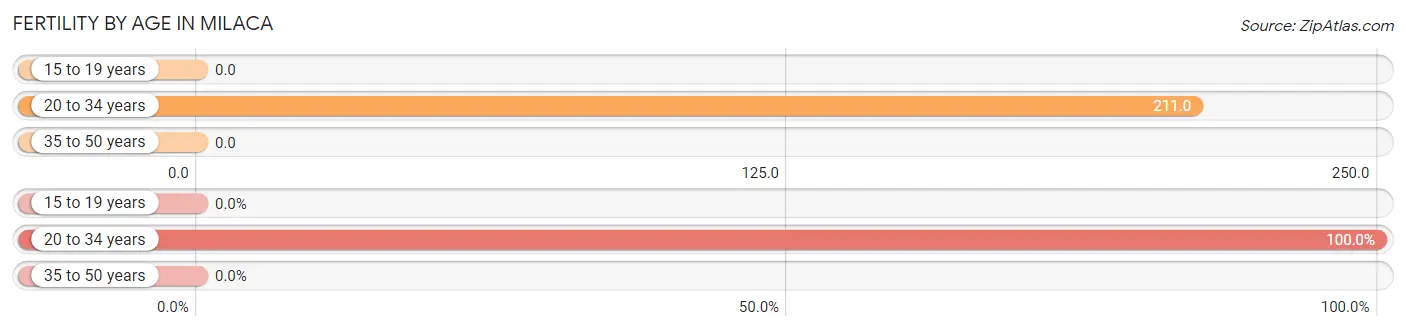
| Age Bracket | Women with Births | Births / 1,000 Women |
| 15 to 19 years | 0 (0.0%) | 0.0 |
| 20 to 34 years | 46 (100.0%) | 211.0 |
| 35 to 50 years | 0 (0.0%) | 0.0 |
| Total | 46 (100.0%) | 73.0 |
Fertility by Age by Marriage Status in Milaca
54.3% of women with births (46) in Milaca are married. The highest percentage of unmarried women with births falls into 20 to 34 years age bracket with 45.7% of them unmarried at the time of birth, while the lowest percentage of unmarried women with births belong to 20 to 34 years age bracket with 45.7% of them unmarried.
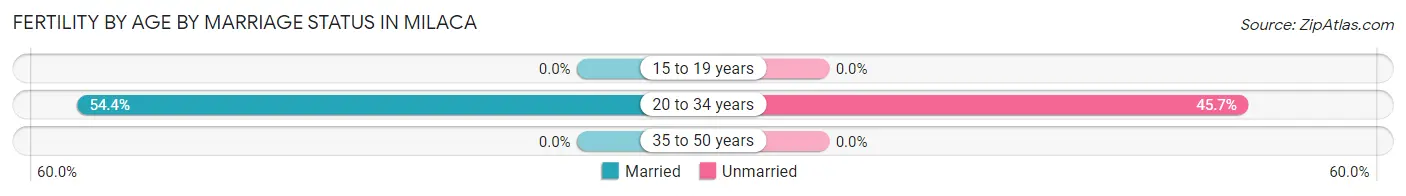
| Age Bracket | Married | Unmarried |
| 15 to 19 years | 0 (0.0%) | 0 (0.0%) |
| 20 to 34 years | 25 (54.3%) | 21 (45.7%) |
| 35 to 50 years | 0 (0.0%) | 0 (0.0%) |
| Total | 25 (54.3%) | 21 (45.7%) |
Fertility by Education in Milaca
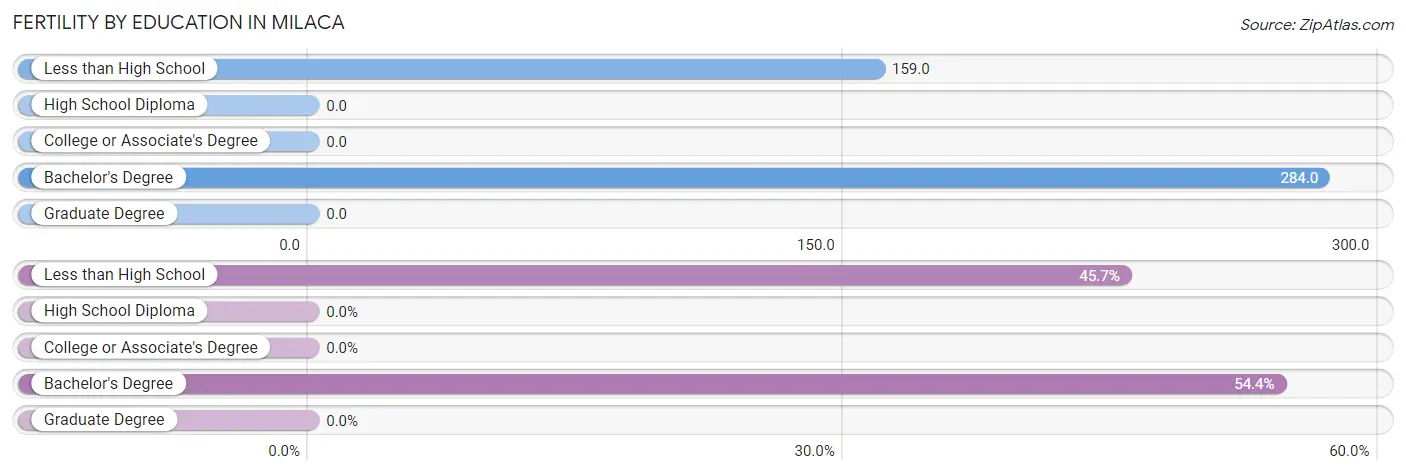
| Educational Attainment | Women with Births | Births / 1,000 Women |
| Less than High School | 21 (45.7%) | 159.0 |
| High School Diploma | 0 (0.0%) | 0.0 |
| College or Associate's Degree | 0 (0.0%) | 0.0 |
| Bachelor's Degree | 25 (54.3%) | 284.0 |
| Graduate Degree | 0 (0.0%) | 0.0 |
| Total | 46 (100.0%) | 73.0 |
Fertility by Education by Marriage Status in Milaca
45.7% of women with births in Milaca are unmarried. Women with the educational attainment of bachelor's degree are most likely to be married with 100.0% of them married at childbirth, while women with the educational attainment of less than high school are least likely to be married with 100.0% of them unmarried at childbirth.
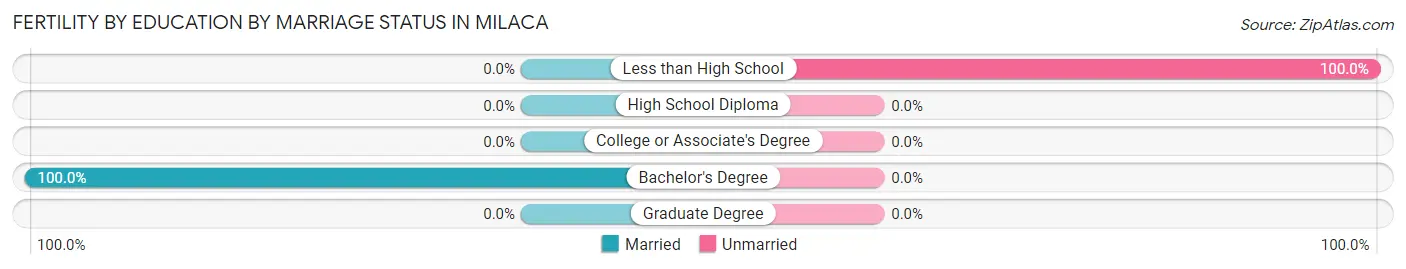
| Educational Attainment | Married | Unmarried |
| Less than High School | 0 (0.0%) | 21 (100.0%) |
| High School Diploma | 0 (0.0%) | 0 (0.0%) |
| College or Associate's Degree | 0 (0.0%) | 0 (0.0%) |
| Bachelor's Degree | 25 (100.0%) | 0 (0.0%) |
| Graduate Degree | 0 (0.0%) | 0 (0.0%) |
| Total | 25 (54.3%) | 21 (45.7%) |
Employment Characteristics in Milaca
Employment by Class of Employer in Milaca
Among the 1,512 employed individuals in Milaca, private company employees (960 | 63.5%), self-employed (not incorporated) (163 | 10.8%), and local government employees (134 | 8.9%) make up the most common classes of employment.
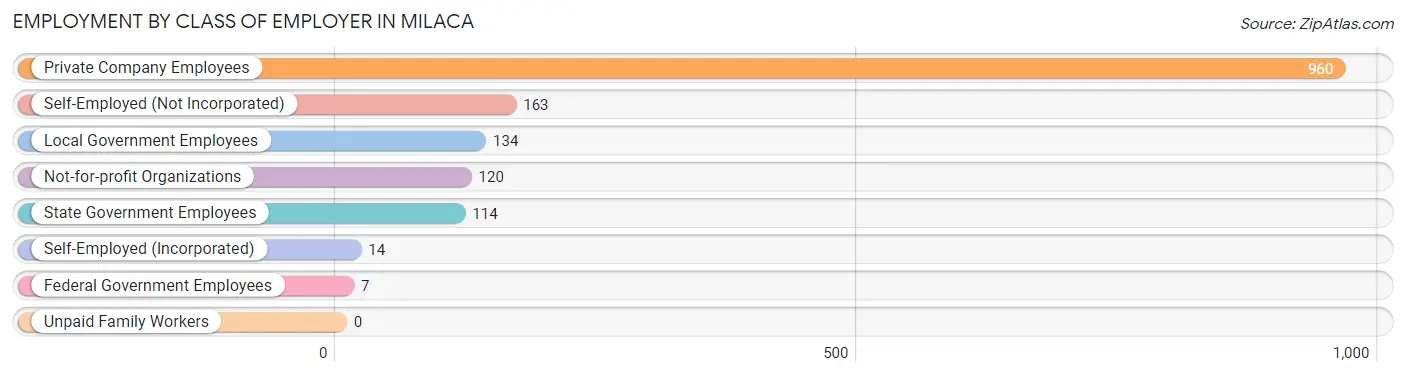
| Employer Class | # Employees | % Employees |
| Private Company Employees | 960 | 63.5% |
| Self-Employed (Incorporated) | 14 | 0.9% |
| Self-Employed (Not Incorporated) | 163 | 10.8% |
| Not-for-profit Organizations | 120 | 7.9% |
| Local Government Employees | 134 | 8.9% |
| State Government Employees | 114 | 7.5% |
| Federal Government Employees | 7 | 0.5% |
| Unpaid Family Workers | 0 | 0.0% |
| Total | 1,512 | 100.0% |
Employment Status by Age in Milaca
According to the labor force statistics for Milaca, out of the total population over 16 years of age (2,504), 62.9% or 1,575 individuals are in the labor force, with 0.9% or 14 of them unemployed. The age group with the highest labor force participation rate is 25 to 29 years, with 98.9% or 180 individuals in the labor force. Within the labor force, the 25 to 29 years age range has the highest percentage of unemployed individuals, with 7.8% or 14 of them being unemployed.
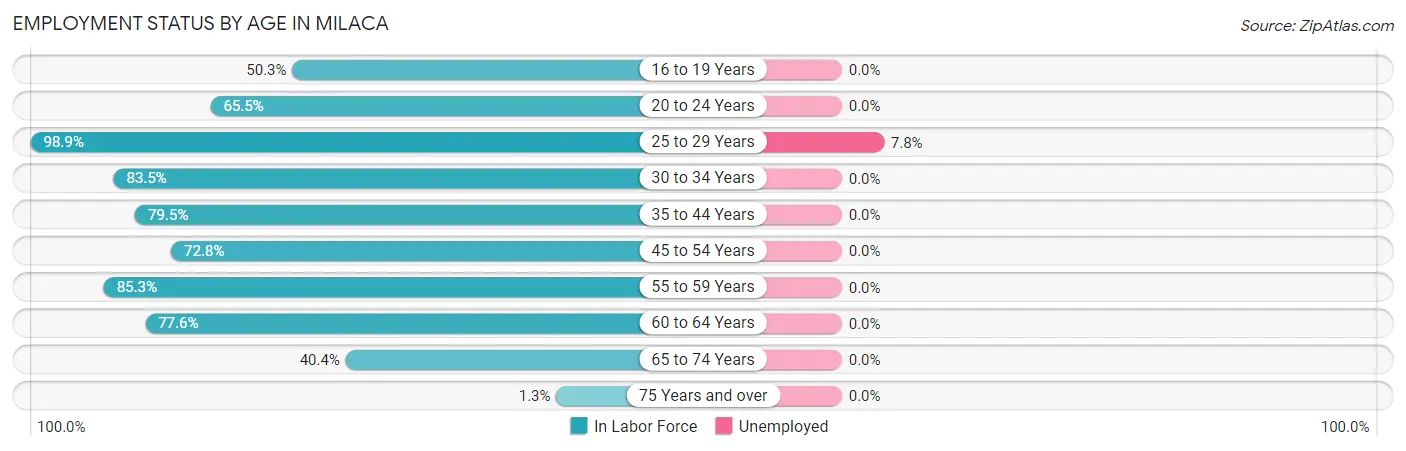
| Age Bracket | In Labor Force | Unemployed |
| 16 to 19 Years | 87 (50.3%) | 0 (0.0%) |
| 20 to 24 Years | 74 (65.5%) | 0 (0.0%) |
| 25 to 29 Years | 180 (98.9%) | 14 (7.8%) |
| 30 to 34 Years | 147 (83.5%) | 0 (0.0%) |
| 35 to 44 Years | 302 (79.5%) | 0 (0.0%) |
| 45 to 54 Years | 267 (72.8%) | 0 (0.0%) |
| 55 to 59 Years | 110 (85.3%) | 0 (0.0%) |
| 60 to 64 Years | 270 (77.6%) | 0 (0.0%) |
| 65 to 74 Years | 135 (40.4%) | 0 (0.0%) |
| 75 Years and over | 4 (1.3%) | 0 (0.0%) |
| Total | 1,575 (62.9%) | 14 (0.9%) |
Employment Status by Educational Attainment in Milaca
According to labor force statistics for Milaca, 80.7% of individuals (1,277) out of the total population between 25 and 64 years of age (1,582) are in the labor force, with 1.1% or 14 of them being unemployed. The group with the highest labor force participation rate are those with the educational attainment of bachelor's degree or higher, with 95.9% or 213 individuals in the labor force. Within the labor force, individuals with less than high school education have the highest percentage of unemployment, with 7.1% or 8 of them being unemployed.
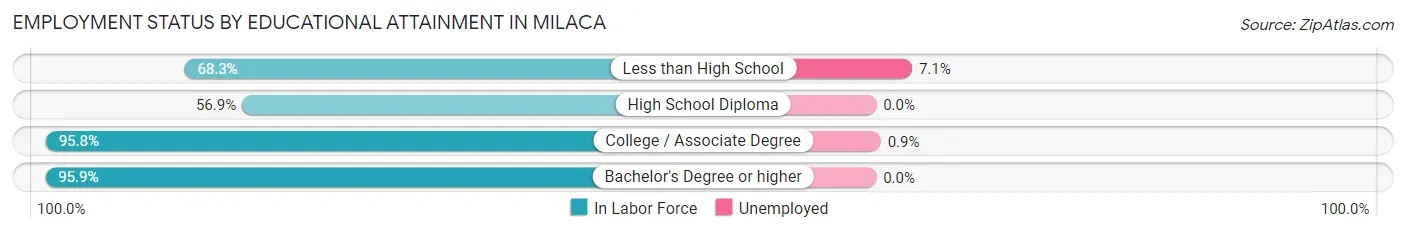
| Educational Attainment | In Labor Force | Unemployed |
| Less than High School | 112 (68.3%) | 12 (7.1%) |
| High School Diploma | 285 (56.9%) | 0 (0.0%) |
| College / Associate Degree | 666 (95.8%) | 6 (0.9%) |
| Bachelor's Degree or higher | 213 (95.9%) | 0 (0.0%) |
| Total | 1,277 (80.7%) | 17 (1.1%) |
Employment Occupations by Sex in Milaca
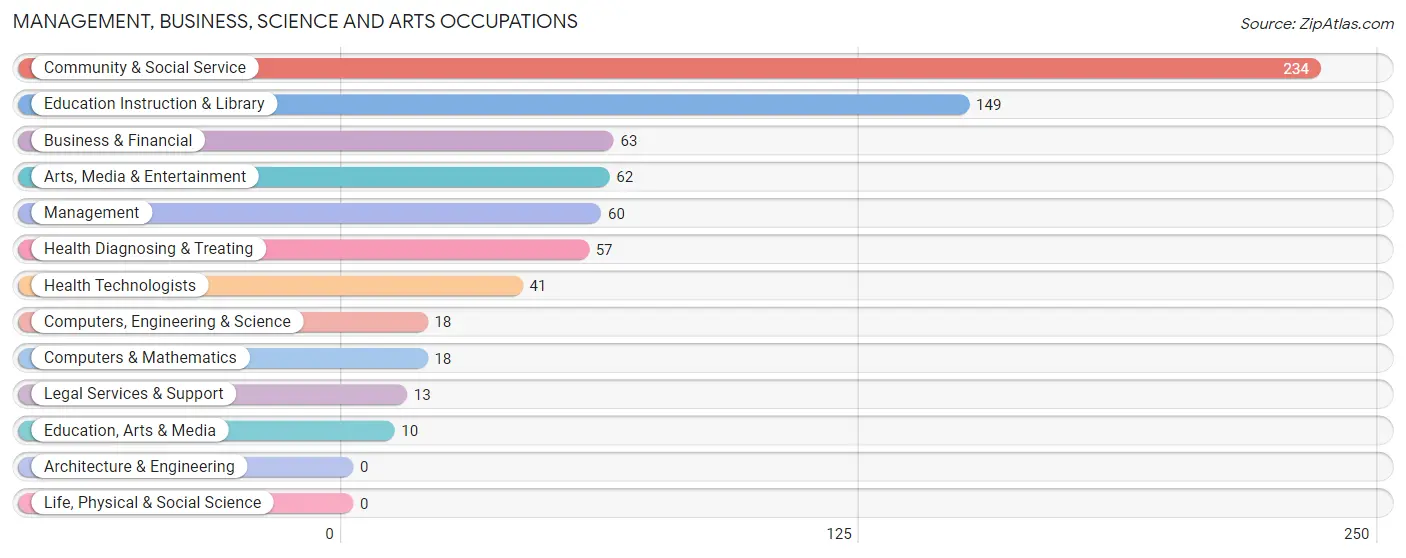
Management, Business, Science and Arts Occupations
The most common Management, Business, Science and Arts occupations in Milaca are Community & Social Service (234 | 15.0%), Education Instruction & Library (149 | 9.5%), Business & Financial (63 | 4.0%), Arts, Media & Entertainment (62 | 4.0%), and Management (60 | 3.8%).
Management, Business, Science and Arts Occupations by Sex
Within the Management, Business, Science and Arts occupations in Milaca, the most male-oriented occupations are Business & Financial (87.3%), Management (68.3%), and Education Instruction & Library (52.3%), while the most female-oriented occupations are Computers, Engineering & Science (100.0%), Computers & Mathematics (100.0%), and Education, Arts & Media (100.0%).
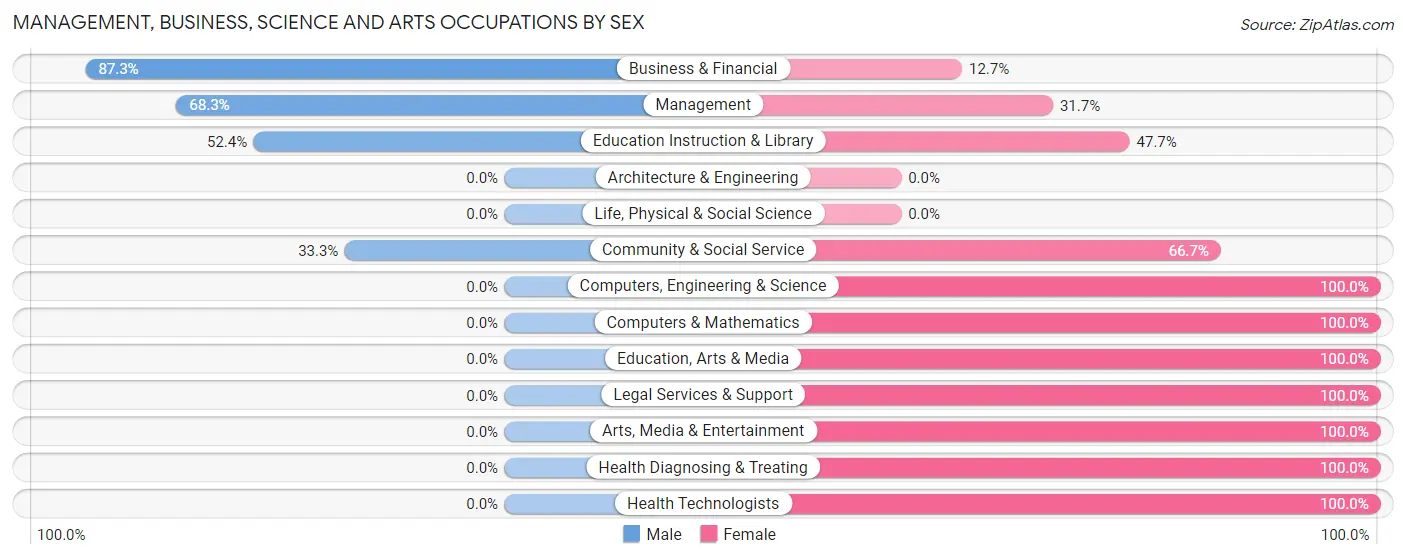
| Occupation | Male | Female |
| Management | 41 (68.3%) | 19 (31.7%) |
| Business & Financial | 55 (87.3%) | 8 (12.7%) |
| Computers, Engineering & Science | 0 (0.0%) | 18 (100.0%) |
| Computers & Mathematics | 0 (0.0%) | 18 (100.0%) |
| Architecture & Engineering | 0 (0.0%) | 0 (0.0%) |
| Life, Physical & Social Science | 0 (0.0%) | 0 (0.0%) |
| Community & Social Service | 78 (33.3%) | 156 (66.7%) |
| Education, Arts & Media | 0 (0.0%) | 10 (100.0%) |
| Legal Services & Support | 0 (0.0%) | 13 (100.0%) |
| Education Instruction & Library | 78 (52.3%) | 71 (47.6%) |
| Arts, Media & Entertainment | 0 (0.0%) | 62 (100.0%) |
| Health Diagnosing & Treating | 0 (0.0%) | 57 (100.0%) |
| Health Technologists | 0 (0.0%) | 41 (100.0%) |
| Total (Category) | 174 (40.3%) | 258 (59.7%) |
| Total (Overall) | 797 (51.0%) | 765 (49.0%) |
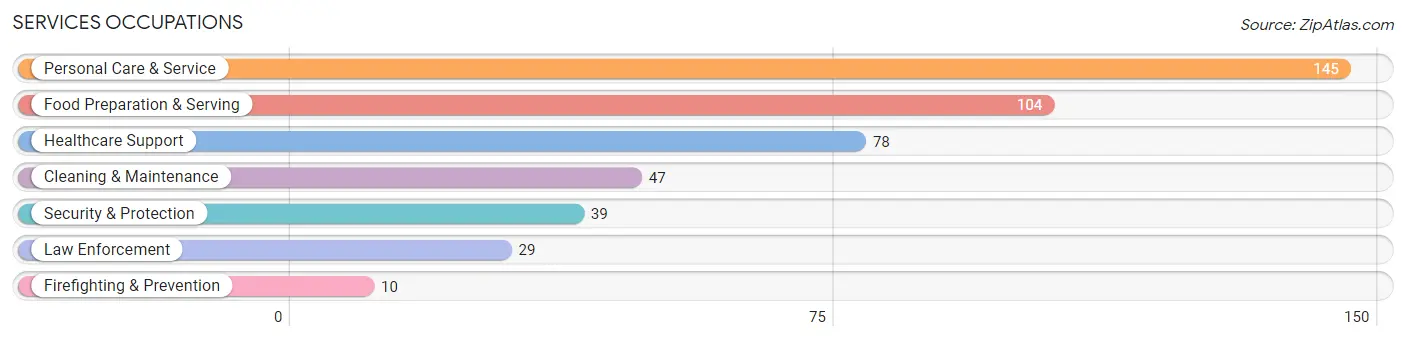
Services Occupations
The most common Services occupations in Milaca are Personal Care & Service (145 | 9.3%), Food Preparation & Serving (104 | 6.7%), Healthcare Support (78 | 5.0%), Cleaning & Maintenance (47 | 3.0%), and Security & Protection (39 | 2.5%).
Services Occupations by Sex
Within the Services occupations in Milaca, the most male-oriented occupations are Security & Protection (100.0%), Firefighting & Prevention (100.0%), and Law Enforcement (100.0%), while the most female-oriented occupations are Healthcare Support (100.0%), Personal Care & Service (91.7%), and Food Preparation & Serving (74.0%).
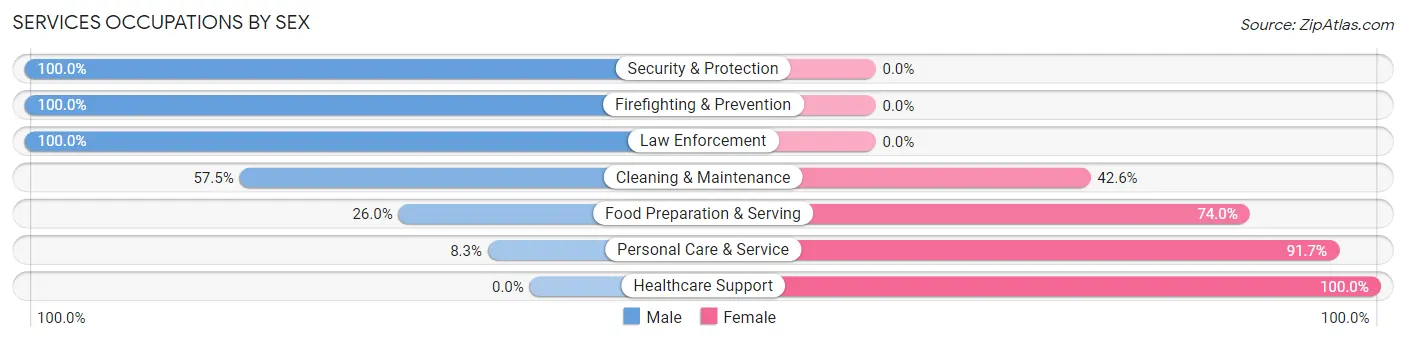
| Occupation | Male | Female |
| Healthcare Support | 0 (0.0%) | 78 (100.0%) |
| Security & Protection | 39 (100.0%) | 0 (0.0%) |
| Firefighting & Prevention | 10 (100.0%) | 0 (0.0%) |
| Law Enforcement | 29 (100.0%) | 0 (0.0%) |
| Food Preparation & Serving | 27 (26.0%) | 77 (74.0%) |
| Cleaning & Maintenance | 27 (57.5%) | 20 (42.5%) |
| Personal Care & Service | 12 (8.3%) | 133 (91.7%) |
| Total (Category) | 105 (25.4%) | 308 (74.6%) |
| Total (Overall) | 797 (51.0%) | 765 (49.0%) |
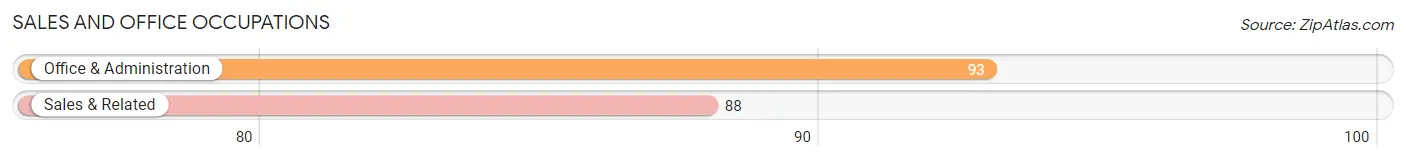
Sales and Office Occupations
The most common Sales and Office occupations in Milaca are Office & Administration (93 | 5.9%), and Sales & Related (88 | 5.6%).
Sales and Office Occupations by Sex

| Occupation | Male | Female |
| Sales & Related | 73 (83.0%) | 15 (17.1%) |
| Office & Administration | 18 (19.4%) | 75 (80.6%) |
| Total (Category) | 91 (50.3%) | 90 (49.7%) |
| Total (Overall) | 797 (51.0%) | 765 (49.0%) |
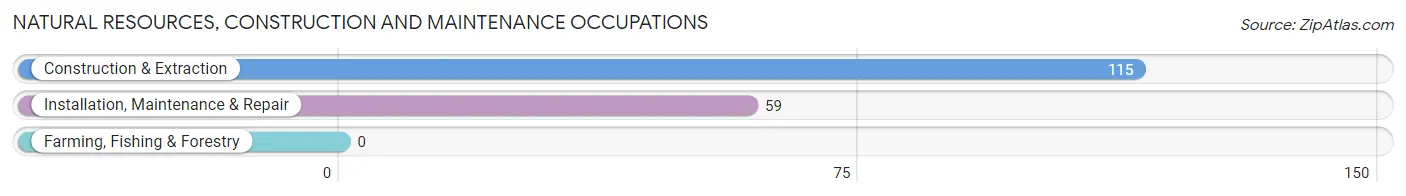
Natural Resources, Construction and Maintenance Occupations
The most common Natural Resources, Construction and Maintenance occupations in Milaca are Construction & Extraction (115 | 7.4%), and Installation, Maintenance & Repair (59 | 3.8%).
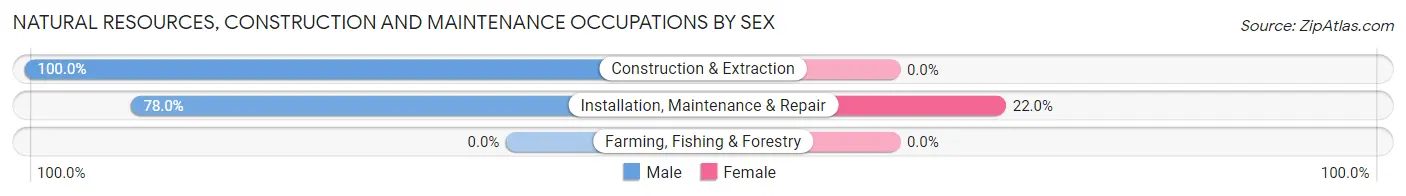
Natural Resources, Construction and Maintenance Occupations by Sex
| Occupation | Male | Female |
| Farming, Fishing & Forestry | 0 (0.0%) | 0 (0.0%) |
| Construction & Extraction | 115 (100.0%) | 0 (0.0%) |
| Installation, Maintenance & Repair | 46 (78.0%) | 13 (22.0%) |
| Total (Category) | 161 (92.5%) | 13 (7.5%) |
| Total (Overall) | 797 (51.0%) | 765 (49.0%) |
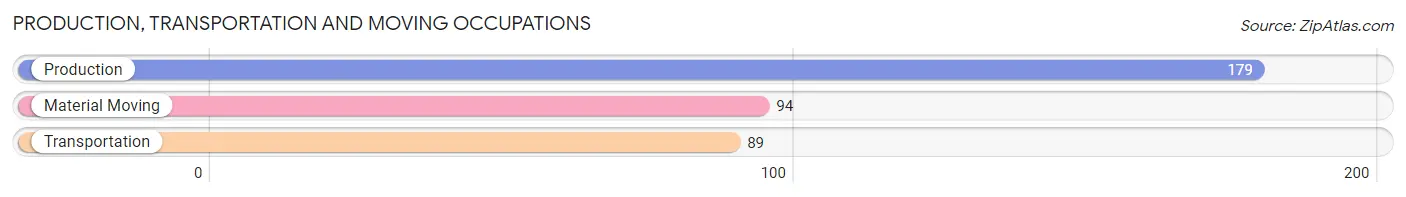
Production, Transportation and Moving Occupations
The most common Production, Transportation and Moving occupations in Milaca are Production (179 | 11.5%), Material Moving (94 | 6.0%), and Transportation (89 | 5.7%).
Production, Transportation and Moving Occupations by Sex
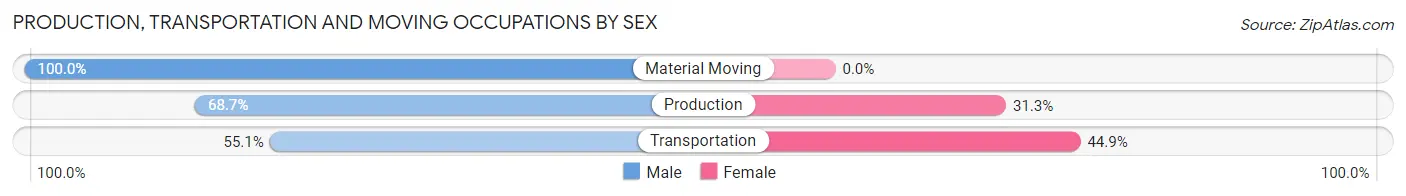
| Occupation | Male | Female |
| Production | 123 (68.7%) | 56 (31.3%) |
| Transportation | 49 (55.1%) | 40 (44.9%) |
| Material Moving | 94 (100.0%) | 0 (0.0%) |
| Total (Category) | 266 (73.5%) | 96 (26.5%) |
| Total (Overall) | 797 (51.0%) | 765 (49.0%) |
Employment Industries by Sex in Milaca
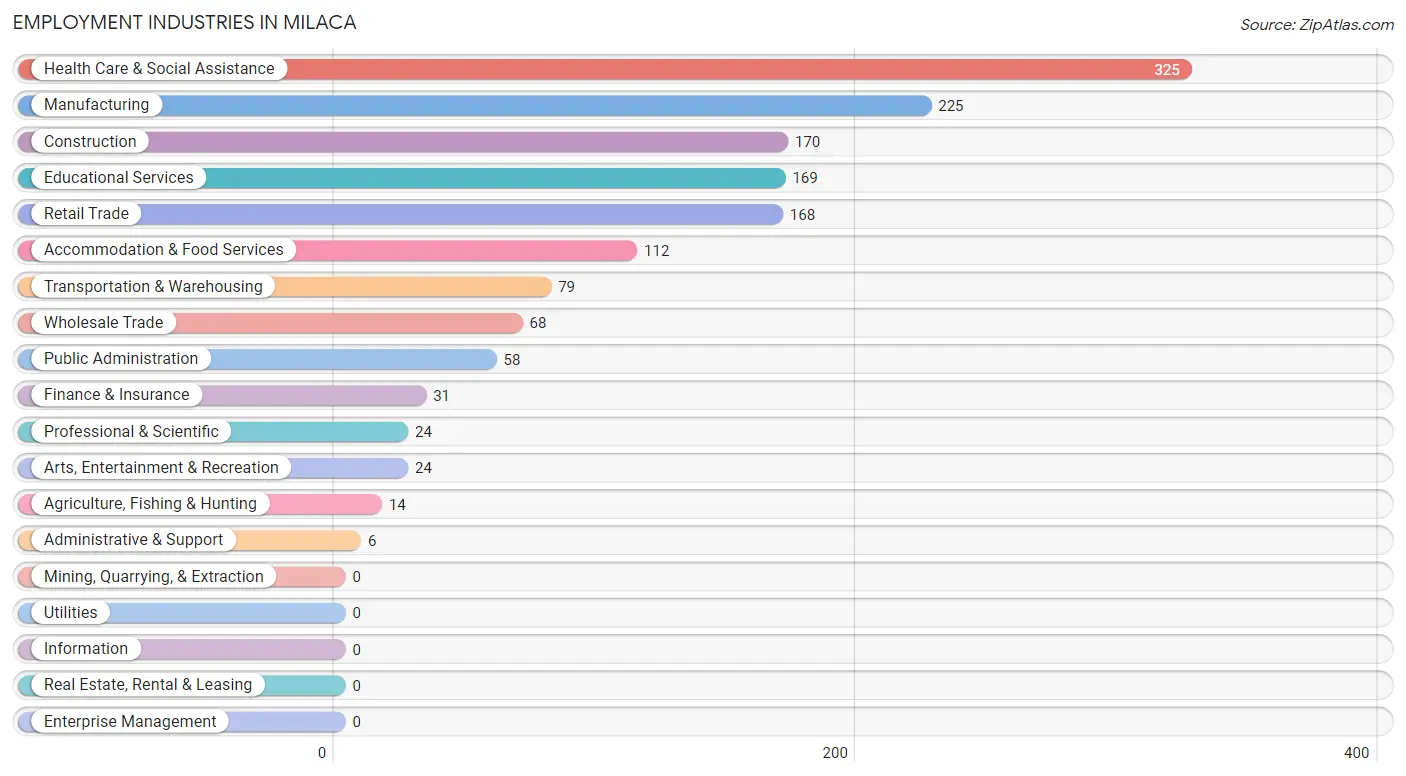
Employment Industries in Milaca
The major employment industries in Milaca include Health Care & Social Assistance (325 | 20.8%), Manufacturing (225 | 14.4%), Construction (170 | 10.9%), Educational Services (169 | 10.8%), and Retail Trade (168 | 10.8%).
Employment Industries by Sex in Milaca
The Milaca industries that see more men than women are Agriculture, Fishing & Hunting (100.0%), Administrative & Support (100.0%), and Construction (95.3%), whereas the industries that tend to have a higher number of women are Finance & Insurance (100.0%), Health Care & Social Assistance (90.1%), and Accommodation & Food Services (67.0%).
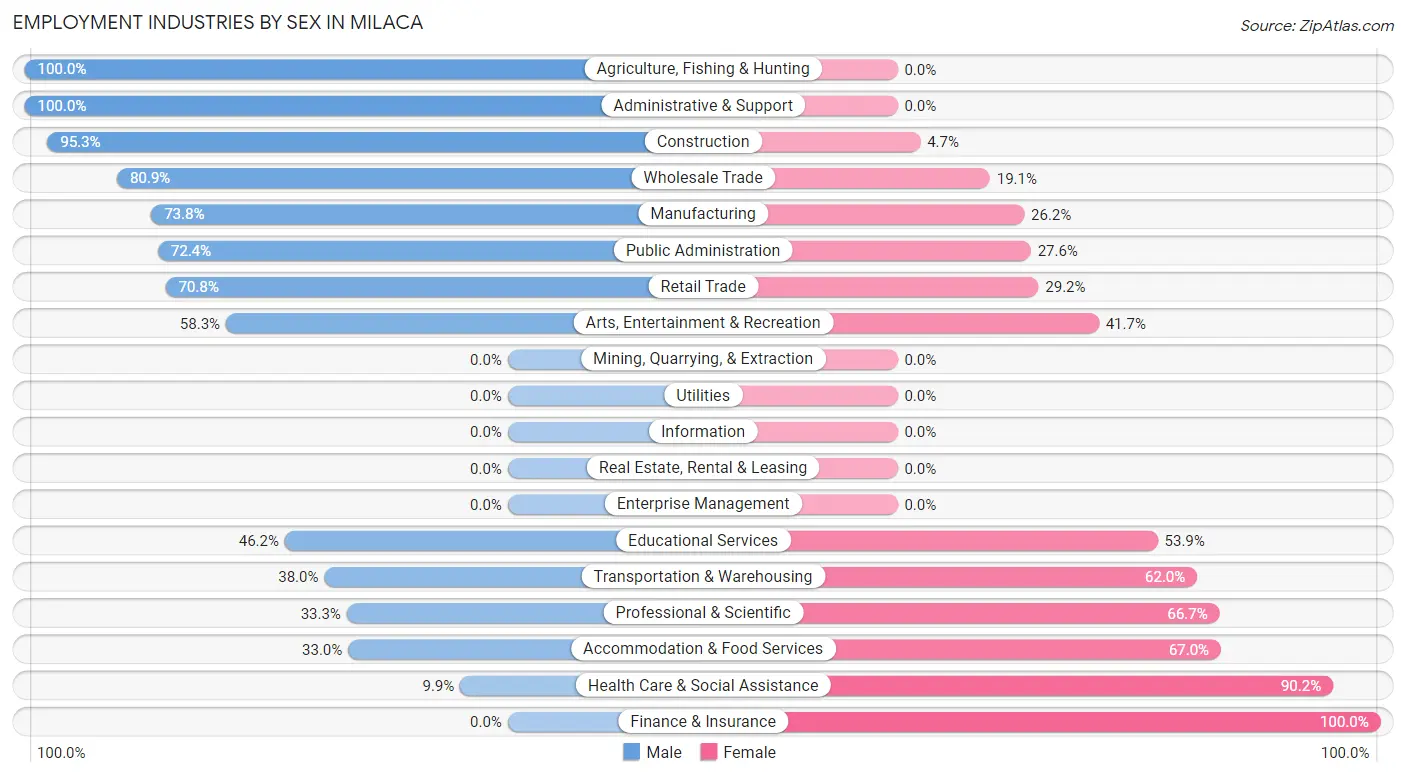
| Industry | Male | Female |
| Agriculture, Fishing & Hunting | 14 (100.0%) | 0 (0.0%) |
| Mining, Quarrying, & Extraction | 0 (0.0%) | 0 (0.0%) |
| Construction | 162 (95.3%) | 8 (4.7%) |
| Manufacturing | 166 (73.8%) | 59 (26.2%) |
| Wholesale Trade | 55 (80.9%) | 13 (19.1%) |
| Retail Trade | 119 (70.8%) | 49 (29.2%) |
| Transportation & Warehousing | 30 (38.0%) | 49 (62.0%) |
| Utilities | 0 (0.0%) | 0 (0.0%) |
| Information | 0 (0.0%) | 0 (0.0%) |
| Finance & Insurance | 0 (0.0%) | 31 (100.0%) |
| Real Estate, Rental & Leasing | 0 (0.0%) | 0 (0.0%) |
| Professional & Scientific | 8 (33.3%) | 16 (66.7%) |
| Enterprise Management | 0 (0.0%) | 0 (0.0%) |
| Administrative & Support | 6 (100.0%) | 0 (0.0%) |
| Educational Services | 78 (46.2%) | 91 (53.8%) |
| Health Care & Social Assistance | 32 (9.9%) | 293 (90.1%) |
| Arts, Entertainment & Recreation | 14 (58.3%) | 10 (41.7%) |
| Accommodation & Food Services | 37 (33.0%) | 75 (67.0%) |
| Public Administration | 42 (72.4%) | 16 (27.6%) |
| Total | 797 (51.0%) | 765 (49.0%) |
Education in Milaca
School Enrollment in Milaca
The most common levels of schooling among the 545 students in Milaca are high school (178 | 32.7%), middle school (139 | 25.5%), and elementary school (130 | 23.8%).
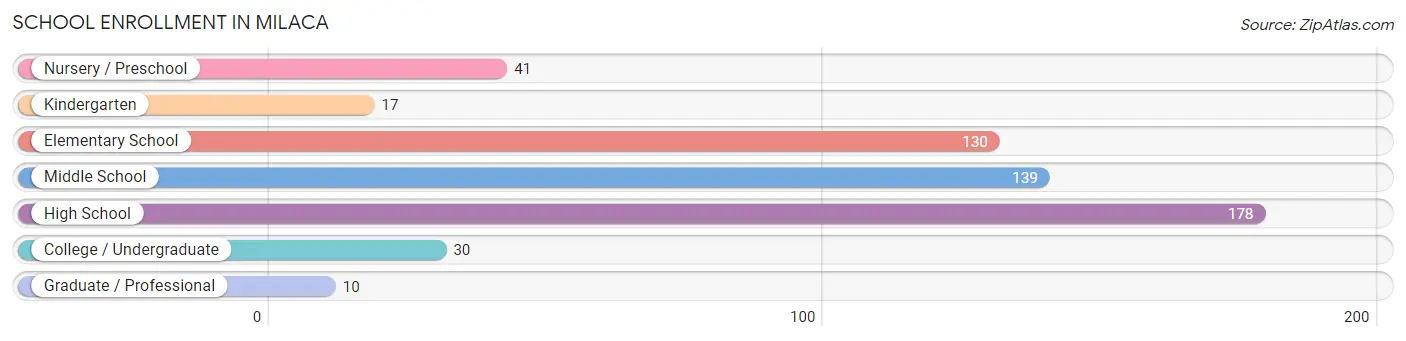
| School Level | # Students | % Students |
| Nursery / Preschool | 41 | 7.5% |
| Kindergarten | 17 | 3.1% |
| Elementary School | 130 | 23.8% |
| Middle School | 139 | 25.5% |
| High School | 178 | 32.7% |
| College / Undergraduate | 30 | 5.5% |
| Graduate / Professional | 10 | 1.8% |
| Total | 545 | 100.0% |
School Enrollment by Age by Funding Source in Milaca
Out of a total of 545 students who are enrolled in schools in Milaca, 23 (4.2%) attend a private institution, while the remaining 522 (95.8%) are enrolled in public schools. The age group of 35 years and over has the highest likelihood of being enrolled in private schools, with 10 (45.5% in the age bracket) enrolled. Conversely, the age group of 5 to 9 year old has the lowest likelihood of being enrolled in a private school, with 147 (100.0% in the age bracket) attending a public institution.
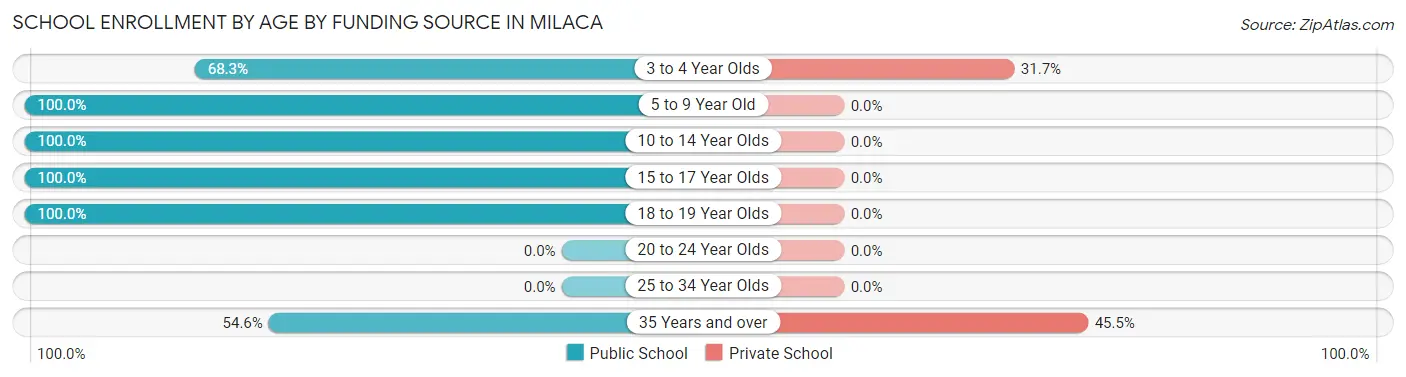
| Age Bracket | Public School | Private School |
| 3 to 4 Year Olds | 28 (68.3%) | 13 (31.7%) |
| 5 to 9 Year Old | 147 (100.0%) | 0 (0.0%) |
| 10 to 14 Year Olds | 139 (100.0%) | 0 (0.0%) |
| 15 to 17 Year Olds | 114 (100.0%) | 0 (0.0%) |
| 18 to 19 Year Olds | 82 (100.0%) | 0 (0.0%) |
| 20 to 24 Year Olds | 0 (0.0%) | 0 (0.0%) |
| 25 to 34 Year Olds | 0 (0.0%) | 0 (0.0%) |
| 35 Years and over | 12 (54.5%) | 10 (45.5%) |
| Total | 522 (95.8%) | 23 (4.2%) |
Educational Attainment by Field of Study in Milaca
Education (146 | 41.9%), business (58 | 16.7%), science & technology (38 | 10.9%), bio, nature & agricultural (30 | 8.6%), and liberal arts & history (28 | 8.1%) are the most common fields of study among 348 individuals in Milaca who have obtained a bachelor's degree or higher.
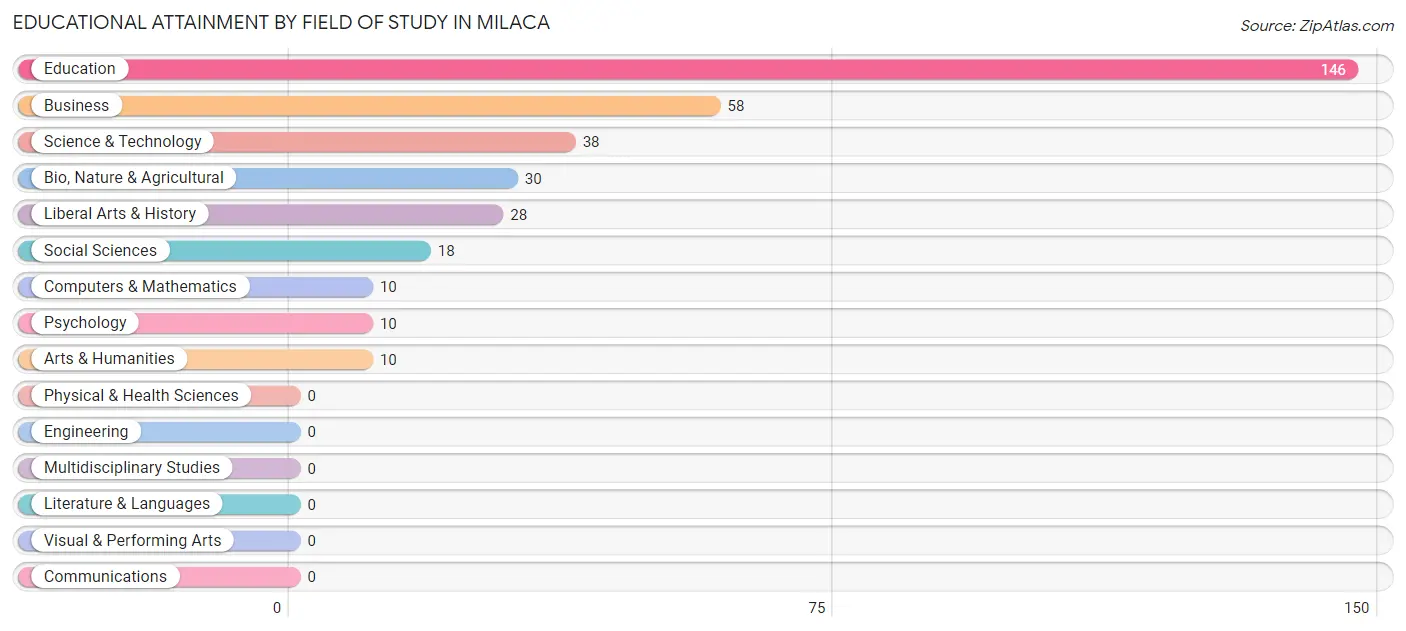
| Field of Study | # Graduates | % Graduates |
| Computers & Mathematics | 10 | 2.9% |
| Bio, Nature & Agricultural | 30 | 8.6% |
| Physical & Health Sciences | 0 | 0.0% |
| Psychology | 10 | 2.9% |
| Social Sciences | 18 | 5.2% |
| Engineering | 0 | 0.0% |
| Multidisciplinary Studies | 0 | 0.0% |
| Science & Technology | 38 | 10.9% |
| Business | 58 | 16.7% |
| Education | 146 | 41.9% |
| Literature & Languages | 0 | 0.0% |
| Liberal Arts & History | 28 | 8.1% |
| Visual & Performing Arts | 0 | 0.0% |
| Communications | 0 | 0.0% |
| Arts & Humanities | 10 | 2.9% |
| Total | 348 | 100.0% |
Transportation & Commute in Milaca
Vehicle Availability by Sex in Milaca
The most prevalent vehicle ownership categories in Milaca are males with 2 vehicles (257, accounting for 33.0%) and females with 2 vehicles (281, making up 36.0%).
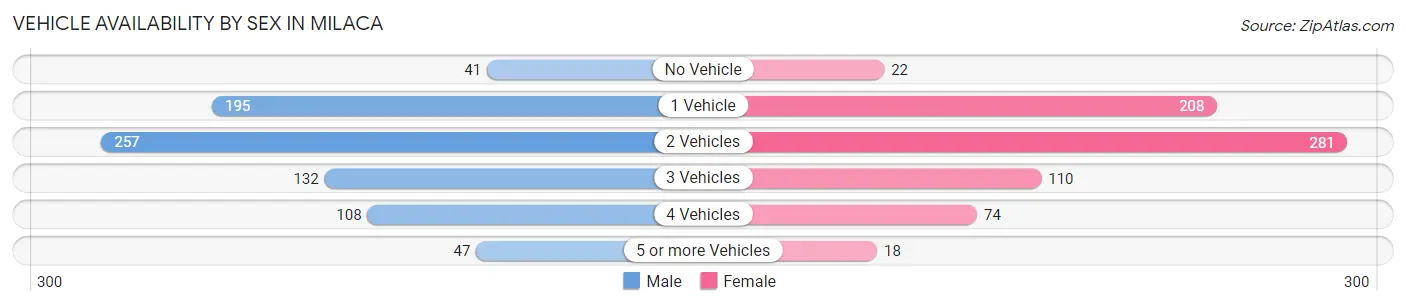
| Vehicles Available | Male | Female |
| No Vehicle | 41 (5.3%) | 22 (3.1%) |
| 1 Vehicle | 195 (25.0%) | 208 (29.2%) |
| 2 Vehicles | 257 (33.0%) | 281 (39.4%) |
| 3 Vehicles | 132 (16.9%) | 110 (15.4%) |
| 4 Vehicles | 108 (13.9%) | 74 (10.4%) |
| 5 or more Vehicles | 47 (6.0%) | 18 (2.5%) |
| Total | 780 (100.0%) | 713 (100.0%) |
Commute Time in Milaca
The most frequently occuring commute durations in Milaca are 5 to 9 minutes (238 commuters, 18.0%), 20 to 24 minutes (210 commuters, 15.9%), and less than 5 minutes (198 commuters, 15.0%).
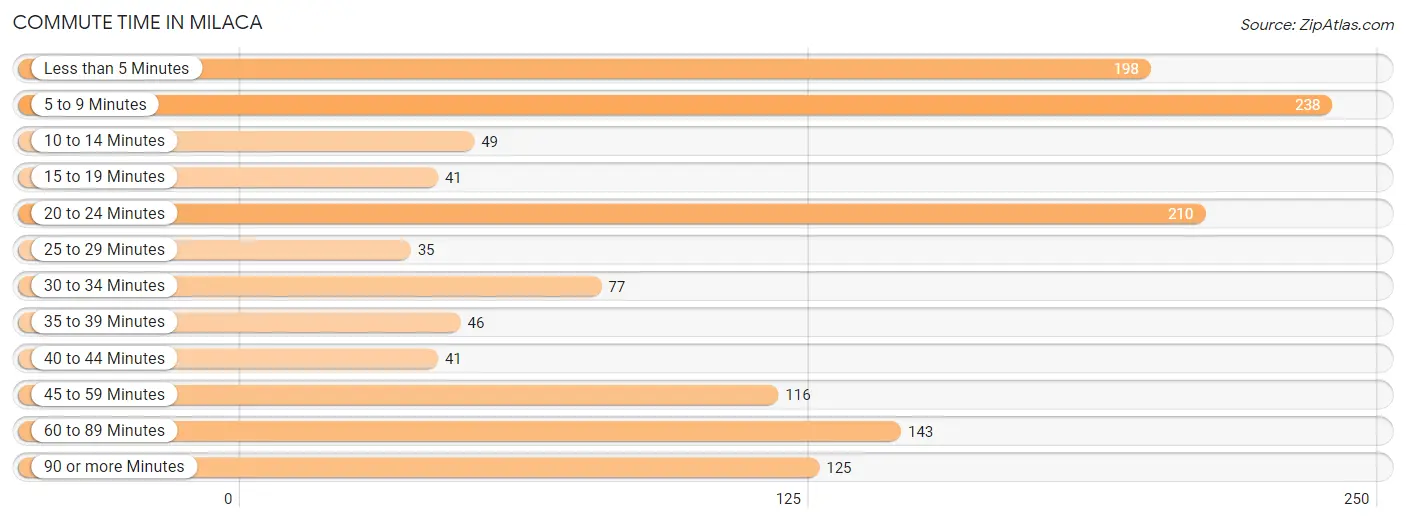
| Commute Time | # Commuters | % Commuters |
| Less than 5 Minutes | 198 | 15.0% |
| 5 to 9 Minutes | 238 | 18.0% |
| 10 to 14 Minutes | 49 | 3.7% |
| 15 to 19 Minutes | 41 | 3.1% |
| 20 to 24 Minutes | 210 | 15.9% |
| 25 to 29 Minutes | 35 | 2.6% |
| 30 to 34 Minutes | 77 | 5.8% |
| 35 to 39 Minutes | 46 | 3.5% |
| 40 to 44 Minutes | 41 | 3.1% |
| 45 to 59 Minutes | 116 | 8.8% |
| 60 to 89 Minutes | 143 | 10.8% |
| 90 or more Minutes | 125 | 9.5% |
Commute Time by Sex in Milaca
The most common commute times in Milaca are 5 to 9 minutes (167 commuters, 22.5%) for males and 20 to 24 minutes (128 commuters, 22.2%) for females.
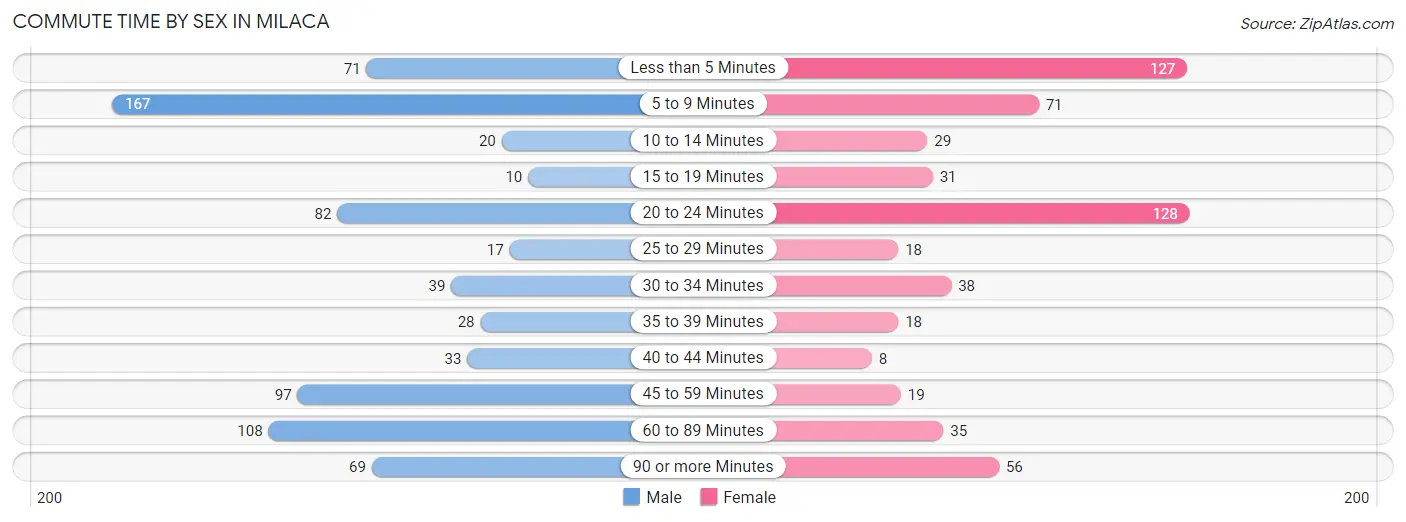
| Commute Time | Male | Female |
| Less than 5 Minutes | 71 (9.6%) | 127 (22.0%) |
| 5 to 9 Minutes | 167 (22.5%) | 71 (12.3%) |
| 10 to 14 Minutes | 20 (2.7%) | 29 (5.0%) |
| 15 to 19 Minutes | 10 (1.3%) | 31 (5.4%) |
| 20 to 24 Minutes | 82 (11.1%) | 128 (22.2%) |
| 25 to 29 Minutes | 17 (2.3%) | 18 (3.1%) |
| 30 to 34 Minutes | 39 (5.3%) | 38 (6.6%) |
| 35 to 39 Minutes | 28 (3.8%) | 18 (3.1%) |
| 40 to 44 Minutes | 33 (4.4%) | 8 (1.4%) |
| 45 to 59 Minutes | 97 (13.1%) | 19 (3.3%) |
| 60 to 89 Minutes | 108 (14.6%) | 35 (6.1%) |
| 90 or more Minutes | 69 (9.3%) | 56 (9.7%) |
Time of Departure to Work by Sex in Milaca
The most frequent times of departure to work in Milaca are 12:00 PM to 3:59 PM (107, 14.4%) for males and 7:00 AM to 7:29 AM (121, 20.9%) for females.
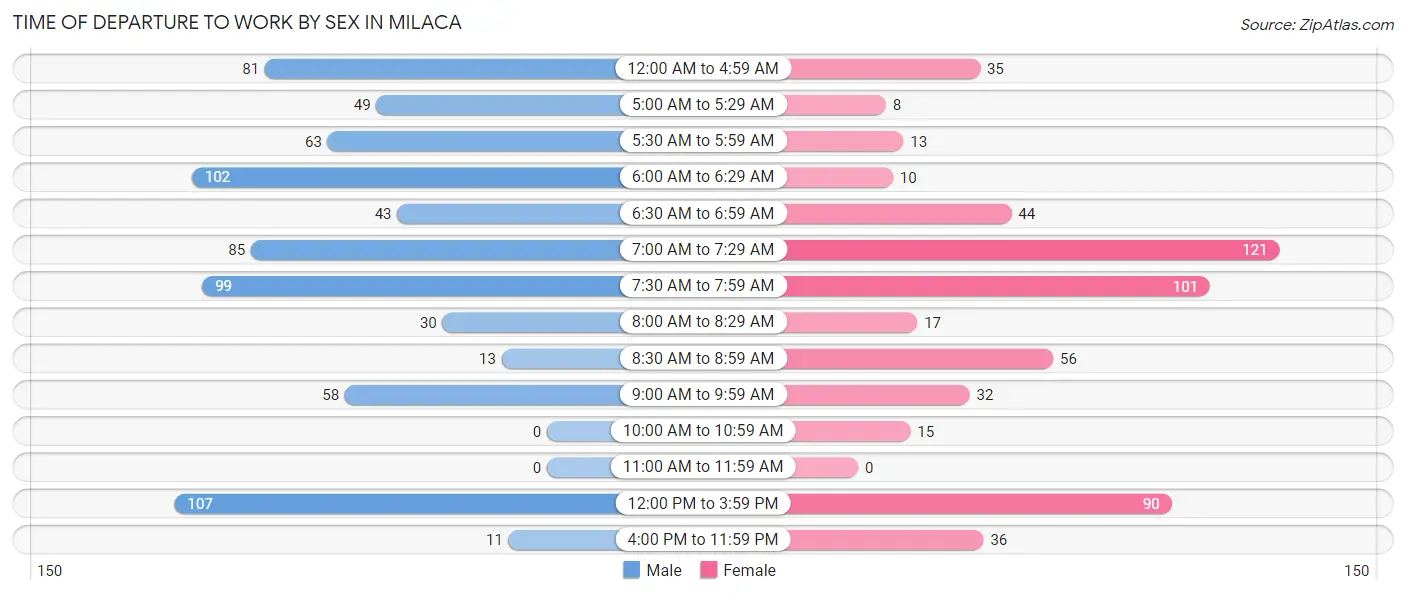
| Time of Departure | Male | Female |
| 12:00 AM to 4:59 AM | 81 (10.9%) | 35 (6.1%) |
| 5:00 AM to 5:29 AM | 49 (6.6%) | 8 (1.4%) |
| 5:30 AM to 5:59 AM | 63 (8.5%) | 13 (2.2%) |
| 6:00 AM to 6:29 AM | 102 (13.8%) | 10 (1.7%) |
| 6:30 AM to 6:59 AM | 43 (5.8%) | 44 (7.6%) |
| 7:00 AM to 7:29 AM | 85 (11.5%) | 121 (20.9%) |
| 7:30 AM to 7:59 AM | 99 (13.4%) | 101 (17.5%) |
| 8:00 AM to 8:29 AM | 30 (4.1%) | 17 (2.9%) |
| 8:30 AM to 8:59 AM | 13 (1.8%) | 56 (9.7%) |
| 9:00 AM to 9:59 AM | 58 (7.8%) | 32 (5.5%) |
| 10:00 AM to 10:59 AM | 0 (0.0%) | 15 (2.6%) |
| 11:00 AM to 11:59 AM | 0 (0.0%) | 0 (0.0%) |
| 12:00 PM to 3:59 PM | 107 (14.4%) | 90 (15.6%) |
| 4:00 PM to 11:59 PM | 11 (1.5%) | 36 (6.2%) |
| Total | 741 (100.0%) | 578 (100.0%) |
Housing Occupancy in Milaca
Occupancy by Ownership in Milaca
Of the total 1,533 dwellings in Milaca, owner-occupied units account for 884 (57.7%), while renter-occupied units make up 649 (42.3%).
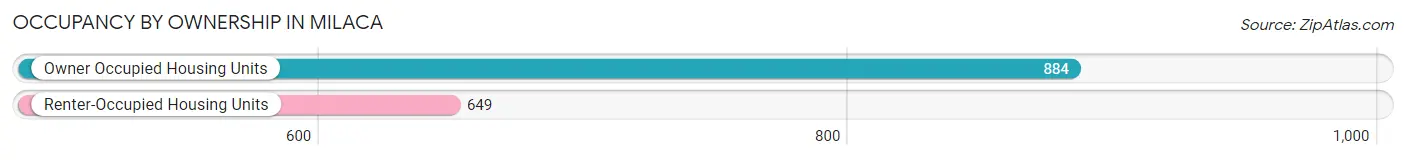
| Occupancy | # Housing Units | % Housing Units |
| Owner Occupied Housing Units | 884 | 57.7% |
| Renter-Occupied Housing Units | 649 | 42.3% |
| Total Occupied Housing Units | 1,533 | 100.0% |
Occupancy by Household Size in Milaca
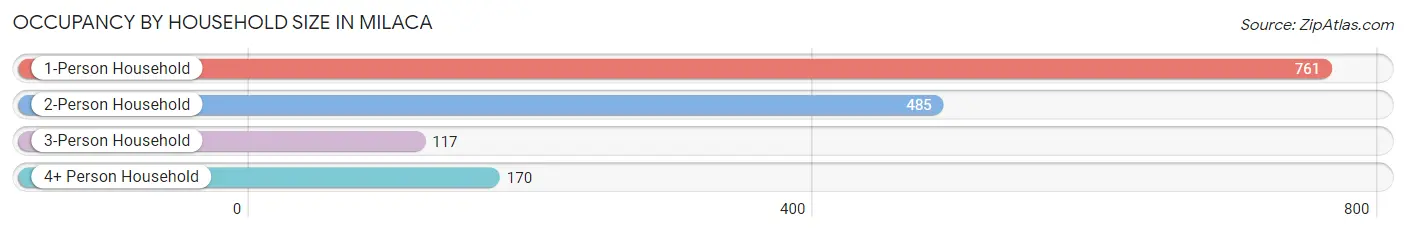
| Household Size | # Housing Units | % Housing Units |
| 1-Person Household | 761 | 49.6% |
| 2-Person Household | 485 | 31.6% |
| 3-Person Household | 117 | 7.6% |
| 4+ Person Household | 170 | 11.1% |
| Total Housing Units | 1,533 | 100.0% |
Occupancy by Ownership by Household Size in Milaca
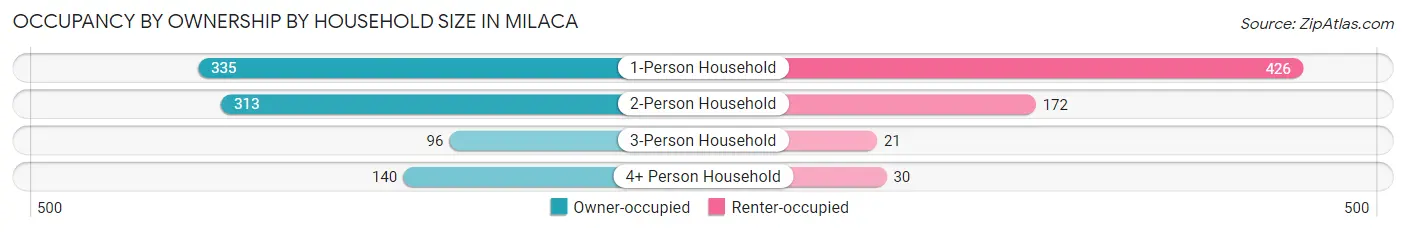
| Household Size | Owner-occupied | Renter-occupied |
| 1-Person Household | 335 (44.0%) | 426 (56.0%) |
| 2-Person Household | 313 (64.5%) | 172 (35.5%) |
| 3-Person Household | 96 (82.1%) | 21 (17.9%) |
| 4+ Person Household | 140 (82.4%) | 30 (17.6%) |
| Total Housing Units | 884 (57.7%) | 649 (42.3%) |
Occupancy by Educational Attainment in Milaca
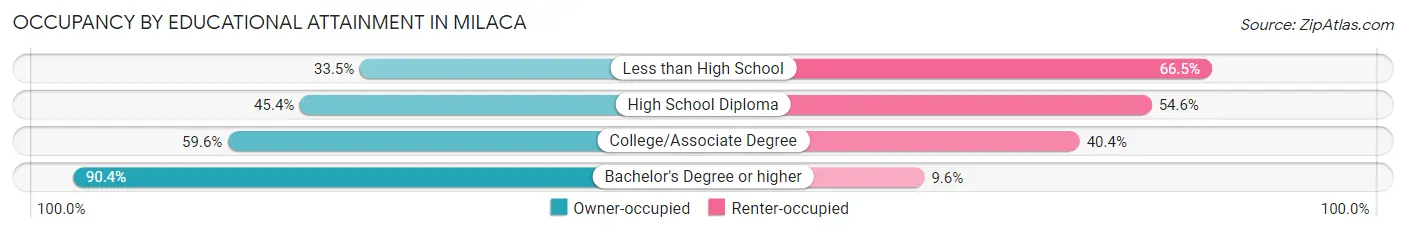
| Household Size | Owner-occupied | Renter-occupied |
| Less than High School | 75 (33.5%) | 149 (66.5%) |
| High School Diploma | 186 (45.4%) | 224 (54.6%) |
| College/Associate Degree | 368 (59.6%) | 249 (40.4%) |
| Bachelor's Degree or higher | 255 (90.4%) | 27 (9.6%) |
Occupancy by Age of Householder in Milaca
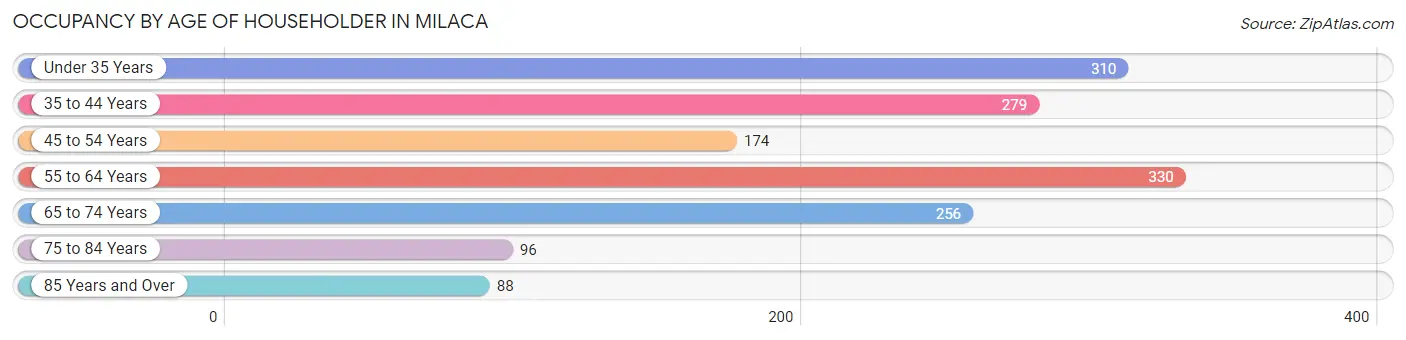
| Age Bracket | # Households | % Households |
| Under 35 Years | 310 | 20.2% |
| 35 to 44 Years | 279 | 18.2% |
| 45 to 54 Years | 174 | 11.4% |
| 55 to 64 Years | 330 | 21.5% |
| 65 to 74 Years | 256 | 16.7% |
| 75 to 84 Years | 96 | 6.3% |
| 85 Years and Over | 88 | 5.7% |
| Total | 1,533 | 100.0% |
Housing Finances in Milaca
Median Income by Occupancy in Milaca
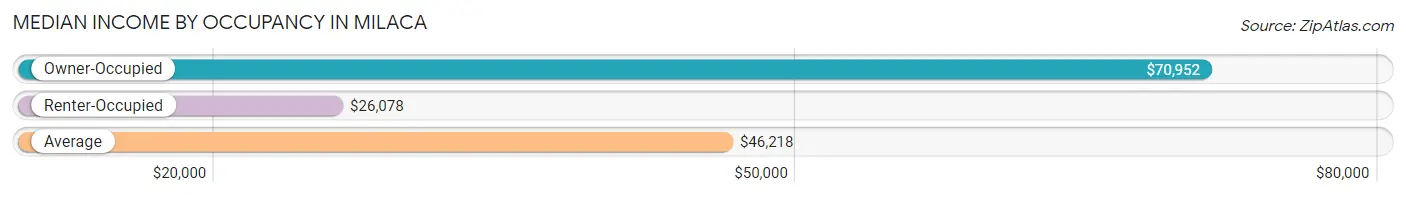
| Occupancy Type | # Households | Median Income |
| Owner-Occupied | 884 (57.7%) | $70,952 |
| Renter-Occupied | 649 (42.3%) | $26,078 |
| Average | 1,533 (100.0%) | $46,218 |
Occupancy by Householder Income Bracket in Milaca
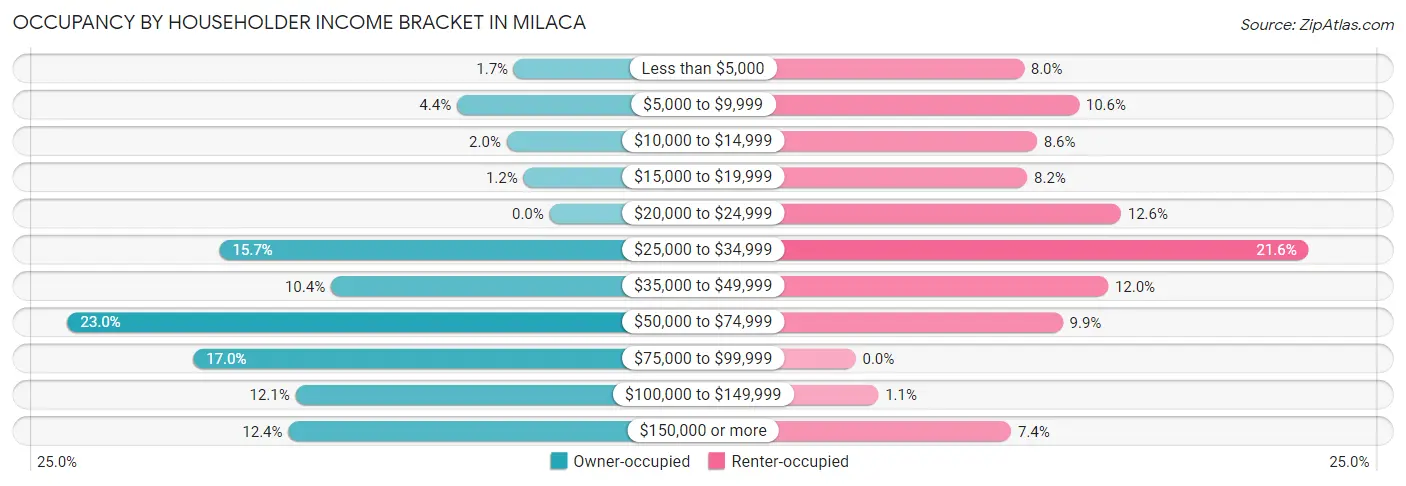
| Income Bracket | Owner-occupied | Renter-occupied |
| Less than $5,000 | 15 (1.7%) | 52 (8.0%) |
| $5,000 to $9,999 | 39 (4.4%) | 69 (10.6%) |
| $10,000 to $14,999 | 18 (2.0%) | 56 (8.6%) |
| $15,000 to $19,999 | 11 (1.2%) | 53 (8.2%) |
| $20,000 to $24,999 | 0 (0.0%) | 82 (12.6%) |
| $25,000 to $34,999 | 139 (15.7%) | 140 (21.6%) |
| $35,000 to $49,999 | 92 (10.4%) | 78 (12.0%) |
| $50,000 to $74,999 | 203 (23.0%) | 64 (9.9%) |
| $75,000 to $99,999 | 150 (17.0%) | 0 (0.0%) |
| $100,000 to $149,999 | 107 (12.1%) | 7 (1.1%) |
| $150,000 or more | 110 (12.4%) | 48 (7.4%) |
| Total | 884 (100.0%) | 649 (100.0%) |
Monthly Housing Cost Tiers in Milaca
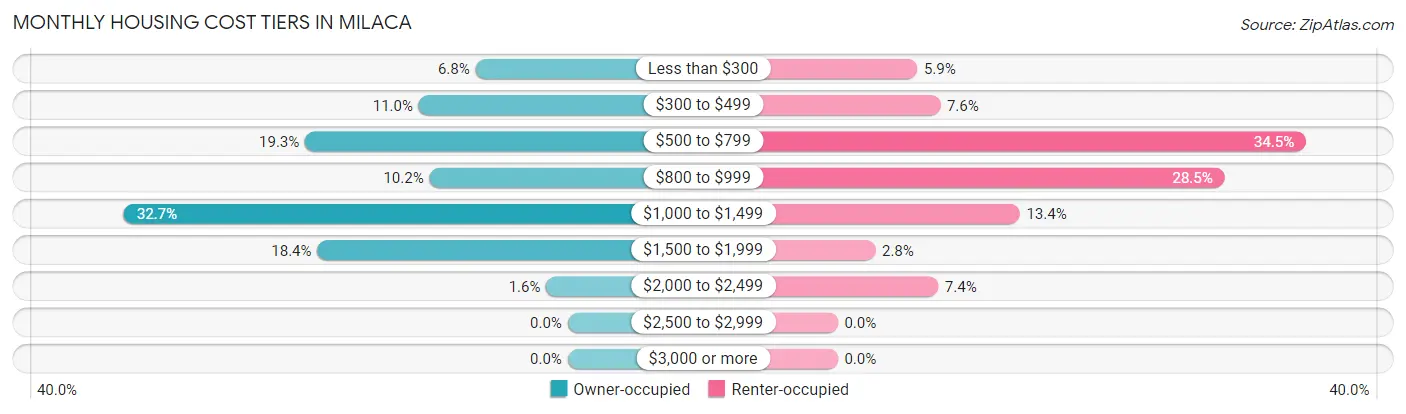
| Monthly Cost | Owner-occupied | Renter-occupied |
| Less than $300 | 60 (6.8%) | 38 (5.9%) |
| $300 to $499 | 97 (11.0%) | 49 (7.5%) |
| $500 to $799 | 171 (19.3%) | 224 (34.5%) |
| $800 to $999 | 90 (10.2%) | 185 (28.5%) |
| $1,000 to $1,499 | 289 (32.7%) | 87 (13.4%) |
| $1,500 to $1,999 | 163 (18.4%) | 18 (2.8%) |
| $2,000 to $2,499 | 14 (1.6%) | 48 (7.4%) |
| $2,500 to $2,999 | 0 (0.0%) | 0 (0.0%) |
| $3,000 or more | 0 (0.0%) | 0 (0.0%) |
| Total | 884 (100.0%) | 649 (100.0%) |
Physical Housing Characteristics in Milaca
Housing Structures in Milaca
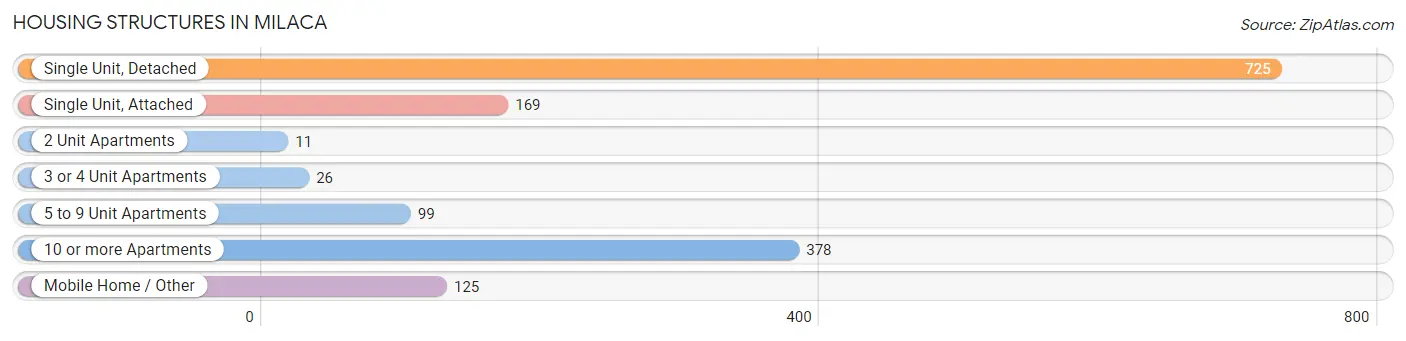
| Structure Type | # Housing Units | % Housing Units |
| Single Unit, Detached | 725 | 47.3% |
| Single Unit, Attached | 169 | 11.0% |
| 2 Unit Apartments | 11 | 0.7% |
| 3 or 4 Unit Apartments | 26 | 1.7% |
| 5 to 9 Unit Apartments | 99 | 6.5% |
| 10 or more Apartments | 378 | 24.7% |
| Mobile Home / Other | 125 | 8.2% |
| Total | 1,533 | 100.0% |
Housing Structures by Occupancy in Milaca
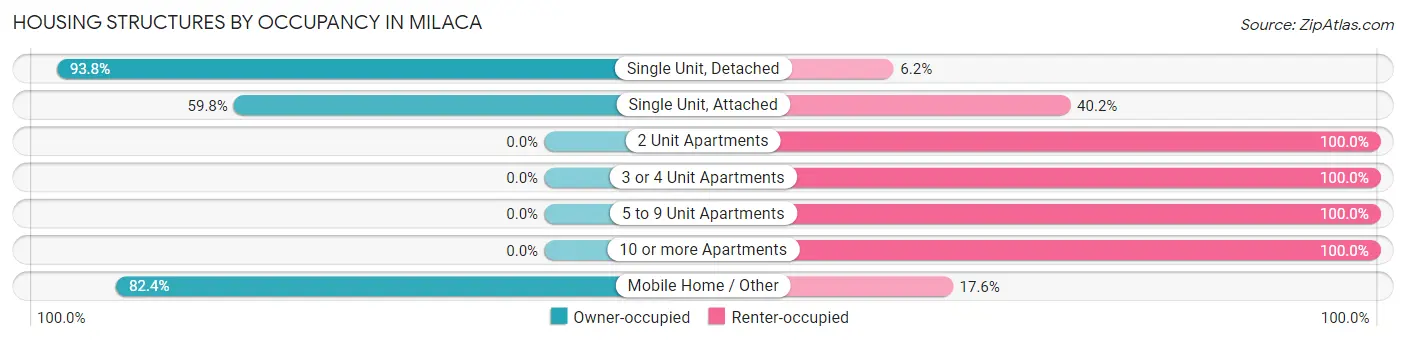
| Structure Type | Owner-occupied | Renter-occupied |
| Single Unit, Detached | 680 (93.8%) | 45 (6.2%) |
| Single Unit, Attached | 101 (59.8%) | 68 (40.2%) |
| 2 Unit Apartments | 0 (0.0%) | 11 (100.0%) |
| 3 or 4 Unit Apartments | 0 (0.0%) | 26 (100.0%) |
| 5 to 9 Unit Apartments | 0 (0.0%) | 99 (100.0%) |
| 10 or more Apartments | 0 (0.0%) | 378 (100.0%) |
| Mobile Home / Other | 103 (82.4%) | 22 (17.6%) |
| Total | 884 (57.7%) | 649 (42.3%) |
Housing Structures by Number of Rooms in Milaca
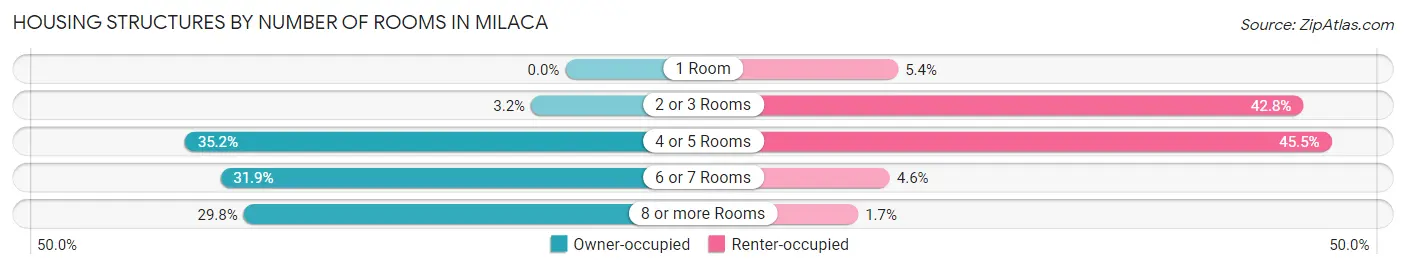
| Number of Rooms | Owner-occupied | Renter-occupied |
| 1 Room | 0 (0.0%) | 35 (5.4%) |
| 2 or 3 Rooms | 28 (3.2%) | 278 (42.8%) |
| 4 or 5 Rooms | 311 (35.2%) | 295 (45.5%) |
| 6 or 7 Rooms | 282 (31.9%) | 30 (4.6%) |
| 8 or more Rooms | 263 (29.7%) | 11 (1.7%) |
| Total | 884 (100.0%) | 649 (100.0%) |
Housing Structure by Heating Type in Milaca
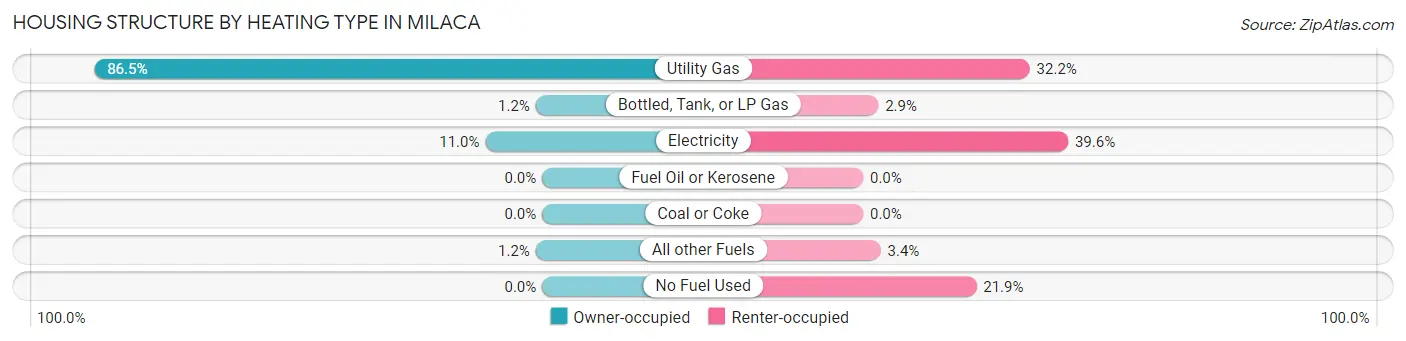
| Heating Type | Owner-occupied | Renter-occupied |
| Utility Gas | 765 (86.5%) | 209 (32.2%) |
| Bottled, Tank, or LP Gas | 11 (1.2%) | 19 (2.9%) |
| Electricity | 97 (11.0%) | 257 (39.6%) |
| Fuel Oil or Kerosene | 0 (0.0%) | 0 (0.0%) |
| Coal or Coke | 0 (0.0%) | 0 (0.0%) |
| All other Fuels | 11 (1.2%) | 22 (3.4%) |
| No Fuel Used | 0 (0.0%) | 142 (21.9%) |
| Total | 884 (100.0%) | 649 (100.0%) |
Household Vehicle Usage in Milaca
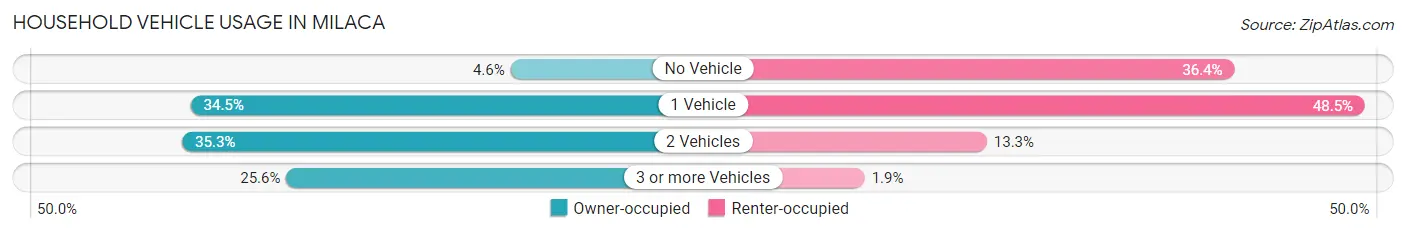
| Vehicles per Household | Owner-occupied | Renter-occupied |
| No Vehicle | 41 (4.6%) | 236 (36.4%) |
| 1 Vehicle | 305 (34.5%) | 315 (48.5%) |
| 2 Vehicles | 312 (35.3%) | 86 (13.3%) |
| 3 or more Vehicles | 226 (25.6%) | 12 (1.8%) |
| Total | 884 (100.0%) | 649 (100.0%) |
Real Estate & Mortgages in Milaca
Real Estate and Mortgage Overview in Milaca
| Characteristic | Without Mortgage | With Mortgage |
| Housing Units | 302 | 582 |
| Median Property Value | $152,100 | $189,900 |
| Median Household Income | $37,500 | $64 |
| Monthly Housing Costs | $490 | $0 |
| Real Estate Taxes | $1,823 | $0 |
Property Value by Mortgage Status in Milaca
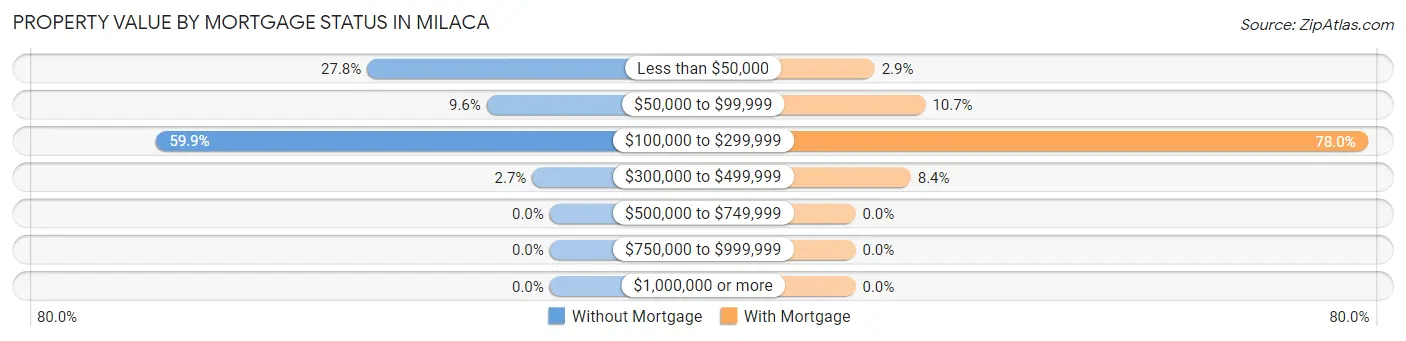
| Property Value | Without Mortgage | With Mortgage |
| Less than $50,000 | 84 (27.8%) | 17 (2.9%) |
| $50,000 to $99,999 | 29 (9.6%) | 62 (10.6%) |
| $100,000 to $299,999 | 181 (59.9%) | 454 (78.0%) |
| $300,000 to $499,999 | 8 (2.6%) | 49 (8.4%) |
| $500,000 to $749,999 | 0 (0.0%) | 0 (0.0%) |
| $750,000 to $999,999 | 0 (0.0%) | 0 (0.0%) |
| $1,000,000 or more | 0 (0.0%) | 0 (0.0%) |
| Total | 302 (100.0%) | 582 (100.0%) |
Household Income by Mortgage Status in Milaca
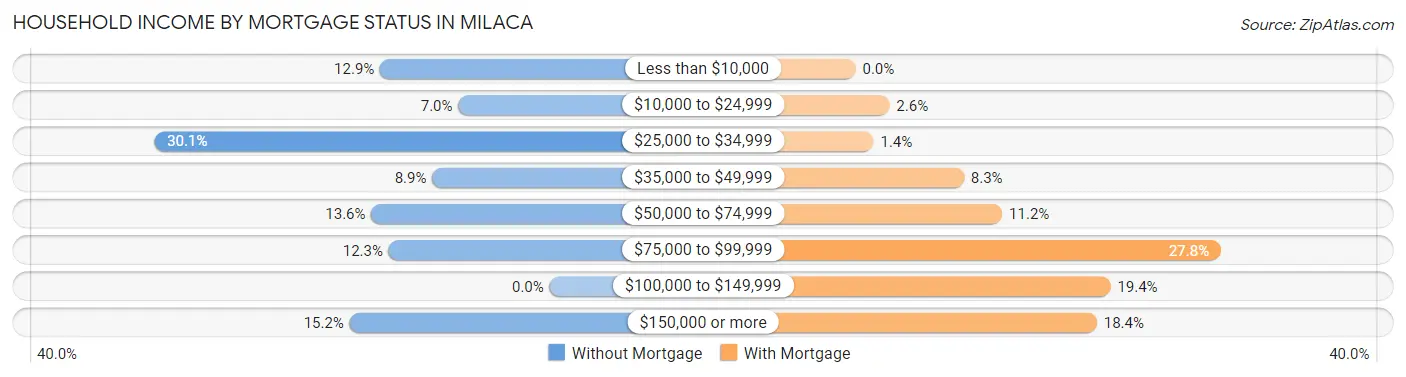
| Household Income | Without Mortgage | With Mortgage |
| Less than $10,000 | 39 (12.9%) | 0 (0.0%) |
| $10,000 to $24,999 | 21 (7.0%) | 15 (2.6%) |
| $25,000 to $34,999 | 91 (30.1%) | 8 (1.4%) |
| $35,000 to $49,999 | 27 (8.9%) | 48 (8.3%) |
| $50,000 to $74,999 | 41 (13.6%) | 65 (11.2%) |
| $75,000 to $99,999 | 37 (12.2%) | 162 (27.8%) |
| $100,000 to $149,999 | 0 (0.0%) | 113 (19.4%) |
| $150,000 or more | 46 (15.2%) | 107 (18.4%) |
| Total | 302 (100.0%) | 582 (100.0%) |
Property Value to Household Income Ratio in Milaca
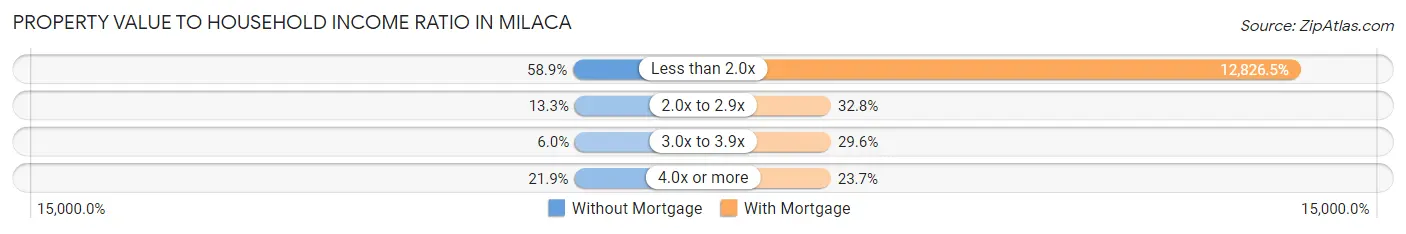
| Value-to-Income Ratio | Without Mortgage | With Mortgage |
| Less than 2.0x | 178 (58.9%) | 74,650 (12,826.5%) |
| 2.0x to 2.9x | 40 (13.3%) | 191 (32.8%) |
| 3.0x to 3.9x | 18 (6.0%) | 172 (29.5%) |
| 4.0x or more | 66 (21.8%) | 138 (23.7%) |
| Total | 302 (100.0%) | 582 (100.0%) |
Real Estate Taxes by Mortgage Status in Milaca
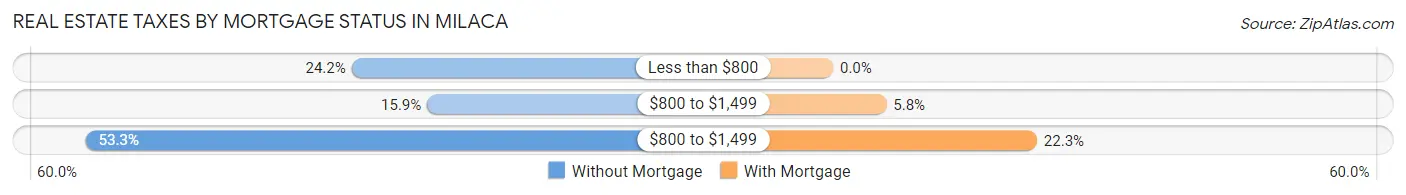
| Property Taxes | Without Mortgage | With Mortgage |
| Less than $800 | 73 (24.2%) | 0 (0.0%) |
| $800 to $1,499 | 48 (15.9%) | 34 (5.8%) |
| $800 to $1,499 | 161 (53.3%) | 130 (22.3%) |
| Total | 302 (100.0%) | 582 (100.0%) |
Health & Disability in Milaca
Health Insurance Coverage by Age in Milaca
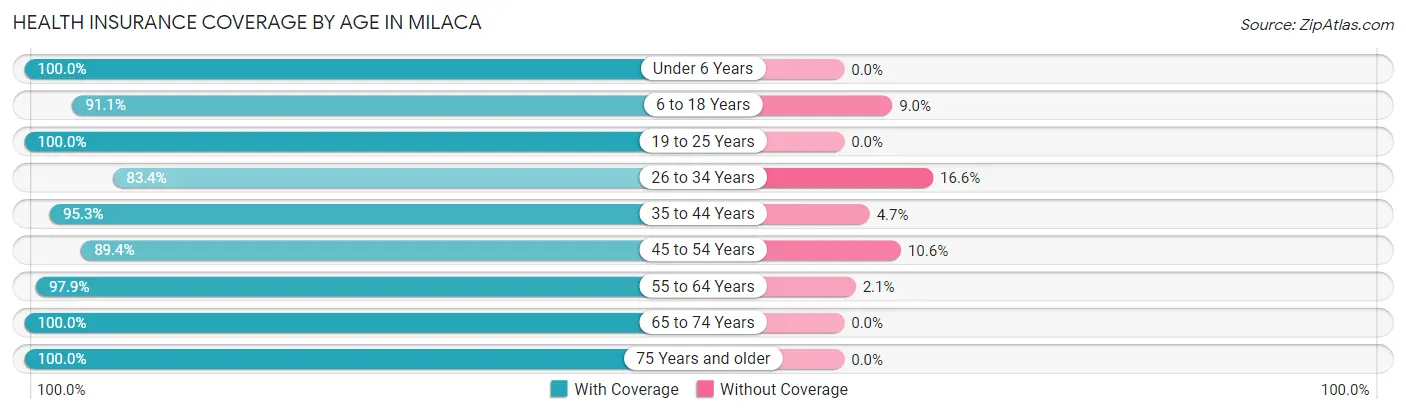
| Age Bracket | With Coverage | Without Coverage |
| Under 6 Years | 188 (100.0%) | 0 (0.0%) |
| 6 to 18 Years | 417 (91.0%) | 41 (8.9%) |
| 19 to 25 Years | 177 (100.0%) | 0 (0.0%) |
| 26 to 34 Years | 267 (83.4%) | 53 (16.6%) |
| 35 to 44 Years | 342 (95.3%) | 17 (4.7%) |
| 45 to 54 Years | 313 (89.4%) | 37 (10.6%) |
| 55 to 64 Years | 459 (97.9%) | 10 (2.1%) |
| 65 to 74 Years | 327 (100.0%) | 0 (0.0%) |
| 75 Years and older | 224 (100.0%) | 0 (0.0%) |
| Total | 2,714 (94.5%) | 158 (5.5%) |
Health Insurance Coverage by Citizenship Status in Milaca
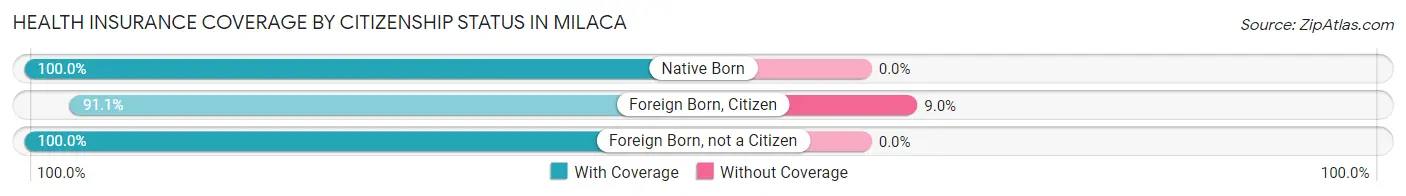
| Citizenship Status | With Coverage | Without Coverage |
| Native Born | 188 (100.0%) | 0 (0.0%) |
| Foreign Born, Citizen | 417 (91.0%) | 41 (8.9%) |
| Foreign Born, not a Citizen | 177 (100.0%) | 0 (0.0%) |
Health Insurance Coverage by Household Income in Milaca
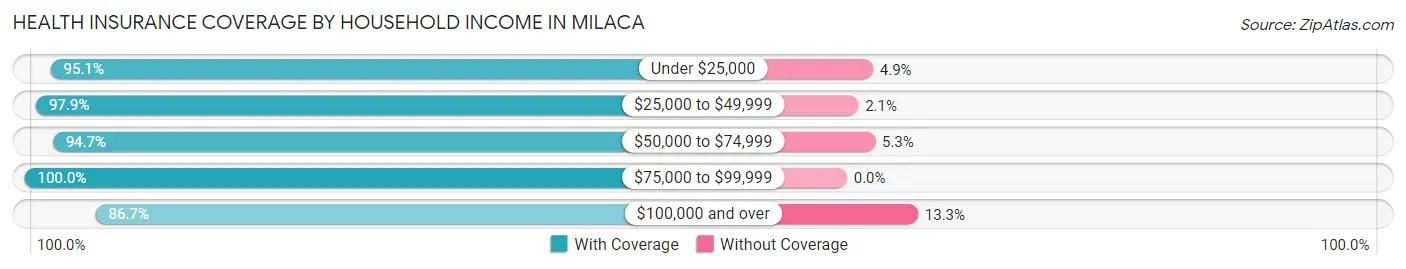
| Household Income | With Coverage | Without Coverage |
| Under $25,000 | 429 (95.1%) | 22 (4.9%) |
| $25,000 to $49,999 | 867 (97.9%) | 19 (2.1%) |
| $50,000 to $74,999 | 485 (94.7%) | 27 (5.3%) |
| $75,000 to $99,999 | 328 (100.0%) | 0 (0.0%) |
| $100,000 and over | 586 (86.7%) | 90 (13.3%) |
Public vs Private Health Insurance Coverage by Age in Milaca
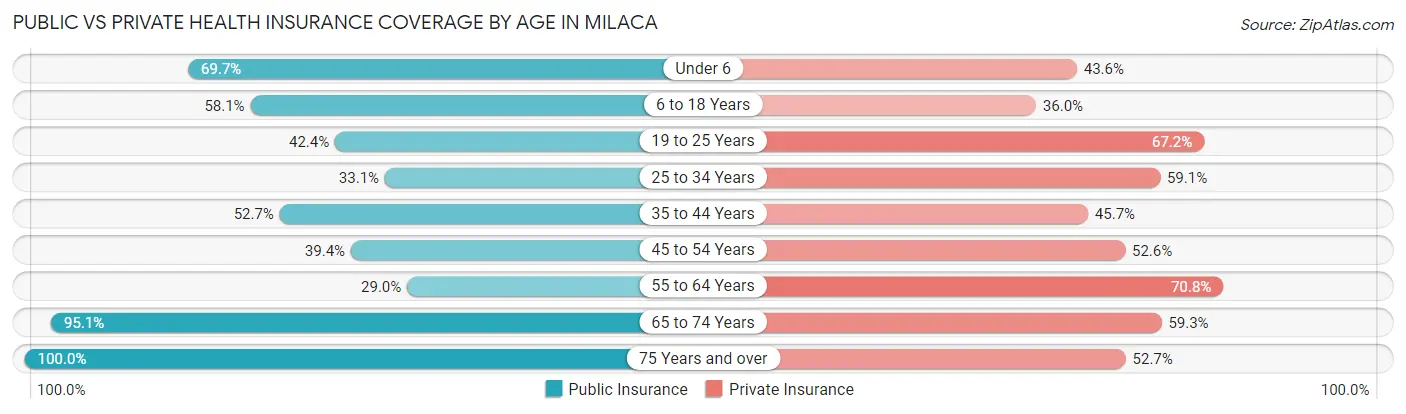
| Age Bracket | Public Insurance | Private Insurance |
| Under 6 | 131 (69.7%) | 82 (43.6%) |
| 6 to 18 Years | 266 (58.1%) | 165 (36.0%) |
| 19 to 25 Years | 75 (42.4%) | 119 (67.2%) |
| 25 to 34 Years | 106 (33.1%) | 189 (59.1%) |
| 35 to 44 Years | 189 (52.6%) | 164 (45.7%) |
| 45 to 54 Years | 138 (39.4%) | 184 (52.6%) |
| 55 to 64 Years | 136 (29.0%) | 332 (70.8%) |
| 65 to 74 Years | 311 (95.1%) | 194 (59.3%) |
| 75 Years and over | 224 (100.0%) | 118 (52.7%) |
| Total | 1,576 (54.9%) | 1,547 (53.9%) |
Disability Status by Sex by Age in Milaca
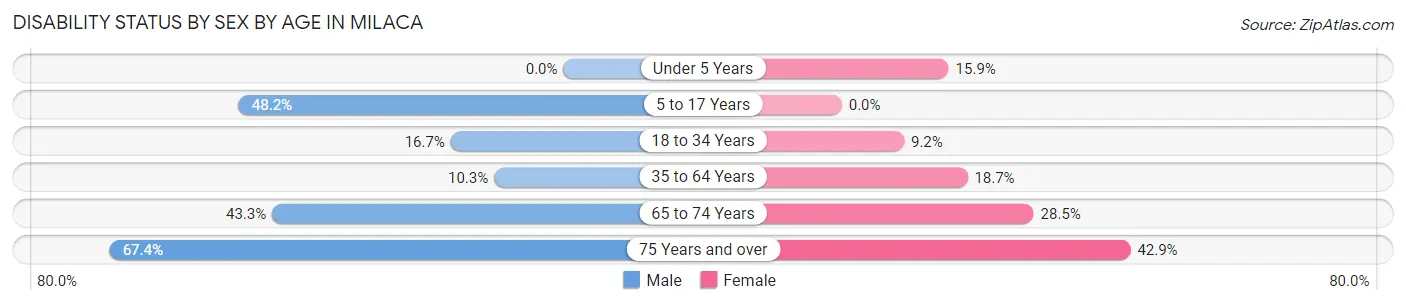
| Age Bracket | Male | Female |
| Under 5 Years | 0 (0.0%) | 10 (15.9%) |
| 5 to 17 Years | 92 (48.2%) | 0 (0.0%) |
| 18 to 34 Years | 45 (16.7%) | 28 (9.2%) |
| 35 to 64 Years | 60 (10.3%) | 111 (18.7%) |
| 65 to 74 Years | 61 (43.3%) | 53 (28.5%) |
| 75 Years and over | 66 (67.3%) | 54 (42.9%) |
Disability Class by Sex by Age in Milaca
Disability Class: Hearing Difficulty
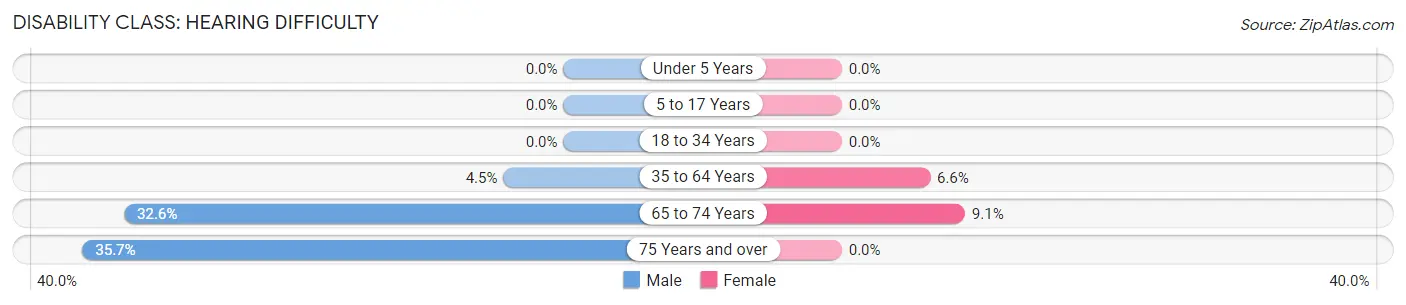
| Age Bracket | Male | Female |
| Under 5 Years | 0 (0.0%) | 0 (0.0%) |
| 5 to 17 Years | 0 (0.0%) | 0 (0.0%) |
| 18 to 34 Years | 0 (0.0%) | 0 (0.0%) |
| 35 to 64 Years | 26 (4.5%) | 39 (6.6%) |
| 65 to 74 Years | 46 (32.6%) | 17 (9.1%) |
| 75 Years and over | 35 (35.7%) | 0 (0.0%) |
Disability Class: Vision Difficulty
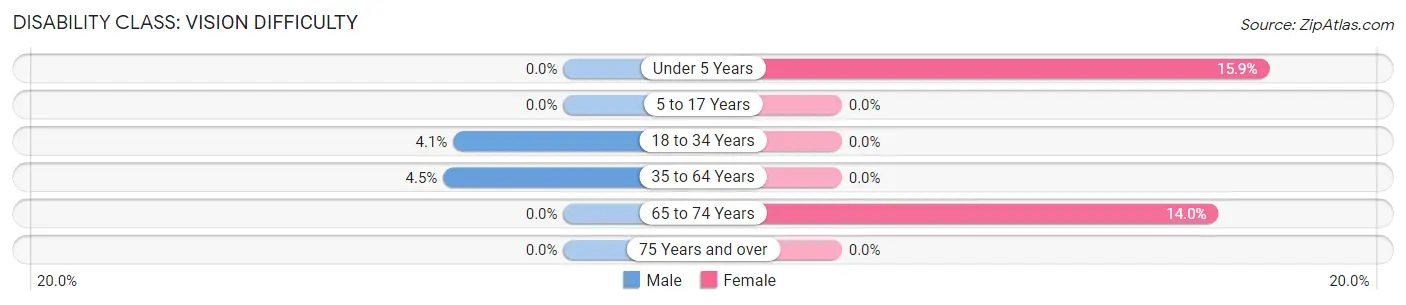
| Age Bracket | Male | Female |
| Under 5 Years | 0 (0.0%) | 10 (15.9%) |
| 5 to 17 Years | 0 (0.0%) | 0 (0.0%) |
| 18 to 34 Years | 11 (4.1%) | 0 (0.0%) |
| 35 to 64 Years | 26 (4.5%) | 0 (0.0%) |
| 65 to 74 Years | 0 (0.0%) | 26 (14.0%) |
| 75 Years and over | 0 (0.0%) | 0 (0.0%) |
Disability Class: Cognitive Difficulty
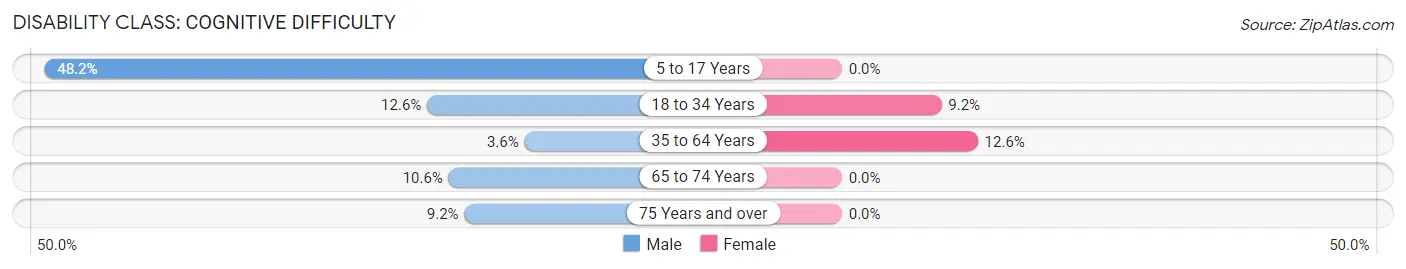
| Age Bracket | Male | Female |
| 5 to 17 Years | 92 (48.2%) | 0 (0.0%) |
| 18 to 34 Years | 34 (12.6%) | 28 (9.2%) |
| 35 to 64 Years | 21 (3.6%) | 75 (12.6%) |
| 65 to 74 Years | 15 (10.6%) | 0 (0.0%) |
| 75 Years and over | 9 (9.2%) | 0 (0.0%) |
Disability Class: Ambulatory Difficulty
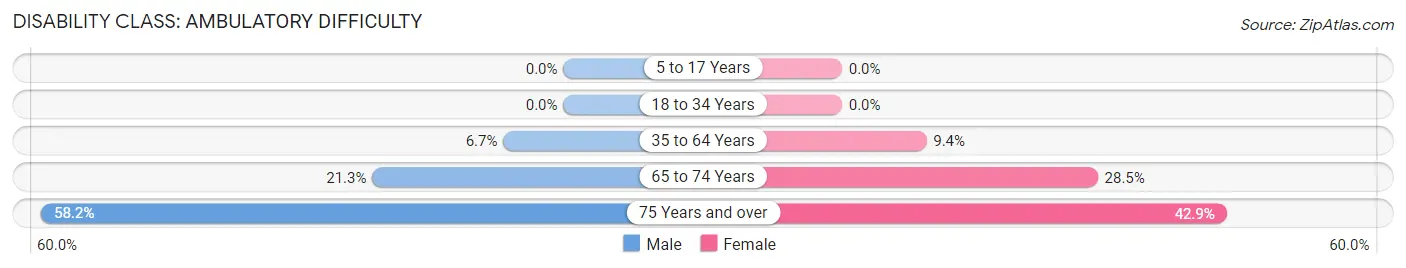
| Age Bracket | Male | Female |
| 5 to 17 Years | 0 (0.0%) | 0 (0.0%) |
| 18 to 34 Years | 0 (0.0%) | 0 (0.0%) |
| 35 to 64 Years | 39 (6.7%) | 56 (9.4%) |
| 65 to 74 Years | 30 (21.3%) | 53 (28.5%) |
| 75 Years and over | 57 (58.2%) | 54 (42.9%) |
Disability Class: Self-Care Difficulty
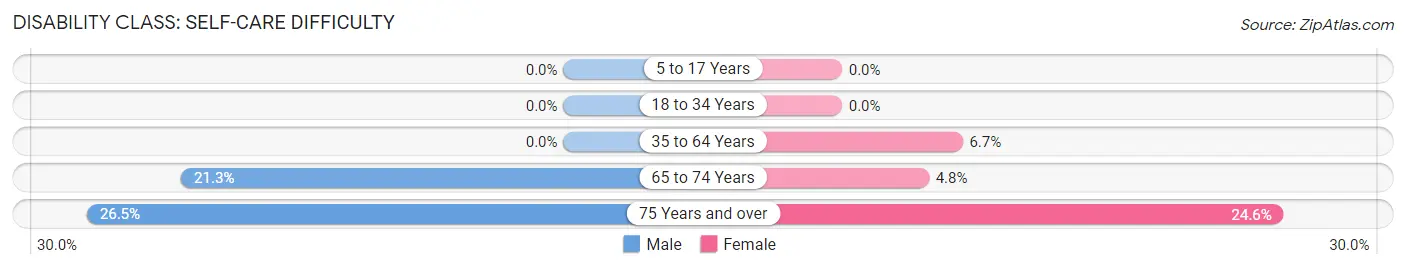
| Age Bracket | Male | Female |
| 5 to 17 Years | 0 (0.0%) | 0 (0.0%) |
| 18 to 34 Years | 0 (0.0%) | 0 (0.0%) |
| 35 to 64 Years | 0 (0.0%) | 40 (6.7%) |
| 65 to 74 Years | 30 (21.3%) | 9 (4.8%) |
| 75 Years and over | 26 (26.5%) | 31 (24.6%) |
Technology Access in Milaca
Computing Device Access in Milaca
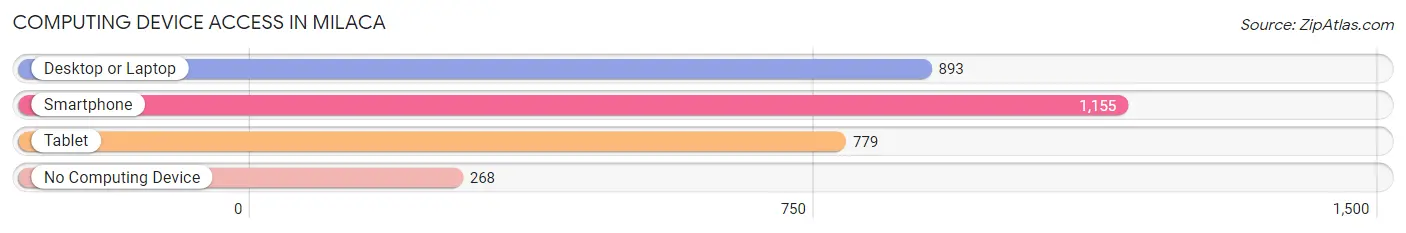
| Device Type | # Households | % Households |
| Desktop or Laptop | 893 | 58.3% |
| Smartphone | 1,155 | 75.3% |
| Tablet | 779 | 50.8% |
| No Computing Device | 268 | 17.5% |
| Total | 1,533 | 100.0% |
Internet Access in Milaca
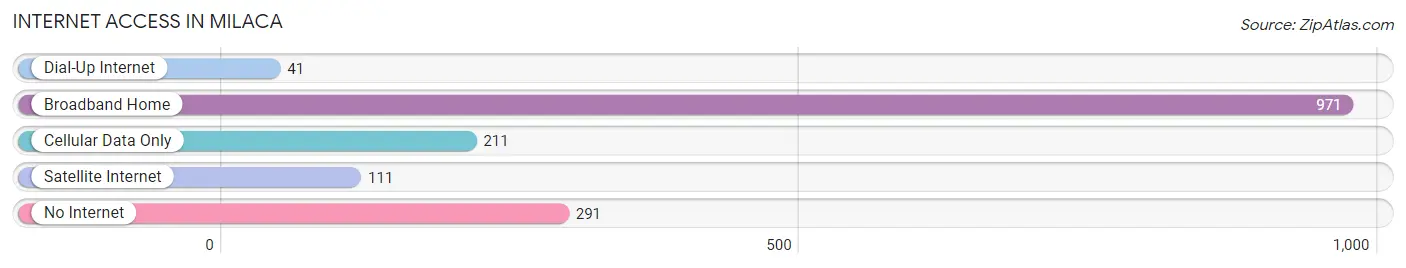
| Internet Type | # Households | % Households |
| Dial-Up Internet | 41 | 2.7% |
| Broadband Home | 971 | 63.3% |
| Cellular Data Only | 211 | 13.8% |
| Satellite Internet | 111 | 7.2% |
| No Internet | 291 | 19.0% |
| Total | 1,533 | 100.0% |
Milaca Summary
History
The area now known as Milaca, Minnesota was first inhabited by the Dakota Sioux people. The first European settlers arrived in the area in the mid-1800s, and the town was officially founded in 1856. The town was named after the Mille Lacs Lake, which was named by French explorers in the late 1600s. The lake was named after the Mille Lacs Band of Ojibwe, who had inhabited the area for centuries.
The town of Milaca was originally a logging and farming community. The first sawmill was built in 1856, and the first grist mill was built in 1858. The town was incorporated in 1872, and the first post office was established in 1873. The first school was built in 1876, and the first church was built in 1877.
The railroad arrived in Milaca in 1881, and the town quickly grew. The population increased from just over 500 in 1880 to over 1,000 in 1900. The town was home to several businesses, including a bank, a hotel, a newspaper, and a variety of stores.
In the early 1900s, Milaca became a popular tourist destination. The town was home to several resorts, and the Mille Lacs Lake was a popular fishing spot. The town also had a thriving lumber industry, and the Milaca Lumber Company was one of the largest employers in the area.
The Great Depression hit Milaca hard, and the population declined from 1,500 in 1930 to just over 1,000 in 1940. The town slowly recovered, and the population increased to 1,500 by 1950.
Geography
Milaca is located in central Minnesota, in Mille Lacs County. The town is situated on the banks of the Rum River, which flows into the Mille Lacs Lake. The town is located about 50 miles north of Minneapolis, and about 25 miles south of St. Cloud.
The town has a total area of 2.2 square miles, all of which is land. The terrain is mostly flat, with some rolling hills. The town is located in a temperate climate, with warm summers and cold winters.
Economy
The economy of Milaca is largely based on agriculture and tourism. The town is home to several farms, and the surrounding area is known for its dairy and beef production. The town is also home to several resorts, which attract tourists from all over the region.
The town is also home to several manufacturing companies, including a paper mill, a plastics factory, and a metal fabrication plant. The town is also home to several retail stores, restaurants, and other businesses.
Demographics
As of the 2010 census, the population of Milaca was 2,845. The population is mostly white (96.2%), with small percentages of African American (1.2%), Native American (0.7%), Asian (0.4%), and other races (1.5%).
The median household income in Milaca is $45,938, and the median family income is $54,917. The town has a poverty rate of 11.3%, and the unemployment rate is 4.2%. The town has a high school graduation rate of 87.3%.
Common Questions
What is Per Capita Income in Milaca?
Per Capita income in Milaca is $33,236.
What is the Median Family Income in Milaca?
Median Family Income in Milaca is $65,807.
What is the Median Household income in Milaca?
Median Household Income in Milaca is $46,218.
What is Income or Wage Gap in Milaca?
Income or Wage Gap in Milaca is 33.3%.
Women in Milaca earn 66.7 cents for every dollar earned by a man.
What is Family Income Deficit in Milaca?
Family Income Deficit in Milaca is $5,593.
Families that are below poverty line in Milaca earn $5,593 less on average than the poverty threshold level.
What is Inequality or Gini Index in Milaca?
Inequality or Gini Index in Milaca is 0.46.
What is the Total Population of Milaca?
Total Population of Milaca is 3,031.
What is the Total Male Population of Milaca?
Total Male Population of Milaca is 1,487.
What is the Total Female Population of Milaca?
Total Female Population of Milaca is 1,544.
What is the Ratio of Males per 100 Females in Milaca?
There are 96.31 Males per 100 Females in Milaca.
What is the Ratio of Females per 100 Males in Milaca?
There are 103.83 Females per 100 Males in Milaca.
What is the Median Population Age in Milaca?
Median Population Age in Milaca is 43.5 Years.
What is the Average Family Size in Milaca
Average Family Size in Milaca is 2.7 People.
What is the Average Household Size in Milaca
Average Household Size in Milaca is 1.9 People.
How Large is the Labor Force in Milaca?
There are 1,575 People in the Labor Forcein in Milaca.
What is the Percentage of People in the Labor Force in Milaca?
62.9% of People are in the Labor Force in Milaca.
What is the Unemployment Rate in Milaca?
Unemployment Rate in Milaca is 0.9%.