Slayton, MN Map & Demographics
Slayton Map
Slayton Overview
$36,885
PER CAPITA INCOME
$95,375
AVG FAMILY INCOME
$58,026
AVG HOUSEHOLD INCOME
17.9%
WAGE / INCOME GAP [ % ]
82.1¢/ $1
WAGE / INCOME GAP [ $ ]
0.45
INEQUALITY / GINI INDEX
2,053
TOTAL POPULATION
959
MALE POPULATION
1,094
FEMALE POPULATION
87.66
MALES / 100 FEMALES
114.08
FEMALES / 100 MALES
40.3
MEDIAN AGE
3.1
AVG FAMILY SIZE
2.2
AVG HOUSEHOLD SIZE
1,038
LABOR FORCE [ PEOPLE ]
62.0%
PERCENT IN LABOR FORCE
3.8%
UNEMPLOYMENT RATE
Slayton Zip Codes
Slayton Area Codes
Income in Slayton
Income Overview in Slayton
Per Capita Income in Slayton is $36,885, while median incomes of families and households are $95,375 and $58,026 respectively.
| Characteristic | Number | Measure |
| Per Capita Income | 2,053 | $36,885 |
| Median Family Income | 481 | $95,375 |
| Mean Family Income | 481 | $110,921 |
| Median Household Income | 908 | $58,026 |
| Mean Household Income | 908 | $78,482 |
| Income Deficit | 481 | $0 |
| Wage / Income Gap (%) | 2,053 | 17.88% |
| Wage / Income Gap ($) | 2,053 | 82.12¢ per $1 |
| Gini / Inequality Index | 2,053 | 0.45 |
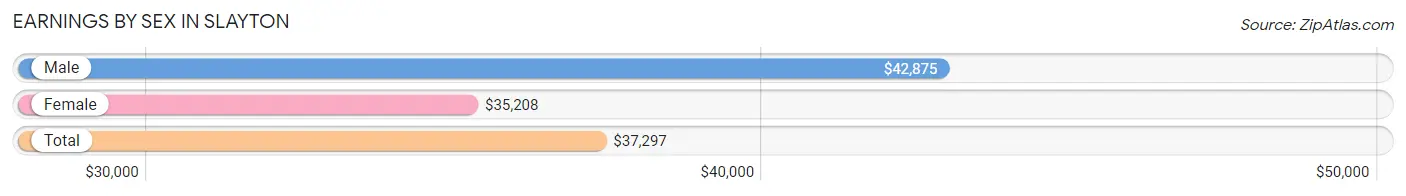
Earnings by Sex in Slayton
Average Earnings in Slayton are $37,297, $42,875 for men and $35,208 for women, a difference of 17.9%.
| Sex | Number | Average Earnings |
| Male | 541 (48.9%) | $42,875 |
| Female | 565 (51.1%) | $35,208 |
| Total | 1,106 (100.0%) | $37,297 |
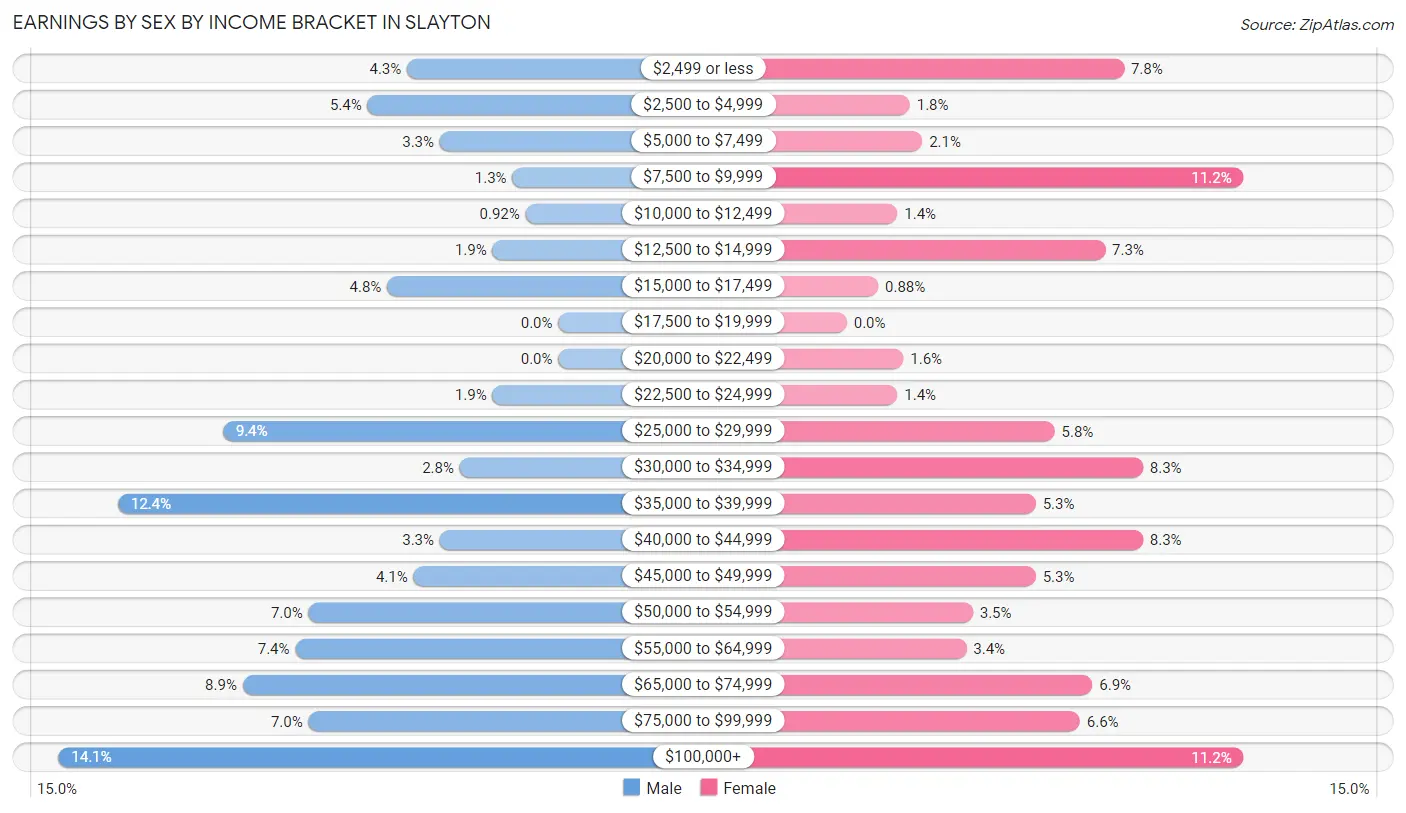
Earnings by Sex by Income Bracket in Slayton
The most common earnings brackets in Slayton are $100,000+ for men (76 | 14.1%) and $7,500 to $9,999 for women (63 | 11.2%).
| Income | Male | Female |
| $2,499 or less | 23 (4.3%) | 44 (7.8%) |
| $2,500 to $4,999 | 29 (5.4%) | 10 (1.8%) |
| $5,000 to $7,499 | 18 (3.3%) | 12 (2.1%) |
| $7,500 to $9,999 | 7 (1.3%) | 63 (11.2%) |
| $10,000 to $12,499 | 5 (0.9%) | 8 (1.4%) |
| $12,500 to $14,999 | 10 (1.8%) | 41 (7.3%) |
| $15,000 to $17,499 | 26 (4.8%) | 5 (0.9%) |
| $17,500 to $19,999 | 0 (0.0%) | 0 (0.0%) |
| $20,000 to $22,499 | 0 (0.0%) | 9 (1.6%) |
| $22,500 to $24,999 | 10 (1.8%) | 8 (1.4%) |
| $25,000 to $29,999 | 51 (9.4%) | 33 (5.8%) |
| $30,000 to $34,999 | 15 (2.8%) | 47 (8.3%) |
| $35,000 to $39,999 | 67 (12.4%) | 30 (5.3%) |
| $40,000 to $44,999 | 18 (3.3%) | 47 (8.3%) |
| $45,000 to $49,999 | 22 (4.1%) | 30 (5.3%) |
| $50,000 to $54,999 | 38 (7.0%) | 20 (3.5%) |
| $55,000 to $64,999 | 40 (7.4%) | 19 (3.4%) |
| $65,000 to $74,999 | 48 (8.9%) | 39 (6.9%) |
| $75,000 to $99,999 | 38 (7.0%) | 37 (6.6%) |
| $100,000+ | 76 (14.1%) | 63 (11.2%) |
| Total | 541 (100.0%) | 565 (100.0%) |
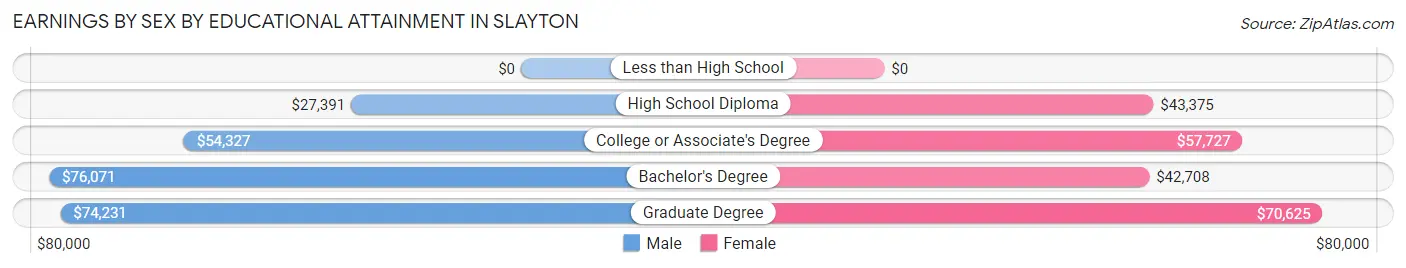
Earnings by Sex by Educational Attainment in Slayton
Average earnings in Slayton are $52,368 for men and $43,603 for women, a difference of 16.7%. Men with an educational attainment of bachelor's degree enjoy the highest average annual earnings of $76,071, while those with high school diploma education earn the least with $27,391. Women with an educational attainment of graduate degree earn the most with the average annual earnings of $70,625, while those with bachelor's degree education have the smallest earnings of $42,708.
| Educational Attainment | Male Income | Female Income |
| Less than High School | - | - |
| High School Diploma | $27,391 | $43,375 |
| College or Associate's Degree | $54,327 | $57,727 |
| Bachelor's Degree | $76,071 | $42,708 |
| Graduate Degree | $74,231 | $70,625 |
| Total | $52,368 | $43,603 |
Family Income in Slayton
Family Income Brackets in Slayton
According to the Slayton family income data, there are 93 families falling into the $75,000 to $99,999 income range, which is the most common income bracket and makes up 19.3% of all families. Conversely, the $10,000 to $14,999 income bracket is the least frequent group with only 3 families (0.6%) belonging to this category.
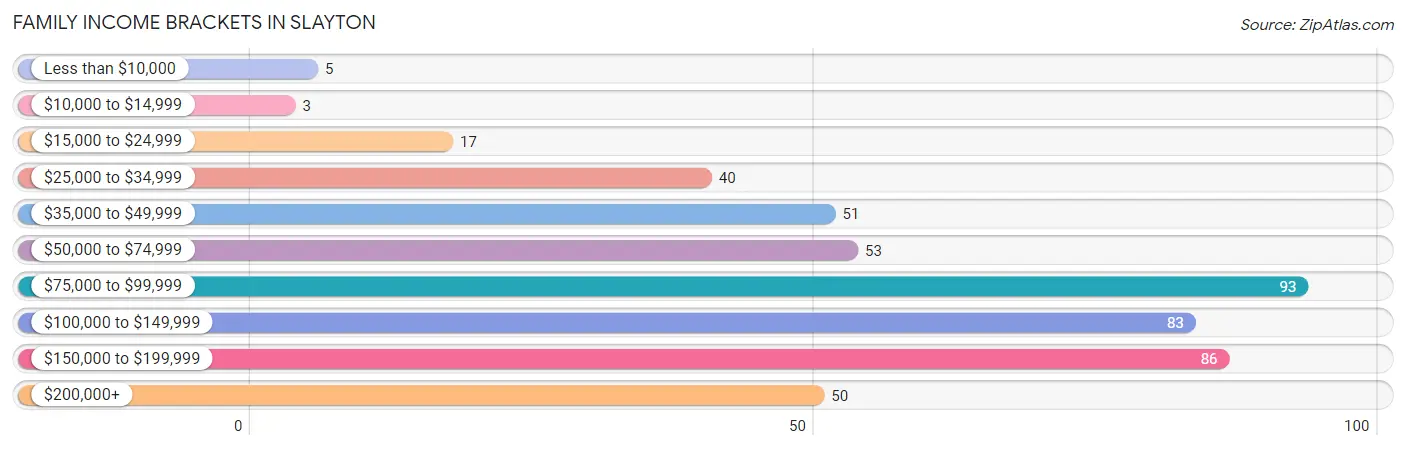
| Income Bracket | # Families | % Families |
| Less than $10,000 | 5 | 1.0% |
| $10,000 to $14,999 | 3 | 0.6% |
| $15,000 to $24,999 | 17 | 3.5% |
| $25,000 to $34,999 | 40 | 8.3% |
| $35,000 to $49,999 | 51 | 10.6% |
| $50,000 to $74,999 | 53 | 11.0% |
| $75,000 to $99,999 | 93 | 19.3% |
| $100,000 to $149,999 | 83 | 17.3% |
| $150,000 to $199,999 | 86 | 17.9% |
| $200,000+ | 50 | 10.4% |
Family Income by Famaliy Size in Slayton
5-person families (38 | 7.9%) account for the highest median family income in Slayton with $190,741 per family, while 2-person families (257 | 53.4%) have the highest median income of $39,323 per family member.
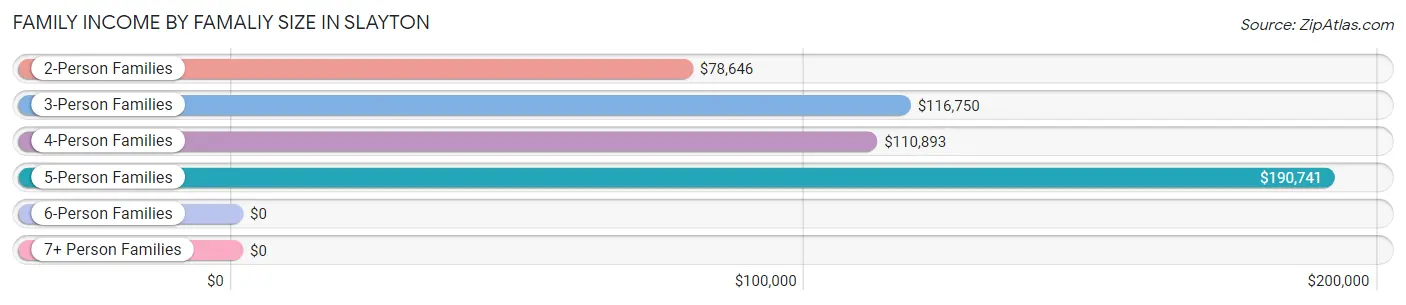
| Income Bracket | # Families | Median Income |
| 2-Person Families | 257 (53.4%) | $78,646 |
| 3-Person Families | 77 (16.0%) | $116,750 |
| 4-Person Families | 94 (19.5%) | $110,893 |
| 5-Person Families | 38 (7.9%) | $190,741 |
| 6-Person Families | 11 (2.3%) | $0 |
| 7+ Person Families | 4 (0.8%) | $0 |
| Total | 481 (100.0%) | $95,375 |
Family Income by Number of Earners in Slayton
The median family income in Slayton is $95,375, with families comprising 3+ earners (54) having the highest median family income of $186,250, while families with no earners (79) have the lowest median family income of $46,964, accounting for 11.2% and 16.4% of families, respectively.
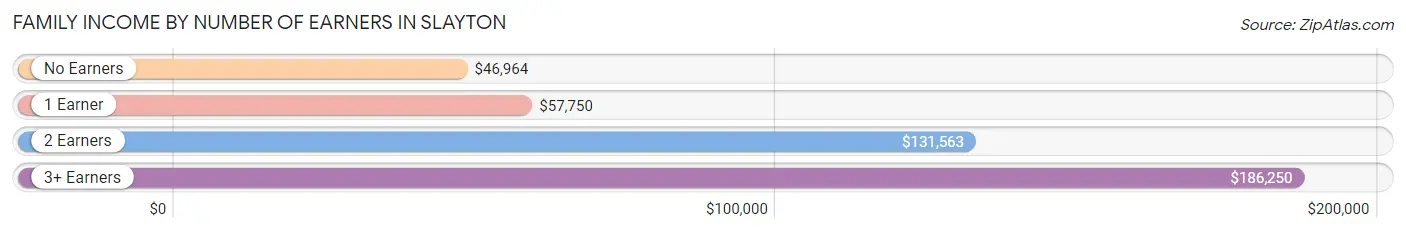
| Number of Earners | # Families | Median Income |
| No Earners | 79 (16.4%) | $46,964 |
| 1 Earner | 153 (31.8%) | $57,750 |
| 2 Earners | 195 (40.5%) | $131,563 |
| 3+ Earners | 54 (11.2%) | $186,250 |
| Total | 481 (100.0%) | $95,375 |
Household Income in Slayton
Household Income Brackets in Slayton
With 141 households falling in the category, the $35,000 to $49,999 income range is the most frequent in Slayton, accounting for 15.5% of all households. In contrast, only 25 households (2.8%) fall into the less than $10,000 income bracket, making it the least populous group.
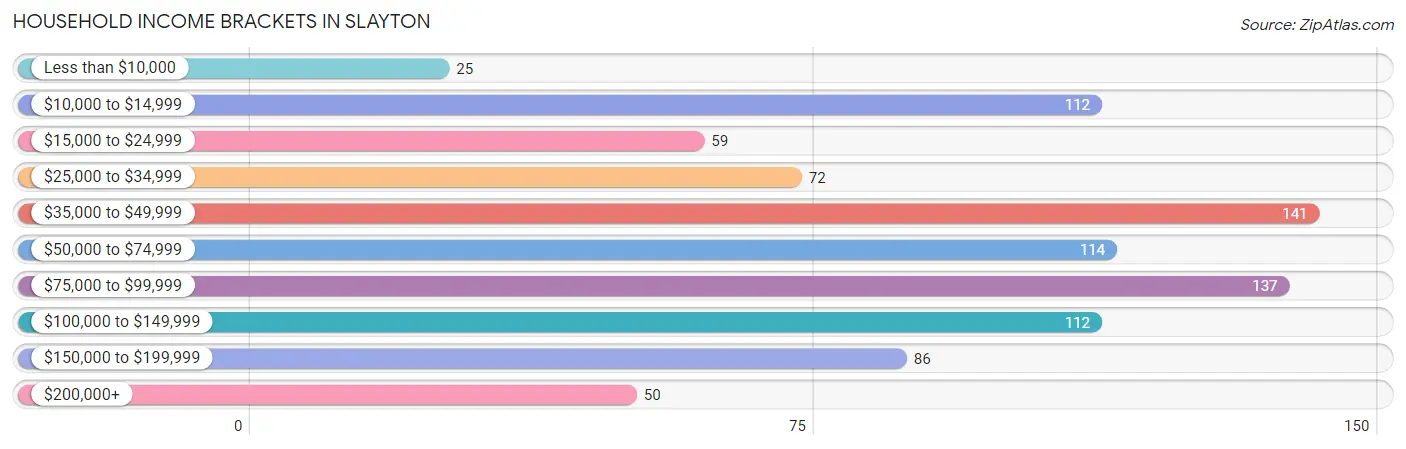
| Income Bracket | # Households | % Households |
| Less than $10,000 | 25 | 2.8% |
| $10,000 to $14,999 | 112 | 12.3% |
| $15,000 to $24,999 | 59 | 6.5% |
| $25,000 to $34,999 | 72 | 7.9% |
| $35,000 to $49,999 | 141 | 15.5% |
| $50,000 to $74,999 | 114 | 12.6% |
| $75,000 to $99,999 | 137 | 15.1% |
| $100,000 to $149,999 | 112 | 12.3% |
| $150,000 to $199,999 | 86 | 9.5% |
| $200,000+ | 50 | 5.5% |
Household Income by Householder Age in Slayton
The median household income in Slayton is $58,026, with the highest median household income of $85,000 found in the 25 to 44 years age bracket for the primary householder. A total of 284 households (31.3%) fall into this category. Meanwhile, the 15 to 24 years age bracket for the primary householder has the lowest median household income of $0, with 66 households (7.3%) in this group.
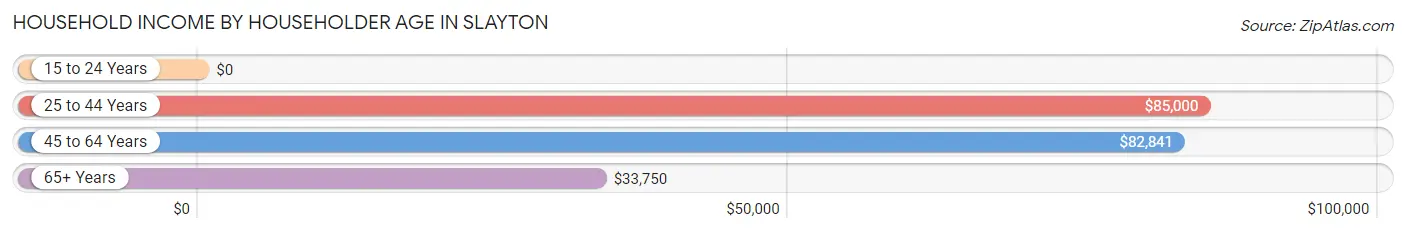
| Income Bracket | # Households | Median Income |
| 15 to 24 Years | 66 (7.3%) | $0 |
| 25 to 44 Years | 284 (31.3%) | $85,000 |
| 45 to 64 Years | 207 (22.8%) | $82,841 |
| 65+ Years | 351 (38.7%) | $33,750 |
| Total | 908 (100.0%) | $58,026 |
Poverty in Slayton
Income Below Poverty by Sex and Age in Slayton
With 7.0% poverty level for males and 11.6% for females among the residents of Slayton, 65 to 74 year old males and 18 to 24 year old females are the most vulnerable to poverty, with 18 males (23.1%) and 63 females (60.6%) in their respective age groups living below the poverty level.
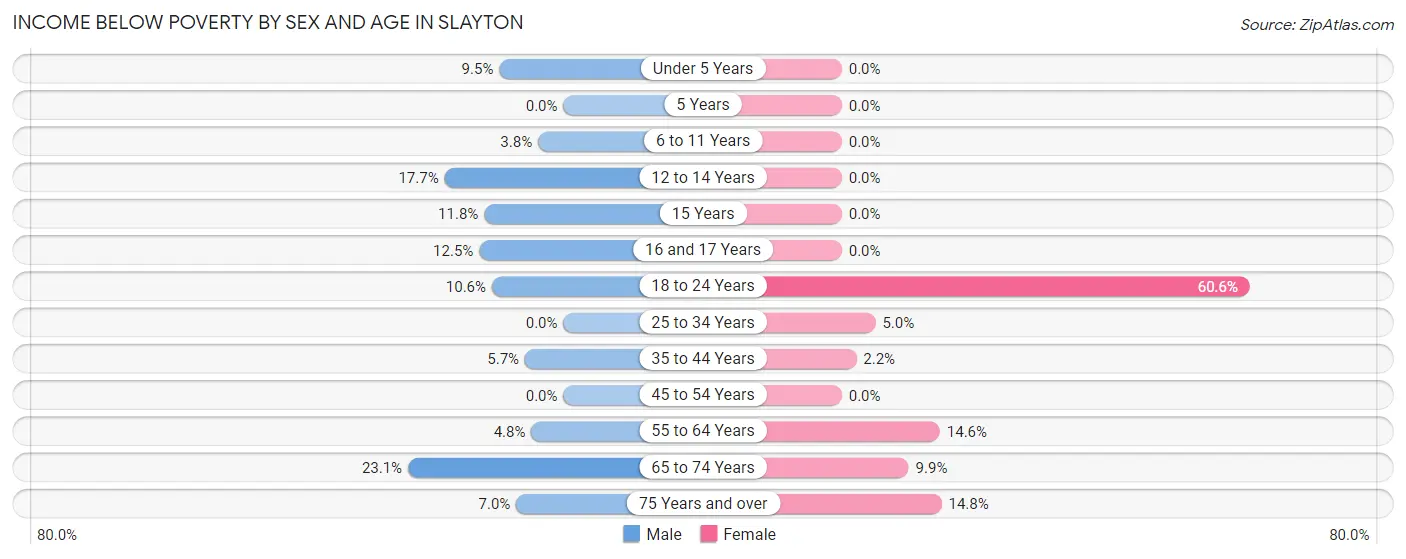
| Age Bracket | Male | Female |
| Under 5 Years | 4 (9.5%) | 0 (0.0%) |
| 5 Years | 0 (0.0%) | 0 (0.0%) |
| 6 to 11 Years | 4 (3.8%) | 0 (0.0%) |
| 12 to 14 Years | 3 (17.6%) | 0 (0.0%) |
| 15 Years | 2 (11.8%) | 0 (0.0%) |
| 16 and 17 Years | 3 (12.5%) | 0 (0.0%) |
| 18 to 24 Years | 12 (10.6%) | 63 (60.6%) |
| 25 to 34 Years | 0 (0.0%) | 5 (5.0%) |
| 35 to 44 Years | 9 (5.7%) | 3 (2.2%) |
| 45 to 54 Years | 0 (0.0%) | 0 (0.0%) |
| 55 to 64 Years | 4 (4.8%) | 15 (14.6%) |
| 65 to 74 Years | 18 (23.1%) | 15 (9.9%) |
| 75 Years and over | 7 (7.0%) | 24 (14.8%) |
| Total | 66 (7.0%) | 125 (11.6%) |
Income Above Poverty by Sex and Age in Slayton
According to the poverty statistics in Slayton, males aged 5 years and females aged under 5 years are the age groups that are most secure financially, with 100.0% of males and 100.0% of females in these age groups living above the poverty line.
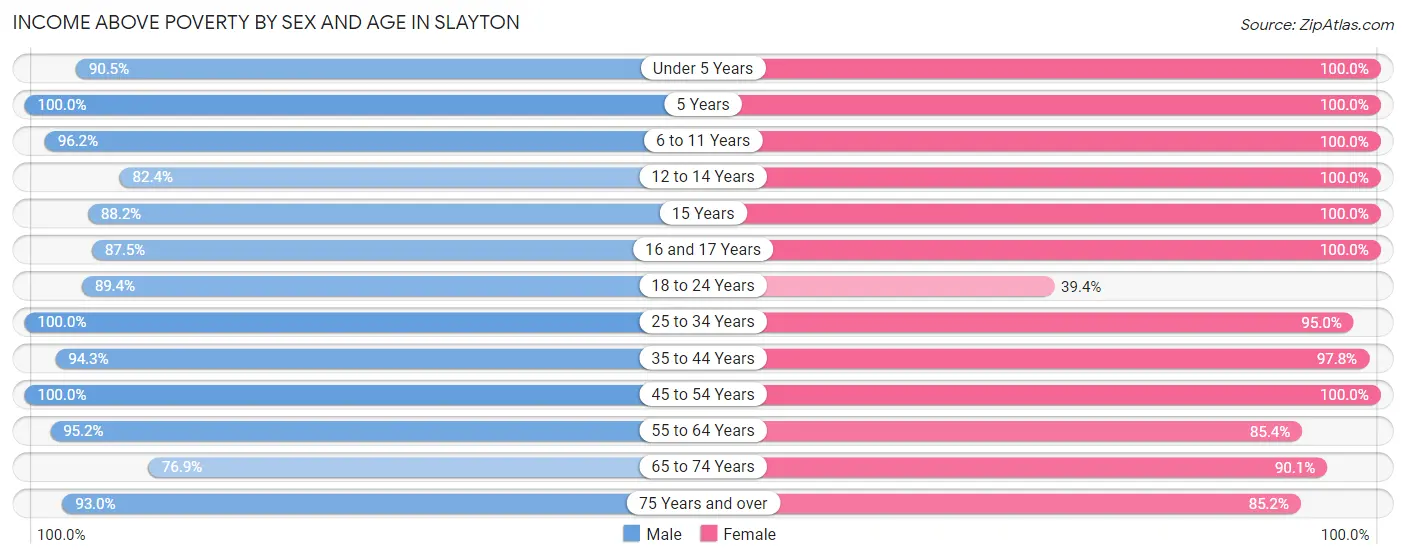
| Age Bracket | Male | Female |
| Under 5 Years | 38 (90.5%) | 49 (100.0%) |
| 5 Years | 24 (100.0%) | 5 (100.0%) |
| 6 to 11 Years | 102 (96.2%) | 36 (100.0%) |
| 12 to 14 Years | 14 (82.4%) | 65 (100.0%) |
| 15 Years | 15 (88.2%) | 15 (100.0%) |
| 16 and 17 Years | 21 (87.5%) | 55 (100.0%) |
| 18 to 24 Years | 101 (89.4%) | 41 (39.4%) |
| 25 to 34 Years | 115 (100.0%) | 95 (95.0%) |
| 35 to 44 Years | 149 (94.3%) | 136 (97.8%) |
| 45 to 54 Years | 71 (100.0%) | 93 (100.0%) |
| 55 to 64 Years | 80 (95.2%) | 88 (85.4%) |
| 65 to 74 Years | 60 (76.9%) | 136 (90.1%) |
| 75 Years and over | 93 (93.0%) | 138 (85.2%) |
| Total | 883 (93.0%) | 952 (88.4%) |
Income Below Poverty Among Married-Couple Families in Slayton
The poverty statistics for married-couple families in Slayton show that 0.8% or 3 of the total 388 families live below the poverty line. Families with no children have the highest poverty rate of 1.3%, comprising of 3 families. On the other hand, families with 1 or 2 children have the lowest poverty rate of 0.0%, which includes 0 families.
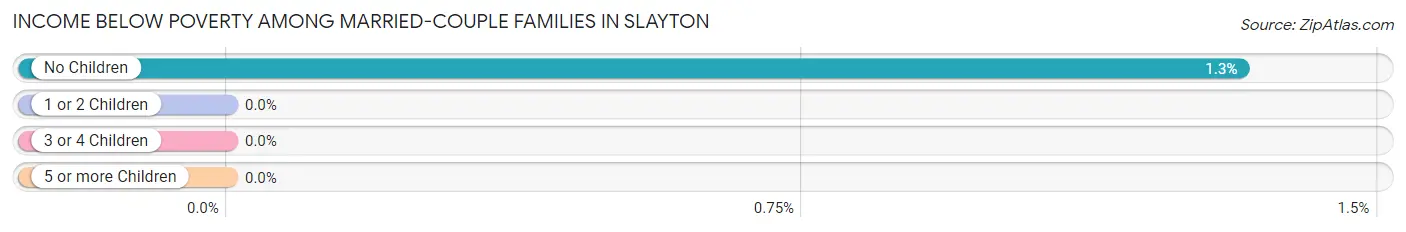
| Children | Above Poverty | Below Poverty |
| No Children | 224 (98.7%) | 3 (1.3%) |
| 1 or 2 Children | 113 (100.0%) | 0 (0.0%) |
| 3 or 4 Children | 44 (100.0%) | 0 (0.0%) |
| 5 or more Children | 4 (100.0%) | 0 (0.0%) |
| Total | 385 (99.2%) | 3 (0.8%) |
Income Below Poverty Among Single-Parent Households in Slayton
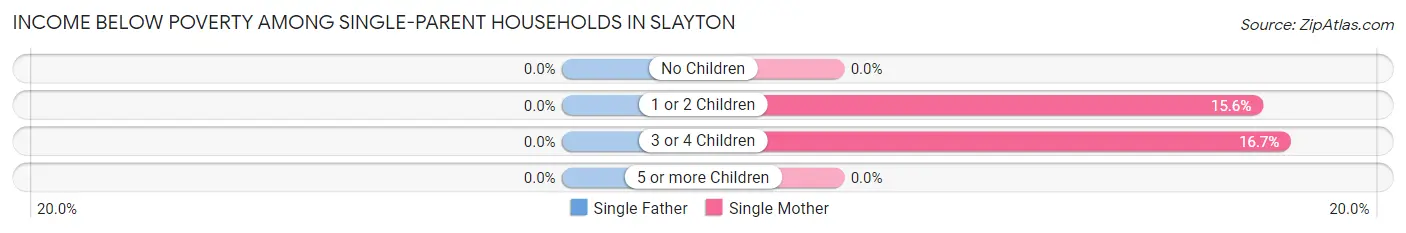
| Children | Single Father | Single Mother |
| No Children | 0 (0.0%) | 0 (0.0%) |
| 1 or 2 Children | 0 (0.0%) | 5 (15.6%) |
| 3 or 4 Children | 0 (0.0%) | 3 (16.7%) |
| 5 or more Children | 0 (0.0%) | 0 (0.0%) |
| Total | 0 (0.0%) | 8 (9.0%) |
Income Below Poverty Among Married-Couple vs Single-Parent Households in Slayton
The poverty data for Slayton shows that 3 of the married-couple family households (0.8%) and 8 of the single-parent households (8.6%) are living below the poverty level. Within the married-couple family households, those with no children have the highest poverty rate, with 3 households (1.3%) falling below the poverty line. Among the single-parent households, those with 3 or 4 children have the highest poverty rate, with 3 household (16.7%) living below poverty.
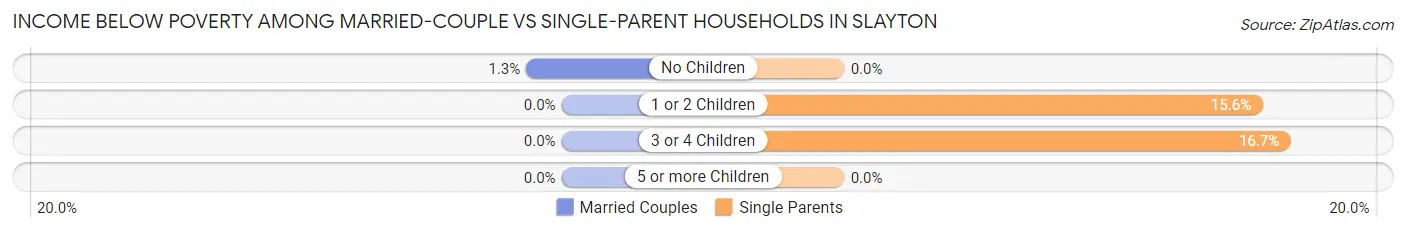
| Children | Married-Couple Families | Single-Parent Households |
| No Children | 3 (1.3%) | 0 (0.0%) |
| 1 or 2 Children | 0 (0.0%) | 5 (15.6%) |
| 3 or 4 Children | 0 (0.0%) | 3 (16.7%) |
| 5 or more Children | 0 (0.0%) | 0 (0.0%) |
| Total | 3 (0.8%) | 8 (8.6%) |
Race in Slayton
The most populous races in Slayton are White / Caucasian (1,913 | 93.2%), Some other Race (118 | 5.8%), and Hispanic or Latino (72 | 3.5%).
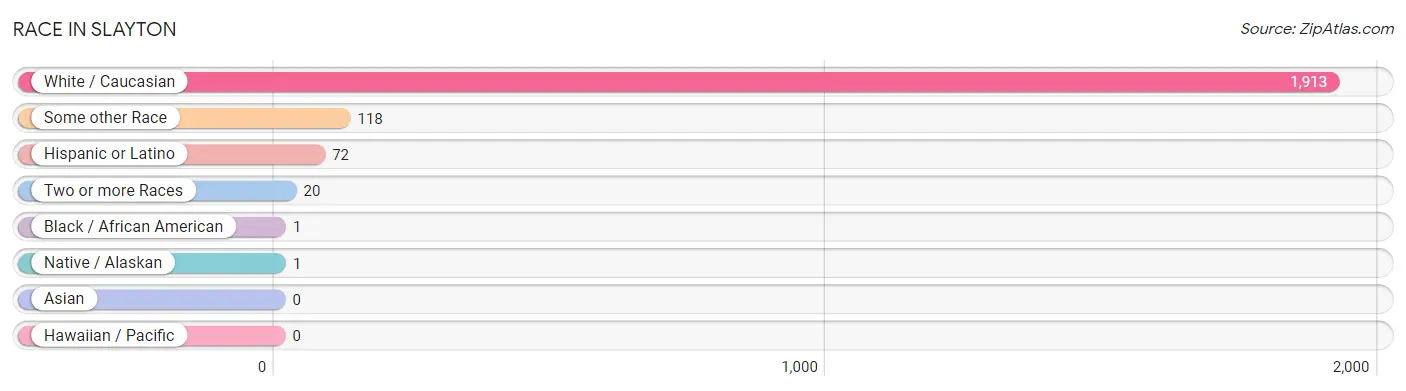
| Race | # Population | % Population |
| Asian | 0 | 0.0% |
| Black / African American | 1 | 0.1% |
| Hawaiian / Pacific | 0 | 0.0% |
| Hispanic or Latino | 72 | 3.5% |
| Native / Alaskan | 1 | 0.1% |
| White / Caucasian | 1,913 | 93.2% |
| Two or more Races | 20 | 1.0% |
| Some other Race | 118 | 5.8% |
| Total | 2,053 | 100.0% |
Ancestry in Slayton
The most populous ancestries reported in Slayton are German (1,035 | 50.4%), Norwegian (425 | 20.7%), Irish (148 | 7.2%), Dutch (123 | 6.0%), and Swedish (85 | 4.1%), together accounting for 88.4% of all Slayton residents.
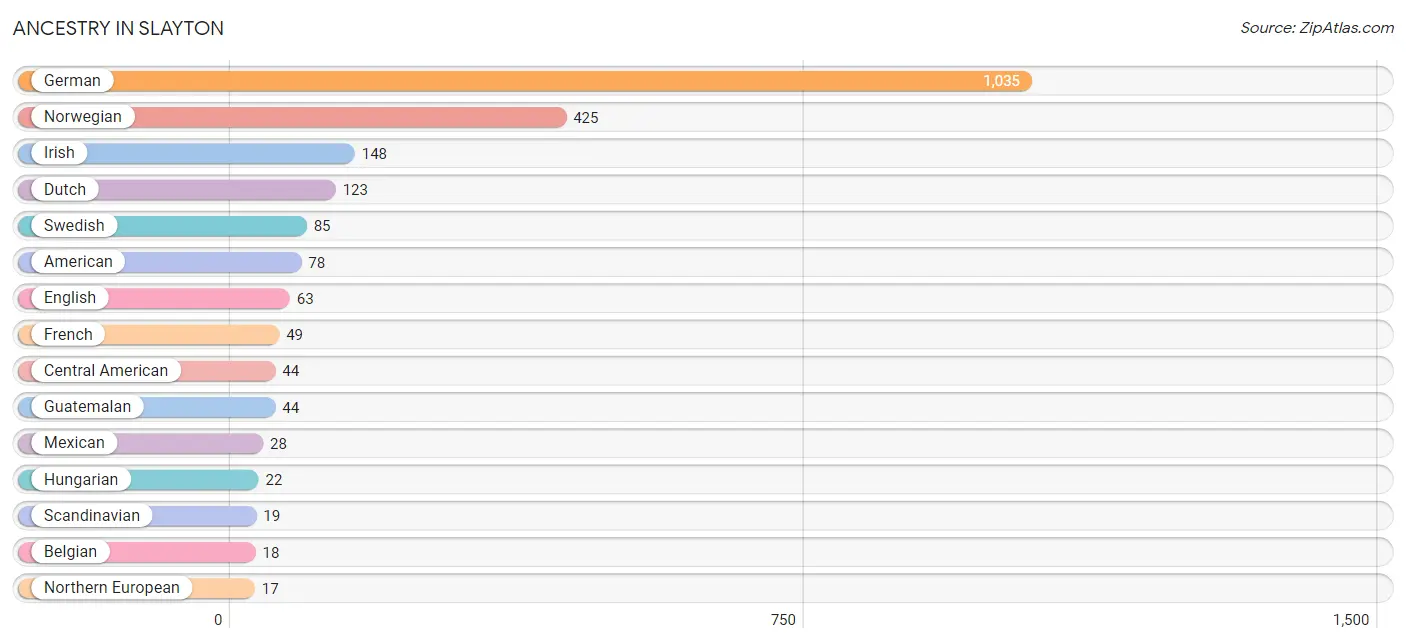
| Ancestry | # Population | % Population |
| American | 78 | 3.8% |
| Belgian | 18 | 0.9% |
| Central American | 44 | 2.1% |
| Czech | 6 | 0.3% |
| Danish | 16 | 0.8% |
| Dutch | 123 | 6.0% |
| English | 63 | 3.1% |
| European | 13 | 0.6% |
| French | 49 | 2.4% |
| French Canadian | 4 | 0.2% |
| German | 1,035 | 50.4% |
| Guatemalan | 44 | 2.1% |
| Hungarian | 22 | 1.1% |
| Irish | 148 | 7.2% |
| Mexican | 28 | 1.4% |
| Northern European | 17 | 0.8% |
| Norwegian | 425 | 20.7% |
| Polish | 13 | 0.6% |
| Portuguese | 14 | 0.7% |
| Russian | 12 | 0.6% |
| Scandinavian | 19 | 0.9% |
| Scotch-Irish | 4 | 0.2% |
| Scottish | 9 | 0.4% |
| Swedish | 85 | 4.1% | View All 24 Rows |
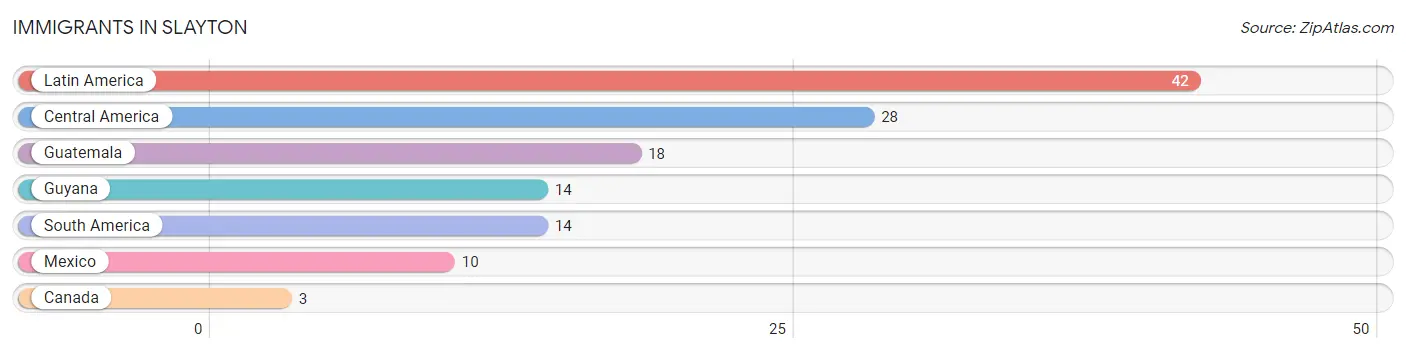
Immigrants in Slayton
The most numerous immigrant groups reported in Slayton came from Latin America (42 | 2.1%), Central America (28 | 1.4%), Guatemala (18 | 0.9%), Guyana (14 | 0.7%), and South America (14 | 0.7%), together accounting for 5.7% of all Slayton residents.
| Immigration Origin | # Population | % Population |
| Canada | 3 | 0.2% |
| Central America | 28 | 1.4% |
| Guatemala | 18 | 0.9% |
| Guyana | 14 | 0.7% |
| Latin America | 42 | 2.1% |
| Mexico | 10 | 0.5% |
| South America | 14 | 0.7% | View All 7 Rows |
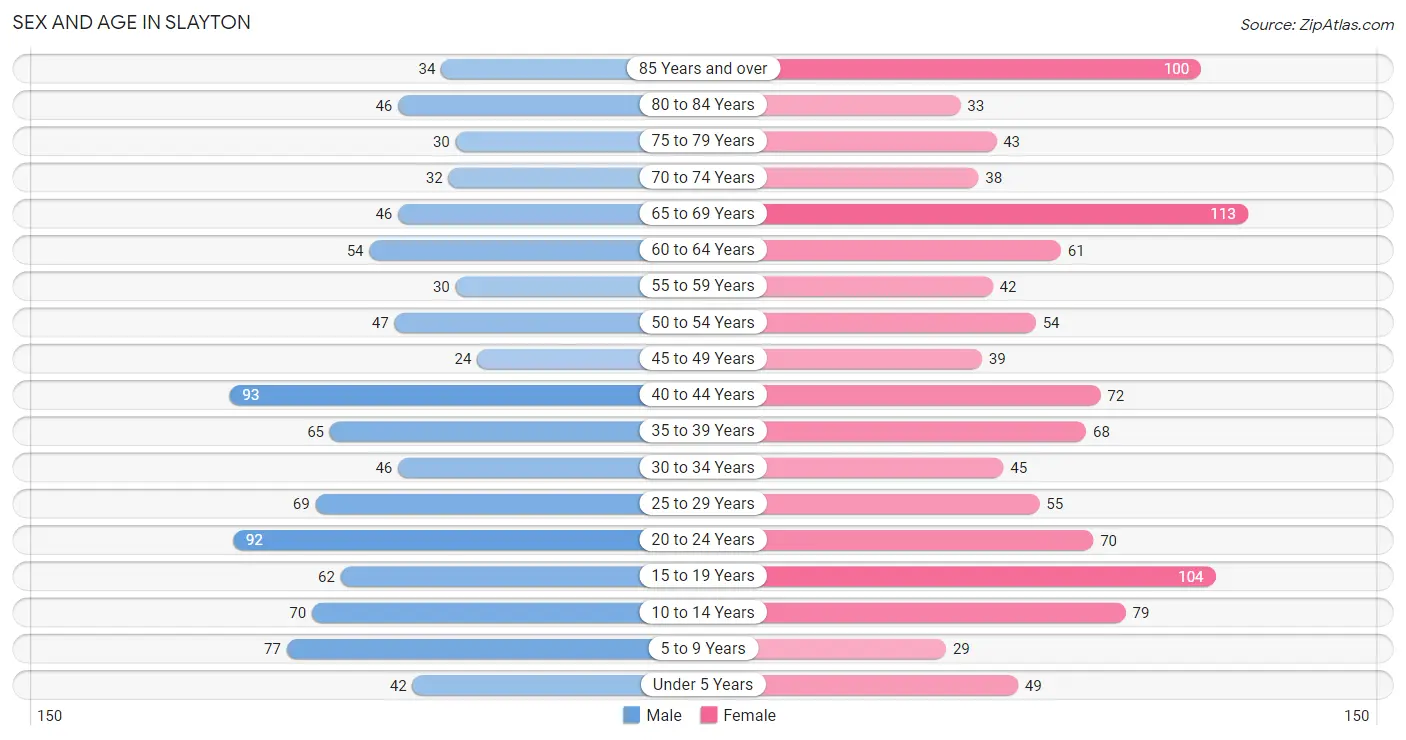
Sex and Age in Slayton
Sex and Age in Slayton
The most populous age groups in Slayton are 40 to 44 Years (93 | 9.7%) for men and 65 to 69 Years (113 | 10.3%) for women.
| Age Bracket | Male | Female |
| Under 5 Years | 42 (4.4%) | 49 (4.5%) |
| 5 to 9 Years | 77 (8.0%) | 29 (2.6%) |
| 10 to 14 Years | 70 (7.3%) | 79 (7.2%) |
| 15 to 19 Years | 62 (6.5%) | 104 (9.5%) |
| 20 to 24 Years | 92 (9.6%) | 70 (6.4%) |
| 25 to 29 Years | 69 (7.2%) | 55 (5.0%) |
| 30 to 34 Years | 46 (4.8%) | 45 (4.1%) |
| 35 to 39 Years | 65 (6.8%) | 68 (6.2%) |
| 40 to 44 Years | 93 (9.7%) | 72 (6.6%) |
| 45 to 49 Years | 24 (2.5%) | 39 (3.6%) |
| 50 to 54 Years | 47 (4.9%) | 54 (4.9%) |
| 55 to 59 Years | 30 (3.1%) | 42 (3.8%) |
| 60 to 64 Years | 54 (5.6%) | 61 (5.6%) |
| 65 to 69 Years | 46 (4.8%) | 113 (10.3%) |
| 70 to 74 Years | 32 (3.3%) | 38 (3.5%) |
| 75 to 79 Years | 30 (3.1%) | 43 (3.9%) |
| 80 to 84 Years | 46 (4.8%) | 33 (3.0%) |
| 85 Years and over | 34 (3.5%) | 100 (9.1%) |
| Total | 959 (100.0%) | 1,094 (100.0%) |
Families and Households in Slayton
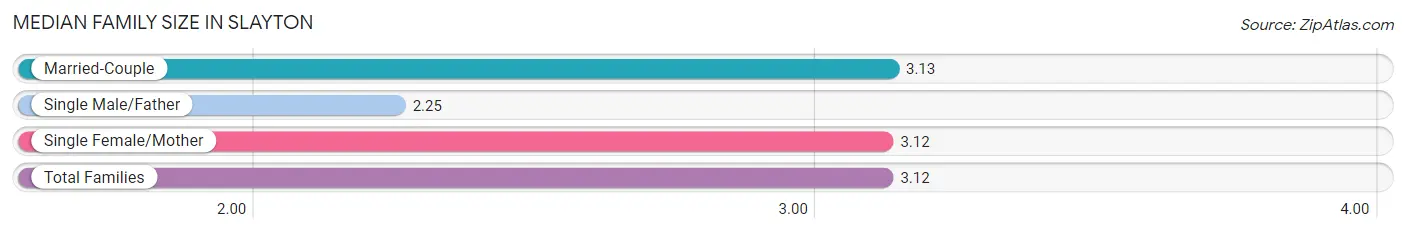
Median Family Size in Slayton
The median family size in Slayton is 3.12 persons per family, with married-couple families (388 | 80.7%) accounting for the largest median family size of 3.13 persons per family. On the other hand, single male/father families (4 | 0.8%) represent the smallest median family size with 2.25 persons per family.
| Family Type | # Families | Family Size |
| Married-Couple | 388 (80.7%) | 3.13 |
| Single Male/Father | 4 (0.8%) | 2.25 |
| Single Female/Mother | 89 (18.5%) | 3.12 |
| Total Families | 481 (100.0%) | 3.12 |
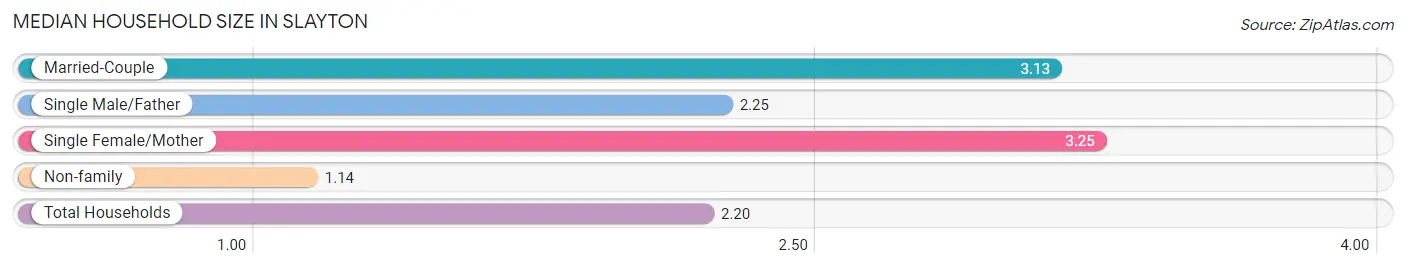
Median Household Size in Slayton
The median household size in Slayton is 2.20 persons per household, with single female/mother households (89 | 9.8%) accounting for the largest median household size of 3.25 persons per household. non-family households (427 | 47.0%) represent the smallest median household size with 1.14 persons per household.
| Household Type | # Households | Household Size |
| Married-Couple | 388 (42.7%) | 3.13 |
| Single Male/Father | 4 (0.4%) | 2.25 |
| Single Female/Mother | 89 (9.8%) | 3.25 |
| Non-family | 427 (47.0%) | 1.14 |
| Total Households | 908 (100.0%) | 2.20 |
Household Size by Marriage Status in Slayton
Out of a total of 908 households in Slayton, 481 (53.0%) are family households, while 427 (47.0%) are nonfamily households. The most numerous type of family households are 2-person households, comprising 257, and the most common type of nonfamily households are 1-person households, comprising 379.
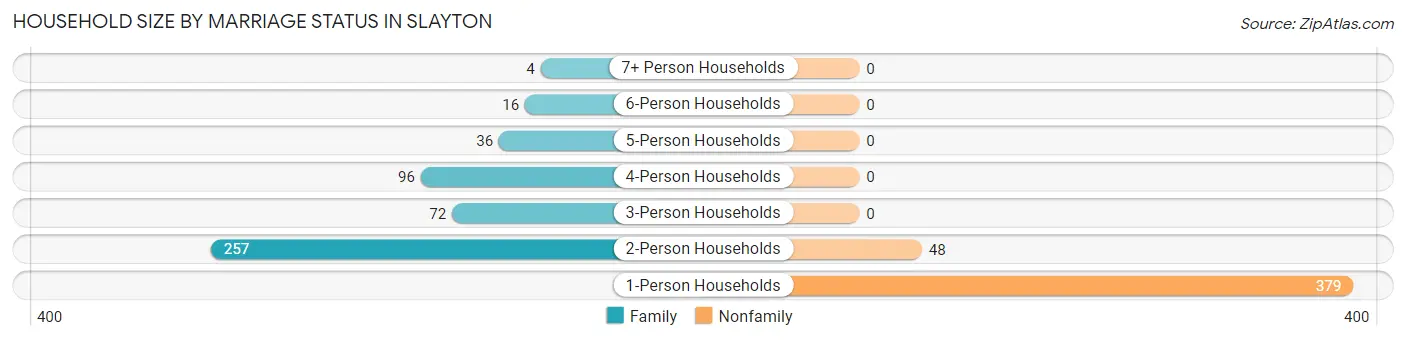
| Household Size | Family Households | Nonfamily Households |
| 1-Person Households | - | 379 (41.7%) |
| 2-Person Households | 257 (28.3%) | 48 (5.3%) |
| 3-Person Households | 72 (7.9%) | 0 (0.0%) |
| 4-Person Households | 96 (10.6%) | 0 (0.0%) |
| 5-Person Households | 36 (4.0%) | 0 (0.0%) |
| 6-Person Households | 16 (1.8%) | 0 (0.0%) |
| 7+ Person Households | 4 (0.4%) | 0 (0.0%) |
| Total | 481 (53.0%) | 427 (47.0%) |
Female Fertility in Slayton
Fertility by Age in Slayton
Average fertility rate in Slayton is 44.0 births per 1,000 women. Women in the age bracket of 20 to 34 years have the highest fertility rate with 124.0 births per 1,000 women. Women in the age bracket of 20 to 34 years acount for 100.0% of all women with births.
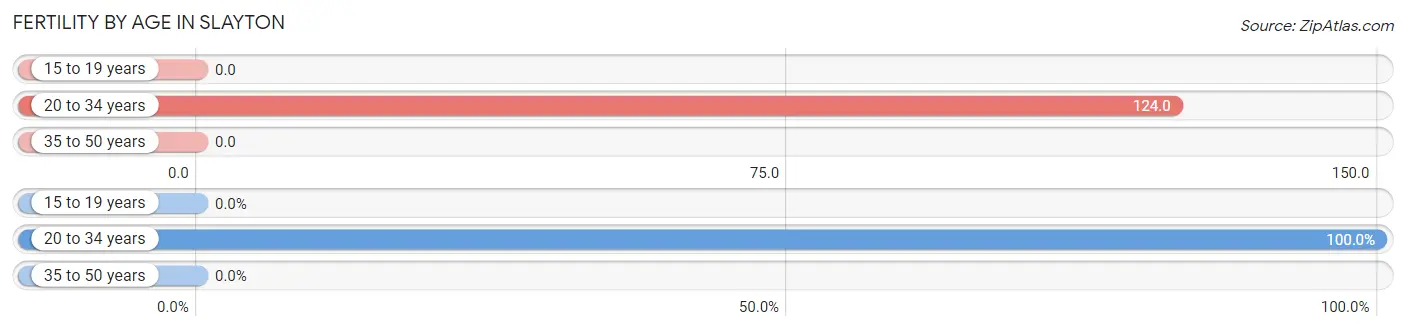
| Age Bracket | Women with Births | Births / 1,000 Women |
| 15 to 19 years | 0 (0.0%) | 0.0 |
| 20 to 34 years | 21 (100.0%) | 124.0 |
| 35 to 50 years | 0 (0.0%) | 0.0 |
| Total | 21 (100.0%) | 44.0 |
Fertility by Age by Marriage Status in Slayton
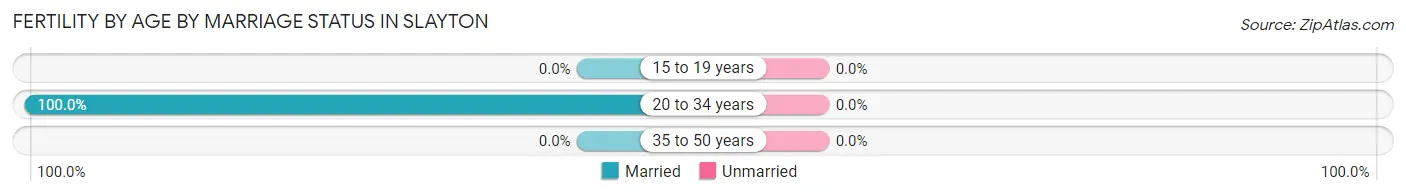
| Age Bracket | Married | Unmarried |
| 15 to 19 years | 0 (0.0%) | 0 (0.0%) |
| 20 to 34 years | 21 (100.0%) | 0 (0.0%) |
| 35 to 50 years | 0 (0.0%) | 0 (0.0%) |
| Total | 21 (100.0%) | 0 (0.0%) |
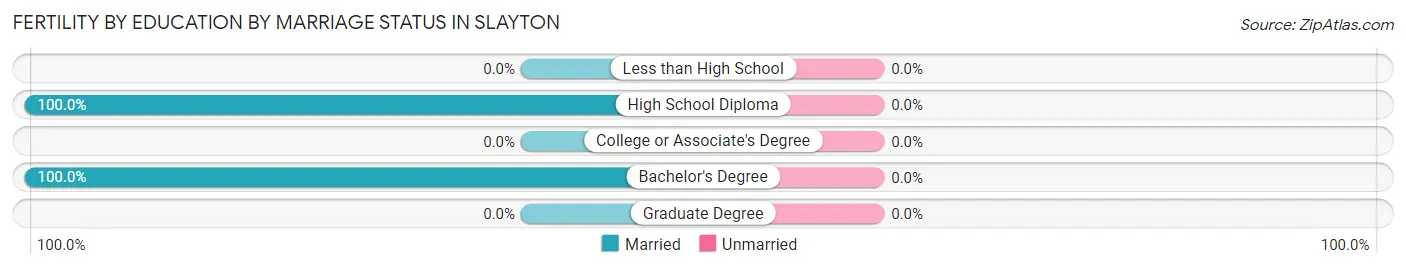
Fertility by Education in Slayton
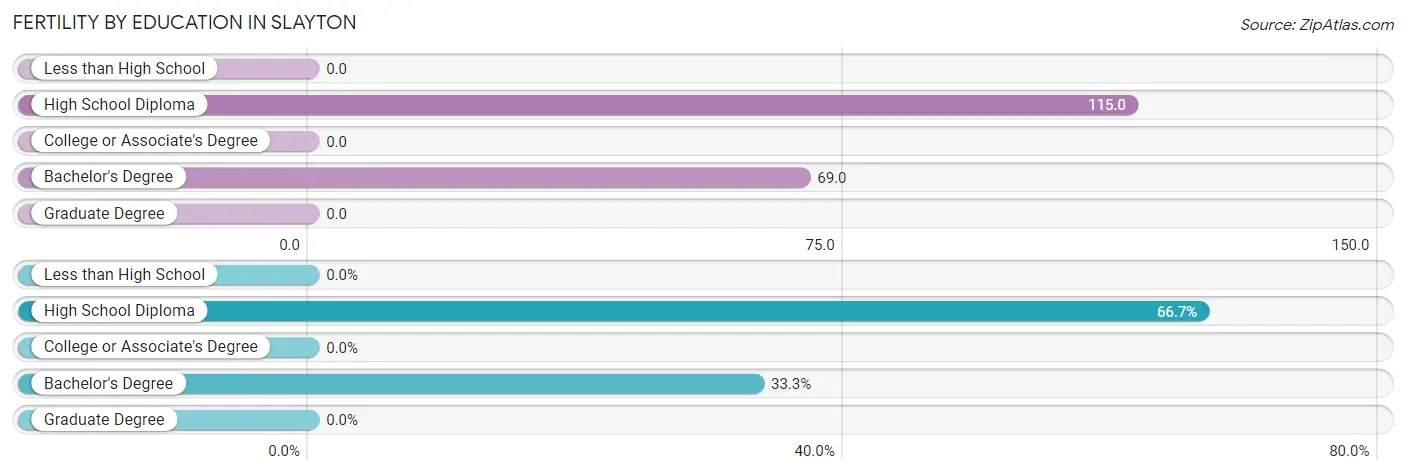
| Educational Attainment | Women with Births | Births / 1,000 Women |
| Less than High School | 0 (0.0%) | 0.0 |
| High School Diploma | 14 (66.7%) | 115.0 |
| College or Associate's Degree | 0 (0.0%) | 0.0 |
| Bachelor's Degree | 7 (33.3%) | 69.0 |
| Graduate Degree | 0 (0.0%) | 0.0 |
| Total | 21 (100.0%) | 44.0 |
Fertility by Education by Marriage Status in Slayton
| Educational Attainment | Married | Unmarried |
| Less than High School | 0 (0.0%) | 0 (0.0%) |
| High School Diploma | 14 (100.0%) | 0 (0.0%) |
| College or Associate's Degree | 0 (0.0%) | 0 (0.0%) |
| Bachelor's Degree | 7 (100.0%) | 0 (0.0%) |
| Graduate Degree | 0 (0.0%) | 0 (0.0%) |
| Total | 21 (100.0%) | 0 (0.0%) |
Employment Characteristics in Slayton
Employment by Class of Employer in Slayton
Among the 1,000 employed individuals in Slayton, private company employees (672 | 67.2%), local government employees (111 | 11.1%), and not-for-profit organizations (108 | 10.8%) make up the most common classes of employment.
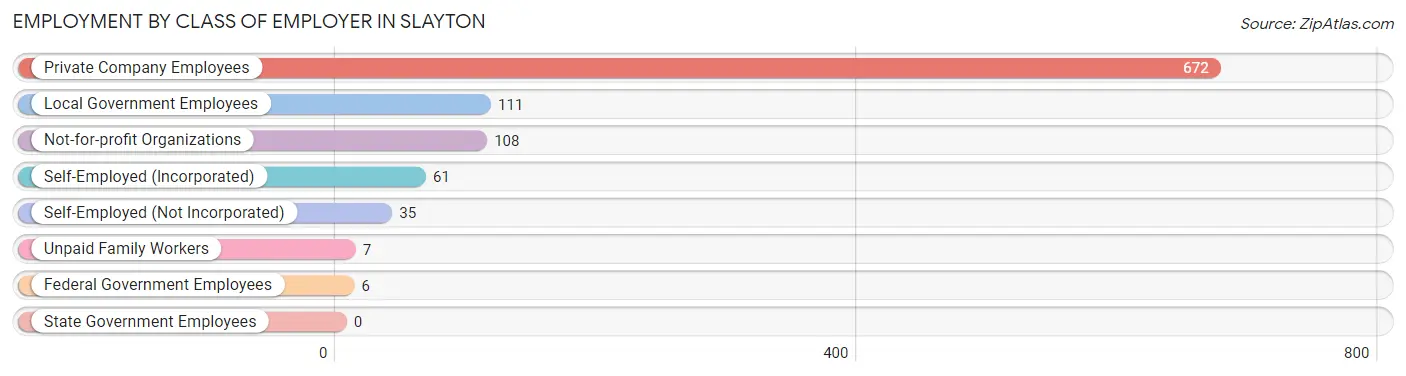
| Employer Class | # Employees | % Employees |
| Private Company Employees | 672 | 67.2% |
| Self-Employed (Incorporated) | 61 | 6.1% |
| Self-Employed (Not Incorporated) | 35 | 3.5% |
| Not-for-profit Organizations | 108 | 10.8% |
| Local Government Employees | 111 | 11.1% |
| State Government Employees | 0 | 0.0% |
| Federal Government Employees | 6 | 0.6% |
| Unpaid Family Workers | 7 | 0.7% |
| Total | 1,000 | 100.0% |
Employment Status by Age in Slayton
According to the labor force statistics for Slayton, out of the total population over 16 years of age (1,675), 62.0% or 1,038 individuals are in the labor force, with 3.8% or 39 of them unemployed. The age group with the highest labor force participation rate is 30 to 34 years, with 100.0% or 91 individuals in the labor force. Within the labor force, the 16 to 19 years age range has the highest percentage of unemployed individuals, with 15.1% or 14 of them being unemployed.
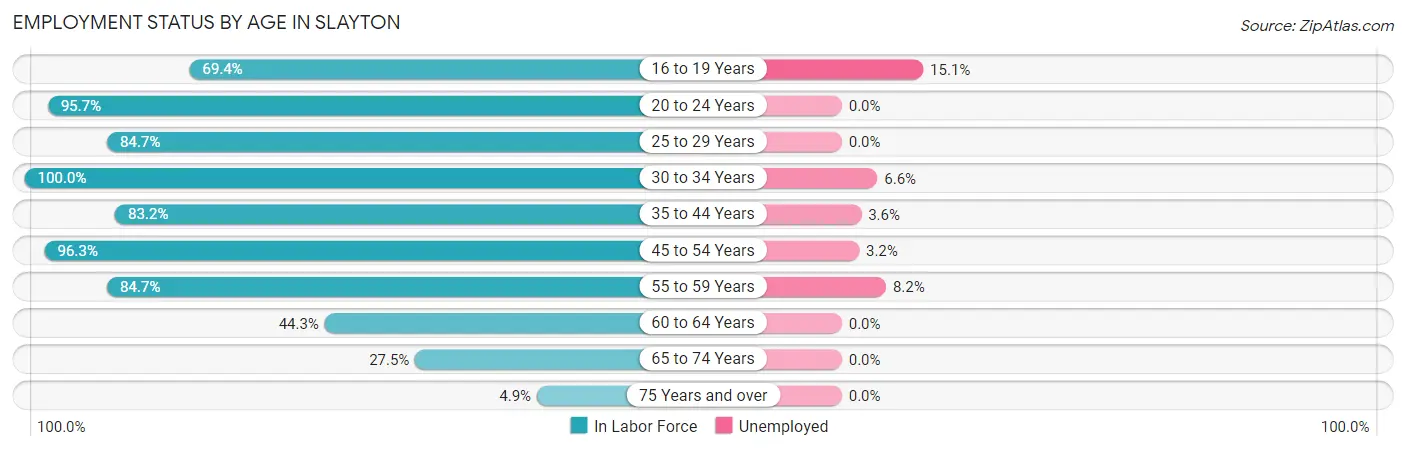
| Age Bracket | In Labor Force | Unemployed |
| 16 to 19 Years | 93 (69.4%) | 14 (15.1%) |
| 20 to 24 Years | 155 (95.7%) | 0 (0.0%) |
| 25 to 29 Years | 105 (84.7%) | 0 (0.0%) |
| 30 to 34 Years | 91 (100.0%) | 6 (6.6%) |
| 35 to 44 Years | 248 (83.2%) | 9 (3.6%) |
| 45 to 54 Years | 158 (96.3%) | 5 (3.2%) |
| 55 to 59 Years | 61 (84.7%) | 5 (8.2%) |
| 60 to 64 Years | 51 (44.3%) | 0 (0.0%) |
| 65 to 74 Years | 63 (27.5%) | 0 (0.0%) |
| 75 Years and over | 14 (4.9%) | 0 (0.0%) |
| Total | 1,038 (62.0%) | 39 (3.8%) |
Employment Status by Educational Attainment in Slayton
According to labor force statistics for Slayton, 82.6% of individuals (714) out of the total population between 25 and 64 years of age (864) are in the labor force, with 3.5% or 25 of them being unemployed. The group with the highest labor force participation rate are those with the educational attainment of high school diploma, with 91.0% or 242 individuals in the labor force. Within the labor force, individuals with less than high school education have the highest percentage of unemployment, with 9.1% or 5 of them being unemployed.
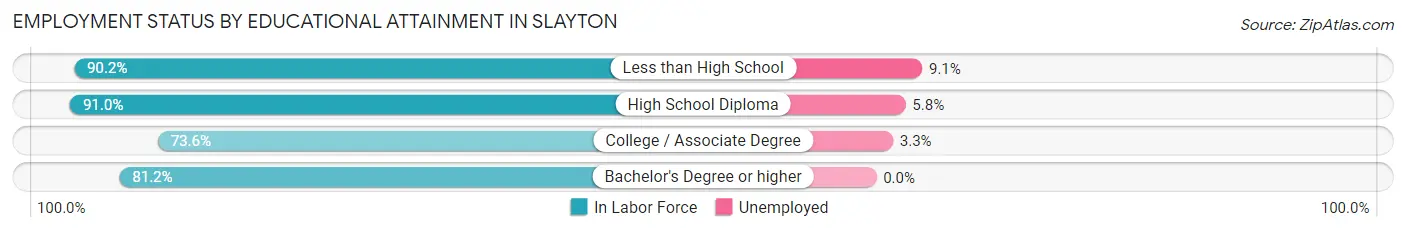
| Educational Attainment | In Labor Force | Unemployed |
| Less than High School | 55 (90.2%) | 6 (9.1%) |
| High School Diploma | 242 (91.0%) | 15 (5.8%) |
| College / Associate Degree | 184 (73.6%) | 8 (3.3%) |
| Bachelor's Degree or higher | 233 (81.2%) | 0 (0.0%) |
| Total | 714 (82.6%) | 30 (3.5%) |
Employment Occupations by Sex in Slayton
Management, Business, Science and Arts Occupations
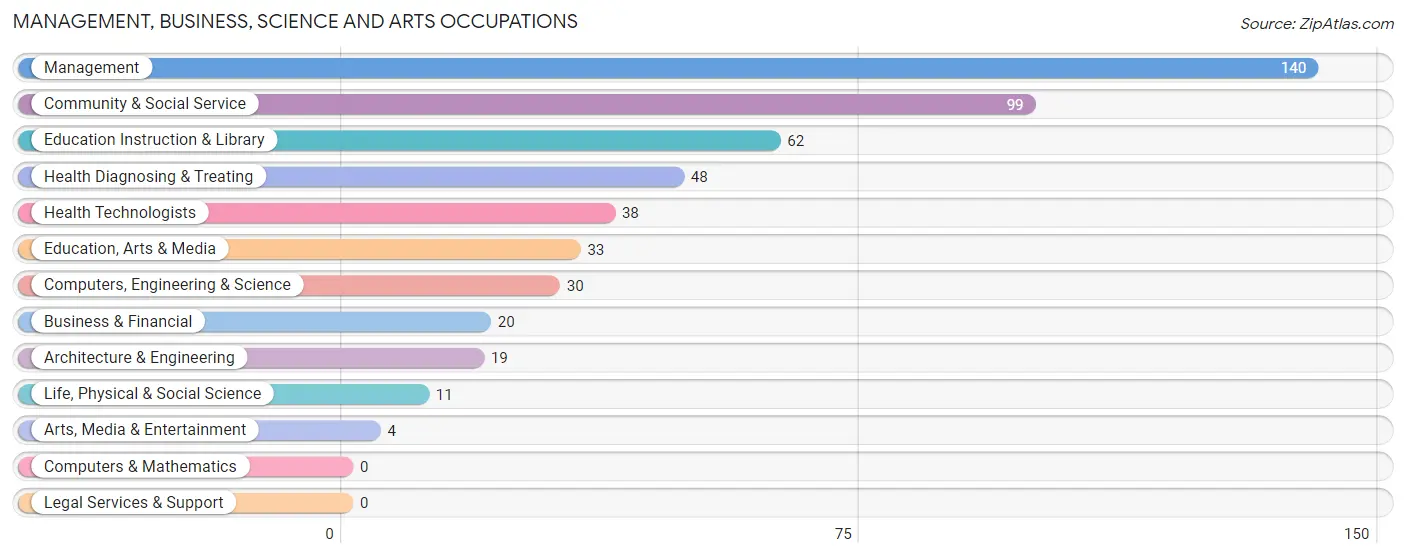
The most common Management, Business, Science and Arts occupations in Slayton are Management (140 | 14.0%), Community & Social Service (99 | 9.9%), Education Instruction & Library (62 | 6.2%), Health Diagnosing & Treating (48 | 4.8%), and Health Technologists (38 | 3.8%).
Management, Business, Science and Arts Occupations by Sex
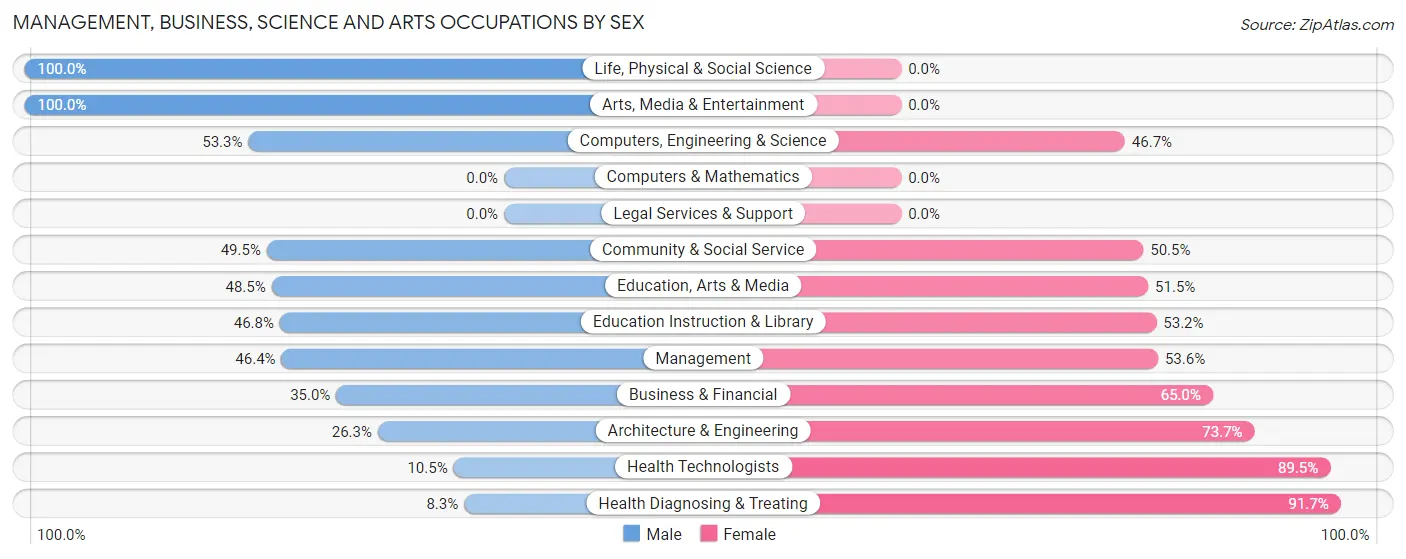
Within the Management, Business, Science and Arts occupations in Slayton, the most male-oriented occupations are Life, Physical & Social Science (100.0%), Arts, Media & Entertainment (100.0%), and Computers, Engineering & Science (53.3%), while the most female-oriented occupations are Health Diagnosing & Treating (91.7%), Health Technologists (89.5%), and Architecture & Engineering (73.7%).
| Occupation | Male | Female |
| Management | 65 (46.4%) | 75 (53.6%) |
| Business & Financial | 7 (35.0%) | 13 (65.0%) |
| Computers, Engineering & Science | 16 (53.3%) | 14 (46.7%) |
| Computers & Mathematics | 0 (0.0%) | 0 (0.0%) |
| Architecture & Engineering | 5 (26.3%) | 14 (73.7%) |
| Life, Physical & Social Science | 11 (100.0%) | 0 (0.0%) |
| Community & Social Service | 49 (49.5%) | 50 (50.5%) |
| Education, Arts & Media | 16 (48.5%) | 17 (51.5%) |
| Legal Services & Support | 0 (0.0%) | 0 (0.0%) |
| Education Instruction & Library | 29 (46.8%) | 33 (53.2%) |
| Arts, Media & Entertainment | 4 (100.0%) | 0 (0.0%) |
| Health Diagnosing & Treating | 4 (8.3%) | 44 (91.7%) |
| Health Technologists | 4 (10.5%) | 34 (89.5%) |
| Total (Category) | 141 (41.8%) | 196 (58.2%) |
| Total (Overall) | 499 (49.9%) | 501 (50.1%) |
Services Occupations
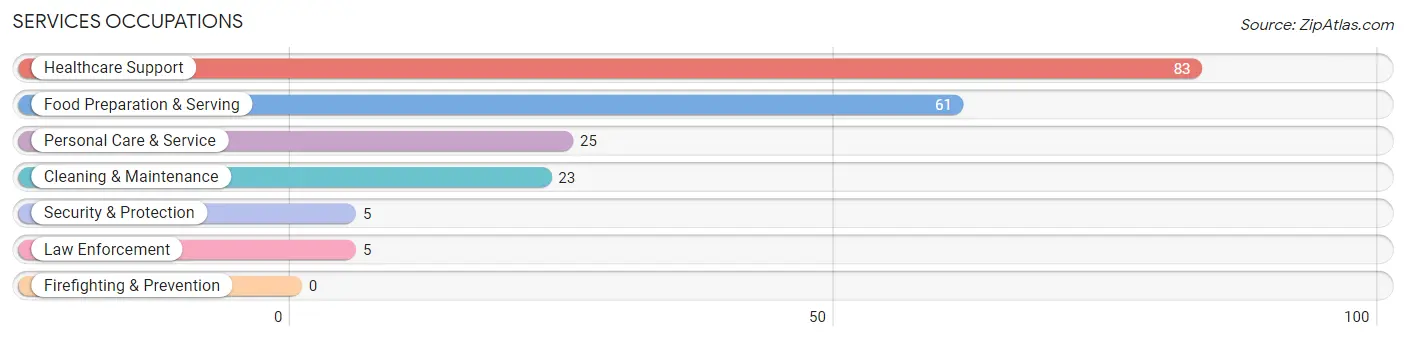
The most common Services occupations in Slayton are Healthcare Support (83 | 8.3%), Food Preparation & Serving (61 | 6.1%), Personal Care & Service (25 | 2.5%), Cleaning & Maintenance (23 | 2.3%), and Security & Protection (5 | 0.5%).
Services Occupations by Sex
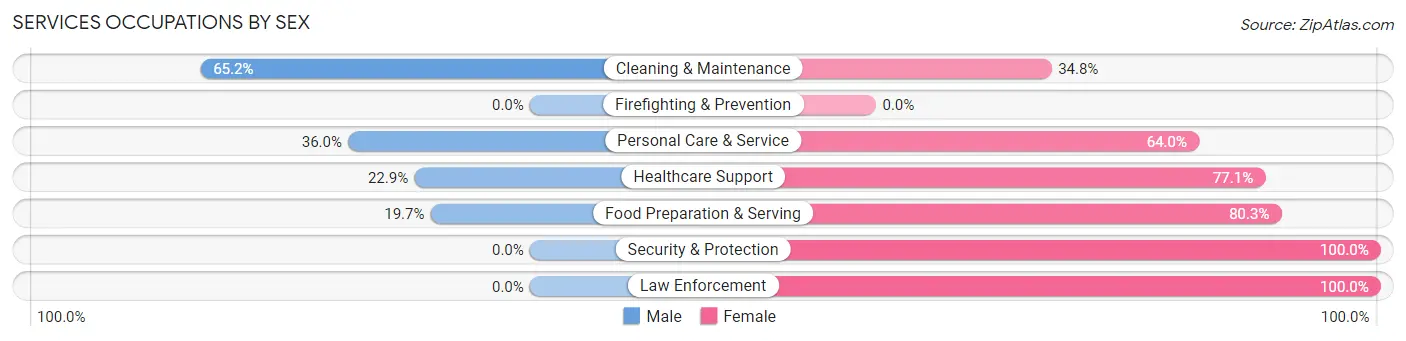
Within the Services occupations in Slayton, the most male-oriented occupations are Cleaning & Maintenance (65.2%), Personal Care & Service (36.0%), and Healthcare Support (22.9%), while the most female-oriented occupations are Security & Protection (100.0%), Law Enforcement (100.0%), and Food Preparation & Serving (80.3%).
| Occupation | Male | Female |
| Healthcare Support | 19 (22.9%) | 64 (77.1%) |
| Security & Protection | 0 (0.0%) | 5 (100.0%) |
| Firefighting & Prevention | 0 (0.0%) | 0 (0.0%) |
| Law Enforcement | 0 (0.0%) | 5 (100.0%) |
| Food Preparation & Serving | 12 (19.7%) | 49 (80.3%) |
| Cleaning & Maintenance | 15 (65.2%) | 8 (34.8%) |
| Personal Care & Service | 9 (36.0%) | 16 (64.0%) |
| Total (Category) | 55 (27.9%) | 142 (72.1%) |
| Total (Overall) | 499 (49.9%) | 501 (50.1%) |
Sales and Office Occupations
The most common Sales and Office occupations in Slayton are Sales & Related (82 | 8.2%), and Office & Administration (65 | 6.5%).
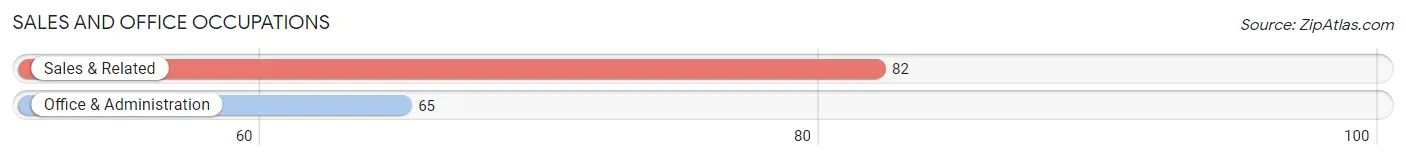
Sales and Office Occupations by Sex
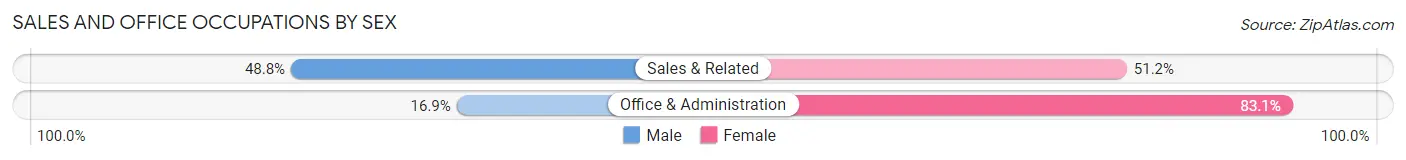
| Occupation | Male | Female |
| Sales & Related | 40 (48.8%) | 42 (51.2%) |
| Office & Administration | 11 (16.9%) | 54 (83.1%) |
| Total (Category) | 51 (34.7%) | 96 (65.3%) |
| Total (Overall) | 499 (49.9%) | 501 (50.1%) |
Natural Resources, Construction and Maintenance Occupations
The most common Natural Resources, Construction and Maintenance occupations in Slayton are Construction & Extraction (57 | 5.7%), Farming, Fishing & Forestry (25 | 2.5%), and Installation, Maintenance & Repair (24 | 2.4%).
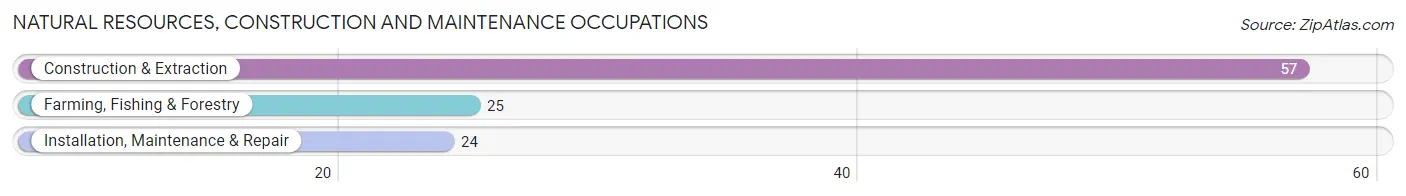
Natural Resources, Construction and Maintenance Occupations by Sex
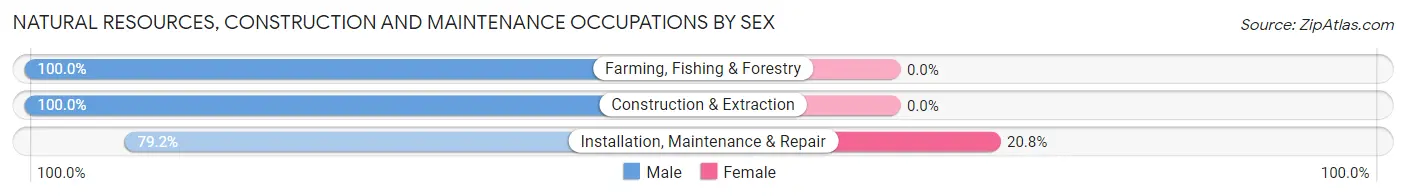
| Occupation | Male | Female |
| Farming, Fishing & Forestry | 25 (100.0%) | 0 (0.0%) |
| Construction & Extraction | 57 (100.0%) | 0 (0.0%) |
| Installation, Maintenance & Repair | 19 (79.2%) | 5 (20.8%) |
| Total (Category) | 101 (95.3%) | 5 (4.7%) |
| Total (Overall) | 499 (49.9%) | 501 (50.1%) |
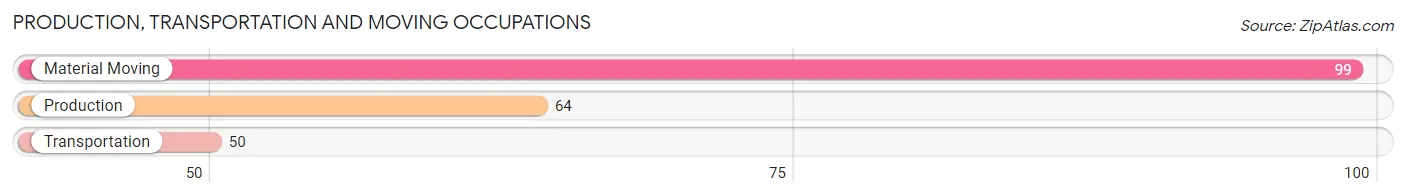
Production, Transportation and Moving Occupations
The most common Production, Transportation and Moving occupations in Slayton are Material Moving (99 | 9.9%), Production (64 | 6.4%), and Transportation (50 | 5.0%).
Production, Transportation and Moving Occupations by Sex
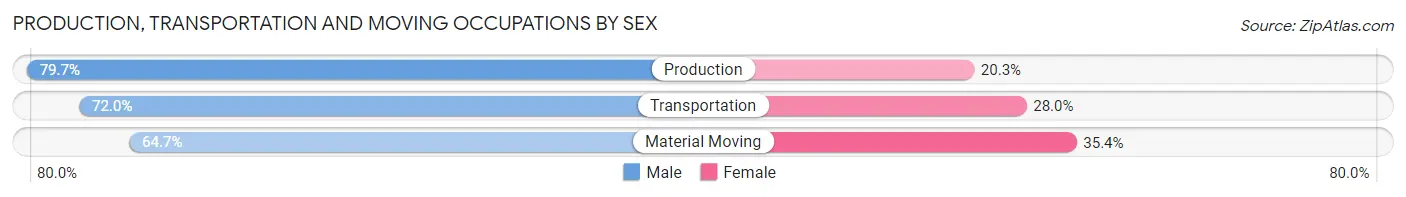
| Occupation | Male | Female |
| Production | 51 (79.7%) | 13 (20.3%) |
| Transportation | 36 (72.0%) | 14 (28.0%) |
| Material Moving | 64 (64.6%) | 35 (35.3%) |
| Total (Category) | 151 (70.9%) | 62 (29.1%) |
| Total (Overall) | 499 (49.9%) | 501 (50.1%) |
Employment Industries by Sex in Slayton
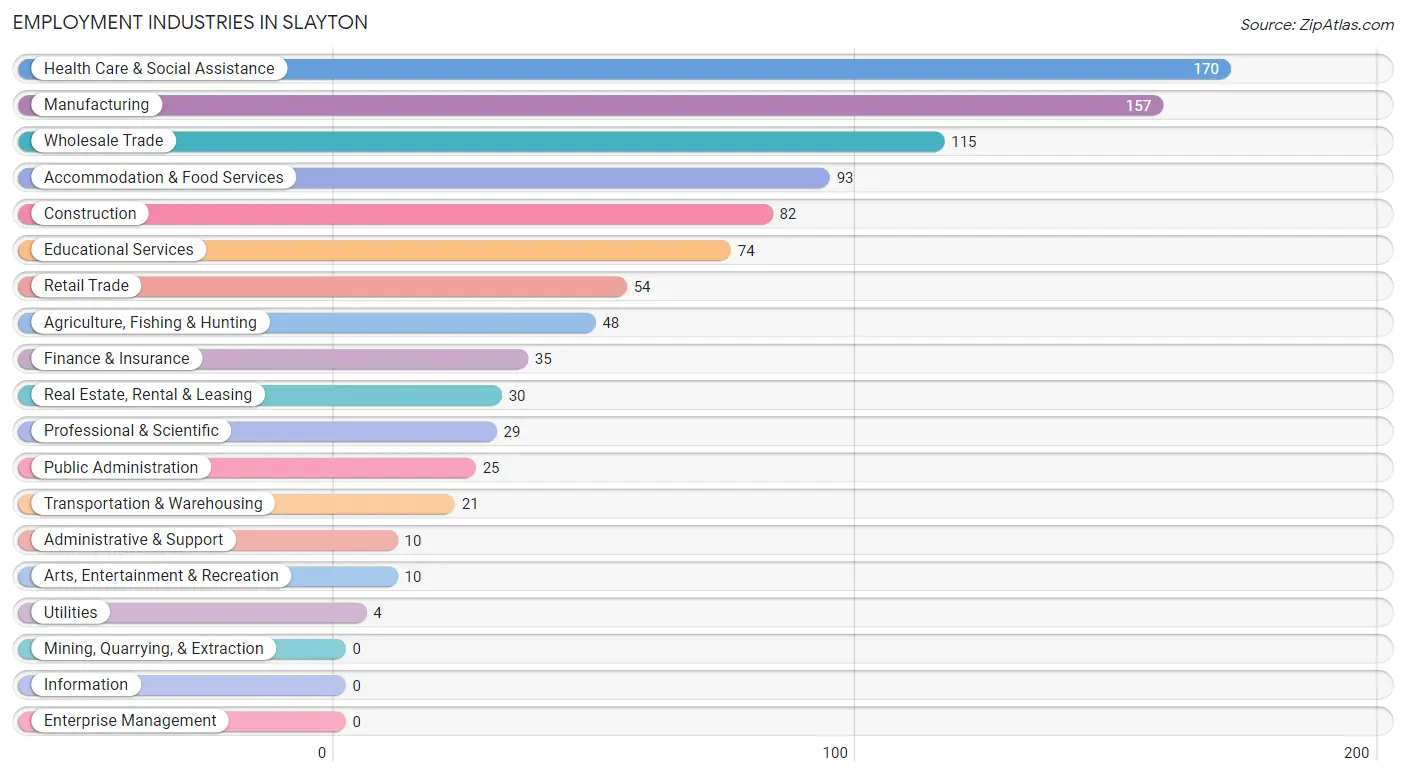
Employment Industries in Slayton
The major employment industries in Slayton include Health Care & Social Assistance (170 | 17.0%), Manufacturing (157 | 15.7%), Wholesale Trade (115 | 11.5%), Accommodation & Food Services (93 | 9.3%), and Construction (82 | 8.2%).
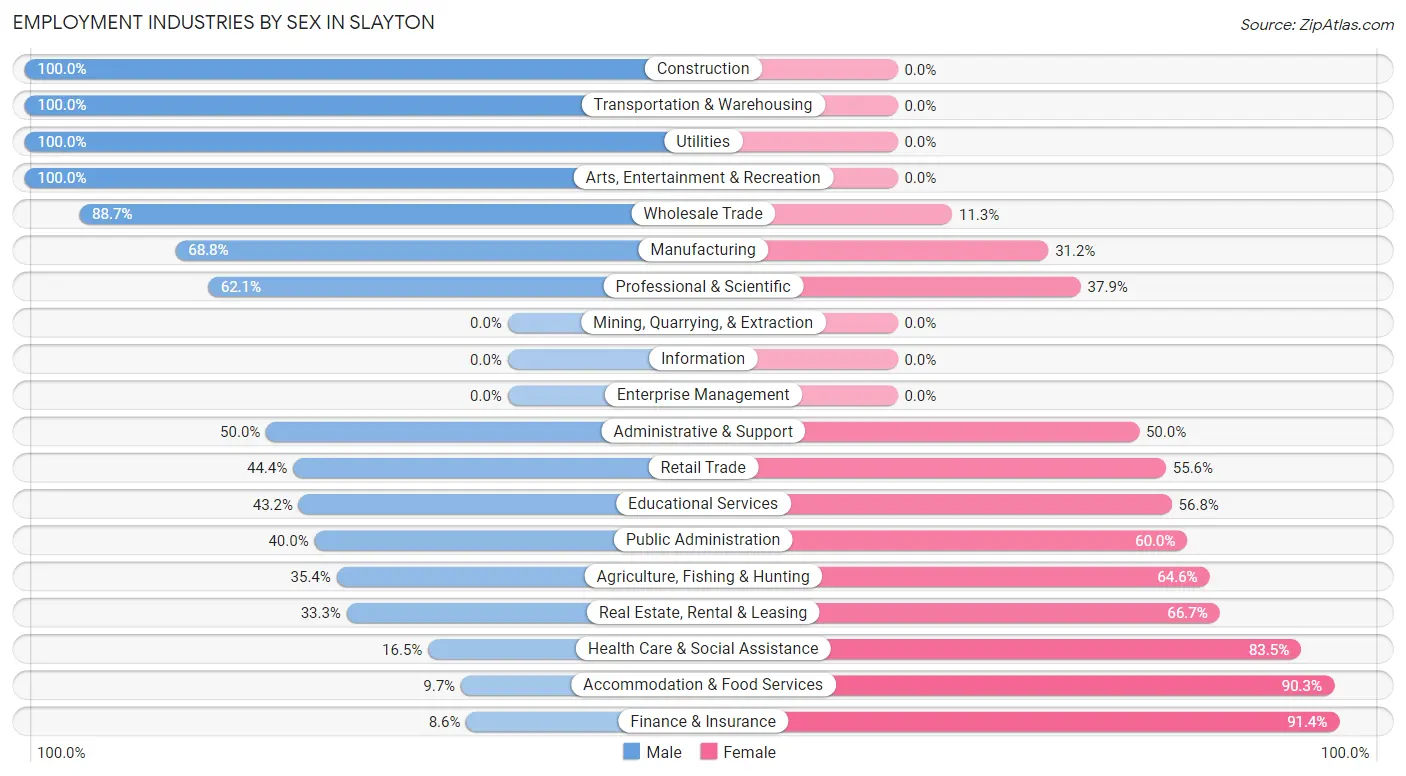
Employment Industries by Sex in Slayton
The Slayton industries that see more men than women are Construction (100.0%), Transportation & Warehousing (100.0%), and Utilities (100.0%), whereas the industries that tend to have a higher number of women are Finance & Insurance (91.4%), Accommodation & Food Services (90.3%), and Health Care & Social Assistance (83.5%).
| Industry | Male | Female |
| Agriculture, Fishing & Hunting | 17 (35.4%) | 31 (64.6%) |
| Mining, Quarrying, & Extraction | 0 (0.0%) | 0 (0.0%) |
| Construction | 82 (100.0%) | 0 (0.0%) |
| Manufacturing | 108 (68.8%) | 49 (31.2%) |
| Wholesale Trade | 102 (88.7%) | 13 (11.3%) |
| Retail Trade | 24 (44.4%) | 30 (55.6%) |
| Transportation & Warehousing | 21 (100.0%) | 0 (0.0%) |
| Utilities | 4 (100.0%) | 0 (0.0%) |
| Information | 0 (0.0%) | 0 (0.0%) |
| Finance & Insurance | 3 (8.6%) | 32 (91.4%) |
| Real Estate, Rental & Leasing | 10 (33.3%) | 20 (66.7%) |
| Professional & Scientific | 18 (62.1%) | 11 (37.9%) |
| Enterprise Management | 0 (0.0%) | 0 (0.0%) |
| Administrative & Support | 5 (50.0%) | 5 (50.0%) |
| Educational Services | 32 (43.2%) | 42 (56.8%) |
| Health Care & Social Assistance | 28 (16.5%) | 142 (83.5%) |
| Arts, Entertainment & Recreation | 10 (100.0%) | 0 (0.0%) |
| Accommodation & Food Services | 9 (9.7%) | 84 (90.3%) |
| Public Administration | 10 (40.0%) | 15 (60.0%) |
| Total | 499 (49.9%) | 501 (50.1%) |
Education in Slayton
School Enrollment in Slayton
The most common levels of schooling among the 476 students in Slayton are middle school (147 | 30.9%), high school (116 | 24.4%), and elementary school (88 | 18.5%).
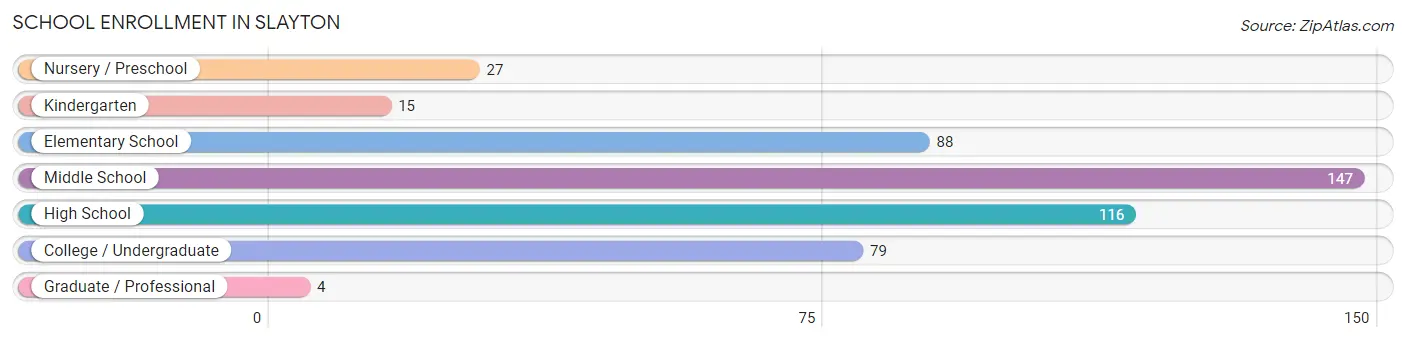
| School Level | # Students | % Students |
| Nursery / Preschool | 27 | 5.7% |
| Kindergarten | 15 | 3.2% |
| Elementary School | 88 | 18.5% |
| Middle School | 147 | 30.9% |
| High School | 116 | 24.4% |
| College / Undergraduate | 79 | 16.6% |
| Graduate / Professional | 4 | 0.8% |
| Total | 476 | 100.0% |
School Enrollment by Age by Funding Source in Slayton
Out of a total of 476 students who are enrolled in schools in Slayton, 26 (5.5%) attend a private institution, while the remaining 450 (94.5%) are enrolled in public schools. The age group of 18 to 19 year olds has the highest likelihood of being enrolled in private schools, with 20 (58.8% in the age bracket) enrolled. Conversely, the age group of 3 to 4 year olds has the lowest likelihood of being enrolled in a private school, with 8 (100.0% in the age bracket) attending a public institution.
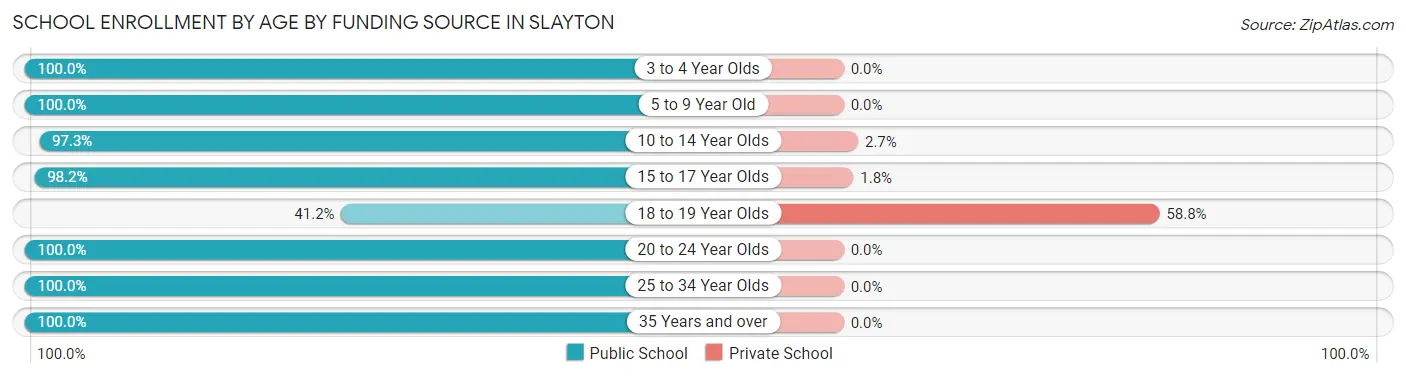
| Age Bracket | Public School | Private School |
| 3 to 4 Year Olds | 8 (100.0%) | 0 (0.0%) |
| 5 to 9 Year Old | 106 (100.0%) | 0 (0.0%) |
| 10 to 14 Year Olds | 145 (97.3%) | 4 (2.7%) |
| 15 to 17 Year Olds | 109 (98.2%) | 2 (1.8%) |
| 18 to 19 Year Olds | 14 (41.2%) | 20 (58.8%) |
| 20 to 24 Year Olds | 43 (100.0%) | 0 (0.0%) |
| 25 to 34 Year Olds | 19 (100.0%) | 0 (0.0%) |
| 35 Years and over | 6 (100.0%) | 0 (0.0%) |
| Total | 450 (94.5%) | 26 (5.5%) |
Educational Attainment by Field of Study in Slayton
Education (148 | 35.7%), arts & humanities (55 | 13.3%), business (53 | 12.8%), bio, nature & agricultural (39 | 9.4%), and social sciences (37 | 8.9%) are the most common fields of study among 415 individuals in Slayton who have obtained a bachelor's degree or higher.
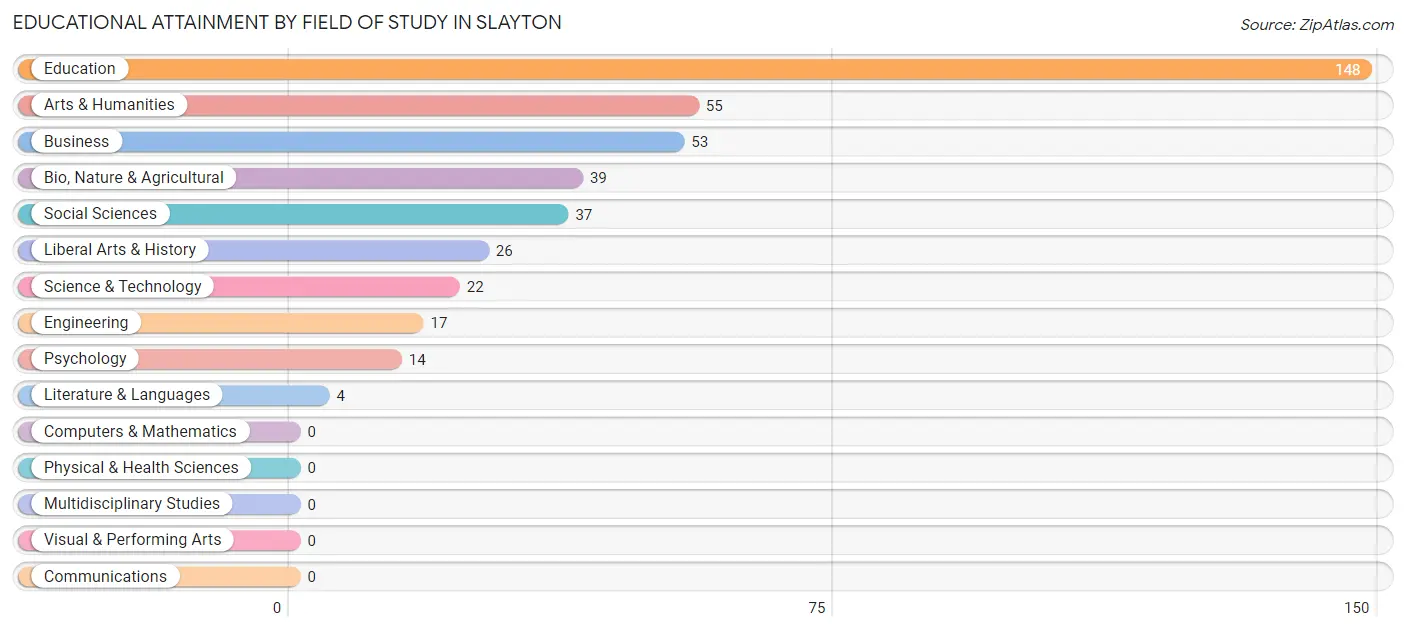
| Field of Study | # Graduates | % Graduates |
| Computers & Mathematics | 0 | 0.0% |
| Bio, Nature & Agricultural | 39 | 9.4% |
| Physical & Health Sciences | 0 | 0.0% |
| Psychology | 14 | 3.4% |
| Social Sciences | 37 | 8.9% |
| Engineering | 17 | 4.1% |
| Multidisciplinary Studies | 0 | 0.0% |
| Science & Technology | 22 | 5.3% |
| Business | 53 | 12.8% |
| Education | 148 | 35.7% |
| Literature & Languages | 4 | 1.0% |
| Liberal Arts & History | 26 | 6.3% |
| Visual & Performing Arts | 0 | 0.0% |
| Communications | 0 | 0.0% |
| Arts & Humanities | 55 | 13.3% |
| Total | 415 | 100.0% |
Transportation & Commute in Slayton
Vehicle Availability by Sex in Slayton
The most prevalent vehicle ownership categories in Slayton are males with 2 vehicles (230, accounting for 46.1%) and females with 2 vehicles (226, making up 45.9%).
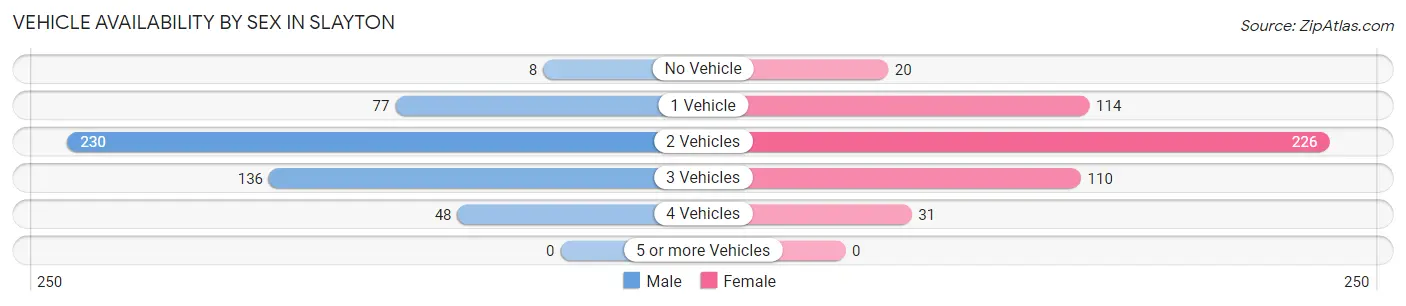
| Vehicles Available | Male | Female |
| No Vehicle | 8 (1.6%) | 20 (4.0%) |
| 1 Vehicle | 77 (15.4%) | 114 (22.8%) |
| 2 Vehicles | 230 (46.1%) | 226 (45.1%) |
| 3 Vehicles | 136 (27.3%) | 110 (22.0%) |
| 4 Vehicles | 48 (9.6%) | 31 (6.2%) |
| 5 or more Vehicles | 0 (0.0%) | 0 (0.0%) |
| Total | 499 (100.0%) | 501 (100.0%) |
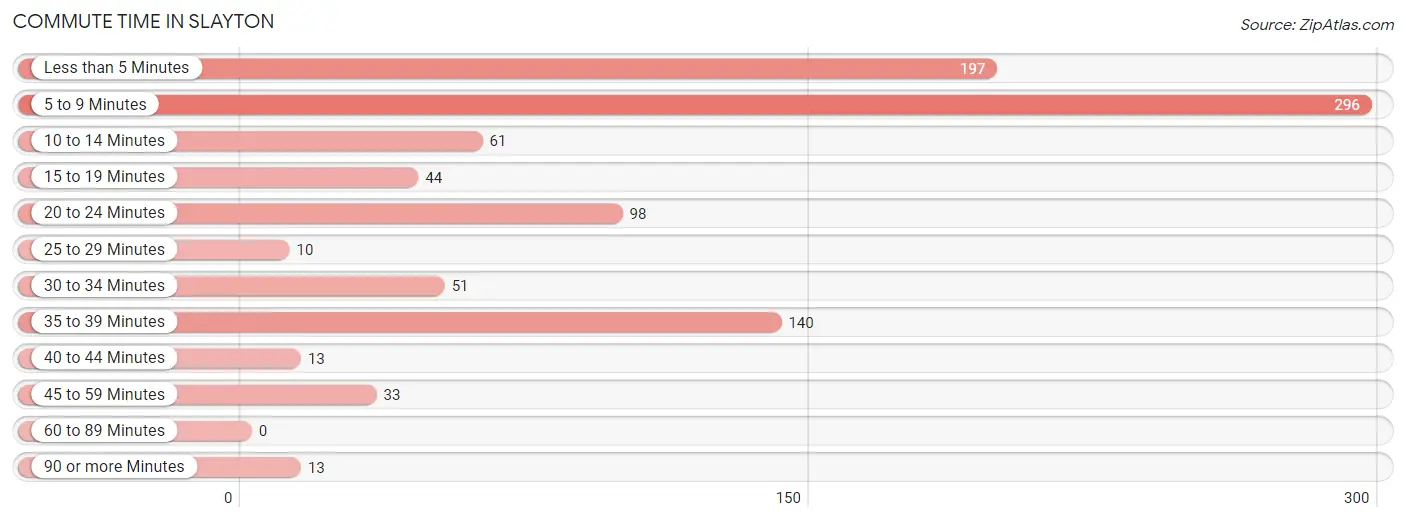
Commute Time in Slayton
The most frequently occuring commute durations in Slayton are 5 to 9 minutes (296 commuters, 31.0%), less than 5 minutes (197 commuters, 20.6%), and 35 to 39 minutes (140 commuters, 14.6%).
| Commute Time | # Commuters | % Commuters |
| Less than 5 Minutes | 197 | 20.6% |
| 5 to 9 Minutes | 296 | 31.0% |
| 10 to 14 Minutes | 61 | 6.4% |
| 15 to 19 Minutes | 44 | 4.6% |
| 20 to 24 Minutes | 98 | 10.2% |
| 25 to 29 Minutes | 10 | 1.1% |
| 30 to 34 Minutes | 51 | 5.3% |
| 35 to 39 Minutes | 140 | 14.6% |
| 40 to 44 Minutes | 13 | 1.4% |
| 45 to 59 Minutes | 33 | 3.5% |
| 60 to 89 Minutes | 0 | 0.0% |
| 90 or more Minutes | 13 | 1.4% |
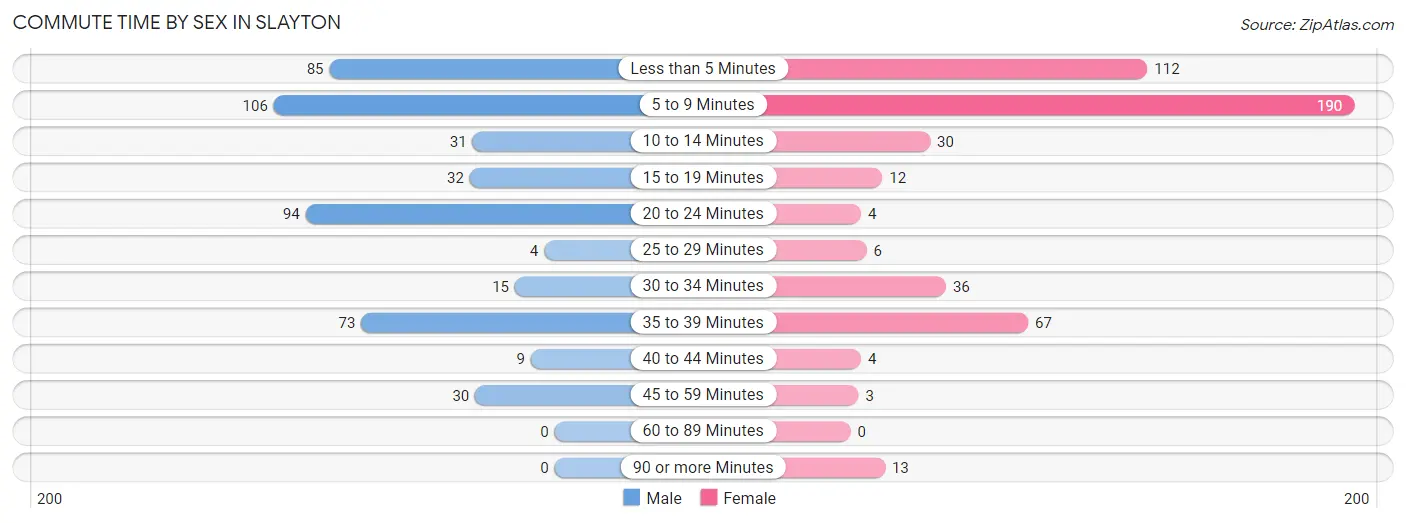
Commute Time by Sex in Slayton
The most common commute times in Slayton are 5 to 9 minutes (106 commuters, 22.1%) for males and 5 to 9 minutes (190 commuters, 39.8%) for females.
| Commute Time | Male | Female |
| Less than 5 Minutes | 85 (17.7%) | 112 (23.5%) |
| 5 to 9 Minutes | 106 (22.1%) | 190 (39.8%) |
| 10 to 14 Minutes | 31 (6.5%) | 30 (6.3%) |
| 15 to 19 Minutes | 32 (6.7%) | 12 (2.5%) |
| 20 to 24 Minutes | 94 (19.6%) | 4 (0.8%) |
| 25 to 29 Minutes | 4 (0.8%) | 6 (1.3%) |
| 30 to 34 Minutes | 15 (3.1%) | 36 (7.5%) |
| 35 to 39 Minutes | 73 (15.2%) | 67 (14.1%) |
| 40 to 44 Minutes | 9 (1.9%) | 4 (0.8%) |
| 45 to 59 Minutes | 30 (6.3%) | 3 (0.6%) |
| 60 to 89 Minutes | 0 (0.0%) | 0 (0.0%) |
| 90 or more Minutes | 0 (0.0%) | 13 (2.7%) |
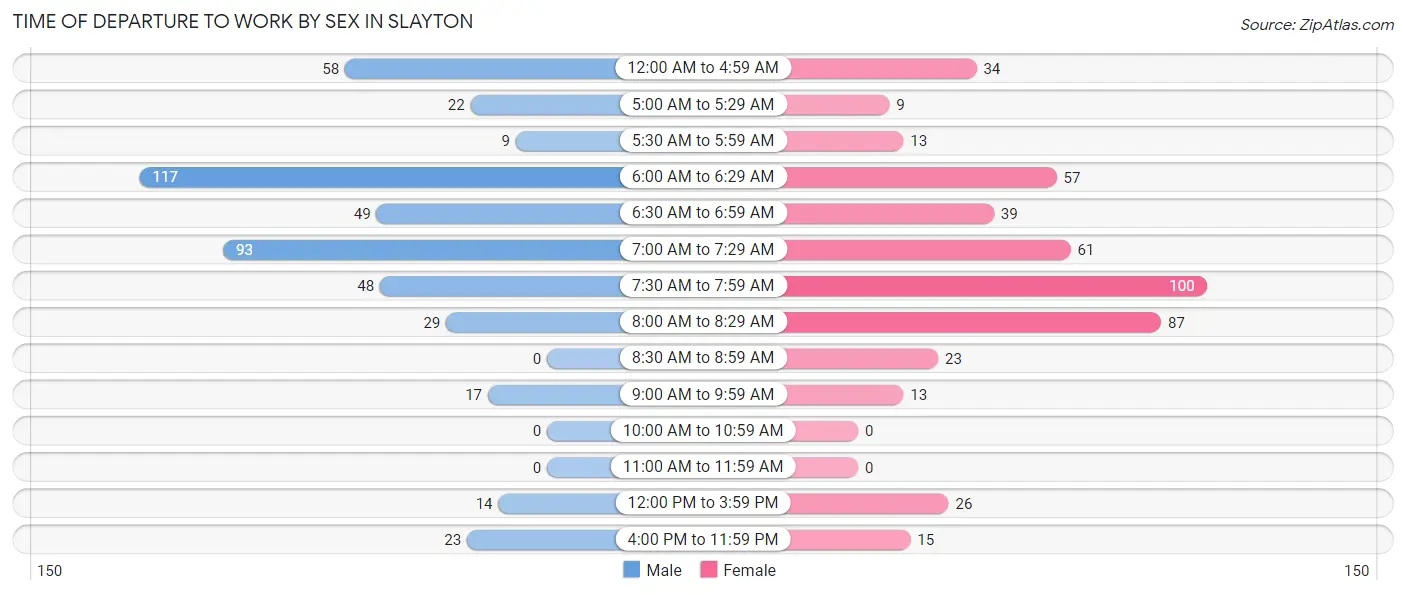
Time of Departure to Work by Sex in Slayton
The most frequent times of departure to work in Slayton are 6:00 AM to 6:29 AM (117, 24.4%) for males and 7:30 AM to 7:59 AM (100, 21.0%) for females.
| Time of Departure | Male | Female |
| 12:00 AM to 4:59 AM | 58 (12.1%) | 34 (7.1%) |
| 5:00 AM to 5:29 AM | 22 (4.6%) | 9 (1.9%) |
| 5:30 AM to 5:59 AM | 9 (1.9%) | 13 (2.7%) |
| 6:00 AM to 6:29 AM | 117 (24.4%) | 57 (11.9%) |
| 6:30 AM to 6:59 AM | 49 (10.2%) | 39 (8.2%) |
| 7:00 AM to 7:29 AM | 93 (19.4%) | 61 (12.8%) |
| 7:30 AM to 7:59 AM | 48 (10.0%) | 100 (21.0%) |
| 8:00 AM to 8:29 AM | 29 (6.0%) | 87 (18.2%) |
| 8:30 AM to 8:59 AM | 0 (0.0%) | 23 (4.8%) |
| 9:00 AM to 9:59 AM | 17 (3.5%) | 13 (2.7%) |
| 10:00 AM to 10:59 AM | 0 (0.0%) | 0 (0.0%) |
| 11:00 AM to 11:59 AM | 0 (0.0%) | 0 (0.0%) |
| 12:00 PM to 3:59 PM | 14 (2.9%) | 26 (5.4%) |
| 4:00 PM to 11:59 PM | 23 (4.8%) | 15 (3.1%) |
| Total | 479 (100.0%) | 477 (100.0%) |
Housing Occupancy in Slayton
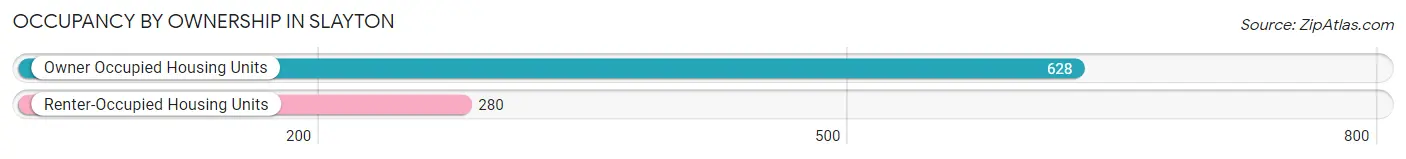
Occupancy by Ownership in Slayton
Of the total 908 dwellings in Slayton, owner-occupied units account for 628 (69.2%), while renter-occupied units make up 280 (30.8%).
| Occupancy | # Housing Units | % Housing Units |
| Owner Occupied Housing Units | 628 | 69.2% |
| Renter-Occupied Housing Units | 280 | 30.8% |
| Total Occupied Housing Units | 908 | 100.0% |
Occupancy by Household Size in Slayton
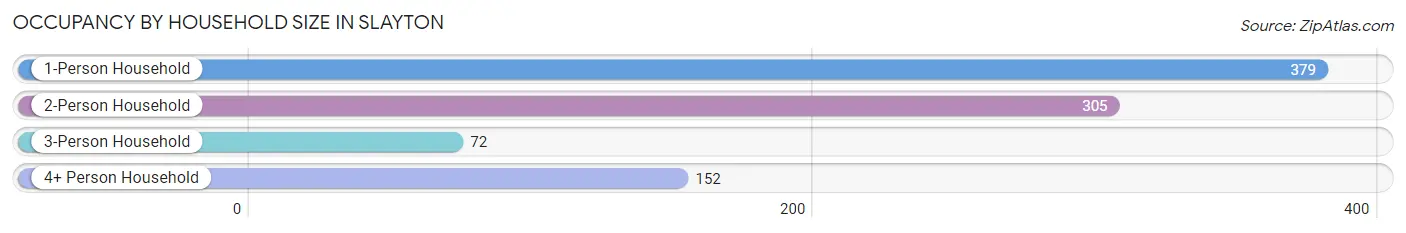
| Household Size | # Housing Units | % Housing Units |
| 1-Person Household | 379 | 41.7% |
| 2-Person Household | 305 | 33.6% |
| 3-Person Household | 72 | 7.9% |
| 4+ Person Household | 152 | 16.7% |
| Total Housing Units | 908 | 100.0% |
Occupancy by Ownership by Household Size in Slayton
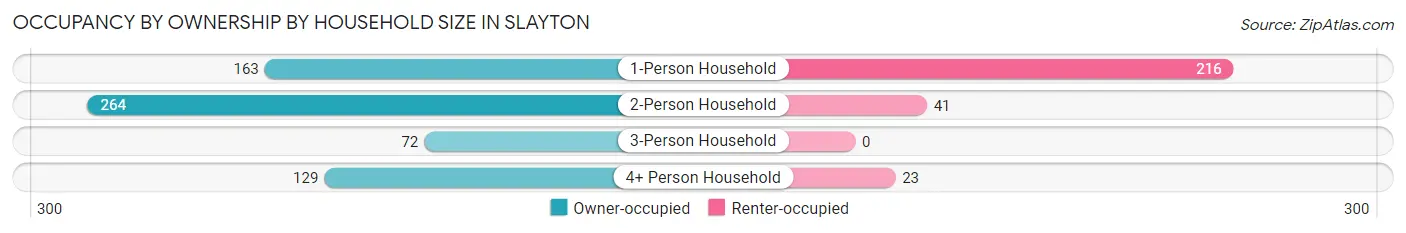
| Household Size | Owner-occupied | Renter-occupied |
| 1-Person Household | 163 (43.0%) | 216 (57.0%) |
| 2-Person Household | 264 (86.6%) | 41 (13.4%) |
| 3-Person Household | 72 (100.0%) | 0 (0.0%) |
| 4+ Person Household | 129 (84.9%) | 23 (15.1%) |
| Total Housing Units | 628 (69.2%) | 280 (30.8%) |
Occupancy by Educational Attainment in Slayton
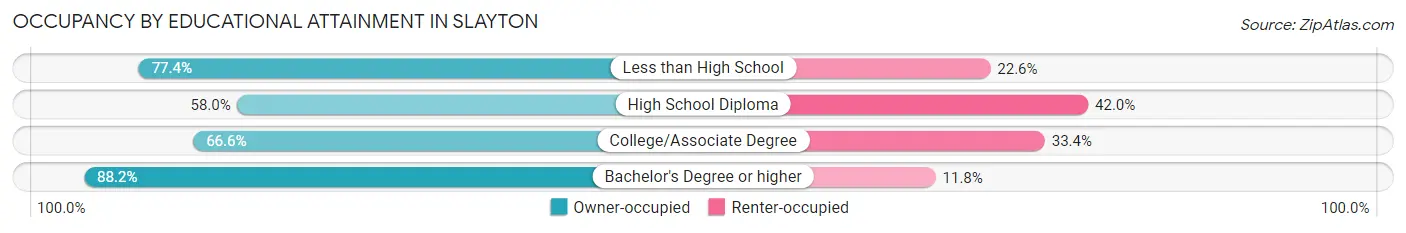
| Household Size | Owner-occupied | Renter-occupied |
| Less than High School | 41 (77.4%) | 12 (22.6%) |
| High School Diploma | 189 (58.0%) | 137 (42.0%) |
| College/Associate Degree | 211 (66.6%) | 106 (33.4%) |
| Bachelor's Degree or higher | 187 (88.2%) | 25 (11.8%) |
Occupancy by Age of Householder in Slayton
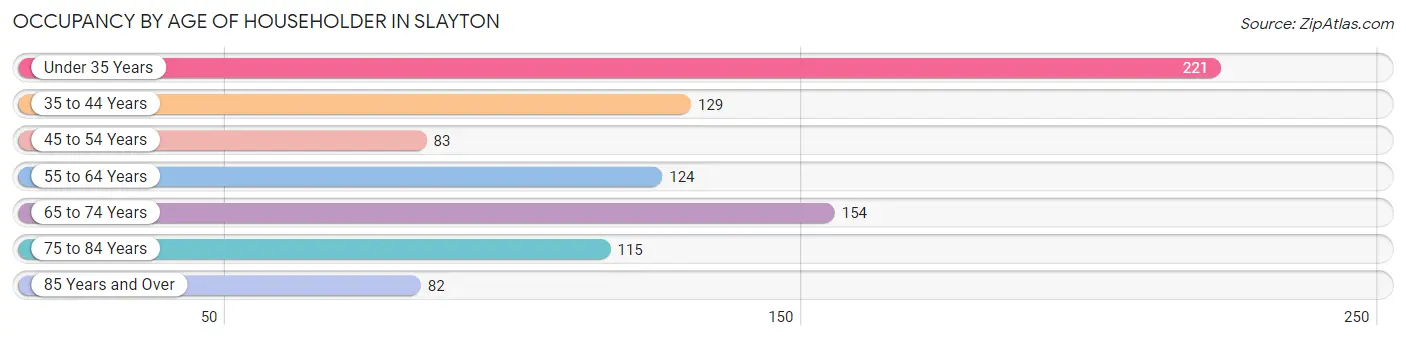
| Age Bracket | # Households | % Households |
| Under 35 Years | 221 | 24.3% |
| 35 to 44 Years | 129 | 14.2% |
| 45 to 54 Years | 83 | 9.1% |
| 55 to 64 Years | 124 | 13.7% |
| 65 to 74 Years | 154 | 17.0% |
| 75 to 84 Years | 115 | 12.7% |
| 85 Years and Over | 82 | 9.0% |
| Total | 908 | 100.0% |
Housing Finances in Slayton
Median Income by Occupancy in Slayton
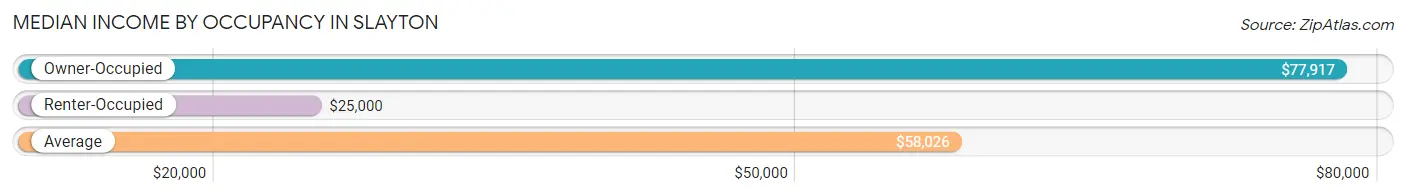
| Occupancy Type | # Households | Median Income |
| Owner-Occupied | 628 (69.2%) | $77,917 |
| Renter-Occupied | 280 (30.8%) | $25,000 |
| Average | 908 (100.0%) | $58,026 |
Occupancy by Householder Income Bracket in Slayton
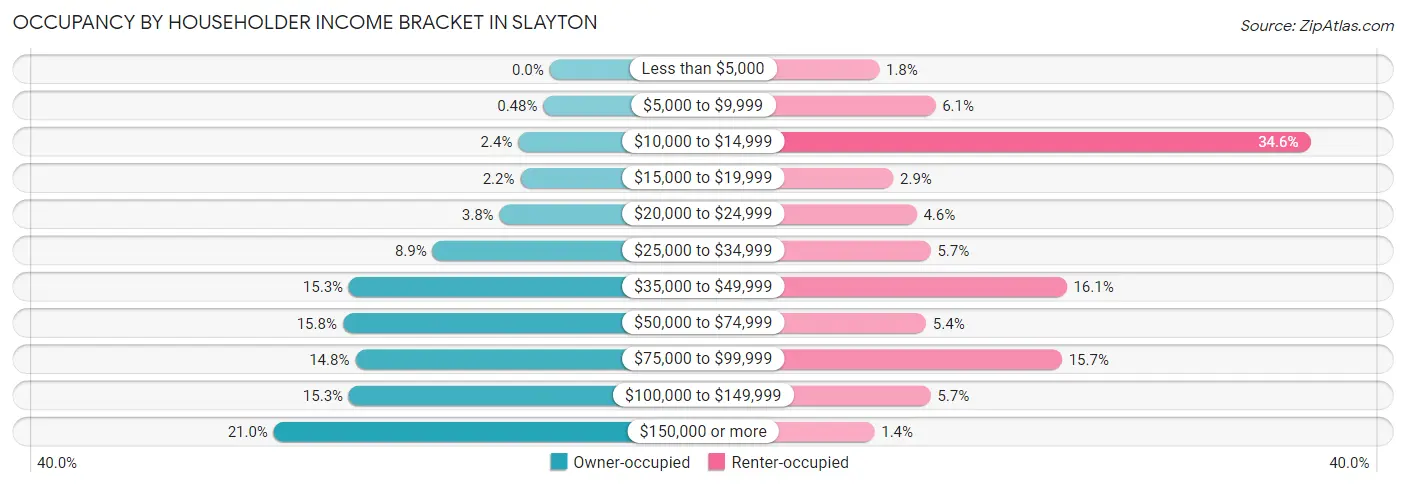
| Income Bracket | Owner-occupied | Renter-occupied |
| Less than $5,000 | 0 (0.0%) | 5 (1.8%) |
| $5,000 to $9,999 | 3 (0.5%) | 17 (6.1%) |
| $10,000 to $14,999 | 15 (2.4%) | 97 (34.6%) |
| $15,000 to $19,999 | 14 (2.2%) | 8 (2.9%) |
| $20,000 to $24,999 | 24 (3.8%) | 13 (4.6%) |
| $25,000 to $34,999 | 56 (8.9%) | 16 (5.7%) |
| $35,000 to $49,999 | 96 (15.3%) | 45 (16.1%) |
| $50,000 to $74,999 | 99 (15.8%) | 15 (5.4%) |
| $75,000 to $99,999 | 93 (14.8%) | 44 (15.7%) |
| $100,000 to $149,999 | 96 (15.3%) | 16 (5.7%) |
| $150,000 or more | 132 (21.0%) | 4 (1.4%) |
| Total | 628 (100.0%) | 280 (100.0%) |
Monthly Housing Cost Tiers in Slayton
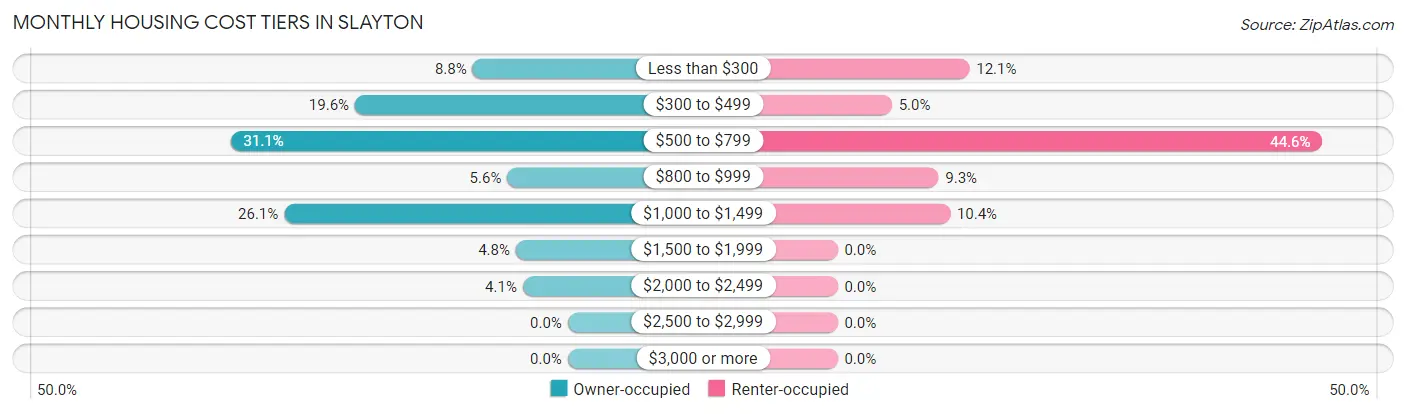
| Monthly Cost | Owner-occupied | Renter-occupied |
| Less than $300 | 55 (8.8%) | 34 (12.1%) |
| $300 to $499 | 123 (19.6%) | 14 (5.0%) |
| $500 to $799 | 195 (31.0%) | 125 (44.6%) |
| $800 to $999 | 35 (5.6%) | 26 (9.3%) |
| $1,000 to $1,499 | 164 (26.1%) | 29 (10.4%) |
| $1,500 to $1,999 | 30 (4.8%) | 0 (0.0%) |
| $2,000 to $2,499 | 26 (4.1%) | 0 (0.0%) |
| $2,500 to $2,999 | 0 (0.0%) | 0 (0.0%) |
| $3,000 or more | 0 (0.0%) | 0 (0.0%) |
| Total | 628 (100.0%) | 280 (100.0%) |
Physical Housing Characteristics in Slayton
Housing Structures in Slayton
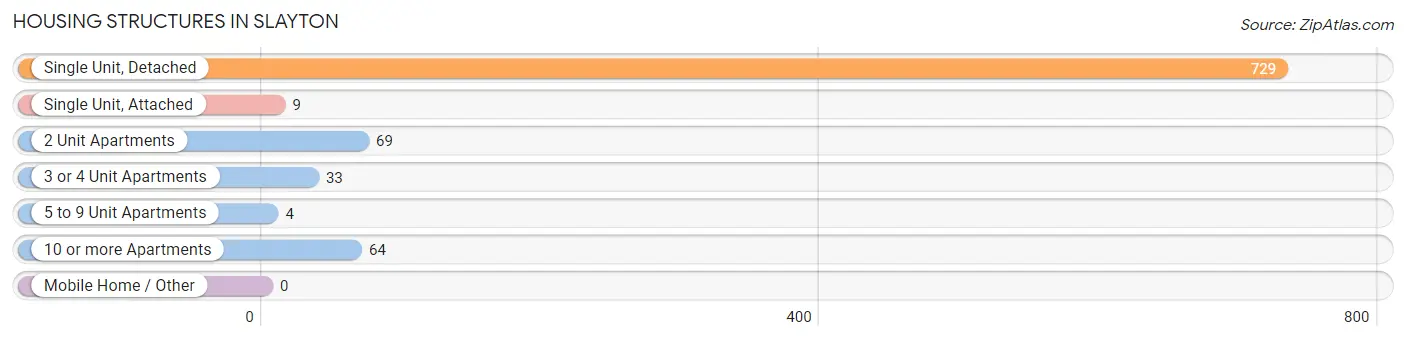
| Structure Type | # Housing Units | % Housing Units |
| Single Unit, Detached | 729 | 80.3% |
| Single Unit, Attached | 9 | 1.0% |
| 2 Unit Apartments | 69 | 7.6% |
| 3 or 4 Unit Apartments | 33 | 3.6% |
| 5 to 9 Unit Apartments | 4 | 0.4% |
| 10 or more Apartments | 64 | 7.0% |
| Mobile Home / Other | 0 | 0.0% |
| Total | 908 | 100.0% |
Housing Structures by Occupancy in Slayton
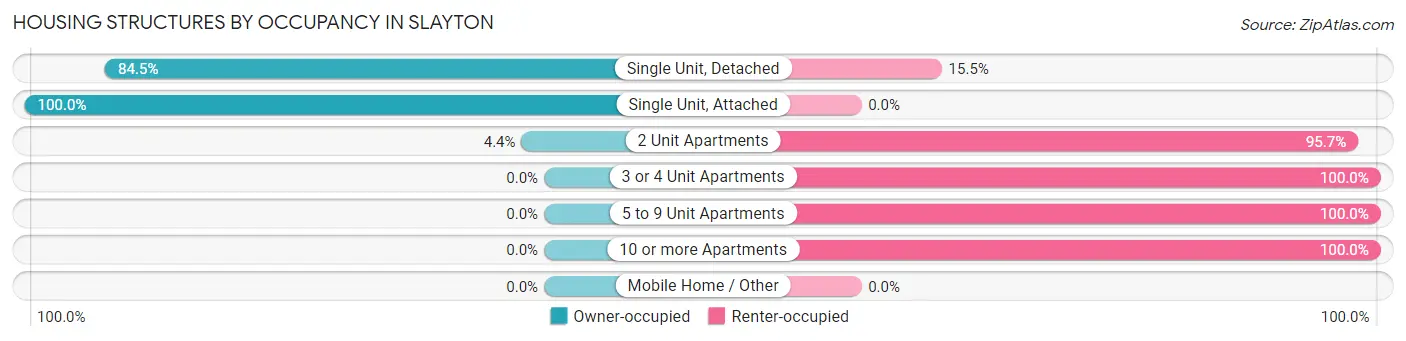
| Structure Type | Owner-occupied | Renter-occupied |
| Single Unit, Detached | 616 (84.5%) | 113 (15.5%) |
| Single Unit, Attached | 9 (100.0%) | 0 (0.0%) |
| 2 Unit Apartments | 3 (4.3%) | 66 (95.7%) |
| 3 or 4 Unit Apartments | 0 (0.0%) | 33 (100.0%) |
| 5 to 9 Unit Apartments | 0 (0.0%) | 4 (100.0%) |
| 10 or more Apartments | 0 (0.0%) | 64 (100.0%) |
| Mobile Home / Other | 0 (0.0%) | 0 (0.0%) |
| Total | 628 (69.2%) | 280 (30.8%) |
Housing Structures by Number of Rooms in Slayton
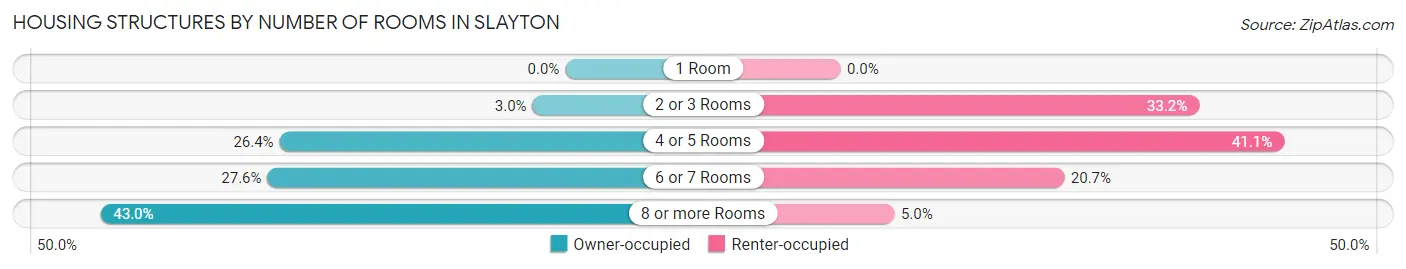
| Number of Rooms | Owner-occupied | Renter-occupied |
| 1 Room | 0 (0.0%) | 0 (0.0%) |
| 2 or 3 Rooms | 19 (3.0%) | 93 (33.2%) |
| 4 or 5 Rooms | 166 (26.4%) | 115 (41.1%) |
| 6 or 7 Rooms | 173 (27.6%) | 58 (20.7%) |
| 8 or more Rooms | 270 (43.0%) | 14 (5.0%) |
| Total | 628 (100.0%) | 280 (100.0%) |
Housing Structure by Heating Type in Slayton
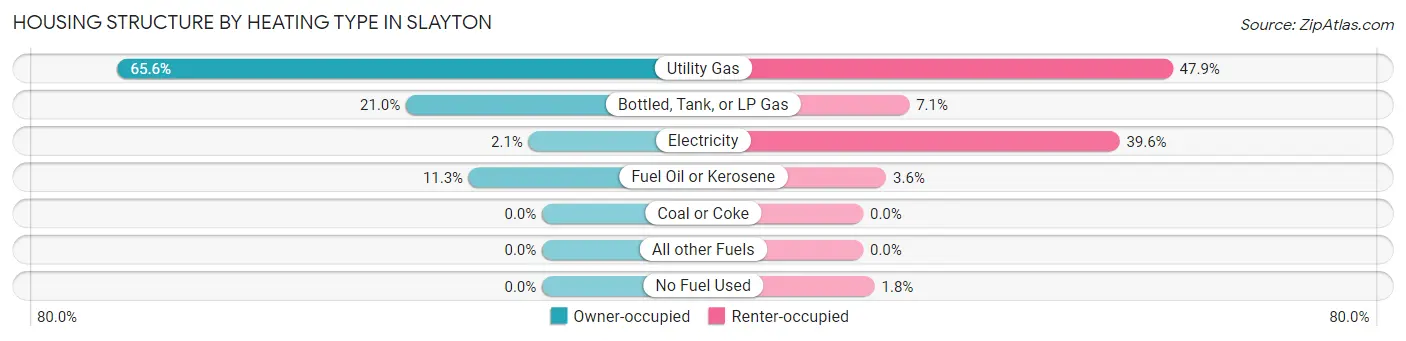
| Heating Type | Owner-occupied | Renter-occupied |
| Utility Gas | 412 (65.6%) | 134 (47.9%) |
| Bottled, Tank, or LP Gas | 132 (21.0%) | 20 (7.1%) |
| Electricity | 13 (2.1%) | 111 (39.6%) |
| Fuel Oil or Kerosene | 71 (11.3%) | 10 (3.6%) |
| Coal or Coke | 0 (0.0%) | 0 (0.0%) |
| All other Fuels | 0 (0.0%) | 0 (0.0%) |
| No Fuel Used | 0 (0.0%) | 5 (1.8%) |
| Total | 628 (100.0%) | 280 (100.0%) |
Household Vehicle Usage in Slayton
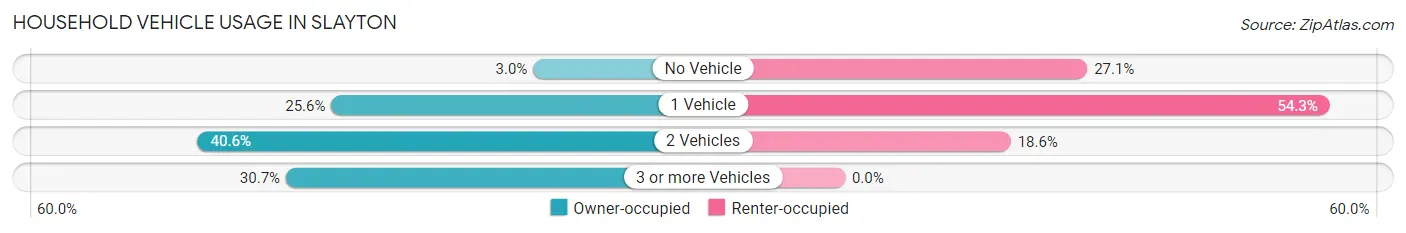
| Vehicles per Household | Owner-occupied | Renter-occupied |
| No Vehicle | 19 (3.0%) | 76 (27.1%) |
| 1 Vehicle | 161 (25.6%) | 152 (54.3%) |
| 2 Vehicles | 255 (40.6%) | 52 (18.6%) |
| 3 or more Vehicles | 193 (30.7%) | 0 (0.0%) |
| Total | 628 (100.0%) | 280 (100.0%) |
Real Estate & Mortgages in Slayton
Real Estate and Mortgage Overview in Slayton
| Characteristic | Without Mortgage | With Mortgage |
| Housing Units | 311 | 317 |
| Median Property Value | $137,100 | $151,500 |
| Median Household Income | $62,639 | $100 |
| Monthly Housing Costs | $483 | $0 |
| Real Estate Taxes | $1,201 | $0 |
Property Value by Mortgage Status in Slayton
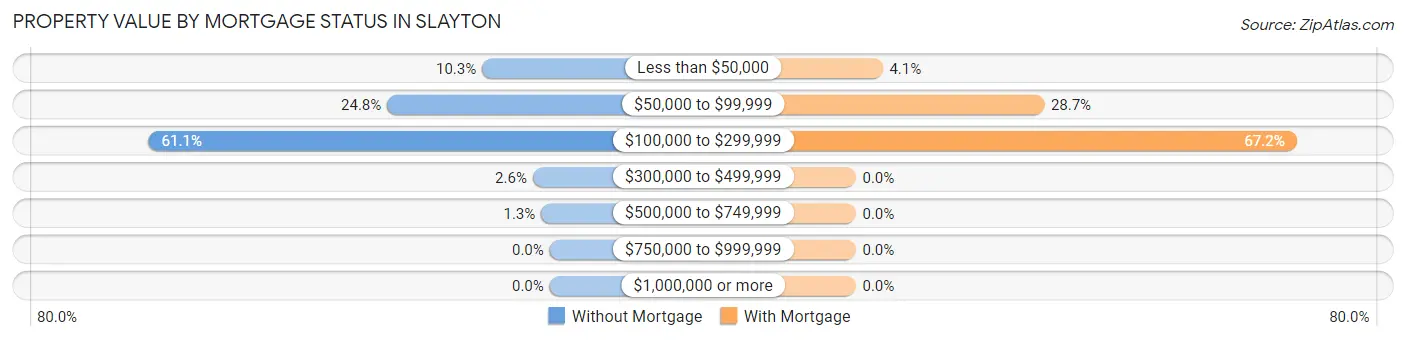
| Property Value | Without Mortgage | With Mortgage |
| Less than $50,000 | 32 (10.3%) | 13 (4.1%) |
| $50,000 to $99,999 | 77 (24.8%) | 91 (28.7%) |
| $100,000 to $299,999 | 190 (61.1%) | 213 (67.2%) |
| $300,000 to $499,999 | 8 (2.6%) | 0 (0.0%) |
| $500,000 to $749,999 | 4 (1.3%) | 0 (0.0%) |
| $750,000 to $999,999 | 0 (0.0%) | 0 (0.0%) |
| $1,000,000 or more | 0 (0.0%) | 0 (0.0%) |
| Total | 311 (100.0%) | 317 (100.0%) |
Household Income by Mortgage Status in Slayton
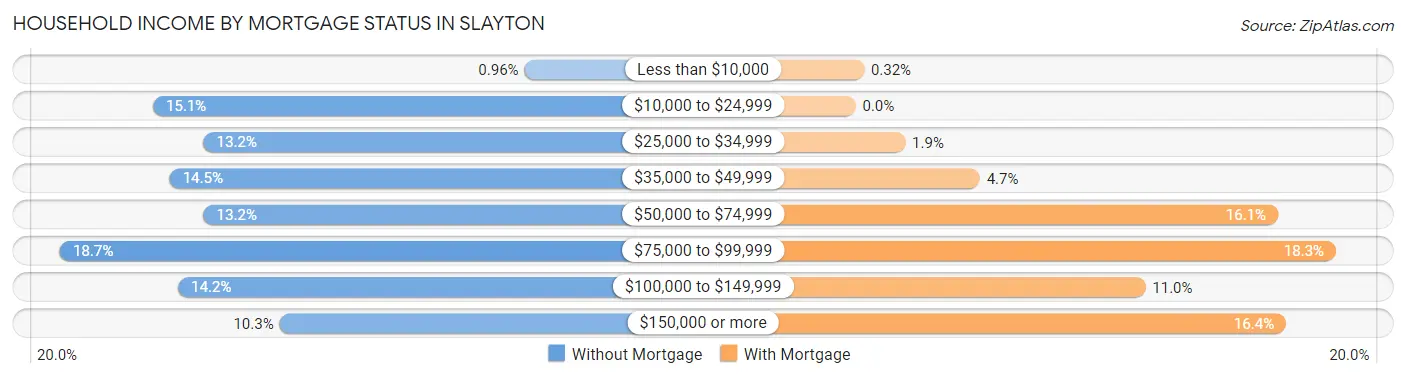
| Household Income | Without Mortgage | With Mortgage |
| Less than $10,000 | 3 (1.0%) | 1 (0.3%) |
| $10,000 to $24,999 | 47 (15.1%) | 0 (0.0%) |
| $25,000 to $34,999 | 41 (13.2%) | 6 (1.9%) |
| $35,000 to $49,999 | 45 (14.5%) | 15 (4.7%) |
| $50,000 to $74,999 | 41 (13.2%) | 51 (16.1%) |
| $75,000 to $99,999 | 58 (18.6%) | 58 (18.3%) |
| $100,000 to $149,999 | 44 (14.1%) | 35 (11.0%) |
| $150,000 or more | 32 (10.3%) | 52 (16.4%) |
| Total | 311 (100.0%) | 317 (100.0%) |
Property Value to Household Income Ratio in Slayton
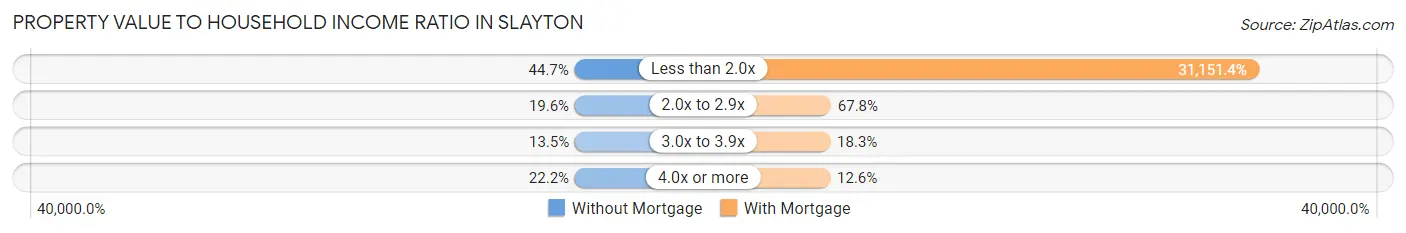
| Value-to-Income Ratio | Without Mortgage | With Mortgage |
| Less than 2.0x | 139 (44.7%) | 98,750 (31,151.4%) |
| 2.0x to 2.9x | 61 (19.6%) | 215 (67.8%) |
| 3.0x to 3.9x | 42 (13.5%) | 58 (18.3%) |
| 4.0x or more | 69 (22.2%) | 40 (12.6%) |
| Total | 311 (100.0%) | 317 (100.0%) |
Real Estate Taxes by Mortgage Status in Slayton
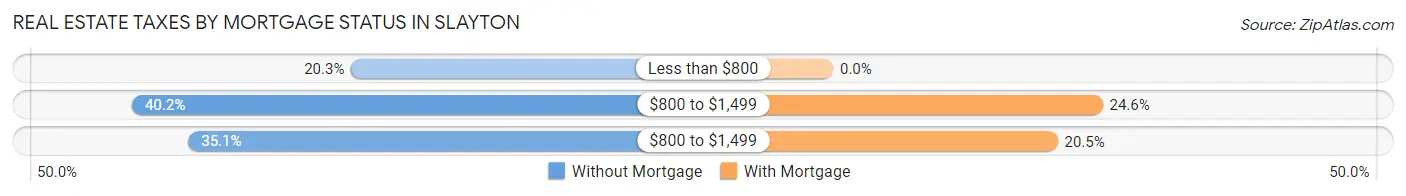
| Property Taxes | Without Mortgage | With Mortgage |
| Less than $800 | 63 (20.3%) | 0 (0.0%) |
| $800 to $1,499 | 125 (40.2%) | 78 (24.6%) |
| $800 to $1,499 | 109 (35.0%) | 65 (20.5%) |
| Total | 311 (100.0%) | 317 (100.0%) |
Health & Disability in Slayton
Health Insurance Coverage by Age in Slayton
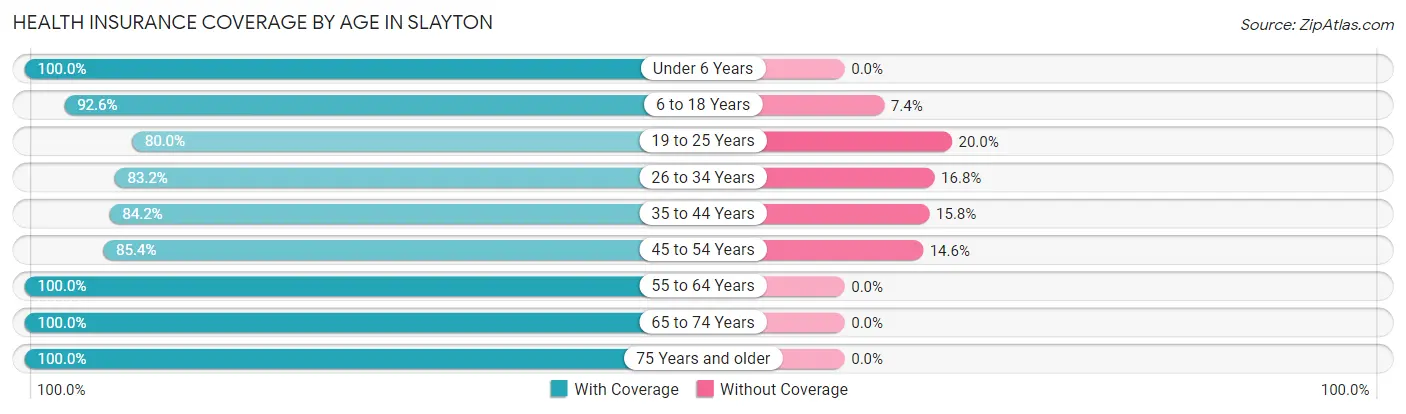
| Age Bracket | With Coverage | Without Coverage |
| Under 6 Years | 120 (100.0%) | 0 (0.0%) |
| 6 to 18 Years | 326 (92.6%) | 26 (7.4%) |
| 19 to 25 Years | 184 (80.0%) | 46 (20.0%) |
| 26 to 34 Years | 154 (83.2%) | 31 (16.8%) |
| 35 to 44 Years | 250 (84.2%) | 47 (15.8%) |
| 45 to 54 Years | 140 (85.4%) | 24 (14.6%) |
| 55 to 64 Years | 187 (100.0%) | 0 (0.0%) |
| 65 to 74 Years | 229 (100.0%) | 0 (0.0%) |
| 75 Years and older | 262 (100.0%) | 0 (0.0%) |
| Total | 1,852 (91.4%) | 174 (8.6%) |
Health Insurance Coverage by Citizenship Status in Slayton
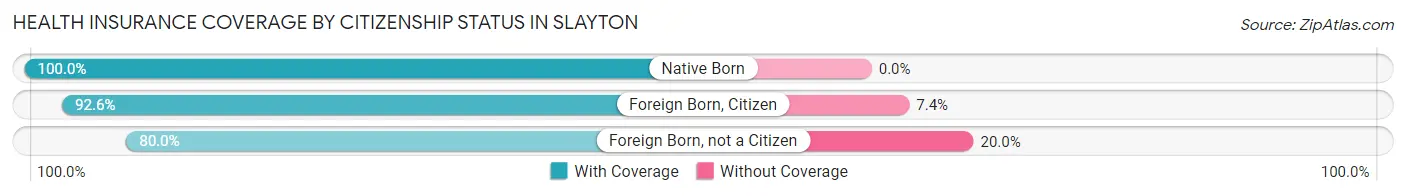
| Citizenship Status | With Coverage | Without Coverage |
| Native Born | 120 (100.0%) | 0 (0.0%) |
| Foreign Born, Citizen | 326 (92.6%) | 26 (7.4%) |
| Foreign Born, not a Citizen | 184 (80.0%) | 46 (20.0%) |
Health Insurance Coverage by Household Income in Slayton
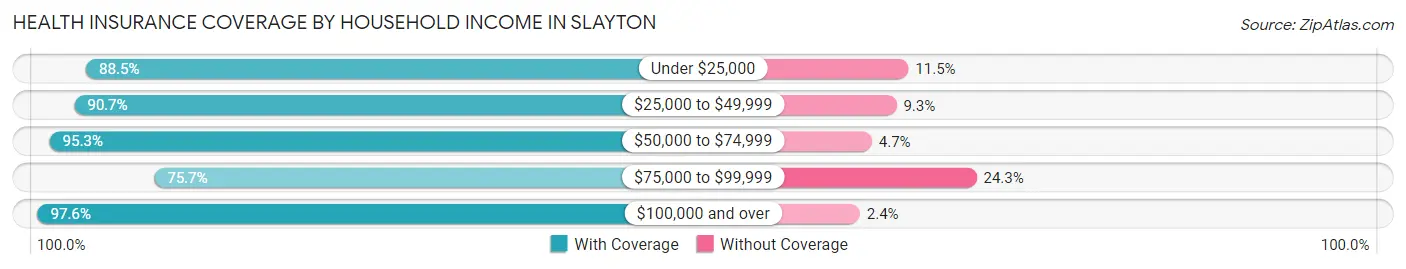
| Household Income | With Coverage | Without Coverage |
| Under $25,000 | 207 (88.5%) | 27 (11.5%) |
| $25,000 to $49,999 | 370 (90.7%) | 38 (9.3%) |
| $50,000 to $74,999 | 203 (95.3%) | 10 (4.7%) |
| $75,000 to $99,999 | 246 (75.7%) | 79 (24.3%) |
| $100,000 and over | 800 (97.6%) | 20 (2.4%) |
Public vs Private Health Insurance Coverage by Age in Slayton
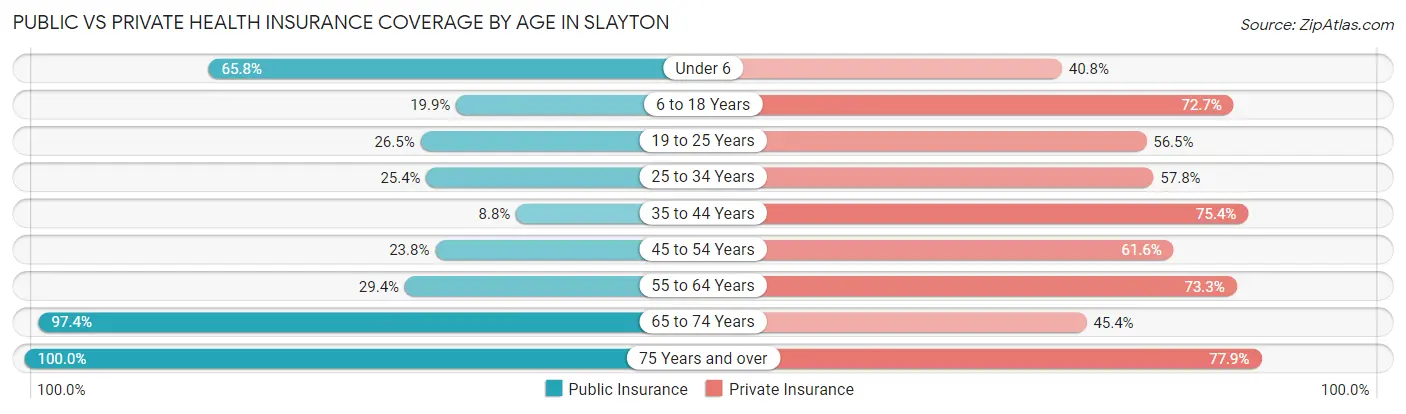
| Age Bracket | Public Insurance | Private Insurance |
| Under 6 | 79 (65.8%) | 49 (40.8%) |
| 6 to 18 Years | 70 (19.9%) | 256 (72.7%) |
| 19 to 25 Years | 61 (26.5%) | 130 (56.5%) |
| 25 to 34 Years | 47 (25.4%) | 107 (57.8%) |
| 35 to 44 Years | 26 (8.7%) | 224 (75.4%) |
| 45 to 54 Years | 39 (23.8%) | 101 (61.6%) |
| 55 to 64 Years | 55 (29.4%) | 137 (73.3%) |
| 65 to 74 Years | 223 (97.4%) | 104 (45.4%) |
| 75 Years and over | 262 (100.0%) | 204 (77.9%) |
| Total | 862 (42.5%) | 1,312 (64.8%) |
Disability Status by Sex by Age in Slayton
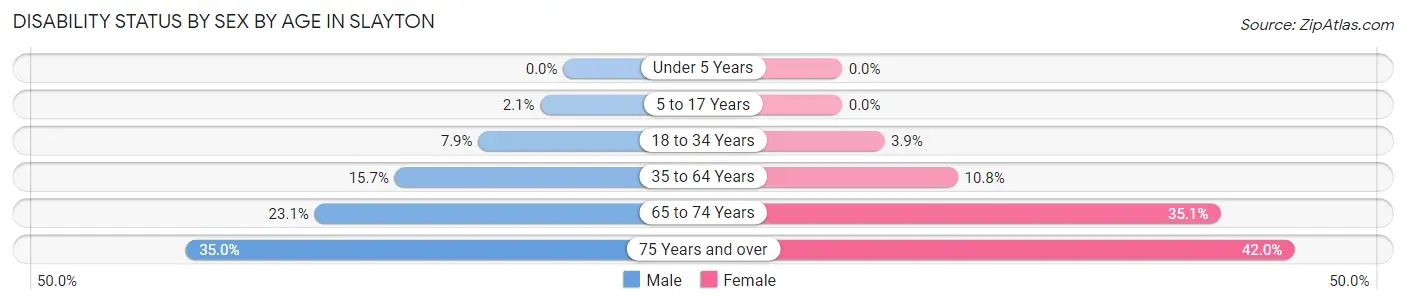
| Age Bracket | Male | Female |
| Under 5 Years | 0 (0.0%) | 0 (0.0%) |
| 5 to 17 Years | 4 (2.1%) | 0 (0.0%) |
| 18 to 34 Years | 18 (7.9%) | 8 (3.9%) |
| 35 to 64 Years | 49 (15.7%) | 36 (10.7%) |
| 65 to 74 Years | 18 (23.1%) | 53 (35.1%) |
| 75 Years and over | 35 (35.0%) | 68 (42.0%) |
Disability Class by Sex by Age in Slayton
Disability Class: Hearing Difficulty
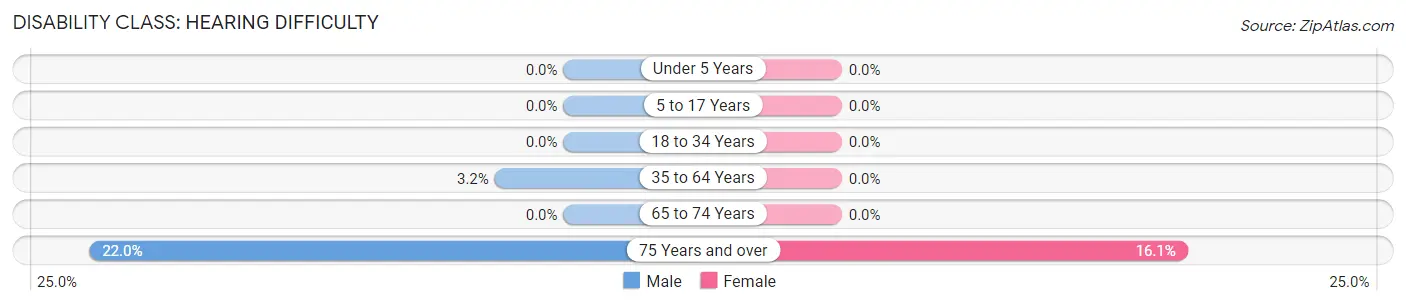
| Age Bracket | Male | Female |
| Under 5 Years | 0 (0.0%) | 0 (0.0%) |
| 5 to 17 Years | 0 (0.0%) | 0 (0.0%) |
| 18 to 34 Years | 0 (0.0%) | 0 (0.0%) |
| 35 to 64 Years | 10 (3.2%) | 0 (0.0%) |
| 65 to 74 Years | 0 (0.0%) | 0 (0.0%) |
| 75 Years and over | 22 (22.0%) | 26 (16.1%) |
Disability Class: Vision Difficulty
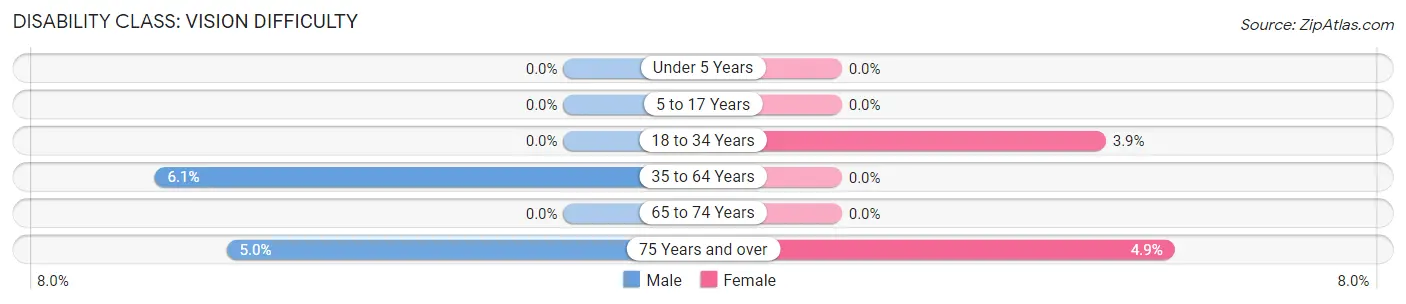
| Age Bracket | Male | Female |
| Under 5 Years | 0 (0.0%) | 0 (0.0%) |
| 5 to 17 Years | 0 (0.0%) | 0 (0.0%) |
| 18 to 34 Years | 0 (0.0%) | 8 (3.9%) |
| 35 to 64 Years | 19 (6.1%) | 0 (0.0%) |
| 65 to 74 Years | 0 (0.0%) | 0 (0.0%) |
| 75 Years and over | 5 (5.0%) | 8 (4.9%) |
Disability Class: Cognitive Difficulty
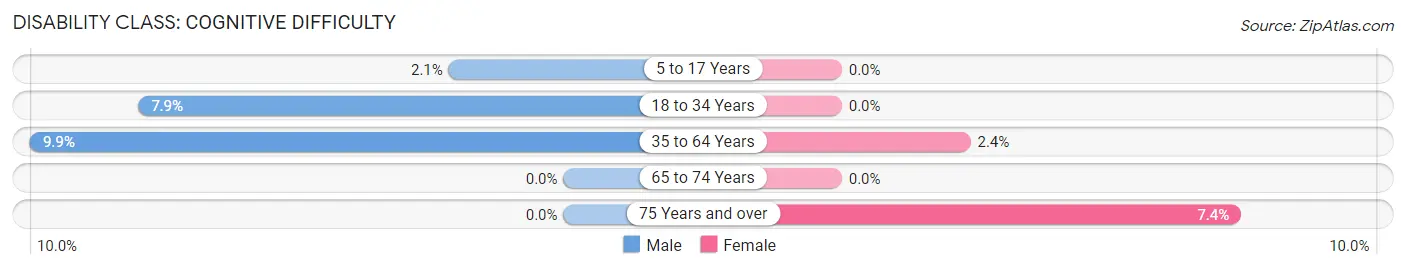
| Age Bracket | Male | Female |
| 5 to 17 Years | 4 (2.1%) | 0 (0.0%) |
| 18 to 34 Years | 18 (7.9%) | 0 (0.0%) |
| 35 to 64 Years | 31 (9.9%) | 8 (2.4%) |
| 65 to 74 Years | 0 (0.0%) | 0 (0.0%) |
| 75 Years and over | 0 (0.0%) | 12 (7.4%) |
Disability Class: Ambulatory Difficulty
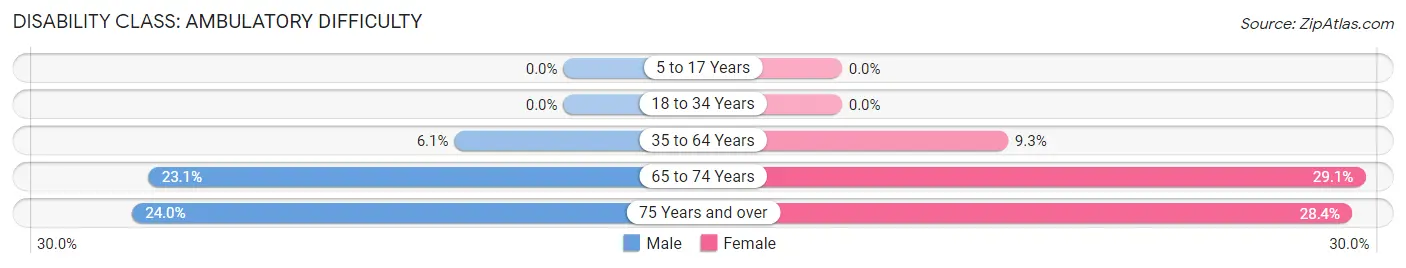
| Age Bracket | Male | Female |
| 5 to 17 Years | 0 (0.0%) | 0 (0.0%) |
| 18 to 34 Years | 0 (0.0%) | 0 (0.0%) |
| 35 to 64 Years | 19 (6.1%) | 31 (9.2%) |
| 65 to 74 Years | 18 (23.1%) | 44 (29.1%) |
| 75 Years and over | 24 (24.0%) | 46 (28.4%) |
Disability Class: Self-Care Difficulty
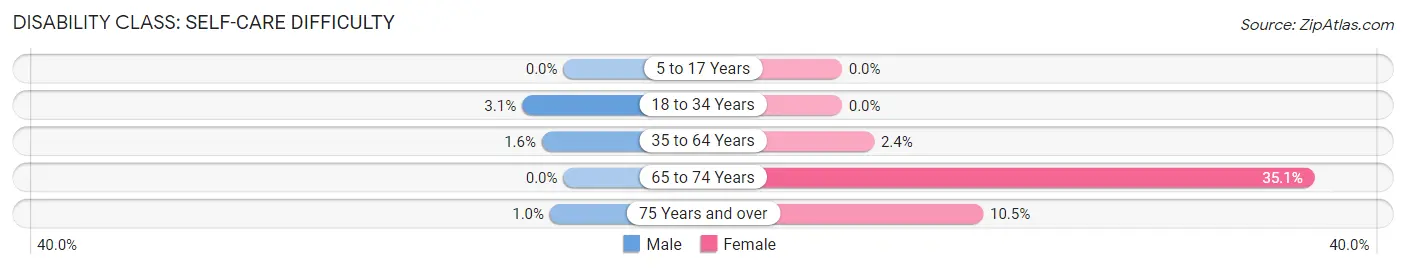
| Age Bracket | Male | Female |
| 5 to 17 Years | 0 (0.0%) | 0 (0.0%) |
| 18 to 34 Years | 7 (3.1%) | 0 (0.0%) |
| 35 to 64 Years | 5 (1.6%) | 8 (2.4%) |
| 65 to 74 Years | 0 (0.0%) | 53 (35.1%) |
| 75 Years and over | 1 (1.0%) | 17 (10.5%) |
Technology Access in Slayton
Computing Device Access in Slayton
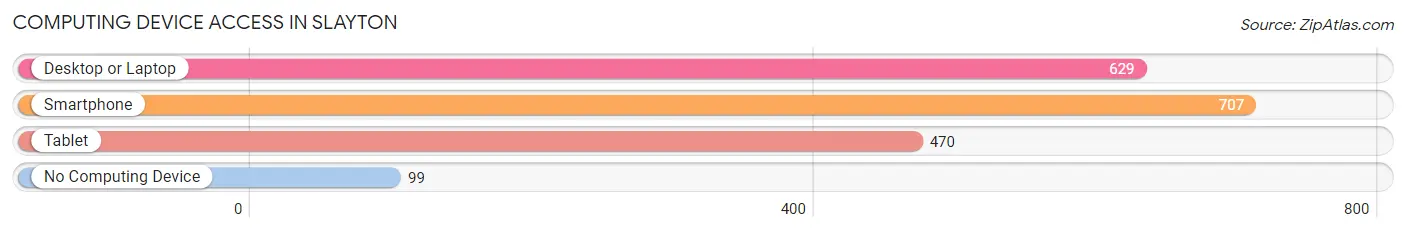
| Device Type | # Households | % Households |
| Desktop or Laptop | 629 | 69.3% |
| Smartphone | 707 | 77.9% |
| Tablet | 470 | 51.8% |
| No Computing Device | 99 | 10.9% |
| Total | 908 | 100.0% |
Internet Access in Slayton
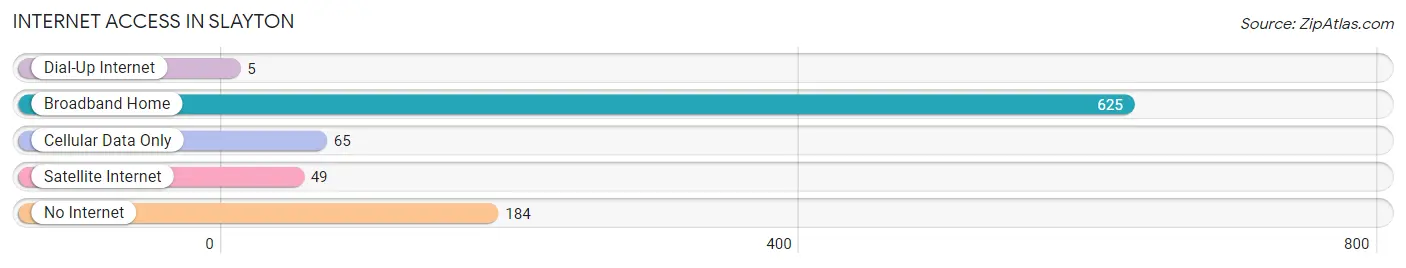
| Internet Type | # Households | % Households |
| Dial-Up Internet | 5 | 0.5% |
| Broadband Home | 625 | 68.8% |
| Cellular Data Only | 65 | 7.2% |
| Satellite Internet | 49 | 5.4% |
| No Internet | 184 | 20.3% |
| Total | 908 | 100.0% |
Slayton Summary
Slayton, Minnesota is a small city located in Murray County in the southwestern part of the state. It is situated on the banks of the Des Moines River and is home to a population of approximately 2,500 people. The city was founded in 1881 and was named after the first settler, William Slayton.
Geography
Slayton is located in the southwestern part of Minnesota, in Murray County. It is situated on the banks of the Des Moines River, which flows through the city. The city is surrounded by rolling hills and farmland, and is located approximately 30 miles from the Iowa border. The city has a total area of 2.2 square miles, all of which is land.
Climate
Slayton has a humid continental climate, with cold winters and hot summers. The average annual temperature is around 45 degrees Fahrenheit, with temperatures ranging from an average low of 22 degrees in January to an average high of 68 degrees in July. The city receives an average of 28 inches of precipitation per year, with the majority of it falling in the spring and summer months.
Demographics
As of the 2010 census, the population of Slayton was 2,521. The racial makeup of the city was 97.2% White, 0.3% African American, 0.3% Native American, 0.4% Asian, 0.1% Pacific Islander, 0.7% from other races, and 0.9% from two or more races. Hispanic or Latino of any race were 1.7% of the population.
Economy
Slayton’s economy is largely based on agriculture and manufacturing. The city is home to several large agricultural businesses, including a turkey processing plant, a dairy, and a feed mill. The city also has several manufacturing businesses, including a plastics factory and a metal fabrication plant.
The city is also home to several retail businesses, including a grocery store, a hardware store, and several restaurants. The city also has a small airport, which serves as a hub for private and corporate aircraft.
History
Slayton was founded in 1881 by William Slayton, who was the first settler in the area. The city was originally known as Slaytonville, but the name was changed to Slayton in 1883. The city was incorporated in 1887 and has remained a small, rural community ever since.
In the early 1900s, the city was home to several large businesses, including a flour mill, a creamery, and a brickyard. The city also had a railroad line, which connected it to the larger cities of Sioux Falls and Minneapolis.
In the 1950s, the city began to experience a population decline as many of its residents moved away to larger cities. However, in recent years, the city has seen a resurgence in population growth, as many people have moved back to the area to take advantage of the city’s low cost of living and its proximity to larger cities.
Today, Slayton is a small, rural community that is home to a diverse population. The city is home to several businesses, including a grocery store, a hardware store, and several restaurants. The city also has a small airport, which serves as a hub for private and corporate aircraft.
Common Questions
What is Per Capita Income in Slayton?
Per Capita income in Slayton is $36,885.
What is the Median Family Income in Slayton?
Median Family Income in Slayton is $95,375.
What is the Median Household income in Slayton?
Median Household Income in Slayton is $58,026.
What is Income or Wage Gap in Slayton?
Income or Wage Gap in Slayton is 17.9%.
Women in Slayton earn 82.1 cents for every dollar earned by a man.
What is Inequality or Gini Index in Slayton?
Inequality or Gini Index in Slayton is 0.45.
What is the Total Population of Slayton?
Total Population of Slayton is 2,053.
What is the Total Male Population of Slayton?
Total Male Population of Slayton is 959.
What is the Total Female Population of Slayton?
Total Female Population of Slayton is 1,094.
What is the Ratio of Males per 100 Females in Slayton?
There are 87.66 Males per 100 Females in Slayton.
What is the Ratio of Females per 100 Males in Slayton?
There are 114.08 Females per 100 Males in Slayton.
What is the Median Population Age in Slayton?
Median Population Age in Slayton is 40.3 Years.
What is the Average Family Size in Slayton
Average Family Size in Slayton is 3.1 People.
What is the Average Household Size in Slayton
Average Household Size in Slayton is 2.2 People.
How Large is the Labor Force in Slayton?
There are 1,038 People in the Labor Forcein in Slayton.
What is the Percentage of People in the Labor Force in Slayton?
62.0% of People are in the Labor Force in Slayton.
What is the Unemployment Rate in Slayton?
Unemployment Rate in Slayton is 3.8%.