Pine River, MN Map & Demographics
Pine River Map
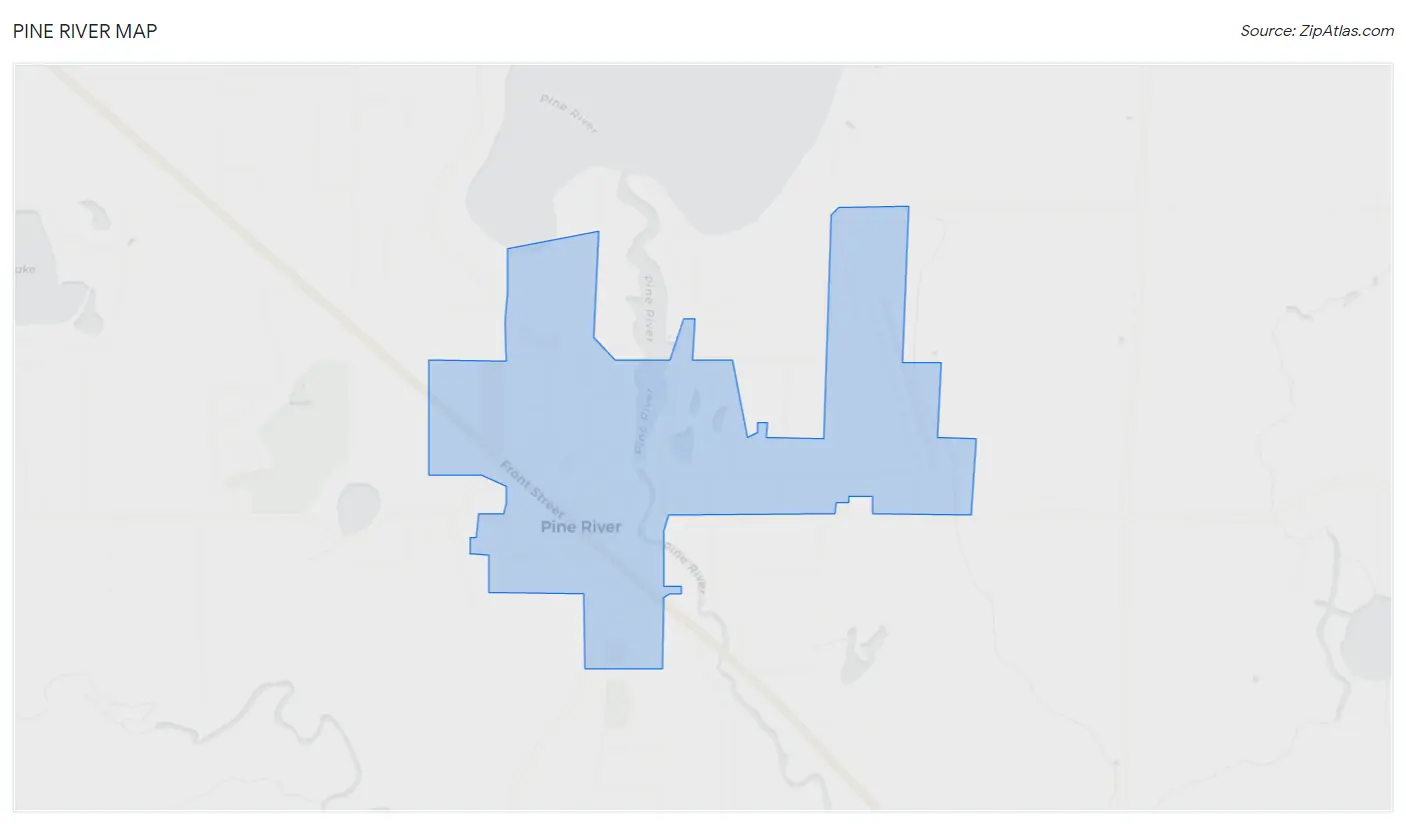
Pine River Overview
$24,020
PER CAPITA INCOME
$48,056
AVG FAMILY INCOME
$38,125
AVG HOUSEHOLD INCOME
0.2%
WAGE / INCOME GAP [ % ]
99.8¢/ $1
WAGE / INCOME GAP [ $ ]
0.36
INEQUALITY / GINI INDEX
845
TOTAL POPULATION
469
MALE POPULATION
376
FEMALE POPULATION
124.73
MALES / 100 FEMALES
80.17
FEMALES / 100 MALES
43.3
MEDIAN AGE
2.9
AVG FAMILY SIZE
2.0
AVG HOUSEHOLD SIZE
406
LABOR FORCE [ PEOPLE ]
60.2%
PERCENT IN LABOR FORCE
2.2%
UNEMPLOYMENT RATE
Pine River Zip Codes
Pine River Area Codes
Income in Pine River
Income Overview in Pine River
Per Capita Income in Pine River is $24,020, while median incomes of families and households are $48,056 and $38,125 respectively.
| Characteristic | Number | Measure |
| Per Capita Income | 845 | $24,020 |
| Median Family Income | 184 | $48,056 |
| Mean Family Income | 184 | $57,703 |
| Median Household Income | 389 | $38,125 |
| Mean Household Income | 389 | $46,062 |
| Income Deficit | 184 | $0 |
| Wage / Income Gap (%) | 845 | 0.17% |
| Wage / Income Gap ($) | 845 | 99.83¢ per $1 |
| Gini / Inequality Index | 845 | 0.36 |
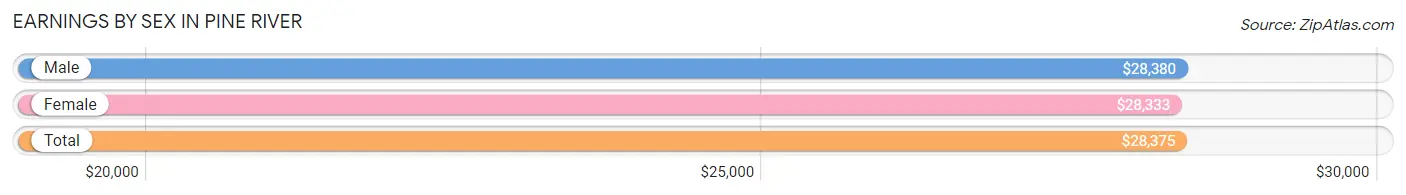
Earnings by Sex in Pine River
Average Earnings in Pine River are $28,375, $28,380 for men and $28,333 for women, a difference of 0.2%.
| Sex | Number | Average Earnings |
| Male | 221 (53.8%) | $28,380 |
| Female | 190 (46.2%) | $28,333 |
| Total | 411 (100.0%) | $28,375 |
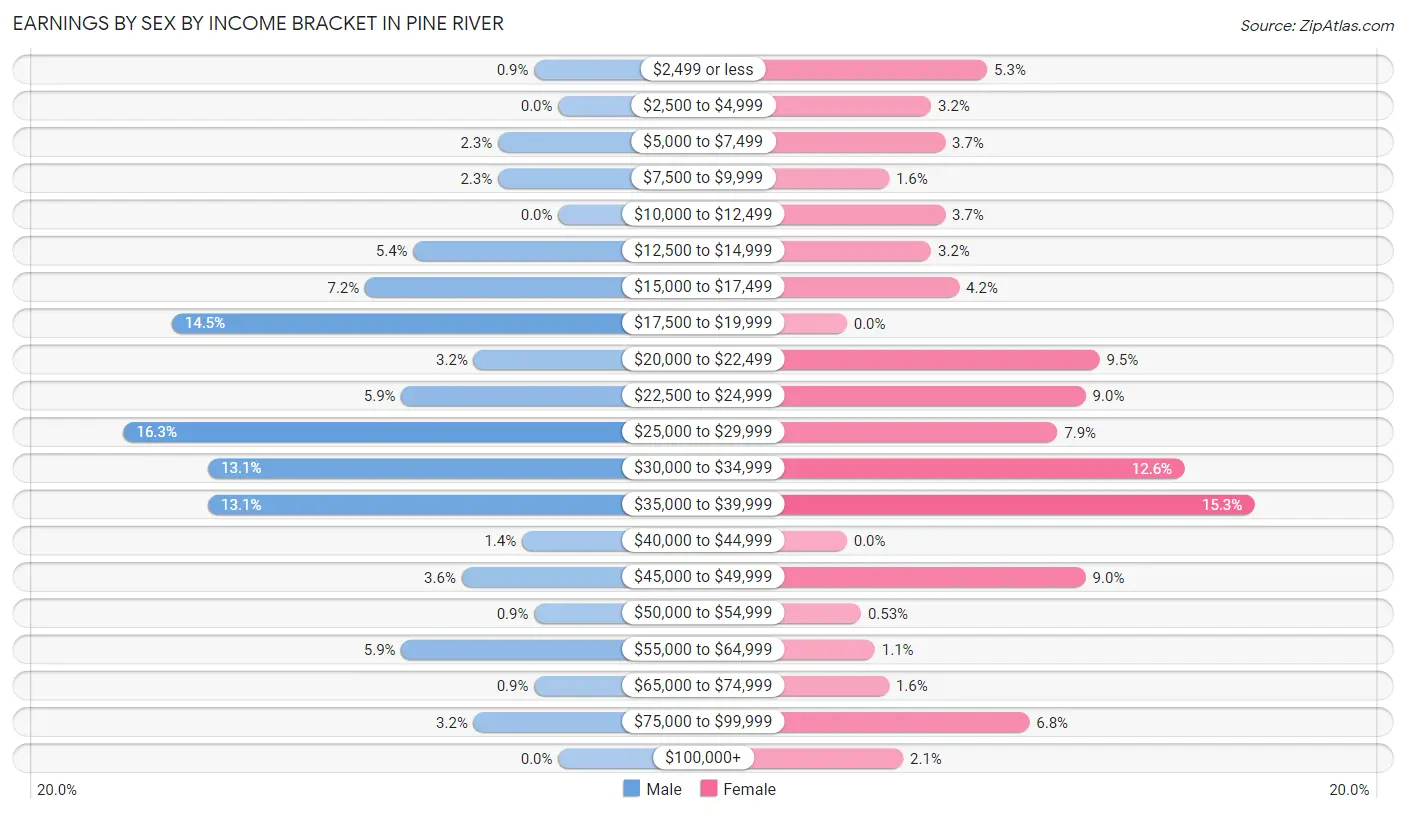
Earnings by Sex by Income Bracket in Pine River
The most common earnings brackets in Pine River are $25,000 to $29,999 for men (36 | 16.3%) and $35,000 to $39,999 for women (29 | 15.3%).
| Income | Male | Female |
| $2,499 or less | 2 (0.9%) | 10 (5.3%) |
| $2,500 to $4,999 | 0 (0.0%) | 6 (3.2%) |
| $5,000 to $7,499 | 5 (2.3%) | 7 (3.7%) |
| $7,500 to $9,999 | 5 (2.3%) | 3 (1.6%) |
| $10,000 to $12,499 | 0 (0.0%) | 7 (3.7%) |
| $12,500 to $14,999 | 12 (5.4%) | 6 (3.2%) |
| $15,000 to $17,499 | 16 (7.2%) | 8 (4.2%) |
| $17,500 to $19,999 | 32 (14.5%) | 0 (0.0%) |
| $20,000 to $22,499 | 7 (3.2%) | 18 (9.5%) |
| $22,500 to $24,999 | 13 (5.9%) | 17 (8.9%) |
| $25,000 to $29,999 | 36 (16.3%) | 15 (7.9%) |
| $30,000 to $34,999 | 29 (13.1%) | 24 (12.6%) |
| $35,000 to $39,999 | 29 (13.1%) | 29 (15.3%) |
| $40,000 to $44,999 | 3 (1.4%) | 0 (0.0%) |
| $45,000 to $49,999 | 8 (3.6%) | 17 (8.9%) |
| $50,000 to $54,999 | 2 (0.9%) | 1 (0.5%) |
| $55,000 to $64,999 | 13 (5.9%) | 2 (1.1%) |
| $65,000 to $74,999 | 2 (0.9%) | 3 (1.6%) |
| $75,000 to $99,999 | 7 (3.2%) | 13 (6.8%) |
| $100,000+ | 0 (0.0%) | 4 (2.1%) |
| Total | 221 (100.0%) | 190 (100.0%) |
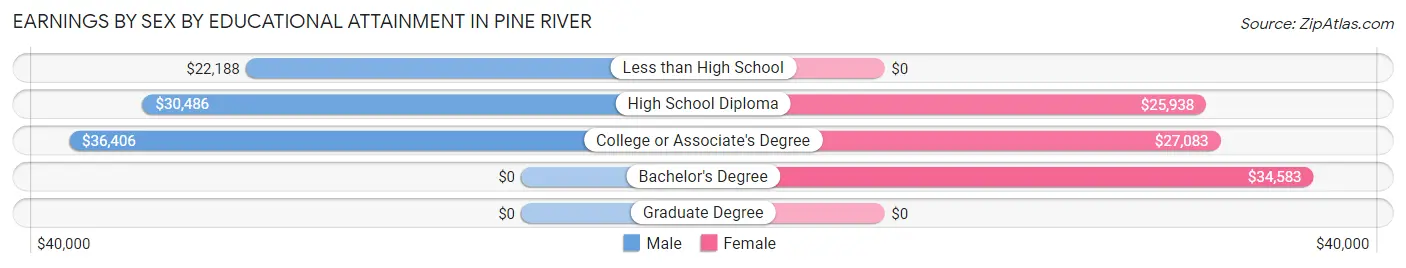
Earnings by Sex by Educational Attainment in Pine River
Average earnings in Pine River are $29,074 for men and $27,396 for women, a difference of 5.8%. Men with an educational attainment of college or associate's degree enjoy the highest average annual earnings of $36,406, while those with less than high school education earn the least with $22,188. Women with an educational attainment of bachelor's degree earn the most with the average annual earnings of $34,583, while those with high school diploma education have the smallest earnings of $25,938.
| Educational Attainment | Male Income | Female Income |
| Less than High School | $22,188 | $0 |
| High School Diploma | $30,486 | $25,938 |
| College or Associate's Degree | $36,406 | $27,083 |
| Bachelor's Degree | - | - |
| Graduate Degree | - | - |
| Total | $29,074 | $27,396 |
Family Income in Pine River
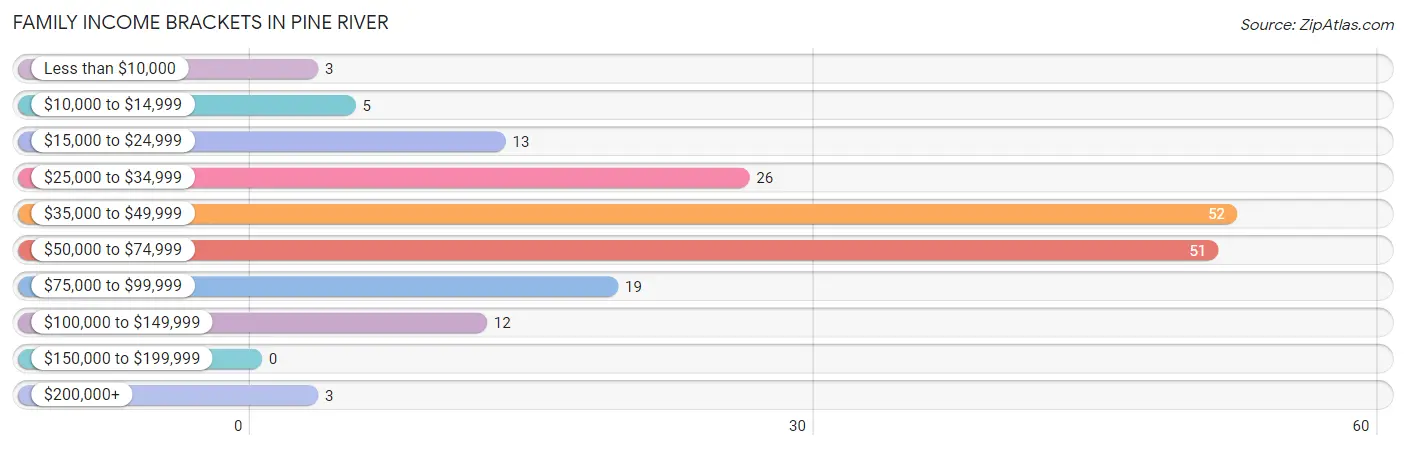
Family Income Brackets in Pine River
According to the Pine River family income data, there are 52 families falling into the $35,000 to $49,999 income range, which is the most common income bracket and makes up 28.3% of all families.
| Income Bracket | # Families | % Families |
| Less than $10,000 | 3 | 1.6% |
| $10,000 to $14,999 | 5 | 2.7% |
| $15,000 to $24,999 | 13 | 7.1% |
| $25,000 to $34,999 | 26 | 14.1% |
| $35,000 to $49,999 | 52 | 28.3% |
| $50,000 to $74,999 | 51 | 27.7% |
| $75,000 to $99,999 | 19 | 10.3% |
| $100,000 to $149,999 | 12 | 6.5% |
| $150,000 to $199,999 | 0 | 0.0% |
| $200,000+ | 3 | 1.6% |
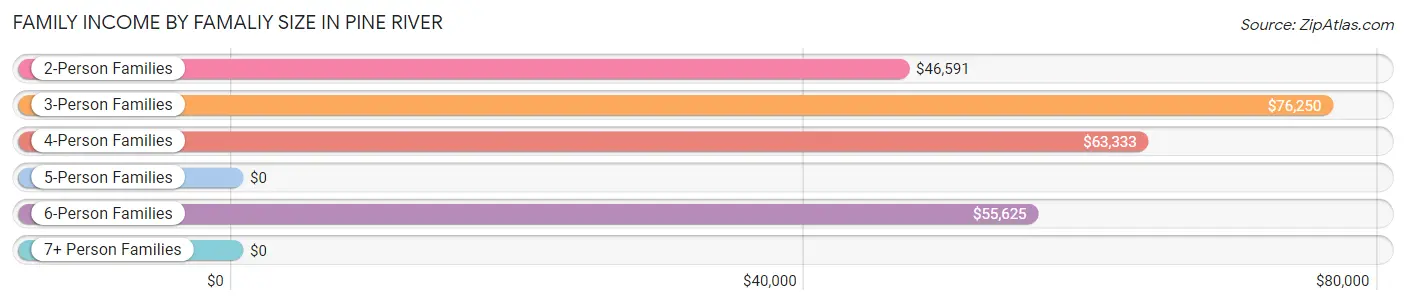
Family Income by Famaliy Size in Pine River
3-person families (10 | 5.4%) account for the highest median family income in Pine River with $76,250 per family, while 3-person families (10 | 5.4%) have the highest median income of $25,417 per family member.
| Income Bracket | # Families | Median Income |
| 2-Person Families | 116 (63.0%) | $46,591 |
| 3-Person Families | 10 (5.4%) | $76,250 |
| 4-Person Families | 30 (16.3%) | $63,333 |
| 5-Person Families | 2 (1.1%) | $0 |
| 6-Person Families | 23 (12.5%) | $55,625 |
| 7+ Person Families | 3 (1.6%) | $0 |
| Total | 184 (100.0%) | $48,056 |
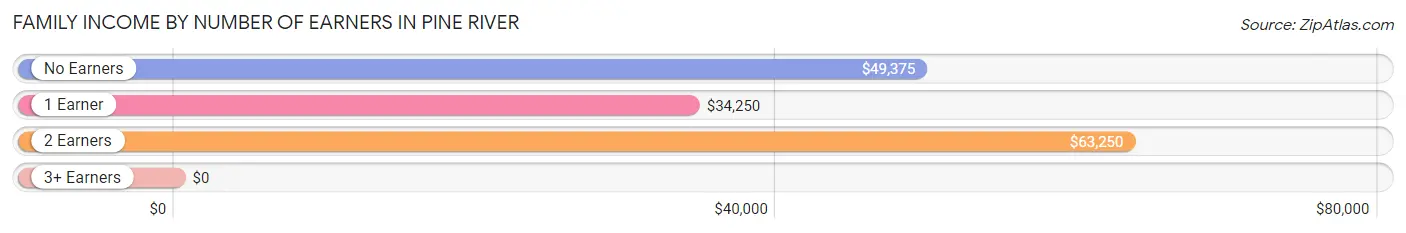
Family Income by Number of Earners in Pine River
| Number of Earners | # Families | Median Income |
| No Earners | 23 (12.5%) | $49,375 |
| 1 Earner | 61 (33.2%) | $34,250 |
| 2 Earners | 91 (49.5%) | $63,250 |
| 3+ Earners | 9 (4.9%) | $0 |
| Total | 184 (100.0%) | $48,056 |
Household Income in Pine River
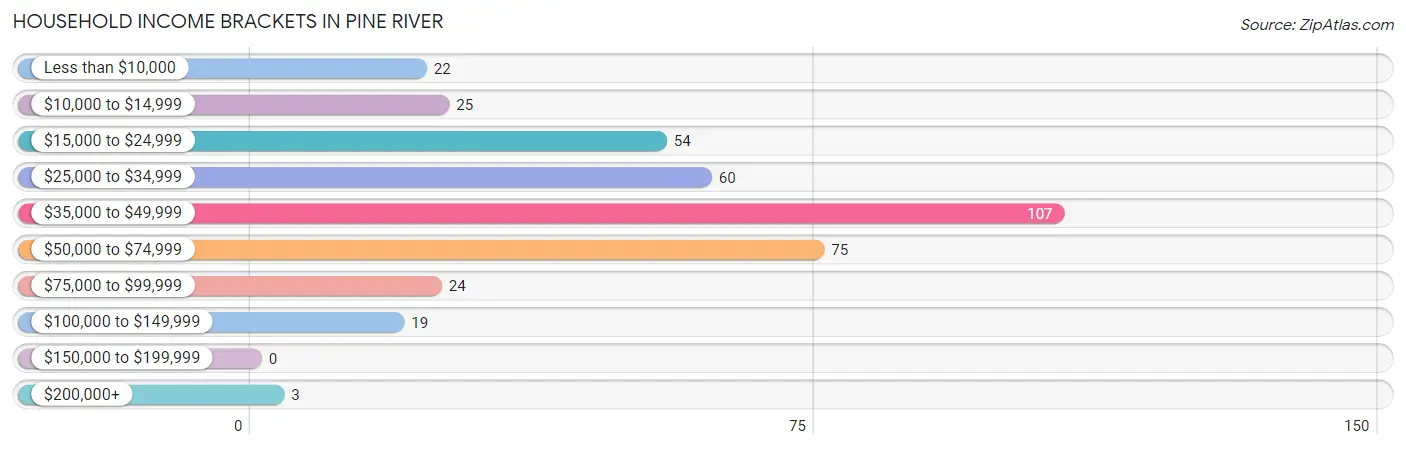
Household Income Brackets in Pine River
With 107 households falling in the category, the $35,000 to $49,999 income range is the most frequent in Pine River, accounting for 27.5% of all households.
| Income Bracket | # Households | % Households |
| Less than $10,000 | 22 | 5.7% |
| $10,000 to $14,999 | 25 | 6.4% |
| $15,000 to $24,999 | 54 | 13.9% |
| $25,000 to $34,999 | 60 | 15.4% |
| $35,000 to $49,999 | 107 | 27.5% |
| $50,000 to $74,999 | 75 | 19.3% |
| $75,000 to $99,999 | 24 | 6.2% |
| $100,000 to $149,999 | 19 | 4.9% |
| $150,000 to $199,999 | 0 | 0.0% |
| $200,000+ | 3 | 0.8% |
Household Income by Householder Age in Pine River
The median household income in Pine River is $38,125, with the highest median household income of $54,375 found in the 15 to 24 years age bracket for the primary householder. A total of 33 households (8.5%) fall into this category. Meanwhile, the 65+ years age bracket for the primary householder has the lowest median household income of $33,304, with 127 households (32.7%) in this group.
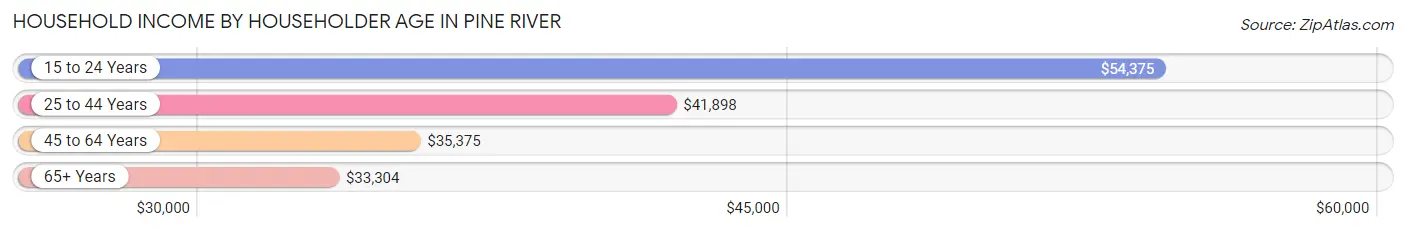
| Income Bracket | # Households | Median Income |
| 15 to 24 Years | 33 (8.5%) | $54,375 |
| 25 to 44 Years | 115 (29.6%) | $41,898 |
| 45 to 64 Years | 114 (29.3%) | $35,375 |
| 65+ Years | 127 (32.7%) | $33,304 |
| Total | 389 (100.0%) | $38,125 |
Poverty in Pine River
Income Below Poverty by Sex and Age in Pine River
With 19.2% poverty level for males and 19.3% for females among the residents of Pine River, 15 year old males and 65 to 74 year old females are the most vulnerable to poverty, with 2 males (100.0%) and 9 females (37.5%) in their respective age groups living below the poverty level.
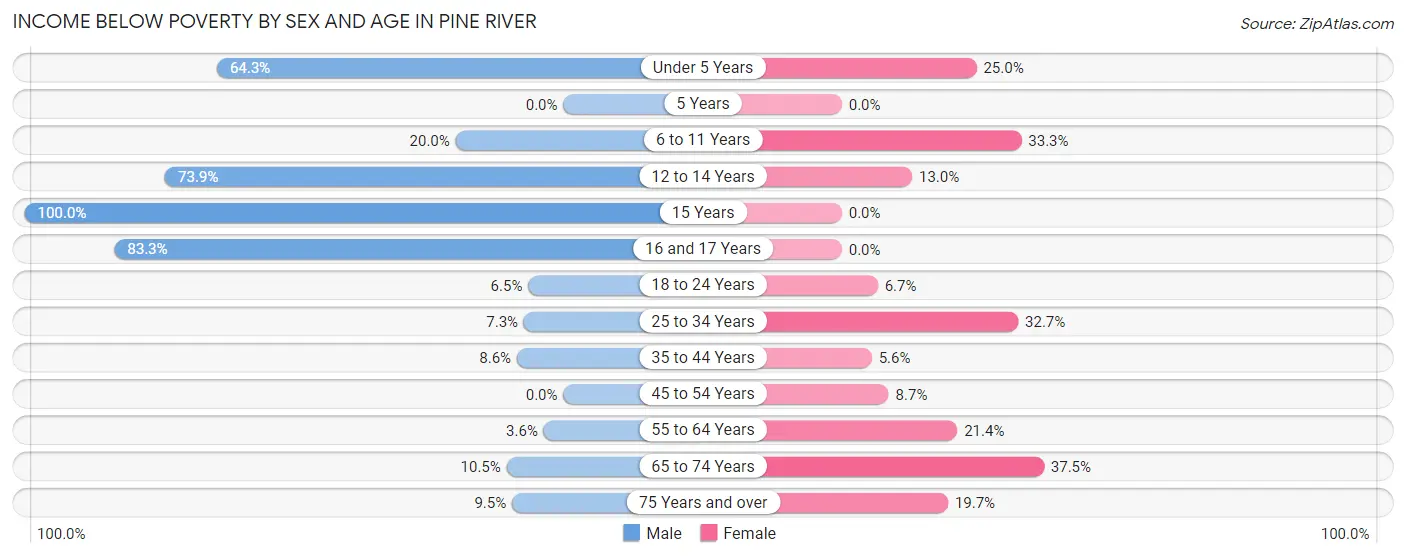
| Age Bracket | Male | Female |
| Under 5 Years | 27 (64.3%) | 3 (25.0%) |
| 5 Years | 0 (0.0%) | 0 (0.0%) |
| 6 to 11 Years | 9 (20.0%) | 7 (33.3%) |
| 12 to 14 Years | 17 (73.9%) | 3 (13.0%) |
| 15 Years | 2 (100.0%) | 0 (0.0%) |
| 16 and 17 Years | 5 (83.3%) | 0 (0.0%) |
| 18 to 24 Years | 3 (6.5%) | 2 (6.7%) |
| 25 to 34 Years | 3 (7.3%) | 18 (32.7%) |
| 35 to 44 Years | 5 (8.6%) | 2 (5.6%) |
| 45 to 54 Years | 0 (0.0%) | 4 (8.7%) |
| 55 to 64 Years | 2 (3.6%) | 9 (21.4%) |
| 65 to 74 Years | 2 (10.5%) | 9 (37.5%) |
| 75 Years and over | 4 (9.5%) | 13 (19.7%) |
| Total | 79 (19.2%) | 70 (19.3%) |
Income Above Poverty by Sex and Age in Pine River
According to the poverty statistics in Pine River, males aged 5 years and females aged 16 and 17 years are the age groups that are most secure financially, with 100.0% of males and 100.0% of females in these age groups living above the poverty line.
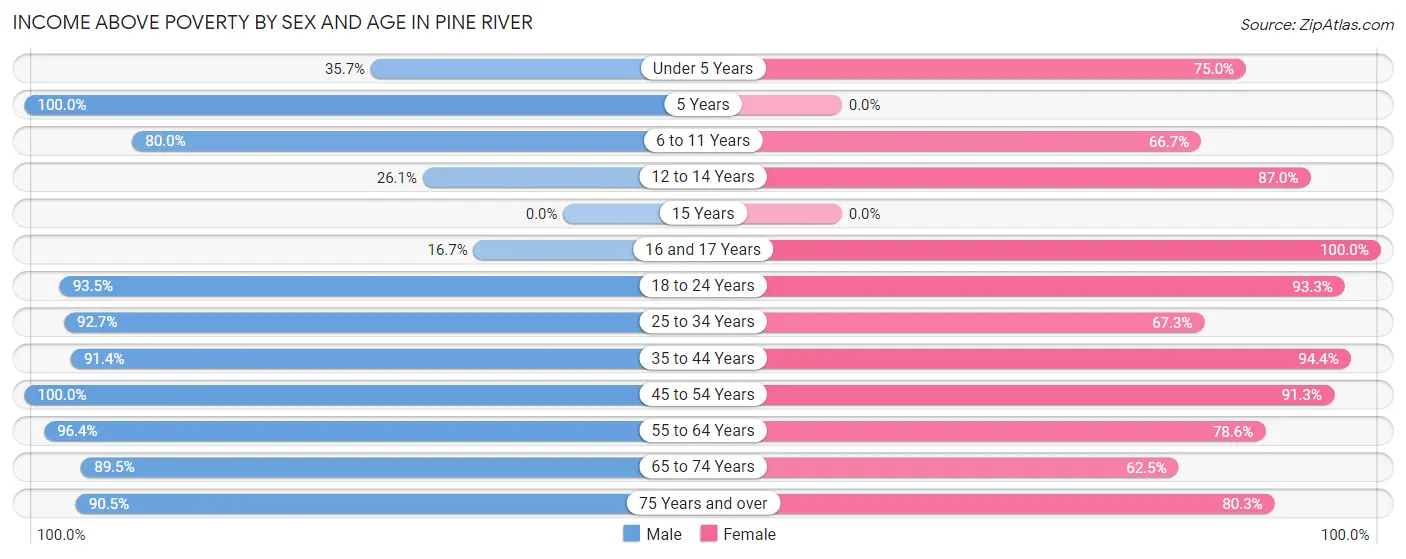
| Age Bracket | Male | Female |
| Under 5 Years | 15 (35.7%) | 9 (75.0%) |
| 5 Years | 3 (100.0%) | 0 (0.0%) |
| 6 to 11 Years | 36 (80.0%) | 14 (66.7%) |
| 12 to 14 Years | 6 (26.1%) | 20 (87.0%) |
| 15 Years | 0 (0.0%) | 0 (0.0%) |
| 16 and 17 Years | 1 (16.7%) | 8 (100.0%) |
| 18 to 24 Years | 43 (93.5%) | 28 (93.3%) |
| 25 to 34 Years | 38 (92.7%) | 37 (67.3%) |
| 35 to 44 Years | 53 (91.4%) | 34 (94.4%) |
| 45 to 54 Years | 29 (100.0%) | 42 (91.3%) |
| 55 to 64 Years | 53 (96.4%) | 33 (78.6%) |
| 65 to 74 Years | 17 (89.5%) | 15 (62.5%) |
| 75 Years and over | 38 (90.5%) | 53 (80.3%) |
| Total | 332 (80.8%) | 293 (80.7%) |
Income Below Poverty Among Married-Couple Families in Pine River
The poverty statistics for married-couple families in Pine River show that 2.6% or 3 of the total 116 families live below the poverty line. Families with 5 or more children have the highest poverty rate of 100.0%, comprising of 3 families. On the other hand, families with no children have the lowest poverty rate of 0.0%, which includes 0 families.
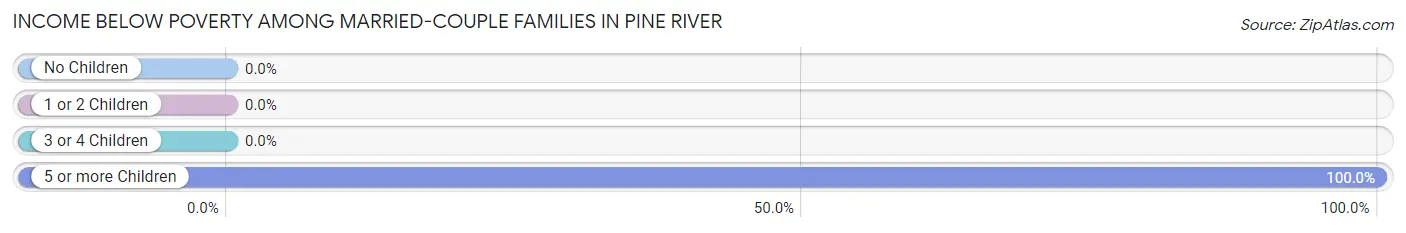
| Children | Above Poverty | Below Poverty |
| No Children | 76 (100.0%) | 0 (0.0%) |
| 1 or 2 Children | 27 (100.0%) | 0 (0.0%) |
| 3 or 4 Children | 10 (100.0%) | 0 (0.0%) |
| 5 or more Children | 0 (0.0%) | 3 (100.0%) |
| Total | 113 (97.4%) | 3 (2.6%) |
Income Below Poverty Among Single-Parent Households in Pine River
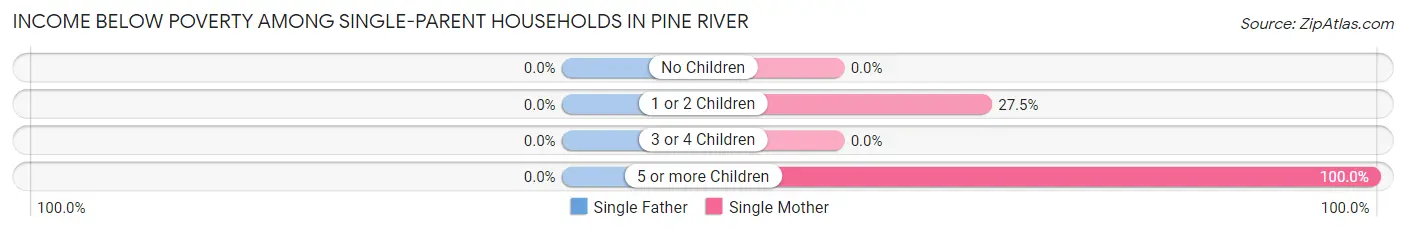
| Children | Single Father | Single Mother |
| No Children | 0 (0.0%) | 0 (0.0%) |
| 1 or 2 Children | 0 (0.0%) | 11 (27.5%) |
| 3 or 4 Children | 0 (0.0%) | 0 (0.0%) |
| 5 or more Children | 0 (0.0%) | 10 (100.0%) |
| Total | 0 (0.0%) | 21 (38.9%) |
Income Below Poverty Among Married-Couple vs Single-Parent Households in Pine River
The poverty data for Pine River shows that 3 of the married-couple family households (2.6%) and 21 of the single-parent households (30.9%) are living below the poverty level. Within the married-couple family households, those with 5 or more children have the highest poverty rate, with 3 households (100.0%) falling below the poverty line. Among the single-parent households, those with 5 or more children have the highest poverty rate, with 10 household (100.0%) living below poverty.
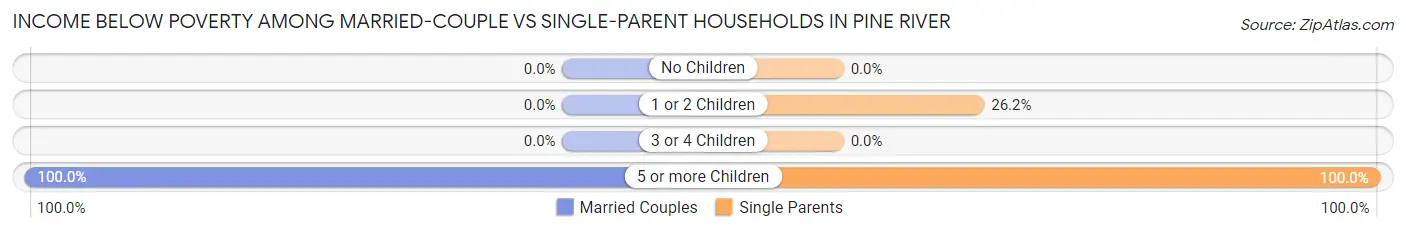
| Children | Married-Couple Families | Single-Parent Households |
| No Children | 0 (0.0%) | 0 (0.0%) |
| 1 or 2 Children | 0 (0.0%) | 11 (26.2%) |
| 3 or 4 Children | 0 (0.0%) | 0 (0.0%) |
| 5 or more Children | 3 (100.0%) | 10 (100.0%) |
| Total | 3 (2.6%) | 21 (30.9%) |
Race in Pine River
The most populous races in Pine River are White / Caucasian (769 | 91.0%), Two or more Races (43 | 5.1%), and Native / Alaskan (20 | 2.4%).
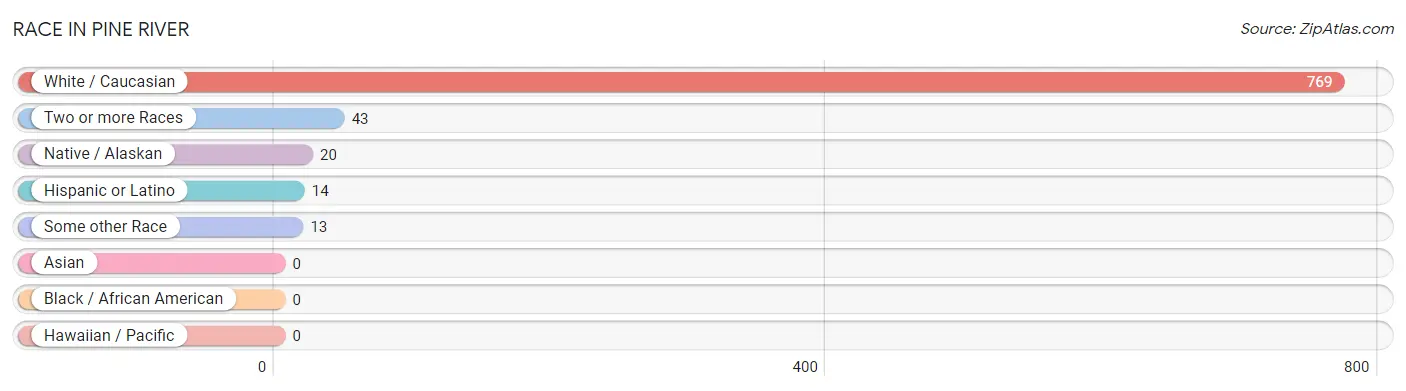
| Race | # Population | % Population |
| Asian | 0 | 0.0% |
| Black / African American | 0 | 0.0% |
| Hawaiian / Pacific | 0 | 0.0% |
| Hispanic or Latino | 14 | 1.7% |
| Native / Alaskan | 20 | 2.4% |
| White / Caucasian | 769 | 91.0% |
| Two or more Races | 43 | 5.1% |
| Some other Race | 13 | 1.5% |
| Total | 845 | 100.0% |
Ancestry in Pine River
The most populous ancestries reported in Pine River are German (199 | 23.5%), Norwegian (84 | 9.9%), Irish (74 | 8.8%), American (68 | 8.1%), and Swedish (54 | 6.4%), together accounting for 56.7% of all Pine River residents.
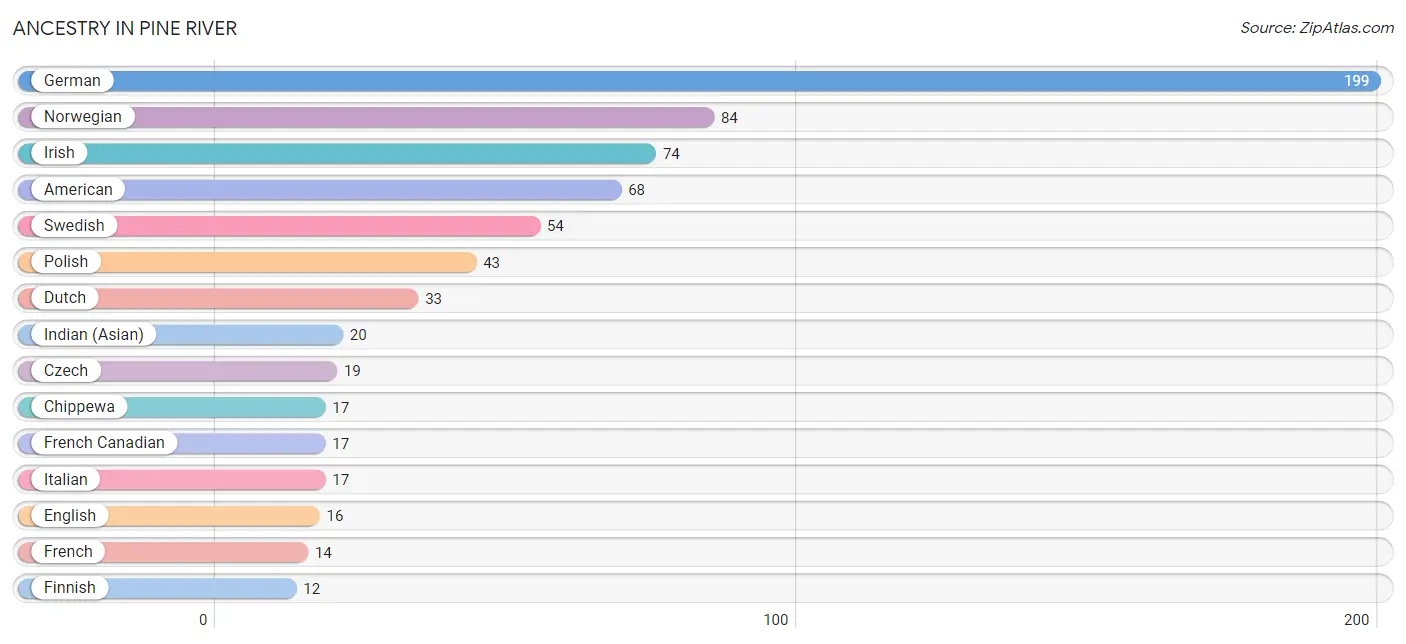
| Ancestry | # Population | % Population |
| American | 68 | 8.1% |
| Chippewa | 17 | 2.0% |
| Czech | 19 | 2.2% |
| Danish | 7 | 0.8% |
| Dutch | 33 | 3.9% |
| Eastern European | 2 | 0.2% |
| English | 16 | 1.9% |
| European | 9 | 1.1% |
| Finnish | 12 | 1.4% |
| French | 14 | 1.7% |
| French Canadian | 17 | 2.0% |
| German | 199 | 23.5% |
| Indian (Asian) | 20 | 2.4% |
| Irish | 74 | 8.8% |
| Italian | 17 | 2.0% |
| Lithuanian | 4 | 0.5% |
| Mexican | 6 | 0.7% |
| Norwegian | 84 | 9.9% |
| Polish | 43 | 5.1% |
| Romanian | 3 | 0.4% |
| Scandinavian | 3 | 0.4% |
| Scotch-Irish | 3 | 0.4% |
| Scottish | 7 | 0.8% |
| Sioux | 1 | 0.1% |
| South American | 6 | 0.7% |
| Spanish | 2 | 0.2% |
| Swedish | 54 | 6.4% |
| Uruguayan | 6 | 0.7% |
| Welsh | 2 | 0.2% | View All 29 Rows |
Immigrants in Pine River
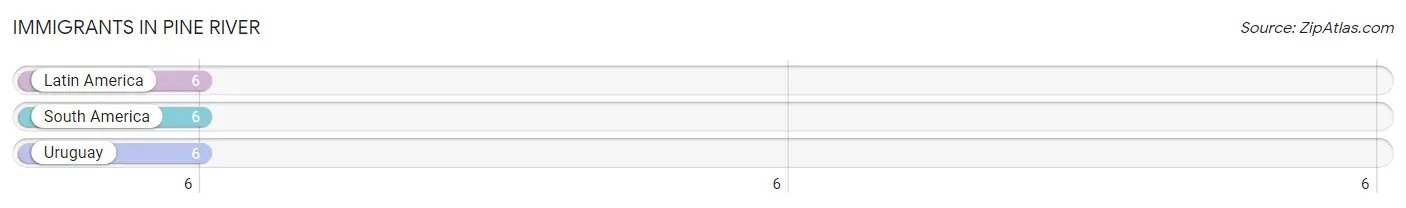
The most numerous immigrant groups reported in Pine River came from Latin America (6 | 0.7%), South America (6 | 0.7%), and Uruguay (6 | 0.7%), together accounting for 2.1% of all Pine River residents.
| Immigration Origin | # Population | % Population |
| Latin America | 6 | 0.7% |
| South America | 6 | 0.7% |
| Uruguay | 6 | 0.7% | View All 3 Rows |
Sex and Age in Pine River
Sex and Age in Pine River
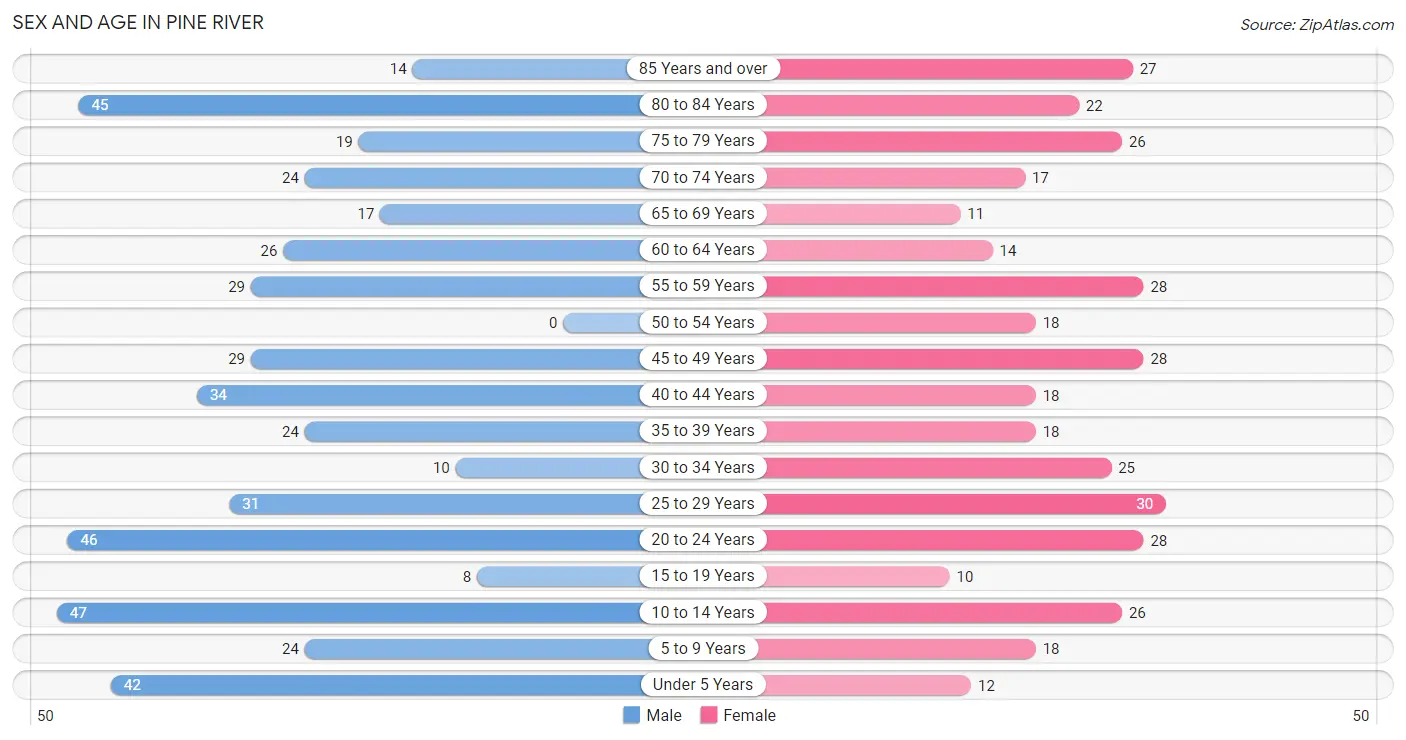
The most populous age groups in Pine River are 10 to 14 Years (47 | 10.0%) for men and 25 to 29 Years (30 | 8.0%) for women.
| Age Bracket | Male | Female |
| Under 5 Years | 42 (9.0%) | 12 (3.2%) |
| 5 to 9 Years | 24 (5.1%) | 18 (4.8%) |
| 10 to 14 Years | 47 (10.0%) | 26 (6.9%) |
| 15 to 19 Years | 8 (1.7%) | 10 (2.7%) |
| 20 to 24 Years | 46 (9.8%) | 28 (7.4%) |
| 25 to 29 Years | 31 (6.6%) | 30 (8.0%) |
| 30 to 34 Years | 10 (2.1%) | 25 (6.7%) |
| 35 to 39 Years | 24 (5.1%) | 18 (4.8%) |
| 40 to 44 Years | 34 (7.2%) | 18 (4.8%) |
| 45 to 49 Years | 29 (6.2%) | 28 (7.4%) |
| 50 to 54 Years | 0 (0.0%) | 18 (4.8%) |
| 55 to 59 Years | 29 (6.2%) | 28 (7.4%) |
| 60 to 64 Years | 26 (5.5%) | 14 (3.7%) |
| 65 to 69 Years | 17 (3.6%) | 11 (2.9%) |
| 70 to 74 Years | 24 (5.1%) | 17 (4.5%) |
| 75 to 79 Years | 19 (4.1%) | 26 (6.9%) |
| 80 to 84 Years | 45 (9.6%) | 22 (5.9%) |
| 85 Years and over | 14 (3.0%) | 27 (7.2%) |
| Total | 469 (100.0%) | 376 (100.0%) |
Families and Households in Pine River
Median Family Size in Pine River
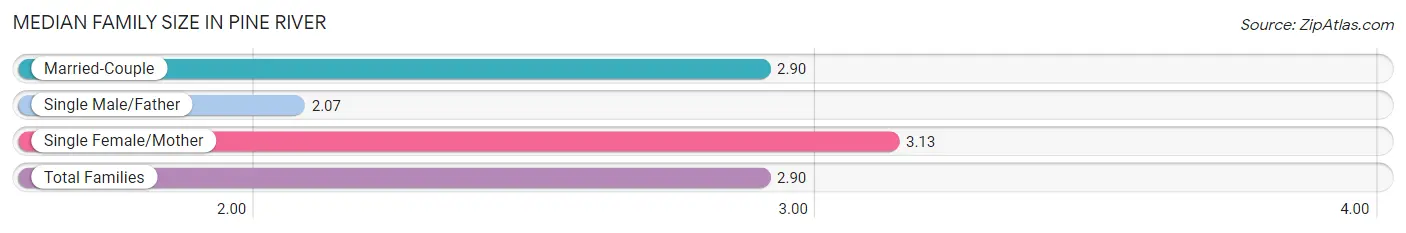
The median family size in Pine River is 2.90 persons per family, with single female/mother families (54 | 29.3%) accounting for the largest median family size of 3.13 persons per family. On the other hand, single male/father families (14 | 7.6%) represent the smallest median family size with 2.07 persons per family.
| Family Type | # Families | Family Size |
| Married-Couple | 116 (63.0%) | 2.90 |
| Single Male/Father | 14 (7.6%) | 2.07 |
| Single Female/Mother | 54 (29.3%) | 3.13 |
| Total Families | 184 (100.0%) | 2.90 |
Median Household Size in Pine River
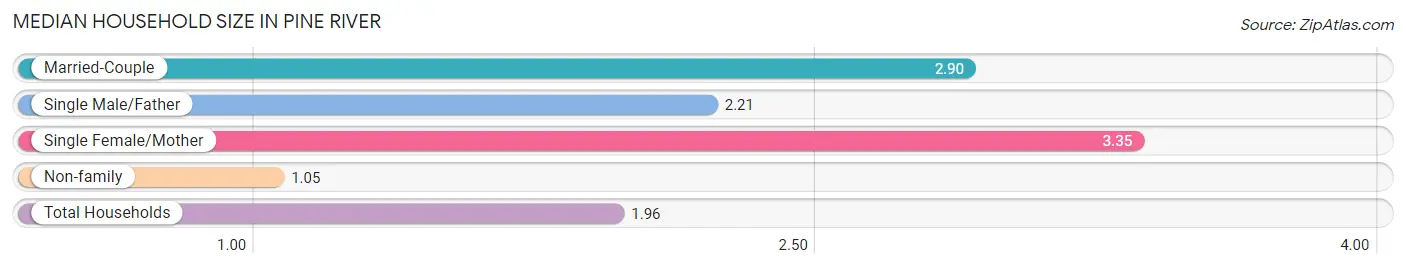
The median household size in Pine River is 1.96 persons per household, with single female/mother households (54 | 13.9%) accounting for the largest median household size of 3.35 persons per household. non-family households (205 | 52.7%) represent the smallest median household size with 1.05 persons per household.
| Household Type | # Households | Household Size |
| Married-Couple | 116 (29.8%) | 2.90 |
| Single Male/Father | 14 (3.6%) | 2.21 |
| Single Female/Mother | 54 (13.9%) | 3.35 |
| Non-family | 205 (52.7%) | 1.05 |
| Total Households | 389 (100.0%) | 1.96 |
Household Size by Marriage Status in Pine River
Out of a total of 389 households in Pine River, 184 (47.3%) are family households, while 205 (52.7%) are nonfamily households. The most numerous type of family households are 2-person households, comprising 108, and the most common type of nonfamily households are 1-person households, comprising 196.
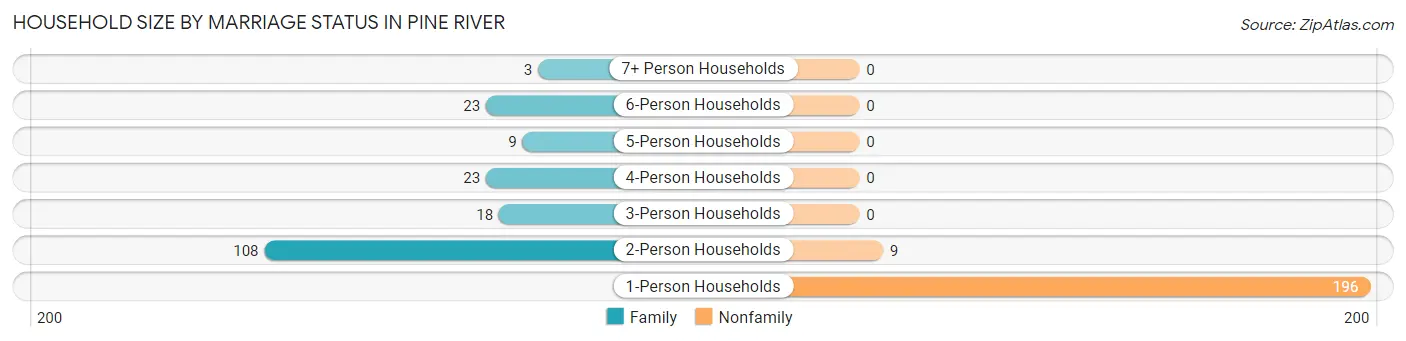
| Household Size | Family Households | Nonfamily Households |
| 1-Person Households | - | 196 (50.4%) |
| 2-Person Households | 108 (27.8%) | 9 (2.3%) |
| 3-Person Households | 18 (4.6%) | 0 (0.0%) |
| 4-Person Households | 23 (5.9%) | 0 (0.0%) |
| 5-Person Households | 9 (2.3%) | 0 (0.0%) |
| 6-Person Households | 23 (5.9%) | 0 (0.0%) |
| 7+ Person Households | 3 (0.8%) | 0 (0.0%) |
| Total | 184 (47.3%) | 205 (52.7%) |
Female Fertility in Pine River
Fertility by Age in Pine River
Average fertility rate in Pine River is 96.0 births per 1,000 women. Women in the age bracket of 20 to 34 years have the highest fertility rate with 181.0 births per 1,000 women. Women in the age bracket of 20 to 34 years acount for 100.0% of all women with births.
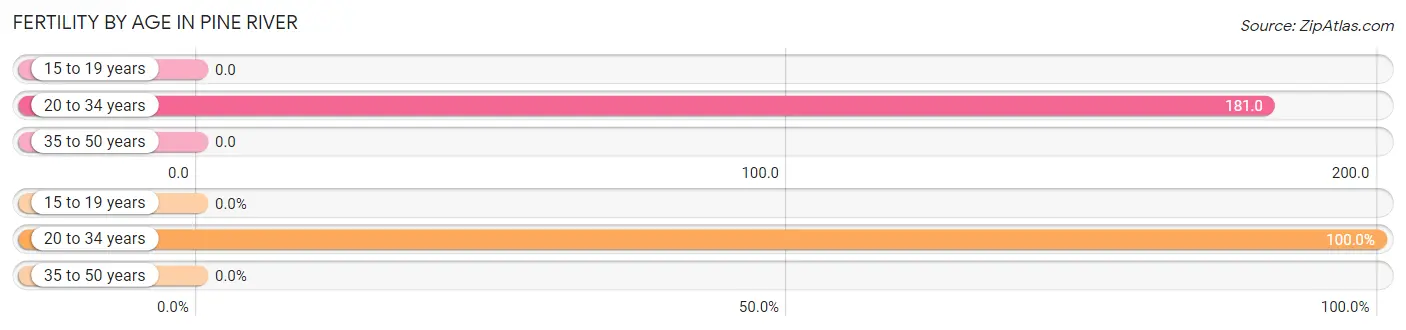
| Age Bracket | Women with Births | Births / 1,000 Women |
| 15 to 19 years | 0 (0.0%) | 0.0 |
| 20 to 34 years | 15 (100.0%) | 181.0 |
| 35 to 50 years | 0 (0.0%) | 0.0 |
| Total | 15 (100.0%) | 96.0 |
Fertility by Age by Marriage Status in Pine River
33.3% of women with births (15) in Pine River are married. The highest percentage of unmarried women with births falls into 20 to 34 years age bracket with 66.7% of them unmarried at the time of birth, while the lowest percentage of unmarried women with births belong to 20 to 34 years age bracket with 66.7% of them unmarried.
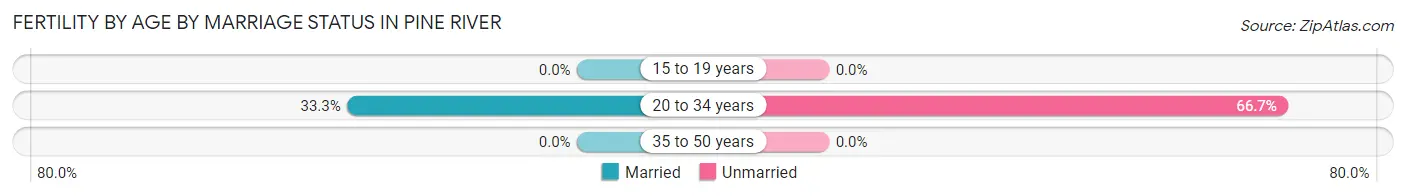
| Age Bracket | Married | Unmarried |
| 15 to 19 years | 0 (0.0%) | 0 (0.0%) |
| 20 to 34 years | 5 (33.3%) | 10 (66.7%) |
| 35 to 50 years | 0 (0.0%) | 0 (0.0%) |
| Total | 5 (33.3%) | 10 (66.7%) |
Fertility by Education in Pine River
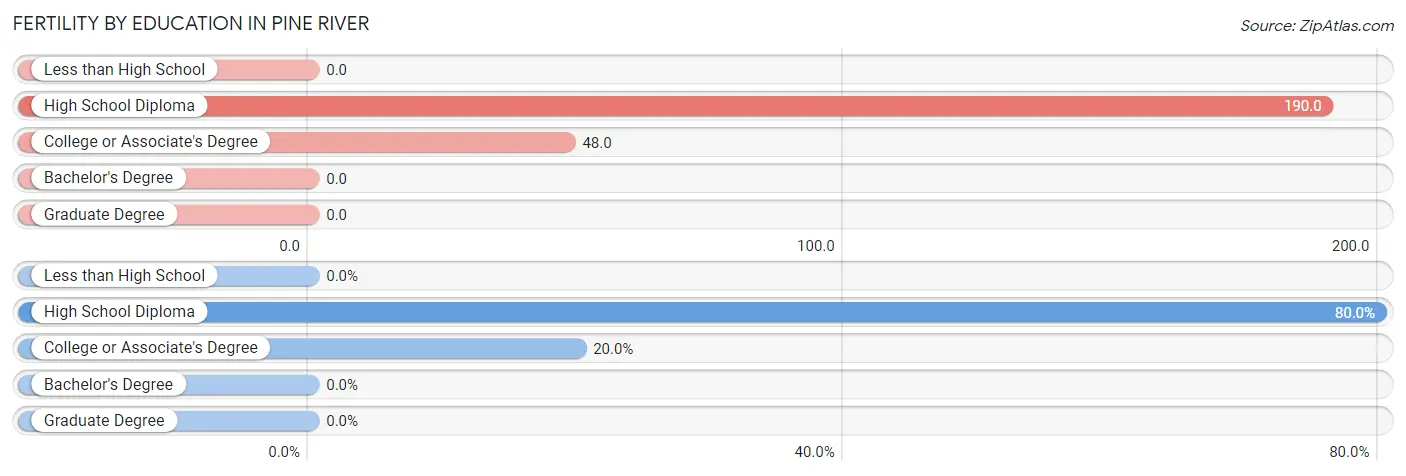
| Educational Attainment | Women with Births | Births / 1,000 Women |
| Less than High School | 0 (0.0%) | 0.0 |
| High School Diploma | 12 (80.0%) | 190.0 |
| College or Associate's Degree | 3 (20.0%) | 48.0 |
| Bachelor's Degree | 0 (0.0%) | 0.0 |
| Graduate Degree | 0 (0.0%) | 0.0 |
| Total | 15 (100.0%) | 96.0 |
Fertility by Education by Marriage Status in Pine River
66.7% of women with births in Pine River are unmarried. Women with the educational attainment of college or associate's degree are most likely to be married with 100.0% of them married at childbirth, while women with the educational attainment of high school diploma are least likely to be married with 83.3% of them unmarried at childbirth.
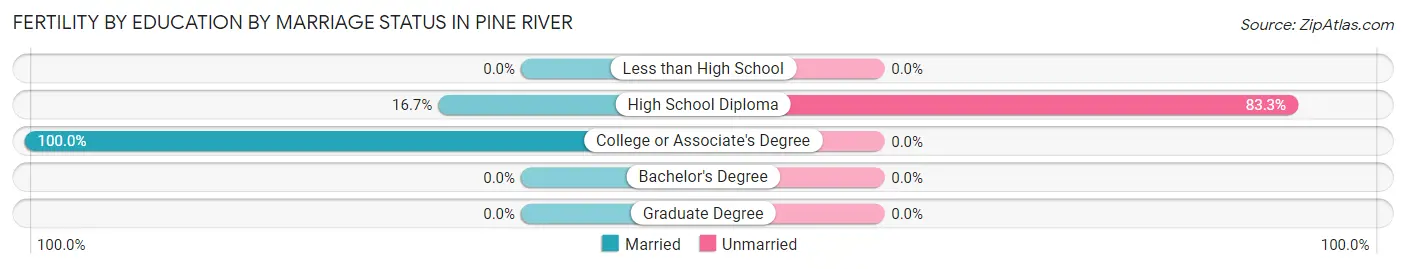
| Educational Attainment | Married | Unmarried |
| Less than High School | 0 (0.0%) | 0 (0.0%) |
| High School Diploma | 2 (16.7%) | 10 (83.3%) |
| College or Associate's Degree | 3 (100.0%) | 0 (0.0%) |
| Bachelor's Degree | 0 (0.0%) | 0 (0.0%) |
| Graduate Degree | 0 (0.0%) | 0 (0.0%) |
| Total | 5 (33.3%) | 10 (66.7%) |
Employment Characteristics in Pine River
Employment by Class of Employer in Pine River
Among the 378 employed individuals in Pine River, private company employees (242 | 64.0%), not-for-profit organizations (63 | 16.7%), and self-employed (not incorporated) (47 | 12.4%) make up the most common classes of employment.
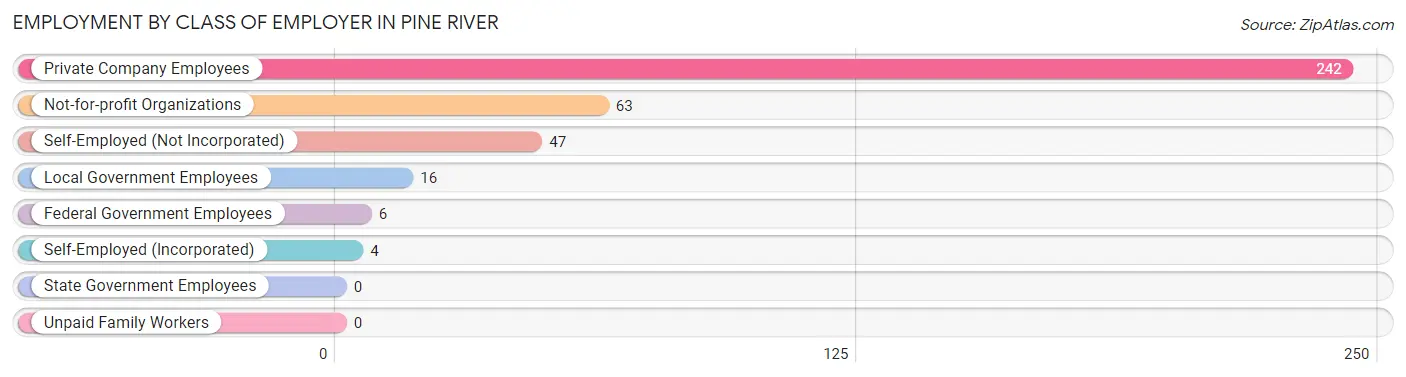
| Employer Class | # Employees | % Employees |
| Private Company Employees | 242 | 64.0% |
| Self-Employed (Incorporated) | 4 | 1.1% |
| Self-Employed (Not Incorporated) | 47 | 12.4% |
| Not-for-profit Organizations | 63 | 16.7% |
| Local Government Employees | 16 | 4.2% |
| State Government Employees | 0 | 0.0% |
| Federal Government Employees | 6 | 1.6% |
| Unpaid Family Workers | 0 | 0.0% |
| Total | 378 | 100.0% |
Employment Status by Age in Pine River
According to the labor force statistics for Pine River, out of the total population over 16 years of age (674), 60.2% or 406 individuals are in the labor force, with 2.2% or 9 of them unemployed. The age group with the highest labor force participation rate is 35 to 44 years, with 97.9% or 92 individuals in the labor force. Within the labor force, the 16 to 19 years age range has the highest percentage of unemployed individuals, with 50.0% or 3 of them being unemployed.
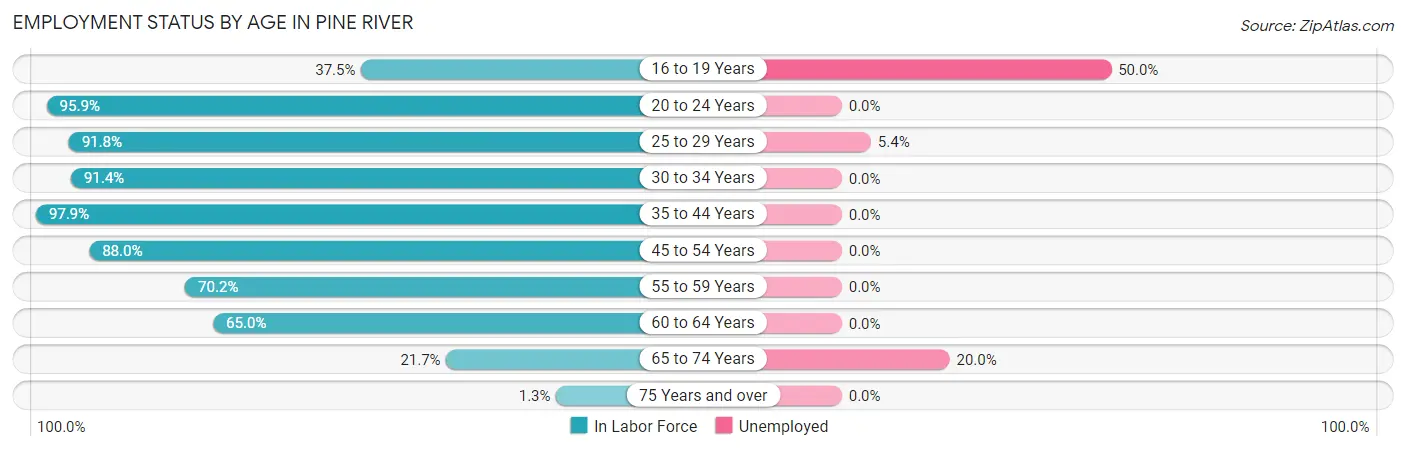
| Age Bracket | In Labor Force | Unemployed |
| 16 to 19 Years | 6 (37.5%) | 3 (50.0%) |
| 20 to 24 Years | 71 (95.9%) | 0 (0.0%) |
| 25 to 29 Years | 56 (91.8%) | 3 (5.4%) |
| 30 to 34 Years | 32 (91.4%) | 0 (0.0%) |
| 35 to 44 Years | 92 (97.9%) | 0 (0.0%) |
| 45 to 54 Years | 66 (88.0%) | 0 (0.0%) |
| 55 to 59 Years | 40 (70.2%) | 0 (0.0%) |
| 60 to 64 Years | 26 (65.0%) | 0 (0.0%) |
| 65 to 74 Years | 15 (21.7%) | 3 (20.0%) |
| 75 Years and over | 2 (1.3%) | 0 (0.0%) |
| Total | 406 (60.2%) | 9 (2.2%) |
Employment Status by Educational Attainment in Pine River
According to labor force statistics for Pine River, 86.2% of individuals (312) out of the total population between 25 and 64 years of age (362) are in the labor force, with 1.0% or 3 of them being unemployed. The group with the highest labor force participation rate are those with the educational attainment of college / associate degree, with 90.3% or 84 individuals in the labor force. Within the labor force, individuals with college / associate degree education have the highest percentage of unemployment, with 3.6% or 3 of them being unemployed.
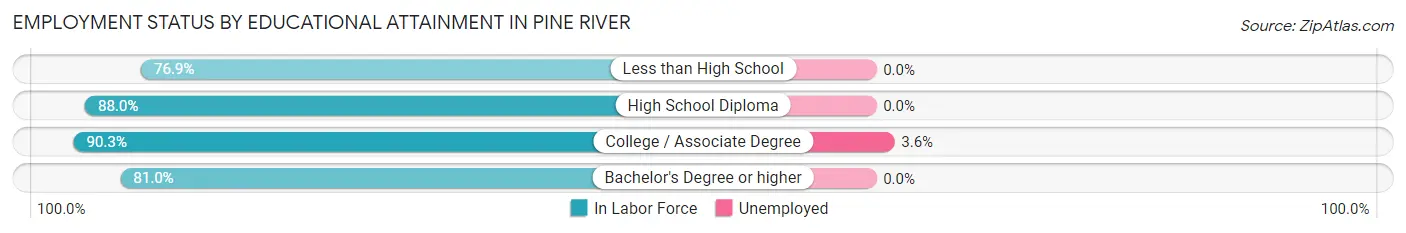
| Educational Attainment | In Labor Force | Unemployed |
| Less than High School | 40 (76.9%) | 0 (0.0%) |
| High School Diploma | 154 (88.0%) | 0 (0.0%) |
| College / Associate Degree | 84 (90.3%) | 3 (3.6%) |
| Bachelor's Degree or higher | 34 (81.0%) | 0 (0.0%) |
| Total | 312 (86.2%) | 4 (1.0%) |
Employment Occupations by Sex in Pine River
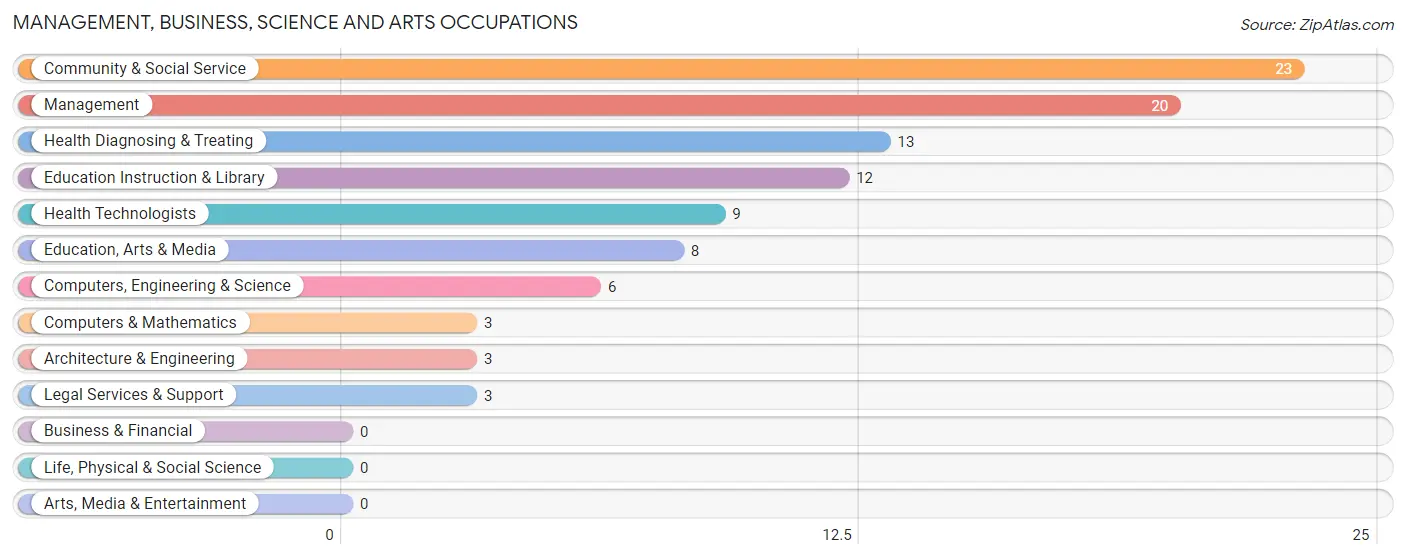
Management, Business, Science and Arts Occupations
The most common Management, Business, Science and Arts occupations in Pine River are Community & Social Service (23 | 5.8%), Management (20 | 5.0%), Health Diagnosing & Treating (13 | 3.3%), Education Instruction & Library (12 | 3.0%), and Health Technologists (9 | 2.3%).
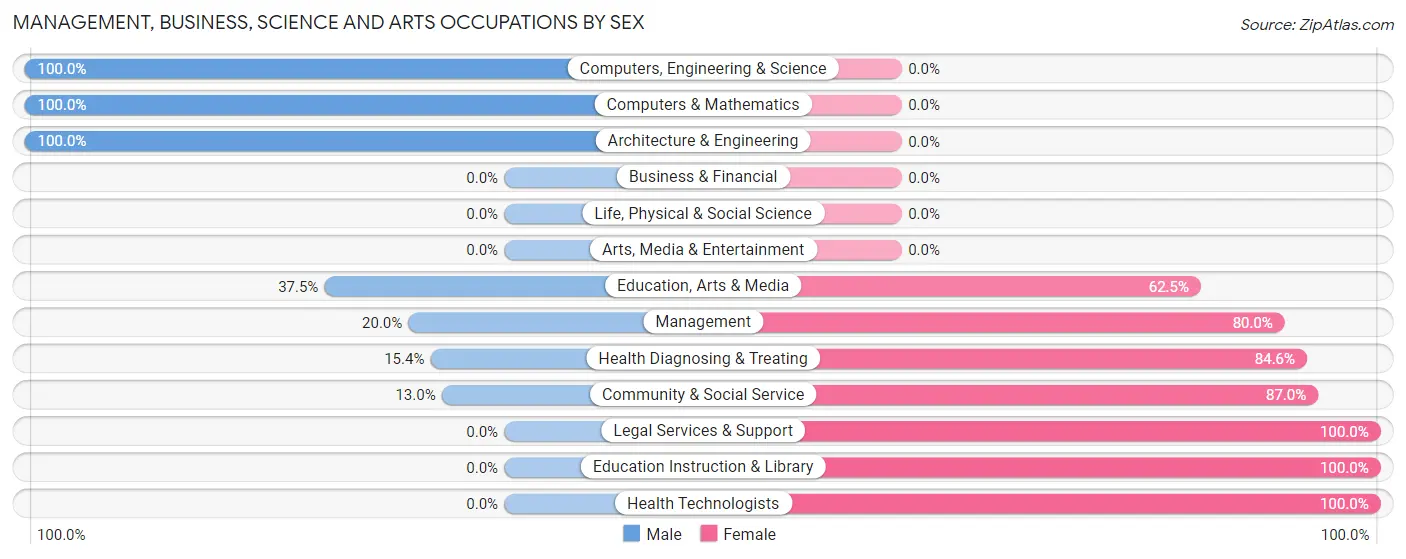
Management, Business, Science and Arts Occupations by Sex
Within the Management, Business, Science and Arts occupations in Pine River, the most male-oriented occupations are Computers, Engineering & Science (100.0%), Computers & Mathematics (100.0%), and Architecture & Engineering (100.0%), while the most female-oriented occupations are Legal Services & Support (100.0%), Education Instruction & Library (100.0%), and Health Technologists (100.0%).
| Occupation | Male | Female |
| Management | 4 (20.0%) | 16 (80.0%) |
| Business & Financial | 0 (0.0%) | 0 (0.0%) |
| Computers, Engineering & Science | 6 (100.0%) | 0 (0.0%) |
| Computers & Mathematics | 3 (100.0%) | 0 (0.0%) |
| Architecture & Engineering | 3 (100.0%) | 0 (0.0%) |
| Life, Physical & Social Science | 0 (0.0%) | 0 (0.0%) |
| Community & Social Service | 3 (13.0%) | 20 (87.0%) |
| Education, Arts & Media | 3 (37.5%) | 5 (62.5%) |
| Legal Services & Support | 0 (0.0%) | 3 (100.0%) |
| Education Instruction & Library | 0 (0.0%) | 12 (100.0%) |
| Arts, Media & Entertainment | 0 (0.0%) | 0 (0.0%) |
| Health Diagnosing & Treating | 2 (15.4%) | 11 (84.6%) |
| Health Technologists | 0 (0.0%) | 9 (100.0%) |
| Total (Category) | 15 (24.2%) | 47 (75.8%) |
| Total (Overall) | 216 (54.4%) | 181 (45.6%) |
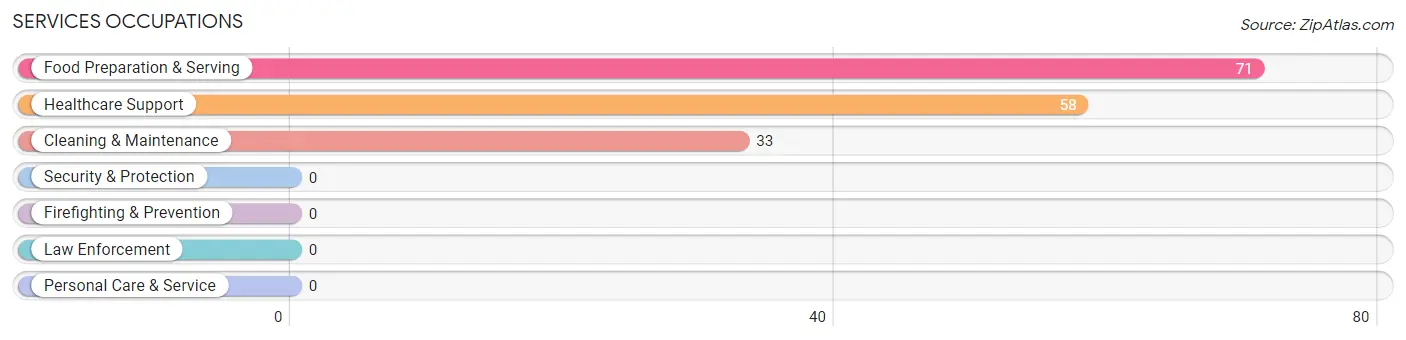
Services Occupations
The most common Services occupations in Pine River are Food Preparation & Serving (71 | 17.9%), Healthcare Support (58 | 14.6%), and Cleaning & Maintenance (33 | 8.3%).
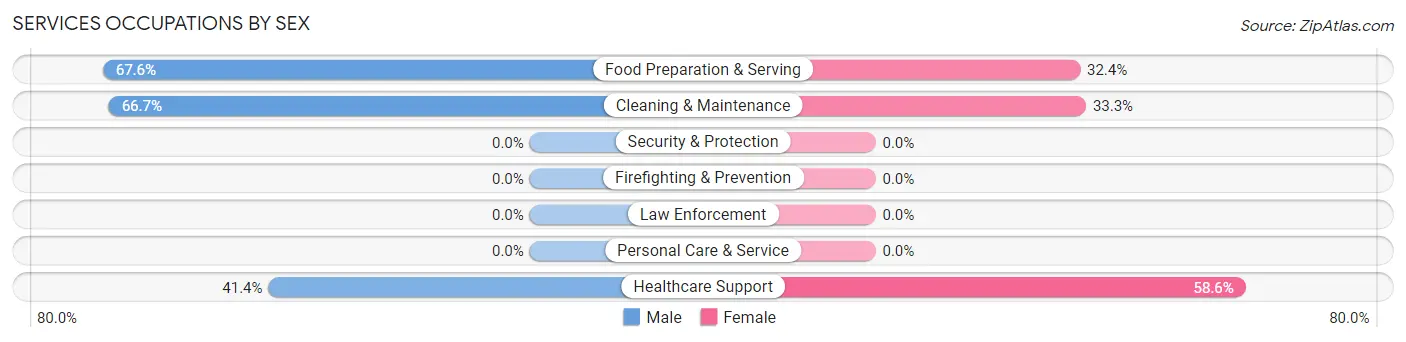
Services Occupations by Sex
Within the Services occupations in Pine River, the most male-oriented occupations are Food Preparation & Serving (67.6%), Cleaning & Maintenance (66.7%), and Healthcare Support (41.4%), while the most female-oriented occupations are Healthcare Support (58.6%), Cleaning & Maintenance (33.3%), and Food Preparation & Serving (32.4%).
| Occupation | Male | Female |
| Healthcare Support | 24 (41.4%) | 34 (58.6%) |
| Security & Protection | 0 (0.0%) | 0 (0.0%) |
| Firefighting & Prevention | 0 (0.0%) | 0 (0.0%) |
| Law Enforcement | 0 (0.0%) | 0 (0.0%) |
| Food Preparation & Serving | 48 (67.6%) | 23 (32.4%) |
| Cleaning & Maintenance | 22 (66.7%) | 11 (33.3%) |
| Personal Care & Service | 0 (0.0%) | 0 (0.0%) |
| Total (Category) | 94 (58.0%) | 68 (42.0%) |
| Total (Overall) | 216 (54.4%) | 181 (45.6%) |
Sales and Office Occupations
The most common Sales and Office occupations in Pine River are Sales & Related (67 | 16.9%), and Office & Administration (28 | 7.0%).

Sales and Office Occupations by Sex

| Occupation | Male | Female |
| Sales & Related | 42 (62.7%) | 25 (37.3%) |
| Office & Administration | 8 (28.6%) | 20 (71.4%) |
| Total (Category) | 50 (52.6%) | 45 (47.4%) |
| Total (Overall) | 216 (54.4%) | 181 (45.6%) |
Natural Resources, Construction and Maintenance Occupations
The most common Natural Resources, Construction and Maintenance occupations in Pine River are Construction & Extraction (9 | 2.3%), Farming, Fishing & Forestry (5 | 1.3%), and Installation, Maintenance & Repair (2 | 0.5%).
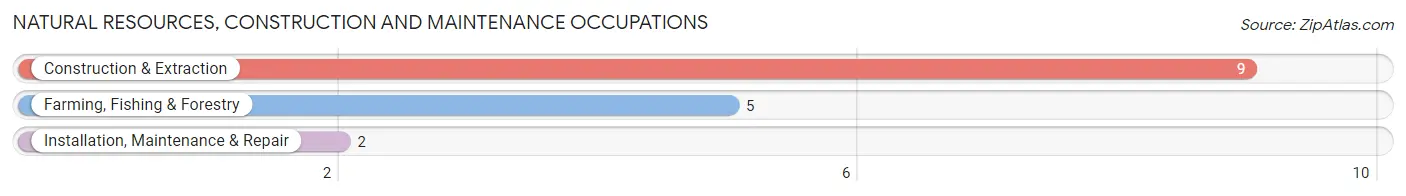
Natural Resources, Construction and Maintenance Occupations by Sex

| Occupation | Male | Female |
| Farming, Fishing & Forestry | 0 (0.0%) | 5 (100.0%) |
| Construction & Extraction | 9 (100.0%) | 0 (0.0%) |
| Installation, Maintenance & Repair | 2 (100.0%) | 0 (0.0%) |
| Total (Category) | 11 (68.8%) | 5 (31.2%) |
| Total (Overall) | 216 (54.4%) | 181 (45.6%) |
Production, Transportation and Moving Occupations
The most common Production, Transportation and Moving occupations in Pine River are Production (29 | 7.3%), Transportation (24 | 6.0%), and Material Moving (9 | 2.3%).
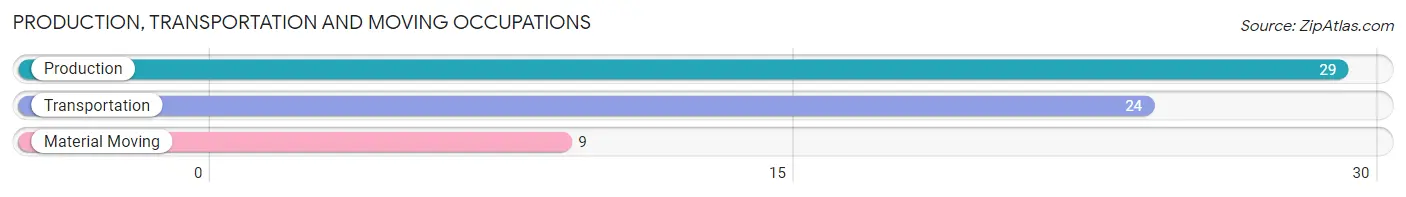
Production, Transportation and Moving Occupations by Sex
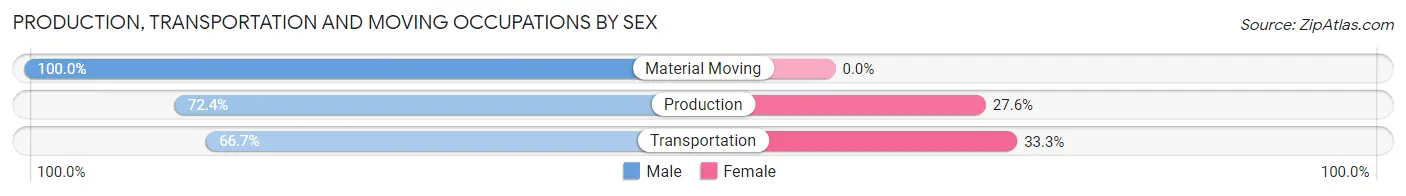
| Occupation | Male | Female |
| Production | 21 (72.4%) | 8 (27.6%) |
| Transportation | 16 (66.7%) | 8 (33.3%) |
| Material Moving | 9 (100.0%) | 0 (0.0%) |
| Total (Category) | 46 (74.2%) | 16 (25.8%) |
| Total (Overall) | 216 (54.4%) | 181 (45.6%) |
Employment Industries by Sex in Pine River
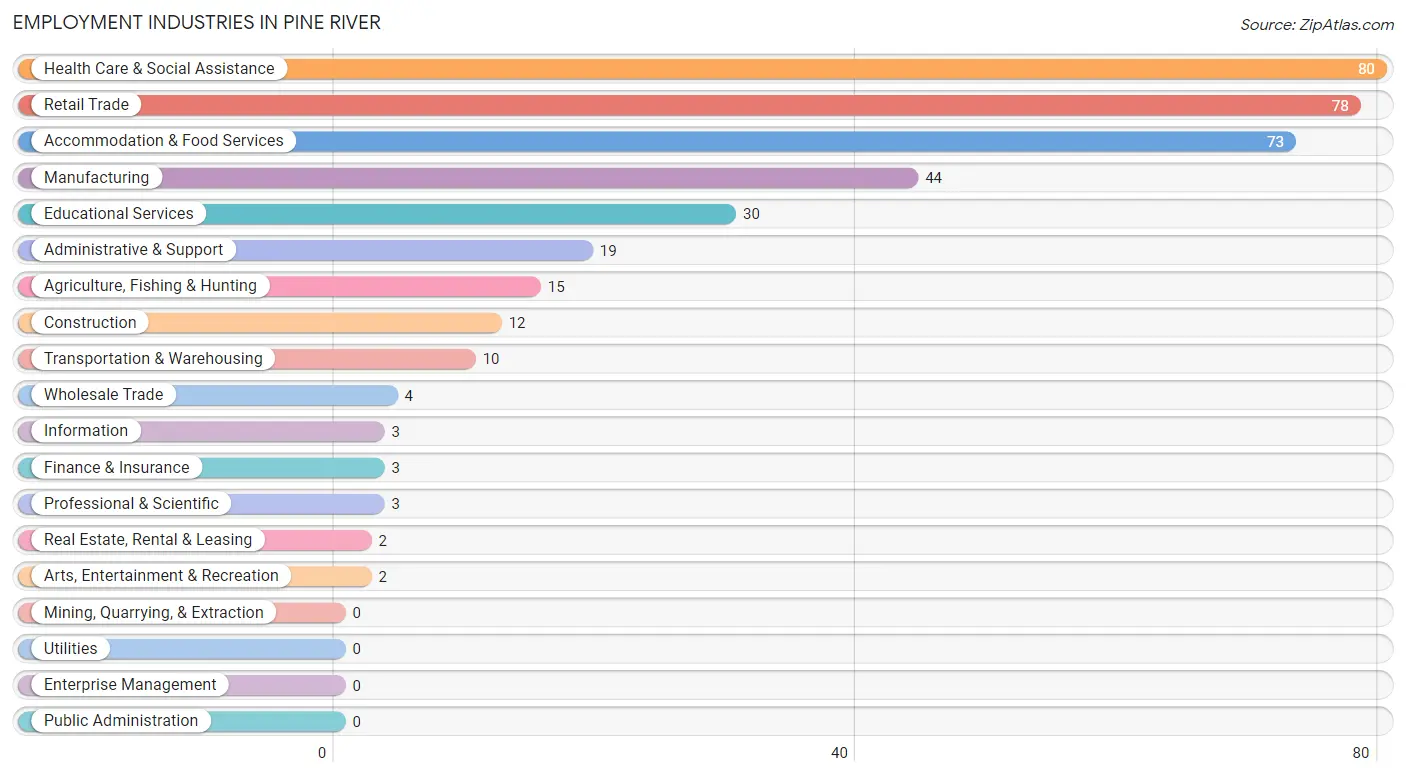
Employment Industries in Pine River
The major employment industries in Pine River include Health Care & Social Assistance (80 | 20.2%), Retail Trade (78 | 19.7%), Accommodation & Food Services (73 | 18.4%), Manufacturing (44 | 11.1%), and Educational Services (30 | 7.6%).
Employment Industries by Sex in Pine River
The Pine River industries that see more men than women are Information (100.0%), Finance & Insurance (100.0%), and Real Estate, Rental & Leasing (100.0%), whereas the industries that tend to have a higher number of women are Wholesale Trade (100.0%), Professional & Scientific (100.0%), and Educational Services (100.0%).
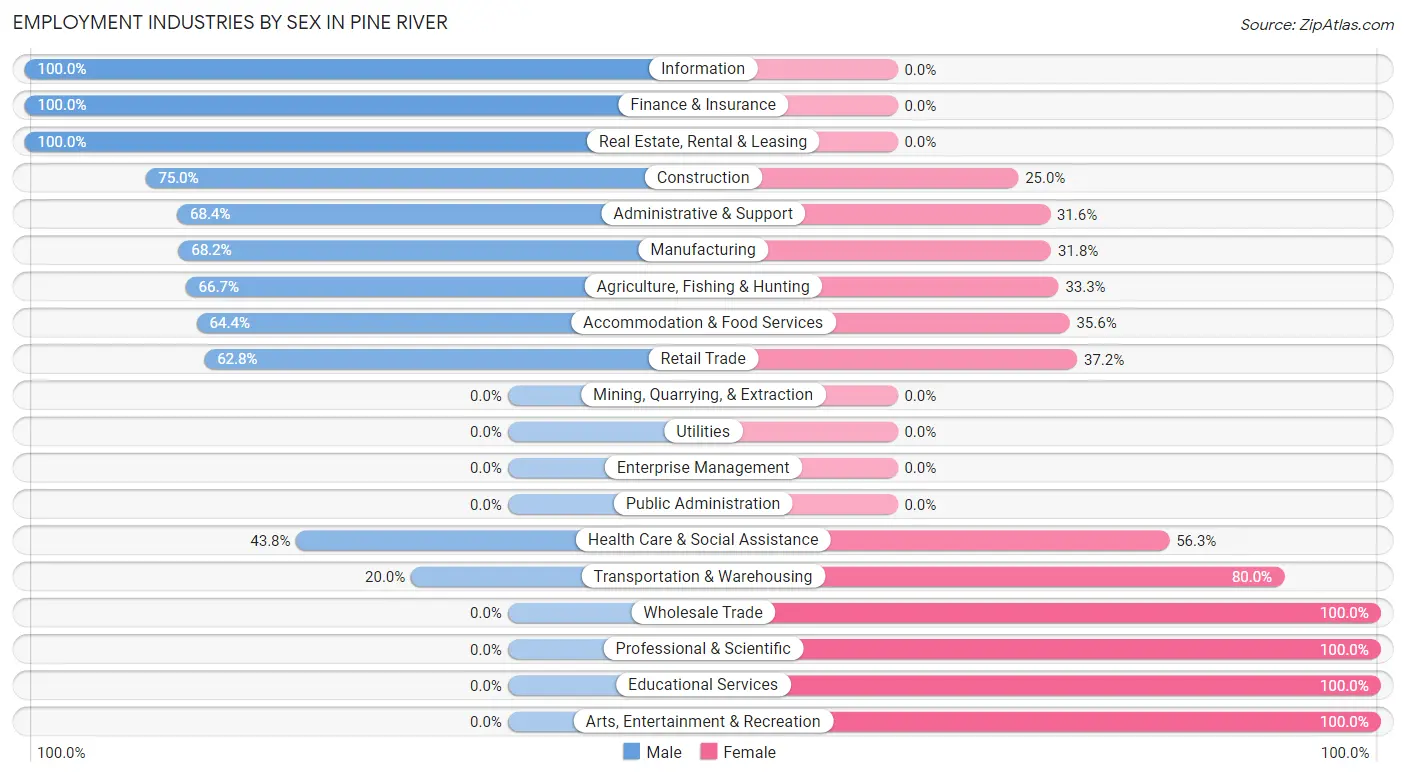
| Industry | Male | Female |
| Agriculture, Fishing & Hunting | 10 (66.7%) | 5 (33.3%) |
| Mining, Quarrying, & Extraction | 0 (0.0%) | 0 (0.0%) |
| Construction | 9 (75.0%) | 3 (25.0%) |
| Manufacturing | 30 (68.2%) | 14 (31.8%) |
| Wholesale Trade | 0 (0.0%) | 4 (100.0%) |
| Retail Trade | 49 (62.8%) | 29 (37.2%) |
| Transportation & Warehousing | 2 (20.0%) | 8 (80.0%) |
| Utilities | 0 (0.0%) | 0 (0.0%) |
| Information | 3 (100.0%) | 0 (0.0%) |
| Finance & Insurance | 3 (100.0%) | 0 (0.0%) |
| Real Estate, Rental & Leasing | 2 (100.0%) | 0 (0.0%) |
| Professional & Scientific | 0 (0.0%) | 3 (100.0%) |
| Enterprise Management | 0 (0.0%) | 0 (0.0%) |
| Administrative & Support | 13 (68.4%) | 6 (31.6%) |
| Educational Services | 0 (0.0%) | 30 (100.0%) |
| Health Care & Social Assistance | 35 (43.8%) | 45 (56.2%) |
| Arts, Entertainment & Recreation | 0 (0.0%) | 2 (100.0%) |
| Accommodation & Food Services | 47 (64.4%) | 26 (35.6%) |
| Public Administration | 0 (0.0%) | 0 (0.0%) |
| Total | 216 (54.4%) | 181 (45.6%) |
Education in Pine River
School Enrollment in Pine River
The most common levels of schooling among the 156 students in Pine River are middle school (56 | 35.9%), elementary school (31 | 19.9%), and high school (27 | 17.3%).
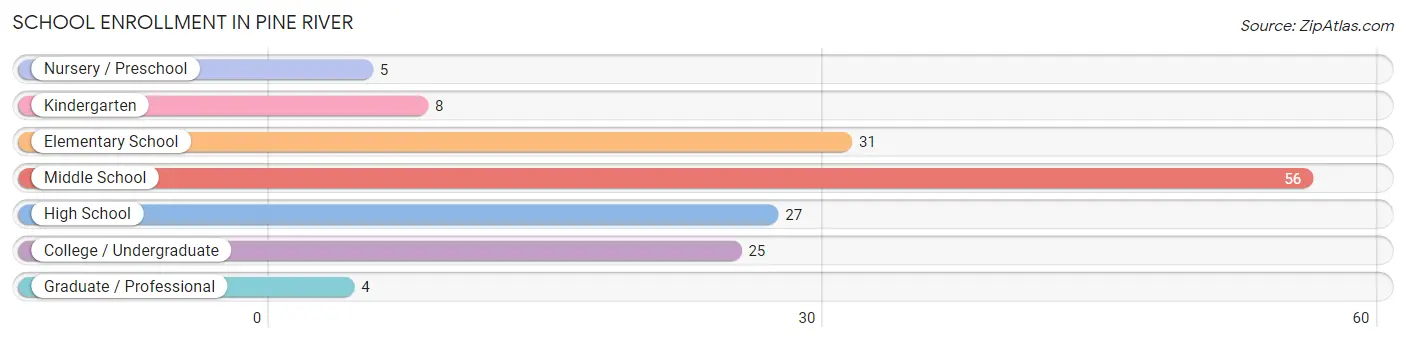
| School Level | # Students | % Students |
| Nursery / Preschool | 5 | 3.2% |
| Kindergarten | 8 | 5.1% |
| Elementary School | 31 | 19.9% |
| Middle School | 56 | 35.9% |
| High School | 27 | 17.3% |
| College / Undergraduate | 25 | 16.0% |
| Graduate / Professional | 4 | 2.6% |
| Total | 156 | 100.0% |
School Enrollment by Age by Funding Source in Pine River
Out of a total of 156 students who are enrolled in schools in Pine River, 27 (17.3%) attend a private institution, while the remaining 129 (82.7%) are enrolled in public schools. The age group of 5 to 9 year old has the highest likelihood of being enrolled in private schools, with 9 (25.0% in the age bracket) enrolled. Conversely, the age group of 3 to 4 year olds has the lowest likelihood of being enrolled in a private school, with 5 (100.0% in the age bracket) attending a public institution.
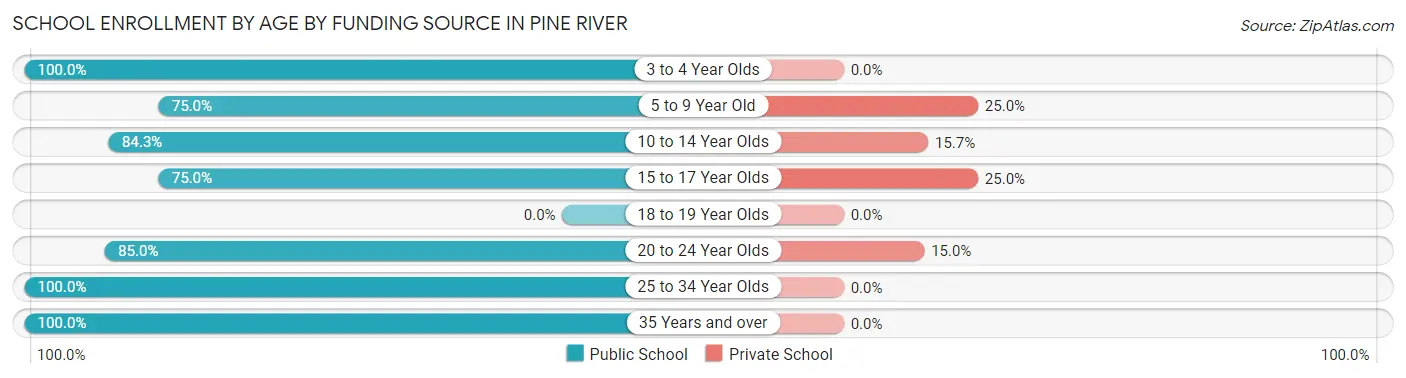
| Age Bracket | Public School | Private School |
| 3 to 4 Year Olds | 5 (100.0%) | 0 (0.0%) |
| 5 to 9 Year Old | 27 (75.0%) | 9 (25.0%) |
| 10 to 14 Year Olds | 59 (84.3%) | 11 (15.7%) |
| 15 to 17 Year Olds | 12 (75.0%) | 4 (25.0%) |
| 18 to 19 Year Olds | 0 (0.0%) | 0 (0.0%) |
| 20 to 24 Year Olds | 17 (85.0%) | 3 (15.0%) |
| 25 to 34 Year Olds | 4 (100.0%) | 0 (0.0%) |
| 35 Years and over | 5 (100.0%) | 0 (0.0%) |
| Total | 129 (82.7%) | 27 (17.3%) |
Educational Attainment by Field of Study in Pine River
Social sciences (16 | 17.4%), business (16 | 17.4%), education (16 | 17.4%), visual & performing arts (7 | 7.6%), and computers & mathematics (6 | 6.5%) are the most common fields of study among 92 individuals in Pine River who have obtained a bachelor's degree or higher.
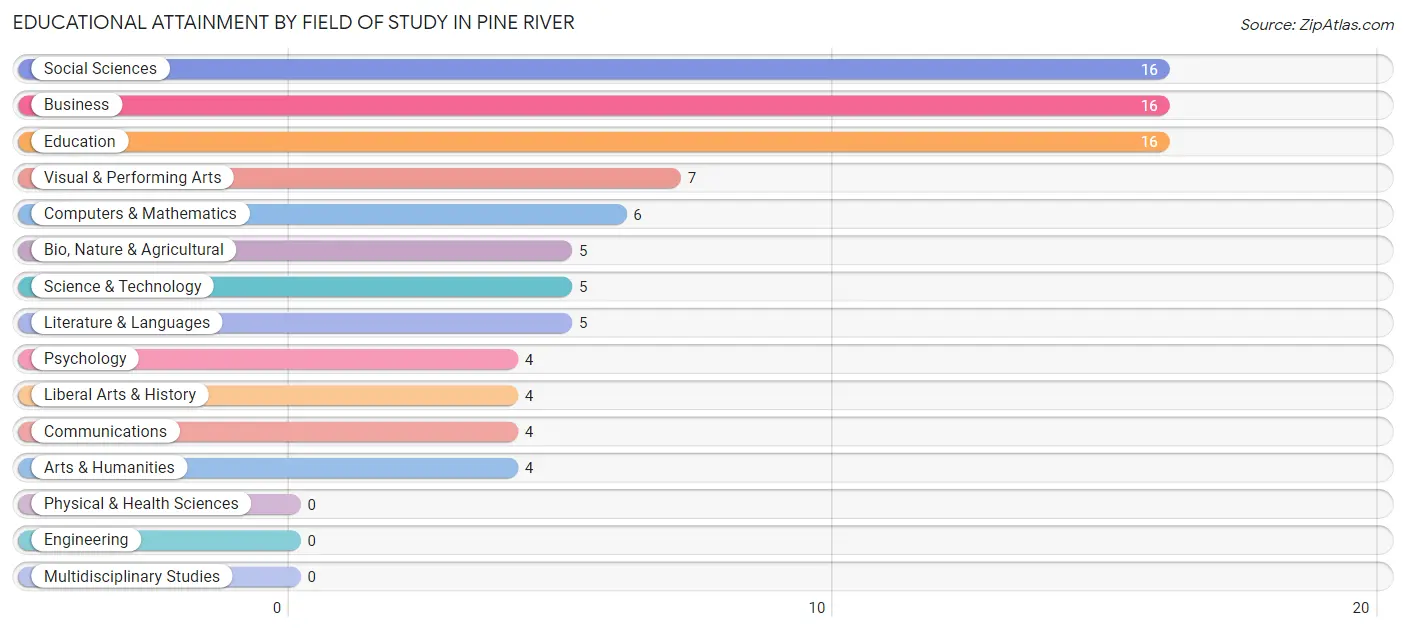
| Field of Study | # Graduates | % Graduates |
| Computers & Mathematics | 6 | 6.5% |
| Bio, Nature & Agricultural | 5 | 5.4% |
| Physical & Health Sciences | 0 | 0.0% |
| Psychology | 4 | 4.3% |
| Social Sciences | 16 | 17.4% |
| Engineering | 0 | 0.0% |
| Multidisciplinary Studies | 0 | 0.0% |
| Science & Technology | 5 | 5.4% |
| Business | 16 | 17.4% |
| Education | 16 | 17.4% |
| Literature & Languages | 5 | 5.4% |
| Liberal Arts & History | 4 | 4.3% |
| Visual & Performing Arts | 7 | 7.6% |
| Communications | 4 | 4.3% |
| Arts & Humanities | 4 | 4.3% |
| Total | 92 | 100.0% |
Transportation & Commute in Pine River
Vehicle Availability by Sex in Pine River
The most prevalent vehicle ownership categories in Pine River are males with 1 vehicle (104, accounting for 49.5%) and females with 1 vehicle (54, making up 63.0%).
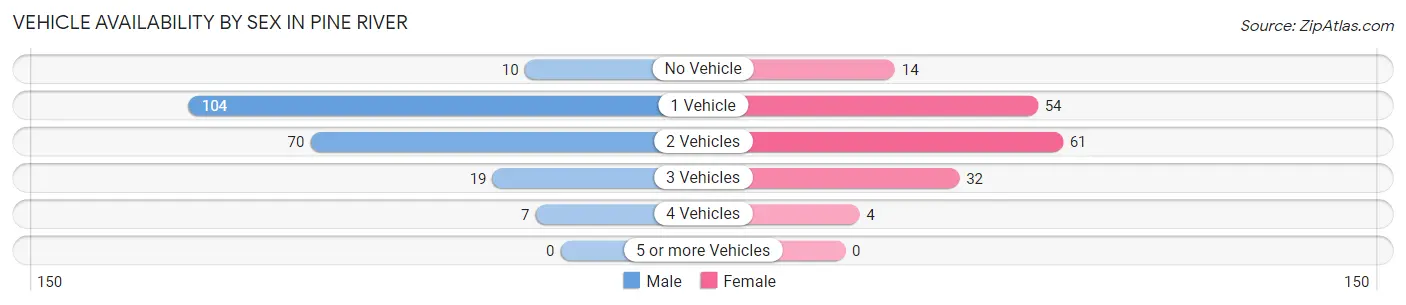
| Vehicles Available | Male | Female |
| No Vehicle | 10 (4.8%) | 14 (8.5%) |
| 1 Vehicle | 104 (49.5%) | 54 (32.7%) |
| 2 Vehicles | 70 (33.3%) | 61 (37.0%) |
| 3 Vehicles | 19 (9.0%) | 32 (19.4%) |
| 4 Vehicles | 7 (3.3%) | 4 (2.4%) |
| 5 or more Vehicles | 0 (0.0%) | 0 (0.0%) |
| Total | 210 (100.0%) | 165 (100.0%) |
Commute Time in Pine River
The most frequently occuring commute durations in Pine River are 5 to 9 minutes (103 commuters, 28.7%), 10 to 14 minutes (51 commuters, 14.2%), and 15 to 19 minutes (41 commuters, 11.4%).
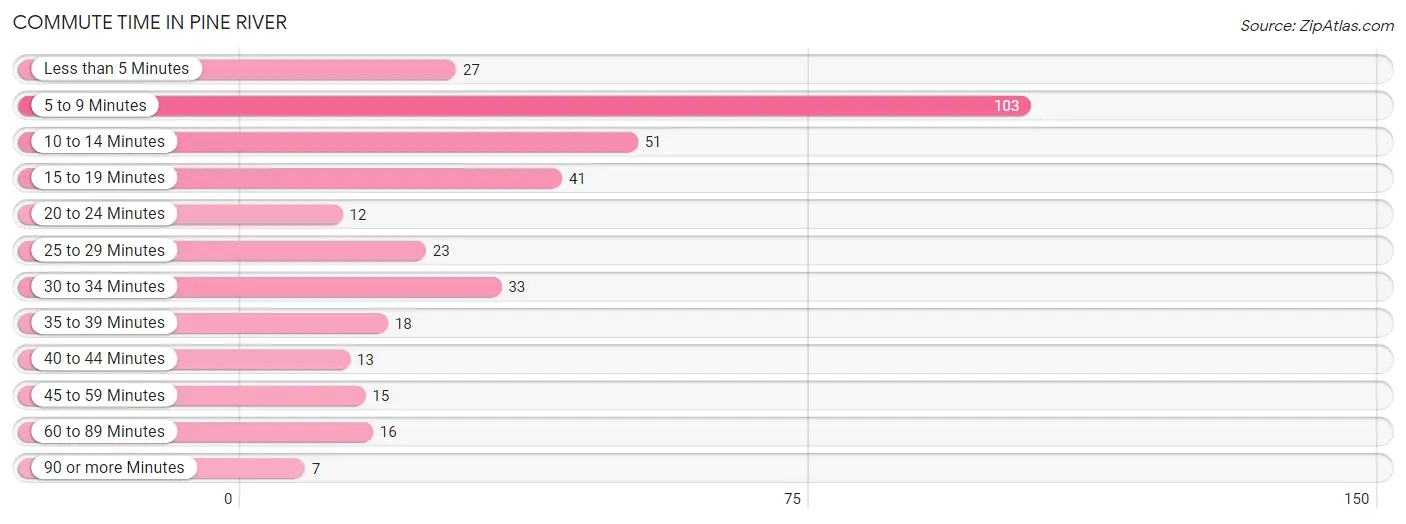
| Commute Time | # Commuters | % Commuters |
| Less than 5 Minutes | 27 | 7.5% |
| 5 to 9 Minutes | 103 | 28.7% |
| 10 to 14 Minutes | 51 | 14.2% |
| 15 to 19 Minutes | 41 | 11.4% |
| 20 to 24 Minutes | 12 | 3.3% |
| 25 to 29 Minutes | 23 | 6.4% |
| 30 to 34 Minutes | 33 | 9.2% |
| 35 to 39 Minutes | 18 | 5.0% |
| 40 to 44 Minutes | 13 | 3.6% |
| 45 to 59 Minutes | 15 | 4.2% |
| 60 to 89 Minutes | 16 | 4.5% |
| 90 or more Minutes | 7 | 1.9% |
Commute Time by Sex in Pine River
The most common commute times in Pine River are 5 to 9 minutes (68 commuters, 34.0%) for males and 5 to 9 minutes (35 commuters, 22.0%) for females.
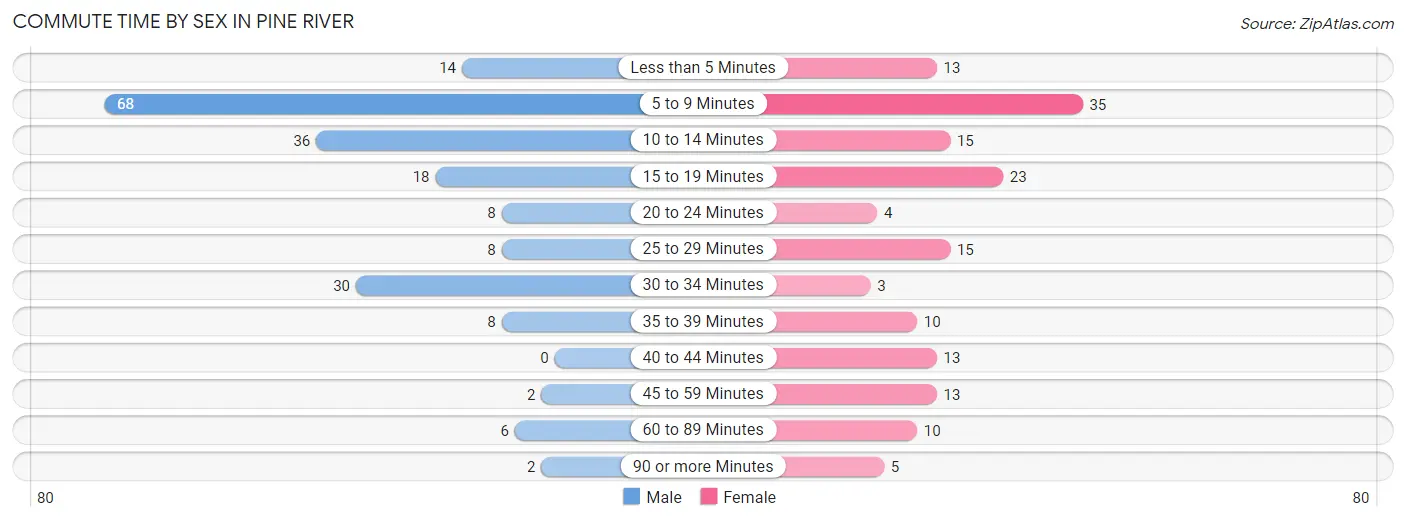
| Commute Time | Male | Female |
| Less than 5 Minutes | 14 (7.0%) | 13 (8.2%) |
| 5 to 9 Minutes | 68 (34.0%) | 35 (22.0%) |
| 10 to 14 Minutes | 36 (18.0%) | 15 (9.4%) |
| 15 to 19 Minutes | 18 (9.0%) | 23 (14.5%) |
| 20 to 24 Minutes | 8 (4.0%) | 4 (2.5%) |
| 25 to 29 Minutes | 8 (4.0%) | 15 (9.4%) |
| 30 to 34 Minutes | 30 (15.0%) | 3 (1.9%) |
| 35 to 39 Minutes | 8 (4.0%) | 10 (6.3%) |
| 40 to 44 Minutes | 0 (0.0%) | 13 (8.2%) |
| 45 to 59 Minutes | 2 (1.0%) | 13 (8.2%) |
| 60 to 89 Minutes | 6 (3.0%) | 10 (6.3%) |
| 90 or more Minutes | 2 (1.0%) | 5 (3.1%) |
Time of Departure to Work by Sex in Pine River
The most frequent times of departure to work in Pine River are 12:00 PM to 3:59 PM (58, 29.0%) for males and 12:00 PM to 3:59 PM (34, 21.4%) for females.
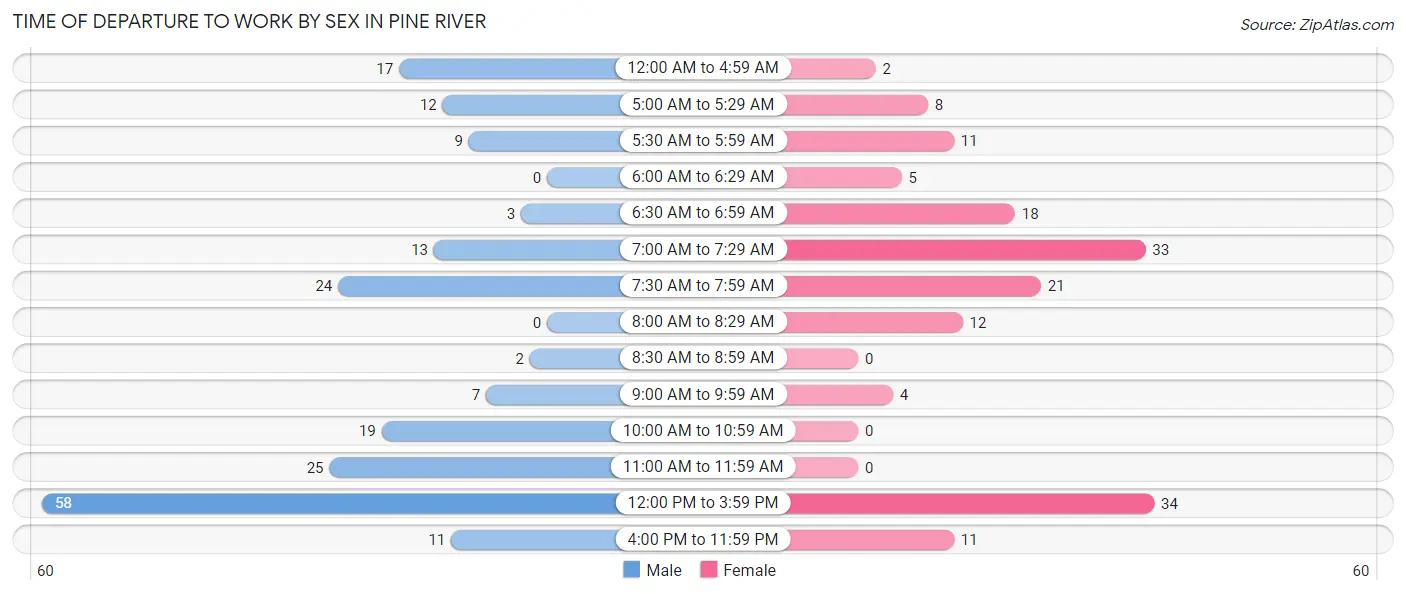
| Time of Departure | Male | Female |
| 12:00 AM to 4:59 AM | 17 (8.5%) | 2 (1.3%) |
| 5:00 AM to 5:29 AM | 12 (6.0%) | 8 (5.0%) |
| 5:30 AM to 5:59 AM | 9 (4.5%) | 11 (6.9%) |
| 6:00 AM to 6:29 AM | 0 (0.0%) | 5 (3.1%) |
| 6:30 AM to 6:59 AM | 3 (1.5%) | 18 (11.3%) |
| 7:00 AM to 7:29 AM | 13 (6.5%) | 33 (20.7%) |
| 7:30 AM to 7:59 AM | 24 (12.0%) | 21 (13.2%) |
| 8:00 AM to 8:29 AM | 0 (0.0%) | 12 (7.5%) |
| 8:30 AM to 8:59 AM | 2 (1.0%) | 0 (0.0%) |
| 9:00 AM to 9:59 AM | 7 (3.5%) | 4 (2.5%) |
| 10:00 AM to 10:59 AM | 19 (9.5%) | 0 (0.0%) |
| 11:00 AM to 11:59 AM | 25 (12.5%) | 0 (0.0%) |
| 12:00 PM to 3:59 PM | 58 (29.0%) | 34 (21.4%) |
| 4:00 PM to 11:59 PM | 11 (5.5%) | 11 (6.9%) |
| Total | 200 (100.0%) | 159 (100.0%) |
Housing Occupancy in Pine River
Occupancy by Ownership in Pine River
Of the total 389 dwellings in Pine River, owner-occupied units account for 168 (43.2%), while renter-occupied units make up 221 (56.8%).
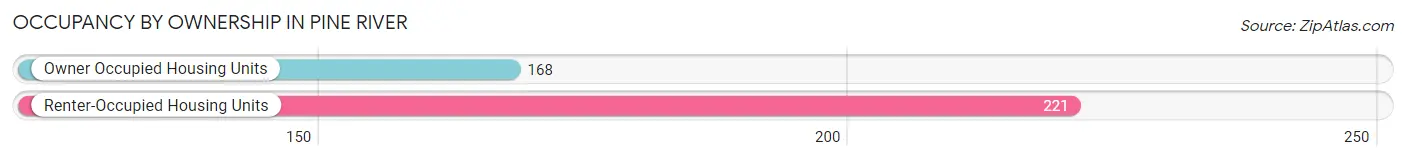
| Occupancy | # Housing Units | % Housing Units |
| Owner Occupied Housing Units | 168 | 43.2% |
| Renter-Occupied Housing Units | 221 | 56.8% |
| Total Occupied Housing Units | 389 | 100.0% |
Occupancy by Household Size in Pine River
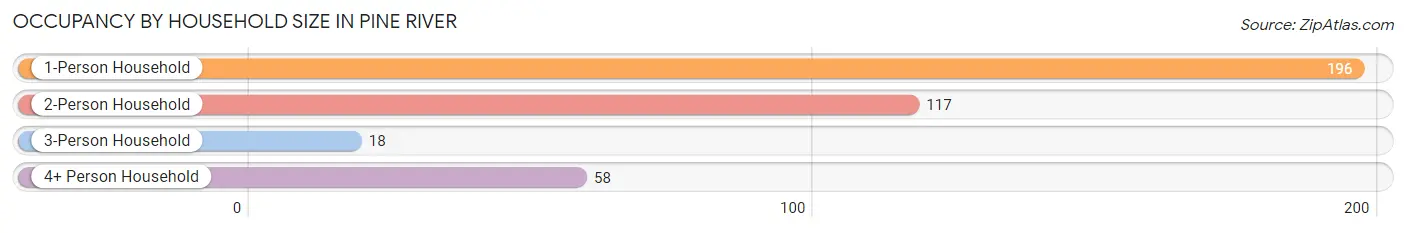
| Household Size | # Housing Units | % Housing Units |
| 1-Person Household | 196 | 50.4% |
| 2-Person Household | 117 | 30.1% |
| 3-Person Household | 18 | 4.6% |
| 4+ Person Household | 58 | 14.9% |
| Total Housing Units | 389 | 100.0% |
Occupancy by Ownership by Household Size in Pine River
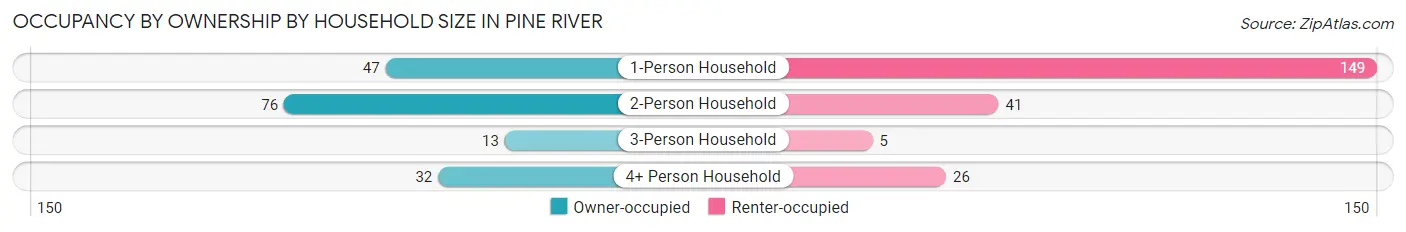
| Household Size | Owner-occupied | Renter-occupied |
| 1-Person Household | 47 (24.0%) | 149 (76.0%) |
| 2-Person Household | 76 (65.0%) | 41 (35.0%) |
| 3-Person Household | 13 (72.2%) | 5 (27.8%) |
| 4+ Person Household | 32 (55.2%) | 26 (44.8%) |
| Total Housing Units | 168 (43.2%) | 221 (56.8%) |
Occupancy by Educational Attainment in Pine River
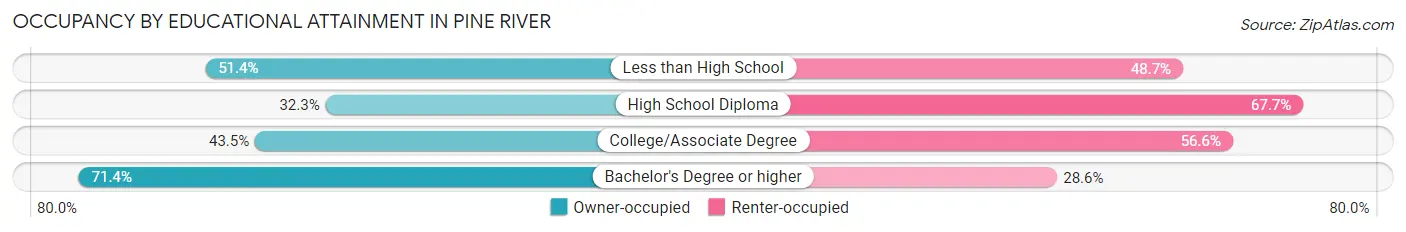
| Household Size | Owner-occupied | Renter-occupied |
| Less than High School | 19 (51.3%) | 18 (48.6%) |
| High School Diploma | 51 (32.3%) | 107 (67.7%) |
| College/Associate Degree | 63 (43.4%) | 82 (56.6%) |
| Bachelor's Degree or higher | 35 (71.4%) | 14 (28.6%) |
Occupancy by Age of Householder in Pine River
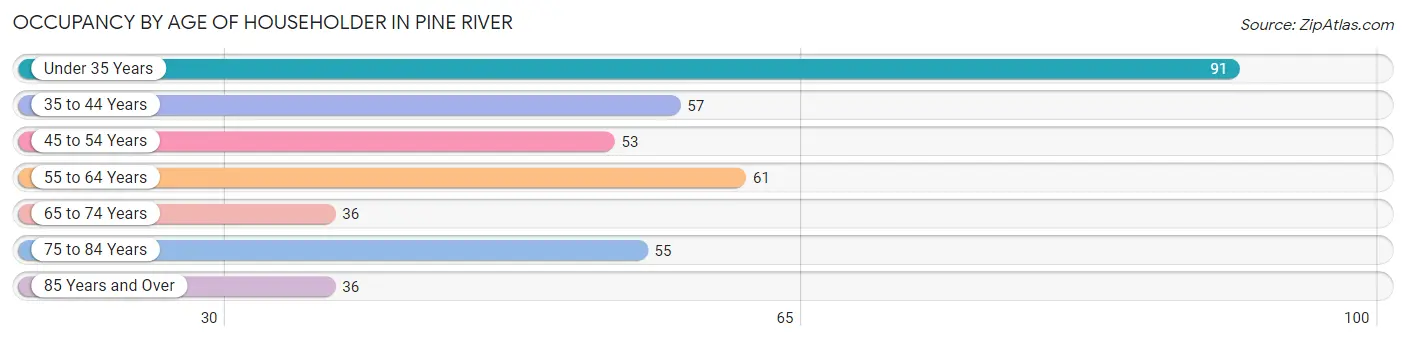
| Age Bracket | # Households | % Households |
| Under 35 Years | 91 | 23.4% |
| 35 to 44 Years | 57 | 14.6% |
| 45 to 54 Years | 53 | 13.6% |
| 55 to 64 Years | 61 | 15.7% |
| 65 to 74 Years | 36 | 9.2% |
| 75 to 84 Years | 55 | 14.1% |
| 85 Years and Over | 36 | 9.2% |
| Total | 389 | 100.0% |
Housing Finances in Pine River
Median Income by Occupancy in Pine River
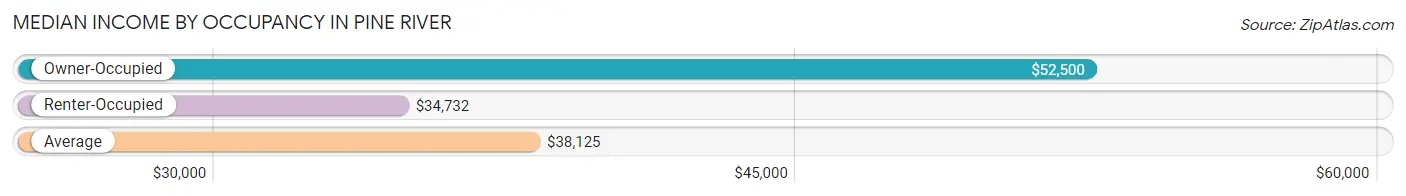
| Occupancy Type | # Households | Median Income |
| Owner-Occupied | 168 (43.2%) | $52,500 |
| Renter-Occupied | 221 (56.8%) | $34,732 |
| Average | 389 (100.0%) | $38,125 |
Occupancy by Householder Income Bracket in Pine River
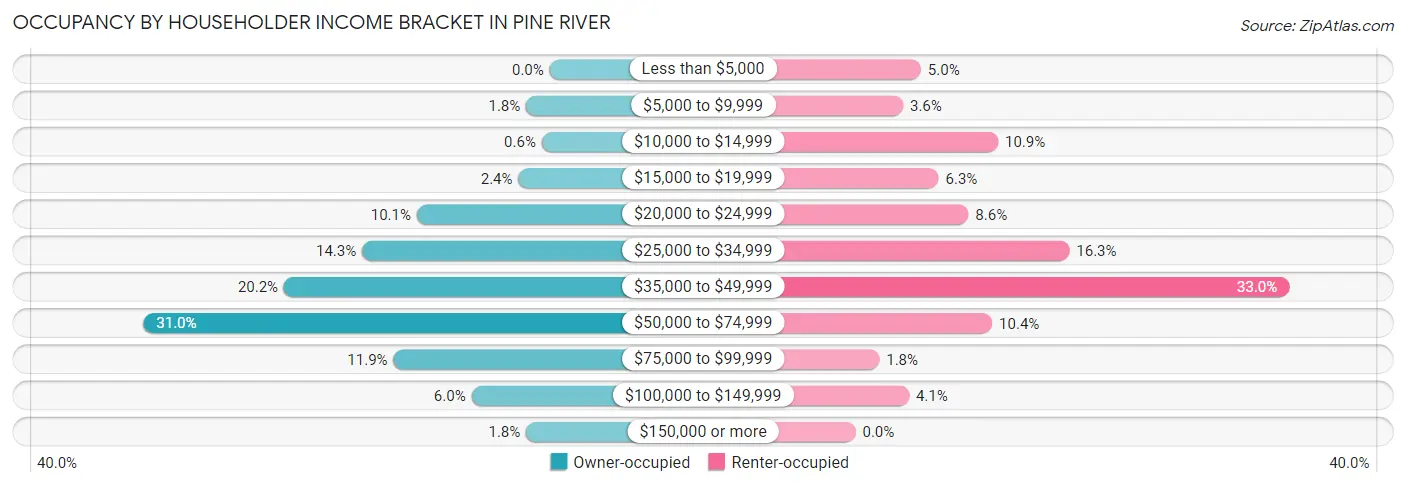
| Income Bracket | Owner-occupied | Renter-occupied |
| Less than $5,000 | 0 (0.0%) | 11 (5.0%) |
| $5,000 to $9,999 | 3 (1.8%) | 8 (3.6%) |
| $10,000 to $14,999 | 1 (0.6%) | 24 (10.9%) |
| $15,000 to $19,999 | 4 (2.4%) | 14 (6.3%) |
| $20,000 to $24,999 | 17 (10.1%) | 19 (8.6%) |
| $25,000 to $34,999 | 24 (14.3%) | 36 (16.3%) |
| $35,000 to $49,999 | 34 (20.2%) | 73 (33.0%) |
| $50,000 to $74,999 | 52 (30.9%) | 23 (10.4%) |
| $75,000 to $99,999 | 20 (11.9%) | 4 (1.8%) |
| $100,000 to $149,999 | 10 (5.9%) | 9 (4.1%) |
| $150,000 or more | 3 (1.8%) | 0 (0.0%) |
| Total | 168 (100.0%) | 221 (100.0%) |
Monthly Housing Cost Tiers in Pine River
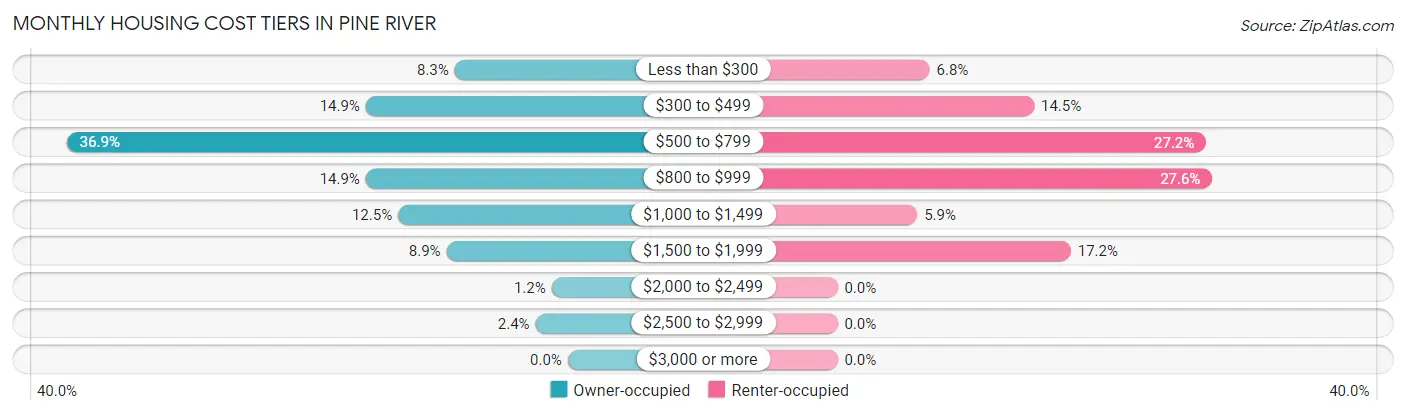
| Monthly Cost | Owner-occupied | Renter-occupied |
| Less than $300 | 14 (8.3%) | 15 (6.8%) |
| $300 to $499 | 25 (14.9%) | 32 (14.5%) |
| $500 to $799 | 62 (36.9%) | 60 (27.2%) |
| $800 to $999 | 25 (14.9%) | 61 (27.6%) |
| $1,000 to $1,499 | 21 (12.5%) | 13 (5.9%) |
| $1,500 to $1,999 | 15 (8.9%) | 38 (17.2%) |
| $2,000 to $2,499 | 2 (1.2%) | 0 (0.0%) |
| $2,500 to $2,999 | 4 (2.4%) | 0 (0.0%) |
| $3,000 or more | 0 (0.0%) | 0 (0.0%) |
| Total | 168 (100.0%) | 221 (100.0%) |
Physical Housing Characteristics in Pine River
Housing Structures in Pine River
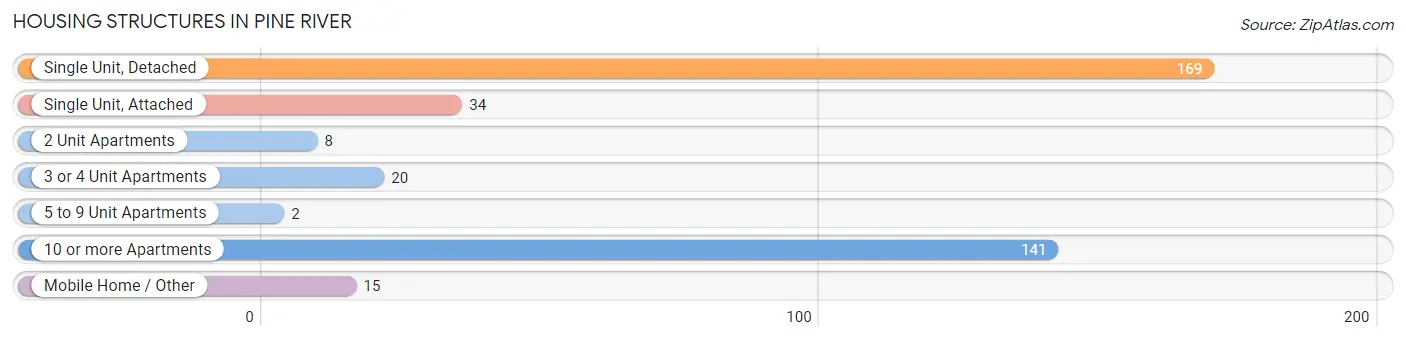
| Structure Type | # Housing Units | % Housing Units |
| Single Unit, Detached | 169 | 43.4% |
| Single Unit, Attached | 34 | 8.7% |
| 2 Unit Apartments | 8 | 2.1% |
| 3 or 4 Unit Apartments | 20 | 5.1% |
| 5 to 9 Unit Apartments | 2 | 0.5% |
| 10 or more Apartments | 141 | 36.2% |
| Mobile Home / Other | 15 | 3.9% |
| Total | 389 | 100.0% |
Housing Structures by Occupancy in Pine River
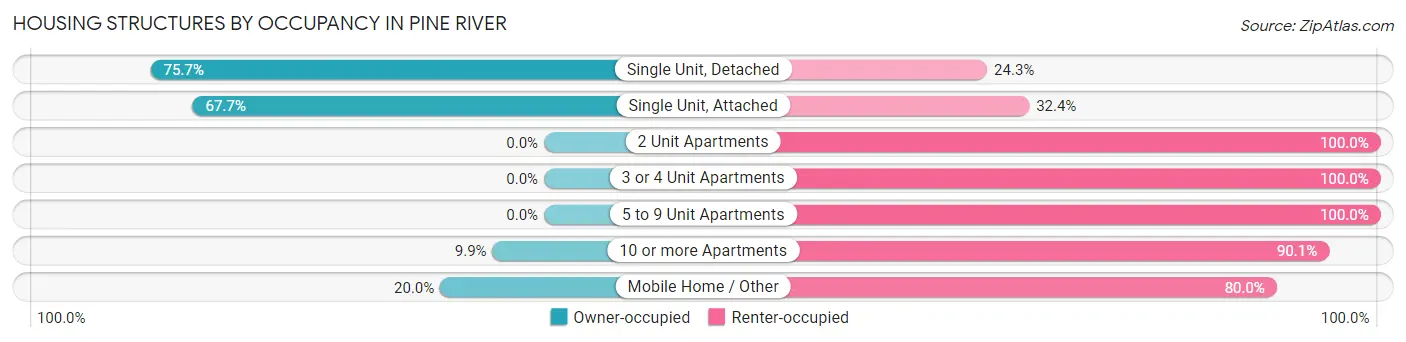
| Structure Type | Owner-occupied | Renter-occupied |
| Single Unit, Detached | 128 (75.7%) | 41 (24.3%) |
| Single Unit, Attached | 23 (67.6%) | 11 (32.4%) |
| 2 Unit Apartments | 0 (0.0%) | 8 (100.0%) |
| 3 or 4 Unit Apartments | 0 (0.0%) | 20 (100.0%) |
| 5 to 9 Unit Apartments | 0 (0.0%) | 2 (100.0%) |
| 10 or more Apartments | 14 (9.9%) | 127 (90.1%) |
| Mobile Home / Other | 3 (20.0%) | 12 (80.0%) |
| Total | 168 (43.2%) | 221 (56.8%) |
Housing Structures by Number of Rooms in Pine River
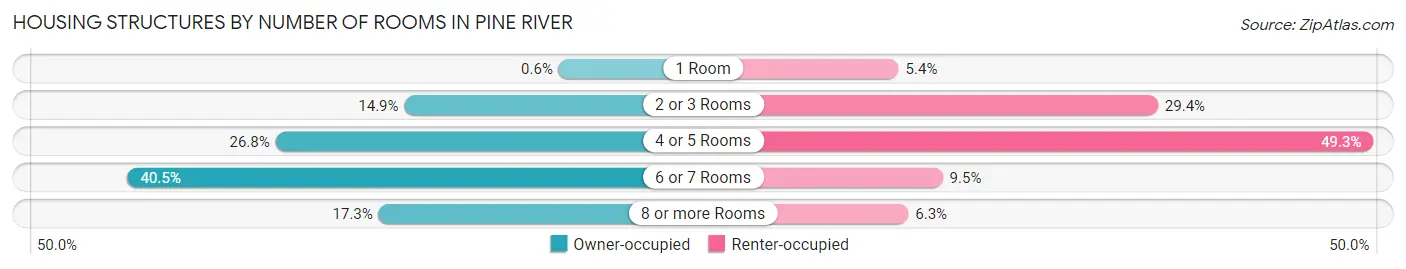
| Number of Rooms | Owner-occupied | Renter-occupied |
| 1 Room | 1 (0.6%) | 12 (5.4%) |
| 2 or 3 Rooms | 25 (14.9%) | 65 (29.4%) |
| 4 or 5 Rooms | 45 (26.8%) | 109 (49.3%) |
| 6 or 7 Rooms | 68 (40.5%) | 21 (9.5%) |
| 8 or more Rooms | 29 (17.3%) | 14 (6.3%) |
| Total | 168 (100.0%) | 221 (100.0%) |
Housing Structure by Heating Type in Pine River
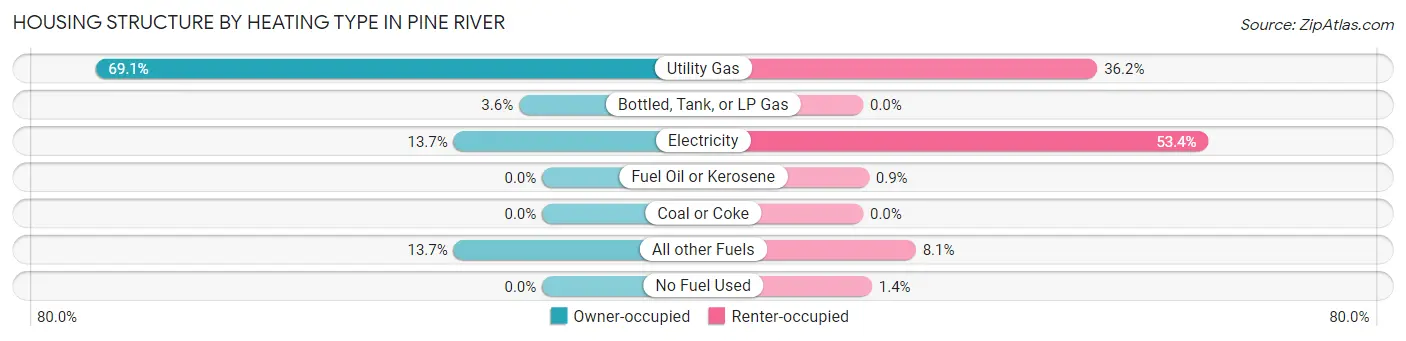
| Heating Type | Owner-occupied | Renter-occupied |
| Utility Gas | 116 (69.1%) | 80 (36.2%) |
| Bottled, Tank, or LP Gas | 6 (3.6%) | 0 (0.0%) |
| Electricity | 23 (13.7%) | 118 (53.4%) |
| Fuel Oil or Kerosene | 0 (0.0%) | 2 (0.9%) |
| Coal or Coke | 0 (0.0%) | 0 (0.0%) |
| All other Fuels | 23 (13.7%) | 18 (8.1%) |
| No Fuel Used | 0 (0.0%) | 3 (1.4%) |
| Total | 168 (100.0%) | 221 (100.0%) |
Household Vehicle Usage in Pine River
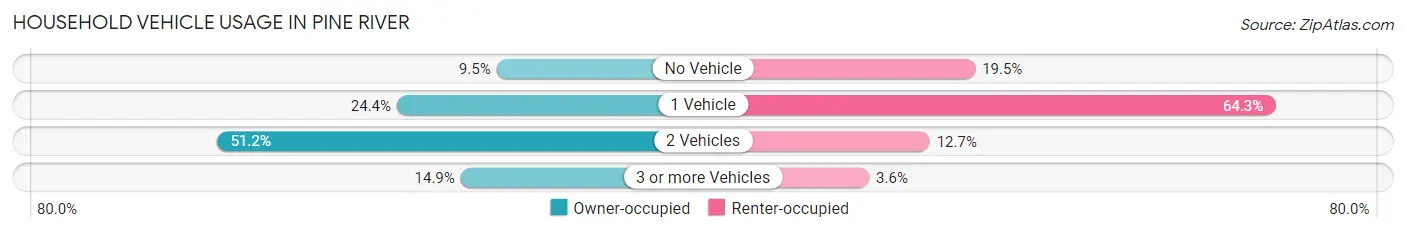
| Vehicles per Household | Owner-occupied | Renter-occupied |
| No Vehicle | 16 (9.5%) | 43 (19.5%) |
| 1 Vehicle | 41 (24.4%) | 142 (64.2%) |
| 2 Vehicles | 86 (51.2%) | 28 (12.7%) |
| 3 or more Vehicles | 25 (14.9%) | 8 (3.6%) |
| Total | 168 (100.0%) | 221 (100.0%) |
Real Estate & Mortgages in Pine River
Real Estate and Mortgage Overview in Pine River
| Characteristic | Without Mortgage | With Mortgage |
| Housing Units | 57 | 111 |
| Median Property Value | $97,400 | $140,700 |
| Median Household Income | $49,464 | $3 |
| Monthly Housing Costs | $434 | $0 |
| Real Estate Taxes | $911 | $4 |
Property Value by Mortgage Status in Pine River
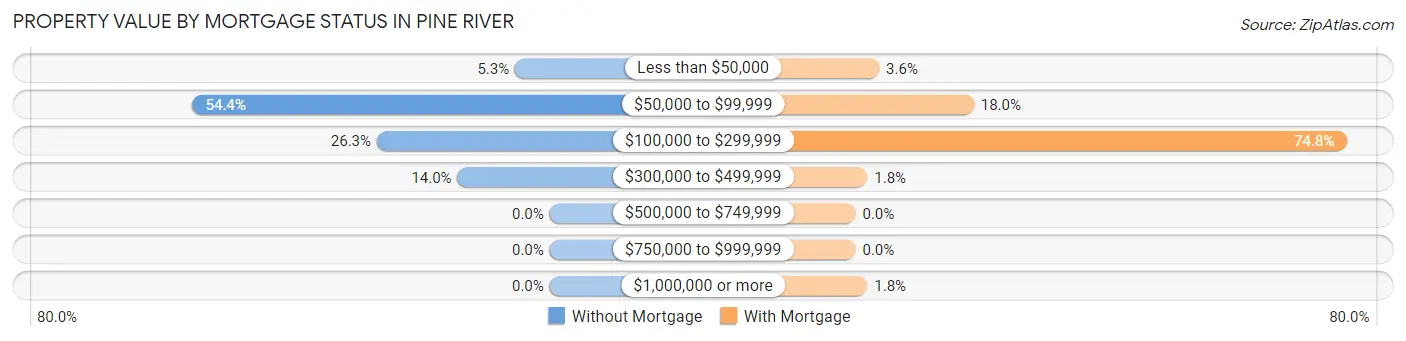
| Property Value | Without Mortgage | With Mortgage |
| Less than $50,000 | 3 (5.3%) | 4 (3.6%) |
| $50,000 to $99,999 | 31 (54.4%) | 20 (18.0%) |
| $100,000 to $299,999 | 15 (26.3%) | 83 (74.8%) |
| $300,000 to $499,999 | 8 (14.0%) | 2 (1.8%) |
| $500,000 to $749,999 | 0 (0.0%) | 0 (0.0%) |
| $750,000 to $999,999 | 0 (0.0%) | 0 (0.0%) |
| $1,000,000 or more | 0 (0.0%) | 2 (1.8%) |
| Total | 57 (100.0%) | 111 (100.0%) |
Household Income by Mortgage Status in Pine River
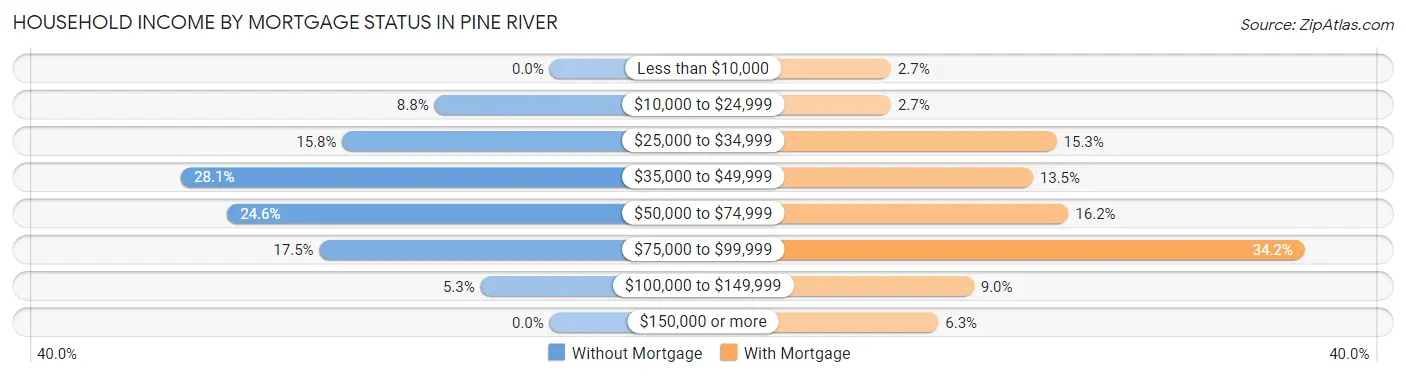
| Household Income | Without Mortgage | With Mortgage |
| Less than $10,000 | 0 (0.0%) | 3 (2.7%) |
| $10,000 to $24,999 | 5 (8.8%) | 3 (2.7%) |
| $25,000 to $34,999 | 9 (15.8%) | 17 (15.3%) |
| $35,000 to $49,999 | 16 (28.1%) | 15 (13.5%) |
| $50,000 to $74,999 | 14 (24.6%) | 18 (16.2%) |
| $75,000 to $99,999 | 10 (17.5%) | 38 (34.2%) |
| $100,000 to $149,999 | 3 (5.3%) | 10 (9.0%) |
| $150,000 or more | 0 (0.0%) | 7 (6.3%) |
| Total | 57 (100.0%) | 111 (100.0%) |
Property Value to Household Income Ratio in Pine River
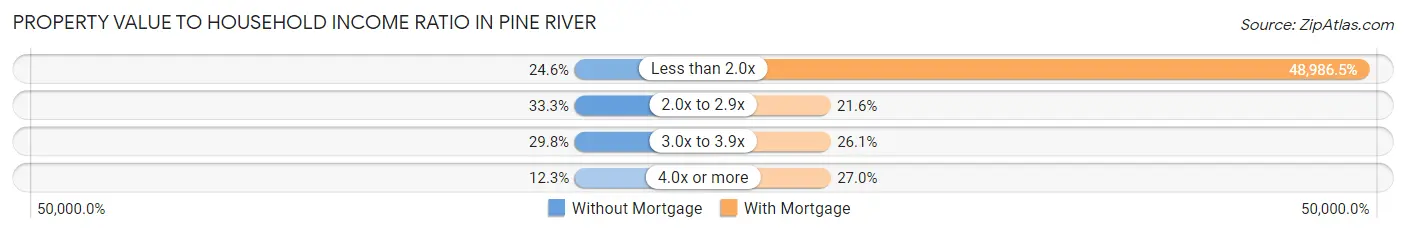
| Value-to-Income Ratio | Without Mortgage | With Mortgage |
| Less than 2.0x | 14 (24.6%) | 54,375 (48,986.5%) |
| 2.0x to 2.9x | 19 (33.3%) | 24 (21.6%) |
| 3.0x to 3.9x | 17 (29.8%) | 29 (26.1%) |
| 4.0x or more | 7 (12.3%) | 30 (27.0%) |
| Total | 57 (100.0%) | 111 (100.0%) |
Real Estate Taxes by Mortgage Status in Pine River

| Property Taxes | Without Mortgage | With Mortgage |
| Less than $800 | 14 (24.6%) | 0 (0.0%) |
| $800 to $1,499 | 24 (42.1%) | 38 (34.2%) |
| $800 to $1,499 | 10 (17.5%) | 41 (36.9%) |
| Total | 57 (100.0%) | 111 (100.0%) |
Health & Disability in Pine River
Health Insurance Coverage by Age in Pine River
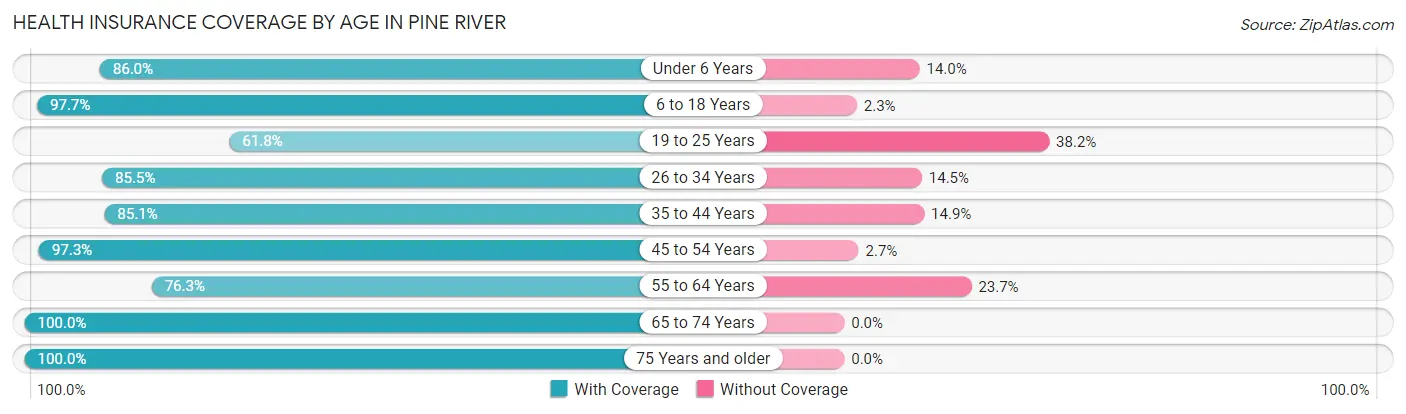
| Age Bracket | With Coverage | Without Coverage |
| Under 6 Years | 49 (86.0%) | 8 (14.0%) |
| 6 to 18 Years | 125 (97.7%) | 3 (2.3%) |
| 19 to 25 Years | 55 (61.8%) | 34 (38.2%) |
| 26 to 34 Years | 71 (85.5%) | 12 (14.5%) |
| 35 to 44 Years | 80 (85.1%) | 14 (14.9%) |
| 45 to 54 Years | 73 (97.3%) | 2 (2.7%) |
| 55 to 64 Years | 74 (76.3%) | 23 (23.7%) |
| 65 to 74 Years | 43 (100.0%) | 0 (0.0%) |
| 75 Years and older | 108 (100.0%) | 0 (0.0%) |
| Total | 678 (87.6%) | 96 (12.4%) |
Health Insurance Coverage by Citizenship Status in Pine River

| Citizenship Status | With Coverage | Without Coverage |
| Native Born | 49 (86.0%) | 8 (14.0%) |
| Foreign Born, Citizen | 125 (97.7%) | 3 (2.3%) |
| Foreign Born, not a Citizen | 55 (61.8%) | 34 (38.2%) |
Health Insurance Coverage by Household Income in Pine River
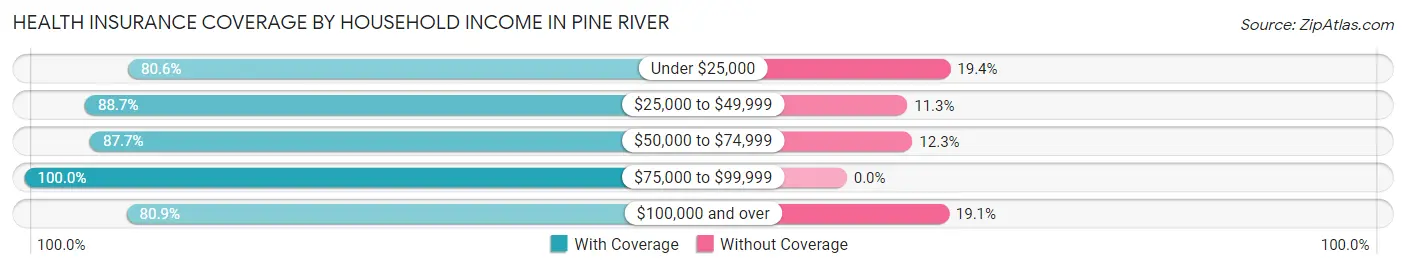
| Household Income | With Coverage | Without Coverage |
| Under $25,000 | 108 (80.6%) | 26 (19.4%) |
| $25,000 to $49,999 | 274 (88.7%) | 35 (11.3%) |
| $50,000 to $74,999 | 157 (87.7%) | 22 (12.3%) |
| $75,000 to $99,999 | 73 (100.0%) | 0 (0.0%) |
| $100,000 and over | 55 (80.9%) | 13 (19.1%) |
Public vs Private Health Insurance Coverage by Age in Pine River
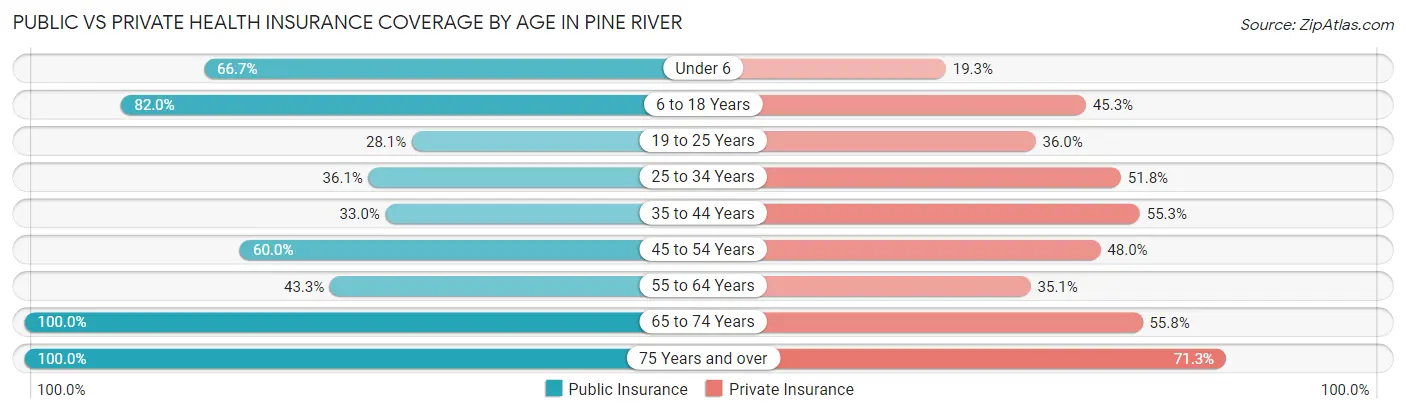
| Age Bracket | Public Insurance | Private Insurance |
| Under 6 | 38 (66.7%) | 11 (19.3%) |
| 6 to 18 Years | 105 (82.0%) | 58 (45.3%) |
| 19 to 25 Years | 25 (28.1%) | 32 (36.0%) |
| 25 to 34 Years | 30 (36.1%) | 43 (51.8%) |
| 35 to 44 Years | 31 (33.0%) | 52 (55.3%) |
| 45 to 54 Years | 45 (60.0%) | 36 (48.0%) |
| 55 to 64 Years | 42 (43.3%) | 34 (35.0%) |
| 65 to 74 Years | 43 (100.0%) | 24 (55.8%) |
| 75 Years and over | 108 (100.0%) | 77 (71.3%) |
| Total | 467 (60.3%) | 367 (47.4%) |
Disability Status by Sex by Age in Pine River
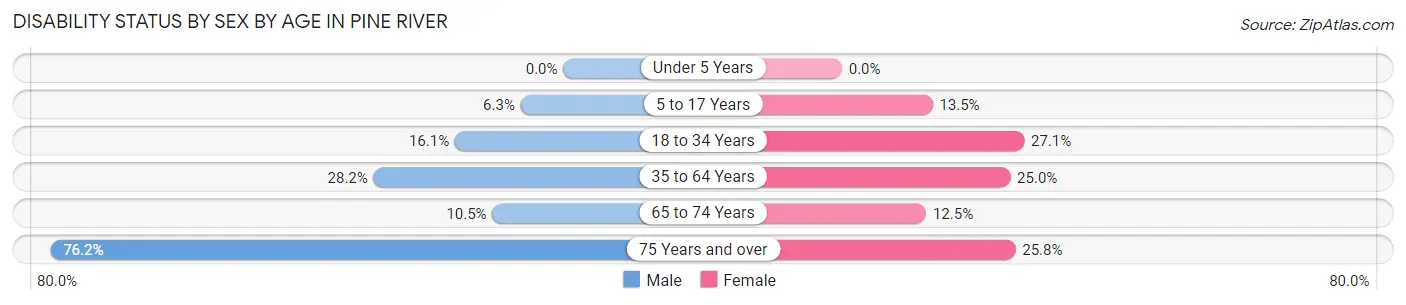
| Age Bracket | Male | Female |
| Under 5 Years | 0 (0.0%) | 0 (0.0%) |
| 5 to 17 Years | 5 (6.3%) | 7 (13.5%) |
| 18 to 34 Years | 14 (16.1%) | 23 (27.1%) |
| 35 to 64 Years | 40 (28.2%) | 31 (25.0%) |
| 65 to 74 Years | 2 (10.5%) | 3 (12.5%) |
| 75 Years and over | 32 (76.2%) | 17 (25.8%) |
Disability Class by Sex by Age in Pine River
Disability Class: Hearing Difficulty
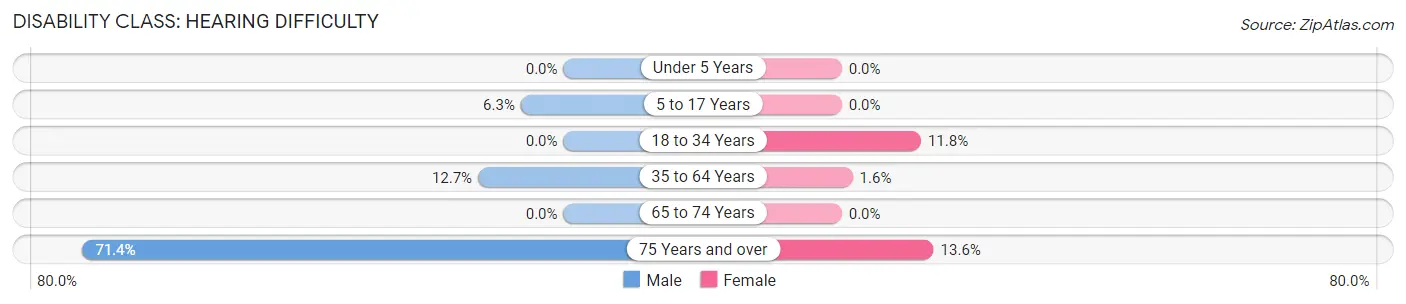
| Age Bracket | Male | Female |
| Under 5 Years | 0 (0.0%) | 0 (0.0%) |
| 5 to 17 Years | 5 (6.3%) | 0 (0.0%) |
| 18 to 34 Years | 0 (0.0%) | 10 (11.8%) |
| 35 to 64 Years | 18 (12.7%) | 2 (1.6%) |
| 65 to 74 Years | 0 (0.0%) | 0 (0.0%) |
| 75 Years and over | 30 (71.4%) | 9 (13.6%) |
Disability Class: Vision Difficulty
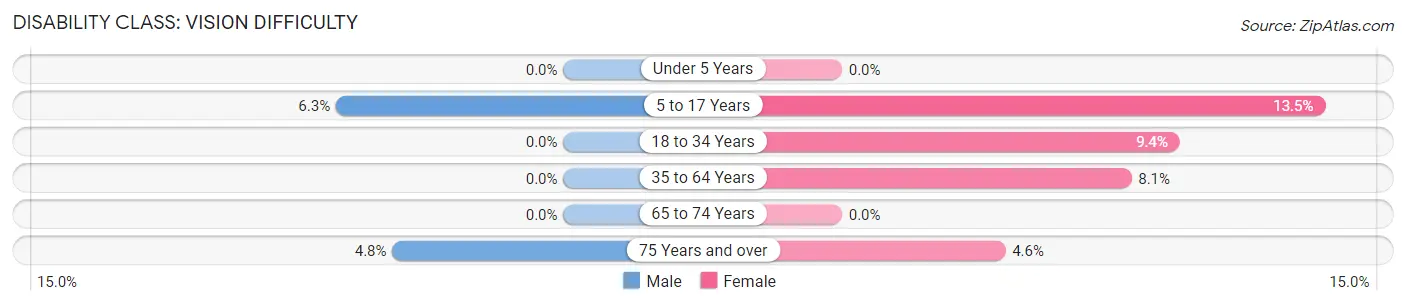
| Age Bracket | Male | Female |
| Under 5 Years | 0 (0.0%) | 0 (0.0%) |
| 5 to 17 Years | 5 (6.3%) | 7 (13.5%) |
| 18 to 34 Years | 0 (0.0%) | 8 (9.4%) |
| 35 to 64 Years | 0 (0.0%) | 10 (8.1%) |
| 65 to 74 Years | 0 (0.0%) | 0 (0.0%) |
| 75 Years and over | 2 (4.8%) | 3 (4.5%) |
Disability Class: Cognitive Difficulty
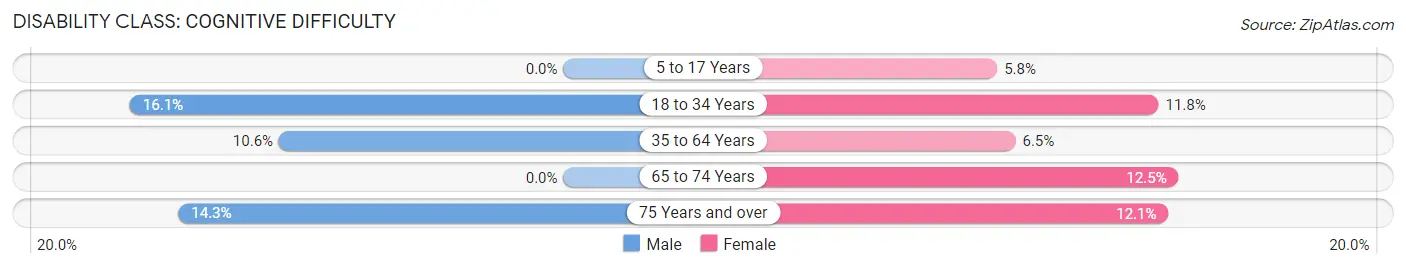
| Age Bracket | Male | Female |
| 5 to 17 Years | 0 (0.0%) | 3 (5.8%) |
| 18 to 34 Years | 14 (16.1%) | 10 (11.8%) |
| 35 to 64 Years | 15 (10.6%) | 8 (6.5%) |
| 65 to 74 Years | 0 (0.0%) | 3 (12.5%) |
| 75 Years and over | 6 (14.3%) | 8 (12.1%) |
Disability Class: Ambulatory Difficulty
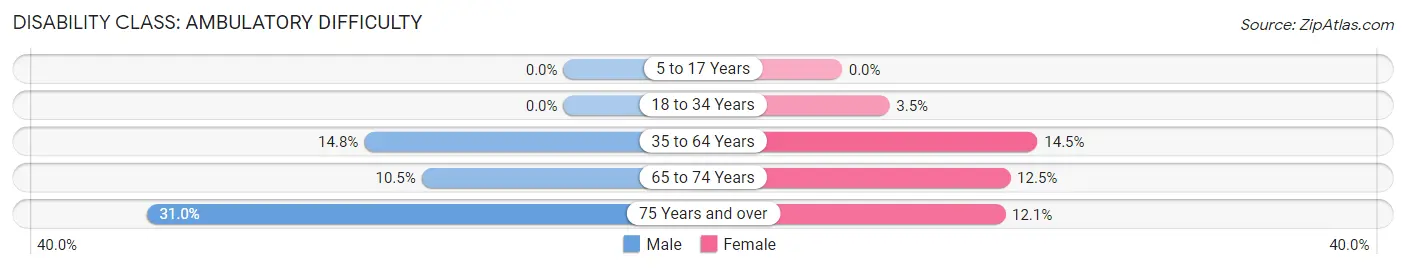
| Age Bracket | Male | Female |
| 5 to 17 Years | 0 (0.0%) | 0 (0.0%) |
| 18 to 34 Years | 0 (0.0%) | 3 (3.5%) |
| 35 to 64 Years | 21 (14.8%) | 18 (14.5%) |
| 65 to 74 Years | 2 (10.5%) | 3 (12.5%) |
| 75 Years and over | 13 (30.9%) | 8 (12.1%) |
Disability Class: Self-Care Difficulty
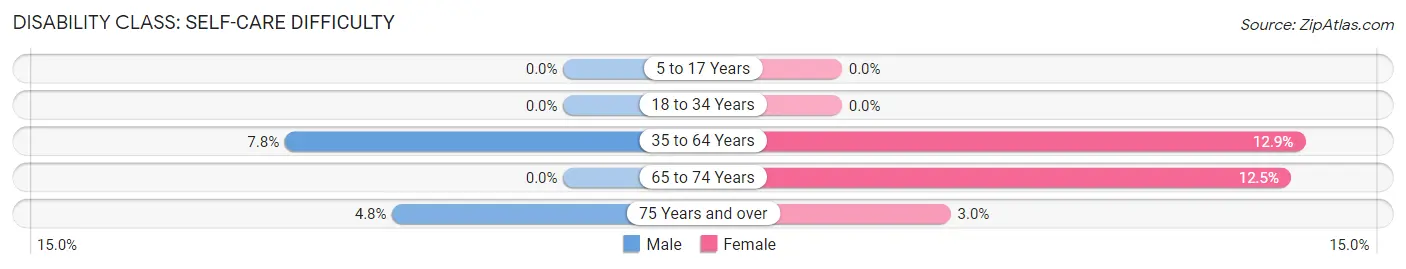
| Age Bracket | Male | Female |
| 5 to 17 Years | 0 (0.0%) | 0 (0.0%) |
| 18 to 34 Years | 0 (0.0%) | 0 (0.0%) |
| 35 to 64 Years | 11 (7.7%) | 16 (12.9%) |
| 65 to 74 Years | 0 (0.0%) | 3 (12.5%) |
| 75 Years and over | 2 (4.8%) | 2 (3.0%) |
Technology Access in Pine River
Computing Device Access in Pine River
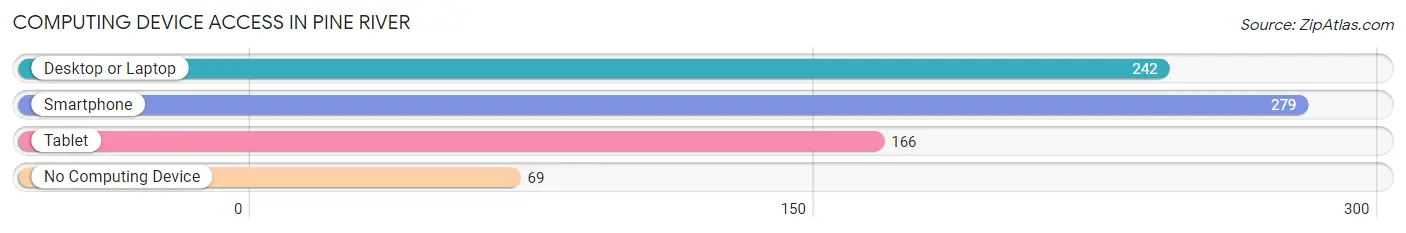
| Device Type | # Households | % Households |
| Desktop or Laptop | 242 | 62.2% |
| Smartphone | 279 | 71.7% |
| Tablet | 166 | 42.7% |
| No Computing Device | 69 | 17.7% |
| Total | 389 | 100.0% |
Internet Access in Pine River
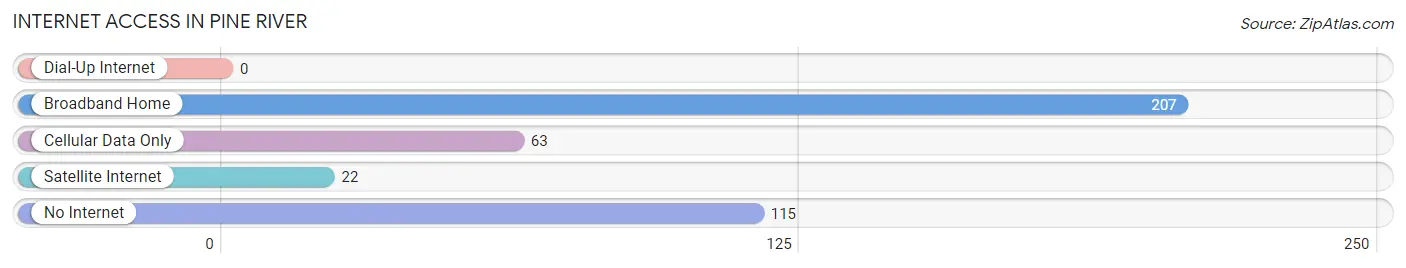
| Internet Type | # Households | % Households |
| Dial-Up Internet | 0 | 0.0% |
| Broadband Home | 207 | 53.2% |
| Cellular Data Only | 63 | 16.2% |
| Satellite Internet | 22 | 5.7% |
| No Internet | 115 | 29.6% |
| Total | 389 | 100.0% |
Pine River Summary
Pine River is a small city located in Cass County, Minnesota, United States. It is situated on the banks of the Pine River, a tributary of the Mississippi River. The city has a population of 1,717 as of the 2010 census.
History
The area that is now Pine River was first settled in the late 1800s by a group of Norwegian immigrants. The first permanent settlers arrived in 1871 and the town was officially incorporated in 1881. The town was named after the nearby Pine River, which was named by the Ojibwe people who lived in the area.
The early settlers of Pine River were mostly farmers and loggers. The town was a major logging center in the late 1800s and early 1900s, with several sawmills located in the area. The town also had a thriving agricultural industry, with many farmers growing wheat, oats, and other grains.
In the early 1900s, the town began to diversify its economy. Several businesses opened in the area, including a creamery, a flour mill, a furniture factory, and a canning factory. The town also had a thriving tourism industry, with many visitors coming to the area to fish and hunt.
Geography
Pine River is located in central Cass County, Minnesota. It is situated on the banks of the Pine River, a tributary of the Mississippi River. The city has a total area of 1.2 square miles, all of which is land.
The city is located in a heavily forested area, with many lakes and rivers in the vicinity. The nearest major city is Brainerd, which is located about 25 miles to the south.
Economy
The economy of Pine River is largely based on tourism and agriculture. The city is home to several tourist attractions, including the Pine River Dam, the Pine River State Forest, and the Pine River Wildlife Management Area. The city also has a thriving agricultural industry, with many farmers growing wheat, oats, and other grains.
The city also has a number of businesses, including a grocery store, a hardware store, a lumber yard, and several restaurants. The city also has a small manufacturing sector, with several small factories located in the area.
Demographics
As of the 2010 census, the population of Pine River was 1,717. The racial makeup of the city was 97.2% White, 0.3% African American, 0.3% Native American, 0.3% Asian, 0.2% from other races, and 1.7% from two or more races. Hispanic or Latino of any race were 1.2% of the population.
The median income for a household in the city was $37,917, and the median income for a family was $45,000. The per capita income for the city was $19,945. About 11.2% of families and 14.2% of the population were below the poverty line, including 18.2% of those under age 18 and 8.3% of those age 65 or over.
Common Questions
What is Per Capita Income in Pine River?
Per Capita income in Pine River is $24,020.
What is the Median Family Income in Pine River?
Median Family Income in Pine River is $48,056.
What is the Median Household income in Pine River?
Median Household Income in Pine River is $38,125.
What is Income or Wage Gap in Pine River?
Income or Wage Gap in Pine River is 0.2%.
Women in Pine River earn 99.8 cents for every dollar earned by a man.
What is Inequality or Gini Index in Pine River?
Inequality or Gini Index in Pine River is 0.36.
What is the Total Population of Pine River?
Total Population of Pine River is 845.
What is the Total Male Population of Pine River?
Total Male Population of Pine River is 469.
What is the Total Female Population of Pine River?
Total Female Population of Pine River is 376.
What is the Ratio of Males per 100 Females in Pine River?
There are 124.73 Males per 100 Females in Pine River.
What is the Ratio of Females per 100 Males in Pine River?
There are 80.17 Females per 100 Males in Pine River.
What is the Median Population Age in Pine River?
Median Population Age in Pine River is 43.3 Years.
What is the Average Family Size in Pine River
Average Family Size in Pine River is 2.9 People.
What is the Average Household Size in Pine River
Average Household Size in Pine River is 2.0 People.
How Large is the Labor Force in Pine River?
There are 406 People in the Labor Forcein in Pine River.
What is the Percentage of People in the Labor Force in Pine River?
60.2% of People are in the Labor Force in Pine River.
What is the Unemployment Rate in Pine River?
Unemployment Rate in Pine River is 2.2%.