Edgerton, MN Map & Demographics
Edgerton Map
Edgerton Overview
$33,738
PER CAPITA INCOME
$93,676
AVG FAMILY INCOME
$69,464
AVG HOUSEHOLD INCOME
20.3%
WAGE / INCOME GAP [ % ]
79.7¢/ $1
WAGE / INCOME GAP [ $ ]
0.35
INEQUALITY / GINI INDEX
1,256
TOTAL POPULATION
684
MALE POPULATION
572
FEMALE POPULATION
119.58
MALES / 100 FEMALES
83.63
FEMALES / 100 MALES
46.1
MEDIAN AGE
2.8
AVG FAMILY SIZE
2.2
AVG HOUSEHOLD SIZE
651
LABOR FORCE [ PEOPLE ]
64.8%
PERCENT IN LABOR FORCE
Edgerton Zip Codes
Edgerton Area Codes
Income in Edgerton
Income Overview in Edgerton
Per Capita Income in Edgerton is $33,738, while median incomes of families and households are $93,676 and $69,464 respectively.
| Characteristic | Number | Measure |
| Per Capita Income | 1,256 | $33,738 |
| Median Family Income | 334 | $93,676 |
| Mean Family Income | 334 | $98,740 |
| Median Household Income | 534 | $69,464 |
| Mean Household Income | 534 | $80,016 |
| Income Deficit | 334 | $0 |
| Wage / Income Gap (%) | 1,256 | 20.33% |
| Wage / Income Gap ($) | 1,256 | 79.67¢ per $1 |
| Gini / Inequality Index | 1,256 | 0.35 |
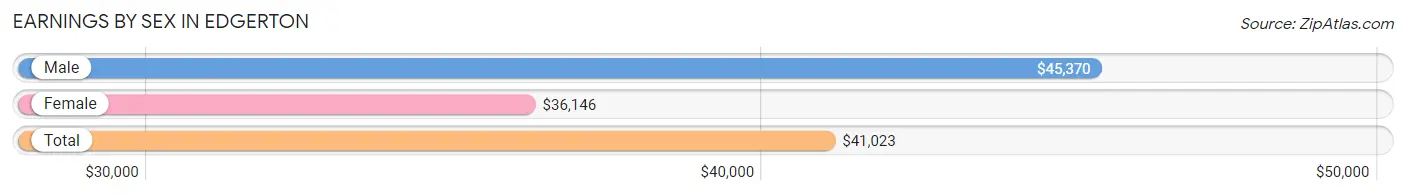
Earnings by Sex in Edgerton
Average Earnings in Edgerton are $41,023, $45,370 for men and $36,146 for women, a difference of 20.3%.
| Sex | Number | Average Earnings |
| Male | 410 (57.6%) | $45,370 |
| Female | 302 (42.4%) | $36,146 |
| Total | 712 (100.0%) | $41,023 |
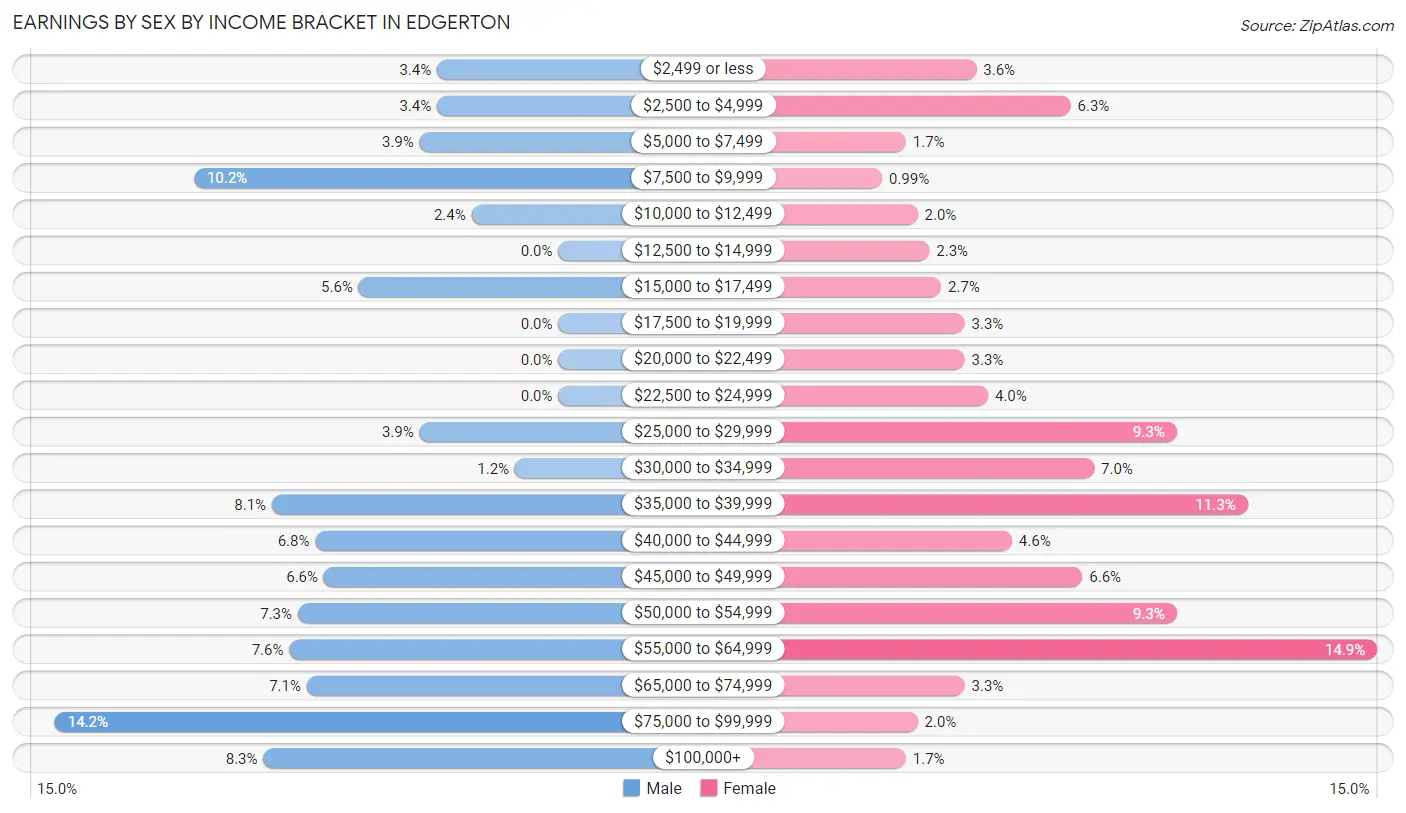
Earnings by Sex by Income Bracket in Edgerton
The most common earnings brackets in Edgerton are $75,000 to $99,999 for men (58 | 14.1%) and $55,000 to $64,999 for women (45 | 14.9%).
| Income | Male | Female |
| $2,499 or less | 14 (3.4%) | 11 (3.6%) |
| $2,500 to $4,999 | 14 (3.4%) | 19 (6.3%) |
| $5,000 to $7,499 | 16 (3.9%) | 5 (1.7%) |
| $7,500 to $9,999 | 42 (10.2%) | 3 (1.0%) |
| $10,000 to $12,499 | 10 (2.4%) | 6 (2.0%) |
| $12,500 to $14,999 | 0 (0.0%) | 7 (2.3%) |
| $15,000 to $17,499 | 23 (5.6%) | 8 (2.6%) |
| $17,500 to $19,999 | 0 (0.0%) | 10 (3.3%) |
| $20,000 to $22,499 | 0 (0.0%) | 10 (3.3%) |
| $22,500 to $24,999 | 0 (0.0%) | 12 (4.0%) |
| $25,000 to $29,999 | 16 (3.9%) | 28 (9.3%) |
| $30,000 to $34,999 | 5 (1.2%) | 21 (7.0%) |
| $35,000 to $39,999 | 33 (8.1%) | 34 (11.3%) |
| $40,000 to $44,999 | 28 (6.8%) | 14 (4.6%) |
| $45,000 to $49,999 | 27 (6.6%) | 20 (6.6%) |
| $50,000 to $54,999 | 30 (7.3%) | 28 (9.3%) |
| $55,000 to $64,999 | 31 (7.6%) | 45 (14.9%) |
| $65,000 to $74,999 | 29 (7.1%) | 10 (3.3%) |
| $75,000 to $99,999 | 58 (14.1%) | 6 (2.0%) |
| $100,000+ | 34 (8.3%) | 5 (1.7%) |
| Total | 410 (100.0%) | 302 (100.0%) |
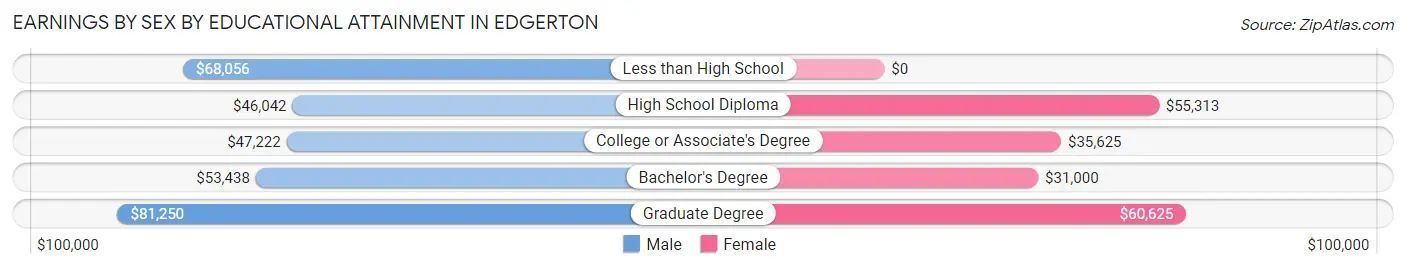
Earnings by Sex by Educational Attainment in Edgerton
Average earnings in Edgerton are $53,421 for men and $36,354 for women, a difference of 32.0%. Men with an educational attainment of graduate degree enjoy the highest average annual earnings of $81,250, while those with high school diploma education earn the least with $46,042. Women with an educational attainment of graduate degree earn the most with the average annual earnings of $60,625, while those with bachelor's degree education have the smallest earnings of $31,000.
| Educational Attainment | Male Income | Female Income |
| Less than High School | $68,056 | $0 |
| High School Diploma | $46,042 | $55,313 |
| College or Associate's Degree | $47,222 | $35,625 |
| Bachelor's Degree | $53,438 | $31,000 |
| Graduate Degree | $81,250 | $60,625 |
| Total | $53,421 | $36,354 |
Family Income in Edgerton
Family Income Brackets in Edgerton
According to the Edgerton family income data, there are 102 families falling into the $100,000 to $149,999 income range, which is the most common income bracket and makes up 30.5% of all families.
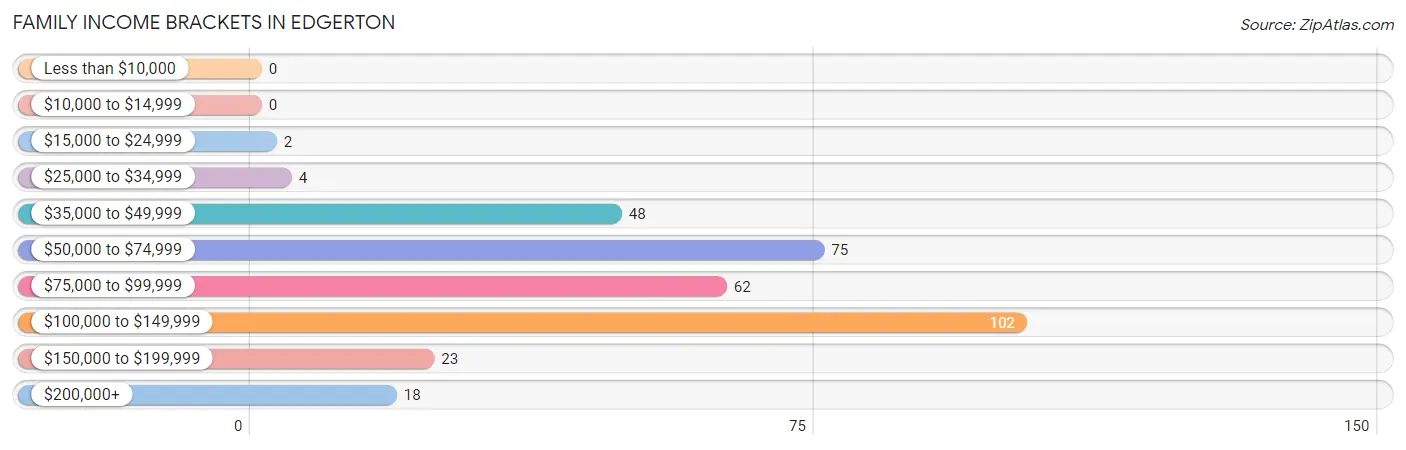
| Income Bracket | # Families | % Families |
| Less than $10,000 | 0 | 0.0% |
| $10,000 to $14,999 | 0 | 0.0% |
| $15,000 to $24,999 | 2 | 0.6% |
| $25,000 to $34,999 | 4 | 1.2% |
| $35,000 to $49,999 | 48 | 14.4% |
| $50,000 to $74,999 | 75 | 22.5% |
| $75,000 to $99,999 | 62 | 18.6% |
| $100,000 to $149,999 | 102 | 30.5% |
| $150,000 to $199,999 | 23 | 6.9% |
| $200,000+ | 18 | 5.4% |
Family Income by Famaliy Size in Edgerton
5-person families (34 | 10.2%) account for the highest median family income in Edgerton with $113,500 per family, while 2-person families (208 | 62.3%) have the highest median income of $46,731 per family member.
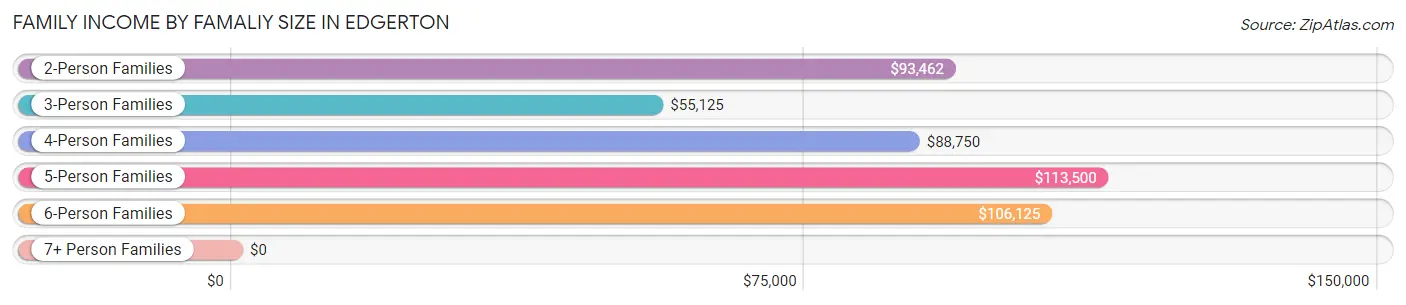
| Income Bracket | # Families | Median Income |
| 2-Person Families | 208 (62.3%) | $93,462 |
| 3-Person Families | 47 (14.1%) | $55,125 |
| 4-Person Families | 18 (5.4%) | $88,750 |
| 5-Person Families | 34 (10.2%) | $113,500 |
| 6-Person Families | 23 (6.9%) | $106,125 |
| 7+ Person Families | 4 (1.2%) | $0 |
| Total | 334 (100.0%) | $93,676 |
Family Income by Number of Earners in Edgerton
The median family income in Edgerton is $93,676, with families comprising 3+ earners (29) having the highest median family income of $114,750, while families with no earners (40) have the lowest median family income of $48,750, accounting for 8.7% and 12.0% of families, respectively.
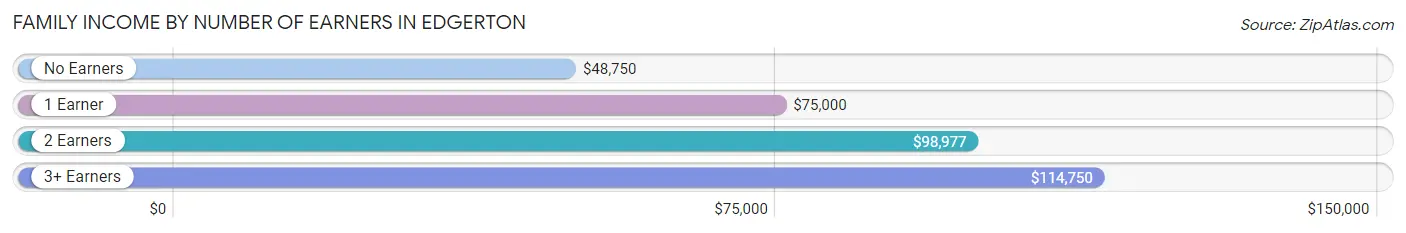
| Number of Earners | # Families | Median Income |
| No Earners | 40 (12.0%) | $48,750 |
| 1 Earner | 82 (24.5%) | $75,000 |
| 2 Earners | 183 (54.8%) | $98,977 |
| 3+ Earners | 29 (8.7%) | $114,750 |
| Total | 334 (100.0%) | $93,676 |
Household Income in Edgerton
Household Income Brackets in Edgerton
With 133 households falling in the category, the $100,000 to $149,999 income range is the most frequent in Edgerton, accounting for 24.9% of all households. In contrast, only 3 households (0.6%) fall into the $10,000 to $14,999 income bracket, making it the least populous group.
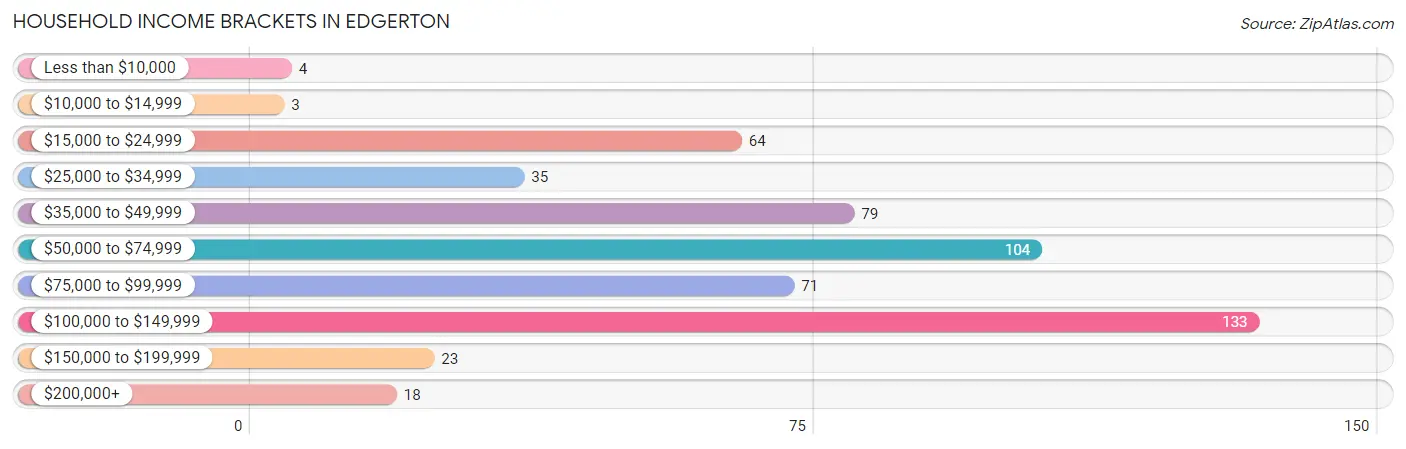
| Income Bracket | # Households | % Households |
| Less than $10,000 | 4 | 0.7% |
| $10,000 to $14,999 | 3 | 0.6% |
| $15,000 to $24,999 | 64 | 12.0% |
| $25,000 to $34,999 | 35 | 6.6% |
| $35,000 to $49,999 | 79 | 14.8% |
| $50,000 to $74,999 | 104 | 19.5% |
| $75,000 to $99,999 | 71 | 13.3% |
| $100,000 to $149,999 | 133 | 24.9% |
| $150,000 to $199,999 | 23 | 4.3% |
| $200,000+ | 18 | 3.4% |
Household Income by Householder Age in Edgerton
The median household income in Edgerton is $69,464, with the highest median household income of $116,985 found in the 45 to 64 years age bracket for the primary householder. A total of 161 households (30.1%) fall into this category. Meanwhile, the 15 to 24 years age bracket for the primary householder has the lowest median household income of $0, with 45 households (8.4%) in this group.
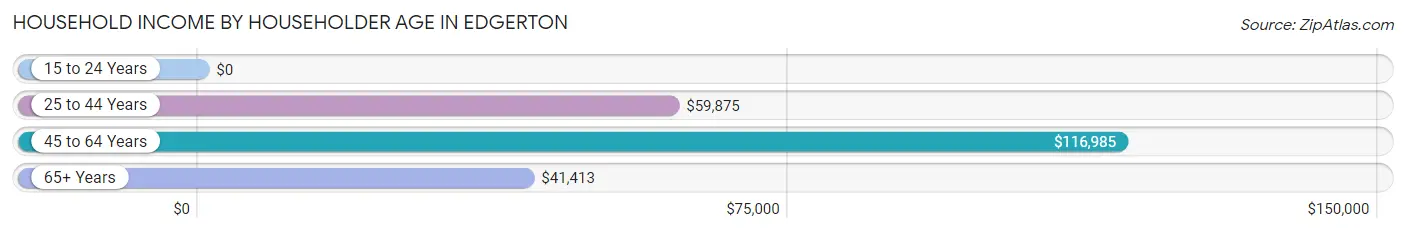
| Income Bracket | # Households | Median Income |
| 15 to 24 Years | 45 (8.4%) | $0 |
| 25 to 44 Years | 132 (24.7%) | $59,875 |
| 45 to 64 Years | 161 (30.1%) | $116,985 |
| 65+ Years | 196 (36.7%) | $41,413 |
| Total | 534 (100.0%) | $69,464 |
Poverty in Edgerton
Income Below Poverty by Sex and Age in Edgerton
With 5.4% poverty level for males and 1.9% for females among the residents of Edgerton, 25 to 34 year old males and 65 to 74 year old females are the most vulnerable to poverty, with 36 males (32.7%) and 5 females (9.8%) in their respective age groups living below the poverty level.
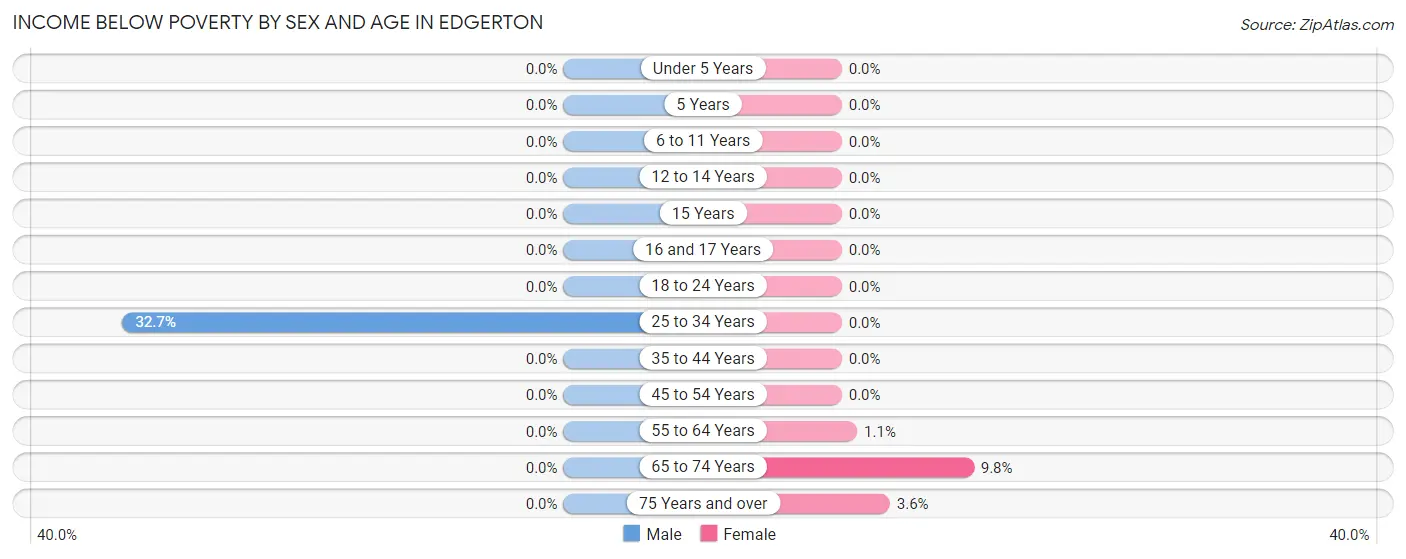
| Age Bracket | Male | Female |
| Under 5 Years | 0 (0.0%) | 0 (0.0%) |
| 5 Years | 0 (0.0%) | 0 (0.0%) |
| 6 to 11 Years | 0 (0.0%) | 0 (0.0%) |
| 12 to 14 Years | 0 (0.0%) | 0 (0.0%) |
| 15 Years | 0 (0.0%) | 0 (0.0%) |
| 16 and 17 Years | 0 (0.0%) | 0 (0.0%) |
| 18 to 24 Years | 0 (0.0%) | 0 (0.0%) |
| 25 to 34 Years | 36 (32.7%) | 0 (0.0%) |
| 35 to 44 Years | 0 (0.0%) | 0 (0.0%) |
| 45 to 54 Years | 0 (0.0%) | 0 (0.0%) |
| 55 to 64 Years | 0 (0.0%) | 1 (1.1%) |
| 65 to 74 Years | 0 (0.0%) | 5 (9.8%) |
| 75 Years and over | 0 (0.0%) | 4 (3.6%) |
| Total | 36 (5.4%) | 10 (1.9%) |
Income Above Poverty by Sex and Age in Edgerton
According to the poverty statistics in Edgerton, males aged under 5 years and females aged under 5 years are the age groups that are most secure financially, with 100.0% of males and 100.0% of females in these age groups living above the poverty line.
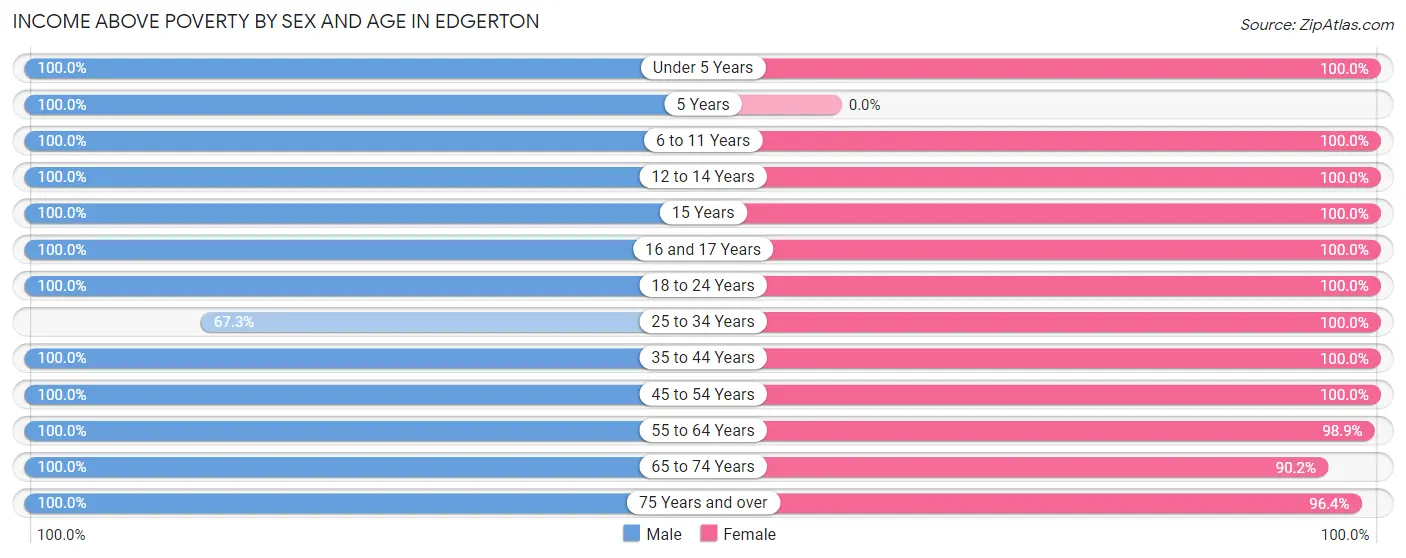
| Age Bracket | Male | Female |
| Under 5 Years | 40 (100.0%) | 33 (100.0%) |
| 5 Years | 13 (100.0%) | 0 (0.0%) |
| 6 to 11 Years | 72 (100.0%) | 23 (100.0%) |
| 12 to 14 Years | 41 (100.0%) | 7 (100.0%) |
| 15 Years | 9 (100.0%) | 13 (100.0%) |
| 16 and 17 Years | 17 (100.0%) | 12 (100.0%) |
| 18 to 24 Years | 73 (100.0%) | 30 (100.0%) |
| 25 to 34 Years | 74 (67.3%) | 57 (100.0%) |
| 35 to 44 Years | 39 (100.0%) | 38 (100.0%) |
| 45 to 54 Years | 35 (100.0%) | 75 (100.0%) |
| 55 to 64 Years | 87 (100.0%) | 87 (98.9%) |
| 65 to 74 Years | 61 (100.0%) | 46 (90.2%) |
| 75 Years and over | 64 (100.0%) | 108 (96.4%) |
| Total | 625 (94.6%) | 529 (98.1%) |
Income Below Poverty Among Married-Couple Families in Edgerton
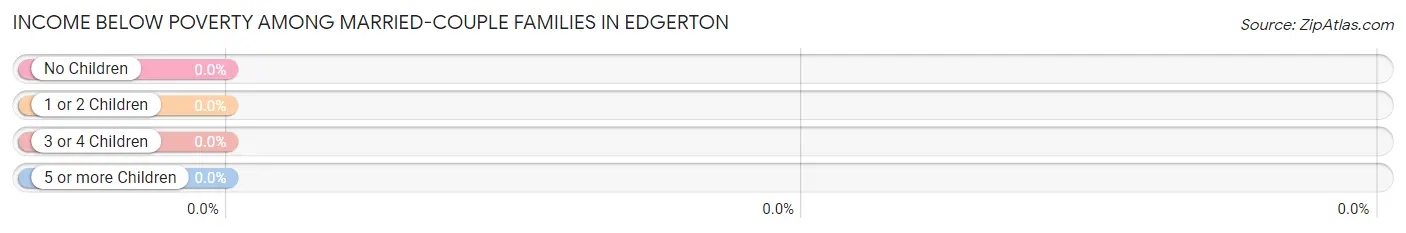
| Children | Above Poverty | Below Poverty |
| No Children | 196 (100.0%) | 0 (0.0%) |
| 1 or 2 Children | 47 (100.0%) | 0 (0.0%) |
| 3 or 4 Children | 44 (100.0%) | 0 (0.0%) |
| 5 or more Children | 4 (100.0%) | 0 (0.0%) |
| Total | 291 (100.0%) | 0 (0.0%) |
Income Below Poverty Among Single-Parent Households in Edgerton
| Children | Single Father | Single Mother |
| No Children | 0 (0.0%) | 0 (0.0%) |
| 1 or 2 Children | 0 (0.0%) | 0 (0.0%) |
| 3 or 4 Children | 0 (0.0%) | 0 (0.0%) |
| 5 or more Children | 0 (0.0%) | 0 (0.0%) |
| Total | 0 (0.0%) | 0 (0.0%) |
Income Below Poverty Among Married-Couple vs Single-Parent Households in Edgerton
| Children | Married-Couple Families | Single-Parent Households |
| No Children | 0 (0.0%) | 0 (0.0%) |
| 1 or 2 Children | 0 (0.0%) | 0 (0.0%) |
| 3 or 4 Children | 0 (0.0%) | 0 (0.0%) |
| 5 or more Children | 0 (0.0%) | 0 (0.0%) |
| Total | 0 (0.0%) | 0 (0.0%) |
Race in Edgerton
The most populous races in Edgerton are White / Caucasian (1,145 | 91.2%), Hispanic or Latino (66 | 5.2%), and Hawaiian / Pacific (36 | 2.9%).
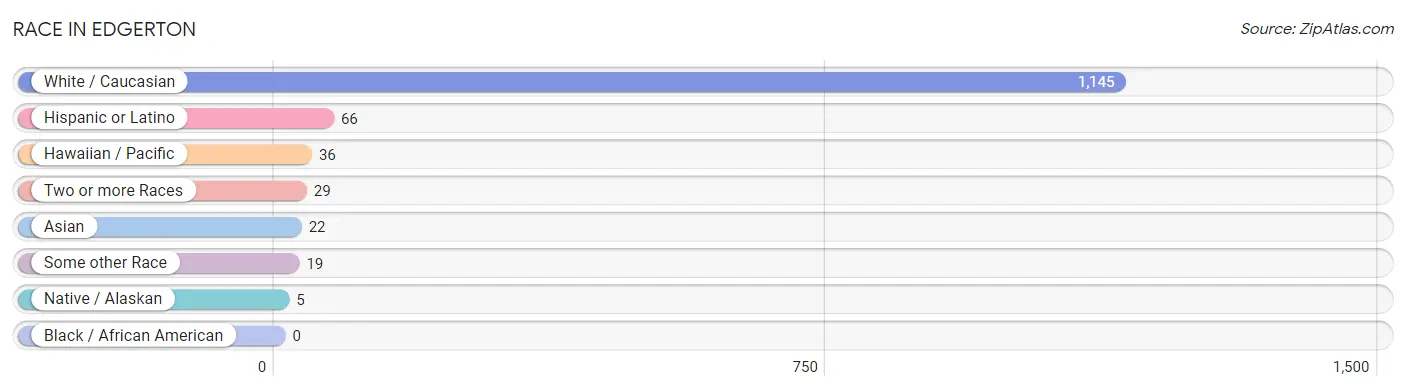
| Race | # Population | % Population |
| Asian | 22 | 1.8% |
| Black / African American | 0 | 0.0% |
| Hawaiian / Pacific | 36 | 2.9% |
| Hispanic or Latino | 66 | 5.2% |
| Native / Alaskan | 5 | 0.4% |
| White / Caucasian | 1,145 | 91.2% |
| Two or more Races | 29 | 2.3% |
| Some other Race | 19 | 1.5% |
| Total | 1,256 | 100.0% |
Ancestry in Edgerton
The most populous ancestries reported in Edgerton are Dutch (655 | 52.1%), German (257 | 20.5%), Norwegian (64 | 5.1%), Central American (36 | 2.9%), and Nicaraguan (36 | 2.9%), together accounting for 83.4% of all Edgerton residents.
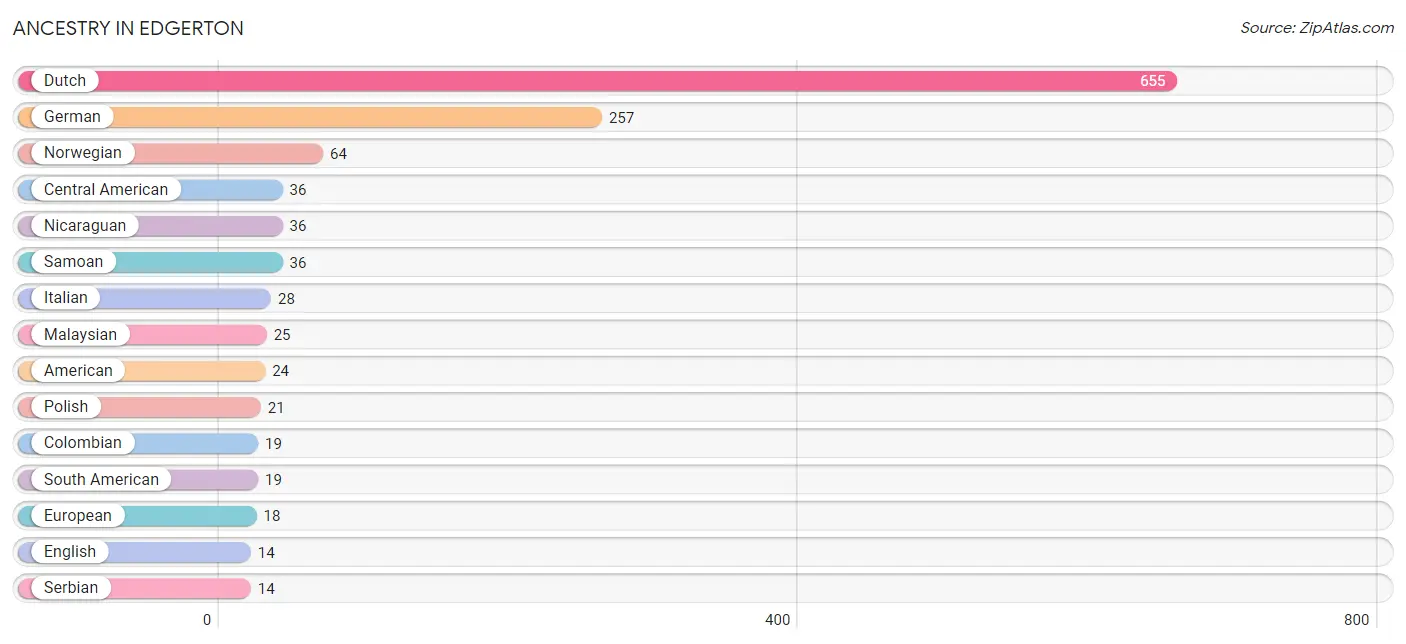
| Ancestry | # Population | % Population |
| American | 24 | 1.9% |
| Belgian | 4 | 0.3% |
| Central American | 36 | 2.9% |
| Cherokee | 3 | 0.2% |
| Chippewa | 5 | 0.4% |
| Colombian | 19 | 1.5% |
| Dutch | 655 | 52.1% |
| English | 14 | 1.1% |
| European | 18 | 1.4% |
| German | 257 | 20.5% |
| Hungarian | 5 | 0.4% |
| Irish | 10 | 0.8% |
| Italian | 28 | 2.2% |
| Malaysian | 25 | 2.0% |
| Nicaraguan | 36 | 2.9% |
| Northern European | 2 | 0.2% |
| Norwegian | 64 | 5.1% |
| Pakistani | 9 | 0.7% |
| Polish | 21 | 1.7% |
| Portuguese | 3 | 0.2% |
| Puerto Rican | 11 | 0.9% |
| Russian | 6 | 0.5% |
| Samoan | 36 | 2.9% |
| Scandinavian | 3 | 0.2% |
| Scotch-Irish | 2 | 0.2% |
| Scottish | 5 | 0.4% |
| Serbian | 14 | 1.1% |
| Sioux | 14 | 1.1% |
| South American | 19 | 1.5% |
| Swedish | 7 | 0.6% |
| Swiss | 2 | 0.2% | View All 31 Rows |
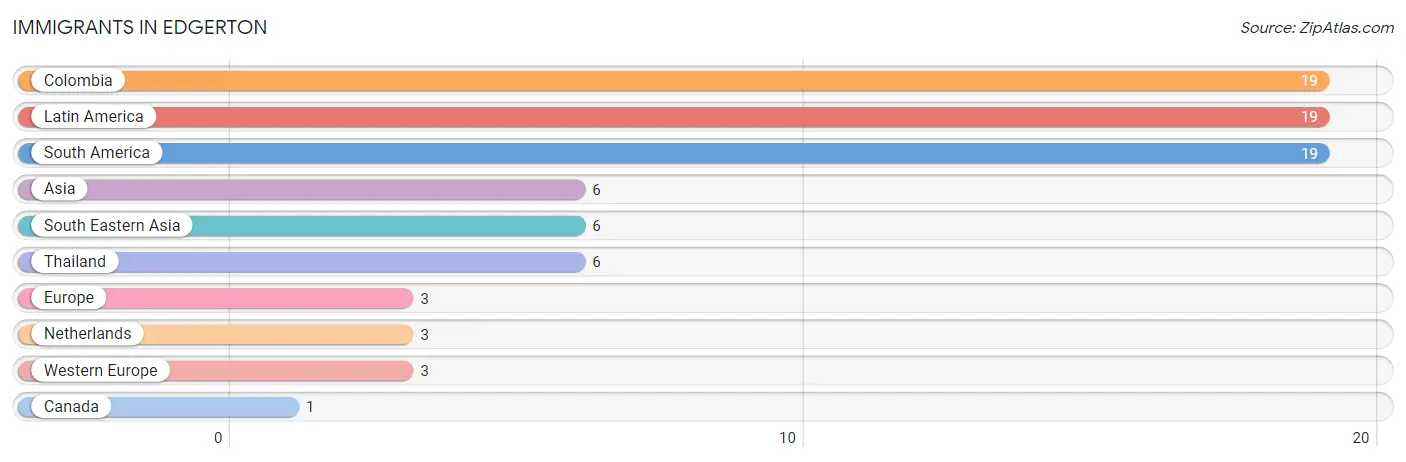
Immigrants in Edgerton
The most numerous immigrant groups reported in Edgerton came from Colombia (19 | 1.5%), Latin America (19 | 1.5%), South America (19 | 1.5%), Asia (6 | 0.5%), and South Eastern Asia (6 | 0.5%), together accounting for 5.5% of all Edgerton residents.
| Immigration Origin | # Population | % Population |
| Asia | 6 | 0.5% |
| Canada | 1 | 0.1% |
| Colombia | 19 | 1.5% |
| Europe | 3 | 0.2% |
| Latin America | 19 | 1.5% |
| Netherlands | 3 | 0.2% |
| South America | 19 | 1.5% |
| South Eastern Asia | 6 | 0.5% |
| Thailand | 6 | 0.5% |
| Western Europe | 3 | 0.2% | View All 10 Rows |
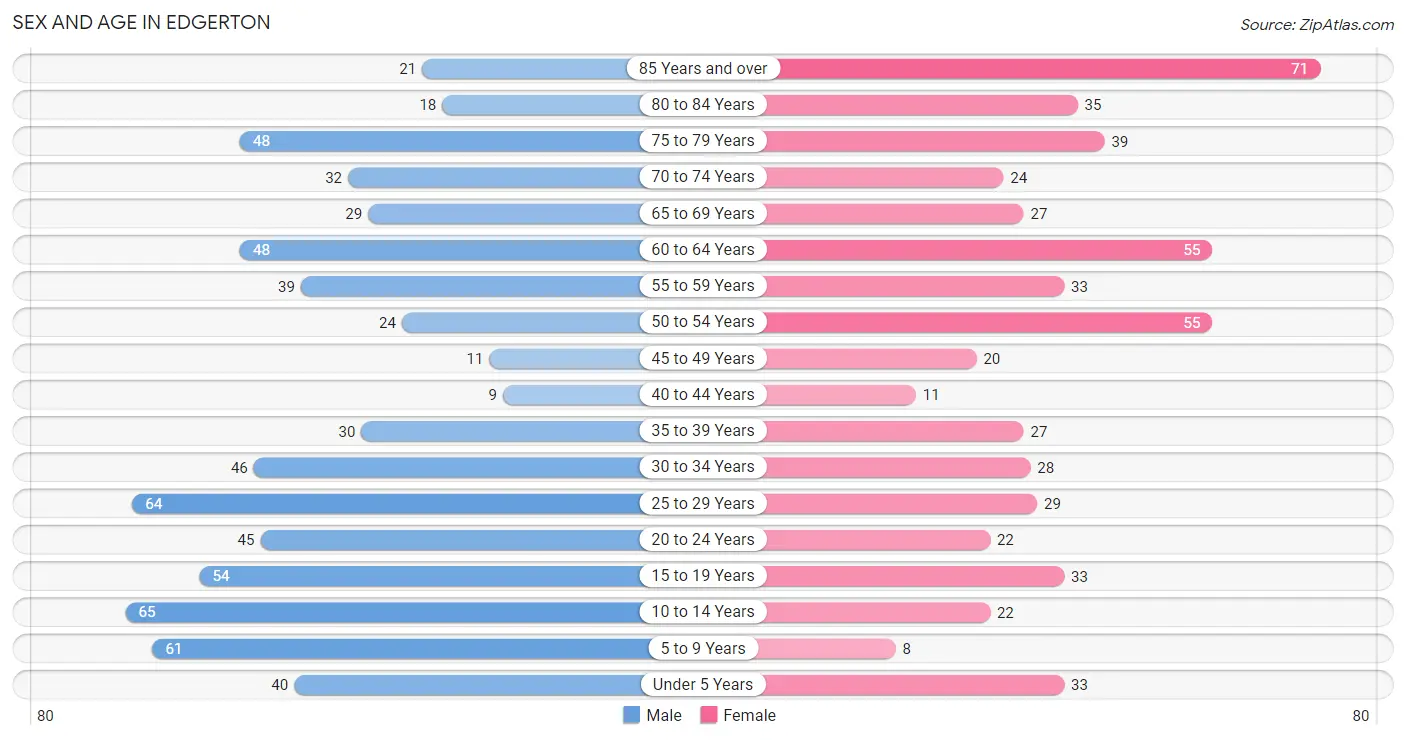
Sex and Age in Edgerton
Sex and Age in Edgerton
The most populous age groups in Edgerton are 10 to 14 Years (65 | 9.5%) for men and 85 Years and over (71 | 12.4%) for women.
| Age Bracket | Male | Female |
| Under 5 Years | 40 (5.9%) | 33 (5.8%) |
| 5 to 9 Years | 61 (8.9%) | 8 (1.4%) |
| 10 to 14 Years | 65 (9.5%) | 22 (3.8%) |
| 15 to 19 Years | 54 (7.9%) | 33 (5.8%) |
| 20 to 24 Years | 45 (6.6%) | 22 (3.8%) |
| 25 to 29 Years | 64 (9.4%) | 29 (5.1%) |
| 30 to 34 Years | 46 (6.7%) | 28 (4.9%) |
| 35 to 39 Years | 30 (4.4%) | 27 (4.7%) |
| 40 to 44 Years | 9 (1.3%) | 11 (1.9%) |
| 45 to 49 Years | 11 (1.6%) | 20 (3.5%) |
| 50 to 54 Years | 24 (3.5%) | 55 (9.6%) |
| 55 to 59 Years | 39 (5.7%) | 33 (5.8%) |
| 60 to 64 Years | 48 (7.0%) | 55 (9.6%) |
| 65 to 69 Years | 29 (4.2%) | 27 (4.7%) |
| 70 to 74 Years | 32 (4.7%) | 24 (4.2%) |
| 75 to 79 Years | 48 (7.0%) | 39 (6.8%) |
| 80 to 84 Years | 18 (2.6%) | 35 (6.1%) |
| 85 Years and over | 21 (3.1%) | 71 (12.4%) |
| Total | 684 (100.0%) | 572 (100.0%) |
Families and Households in Edgerton
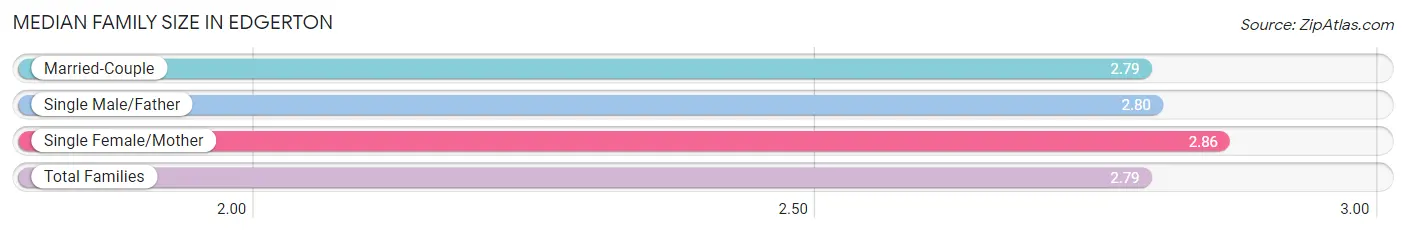
Median Family Size in Edgerton
The median family size in Edgerton is 2.79 persons per family, with single female/mother families (28 | 8.4%) accounting for the largest median family size of 2.86 persons per family. On the other hand, married-couple families (291 | 87.1%) represent the smallest median family size with 2.79 persons per family.
| Family Type | # Families | Family Size |
| Married-Couple | 291 (87.1%) | 2.79 |
| Single Male/Father | 15 (4.5%) | 2.80 |
| Single Female/Mother | 28 (8.4%) | 2.86 |
| Total Families | 334 (100.0%) | 2.79 |
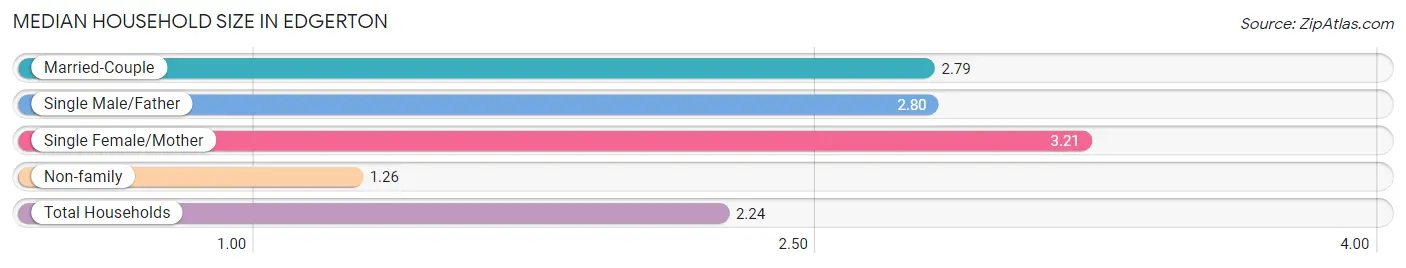
Median Household Size in Edgerton
The median household size in Edgerton is 2.24 persons per household, with single female/mother households (28 | 5.2%) accounting for the largest median household size of 3.21 persons per household. non-family households (200 | 37.4%) represent the smallest median household size with 1.26 persons per household.
| Household Type | # Households | Household Size |
| Married-Couple | 291 (54.5%) | 2.79 |
| Single Male/Father | 15 (2.8%) | 2.80 |
| Single Female/Mother | 28 (5.2%) | 3.21 |
| Non-family | 200 (37.4%) | 1.26 |
| Total Households | 534 (100.0%) | 2.24 |
Household Size by Marriage Status in Edgerton
Out of a total of 534 households in Edgerton, 334 (62.5%) are family households, while 200 (37.4%) are nonfamily households. The most numerous type of family households are 2-person households, comprising 204, and the most common type of nonfamily households are 1-person households, comprising 177.
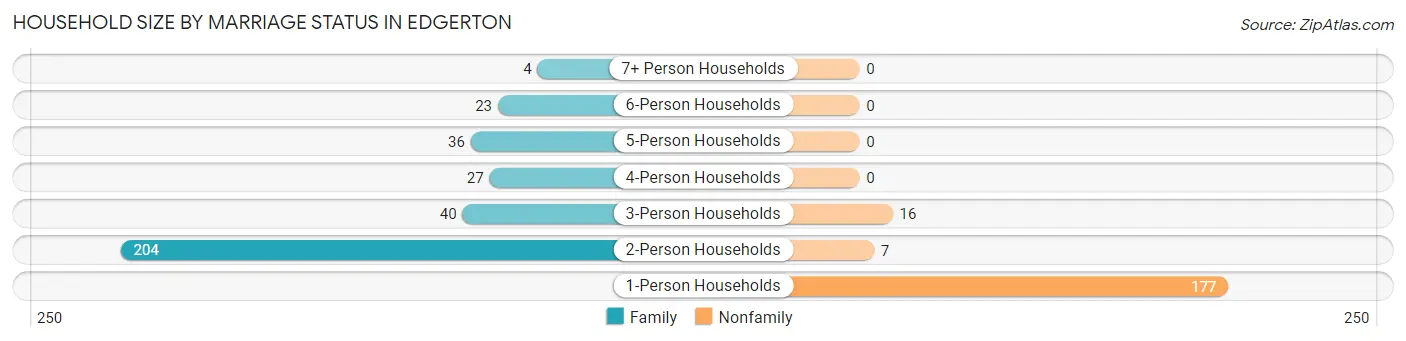
| Household Size | Family Households | Nonfamily Households |
| 1-Person Households | - | 177 (33.2%) |
| 2-Person Households | 204 (38.2%) | 7 (1.3%) |
| 3-Person Households | 40 (7.5%) | 16 (3.0%) |
| 4-Person Households | 27 (5.1%) | 0 (0.0%) |
| 5-Person Households | 36 (6.7%) | 0 (0.0%) |
| 6-Person Households | 23 (4.3%) | 0 (0.0%) |
| 7+ Person Households | 4 (0.7%) | 0 (0.0%) |
| Total | 334 (62.5%) | 200 (37.4%) |
Female Fertility in Edgerton
Fertility by Age in Edgerton
Average fertility rate in Edgerton is 91.0 births per 1,000 women. Women in the age bracket of 20 to 34 years have the highest fertility rate with 203.0 births per 1,000 women. Women in the age bracket of 20 to 34 years acount for 100.0% of all women with births.
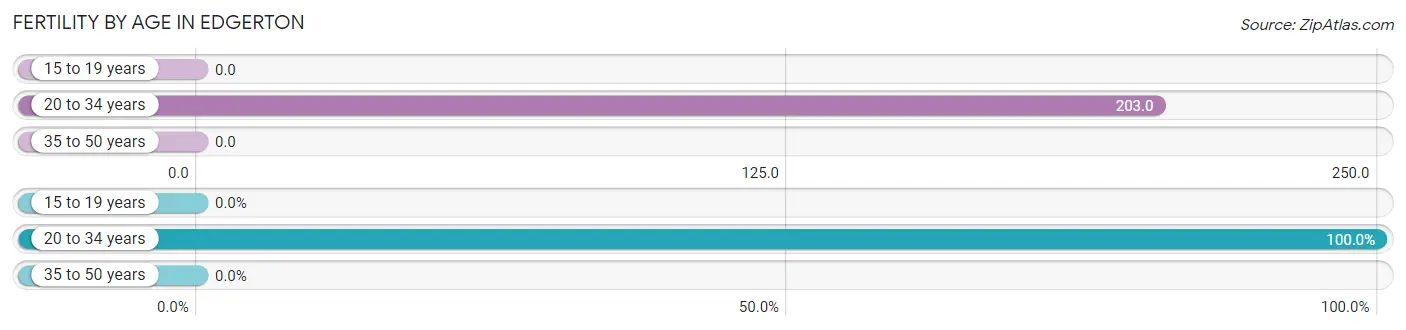
| Age Bracket | Women with Births | Births / 1,000 Women |
| 15 to 19 years | 0 (0.0%) | 0.0 |
| 20 to 34 years | 16 (100.0%) | 203.0 |
| 35 to 50 years | 0 (0.0%) | 0.0 |
| Total | 16 (100.0%) | 91.0 |
Fertility by Age by Marriage Status in Edgerton
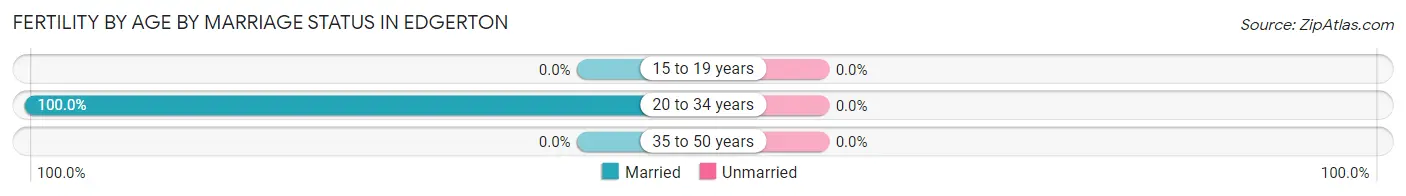
| Age Bracket | Married | Unmarried |
| 15 to 19 years | 0 (0.0%) | 0 (0.0%) |
| 20 to 34 years | 16 (100.0%) | 0 (0.0%) |
| 35 to 50 years | 0 (0.0%) | 0 (0.0%) |
| Total | 16 (100.0%) | 0 (0.0%) |
Fertility by Education in Edgerton
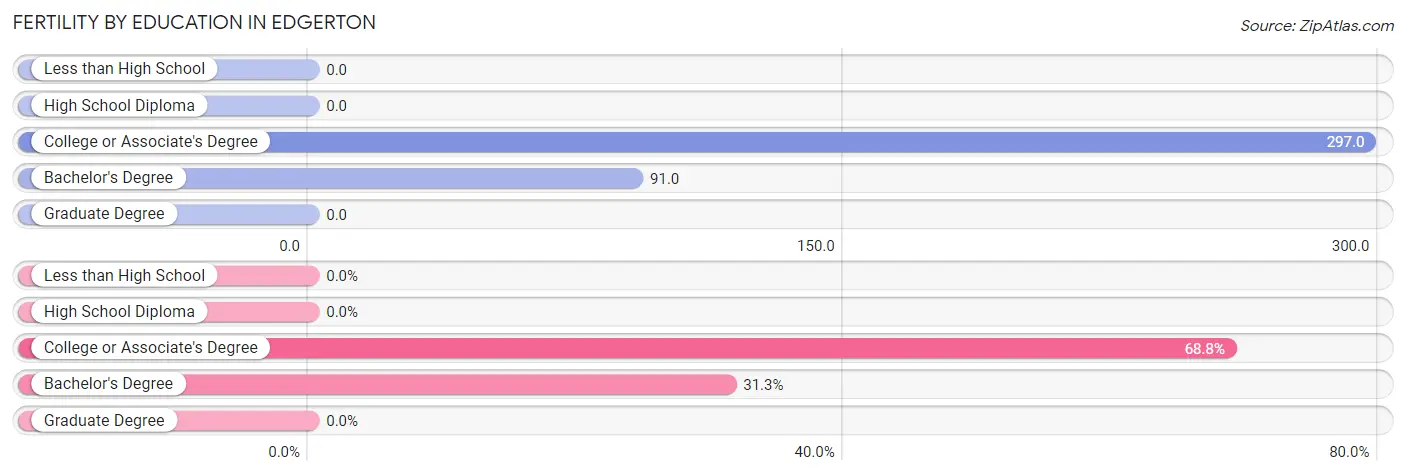
| Educational Attainment | Women with Births | Births / 1,000 Women |
| Less than High School | 0 (0.0%) | 0.0 |
| High School Diploma | 0 (0.0%) | 0.0 |
| College or Associate's Degree | 11 (68.8%) | 297.0 |
| Bachelor's Degree | 5 (31.2%) | 91.0 |
| Graduate Degree | 0 (0.0%) | 0.0 |
| Total | 16 (100.0%) | 91.0 |
Fertility by Education by Marriage Status in Edgerton
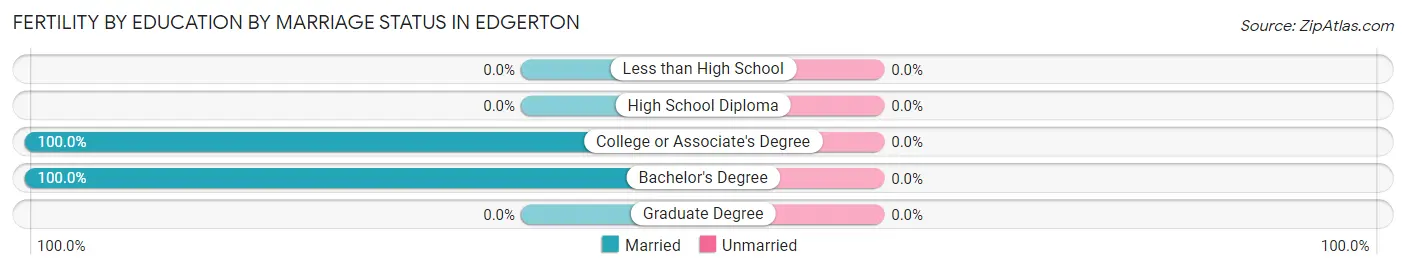
| Educational Attainment | Married | Unmarried |
| Less than High School | 0 (0.0%) | 0 (0.0%) |
| High School Diploma | 0 (0.0%) | 0 (0.0%) |
| College or Associate's Degree | 11 (100.0%) | 0 (0.0%) |
| Bachelor's Degree | 5 (100.0%) | 0 (0.0%) |
| Graduate Degree | 0 (0.0%) | 0 (0.0%) |
| Total | 16 (100.0%) | 0 (0.0%) |
Employment Characteristics in Edgerton
Employment by Class of Employer in Edgerton
Among the 632 employed individuals in Edgerton, private company employees (418 | 66.1%), not-for-profit organizations (82 | 13.0%), and self-employed (incorporated) (40 | 6.3%) make up the most common classes of employment.
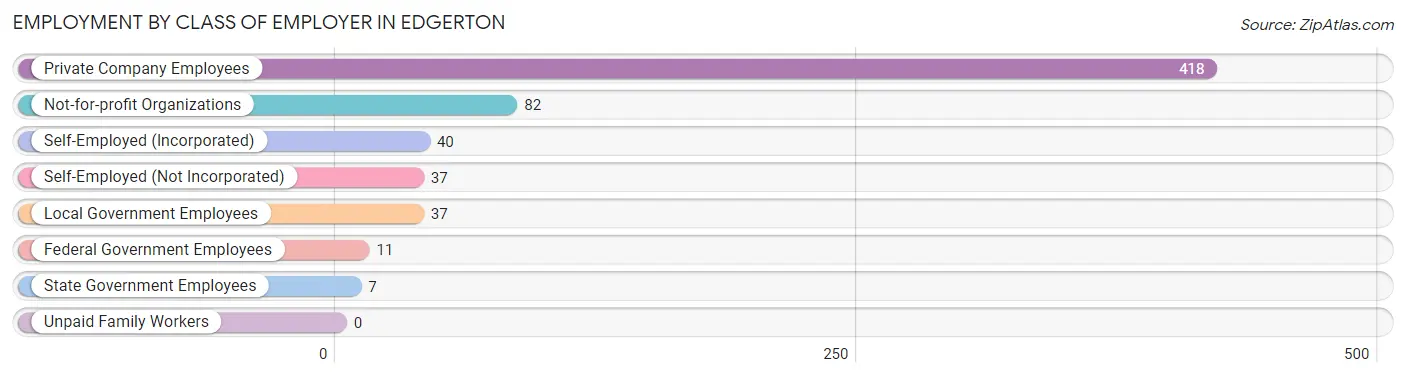
| Employer Class | # Employees | % Employees |
| Private Company Employees | 418 | 66.1% |
| Self-Employed (Incorporated) | 40 | 6.3% |
| Self-Employed (Not Incorporated) | 37 | 5.9% |
| Not-for-profit Organizations | 82 | 13.0% |
| Local Government Employees | 37 | 5.9% |
| State Government Employees | 7 | 1.1% |
| Federal Government Employees | 11 | 1.7% |
| Unpaid Family Workers | 0 | 0.0% |
| Total | 632 | 100.0% |
Employment Status by Age in Edgerton
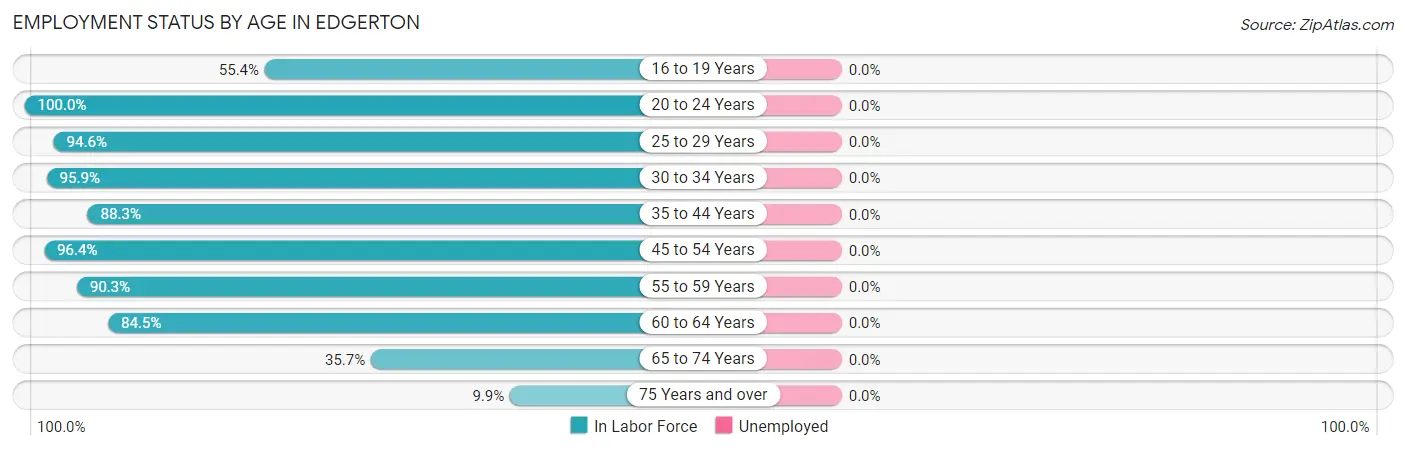
| Age Bracket | In Labor Force | Unemployed |
| 16 to 19 Years | 36 (55.4%) | 0 (0.0%) |
| 20 to 24 Years | 67 (100.0%) | 0 (0.0%) |
| 25 to 29 Years | 88 (94.6%) | 0 (0.0%) |
| 30 to 34 Years | 71 (95.9%) | 0 (0.0%) |
| 35 to 44 Years | 68 (88.3%) | 0 (0.0%) |
| 45 to 54 Years | 106 (96.4%) | 0 (0.0%) |
| 55 to 59 Years | 65 (90.3%) | 0 (0.0%) |
| 60 to 64 Years | 87 (84.5%) | 0 (0.0%) |
| 65 to 74 Years | 40 (35.7%) | 0 (0.0%) |
| 75 Years and over | 23 (9.9%) | 0 (0.0%) |
| Total | 651 (64.8%) | 0 (0.0%) |
Employment Status by Educational Attainment in Edgerton
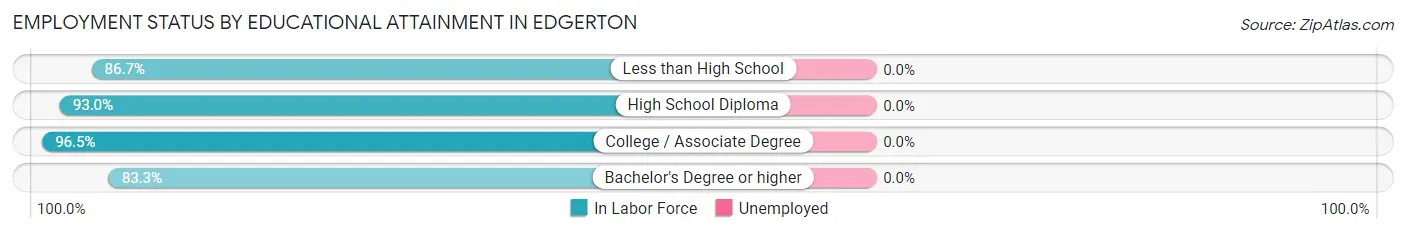
| Educational Attainment | In Labor Force | Unemployed |
| Less than High School | 13 (86.7%) | 0 (0.0%) |
| High School Diploma | 93 (93.0%) | 0 (0.0%) |
| College / Associate Degree | 249 (96.5%) | 0 (0.0%) |
| Bachelor's Degree or higher | 130 (83.3%) | 0 (0.0%) |
| Total | 485 (91.7%) | 0 (0.0%) |
Employment Occupations by Sex in Edgerton
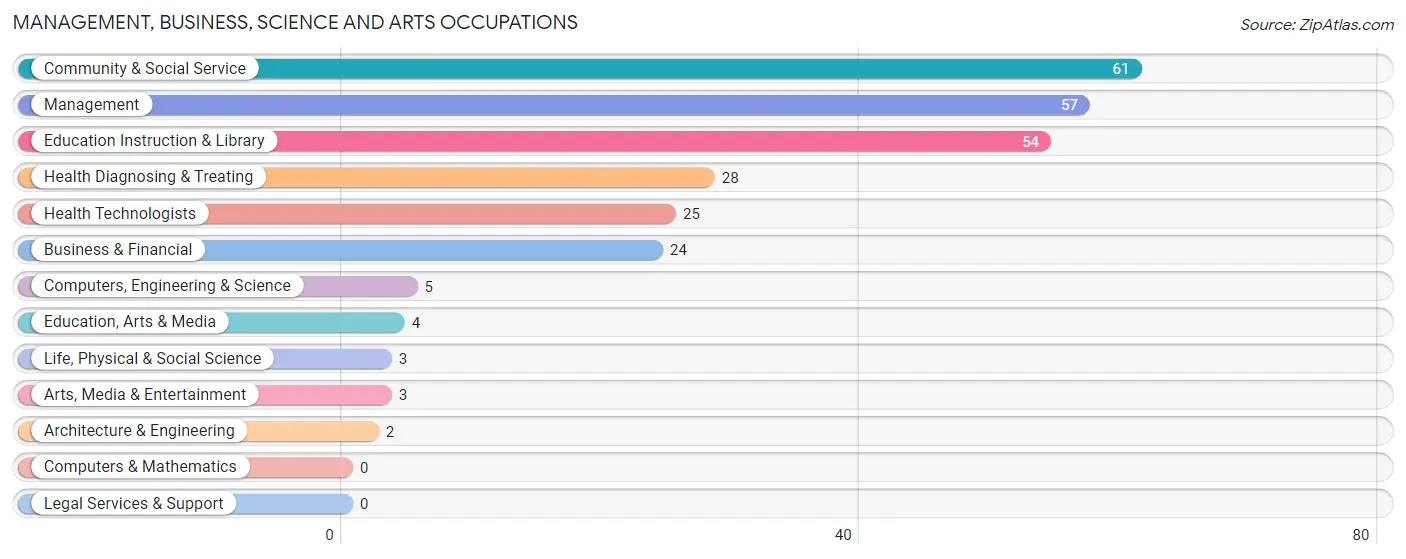
Management, Business, Science and Arts Occupations
The most common Management, Business, Science and Arts occupations in Edgerton are Community & Social Service (61 | 9.4%), Management (57 | 8.8%), Education Instruction & Library (54 | 8.3%), Health Diagnosing & Treating (28 | 4.3%), and Health Technologists (25 | 3.8%).
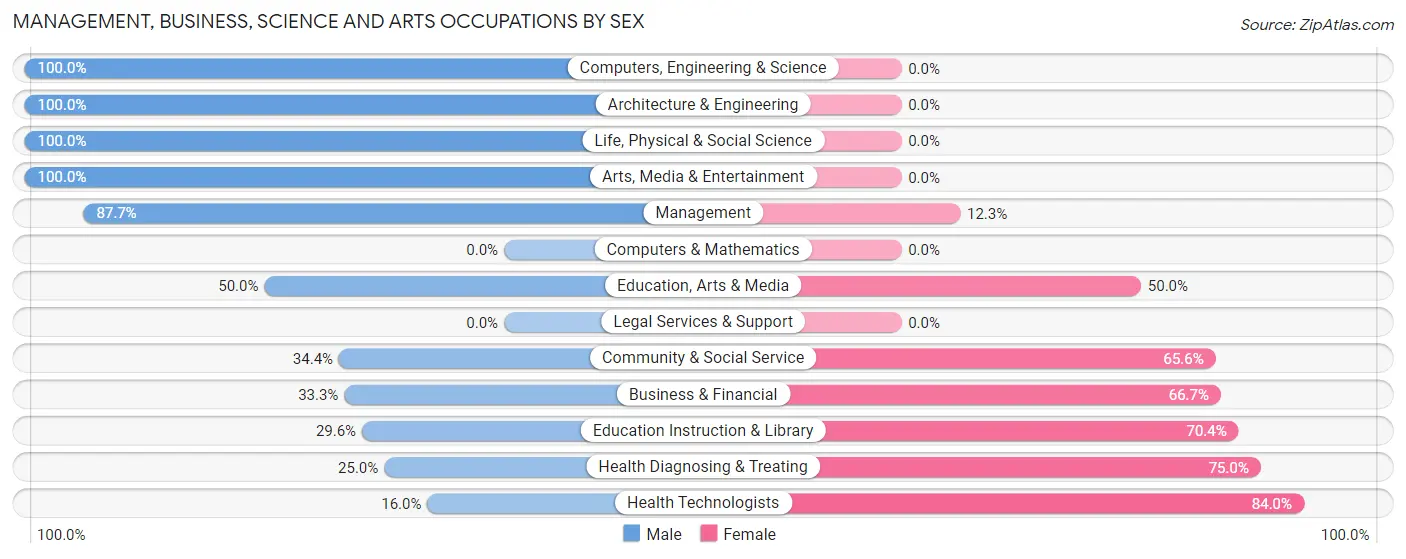
Management, Business, Science and Arts Occupations by Sex
Within the Management, Business, Science and Arts occupations in Edgerton, the most male-oriented occupations are Computers, Engineering & Science (100.0%), Architecture & Engineering (100.0%), and Life, Physical & Social Science (100.0%), while the most female-oriented occupations are Health Technologists (84.0%), Health Diagnosing & Treating (75.0%), and Education Instruction & Library (70.4%).
| Occupation | Male | Female |
| Management | 50 (87.7%) | 7 (12.3%) |
| Business & Financial | 8 (33.3%) | 16 (66.7%) |
| Computers, Engineering & Science | 5 (100.0%) | 0 (0.0%) |
| Computers & Mathematics | 0 (0.0%) | 0 (0.0%) |
| Architecture & Engineering | 2 (100.0%) | 0 (0.0%) |
| Life, Physical & Social Science | 3 (100.0%) | 0 (0.0%) |
| Community & Social Service | 21 (34.4%) | 40 (65.6%) |
| Education, Arts & Media | 2 (50.0%) | 2 (50.0%) |
| Legal Services & Support | 0 (0.0%) | 0 (0.0%) |
| Education Instruction & Library | 16 (29.6%) | 38 (70.4%) |
| Arts, Media & Entertainment | 3 (100.0%) | 0 (0.0%) |
| Health Diagnosing & Treating | 7 (25.0%) | 21 (75.0%) |
| Health Technologists | 4 (16.0%) | 21 (84.0%) |
| Total (Category) | 91 (52.0%) | 84 (48.0%) |
| Total (Overall) | 378 (58.1%) | 273 (41.9%) |
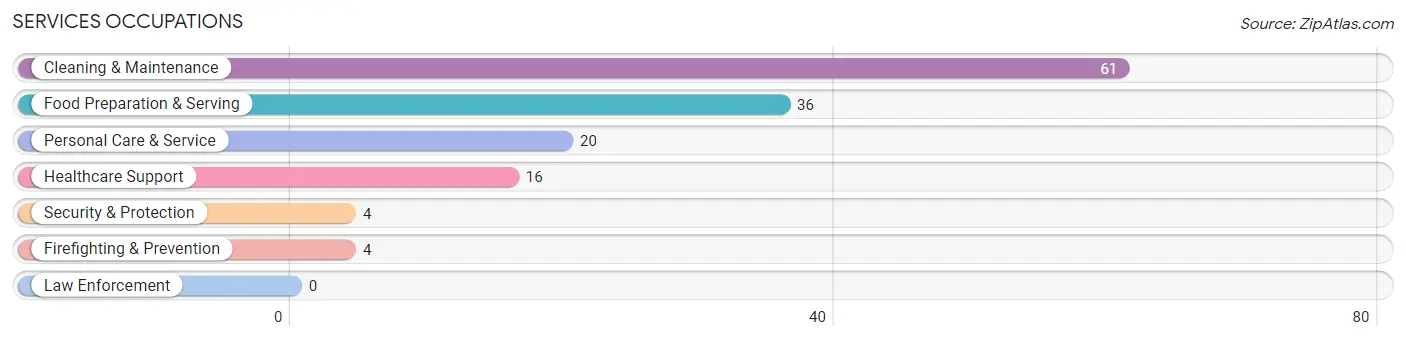
Services Occupations
The most common Services occupations in Edgerton are Cleaning & Maintenance (61 | 9.4%), Food Preparation & Serving (36 | 5.5%), Personal Care & Service (20 | 3.1%), Healthcare Support (16 | 2.5%), and Security & Protection (4 | 0.6%).
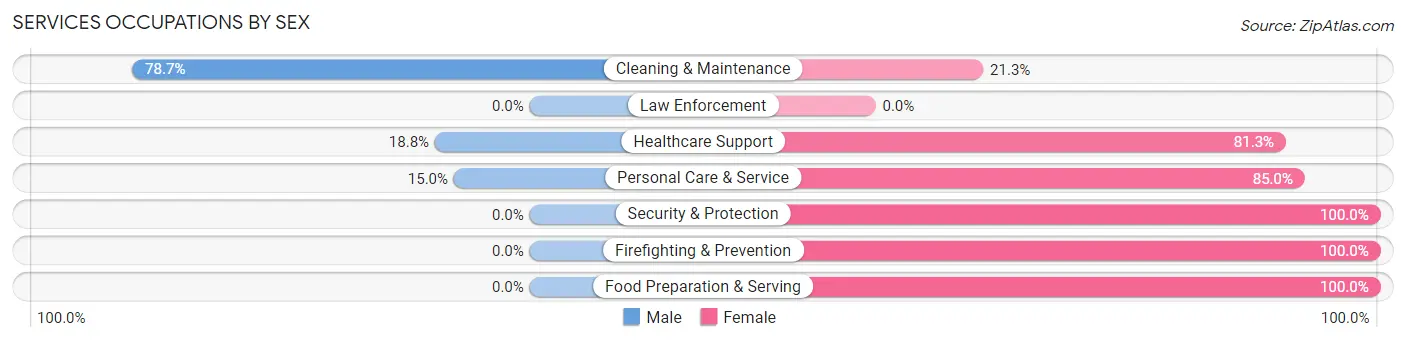
Services Occupations by Sex
Within the Services occupations in Edgerton, the most male-oriented occupations are Cleaning & Maintenance (78.7%), Healthcare Support (18.8%), and Personal Care & Service (15.0%), while the most female-oriented occupations are Security & Protection (100.0%), Firefighting & Prevention (100.0%), and Food Preparation & Serving (100.0%).
| Occupation | Male | Female |
| Healthcare Support | 3 (18.8%) | 13 (81.2%) |
| Security & Protection | 0 (0.0%) | 4 (100.0%) |
| Firefighting & Prevention | 0 (0.0%) | 4 (100.0%) |
| Law Enforcement | 0 (0.0%) | 0 (0.0%) |
| Food Preparation & Serving | 0 (0.0%) | 36 (100.0%) |
| Cleaning & Maintenance | 48 (78.7%) | 13 (21.3%) |
| Personal Care & Service | 3 (15.0%) | 17 (85.0%) |
| Total (Category) | 54 (39.4%) | 83 (60.6%) |
| Total (Overall) | 378 (58.1%) | 273 (41.9%) |
Sales and Office Occupations
The most common Sales and Office occupations in Edgerton are Office & Administration (64 | 9.8%), and Sales & Related (38 | 5.8%).
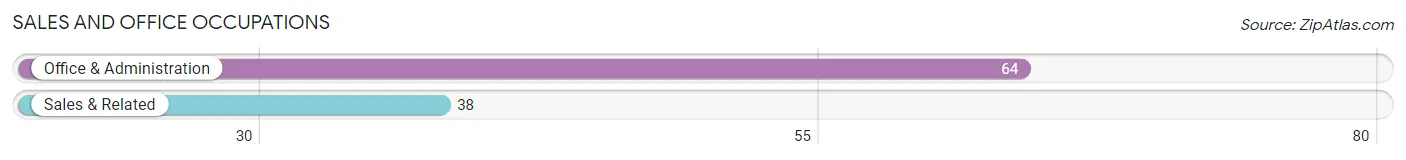
Sales and Office Occupations by Sex
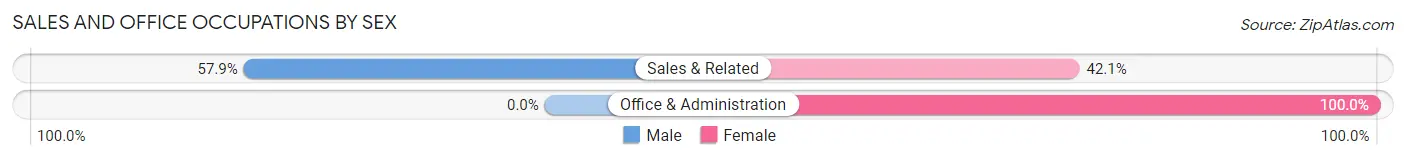
| Occupation | Male | Female |
| Sales & Related | 22 (57.9%) | 16 (42.1%) |
| Office & Administration | 0 (0.0%) | 64 (100.0%) |
| Total (Category) | 22 (21.6%) | 80 (78.4%) |
| Total (Overall) | 378 (58.1%) | 273 (41.9%) |
Natural Resources, Construction and Maintenance Occupations
The most common Natural Resources, Construction and Maintenance occupations in Edgerton are Construction & Extraction (58 | 8.9%), Installation, Maintenance & Repair (23 | 3.5%), and Farming, Fishing & Forestry (12 | 1.8%).
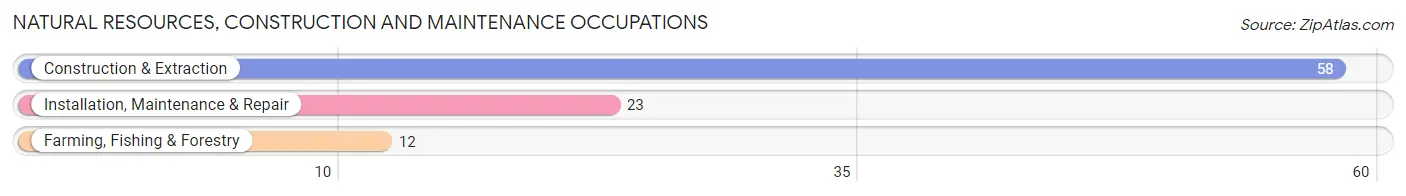
Natural Resources, Construction and Maintenance Occupations by Sex
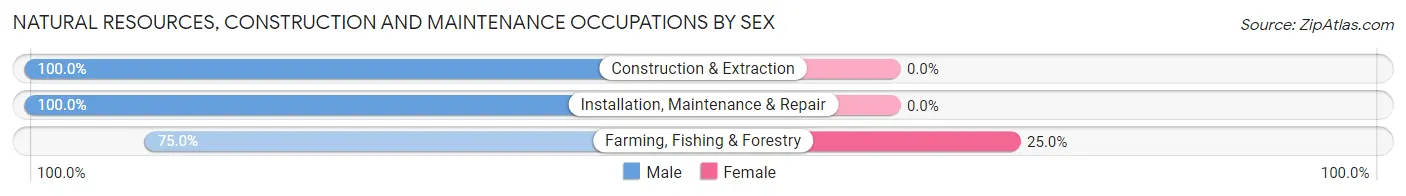
| Occupation | Male | Female |
| Farming, Fishing & Forestry | 9 (75.0%) | 3 (25.0%) |
| Construction & Extraction | 58 (100.0%) | 0 (0.0%) |
| Installation, Maintenance & Repair | 23 (100.0%) | 0 (0.0%) |
| Total (Category) | 90 (96.8%) | 3 (3.2%) |
| Total (Overall) | 378 (58.1%) | 273 (41.9%) |
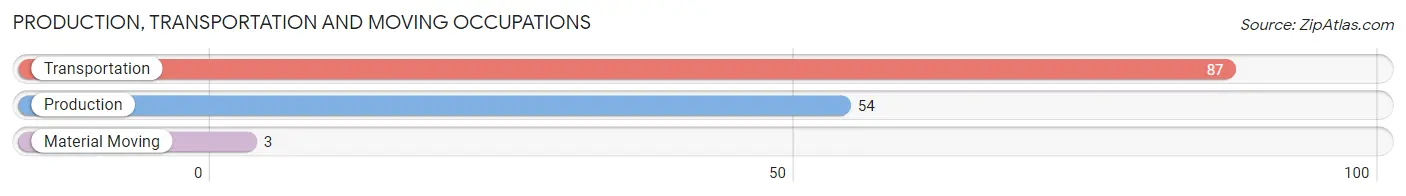
Production, Transportation and Moving Occupations
The most common Production, Transportation and Moving occupations in Edgerton are Transportation (87 | 13.4%), Production (54 | 8.3%), and Material Moving (3 | 0.5%).
Production, Transportation and Moving Occupations by Sex
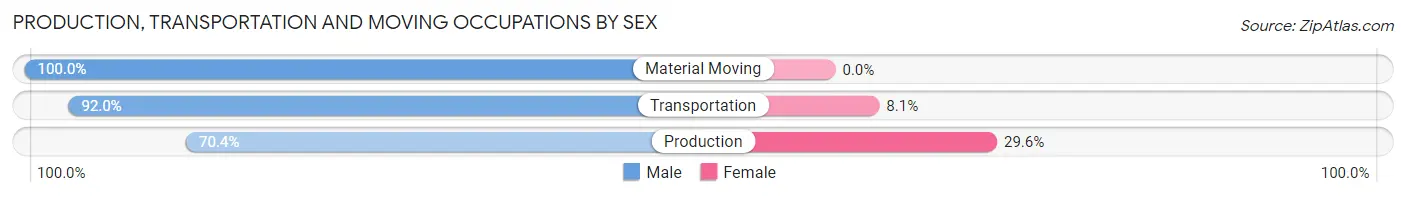
| Occupation | Male | Female |
| Production | 38 (70.4%) | 16 (29.6%) |
| Transportation | 80 (91.9%) | 7 (8.1%) |
| Material Moving | 3 (100.0%) | 0 (0.0%) |
| Total (Category) | 121 (84.0%) | 23 (16.0%) |
| Total (Overall) | 378 (58.1%) | 273 (41.9%) |
Employment Industries by Sex in Edgerton
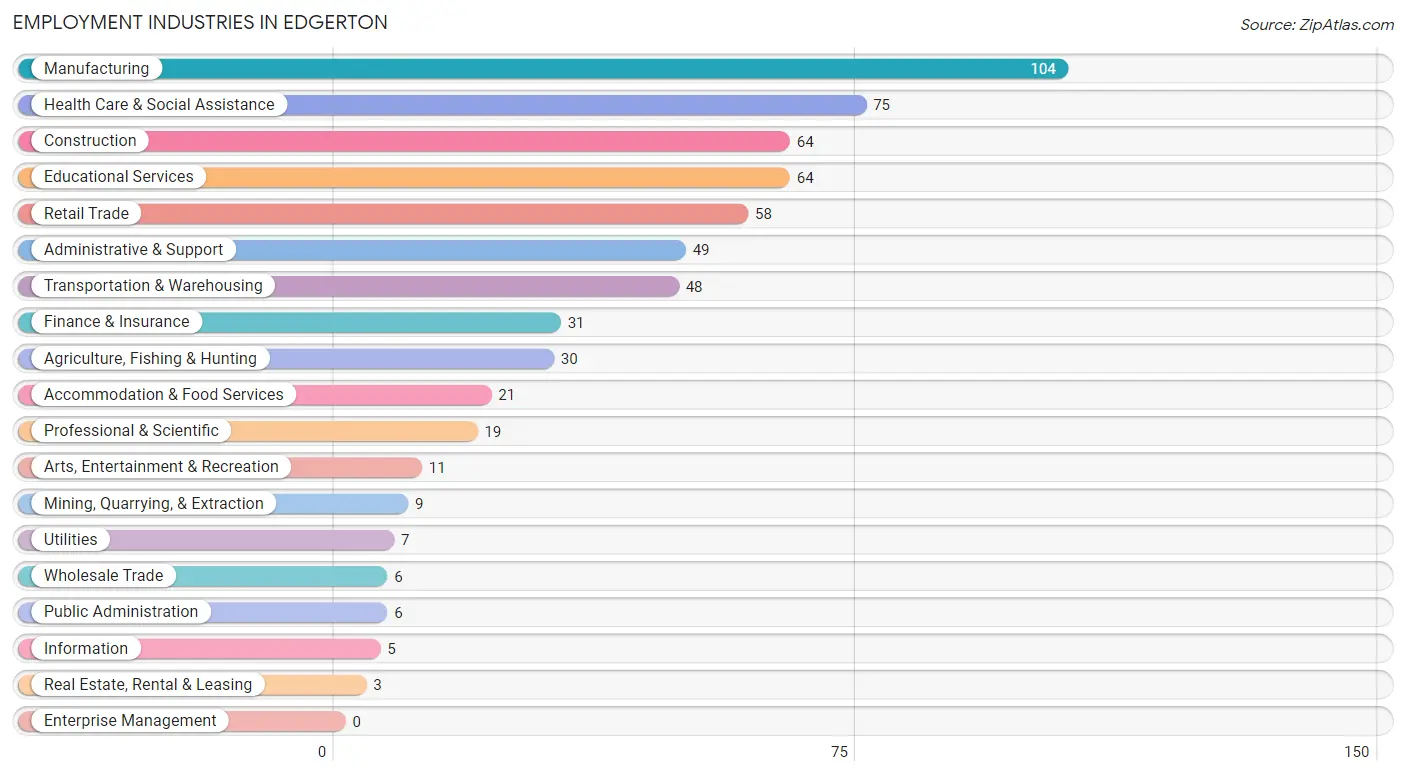
Employment Industries in Edgerton
The major employment industries in Edgerton include Manufacturing (104 | 16.0%), Health Care & Social Assistance (75 | 11.5%), Construction (64 | 9.8%), Educational Services (64 | 9.8%), and Retail Trade (58 | 8.9%).
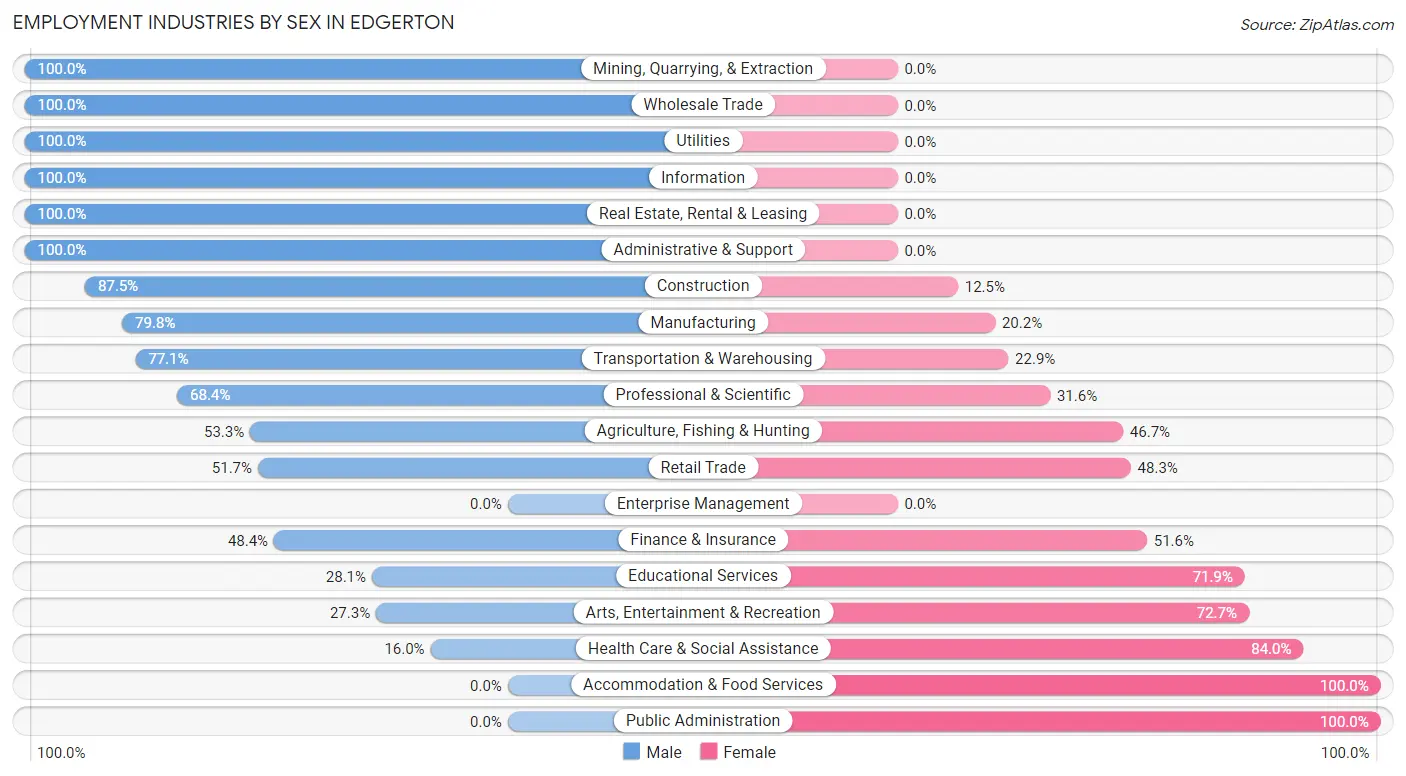
Employment Industries by Sex in Edgerton
The Edgerton industries that see more men than women are Mining, Quarrying, & Extraction (100.0%), Wholesale Trade (100.0%), and Utilities (100.0%), whereas the industries that tend to have a higher number of women are Accommodation & Food Services (100.0%), Public Administration (100.0%), and Health Care & Social Assistance (84.0%).
| Industry | Male | Female |
| Agriculture, Fishing & Hunting | 16 (53.3%) | 14 (46.7%) |
| Mining, Quarrying, & Extraction | 9 (100.0%) | 0 (0.0%) |
| Construction | 56 (87.5%) | 8 (12.5%) |
| Manufacturing | 83 (79.8%) | 21 (20.2%) |
| Wholesale Trade | 6 (100.0%) | 0 (0.0%) |
| Retail Trade | 30 (51.7%) | 28 (48.3%) |
| Transportation & Warehousing | 37 (77.1%) | 11 (22.9%) |
| Utilities | 7 (100.0%) | 0 (0.0%) |
| Information | 5 (100.0%) | 0 (0.0%) |
| Finance & Insurance | 15 (48.4%) | 16 (51.6%) |
| Real Estate, Rental & Leasing | 3 (100.0%) | 0 (0.0%) |
| Professional & Scientific | 13 (68.4%) | 6 (31.6%) |
| Enterprise Management | 0 (0.0%) | 0 (0.0%) |
| Administrative & Support | 49 (100.0%) | 0 (0.0%) |
| Educational Services | 18 (28.1%) | 46 (71.9%) |
| Health Care & Social Assistance | 12 (16.0%) | 63 (84.0%) |
| Arts, Entertainment & Recreation | 3 (27.3%) | 8 (72.7%) |
| Accommodation & Food Services | 0 (0.0%) | 21 (100.0%) |
| Public Administration | 0 (0.0%) | 6 (100.0%) |
| Total | 378 (58.1%) | 273 (41.9%) |
Education in Edgerton
School Enrollment in Edgerton
The most common levels of schooling among the 267 students in Edgerton are high school (71 | 26.6%), elementary school (70 | 26.2%), and middle school (67 | 25.1%).
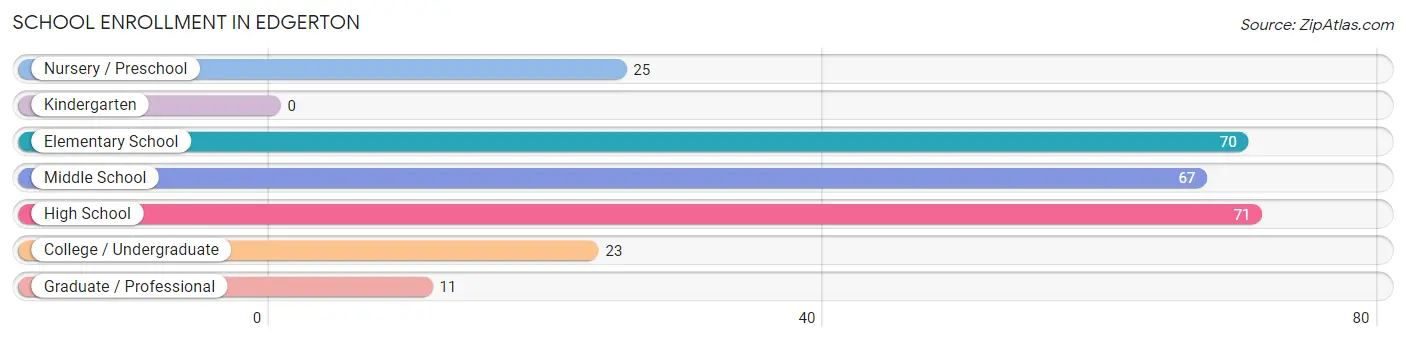
| School Level | # Students | % Students |
| Nursery / Preschool | 25 | 9.4% |
| Kindergarten | 0 | 0.0% |
| Elementary School | 70 | 26.2% |
| Middle School | 67 | 25.1% |
| High School | 71 | 26.6% |
| College / Undergraduate | 23 | 8.6% |
| Graduate / Professional | 11 | 4.1% |
| Total | 267 | 100.0% |
School Enrollment by Age by Funding Source in Edgerton
Out of a total of 267 students who are enrolled in schools in Edgerton, 107 (40.1%) attend a private institution, while the remaining 160 (59.9%) are enrolled in public schools. The age group of 25 to 34 year olds has the highest likelihood of being enrolled in private schools, with 4 (100.0% in the age bracket) enrolled. Conversely, the age group of 20 to 24 year olds has the lowest likelihood of being enrolled in a private school, with 7 (100.0% in the age bracket) attending a public institution.
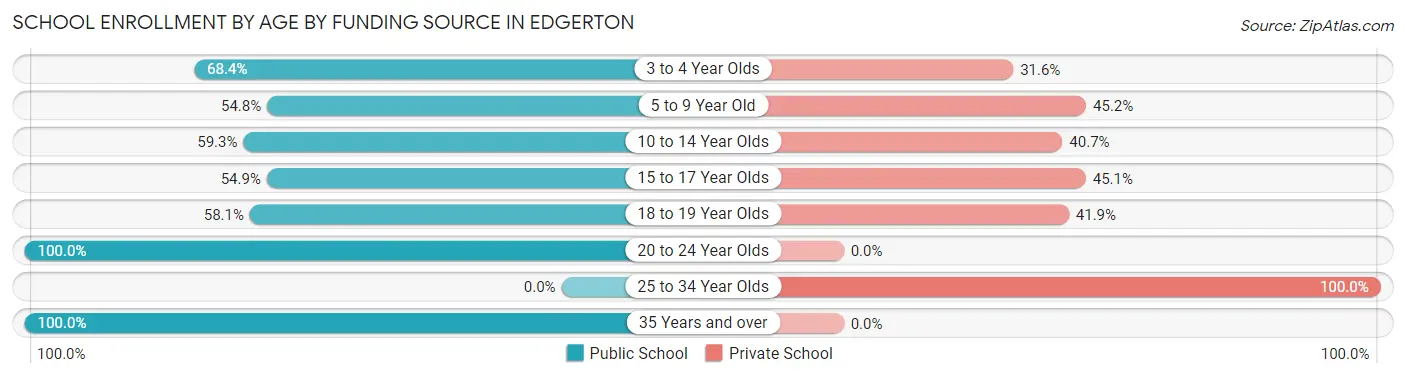
| Age Bracket | Public School | Private School |
| 3 to 4 Year Olds | 13 (68.4%) | 6 (31.6%) |
| 5 to 9 Year Old | 34 (54.8%) | 28 (45.2%) |
| 10 to 14 Year Olds | 48 (59.3%) | 33 (40.7%) |
| 15 to 17 Year Olds | 28 (54.9%) | 23 (45.1%) |
| 18 to 19 Year Olds | 18 (58.1%) | 13 (41.9%) |
| 20 to 24 Year Olds | 7 (100.0%) | 0 (0.0%) |
| 25 to 34 Year Olds | 0 (0.0%) | 4 (100.0%) |
| 35 Years and over | 12 (100.0%) | 0 (0.0%) |
| Total | 160 (59.9%) | 107 (40.1%) |
Educational Attainment by Field of Study in Edgerton
Education (99 | 36.9%), business (45 | 16.8%), science & technology (34 | 12.7%), bio, nature & agricultural (24 | 9.0%), and liberal arts & history (14 | 5.2%) are the most common fields of study among 268 individuals in Edgerton who have obtained a bachelor's degree or higher.
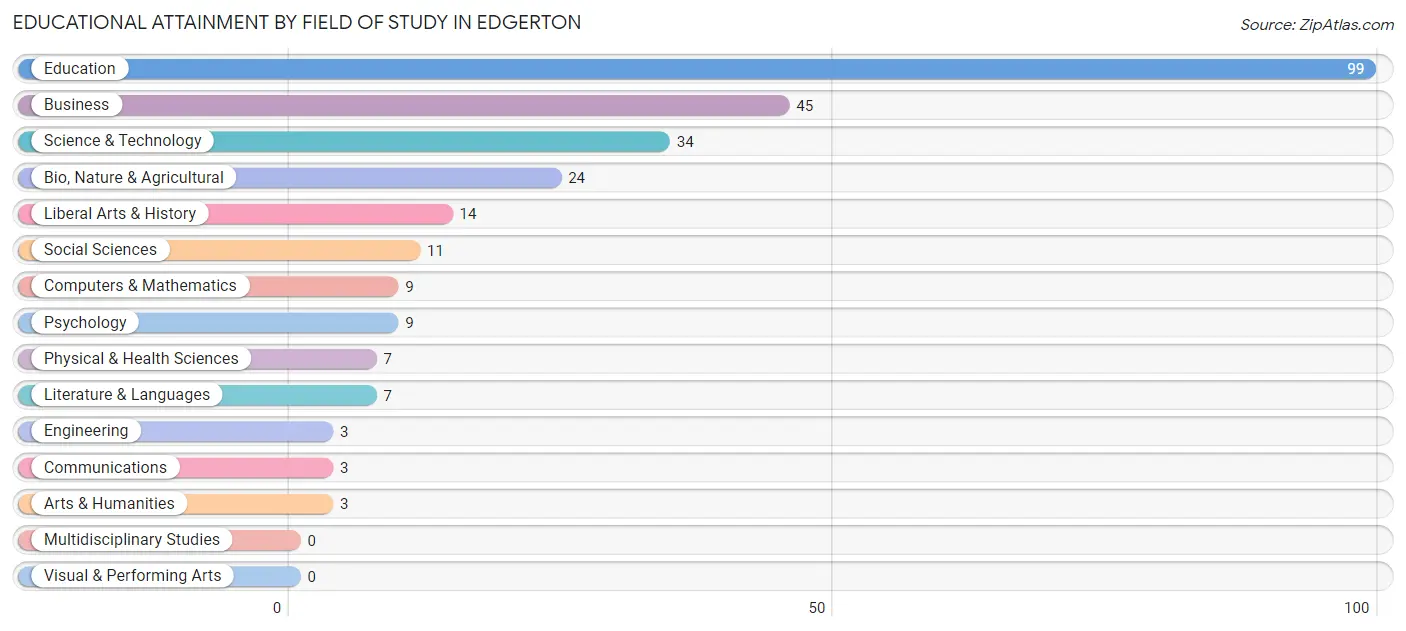
| Field of Study | # Graduates | % Graduates |
| Computers & Mathematics | 9 | 3.4% |
| Bio, Nature & Agricultural | 24 | 9.0% |
| Physical & Health Sciences | 7 | 2.6% |
| Psychology | 9 | 3.4% |
| Social Sciences | 11 | 4.1% |
| Engineering | 3 | 1.1% |
| Multidisciplinary Studies | 0 | 0.0% |
| Science & Technology | 34 | 12.7% |
| Business | 45 | 16.8% |
| Education | 99 | 36.9% |
| Literature & Languages | 7 | 2.6% |
| Liberal Arts & History | 14 | 5.2% |
| Visual & Performing Arts | 0 | 0.0% |
| Communications | 3 | 1.1% |
| Arts & Humanities | 3 | 1.1% |
| Total | 268 | 100.0% |
Transportation & Commute in Edgerton
Vehicle Availability by Sex in Edgerton
The most prevalent vehicle ownership categories in Edgerton are males with 2 vehicles (160, accounting for 43.1%) and females with 2 vehicles (115, making up 61.3%).
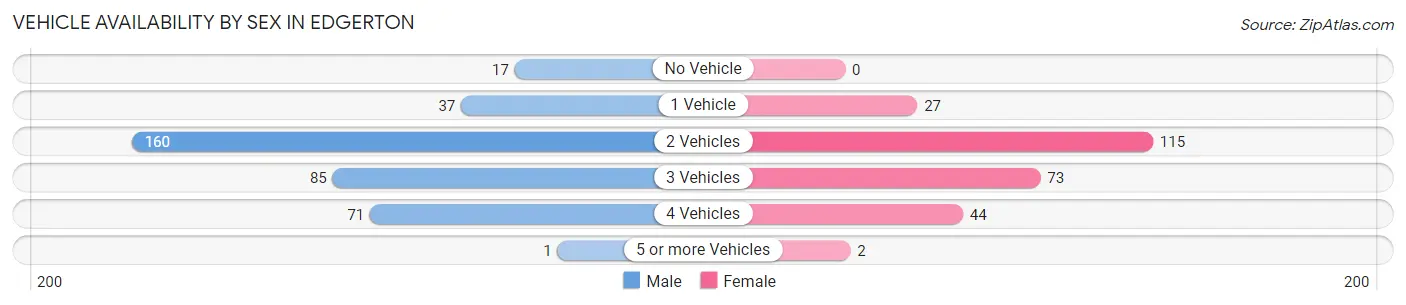
| Vehicles Available | Male | Female |
| No Vehicle | 17 (4.6%) | 0 (0.0%) |
| 1 Vehicle | 37 (10.0%) | 27 (10.3%) |
| 2 Vehicles | 160 (43.1%) | 115 (44.1%) |
| 3 Vehicles | 85 (22.9%) | 73 (28.0%) |
| 4 Vehicles | 71 (19.1%) | 44 (16.9%) |
| 5 or more Vehicles | 1 (0.3%) | 2 (0.8%) |
| Total | 371 (100.0%) | 261 (100.0%) |
Commute Time in Edgerton
The most frequently occuring commute durations in Edgerton are less than 5 minutes (178 commuters, 29.4%), 5 to 9 minutes (157 commuters, 25.9%), and 20 to 24 minutes (122 commuters, 20.1%).
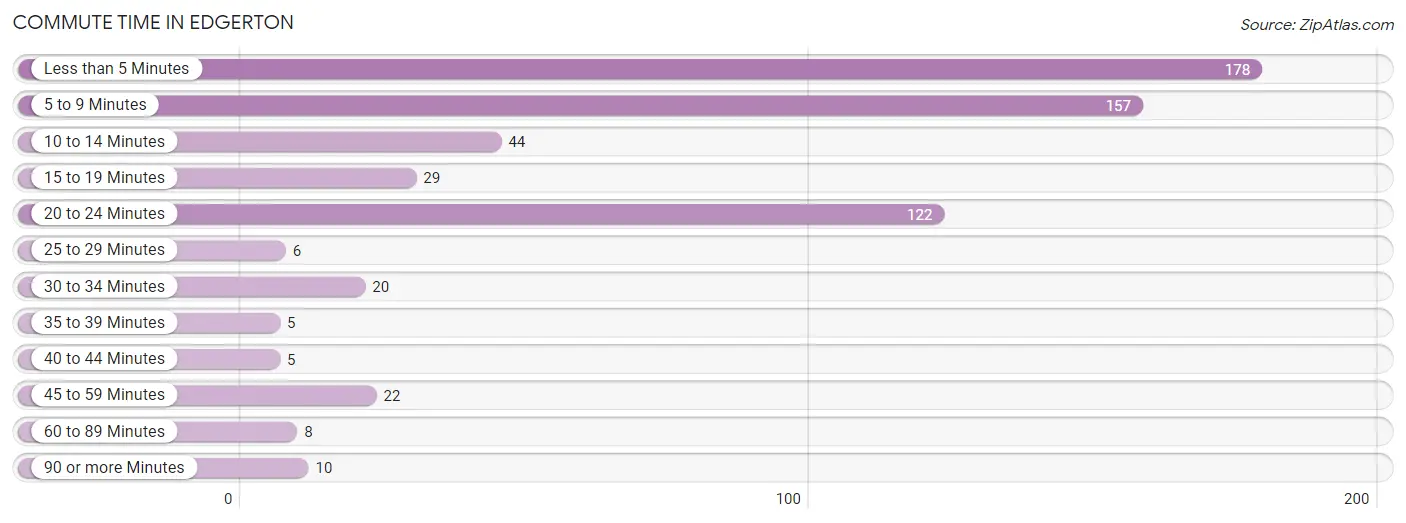
| Commute Time | # Commuters | % Commuters |
| Less than 5 Minutes | 178 | 29.4% |
| 5 to 9 Minutes | 157 | 25.9% |
| 10 to 14 Minutes | 44 | 7.3% |
| 15 to 19 Minutes | 29 | 4.8% |
| 20 to 24 Minutes | 122 | 20.1% |
| 25 to 29 Minutes | 6 | 1.0% |
| 30 to 34 Minutes | 20 | 3.3% |
| 35 to 39 Minutes | 5 | 0.8% |
| 40 to 44 Minutes | 5 | 0.8% |
| 45 to 59 Minutes | 22 | 3.6% |
| 60 to 89 Minutes | 8 | 1.3% |
| 90 or more Minutes | 10 | 1.7% |
Commute Time by Sex in Edgerton
The most common commute times in Edgerton are 5 to 9 minutes (100 commuters, 27.6%) for males and less than 5 minutes (101 commuters, 41.4%) for females.
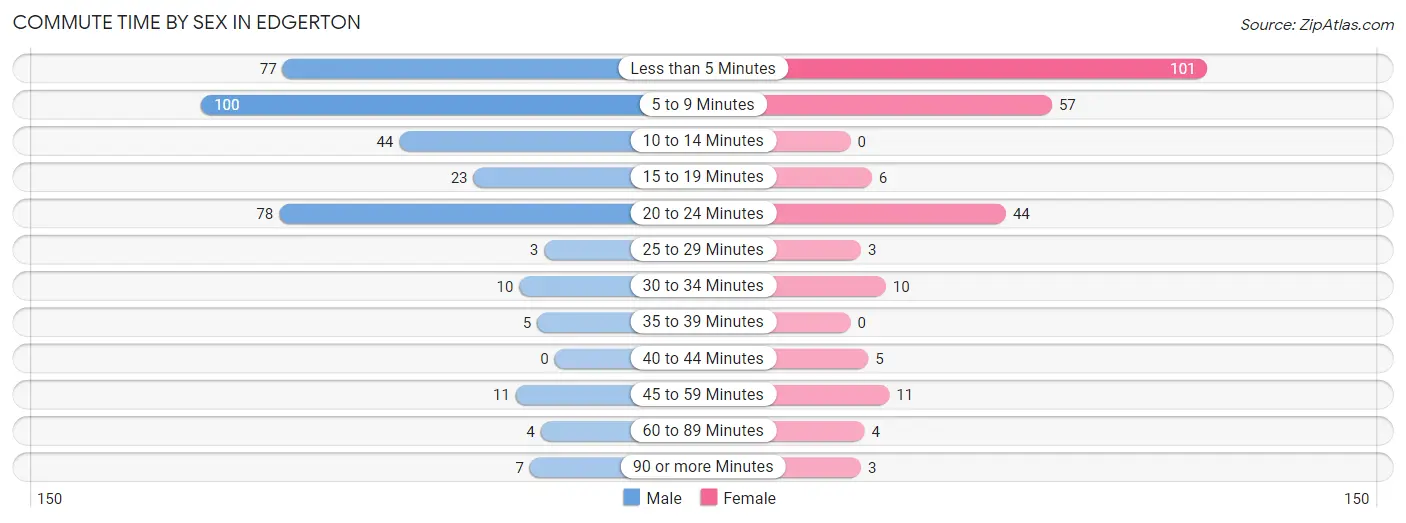
| Commute Time | Male | Female |
| Less than 5 Minutes | 77 (21.3%) | 101 (41.4%) |
| 5 to 9 Minutes | 100 (27.6%) | 57 (23.4%) |
| 10 to 14 Minutes | 44 (12.1%) | 0 (0.0%) |
| 15 to 19 Minutes | 23 (6.4%) | 6 (2.5%) |
| 20 to 24 Minutes | 78 (21.5%) | 44 (18.0%) |
| 25 to 29 Minutes | 3 (0.8%) | 3 (1.2%) |
| 30 to 34 Minutes | 10 (2.8%) | 10 (4.1%) |
| 35 to 39 Minutes | 5 (1.4%) | 0 (0.0%) |
| 40 to 44 Minutes | 0 (0.0%) | 5 (2.1%) |
| 45 to 59 Minutes | 11 (3.0%) | 11 (4.5%) |
| 60 to 89 Minutes | 4 (1.1%) | 4 (1.6%) |
| 90 or more Minutes | 7 (1.9%) | 3 (1.2%) |
Time of Departure to Work by Sex in Edgerton
The most frequent times of departure to work in Edgerton are 7:30 AM to 7:59 AM (86, 23.8%) for males and 7:30 AM to 7:59 AM (53, 21.7%) for females.
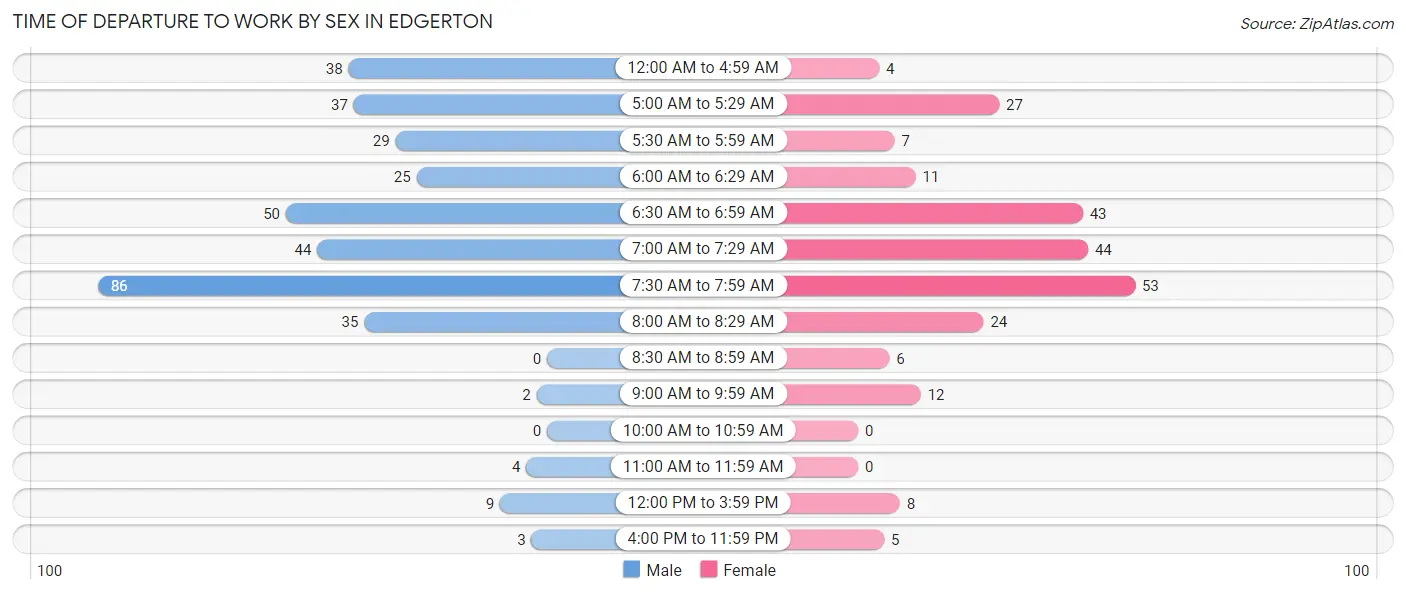
| Time of Departure | Male | Female |
| 12:00 AM to 4:59 AM | 38 (10.5%) | 4 (1.6%) |
| 5:00 AM to 5:29 AM | 37 (10.2%) | 27 (11.1%) |
| 5:30 AM to 5:59 AM | 29 (8.0%) | 7 (2.9%) |
| 6:00 AM to 6:29 AM | 25 (6.9%) | 11 (4.5%) |
| 6:30 AM to 6:59 AM | 50 (13.8%) | 43 (17.6%) |
| 7:00 AM to 7:29 AM | 44 (12.1%) | 44 (18.0%) |
| 7:30 AM to 7:59 AM | 86 (23.8%) | 53 (21.7%) |
| 8:00 AM to 8:29 AM | 35 (9.7%) | 24 (9.8%) |
| 8:30 AM to 8:59 AM | 0 (0.0%) | 6 (2.5%) |
| 9:00 AM to 9:59 AM | 2 (0.5%) | 12 (4.9%) |
| 10:00 AM to 10:59 AM | 0 (0.0%) | 0 (0.0%) |
| 11:00 AM to 11:59 AM | 4 (1.1%) | 0 (0.0%) |
| 12:00 PM to 3:59 PM | 9 (2.5%) | 8 (3.3%) |
| 4:00 PM to 11:59 PM | 3 (0.8%) | 5 (2.1%) |
| Total | 362 (100.0%) | 244 (100.0%) |
Housing Occupancy in Edgerton
Occupancy by Ownership in Edgerton
Of the total 534 dwellings in Edgerton, owner-occupied units account for 447 (83.7%), while renter-occupied units make up 87 (16.3%).
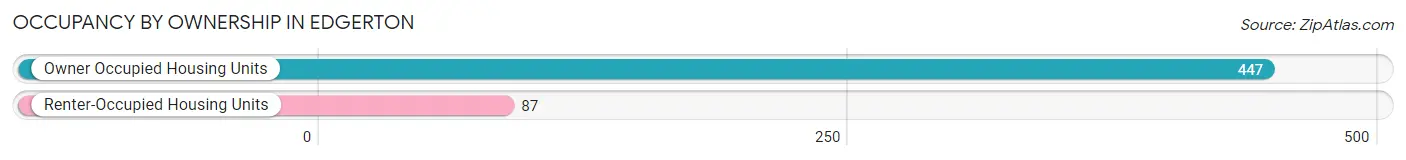
| Occupancy | # Housing Units | % Housing Units |
| Owner Occupied Housing Units | 447 | 83.7% |
| Renter-Occupied Housing Units | 87 | 16.3% |
| Total Occupied Housing Units | 534 | 100.0% |
Occupancy by Household Size in Edgerton
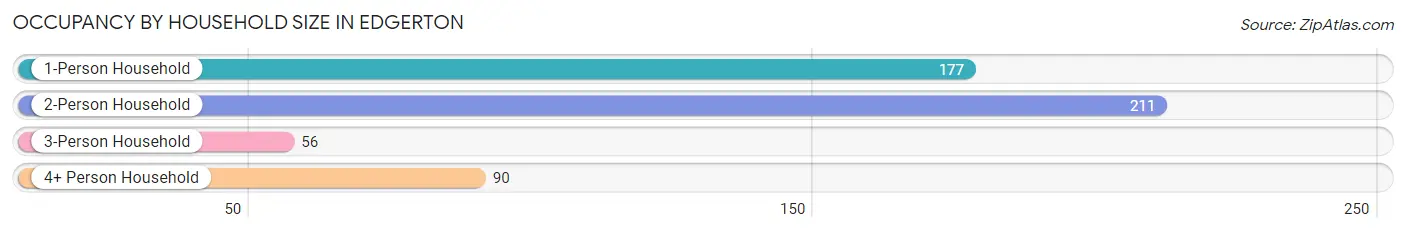
| Household Size | # Housing Units | % Housing Units |
| 1-Person Household | 177 | 33.2% |
| 2-Person Household | 211 | 39.5% |
| 3-Person Household | 56 | 10.5% |
| 4+ Person Household | 90 | 16.9% |
| Total Housing Units | 534 | 100.0% |
Occupancy by Ownership by Household Size in Edgerton
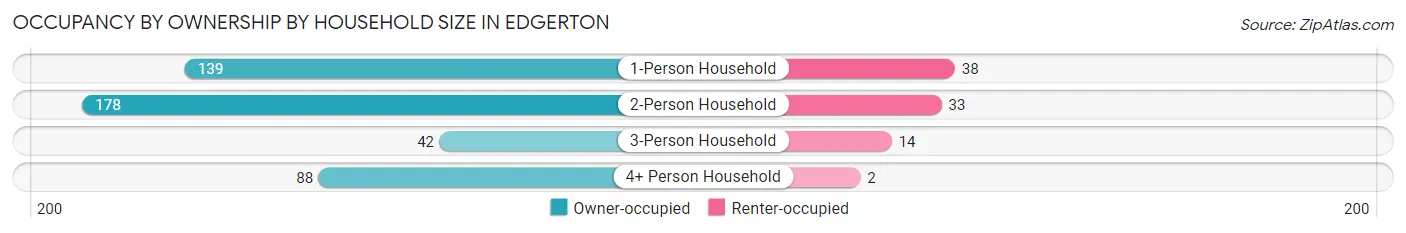
| Household Size | Owner-occupied | Renter-occupied |
| 1-Person Household | 139 (78.5%) | 38 (21.5%) |
| 2-Person Household | 178 (84.4%) | 33 (15.6%) |
| 3-Person Household | 42 (75.0%) | 14 (25.0%) |
| 4+ Person Household | 88 (97.8%) | 2 (2.2%) |
| Total Housing Units | 447 (83.7%) | 87 (16.3%) |
Occupancy by Educational Attainment in Edgerton
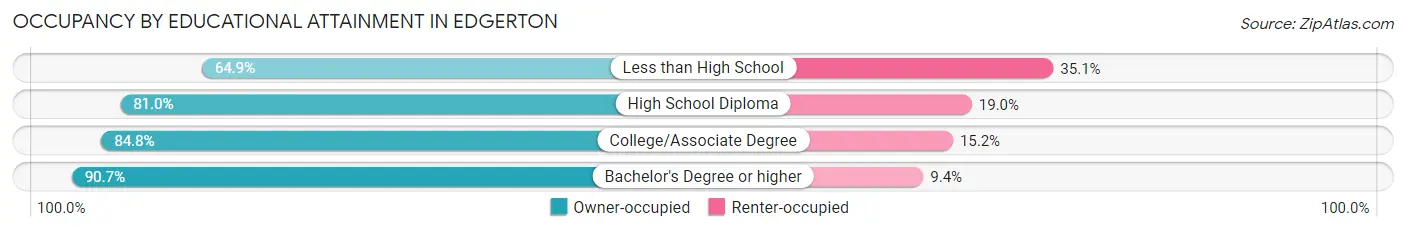
| Household Size | Owner-occupied | Renter-occupied |
| Less than High School | 24 (64.9%) | 13 (35.1%) |
| High School Diploma | 141 (81.0%) | 33 (19.0%) |
| College/Associate Degree | 156 (84.8%) | 28 (15.2%) |
| Bachelor's Degree or higher | 126 (90.6%) | 13 (9.3%) |
Occupancy by Age of Householder in Edgerton
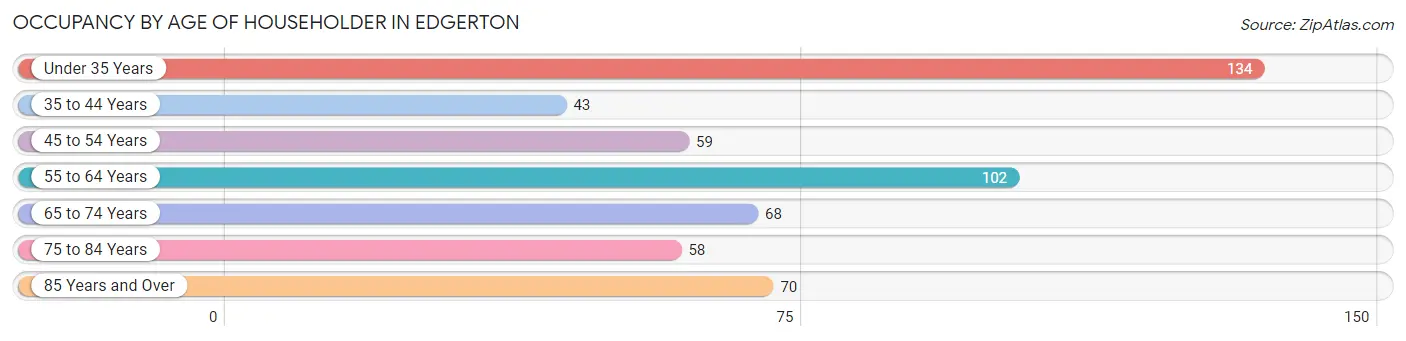
| Age Bracket | # Households | % Households |
| Under 35 Years | 134 | 25.1% |
| 35 to 44 Years | 43 | 8.1% |
| 45 to 54 Years | 59 | 11.1% |
| 55 to 64 Years | 102 | 19.1% |
| 65 to 74 Years | 68 | 12.7% |
| 75 to 84 Years | 58 | 10.9% |
| 85 Years and Over | 70 | 13.1% |
| Total | 534 | 100.0% |
Housing Finances in Edgerton
Median Income by Occupancy in Edgerton
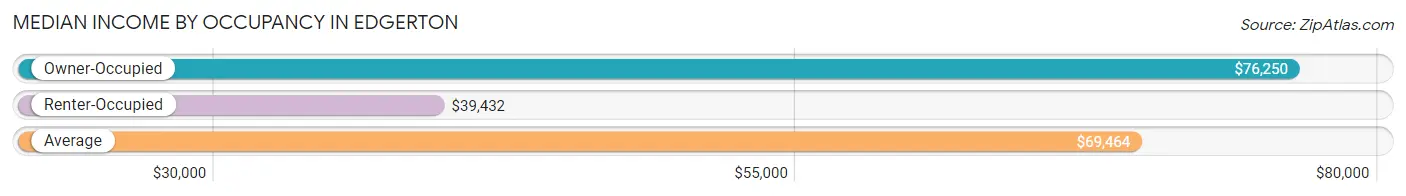
| Occupancy Type | # Households | Median Income |
| Owner-Occupied | 447 (83.7%) | $76,250 |
| Renter-Occupied | 87 (16.3%) | $39,432 |
| Average | 534 (100.0%) | $69,464 |
Occupancy by Householder Income Bracket in Edgerton
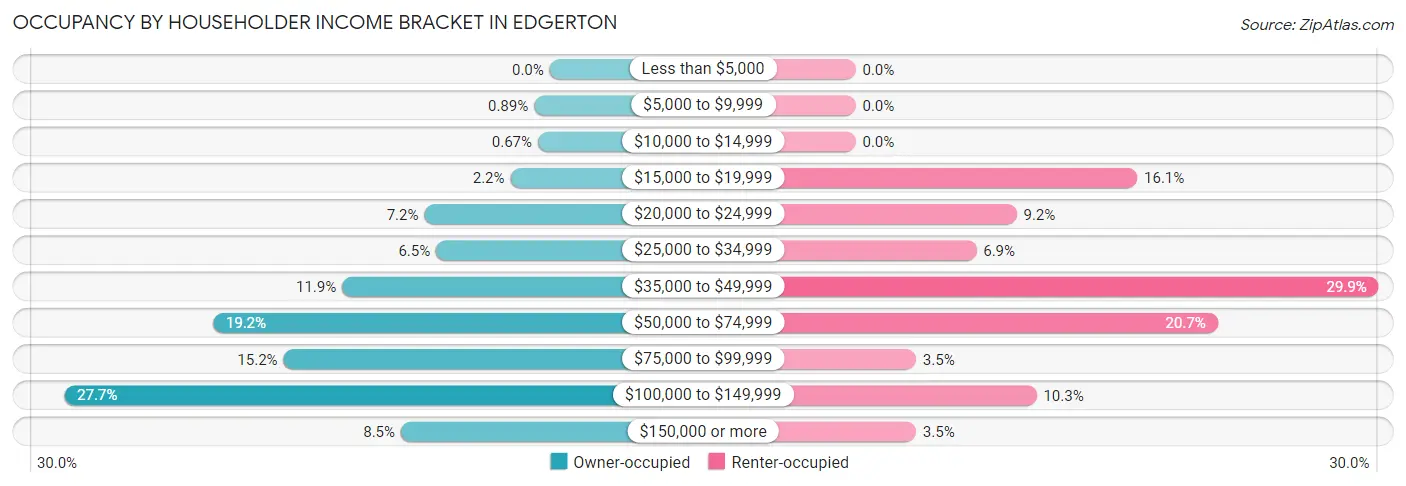
| Income Bracket | Owner-occupied | Renter-occupied |
| Less than $5,000 | 0 (0.0%) | 0 (0.0%) |
| $5,000 to $9,999 | 4 (0.9%) | 0 (0.0%) |
| $10,000 to $14,999 | 3 (0.7%) | 0 (0.0%) |
| $15,000 to $19,999 | 10 (2.2%) | 14 (16.1%) |
| $20,000 to $24,999 | 32 (7.2%) | 8 (9.2%) |
| $25,000 to $34,999 | 29 (6.5%) | 6 (6.9%) |
| $35,000 to $49,999 | 53 (11.9%) | 26 (29.9%) |
| $50,000 to $74,999 | 86 (19.2%) | 18 (20.7%) |
| $75,000 to $99,999 | 68 (15.2%) | 3 (3.5%) |
| $100,000 to $149,999 | 124 (27.7%) | 9 (10.3%) |
| $150,000 or more | 38 (8.5%) | 3 (3.5%) |
| Total | 447 (100.0%) | 87 (100.0%) |
Monthly Housing Cost Tiers in Edgerton
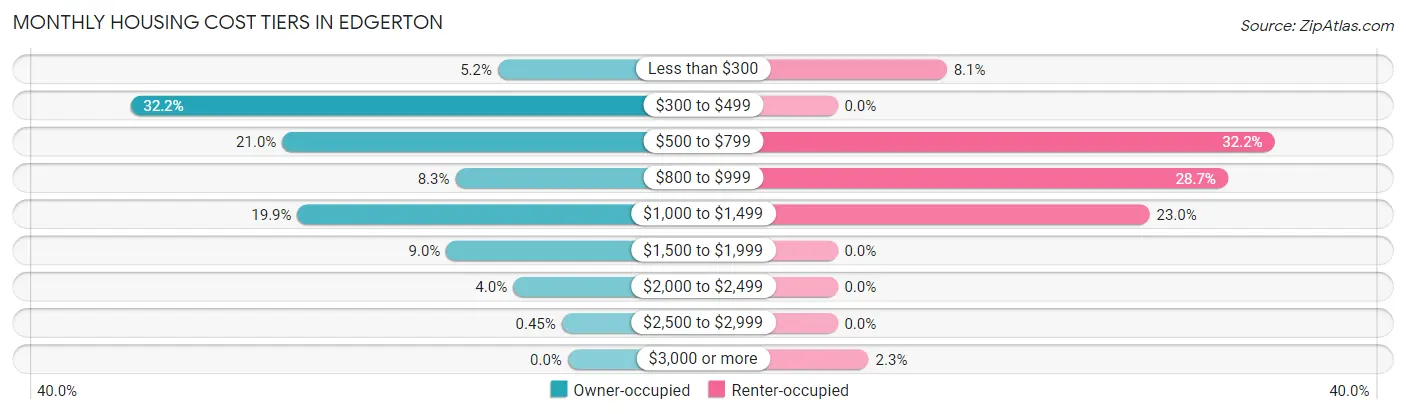
| Monthly Cost | Owner-occupied | Renter-occupied |
| Less than $300 | 23 (5.1%) | 7 (8.1%) |
| $300 to $499 | 144 (32.2%) | 0 (0.0%) |
| $500 to $799 | 94 (21.0%) | 28 (32.2%) |
| $800 to $999 | 37 (8.3%) | 25 (28.7%) |
| $1,000 to $1,499 | 89 (19.9%) | 20 (23.0%) |
| $1,500 to $1,999 | 40 (8.9%) | 0 (0.0%) |
| $2,000 to $2,499 | 18 (4.0%) | 0 (0.0%) |
| $2,500 to $2,999 | 2 (0.4%) | 0 (0.0%) |
| $3,000 or more | 0 (0.0%) | 2 (2.3%) |
| Total | 447 (100.0%) | 87 (100.0%) |
Physical Housing Characteristics in Edgerton
Housing Structures in Edgerton
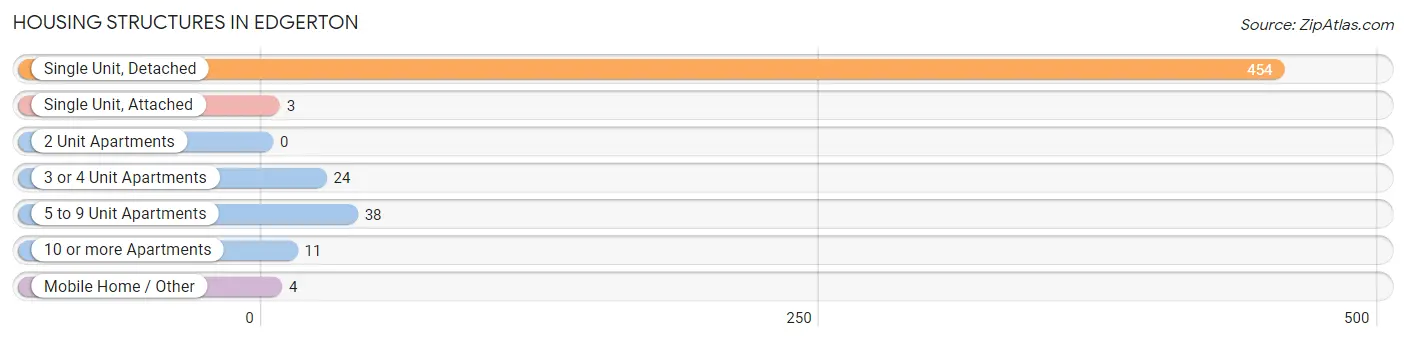
| Structure Type | # Housing Units | % Housing Units |
| Single Unit, Detached | 454 | 85.0% |
| Single Unit, Attached | 3 | 0.6% |
| 2 Unit Apartments | 0 | 0.0% |
| 3 or 4 Unit Apartments | 24 | 4.5% |
| 5 to 9 Unit Apartments | 38 | 7.1% |
| 10 or more Apartments | 11 | 2.1% |
| Mobile Home / Other | 4 | 0.7% |
| Total | 534 | 100.0% |
Housing Structures by Occupancy in Edgerton
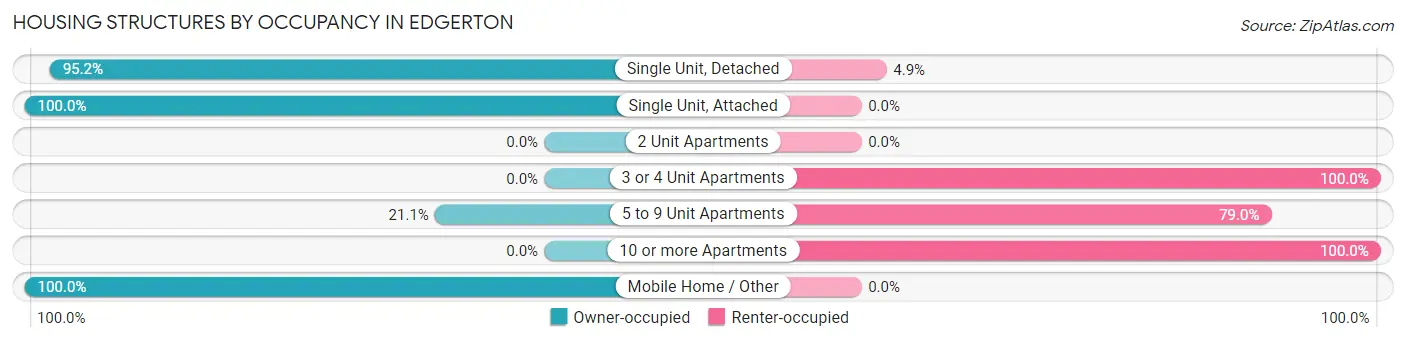
| Structure Type | Owner-occupied | Renter-occupied |
| Single Unit, Detached | 432 (95.2%) | 22 (4.9%) |
| Single Unit, Attached | 3 (100.0%) | 0 (0.0%) |
| 2 Unit Apartments | 0 (0.0%) | 0 (0.0%) |
| 3 or 4 Unit Apartments | 0 (0.0%) | 24 (100.0%) |
| 5 to 9 Unit Apartments | 8 (21.0%) | 30 (78.9%) |
| 10 or more Apartments | 0 (0.0%) | 11 (100.0%) |
| Mobile Home / Other | 4 (100.0%) | 0 (0.0%) |
| Total | 447 (83.7%) | 87 (16.3%) |
Housing Structures by Number of Rooms in Edgerton
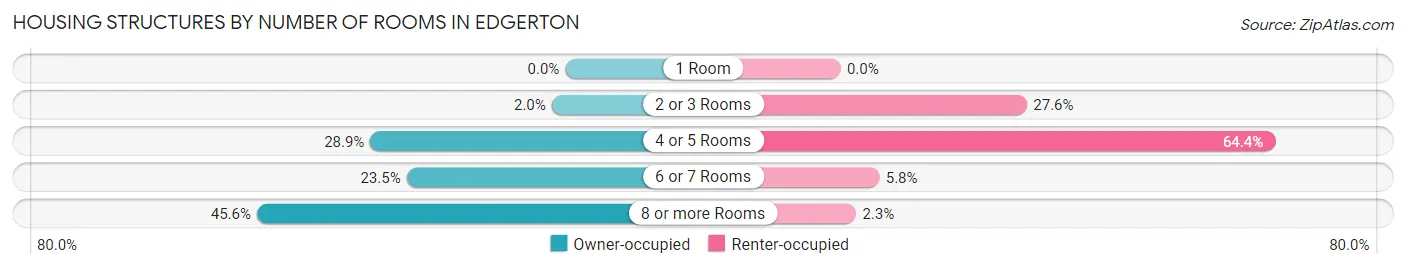
| Number of Rooms | Owner-occupied | Renter-occupied |
| 1 Room | 0 (0.0%) | 0 (0.0%) |
| 2 or 3 Rooms | 9 (2.0%) | 24 (27.6%) |
| 4 or 5 Rooms | 129 (28.9%) | 56 (64.4%) |
| 6 or 7 Rooms | 105 (23.5%) | 5 (5.8%) |
| 8 or more Rooms | 204 (45.6%) | 2 (2.3%) |
| Total | 447 (100.0%) | 87 (100.0%) |
Housing Structure by Heating Type in Edgerton
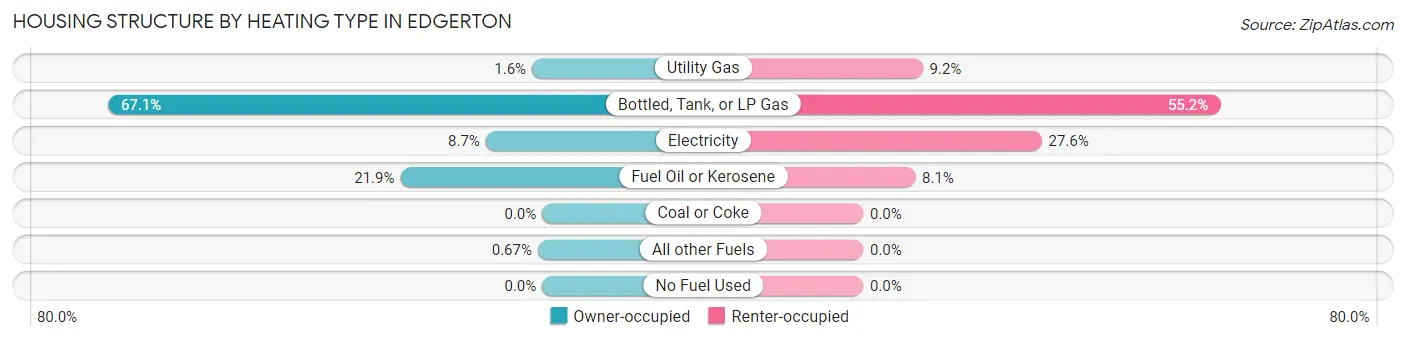
| Heating Type | Owner-occupied | Renter-occupied |
| Utility Gas | 7 (1.6%) | 8 (9.2%) |
| Bottled, Tank, or LP Gas | 300 (67.1%) | 48 (55.2%) |
| Electricity | 39 (8.7%) | 24 (27.6%) |
| Fuel Oil or Kerosene | 98 (21.9%) | 7 (8.1%) |
| Coal or Coke | 0 (0.0%) | 0 (0.0%) |
| All other Fuels | 3 (0.7%) | 0 (0.0%) |
| No Fuel Used | 0 (0.0%) | 0 (0.0%) |
| Total | 447 (100.0%) | 87 (100.0%) |
Household Vehicle Usage in Edgerton
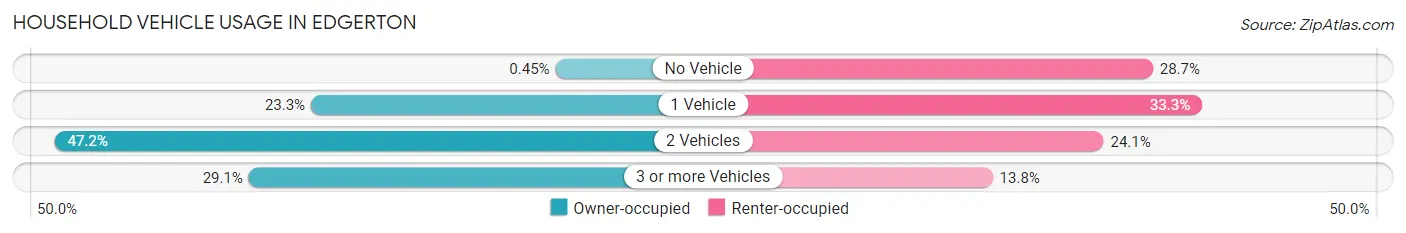
| Vehicles per Household | Owner-occupied | Renter-occupied |
| No Vehicle | 2 (0.4%) | 25 (28.7%) |
| 1 Vehicle | 104 (23.3%) | 29 (33.3%) |
| 2 Vehicles | 211 (47.2%) | 21 (24.1%) |
| 3 or more Vehicles | 130 (29.1%) | 12 (13.8%) |
| Total | 447 (100.0%) | 87 (100.0%) |
Real Estate & Mortgages in Edgerton
Real Estate and Mortgage Overview in Edgerton
| Characteristic | Without Mortgage | With Mortgage |
| Housing Units | 234 | 213 |
| Median Property Value | $115,000 | $127,200 |
| Median Household Income | $60,833 | $22 |
| Monthly Housing Costs | $460 | $0 |
| Real Estate Taxes | $1,212 | $0 |
Property Value by Mortgage Status in Edgerton
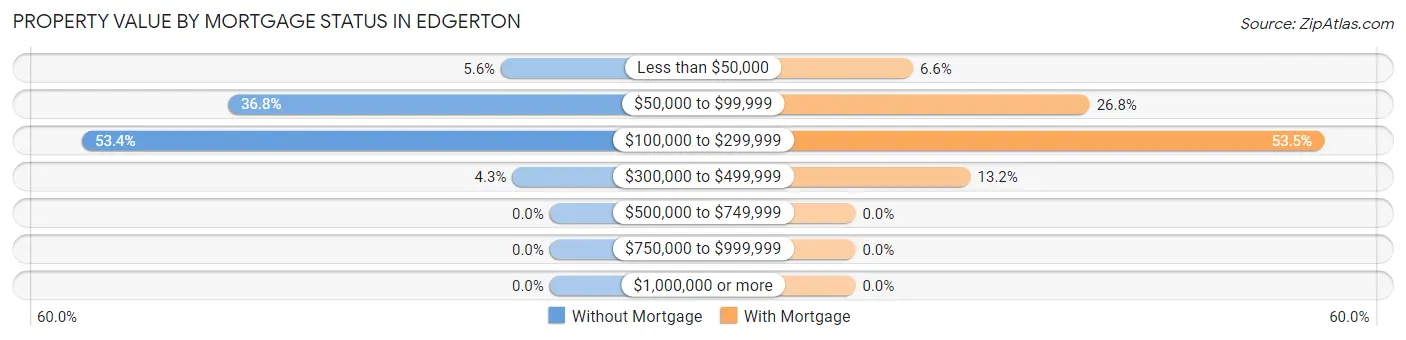
| Property Value | Without Mortgage | With Mortgage |
| Less than $50,000 | 13 (5.6%) | 14 (6.6%) |
| $50,000 to $99,999 | 86 (36.7%) | 57 (26.8%) |
| $100,000 to $299,999 | 125 (53.4%) | 114 (53.5%) |
| $300,000 to $499,999 | 10 (4.3%) | 28 (13.2%) |
| $500,000 to $749,999 | 0 (0.0%) | 0 (0.0%) |
| $750,000 to $999,999 | 0 (0.0%) | 0 (0.0%) |
| $1,000,000 or more | 0 (0.0%) | 0 (0.0%) |
| Total | 234 (100.0%) | 213 (100.0%) |
Household Income by Mortgage Status in Edgerton
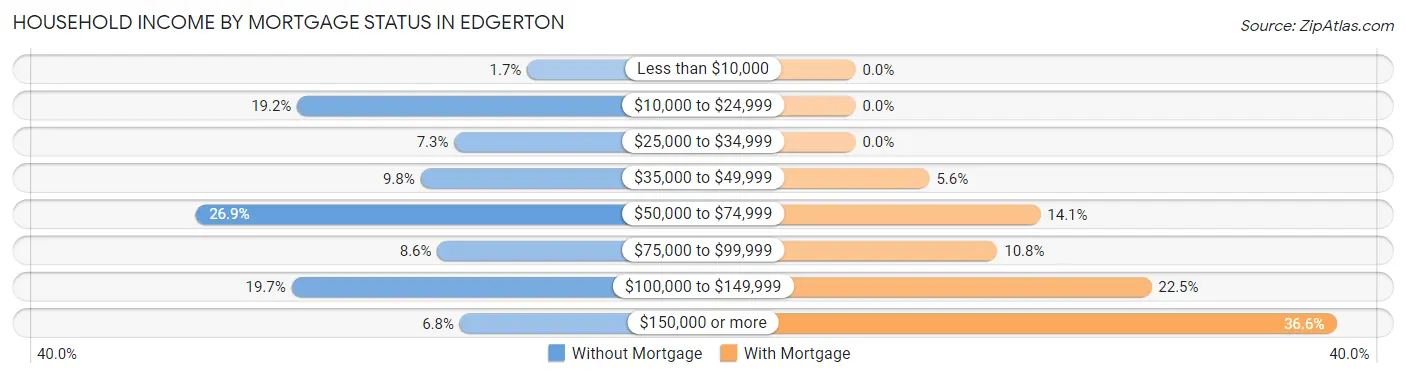
| Household Income | Without Mortgage | With Mortgage |
| Less than $10,000 | 4 (1.7%) | 0 (0.0%) |
| $10,000 to $24,999 | 45 (19.2%) | 0 (0.0%) |
| $25,000 to $34,999 | 17 (7.3%) | 0 (0.0%) |
| $35,000 to $49,999 | 23 (9.8%) | 12 (5.6%) |
| $50,000 to $74,999 | 63 (26.9%) | 30 (14.1%) |
| $75,000 to $99,999 | 20 (8.6%) | 23 (10.8%) |
| $100,000 to $149,999 | 46 (19.7%) | 48 (22.5%) |
| $150,000 or more | 16 (6.8%) | 78 (36.6%) |
| Total | 234 (100.0%) | 213 (100.0%) |
Property Value to Household Income Ratio in Edgerton
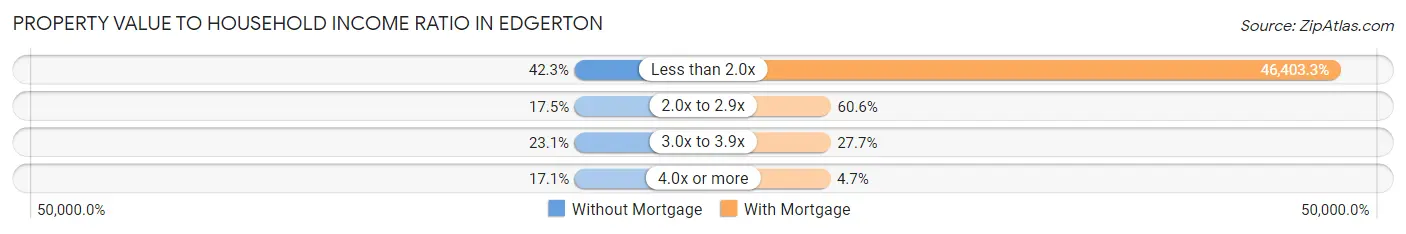
| Value-to-Income Ratio | Without Mortgage | With Mortgage |
| Less than 2.0x | 99 (42.3%) | 98,839 (46,403.3%) |
| 2.0x to 2.9x | 41 (17.5%) | 129 (60.6%) |
| 3.0x to 3.9x | 54 (23.1%) | 59 (27.7%) |
| 4.0x or more | 40 (17.1%) | 10 (4.7%) |
| Total | 234 (100.0%) | 213 (100.0%) |
Real Estate Taxes by Mortgage Status in Edgerton
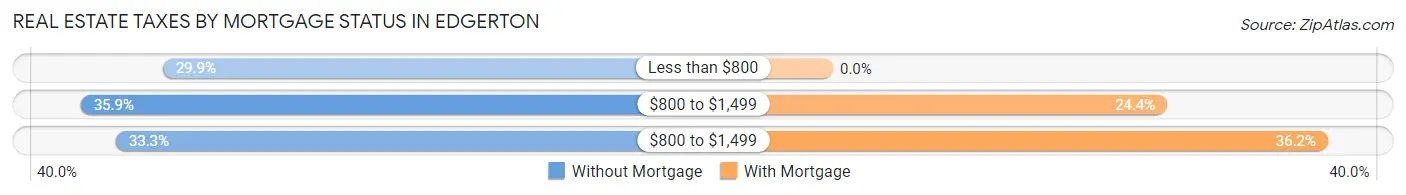
| Property Taxes | Without Mortgage | With Mortgage |
| Less than $800 | 70 (29.9%) | 0 (0.0%) |
| $800 to $1,499 | 84 (35.9%) | 52 (24.4%) |
| $800 to $1,499 | 78 (33.3%) | 77 (36.1%) |
| Total | 234 (100.0%) | 213 (100.0%) |
Health & Disability in Edgerton
Health Insurance Coverage by Age in Edgerton
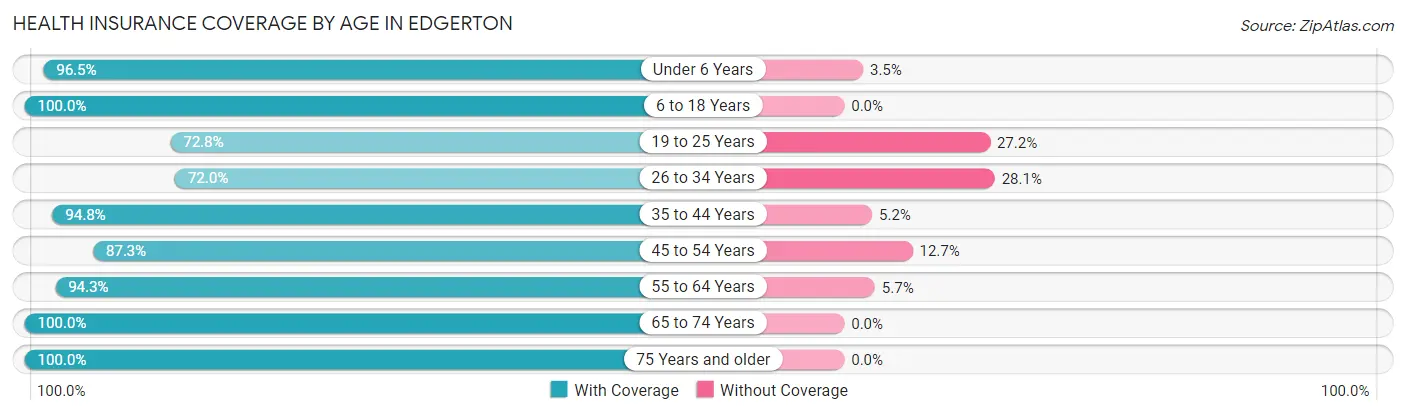
| Age Bracket | With Coverage | Without Coverage |
| Under 6 Years | 83 (96.5%) | 3 (3.5%) |
| 6 to 18 Years | 208 (100.0%) | 0 (0.0%) |
| 19 to 25 Years | 67 (72.8%) | 25 (27.2%) |
| 26 to 34 Years | 118 (72.0%) | 46 (28.1%) |
| 35 to 44 Years | 73 (94.8%) | 4 (5.2%) |
| 45 to 54 Years | 96 (87.3%) | 14 (12.7%) |
| 55 to 64 Years | 165 (94.3%) | 10 (5.7%) |
| 65 to 74 Years | 112 (100.0%) | 0 (0.0%) |
| 75 Years and older | 176 (100.0%) | 0 (0.0%) |
| Total | 1,098 (91.5%) | 102 (8.5%) |
Health Insurance Coverage by Citizenship Status in Edgerton
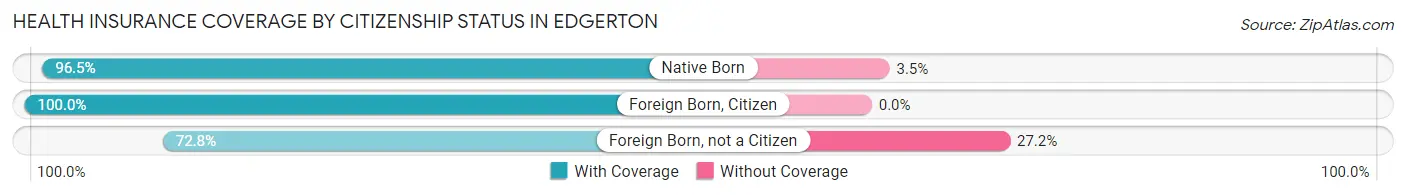
| Citizenship Status | With Coverage | Without Coverage |
| Native Born | 83 (96.5%) | 3 (3.5%) |
| Foreign Born, Citizen | 208 (100.0%) | 0 (0.0%) |
| Foreign Born, not a Citizen | 67 (72.8%) | 25 (27.2%) |
Health Insurance Coverage by Household Income in Edgerton
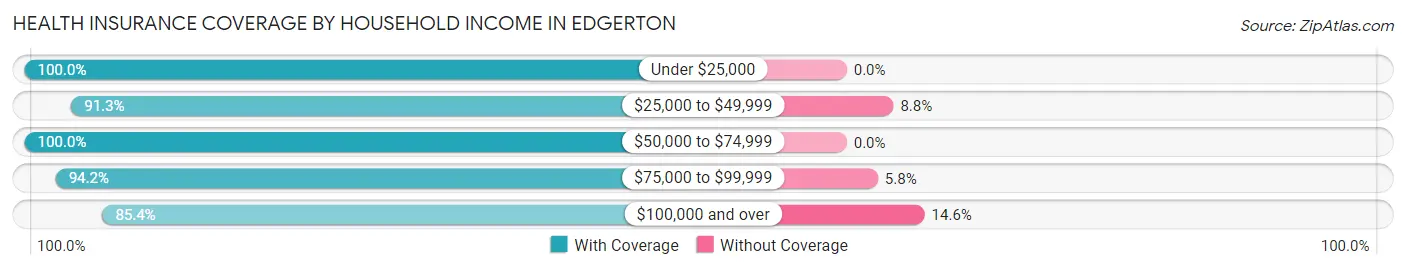
| Household Income | With Coverage | Without Coverage |
| Under $25,000 | 73 (100.0%) | 0 (0.0%) |
| $25,000 to $49,999 | 146 (91.2%) | 14 (8.7%) |
| $50,000 to $74,999 | 235 (100.0%) | 0 (0.0%) |
| $75,000 to $99,999 | 194 (94.2%) | 12 (5.8%) |
| $100,000 and over | 445 (85.4%) | 76 (14.6%) |
Public vs Private Health Insurance Coverage by Age in Edgerton
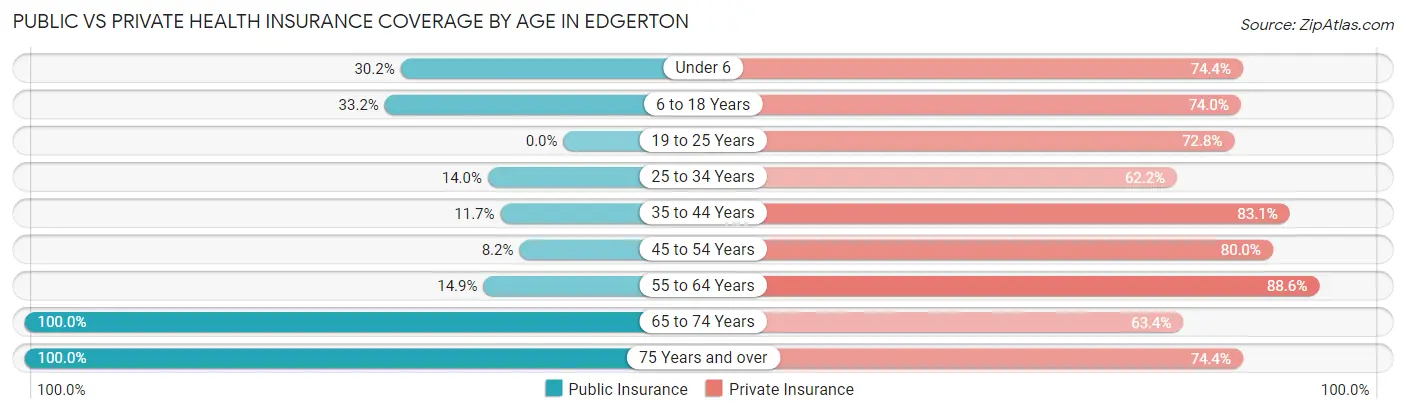
| Age Bracket | Public Insurance | Private Insurance |
| Under 6 | 26 (30.2%) | 64 (74.4%) |
| 6 to 18 Years | 69 (33.2%) | 154 (74.0%) |
| 19 to 25 Years | 0 (0.0%) | 67 (72.8%) |
| 25 to 34 Years | 23 (14.0%) | 102 (62.2%) |
| 35 to 44 Years | 9 (11.7%) | 64 (83.1%) |
| 45 to 54 Years | 9 (8.2%) | 88 (80.0%) |
| 55 to 64 Years | 26 (14.9%) | 155 (88.6%) |
| 65 to 74 Years | 112 (100.0%) | 71 (63.4%) |
| 75 Years and over | 176 (100.0%) | 131 (74.4%) |
| Total | 450 (37.5%) | 896 (74.7%) |
Disability Status by Sex by Age in Edgerton
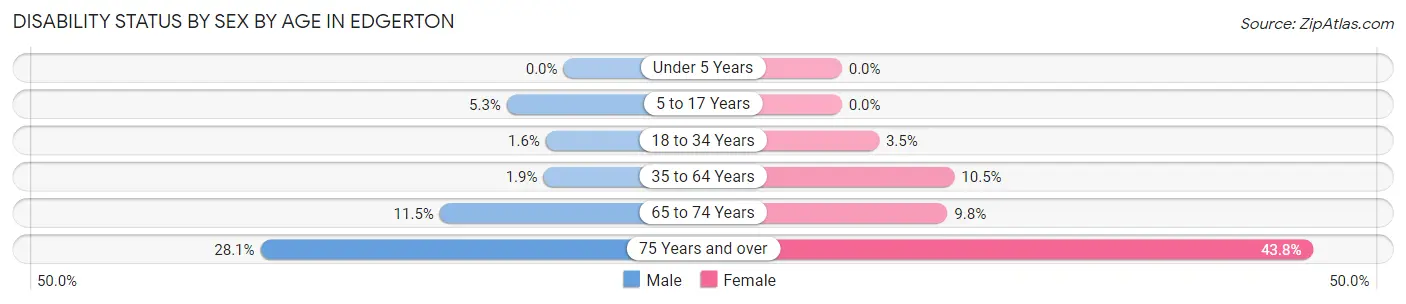
| Age Bracket | Male | Female |
| Under 5 Years | 0 (0.0%) | 0 (0.0%) |
| 5 to 17 Years | 8 (5.3%) | 0 (0.0%) |
| 18 to 34 Years | 3 (1.6%) | 3 (3.5%) |
| 35 to 64 Years | 3 (1.9%) | 21 (10.4%) |
| 65 to 74 Years | 7 (11.5%) | 5 (9.8%) |
| 75 Years and over | 18 (28.1%) | 49 (43.8%) |
Disability Class by Sex by Age in Edgerton
Disability Class: Hearing Difficulty
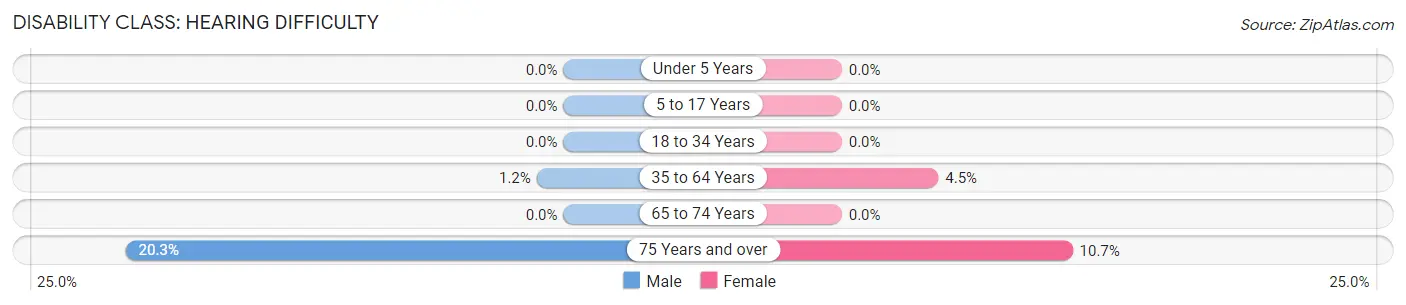
| Age Bracket | Male | Female |
| Under 5 Years | 0 (0.0%) | 0 (0.0%) |
| 5 to 17 Years | 0 (0.0%) | 0 (0.0%) |
| 18 to 34 Years | 0 (0.0%) | 0 (0.0%) |
| 35 to 64 Years | 2 (1.2%) | 9 (4.5%) |
| 65 to 74 Years | 0 (0.0%) | 0 (0.0%) |
| 75 Years and over | 13 (20.3%) | 12 (10.7%) |
Disability Class: Vision Difficulty
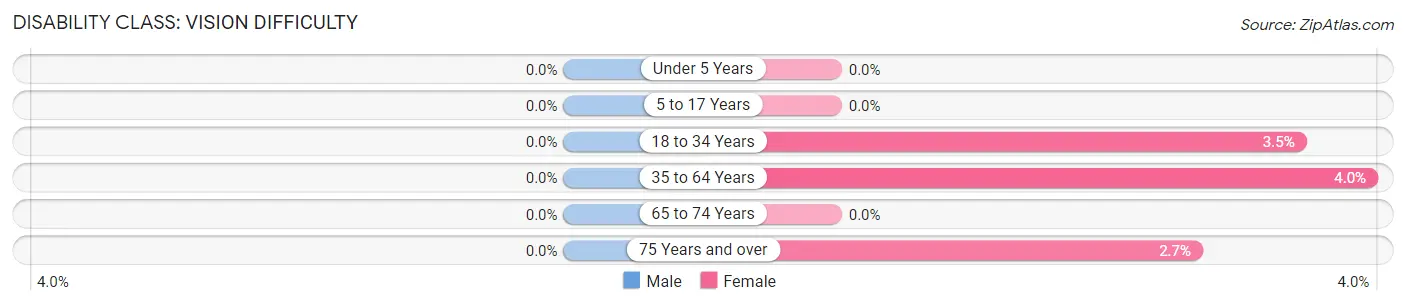
| Age Bracket | Male | Female |
| Under 5 Years | 0 (0.0%) | 0 (0.0%) |
| 5 to 17 Years | 0 (0.0%) | 0 (0.0%) |
| 18 to 34 Years | 0 (0.0%) | 3 (3.5%) |
| 35 to 64 Years | 0 (0.0%) | 8 (4.0%) |
| 65 to 74 Years | 0 (0.0%) | 0 (0.0%) |
| 75 Years and over | 0 (0.0%) | 3 (2.7%) |
Disability Class: Cognitive Difficulty
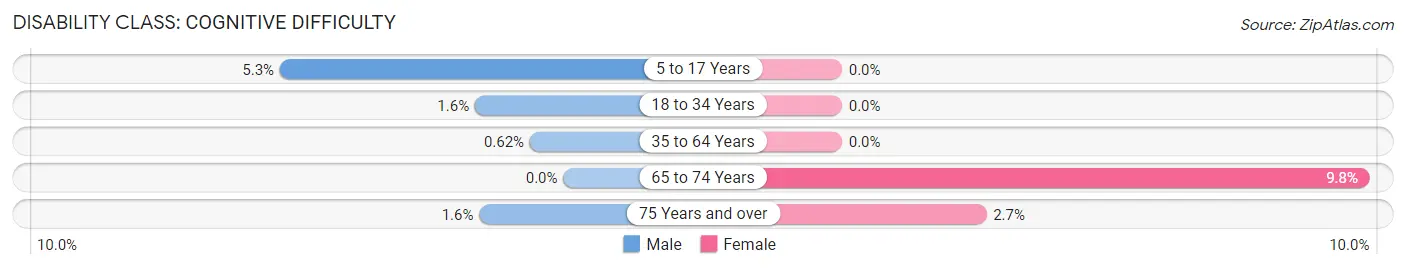
| Age Bracket | Male | Female |
| 5 to 17 Years | 8 (5.3%) | 0 (0.0%) |
| 18 to 34 Years | 3 (1.6%) | 0 (0.0%) |
| 35 to 64 Years | 1 (0.6%) | 0 (0.0%) |
| 65 to 74 Years | 0 (0.0%) | 5 (9.8%) |
| 75 Years and over | 1 (1.6%) | 3 (2.7%) |
Disability Class: Ambulatory Difficulty
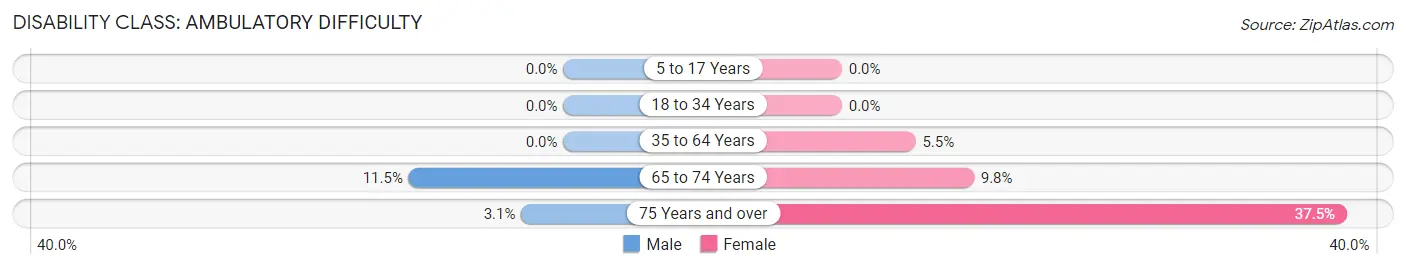
| Age Bracket | Male | Female |
| 5 to 17 Years | 0 (0.0%) | 0 (0.0%) |
| 18 to 34 Years | 0 (0.0%) | 0 (0.0%) |
| 35 to 64 Years | 0 (0.0%) | 11 (5.5%) |
| 65 to 74 Years | 7 (11.5%) | 5 (9.8%) |
| 75 Years and over | 2 (3.1%) | 42 (37.5%) |
Disability Class: Self-Care Difficulty
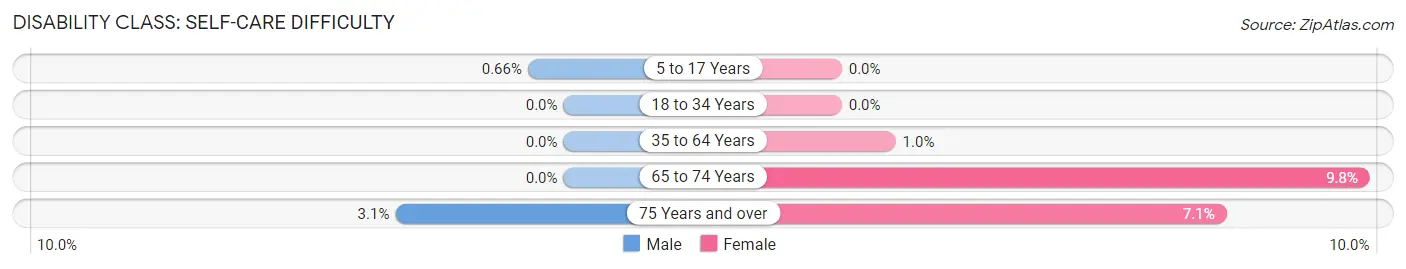
| Age Bracket | Male | Female |
| 5 to 17 Years | 1 (0.7%) | 0 (0.0%) |
| 18 to 34 Years | 0 (0.0%) | 0 (0.0%) |
| 35 to 64 Years | 0 (0.0%) | 2 (1.0%) |
| 65 to 74 Years | 0 (0.0%) | 5 (9.8%) |
| 75 Years and over | 2 (3.1%) | 8 (7.1%) |
Technology Access in Edgerton
Computing Device Access in Edgerton
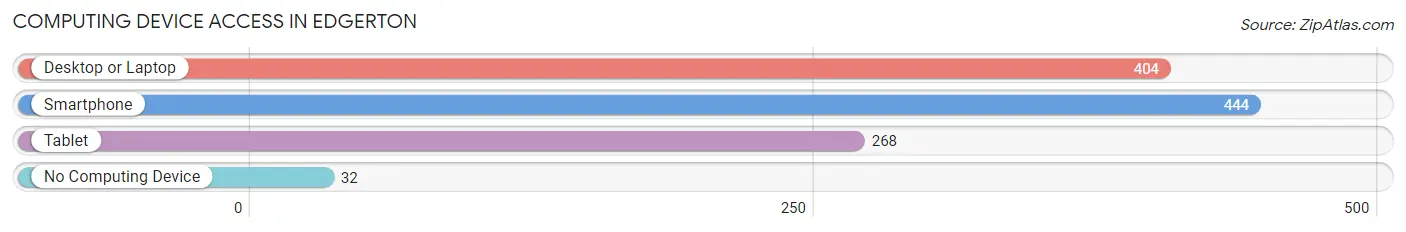
| Device Type | # Households | % Households |
| Desktop or Laptop | 404 | 75.7% |
| Smartphone | 444 | 83.2% |
| Tablet | 268 | 50.2% |
| No Computing Device | 32 | 6.0% |
| Total | 534 | 100.0% |
Internet Access in Edgerton
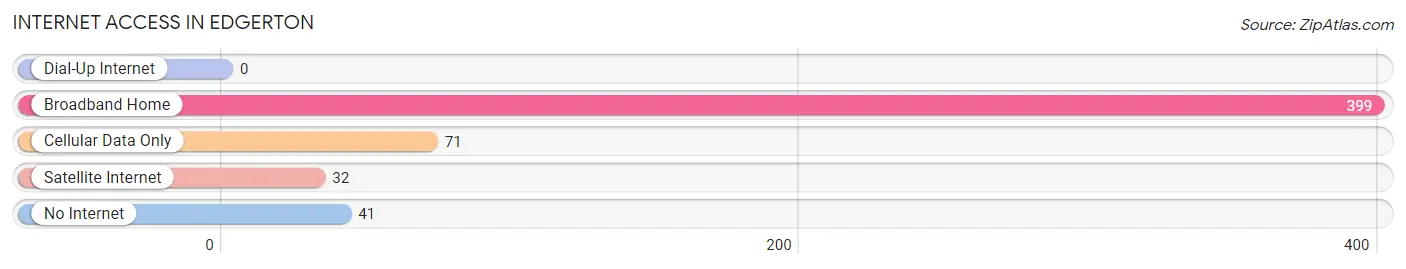
| Internet Type | # Households | % Households |
| Dial-Up Internet | 0 | 0.0% |
| Broadband Home | 399 | 74.7% |
| Cellular Data Only | 71 | 13.3% |
| Satellite Internet | 32 | 6.0% |
| No Internet | 41 | 7.7% |
| Total | 534 | 100.0% |
Edgerton Summary
Edgerton, Minnesota is a small city located in the southwestern corner of the state, near the border with South Dakota. It is part of the Marshall County, and is situated on the banks of the Redwood River. The city has a population of just over 1,000 people, and is known for its rural charm and friendly atmosphere.
History
Edgerton was founded in 1881 by a group of settlers from Wisconsin. The city was named after the Edgerton family, who were among the first settlers in the area. The city was incorporated in 1883, and the first mayor was elected in 1884.
The city grew slowly over the years, and by the early 1900s, it had become a thriving agricultural center. The city was home to several grain elevators, a creamery, and a number of other businesses.
In the 1950s, the city began to experience a decline in population as people moved away to larger cities. However, in recent years, the city has seen a resurgence in population as people have moved back to the area to take advantage of the rural lifestyle and the low cost of living.
Geography
Edgerton is located in the southwestern corner of Minnesota, near the border with South Dakota. The city is situated on the banks of the Redwood River, and is surrounded by rolling hills and farmland. The city is located about 30 miles from the nearest major city, Sioux Falls, South Dakota.
The climate in Edgerton is typical of the Midwest, with hot summers and cold winters. The average temperature in the summer is around 75 degrees Fahrenheit, and the average temperature in the winter is around 20 degrees Fahrenheit.
Economy
The economy of Edgerton is largely based on agriculture. The city is home to several grain elevators, and the surrounding area is home to many farms and ranches. The city is also home to a number of small businesses, including a grocery store, a hardware store, and a few restaurants.
The city is also home to a number of manufacturing companies, including a plastics manufacturer and a metal fabrication company. The city is also home to a number of small businesses, including a bakery, a florist, and a few other retail stores.
Demographics
As of the 2010 census, the population of Edgerton was 1,072. The population is predominantly white, with a small percentage of African Americans, Hispanics, and Native Americans. The median household income in the city is $41,000, and the median age is 43.
The city is home to a number of churches, including the Edgerton United Methodist Church, the Edgerton Lutheran Church, and the Edgerton Baptist Church. The city is also home to a number of schools, including the Edgerton Elementary School, the Edgerton Middle School, and the Edgerton High School.
Conclusion
Edgerton, Minnesota is a small city located in the southwestern corner of the state, near the border with South Dakota. The city has a population of just over 1,000 people, and is known for its rural charm and friendly atmosphere. The economy of Edgerton is largely based on agriculture, and the city is home to a number of small businesses. The population is predominantly white, with a small percentage of African Americans, Hispanics, and Native Americans. The city is home to a number of churches and schools, and is a great place to live for those looking for a rural lifestyle.
Common Questions
What is Per Capita Income in Edgerton?
Per Capita income in Edgerton is $33,738.
What is the Median Family Income in Edgerton?
Median Family Income in Edgerton is $93,676.
What is the Median Household income in Edgerton?
Median Household Income in Edgerton is $69,464.
What is Income or Wage Gap in Edgerton?
Income or Wage Gap in Edgerton is 20.3%.
Women in Edgerton earn 79.7 cents for every dollar earned by a man.
What is Inequality or Gini Index in Edgerton?
Inequality or Gini Index in Edgerton is 0.35.
What is the Total Population of Edgerton?
Total Population of Edgerton is 1,256.
What is the Total Male Population of Edgerton?
Total Male Population of Edgerton is 684.
What is the Total Female Population of Edgerton?
Total Female Population of Edgerton is 572.
What is the Ratio of Males per 100 Females in Edgerton?
There are 119.58 Males per 100 Females in Edgerton.
What is the Ratio of Females per 100 Males in Edgerton?
There are 83.63 Females per 100 Males in Edgerton.
What is the Median Population Age in Edgerton?
Median Population Age in Edgerton is 46.1 Years.
What is the Average Family Size in Edgerton
Average Family Size in Edgerton is 2.8 People.
What is the Average Household Size in Edgerton
Average Household Size in Edgerton is 2.2 People.
How Large is the Labor Force in Edgerton?
There are 651 People in the Labor Forcein in Edgerton.
What is the Percentage of People in the Labor Force in Edgerton?
64.8% of People are in the Labor Force in Edgerton.