Roseau, MN Map & Demographics
Roseau Map
Roseau Overview
$36,513
PER CAPITA INCOME
$84,306
AVG FAMILY INCOME
$62,829
AVG HOUSEHOLD INCOME
23.2%
WAGE / INCOME GAP [ % ]
76.8¢/ $1
WAGE / INCOME GAP [ $ ]
0.43
INEQUALITY / GINI INDEX
2,731
TOTAL POPULATION
1,259
MALE POPULATION
1,472
FEMALE POPULATION
85.53
MALES / 100 FEMALES
116.92
FEMALES / 100 MALES
38.6
MEDIAN AGE
2.9
AVG FAMILY SIZE
2.2
AVG HOUSEHOLD SIZE
1,467
LABOR FORCE [ PEOPLE ]
68.7%
PERCENT IN LABOR FORCE
4.6%
UNEMPLOYMENT RATE
Roseau Zip Codes
Roseau Area Codes
Income in Roseau
Income Overview in Roseau
Per Capita Income in Roseau is $36,513, while median incomes of families and households are $84,306 and $62,829 respectively.
| Characteristic | Number | Measure |
| Per Capita Income | 2,731 | $36,513 |
| Median Family Income | 708 | $84,306 |
| Mean Family Income | 708 | $93,153 |
| Median Household Income | 1,218 | $62,829 |
| Mean Household Income | 1,218 | $78,766 |
| Income Deficit | 708 | $0 |
| Wage / Income Gap (%) | 2,731 | 23.21% |
| Wage / Income Gap ($) | 2,731 | 76.79¢ per $1 |
| Gini / Inequality Index | 2,731 | 0.43 |
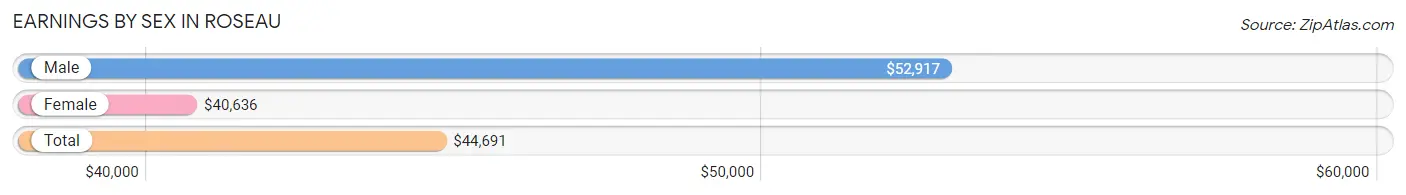
Earnings by Sex in Roseau
Average Earnings in Roseau are $44,691, $52,917 for men and $40,636 for women, a difference of 23.2%.
| Sex | Number | Average Earnings |
| Male | 796 (52.5%) | $52,917 |
| Female | 719 (47.5%) | $40,636 |
| Total | 1,515 (100.0%) | $44,691 |
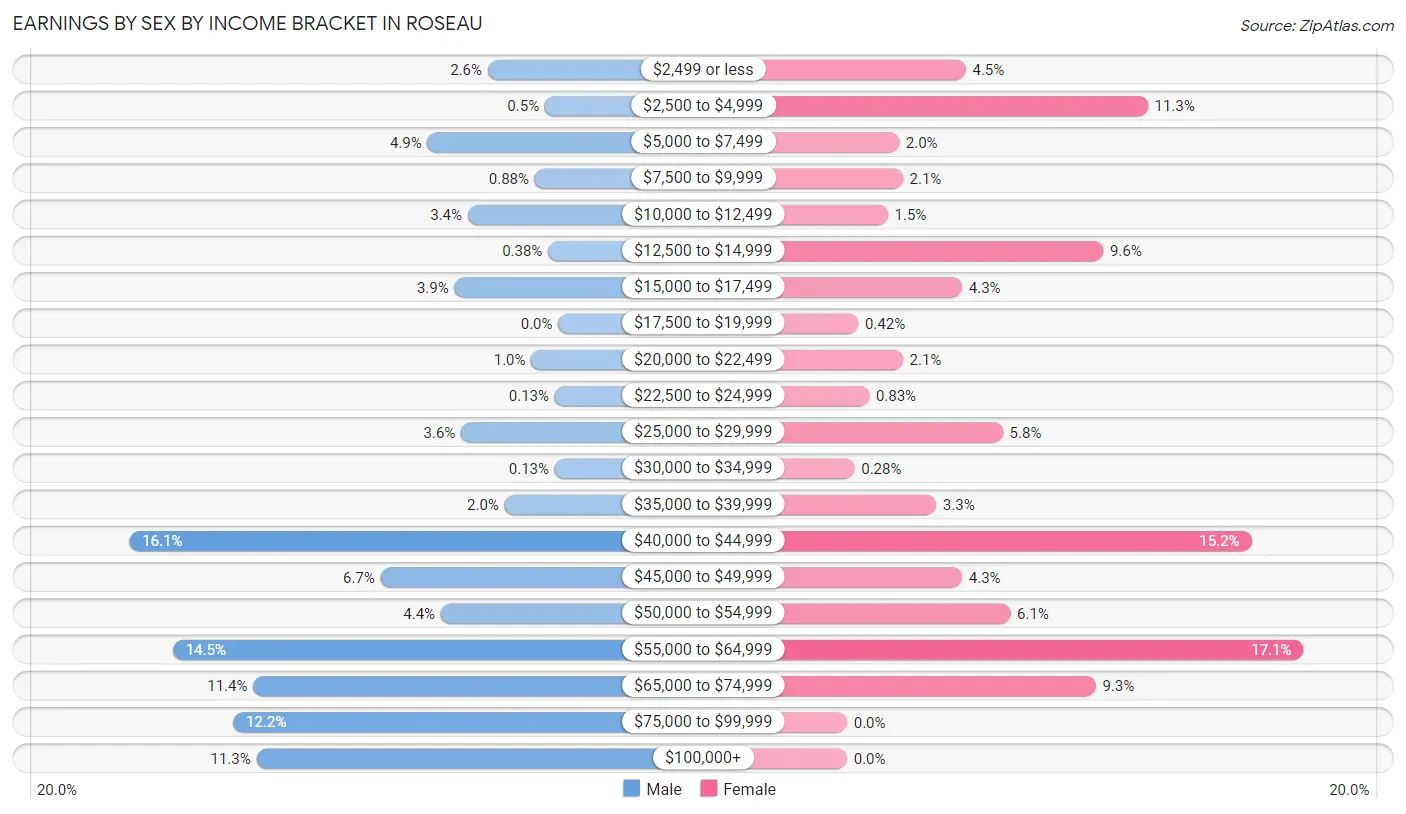
Earnings by Sex by Income Bracket in Roseau
The most common earnings brackets in Roseau are $40,000 to $44,999 for men (128 | 16.1%) and $55,000 to $64,999 for women (123 | 17.1%).
| Income | Male | Female |
| $2,499 or less | 21 (2.6%) | 32 (4.4%) |
| $2,500 to $4,999 | 4 (0.5%) | 81 (11.3%) |
| $5,000 to $7,499 | 39 (4.9%) | 14 (1.9%) |
| $7,500 to $9,999 | 7 (0.9%) | 15 (2.1%) |
| $10,000 to $12,499 | 27 (3.4%) | 11 (1.5%) |
| $12,500 to $14,999 | 3 (0.4%) | 69 (9.6%) |
| $15,000 to $17,499 | 31 (3.9%) | 31 (4.3%) |
| $17,500 to $19,999 | 0 (0.0%) | 3 (0.4%) |
| $20,000 to $22,499 | 8 (1.0%) | 15 (2.1%) |
| $22,500 to $24,999 | 1 (0.1%) | 6 (0.8%) |
| $25,000 to $29,999 | 29 (3.6%) | 42 (5.8%) |
| $30,000 to $34,999 | 1 (0.1%) | 2 (0.3%) |
| $35,000 to $39,999 | 16 (2.0%) | 24 (3.3%) |
| $40,000 to $44,999 | 128 (16.1%) | 109 (15.2%) |
| $45,000 to $49,999 | 53 (6.7%) | 31 (4.3%) |
| $50,000 to $54,999 | 35 (4.4%) | 44 (6.1%) |
| $55,000 to $64,999 | 115 (14.4%) | 123 (17.1%) |
| $65,000 to $74,999 | 91 (11.4%) | 67 (9.3%) |
| $75,000 to $99,999 | 97 (12.2%) | 0 (0.0%) |
| $100,000+ | 90 (11.3%) | 0 (0.0%) |
| Total | 796 (100.0%) | 719 (100.0%) |
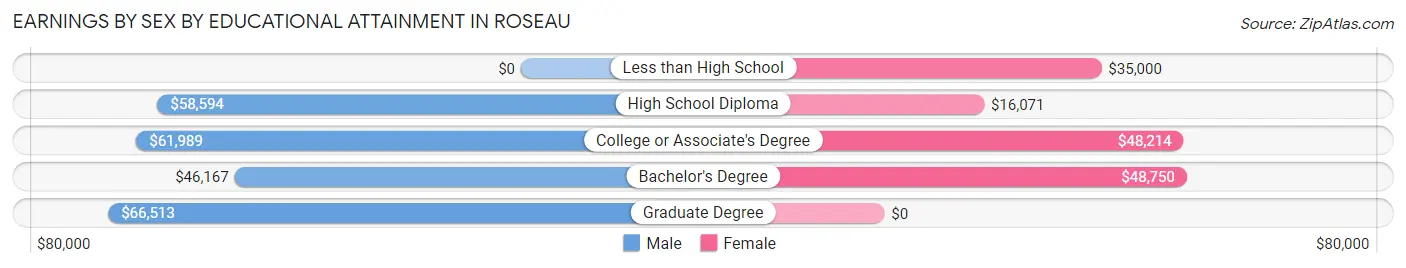
Earnings by Sex by Educational Attainment in Roseau
Average earnings in Roseau are $60,341 for men and $41,228 for women, a difference of 31.7%. Men with an educational attainment of graduate degree enjoy the highest average annual earnings of $66,513, while those with bachelor's degree education earn the least with $46,167. Women with an educational attainment of bachelor's degree earn the most with the average annual earnings of $48,750, while those with high school diploma education have the smallest earnings of $16,071.
| Educational Attainment | Male Income | Female Income |
| Less than High School | - | - |
| High School Diploma | $58,594 | $16,071 |
| College or Associate's Degree | $61,989 | $48,214 |
| Bachelor's Degree | $46,167 | $48,750 |
| Graduate Degree | $66,513 | $0 |
| Total | $60,341 | $41,228 |
Family Income in Roseau
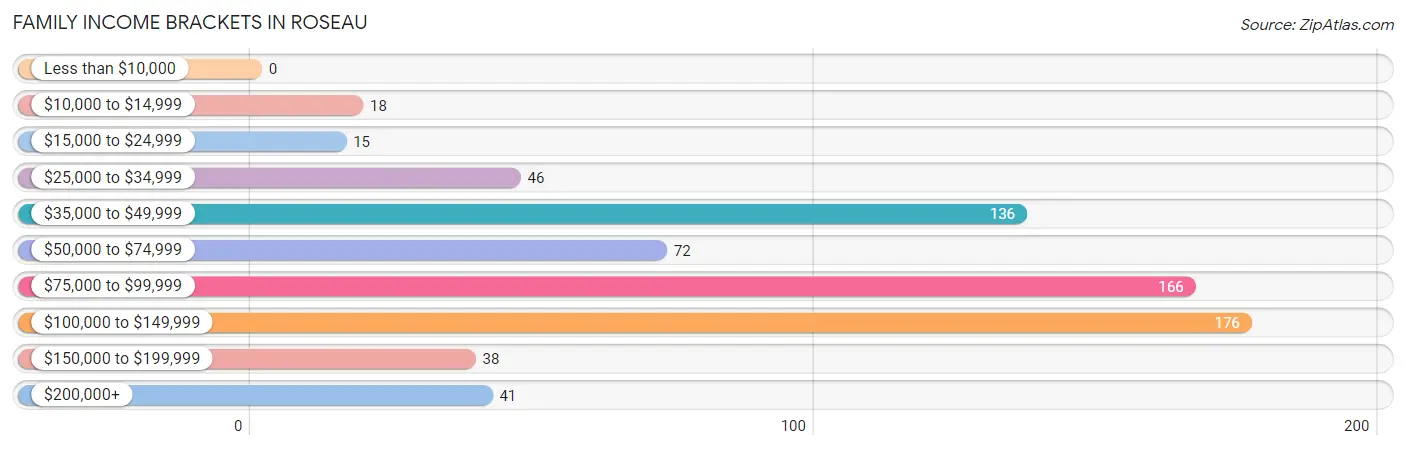
Family Income Brackets in Roseau
According to the Roseau family income data, there are 176 families falling into the $100,000 to $149,999 income range, which is the most common income bracket and makes up 24.9% of all families.
| Income Bracket | # Families | % Families |
| Less than $10,000 | 0 | 0.0% |
| $10,000 to $14,999 | 18 | 2.5% |
| $15,000 to $24,999 | 15 | 2.1% |
| $25,000 to $34,999 | 46 | 6.5% |
| $35,000 to $49,999 | 136 | 19.2% |
| $50,000 to $74,999 | 72 | 10.2% |
| $75,000 to $99,999 | 166 | 23.4% |
| $100,000 to $149,999 | 176 | 24.9% |
| $150,000 to $199,999 | 38 | 5.4% |
| $200,000+ | 41 | 5.8% |
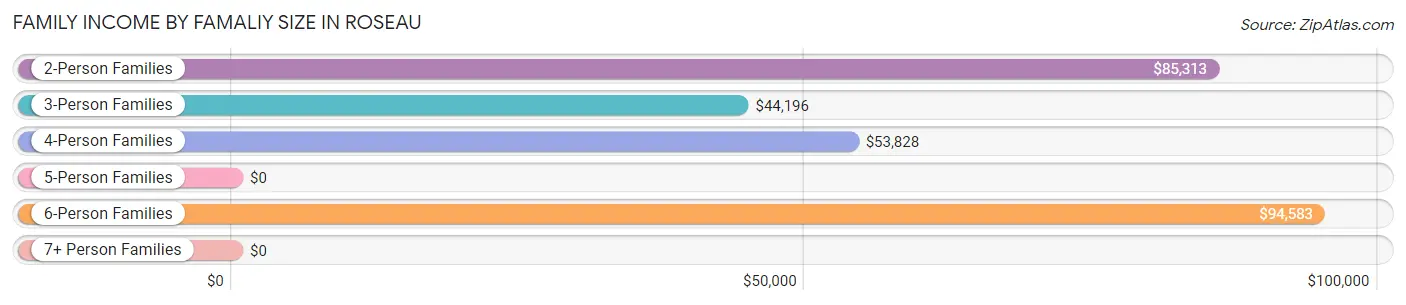
Family Income by Famaliy Size in Roseau
6-person families (49 | 6.9%) account for the highest median family income in Roseau with $94,583 per family, while 2-person families (381 | 53.8%) have the highest median income of $42,656 per family member.
| Income Bracket | # Families | Median Income |
| 2-Person Families | 381 (53.8%) | $85,313 |
| 3-Person Families | 167 (23.6%) | $44,196 |
| 4-Person Families | 79 (11.2%) | $53,828 |
| 5-Person Families | 13 (1.8%) | $0 |
| 6-Person Families | 49 (6.9%) | $94,583 |
| 7+ Person Families | 19 (2.7%) | $0 |
| Total | 708 (100.0%) | $84,306 |
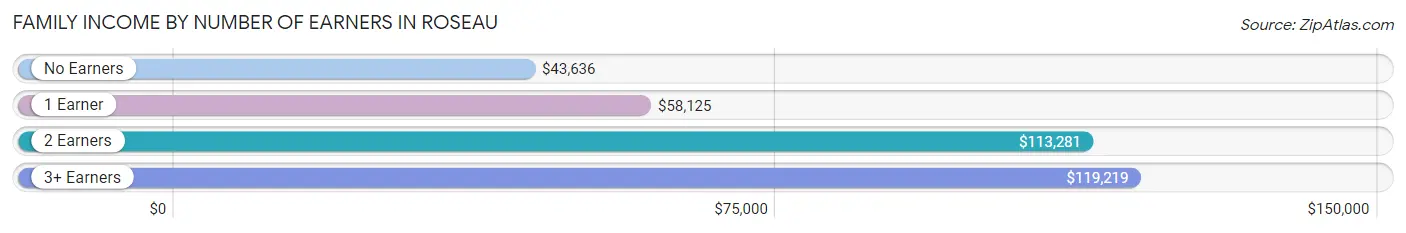
Family Income by Number of Earners in Roseau
The median family income in Roseau is $84,306, with families comprising 3+ earners (73) having the highest median family income of $119,219, while families with no earners (74) have the lowest median family income of $43,636, accounting for 10.3% and 10.4% of families, respectively.
| Number of Earners | # Families | Median Income |
| No Earners | 74 (10.4%) | $43,636 |
| 1 Earner | 219 (30.9%) | $58,125 |
| 2 Earners | 342 (48.3%) | $113,281 |
| 3+ Earners | 73 (10.3%) | $119,219 |
| Total | 708 (100.0%) | $84,306 |
Household Income in Roseau
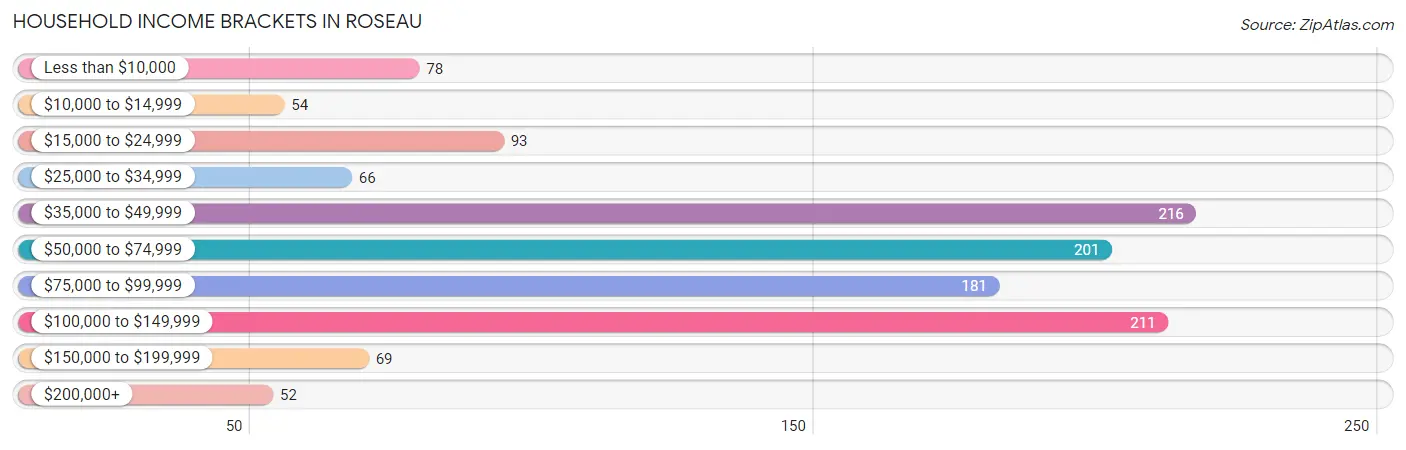
Household Income Brackets in Roseau
With 216 households falling in the category, the $35,000 to $49,999 income range is the most frequent in Roseau, accounting for 17.7% of all households. In contrast, only 52 households (4.3%) fall into the $200,000+ income bracket, making it the least populous group.
| Income Bracket | # Households | % Households |
| Less than $10,000 | 78 | 6.4% |
| $10,000 to $14,999 | 54 | 4.4% |
| $15,000 to $24,999 | 93 | 7.6% |
| $25,000 to $34,999 | 66 | 5.4% |
| $35,000 to $49,999 | 216 | 17.7% |
| $50,000 to $74,999 | 201 | 16.5% |
| $75,000 to $99,999 | 181 | 14.9% |
| $100,000 to $149,999 | 211 | 17.3% |
| $150,000 to $199,999 | 69 | 5.7% |
| $200,000+ | 52 | 4.3% |
Household Income by Householder Age in Roseau
The median household income in Roseau is $62,829, with the highest median household income of $84,844 found in the 45 to 64 years age bracket for the primary householder. A total of 411 households (33.7%) fall into this category. Meanwhile, the 65+ years age bracket for the primary householder has the lowest median household income of $43,393, with 376 households (30.9%) in this group.
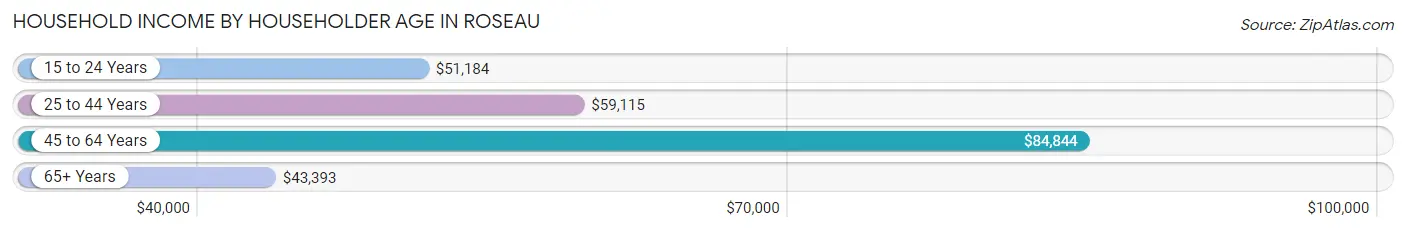
| Income Bracket | # Households | Median Income |
| 15 to 24 Years | 32 (2.6%) | $51,184 |
| 25 to 44 Years | 399 (32.8%) | $59,115 |
| 45 to 64 Years | 411 (33.7%) | $84,844 |
| 65+ Years | 376 (30.9%) | $43,393 |
| Total | 1,218 (100.0%) | $62,829 |
Poverty in Roseau
Income Below Poverty by Sex and Age in Roseau
With 11.3% poverty level for males and 12.6% for females among the residents of Roseau, under 5 year old males and 12 to 14 year old females are the most vulnerable to poverty, with 34 males (47.9%) and 16 females (36.4%) in their respective age groups living below the poverty level.
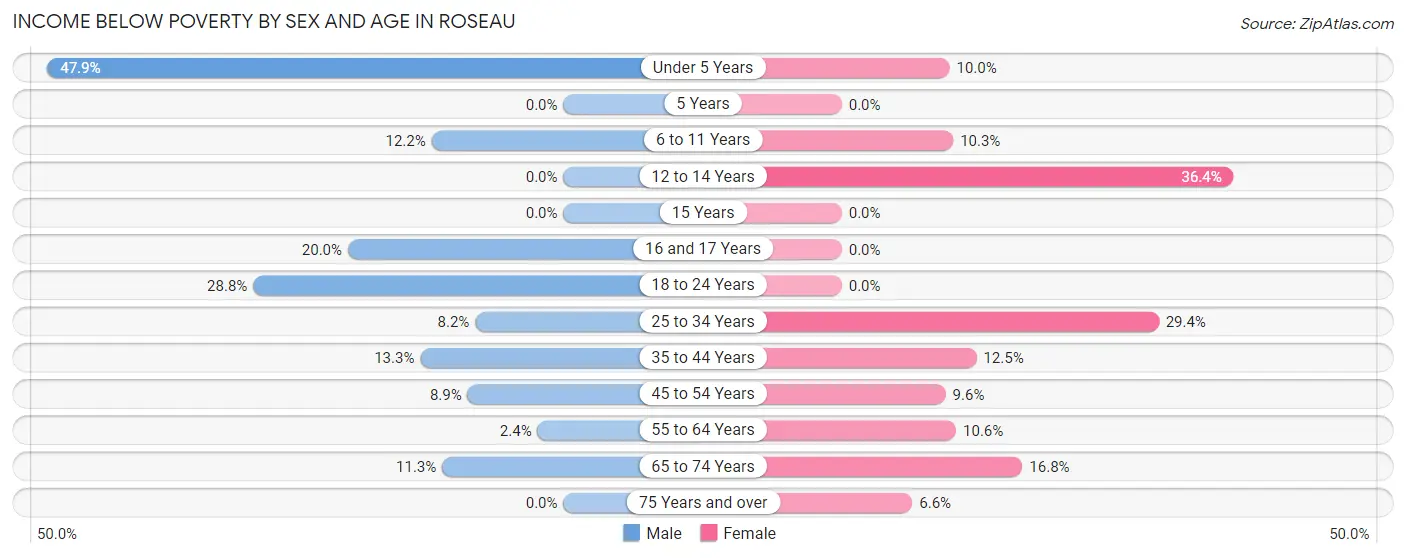
| Age Bracket | Male | Female |
| Under 5 Years | 34 (47.9%) | 12 (10.0%) |
| 5 Years | 0 (0.0%) | 0 (0.0%) |
| 6 to 11 Years | 17 (12.2%) | 15 (10.3%) |
| 12 to 14 Years | 0 (0.0%) | 16 (36.4%) |
| 15 Years | 0 (0.0%) | 0 (0.0%) |
| 16 and 17 Years | 7 (20.0%) | 0 (0.0%) |
| 18 to 24 Years | 19 (28.8%) | 0 (0.0%) |
| 25 to 34 Years | 18 (8.2%) | 45 (29.4%) |
| 35 to 44 Years | 17 (13.3%) | 25 (12.5%) |
| 45 to 54 Years | 12 (8.9%) | 8 (9.6%) |
| 55 to 64 Years | 5 (2.4%) | 19 (10.6%) |
| 65 to 74 Years | 9 (11.3%) | 29 (16.8%) |
| 75 Years and over | 0 (0.0%) | 11 (6.6%) |
| Total | 138 (11.3%) | 180 (12.6%) |
Income Above Poverty by Sex and Age in Roseau
According to the poverty statistics in Roseau, males aged 5 years and females aged 5 years are the age groups that are most secure financially, with 100.0% of males and 100.0% of females in these age groups living above the poverty line.
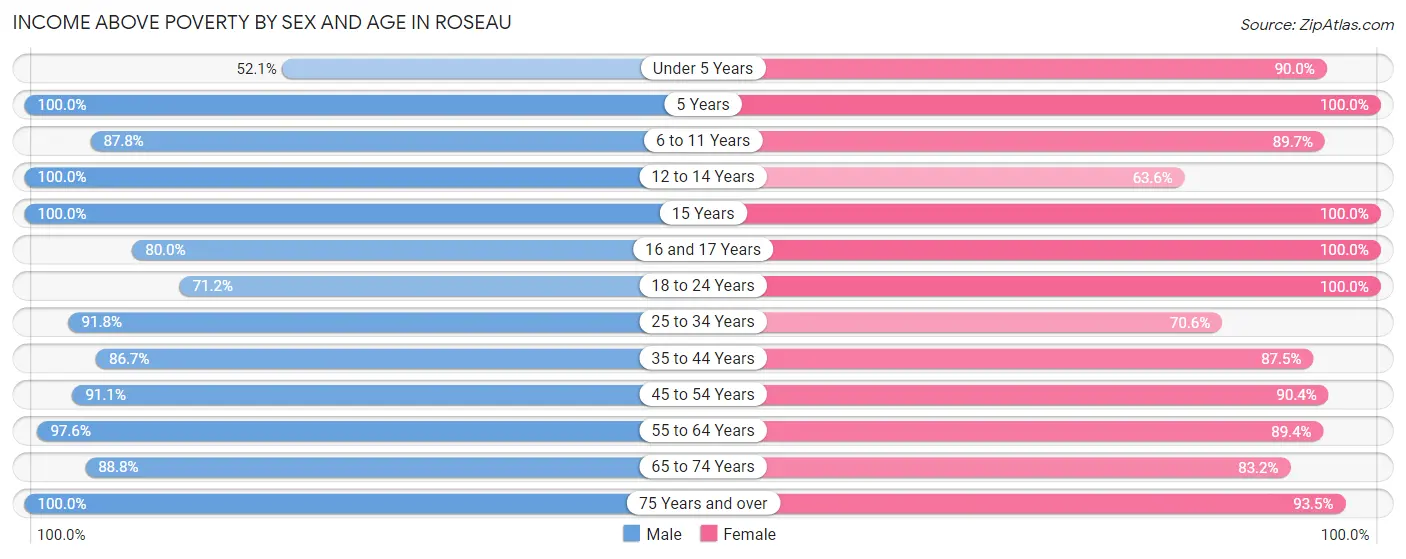
| Age Bracket | Male | Female |
| Under 5 Years | 37 (52.1%) | 108 (90.0%) |
| 5 Years | 5 (100.0%) | 33 (100.0%) |
| 6 to 11 Years | 122 (87.8%) | 130 (89.7%) |
| 12 to 14 Years | 8 (100.0%) | 28 (63.6%) |
| 15 Years | 15 (100.0%) | 14 (100.0%) |
| 16 and 17 Years | 28 (80.0%) | 25 (100.0%) |
| 18 to 24 Years | 47 (71.2%) | 94 (100.0%) |
| 25 to 34 Years | 202 (91.8%) | 108 (70.6%) |
| 35 to 44 Years | 111 (86.7%) | 175 (87.5%) |
| 45 to 54 Years | 123 (91.1%) | 75 (90.4%) |
| 55 to 64 Years | 203 (97.6%) | 160 (89.4%) |
| 65 to 74 Years | 71 (88.7%) | 144 (83.2%) |
| 75 Years and over | 107 (100.0%) | 157 (93.4%) |
| Total | 1,079 (88.7%) | 1,251 (87.4%) |
Income Below Poverty Among Married-Couple Families in Roseau
The poverty statistics for married-couple families in Roseau show that 6.3% or 35 of the total 553 families live below the poverty line. Families with 3 or 4 children have the highest poverty rate of 30.9%, comprising of 17 families. On the other hand, families with no children have the lowest poverty rate of 0.0%, which includes 0 families.
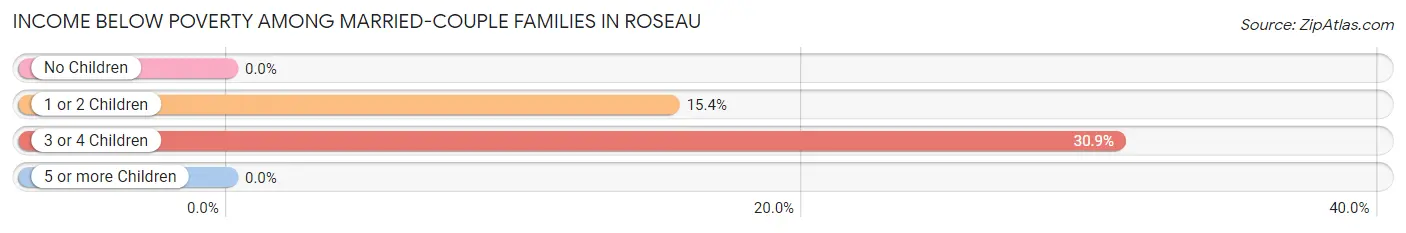
| Children | Above Poverty | Below Poverty |
| No Children | 362 (100.0%) | 0 (0.0%) |
| 1 or 2 Children | 99 (84.6%) | 18 (15.4%) |
| 3 or 4 Children | 38 (69.1%) | 17 (30.9%) |
| 5 or more Children | 19 (100.0%) | 0 (0.0%) |
| Total | 518 (93.7%) | 35 (6.3%) |
Income Below Poverty Among Single-Parent Households in Roseau
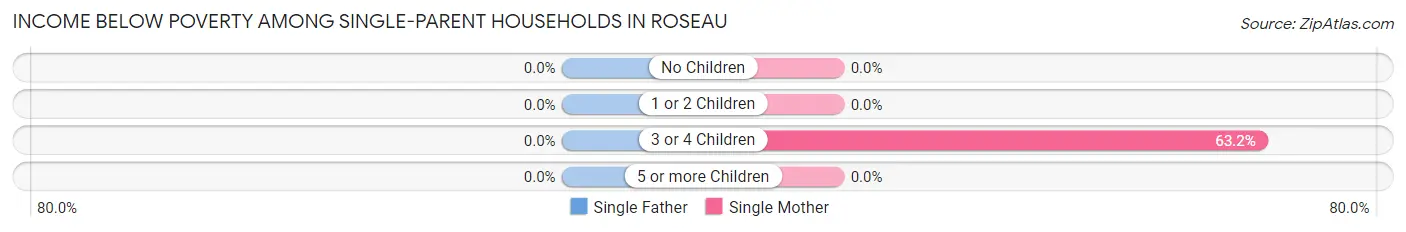
| Children | Single Father | Single Mother |
| No Children | 0 (0.0%) | 0 (0.0%) |
| 1 or 2 Children | 0 (0.0%) | 0 (0.0%) |
| 3 or 4 Children | 0 (0.0%) | 12 (63.2%) |
| 5 or more Children | 0 (0.0%) | 0 (0.0%) |
| Total | 0 (0.0%) | 12 (9.5%) |
Income Below Poverty Among Married-Couple vs Single-Parent Households in Roseau
The poverty data for Roseau shows that 35 of the married-couple family households (6.3%) and 12 of the single-parent households (7.7%) are living below the poverty level. Within the married-couple family households, those with 3 or 4 children have the highest poverty rate, with 17 households (30.9%) falling below the poverty line. Among the single-parent households, those with 3 or 4 children have the highest poverty rate, with 12 household (63.2%) living below poverty.
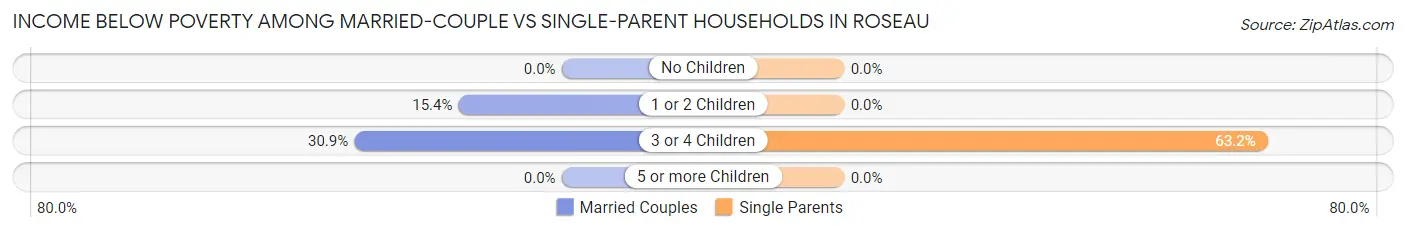
| Children | Married-Couple Families | Single-Parent Households |
| No Children | 0 (0.0%) | 0 (0.0%) |
| 1 or 2 Children | 18 (15.4%) | 0 (0.0%) |
| 3 or 4 Children | 17 (30.9%) | 12 (63.2%) |
| 5 or more Children | 0 (0.0%) | 0 (0.0%) |
| Total | 35 (6.3%) | 12 (7.7%) |
Race in Roseau
The most populous races in Roseau are White / Caucasian (2,491 | 91.2%), Two or more Races (141 | 5.2%), and Hispanic or Latino (95 | 3.5%).
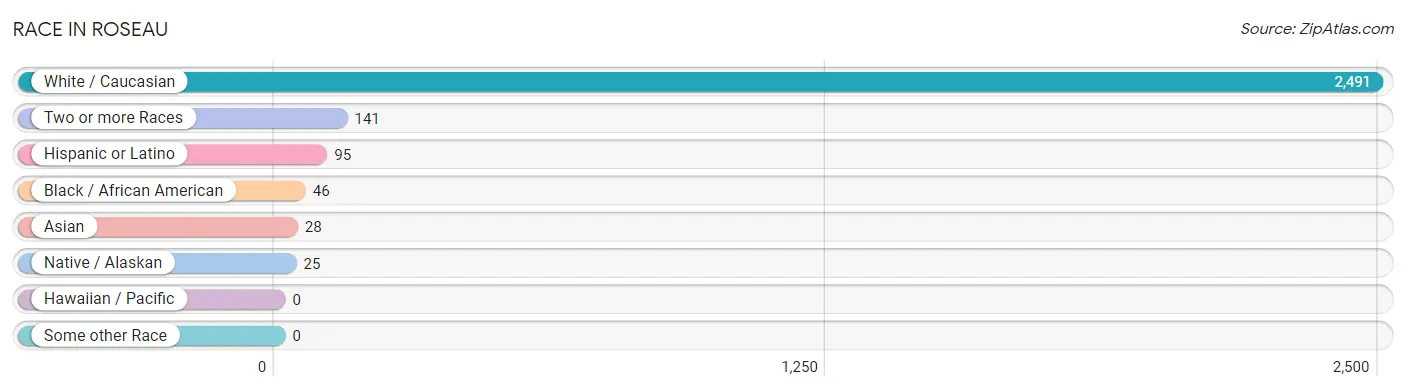
| Race | # Population | % Population |
| Asian | 28 | 1.0% |
| Black / African American | 46 | 1.7% |
| Hawaiian / Pacific | 0 | 0.0% |
| Hispanic or Latino | 95 | 3.5% |
| Native / Alaskan | 25 | 0.9% |
| White / Caucasian | 2,491 | 91.2% |
| Two or more Races | 141 | 5.2% |
| Some other Race | 0 | 0.0% |
| Total | 2,731 | 100.0% |
Ancestry in Roseau
The most populous ancestries reported in Roseau are Norwegian (757 | 27.7%), Swedish (445 | 16.3%), German (431 | 15.8%), French (190 | 7.0%), and American (181 | 6.6%), together accounting for 73.4% of all Roseau residents.
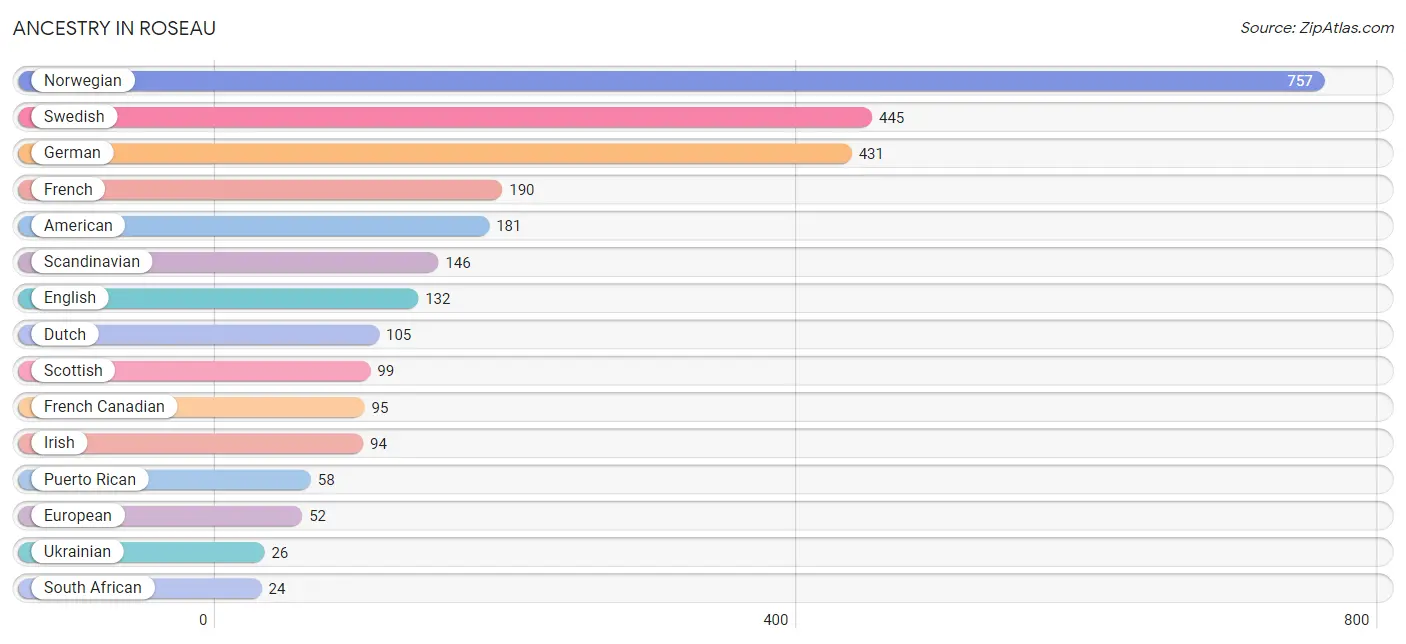
| Ancestry | # Population | % Population |
| American | 181 | 6.6% |
| Arab | 3 | 0.1% |
| Bhutanese | 5 | 0.2% |
| British | 6 | 0.2% |
| Burmese | 7 | 0.3% |
| Canadian | 11 | 0.4% |
| Cherokee | 5 | 0.2% |
| Chippewa | 18 | 0.7% |
| Colombian | 18 | 0.7% |
| Czech | 22 | 0.8% |
| Czechoslovakian | 5 | 0.2% |
| Dutch | 105 | 3.8% |
| English | 132 | 4.8% |
| European | 52 | 1.9% |
| Finnish | 14 | 0.5% |
| French | 190 | 7.0% |
| French Canadian | 95 | 3.5% |
| German | 431 | 15.8% |
| Irish | 94 | 3.4% |
| Italian | 16 | 0.6% |
| Korean | 12 | 0.4% |
| Mexican | 19 | 0.7% |
| Navajo | 16 | 0.6% |
| Norwegian | 757 | 27.7% |
| Polish | 20 | 0.7% |
| Puerto Rican | 58 | 2.1% |
| Scandinavian | 146 | 5.3% |
| Scottish | 99 | 3.6% |
| Sioux | 9 | 0.3% |
| South African | 24 | 0.9% |
| South American | 18 | 0.7% |
| Subsaharan African | 24 | 0.9% |
| Swedish | 445 | 16.3% |
| Swiss | 3 | 0.1% |
| Thai | 14 | 0.5% |
| Ukrainian | 26 | 0.9% | View All 36 Rows |
Immigrants in Roseau
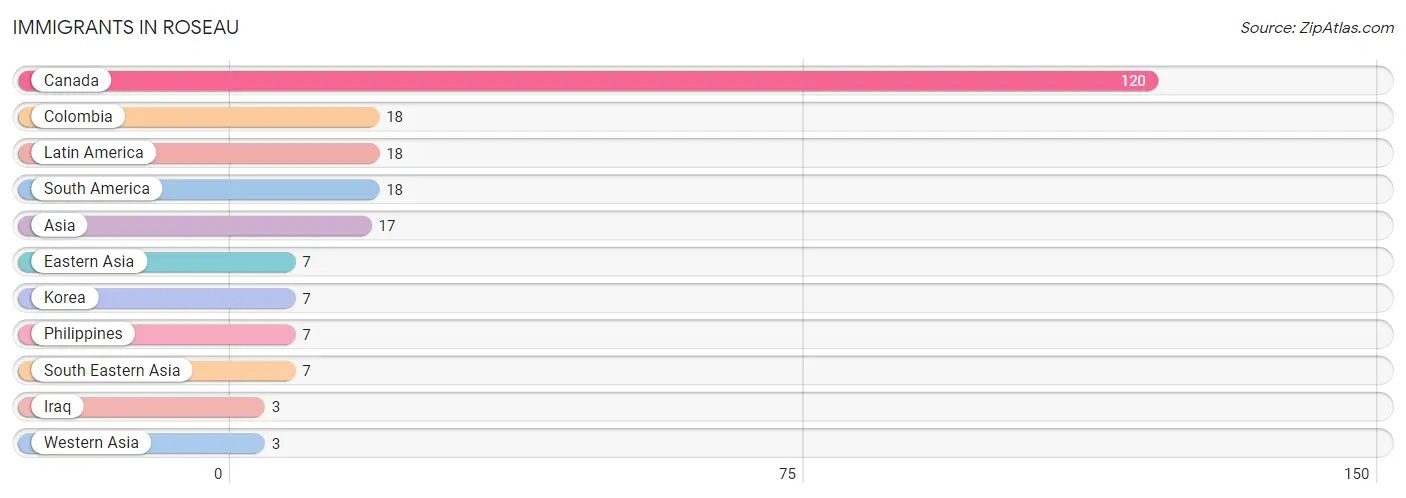
The most numerous immigrant groups reported in Roseau came from Canada (120 | 4.4%), Colombia (18 | 0.7%), Latin America (18 | 0.7%), South America (18 | 0.7%), and Asia (17 | 0.6%), together accounting for 7.0% of all Roseau residents.
| Immigration Origin | # Population | % Population |
| Asia | 17 | 0.6% |
| Canada | 120 | 4.4% |
| Colombia | 18 | 0.7% |
| Eastern Asia | 7 | 0.3% |
| Iraq | 3 | 0.1% |
| Korea | 7 | 0.3% |
| Latin America | 18 | 0.7% |
| Philippines | 7 | 0.3% |
| South America | 18 | 0.7% |
| South Eastern Asia | 7 | 0.3% |
| Western Asia | 3 | 0.1% | View All 11 Rows |
Sex and Age in Roseau
Sex and Age in Roseau
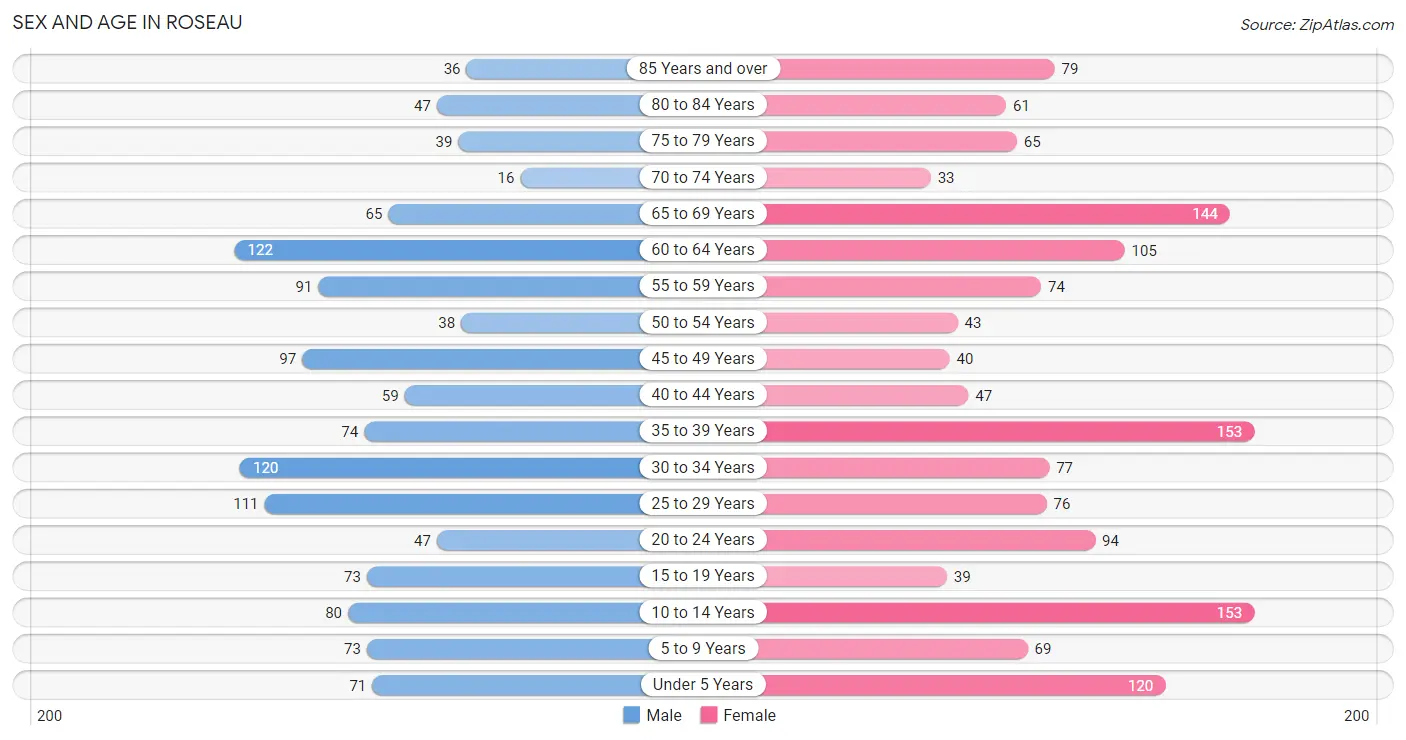
The most populous age groups in Roseau are 60 to 64 Years (122 | 9.7%) for men and 10 to 14 Years (153 | 10.4%) for women.
| Age Bracket | Male | Female |
| Under 5 Years | 71 (5.6%) | 120 (8.2%) |
| 5 to 9 Years | 73 (5.8%) | 69 (4.7%) |
| 10 to 14 Years | 80 (6.4%) | 153 (10.4%) |
| 15 to 19 Years | 73 (5.8%) | 39 (2.6%) |
| 20 to 24 Years | 47 (3.7%) | 94 (6.4%) |
| 25 to 29 Years | 111 (8.8%) | 76 (5.2%) |
| 30 to 34 Years | 120 (9.5%) | 77 (5.2%) |
| 35 to 39 Years | 74 (5.9%) | 153 (10.4%) |
| 40 to 44 Years | 59 (4.7%) | 47 (3.2%) |
| 45 to 49 Years | 97 (7.7%) | 40 (2.7%) |
| 50 to 54 Years | 38 (3.0%) | 43 (2.9%) |
| 55 to 59 Years | 91 (7.2%) | 74 (5.0%) |
| 60 to 64 Years | 122 (9.7%) | 105 (7.1%) |
| 65 to 69 Years | 65 (5.2%) | 144 (9.8%) |
| 70 to 74 Years | 16 (1.3%) | 33 (2.2%) |
| 75 to 79 Years | 39 (3.1%) | 65 (4.4%) |
| 80 to 84 Years | 47 (3.7%) | 61 (4.1%) |
| 85 Years and over | 36 (2.9%) | 79 (5.4%) |
| Total | 1,259 (100.0%) | 1,472 (100.0%) |
Families and Households in Roseau
Median Family Size in Roseau
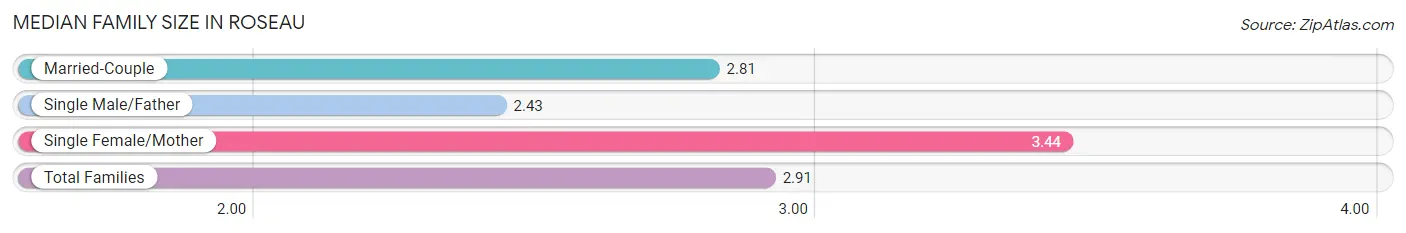
The median family size in Roseau is 2.91 persons per family, with single female/mother families (127 | 17.9%) accounting for the largest median family size of 3.44 persons per family. On the other hand, single male/father families (28 | 4.0%) represent the smallest median family size with 2.43 persons per family.
| Family Type | # Families | Family Size |
| Married-Couple | 553 (78.1%) | 2.81 |
| Single Male/Father | 28 (4.0%) | 2.43 |
| Single Female/Mother | 127 (17.9%) | 3.44 |
| Total Families | 708 (100.0%) | 2.91 |
Median Household Size in Roseau
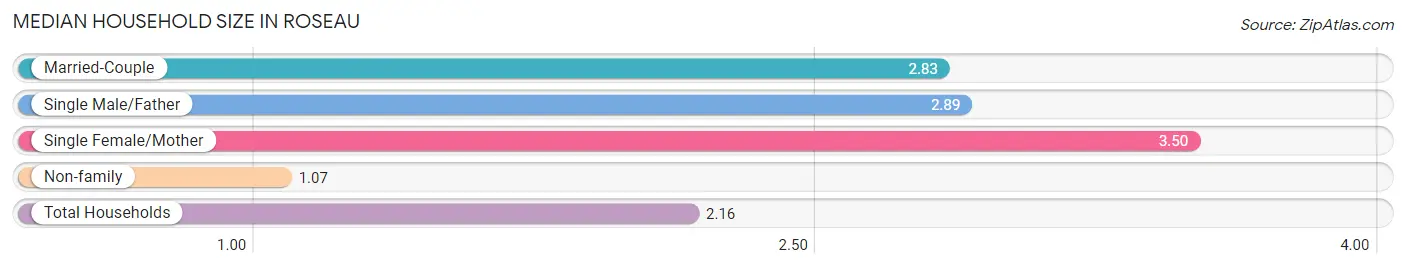
The median household size in Roseau is 2.16 persons per household, with single female/mother households (127 | 10.4%) accounting for the largest median household size of 3.5 persons per household. non-family households (510 | 41.9%) represent the smallest median household size with 1.07 persons per household.
| Household Type | # Households | Household Size |
| Married-Couple | 553 (45.4%) | 2.83 |
| Single Male/Father | 28 (2.3%) | 2.89 |
| Single Female/Mother | 127 (10.4%) | 3.50 |
| Non-family | 510 (41.9%) | 1.07 |
| Total Households | 1,218 (100.0%) | 2.16 |
Household Size by Marriage Status in Roseau
Out of a total of 1,218 households in Roseau, 708 (58.1%) are family households, while 510 (41.9%) are nonfamily households. The most numerous type of family households are 2-person households, comprising 368, and the most common type of nonfamily households are 1-person households, comprising 498.
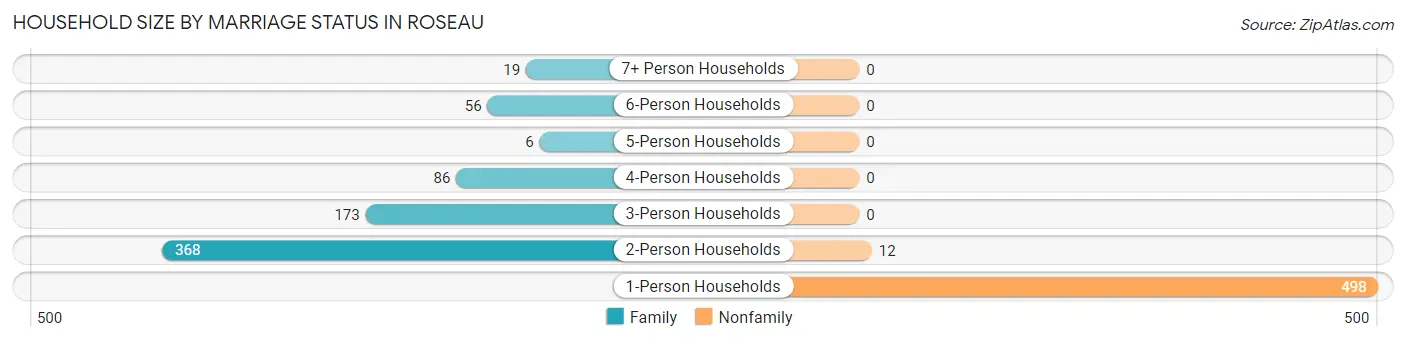
| Household Size | Family Households | Nonfamily Households |
| 1-Person Households | - | 498 (40.9%) |
| 2-Person Households | 368 (30.2%) | 12 (1.0%) |
| 3-Person Households | 173 (14.2%) | 0 (0.0%) |
| 4-Person Households | 86 (7.1%) | 0 (0.0%) |
| 5-Person Households | 6 (0.5%) | 0 (0.0%) |
| 6-Person Households | 56 (4.6%) | 0 (0.0%) |
| 7+ Person Households | 19 (1.6%) | 0 (0.0%) |
| Total | 708 (58.1%) | 510 (41.9%) |
Female Fertility in Roseau
Fertility by Age in Roseau
Average fertility rate in Roseau is 143.0 births per 1,000 women. Women in the age bracket of 35 to 50 years have the highest fertility rate with 170.0 births per 1,000 women. Women in the age bracket of 35 to 50 years acount for 55.3% of all women with births.
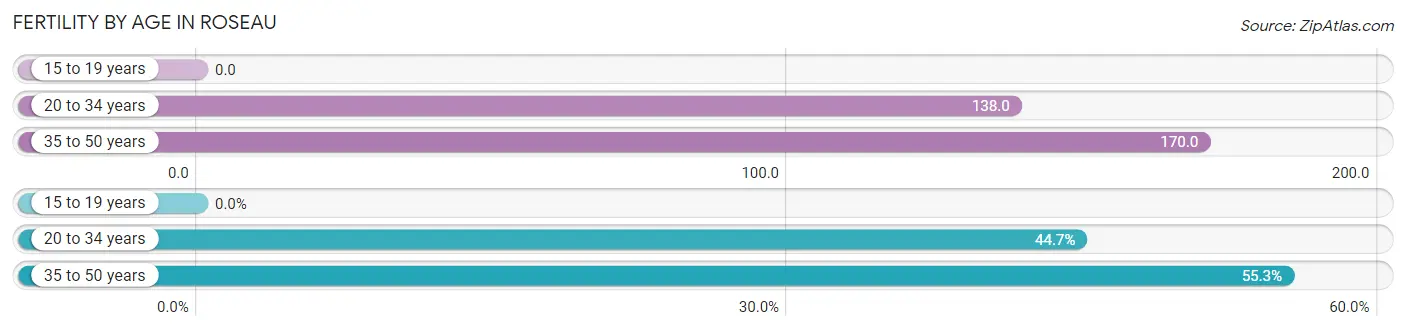
| Age Bracket | Women with Births | Births / 1,000 Women |
| 15 to 19 years | 0 (0.0%) | 0.0 |
| 20 to 34 years | 34 (44.7%) | 138.0 |
| 35 to 50 years | 42 (55.3%) | 170.0 |
| Total | 76 (100.0%) | 143.0 |
Fertility by Age by Marriage Status in Roseau
44.7% of women with births (76) in Roseau are married. The highest percentage of unmarried women with births falls into 35 to 50 years age bracket with 100.0% of them unmarried at the time of birth, while the lowest percentage of unmarried women with births belong to 20 to 34 years age bracket with 0.0% of them unmarried.
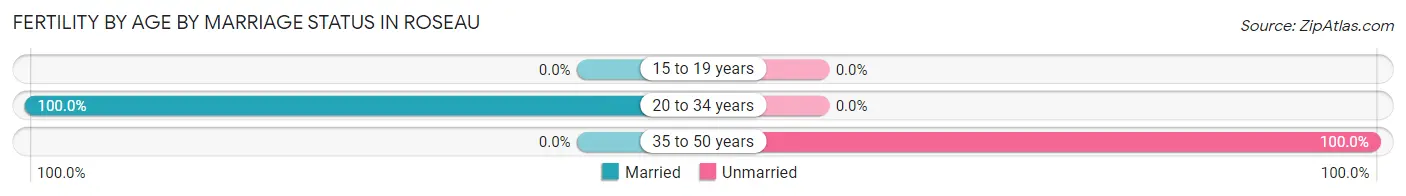
| Age Bracket | Married | Unmarried |
| 15 to 19 years | 0 (0.0%) | 0 (0.0%) |
| 20 to 34 years | 34 (100.0%) | 0 (0.0%) |
| 35 to 50 years | 0 (0.0%) | 42 (100.0%) |
| Total | 34 (44.7%) | 42 (55.3%) |
Fertility by Education in Roseau
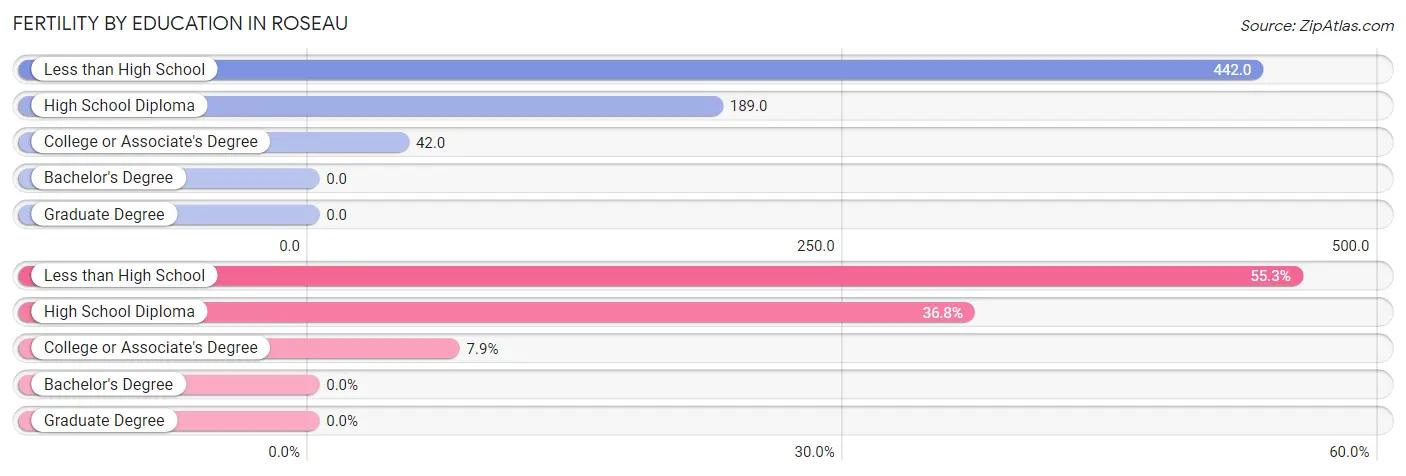
| Educational Attainment | Women with Births | Births / 1,000 Women |
| Less than High School | 42 (55.3%) | 442.0 |
| High School Diploma | 28 (36.8%) | 189.0 |
| College or Associate's Degree | 6 (7.9%) | 42.0 |
| Bachelor's Degree | 0 (0.0%) | 0.0 |
| Graduate Degree | 0 (0.0%) | 0.0 |
| Total | 76 (100.0%) | 143.0 |
Fertility by Education by Marriage Status in Roseau
55.3% of women with births in Roseau are unmarried. Women with the educational attainment of high school diploma are most likely to be married with 100.0% of them married at childbirth, while women with the educational attainment of less than high school are least likely to be married with 100.0% of them unmarried at childbirth.
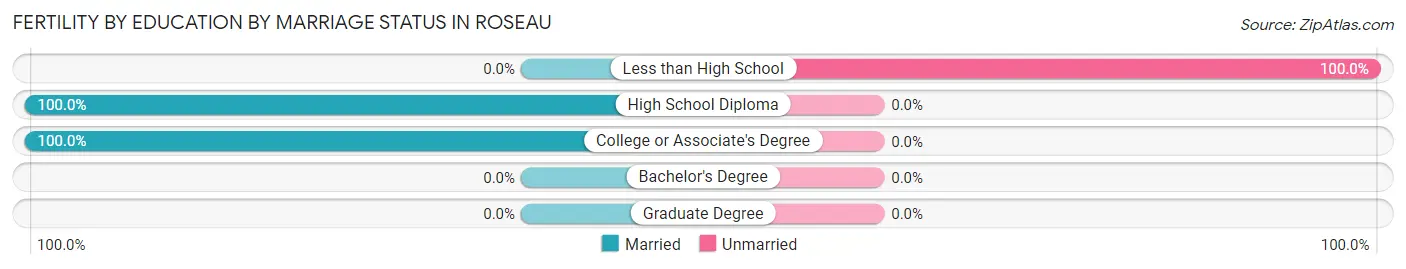
| Educational Attainment | Married | Unmarried |
| Less than High School | 0 (0.0%) | 42 (100.0%) |
| High School Diploma | 28 (100.0%) | 0 (0.0%) |
| College or Associate's Degree | 6 (100.0%) | 0 (0.0%) |
| Bachelor's Degree | 0 (0.0%) | 0 (0.0%) |
| Graduate Degree | 0 (0.0%) | 0 (0.0%) |
| Total | 34 (44.7%) | 42 (55.3%) |
Employment Characteristics in Roseau
Employment by Class of Employer in Roseau
Among the 1,358 employed individuals in Roseau, private company employees (947 | 69.7%), not-for-profit organizations (142 | 10.5%), and local government employees (112 | 8.3%) make up the most common classes of employment.
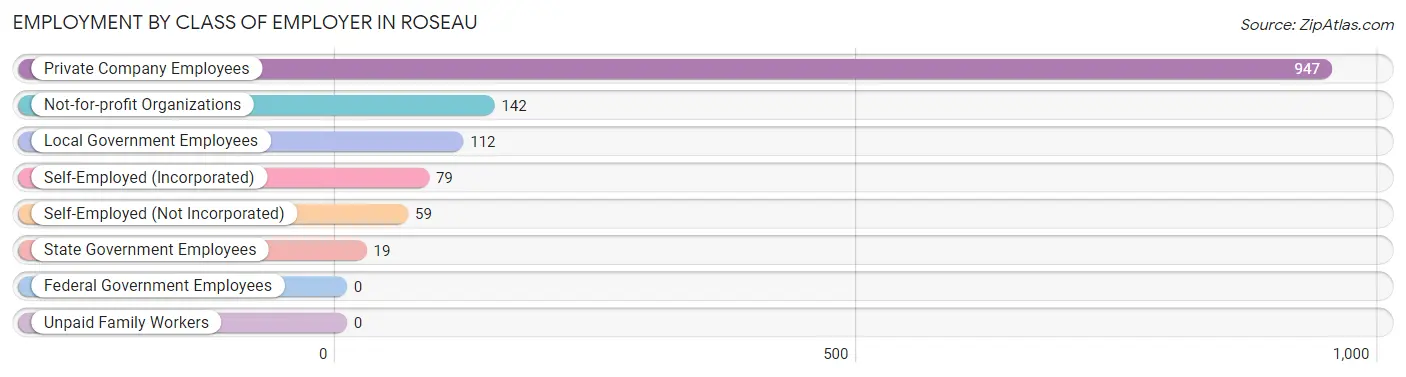
| Employer Class | # Employees | % Employees |
| Private Company Employees | 947 | 69.7% |
| Self-Employed (Incorporated) | 79 | 5.8% |
| Self-Employed (Not Incorporated) | 59 | 4.3% |
| Not-for-profit Organizations | 142 | 10.5% |
| Local Government Employees | 112 | 8.3% |
| State Government Employees | 19 | 1.4% |
| Federal Government Employees | 0 | 0.0% |
| Unpaid Family Workers | 0 | 0.0% |
| Total | 1,358 | 100.0% |
Employment Status by Age in Roseau
According to the labor force statistics for Roseau, out of the total population over 16 years of age (2,135), 68.7% or 1,467 individuals are in the labor force, with 4.6% or 67 of them unemployed. The age group with the highest labor force participation rate is 35 to 44 years, with 96.7% or 322 individuals in the labor force. Within the labor force, the 16 to 19 years age range has the highest percentage of unemployed individuals, with 16.7% or 12 of them being unemployed.
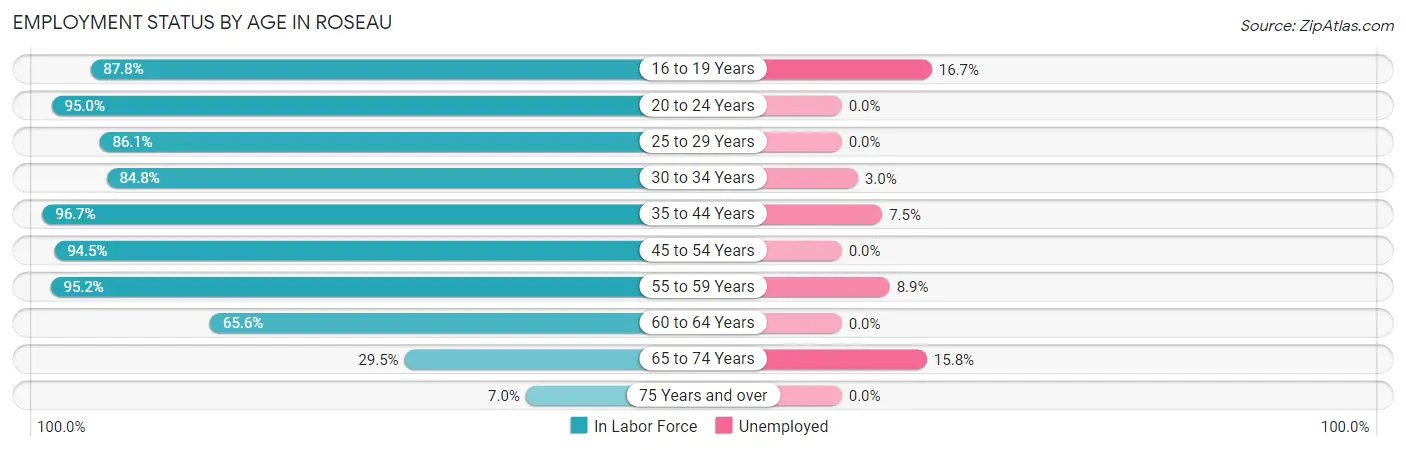
| Age Bracket | In Labor Force | Unemployed |
| 16 to 19 Years | 72 (87.8%) | 12 (16.7%) |
| 20 to 24 Years | 134 (95.0%) | 0 (0.0%) |
| 25 to 29 Years | 161 (86.1%) | 0 (0.0%) |
| 30 to 34 Years | 167 (84.8%) | 5 (3.0%) |
| 35 to 44 Years | 322 (96.7%) | 24 (7.5%) |
| 45 to 54 Years | 206 (94.5%) | 0 (0.0%) |
| 55 to 59 Years | 157 (95.2%) | 14 (8.9%) |
| 60 to 64 Years | 149 (65.6%) | 0 (0.0%) |
| 65 to 74 Years | 76 (29.5%) | 12 (15.8%) |
| 75 Years and over | 23 (7.0%) | 0 (0.0%) |
| Total | 1,467 (68.7%) | 67 (4.6%) |
Employment Status by Educational Attainment in Roseau
According to labor force statistics for Roseau, 87.6% of individuals (1,162) out of the total population between 25 and 64 years of age (1,327) are in the labor force, with 3.7% or 43 of them being unemployed. The group with the highest labor force participation rate are those with the educational attainment of college / associate degree, with 93.1% or 416 individuals in the labor force. Within the labor force, individuals with less than high school education have the highest percentage of unemployment, with 21.8% or 24 of them being unemployed.
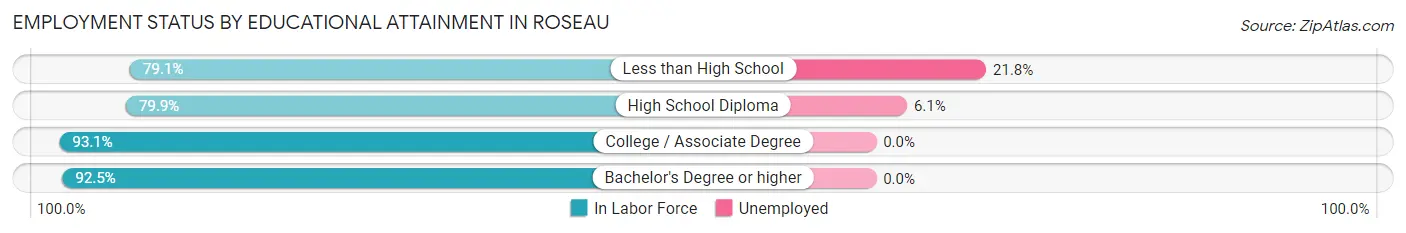
| Educational Attainment | In Labor Force | Unemployed |
| Less than High School | 110 (79.1%) | 30 (21.8%) |
| High School Diploma | 314 (79.9%) | 24 (6.1%) |
| College / Associate Degree | 416 (93.1%) | 0 (0.0%) |
| Bachelor's Degree or higher | 322 (92.5%) | 0 (0.0%) |
| Total | 1,162 (87.6%) | 49 (3.7%) |
Employment Occupations by Sex in Roseau
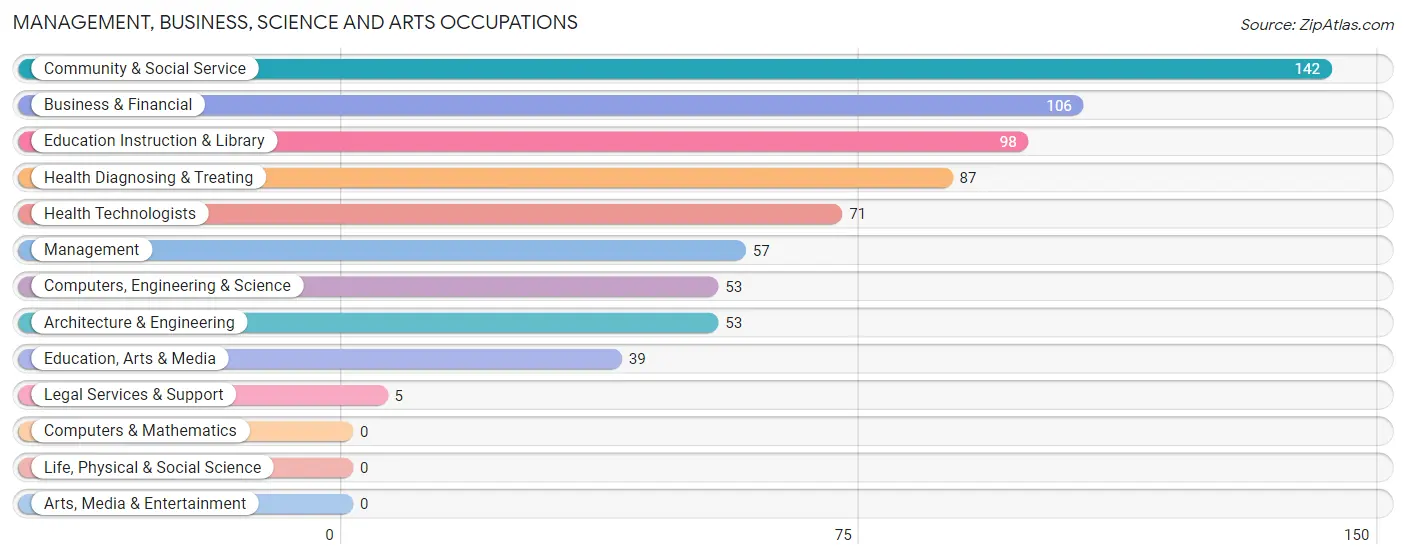
Management, Business, Science and Arts Occupations
The most common Management, Business, Science and Arts occupations in Roseau are Community & Social Service (142 | 10.1%), Business & Financial (106 | 7.6%), Education Instruction & Library (98 | 7.0%), Health Diagnosing & Treating (87 | 6.2%), and Health Technologists (71 | 5.1%).
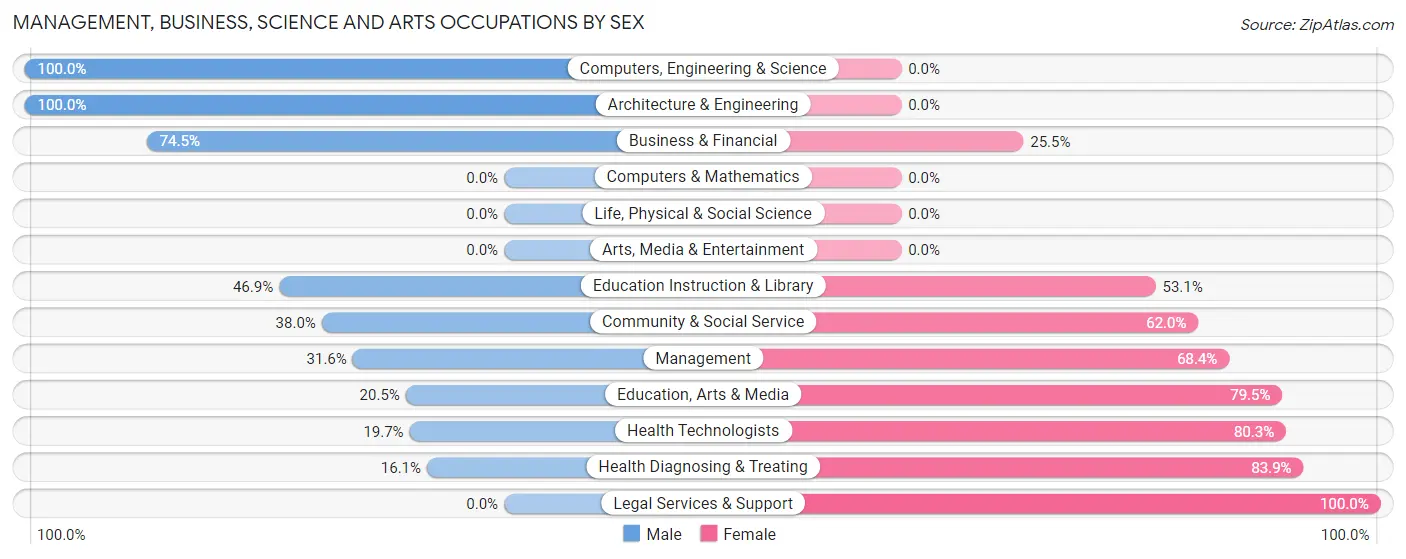
Management, Business, Science and Arts Occupations by Sex
Within the Management, Business, Science and Arts occupations in Roseau, the most male-oriented occupations are Computers, Engineering & Science (100.0%), Architecture & Engineering (100.0%), and Business & Financial (74.5%), while the most female-oriented occupations are Legal Services & Support (100.0%), Health Diagnosing & Treating (83.9%), and Health Technologists (80.3%).
| Occupation | Male | Female |
| Management | 18 (31.6%) | 39 (68.4%) |
| Business & Financial | 79 (74.5%) | 27 (25.5%) |
| Computers, Engineering & Science | 53 (100.0%) | 0 (0.0%) |
| Computers & Mathematics | 0 (0.0%) | 0 (0.0%) |
| Architecture & Engineering | 53 (100.0%) | 0 (0.0%) |
| Life, Physical & Social Science | 0 (0.0%) | 0 (0.0%) |
| Community & Social Service | 54 (38.0%) | 88 (62.0%) |
| Education, Arts & Media | 8 (20.5%) | 31 (79.5%) |
| Legal Services & Support | 0 (0.0%) | 5 (100.0%) |
| Education Instruction & Library | 46 (46.9%) | 52 (53.1%) |
| Arts, Media & Entertainment | 0 (0.0%) | 0 (0.0%) |
| Health Diagnosing & Treating | 14 (16.1%) | 73 (83.9%) |
| Health Technologists | 14 (19.7%) | 57 (80.3%) |
| Total (Category) | 218 (49.0%) | 227 (51.0%) |
| Total (Overall) | 728 (52.0%) | 672 (48.0%) |
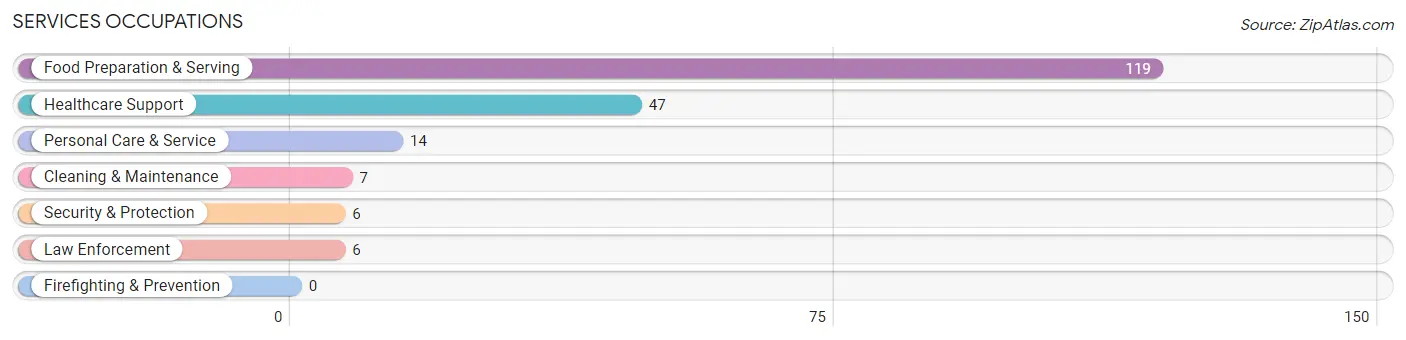
Services Occupations
The most common Services occupations in Roseau are Food Preparation & Serving (119 | 8.5%), Healthcare Support (47 | 3.4%), Personal Care & Service (14 | 1.0%), Cleaning & Maintenance (7 | 0.5%), and Security & Protection (6 | 0.4%).
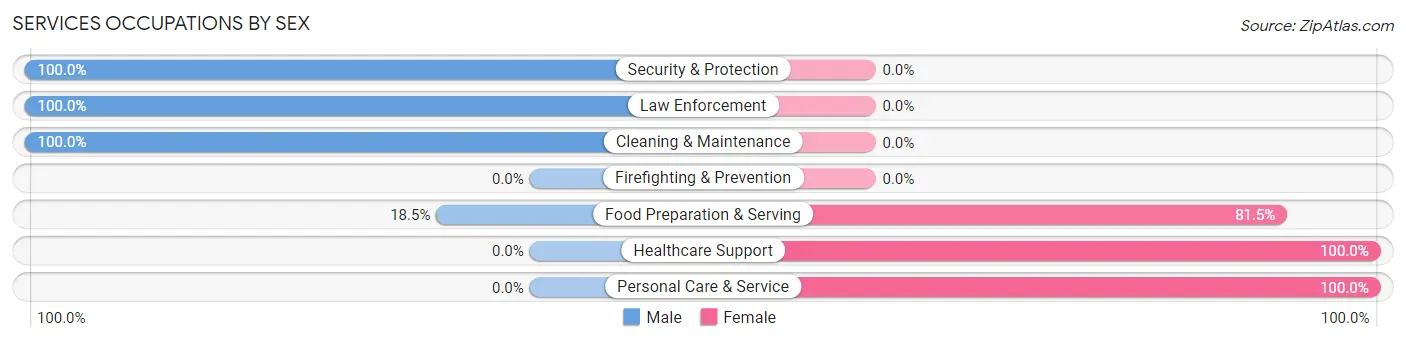
Services Occupations by Sex
Within the Services occupations in Roseau, the most male-oriented occupations are Security & Protection (100.0%), Law Enforcement (100.0%), and Cleaning & Maintenance (100.0%), while the most female-oriented occupations are Healthcare Support (100.0%), Personal Care & Service (100.0%), and Food Preparation & Serving (81.5%).
| Occupation | Male | Female |
| Healthcare Support | 0 (0.0%) | 47 (100.0%) |
| Security & Protection | 6 (100.0%) | 0 (0.0%) |
| Firefighting & Prevention | 0 (0.0%) | 0 (0.0%) |
| Law Enforcement | 6 (100.0%) | 0 (0.0%) |
| Food Preparation & Serving | 22 (18.5%) | 97 (81.5%) |
| Cleaning & Maintenance | 7 (100.0%) | 0 (0.0%) |
| Personal Care & Service | 0 (0.0%) | 14 (100.0%) |
| Total (Category) | 35 (18.1%) | 158 (81.9%) |
| Total (Overall) | 728 (52.0%) | 672 (48.0%) |
Sales and Office Occupations
The most common Sales and Office occupations in Roseau are Office & Administration (193 | 13.8%), and Sales & Related (34 | 2.4%).
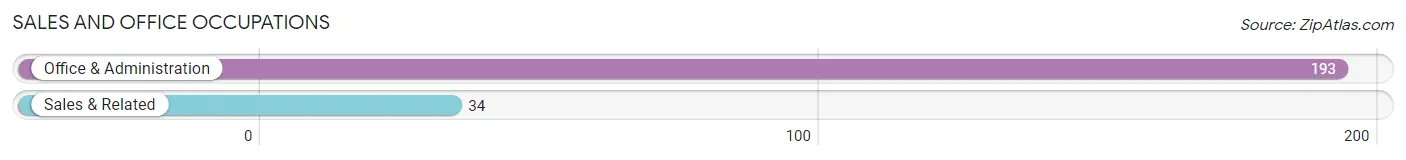
Sales and Office Occupations by Sex
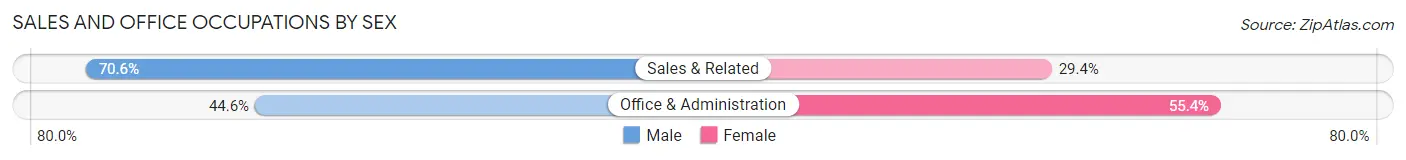
| Occupation | Male | Female |
| Sales & Related | 24 (70.6%) | 10 (29.4%) |
| Office & Administration | 86 (44.6%) | 107 (55.4%) |
| Total (Category) | 110 (48.5%) | 117 (51.5%) |
| Total (Overall) | 728 (52.0%) | 672 (48.0%) |
Natural Resources, Construction and Maintenance Occupations
The most common Natural Resources, Construction and Maintenance occupations in Roseau are Construction & Extraction (55 | 3.9%), Farming, Fishing & Forestry (39 | 2.8%), and Installation, Maintenance & Repair (26 | 1.9%).
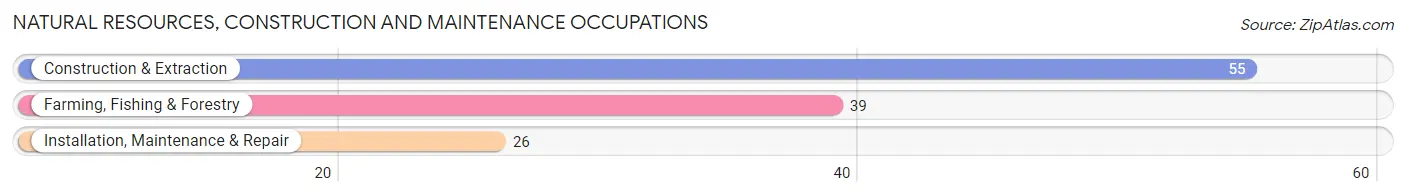
Natural Resources, Construction and Maintenance Occupations by Sex
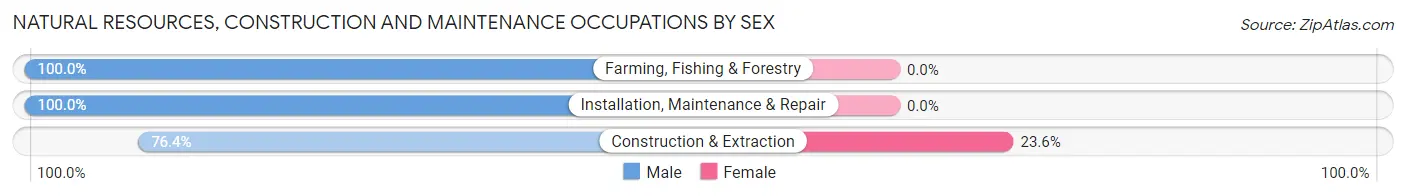
| Occupation | Male | Female |
| Farming, Fishing & Forestry | 39 (100.0%) | 0 (0.0%) |
| Construction & Extraction | 42 (76.4%) | 13 (23.6%) |
| Installation, Maintenance & Repair | 26 (100.0%) | 0 (0.0%) |
| Total (Category) | 107 (89.2%) | 13 (10.8%) |
| Total (Overall) | 728 (52.0%) | 672 (48.0%) |
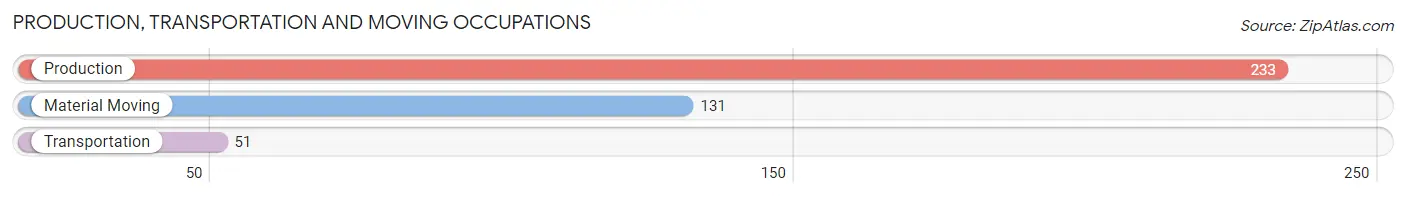
Production, Transportation and Moving Occupations
The most common Production, Transportation and Moving occupations in Roseau are Production (233 | 16.6%), Material Moving (131 | 9.4%), and Transportation (51 | 3.6%).
Production, Transportation and Moving Occupations by Sex
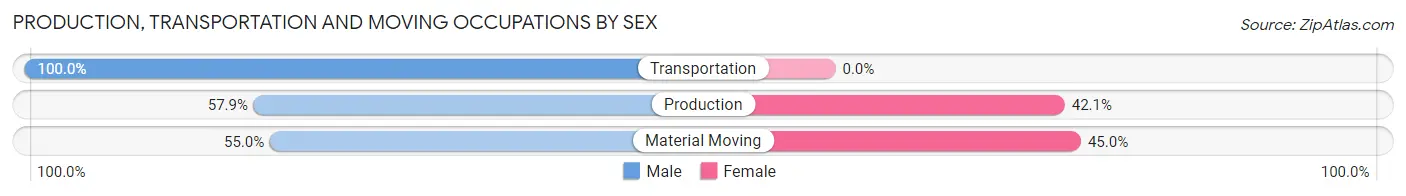
| Occupation | Male | Female |
| Production | 135 (57.9%) | 98 (42.1%) |
| Transportation | 51 (100.0%) | 0 (0.0%) |
| Material Moving | 72 (55.0%) | 59 (45.0%) |
| Total (Category) | 258 (62.2%) | 157 (37.8%) |
| Total (Overall) | 728 (52.0%) | 672 (48.0%) |
Employment Industries by Sex in Roseau
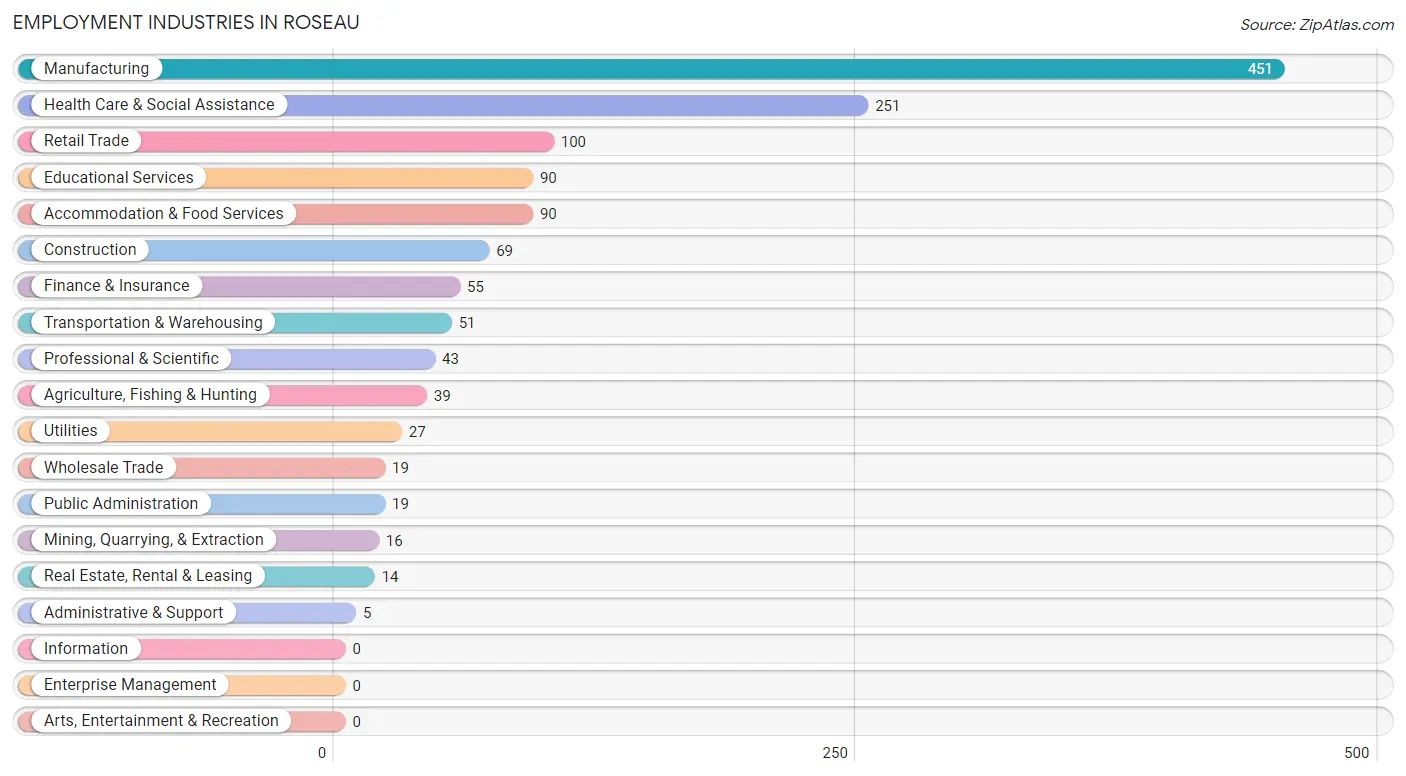
Employment Industries in Roseau
The major employment industries in Roseau include Manufacturing (451 | 32.2%), Health Care & Social Assistance (251 | 17.9%), Retail Trade (100 | 7.1%), Educational Services (90 | 6.4%), and Accommodation & Food Services (90 | 6.4%).
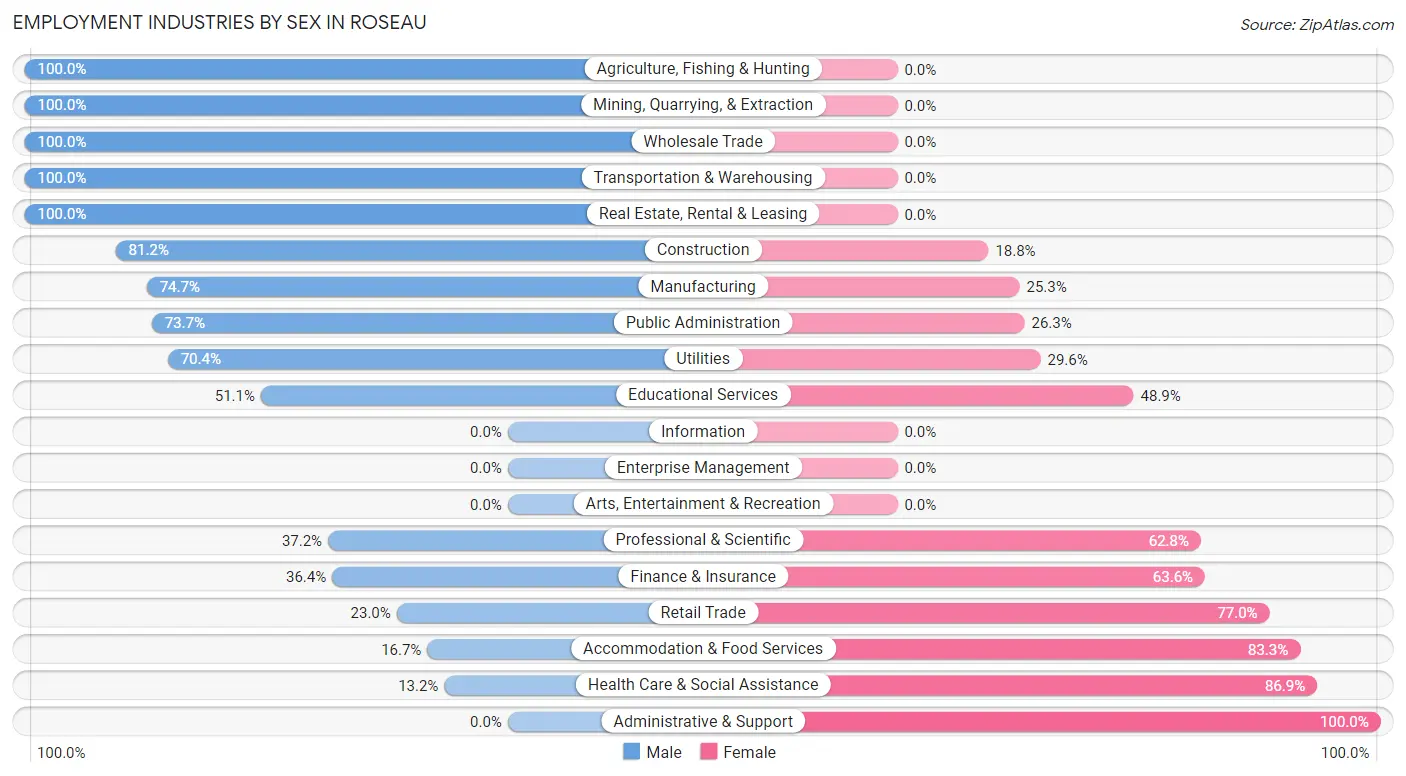
Employment Industries by Sex in Roseau
The Roseau industries that see more men than women are Agriculture, Fishing & Hunting (100.0%), Mining, Quarrying, & Extraction (100.0%), and Wholesale Trade (100.0%), whereas the industries that tend to have a higher number of women are Administrative & Support (100.0%), Health Care & Social Assistance (86.9%), and Accommodation & Food Services (83.3%).
| Industry | Male | Female |
| Agriculture, Fishing & Hunting | 39 (100.0%) | 0 (0.0%) |
| Mining, Quarrying, & Extraction | 16 (100.0%) | 0 (0.0%) |
| Construction | 56 (81.2%) | 13 (18.8%) |
| Manufacturing | 337 (74.7%) | 114 (25.3%) |
| Wholesale Trade | 19 (100.0%) | 0 (0.0%) |
| Retail Trade | 23 (23.0%) | 77 (77.0%) |
| Transportation & Warehousing | 51 (100.0%) | 0 (0.0%) |
| Utilities | 19 (70.4%) | 8 (29.6%) |
| Information | 0 (0.0%) | 0 (0.0%) |
| Finance & Insurance | 20 (36.4%) | 35 (63.6%) |
| Real Estate, Rental & Leasing | 14 (100.0%) | 0 (0.0%) |
| Professional & Scientific | 16 (37.2%) | 27 (62.8%) |
| Enterprise Management | 0 (0.0%) | 0 (0.0%) |
| Administrative & Support | 0 (0.0%) | 5 (100.0%) |
| Educational Services | 46 (51.1%) | 44 (48.9%) |
| Health Care & Social Assistance | 33 (13.2%) | 218 (86.9%) |
| Arts, Entertainment & Recreation | 0 (0.0%) | 0 (0.0%) |
| Accommodation & Food Services | 15 (16.7%) | 75 (83.3%) |
| Public Administration | 14 (73.7%) | 5 (26.3%) |
| Total | 728 (52.0%) | 672 (48.0%) |
Education in Roseau
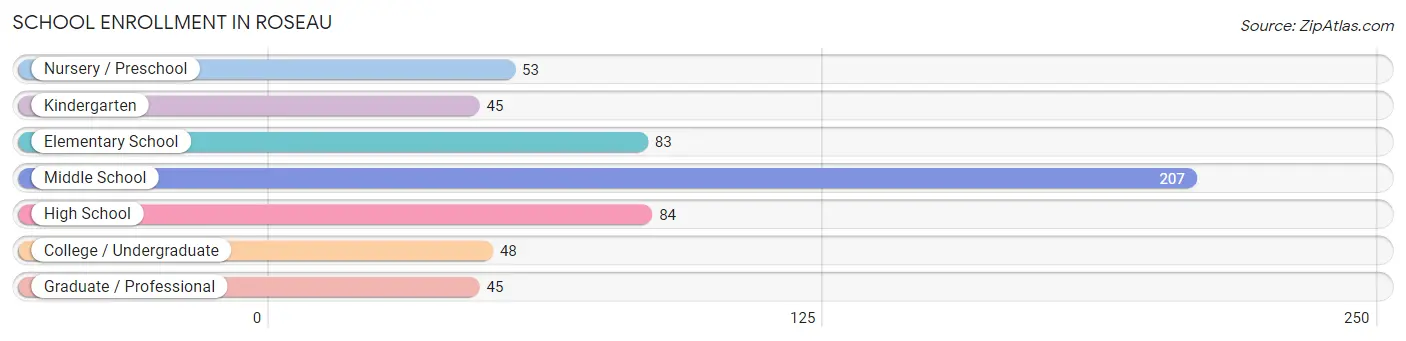
School Enrollment in Roseau
The most common levels of schooling among the 565 students in Roseau are middle school (207 | 36.6%), high school (84 | 14.9%), and elementary school (83 | 14.7%).
| School Level | # Students | % Students |
| Nursery / Preschool | 53 | 9.4% |
| Kindergarten | 45 | 8.0% |
| Elementary School | 83 | 14.7% |
| Middle School | 207 | 36.6% |
| High School | 84 | 14.9% |
| College / Undergraduate | 48 | 8.5% |
| Graduate / Professional | 45 | 8.0% |
| Total | 565 | 100.0% |
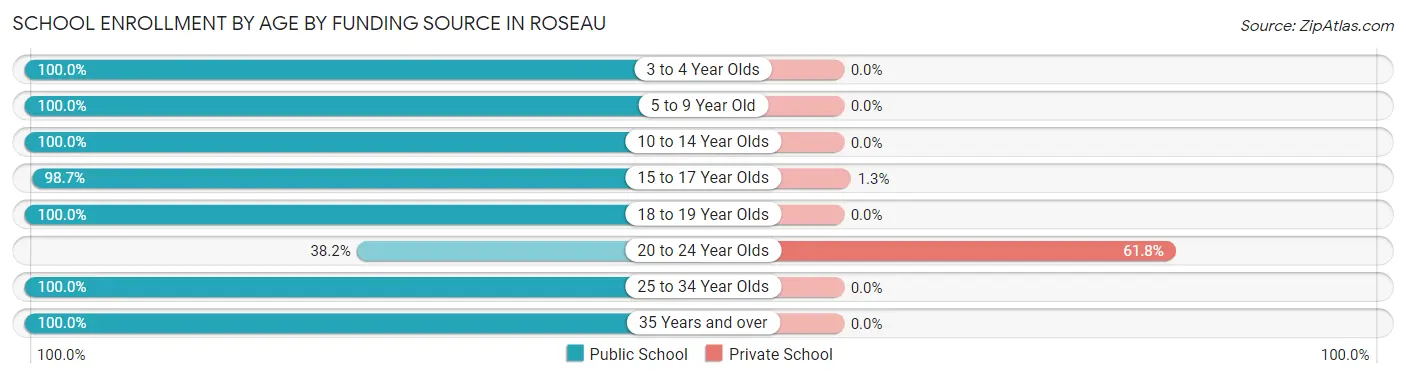
School Enrollment by Age by Funding Source in Roseau
Out of a total of 565 students who are enrolled in schools in Roseau, 35 (6.2%) attend a private institution, while the remaining 530 (93.8%) are enrolled in public schools. The age group of 20 to 24 year olds has the highest likelihood of being enrolled in private schools, with 34 (61.8% in the age bracket) enrolled. Conversely, the age group of 3 to 4 year olds has the lowest likelihood of being enrolled in a private school, with 45 (100.0% in the age bracket) attending a public institution.
| Age Bracket | Public School | Private School |
| 3 to 4 Year Olds | 45 (100.0%) | 0 (0.0%) |
| 5 to 9 Year Old | 110 (100.0%) | 0 (0.0%) |
| 10 to 14 Year Olds | 233 (100.0%) | 0 (0.0%) |
| 15 to 17 Year Olds | 75 (98.7%) | 1 (1.3%) |
| 18 to 19 Year Olds | 8 (100.0%) | 0 (0.0%) |
| 20 to 24 Year Olds | 21 (38.2%) | 34 (61.8%) |
| 25 to 34 Year Olds | 13 (100.0%) | 0 (0.0%) |
| 35 Years and over | 25 (100.0%) | 0 (0.0%) |
| Total | 530 (93.8%) | 35 (6.2%) |
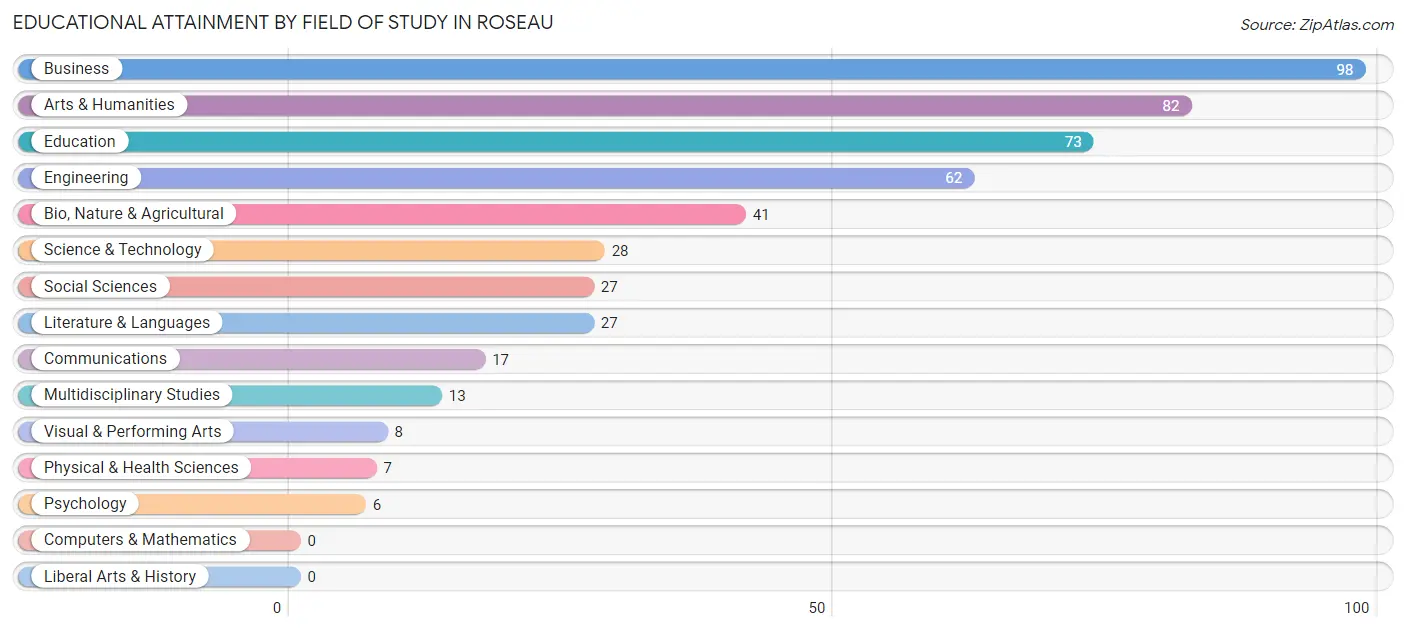
Educational Attainment by Field of Study in Roseau
Business (98 | 20.0%), arts & humanities (82 | 16.8%), education (73 | 14.9%), engineering (62 | 12.7%), and bio, nature & agricultural (41 | 8.4%) are the most common fields of study among 489 individuals in Roseau who have obtained a bachelor's degree or higher.
| Field of Study | # Graduates | % Graduates |
| Computers & Mathematics | 0 | 0.0% |
| Bio, Nature & Agricultural | 41 | 8.4% |
| Physical & Health Sciences | 7 | 1.4% |
| Psychology | 6 | 1.2% |
| Social Sciences | 27 | 5.5% |
| Engineering | 62 | 12.7% |
| Multidisciplinary Studies | 13 | 2.7% |
| Science & Technology | 28 | 5.7% |
| Business | 98 | 20.0% |
| Education | 73 | 14.9% |
| Literature & Languages | 27 | 5.5% |
| Liberal Arts & History | 0 | 0.0% |
| Visual & Performing Arts | 8 | 1.6% |
| Communications | 17 | 3.5% |
| Arts & Humanities | 82 | 16.8% |
| Total | 489 | 100.0% |
Transportation & Commute in Roseau
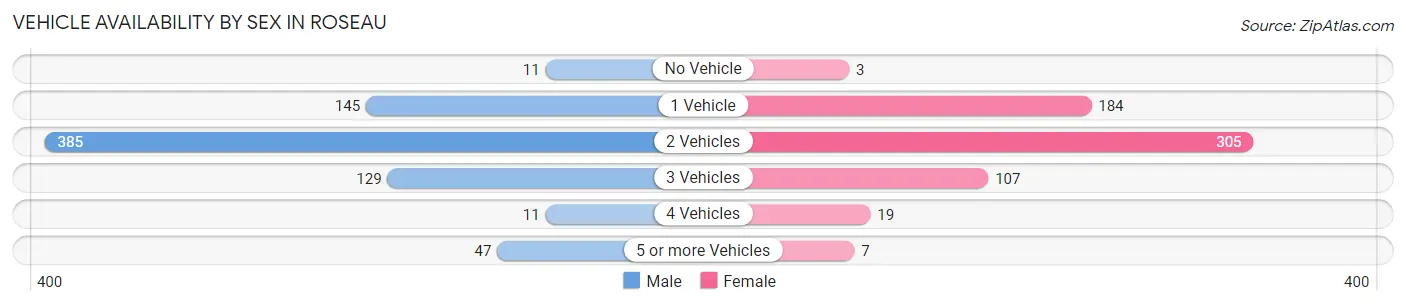
Vehicle Availability by Sex in Roseau
The most prevalent vehicle ownership categories in Roseau are males with 2 vehicles (385, accounting for 52.9%) and females with 2 vehicles (305, making up 61.6%).
| Vehicles Available | Male | Female |
| No Vehicle | 11 (1.5%) | 3 (0.5%) |
| 1 Vehicle | 145 (19.9%) | 184 (29.4%) |
| 2 Vehicles | 385 (52.9%) | 305 (48.8%) |
| 3 Vehicles | 129 (17.7%) | 107 (17.1%) |
| 4 Vehicles | 11 (1.5%) | 19 (3.0%) |
| 5 or more Vehicles | 47 (6.5%) | 7 (1.1%) |
| Total | 728 (100.0%) | 625 (100.0%) |
Commute Time in Roseau
The most frequently occuring commute durations in Roseau are 5 to 9 minutes (358 commuters, 32.0%), 10 to 14 minutes (299 commuters, 26.7%), and less than 5 minutes (135 commuters, 12.1%).
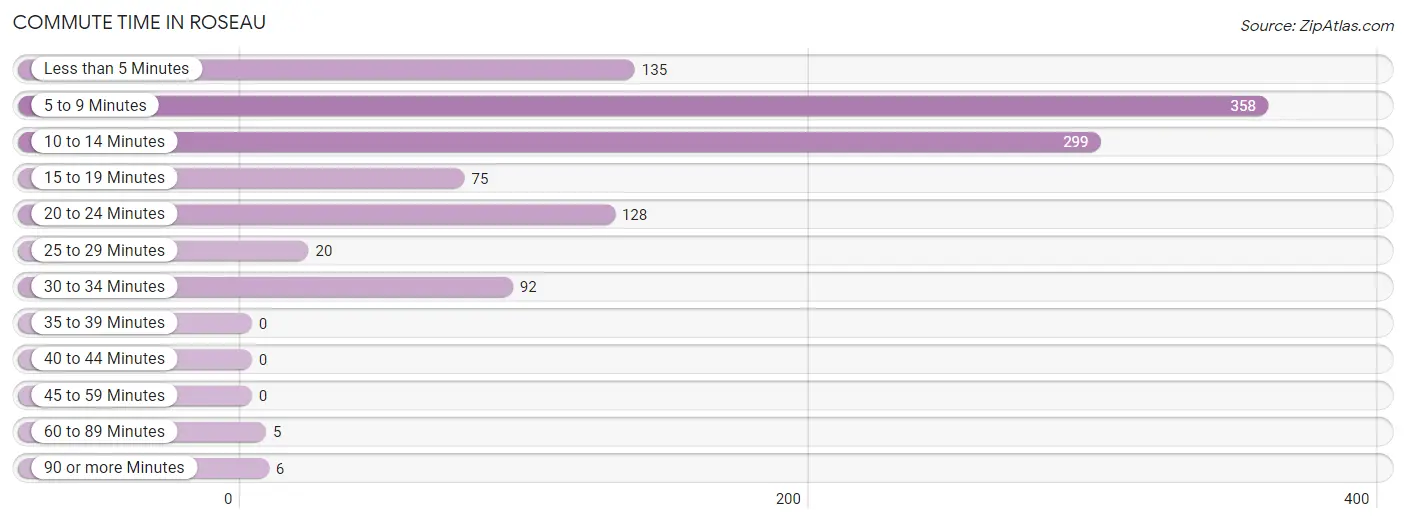
| Commute Time | # Commuters | % Commuters |
| Less than 5 Minutes | 135 | 12.1% |
| 5 to 9 Minutes | 358 | 32.0% |
| 10 to 14 Minutes | 299 | 26.7% |
| 15 to 19 Minutes | 75 | 6.7% |
| 20 to 24 Minutes | 128 | 11.5% |
| 25 to 29 Minutes | 20 | 1.8% |
| 30 to 34 Minutes | 92 | 8.2% |
| 35 to 39 Minutes | 0 | 0.0% |
| 40 to 44 Minutes | 0 | 0.0% |
| 45 to 59 Minutes | 0 | 0.0% |
| 60 to 89 Minutes | 5 | 0.4% |
| 90 or more Minutes | 6 | 0.5% |
Commute Time by Sex in Roseau
The most common commute times in Roseau are 10 to 14 minutes (227 commuters, 41.3%) for males and 5 to 9 minutes (194 commuters, 34.1%) for females.
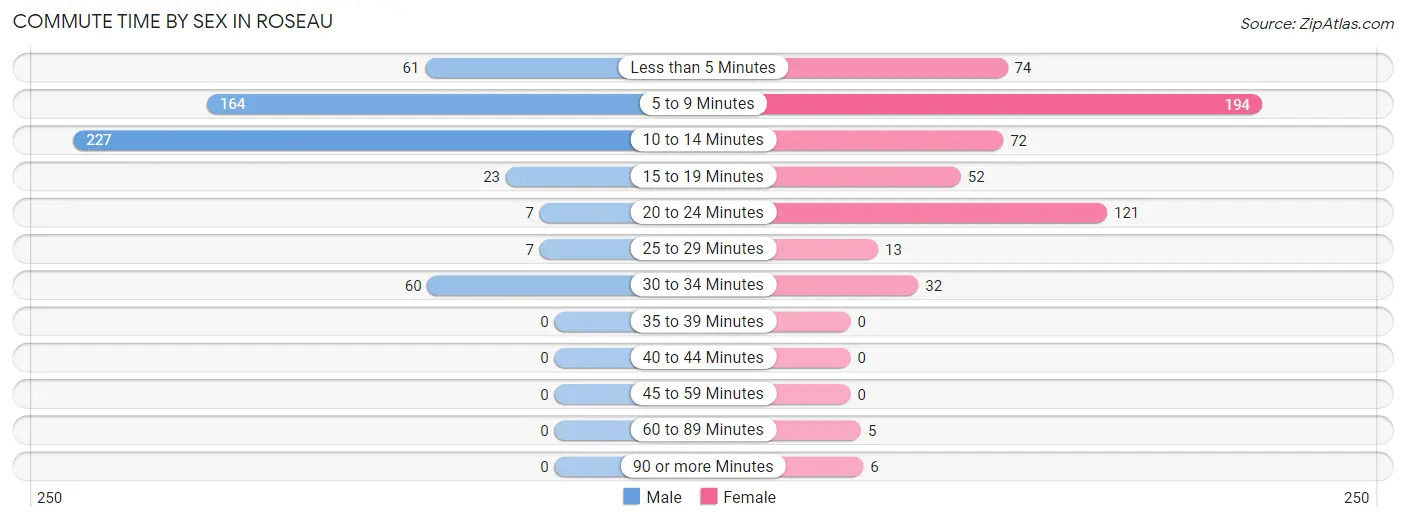
| Commute Time | Male | Female |
| Less than 5 Minutes | 61 (11.1%) | 74 (13.0%) |
| 5 to 9 Minutes | 164 (29.9%) | 194 (34.1%) |
| 10 to 14 Minutes | 227 (41.3%) | 72 (12.7%) |
| 15 to 19 Minutes | 23 (4.2%) | 52 (9.1%) |
| 20 to 24 Minutes | 7 (1.3%) | 121 (21.3%) |
| 25 to 29 Minutes | 7 (1.3%) | 13 (2.3%) |
| 30 to 34 Minutes | 60 (10.9%) | 32 (5.6%) |
| 35 to 39 Minutes | 0 (0.0%) | 0 (0.0%) |
| 40 to 44 Minutes | 0 (0.0%) | 0 (0.0%) |
| 45 to 59 Minutes | 0 (0.0%) | 0 (0.0%) |
| 60 to 89 Minutes | 0 (0.0%) | 5 (0.9%) |
| 90 or more Minutes | 0 (0.0%) | 6 (1.1%) |
Time of Departure to Work by Sex in Roseau
The most frequent times of departure to work in Roseau are 7:30 AM to 7:59 AM (83, 15.1%) for males and 12:00 PM to 3:59 PM (112, 19.7%) for females.
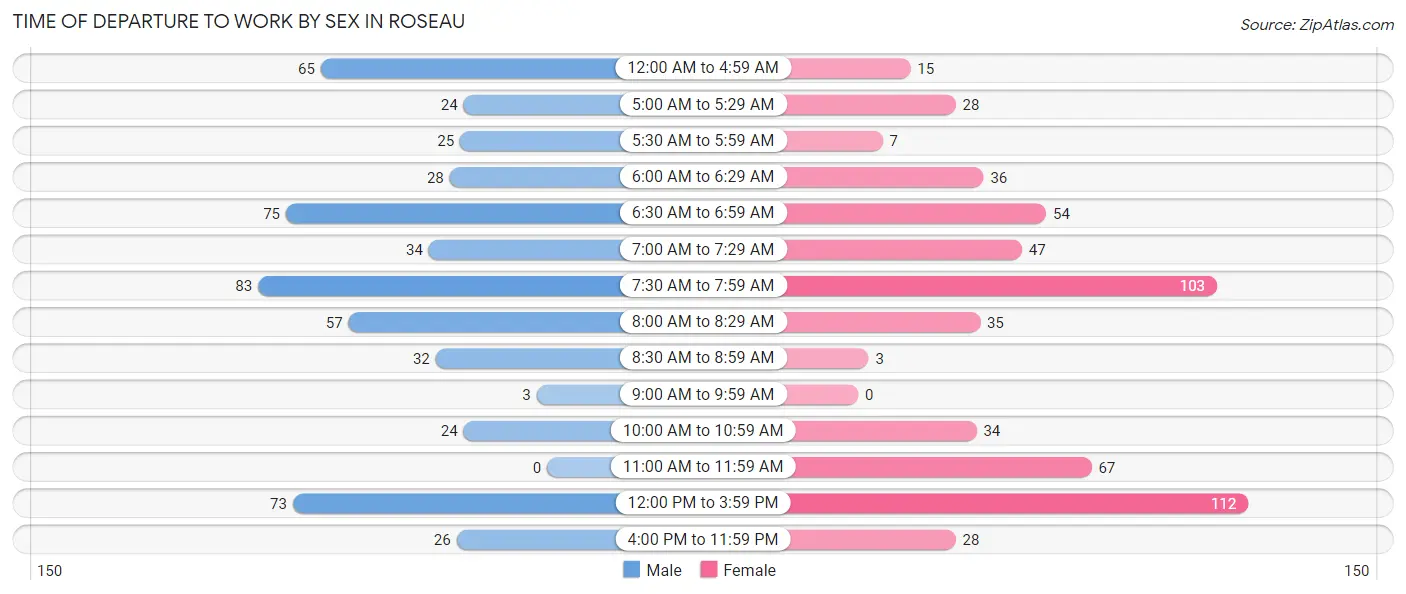
| Time of Departure | Male | Female |
| 12:00 AM to 4:59 AM | 65 (11.8%) | 15 (2.6%) |
| 5:00 AM to 5:29 AM | 24 (4.4%) | 28 (4.9%) |
| 5:30 AM to 5:59 AM | 25 (4.5%) | 7 (1.2%) |
| 6:00 AM to 6:29 AM | 28 (5.1%) | 36 (6.3%) |
| 6:30 AM to 6:59 AM | 75 (13.7%) | 54 (9.5%) |
| 7:00 AM to 7:29 AM | 34 (6.2%) | 47 (8.3%) |
| 7:30 AM to 7:59 AM | 83 (15.1%) | 103 (18.1%) |
| 8:00 AM to 8:29 AM | 57 (10.4%) | 35 (6.1%) |
| 8:30 AM to 8:59 AM | 32 (5.8%) | 3 (0.5%) |
| 9:00 AM to 9:59 AM | 3 (0.5%) | 0 (0.0%) |
| 10:00 AM to 10:59 AM | 24 (4.4%) | 34 (6.0%) |
| 11:00 AM to 11:59 AM | 0 (0.0%) | 67 (11.8%) |
| 12:00 PM to 3:59 PM | 73 (13.3%) | 112 (19.7%) |
| 4:00 PM to 11:59 PM | 26 (4.7%) | 28 (4.9%) |
| Total | 549 (100.0%) | 569 (100.0%) |
Housing Occupancy in Roseau
Occupancy by Ownership in Roseau
Of the total 1,218 dwellings in Roseau, owner-occupied units account for 725 (59.5%), while renter-occupied units make up 493 (40.5%).
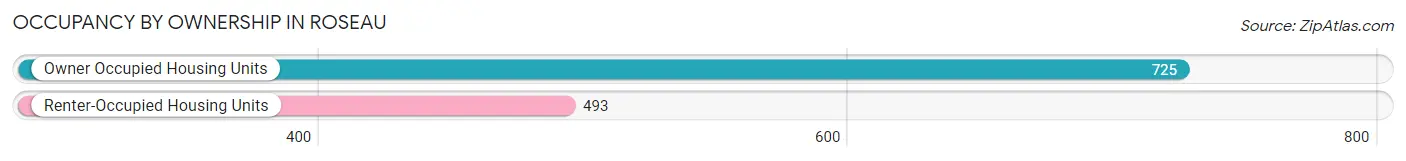
| Occupancy | # Housing Units | % Housing Units |
| Owner Occupied Housing Units | 725 | 59.5% |
| Renter-Occupied Housing Units | 493 | 40.5% |
| Total Occupied Housing Units | 1,218 | 100.0% |
Occupancy by Household Size in Roseau
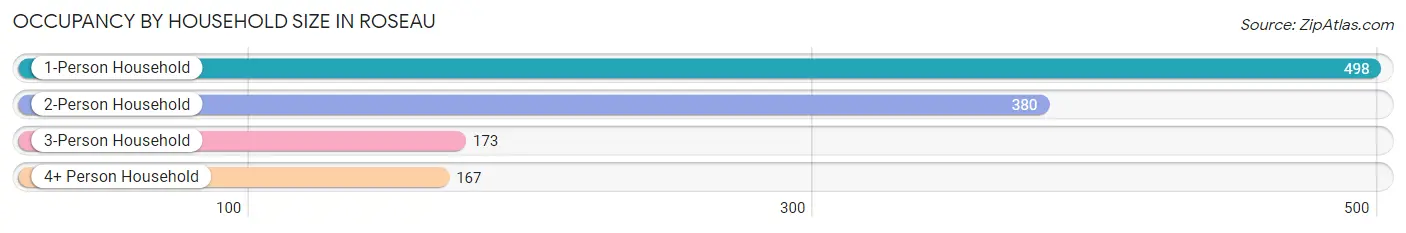
| Household Size | # Housing Units | % Housing Units |
| 1-Person Household | 498 | 40.9% |
| 2-Person Household | 380 | 31.2% |
| 3-Person Household | 173 | 14.2% |
| 4+ Person Household | 167 | 13.7% |
| Total Housing Units | 1,218 | 100.0% |
Occupancy by Ownership by Household Size in Roseau
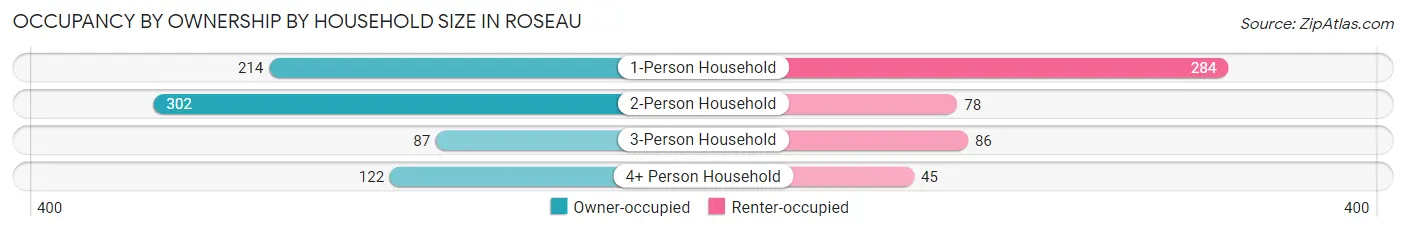
| Household Size | Owner-occupied | Renter-occupied |
| 1-Person Household | 214 (43.0%) | 284 (57.0%) |
| 2-Person Household | 302 (79.5%) | 78 (20.5%) |
| 3-Person Household | 87 (50.3%) | 86 (49.7%) |
| 4+ Person Household | 122 (73.1%) | 45 (27.0%) |
| Total Housing Units | 725 (59.5%) | 493 (40.5%) |
Occupancy by Educational Attainment in Roseau
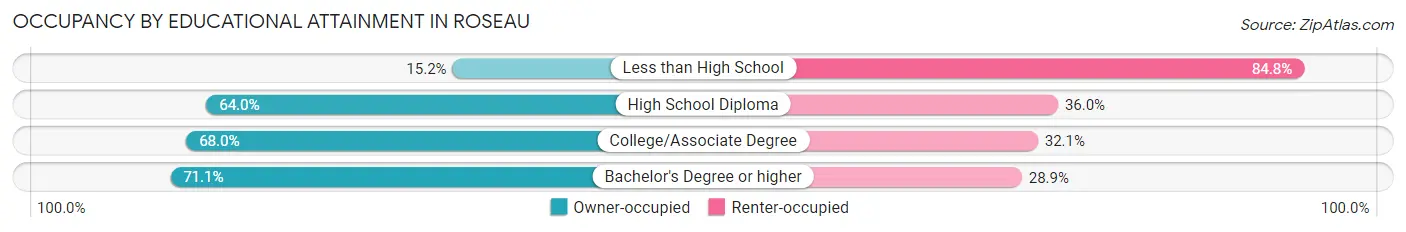
| Household Size | Owner-occupied | Renter-occupied |
| Less than High School | 29 (15.2%) | 162 (84.8%) |
| High School Diploma | 197 (64.0%) | 111 (36.0%) |
| College/Associate Degree | 265 (67.9%) | 125 (32.1%) |
| Bachelor's Degree or higher | 234 (71.1%) | 95 (28.9%) |
Occupancy by Age of Householder in Roseau
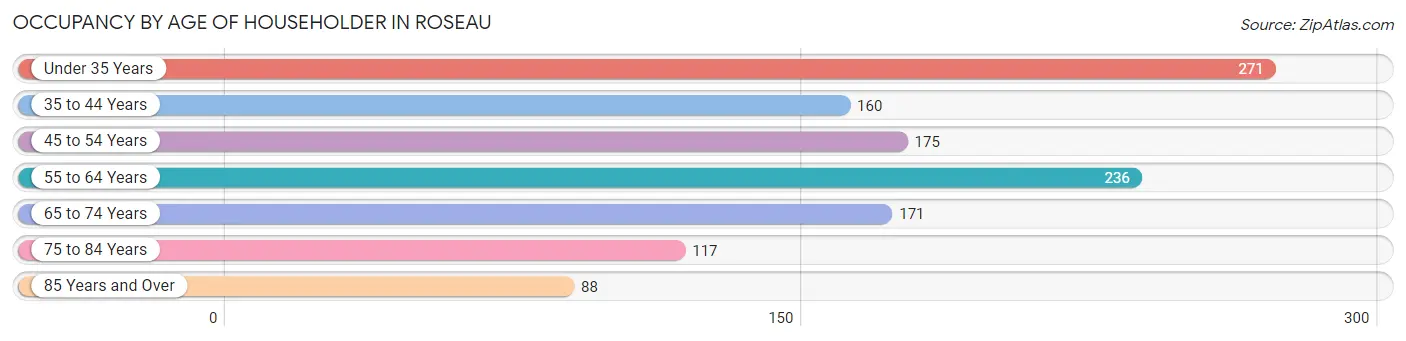
| Age Bracket | # Households | % Households |
| Under 35 Years | 271 | 22.3% |
| 35 to 44 Years | 160 | 13.1% |
| 45 to 54 Years | 175 | 14.4% |
| 55 to 64 Years | 236 | 19.4% |
| 65 to 74 Years | 171 | 14.0% |
| 75 to 84 Years | 117 | 9.6% |
| 85 Years and Over | 88 | 7.2% |
| Total | 1,218 | 100.0% |
Housing Finances in Roseau
Median Income by Occupancy in Roseau
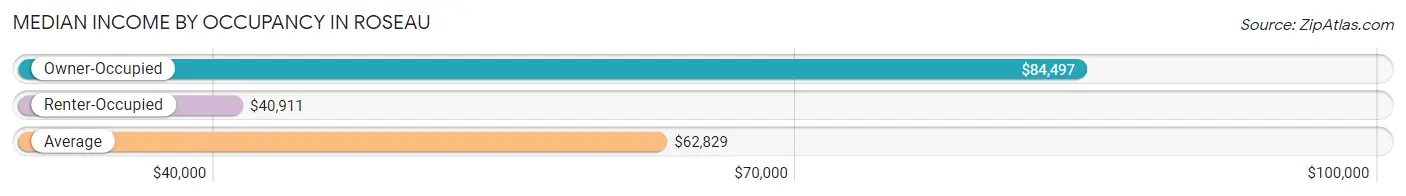
| Occupancy Type | # Households | Median Income |
| Owner-Occupied | 725 (59.5%) | $84,497 |
| Renter-Occupied | 493 (40.5%) | $40,911 |
| Average | 1,218 (100.0%) | $62,829 |
Occupancy by Householder Income Bracket in Roseau
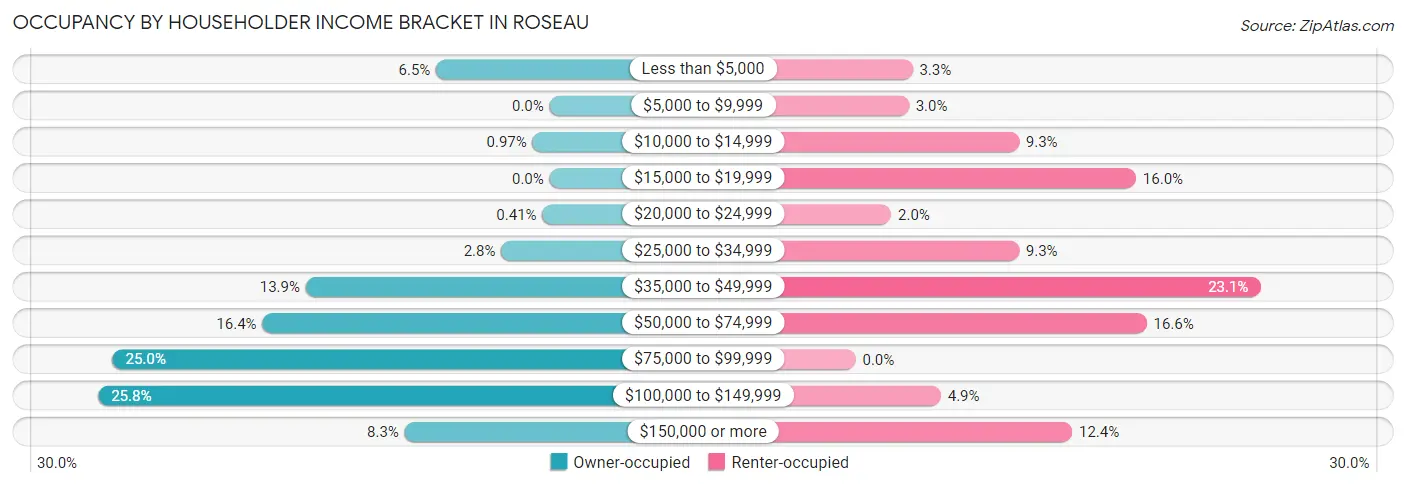
| Income Bracket | Owner-occupied | Renter-occupied |
| Less than $5,000 | 47 (6.5%) | 16 (3.3%) |
| $5,000 to $9,999 | 0 (0.0%) | 15 (3.0%) |
| $10,000 to $14,999 | 7 (1.0%) | 46 (9.3%) |
| $15,000 to $19,999 | 0 (0.0%) | 79 (16.0%) |
| $20,000 to $24,999 | 3 (0.4%) | 10 (2.0%) |
| $25,000 to $34,999 | 20 (2.8%) | 46 (9.3%) |
| $35,000 to $49,999 | 101 (13.9%) | 114 (23.1%) |
| $50,000 to $74,999 | 119 (16.4%) | 82 (16.6%) |
| $75,000 to $99,999 | 181 (25.0%) | 0 (0.0%) |
| $100,000 to $149,999 | 187 (25.8%) | 24 (4.9%) |
| $150,000 or more | 60 (8.3%) | 61 (12.4%) |
| Total | 725 (100.0%) | 493 (100.0%) |
Monthly Housing Cost Tiers in Roseau
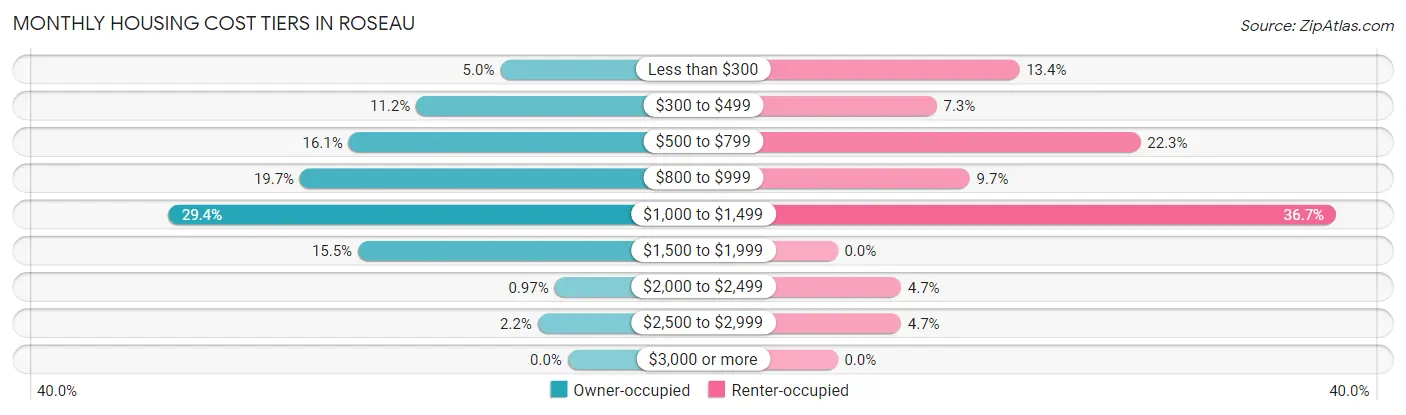
| Monthly Cost | Owner-occupied | Renter-occupied |
| Less than $300 | 36 (5.0%) | 66 (13.4%) |
| $300 to $499 | 81 (11.2%) | 36 (7.3%) |
| $500 to $799 | 117 (16.1%) | 110 (22.3%) |
| $800 to $999 | 143 (19.7%) | 48 (9.7%) |
| $1,000 to $1,499 | 213 (29.4%) | 181 (36.7%) |
| $1,500 to $1,999 | 112 (15.4%) | 0 (0.0%) |
| $2,000 to $2,499 | 7 (1.0%) | 23 (4.7%) |
| $2,500 to $2,999 | 16 (2.2%) | 23 (4.7%) |
| $3,000 or more | 0 (0.0%) | 0 (0.0%) |
| Total | 725 (100.0%) | 493 (100.0%) |
Physical Housing Characteristics in Roseau
Housing Structures in Roseau
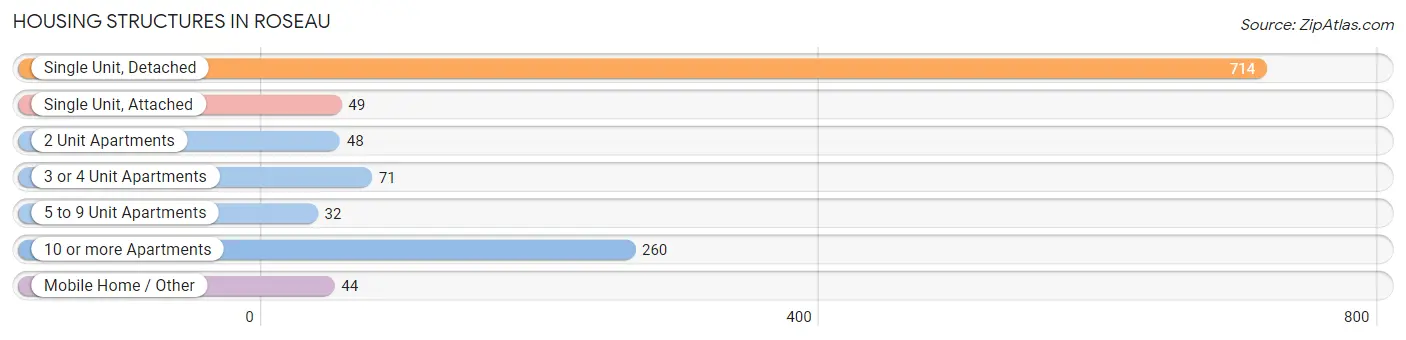
| Structure Type | # Housing Units | % Housing Units |
| Single Unit, Detached | 714 | 58.6% |
| Single Unit, Attached | 49 | 4.0% |
| 2 Unit Apartments | 48 | 3.9% |
| 3 or 4 Unit Apartments | 71 | 5.8% |
| 5 to 9 Unit Apartments | 32 | 2.6% |
| 10 or more Apartments | 260 | 21.3% |
| Mobile Home / Other | 44 | 3.6% |
| Total | 1,218 | 100.0% |
Housing Structures by Occupancy in Roseau

| Structure Type | Owner-occupied | Renter-occupied |
| Single Unit, Detached | 654 (91.6%) | 60 (8.4%) |
| Single Unit, Attached | 29 (59.2%) | 20 (40.8%) |
| 2 Unit Apartments | 4 (8.3%) | 44 (91.7%) |
| 3 or 4 Unit Apartments | 0 (0.0%) | 71 (100.0%) |
| 5 to 9 Unit Apartments | 0 (0.0%) | 32 (100.0%) |
| 10 or more Apartments | 0 (0.0%) | 260 (100.0%) |
| Mobile Home / Other | 38 (86.4%) | 6 (13.6%) |
| Total | 725 (59.5%) | 493 (40.5%) |
Housing Structures by Number of Rooms in Roseau
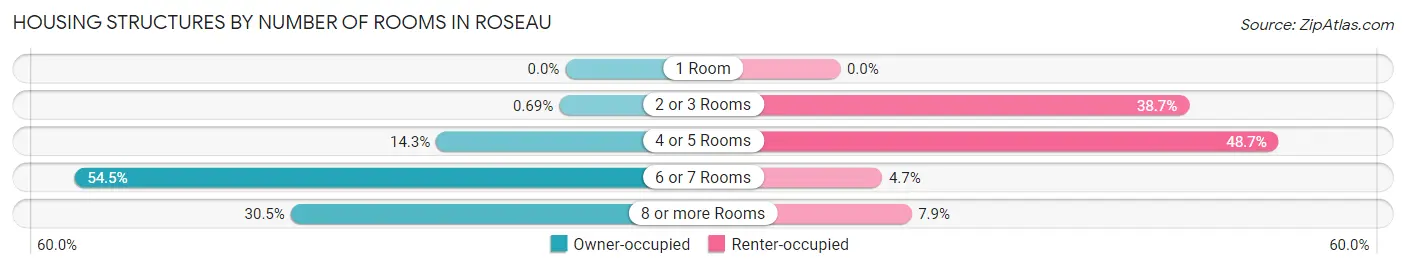
| Number of Rooms | Owner-occupied | Renter-occupied |
| 1 Room | 0 (0.0%) | 0 (0.0%) |
| 2 or 3 Rooms | 5 (0.7%) | 191 (38.7%) |
| 4 or 5 Rooms | 104 (14.3%) | 240 (48.7%) |
| 6 or 7 Rooms | 395 (54.5%) | 23 (4.7%) |
| 8 or more Rooms | 221 (30.5%) | 39 (7.9%) |
| Total | 725 (100.0%) | 493 (100.0%) |
Housing Structure by Heating Type in Roseau
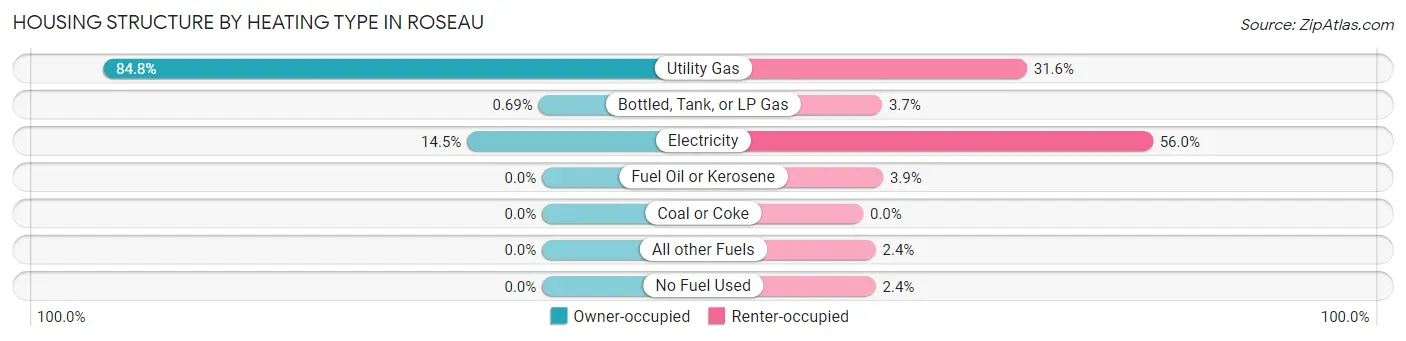
| Heating Type | Owner-occupied | Renter-occupied |
| Utility Gas | 615 (84.8%) | 156 (31.6%) |
| Bottled, Tank, or LP Gas | 5 (0.7%) | 18 (3.6%) |
| Electricity | 105 (14.5%) | 276 (56.0%) |
| Fuel Oil or Kerosene | 0 (0.0%) | 19 (3.8%) |
| Coal or Coke | 0 (0.0%) | 0 (0.0%) |
| All other Fuels | 0 (0.0%) | 12 (2.4%) |
| No Fuel Used | 0 (0.0%) | 12 (2.4%) |
| Total | 725 (100.0%) | 493 (100.0%) |
Household Vehicle Usage in Roseau
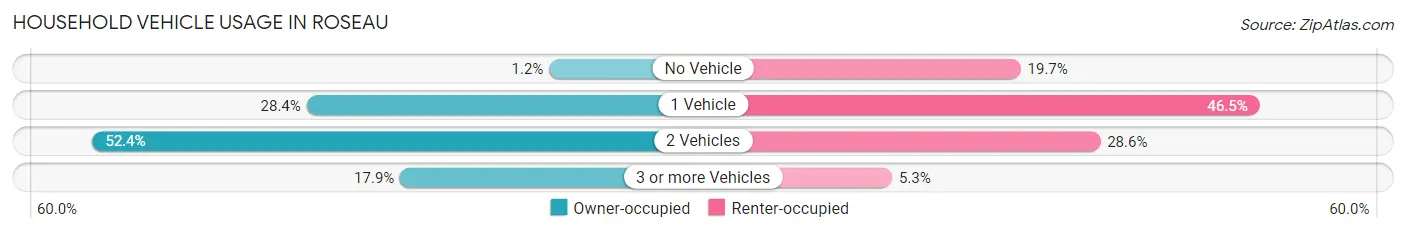
| Vehicles per Household | Owner-occupied | Renter-occupied |
| No Vehicle | 9 (1.2%) | 97 (19.7%) |
| 1 Vehicle | 206 (28.4%) | 229 (46.5%) |
| 2 Vehicles | 380 (52.4%) | 141 (28.6%) |
| 3 or more Vehicles | 130 (17.9%) | 26 (5.3%) |
| Total | 725 (100.0%) | 493 (100.0%) |
Real Estate & Mortgages in Roseau
Real Estate and Mortgage Overview in Roseau
| Characteristic | Without Mortgage | With Mortgage |
| Housing Units | 254 | 471 |
| Median Property Value | $122,100 | $145,300 |
| Median Household Income | $48,750 | $15 |
| Monthly Housing Costs | $517 | $0 |
| Real Estate Taxes | $1,755 | $0 |
Property Value by Mortgage Status in Roseau
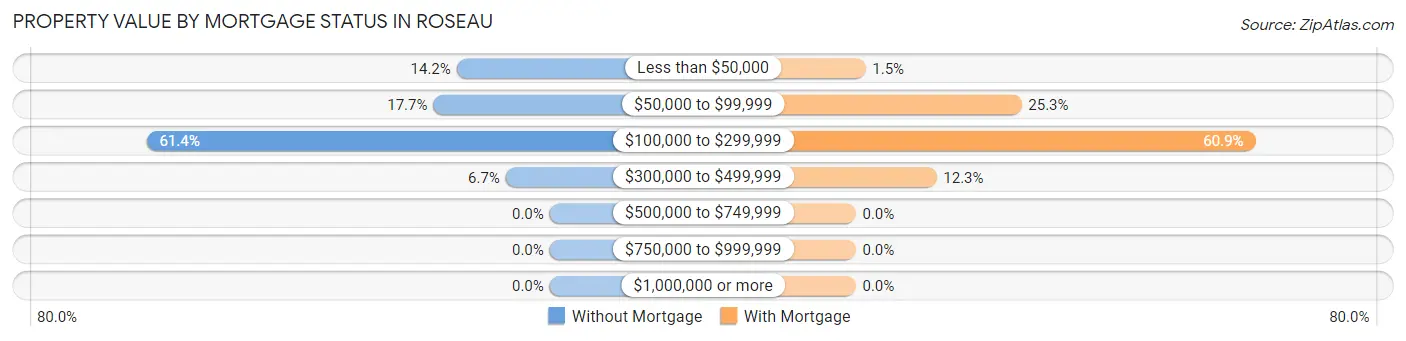
| Property Value | Without Mortgage | With Mortgage |
| Less than $50,000 | 36 (14.2%) | 7 (1.5%) |
| $50,000 to $99,999 | 45 (17.7%) | 119 (25.3%) |
| $100,000 to $299,999 | 156 (61.4%) | 287 (60.9%) |
| $300,000 to $499,999 | 17 (6.7%) | 58 (12.3%) |
| $500,000 to $749,999 | 0 (0.0%) | 0 (0.0%) |
| $750,000 to $999,999 | 0 (0.0%) | 0 (0.0%) |
| $1,000,000 or more | 0 (0.0%) | 0 (0.0%) |
| Total | 254 (100.0%) | 471 (100.0%) |
Household Income by Mortgage Status in Roseau
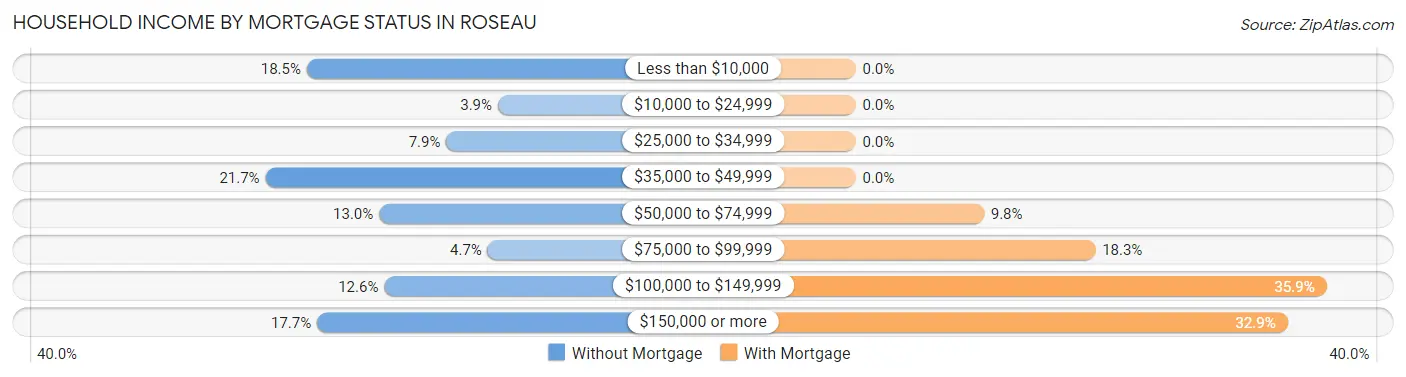
| Household Income | Without Mortgage | With Mortgage |
| Less than $10,000 | 47 (18.5%) | 0 (0.0%) |
| $10,000 to $24,999 | 10 (3.9%) | 0 (0.0%) |
| $25,000 to $34,999 | 20 (7.9%) | 0 (0.0%) |
| $35,000 to $49,999 | 55 (21.6%) | 0 (0.0%) |
| $50,000 to $74,999 | 33 (13.0%) | 46 (9.8%) |
| $75,000 to $99,999 | 12 (4.7%) | 86 (18.3%) |
| $100,000 to $149,999 | 32 (12.6%) | 169 (35.9%) |
| $150,000 or more | 45 (17.7%) | 155 (32.9%) |
| Total | 254 (100.0%) | 471 (100.0%) |
Property Value to Household Income Ratio in Roseau
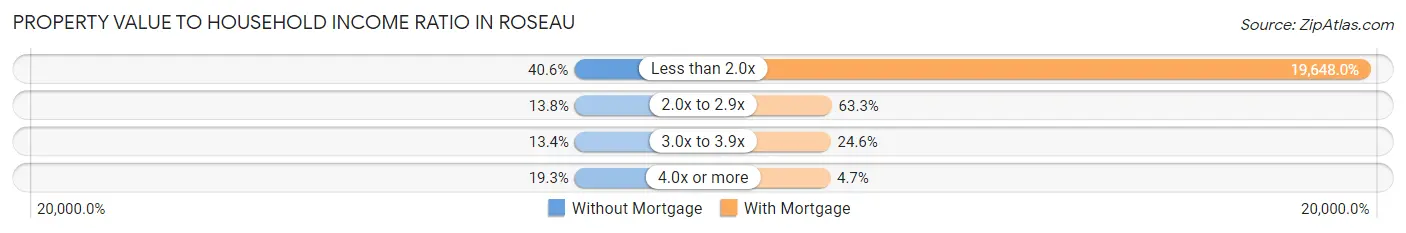
| Value-to-Income Ratio | Without Mortgage | With Mortgage |
| Less than 2.0x | 103 (40.6%) | 92,542 (19,648.0%) |
| 2.0x to 2.9x | 35 (13.8%) | 298 (63.3%) |
| 3.0x to 3.9x | 34 (13.4%) | 116 (24.6%) |
| 4.0x or more | 49 (19.3%) | 22 (4.7%) |
| Total | 254 (100.0%) | 471 (100.0%) |
Real Estate Taxes by Mortgage Status in Roseau
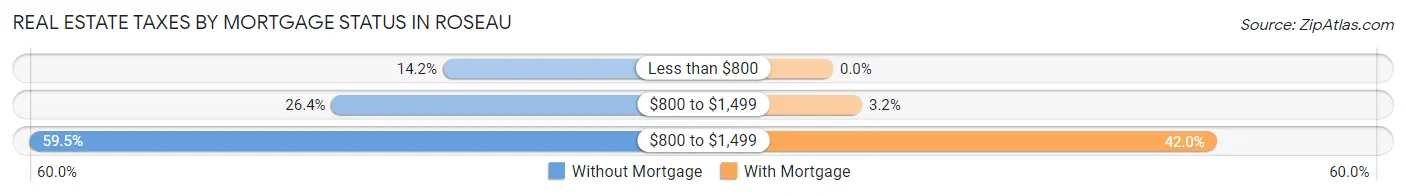
| Property Taxes | Without Mortgage | With Mortgage |
| Less than $800 | 36 (14.2%) | 0 (0.0%) |
| $800 to $1,499 | 67 (26.4%) | 15 (3.2%) |
| $800 to $1,499 | 151 (59.5%) | 198 (42.0%) |
| Total | 254 (100.0%) | 471 (100.0%) |
Health & Disability in Roseau
Health Insurance Coverage by Age in Roseau
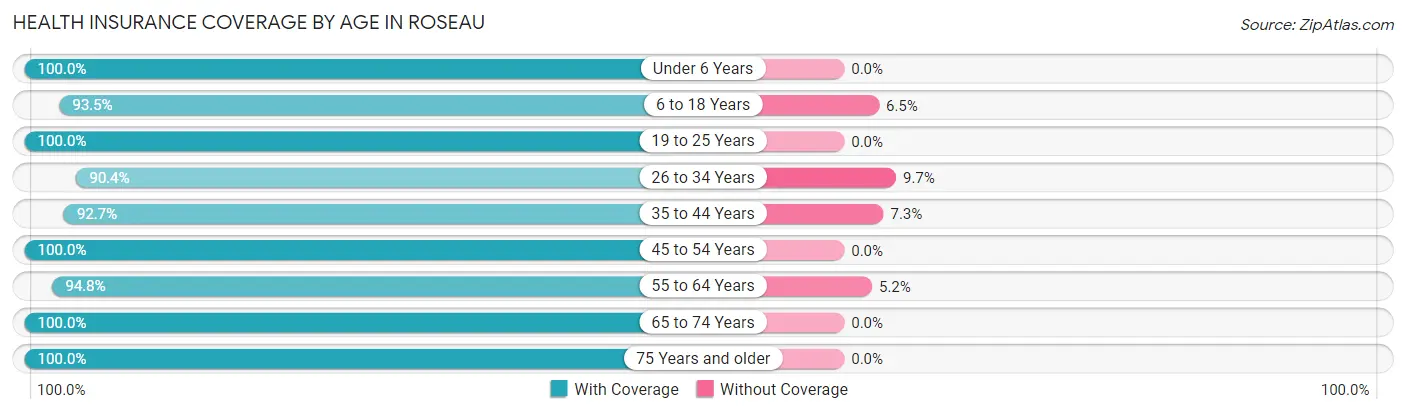
| Age Bracket | With Coverage | Without Coverage |
| Under 6 Years | 229 (100.0%) | 0 (0.0%) |
| 6 to 18 Years | 404 (93.5%) | 28 (6.5%) |
| 19 to 25 Years | 153 (100.0%) | 0 (0.0%) |
| 26 to 34 Years | 337 (90.3%) | 36 (9.7%) |
| 35 to 44 Years | 304 (92.7%) | 24 (7.3%) |
| 45 to 54 Years | 218 (100.0%) | 0 (0.0%) |
| 55 to 64 Years | 367 (94.8%) | 20 (5.2%) |
| 65 to 74 Years | 253 (100.0%) | 0 (0.0%) |
| 75 Years and older | 275 (100.0%) | 0 (0.0%) |
| Total | 2,540 (95.9%) | 108 (4.1%) |
Health Insurance Coverage by Citizenship Status in Roseau
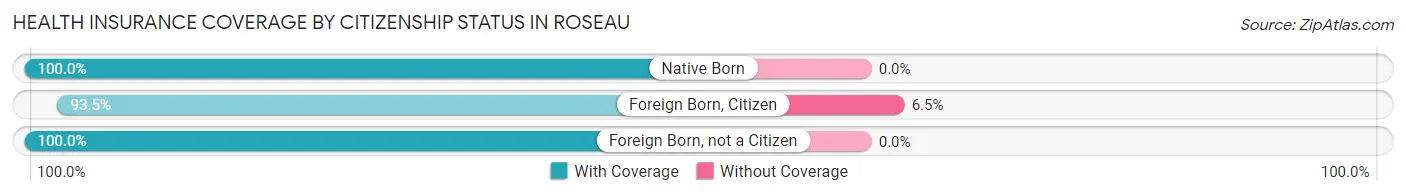
| Citizenship Status | With Coverage | Without Coverage |
| Native Born | 229 (100.0%) | 0 (0.0%) |
| Foreign Born, Citizen | 404 (93.5%) | 28 (6.5%) |
| Foreign Born, not a Citizen | 153 (100.0%) | 0 (0.0%) |
Health Insurance Coverage by Household Income in Roseau
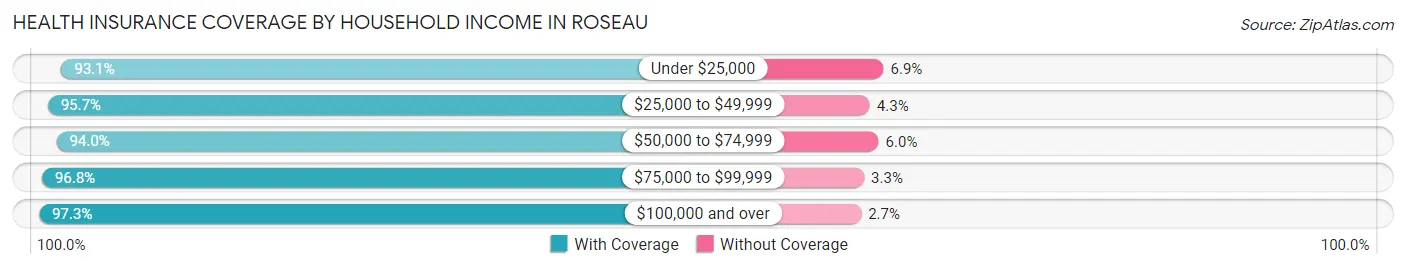
| Household Income | With Coverage | Without Coverage |
| Under $25,000 | 284 (93.1%) | 21 (6.9%) |
| $25,000 to $49,999 | 618 (95.7%) | 28 (4.3%) |
| $50,000 to $74,999 | 315 (94.0%) | 20 (6.0%) |
| $75,000 to $99,999 | 447 (96.8%) | 15 (3.3%) |
| $100,000 and over | 864 (97.3%) | 24 (2.7%) |
Public vs Private Health Insurance Coverage by Age in Roseau
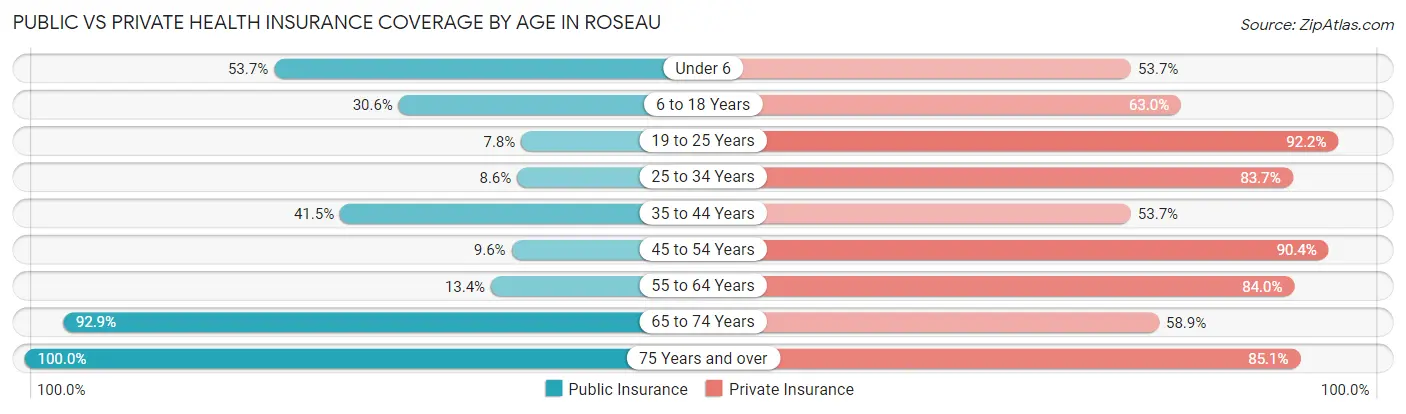
| Age Bracket | Public Insurance | Private Insurance |
| Under 6 | 123 (53.7%) | 123 (53.7%) |
| 6 to 18 Years | 132 (30.6%) | 272 (63.0%) |
| 19 to 25 Years | 12 (7.8%) | 141 (92.2%) |
| 25 to 34 Years | 32 (8.6%) | 312 (83.7%) |
| 35 to 44 Years | 136 (41.5%) | 176 (53.7%) |
| 45 to 54 Years | 21 (9.6%) | 197 (90.4%) |
| 55 to 64 Years | 52 (13.4%) | 325 (84.0%) |
| 65 to 74 Years | 235 (92.9%) | 149 (58.9%) |
| 75 Years and over | 275 (100.0%) | 234 (85.1%) |
| Total | 1,018 (38.4%) | 1,929 (72.9%) |
Disability Status by Sex by Age in Roseau
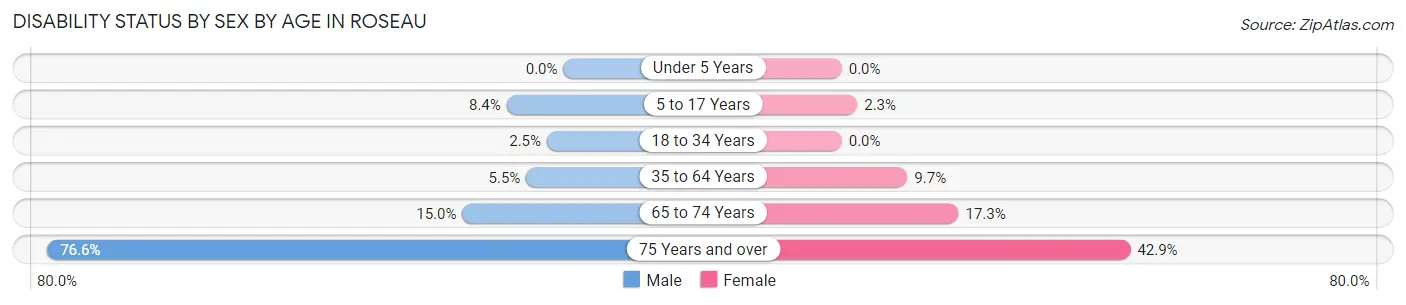
| Age Bracket | Male | Female |
| Under 5 Years | 0 (0.0%) | 0 (0.0%) |
| 5 to 17 Years | 17 (8.4%) | 6 (2.3%) |
| 18 to 34 Years | 7 (2.5%) | 0 (0.0%) |
| 35 to 64 Years | 26 (5.5%) | 45 (9.7%) |
| 65 to 74 Years | 12 (15.0%) | 30 (17.3%) |
| 75 Years and over | 82 (76.6%) | 72 (42.9%) |
Disability Class by Sex by Age in Roseau
Disability Class: Hearing Difficulty
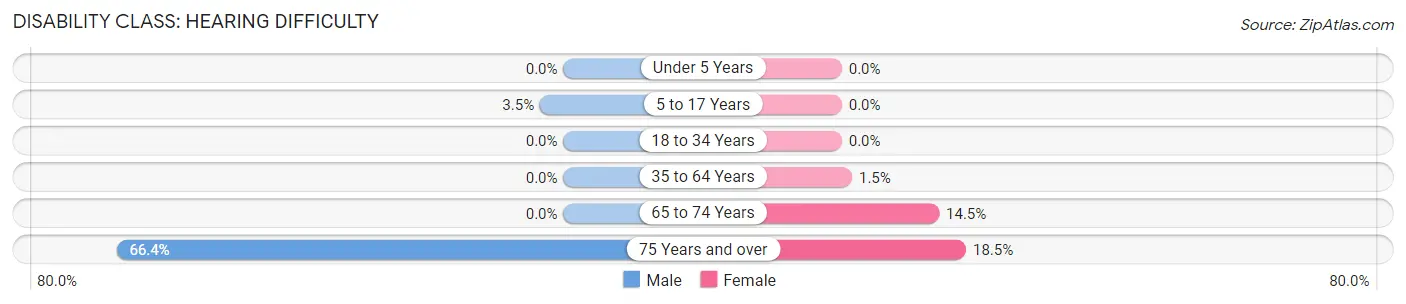
| Age Bracket | Male | Female |
| Under 5 Years | 0 (0.0%) | 0 (0.0%) |
| 5 to 17 Years | 7 (3.5%) | 0 (0.0%) |
| 18 to 34 Years | 0 (0.0%) | 0 (0.0%) |
| 35 to 64 Years | 0 (0.0%) | 7 (1.5%) |
| 65 to 74 Years | 0 (0.0%) | 25 (14.4%) |
| 75 Years and over | 71 (66.4%) | 31 (18.4%) |
Disability Class: Vision Difficulty
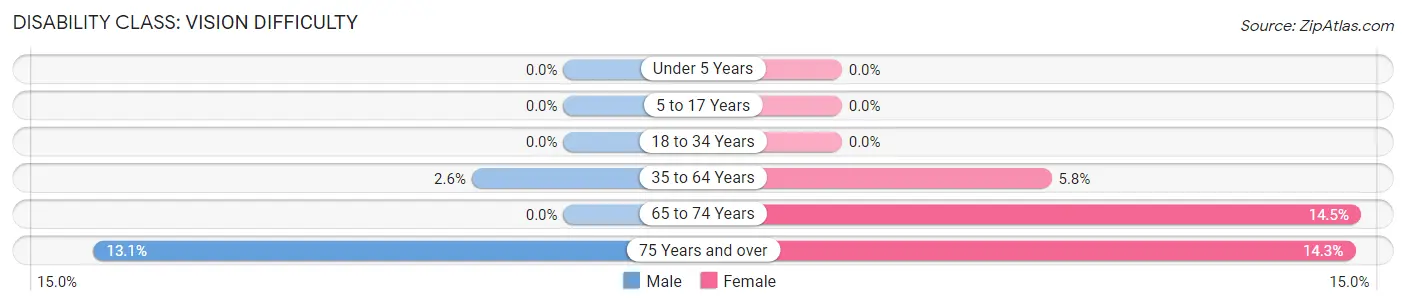
| Age Bracket | Male | Female |
| Under 5 Years | 0 (0.0%) | 0 (0.0%) |
| 5 to 17 Years | 0 (0.0%) | 0 (0.0%) |
| 18 to 34 Years | 0 (0.0%) | 0 (0.0%) |
| 35 to 64 Years | 12 (2.5%) | 27 (5.8%) |
| 65 to 74 Years | 0 (0.0%) | 25 (14.4%) |
| 75 Years and over | 14 (13.1%) | 24 (14.3%) |
Disability Class: Cognitive Difficulty
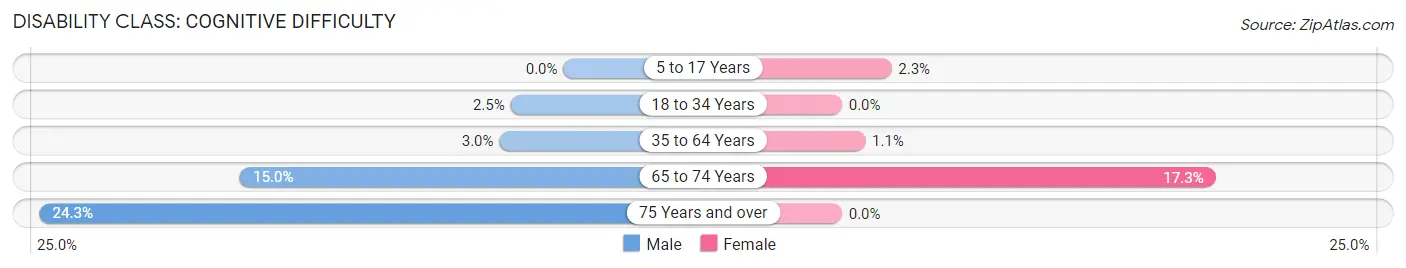
| Age Bracket | Male | Female |
| 5 to 17 Years | 0 (0.0%) | 6 (2.3%) |
| 18 to 34 Years | 7 (2.5%) | 0 (0.0%) |
| 35 to 64 Years | 14 (3.0%) | 5 (1.1%) |
| 65 to 74 Years | 12 (15.0%) | 30 (17.3%) |
| 75 Years and over | 26 (24.3%) | 0 (0.0%) |
Disability Class: Ambulatory Difficulty
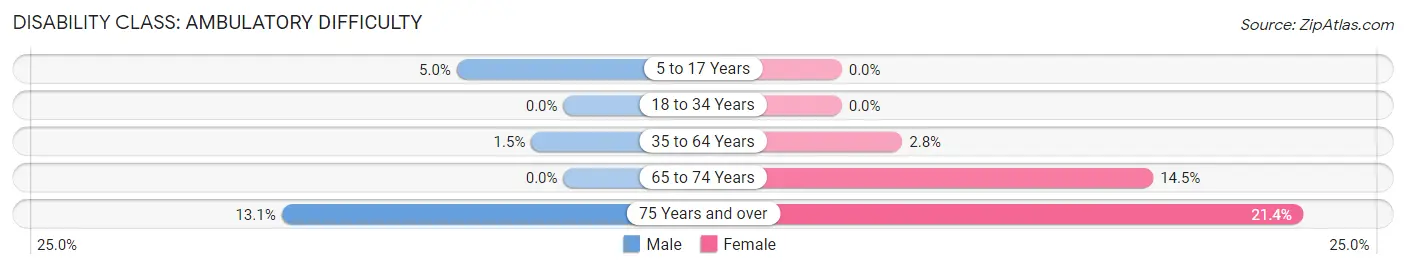
| Age Bracket | Male | Female |
| 5 to 17 Years | 10 (5.0%) | 0 (0.0%) |
| 18 to 34 Years | 0 (0.0%) | 0 (0.0%) |
| 35 to 64 Years | 7 (1.5%) | 13 (2.8%) |
| 65 to 74 Years | 0 (0.0%) | 25 (14.4%) |
| 75 Years and over | 14 (13.1%) | 36 (21.4%) |
Disability Class: Self-Care Difficulty
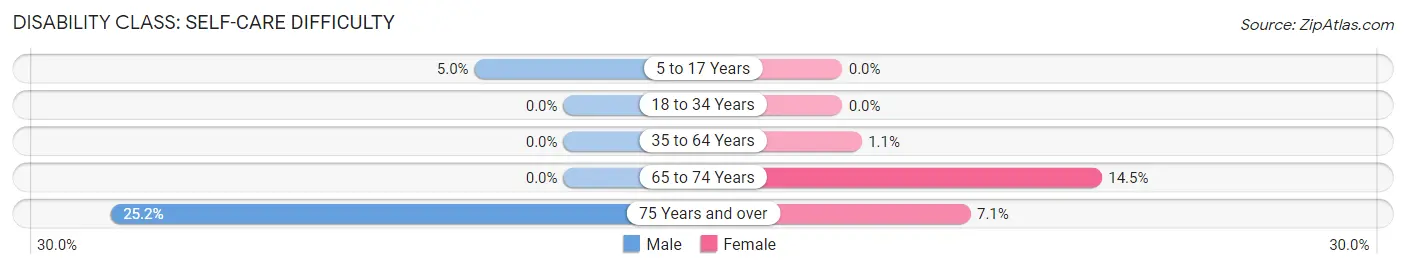
| Age Bracket | Male | Female |
| 5 to 17 Years | 10 (5.0%) | 0 (0.0%) |
| 18 to 34 Years | 0 (0.0%) | 0 (0.0%) |
| 35 to 64 Years | 0 (0.0%) | 5 (1.1%) |
| 65 to 74 Years | 0 (0.0%) | 25 (14.4%) |
| 75 Years and over | 27 (25.2%) | 12 (7.1%) |
Technology Access in Roseau
Computing Device Access in Roseau
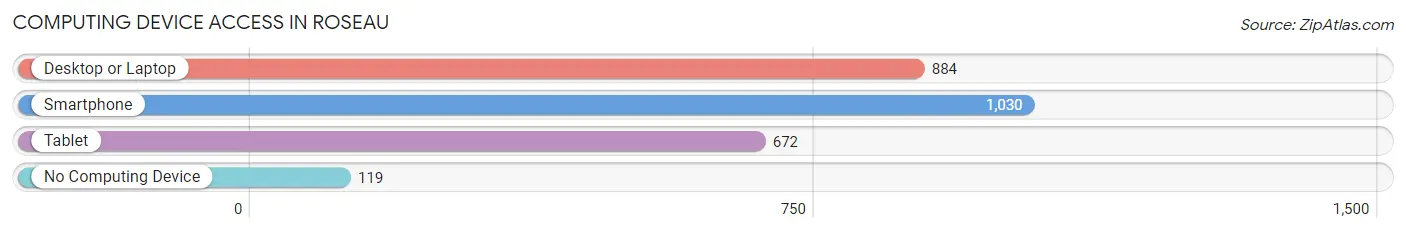
| Device Type | # Households | % Households |
| Desktop or Laptop | 884 | 72.6% |
| Smartphone | 1,030 | 84.6% |
| Tablet | 672 | 55.2% |
| No Computing Device | 119 | 9.8% |
| Total | 1,218 | 100.0% |
Internet Access in Roseau
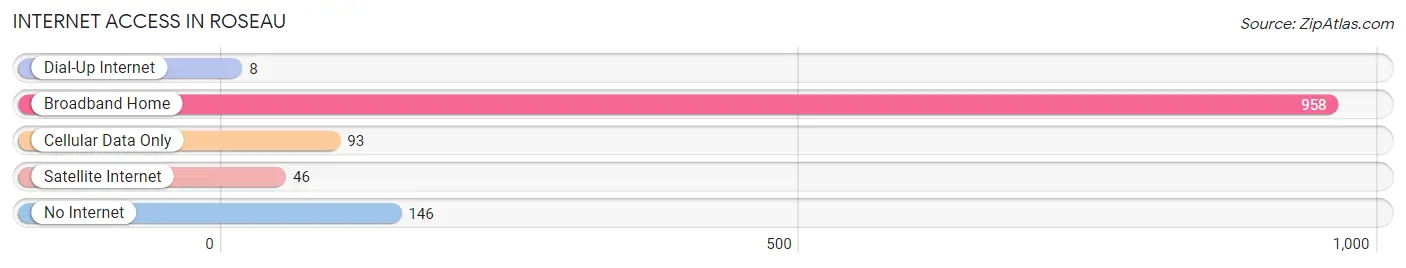
| Internet Type | # Households | % Households |
| Dial-Up Internet | 8 | 0.7% |
| Broadband Home | 958 | 78.6% |
| Cellular Data Only | 93 | 7.6% |
| Satellite Internet | 46 | 3.8% |
| No Internet | 146 | 12.0% |
| Total | 1,218 | 100.0% |
Roseau Summary
History
The city of Roseau, Minnesota is located in the northwestern corner of the state, near the Canadian border. It is the county seat of Roseau County and is the largest city in the county. The city was founded in 1887 and was named after the nearby Roseau River. The city was originally a trading post for the Ojibwe people, who had inhabited the area for centuries.
The first settlers in the area were French-Canadian fur traders, who established a trading post in the area in the late 1700s. The area was also home to a number of logging camps, which were established in the late 1800s. The logging industry was the main source of employment for the area until the early 1900s, when the area began to transition to an agricultural economy.
The city of Roseau was officially incorporated in 1887 and was named after the nearby Roseau River. The city quickly grew and by the early 1900s, it had become a major center for the lumber industry. The city also became a hub for the agricultural industry, with many farmers settling in the area.
The city continued to grow throughout the 20th century and by the 2000s, it had become a major center for the agricultural and tourism industries. The city is home to a number of tourist attractions, including the Roseau County Museum, the Roseau County Historical Society, and the Roseau County Fairgrounds.
Geography
Roseau is located in the northwestern corner of Minnesota, near the Canadian border. It is the county seat of Roseau County and is the largest city in the county. The city is situated on the banks of the Roseau River, which flows through the city. The city is surrounded by a number of lakes, including Lake of the Woods, Lake Bronson, and Lake of the Woods County Park.
The city has a total area of 8.2 square miles, of which 8.1 square miles is land and 0.1 square miles is water. The city has a humid continental climate, with cold winters and warm summers. The average temperature in the city is 34°F in the winter and 75°F in the summer.
Economy
The economy of Roseau is largely based on agriculture and tourism. The city is home to a number of tourist attractions, including the Roseau County Museum, the Roseau County Historical Society, and the Roseau County Fairgrounds. The city is also home to a number of agricultural businesses, including dairy farms, grain elevators, and feed mills.
The city is also home to a number of manufacturing businesses, including a paper mill, a wood products plant, and a plastics plant. The city is also home to a number of retail businesses, including a number of restaurants, grocery stores, and clothing stores.
Demographics
As of the 2010 census, the city of Roseau had a population of 2,631. The racial makeup of the city was 97.2% White, 0.4% African American, 0.3% Native American, 0.3% Asian, 0.1% Pacific Islander, 0.7% from other races, and 0.9% from two or more races. Hispanic or Latino of any race were 1.7% of the population.
The median income for a household in the city was $41,250, and the median income for a family was $50,000. The per capita income for the city was $20,845. About 11.2% of families and 14.2% of the population were below the poverty line, including 18.2% of those under age 18 and 8.3% of those age 65 or over.
Common Questions
What is Per Capita Income in Roseau?
Per Capita income in Roseau is $36,513.
What is the Median Family Income in Roseau?
Median Family Income in Roseau is $84,306.
What is the Median Household income in Roseau?
Median Household Income in Roseau is $62,829.
What is Income or Wage Gap in Roseau?
Income or Wage Gap in Roseau is 23.2%.
Women in Roseau earn 76.8 cents for every dollar earned by a man.
What is Inequality or Gini Index in Roseau?
Inequality or Gini Index in Roseau is 0.43.
What is the Total Population of Roseau?
Total Population of Roseau is 2,731.
What is the Total Male Population of Roseau?
Total Male Population of Roseau is 1,259.
What is the Total Female Population of Roseau?
Total Female Population of Roseau is 1,472.
What is the Ratio of Males per 100 Females in Roseau?
There are 85.53 Males per 100 Females in Roseau.
What is the Ratio of Females per 100 Males in Roseau?
There are 116.92 Females per 100 Males in Roseau.
What is the Median Population Age in Roseau?
Median Population Age in Roseau is 38.6 Years.
What is the Average Family Size in Roseau
Average Family Size in Roseau is 2.9 People.
What is the Average Household Size in Roseau
Average Household Size in Roseau is 2.2 People.
How Large is the Labor Force in Roseau?
There are 1,467 People in the Labor Forcein in Roseau.
What is the Percentage of People in the Labor Force in Roseau?
68.7% of People are in the Labor Force in Roseau.
What is the Unemployment Rate in Roseau?
Unemployment Rate in Roseau is 4.6%.