Calumet, MN Map & Demographics
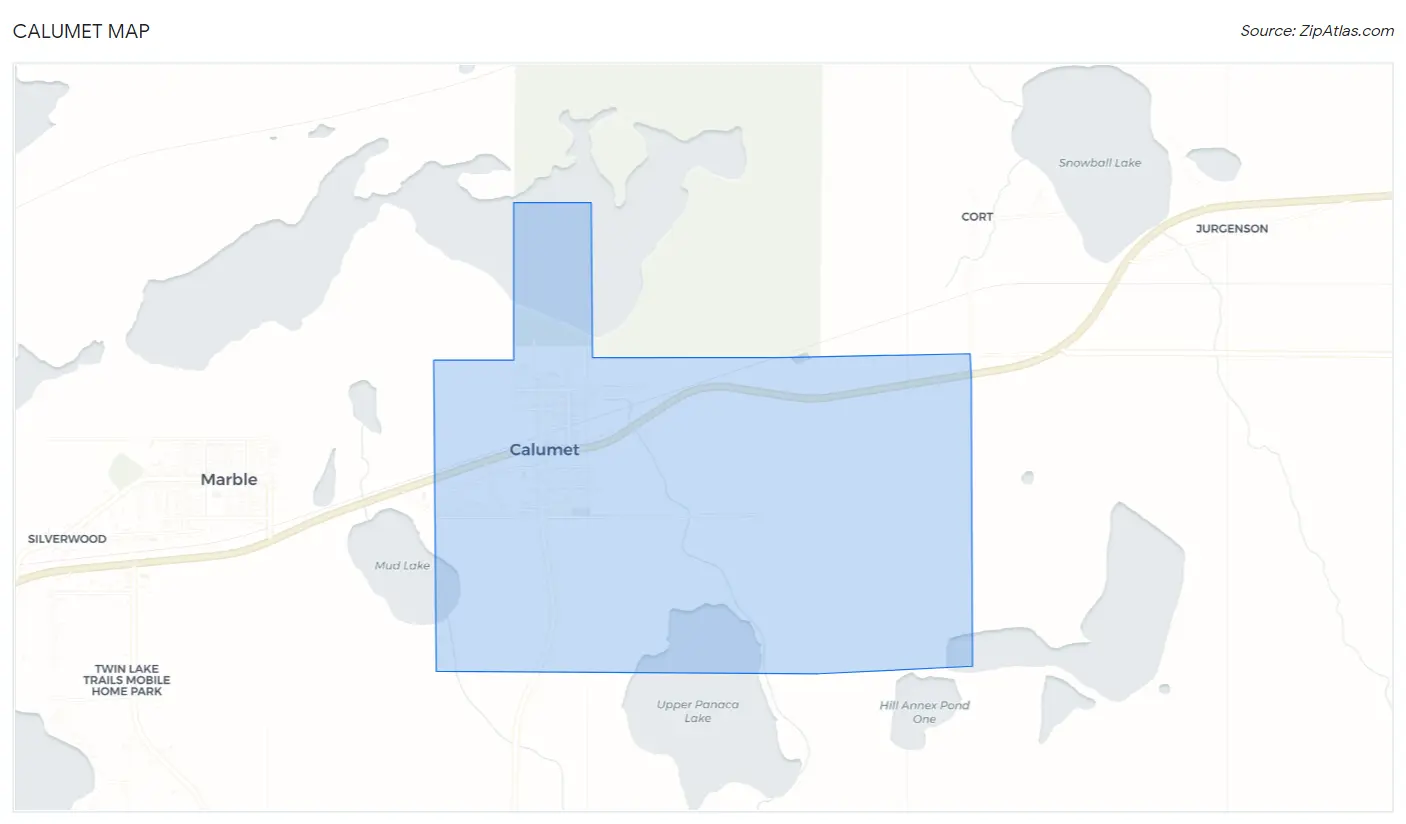
Calumet Map
Calumet Overview
$24,647
PER CAPITA INCOME
$36,875
AVG FAMILY INCOME
$31,000
AVG HOUSEHOLD INCOME
60.2%
WAGE / INCOME GAP [ % ]
39.8¢/ $1
WAGE / INCOME GAP [ $ ]
0.46
INEQUALITY / GINI INDEX
266
TOTAL POPULATION
101
MALE POPULATION
165
FEMALE POPULATION
61.21
MALES / 100 FEMALES
163.37
FEMALES / 100 MALES
54.5
MEDIAN AGE
2.9
AVG FAMILY SIZE
2.0
AVG HOUSEHOLD SIZE
113
LABOR FORCE [ PEOPLE ]
53.6%
PERCENT IN LABOR FORCE
14.2%
UNEMPLOYMENT RATE
Calumet Zip Codes
Calumet Area Codes
Income in Calumet
Income Overview in Calumet
Per Capita Income in Calumet is $24,647, while median incomes of families and households are $36,875 and $31,000 respectively.
| Characteristic | Number | Measure |
| Per Capita Income | 266 | $24,647 |
| Median Family Income | 64 | $36,875 |
| Mean Family Income | 64 | $53,173 |
| Median Household Income | 136 | $31,000 |
| Mean Household Income | 136 | $47,651 |
| Income Deficit | 64 | $0 |
| Wage / Income Gap (%) | 266 | 60.18% |
| Wage / Income Gap ($) | 266 | 39.82¢ per $1 |
| Gini / Inequality Index | 266 | 0.46 |
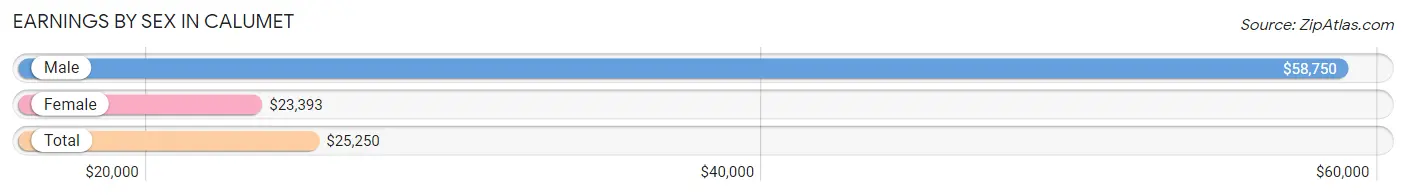
Earnings by Sex in Calumet
Average Earnings in Calumet are $25,250, $58,750 for men and $23,393 for women, a difference of 60.2%.
| Sex | Number | Average Earnings |
| Male | 34 (31.2%) | $58,750 |
| Female | 75 (68.8%) | $23,393 |
| Total | 109 (100.0%) | $25,250 |
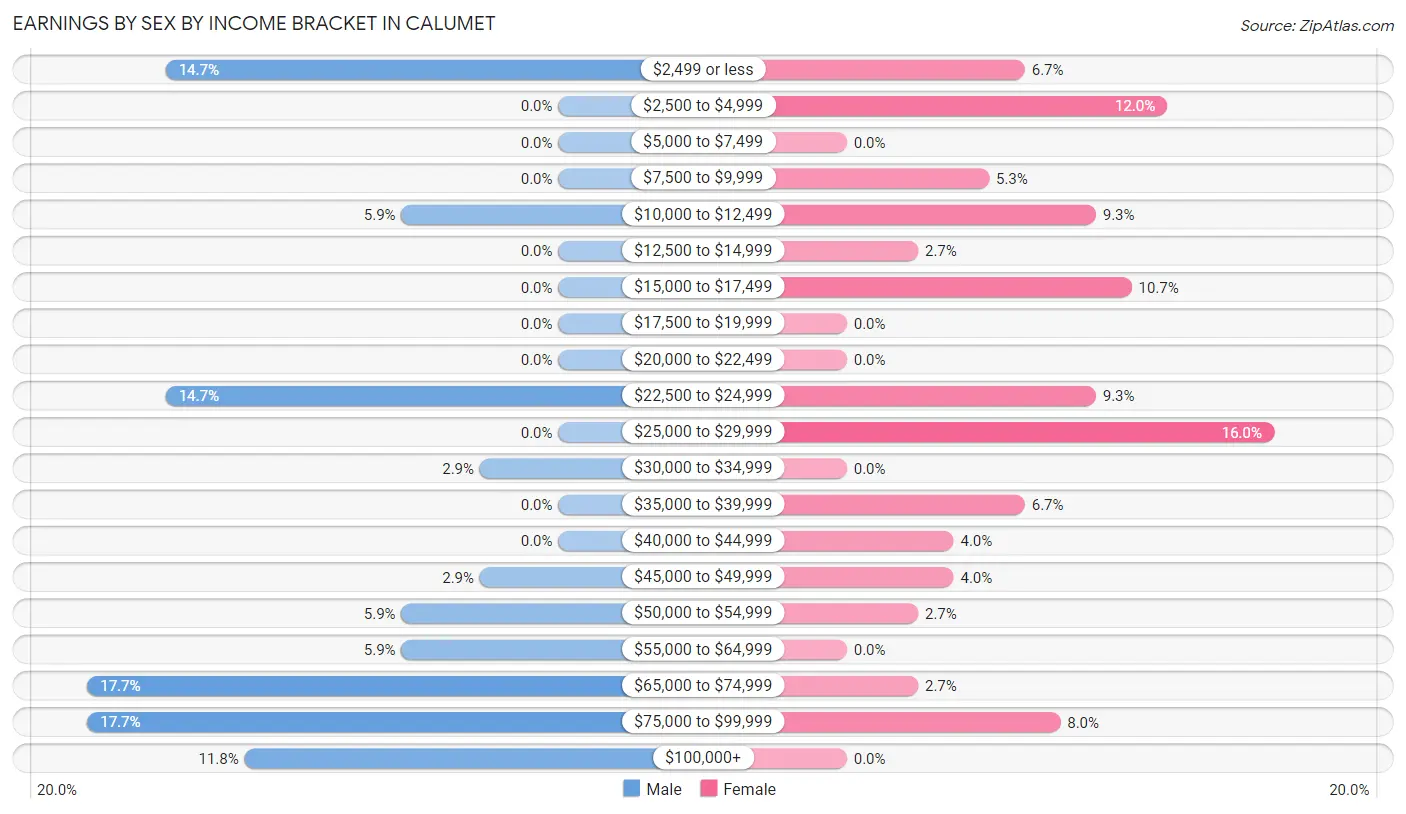
Earnings by Sex by Income Bracket in Calumet
The most common earnings brackets in Calumet are $65,000 to $74,999 for men (6 | 17.6%) and $25,000 to $29,999 for women (12 | 16.0%).
| Income | Male | Female |
| $2,499 or less | 5 (14.7%) | 5 (6.7%) |
| $2,500 to $4,999 | 0 (0.0%) | 9 (12.0%) |
| $5,000 to $7,499 | 0 (0.0%) | 0 (0.0%) |
| $7,500 to $9,999 | 0 (0.0%) | 4 (5.3%) |
| $10,000 to $12,499 | 2 (5.9%) | 7 (9.3%) |
| $12,500 to $14,999 | 0 (0.0%) | 2 (2.7%) |
| $15,000 to $17,499 | 0 (0.0%) | 8 (10.7%) |
| $17,500 to $19,999 | 0 (0.0%) | 0 (0.0%) |
| $20,000 to $22,499 | 0 (0.0%) | 0 (0.0%) |
| $22,500 to $24,999 | 5 (14.7%) | 7 (9.3%) |
| $25,000 to $29,999 | 0 (0.0%) | 12 (16.0%) |
| $30,000 to $34,999 | 1 (2.9%) | 0 (0.0%) |
| $35,000 to $39,999 | 0 (0.0%) | 5 (6.7%) |
| $40,000 to $44,999 | 0 (0.0%) | 3 (4.0%) |
| $45,000 to $49,999 | 1 (2.9%) | 3 (4.0%) |
| $50,000 to $54,999 | 2 (5.9%) | 2 (2.7%) |
| $55,000 to $64,999 | 2 (5.9%) | 0 (0.0%) |
| $65,000 to $74,999 | 6 (17.6%) | 2 (2.7%) |
| $75,000 to $99,999 | 6 (17.6%) | 6 (8.0%) |
| $100,000+ | 4 (11.8%) | 0 (0.0%) |
| Total | 34 (100.0%) | 75 (100.0%) |
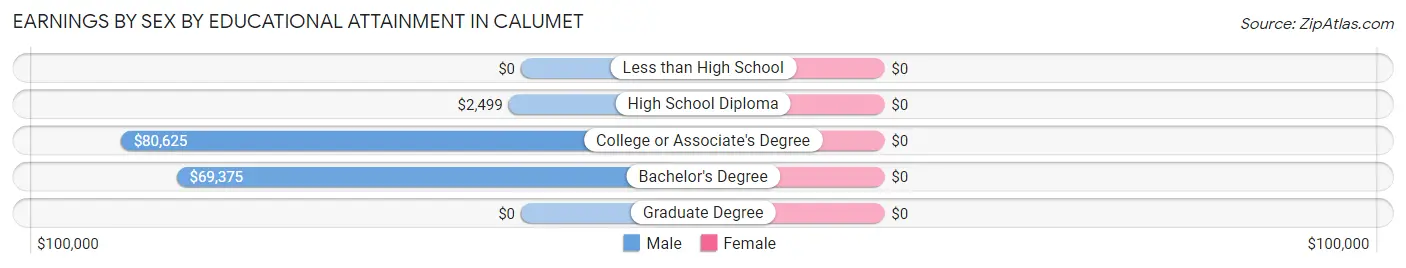
Earnings by Sex by Educational Attainment in Calumet
| Educational Attainment | Male Income | Female Income |
| Less than High School | - | - |
| High School Diploma | $2,499 | $0 |
| College or Associate's Degree | $80,625 | $0 |
| Bachelor's Degree | $69,375 | $0 |
| Graduate Degree | - | - |
| Total | $56,250 | $21,250 |
Family Income in Calumet
Family Income Brackets in Calumet
According to the Calumet family income data, there are 11 families falling into the $25,000 to $34,999 income range, which is the most common income bracket and makes up 17.2% of all families.
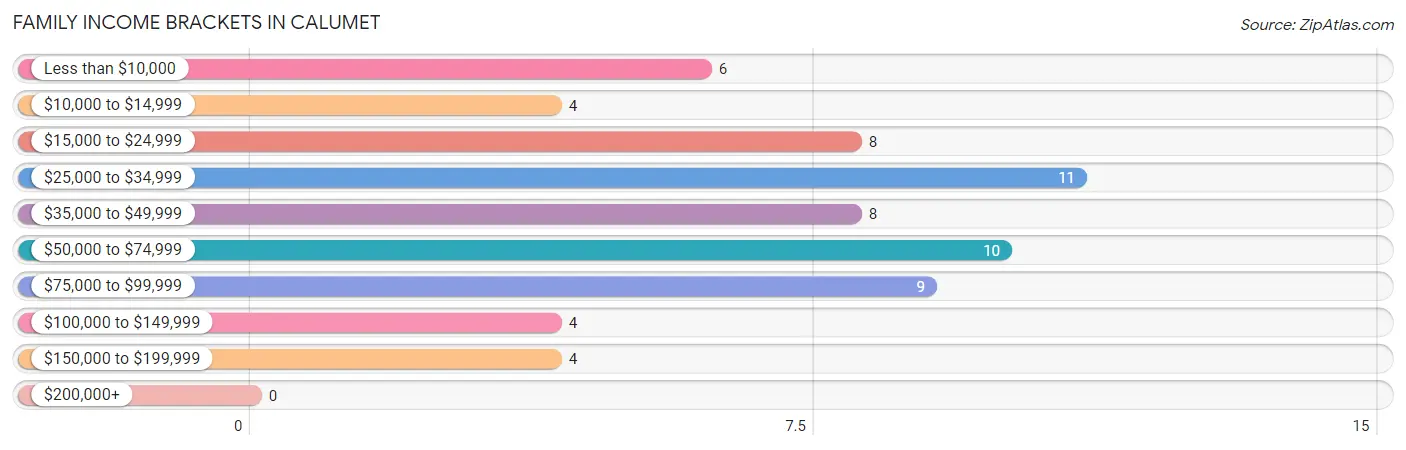
| Income Bracket | # Families | % Families |
| Less than $10,000 | 6 | 9.4% |
| $10,000 to $14,999 | 4 | 6.3% |
| $15,000 to $24,999 | 8 | 12.5% |
| $25,000 to $34,999 | 11 | 17.2% |
| $35,000 to $49,999 | 8 | 12.5% |
| $50,000 to $74,999 | 10 | 15.6% |
| $75,000 to $99,999 | 9 | 14.1% |
| $100,000 to $149,999 | 4 | 6.3% |
| $150,000 to $199,999 | 4 | 6.3% |
| $200,000+ | 0 | 0.0% |
Family Income by Famaliy Size in Calumet
2-person families (36 | 56.2%) account for the highest median family income in Calumet with $45,625 per family, while 2-person families (36 | 56.2%) have the highest median income of $22,812 per family member.
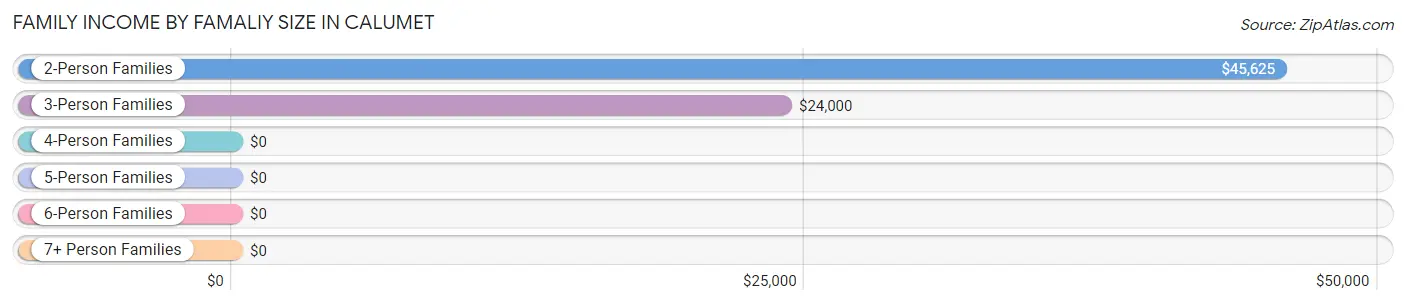
| Income Bracket | # Families | Median Income |
| 2-Person Families | 36 (56.2%) | $45,625 |
| 3-Person Families | 20 (31.2%) | $24,000 |
| 4-Person Families | 6 (9.4%) | $0 |
| 5-Person Families | 1 (1.6%) | $0 |
| 6-Person Families | 0 (0.0%) | $0 |
| 7+ Person Families | 1 (1.6%) | $0 |
| Total | 64 (100.0%) | $36,875 |
Family Income by Number of Earners in Calumet
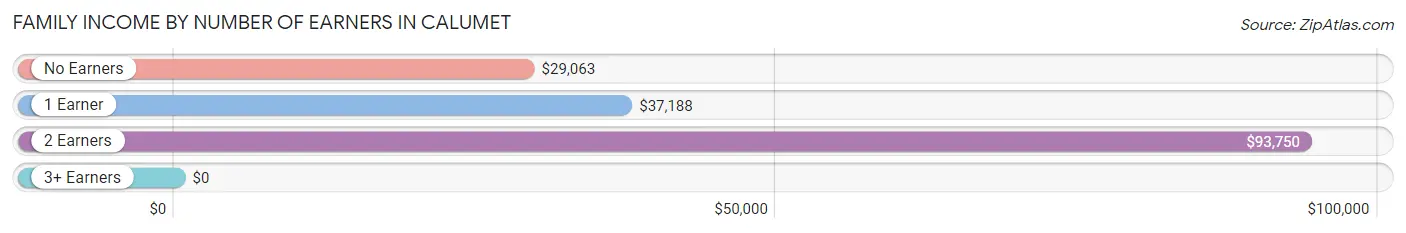
| Number of Earners | # Families | Median Income |
| No Earners | 23 (35.9%) | $29,063 |
| 1 Earner | 29 (45.3%) | $37,188 |
| 2 Earners | 9 (14.1%) | $93,750 |
| 3+ Earners | 3 (4.7%) | $0 |
| Total | 64 (100.0%) | $36,875 |
Household Income in Calumet
Household Income Brackets in Calumet
With 31 households falling in the category, the $15,000 to $24,999 income range is the most frequent in Calumet, accounting for 22.8% of all households.
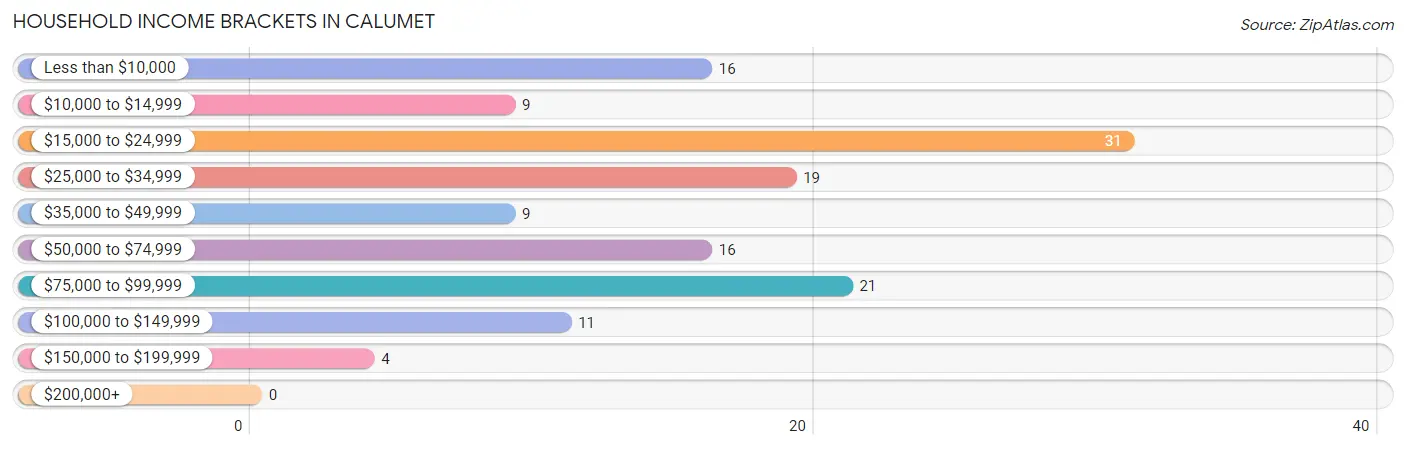
| Income Bracket | # Households | % Households |
| Less than $10,000 | 16 | 11.8% |
| $10,000 to $14,999 | 9 | 6.6% |
| $15,000 to $24,999 | 31 | 22.8% |
| $25,000 to $34,999 | 19 | 14.0% |
| $35,000 to $49,999 | 9 | 6.6% |
| $50,000 to $74,999 | 16 | 11.8% |
| $75,000 to $99,999 | 21 | 15.4% |
| $100,000 to $149,999 | 11 | 8.1% |
| $150,000 to $199,999 | 4 | 2.9% |
| $200,000+ | 0 | 0.0% |
Household Income by Householder Age in Calumet
The median household income in Calumet is $31,000, with the highest median household income of $101,250 found in the 25 to 44 years age bracket for the primary householder. A total of 20 households (14.7%) fall into this category. Meanwhile, the 15 to 24 years age bracket for the primary householder has the lowest median household income of $0, with 7 households (5.1%) in this group.
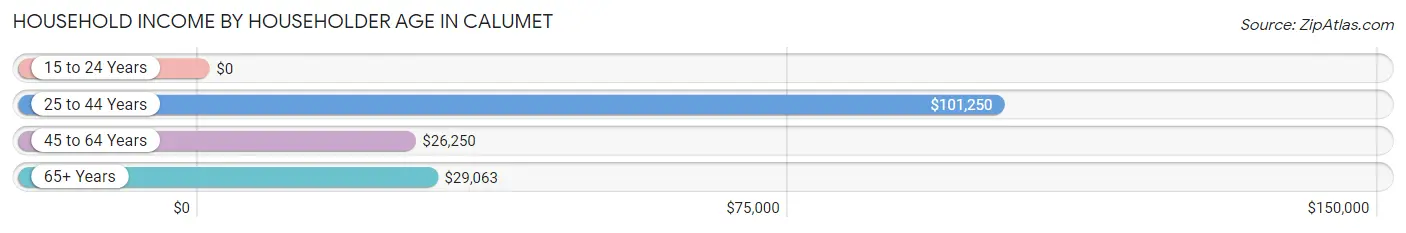
| Income Bracket | # Households | Median Income |
| 15 to 24 Years | 7 (5.1%) | $0 |
| 25 to 44 Years | 20 (14.7%) | $101,250 |
| 45 to 64 Years | 40 (29.4%) | $26,250 |
| 65+ Years | 69 (50.7%) | $29,063 |
| Total | 136 (100.0%) | $31,000 |
Poverty in Calumet
Income Below Poverty by Sex and Age in Calumet
With 28.7% poverty level for males and 23.6% for females among the residents of Calumet, 25 to 34 year old males and under 5 year old females are the most vulnerable to poverty, with 11 males (61.1%) and 16 females (69.6%) in their respective age groups living below the poverty level.
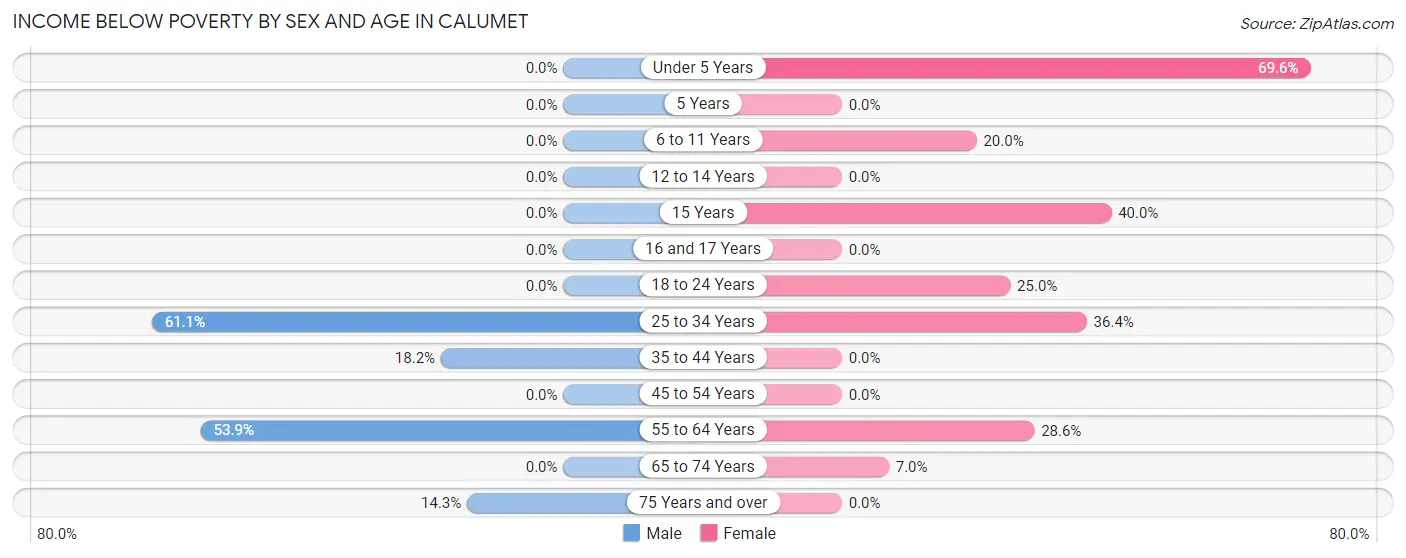
| Age Bracket | Male | Female |
| Under 5 Years | 0 (0.0%) | 16 (69.6%) |
| 5 Years | 0 (0.0%) | 0 (0.0%) |
| 6 to 11 Years | 0 (0.0%) | 1 (20.0%) |
| 12 to 14 Years | 0 (0.0%) | 0 (0.0%) |
| 15 Years | 0 (0.0%) | 2 (40.0%) |
| 16 and 17 Years | 0 (0.0%) | 0 (0.0%) |
| 18 to 24 Years | 0 (0.0%) | 5 (25.0%) |
| 25 to 34 Years | 11 (61.1%) | 4 (36.4%) |
| 35 to 44 Years | 2 (18.2%) | 0 (0.0%) |
| 45 to 54 Years | 0 (0.0%) | 0 (0.0%) |
| 55 to 64 Years | 14 (53.8%) | 8 (28.6%) |
| 65 to 74 Years | 0 (0.0%) | 3 (7.0%) |
| 75 Years and over | 2 (14.3%) | 0 (0.0%) |
| Total | 29 (28.7%) | 39 (23.6%) |
Income Above Poverty by Sex and Age in Calumet
According to the poverty statistics in Calumet, males aged under 5 years and females aged 12 to 14 years are the age groups that are most secure financially, with 100.0% of males and 100.0% of females in these age groups living above the poverty line.
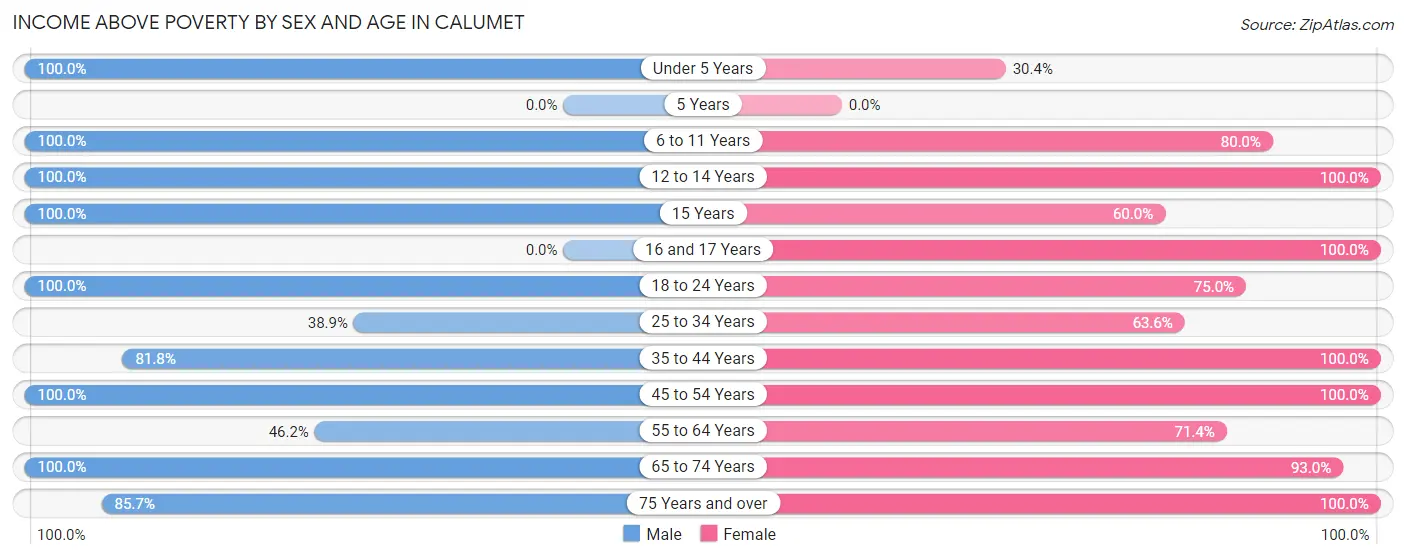
| Age Bracket | Male | Female |
| Under 5 Years | 4 (100.0%) | 7 (30.4%) |
| 5 Years | 0 (0.0%) | 0 (0.0%) |
| 6 to 11 Years | 7 (100.0%) | 4 (80.0%) |
| 12 to 14 Years | 3 (100.0%) | 5 (100.0%) |
| 15 Years | 3 (100.0%) | 3 (60.0%) |
| 16 and 17 Years | 0 (0.0%) | 4 (100.0%) |
| 18 to 24 Years | 2 (100.0%) | 15 (75.0%) |
| 25 to 34 Years | 7 (38.9%) | 7 (63.6%) |
| 35 to 44 Years | 9 (81.8%) | 3 (100.0%) |
| 45 to 54 Years | 3 (100.0%) | 9 (100.0%) |
| 55 to 64 Years | 12 (46.2%) | 20 (71.4%) |
| 65 to 74 Years | 10 (100.0%) | 40 (93.0%) |
| 75 Years and over | 12 (85.7%) | 9 (100.0%) |
| Total | 72 (71.3%) | 126 (76.4%) |
Income Below Poverty Among Married-Couple Families in Calumet
The poverty statistics for married-couple families in Calumet show that 8.1% or 3 of the total 37 families live below the poverty line. Families with no children have the highest poverty rate of 10.0%, comprising of 3 families. On the other hand, families with 1 or 2 children have the lowest poverty rate of 0.0%, which includes 0 families.
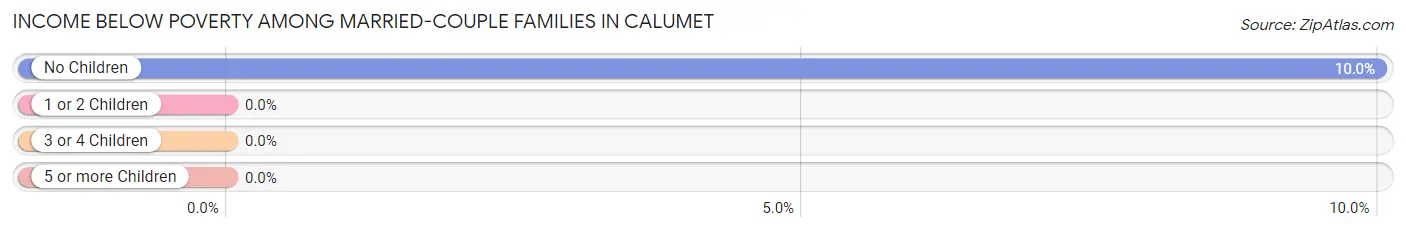
| Children | Above Poverty | Below Poverty |
| No Children | 27 (90.0%) | 3 (10.0%) |
| 1 or 2 Children | 5 (100.0%) | 0 (0.0%) |
| 3 or 4 Children | 1 (100.0%) | 0 (0.0%) |
| 5 or more Children | 1 (100.0%) | 0 (0.0%) |
| Total | 34 (91.9%) | 3 (8.1%) |
Income Below Poverty Among Single-Parent Households in Calumet
According to the poverty data in Calumet, 50.0% or 2 single-father households and 47.8% or 11 single-mother households are living below the poverty line. Among single-father households, those with 1 or 2 children have the highest poverty rate, with 2 households (100.0%) experiencing poverty. Likewise, among single-mother households, those with no children have the highest poverty rate, with 5 households (55.6%) falling below the poverty line.
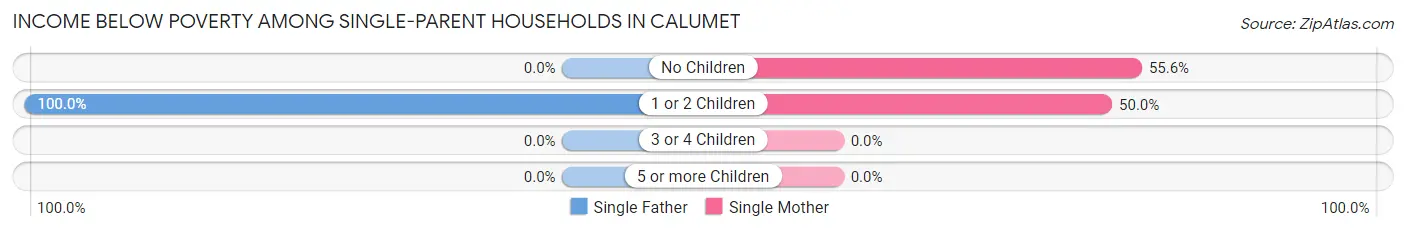
| Children | Single Father | Single Mother |
| No Children | 0 (0.0%) | 5 (55.6%) |
| 1 or 2 Children | 2 (100.0%) | 6 (50.0%) |
| 3 or 4 Children | 0 (0.0%) | 0 (0.0%) |
| 5 or more Children | 0 (0.0%) | 0 (0.0%) |
| Total | 2 (50.0%) | 11 (47.8%) |
Income Below Poverty Among Married-Couple vs Single-Parent Households in Calumet
The poverty data for Calumet shows that 3 of the married-couple family households (8.1%) and 13 of the single-parent households (48.1%) are living below the poverty level. Within the married-couple family households, those with no children have the highest poverty rate, with 3 households (10.0%) falling below the poverty line. Among the single-parent households, those with 1 or 2 children have the highest poverty rate, with 8 household (57.1%) living below poverty.
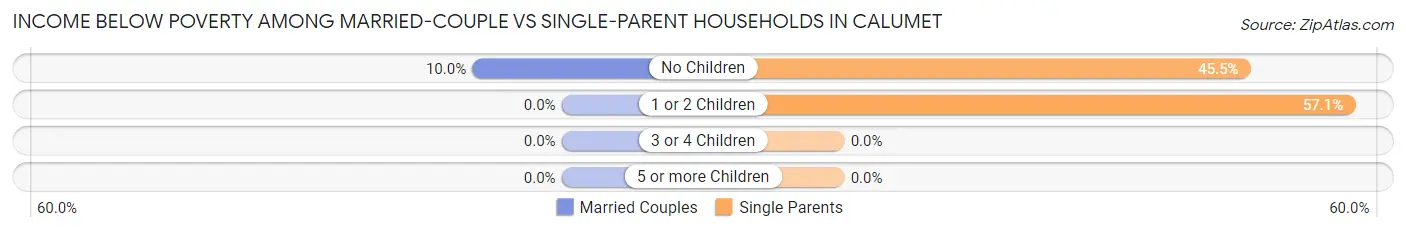
| Children | Married-Couple Families | Single-Parent Households |
| No Children | 3 (10.0%) | 5 (45.5%) |
| 1 or 2 Children | 0 (0.0%) | 8 (57.1%) |
| 3 or 4 Children | 0 (0.0%) | 0 (0.0%) |
| 5 or more Children | 0 (0.0%) | 0 (0.0%) |
| Total | 3 (8.1%) | 13 (48.1%) |
Race in Calumet
The most populous races in Calumet are White / Caucasian (237 | 89.1%), Native / Alaskan (21 | 7.9%), and Two or more Races (8 | 3.0%).
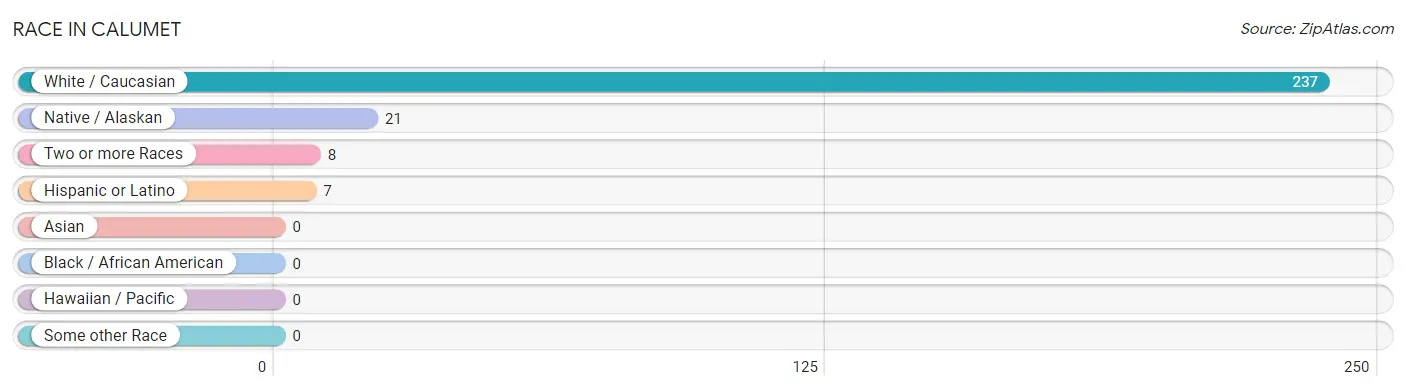
| Race | # Population | % Population |
| Asian | 0 | 0.0% |
| Black / African American | 0 | 0.0% |
| Hawaiian / Pacific | 0 | 0.0% |
| Hispanic or Latino | 7 | 2.6% |
| Native / Alaskan | 21 | 7.9% |
| White / Caucasian | 237 | 89.1% |
| Two or more Races | 8 | 3.0% |
| Some other Race | 0 | 0.0% |
| Total | 266 | 100.0% |
Ancestry in Calumet
The most populous ancestries reported in Calumet are German (97 | 36.5%), Finnish (28 | 10.5%), Dutch (19 | 7.1%), Swedish (13 | 4.9%), and English (11 | 4.1%), together accounting for 63.2% of all Calumet residents.
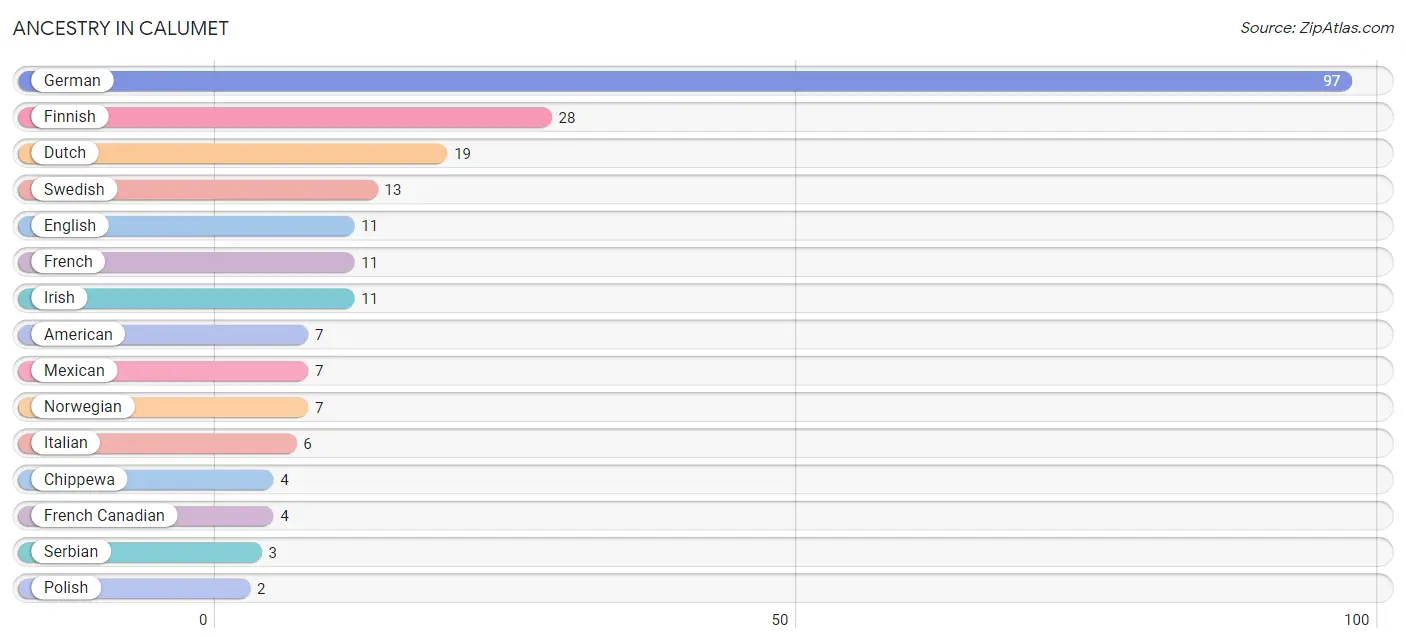
| Ancestry | # Population | % Population |
| American | 7 | 2.6% |
| Chippewa | 4 | 1.5% |
| Danish | 1 | 0.4% |
| Dutch | 19 | 7.1% |
| English | 11 | 4.1% |
| Finnish | 28 | 10.5% |
| French | 11 | 4.1% |
| French Canadian | 4 | 1.5% |
| German | 97 | 36.5% |
| Irish | 11 | 4.1% |
| Italian | 6 | 2.3% |
| Mexican | 7 | 2.6% |
| Norwegian | 7 | 2.6% |
| Polish | 2 | 0.7% |
| Serbian | 3 | 1.1% |
| Sioux | 2 | 0.7% |
| Slavic | 1 | 0.4% |
| Swedish | 13 | 4.9% | View All 18 Rows |
Immigrants in Calumet
The most numerous immigrant groups reported in Calumet came from Europe (1 | 0.4%), Germany (1 | 0.4%), and Western Europe (1 | 0.4%), together accounting for 1.1% of all Calumet residents.
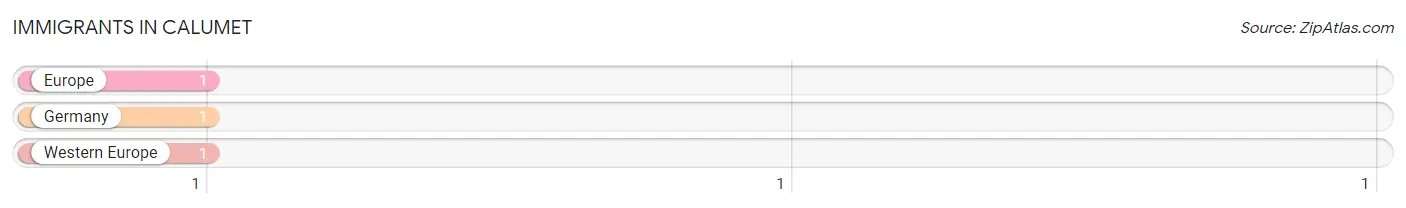
| Immigration Origin | # Population | % Population |
| Europe | 1 | 0.4% |
| Germany | 1 | 0.4% |
| Western Europe | 1 | 0.4% | View All 3 Rows |
Sex and Age in Calumet
Sex and Age in Calumet
The most populous age groups in Calumet are 60 to 64 Years (18 | 17.8%) for men and 65 to 69 Years (30 | 18.2%) for women.
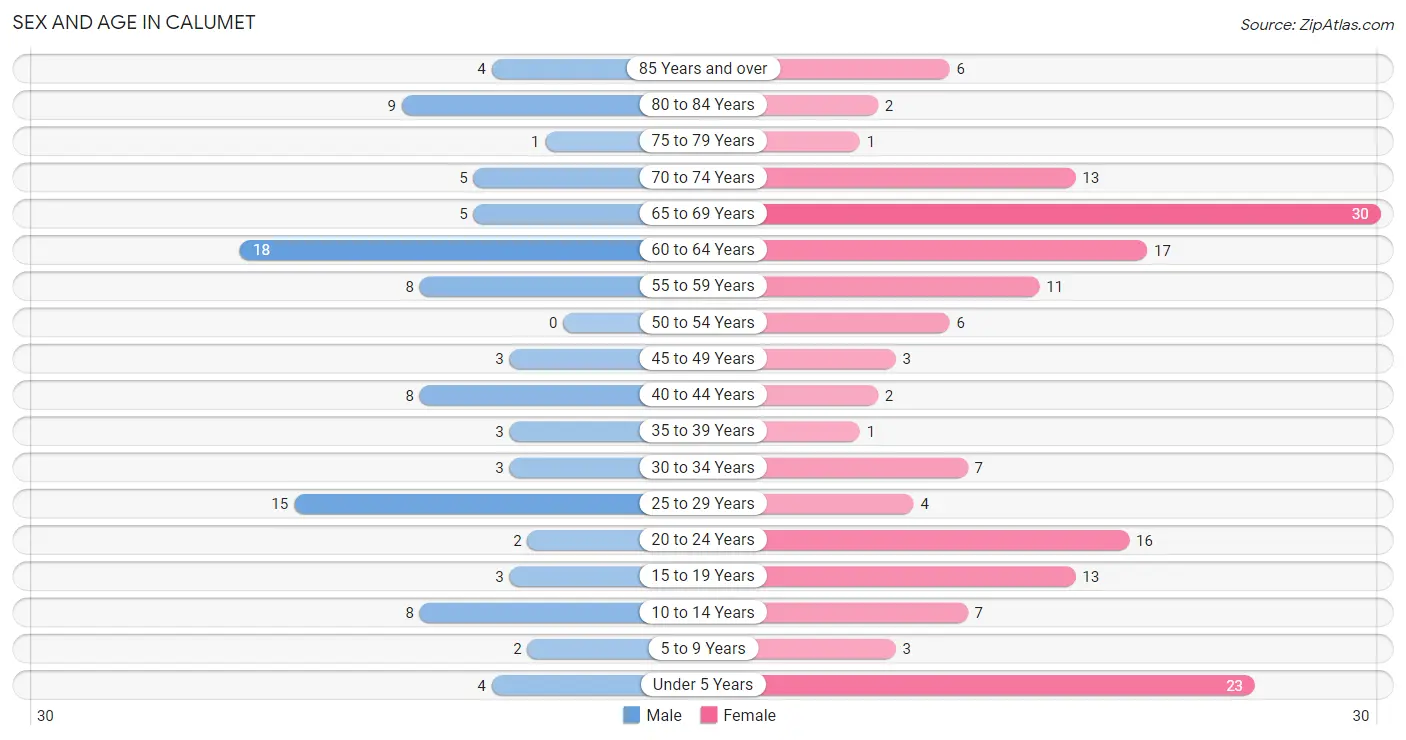
| Age Bracket | Male | Female |
| Under 5 Years | 4 (4.0%) | 23 (13.9%) |
| 5 to 9 Years | 2 (2.0%) | 3 (1.8%) |
| 10 to 14 Years | 8 (7.9%) | 7 (4.2%) |
| 15 to 19 Years | 3 (3.0%) | 13 (7.9%) |
| 20 to 24 Years | 2 (2.0%) | 16 (9.7%) |
| 25 to 29 Years | 15 (14.8%) | 4 (2.4%) |
| 30 to 34 Years | 3 (3.0%) | 7 (4.2%) |
| 35 to 39 Years | 3 (3.0%) | 1 (0.6%) |
| 40 to 44 Years | 8 (7.9%) | 2 (1.2%) |
| 45 to 49 Years | 3 (3.0%) | 3 (1.8%) |
| 50 to 54 Years | 0 (0.0%) | 6 (3.6%) |
| 55 to 59 Years | 8 (7.9%) | 11 (6.7%) |
| 60 to 64 Years | 18 (17.8%) | 17 (10.3%) |
| 65 to 69 Years | 5 (5.0%) | 30 (18.2%) |
| 70 to 74 Years | 5 (5.0%) | 13 (7.9%) |
| 75 to 79 Years | 1 (1.0%) | 1 (0.6%) |
| 80 to 84 Years | 9 (8.9%) | 2 (1.2%) |
| 85 Years and over | 4 (4.0%) | 6 (3.6%) |
| Total | 101 (100.0%) | 165 (100.0%) |
Families and Households in Calumet
Median Family Size in Calumet
The median family size in Calumet is 2.89 persons per family, with single female/mother families (23 | 35.9%) accounting for the largest median family size of 3.52 persons per family. On the other hand, single male/father families (4 | 6.2%) represent the smallest median family size with 2.25 persons per family.
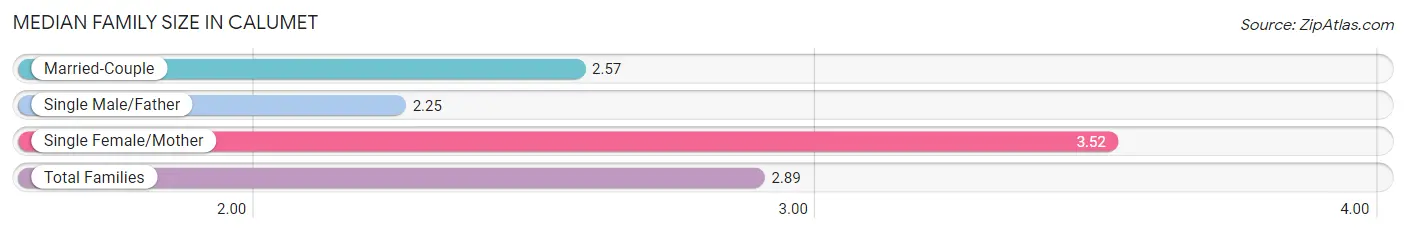
| Family Type | # Families | Family Size |
| Married-Couple | 37 (57.8%) | 2.57 |
| Single Male/Father | 4 (6.2%) | 2.25 |
| Single Female/Mother | 23 (35.9%) | 3.52 |
| Total Families | 64 (100.0%) | 2.89 |
Median Household Size in Calumet
The median household size in Calumet is 1.96 persons per household, with single female/mother households (23 | 16.9%) accounting for the largest median household size of 3.61 persons per household. non-family households (72 | 52.9%) represent the smallest median household size with 1.07 persons per household.
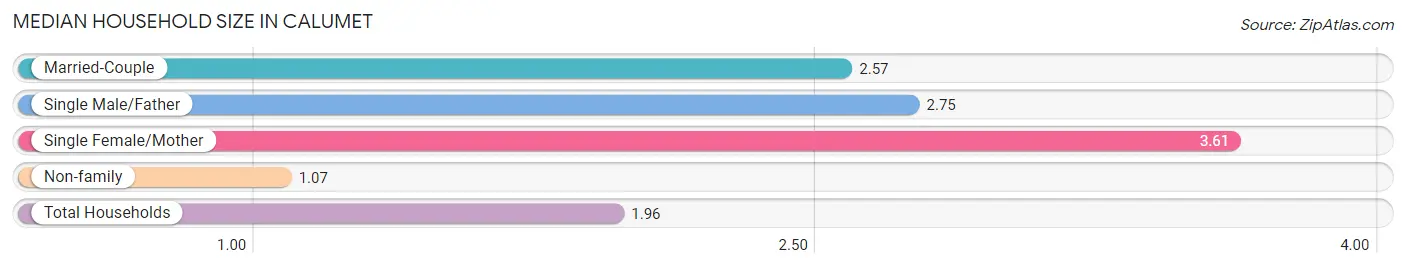
| Household Type | # Households | Household Size |
| Married-Couple | 37 (27.2%) | 2.57 |
| Single Male/Father | 4 (2.9%) | 2.75 |
| Single Female/Mother | 23 (16.9%) | 3.61 |
| Non-family | 72 (52.9%) | 1.07 |
| Total Households | 136 (100.0%) | 1.96 |
Household Size by Marriage Status in Calumet
Out of a total of 136 households in Calumet, 64 (47.1%) are family households, while 72 (52.9%) are nonfamily households. The most numerous type of family households are 2-person households, comprising 34, and the most common type of nonfamily households are 1-person households, comprising 67.
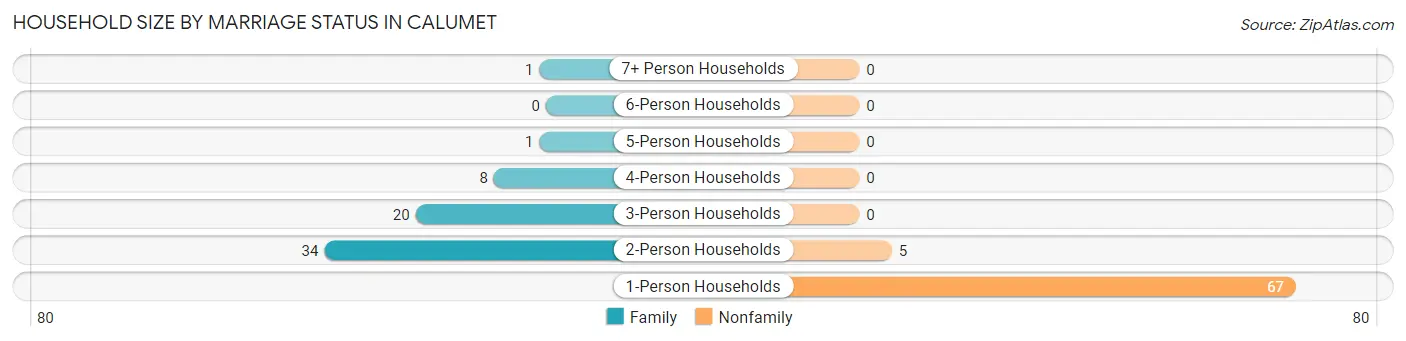
| Household Size | Family Households | Nonfamily Households |
| 1-Person Households | - | 67 (49.3%) |
| 2-Person Households | 34 (25.0%) | 5 (3.7%) |
| 3-Person Households | 20 (14.7%) | 0 (0.0%) |
| 4-Person Households | 8 (5.9%) | 0 (0.0%) |
| 5-Person Households | 1 (0.7%) | 0 (0.0%) |
| 6-Person Households | 0 (0.0%) | 0 (0.0%) |
| 7+ Person Households | 1 (0.7%) | 0 (0.0%) |
| Total | 64 (47.1%) | 72 (52.9%) |
Female Fertility in Calumet
Fertility by Age in Calumet
Average fertility rate in Calumet is 109.0 births per 1,000 women. Women in the age bracket of 20 to 34 years have the highest fertility rate with 185.0 births per 1,000 women. Women in the age bracket of 20 to 34 years acount for 100.0% of all women with births.
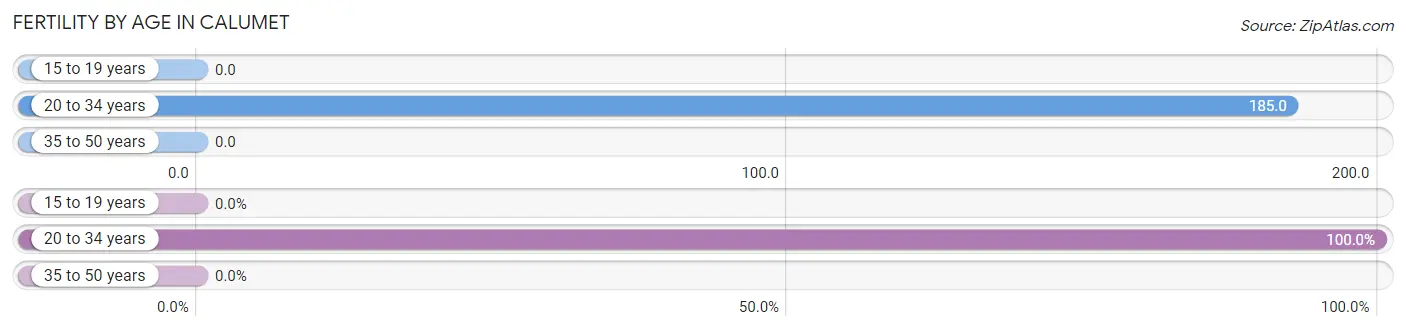
| Age Bracket | Women with Births | Births / 1,000 Women |
| 15 to 19 years | 0 (0.0%) | 0.0 |
| 20 to 34 years | 5 (100.0%) | 185.0 |
| 35 to 50 years | 0 (0.0%) | 0.0 |
| Total | 5 (100.0%) | 109.0 |
Fertility by Age by Marriage Status in Calumet
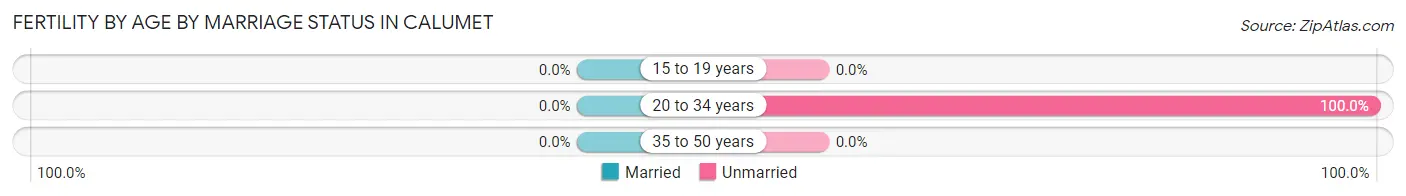
| Age Bracket | Married | Unmarried |
| 15 to 19 years | 0 (0.0%) | 0 (0.0%) |
| 20 to 34 years | 0 (0.0%) | 5 (100.0%) |
| 35 to 50 years | 0 (0.0%) | 0 (0.0%) |
| Total | 0 (0.0%) | 5 (100.0%) |
Fertility by Education in Calumet
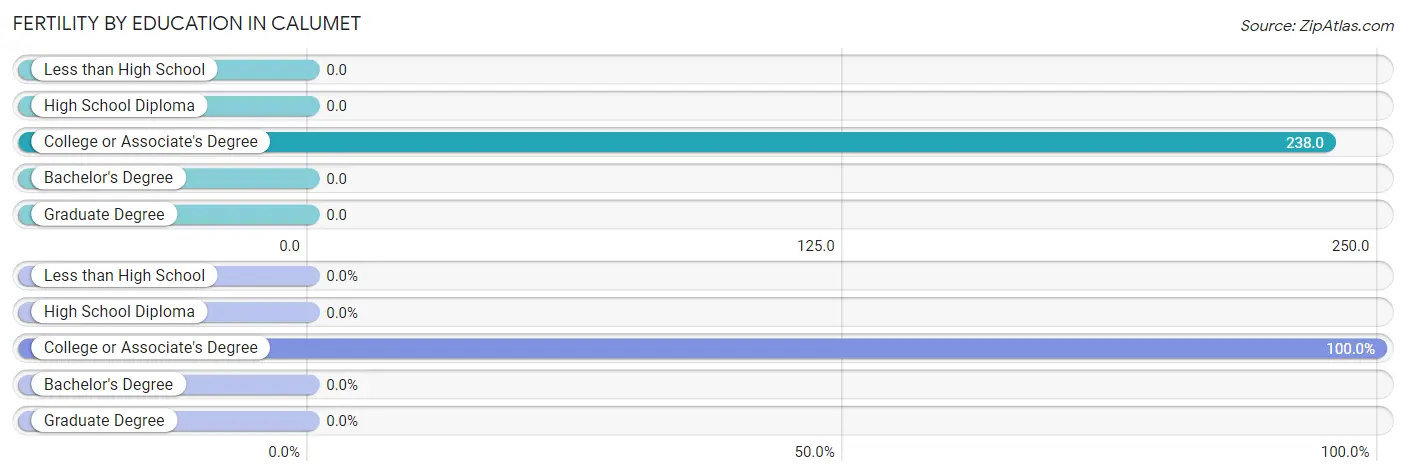
| Educational Attainment | Women with Births | Births / 1,000 Women |
| Less than High School | 0 (0.0%) | 0.0 |
| High School Diploma | 0 (0.0%) | 0.0 |
| College or Associate's Degree | 5 (100.0%) | 238.0 |
| Bachelor's Degree | 0 (0.0%) | 0.0 |
| Graduate Degree | 0 (0.0%) | 0.0 |
| Total | 5 (100.0%) | 109.0 |
Fertility by Education by Marriage Status in Calumet
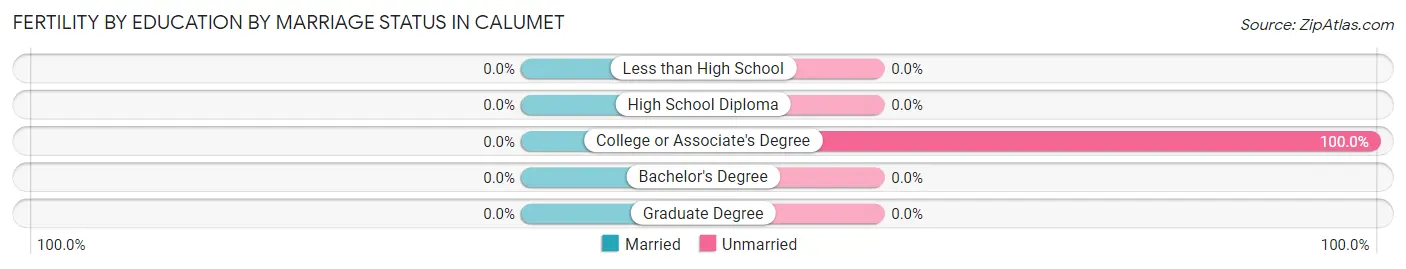
| Educational Attainment | Married | Unmarried |
| Less than High School | 0 (0.0%) | 0 (0.0%) |
| High School Diploma | 0 (0.0%) | 0 (0.0%) |
| College or Associate's Degree | 0 (0.0%) | 5 (100.0%) |
| Bachelor's Degree | 0 (0.0%) | 0 (0.0%) |
| Graduate Degree | 0 (0.0%) | 0 (0.0%) |
| Total | 0 (0.0%) | 5 (100.0%) |
Employment Characteristics in Calumet
Employment by Class of Employer in Calumet
Among the 97 employed individuals in Calumet, private company employees (55 | 56.7%), not-for-profit organizations (21 | 21.6%), and local government employees (14 | 14.4%) make up the most common classes of employment.
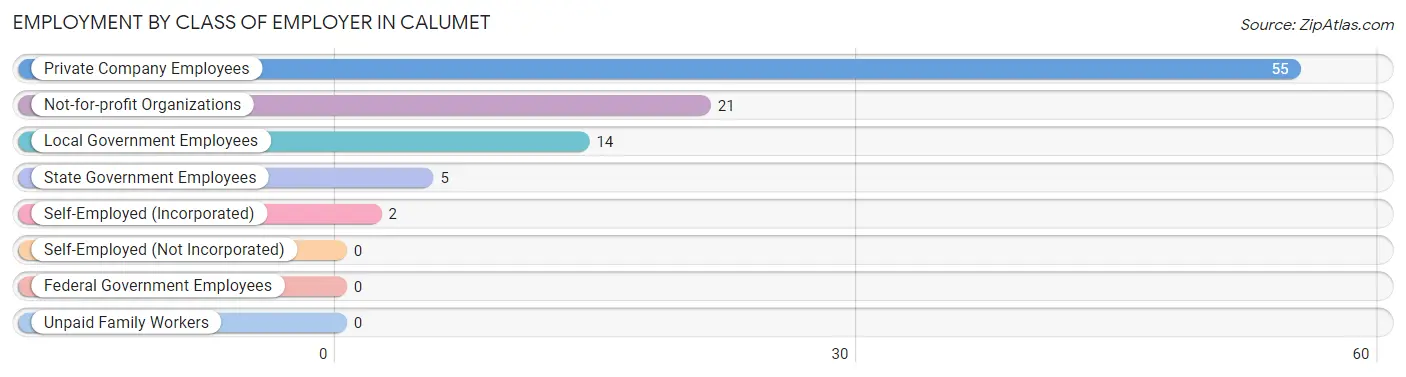
| Employer Class | # Employees | % Employees |
| Private Company Employees | 55 | 56.7% |
| Self-Employed (Incorporated) | 2 | 2.1% |
| Self-Employed (Not Incorporated) | 0 | 0.0% |
| Not-for-profit Organizations | 21 | 21.6% |
| Local Government Employees | 14 | 14.4% |
| State Government Employees | 5 | 5.1% |
| Federal Government Employees | 0 | 0.0% |
| Unpaid Family Workers | 0 | 0.0% |
| Total | 97 | 100.0% |
Employment Status by Age in Calumet
According to the labor force statistics for Calumet, out of the total population over 16 years of age (211), 53.6% or 113 individuals are in the labor force, with 14.2% or 16 of them unemployed. The age group with the highest labor force participation rate is 25 to 29 years, with 100.0% or 19 individuals in the labor force. Within the labor force, the 25 to 29 years age range has the highest percentage of unemployed individuals, with 57.9% or 11 of them being unemployed.
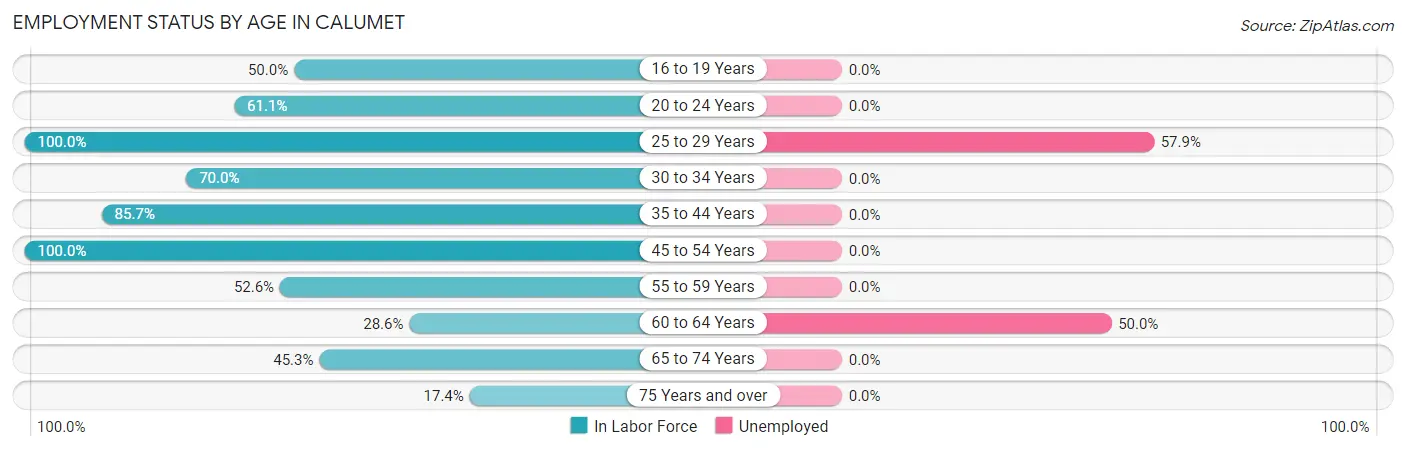
| Age Bracket | In Labor Force | Unemployed |
| 16 to 19 Years | 4 (50.0%) | 0 (0.0%) |
| 20 to 24 Years | 11 (61.1%) | 0 (0.0%) |
| 25 to 29 Years | 19 (100.0%) | 11 (57.9%) |
| 30 to 34 Years | 7 (70.0%) | 0 (0.0%) |
| 35 to 44 Years | 12 (85.7%) | 0 (0.0%) |
| 45 to 54 Years | 12 (100.0%) | 0 (0.0%) |
| 55 to 59 Years | 10 (52.6%) | 0 (0.0%) |
| 60 to 64 Years | 10 (28.6%) | 5 (50.0%) |
| 65 to 74 Years | 24 (45.3%) | 0 (0.0%) |
| 75 Years and over | 4 (17.4%) | 0 (0.0%) |
| Total | 113 (53.6%) | 16 (14.2%) |
Employment Status by Educational Attainment in Calumet
According to labor force statistics for Calumet, 64.2% of individuals (70) out of the total population between 25 and 64 years of age (109) are in the labor force, with 22.9% or 16 of them being unemployed. The group with the highest labor force participation rate are those with the educational attainment of bachelor's degree or higher, with 100.0% or 3 individuals in the labor force. Within the labor force, individuals with high school diploma education have the highest percentage of unemployment, with 52.4% or 11 of them being unemployed.
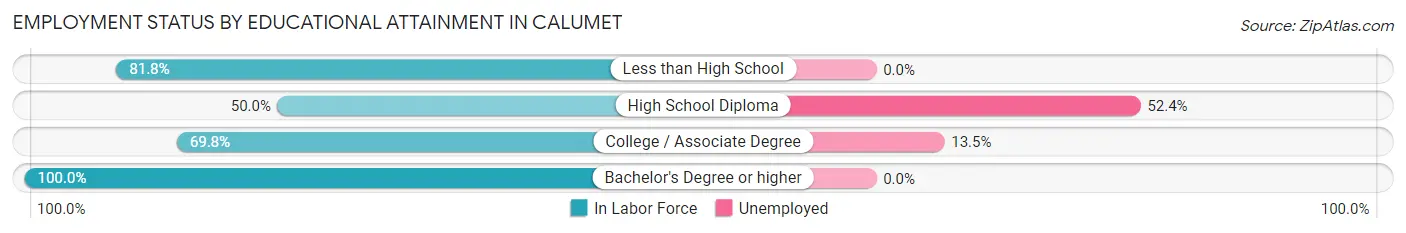
| Educational Attainment | In Labor Force | Unemployed |
| Less than High School | 9 (81.8%) | 0 (0.0%) |
| High School Diploma | 21 (50.0%) | 22 (52.4%) |
| College / Associate Degree | 37 (69.8%) | 7 (13.5%) |
| Bachelor's Degree or higher | 3 (100.0%) | 0 (0.0%) |
| Total | 70 (64.2%) | 25 (22.9%) |
Employment Occupations by Sex in Calumet
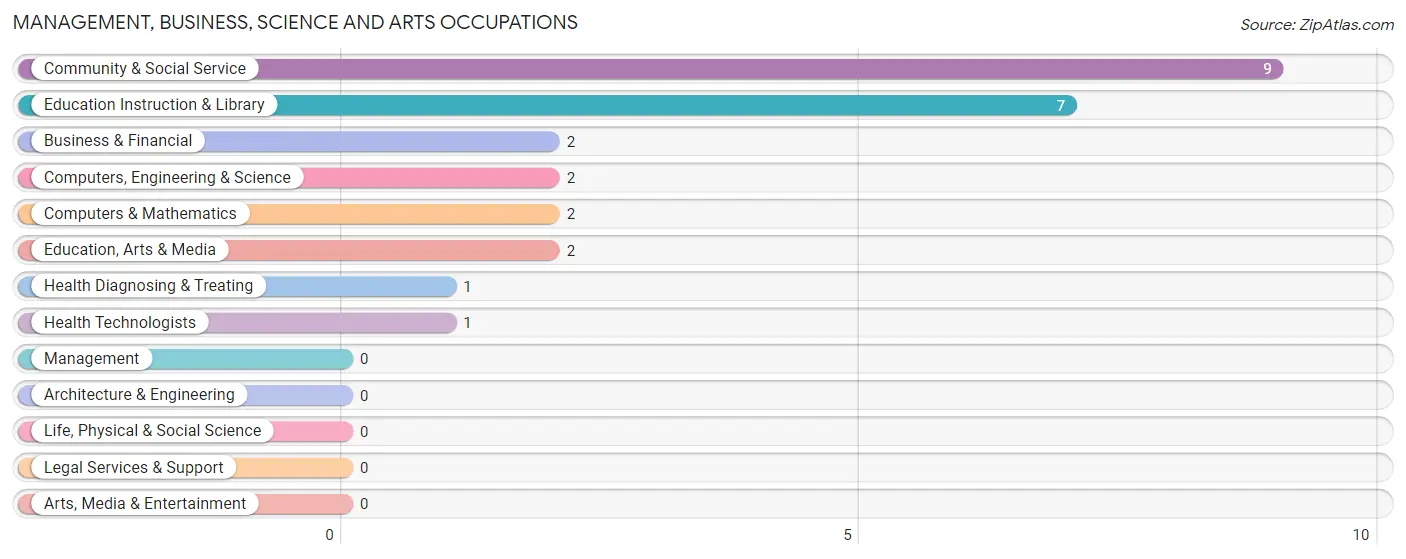
Management, Business, Science and Arts Occupations
The most common Management, Business, Science and Arts occupations in Calumet are Community & Social Service (9 | 9.3%), Education Instruction & Library (7 | 7.2%), Business & Financial (2 | 2.1%), Computers, Engineering & Science (2 | 2.1%), and Computers & Mathematics (2 | 2.1%).
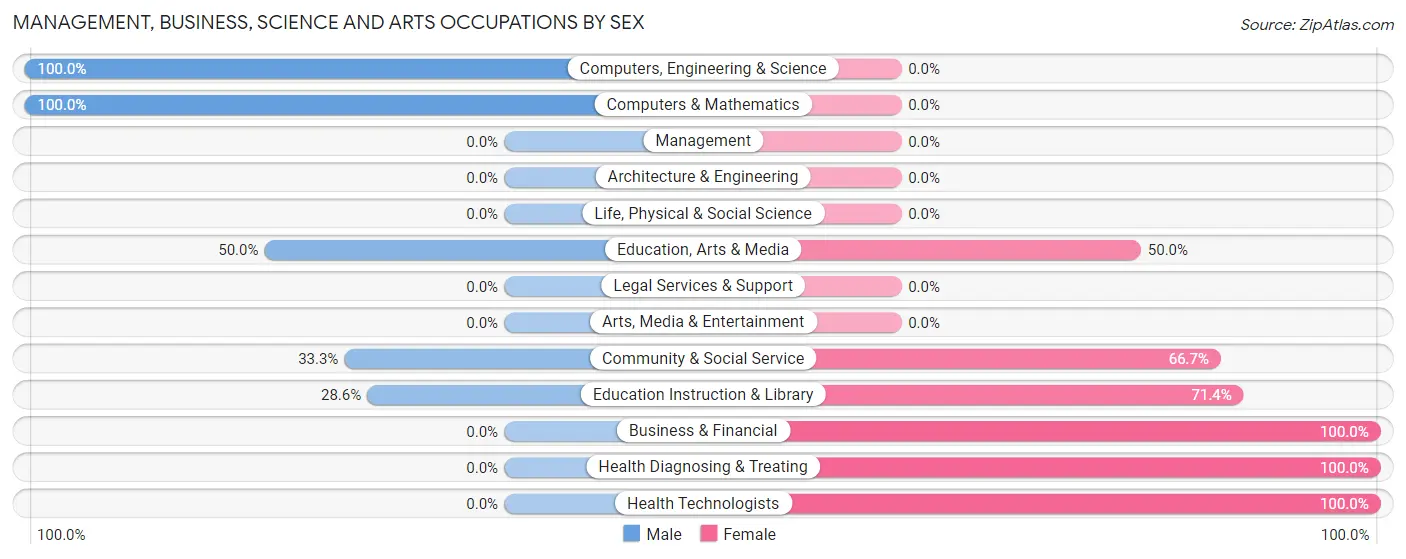
Management, Business, Science and Arts Occupations by Sex
Within the Management, Business, Science and Arts occupations in Calumet, the most male-oriented occupations are Computers, Engineering & Science (100.0%), Computers & Mathematics (100.0%), and Education, Arts & Media (50.0%), while the most female-oriented occupations are Business & Financial (100.0%), Health Diagnosing & Treating (100.0%), and Health Technologists (100.0%).
| Occupation | Male | Female |
| Management | 0 (0.0%) | 0 (0.0%) |
| Business & Financial | 0 (0.0%) | 2 (100.0%) |
| Computers, Engineering & Science | 2 (100.0%) | 0 (0.0%) |
| Computers & Mathematics | 2 (100.0%) | 0 (0.0%) |
| Architecture & Engineering | 0 (0.0%) | 0 (0.0%) |
| Life, Physical & Social Science | 0 (0.0%) | 0 (0.0%) |
| Community & Social Service | 3 (33.3%) | 6 (66.7%) |
| Education, Arts & Media | 1 (50.0%) | 1 (50.0%) |
| Legal Services & Support | 0 (0.0%) | 0 (0.0%) |
| Education Instruction & Library | 2 (28.6%) | 5 (71.4%) |
| Arts, Media & Entertainment | 0 (0.0%) | 0 (0.0%) |
| Health Diagnosing & Treating | 0 (0.0%) | 1 (100.0%) |
| Health Technologists | 0 (0.0%) | 1 (100.0%) |
| Total (Category) | 5 (35.7%) | 9 (64.3%) |
| Total (Overall) | 25 (25.8%) | 72 (74.2%) |
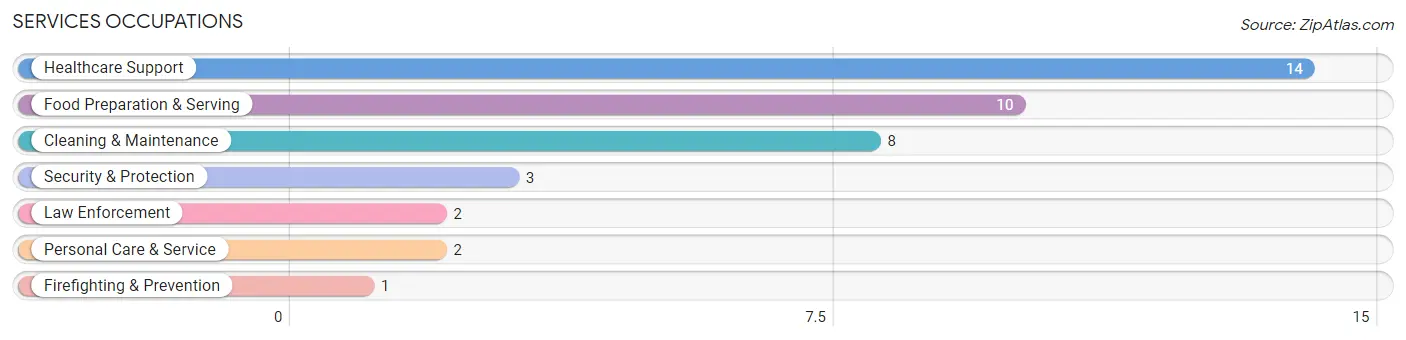
Services Occupations
The most common Services occupations in Calumet are Healthcare Support (14 | 14.4%), Food Preparation & Serving (10 | 10.3%), Cleaning & Maintenance (8 | 8.3%), Security & Protection (3 | 3.1%), and Law Enforcement (2 | 2.1%).
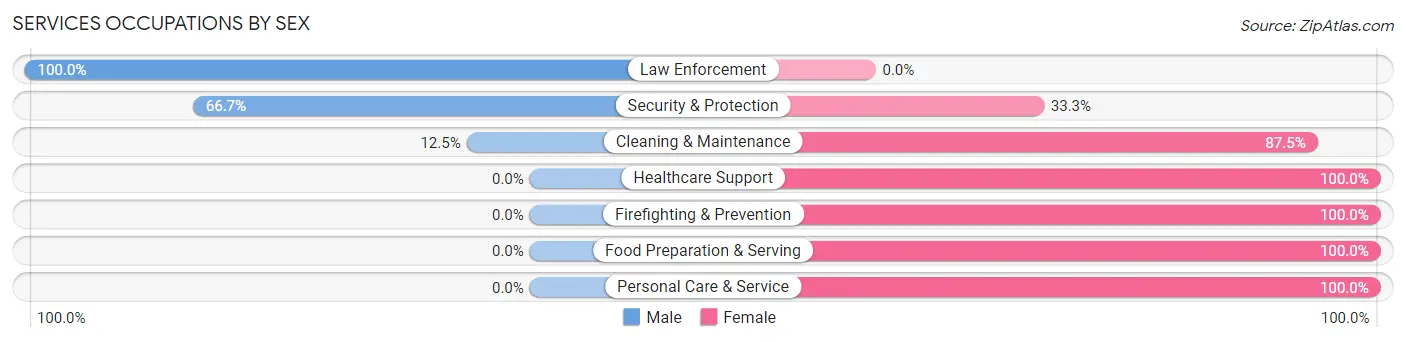
Services Occupations by Sex
Within the Services occupations in Calumet, the most male-oriented occupations are Law Enforcement (100.0%), Security & Protection (66.7%), and Cleaning & Maintenance (12.5%), while the most female-oriented occupations are Healthcare Support (100.0%), Firefighting & Prevention (100.0%), and Food Preparation & Serving (100.0%).
| Occupation | Male | Female |
| Healthcare Support | 0 (0.0%) | 14 (100.0%) |
| Security & Protection | 2 (66.7%) | 1 (33.3%) |
| Firefighting & Prevention | 0 (0.0%) | 1 (100.0%) |
| Law Enforcement | 2 (100.0%) | 0 (0.0%) |
| Food Preparation & Serving | 0 (0.0%) | 10 (100.0%) |
| Cleaning & Maintenance | 1 (12.5%) | 7 (87.5%) |
| Personal Care & Service | 0 (0.0%) | 2 (100.0%) |
| Total (Category) | 3 (8.1%) | 34 (91.9%) |
| Total (Overall) | 25 (25.8%) | 72 (74.2%) |
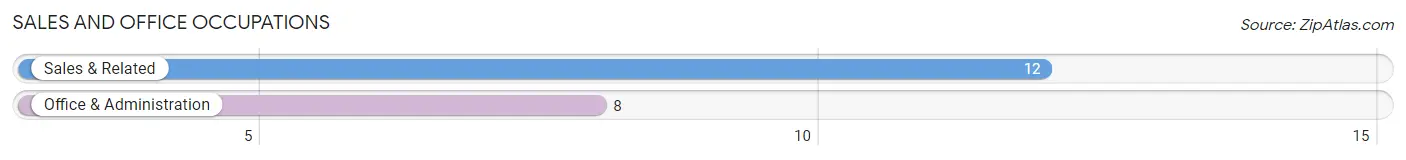
Sales and Office Occupations
The most common Sales and Office occupations in Calumet are Sales & Related (12 | 12.4%), and Office & Administration (8 | 8.3%).
Sales and Office Occupations by Sex
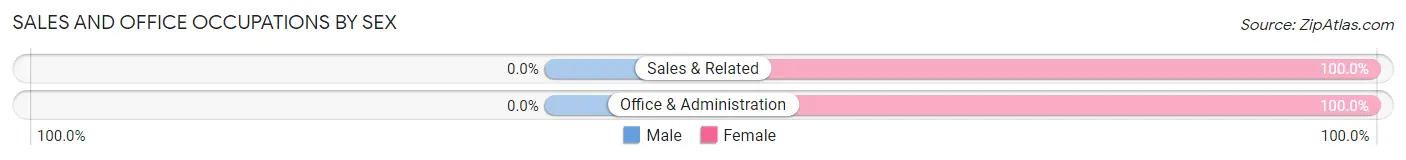
| Occupation | Male | Female |
| Sales & Related | 0 (0.0%) | 12 (100.0%) |
| Office & Administration | 0 (0.0%) | 8 (100.0%) |
| Total (Category) | 0 (0.0%) | 20 (100.0%) |
| Total (Overall) | 25 (25.8%) | 72 (74.2%) |
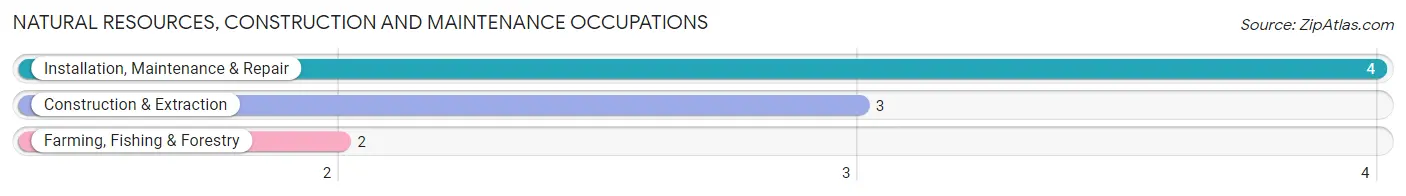
Natural Resources, Construction and Maintenance Occupations
The most common Natural Resources, Construction and Maintenance occupations in Calumet are Installation, Maintenance & Repair (4 | 4.1%), Construction & Extraction (3 | 3.1%), and Farming, Fishing & Forestry (2 | 2.1%).
Natural Resources, Construction and Maintenance Occupations by Sex
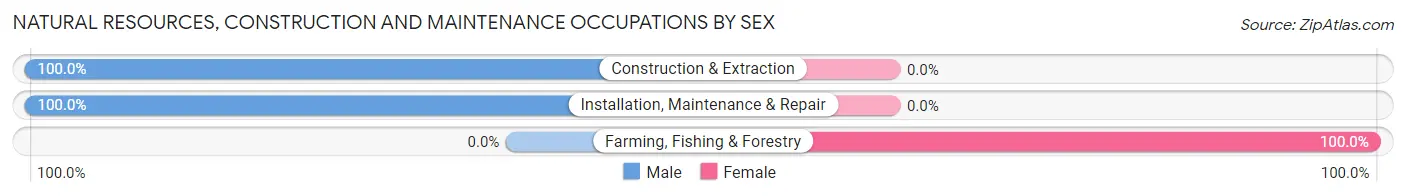
| Occupation | Male | Female |
| Farming, Fishing & Forestry | 0 (0.0%) | 2 (100.0%) |
| Construction & Extraction | 3 (100.0%) | 0 (0.0%) |
| Installation, Maintenance & Repair | 4 (100.0%) | 0 (0.0%) |
| Total (Category) | 7 (77.8%) | 2 (22.2%) |
| Total (Overall) | 25 (25.8%) | 72 (74.2%) |
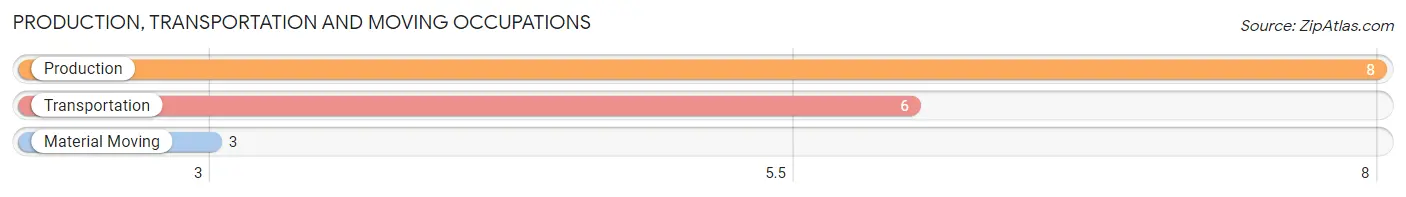
Production, Transportation and Moving Occupations
The most common Production, Transportation and Moving occupations in Calumet are Production (8 | 8.3%), Transportation (6 | 6.2%), and Material Moving (3 | 3.1%).
Production, Transportation and Moving Occupations by Sex
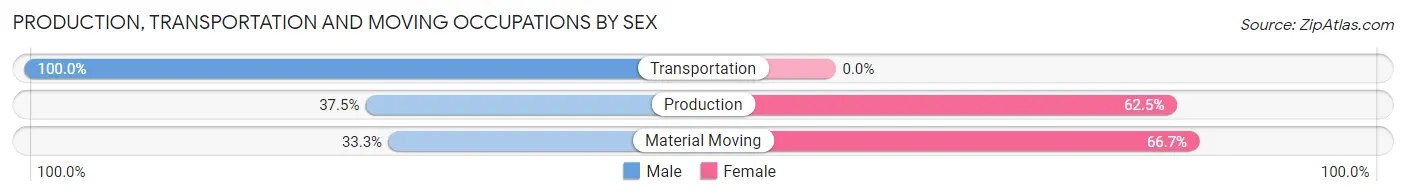
| Occupation | Male | Female |
| Production | 3 (37.5%) | 5 (62.5%) |
| Transportation | 6 (100.0%) | 0 (0.0%) |
| Material Moving | 1 (33.3%) | 2 (66.7%) |
| Total (Category) | 10 (58.8%) | 7 (41.2%) |
| Total (Overall) | 25 (25.8%) | 72 (74.2%) |
Employment Industries by Sex in Calumet
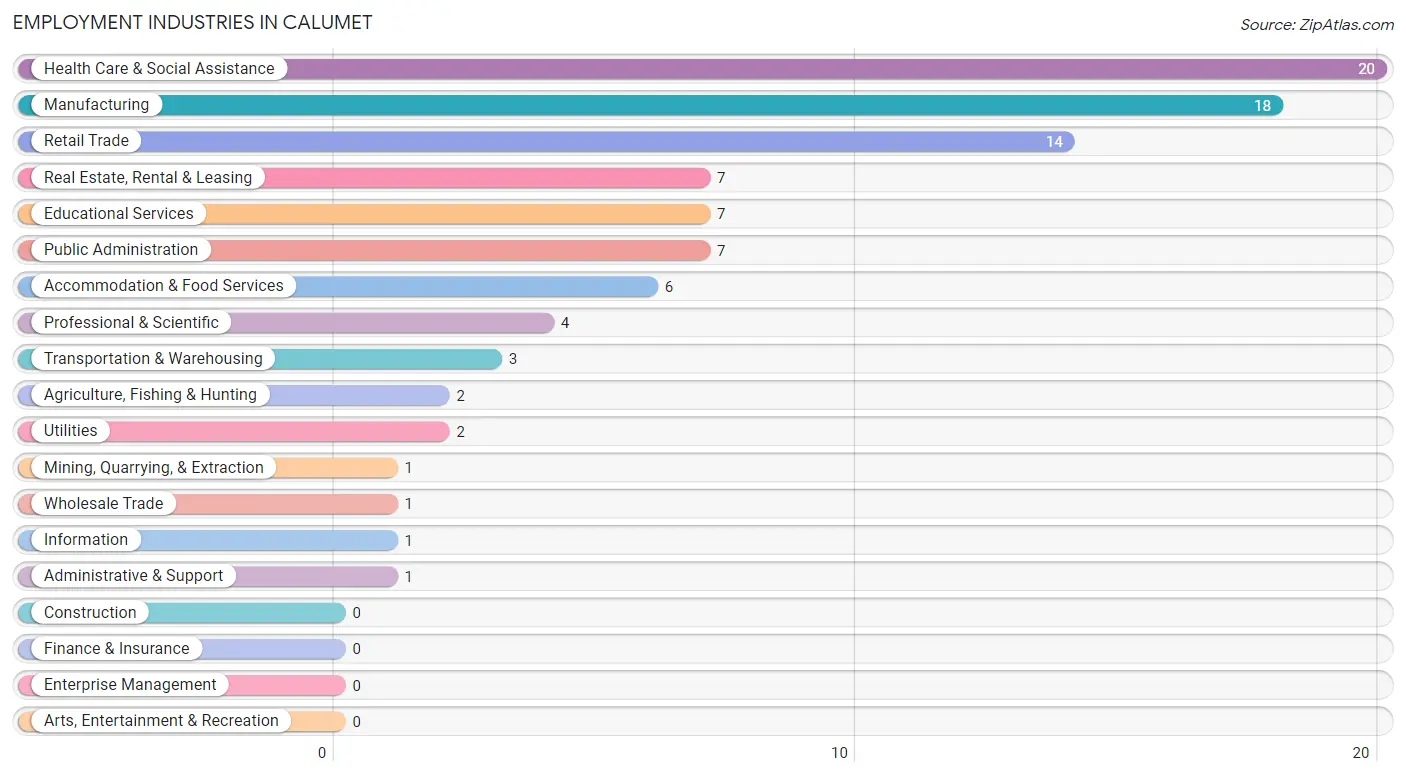
Employment Industries in Calumet
The major employment industries in Calumet include Health Care & Social Assistance (20 | 20.6%), Manufacturing (18 | 18.6%), Retail Trade (14 | 14.4%), Real Estate, Rental & Leasing (7 | 7.2%), and Educational Services (7 | 7.2%).
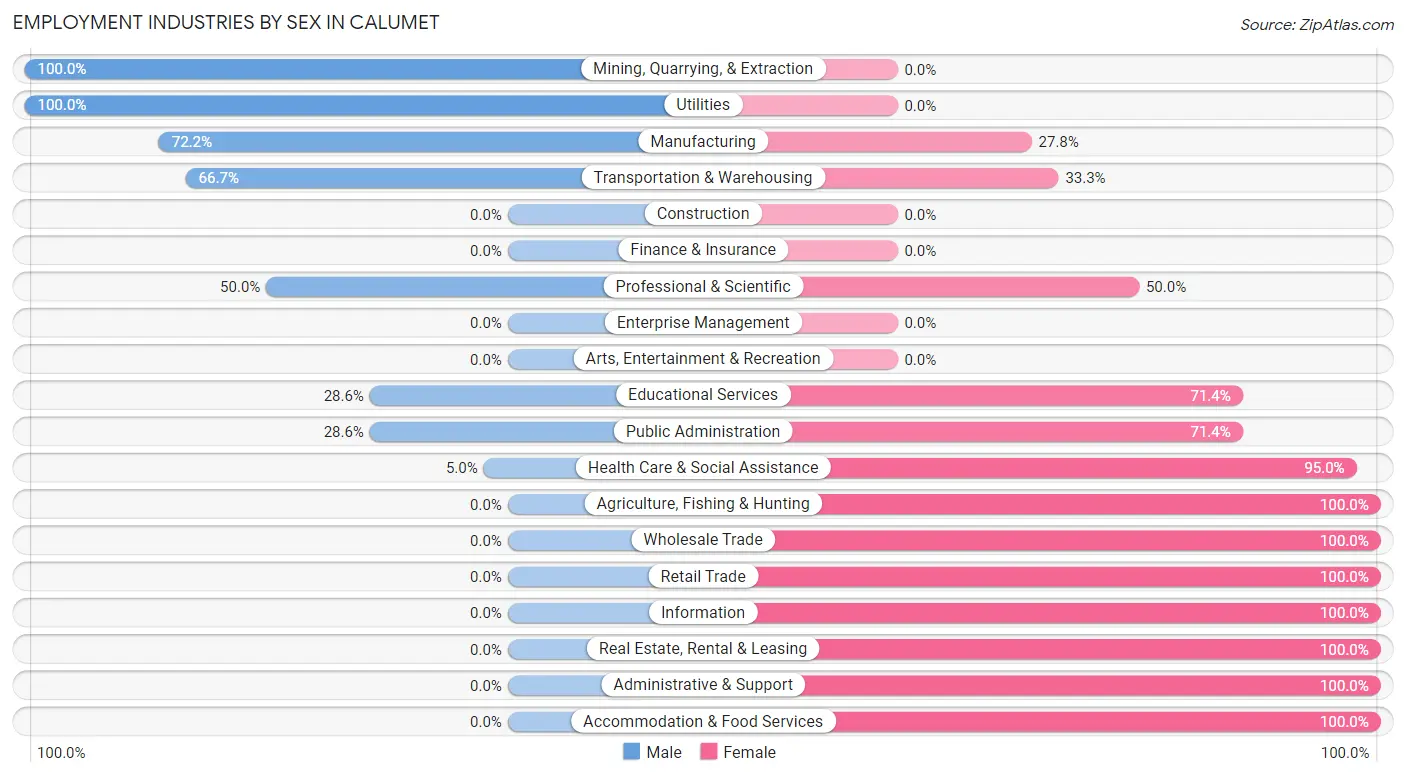
Employment Industries by Sex in Calumet
The Calumet industries that see more men than women are Mining, Quarrying, & Extraction (100.0%), Utilities (100.0%), and Manufacturing (72.2%), whereas the industries that tend to have a higher number of women are Agriculture, Fishing & Hunting (100.0%), Wholesale Trade (100.0%), and Retail Trade (100.0%).
| Industry | Male | Female |
| Agriculture, Fishing & Hunting | 0 (0.0%) | 2 (100.0%) |
| Mining, Quarrying, & Extraction | 1 (100.0%) | 0 (0.0%) |
| Construction | 0 (0.0%) | 0 (0.0%) |
| Manufacturing | 13 (72.2%) | 5 (27.8%) |
| Wholesale Trade | 0 (0.0%) | 1 (100.0%) |
| Retail Trade | 0 (0.0%) | 14 (100.0%) |
| Transportation & Warehousing | 2 (66.7%) | 1 (33.3%) |
| Utilities | 2 (100.0%) | 0 (0.0%) |
| Information | 0 (0.0%) | 1 (100.0%) |
| Finance & Insurance | 0 (0.0%) | 0 (0.0%) |
| Real Estate, Rental & Leasing | 0 (0.0%) | 7 (100.0%) |
| Professional & Scientific | 2 (50.0%) | 2 (50.0%) |
| Enterprise Management | 0 (0.0%) | 0 (0.0%) |
| Administrative & Support | 0 (0.0%) | 1 (100.0%) |
| Educational Services | 2 (28.6%) | 5 (71.4%) |
| Health Care & Social Assistance | 1 (5.0%) | 19 (95.0%) |
| Arts, Entertainment & Recreation | 0 (0.0%) | 0 (0.0%) |
| Accommodation & Food Services | 0 (0.0%) | 6 (100.0%) |
| Public Administration | 2 (28.6%) | 5 (71.4%) |
| Total | 25 (25.8%) | 72 (74.2%) |
Education in Calumet
School Enrollment in Calumet
The most common levels of schooling among the 60 students in Calumet are college / undergraduate (17 | 28.3%), middle school (15 | 25.0%), and high school (11 | 18.3%).
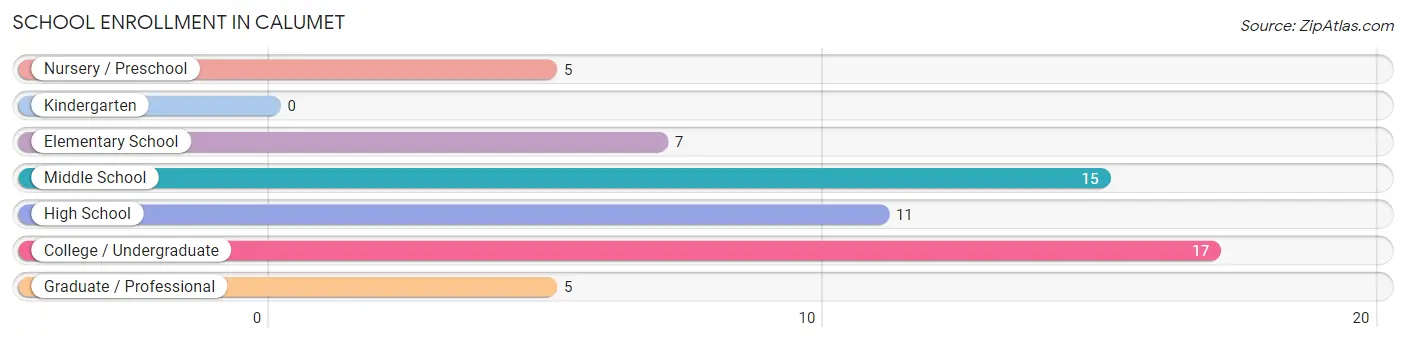
| School Level | # Students | % Students |
| Nursery / Preschool | 5 | 8.3% |
| Kindergarten | 0 | 0.0% |
| Elementary School | 7 | 11.7% |
| Middle School | 15 | 25.0% |
| High School | 11 | 18.3% |
| College / Undergraduate | 17 | 28.3% |
| Graduate / Professional | 5 | 8.3% |
| Total | 60 | 100.0% |
School Enrollment by Age by Funding Source in Calumet
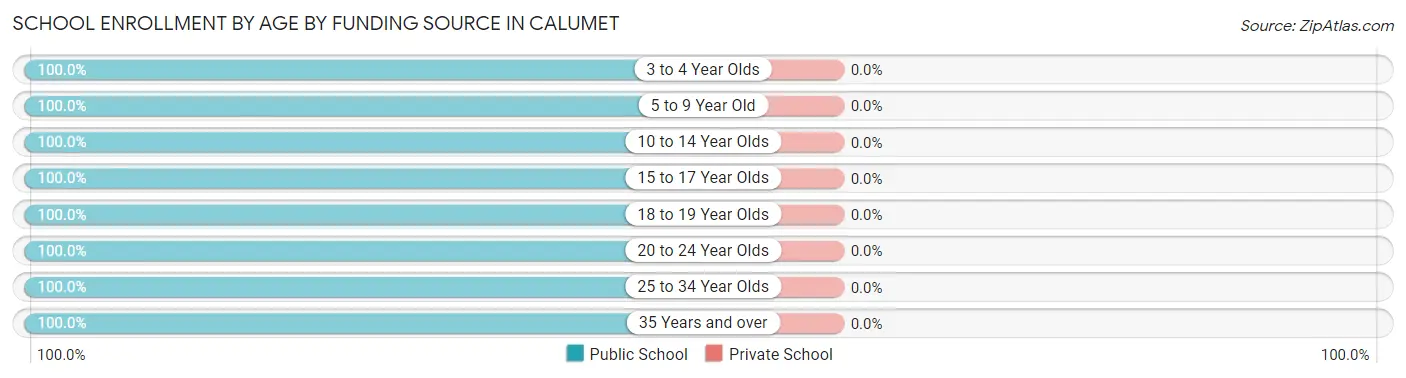
| Age Bracket | Public School | Private School |
| 3 to 4 Year Olds | 5 (100.0%) | 0 (0.0%) |
| 5 to 9 Year Old | 5 (100.0%) | 0 (0.0%) |
| 10 to 14 Year Olds | 14 (100.0%) | 0 (0.0%) |
| 15 to 17 Year Olds | 12 (100.0%) | 0 (0.0%) |
| 18 to 19 Year Olds | 4 (100.0%) | 0 (0.0%) |
| 20 to 24 Year Olds | 5 (100.0%) | 0 (0.0%) |
| 25 to 34 Year Olds | 4 (100.0%) | 0 (0.0%) |
| 35 Years and over | 11 (100.0%) | 0 (0.0%) |
| Total | 60 (100.0%) | 0 (0.0%) |
Educational Attainment by Field of Study in Calumet
Science & technology (6 | 42.9%), engineering (4 | 28.6%), psychology (2 | 14.3%), visual & performing arts (1 | 7.1%), and arts & humanities (1 | 7.1%) are the most common fields of study among 14 individuals in Calumet who have obtained a bachelor's degree or higher.
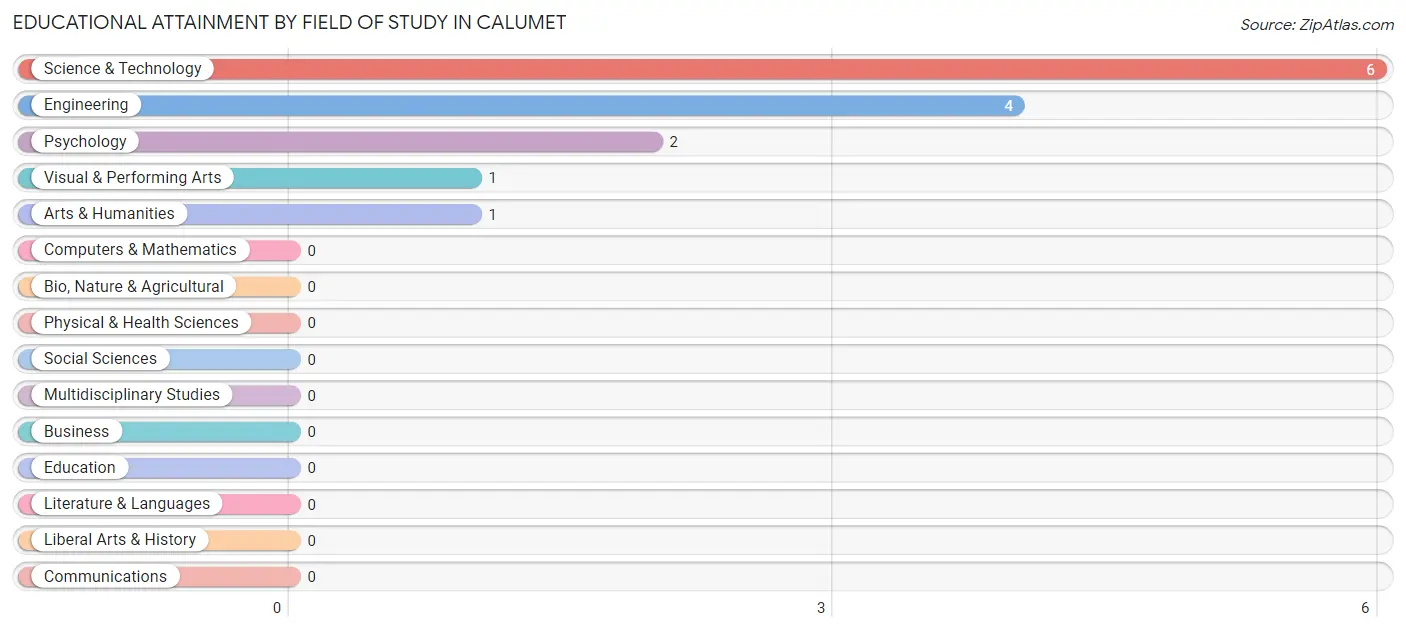
| Field of Study | # Graduates | % Graduates |
| Computers & Mathematics | 0 | 0.0% |
| Bio, Nature & Agricultural | 0 | 0.0% |
| Physical & Health Sciences | 0 | 0.0% |
| Psychology | 2 | 14.3% |
| Social Sciences | 0 | 0.0% |
| Engineering | 4 | 28.6% |
| Multidisciplinary Studies | 0 | 0.0% |
| Science & Technology | 6 | 42.9% |
| Business | 0 | 0.0% |
| Education | 0 | 0.0% |
| Literature & Languages | 0 | 0.0% |
| Liberal Arts & History | 0 | 0.0% |
| Visual & Performing Arts | 1 | 7.1% |
| Communications | 0 | 0.0% |
| Arts & Humanities | 1 | 7.1% |
| Total | 14 | 100.0% |
Transportation & Commute in Calumet
Vehicle Availability by Sex in Calumet
The most prevalent vehicle ownership categories in Calumet are males with 2 vehicles (11, accounting for 44.0%) and females with 2 vehicles (28, making up 15.3%).
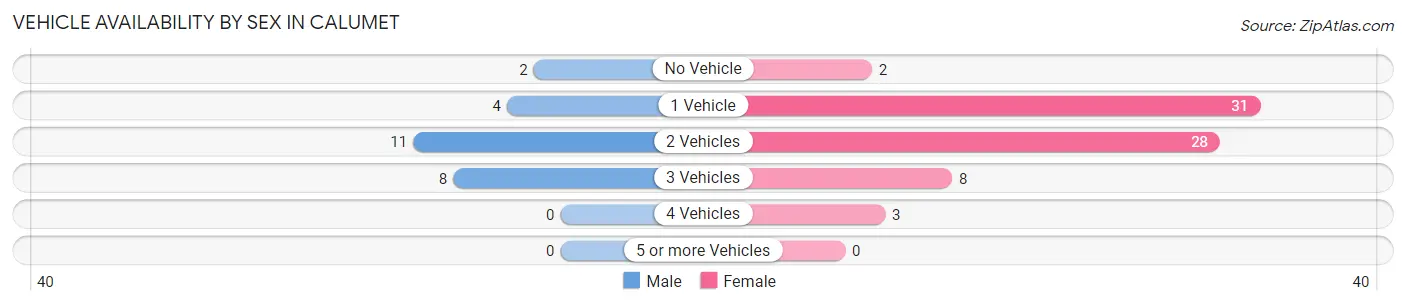
| Vehicles Available | Male | Female |
| No Vehicle | 2 (8.0%) | 2 (2.8%) |
| 1 Vehicle | 4 (16.0%) | 31 (43.1%) |
| 2 Vehicles | 11 (44.0%) | 28 (38.9%) |
| 3 Vehicles | 8 (32.0%) | 8 (11.1%) |
| 4 Vehicles | 0 (0.0%) | 3 (4.2%) |
| 5 or more Vehicles | 0 (0.0%) | 0 (0.0%) |
| Total | 25 (100.0%) | 72 (100.0%) |
Commute Time in Calumet
The most frequently occuring commute durations in Calumet are 20 to 24 minutes (28 commuters, 31.8%), 30 to 34 minutes (25 commuters, 28.4%), and 25 to 29 minutes (16 commuters, 18.2%).
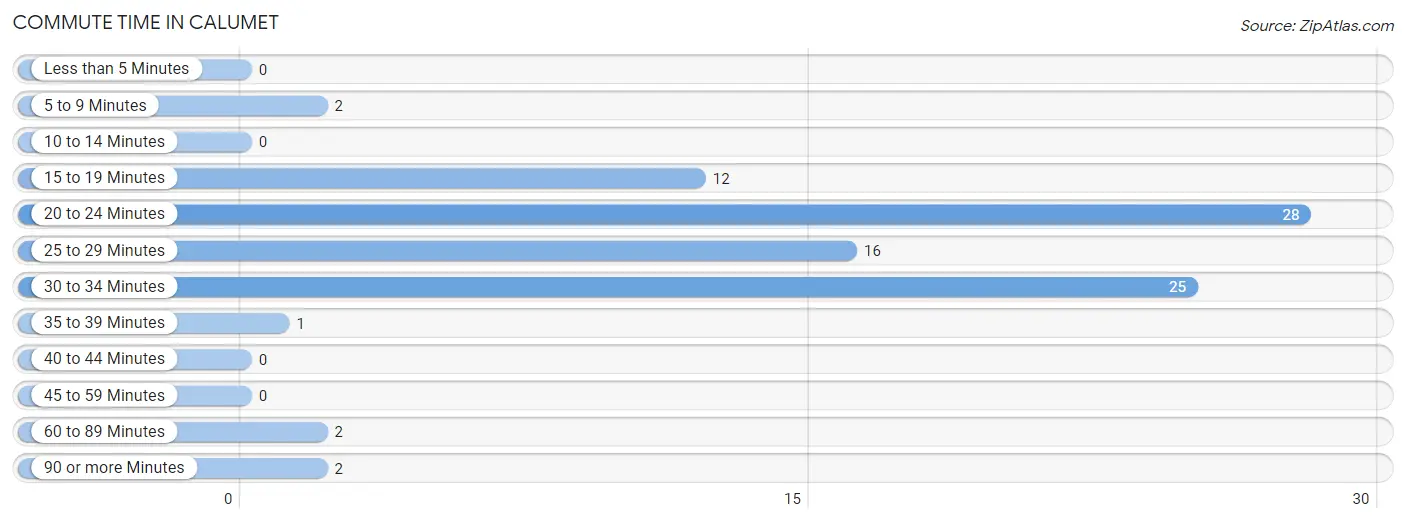
| Commute Time | # Commuters | % Commuters |
| Less than 5 Minutes | 0 | 0.0% |
| 5 to 9 Minutes | 2 | 2.3% |
| 10 to 14 Minutes | 0 | 0.0% |
| 15 to 19 Minutes | 12 | 13.6% |
| 20 to 24 Minutes | 28 | 31.8% |
| 25 to 29 Minutes | 16 | 18.2% |
| 30 to 34 Minutes | 25 | 28.4% |
| 35 to 39 Minutes | 1 | 1.1% |
| 40 to 44 Minutes | 0 | 0.0% |
| 45 to 59 Minutes | 0 | 0.0% |
| 60 to 89 Minutes | 2 | 2.3% |
| 90 or more Minutes | 2 | 2.3% |
Commute Time by Sex in Calumet
The most common commute times in Calumet are 30 to 34 minutes (4 commuters, 20.0%) for males and 20 to 24 minutes (25 commuters, 36.8%) for females.
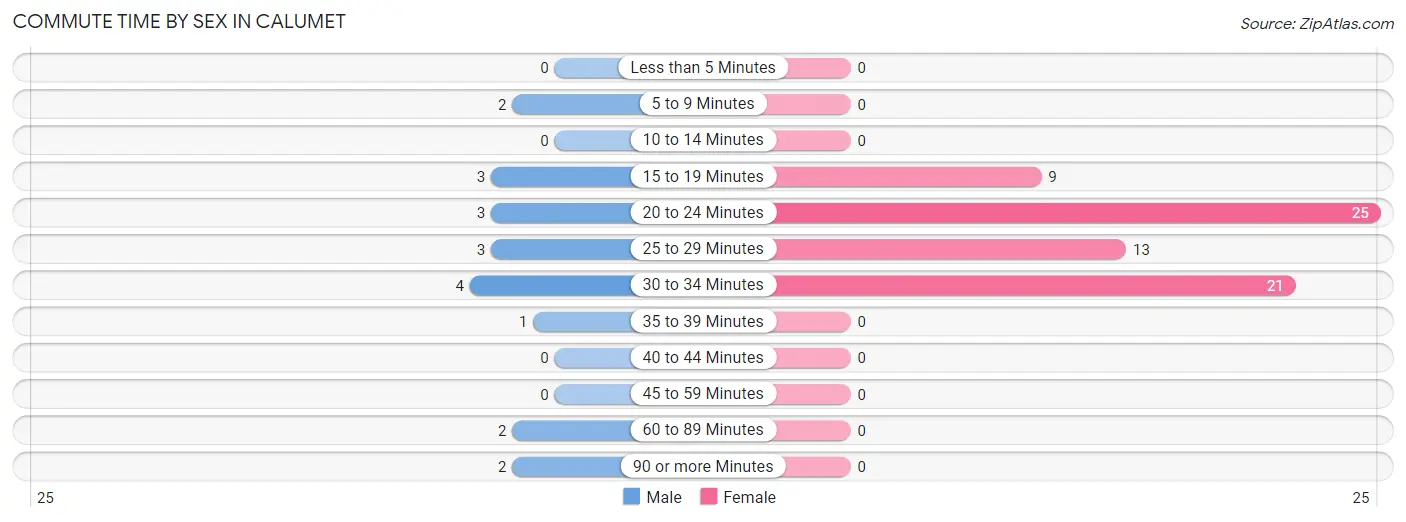
| Commute Time | Male | Female |
| Less than 5 Minutes | 0 (0.0%) | 0 (0.0%) |
| 5 to 9 Minutes | 2 (10.0%) | 0 (0.0%) |
| 10 to 14 Minutes | 0 (0.0%) | 0 (0.0%) |
| 15 to 19 Minutes | 3 (15.0%) | 9 (13.2%) |
| 20 to 24 Minutes | 3 (15.0%) | 25 (36.8%) |
| 25 to 29 Minutes | 3 (15.0%) | 13 (19.1%) |
| 30 to 34 Minutes | 4 (20.0%) | 21 (30.9%) |
| 35 to 39 Minutes | 1 (5.0%) | 0 (0.0%) |
| 40 to 44 Minutes | 0 (0.0%) | 0 (0.0%) |
| 45 to 59 Minutes | 0 (0.0%) | 0 (0.0%) |
| 60 to 89 Minutes | 2 (10.0%) | 0 (0.0%) |
| 90 or more Minutes | 2 (10.0%) | 0 (0.0%) |
Time of Departure to Work by Sex in Calumet
The most frequent times of departure to work in Calumet are 12:00 AM to 4:59 AM (5, 25.0%) for males and 12:00 AM to 4:59 AM (11, 16.2%) for females.
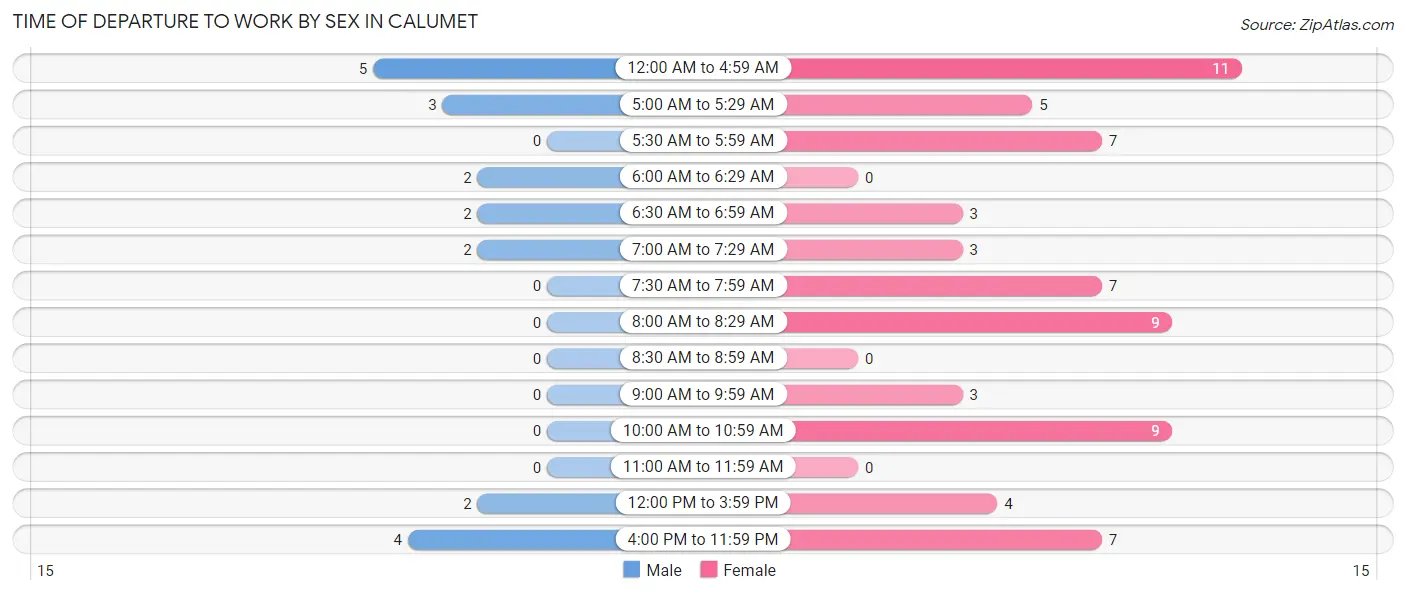
| Time of Departure | Male | Female |
| 12:00 AM to 4:59 AM | 5 (25.0%) | 11 (16.2%) |
| 5:00 AM to 5:29 AM | 3 (15.0%) | 5 (7.3%) |
| 5:30 AM to 5:59 AM | 0 (0.0%) | 7 (10.3%) |
| 6:00 AM to 6:29 AM | 2 (10.0%) | 0 (0.0%) |
| 6:30 AM to 6:59 AM | 2 (10.0%) | 3 (4.4%) |
| 7:00 AM to 7:29 AM | 2 (10.0%) | 3 (4.4%) |
| 7:30 AM to 7:59 AM | 0 (0.0%) | 7 (10.3%) |
| 8:00 AM to 8:29 AM | 0 (0.0%) | 9 (13.2%) |
| 8:30 AM to 8:59 AM | 0 (0.0%) | 0 (0.0%) |
| 9:00 AM to 9:59 AM | 0 (0.0%) | 3 (4.4%) |
| 10:00 AM to 10:59 AM | 0 (0.0%) | 9 (13.2%) |
| 11:00 AM to 11:59 AM | 0 (0.0%) | 0 (0.0%) |
| 12:00 PM to 3:59 PM | 2 (10.0%) | 4 (5.9%) |
| 4:00 PM to 11:59 PM | 4 (20.0%) | 7 (10.3%) |
| Total | 20 (100.0%) | 68 (100.0%) |
Housing Occupancy in Calumet
Occupancy by Ownership in Calumet
Of the total 136 dwellings in Calumet, owner-occupied units account for 86 (63.2%), while renter-occupied units make up 50 (36.8%).
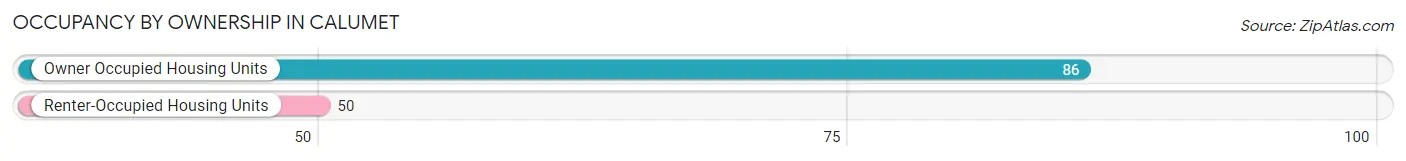
| Occupancy | # Housing Units | % Housing Units |
| Owner Occupied Housing Units | 86 | 63.2% |
| Renter-Occupied Housing Units | 50 | 36.8% |
| Total Occupied Housing Units | 136 | 100.0% |
Occupancy by Household Size in Calumet
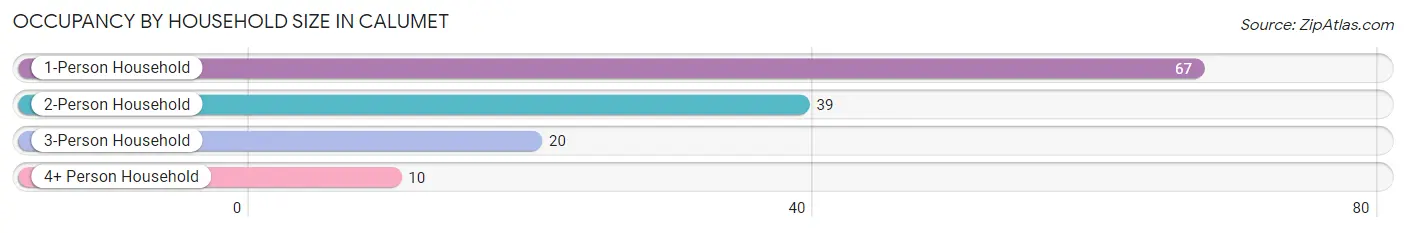
| Household Size | # Housing Units | % Housing Units |
| 1-Person Household | 67 | 49.3% |
| 2-Person Household | 39 | 28.7% |
| 3-Person Household | 20 | 14.7% |
| 4+ Person Household | 10 | 7.3% |
| Total Housing Units | 136 | 100.0% |
Occupancy by Ownership by Household Size in Calumet
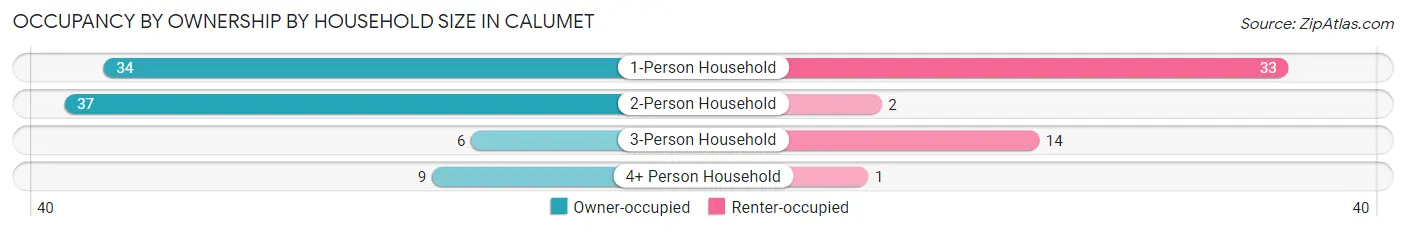
| Household Size | Owner-occupied | Renter-occupied |
| 1-Person Household | 34 (50.7%) | 33 (49.2%) |
| 2-Person Household | 37 (94.9%) | 2 (5.1%) |
| 3-Person Household | 6 (30.0%) | 14 (70.0%) |
| 4+ Person Household | 9 (90.0%) | 1 (10.0%) |
| Total Housing Units | 86 (63.2%) | 50 (36.8%) |
Occupancy by Educational Attainment in Calumet
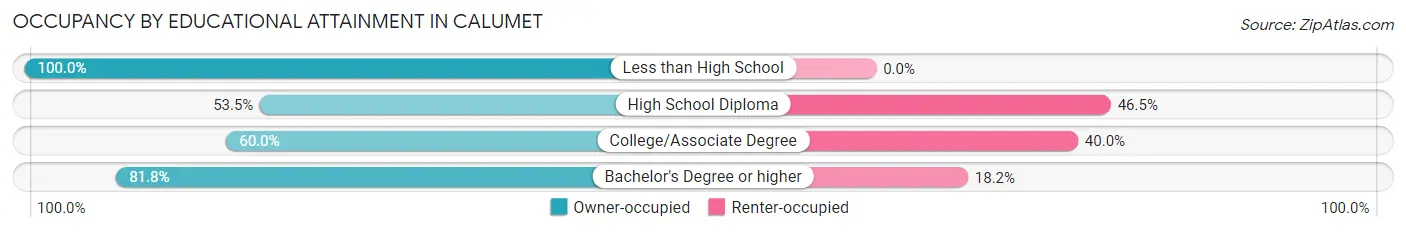
| Household Size | Owner-occupied | Renter-occupied |
| Less than High School | 12 (100.0%) | 0 (0.0%) |
| High School Diploma | 23 (53.5%) | 20 (46.5%) |
| College/Associate Degree | 42 (60.0%) | 28 (40.0%) |
| Bachelor's Degree or higher | 9 (81.8%) | 2 (18.2%) |
Occupancy by Age of Householder in Calumet
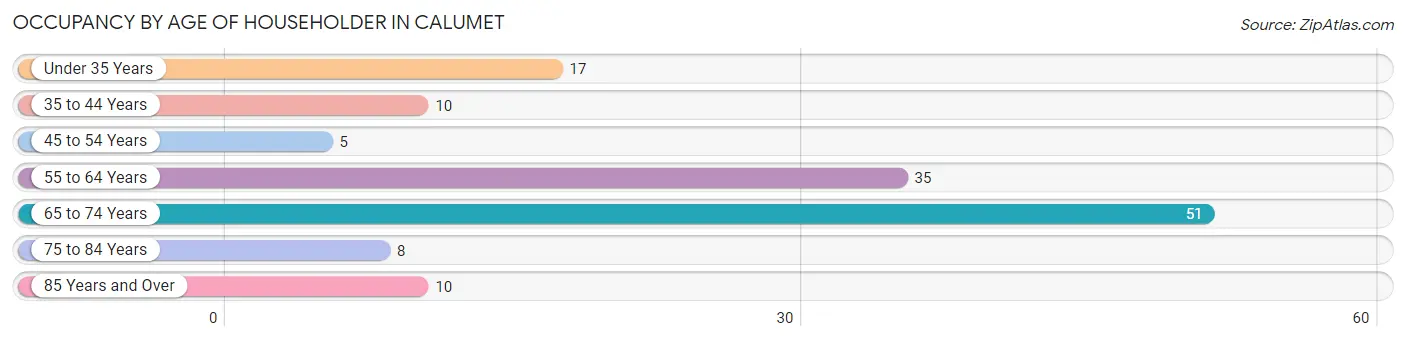
| Age Bracket | # Households | % Households |
| Under 35 Years | 17 | 12.5% |
| 35 to 44 Years | 10 | 7.3% |
| 45 to 54 Years | 5 | 3.7% |
| 55 to 64 Years | 35 | 25.7% |
| 65 to 74 Years | 51 | 37.5% |
| 75 to 84 Years | 8 | 5.9% |
| 85 Years and Over | 10 | 7.3% |
| Total | 136 | 100.0% |
Housing Finances in Calumet
Median Income by Occupancy in Calumet
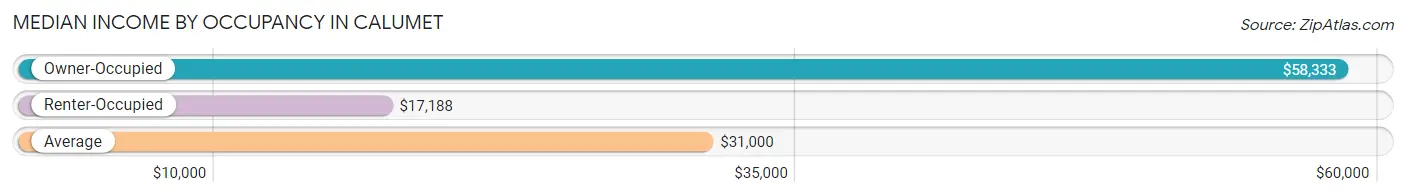
| Occupancy Type | # Households | Median Income |
| Owner-Occupied | 86 (63.2%) | $58,333 |
| Renter-Occupied | 50 (36.8%) | $17,188 |
| Average | 136 (100.0%) | $31,000 |
Occupancy by Householder Income Bracket in Calumet
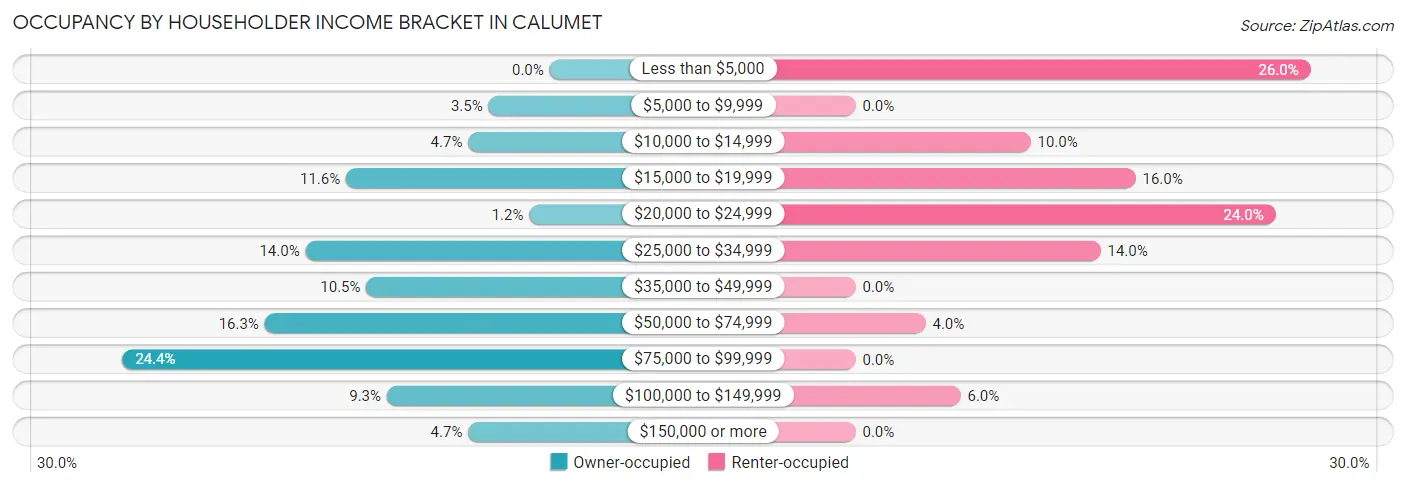
| Income Bracket | Owner-occupied | Renter-occupied |
| Less than $5,000 | 0 (0.0%) | 13 (26.0%) |
| $5,000 to $9,999 | 3 (3.5%) | 0 (0.0%) |
| $10,000 to $14,999 | 4 (4.6%) | 5 (10.0%) |
| $15,000 to $19,999 | 10 (11.6%) | 8 (16.0%) |
| $20,000 to $24,999 | 1 (1.2%) | 12 (24.0%) |
| $25,000 to $34,999 | 12 (14.0%) | 7 (14.0%) |
| $35,000 to $49,999 | 9 (10.5%) | 0 (0.0%) |
| $50,000 to $74,999 | 14 (16.3%) | 2 (4.0%) |
| $75,000 to $99,999 | 21 (24.4%) | 0 (0.0%) |
| $100,000 to $149,999 | 8 (9.3%) | 3 (6.0%) |
| $150,000 or more | 4 (4.6%) | 0 (0.0%) |
| Total | 86 (100.0%) | 50 (100.0%) |
Monthly Housing Cost Tiers in Calumet
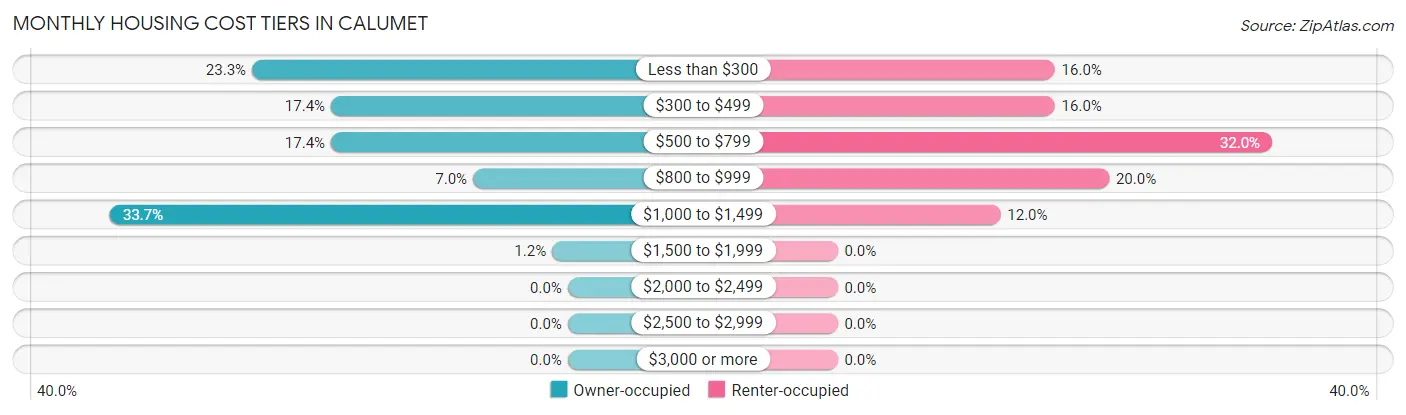
| Monthly Cost | Owner-occupied | Renter-occupied |
| Less than $300 | 20 (23.3%) | 8 (16.0%) |
| $300 to $499 | 15 (17.4%) | 8 (16.0%) |
| $500 to $799 | 15 (17.4%) | 16 (32.0%) |
| $800 to $999 | 6 (7.0%) | 10 (20.0%) |
| $1,000 to $1,499 | 29 (33.7%) | 6 (12.0%) |
| $1,500 to $1,999 | 1 (1.2%) | 0 (0.0%) |
| $2,000 to $2,499 | 0 (0.0%) | 0 (0.0%) |
| $2,500 to $2,999 | 0 (0.0%) | 0 (0.0%) |
| $3,000 or more | 0 (0.0%) | 0 (0.0%) |
| Total | 86 (100.0%) | 50 (100.0%) |
Physical Housing Characteristics in Calumet
Housing Structures in Calumet
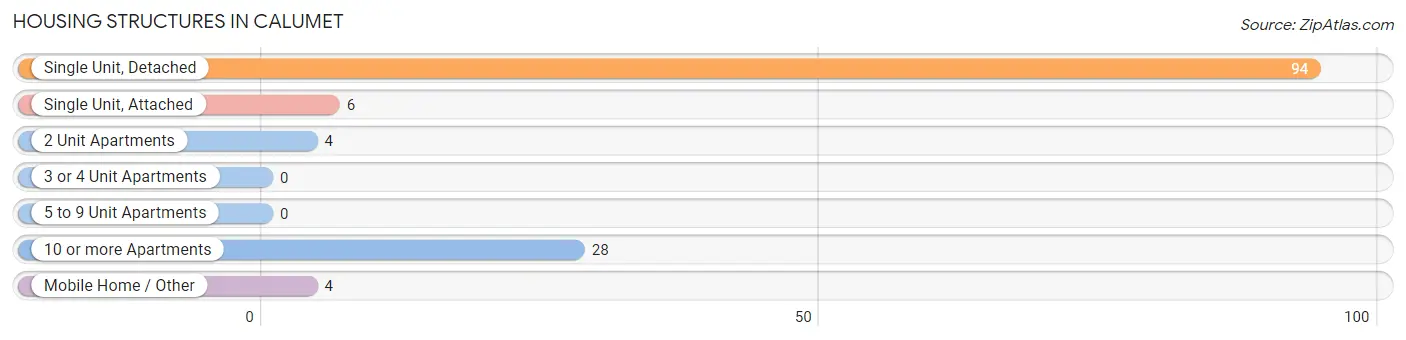
| Structure Type | # Housing Units | % Housing Units |
| Single Unit, Detached | 94 | 69.1% |
| Single Unit, Attached | 6 | 4.4% |
| 2 Unit Apartments | 4 | 2.9% |
| 3 or 4 Unit Apartments | 0 | 0.0% |
| 5 to 9 Unit Apartments | 0 | 0.0% |
| 10 or more Apartments | 28 | 20.6% |
| Mobile Home / Other | 4 | 2.9% |
| Total | 136 | 100.0% |
Housing Structures by Occupancy in Calumet
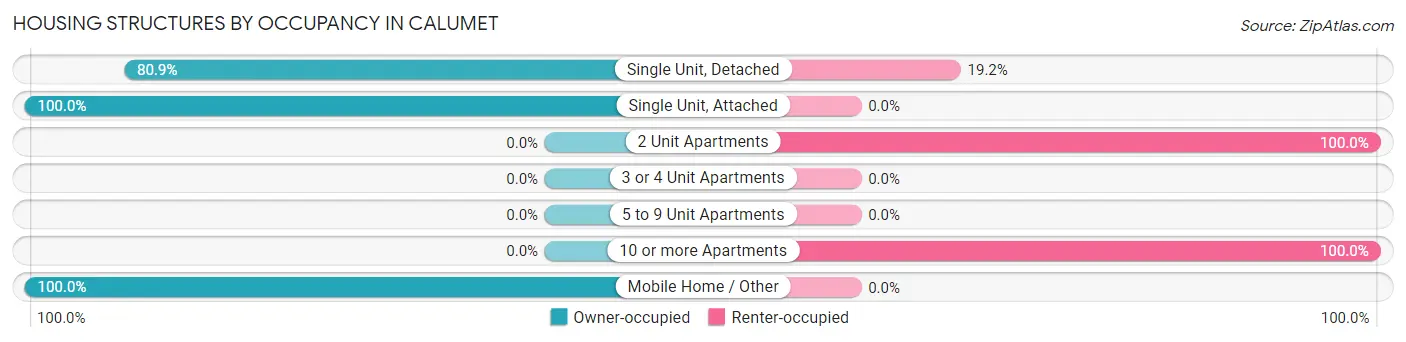
| Structure Type | Owner-occupied | Renter-occupied |
| Single Unit, Detached | 76 (80.8%) | 18 (19.2%) |
| Single Unit, Attached | 6 (100.0%) | 0 (0.0%) |
| 2 Unit Apartments | 0 (0.0%) | 4 (100.0%) |
| 3 or 4 Unit Apartments | 0 (0.0%) | 0 (0.0%) |
| 5 to 9 Unit Apartments | 0 (0.0%) | 0 (0.0%) |
| 10 or more Apartments | 0 (0.0%) | 28 (100.0%) |
| Mobile Home / Other | 4 (100.0%) | 0 (0.0%) |
| Total | 86 (63.2%) | 50 (36.8%) |
Housing Structures by Number of Rooms in Calumet
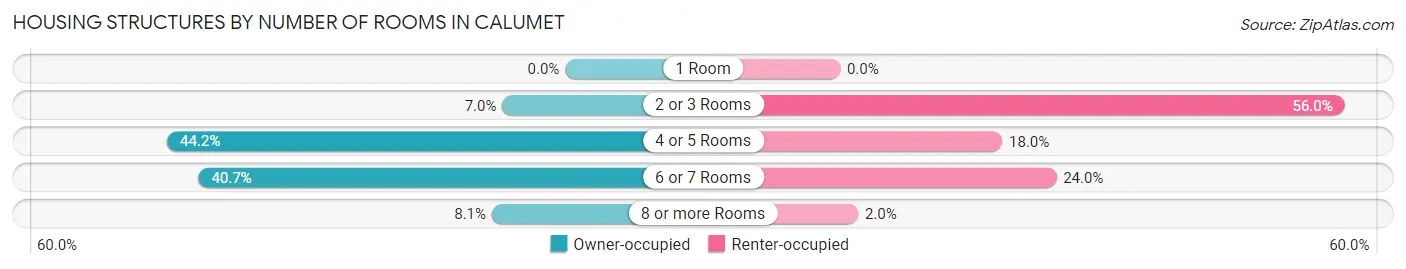
| Number of Rooms | Owner-occupied | Renter-occupied |
| 1 Room | 0 (0.0%) | 0 (0.0%) |
| 2 or 3 Rooms | 6 (7.0%) | 28 (56.0%) |
| 4 or 5 Rooms | 38 (44.2%) | 9 (18.0%) |
| 6 or 7 Rooms | 35 (40.7%) | 12 (24.0%) |
| 8 or more Rooms | 7 (8.1%) | 1 (2.0%) |
| Total | 86 (100.0%) | 50 (100.0%) |
Housing Structure by Heating Type in Calumet
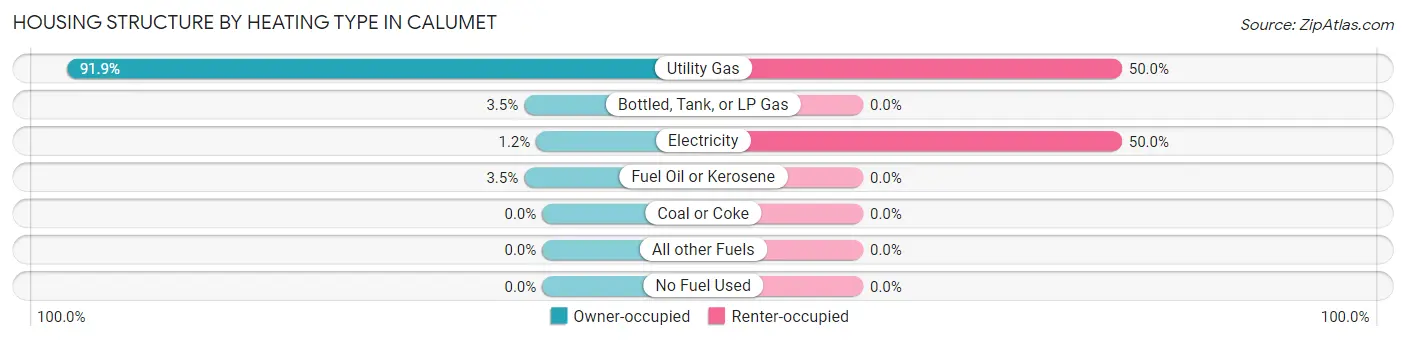
| Heating Type | Owner-occupied | Renter-occupied |
| Utility Gas | 79 (91.9%) | 25 (50.0%) |
| Bottled, Tank, or LP Gas | 3 (3.5%) | 0 (0.0%) |
| Electricity | 1 (1.2%) | 25 (50.0%) |
| Fuel Oil or Kerosene | 3 (3.5%) | 0 (0.0%) |
| Coal or Coke | 0 (0.0%) | 0 (0.0%) |
| All other Fuels | 0 (0.0%) | 0 (0.0%) |
| No Fuel Used | 0 (0.0%) | 0 (0.0%) |
| Total | 86 (100.0%) | 50 (100.0%) |
Household Vehicle Usage in Calumet
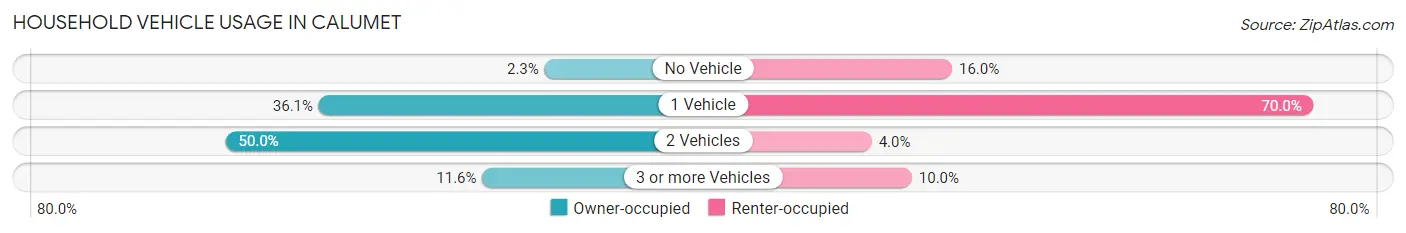
| Vehicles per Household | Owner-occupied | Renter-occupied |
| No Vehicle | 2 (2.3%) | 8 (16.0%) |
| 1 Vehicle | 31 (36.0%) | 35 (70.0%) |
| 2 Vehicles | 43 (50.0%) | 2 (4.0%) |
| 3 or more Vehicles | 10 (11.6%) | 5 (10.0%) |
| Total | 86 (100.0%) | 50 (100.0%) |
Real Estate & Mortgages in Calumet
Real Estate and Mortgage Overview in Calumet
| Characteristic | Without Mortgage | With Mortgage |
| Housing Units | 48 | 38 |
| Median Property Value | $72,000 | $87,500 |
| Median Household Income | $33,750 | $2 |
| Monthly Housing Costs | $375 | $0 |
| Real Estate Taxes | $709 | $0 |
Property Value by Mortgage Status in Calumet
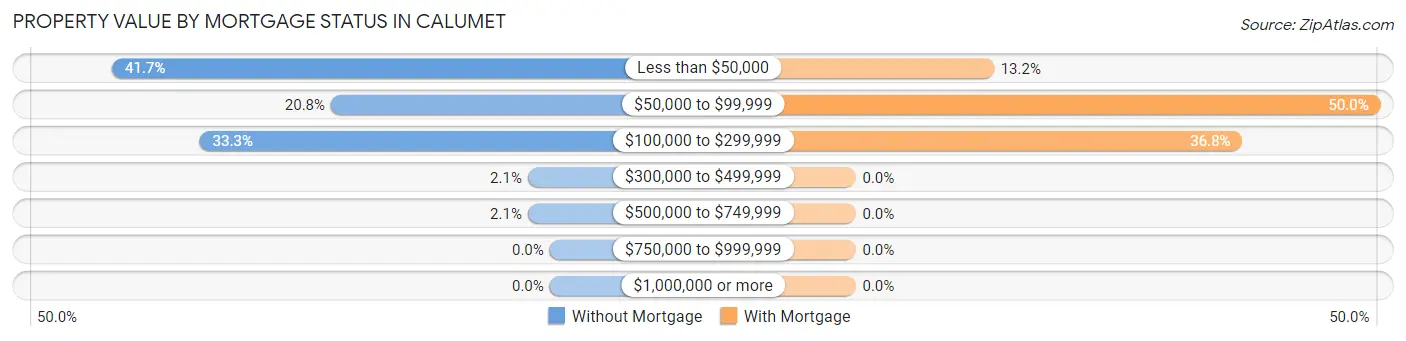
| Property Value | Without Mortgage | With Mortgage |
| Less than $50,000 | 20 (41.7%) | 5 (13.2%) |
| $50,000 to $99,999 | 10 (20.8%) | 19 (50.0%) |
| $100,000 to $299,999 | 16 (33.3%) | 14 (36.8%) |
| $300,000 to $499,999 | 1 (2.1%) | 0 (0.0%) |
| $500,000 to $749,999 | 1 (2.1%) | 0 (0.0%) |
| $750,000 to $999,999 | 0 (0.0%) | 0 (0.0%) |
| $1,000,000 or more | 0 (0.0%) | 0 (0.0%) |
| Total | 48 (100.0%) | 38 (100.0%) |
Household Income by Mortgage Status in Calumet
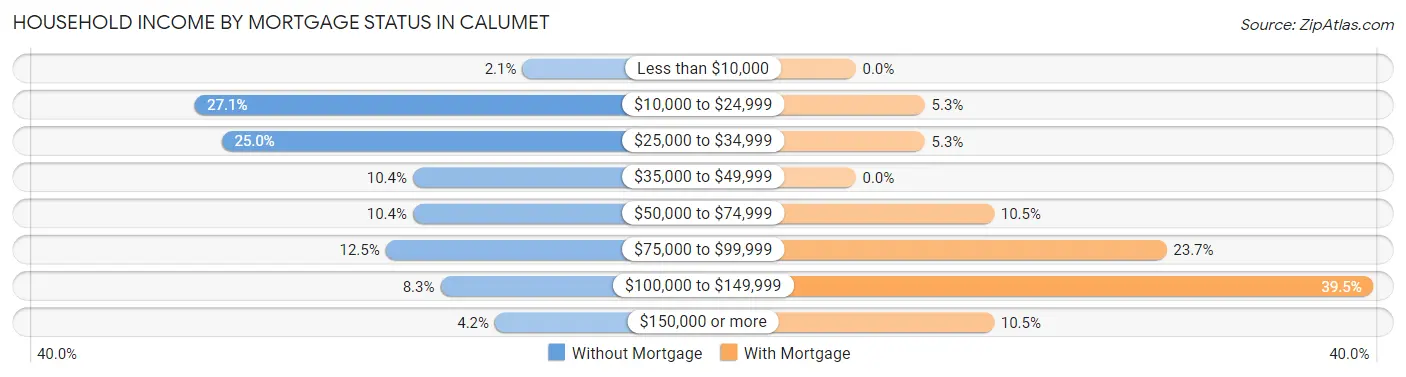
| Household Income | Without Mortgage | With Mortgage |
| Less than $10,000 | 1 (2.1%) | 0 (0.0%) |
| $10,000 to $24,999 | 13 (27.1%) | 2 (5.3%) |
| $25,000 to $34,999 | 12 (25.0%) | 2 (5.3%) |
| $35,000 to $49,999 | 5 (10.4%) | 0 (0.0%) |
| $50,000 to $74,999 | 5 (10.4%) | 4 (10.5%) |
| $75,000 to $99,999 | 6 (12.5%) | 9 (23.7%) |
| $100,000 to $149,999 | 4 (8.3%) | 15 (39.5%) |
| $150,000 or more | 2 (4.2%) | 4 (10.5%) |
| Total | 48 (100.0%) | 38 (100.0%) |
Property Value to Household Income Ratio in Calumet
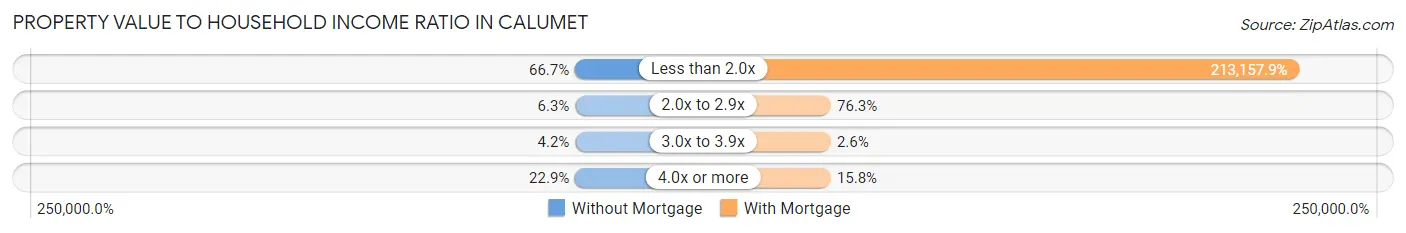
| Value-to-Income Ratio | Without Mortgage | With Mortgage |
| Less than 2.0x | 32 (66.7%) | 81,000 (213,157.9%) |
| 2.0x to 2.9x | 3 (6.2%) | 29 (76.3%) |
| 3.0x to 3.9x | 2 (4.2%) | 1 (2.6%) |
| 4.0x or more | 11 (22.9%) | 6 (15.8%) |
| Total | 48 (100.0%) | 38 (100.0%) |
Real Estate Taxes by Mortgage Status in Calumet
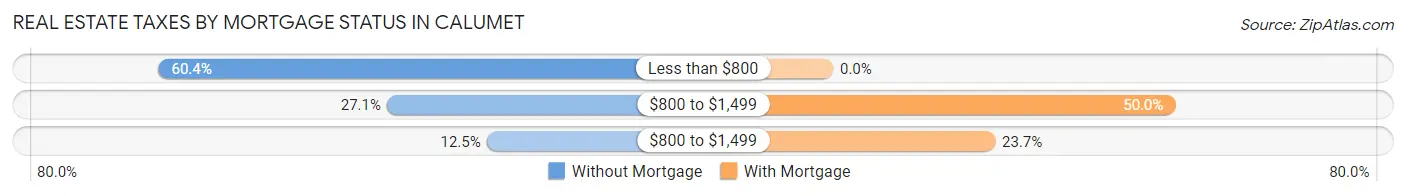
| Property Taxes | Without Mortgage | With Mortgage |
| Less than $800 | 29 (60.4%) | 0 (0.0%) |
| $800 to $1,499 | 13 (27.1%) | 19 (50.0%) |
| $800 to $1,499 | 6 (12.5%) | 9 (23.7%) |
| Total | 48 (100.0%) | 38 (100.0%) |
Health & Disability in Calumet
Health Insurance Coverage by Age in Calumet
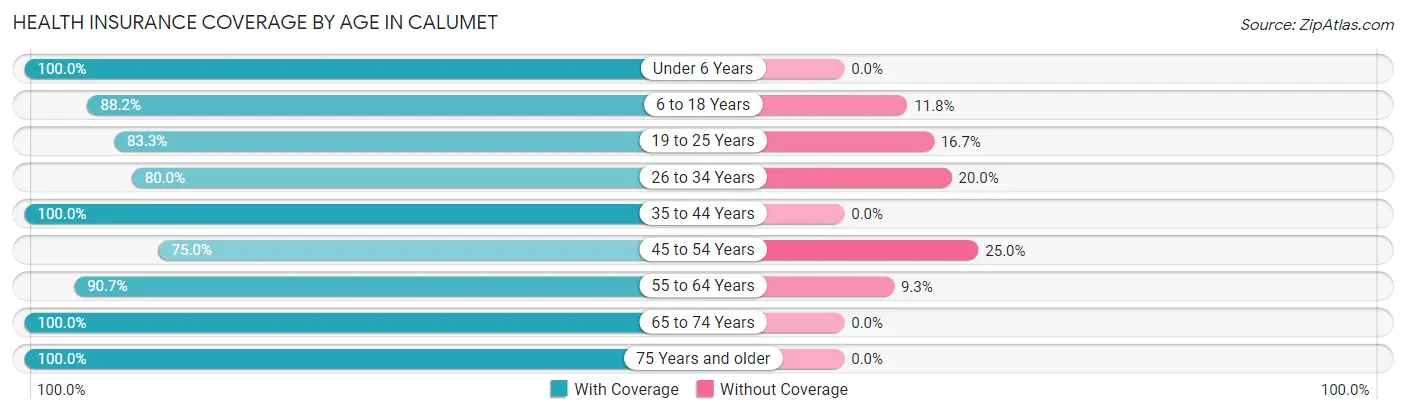
| Age Bracket | With Coverage | Without Coverage |
| Under 6 Years | 27 (100.0%) | 0 (0.0%) |
| 6 to 18 Years | 30 (88.2%) | 4 (11.8%) |
| 19 to 25 Years | 20 (83.3%) | 4 (16.7%) |
| 26 to 34 Years | 20 (80.0%) | 5 (20.0%) |
| 35 to 44 Years | 14 (100.0%) | 0 (0.0%) |
| 45 to 54 Years | 9 (75.0%) | 3 (25.0%) |
| 55 to 64 Years | 49 (90.7%) | 5 (9.3%) |
| 65 to 74 Years | 53 (100.0%) | 0 (0.0%) |
| 75 Years and older | 23 (100.0%) | 0 (0.0%) |
| Total | 245 (92.1%) | 21 (7.9%) |
Health Insurance Coverage by Citizenship Status in Calumet
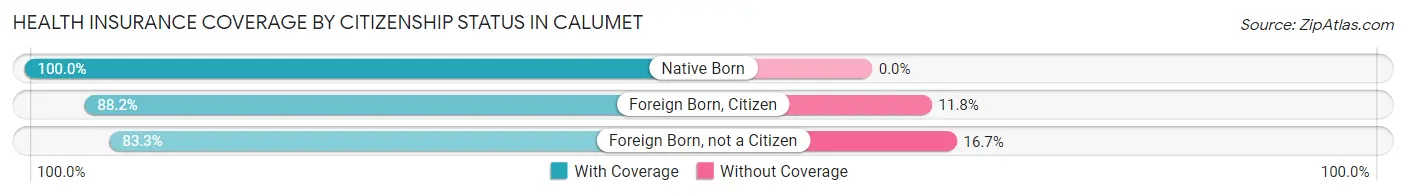
| Citizenship Status | With Coverage | Without Coverage |
| Native Born | 27 (100.0%) | 0 (0.0%) |
| Foreign Born, Citizen | 30 (88.2%) | 4 (11.8%) |
| Foreign Born, not a Citizen | 20 (83.3%) | 4 (16.7%) |
Health Insurance Coverage by Household Income in Calumet
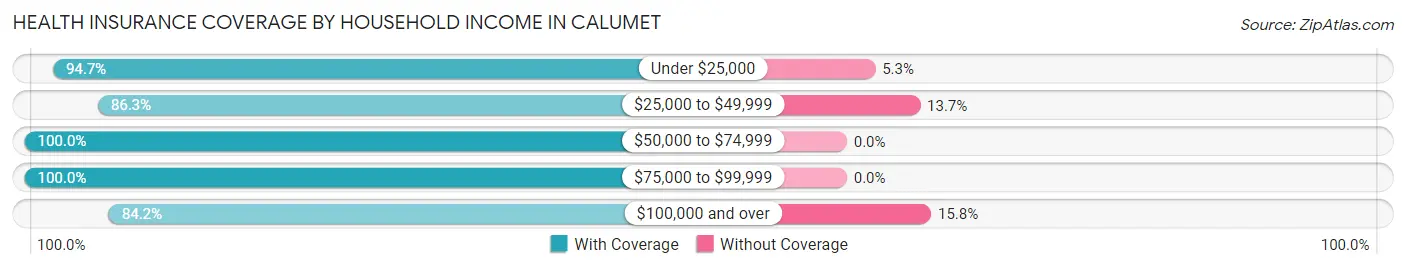
| Household Income | With Coverage | Without Coverage |
| Under $25,000 | 89 (94.7%) | 5 (5.3%) |
| $25,000 to $49,999 | 44 (86.3%) | 7 (13.7%) |
| $50,000 to $74,999 | 32 (100.0%) | 0 (0.0%) |
| $75,000 to $99,999 | 32 (100.0%) | 0 (0.0%) |
| $100,000 and over | 48 (84.2%) | 9 (15.8%) |
Public vs Private Health Insurance Coverage by Age in Calumet
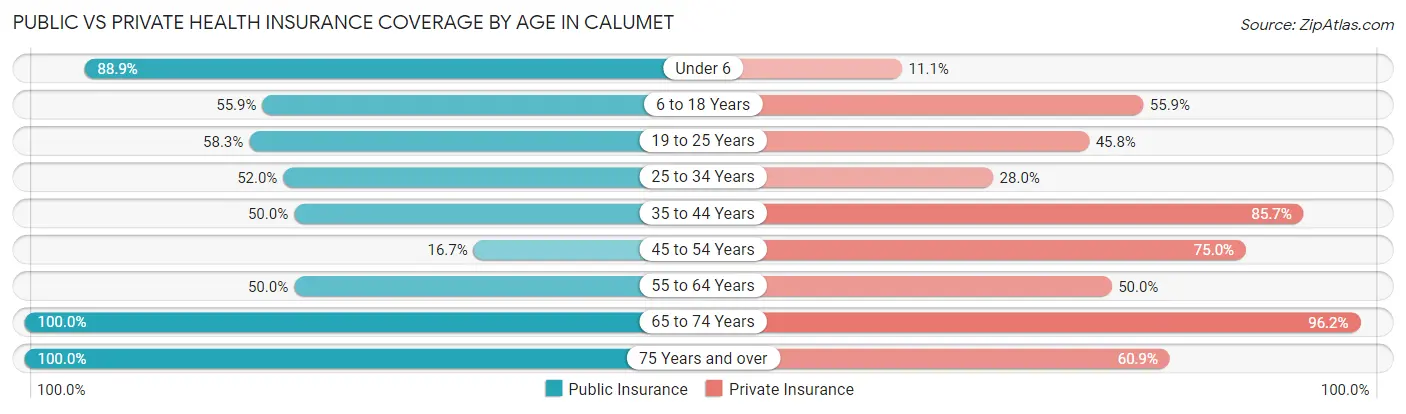
| Age Bracket | Public Insurance | Private Insurance |
| Under 6 | 24 (88.9%) | 3 (11.1%) |
| 6 to 18 Years | 19 (55.9%) | 19 (55.9%) |
| 19 to 25 Years | 14 (58.3%) | 11 (45.8%) |
| 25 to 34 Years | 13 (52.0%) | 7 (28.0%) |
| 35 to 44 Years | 7 (50.0%) | 12 (85.7%) |
| 45 to 54 Years | 2 (16.7%) | 9 (75.0%) |
| 55 to 64 Years | 27 (50.0%) | 27 (50.0%) |
| 65 to 74 Years | 53 (100.0%) | 51 (96.2%) |
| 75 Years and over | 23 (100.0%) | 14 (60.9%) |
| Total | 182 (68.4%) | 153 (57.5%) |
Disability Status by Sex by Age in Calumet
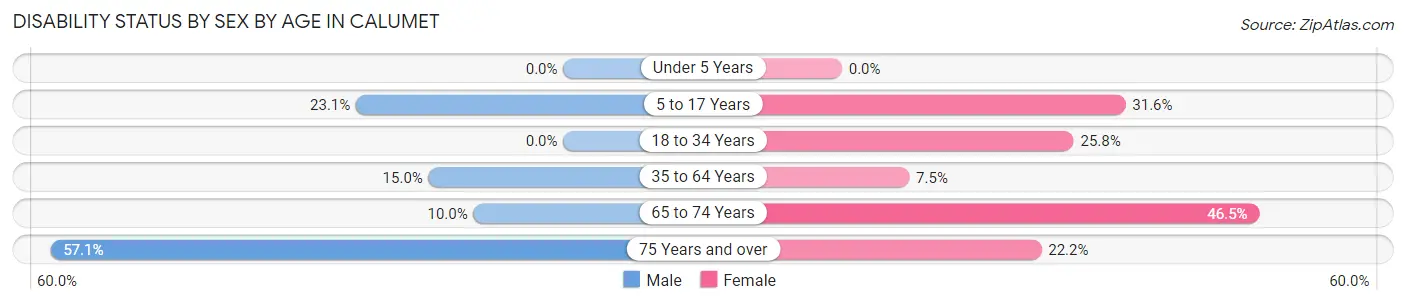
| Age Bracket | Male | Female |
| Under 5 Years | 0 (0.0%) | 0 (0.0%) |
| 5 to 17 Years | 3 (23.1%) | 6 (31.6%) |
| 18 to 34 Years | 0 (0.0%) | 8 (25.8%) |
| 35 to 64 Years | 6 (15.0%) | 3 (7.5%) |
| 65 to 74 Years | 1 (10.0%) | 20 (46.5%) |
| 75 Years and over | 8 (57.1%) | 2 (22.2%) |
Disability Class by Sex by Age in Calumet
Disability Class: Hearing Difficulty
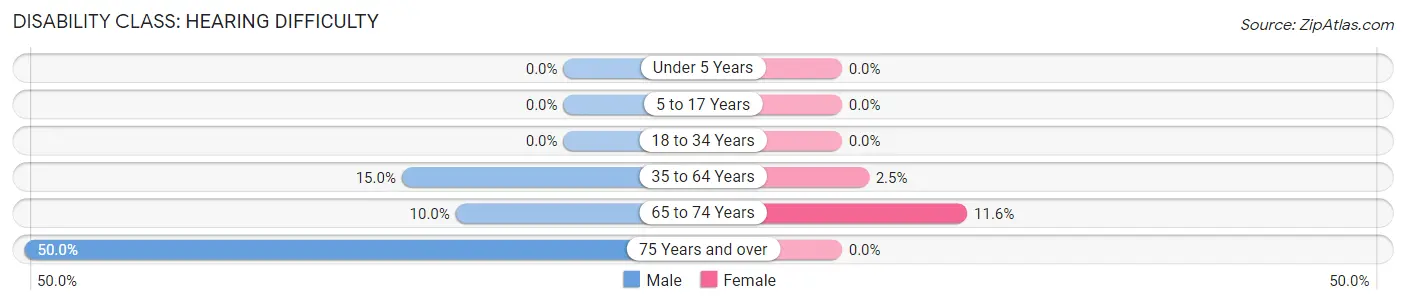
| Age Bracket | Male | Female |
| Under 5 Years | 0 (0.0%) | 0 (0.0%) |
| 5 to 17 Years | 0 (0.0%) | 0 (0.0%) |
| 18 to 34 Years | 0 (0.0%) | 0 (0.0%) |
| 35 to 64 Years | 6 (15.0%) | 1 (2.5%) |
| 65 to 74 Years | 1 (10.0%) | 5 (11.6%) |
| 75 Years and over | 7 (50.0%) | 0 (0.0%) |
Disability Class: Vision Difficulty
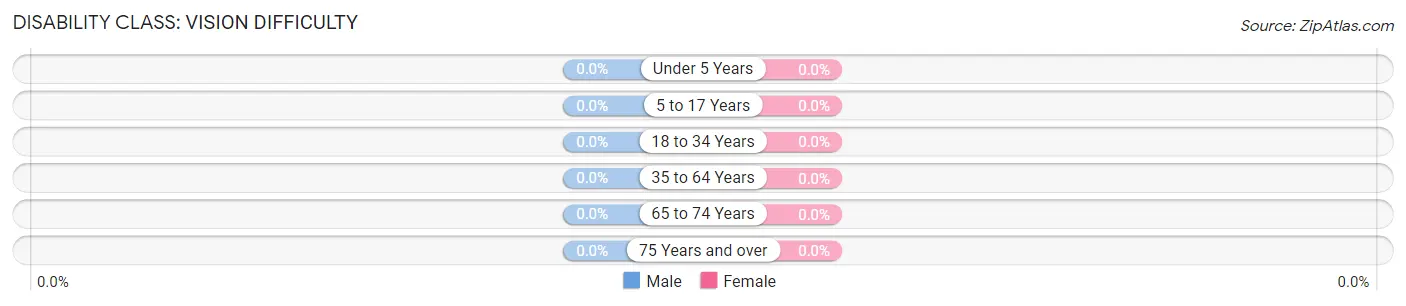
| Age Bracket | Male | Female |
| Under 5 Years | 0 (0.0%) | 0 (0.0%) |
| 5 to 17 Years | 0 (0.0%) | 0 (0.0%) |
| 18 to 34 Years | 0 (0.0%) | 0 (0.0%) |
| 35 to 64 Years | 0 (0.0%) | 0 (0.0%) |
| 65 to 74 Years | 0 (0.0%) | 0 (0.0%) |
| 75 Years and over | 0 (0.0%) | 0 (0.0%) |
Disability Class: Cognitive Difficulty
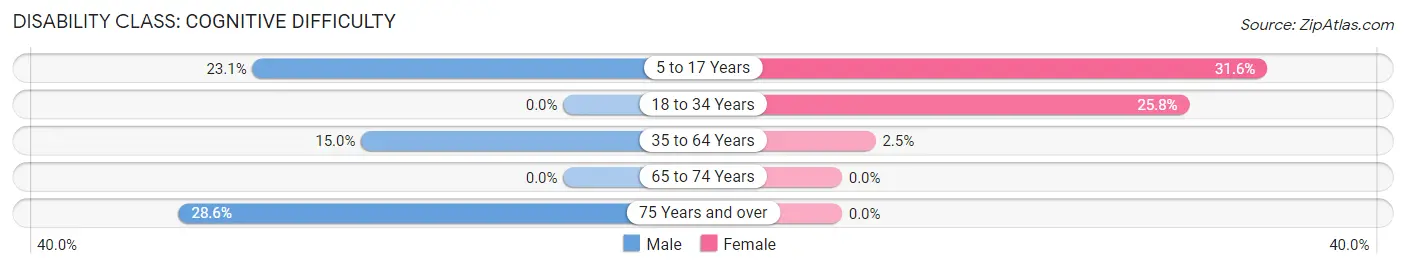
| Age Bracket | Male | Female |
| 5 to 17 Years | 3 (23.1%) | 6 (31.6%) |
| 18 to 34 Years | 0 (0.0%) | 8 (25.8%) |
| 35 to 64 Years | 6 (15.0%) | 1 (2.5%) |
| 65 to 74 Years | 0 (0.0%) | 0 (0.0%) |
| 75 Years and over | 4 (28.6%) | 0 (0.0%) |
Disability Class: Ambulatory Difficulty
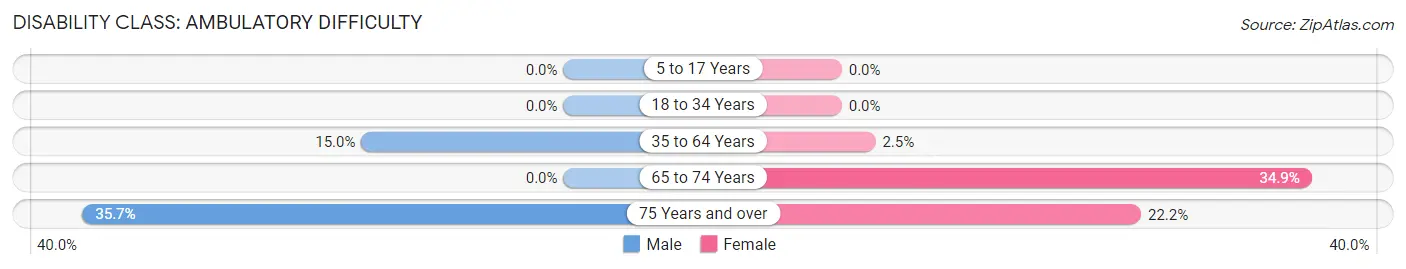
| Age Bracket | Male | Female |
| 5 to 17 Years | 0 (0.0%) | 0 (0.0%) |
| 18 to 34 Years | 0 (0.0%) | 0 (0.0%) |
| 35 to 64 Years | 6 (15.0%) | 1 (2.5%) |
| 65 to 74 Years | 0 (0.0%) | 15 (34.9%) |
| 75 Years and over | 5 (35.7%) | 2 (22.2%) |
Disability Class: Self-Care Difficulty
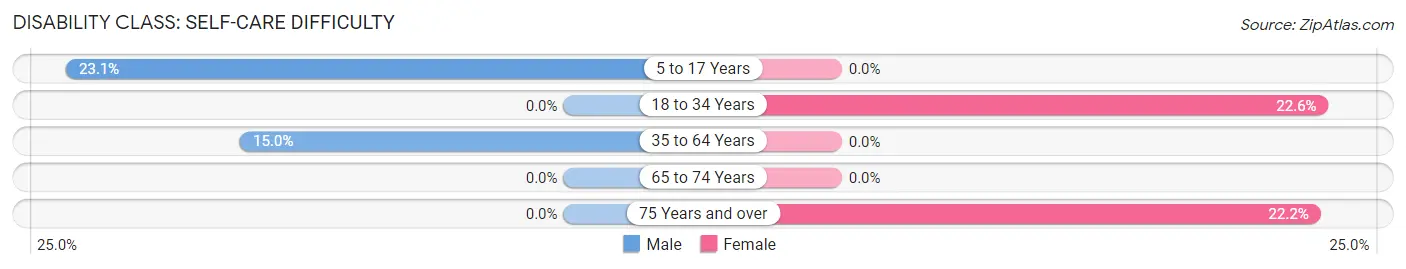
| Age Bracket | Male | Female |
| 5 to 17 Years | 3 (23.1%) | 0 (0.0%) |
| 18 to 34 Years | 0 (0.0%) | 7 (22.6%) |
| 35 to 64 Years | 6 (15.0%) | 0 (0.0%) |
| 65 to 74 Years | 0 (0.0%) | 0 (0.0%) |
| 75 Years and over | 0 (0.0%) | 2 (22.2%) |
Technology Access in Calumet
Computing Device Access in Calumet
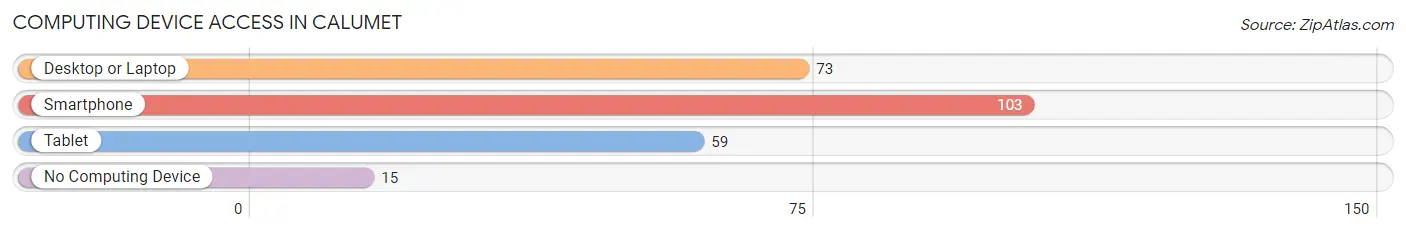
| Device Type | # Households | % Households |
| Desktop or Laptop | 73 | 53.7% |
| Smartphone | 103 | 75.7% |
| Tablet | 59 | 43.4% |
| No Computing Device | 15 | 11.0% |
| Total | 136 | 100.0% |
Internet Access in Calumet
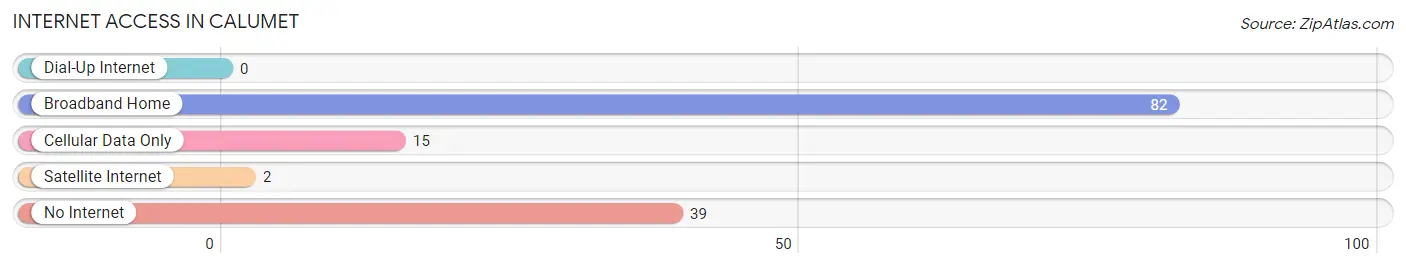
| Internet Type | # Households | % Households |
| Dial-Up Internet | 0 | 0.0% |
| Broadband Home | 82 | 60.3% |
| Cellular Data Only | 15 | 11.0% |
| Satellite Internet | 2 | 1.5% |
| No Internet | 39 | 28.7% |
| Total | 136 | 100.0% |
Calumet Summary
Calumet, Minnesota is a small town located in St. Louis County, in the northeastern part of the state. It is situated on the banks of the St. Louis River, and is part of the Iron Range region. The town was founded in 1892, and has a population of approximately 1,000 people.
History
Calumet was founded in 1892 by a group of Finnish immigrants who had come to the area to work in the iron ore mines. The town was named after the Calumet Mining Company, which was the first to open a mine in the area. The town quickly grew, and by the early 1900s, it had become a bustling mining town. The town was home to a variety of businesses, including a hotel, a general store, a bank, and a post office.
In the early 1900s, the town was also home to a large Finnish population. The Finnish immigrants brought with them their culture and language, and the town became known as “Little Finland.” The Finnish language was spoken in the town until the 1950s, when it began to decline.
Geography
Calumet is located in St. Louis County, in the northeastern part of Minnesota. It is situated on the banks of the St. Louis River, and is part of the Iron Range region. The town is surrounded by forests and lakes, and is located near the Boundary Waters Canoe Area Wilderness.
The town is located approximately 25 miles from Duluth, and is accessible by car or bus. The nearest airport is the Duluth International Airport, which is located about 30 miles away.
Economy
Calumet’s economy is largely based on tourism and the mining industry. The town is home to several tourist attractions, including the Calumet Iron Mine, the Calumet Historical Museum, and the Calumet Lighthouse. The town is also home to several small businesses, including restaurants, shops, and lodging.
The mining industry is still an important part of the town’s economy. The Calumet Iron Mine is still in operation, and is the largest iron ore mine in the state. The mine produces iron ore for use in steel production.
Demographics
As of the 2010 census, the population of Calumet was 1,000 people. The town is predominantly white, with a small percentage of African Americans, Native Americans, and Asians. The median household income is $41,000, and the median age is 44.
Calumet is a small town with a rich history and a unique culture. The town is home to a variety of businesses, and is a popular tourist destination. The town is also home to a large Finnish population, and the Finnish language is still spoken in the town. The town’s economy is largely based on tourism and the mining industry, and the town is home to several tourist attractions.
Common Questions
What is Per Capita Income in Calumet?
Per Capita income in Calumet is $24,647.
What is the Median Family Income in Calumet?
Median Family Income in Calumet is $36,875.
What is the Median Household income in Calumet?
Median Household Income in Calumet is $31,000.
What is Income or Wage Gap in Calumet?
Income or Wage Gap in Calumet is 60.2%.
Women in Calumet earn 39.8 cents for every dollar earned by a man.
What is Inequality or Gini Index in Calumet?
Inequality or Gini Index in Calumet is 0.46.
What is the Total Population of Calumet?
Total Population of Calumet is 266.
What is the Total Male Population of Calumet?
Total Male Population of Calumet is 101.
What is the Total Female Population of Calumet?
Total Female Population of Calumet is 165.
What is the Ratio of Males per 100 Females in Calumet?
There are 61.21 Males per 100 Females in Calumet.
What is the Ratio of Females per 100 Males in Calumet?
There are 163.37 Females per 100 Males in Calumet.
What is the Median Population Age in Calumet?
Median Population Age in Calumet is 54.5 Years.
What is the Average Family Size in Calumet
Average Family Size in Calumet is 2.9 People.
What is the Average Household Size in Calumet
Average Household Size in Calumet is 2.0 People.
How Large is the Labor Force in Calumet?
There are 113 People in the Labor Forcein in Calumet.
What is the Percentage of People in the Labor Force in Calumet?
53.6% of People are in the Labor Force in Calumet.
What is the Unemployment Rate in Calumet?
Unemployment Rate in Calumet is 14.2%.