Bigfork, MN Map & Demographics
Bigfork Map
Bigfork Overview
$28,997
PER CAPITA INCOME
$60,833
AVG FAMILY INCOME
$33,750
AVG HOUSEHOLD INCOME
34.2%
WAGE / INCOME GAP [ % ]
65.8¢/ $1
WAGE / INCOME GAP [ $ ]
0.54
INEQUALITY / GINI INDEX
353
TOTAL POPULATION
147
MALE POPULATION
206
FEMALE POPULATION
71.36
MALES / 100 FEMALES
140.14
FEMALES / 100 MALES
66.3
MEDIAN AGE
2.9
AVG FAMILY SIZE
1.7
AVG HOUSEHOLD SIZE
91
LABOR FORCE [ PEOPLE ]
29.4%
PERCENT IN LABOR FORCE
Bigfork Zip Codes
Bigfork Area Codes
Income in Bigfork
Income Overview in Bigfork
Per Capita Income in Bigfork is $28,997, while median incomes of families and households are $60,833 and $33,750 respectively.
| Characteristic | Number | Measure |
| Per Capita Income | 353 | $28,997 |
| Median Family Income | 54 | $60,833 |
| Mean Family Income | 54 | $73,576 |
| Median Household Income | 145 | $33,750 |
| Mean Household Income | 145 | $57,112 |
| Income Deficit | 54 | $0 |
| Wage / Income Gap (%) | 353 | 34.17% |
| Wage / Income Gap ($) | 353 | 65.83¢ per $1 |
| Gini / Inequality Index | 353 | 0.54 |
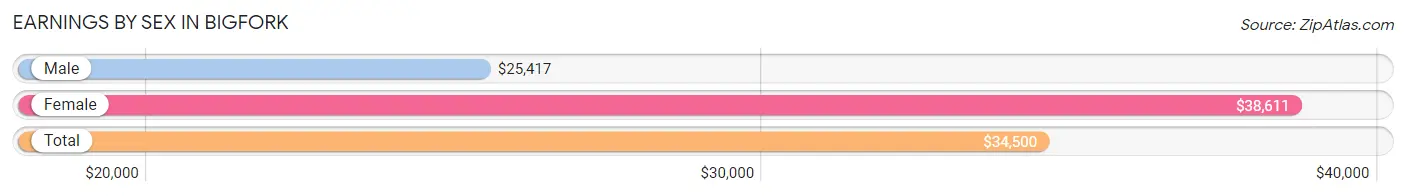
Earnings by Sex in Bigfork
Average Earnings in Bigfork are $34,500, $25,417 for men and $38,611 for women, a difference of 34.2%.
| Sex | Number | Average Earnings |
| Male | 60 (54.5%) | $25,417 |
| Female | 50 (45.5%) | $38,611 |
| Total | 110 (100.0%) | $34,500 |
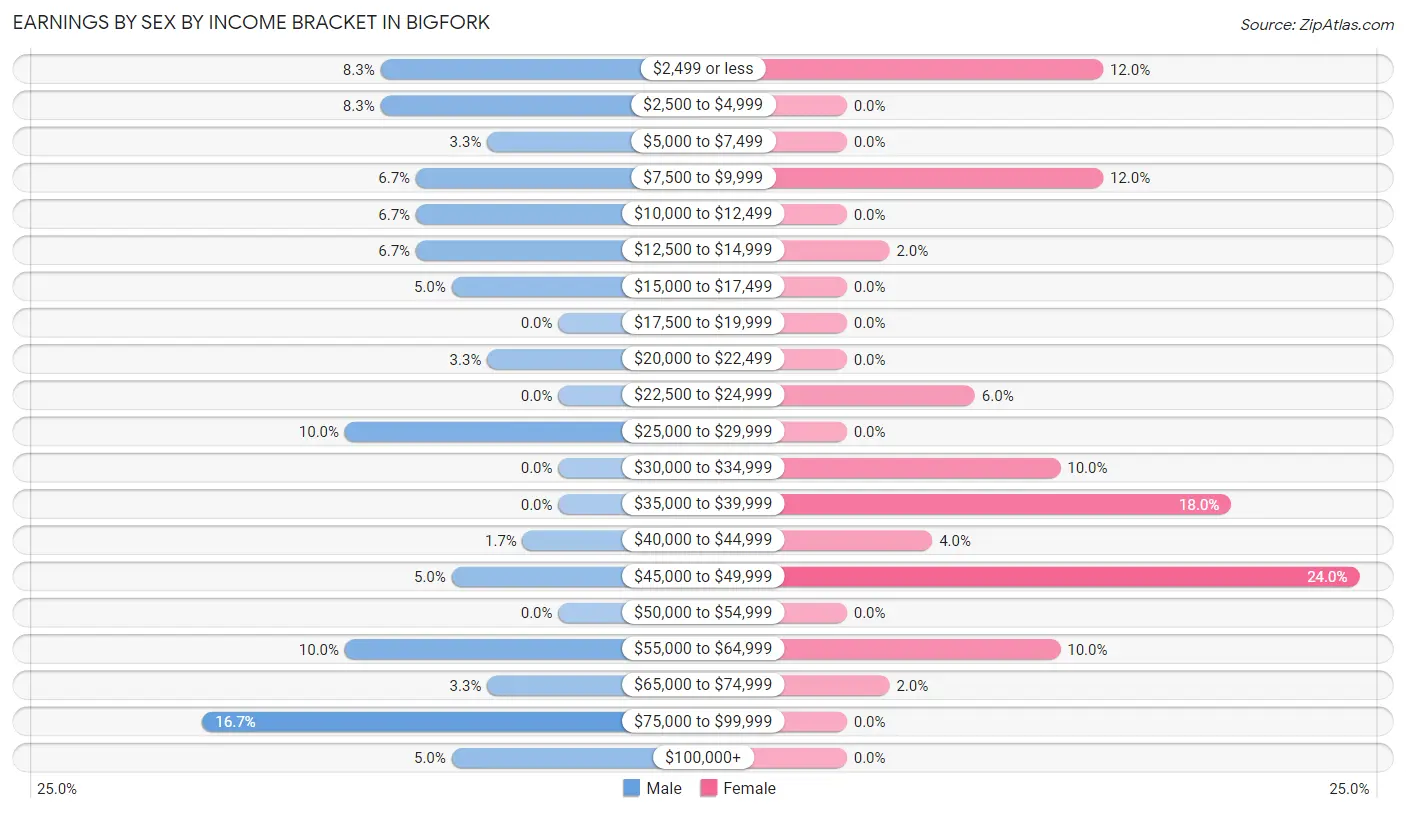
Earnings by Sex by Income Bracket in Bigfork
The most common earnings brackets in Bigfork are $75,000 to $99,999 for men (10 | 16.7%) and $45,000 to $49,999 for women (12 | 24.0%).
| Income | Male | Female |
| $2,499 or less | 5 (8.3%) | 6 (12.0%) |
| $2,500 to $4,999 | 5 (8.3%) | 0 (0.0%) |
| $5,000 to $7,499 | 2 (3.3%) | 0 (0.0%) |
| $7,500 to $9,999 | 4 (6.7%) | 6 (12.0%) |
| $10,000 to $12,499 | 4 (6.7%) | 0 (0.0%) |
| $12,500 to $14,999 | 4 (6.7%) | 1 (2.0%) |
| $15,000 to $17,499 | 3 (5.0%) | 0 (0.0%) |
| $17,500 to $19,999 | 0 (0.0%) | 0 (0.0%) |
| $20,000 to $22,499 | 2 (3.3%) | 0 (0.0%) |
| $22,500 to $24,999 | 0 (0.0%) | 3 (6.0%) |
| $25,000 to $29,999 | 6 (10.0%) | 0 (0.0%) |
| $30,000 to $34,999 | 0 (0.0%) | 5 (10.0%) |
| $35,000 to $39,999 | 0 (0.0%) | 9 (18.0%) |
| $40,000 to $44,999 | 1 (1.7%) | 2 (4.0%) |
| $45,000 to $49,999 | 3 (5.0%) | 12 (24.0%) |
| $50,000 to $54,999 | 0 (0.0%) | 0 (0.0%) |
| $55,000 to $64,999 | 6 (10.0%) | 5 (10.0%) |
| $65,000 to $74,999 | 2 (3.3%) | 1 (2.0%) |
| $75,000 to $99,999 | 10 (16.7%) | 0 (0.0%) |
| $100,000+ | 3 (5.0%) | 0 (0.0%) |
| Total | 60 (100.0%) | 50 (100.0%) |
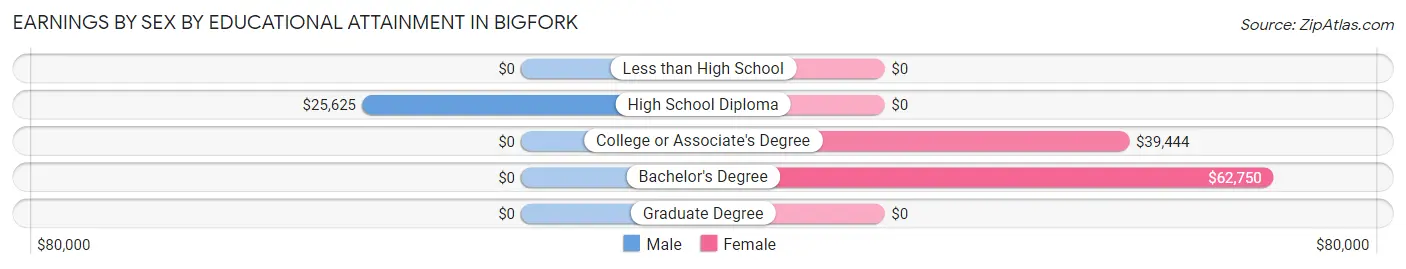
Earnings by Sex by Educational Attainment in Bigfork
Average earnings in Bigfork are $25,417 for men and $38,611 for women, a difference of 34.2%. Men with an educational attainment of high school diploma enjoy the highest average annual earnings of $25,625, while those with high school diploma education earn the least with $25,625. Women with an educational attainment of bachelor's degree earn the most with the average annual earnings of $62,750, while those with college or associate's degree education have the smallest earnings of $39,444.
| Educational Attainment | Male Income | Female Income |
| Less than High School | - | - |
| High School Diploma | $25,625 | $0 |
| College or Associate's Degree | - | - |
| Bachelor's Degree | - | - |
| Graduate Degree | - | - |
| Total | $25,417 | $38,611 |
Family Income in Bigfork
Family Income Brackets in Bigfork
According to the Bigfork family income data, there are 21 families falling into the $50,000 to $74,999 income range, which is the most common income bracket and makes up 38.9% of all families.
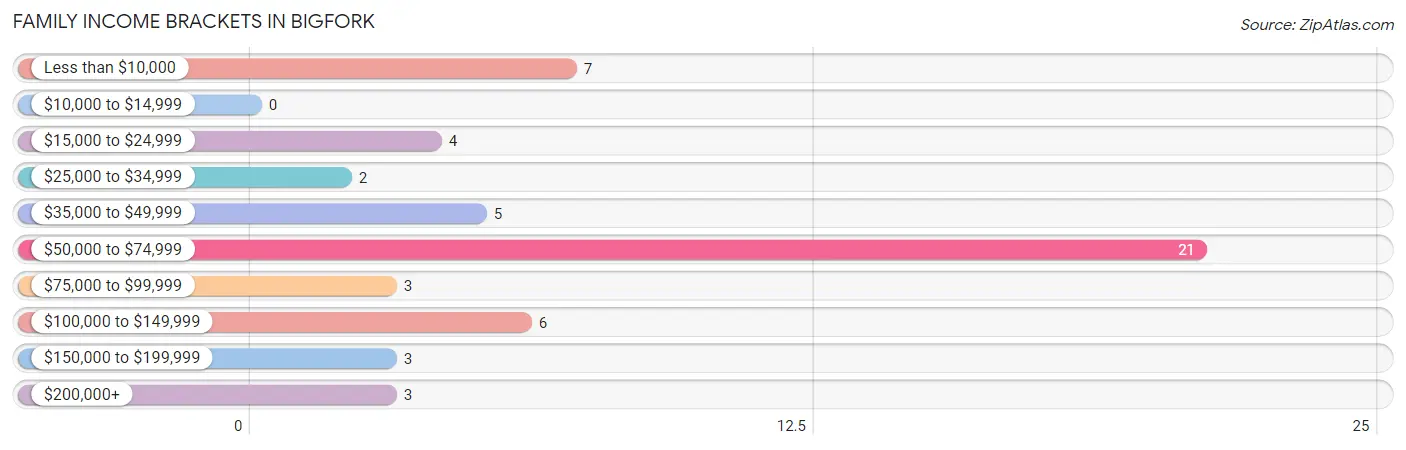
| Income Bracket | # Families | % Families |
| Less than $10,000 | 7 | 13.0% |
| $10,000 to $14,999 | 0 | 0.0% |
| $15,000 to $24,999 | 4 | 7.4% |
| $25,000 to $34,999 | 2 | 3.7% |
| $35,000 to $49,999 | 5 | 9.3% |
| $50,000 to $74,999 | 21 | 38.9% |
| $75,000 to $99,999 | 3 | 5.6% |
| $100,000 to $149,999 | 6 | 11.1% |
| $150,000 to $199,999 | 3 | 5.6% |
| $200,000+ | 3 | 5.6% |
Family Income by Famaliy Size in Bigfork
2-person families (36 | 66.7%) account for the highest median family income in Bigfork with $60,000 per family, while 2-person families (36 | 66.7%) have the highest median income of $30,000 per family member.
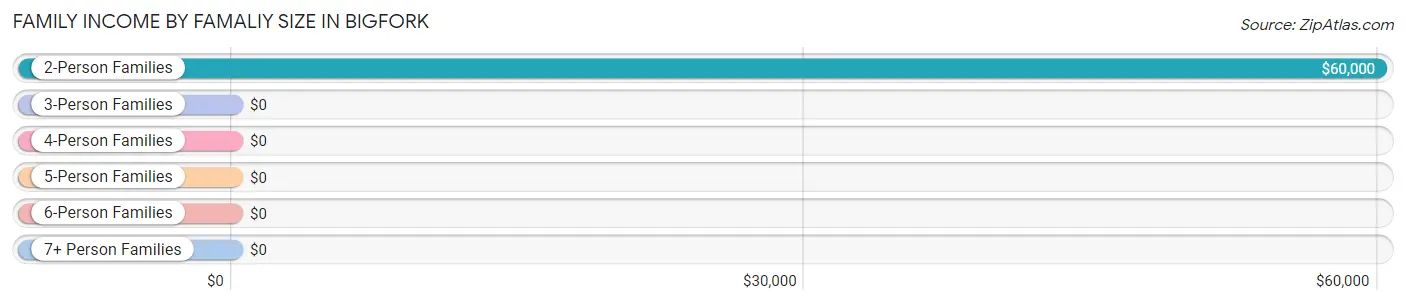
| Income Bracket | # Families | Median Income |
| 2-Person Families | 36 (66.7%) | $60,000 |
| 3-Person Families | 2 (3.7%) | $0 |
| 4-Person Families | 10 (18.5%) | $0 |
| 5-Person Families | 4 (7.4%) | $0 |
| 6-Person Families | 2 (3.7%) | $0 |
| 7+ Person Families | 0 (0.0%) | $0 |
| Total | 54 (100.0%) | $60,833 |
Family Income by Number of Earners in Bigfork
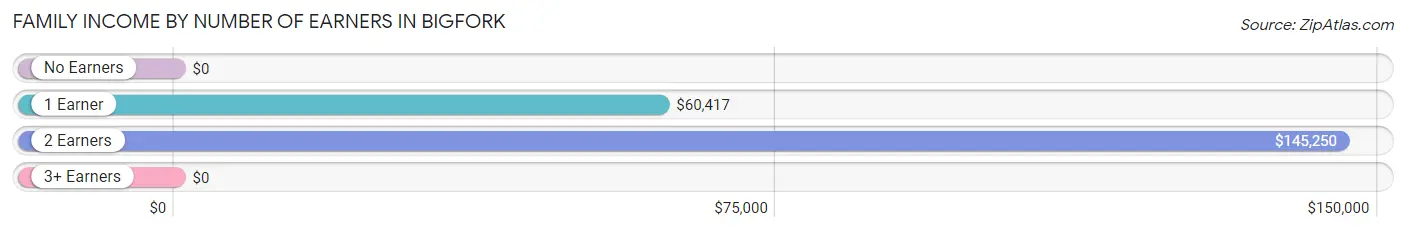
| Number of Earners | # Families | Median Income |
| No Earners | 14 (25.9%) | $0 |
| 1 Earner | 22 (40.7%) | $60,417 |
| 2 Earners | 15 (27.8%) | $145,250 |
| 3+ Earners | 3 (5.6%) | $0 |
| Total | 54 (100.0%) | $60,833 |
Household Income in Bigfork
Household Income Brackets in Bigfork
With 27 households falling in the category, the $15,000 to $24,999 income range is the most frequent in Bigfork, accounting for 18.6% of all households.
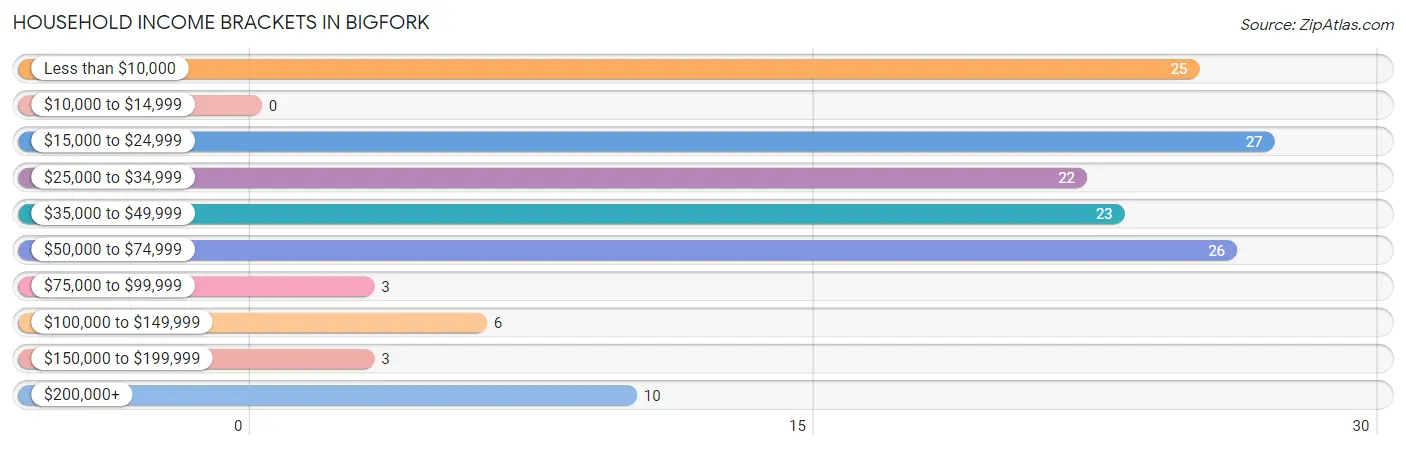
| Income Bracket | # Households | % Households |
| Less than $10,000 | 25 | 17.2% |
| $10,000 to $14,999 | 0 | 0.0% |
| $15,000 to $24,999 | 27 | 18.6% |
| $25,000 to $34,999 | 22 | 15.2% |
| $35,000 to $49,999 | 23 | 15.9% |
| $50,000 to $74,999 | 26 | 17.9% |
| $75,000 to $99,999 | 3 | 2.1% |
| $100,000 to $149,999 | 6 | 4.1% |
| $150,000 to $199,999 | 3 | 2.1% |
| $200,000+ | 10 | 6.9% |
Household Income by Householder Age in Bigfork
The median household income in Bigfork is $33,750, with the highest median household income of $39,722 found in the 45 to 64 years age bracket for the primary householder. A total of 42 households (29.0%) fall into this category.
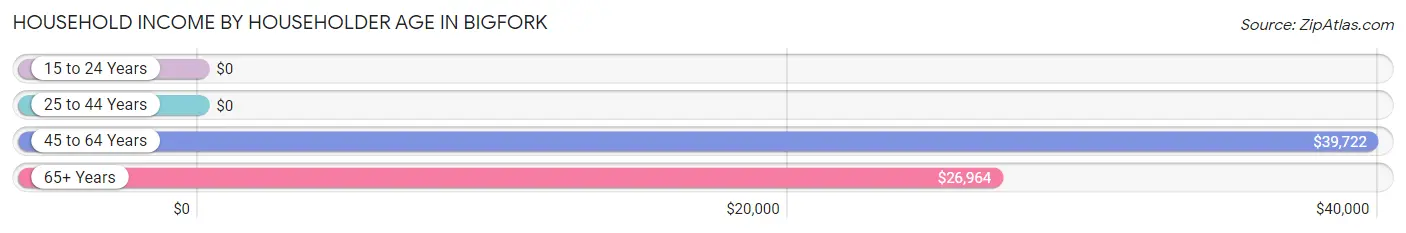
| Income Bracket | # Households | Median Income |
| 15 to 24 Years | 0 (0.0%) | $0 |
| 25 to 44 Years | 20 (13.8%) | $0 |
| 45 to 64 Years | 42 (29.0%) | $39,722 |
| 65+ Years | 83 (57.2%) | $26,964 |
| Total | 145 (100.0%) | $33,750 |
Poverty in Bigfork
Income Below Poverty by Sex and Age in Bigfork
With 22.5% poverty level for males and 22.9% for females among the residents of Bigfork, 6 to 11 year old males and 12 to 14 year old females are the most vulnerable to poverty, with 12 males (100.0%) and 5 females (100.0%) in their respective age groups living below the poverty level.
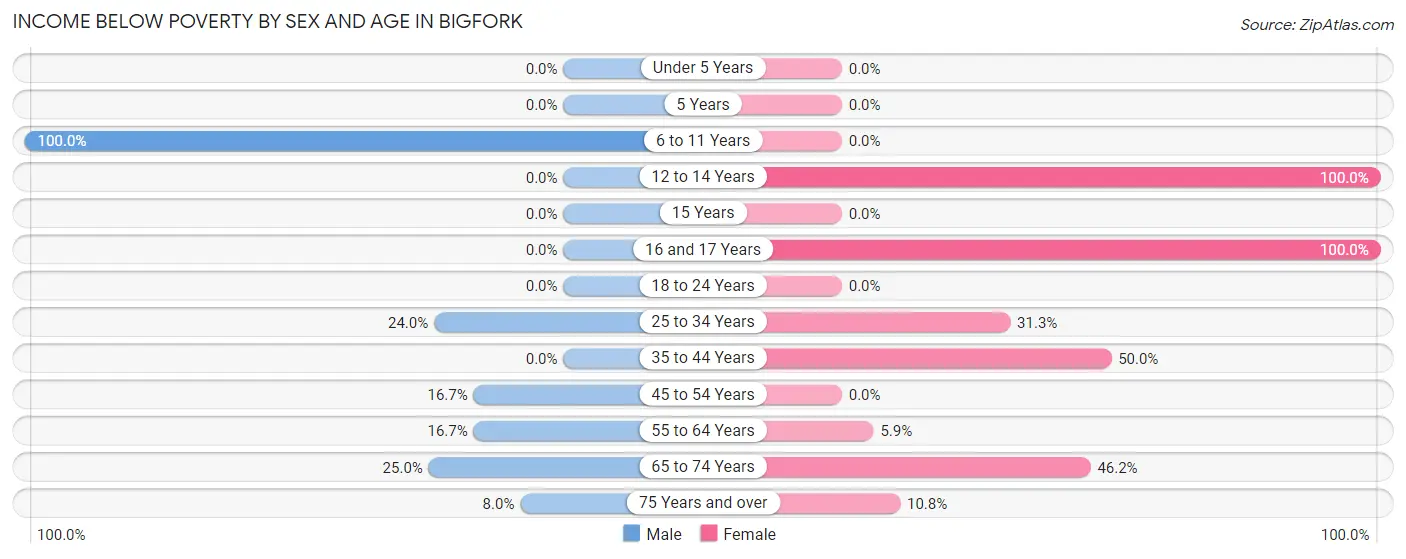
| Age Bracket | Male | Female |
| Under 5 Years | 0 (0.0%) | 0 (0.0%) |
| 5 Years | 0 (0.0%) | 0 (0.0%) |
| 6 to 11 Years | 12 (100.0%) | 0 (0.0%) |
| 12 to 14 Years | 0 (0.0%) | 5 (100.0%) |
| 15 Years | 0 (0.0%) | 0 (0.0%) |
| 16 and 17 Years | 0 (0.0%) | 2 (100.0%) |
| 18 to 24 Years | 0 (0.0%) | 0 (0.0%) |
| 25 to 34 Years | 6 (24.0%) | 5 (31.2%) |
| 35 to 44 Years | 0 (0.0%) | 2 (50.0%) |
| 45 to 54 Years | 2 (16.7%) | 0 (0.0%) |
| 55 to 64 Years | 3 (16.7%) | 2 (5.9%) |
| 65 to 74 Years | 4 (25.0%) | 12 (46.2%) |
| 75 Years and over | 2 (8.0%) | 4 (10.8%) |
| Total | 29 (22.5%) | 32 (22.9%) |
Income Above Poverty by Sex and Age in Bigfork
According to the poverty statistics in Bigfork, males aged under 5 years and females aged under 5 years are the age groups that are most secure financially, with 100.0% of males and 100.0% of females in these age groups living above the poverty line.
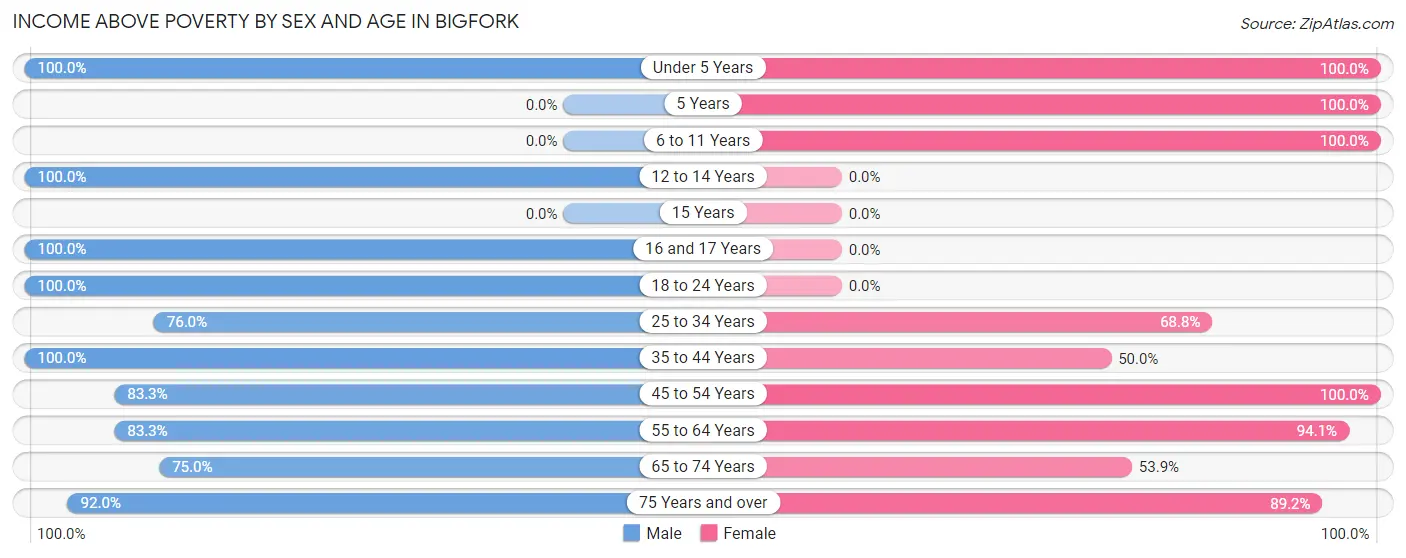
| Age Bracket | Male | Female |
| Under 5 Years | 7 (100.0%) | 7 (100.0%) |
| 5 Years | 0 (0.0%) | 2 (100.0%) |
| 6 to 11 Years | 0 (0.0%) | 3 (100.0%) |
| 12 to 14 Years | 7 (100.0%) | 0 (0.0%) |
| 15 Years | 0 (0.0%) | 0 (0.0%) |
| 16 and 17 Years | 1 (100.0%) | 0 (0.0%) |
| 18 to 24 Years | 2 (100.0%) | 0 (0.0%) |
| 25 to 34 Years | 19 (76.0%) | 11 (68.8%) |
| 35 to 44 Years | 4 (100.0%) | 2 (50.0%) |
| 45 to 54 Years | 10 (83.3%) | 4 (100.0%) |
| 55 to 64 Years | 15 (83.3%) | 32 (94.1%) |
| 65 to 74 Years | 12 (75.0%) | 14 (53.8%) |
| 75 Years and over | 23 (92.0%) | 33 (89.2%) |
| Total | 100 (77.5%) | 108 (77.1%) |
Income Below Poverty Among Married-Couple Families in Bigfork
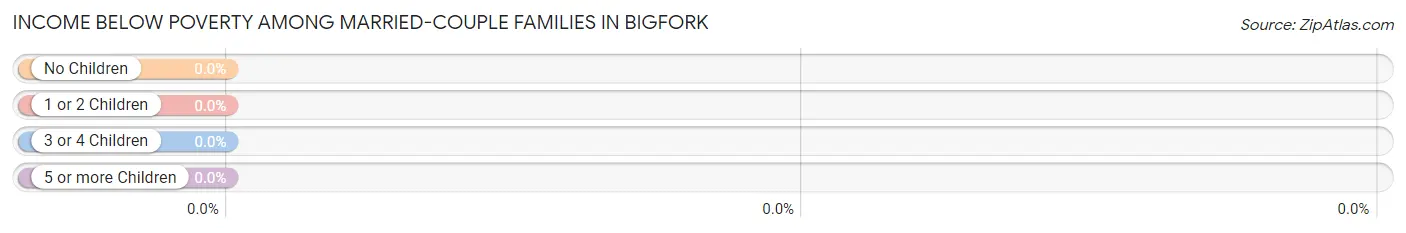
| Children | Above Poverty | Below Poverty |
| No Children | 32 (100.0%) | 0 (0.0%) |
| 1 or 2 Children | 7 (100.0%) | 0 (0.0%) |
| 3 or 4 Children | 6 (100.0%) | 0 (0.0%) |
| 5 or more Children | 0 (0.0%) | 0 (0.0%) |
| Total | 45 (100.0%) | 0 (0.0%) |
Income Below Poverty Among Single-Parent Households in Bigfork
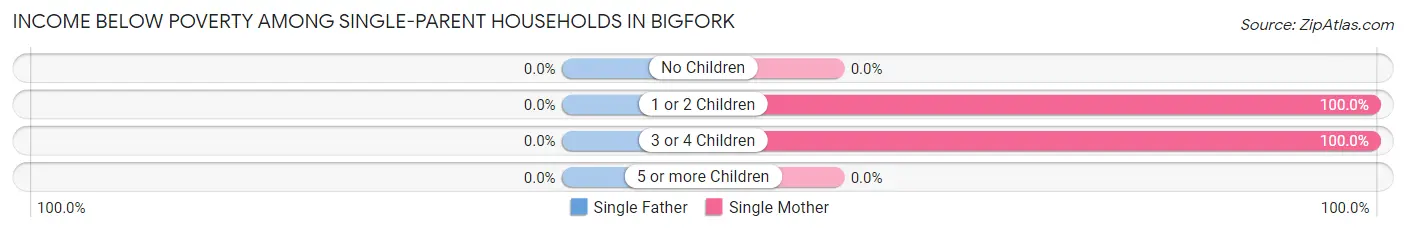
| Children | Single Father | Single Mother |
| No Children | 0 (0.0%) | 0 (0.0%) |
| 1 or 2 Children | 0 (0.0%) | 2 (100.0%) |
| 3 or 4 Children | 0 (0.0%) | 5 (100.0%) |
| 5 or more Children | 0 (0.0%) | 0 (0.0%) |
| Total | 0 (0.0%) | 7 (100.0%) |
Income Below Poverty Among Married-Couple vs Single-Parent Households in Bigfork
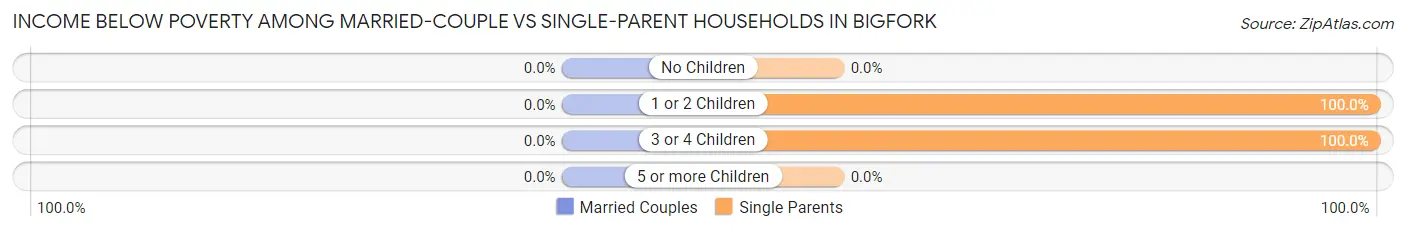
| Children | Married-Couple Families | Single-Parent Households |
| No Children | 0 (0.0%) | 0 (0.0%) |
| 1 or 2 Children | 0 (0.0%) | 2 (100.0%) |
| 3 or 4 Children | 0 (0.0%) | 5 (100.0%) |
| 5 or more Children | 0 (0.0%) | 0 (0.0%) |
| Total | 0 (0.0%) | 7 (77.8%) |
Race in Bigfork
The most populous races in Bigfork are White / Caucasian (330 | 93.5%), Native / Alaskan (14 | 4.0%), and Hispanic or Latino (10 | 2.8%).
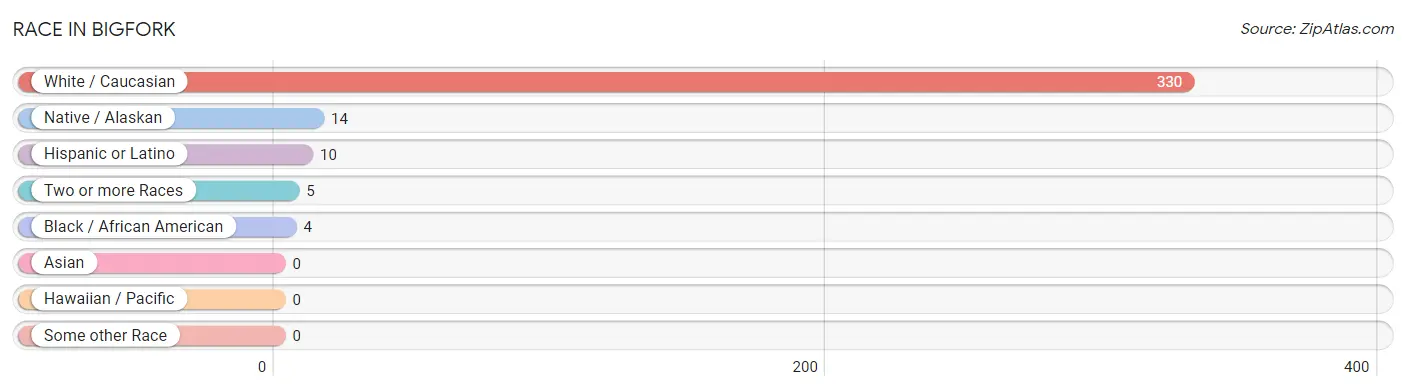
| Race | # Population | % Population |
| Asian | 0 | 0.0% |
| Black / African American | 4 | 1.1% |
| Hawaiian / Pacific | 0 | 0.0% |
| Hispanic or Latino | 10 | 2.8% |
| Native / Alaskan | 14 | 4.0% |
| White / Caucasian | 330 | 93.5% |
| Two or more Races | 5 | 1.4% |
| Some other Race | 0 | 0.0% |
| Total | 353 | 100.0% |
Ancestry in Bigfork
The most populous ancestries reported in Bigfork are German (83 | 23.5%), English (60 | 17.0%), Norwegian (40 | 11.3%), Swedish (40 | 11.3%), and French Canadian (24 | 6.8%), together accounting for 70.0% of all Bigfork residents.
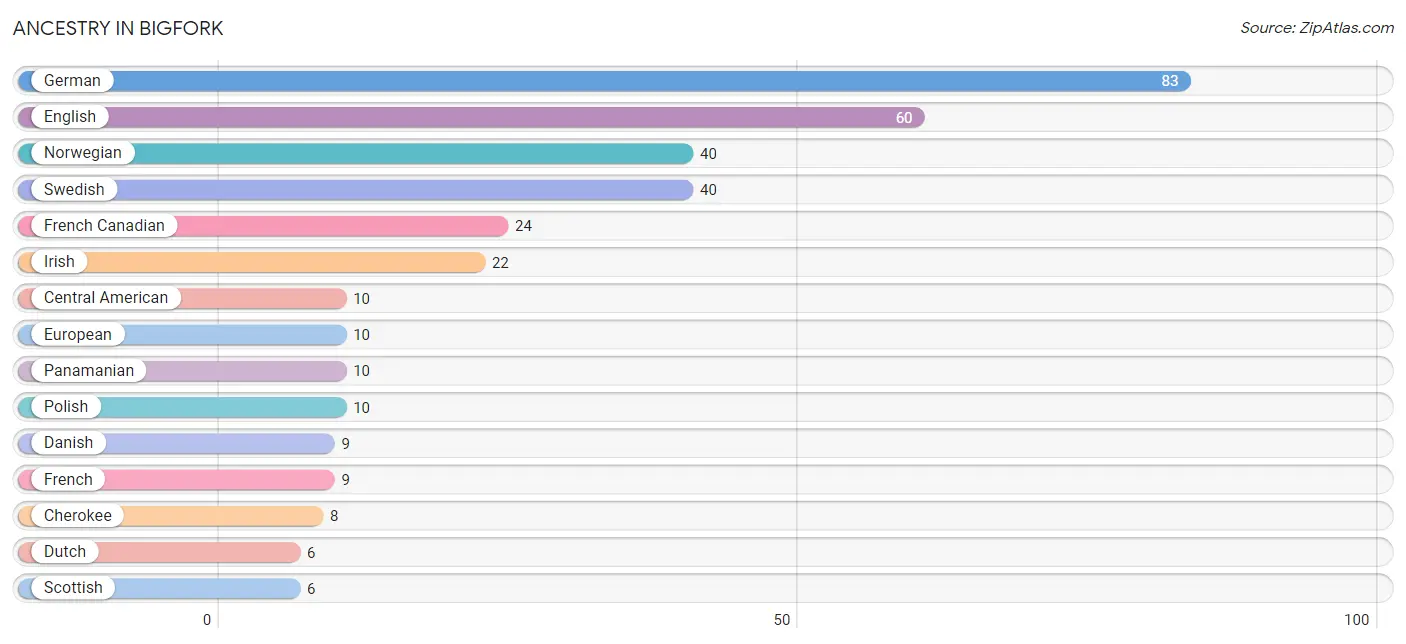
| Ancestry | # Population | % Population |
| American | 3 | 0.9% |
| Central American | 10 | 2.8% |
| Cherokee | 8 | 2.3% |
| Danish | 9 | 2.5% |
| Dutch | 6 | 1.7% |
| English | 60 | 17.0% |
| European | 10 | 2.8% |
| Finnish | 3 | 0.9% |
| French | 9 | 2.5% |
| French Canadian | 24 | 6.8% |
| German | 83 | 23.5% |
| Hungarian | 1 | 0.3% |
| Irish | 22 | 6.2% |
| Norwegian | 40 | 11.3% |
| Panamanian | 10 | 2.8% |
| Polish | 10 | 2.8% |
| Russian | 3 | 0.9% |
| Scottish | 6 | 1.7% |
| Swedish | 40 | 11.3% |
| Ukrainian | 2 | 0.6% | View All 20 Rows |
Immigrants in Bigfork
The most numerous immigrant groups reported in Bigfork came from , and Canada (2 | 0.6%), together accounting for 0.6% of all Bigfork residents.

| Immigration Origin | # Population | % Population |
| Canada | 2 | 0.6% | View All 1 Rows |
Sex and Age in Bigfork
Sex and Age in Bigfork
The most populous age groups in Bigfork are 85 Years and over (19 | 12.9%) for men and 85 Years and over (54 | 26.2%) for women.
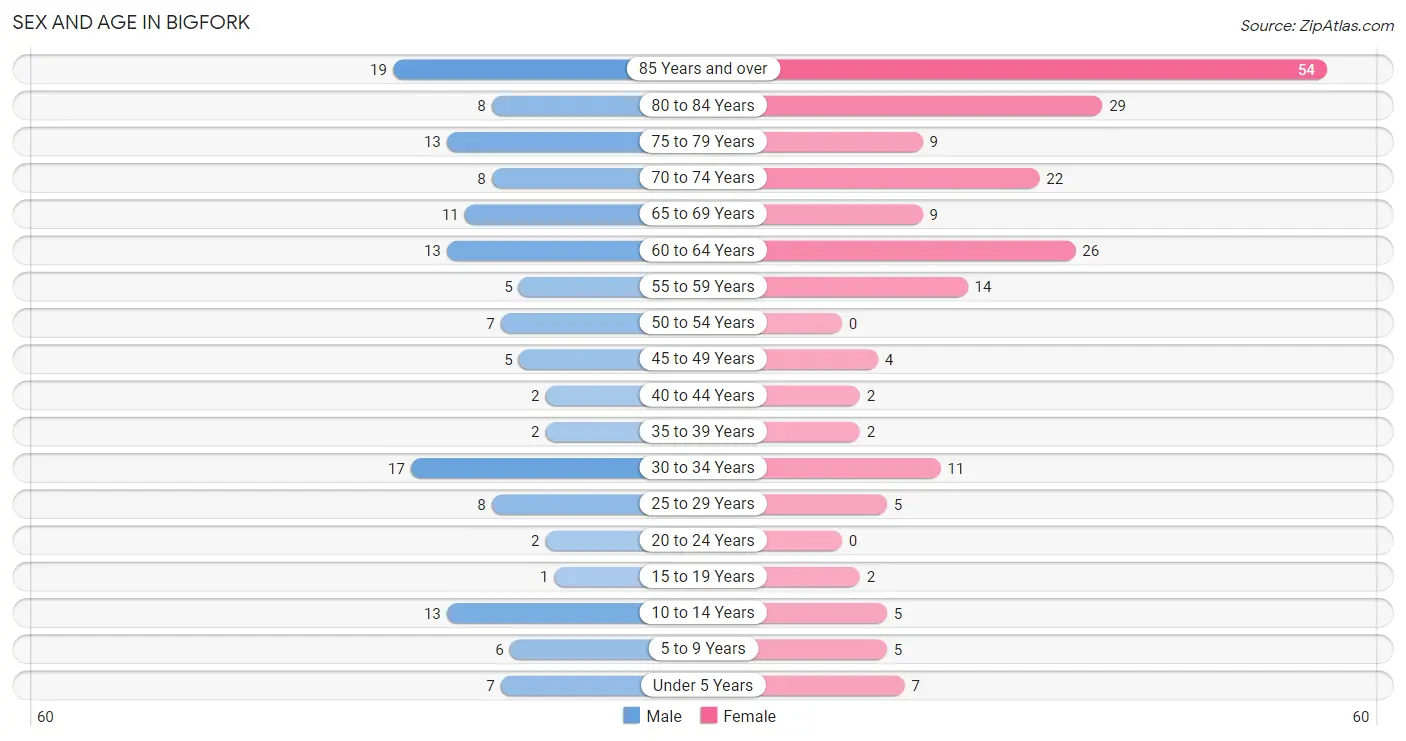
| Age Bracket | Male | Female |
| Under 5 Years | 7 (4.8%) | 7 (3.4%) |
| 5 to 9 Years | 6 (4.1%) | 5 (2.4%) |
| 10 to 14 Years | 13 (8.8%) | 5 (2.4%) |
| 15 to 19 Years | 1 (0.7%) | 2 (1.0%) |
| 20 to 24 Years | 2 (1.4%) | 0 (0.0%) |
| 25 to 29 Years | 8 (5.4%) | 5 (2.4%) |
| 30 to 34 Years | 17 (11.6%) | 11 (5.3%) |
| 35 to 39 Years | 2 (1.4%) | 2 (1.0%) |
| 40 to 44 Years | 2 (1.4%) | 2 (1.0%) |
| 45 to 49 Years | 5 (3.4%) | 4 (1.9%) |
| 50 to 54 Years | 7 (4.8%) | 0 (0.0%) |
| 55 to 59 Years | 5 (3.4%) | 14 (6.8%) |
| 60 to 64 Years | 13 (8.8%) | 26 (12.6%) |
| 65 to 69 Years | 11 (7.5%) | 9 (4.4%) |
| 70 to 74 Years | 8 (5.4%) | 22 (10.7%) |
| 75 to 79 Years | 13 (8.8%) | 9 (4.4%) |
| 80 to 84 Years | 8 (5.4%) | 29 (14.1%) |
| 85 Years and over | 19 (12.9%) | 54 (26.2%) |
| Total | 147 (100.0%) | 206 (100.0%) |
Families and Households in Bigfork
Median Family Size in Bigfork
The median family size in Bigfork is 2.85 persons per family, with single female/mother families (7 | 13.0%) accounting for the largest median family size of 3.71 persons per family. On the other hand, single male/father families (2 | 3.7%) represent the smallest median family size with 2.00 persons per family.
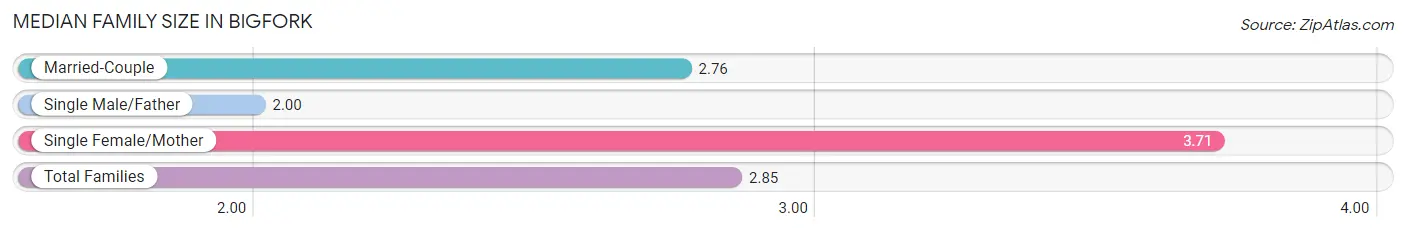
| Family Type | # Families | Family Size |
| Married-Couple | 45 (83.3%) | 2.76 |
| Single Male/Father | 2 (3.7%) | 2.00 |
| Single Female/Mother | 7 (13.0%) | 3.71 |
| Total Families | 54 (100.0%) | 2.85 |
Median Household Size in Bigfork
The median household size in Bigfork is 1.72 persons per household, with single female/mother households (7 | 4.8%) accounting for the largest median household size of 4.14 persons per household. non-family households (91 | 62.8%) represent the smallest median household size with 1.02 persons per household.
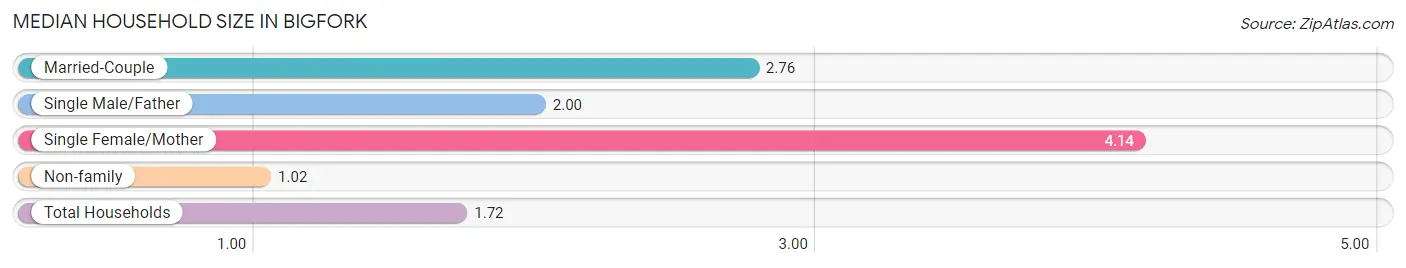
| Household Type | # Households | Household Size |
| Married-Couple | 45 (31.0%) | 2.76 |
| Single Male/Father | 2 (1.4%) | 2.00 |
| Single Female/Mother | 7 (4.8%) | 4.14 |
| Non-family | 91 (62.8%) | 1.02 |
| Total Households | 145 (100.0%) | 1.72 |
Household Size by Marriage Status in Bigfork
Out of a total of 145 households in Bigfork, 54 (37.2%) are family households, while 91 (62.8%) are nonfamily households. The most numerous type of family households are 2-person households, comprising 34, and the most common type of nonfamily households are 1-person households, comprising 90.
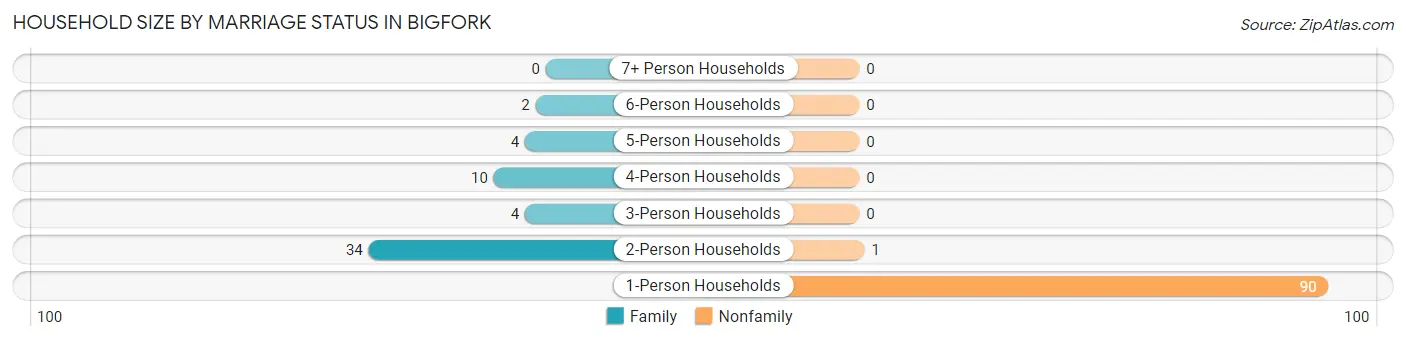
| Household Size | Family Households | Nonfamily Households |
| 1-Person Households | - | 90 (62.1%) |
| 2-Person Households | 34 (23.4%) | 1 (0.7%) |
| 3-Person Households | 4 (2.8%) | 0 (0.0%) |
| 4-Person Households | 10 (6.9%) | 0 (0.0%) |
| 5-Person Households | 4 (2.8%) | 0 (0.0%) |
| 6-Person Households | 2 (1.4%) | 0 (0.0%) |
| 7+ Person Households | 0 (0.0%) | 0 (0.0%) |
| Total | 54 (37.2%) | 91 (62.8%) |
Female Fertility in Bigfork
Fertility by Age in Bigfork
Average fertility rate in Bigfork is 38.0 births per 1,000 women. Women in the age bracket of 20 to 34 years have the highest fertility rate with 63.0 births per 1,000 women. Women in the age bracket of 20 to 34 years acount for 100.0% of all women with births.
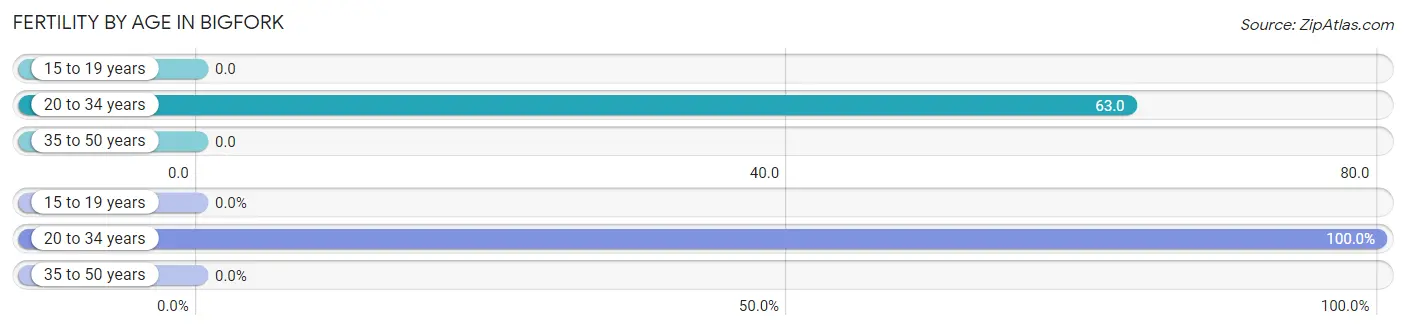
| Age Bracket | Women with Births | Births / 1,000 Women |
| 15 to 19 years | 0 (0.0%) | 0.0 |
| 20 to 34 years | 1 (100.0%) | 63.0 |
| 35 to 50 years | 0 (0.0%) | 0.0 |
| Total | 1 (100.0%) | 38.0 |
Fertility by Age by Marriage Status in Bigfork
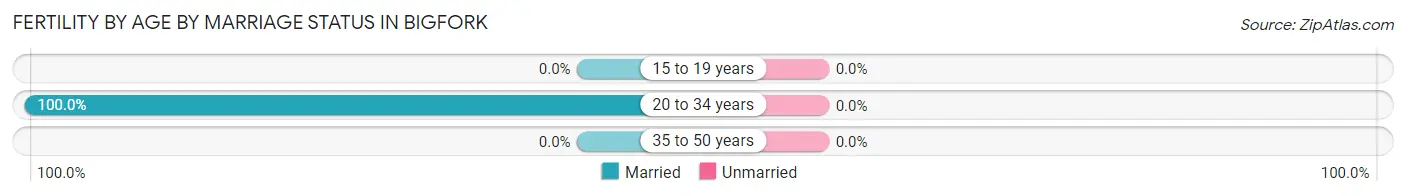
| Age Bracket | Married | Unmarried |
| 15 to 19 years | 0 (0.0%) | 0 (0.0%) |
| 20 to 34 years | 1 (100.0%) | 0 (0.0%) |
| 35 to 50 years | 0 (0.0%) | 0 (0.0%) |
| Total | 1 (100.0%) | 0 (0.0%) |
Fertility by Education in Bigfork
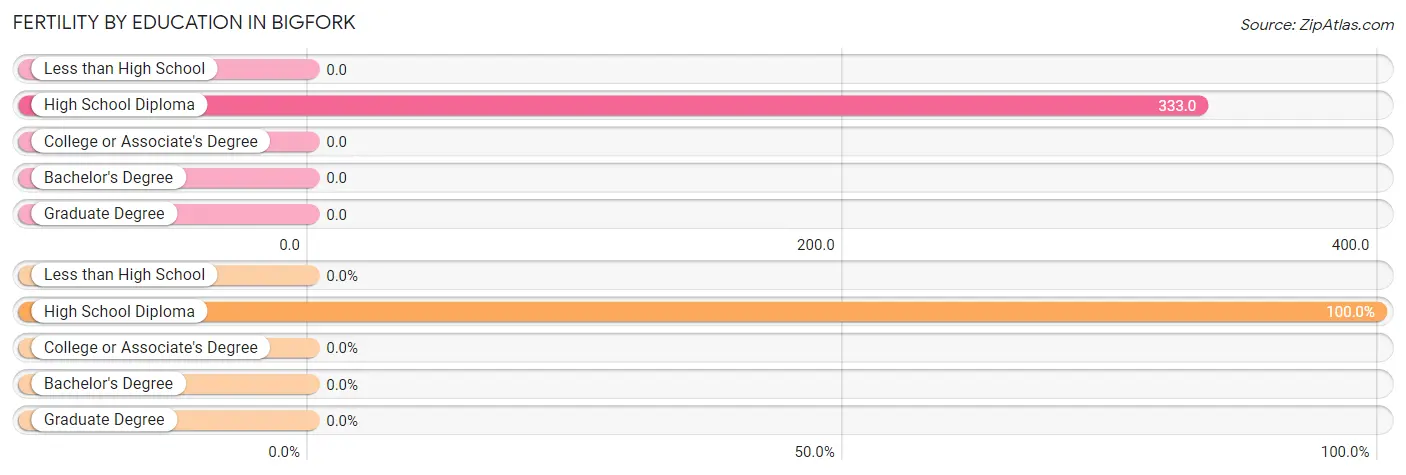
| Educational Attainment | Women with Births | Births / 1,000 Women |
| Less than High School | 0 (0.0%) | 0.0 |
| High School Diploma | 1 (100.0%) | 333.0 |
| College or Associate's Degree | 0 (0.0%) | 0.0 |
| Bachelor's Degree | 0 (0.0%) | 0.0 |
| Graduate Degree | 0 (0.0%) | 0.0 |
| Total | 1 (100.0%) | 38.0 |
Fertility by Education by Marriage Status in Bigfork
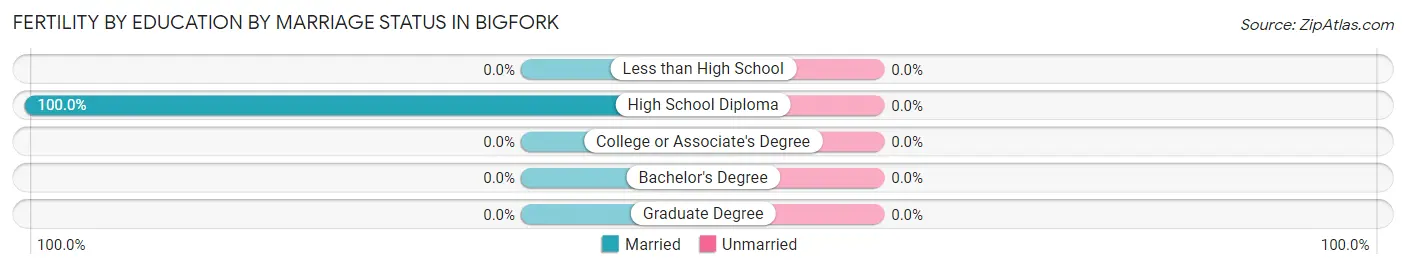
| Educational Attainment | Married | Unmarried |
| Less than High School | 0 (0.0%) | 0 (0.0%) |
| High School Diploma | 1 (100.0%) | 0 (0.0%) |
| College or Associate's Degree | 0 (0.0%) | 0 (0.0%) |
| Bachelor's Degree | 0 (0.0%) | 0 (0.0%) |
| Graduate Degree | 0 (0.0%) | 0 (0.0%) |
| Total | 1 (100.0%) | 0 (0.0%) |
Employment Characteristics in Bigfork
Employment by Class of Employer in Bigfork
Among the 74 employed individuals in Bigfork, private company employees (55 | 74.3%), local government employees (12 | 16.2%), and self-employed (not incorporated) (5 | 6.8%) make up the most common classes of employment.
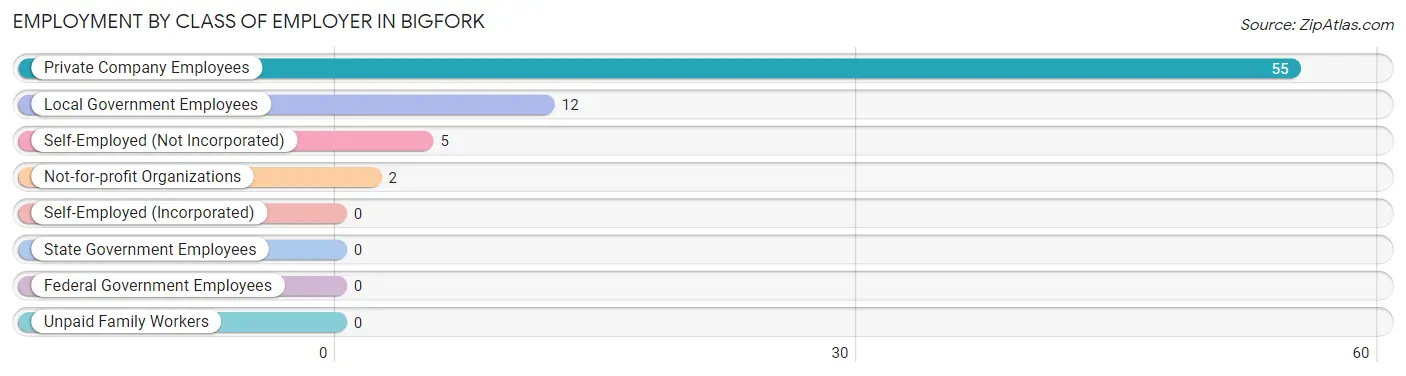
| Employer Class | # Employees | % Employees |
| Private Company Employees | 55 | 74.3% |
| Self-Employed (Incorporated) | 0 | 0.0% |
| Self-Employed (Not Incorporated) | 5 | 6.8% |
| Not-for-profit Organizations | 2 | 2.7% |
| Local Government Employees | 12 | 16.2% |
| State Government Employees | 0 | 0.0% |
| Federal Government Employees | 0 | 0.0% |
| Unpaid Family Workers | 0 | 0.0% |
| Total | 74 | 100.0% |
Employment Status by Age in Bigfork
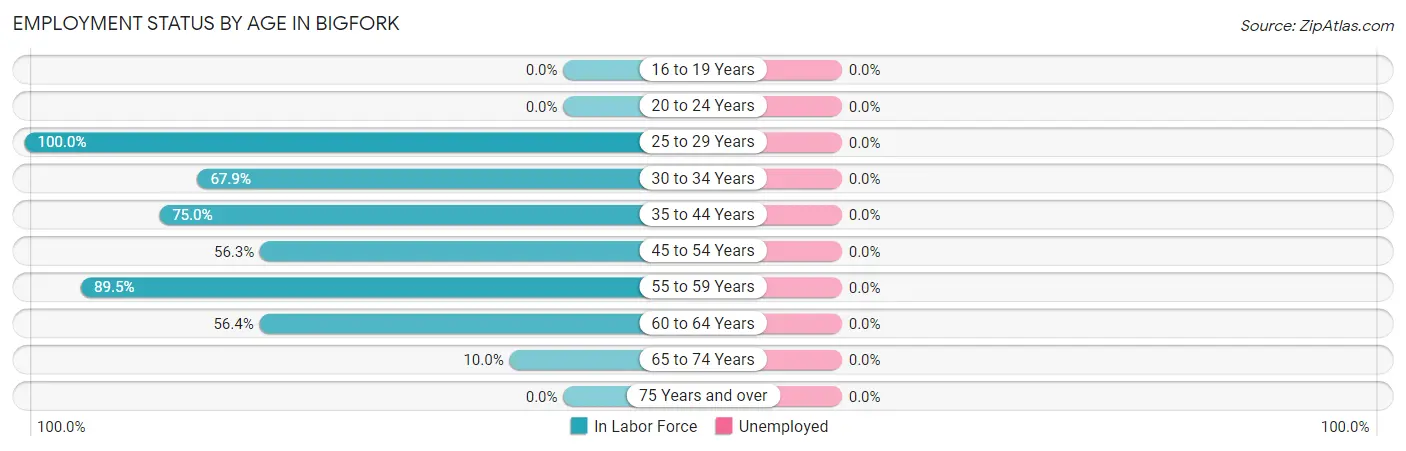
| Age Bracket | In Labor Force | Unemployed |
| 16 to 19 Years | 0 (0.0%) | 0 (0.0%) |
| 20 to 24 Years | 0 (0.0%) | 0 (0.0%) |
| 25 to 29 Years | 13 (100.0%) | 0 (0.0%) |
| 30 to 34 Years | 19 (67.9%) | 0 (0.0%) |
| 35 to 44 Years | 6 (75.0%) | 0 (0.0%) |
| 45 to 54 Years | 9 (56.3%) | 0 (0.0%) |
| 55 to 59 Years | 17 (89.5%) | 0 (0.0%) |
| 60 to 64 Years | 22 (56.4%) | 0 (0.0%) |
| 65 to 74 Years | 5 (10.0%) | 0 (0.0%) |
| 75 Years and over | 0 (0.0%) | 0 (0.0%) |
| Total | 91 (29.4%) | 0 (0.0%) |
Employment Status by Educational Attainment in Bigfork
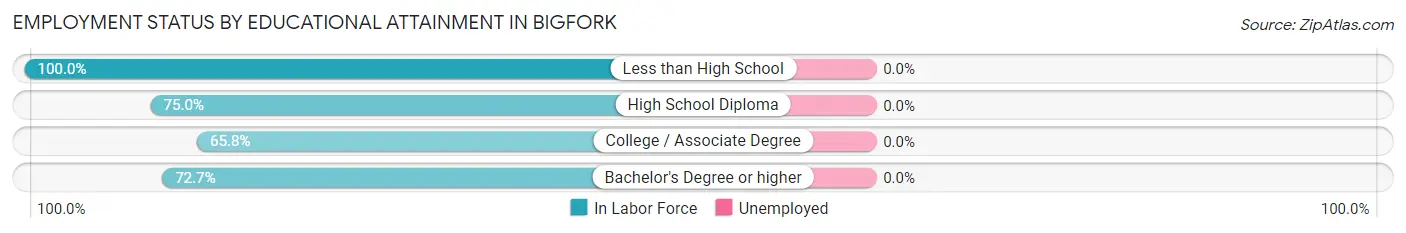
| Educational Attainment | In Labor Force | Unemployed |
| Less than High School | 4 (100.0%) | 0 (0.0%) |
| High School Diploma | 18 (75.0%) | 0 (0.0%) |
| College / Associate Degree | 48 (65.8%) | 0 (0.0%) |
| Bachelor's Degree or higher | 16 (72.7%) | 0 (0.0%) |
| Total | 86 (69.9%) | 0 (0.0%) |
Employment Occupations by Sex in Bigfork
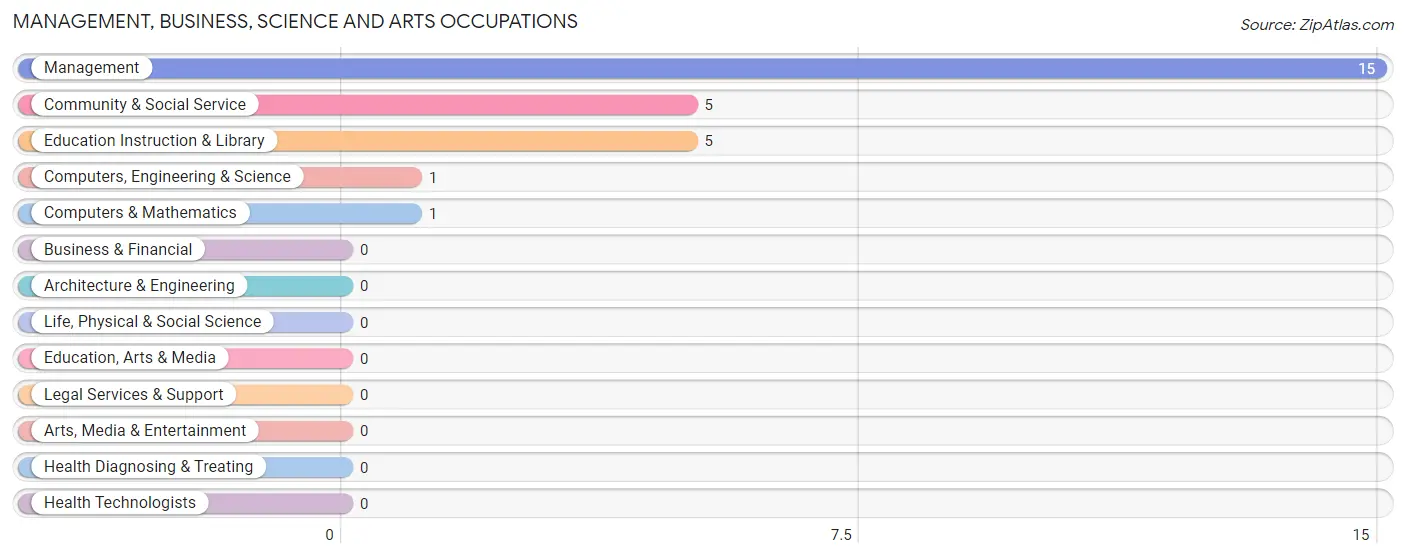
Management, Business, Science and Arts Occupations
The most common Management, Business, Science and Arts occupations in Bigfork are Management (15 | 16.5%), Community & Social Service (5 | 5.5%), Education Instruction & Library (5 | 5.5%), Computers, Engineering & Science (1 | 1.1%), and Computers & Mathematics (1 | 1.1%).
Management, Business, Science and Arts Occupations by Sex
Within the Management, Business, Science and Arts occupations in Bigfork, the most male-oriented occupations are Computers, Engineering & Science (100.0%), Computers & Mathematics (100.0%), and Management (66.7%), while the most female-oriented occupations are Community & Social Service (100.0%), Education Instruction & Library (100.0%), and Management (33.3%).
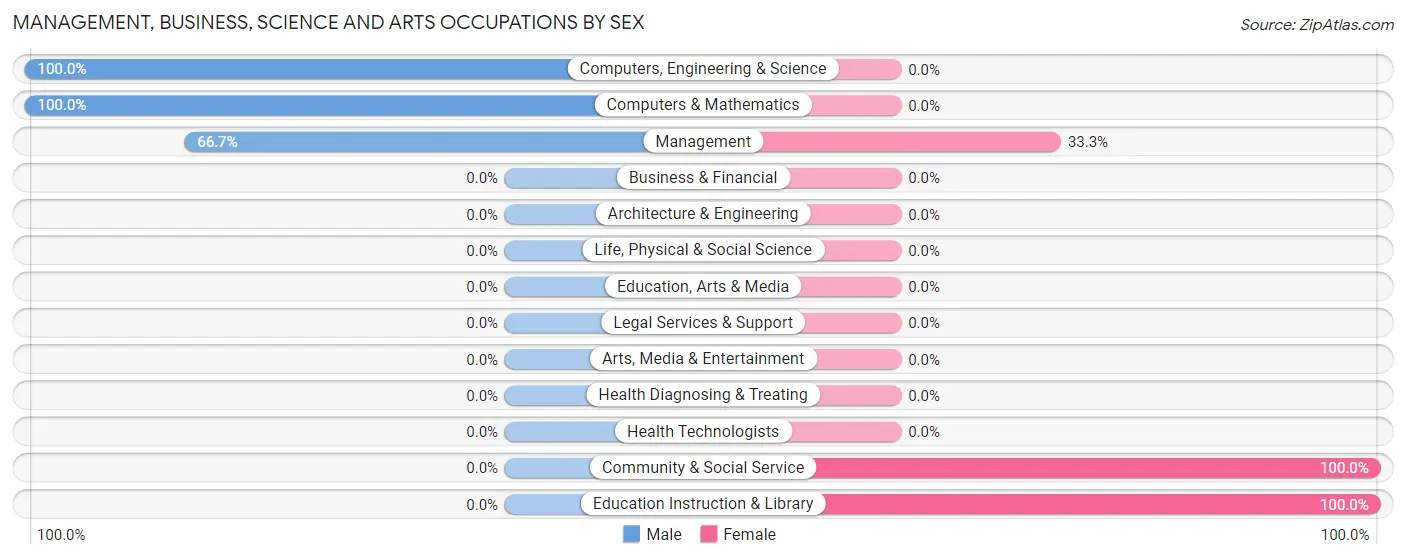
| Occupation | Male | Female |
| Management | 10 (66.7%) | 5 (33.3%) |
| Business & Financial | 0 (0.0%) | 0 (0.0%) |
| Computers, Engineering & Science | 1 (100.0%) | 0 (0.0%) |
| Computers & Mathematics | 1 (100.0%) | 0 (0.0%) |
| Architecture & Engineering | 0 (0.0%) | 0 (0.0%) |
| Life, Physical & Social Science | 0 (0.0%) | 0 (0.0%) |
| Community & Social Service | 0 (0.0%) | 5 (100.0%) |
| Education, Arts & Media | 0 (0.0%) | 0 (0.0%) |
| Legal Services & Support | 0 (0.0%) | 0 (0.0%) |
| Education Instruction & Library | 0 (0.0%) | 5 (100.0%) |
| Arts, Media & Entertainment | 0 (0.0%) | 0 (0.0%) |
| Health Diagnosing & Treating | 0 (0.0%) | 0 (0.0%) |
| Health Technologists | 0 (0.0%) | 0 (0.0%) |
| Total (Category) | 11 (52.4%) | 10 (47.6%) |
| Total (Overall) | 51 (56.0%) | 40 (44.0%) |
Services Occupations
The most common Services occupations in Bigfork are Healthcare Support (10 | 11.0%), Cleaning & Maintenance (7 | 7.7%), Security & Protection (3 | 3.3%), Law Enforcement (3 | 3.3%), and Food Preparation & Serving (2 | 2.2%).

Services Occupations by Sex
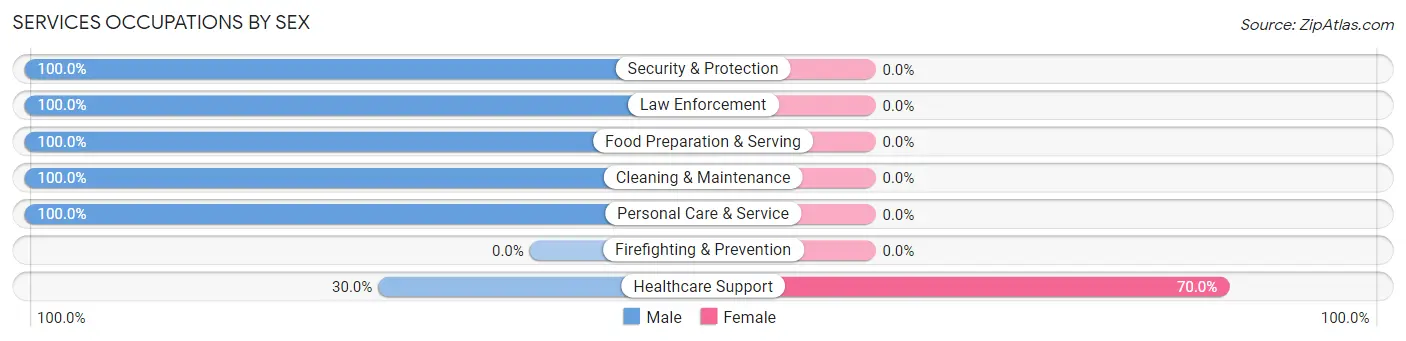
| Occupation | Male | Female |
| Healthcare Support | 3 (30.0%) | 7 (70.0%) |
| Security & Protection | 3 (100.0%) | 0 (0.0%) |
| Firefighting & Prevention | 0 (0.0%) | 0 (0.0%) |
| Law Enforcement | 3 (100.0%) | 0 (0.0%) |
| Food Preparation & Serving | 2 (100.0%) | 0 (0.0%) |
| Cleaning & Maintenance | 7 (100.0%) | 0 (0.0%) |
| Personal Care & Service | 2 (100.0%) | 0 (0.0%) |
| Total (Category) | 17 (70.8%) | 7 (29.2%) |
| Total (Overall) | 51 (56.0%) | 40 (44.0%) |
Sales and Office Occupations
The most common Sales and Office occupations in Bigfork are Office & Administration (14 | 15.4%), and Sales & Related (6 | 6.6%).
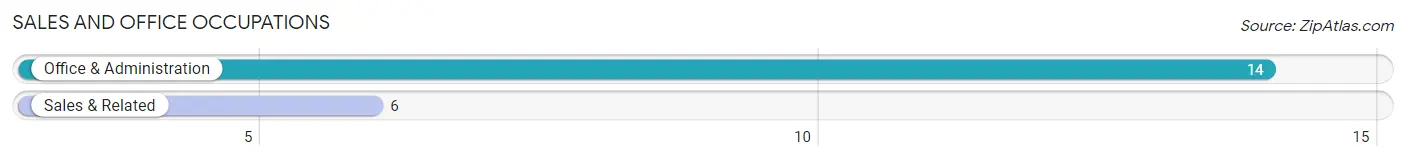
Sales and Office Occupations by Sex

| Occupation | Male | Female |
| Sales & Related | 6 (100.0%) | 0 (0.0%) |
| Office & Administration | 2 (14.3%) | 12 (85.7%) |
| Total (Category) | 8 (40.0%) | 12 (60.0%) |
| Total (Overall) | 51 (56.0%) | 40 (44.0%) |
Natural Resources, Construction and Maintenance Occupations
The most common Natural Resources, Construction and Maintenance occupations in Bigfork are , and Construction & Extraction (4 | 4.4%).
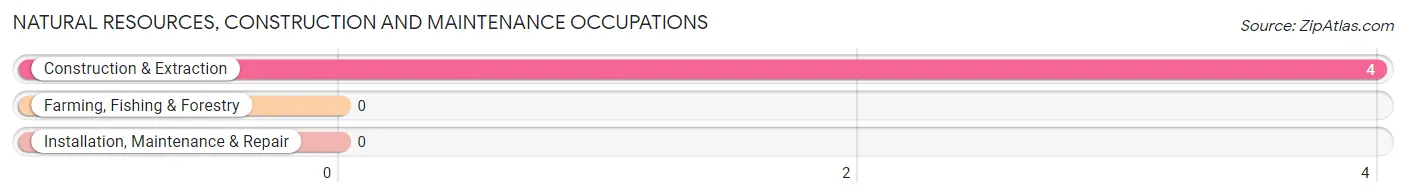
Natural Resources, Construction and Maintenance Occupations by Sex
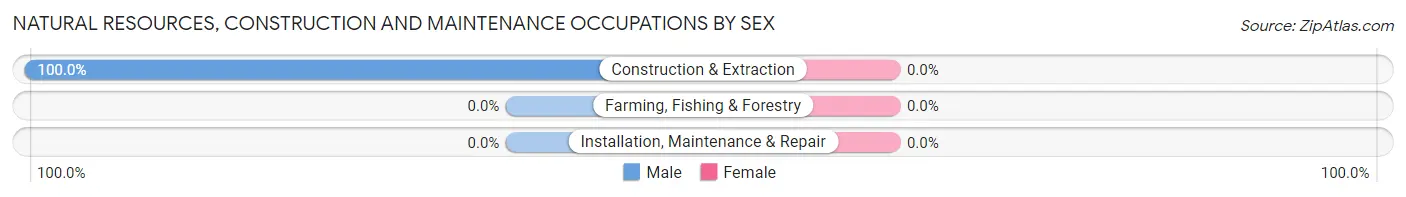
| Occupation | Male | Female |
| Farming, Fishing & Forestry | 0 (0.0%) | 0 (0.0%) |
| Construction & Extraction | 4 (100.0%) | 0 (0.0%) |
| Installation, Maintenance & Repair | 0 (0.0%) | 0 (0.0%) |
| Total (Category) | 4 (100.0%) | 0 (0.0%) |
| Total (Overall) | 51 (56.0%) | 40 (44.0%) |
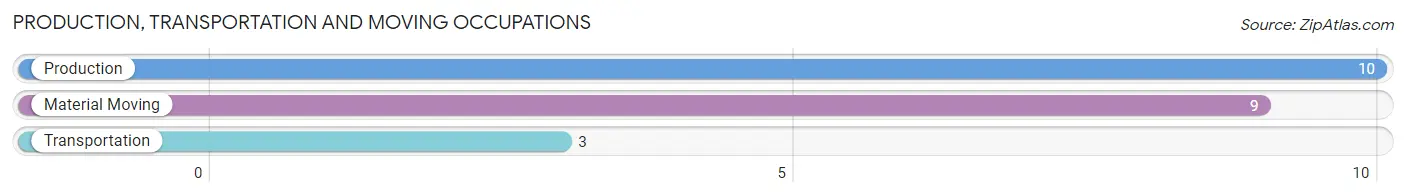
Production, Transportation and Moving Occupations
The most common Production, Transportation and Moving occupations in Bigfork are Production (10 | 11.0%), Material Moving (9 | 9.9%), and Transportation (3 | 3.3%).
Production, Transportation and Moving Occupations by Sex
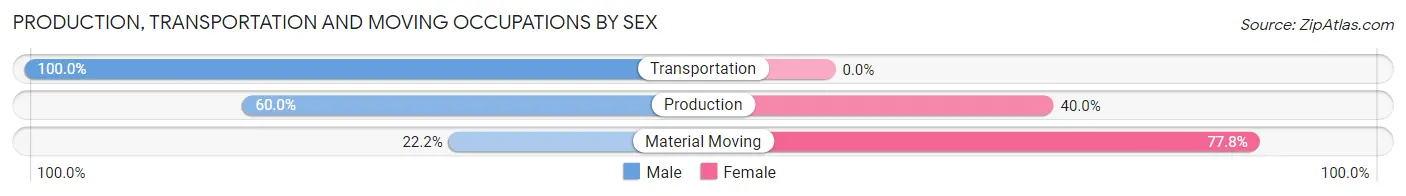
| Occupation | Male | Female |
| Production | 6 (60.0%) | 4 (40.0%) |
| Transportation | 3 (100.0%) | 0 (0.0%) |
| Material Moving | 2 (22.2%) | 7 (77.8%) |
| Total (Category) | 11 (50.0%) | 11 (50.0%) |
| Total (Overall) | 51 (56.0%) | 40 (44.0%) |
Employment Industries by Sex in Bigfork
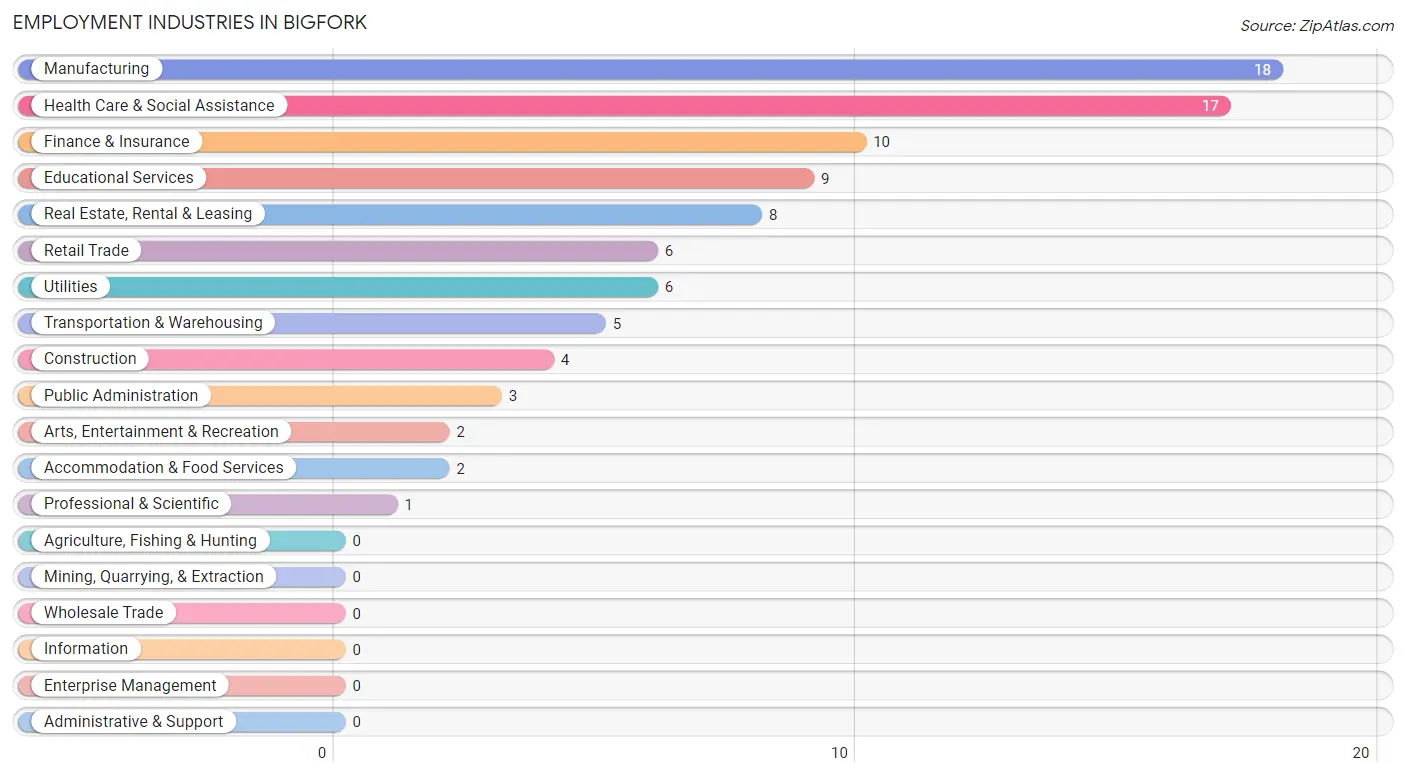
Employment Industries in Bigfork
The major employment industries in Bigfork include Manufacturing (18 | 19.8%), Health Care & Social Assistance (17 | 18.7%), Finance & Insurance (10 | 11.0%), Educational Services (9 | 9.9%), and Real Estate, Rental & Leasing (8 | 8.8%).
Employment Industries by Sex in Bigfork
The Bigfork industries that see more men than women are Construction (100.0%), Retail Trade (100.0%), and Transportation & Warehousing (100.0%), whereas the industries that tend to have a higher number of women are Manufacturing (100.0%), Utilities (100.0%), and Educational Services (55.6%).
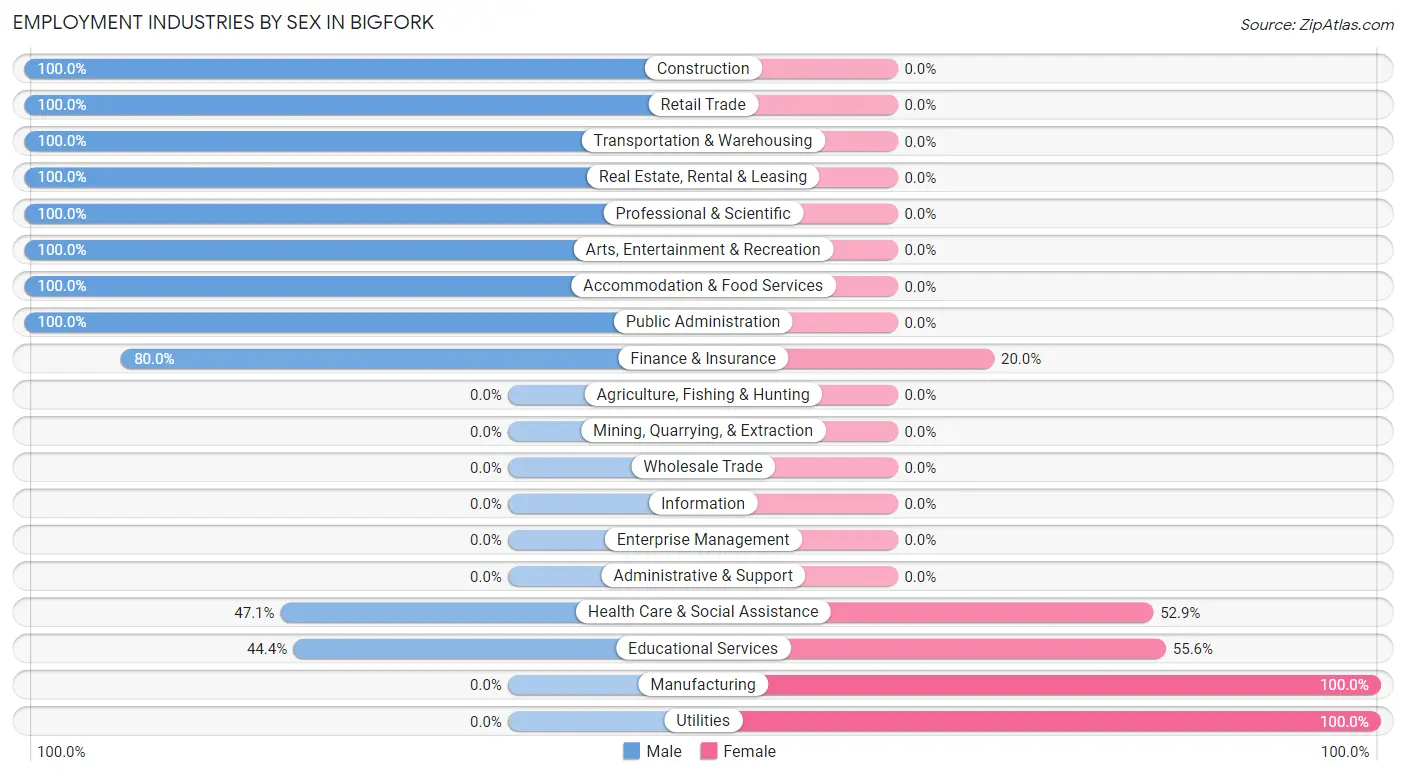
| Industry | Male | Female |
| Agriculture, Fishing & Hunting | 0 (0.0%) | 0 (0.0%) |
| Mining, Quarrying, & Extraction | 0 (0.0%) | 0 (0.0%) |
| Construction | 4 (100.0%) | 0 (0.0%) |
| Manufacturing | 0 (0.0%) | 18 (100.0%) |
| Wholesale Trade | 0 (0.0%) | 0 (0.0%) |
| Retail Trade | 6 (100.0%) | 0 (0.0%) |
| Transportation & Warehousing | 5 (100.0%) | 0 (0.0%) |
| Utilities | 0 (0.0%) | 6 (100.0%) |
| Information | 0 (0.0%) | 0 (0.0%) |
| Finance & Insurance | 8 (80.0%) | 2 (20.0%) |
| Real Estate, Rental & Leasing | 8 (100.0%) | 0 (0.0%) |
| Professional & Scientific | 1 (100.0%) | 0 (0.0%) |
| Enterprise Management | 0 (0.0%) | 0 (0.0%) |
| Administrative & Support | 0 (0.0%) | 0 (0.0%) |
| Educational Services | 4 (44.4%) | 5 (55.6%) |
| Health Care & Social Assistance | 8 (47.1%) | 9 (52.9%) |
| Arts, Entertainment & Recreation | 2 (100.0%) | 0 (0.0%) |
| Accommodation & Food Services | 2 (100.0%) | 0 (0.0%) |
| Public Administration | 3 (100.0%) | 0 (0.0%) |
| Total | 51 (56.0%) | 40 (44.0%) |
Education in Bigfork
School Enrollment in Bigfork
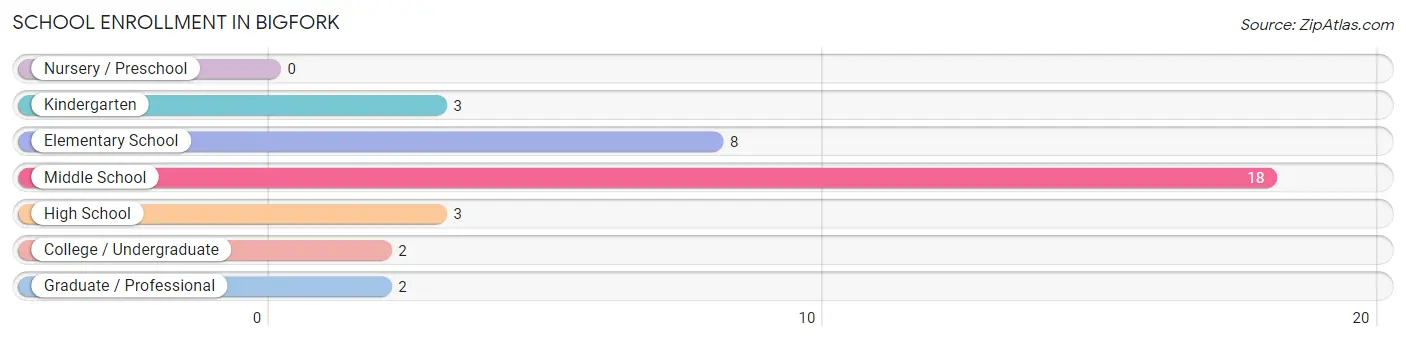
The most common levels of schooling among the 36 students in Bigfork are middle school (18 | 50.0%), elementary school (8 | 22.2%), and kindergarten (3 | 8.3%).
| School Level | # Students | % Students |
| Nursery / Preschool | 0 | 0.0% |
| Kindergarten | 3 | 8.3% |
| Elementary School | 8 | 22.2% |
| Middle School | 18 | 50.0% |
| High School | 3 | 8.3% |
| College / Undergraduate | 2 | 5.6% |
| Graduate / Professional | 2 | 5.6% |
| Total | 36 | 100.0% |
School Enrollment by Age by Funding Source in Bigfork
Out of a total of 36 students who are enrolled in schools in Bigfork, 10 (27.8%) attend a private institution, while the remaining 26 (72.2%) are enrolled in public schools. The age group of 25 to 34 year olds has the highest likelihood of being enrolled in private schools, with 2 (100.0% in the age bracket) enrolled. Conversely, the age group of 35 years and over has the lowest likelihood of being enrolled in a private school, with 2 (100.0% in the age bracket) attending a public institution.
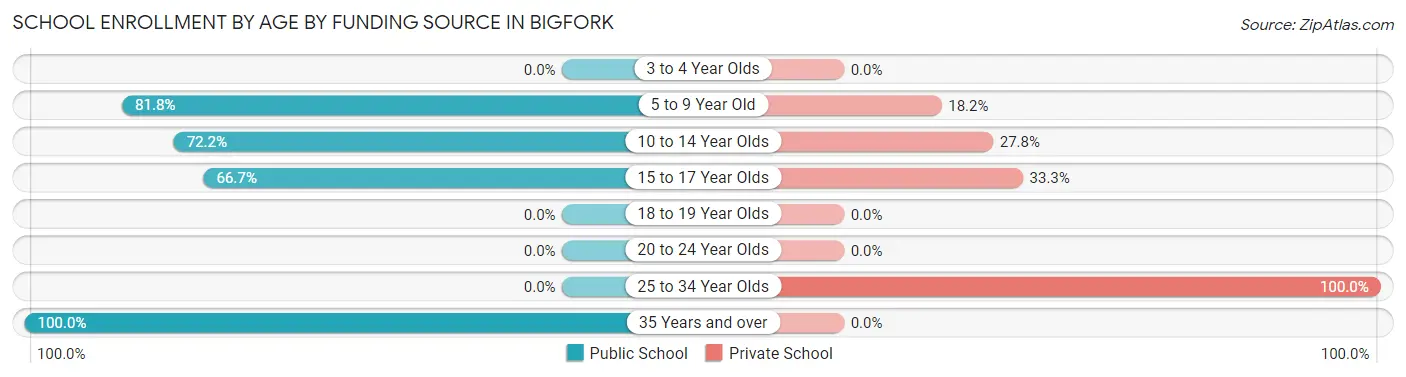
| Age Bracket | Public School | Private School |
| 3 to 4 Year Olds | 0 (0.0%) | 0 (0.0%) |
| 5 to 9 Year Old | 9 (81.8%) | 2 (18.2%) |
| 10 to 14 Year Olds | 13 (72.2%) | 5 (27.8%) |
| 15 to 17 Year Olds | 2 (66.7%) | 1 (33.3%) |
| 18 to 19 Year Olds | 0 (0.0%) | 0 (0.0%) |
| 20 to 24 Year Olds | 0 (0.0%) | 0 (0.0%) |
| 25 to 34 Year Olds | 0 (0.0%) | 2 (100.0%) |
| 35 Years and over | 2 (100.0%) | 0 (0.0%) |
| Total | 26 (72.2%) | 10 (27.8%) |
Educational Attainment by Field of Study in Bigfork
Business (13 | 37.1%), education (8 | 22.9%), social sciences (5 | 14.3%), science & technology (4 | 11.4%), and literature & languages (3 | 8.6%) are the most common fields of study among 35 individuals in Bigfork who have obtained a bachelor's degree or higher.
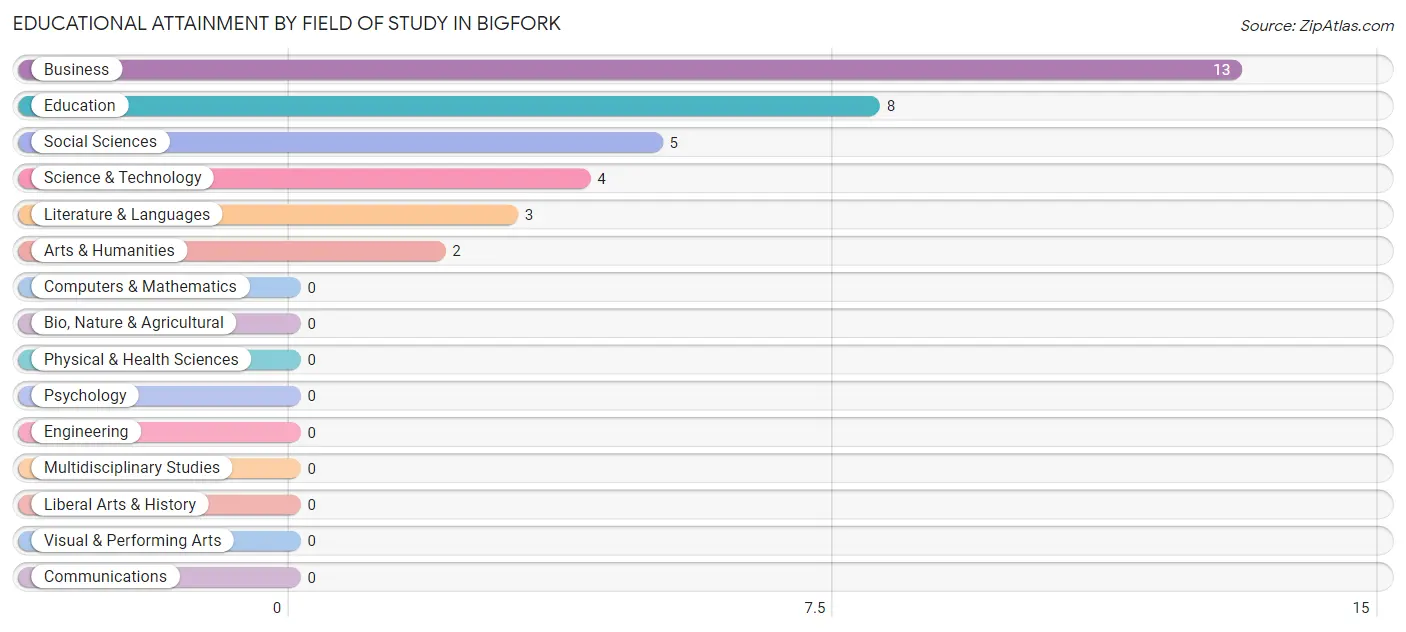
| Field of Study | # Graduates | % Graduates |
| Computers & Mathematics | 0 | 0.0% |
| Bio, Nature & Agricultural | 0 | 0.0% |
| Physical & Health Sciences | 0 | 0.0% |
| Psychology | 0 | 0.0% |
| Social Sciences | 5 | 14.3% |
| Engineering | 0 | 0.0% |
| Multidisciplinary Studies | 0 | 0.0% |
| Science & Technology | 4 | 11.4% |
| Business | 13 | 37.1% |
| Education | 8 | 22.9% |
| Literature & Languages | 3 | 8.6% |
| Liberal Arts & History | 0 | 0.0% |
| Visual & Performing Arts | 0 | 0.0% |
| Communications | 0 | 0.0% |
| Arts & Humanities | 2 | 5.7% |
| Total | 35 | 100.0% |
Transportation & Commute in Bigfork
Vehicle Availability by Sex in Bigfork
The most prevalent vehicle ownership categories in Bigfork are males with 3 vehicles (15, accounting for 40.5%) and females with 3 vehicles (11, making up 53.6%).
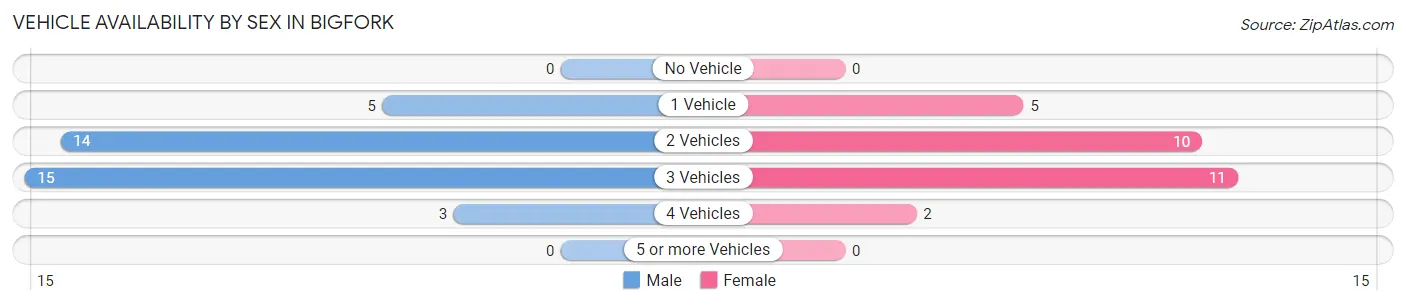
| Vehicles Available | Male | Female |
| No Vehicle | 0 (0.0%) | 0 (0.0%) |
| 1 Vehicle | 5 (13.5%) | 5 (17.9%) |
| 2 Vehicles | 14 (37.8%) | 10 (35.7%) |
| 3 Vehicles | 15 (40.5%) | 11 (39.3%) |
| 4 Vehicles | 3 (8.1%) | 2 (7.1%) |
| 5 or more Vehicles | 0 (0.0%) | 0 (0.0%) |
| Total | 37 (100.0%) | 28 (100.0%) |
Commute Time in Bigfork
The most frequently occuring commute durations in Bigfork are less than 5 minutes (18 commuters, 25.0%), 5 to 9 minutes (18 commuters, 25.0%), and 15 to 19 minutes (8 commuters, 11.1%).
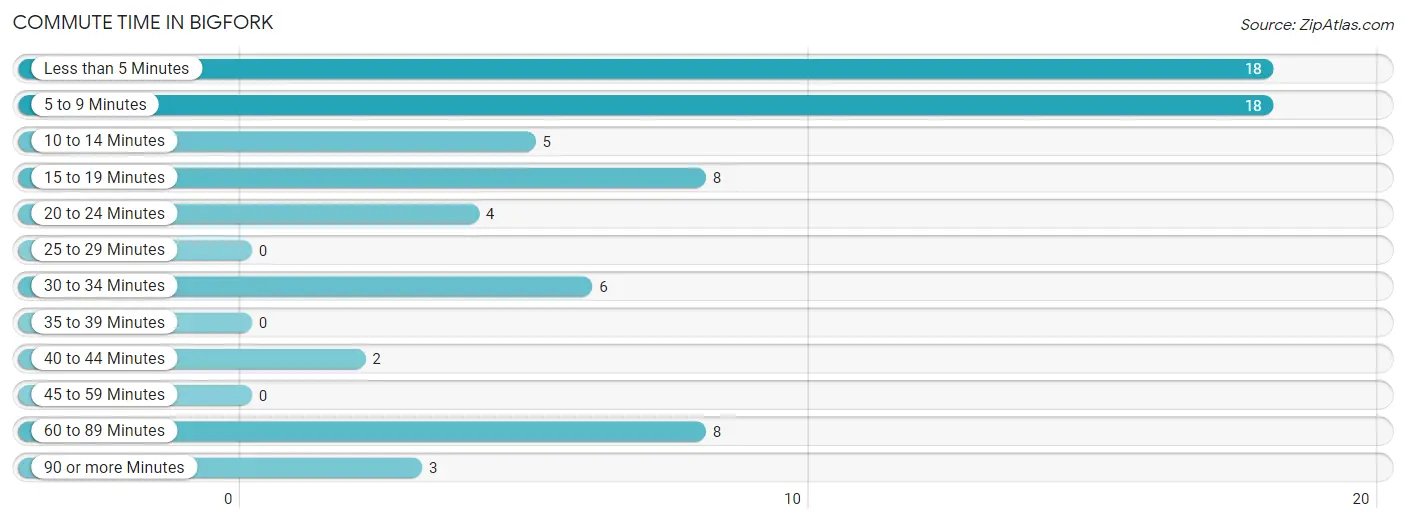
| Commute Time | # Commuters | % Commuters |
| Less than 5 Minutes | 18 | 25.0% |
| 5 to 9 Minutes | 18 | 25.0% |
| 10 to 14 Minutes | 5 | 6.9% |
| 15 to 19 Minutes | 8 | 11.1% |
| 20 to 24 Minutes | 4 | 5.6% |
| 25 to 29 Minutes | 0 | 0.0% |
| 30 to 34 Minutes | 6 | 8.3% |
| 35 to 39 Minutes | 0 | 0.0% |
| 40 to 44 Minutes | 2 | 2.8% |
| 45 to 59 Minutes | 0 | 0.0% |
| 60 to 89 Minutes | 8 | 11.1% |
| 90 or more Minutes | 3 | 4.2% |
Commute Time by Sex in Bigfork
The most common commute times in Bigfork are 5 to 9 minutes (9 commuters, 20.4%) for males and less than 5 minutes (11 commuters, 39.3%) for females.
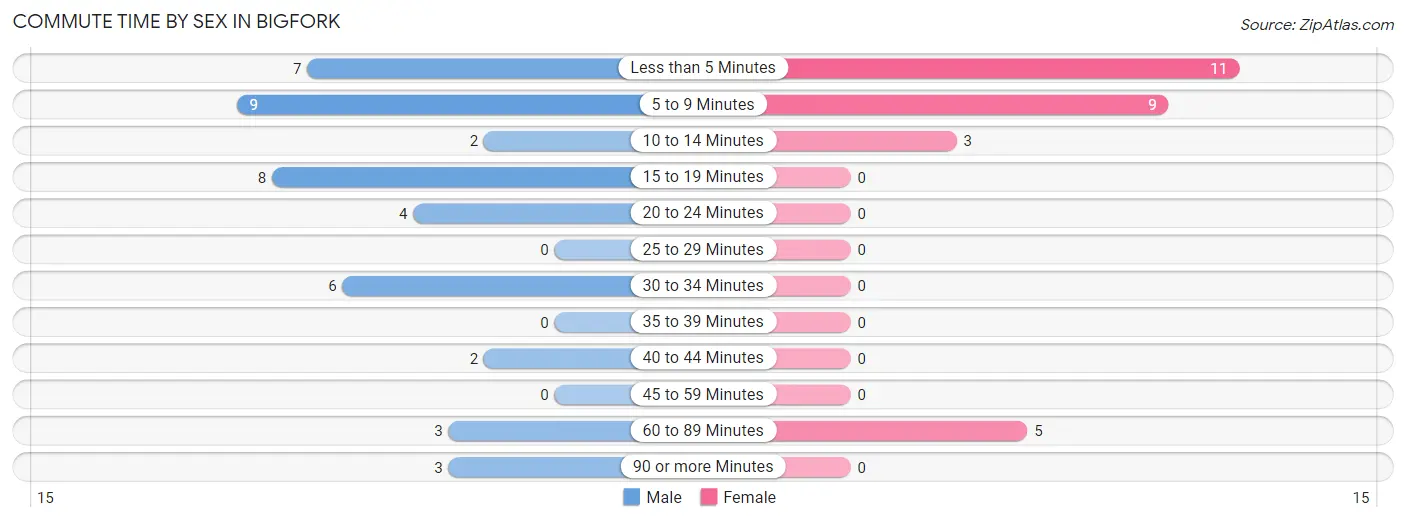
| Commute Time | Male | Female |
| Less than 5 Minutes | 7 (15.9%) | 11 (39.3%) |
| 5 to 9 Minutes | 9 (20.4%) | 9 (32.1%) |
| 10 to 14 Minutes | 2 (4.5%) | 3 (10.7%) |
| 15 to 19 Minutes | 8 (18.2%) | 0 (0.0%) |
| 20 to 24 Minutes | 4 (9.1%) | 0 (0.0%) |
| 25 to 29 Minutes | 0 (0.0%) | 0 (0.0%) |
| 30 to 34 Minutes | 6 (13.6%) | 0 (0.0%) |
| 35 to 39 Minutes | 0 (0.0%) | 0 (0.0%) |
| 40 to 44 Minutes | 2 (4.5%) | 0 (0.0%) |
| 45 to 59 Minutes | 0 (0.0%) | 0 (0.0%) |
| 60 to 89 Minutes | 3 (6.8%) | 5 (17.9%) |
| 90 or more Minutes | 3 (6.8%) | 0 (0.0%) |
Time of Departure to Work by Sex in Bigfork
The most frequent times of departure to work in Bigfork are 8:00 AM to 8:29 AM (18, 40.9%) for males and 6:30 AM to 6:59 AM (12, 42.9%) for females.
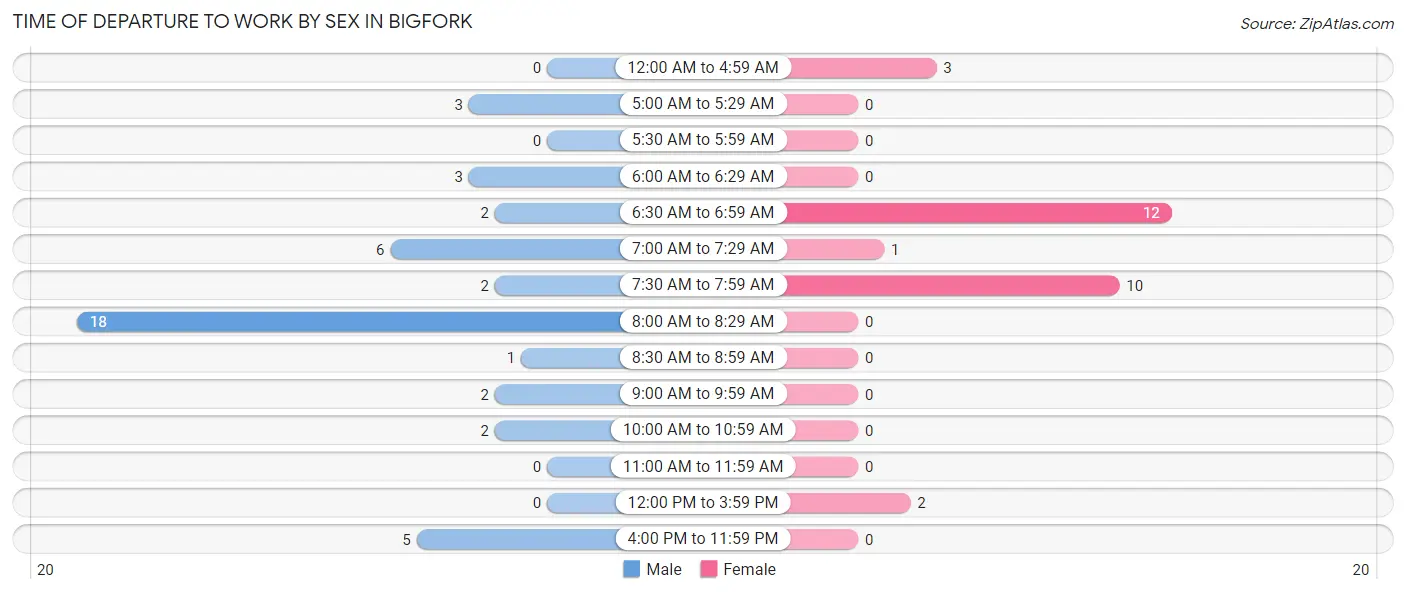
| Time of Departure | Male | Female |
| 12:00 AM to 4:59 AM | 0 (0.0%) | 3 (10.7%) |
| 5:00 AM to 5:29 AM | 3 (6.8%) | 0 (0.0%) |
| 5:30 AM to 5:59 AM | 0 (0.0%) | 0 (0.0%) |
| 6:00 AM to 6:29 AM | 3 (6.8%) | 0 (0.0%) |
| 6:30 AM to 6:59 AM | 2 (4.5%) | 12 (42.9%) |
| 7:00 AM to 7:29 AM | 6 (13.6%) | 1 (3.6%) |
| 7:30 AM to 7:59 AM | 2 (4.5%) | 10 (35.7%) |
| 8:00 AM to 8:29 AM | 18 (40.9%) | 0 (0.0%) |
| 8:30 AM to 8:59 AM | 1 (2.3%) | 0 (0.0%) |
| 9:00 AM to 9:59 AM | 2 (4.5%) | 0 (0.0%) |
| 10:00 AM to 10:59 AM | 2 (4.5%) | 0 (0.0%) |
| 11:00 AM to 11:59 AM | 0 (0.0%) | 0 (0.0%) |
| 12:00 PM to 3:59 PM | 0 (0.0%) | 2 (7.1%) |
| 4:00 PM to 11:59 PM | 5 (11.4%) | 0 (0.0%) |
| Total | 44 (100.0%) | 28 (100.0%) |
Housing Occupancy in Bigfork
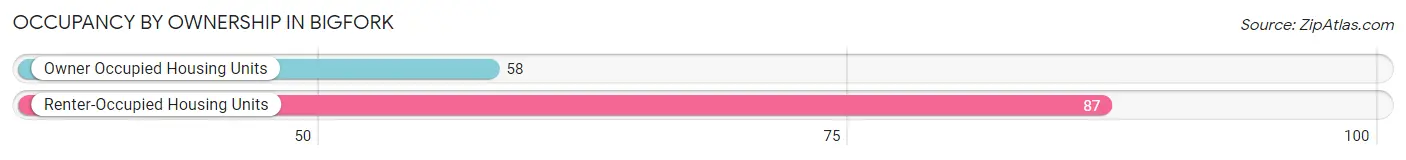
Occupancy by Ownership in Bigfork
Of the total 145 dwellings in Bigfork, owner-occupied units account for 58 (40.0%), while renter-occupied units make up 87 (60.0%).
| Occupancy | # Housing Units | % Housing Units |
| Owner Occupied Housing Units | 58 | 40.0% |
| Renter-Occupied Housing Units | 87 | 60.0% |
| Total Occupied Housing Units | 145 | 100.0% |
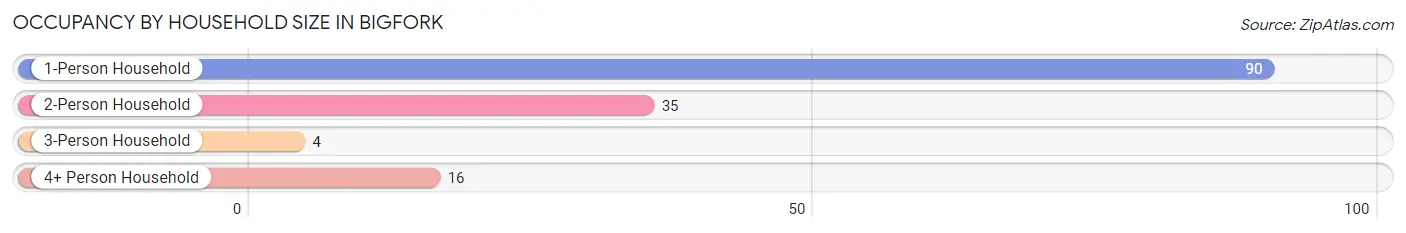
Occupancy by Household Size in Bigfork
| Household Size | # Housing Units | % Housing Units |
| 1-Person Household | 90 | 62.1% |
| 2-Person Household | 35 | 24.1% |
| 3-Person Household | 4 | 2.8% |
| 4+ Person Household | 16 | 11.0% |
| Total Housing Units | 145 | 100.0% |
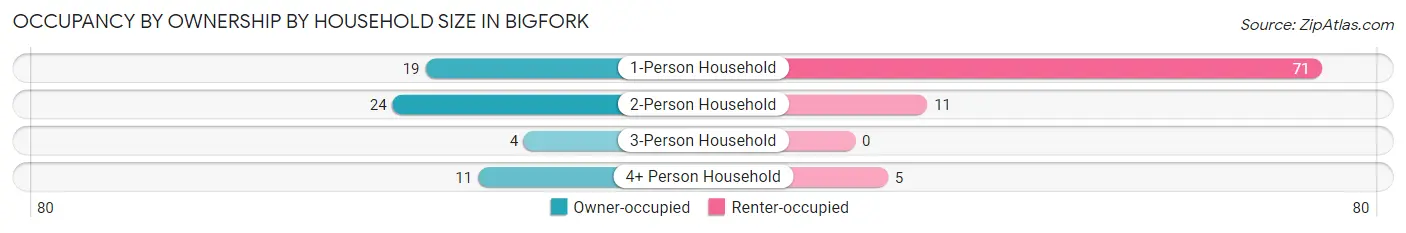
Occupancy by Ownership by Household Size in Bigfork
| Household Size | Owner-occupied | Renter-occupied |
| 1-Person Household | 19 (21.1%) | 71 (78.9%) |
| 2-Person Household | 24 (68.6%) | 11 (31.4%) |
| 3-Person Household | 4 (100.0%) | 0 (0.0%) |
| 4+ Person Household | 11 (68.8%) | 5 (31.2%) |
| Total Housing Units | 58 (40.0%) | 87 (60.0%) |
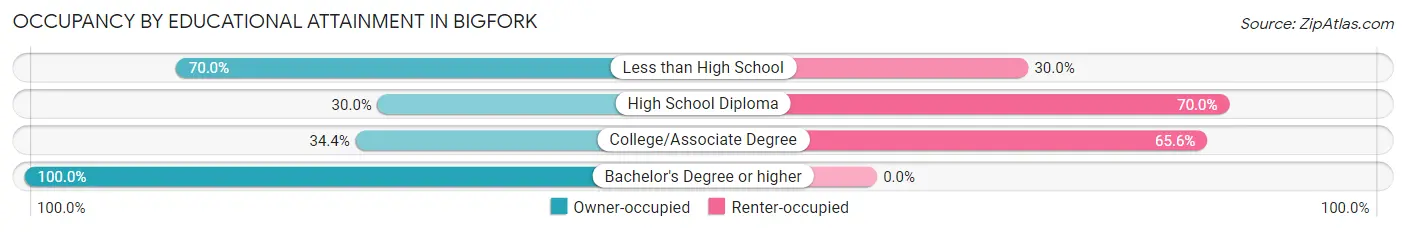
Occupancy by Educational Attainment in Bigfork
| Household Size | Owner-occupied | Renter-occupied |
| Less than High School | 7 (70.0%) | 3 (30.0%) |
| High School Diploma | 9 (30.0%) | 21 (70.0%) |
| College/Associate Degree | 33 (34.4%) | 63 (65.6%) |
| Bachelor's Degree or higher | 9 (100.0%) | 0 (0.0%) |
Occupancy by Age of Householder in Bigfork
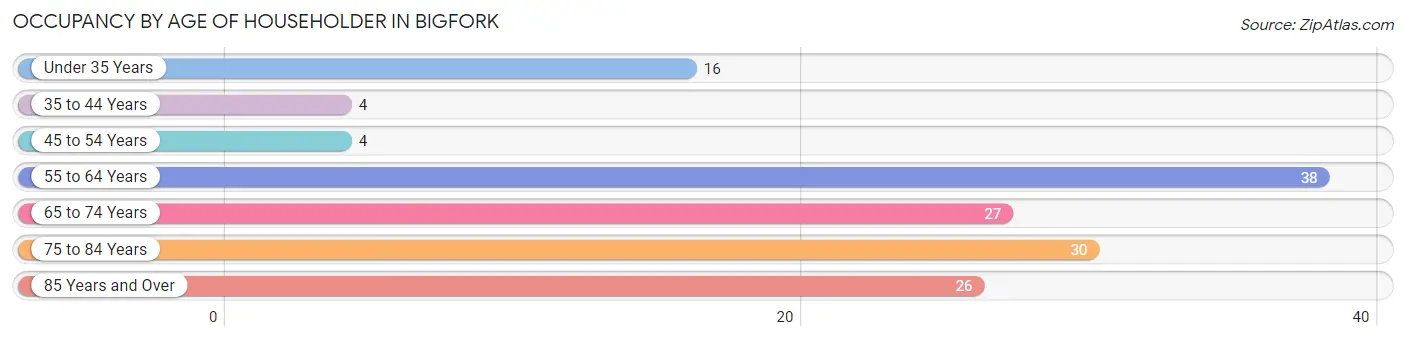
| Age Bracket | # Households | % Households |
| Under 35 Years | 16 | 11.0% |
| 35 to 44 Years | 4 | 2.8% |
| 45 to 54 Years | 4 | 2.8% |
| 55 to 64 Years | 38 | 26.2% |
| 65 to 74 Years | 27 | 18.6% |
| 75 to 84 Years | 30 | 20.7% |
| 85 Years and Over | 26 | 17.9% |
| Total | 145 | 100.0% |
Housing Finances in Bigfork
Median Income by Occupancy in Bigfork
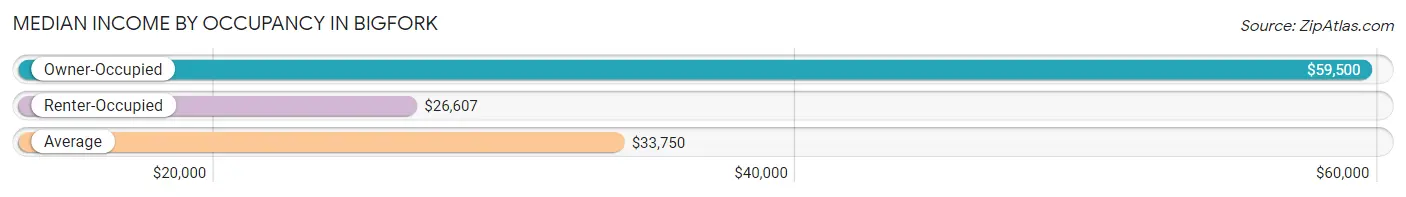
| Occupancy Type | # Households | Median Income |
| Owner-Occupied | 58 (40.0%) | $59,500 |
| Renter-Occupied | 87 (60.0%) | $26,607 |
| Average | 145 (100.0%) | $33,750 |
Occupancy by Householder Income Bracket in Bigfork
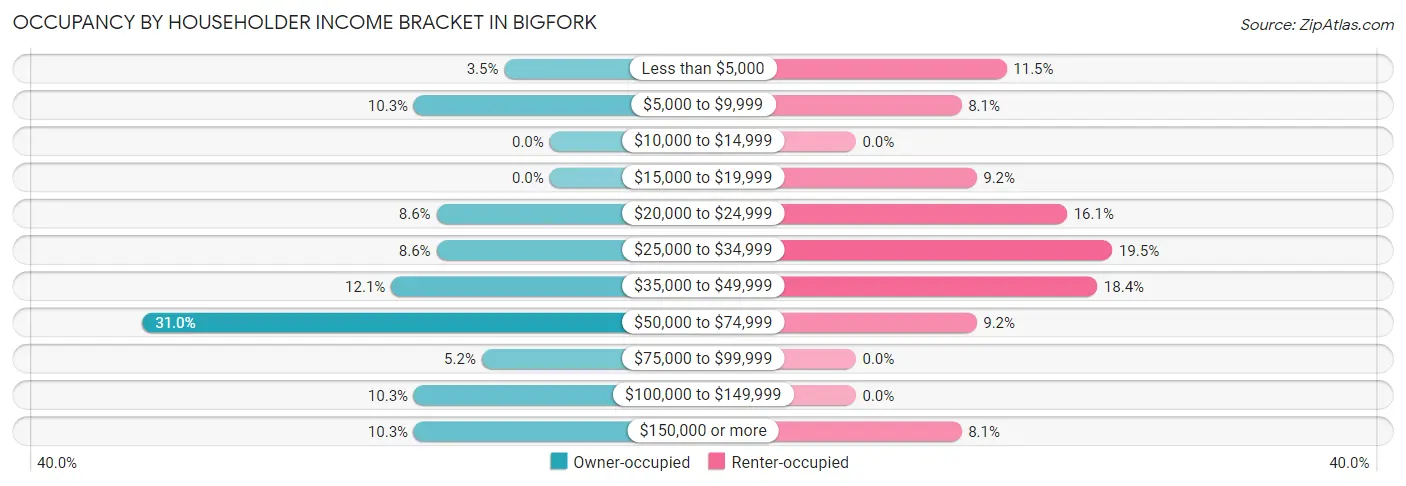
| Income Bracket | Owner-occupied | Renter-occupied |
| Less than $5,000 | 2 (3.5%) | 10 (11.5%) |
| $5,000 to $9,999 | 6 (10.3%) | 7 (8.1%) |
| $10,000 to $14,999 | 0 (0.0%) | 0 (0.0%) |
| $15,000 to $19,999 | 0 (0.0%) | 8 (9.2%) |
| $20,000 to $24,999 | 5 (8.6%) | 14 (16.1%) |
| $25,000 to $34,999 | 5 (8.6%) | 17 (19.5%) |
| $35,000 to $49,999 | 7 (12.1%) | 16 (18.4%) |
| $50,000 to $74,999 | 18 (31.0%) | 8 (9.2%) |
| $75,000 to $99,999 | 3 (5.2%) | 0 (0.0%) |
| $100,000 to $149,999 | 6 (10.3%) | 0 (0.0%) |
| $150,000 or more | 6 (10.3%) | 7 (8.1%) |
| Total | 58 (100.0%) | 87 (100.0%) |
Monthly Housing Cost Tiers in Bigfork
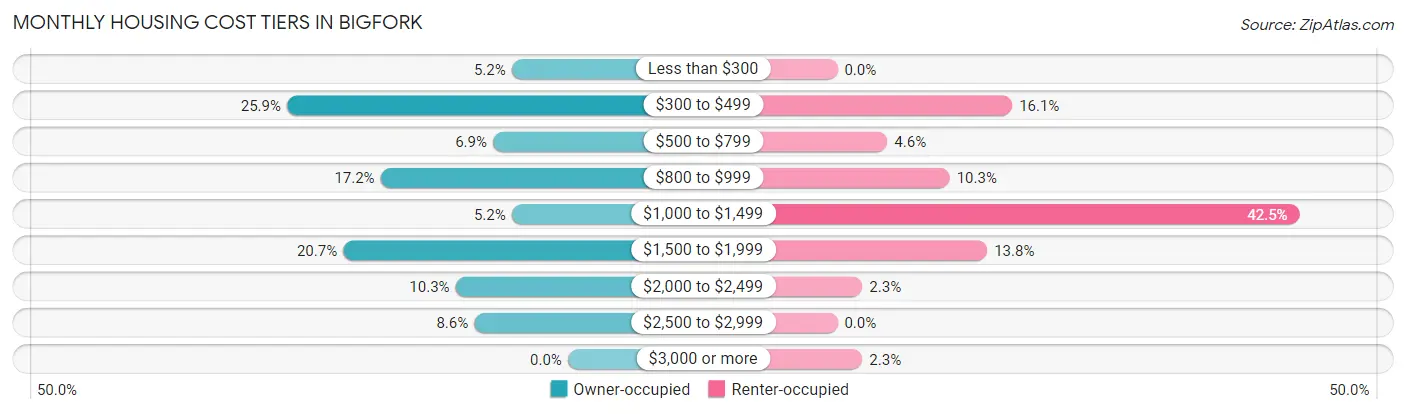
| Monthly Cost | Owner-occupied | Renter-occupied |
| Less than $300 | 3 (5.2%) | 0 (0.0%) |
| $300 to $499 | 15 (25.9%) | 14 (16.1%) |
| $500 to $799 | 4 (6.9%) | 4 (4.6%) |
| $800 to $999 | 10 (17.2%) | 9 (10.3%) |
| $1,000 to $1,499 | 3 (5.2%) | 37 (42.5%) |
| $1,500 to $1,999 | 12 (20.7%) | 12 (13.8%) |
| $2,000 to $2,499 | 6 (10.3%) | 2 (2.3%) |
| $2,500 to $2,999 | 5 (8.6%) | 0 (0.0%) |
| $3,000 or more | 0 (0.0%) | 2 (2.3%) |
| Total | 58 (100.0%) | 87 (100.0%) |
Physical Housing Characteristics in Bigfork
Housing Structures in Bigfork
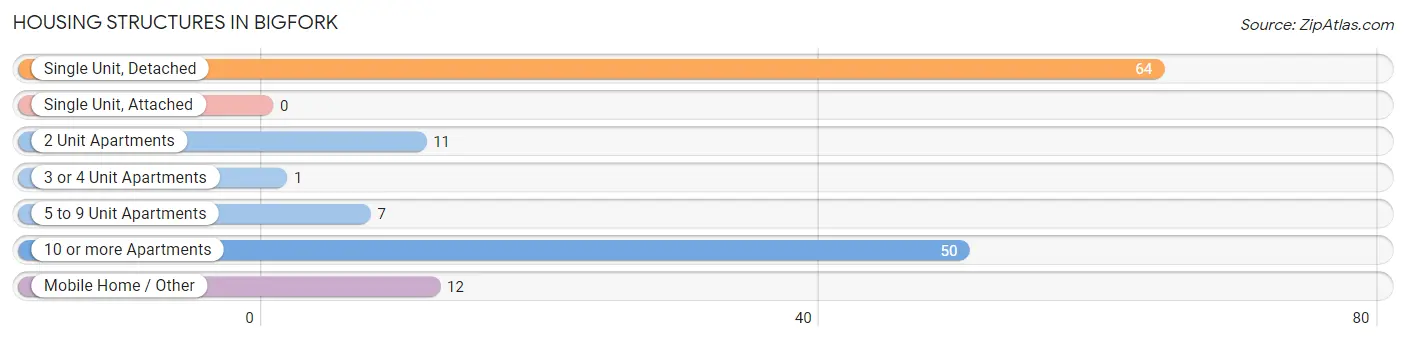
| Structure Type | # Housing Units | % Housing Units |
| Single Unit, Detached | 64 | 44.1% |
| Single Unit, Attached | 0 | 0.0% |
| 2 Unit Apartments | 11 | 7.6% |
| 3 or 4 Unit Apartments | 1 | 0.7% |
| 5 to 9 Unit Apartments | 7 | 4.8% |
| 10 or more Apartments | 50 | 34.5% |
| Mobile Home / Other | 12 | 8.3% |
| Total | 145 | 100.0% |
Housing Structures by Occupancy in Bigfork
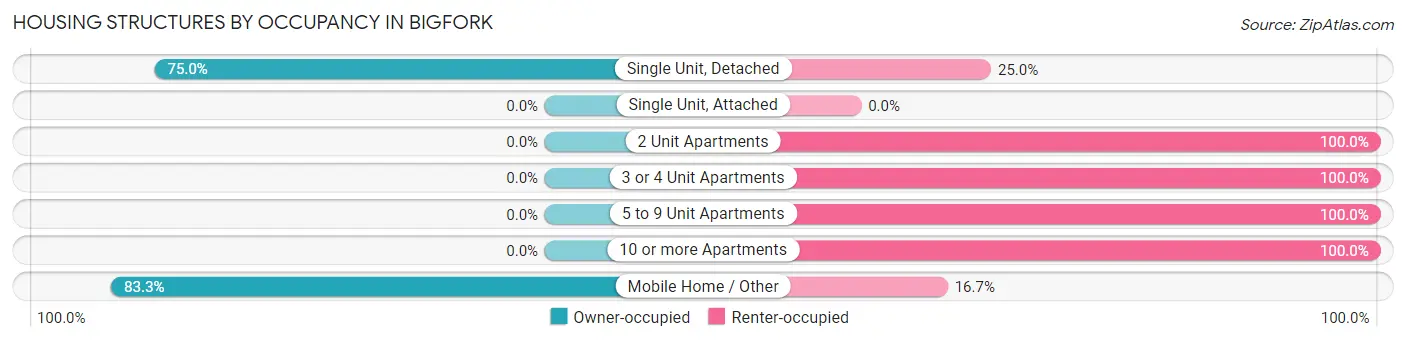
| Structure Type | Owner-occupied | Renter-occupied |
| Single Unit, Detached | 48 (75.0%) | 16 (25.0%) |
| Single Unit, Attached | 0 (0.0%) | 0 (0.0%) |
| 2 Unit Apartments | 0 (0.0%) | 11 (100.0%) |
| 3 or 4 Unit Apartments | 0 (0.0%) | 1 (100.0%) |
| 5 to 9 Unit Apartments | 0 (0.0%) | 7 (100.0%) |
| 10 or more Apartments | 0 (0.0%) | 50 (100.0%) |
| Mobile Home / Other | 10 (83.3%) | 2 (16.7%) |
| Total | 58 (40.0%) | 87 (60.0%) |
Housing Structures by Number of Rooms in Bigfork
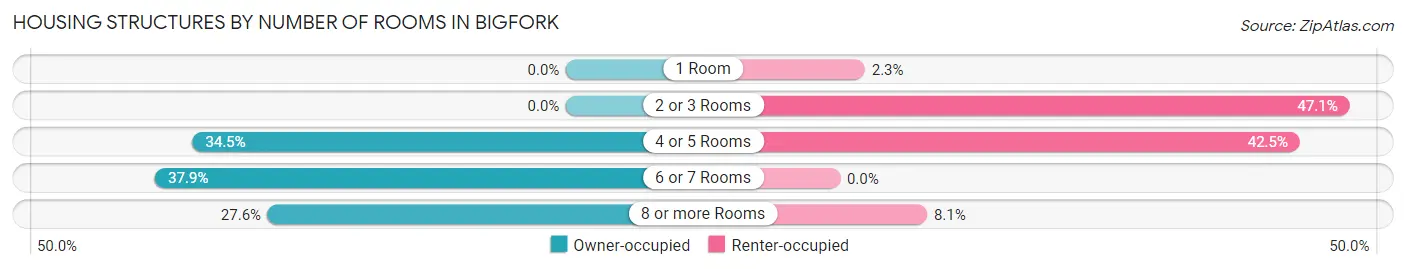
| Number of Rooms | Owner-occupied | Renter-occupied |
| 1 Room | 0 (0.0%) | 2 (2.3%) |
| 2 or 3 Rooms | 0 (0.0%) | 41 (47.1%) |
| 4 or 5 Rooms | 20 (34.5%) | 37 (42.5%) |
| 6 or 7 Rooms | 22 (37.9%) | 0 (0.0%) |
| 8 or more Rooms | 16 (27.6%) | 7 (8.1%) |
| Total | 58 (100.0%) | 87 (100.0%) |
Housing Structure by Heating Type in Bigfork
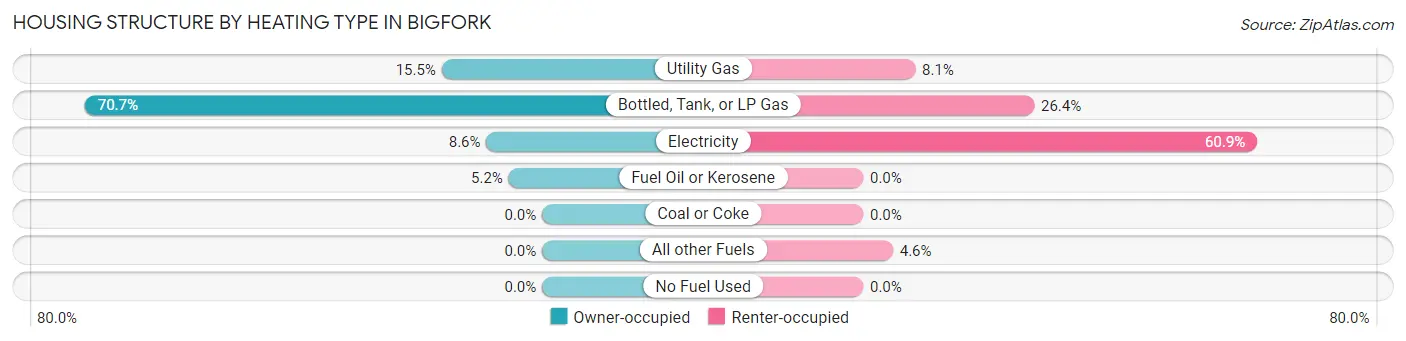
| Heating Type | Owner-occupied | Renter-occupied |
| Utility Gas | 9 (15.5%) | 7 (8.1%) |
| Bottled, Tank, or LP Gas | 41 (70.7%) | 23 (26.4%) |
| Electricity | 5 (8.6%) | 53 (60.9%) |
| Fuel Oil or Kerosene | 3 (5.2%) | 0 (0.0%) |
| Coal or Coke | 0 (0.0%) | 0 (0.0%) |
| All other Fuels | 0 (0.0%) | 4 (4.6%) |
| No Fuel Used | 0 (0.0%) | 0 (0.0%) |
| Total | 58 (100.0%) | 87 (100.0%) |
Household Vehicle Usage in Bigfork
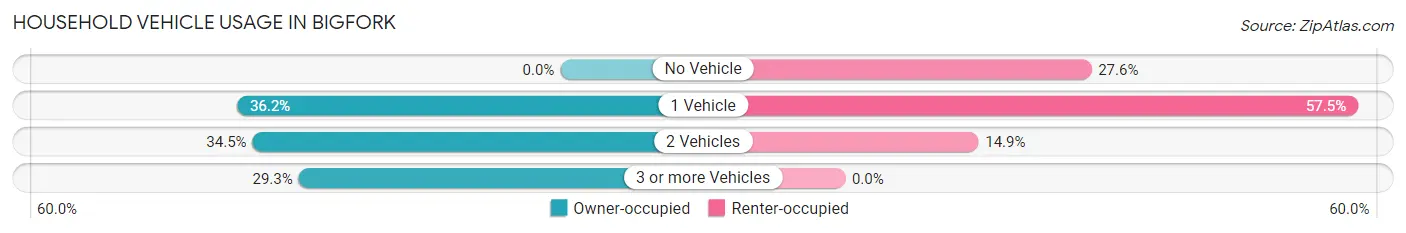
| Vehicles per Household | Owner-occupied | Renter-occupied |
| No Vehicle | 0 (0.0%) | 24 (27.6%) |
| 1 Vehicle | 21 (36.2%) | 50 (57.5%) |
| 2 Vehicles | 20 (34.5%) | 13 (14.9%) |
| 3 or more Vehicles | 17 (29.3%) | 0 (0.0%) |
| Total | 58 (100.0%) | 87 (100.0%) |
Real Estate & Mortgages in Bigfork
Real Estate and Mortgage Overview in Bigfork
| Characteristic | Without Mortgage | With Mortgage |
| Housing Units | 25 | 33 |
| Median Property Value | $143,800 | $173,400 |
| Median Household Income | $24,583 | $3 |
| Monthly Housing Costs | $385 | $0 |
| Real Estate Taxes | $1,417 | $0 |
Property Value by Mortgage Status in Bigfork
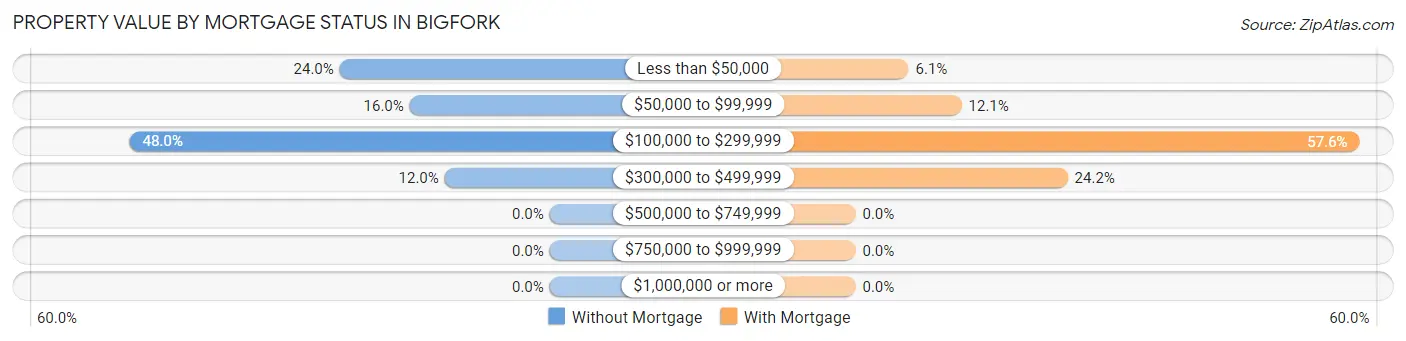
| Property Value | Without Mortgage | With Mortgage |
| Less than $50,000 | 6 (24.0%) | 2 (6.1%) |
| $50,000 to $99,999 | 4 (16.0%) | 4 (12.1%) |
| $100,000 to $299,999 | 12 (48.0%) | 19 (57.6%) |
| $300,000 to $499,999 | 3 (12.0%) | 8 (24.2%) |
| $500,000 to $749,999 | 0 (0.0%) | 0 (0.0%) |
| $750,000 to $999,999 | 0 (0.0%) | 0 (0.0%) |
| $1,000,000 or more | 0 (0.0%) | 0 (0.0%) |
| Total | 25 (100.0%) | 33 (100.0%) |
Household Income by Mortgage Status in Bigfork
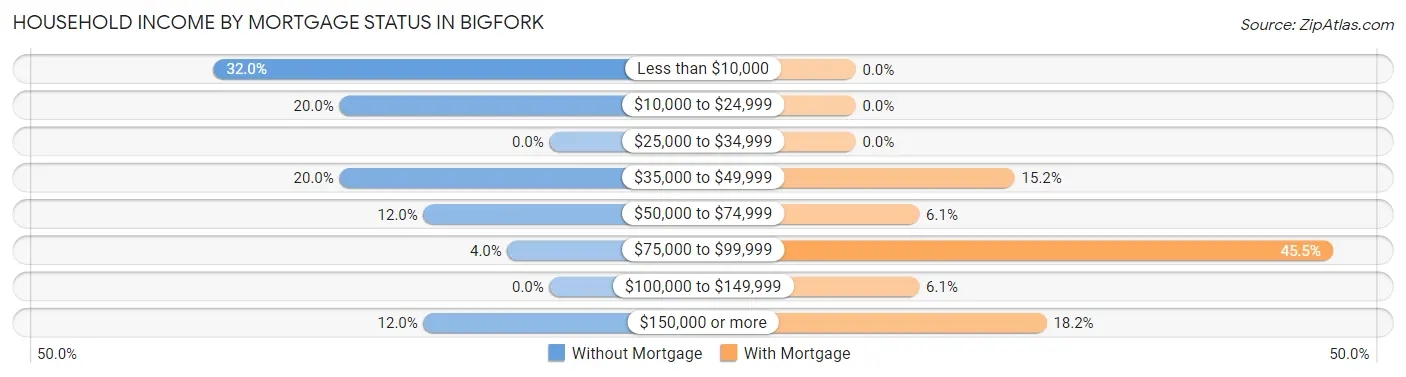
| Household Income | Without Mortgage | With Mortgage |
| Less than $10,000 | 8 (32.0%) | 0 (0.0%) |
| $10,000 to $24,999 | 5 (20.0%) | 0 (0.0%) |
| $25,000 to $34,999 | 0 (0.0%) | 0 (0.0%) |
| $35,000 to $49,999 | 5 (20.0%) | 5 (15.1%) |
| $50,000 to $74,999 | 3 (12.0%) | 2 (6.1%) |
| $75,000 to $99,999 | 1 (4.0%) | 15 (45.5%) |
| $100,000 to $149,999 | 0 (0.0%) | 2 (6.1%) |
| $150,000 or more | 3 (12.0%) | 6 (18.2%) |
| Total | 25 (100.0%) | 33 (100.0%) |
Property Value to Household Income Ratio in Bigfork
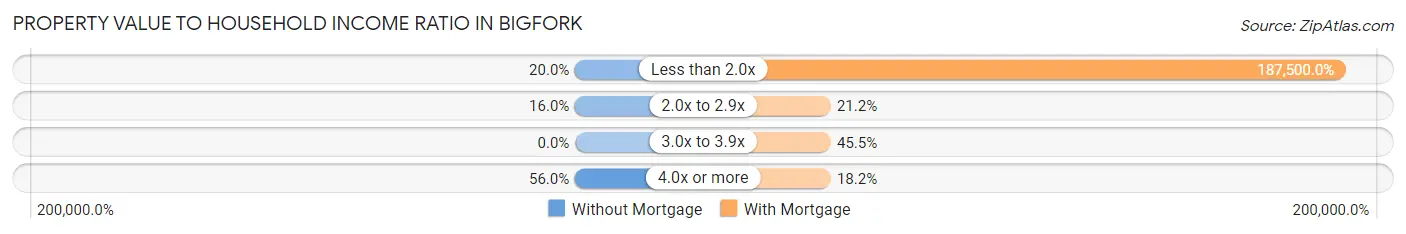
| Value-to-Income Ratio | Without Mortgage | With Mortgage |
| Less than 2.0x | 5 (20.0%) | 61,875 (187,500.0%) |
| 2.0x to 2.9x | 4 (16.0%) | 7 (21.2%) |
| 3.0x to 3.9x | 0 (0.0%) | 15 (45.5%) |
| 4.0x or more | 14 (56.0%) | 6 (18.2%) |
| Total | 25 (100.0%) | 33 (100.0%) |
Real Estate Taxes by Mortgage Status in Bigfork
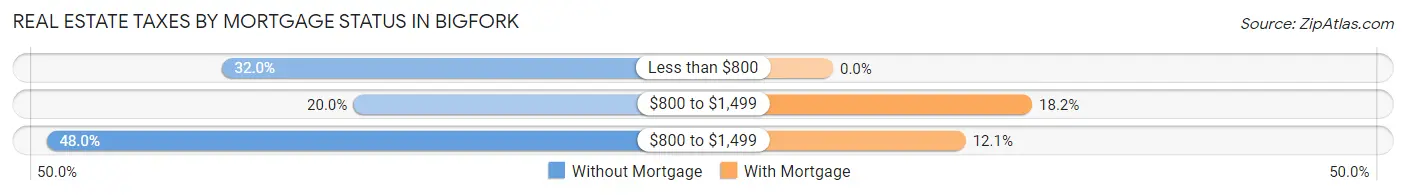
| Property Taxes | Without Mortgage | With Mortgage |
| Less than $800 | 8 (32.0%) | 0 (0.0%) |
| $800 to $1,499 | 5 (20.0%) | 6 (18.2%) |
| $800 to $1,499 | 12 (48.0%) | 4 (12.1%) |
| Total | 25 (100.0%) | 33 (100.0%) |
Health & Disability in Bigfork
Health Insurance Coverage by Age in Bigfork
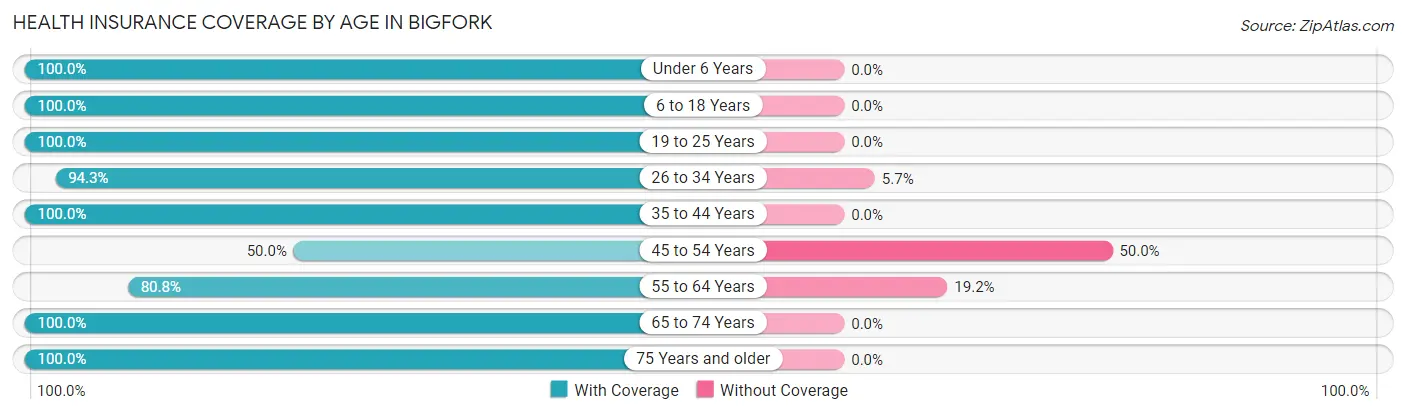
| Age Bracket | With Coverage | Without Coverage |
| Under 6 Years | 16 (100.0%) | 0 (0.0%) |
| 6 to 18 Years | 30 (100.0%) | 0 (0.0%) |
| 19 to 25 Years | 8 (100.0%) | 0 (0.0%) |
| 26 to 34 Years | 33 (94.3%) | 2 (5.7%) |
| 35 to 44 Years | 8 (100.0%) | 0 (0.0%) |
| 45 to 54 Years | 8 (50.0%) | 8 (50.0%) |
| 55 to 64 Years | 42 (80.8%) | 10 (19.2%) |
| 65 to 74 Years | 42 (100.0%) | 0 (0.0%) |
| 75 Years and older | 62 (100.0%) | 0 (0.0%) |
| Total | 249 (92.6%) | 20 (7.4%) |
Health Insurance Coverage by Citizenship Status in Bigfork

| Citizenship Status | With Coverage | Without Coverage |
| Native Born | 16 (100.0%) | 0 (0.0%) |
| Foreign Born, Citizen | 30 (100.0%) | 0 (0.0%) |
| Foreign Born, not a Citizen | 8 (100.0%) | 0 (0.0%) |
Health Insurance Coverage by Household Income in Bigfork
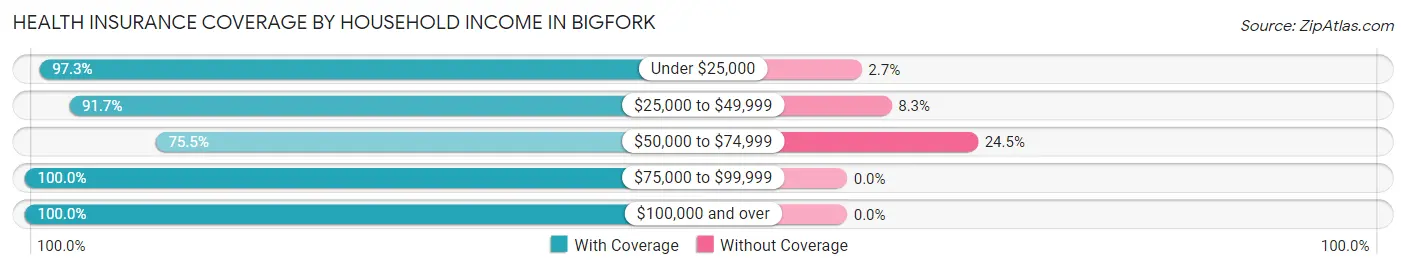
| Household Income | With Coverage | Without Coverage |
| Under $25,000 | 71 (97.3%) | 2 (2.7%) |
| $25,000 to $49,999 | 55 (91.7%) | 5 (8.3%) |
| $50,000 to $74,999 | 40 (75.5%) | 13 (24.5%) |
| $75,000 to $99,999 | 16 (100.0%) | 0 (0.0%) |
| $100,000 and over | 48 (100.0%) | 0 (0.0%) |
Public vs Private Health Insurance Coverage by Age in Bigfork
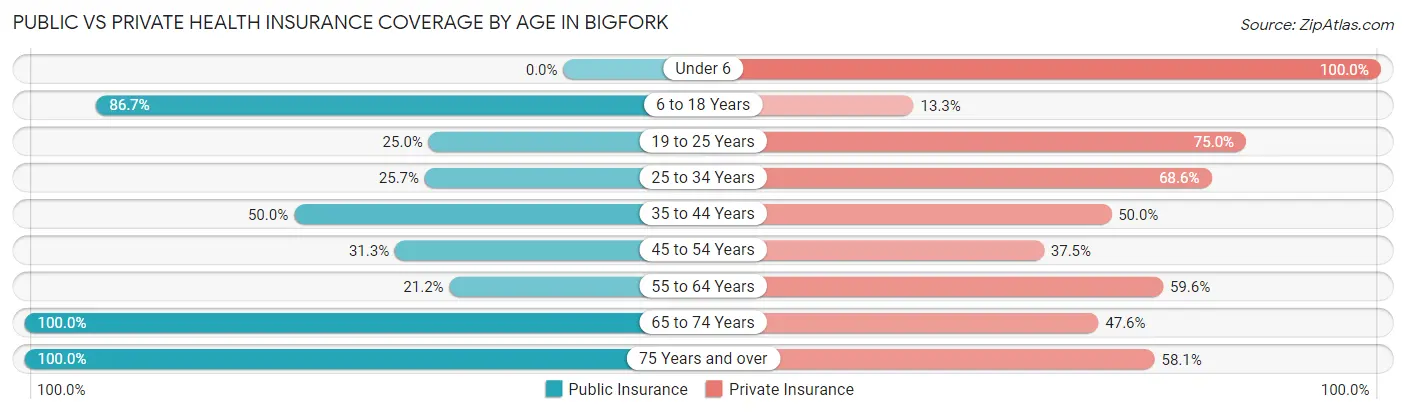
| Age Bracket | Public Insurance | Private Insurance |
| Under 6 | 0 (0.0%) | 16 (100.0%) |
| 6 to 18 Years | 26 (86.7%) | 4 (13.3%) |
| 19 to 25 Years | 2 (25.0%) | 6 (75.0%) |
| 25 to 34 Years | 9 (25.7%) | 24 (68.6%) |
| 35 to 44 Years | 4 (50.0%) | 4 (50.0%) |
| 45 to 54 Years | 5 (31.2%) | 6 (37.5%) |
| 55 to 64 Years | 11 (21.1%) | 31 (59.6%) |
| 65 to 74 Years | 42 (100.0%) | 20 (47.6%) |
| 75 Years and over | 62 (100.0%) | 36 (58.1%) |
| Total | 161 (59.9%) | 147 (54.6%) |
Disability Status by Sex by Age in Bigfork
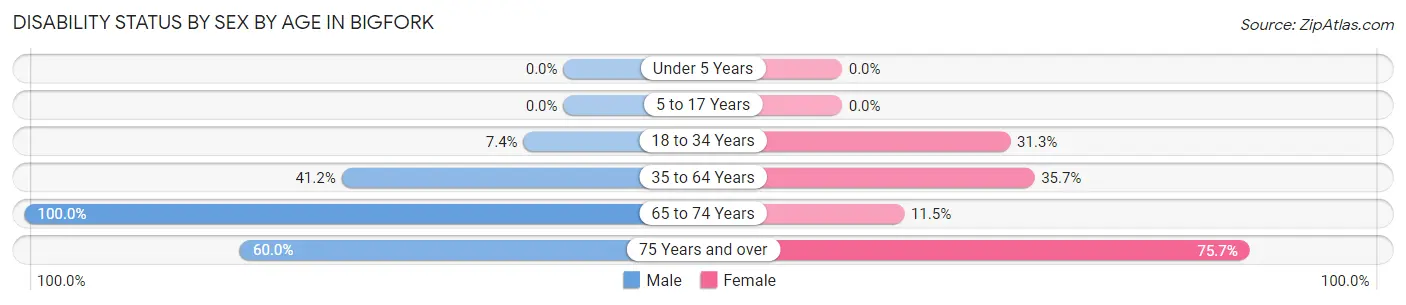
| Age Bracket | Male | Female |
| Under 5 Years | 0 (0.0%) | 0 (0.0%) |
| 5 to 17 Years | 0 (0.0%) | 0 (0.0%) |
| 18 to 34 Years | 2 (7.4%) | 5 (31.2%) |
| 35 to 64 Years | 14 (41.2%) | 15 (35.7%) |
| 65 to 74 Years | 16 (100.0%) | 3 (11.5%) |
| 75 Years and over | 15 (60.0%) | 28 (75.7%) |
Disability Class by Sex by Age in Bigfork
Disability Class: Hearing Difficulty
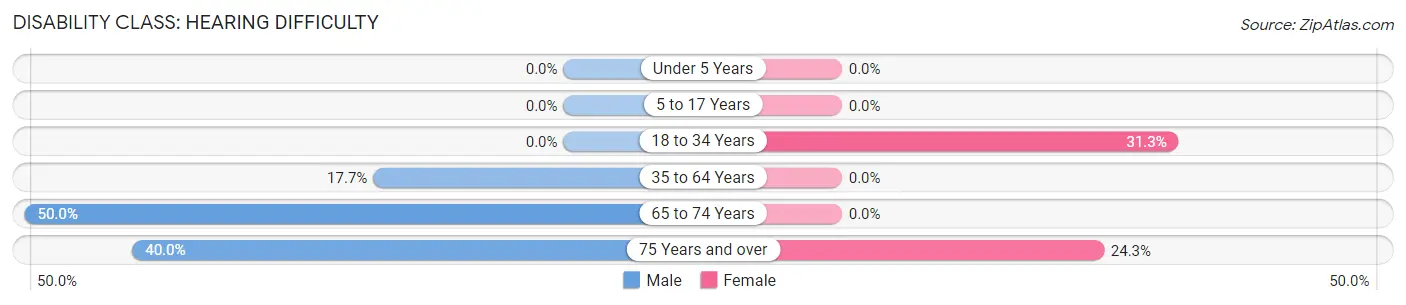
| Age Bracket | Male | Female |
| Under 5 Years | 0 (0.0%) | 0 (0.0%) |
| 5 to 17 Years | 0 (0.0%) | 0 (0.0%) |
| 18 to 34 Years | 0 (0.0%) | 5 (31.2%) |
| 35 to 64 Years | 6 (17.6%) | 0 (0.0%) |
| 65 to 74 Years | 8 (50.0%) | 0 (0.0%) |
| 75 Years and over | 10 (40.0%) | 9 (24.3%) |
Disability Class: Vision Difficulty
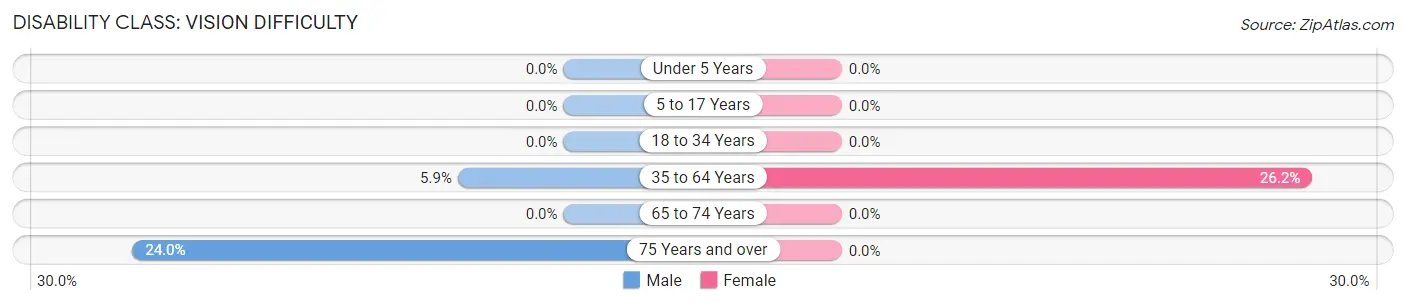
| Age Bracket | Male | Female |
| Under 5 Years | 0 (0.0%) | 0 (0.0%) |
| 5 to 17 Years | 0 (0.0%) | 0 (0.0%) |
| 18 to 34 Years | 0 (0.0%) | 0 (0.0%) |
| 35 to 64 Years | 2 (5.9%) | 11 (26.2%) |
| 65 to 74 Years | 0 (0.0%) | 0 (0.0%) |
| 75 Years and over | 6 (24.0%) | 0 (0.0%) |
Disability Class: Cognitive Difficulty
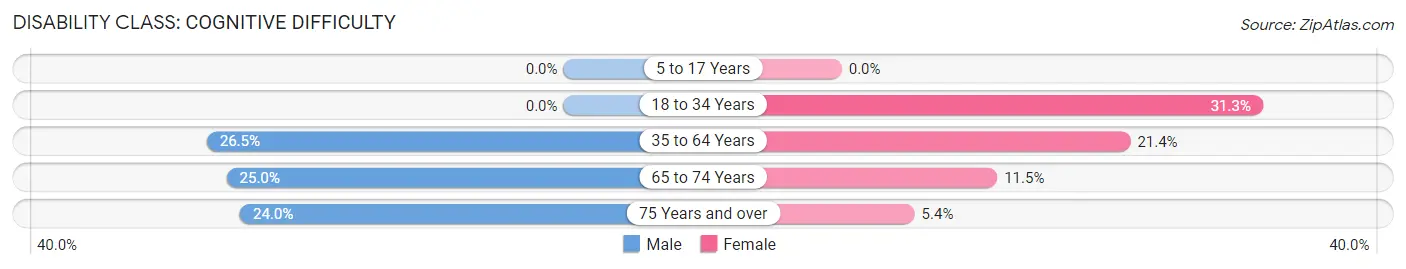
| Age Bracket | Male | Female |
| 5 to 17 Years | 0 (0.0%) | 0 (0.0%) |
| 18 to 34 Years | 0 (0.0%) | 5 (31.2%) |
| 35 to 64 Years | 9 (26.5%) | 9 (21.4%) |
| 65 to 74 Years | 4 (25.0%) | 3 (11.5%) |
| 75 Years and over | 6 (24.0%) | 2 (5.4%) |
Disability Class: Ambulatory Difficulty
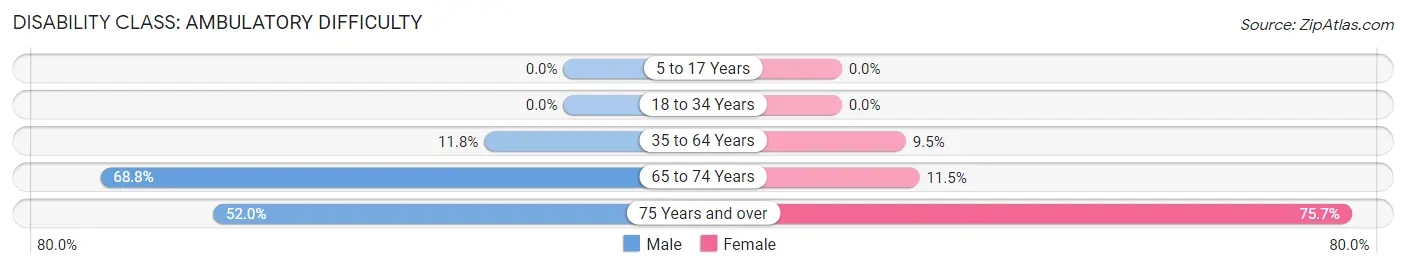
| Age Bracket | Male | Female |
| 5 to 17 Years | 0 (0.0%) | 0 (0.0%) |
| 18 to 34 Years | 0 (0.0%) | 0 (0.0%) |
| 35 to 64 Years | 4 (11.8%) | 4 (9.5%) |
| 65 to 74 Years | 11 (68.8%) | 3 (11.5%) |
| 75 Years and over | 13 (52.0%) | 28 (75.7%) |
Disability Class: Self-Care Difficulty
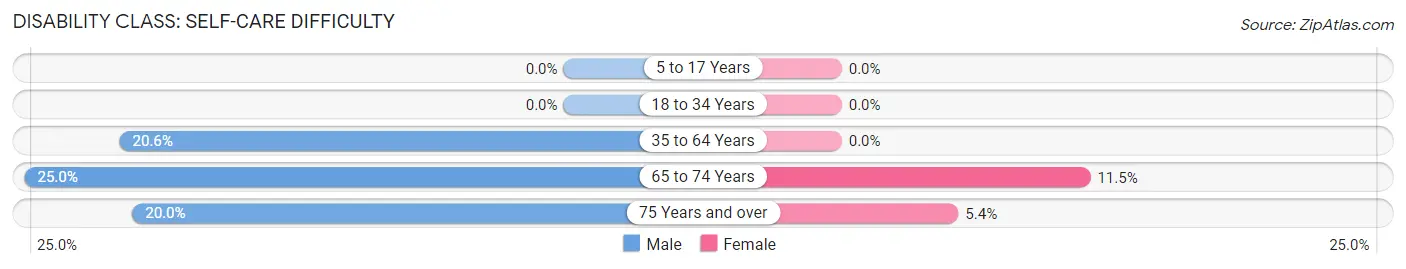
| Age Bracket | Male | Female |
| 5 to 17 Years | 0 (0.0%) | 0 (0.0%) |
| 18 to 34 Years | 0 (0.0%) | 0 (0.0%) |
| 35 to 64 Years | 7 (20.6%) | 0 (0.0%) |
| 65 to 74 Years | 4 (25.0%) | 3 (11.5%) |
| 75 Years and over | 5 (20.0%) | 2 (5.4%) |
Technology Access in Bigfork
Computing Device Access in Bigfork
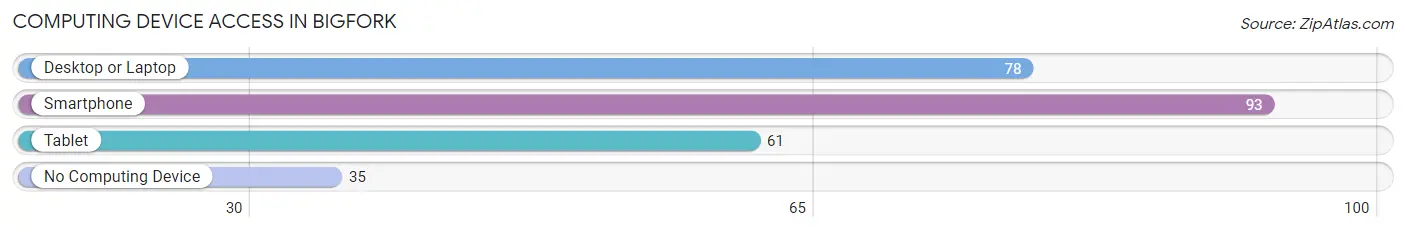
| Device Type | # Households | % Households |
| Desktop or Laptop | 78 | 53.8% |
| Smartphone | 93 | 64.1% |
| Tablet | 61 | 42.1% |
| No Computing Device | 35 | 24.1% |
| Total | 145 | 100.0% |
Internet Access in Bigfork
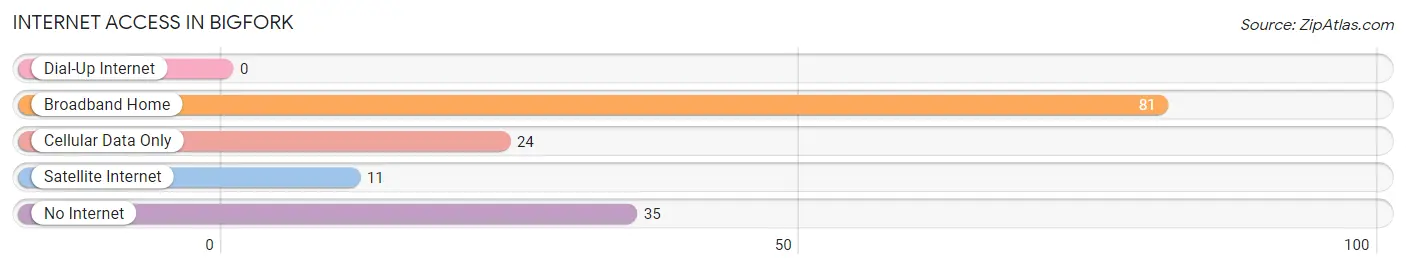
| Internet Type | # Households | % Households |
| Dial-Up Internet | 0 | 0.0% |
| Broadband Home | 81 | 55.9% |
| Cellular Data Only | 24 | 16.6% |
| Satellite Internet | 11 | 7.6% |
| No Internet | 35 | 24.1% |
| Total | 145 | 100.0% |
Bigfork Summary
Bigfork, Minnesota is a small town located in Itasca County, in the northern part of the state. It is situated on the western shore of Bigfork Lake, and is part of the Grand Rapids-Bigfork metropolitan area. The town has a population of just over 1,000 people, and is known for its small-town charm and outdoor recreation opportunities.
History
Bigfork was first settled in the late 1800s by a group of Finnish immigrants. The town was originally known as “Finn Town”, and the settlers built a sawmill and a grist mill on the banks of the Bigfork River. The town was officially incorporated in 1906, and the name was changed to Bigfork.
The town grew slowly over the years, and by the 1950s it had become a popular tourist destination. The town was known for its fishing, hunting, and outdoor recreation opportunities. In the 1960s, the town began to attract more permanent residents, and the population began to grow.
Geography
Bigfork is located in northern Minnesota, in Itasca County. It is situated on the western shore of Bigfork Lake, and is part of the Grand Rapids-Bigfork metropolitan area. The town is surrounded by forests and lakes, and is known for its outdoor recreation opportunities. The town is located about 30 miles north of Grand Rapids, and about 90 miles north of Minneapolis.
The town has a total area of 1.2 square miles, all of which is land. The town is located at an elevation of 1,072 feet above sea level. The climate in Bigfork is humid continental, with cold winters and warm summers.
Economy
The economy of Bigfork is largely based on tourism and outdoor recreation. The town is known for its fishing, hunting, and other outdoor activities. The town also has a number of small businesses, including restaurants, shops, and lodging.
The town is also home to a number of manufacturing companies, including a paper mill and a wood products plant. The town is also home to a number of logging companies, which provide jobs for many of the town’s residents.
Demographics
As of the 2010 census, the population of Bigfork was 1,072. The racial makeup of the town was 97.2% White, 0.7% Native American, 0.2% Asian, 0.1% from other races, and 1.8% from two or more races. Hispanic or Latino of any race were 0.7% of the population.
The median income for a household in the town was $37,500, and the median income for a family was $45,000. The per capita income for the town was $19,000. About 11.2% of the population was below the poverty line.
Bigfork is a small town with a rich history and a strong sense of community. The town is known for its outdoor recreation opportunities, and is a popular destination for tourists and outdoor enthusiasts. The town has a diverse economy, and is home to a number of small businesses and manufacturing companies. The town has a population of just over 1,000 people, and is a great place to live and work.
Common Questions
What is Per Capita Income in Bigfork?
Per Capita income in Bigfork is $28,997.
What is the Median Family Income in Bigfork?
Median Family Income in Bigfork is $60,833.
What is the Median Household income in Bigfork?
Median Household Income in Bigfork is $33,750.
What is Income or Wage Gap in Bigfork?
Income or Wage Gap in Bigfork is 34.2%.
Women in Bigfork earn 65.8 cents for every dollar earned by a man.
What is Inequality or Gini Index in Bigfork?
Inequality or Gini Index in Bigfork is 0.54.
What is the Total Population of Bigfork?
Total Population of Bigfork is 353.
What is the Total Male Population of Bigfork?
Total Male Population of Bigfork is 147.
What is the Total Female Population of Bigfork?
Total Female Population of Bigfork is 206.
What is the Ratio of Males per 100 Females in Bigfork?
There are 71.36 Males per 100 Females in Bigfork.
What is the Ratio of Females per 100 Males in Bigfork?
There are 140.14 Females per 100 Males in Bigfork.
What is the Median Population Age in Bigfork?
Median Population Age in Bigfork is 66.3 Years.
What is the Average Family Size in Bigfork
Average Family Size in Bigfork is 2.9 People.
What is the Average Household Size in Bigfork
Average Household Size in Bigfork is 1.7 People.
How Large is the Labor Force in Bigfork?
There are 91 People in the Labor Forcein in Bigfork.
What is the Percentage of People in the Labor Force in Bigfork?
29.4% of People are in the Labor Force in Bigfork.