Barrett, MN Map & Demographics
Barrett Map
Barrett Overview
$29,436
PER CAPITA INCOME
$80,625
AVG FAMILY INCOME
$50,833
AVG HOUSEHOLD INCOME
39.6%
WAGE / INCOME GAP [ % ]
60.4¢/ $1
WAGE / INCOME GAP [ $ ]
0.44
INEQUALITY / GINI INDEX
352
TOTAL POPULATION
188
MALE POPULATION
164
FEMALE POPULATION
114.63
MALES / 100 FEMALES
87.23
FEMALES / 100 MALES
49.5
MEDIAN AGE
2.5
AVG FAMILY SIZE
1.9
AVG HOUSEHOLD SIZE
168
LABOR FORCE [ PEOPLE ]
55.3%
PERCENT IN LABOR FORCE
3.6%
UNEMPLOYMENT RATE
Barrett Zip Codes
Income in Barrett
Income Overview in Barrett
Per Capita Income in Barrett is $29,436, while median incomes of families and households are $80,625 and $50,833 respectively.
| Characteristic | Number | Measure |
| Per Capita Income | 352 | $29,436 |
| Median Family Income | 85 | $80,625 |
| Mean Family Income | 85 | $83,135 |
| Median Household Income | 160 | $50,833 |
| Mean Household Income | 160 | $60,531 |
| Income Deficit | 85 | $0 |
| Wage / Income Gap (%) | 352 | 39.60% |
| Wage / Income Gap ($) | 352 | 60.40¢ per $1 |
| Gini / Inequality Index | 352 | 0.44 |
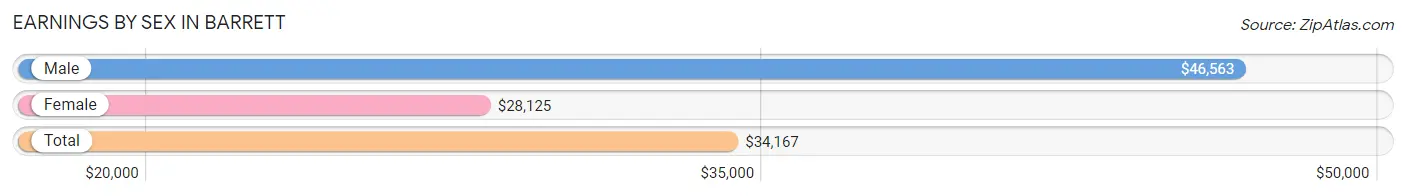
Earnings by Sex in Barrett
Average Earnings in Barrett are $34,167, $46,563 for men and $28,125 for women, a difference of 39.6%.
| Sex | Number | Average Earnings |
| Male | 104 (54.7%) | $46,563 |
| Female | 86 (45.3%) | $28,125 |
| Total | 190 (100.0%) | $34,167 |
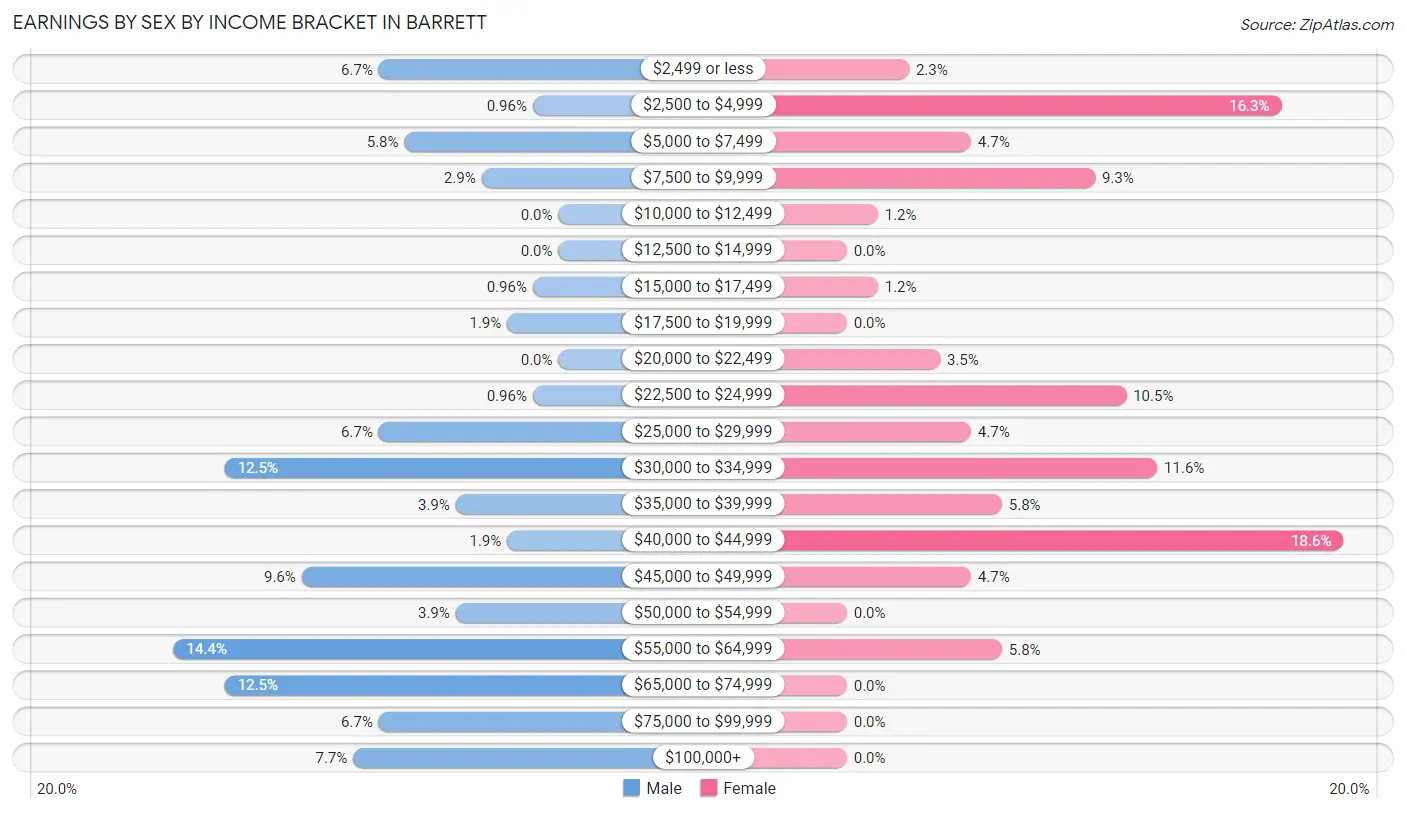
Earnings by Sex by Income Bracket in Barrett
The most common earnings brackets in Barrett are $55,000 to $64,999 for men (15 | 14.4%) and $40,000 to $44,999 for women (16 | 18.6%).
| Income | Male | Female |
| $2,499 or less | 7 (6.7%) | 2 (2.3%) |
| $2,500 to $4,999 | 1 (1.0%) | 14 (16.3%) |
| $5,000 to $7,499 | 6 (5.8%) | 4 (4.6%) |
| $7,500 to $9,999 | 3 (2.9%) | 8 (9.3%) |
| $10,000 to $12,499 | 0 (0.0%) | 1 (1.2%) |
| $12,500 to $14,999 | 0 (0.0%) | 0 (0.0%) |
| $15,000 to $17,499 | 1 (1.0%) | 1 (1.2%) |
| $17,500 to $19,999 | 2 (1.9%) | 0 (0.0%) |
| $20,000 to $22,499 | 0 (0.0%) | 3 (3.5%) |
| $22,500 to $24,999 | 1 (1.0%) | 9 (10.5%) |
| $25,000 to $29,999 | 7 (6.7%) | 4 (4.6%) |
| $30,000 to $34,999 | 13 (12.5%) | 10 (11.6%) |
| $35,000 to $39,999 | 4 (3.8%) | 5 (5.8%) |
| $40,000 to $44,999 | 2 (1.9%) | 16 (18.6%) |
| $45,000 to $49,999 | 10 (9.6%) | 4 (4.6%) |
| $50,000 to $54,999 | 4 (3.8%) | 0 (0.0%) |
| $55,000 to $64,999 | 15 (14.4%) | 5 (5.8%) |
| $65,000 to $74,999 | 13 (12.5%) | 0 (0.0%) |
| $75,000 to $99,999 | 7 (6.7%) | 0 (0.0%) |
| $100,000+ | 8 (7.7%) | 0 (0.0%) |
| Total | 104 (100.0%) | 86 (100.0%) |
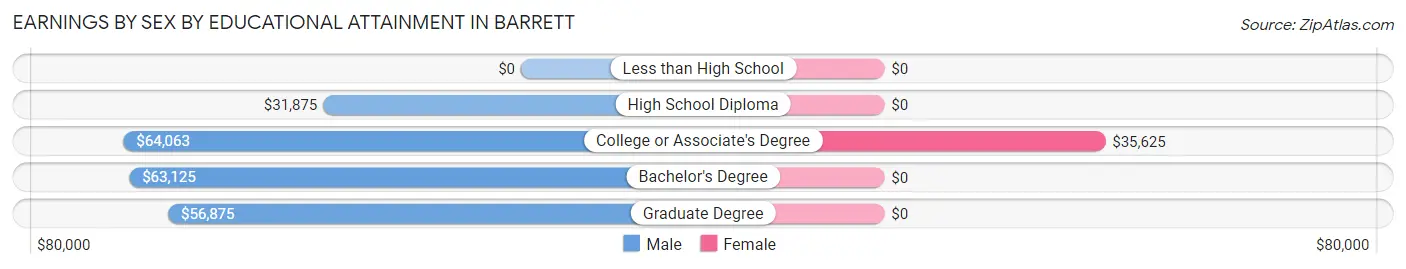
Earnings by Sex by Educational Attainment in Barrett
Average earnings in Barrett are $53,125 for men and $30,938 for women, a difference of 41.8%. Men with an educational attainment of college or associate's degree enjoy the highest average annual earnings of $64,063, while those with high school diploma education earn the least with $31,875. Women with an educational attainment of college or associate's degree earn the most with the average annual earnings of $35,625, while those with college or associate's degree education have the smallest earnings of $35,625.
| Educational Attainment | Male Income | Female Income |
| Less than High School | - | - |
| High School Diploma | $31,875 | $0 |
| College or Associate's Degree | $64,063 | $35,625 |
| Bachelor's Degree | $63,125 | $0 |
| Graduate Degree | $56,875 | $0 |
| Total | $53,125 | $30,938 |
Family Income in Barrett
Family Income Brackets in Barrett
According to the Barrett family income data, there are 23 families falling into the $100,000 to $149,999 income range, which is the most common income bracket and makes up 27.1% of all families.
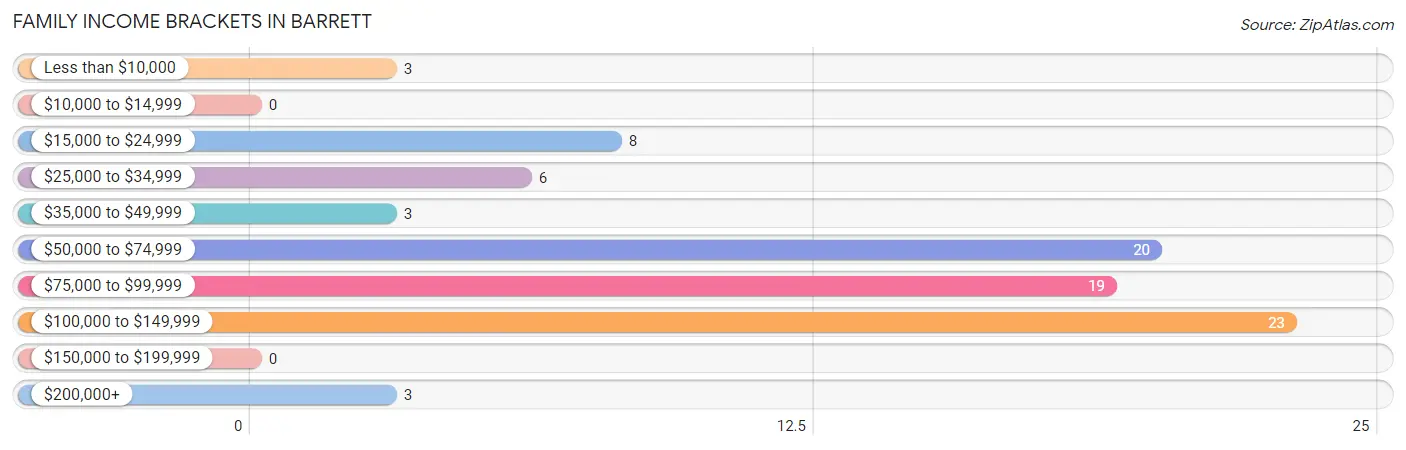
| Income Bracket | # Families | % Families |
| Less than $10,000 | 3 | 3.5% |
| $10,000 to $14,999 | 0 | 0.0% |
| $15,000 to $24,999 | 8 | 9.4% |
| $25,000 to $34,999 | 6 | 7.1% |
| $35,000 to $49,999 | 3 | 3.5% |
| $50,000 to $74,999 | 20 | 23.5% |
| $75,000 to $99,999 | 19 | 22.4% |
| $100,000 to $149,999 | 23 | 27.1% |
| $150,000 to $199,999 | 0 | 0.0% |
| $200,000+ | 3 | 3.5% |
Family Income by Famaliy Size in Barrett
3-person families (22 | 25.9%) account for the highest median family income in Barrett with $99,167 per family, while 2-person families (48 | 56.5%) have the highest median income of $36,875 per family member.
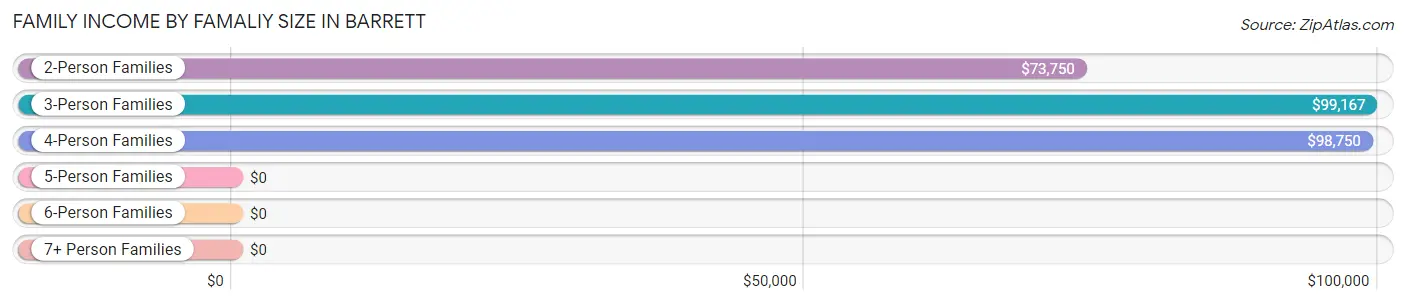
| Income Bracket | # Families | Median Income |
| 2-Person Families | 48 (56.5%) | $73,750 |
| 3-Person Families | 22 (25.9%) | $99,167 |
| 4-Person Families | 13 (15.3%) | $98,750 |
| 5-Person Families | 2 (2.4%) | $0 |
| 6-Person Families | 0 (0.0%) | $0 |
| 7+ Person Families | 0 (0.0%) | $0 |
| Total | 85 (100.0%) | $80,625 |
Family Income by Number of Earners in Barrett
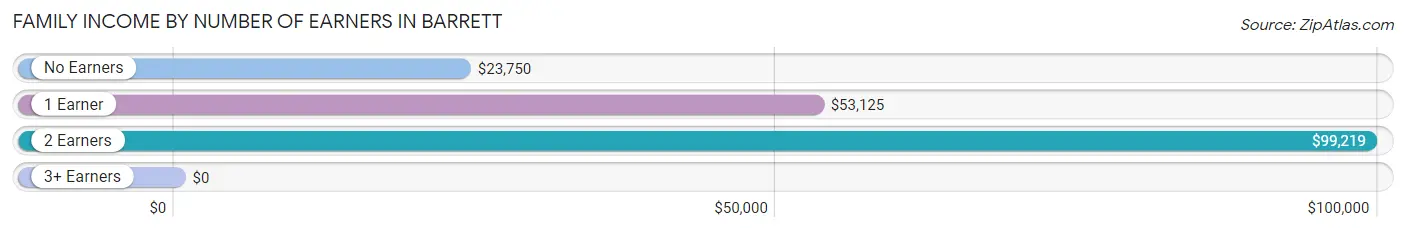
| Number of Earners | # Families | Median Income |
| No Earners | 8 (9.4%) | $23,750 |
| 1 Earner | 25 (29.4%) | $53,125 |
| 2 Earners | 49 (57.7%) | $99,219 |
| 3+ Earners | 3 (3.5%) | $0 |
| Total | 85 (100.0%) | $80,625 |
Household Income in Barrett
Household Income Brackets in Barrett
With 29 households falling in the category, the $75,000 to $99,999 income range is the most frequent in Barrett, accounting for 18.1% of all households.
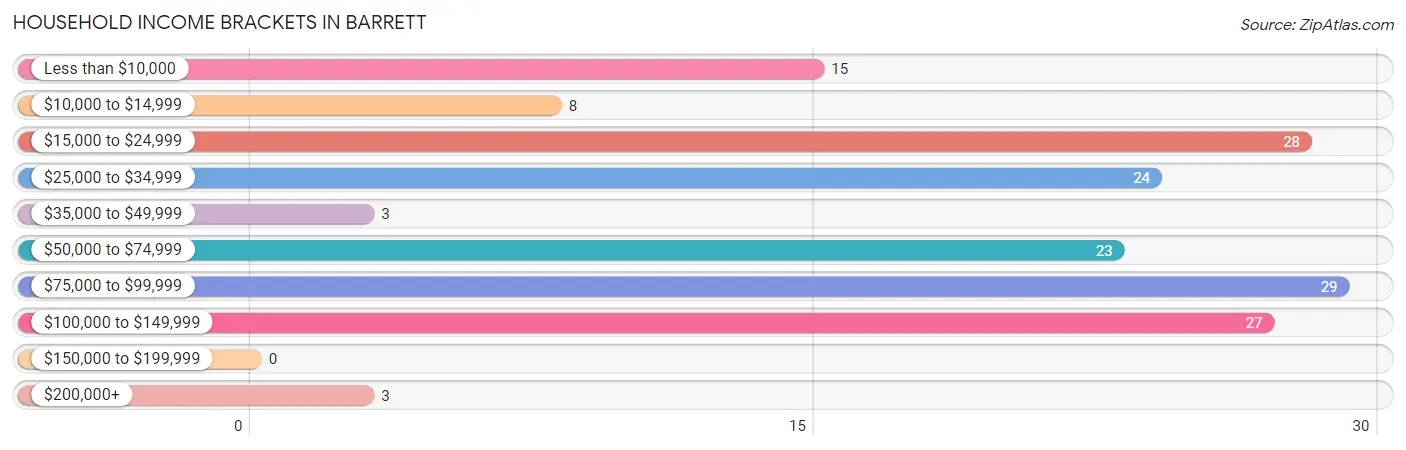
| Income Bracket | # Households | % Households |
| Less than $10,000 | 15 | 9.4% |
| $10,000 to $14,999 | 8 | 5.0% |
| $15,000 to $24,999 | 28 | 17.5% |
| $25,000 to $34,999 | 24 | 15.0% |
| $35,000 to $49,999 | 3 | 1.9% |
| $50,000 to $74,999 | 23 | 14.4% |
| $75,000 to $99,999 | 29 | 18.1% |
| $100,000 to $149,999 | 27 | 16.9% |
| $150,000 to $199,999 | 0 | 0.0% |
| $200,000+ | 3 | 1.9% |
Household Income by Householder Age in Barrett
The median household income in Barrett is $50,833, with the highest median household income of $83,438 found in the 25 to 44 years age bracket for the primary householder. A total of 29 households (18.1%) fall into this category. Meanwhile, the 15 to 24 years age bracket for the primary householder has the lowest median household income of $0, with 10 households (6.2%) in this group.
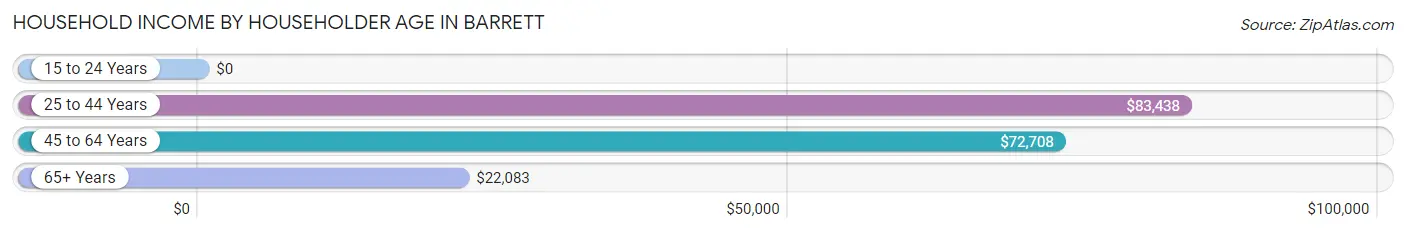
| Income Bracket | # Households | Median Income |
| 15 to 24 Years | 10 (6.2%) | $0 |
| 25 to 44 Years | 29 (18.1%) | $83,438 |
| 45 to 64 Years | 73 (45.6%) | $72,708 |
| 65+ Years | 48 (30.0%) | $22,083 |
| Total | 160 (100.0%) | $50,833 |
Poverty in Barrett
Income Below Poverty by Sex and Age in Barrett
With 7.1% poverty level for males and 23.2% for females among the residents of Barrett, 55 to 64 year old males and 18 to 24 year old females are the most vulnerable to poverty, with 8 males (25.8%) and 7 females (70.0%) in their respective age groups living below the poverty level.
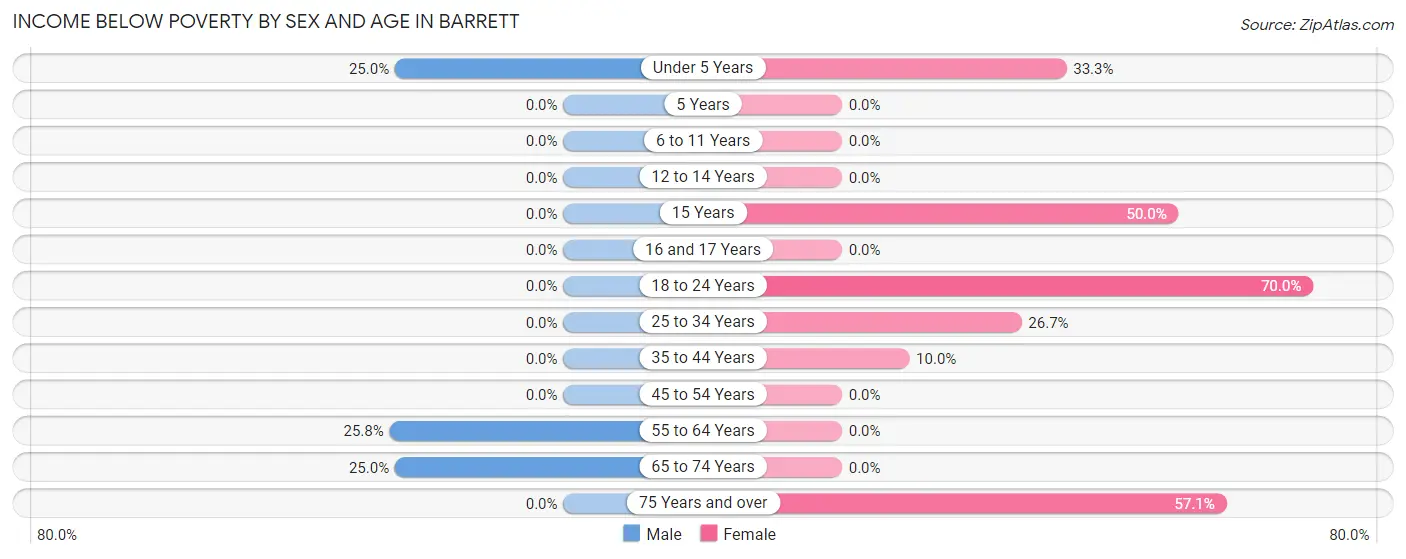
| Age Bracket | Male | Female |
| Under 5 Years | 2 (25.0%) | 2 (33.3%) |
| 5 Years | 0 (0.0%) | 0 (0.0%) |
| 6 to 11 Years | 0 (0.0%) | 0 (0.0%) |
| 12 to 14 Years | 0 (0.0%) | 0 (0.0%) |
| 15 Years | 0 (0.0%) | 2 (50.0%) |
| 16 and 17 Years | 0 (0.0%) | 0 (0.0%) |
| 18 to 24 Years | 0 (0.0%) | 7 (70.0%) |
| 25 to 34 Years | 0 (0.0%) | 4 (26.7%) |
| 35 to 44 Years | 0 (0.0%) | 1 (10.0%) |
| 45 to 54 Years | 0 (0.0%) | 0 (0.0%) |
| 55 to 64 Years | 8 (25.8%) | 0 (0.0%) |
| 65 to 74 Years | 2 (25.0%) | 0 (0.0%) |
| 75 Years and over | 0 (0.0%) | 16 (57.1%) |
| Total | 12 (7.1%) | 32 (23.2%) |
Income Above Poverty by Sex and Age in Barrett
According to the poverty statistics in Barrett, males aged 5 years and females aged 5 years are the age groups that are most secure financially, with 100.0% of males and 100.0% of females in these age groups living above the poverty line.
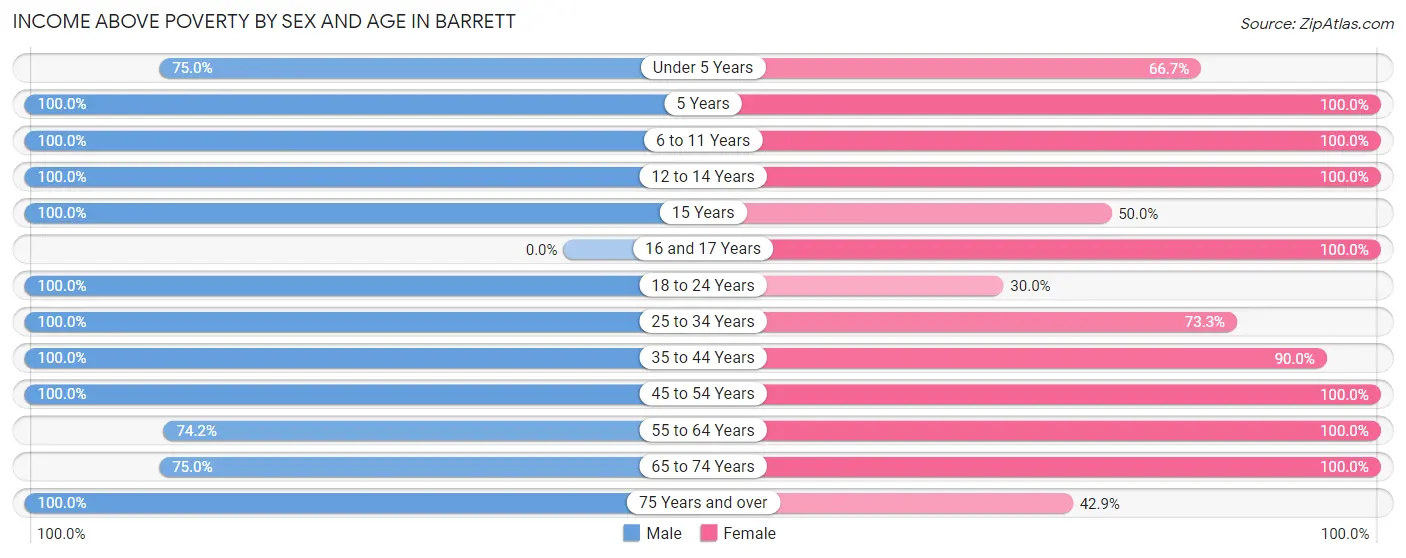
| Age Bracket | Male | Female |
| Under 5 Years | 6 (75.0%) | 4 (66.7%) |
| 5 Years | 6 (100.0%) | 3 (100.0%) |
| 6 to 11 Years | 8 (100.0%) | 2 (100.0%) |
| 12 to 14 Years | 2 (100.0%) | 5 (100.0%) |
| 15 Years | 2 (100.0%) | 2 (50.0%) |
| 16 and 17 Years | 0 (0.0%) | 1 (100.0%) |
| 18 to 24 Years | 21 (100.0%) | 3 (30.0%) |
| 25 to 34 Years | 18 (100.0%) | 11 (73.3%) |
| 35 to 44 Years | 23 (100.0%) | 9 (90.0%) |
| 45 to 54 Years | 23 (100.0%) | 29 (100.0%) |
| 55 to 64 Years | 23 (74.2%) | 14 (100.0%) |
| 65 to 74 Years | 6 (75.0%) | 11 (100.0%) |
| 75 Years and over | 18 (100.0%) | 12 (42.9%) |
| Total | 156 (92.9%) | 106 (76.8%) |
Income Below Poverty Among Married-Couple Families in Barrett
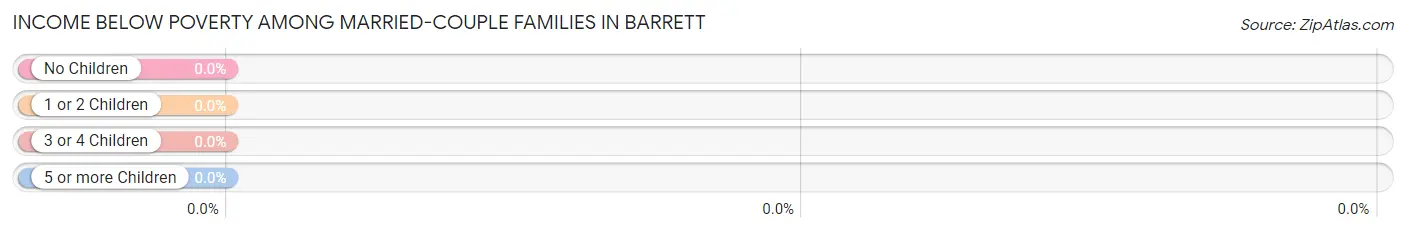
| Children | Above Poverty | Below Poverty |
| No Children | 28 (100.0%) | 0 (0.0%) |
| 1 or 2 Children | 21 (100.0%) | 0 (0.0%) |
| 3 or 4 Children | 2 (100.0%) | 0 (0.0%) |
| 5 or more Children | 0 (0.0%) | 0 (0.0%) |
| Total | 51 (100.0%) | 0 (0.0%) |
Income Below Poverty Among Single-Parent Households in Barrett
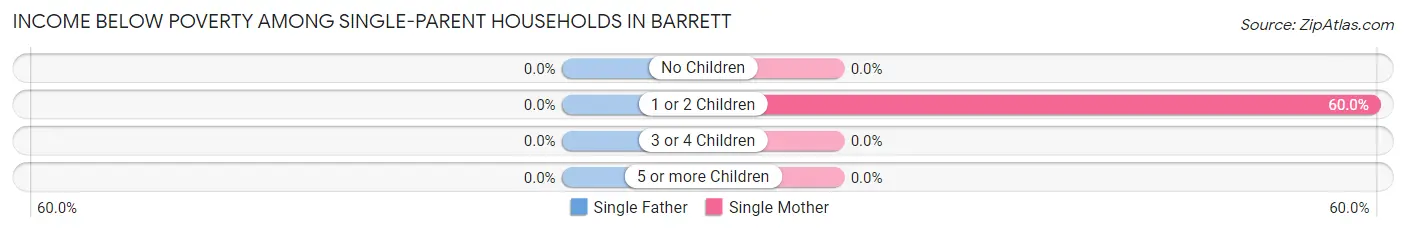
| Children | Single Father | Single Mother |
| No Children | 0 (0.0%) | 0 (0.0%) |
| 1 or 2 Children | 0 (0.0%) | 3 (60.0%) |
| 3 or 4 Children | 0 (0.0%) | 0 (0.0%) |
| 5 or more Children | 0 (0.0%) | 0 (0.0%) |
| Total | 0 (0.0%) | 3 (20.0%) |
Income Below Poverty Among Married-Couple vs Single-Parent Households in Barrett
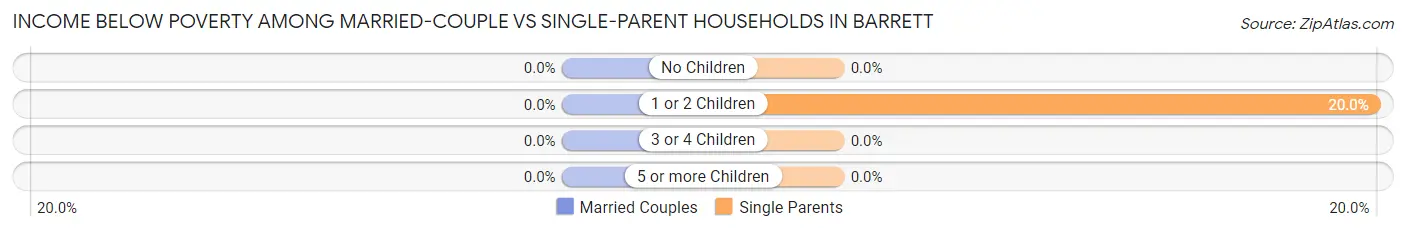
| Children | Married-Couple Families | Single-Parent Households |
| No Children | 0 (0.0%) | 0 (0.0%) |
| 1 or 2 Children | 0 (0.0%) | 3 (20.0%) |
| 3 or 4 Children | 0 (0.0%) | 0 (0.0%) |
| 5 or more Children | 0 (0.0%) | 0 (0.0%) |
| Total | 0 (0.0%) | 3 (8.8%) |
Race in Barrett
The most populous races in Barrett are White / Caucasian (344 | 97.7%), Hispanic or Latino (8 | 2.3%), and Two or more Races (6 | 1.7%).
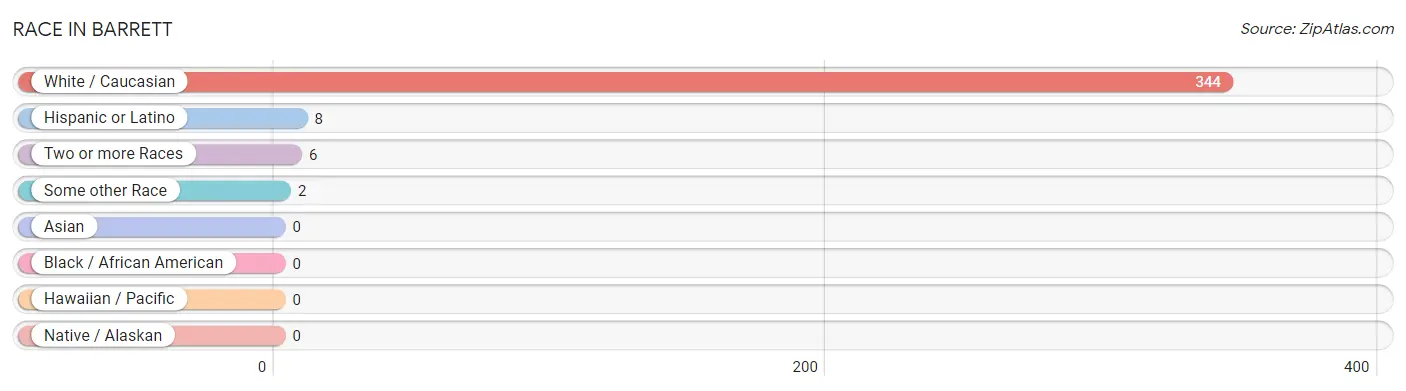
| Race | # Population | % Population |
| Asian | 0 | 0.0% |
| Black / African American | 0 | 0.0% |
| Hawaiian / Pacific | 0 | 0.0% |
| Hispanic or Latino | 8 | 2.3% |
| Native / Alaskan | 0 | 0.0% |
| White / Caucasian | 344 | 97.7% |
| Two or more Races | 6 | 1.7% |
| Some other Race | 2 | 0.6% |
| Total | 352 | 100.0% |
Ancestry in Barrett
The most populous ancestries reported in Barrett are German (131 | 37.2%), Norwegian (97 | 27.6%), Swedish (47 | 13.4%), Scandinavian (30 | 8.5%), and Irish (21 | 6.0%), together accounting for 92.6% of all Barrett residents.
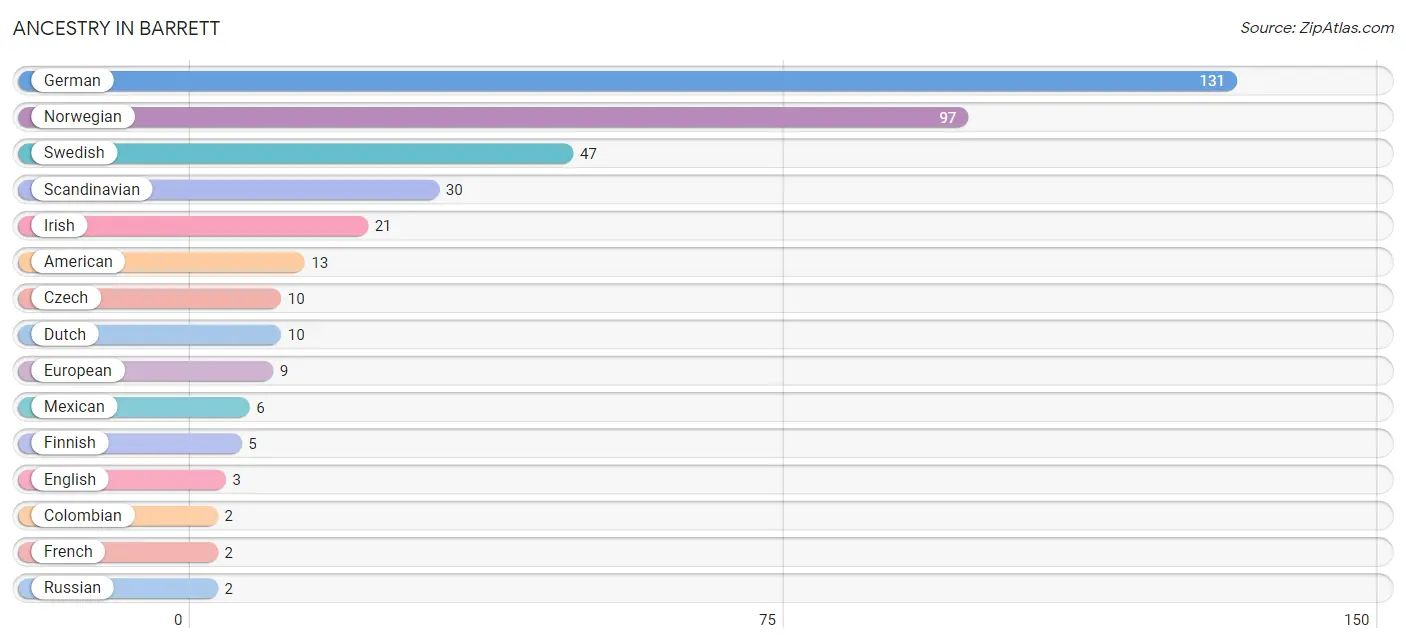
| Ancestry | # Population | % Population |
| American | 13 | 3.7% |
| Colombian | 2 | 0.6% |
| Czech | 10 | 2.8% |
| Dutch | 10 | 2.8% |
| English | 3 | 0.9% |
| European | 9 | 2.6% |
| Finnish | 5 | 1.4% |
| French | 2 | 0.6% |
| French Canadian | 1 | 0.3% |
| German | 131 | 37.2% |
| Irish | 21 | 6.0% |
| Mexican | 6 | 1.7% |
| Norwegian | 97 | 27.6% |
| Polish | 1 | 0.3% |
| Russian | 2 | 0.6% |
| Scandinavian | 30 | 8.5% |
| Scotch-Irish | 2 | 0.6% |
| Scottish | 2 | 0.6% |
| South American | 2 | 0.6% |
| Swedish | 47 | 13.4% | View All 20 Rows |
Immigrants in Barrett

| Immigration Origin | # Population | % Population | View All 0 Rows |
Sex and Age in Barrett
Sex and Age in Barrett
The most populous age groups in Barrett are 55 to 59 Years (24 | 12.8%) for men and 85 Years and over (37 | 22.6%) for women.
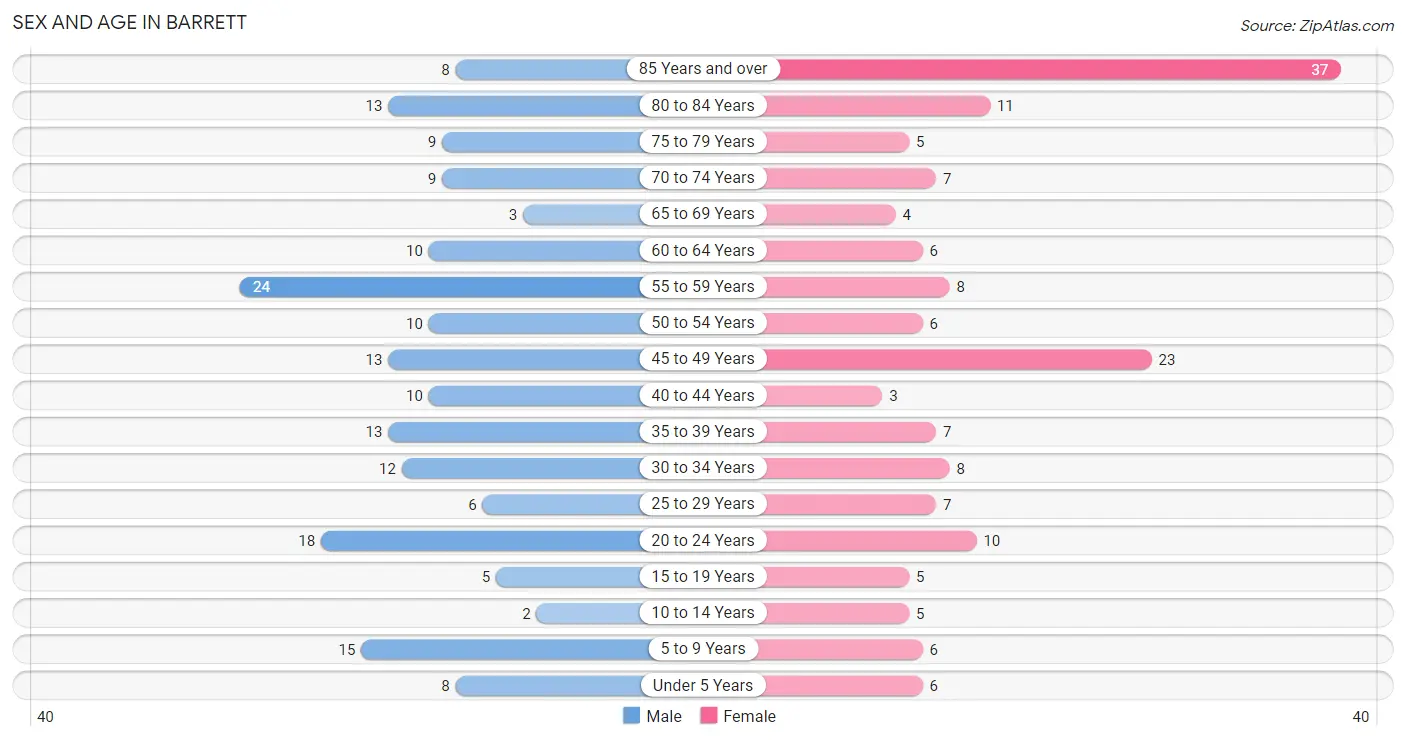
| Age Bracket | Male | Female |
| Under 5 Years | 8 (4.3%) | 6 (3.7%) |
| 5 to 9 Years | 15 (8.0%) | 6 (3.7%) |
| 10 to 14 Years | 2 (1.1%) | 5 (3.0%) |
| 15 to 19 Years | 5 (2.7%) | 5 (3.0%) |
| 20 to 24 Years | 18 (9.6%) | 10 (6.1%) |
| 25 to 29 Years | 6 (3.2%) | 7 (4.3%) |
| 30 to 34 Years | 12 (6.4%) | 8 (4.9%) |
| 35 to 39 Years | 13 (6.9%) | 7 (4.3%) |
| 40 to 44 Years | 10 (5.3%) | 3 (1.8%) |
| 45 to 49 Years | 13 (6.9%) | 23 (14.0%) |
| 50 to 54 Years | 10 (5.3%) | 6 (3.7%) |
| 55 to 59 Years | 24 (12.8%) | 8 (4.9%) |
| 60 to 64 Years | 10 (5.3%) | 6 (3.7%) |
| 65 to 69 Years | 3 (1.6%) | 4 (2.4%) |
| 70 to 74 Years | 9 (4.8%) | 7 (4.3%) |
| 75 to 79 Years | 9 (4.8%) | 5 (3.0%) |
| 80 to 84 Years | 13 (6.9%) | 11 (6.7%) |
| 85 Years and over | 8 (4.3%) | 37 (22.6%) |
| Total | 188 (100.0%) | 164 (100.0%) |
Families and Households in Barrett
Median Family Size in Barrett
The median family size in Barrett is 2.48 persons per family, with married-couple families (51 | 60.0%) accounting for the largest median family size of 2.63 persons per family. On the other hand, single male/father families (19 | 22.4%) represent the smallest median family size with 2.21 persons per family.
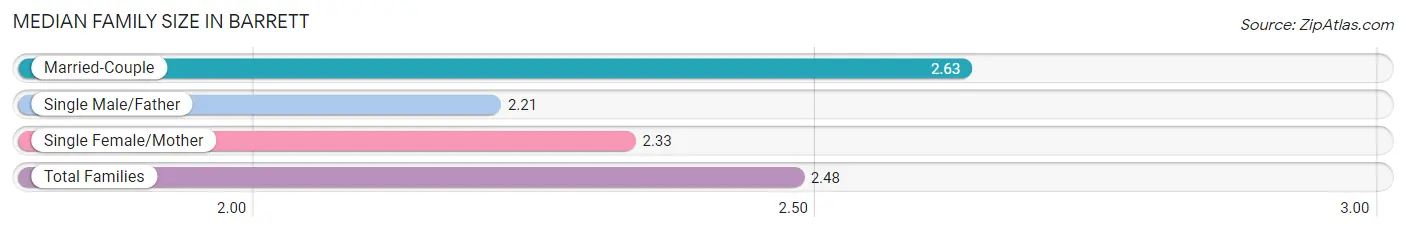
| Family Type | # Families | Family Size |
| Married-Couple | 51 (60.0%) | 2.63 |
| Single Male/Father | 19 (22.4%) | 2.21 |
| Single Female/Mother | 15 (17.6%) | 2.33 |
| Total Families | 85 (100.0%) | 2.48 |
Median Household Size in Barrett
The median household size in Barrett is 1.88 persons per household, with single male/father households (19 | 11.9%) accounting for the largest median household size of 2.74 persons per household. non-family households (75 | 46.9%) represent the smallest median household size with 1.03 persons per household.
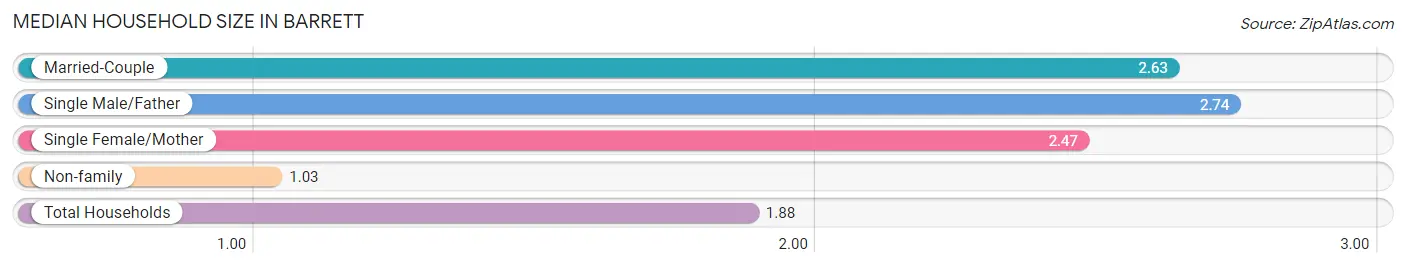
| Household Type | # Households | Household Size |
| Married-Couple | 51 (31.9%) | 2.63 |
| Single Male/Father | 19 (11.9%) | 2.74 |
| Single Female/Mother | 15 (9.4%) | 2.47 |
| Non-family | 75 (46.9%) | 1.03 |
| Total Households | 160 (100.0%) | 1.88 |
Household Size by Marriage Status in Barrett
Out of a total of 160 households in Barrett, 85 (53.1%) are family households, while 75 (46.9%) are nonfamily households. The most numerous type of family households are 2-person households, comprising 45, and the most common type of nonfamily households are 1-person households, comprising 72.
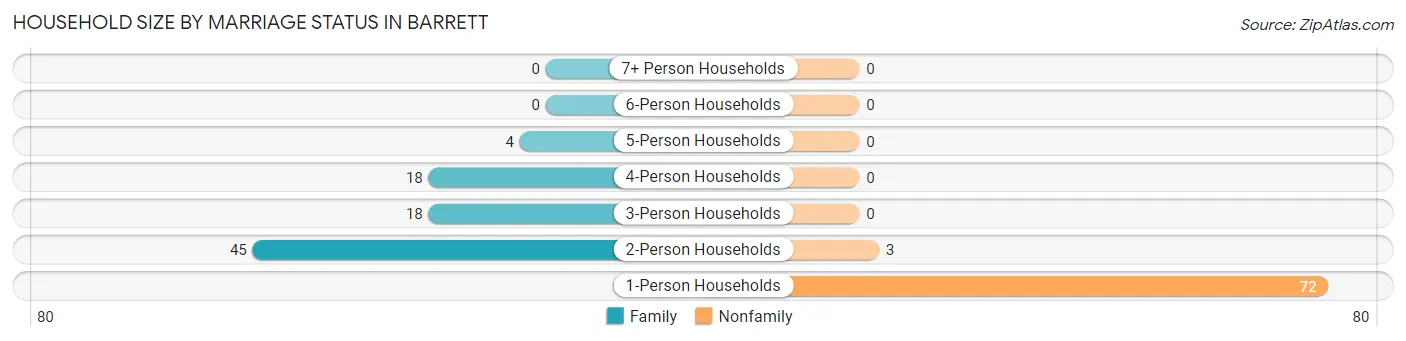
| Household Size | Family Households | Nonfamily Households |
| 1-Person Households | - | 72 (45.0%) |
| 2-Person Households | 45 (28.1%) | 3 (1.9%) |
| 3-Person Households | 18 (11.3%) | 0 (0.0%) |
| 4-Person Households | 18 (11.3%) | 0 (0.0%) |
| 5-Person Households | 4 (2.5%) | 0 (0.0%) |
| 6-Person Households | 0 (0.0%) | 0 (0.0%) |
| 7+ Person Households | 0 (0.0%) | 0 (0.0%) |
| Total | 85 (53.1%) | 75 (46.9%) |
Female Fertility in Barrett
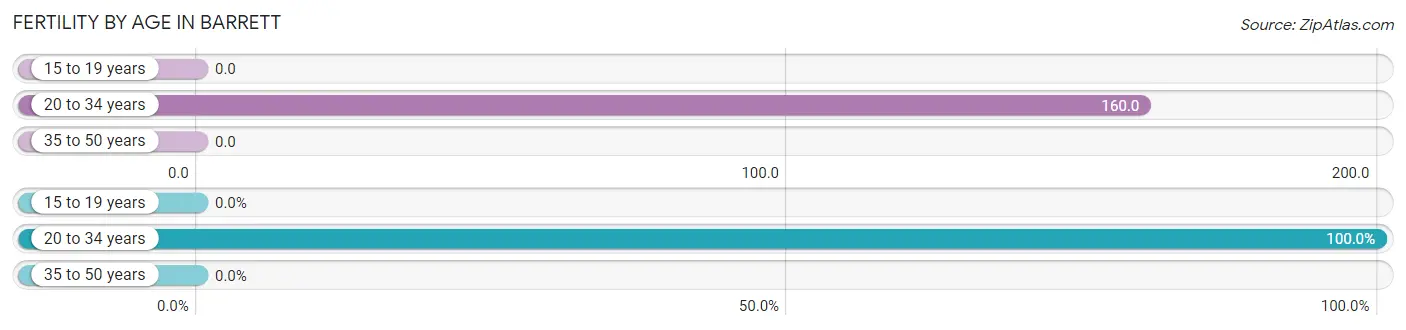
Fertility by Age in Barrett
Average fertility rate in Barrett is 63.0 births per 1,000 women. Women in the age bracket of 20 to 34 years have the highest fertility rate with 160.0 births per 1,000 women. Women in the age bracket of 20 to 34 years acount for 100.0% of all women with births.
| Age Bracket | Women with Births | Births / 1,000 Women |
| 15 to 19 years | 0 (0.0%) | 0.0 |
| 20 to 34 years | 4 (100.0%) | 160.0 |
| 35 to 50 years | 0 (0.0%) | 0.0 |
| Total | 4 (100.0%) | 63.0 |
Fertility by Age by Marriage Status in Barrett
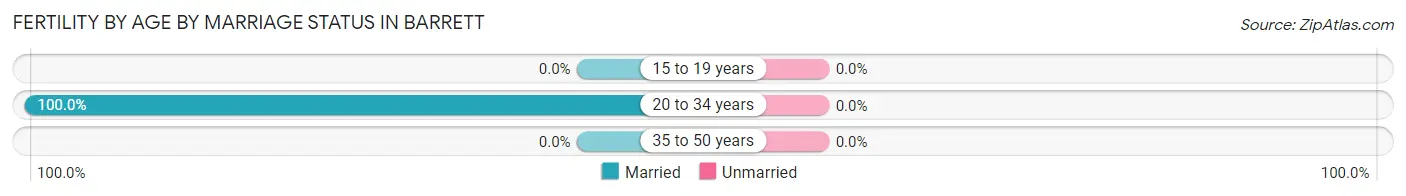
| Age Bracket | Married | Unmarried |
| 15 to 19 years | 0 (0.0%) | 0 (0.0%) |
| 20 to 34 years | 4 (100.0%) | 0 (0.0%) |
| 35 to 50 years | 0 (0.0%) | 0 (0.0%) |
| Total | 4 (100.0%) | 0 (0.0%) |
Fertility by Education in Barrett
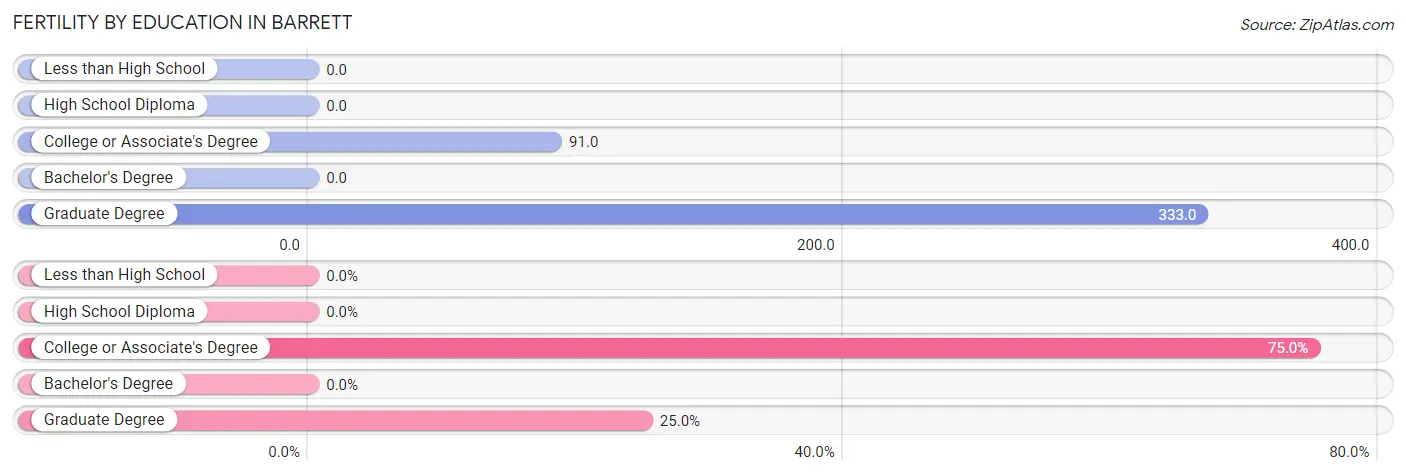
| Educational Attainment | Women with Births | Births / 1,000 Women |
| Less than High School | 0 (0.0%) | 0.0 |
| High School Diploma | 0 (0.0%) | 0.0 |
| College or Associate's Degree | 3 (75.0%) | 91.0 |
| Bachelor's Degree | 0 (0.0%) | 0.0 |
| Graduate Degree | 1 (25.0%) | 333.0 |
| Total | 4 (100.0%) | 63.0 |
Fertility by Education by Marriage Status in Barrett
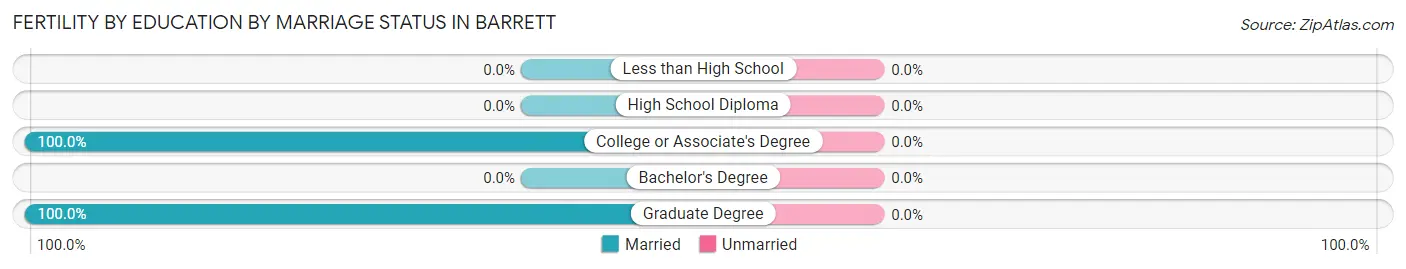
| Educational Attainment | Married | Unmarried |
| Less than High School | 0 (0.0%) | 0 (0.0%) |
| High School Diploma | 0 (0.0%) | 0 (0.0%) |
| College or Associate's Degree | 3 (100.0%) | 0 (0.0%) |
| Bachelor's Degree | 0 (0.0%) | 0 (0.0%) |
| Graduate Degree | 1 (100.0%) | 0 (0.0%) |
| Total | 4 (100.0%) | 0 (0.0%) |
Employment Characteristics in Barrett
Employment by Class of Employer in Barrett
Among the 162 employed individuals in Barrett, private company employees (108 | 66.7%), local government employees (16 | 9.9%), and state government employees (13 | 8.0%) make up the most common classes of employment.
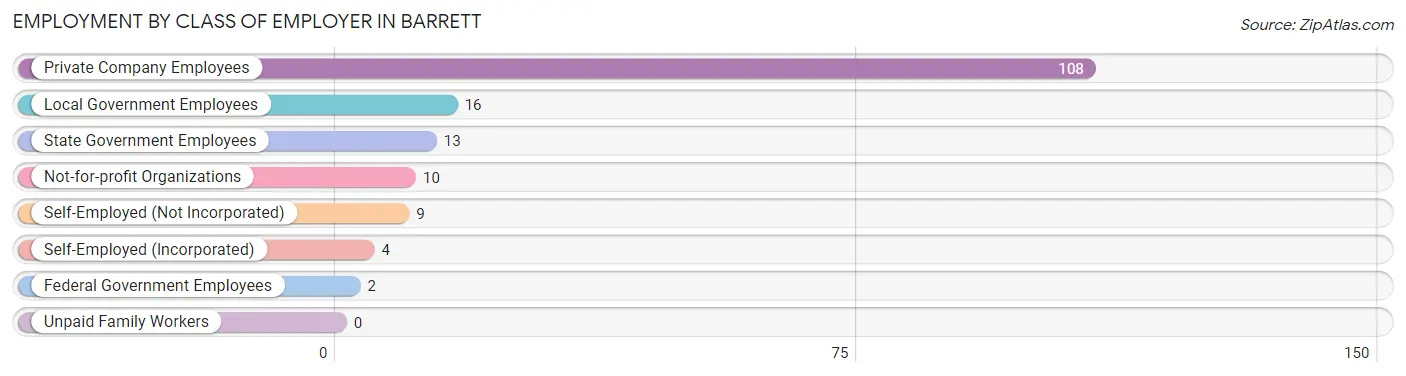
| Employer Class | # Employees | % Employees |
| Private Company Employees | 108 | 66.7% |
| Self-Employed (Incorporated) | 4 | 2.5% |
| Self-Employed (Not Incorporated) | 9 | 5.6% |
| Not-for-profit Organizations | 10 | 6.2% |
| Local Government Employees | 16 | 9.9% |
| State Government Employees | 13 | 8.0% |
| Federal Government Employees | 2 | 1.2% |
| Unpaid Family Workers | 0 | 0.0% |
| Total | 162 | 100.0% |
Employment Status by Age in Barrett
According to the labor force statistics for Barrett, out of the total population over 16 years of age (304), 55.3% or 168 individuals are in the labor force, with 3.6% or 6 of them unemployed. The age group with the highest labor force participation rate is 16 to 19 years, with 100.0% or 4 individuals in the labor force. Within the labor force, the 16 to 19 years age range has the highest percentage of unemployed individuals, with 75.0% or 3 of them being unemployed.
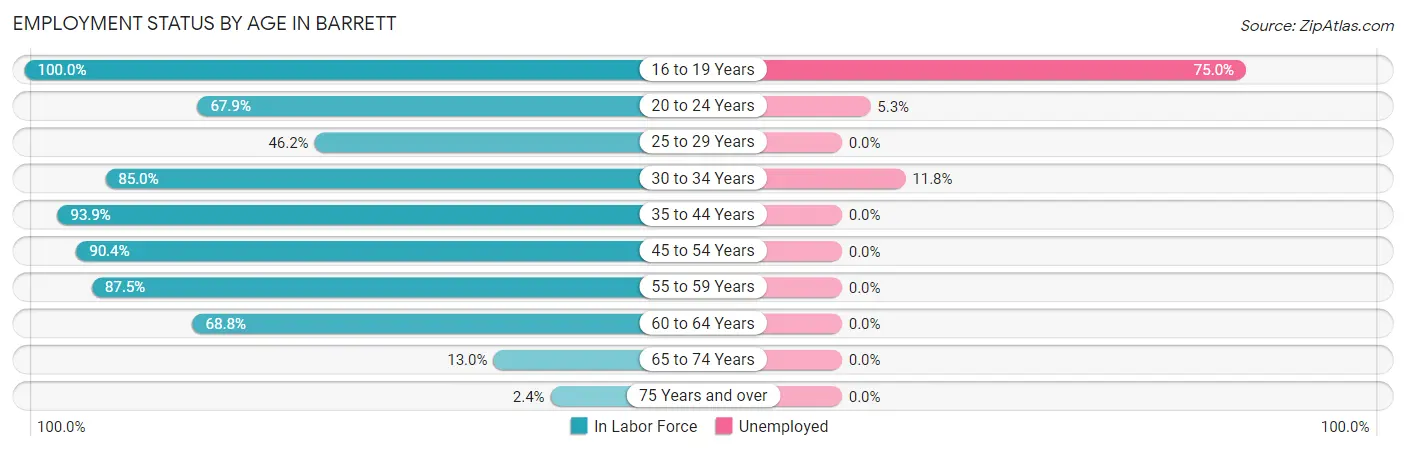
| Age Bracket | In Labor Force | Unemployed |
| 16 to 19 Years | 4 (100.0%) | 3 (75.0%) |
| 20 to 24 Years | 19 (67.9%) | 1 (5.3%) |
| 25 to 29 Years | 6 (46.2%) | 0 (0.0%) |
| 30 to 34 Years | 17 (85.0%) | 2 (11.8%) |
| 35 to 44 Years | 31 (93.9%) | 0 (0.0%) |
| 45 to 54 Years | 47 (90.4%) | 0 (0.0%) |
| 55 to 59 Years | 28 (87.5%) | 0 (0.0%) |
| 60 to 64 Years | 11 (68.8%) | 0 (0.0%) |
| 65 to 74 Years | 3 (13.0%) | 0 (0.0%) |
| 75 Years and over | 2 (2.4%) | 0 (0.0%) |
| Total | 168 (55.3%) | 6 (3.6%) |
Employment Status by Educational Attainment in Barrett
According to labor force statistics for Barrett, 84.3% of individuals (140) out of the total population between 25 and 64 years of age (166) are in the labor force, with 1.4% or 2 of them being unemployed. The group with the highest labor force participation rate are those with the educational attainment of college / associate degree, with 89.2% or 74 individuals in the labor force. Within the labor force, individuals with bachelor's degree or higher education have the highest percentage of unemployment, with 5.3% or 1 of them being unemployed.
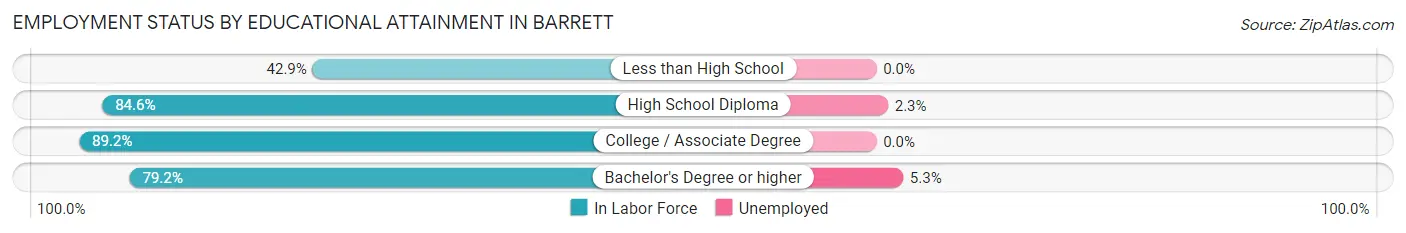
| Educational Attainment | In Labor Force | Unemployed |
| Less than High School | 3 (42.9%) | 0 (0.0%) |
| High School Diploma | 44 (84.6%) | 1 (2.3%) |
| College / Associate Degree | 74 (89.2%) | 0 (0.0%) |
| Bachelor's Degree or higher | 19 (79.2%) | 1 (5.3%) |
| Total | 140 (84.3%) | 2 (1.4%) |
Employment Occupations by Sex in Barrett
Management, Business, Science and Arts Occupations
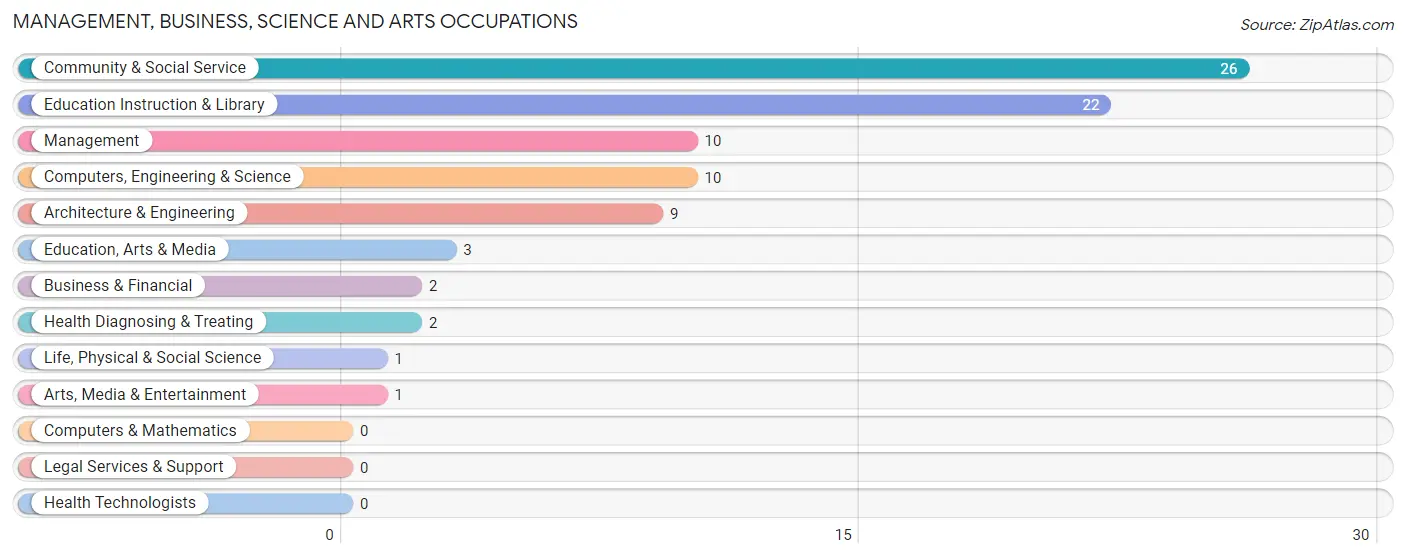
The most common Management, Business, Science and Arts occupations in Barrett are Community & Social Service (26 | 16.1%), Education Instruction & Library (22 | 13.6%), Management (10 | 6.2%), Computers, Engineering & Science (10 | 6.2%), and Architecture & Engineering (9 | 5.6%).
Management, Business, Science and Arts Occupations by Sex
Within the Management, Business, Science and Arts occupations in Barrett, the most male-oriented occupations are Business & Financial (100.0%), Computers, Engineering & Science (100.0%), and Architecture & Engineering (100.0%), while the most female-oriented occupations are Education, Arts & Media (100.0%), Arts, Media & Entertainment (100.0%), and Health Diagnosing & Treating (100.0%).
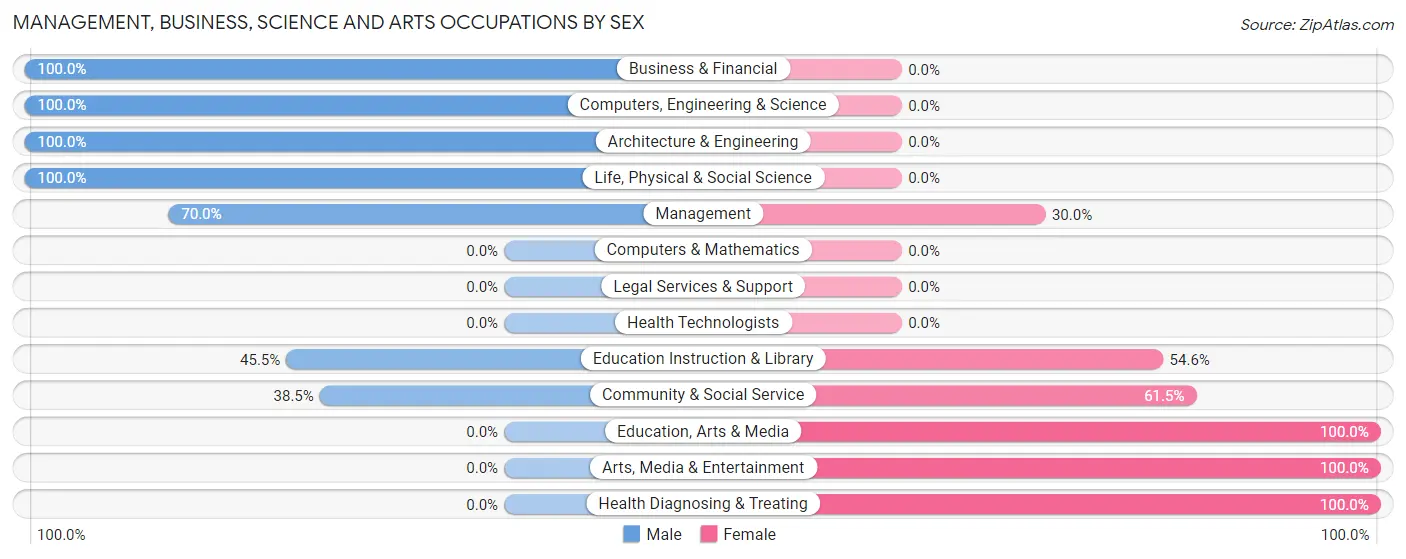
| Occupation | Male | Female |
| Management | 7 (70.0%) | 3 (30.0%) |
| Business & Financial | 2 (100.0%) | 0 (0.0%) |
| Computers, Engineering & Science | 10 (100.0%) | 0 (0.0%) |
| Computers & Mathematics | 0 (0.0%) | 0 (0.0%) |
| Architecture & Engineering | 9 (100.0%) | 0 (0.0%) |
| Life, Physical & Social Science | 1 (100.0%) | 0 (0.0%) |
| Community & Social Service | 10 (38.5%) | 16 (61.5%) |
| Education, Arts & Media | 0 (0.0%) | 3 (100.0%) |
| Legal Services & Support | 0 (0.0%) | 0 (0.0%) |
| Education Instruction & Library | 10 (45.5%) | 12 (54.5%) |
| Arts, Media & Entertainment | 0 (0.0%) | 1 (100.0%) |
| Health Diagnosing & Treating | 0 (0.0%) | 2 (100.0%) |
| Health Technologists | 0 (0.0%) | 0 (0.0%) |
| Total (Category) | 29 (58.0%) | 21 (42.0%) |
| Total (Overall) | 90 (55.6%) | 72 (44.4%) |
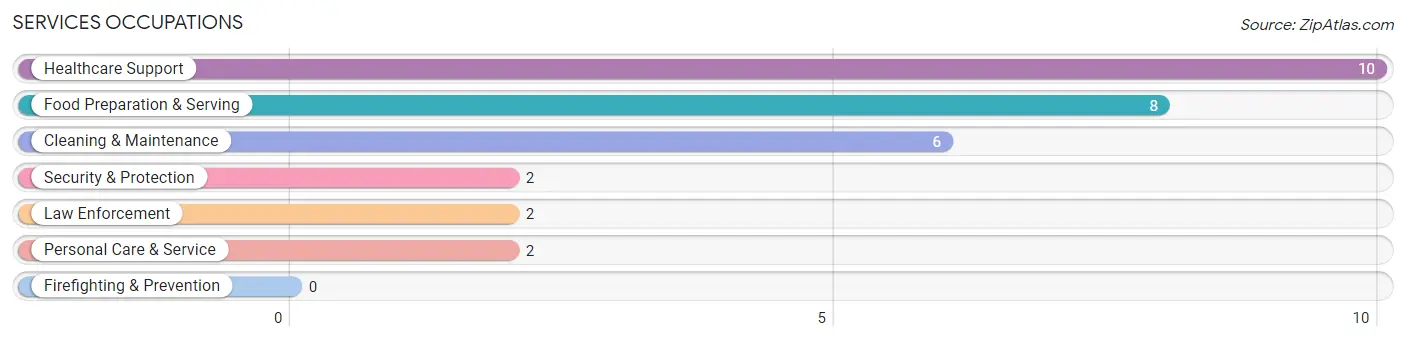
Services Occupations
The most common Services occupations in Barrett are Healthcare Support (10 | 6.2%), Food Preparation & Serving (8 | 4.9%), Cleaning & Maintenance (6 | 3.7%), Security & Protection (2 | 1.2%), and Law Enforcement (2 | 1.2%).
Services Occupations by Sex
Within the Services occupations in Barrett, the most male-oriented occupations are Security & Protection (100.0%), Law Enforcement (100.0%), and Healthcare Support (20.0%), while the most female-oriented occupations are Food Preparation & Serving (100.0%), Personal Care & Service (100.0%), and Cleaning & Maintenance (83.3%).
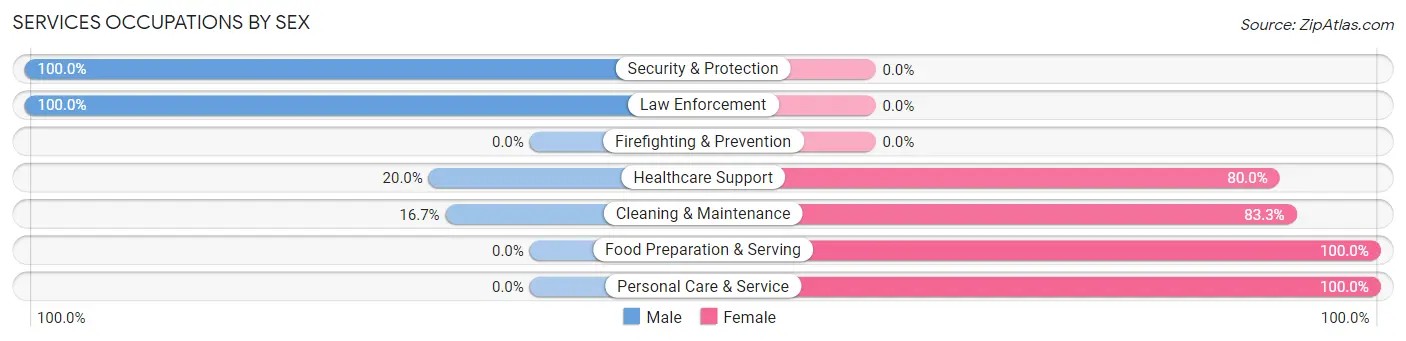
| Occupation | Male | Female |
| Healthcare Support | 2 (20.0%) | 8 (80.0%) |
| Security & Protection | 2 (100.0%) | 0 (0.0%) |
| Firefighting & Prevention | 0 (0.0%) | 0 (0.0%) |
| Law Enforcement | 2 (100.0%) | 0 (0.0%) |
| Food Preparation & Serving | 0 (0.0%) | 8 (100.0%) |
| Cleaning & Maintenance | 1 (16.7%) | 5 (83.3%) |
| Personal Care & Service | 0 (0.0%) | 2 (100.0%) |
| Total (Category) | 5 (17.9%) | 23 (82.1%) |
| Total (Overall) | 90 (55.6%) | 72 (44.4%) |
Sales and Office Occupations
The most common Sales and Office occupations in Barrett are Office & Administration (24 | 14.8%), and Sales & Related (5 | 3.1%).
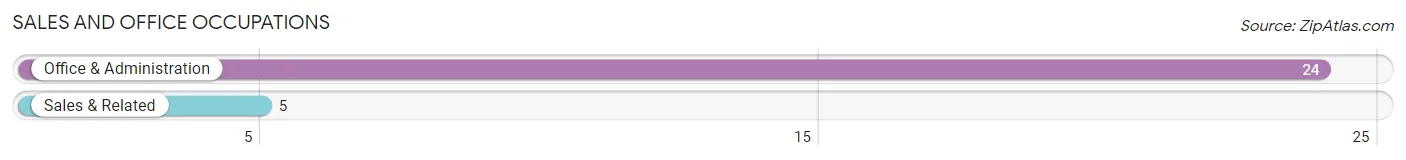
Sales and Office Occupations by Sex

| Occupation | Male | Female |
| Sales & Related | 2 (40.0%) | 3 (60.0%) |
| Office & Administration | 2 (8.3%) | 22 (91.7%) |
| Total (Category) | 4 (13.8%) | 25 (86.2%) |
| Total (Overall) | 90 (55.6%) | 72 (44.4%) |
Natural Resources, Construction and Maintenance Occupations
The most common Natural Resources, Construction and Maintenance occupations in Barrett are Construction & Extraction (27 | 16.7%), and Farming, Fishing & Forestry (1 | 0.6%).
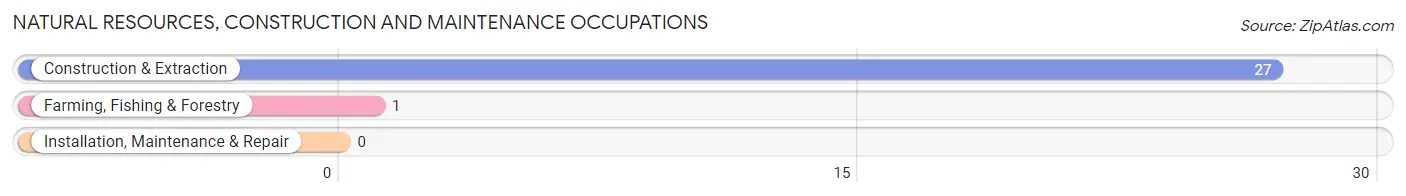
Natural Resources, Construction and Maintenance Occupations by Sex

| Occupation | Male | Female |
| Farming, Fishing & Forestry | 1 (100.0%) | 0 (0.0%) |
| Construction & Extraction | 27 (100.0%) | 0 (0.0%) |
| Installation, Maintenance & Repair | 0 (0.0%) | 0 (0.0%) |
| Total (Category) | 28 (100.0%) | 0 (0.0%) |
| Total (Overall) | 90 (55.6%) | 72 (44.4%) |
Production, Transportation and Moving Occupations
The most common Production, Transportation and Moving occupations in Barrett are Transportation (19 | 11.7%), Production (5 | 3.1%), and Material Moving (3 | 1.8%).
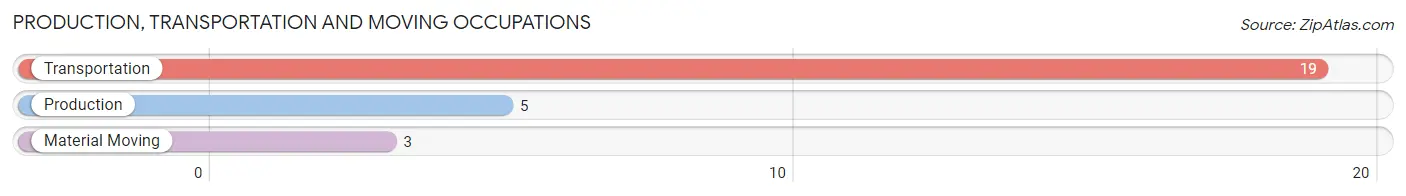
Production, Transportation and Moving Occupations by Sex
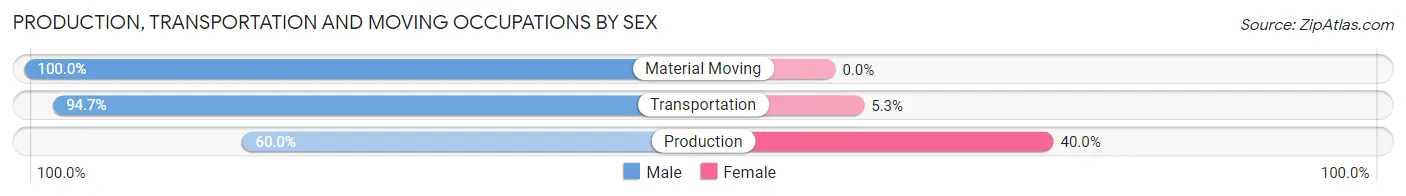
| Occupation | Male | Female |
| Production | 3 (60.0%) | 2 (40.0%) |
| Transportation | 18 (94.7%) | 1 (5.3%) |
| Material Moving | 3 (100.0%) | 0 (0.0%) |
| Total (Category) | 24 (88.9%) | 3 (11.1%) |
| Total (Overall) | 90 (55.6%) | 72 (44.4%) |
Employment Industries by Sex in Barrett
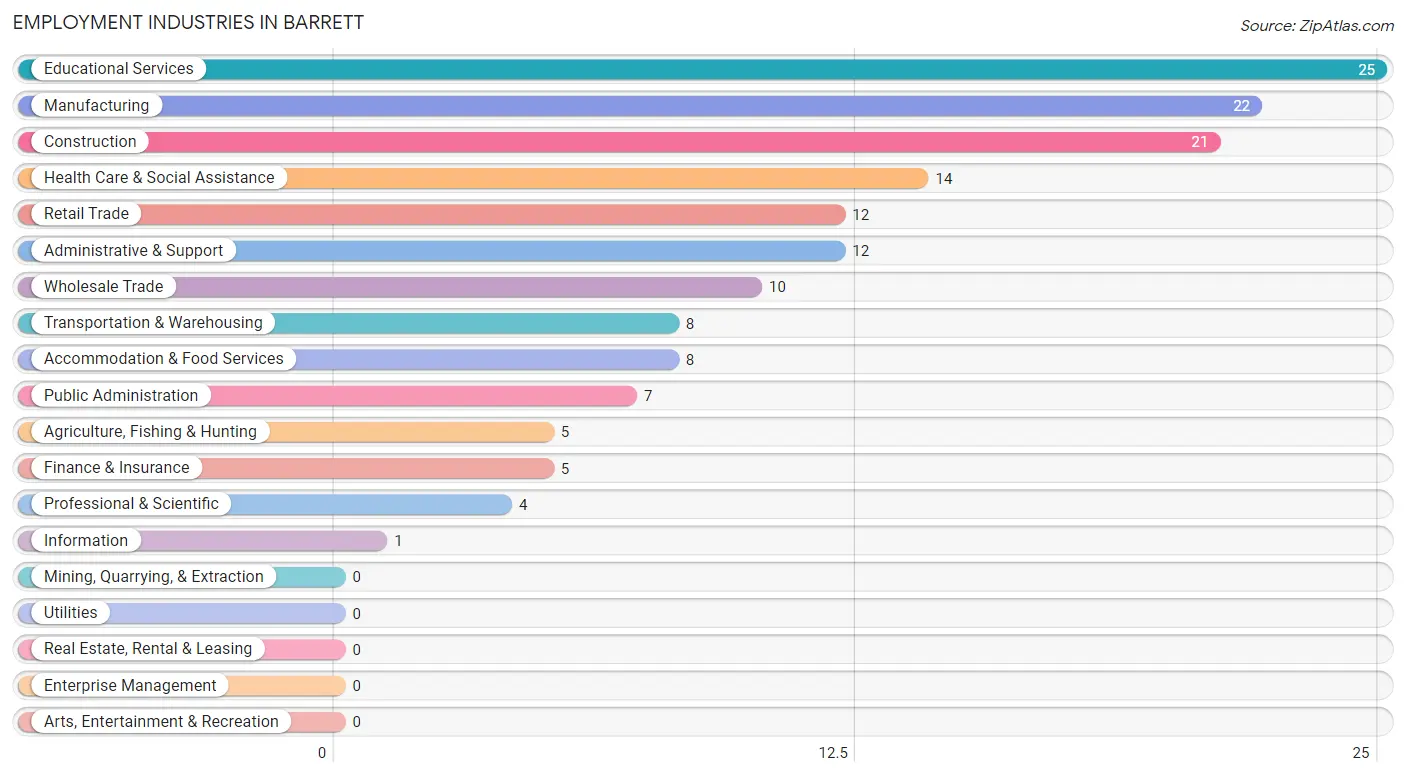
Employment Industries in Barrett
The major employment industries in Barrett include Educational Services (25 | 15.4%), Manufacturing (22 | 13.6%), Construction (21 | 13.0%), Health Care & Social Assistance (14 | 8.6%), and Retail Trade (12 | 7.4%).
Employment Industries by Sex in Barrett
The Barrett industries that see more men than women are Agriculture, Fishing & Hunting (100.0%), Construction (100.0%), and Wholesale Trade (100.0%), whereas the industries that tend to have a higher number of women are Information (100.0%), Finance & Insurance (100.0%), and Accommodation & Food Services (100.0%).
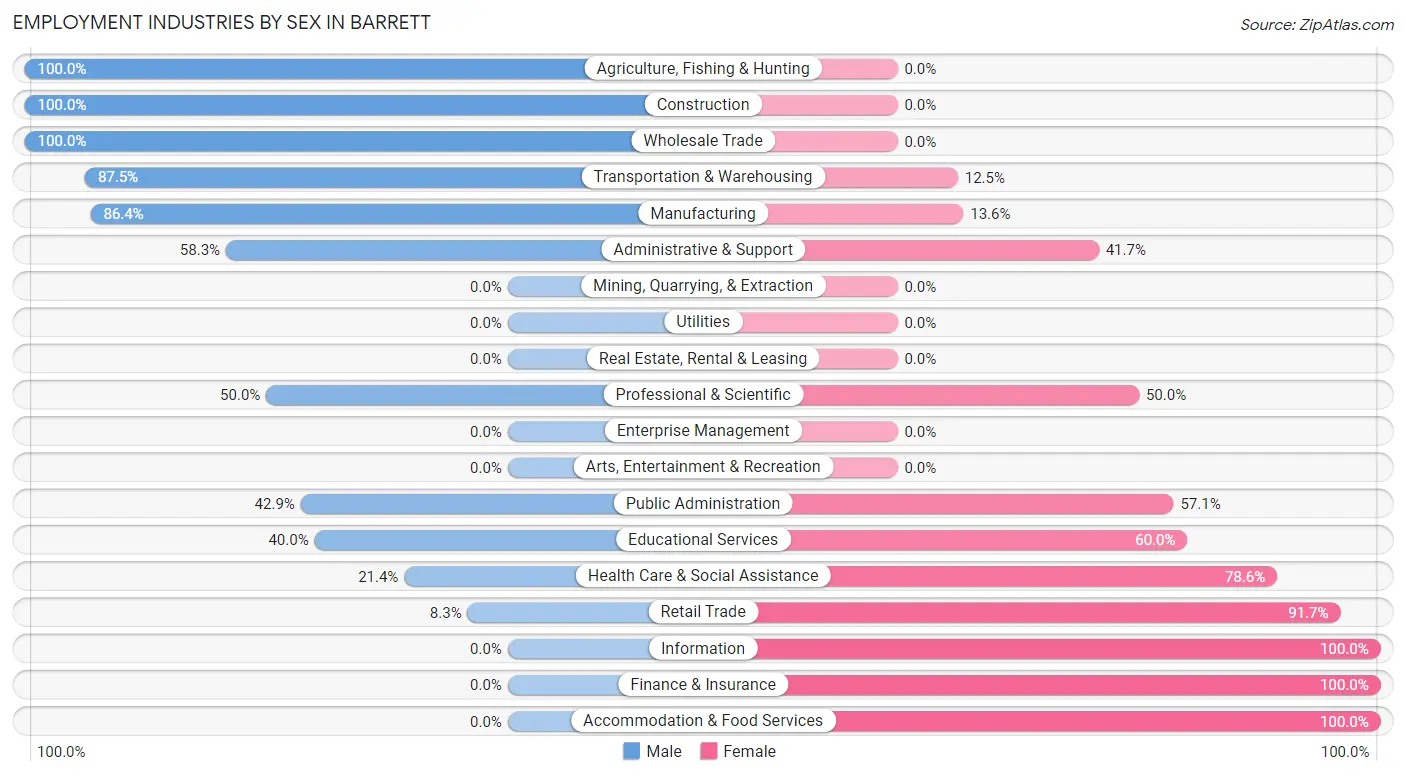
| Industry | Male | Female |
| Agriculture, Fishing & Hunting | 5 (100.0%) | 0 (0.0%) |
| Mining, Quarrying, & Extraction | 0 (0.0%) | 0 (0.0%) |
| Construction | 21 (100.0%) | 0 (0.0%) |
| Manufacturing | 19 (86.4%) | 3 (13.6%) |
| Wholesale Trade | 10 (100.0%) | 0 (0.0%) |
| Retail Trade | 1 (8.3%) | 11 (91.7%) |
| Transportation & Warehousing | 7 (87.5%) | 1 (12.5%) |
| Utilities | 0 (0.0%) | 0 (0.0%) |
| Information | 0 (0.0%) | 1 (100.0%) |
| Finance & Insurance | 0 (0.0%) | 5 (100.0%) |
| Real Estate, Rental & Leasing | 0 (0.0%) | 0 (0.0%) |
| Professional & Scientific | 2 (50.0%) | 2 (50.0%) |
| Enterprise Management | 0 (0.0%) | 0 (0.0%) |
| Administrative & Support | 7 (58.3%) | 5 (41.7%) |
| Educational Services | 10 (40.0%) | 15 (60.0%) |
| Health Care & Social Assistance | 3 (21.4%) | 11 (78.6%) |
| Arts, Entertainment & Recreation | 0 (0.0%) | 0 (0.0%) |
| Accommodation & Food Services | 0 (0.0%) | 8 (100.0%) |
| Public Administration | 3 (42.9%) | 4 (57.1%) |
| Total | 90 (55.6%) | 72 (44.4%) |
Education in Barrett
School Enrollment in Barrett
The most common levels of schooling among the 48 students in Barrett are kindergarten (11 | 22.9%), high school (10 | 20.8%), and elementary school (6 | 12.5%).
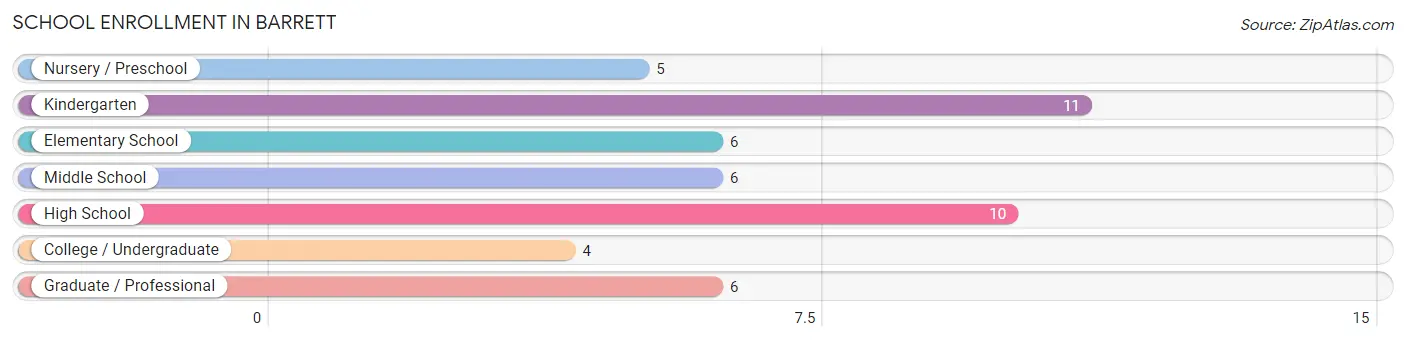
| School Level | # Students | % Students |
| Nursery / Preschool | 5 | 10.4% |
| Kindergarten | 11 | 22.9% |
| Elementary School | 6 | 12.5% |
| Middle School | 6 | 12.5% |
| High School | 10 | 20.8% |
| College / Undergraduate | 4 | 8.3% |
| Graduate / Professional | 6 | 12.5% |
| Total | 48 | 100.0% |
School Enrollment by Age by Funding Source in Barrett
Out of a total of 48 students who are enrolled in schools in Barrett, 9 (18.8%) attend a private institution, while the remaining 39 (81.2%) are enrolled in public schools. The age group of 5 to 9 year old has the highest likelihood of being enrolled in private schools, with 6 (33.3% in the age bracket) enrolled. Conversely, the age group of 3 to 4 year olds has the lowest likelihood of being enrolled in a private school, with 4 (100.0% in the age bracket) attending a public institution.
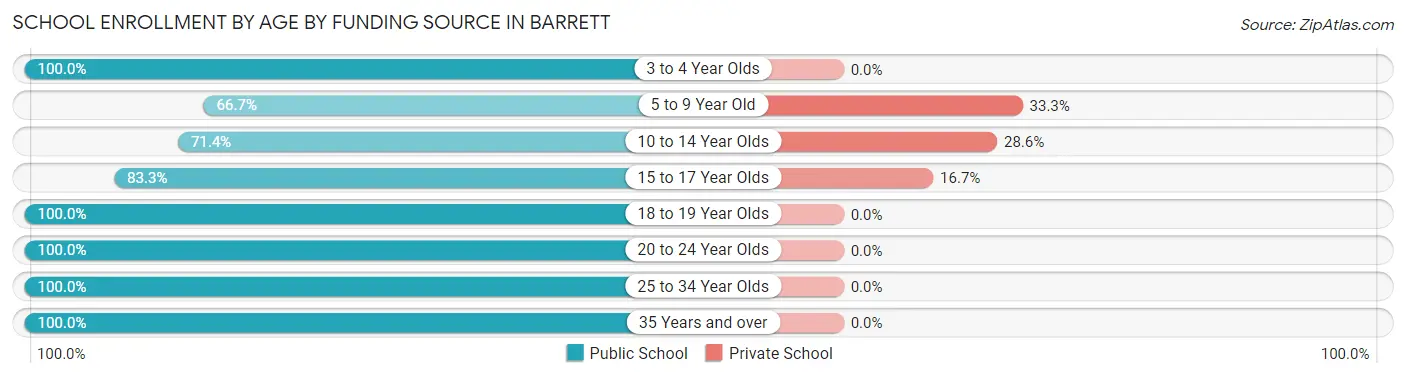
| Age Bracket | Public School | Private School |
| 3 to 4 Year Olds | 4 (100.0%) | 0 (0.0%) |
| 5 to 9 Year Old | 12 (66.7%) | 6 (33.3%) |
| 10 to 14 Year Olds | 5 (71.4%) | 2 (28.6%) |
| 15 to 17 Year Olds | 5 (83.3%) | 1 (16.7%) |
| 18 to 19 Year Olds | 3 (100.0%) | 0 (0.0%) |
| 20 to 24 Year Olds | 3 (100.0%) | 0 (0.0%) |
| 25 to 34 Year Olds | 1 (100.0%) | 0 (0.0%) |
| 35 Years and over | 6 (100.0%) | 0 (0.0%) |
| Total | 39 (81.3%) | 9 (18.8%) |
Educational Attainment by Field of Study in Barrett
Education (17 | 51.5%), liberal arts & history (4 | 12.1%), computers & mathematics (2 | 6.1%), engineering (2 | 6.1%), and business (2 | 6.1%) are the most common fields of study among 33 individuals in Barrett who have obtained a bachelor's degree or higher.
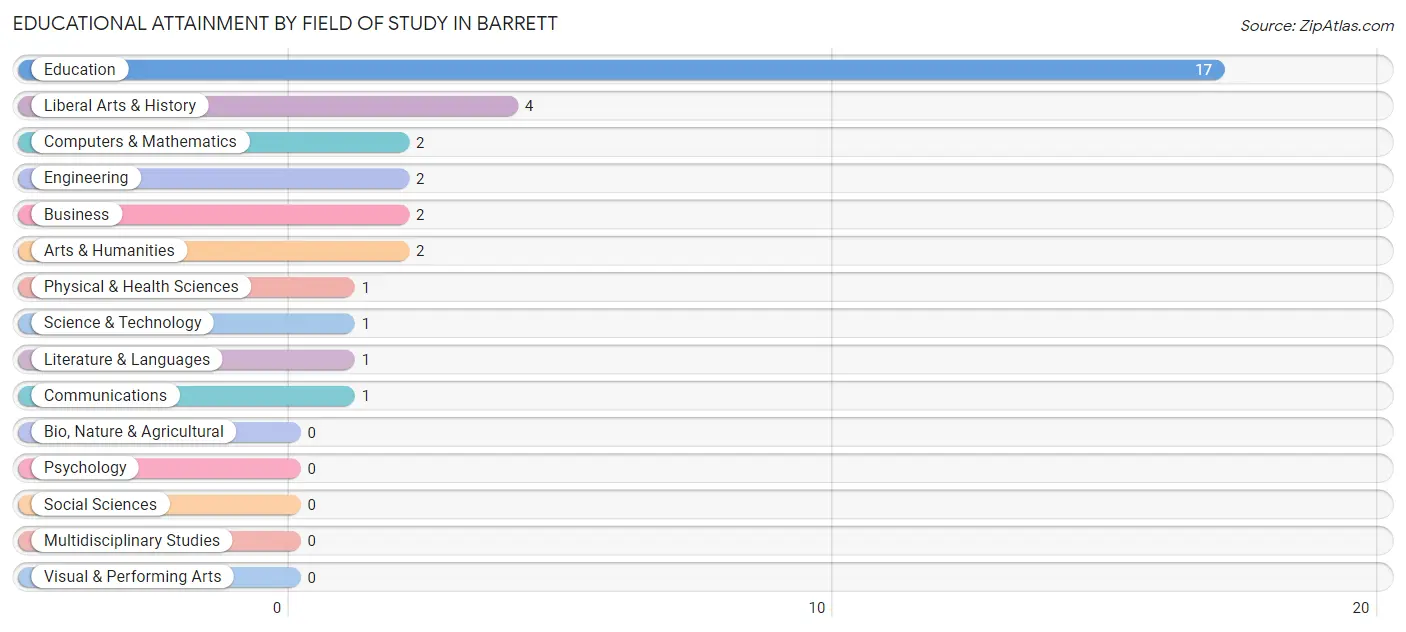
| Field of Study | # Graduates | % Graduates |
| Computers & Mathematics | 2 | 6.1% |
| Bio, Nature & Agricultural | 0 | 0.0% |
| Physical & Health Sciences | 1 | 3.0% |
| Psychology | 0 | 0.0% |
| Social Sciences | 0 | 0.0% |
| Engineering | 2 | 6.1% |
| Multidisciplinary Studies | 0 | 0.0% |
| Science & Technology | 1 | 3.0% |
| Business | 2 | 6.1% |
| Education | 17 | 51.5% |
| Literature & Languages | 1 | 3.0% |
| Liberal Arts & History | 4 | 12.1% |
| Visual & Performing Arts | 0 | 0.0% |
| Communications | 1 | 3.0% |
| Arts & Humanities | 2 | 6.1% |
| Total | 33 | 100.0% |
Transportation & Commute in Barrett
Vehicle Availability by Sex in Barrett
The most prevalent vehicle ownership categories in Barrett are males with 2 vehicles (32, accounting for 35.6%) and females with 2 vehicles (35, making up 44.4%).
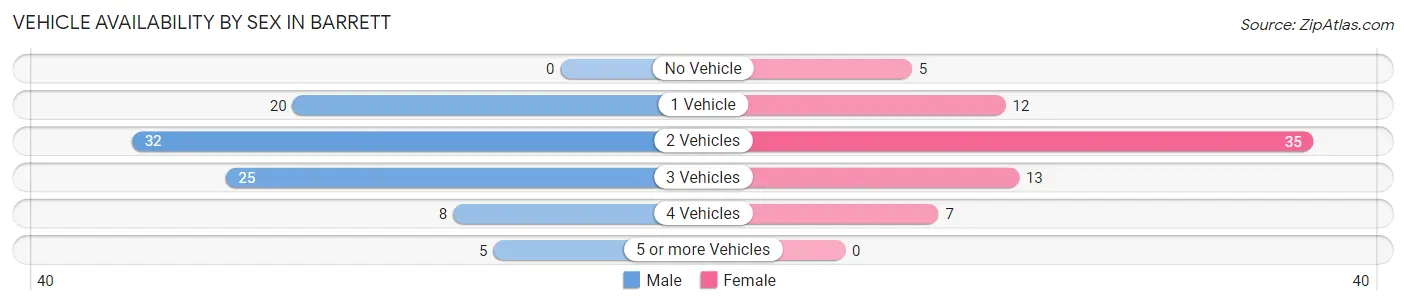
| Vehicles Available | Male | Female |
| No Vehicle | 0 (0.0%) | 5 (6.9%) |
| 1 Vehicle | 20 (22.2%) | 12 (16.7%) |
| 2 Vehicles | 32 (35.6%) | 35 (48.6%) |
| 3 Vehicles | 25 (27.8%) | 13 (18.1%) |
| 4 Vehicles | 8 (8.9%) | 7 (9.7%) |
| 5 or more Vehicles | 5 (5.6%) | 0 (0.0%) |
| Total | 90 (100.0%) | 72 (100.0%) |
Commute Time in Barrett
The most frequently occuring commute durations in Barrett are 10 to 14 minutes (21 commuters, 13.9%), 30 to 34 minutes (19 commuters, 12.6%), and 40 to 44 minutes (17 commuters, 11.3%).
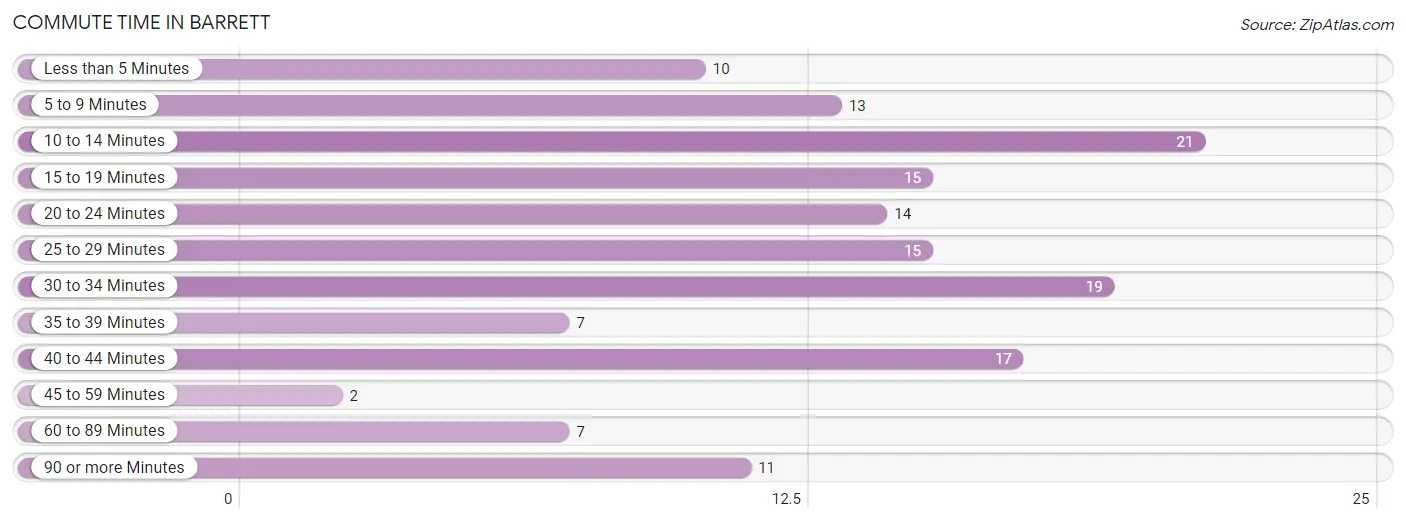
| Commute Time | # Commuters | % Commuters |
| Less than 5 Minutes | 10 | 6.6% |
| 5 to 9 Minutes | 13 | 8.6% |
| 10 to 14 Minutes | 21 | 13.9% |
| 15 to 19 Minutes | 15 | 9.9% |
| 20 to 24 Minutes | 14 | 9.3% |
| 25 to 29 Minutes | 15 | 9.9% |
| 30 to 34 Minutes | 19 | 12.6% |
| 35 to 39 Minutes | 7 | 4.6% |
| 40 to 44 Minutes | 17 | 11.3% |
| 45 to 59 Minutes | 2 | 1.3% |
| 60 to 89 Minutes | 7 | 4.6% |
| 90 or more Minutes | 11 | 7.3% |
Commute Time by Sex in Barrett
The most common commute times in Barrett are 30 to 34 minutes (15 commuters, 17.9%) for males and 40 to 44 minutes (14 commuters, 20.9%) for females.
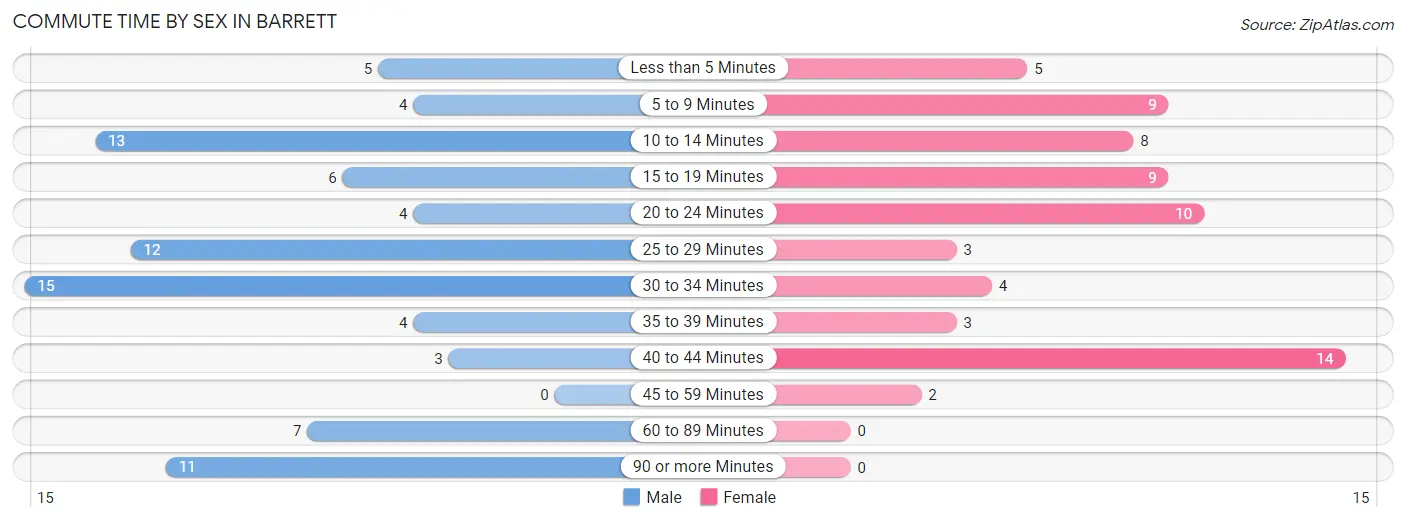
| Commute Time | Male | Female |
| Less than 5 Minutes | 5 (5.9%) | 5 (7.5%) |
| 5 to 9 Minutes | 4 (4.8%) | 9 (13.4%) |
| 10 to 14 Minutes | 13 (15.5%) | 8 (11.9%) |
| 15 to 19 Minutes | 6 (7.1%) | 9 (13.4%) |
| 20 to 24 Minutes | 4 (4.8%) | 10 (14.9%) |
| 25 to 29 Minutes | 12 (14.3%) | 3 (4.5%) |
| 30 to 34 Minutes | 15 (17.9%) | 4 (6.0%) |
| 35 to 39 Minutes | 4 (4.8%) | 3 (4.5%) |
| 40 to 44 Minutes | 3 (3.6%) | 14 (20.9%) |
| 45 to 59 Minutes | 0 (0.0%) | 2 (3.0%) |
| 60 to 89 Minutes | 7 (8.3%) | 0 (0.0%) |
| 90 or more Minutes | 11 (13.1%) | 0 (0.0%) |
Time of Departure to Work by Sex in Barrett
The most frequent times of departure to work in Barrett are 7:30 AM to 7:59 AM (21, 25.0%) for males and 7:00 AM to 7:29 AM (16, 23.9%) for females.
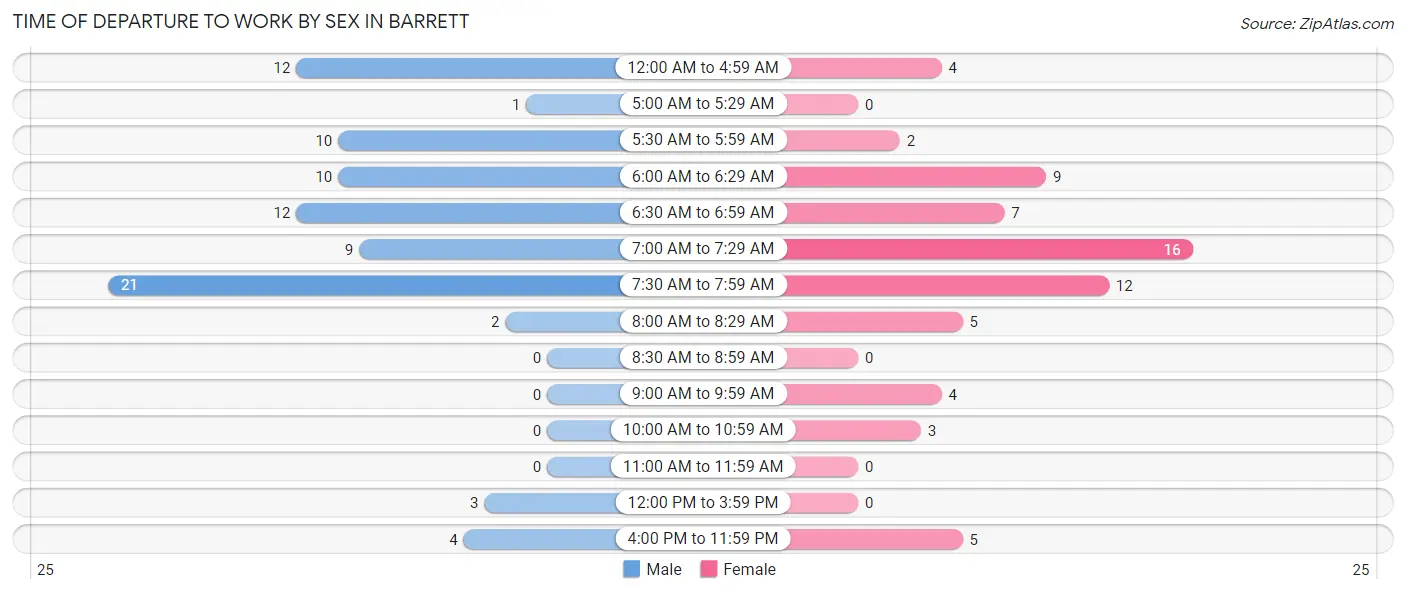
| Time of Departure | Male | Female |
| 12:00 AM to 4:59 AM | 12 (14.3%) | 4 (6.0%) |
| 5:00 AM to 5:29 AM | 1 (1.2%) | 0 (0.0%) |
| 5:30 AM to 5:59 AM | 10 (11.9%) | 2 (3.0%) |
| 6:00 AM to 6:29 AM | 10 (11.9%) | 9 (13.4%) |
| 6:30 AM to 6:59 AM | 12 (14.3%) | 7 (10.4%) |
| 7:00 AM to 7:29 AM | 9 (10.7%) | 16 (23.9%) |
| 7:30 AM to 7:59 AM | 21 (25.0%) | 12 (17.9%) |
| 8:00 AM to 8:29 AM | 2 (2.4%) | 5 (7.5%) |
| 8:30 AM to 8:59 AM | 0 (0.0%) | 0 (0.0%) |
| 9:00 AM to 9:59 AM | 0 (0.0%) | 4 (6.0%) |
| 10:00 AM to 10:59 AM | 0 (0.0%) | 3 (4.5%) |
| 11:00 AM to 11:59 AM | 0 (0.0%) | 0 (0.0%) |
| 12:00 PM to 3:59 PM | 3 (3.6%) | 0 (0.0%) |
| 4:00 PM to 11:59 PM | 4 (4.8%) | 5 (7.5%) |
| Total | 84 (100.0%) | 67 (100.0%) |
Housing Occupancy in Barrett
Occupancy by Ownership in Barrett
Of the total 160 dwellings in Barrett, owner-occupied units account for 124 (77.5%), while renter-occupied units make up 36 (22.5%).
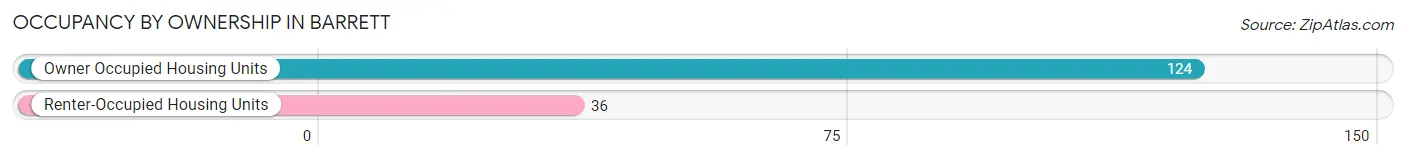
| Occupancy | # Housing Units | % Housing Units |
| Owner Occupied Housing Units | 124 | 77.5% |
| Renter-Occupied Housing Units | 36 | 22.5% |
| Total Occupied Housing Units | 160 | 100.0% |
Occupancy by Household Size in Barrett
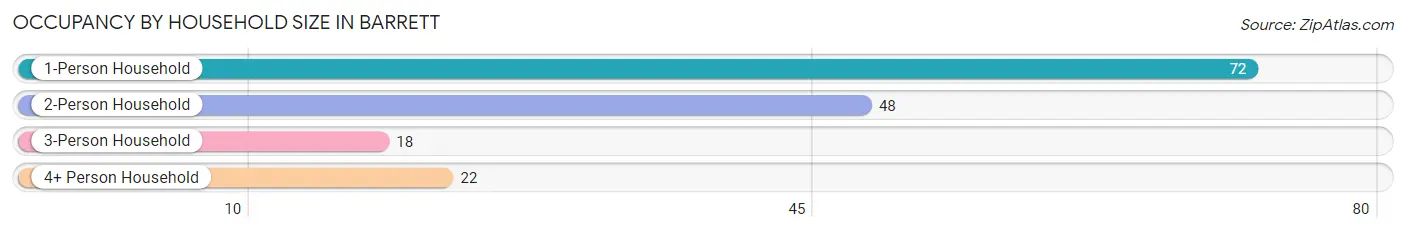
| Household Size | # Housing Units | % Housing Units |
| 1-Person Household | 72 | 45.0% |
| 2-Person Household | 48 | 30.0% |
| 3-Person Household | 18 | 11.3% |
| 4+ Person Household | 22 | 13.8% |
| Total Housing Units | 160 | 100.0% |
Occupancy by Ownership by Household Size in Barrett
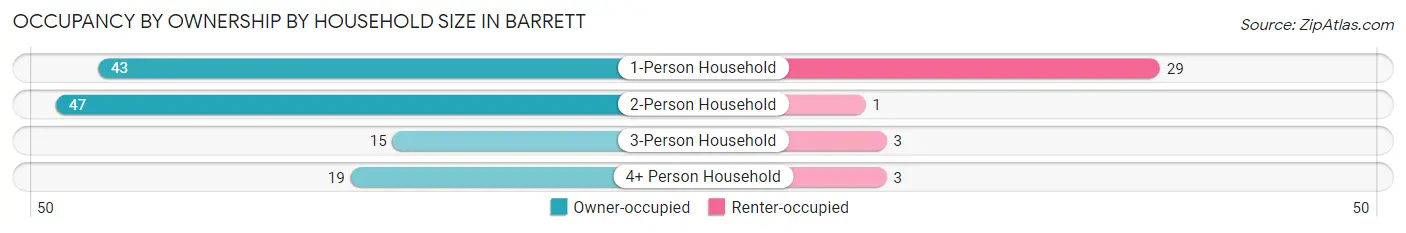
| Household Size | Owner-occupied | Renter-occupied |
| 1-Person Household | 43 (59.7%) | 29 (40.3%) |
| 2-Person Household | 47 (97.9%) | 1 (2.1%) |
| 3-Person Household | 15 (83.3%) | 3 (16.7%) |
| 4+ Person Household | 19 (86.4%) | 3 (13.6%) |
| Total Housing Units | 124 (77.5%) | 36 (22.5%) |
Occupancy by Educational Attainment in Barrett
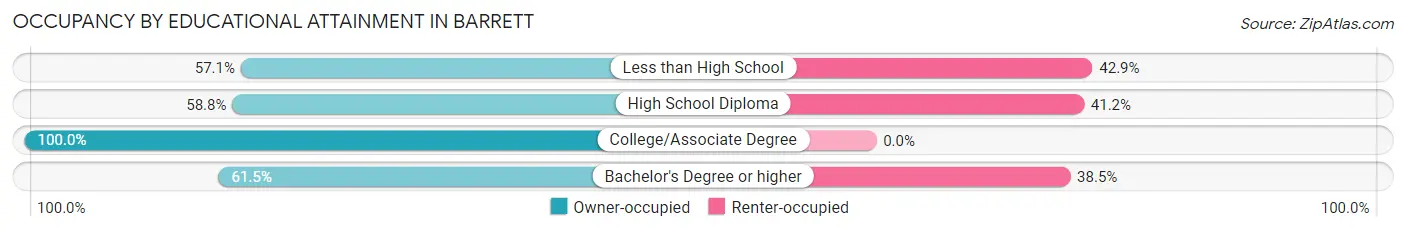
| Household Size | Owner-occupied | Renter-occupied |
| Less than High School | 4 (57.1%) | 3 (42.9%) |
| High School Diploma | 40 (58.8%) | 28 (41.2%) |
| College/Associate Degree | 72 (100.0%) | 0 (0.0%) |
| Bachelor's Degree or higher | 8 (61.5%) | 5 (38.5%) |
Occupancy by Age of Householder in Barrett
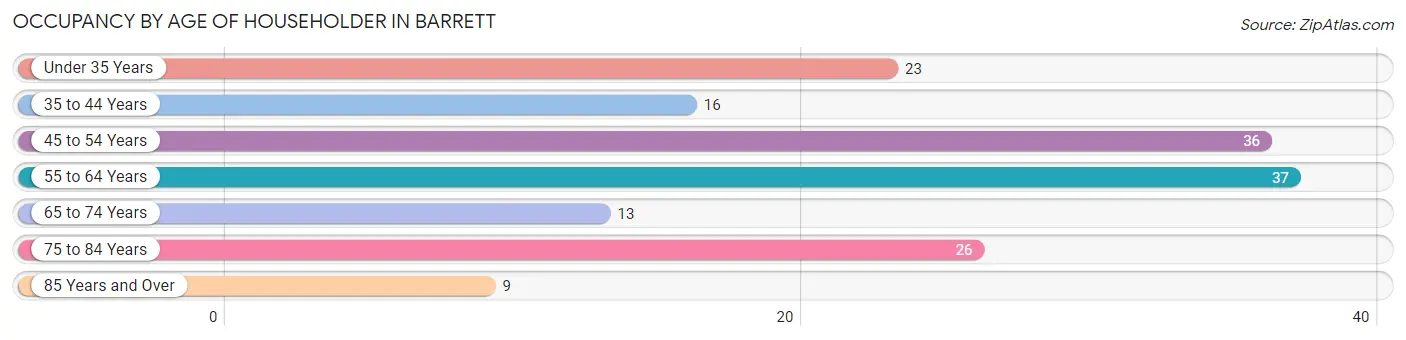
| Age Bracket | # Households | % Households |
| Under 35 Years | 23 | 14.4% |
| 35 to 44 Years | 16 | 10.0% |
| 45 to 54 Years | 36 | 22.5% |
| 55 to 64 Years | 37 | 23.1% |
| 65 to 74 Years | 13 | 8.1% |
| 75 to 84 Years | 26 | 16.3% |
| 85 Years and Over | 9 | 5.6% |
| Total | 160 | 100.0% |
Housing Finances in Barrett
Median Income by Occupancy in Barrett
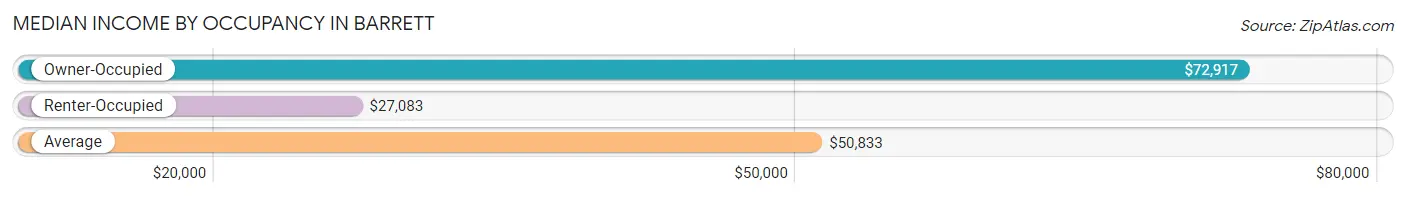
| Occupancy Type | # Households | Median Income |
| Owner-Occupied | 124 (77.5%) | $72,917 |
| Renter-Occupied | 36 (22.5%) | $27,083 |
| Average | 160 (100.0%) | $50,833 |
Occupancy by Householder Income Bracket in Barrett
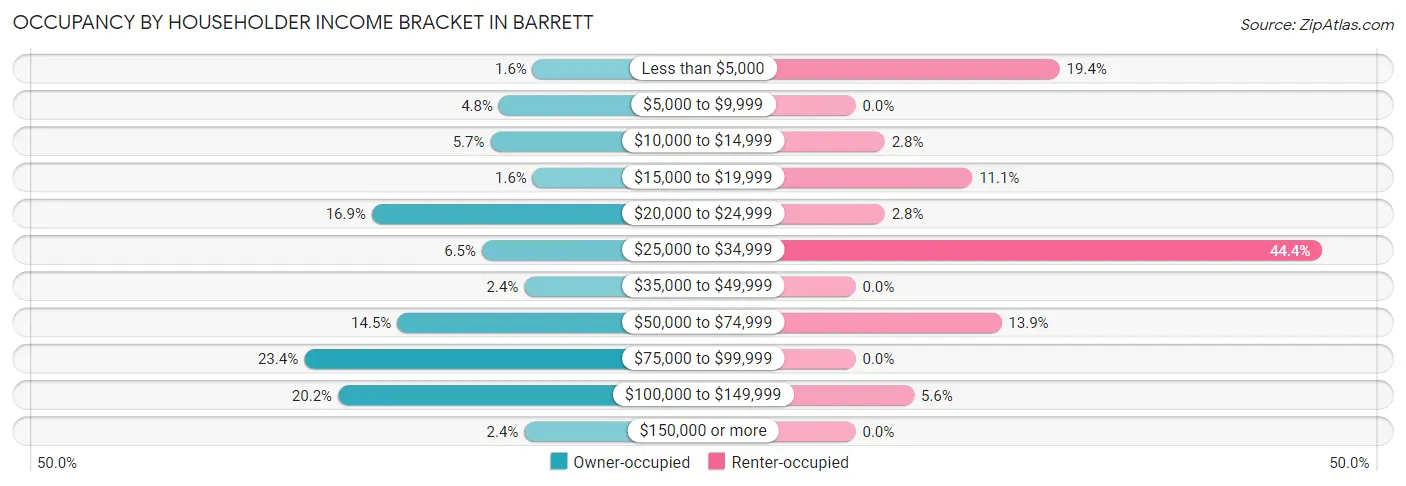
| Income Bracket | Owner-occupied | Renter-occupied |
| Less than $5,000 | 2 (1.6%) | 7 (19.4%) |
| $5,000 to $9,999 | 6 (4.8%) | 0 (0.0%) |
| $10,000 to $14,999 | 7 (5.7%) | 1 (2.8%) |
| $15,000 to $19,999 | 2 (1.6%) | 4 (11.1%) |
| $20,000 to $24,999 | 21 (16.9%) | 1 (2.8%) |
| $25,000 to $34,999 | 8 (6.5%) | 16 (44.4%) |
| $35,000 to $49,999 | 3 (2.4%) | 0 (0.0%) |
| $50,000 to $74,999 | 18 (14.5%) | 5 (13.9%) |
| $75,000 to $99,999 | 29 (23.4%) | 0 (0.0%) |
| $100,000 to $149,999 | 25 (20.2%) | 2 (5.6%) |
| $150,000 or more | 3 (2.4%) | 0 (0.0%) |
| Total | 124 (100.0%) | 36 (100.0%) |
Monthly Housing Cost Tiers in Barrett
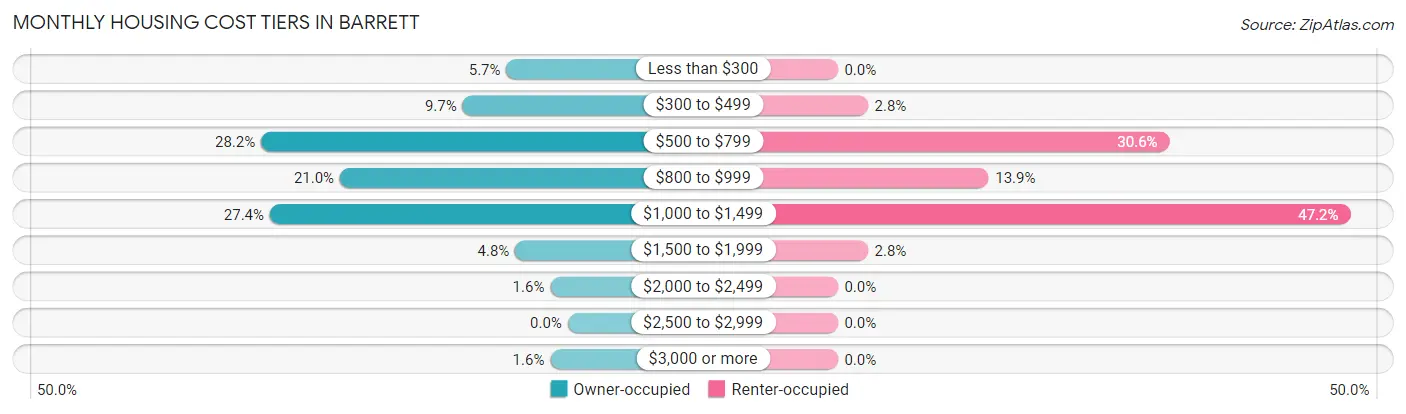
| Monthly Cost | Owner-occupied | Renter-occupied |
| Less than $300 | 7 (5.7%) | 0 (0.0%) |
| $300 to $499 | 12 (9.7%) | 1 (2.8%) |
| $500 to $799 | 35 (28.2%) | 11 (30.6%) |
| $800 to $999 | 26 (21.0%) | 5 (13.9%) |
| $1,000 to $1,499 | 34 (27.4%) | 17 (47.2%) |
| $1,500 to $1,999 | 6 (4.8%) | 1 (2.8%) |
| $2,000 to $2,499 | 2 (1.6%) | 0 (0.0%) |
| $2,500 to $2,999 | 0 (0.0%) | 0 (0.0%) |
| $3,000 or more | 2 (1.6%) | 0 (0.0%) |
| Total | 124 (100.0%) | 36 (100.0%) |
Physical Housing Characteristics in Barrett
Housing Structures in Barrett
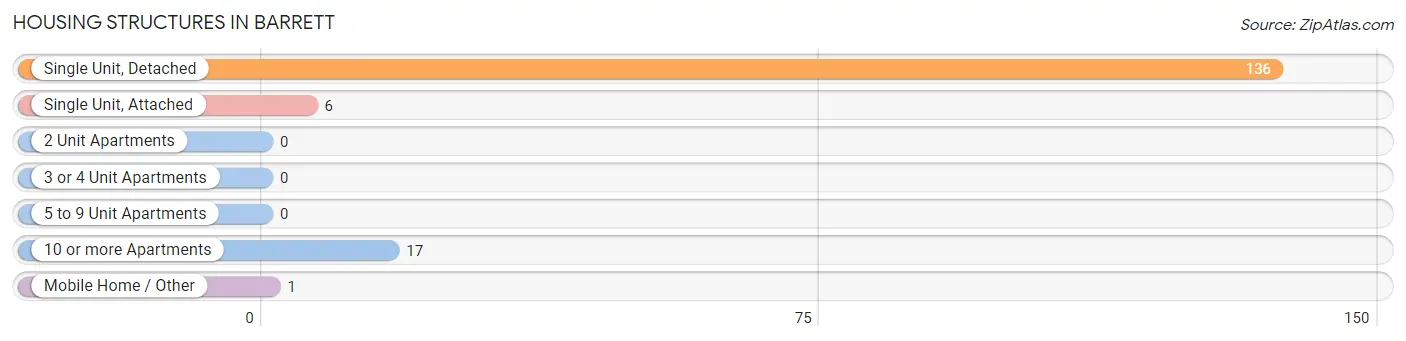
| Structure Type | # Housing Units | % Housing Units |
| Single Unit, Detached | 136 | 85.0% |
| Single Unit, Attached | 6 | 3.7% |
| 2 Unit Apartments | 0 | 0.0% |
| 3 or 4 Unit Apartments | 0 | 0.0% |
| 5 to 9 Unit Apartments | 0 | 0.0% |
| 10 or more Apartments | 17 | 10.6% |
| Mobile Home / Other | 1 | 0.6% |
| Total | 160 | 100.0% |
Housing Structures by Occupancy in Barrett
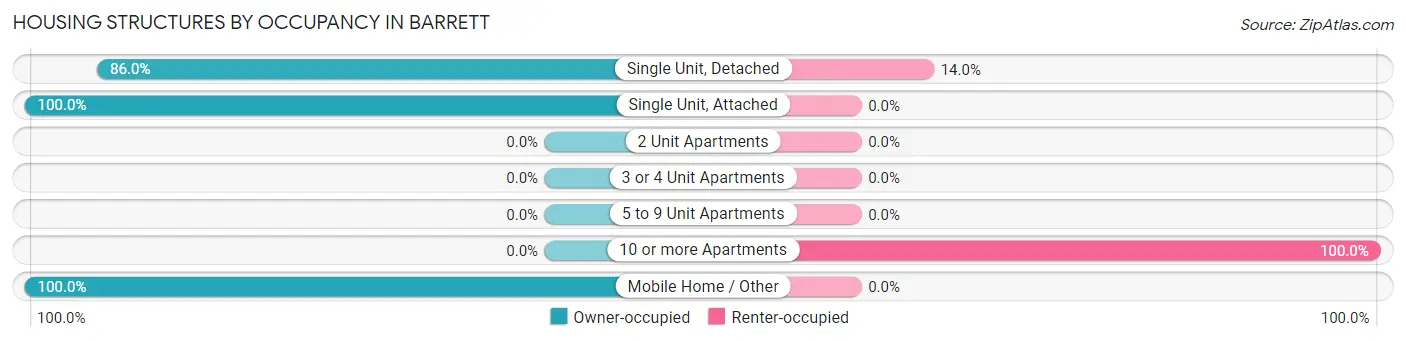
| Structure Type | Owner-occupied | Renter-occupied |
| Single Unit, Detached | 117 (86.0%) | 19 (14.0%) |
| Single Unit, Attached | 6 (100.0%) | 0 (0.0%) |
| 2 Unit Apartments | 0 (0.0%) | 0 (0.0%) |
| 3 or 4 Unit Apartments | 0 (0.0%) | 0 (0.0%) |
| 5 to 9 Unit Apartments | 0 (0.0%) | 0 (0.0%) |
| 10 or more Apartments | 0 (0.0%) | 17 (100.0%) |
| Mobile Home / Other | 1 (100.0%) | 0 (0.0%) |
| Total | 124 (77.5%) | 36 (22.5%) |
Housing Structures by Number of Rooms in Barrett
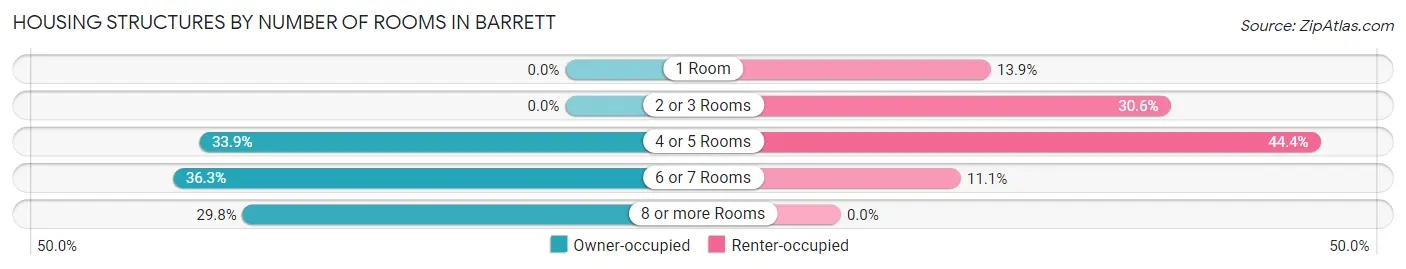
| Number of Rooms | Owner-occupied | Renter-occupied |
| 1 Room | 0 (0.0%) | 5 (13.9%) |
| 2 or 3 Rooms | 0 (0.0%) | 11 (30.6%) |
| 4 or 5 Rooms | 42 (33.9%) | 16 (44.4%) |
| 6 or 7 Rooms | 45 (36.3%) | 4 (11.1%) |
| 8 or more Rooms | 37 (29.8%) | 0 (0.0%) |
| Total | 124 (100.0%) | 36 (100.0%) |
Housing Structure by Heating Type in Barrett
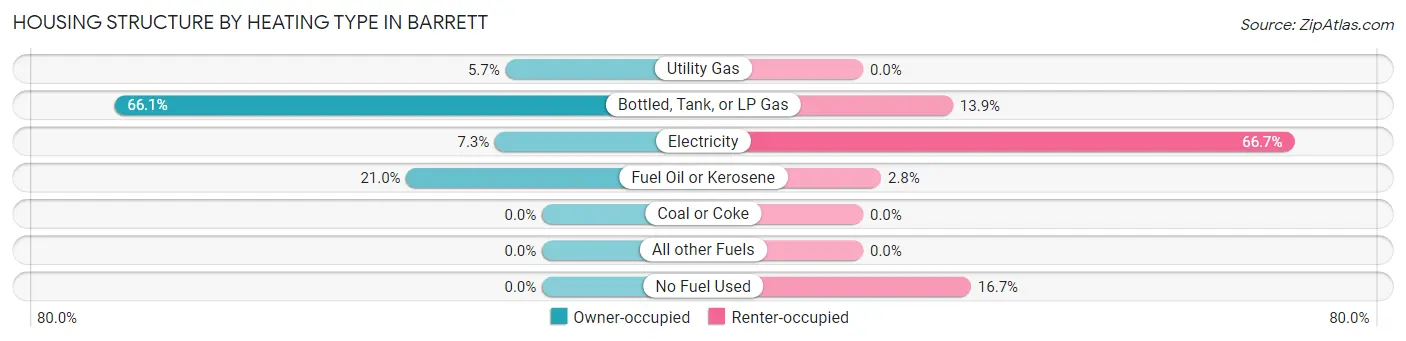
| Heating Type | Owner-occupied | Renter-occupied |
| Utility Gas | 7 (5.7%) | 0 (0.0%) |
| Bottled, Tank, or LP Gas | 82 (66.1%) | 5 (13.9%) |
| Electricity | 9 (7.3%) | 24 (66.7%) |
| Fuel Oil or Kerosene | 26 (21.0%) | 1 (2.8%) |
| Coal or Coke | 0 (0.0%) | 0 (0.0%) |
| All other Fuels | 0 (0.0%) | 0 (0.0%) |
| No Fuel Used | 0 (0.0%) | 6 (16.7%) |
| Total | 124 (100.0%) | 36 (100.0%) |
Household Vehicle Usage in Barrett
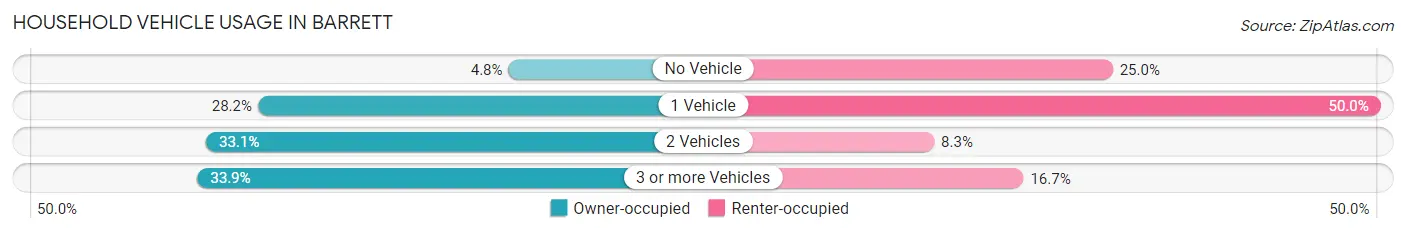
| Vehicles per Household | Owner-occupied | Renter-occupied |
| No Vehicle | 6 (4.8%) | 9 (25.0%) |
| 1 Vehicle | 35 (28.2%) | 18 (50.0%) |
| 2 Vehicles | 41 (33.1%) | 3 (8.3%) |
| 3 or more Vehicles | 42 (33.9%) | 6 (16.7%) |
| Total | 124 (100.0%) | 36 (100.0%) |
Real Estate & Mortgages in Barrett
Real Estate and Mortgage Overview in Barrett
| Characteristic | Without Mortgage | With Mortgage |
| Housing Units | 33 | 91 |
| Median Property Value | $118,800 | $79,400 |
| Median Household Income | $38,125 | $3 |
| Monthly Housing Costs | $469 | $2 |
| Real Estate Taxes | $1,750 | $0 |
Property Value by Mortgage Status in Barrett
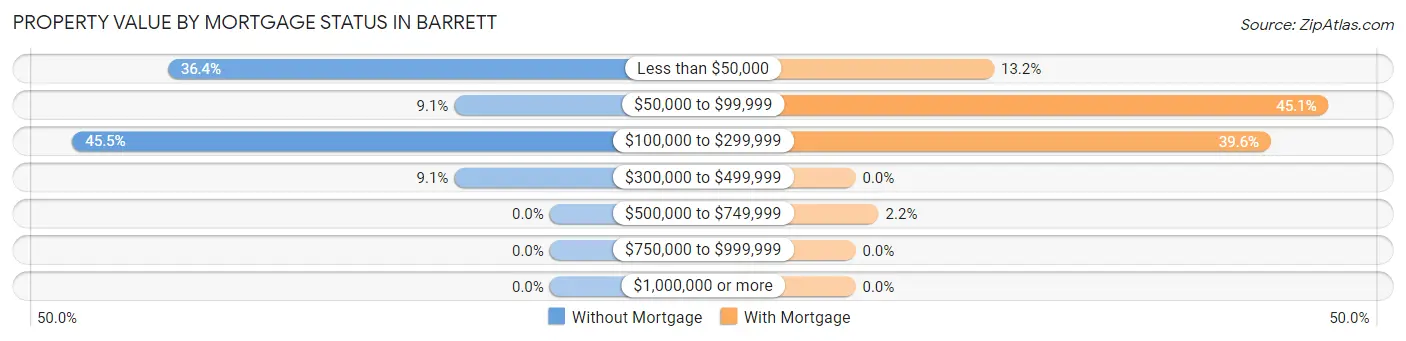
| Property Value | Without Mortgage | With Mortgage |
| Less than $50,000 | 12 (36.4%) | 12 (13.2%) |
| $50,000 to $99,999 | 3 (9.1%) | 41 (45.1%) |
| $100,000 to $299,999 | 15 (45.5%) | 36 (39.6%) |
| $300,000 to $499,999 | 3 (9.1%) | 0 (0.0%) |
| $500,000 to $749,999 | 0 (0.0%) | 2 (2.2%) |
| $750,000 to $999,999 | 0 (0.0%) | 0 (0.0%) |
| $1,000,000 or more | 0 (0.0%) | 0 (0.0%) |
| Total | 33 (100.0%) | 91 (100.0%) |
Household Income by Mortgage Status in Barrett
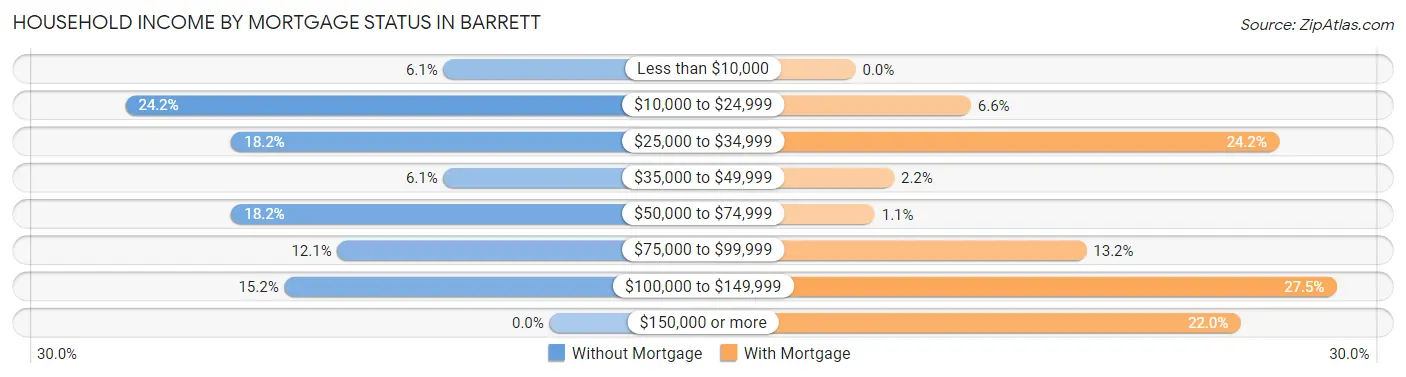
| Household Income | Without Mortgage | With Mortgage |
| Less than $10,000 | 2 (6.1%) | 0 (0.0%) |
| $10,000 to $24,999 | 8 (24.2%) | 6 (6.6%) |
| $25,000 to $34,999 | 6 (18.2%) | 22 (24.2%) |
| $35,000 to $49,999 | 2 (6.1%) | 2 (2.2%) |
| $50,000 to $74,999 | 6 (18.2%) | 1 (1.1%) |
| $75,000 to $99,999 | 4 (12.1%) | 12 (13.2%) |
| $100,000 to $149,999 | 5 (15.1%) | 25 (27.5%) |
| $150,000 or more | 0 (0.0%) | 20 (22.0%) |
| Total | 33 (100.0%) | 91 (100.0%) |
Property Value to Household Income Ratio in Barrett
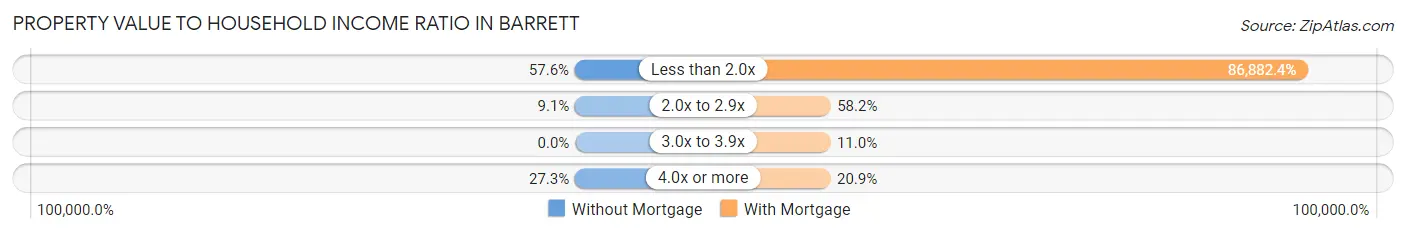
| Value-to-Income Ratio | Without Mortgage | With Mortgage |
| Less than 2.0x | 19 (57.6%) | 79,063 (86,882.4%) |
| 2.0x to 2.9x | 3 (9.1%) | 53 (58.2%) |
| 3.0x to 3.9x | 0 (0.0%) | 10 (11.0%) |
| 4.0x or more | 9 (27.3%) | 19 (20.9%) |
| Total | 33 (100.0%) | 91 (100.0%) |
Real Estate Taxes by Mortgage Status in Barrett
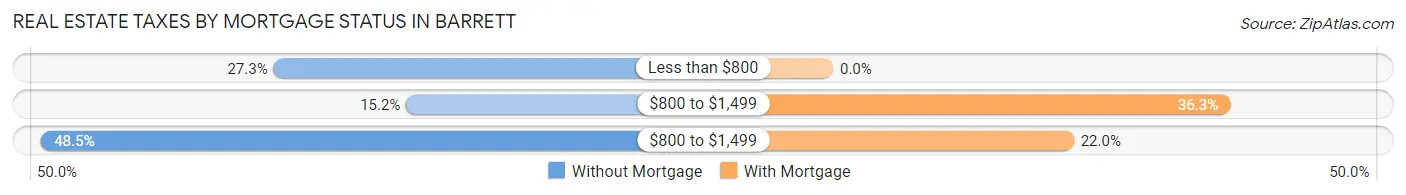
| Property Taxes | Without Mortgage | With Mortgage |
| Less than $800 | 9 (27.3%) | 0 (0.0%) |
| $800 to $1,499 | 5 (15.1%) | 33 (36.3%) |
| $800 to $1,499 | 16 (48.5%) | 20 (22.0%) |
| Total | 33 (100.0%) | 91 (100.0%) |
Health & Disability in Barrett
Health Insurance Coverage by Age in Barrett
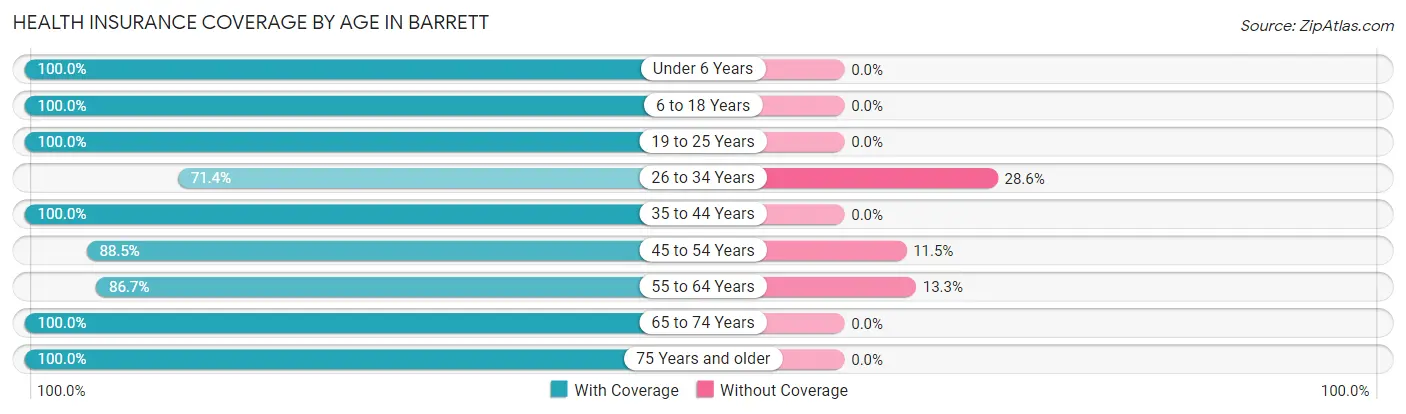
| Age Bracket | With Coverage | Without Coverage |
| Under 6 Years | 23 (100.0%) | 0 (0.0%) |
| 6 to 18 Years | 26 (100.0%) | 0 (0.0%) |
| 19 to 25 Years | 36 (100.0%) | 0 (0.0%) |
| 26 to 34 Years | 20 (71.4%) | 8 (28.6%) |
| 35 to 44 Years | 33 (100.0%) | 0 (0.0%) |
| 45 to 54 Years | 46 (88.5%) | 6 (11.5%) |
| 55 to 64 Years | 39 (86.7%) | 6 (13.3%) |
| 65 to 74 Years | 19 (100.0%) | 0 (0.0%) |
| 75 Years and older | 46 (100.0%) | 0 (0.0%) |
| Total | 288 (93.5%) | 20 (6.5%) |
Health Insurance Coverage by Citizenship Status in Barrett

| Citizenship Status | With Coverage | Without Coverage |
| Native Born | 23 (100.0%) | 0 (0.0%) |
| Foreign Born, Citizen | 26 (100.0%) | 0 (0.0%) |
| Foreign Born, not a Citizen | 36 (100.0%) | 0 (0.0%) |
Health Insurance Coverage by Household Income in Barrett
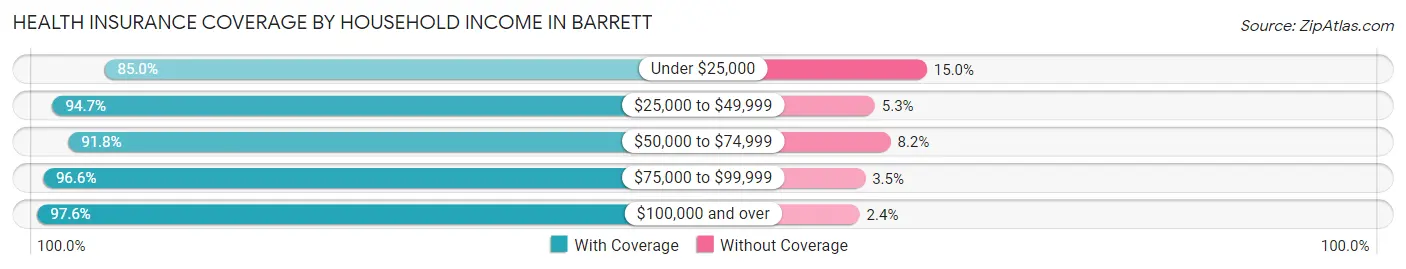
| Household Income | With Coverage | Without Coverage |
| Under $25,000 | 51 (85.0%) | 9 (15.0%) |
| $25,000 to $49,999 | 36 (94.7%) | 2 (5.3%) |
| $50,000 to $74,999 | 56 (91.8%) | 5 (8.2%) |
| $75,000 to $99,999 | 56 (96.6%) | 2 (3.5%) |
| $100,000 and over | 81 (97.6%) | 2 (2.4%) |
Public vs Private Health Insurance Coverage by Age in Barrett
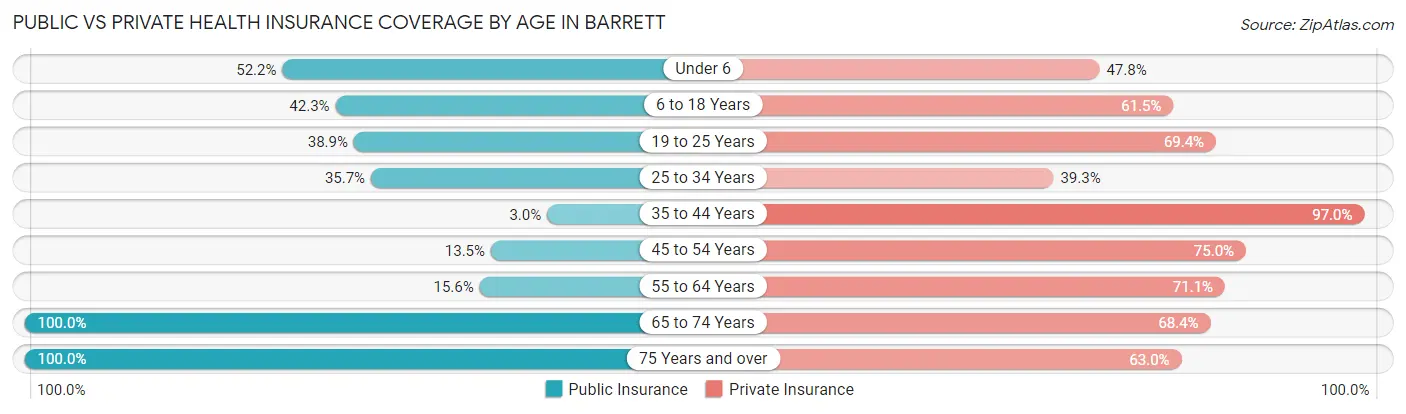
| Age Bracket | Public Insurance | Private Insurance |
| Under 6 | 12 (52.2%) | 11 (47.8%) |
| 6 to 18 Years | 11 (42.3%) | 16 (61.5%) |
| 19 to 25 Years | 14 (38.9%) | 25 (69.4%) |
| 25 to 34 Years | 10 (35.7%) | 11 (39.3%) |
| 35 to 44 Years | 1 (3.0%) | 32 (97.0%) |
| 45 to 54 Years | 7 (13.5%) | 39 (75.0%) |
| 55 to 64 Years | 7 (15.6%) | 32 (71.1%) |
| 65 to 74 Years | 19 (100.0%) | 13 (68.4%) |
| 75 Years and over | 46 (100.0%) | 29 (63.0%) |
| Total | 127 (41.2%) | 208 (67.5%) |
Disability Status by Sex by Age in Barrett
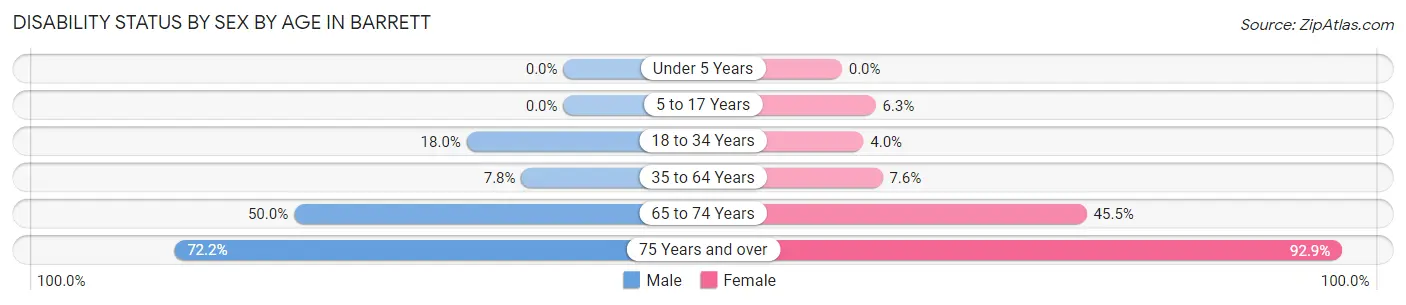
| Age Bracket | Male | Female |
| Under 5 Years | 0 (0.0%) | 0 (0.0%) |
| 5 to 17 Years | 0 (0.0%) | 1 (6.2%) |
| 18 to 34 Years | 7 (17.9%) | 1 (4.0%) |
| 35 to 64 Years | 6 (7.8%) | 4 (7.5%) |
| 65 to 74 Years | 4 (50.0%) | 5 (45.5%) |
| 75 Years and over | 13 (72.2%) | 26 (92.9%) |
Disability Class by Sex by Age in Barrett
Disability Class: Hearing Difficulty
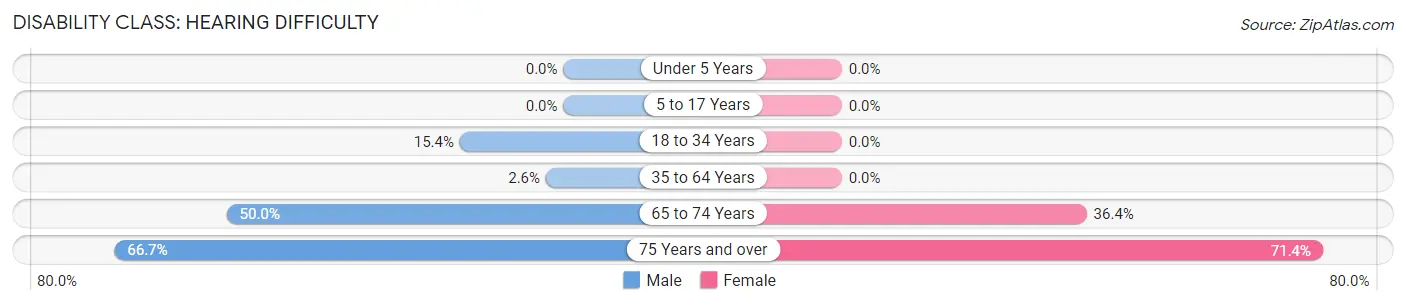
| Age Bracket | Male | Female |
| Under 5 Years | 0 (0.0%) | 0 (0.0%) |
| 5 to 17 Years | 0 (0.0%) | 0 (0.0%) |
| 18 to 34 Years | 6 (15.4%) | 0 (0.0%) |
| 35 to 64 Years | 2 (2.6%) | 0 (0.0%) |
| 65 to 74 Years | 4 (50.0%) | 4 (36.4%) |
| 75 Years and over | 12 (66.7%) | 20 (71.4%) |
Disability Class: Vision Difficulty
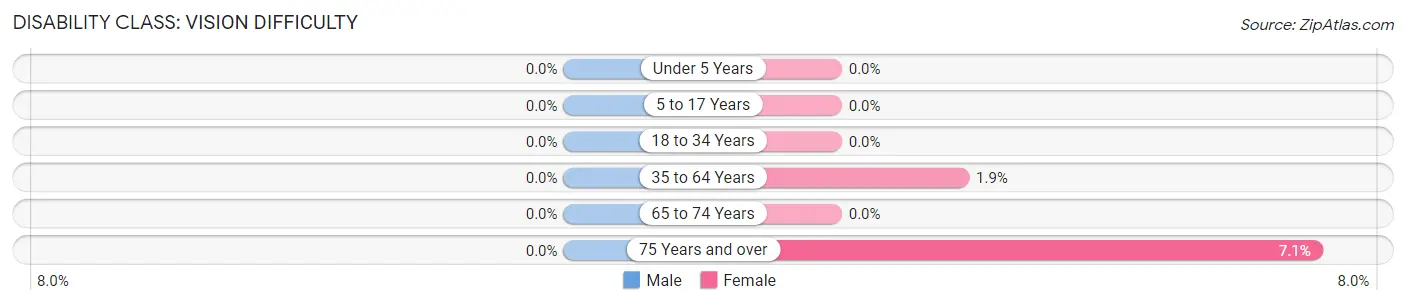
| Age Bracket | Male | Female |
| Under 5 Years | 0 (0.0%) | 0 (0.0%) |
| 5 to 17 Years | 0 (0.0%) | 0 (0.0%) |
| 18 to 34 Years | 0 (0.0%) | 0 (0.0%) |
| 35 to 64 Years | 0 (0.0%) | 1 (1.9%) |
| 65 to 74 Years | 0 (0.0%) | 0 (0.0%) |
| 75 Years and over | 0 (0.0%) | 2 (7.1%) |
Disability Class: Cognitive Difficulty
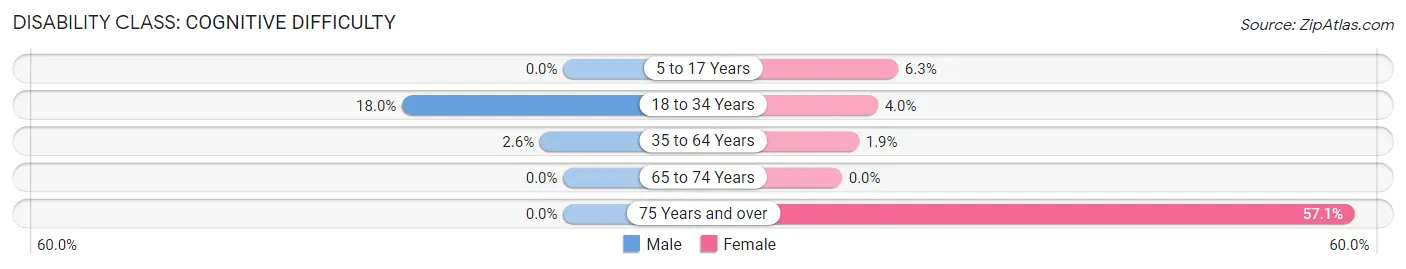
| Age Bracket | Male | Female |
| 5 to 17 Years | 0 (0.0%) | 1 (6.2%) |
| 18 to 34 Years | 7 (17.9%) | 1 (4.0%) |
| 35 to 64 Years | 2 (2.6%) | 1 (1.9%) |
| 65 to 74 Years | 0 (0.0%) | 0 (0.0%) |
| 75 Years and over | 0 (0.0%) | 16 (57.1%) |
Disability Class: Ambulatory Difficulty
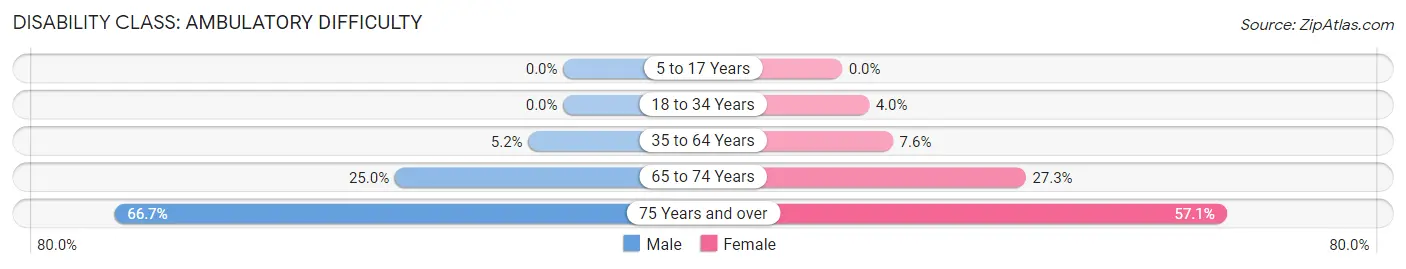
| Age Bracket | Male | Female |
| 5 to 17 Years | 0 (0.0%) | 0 (0.0%) |
| 18 to 34 Years | 0 (0.0%) | 1 (4.0%) |
| 35 to 64 Years | 4 (5.2%) | 4 (7.5%) |
| 65 to 74 Years | 2 (25.0%) | 3 (27.3%) |
| 75 Years and over | 12 (66.7%) | 16 (57.1%) |
Disability Class: Self-Care Difficulty
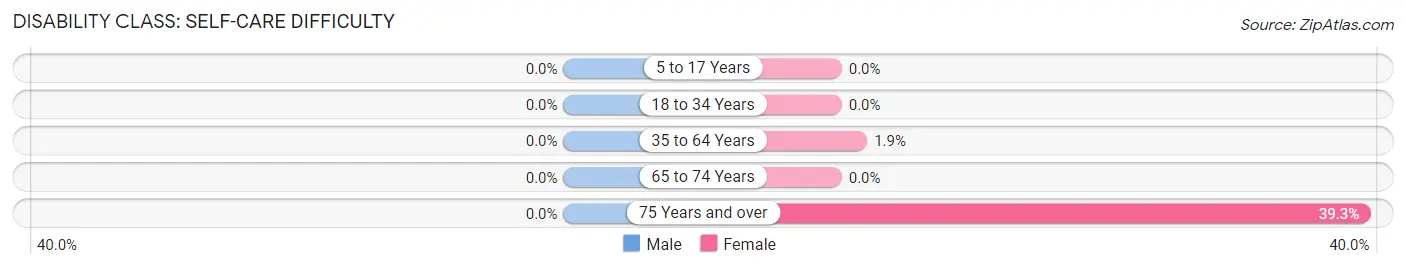
| Age Bracket | Male | Female |
| 5 to 17 Years | 0 (0.0%) | 0 (0.0%) |
| 18 to 34 Years | 0 (0.0%) | 0 (0.0%) |
| 35 to 64 Years | 0 (0.0%) | 1 (1.9%) |
| 65 to 74 Years | 0 (0.0%) | 0 (0.0%) |
| 75 Years and over | 0 (0.0%) | 11 (39.3%) |
Technology Access in Barrett
Computing Device Access in Barrett
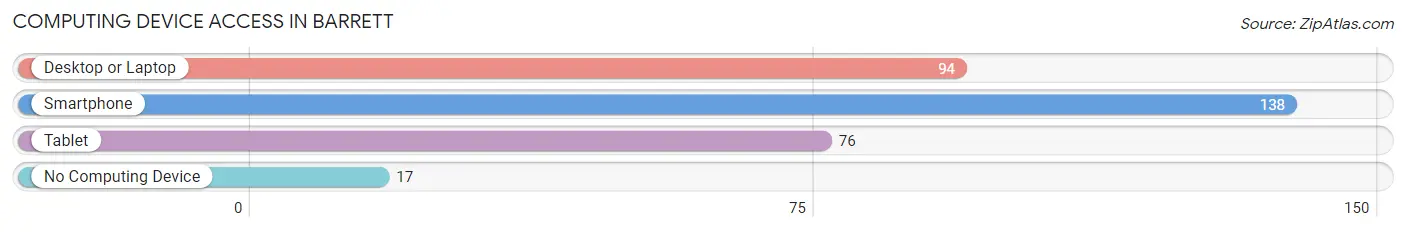
| Device Type | # Households | % Households |
| Desktop or Laptop | 94 | 58.8% |
| Smartphone | 138 | 86.3% |
| Tablet | 76 | 47.5% |
| No Computing Device | 17 | 10.6% |
| Total | 160 | 100.0% |
Internet Access in Barrett
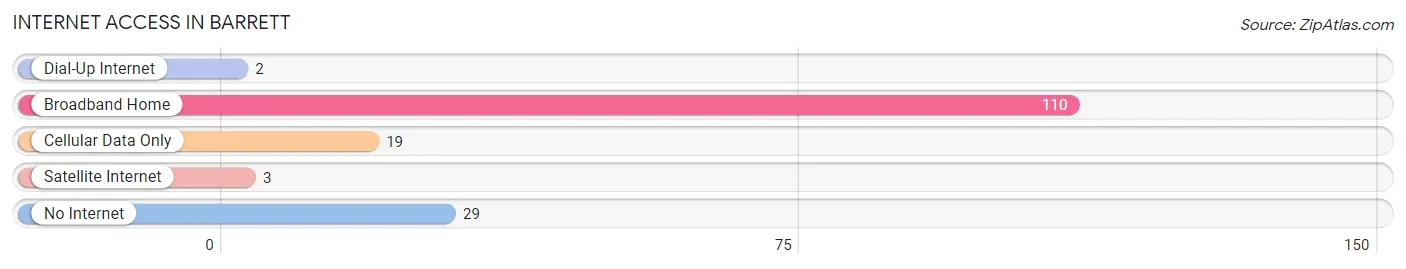
| Internet Type | # Households | % Households |
| Dial-Up Internet | 2 | 1.3% |
| Broadband Home | 110 | 68.8% |
| Cellular Data Only | 19 | 11.9% |
| Satellite Internet | 3 | 1.9% |
| No Internet | 29 | 18.1% |
| Total | 160 | 100.0% |
Barrett Summary
Barrett is a small city located in Stevens County, Minnesota. It is situated on the banks of the Pomme de Terre River, and is part of the Morris-Benson Area. The city has a population of 1,072 people, according to the 2010 census.
History
Barrett was founded in 1881 by a group of settlers from Wisconsin. The city was named after a local settler, John Barrett. The city was incorporated in 1883, and the first mayor was elected in 1884.
The city grew rapidly in the late 19th century, and by 1900, it had a population of 1,072. The city was a major center for the lumber industry, and it was also home to a number of other businesses, including a flour mill, a creamery, and a brickyard.
In the early 20th century, the city experienced a period of decline. The lumber industry had moved on, and the city’s population began to decline. By the 1950s, the population had dropped to just over 500.
In the late 20th century, the city began to experience a resurgence. The city’s population began to grow again, and new businesses began to move into the area. Today, the city is a thriving community with a population of 1,072.
Geography
Barrett is located in Stevens County, Minnesota. It is situated on the banks of the Pomme de Terre River, and is part of the Morris-Benson Area. The city has a total area of 1.2 square miles, all of which is land.
The city is located in a rural area, and is surrounded by farmland and woodlands. The city is located about 25 miles from the city of Morris, and about 50 miles from the city of St. Cloud.
Economy
Barrett’s economy is largely based on agriculture and tourism. The city is home to a number of farms, and the surrounding area is known for its production of corn, soybeans, and other crops.
The city is also home to a number of small businesses, including restaurants, retail stores, and service providers. The city is also home to a number of tourist attractions, including the Pomme de Terre River, the Stevens County Historical Society Museum, and the Stevens County Fairgrounds.
Demographics
According to the 2010 census, Barrett has a population of 1,072 people. The population is spread out with 49.2% male and 50.8% female. The median age is 43.7 years, and the median household income is $45,938.
The city is predominantly white, with 95.2% of the population identifying as white. The city also has a small Hispanic population, with 2.2% of the population identifying as Hispanic or Latino.
Barrett is a small city with a rich history and a bright future. The city is home to a diverse population, and it is a thriving center for agriculture and tourism. The city is a great place to live, work, and play, and it is sure to continue to grow and prosper in the years to come.
Common Questions
What is Per Capita Income in Barrett?
Per Capita income in Barrett is $29,436.
What is the Median Family Income in Barrett?
Median Family Income in Barrett is $80,625.
What is the Median Household income in Barrett?
Median Household Income in Barrett is $50,833.
What is Income or Wage Gap in Barrett?
Income or Wage Gap in Barrett is 39.6%.
Women in Barrett earn 60.4 cents for every dollar earned by a man.
What is Inequality or Gini Index in Barrett?
Inequality or Gini Index in Barrett is 0.44.
What is the Total Population of Barrett?
Total Population of Barrett is 352.
What is the Total Male Population of Barrett?
Total Male Population of Barrett is 188.
What is the Total Female Population of Barrett?
Total Female Population of Barrett is 164.
What is the Ratio of Males per 100 Females in Barrett?
There are 114.63 Males per 100 Females in Barrett.
What is the Ratio of Females per 100 Males in Barrett?
There are 87.23 Females per 100 Males in Barrett.
What is the Median Population Age in Barrett?
Median Population Age in Barrett is 49.5 Years.
What is the Average Family Size in Barrett
Average Family Size in Barrett is 2.5 People.
What is the Average Household Size in Barrett
Average Household Size in Barrett is 1.9 People.
How Large is the Labor Force in Barrett?
There are 168 People in the Labor Forcein in Barrett.
What is the Percentage of People in the Labor Force in Barrett?
55.3% of People are in the Labor Force in Barrett.
What is the Unemployment Rate in Barrett?
Unemployment Rate in Barrett is 3.6%.