Sauk Centre, MN Map & Demographics
Sauk Centre Map
Sauk Centre Overview
$32,533
PER CAPITA INCOME
$76,458
AVG FAMILY INCOME
$68,094
AVG HOUSEHOLD INCOME
28.7%
WAGE / INCOME GAP [ % ]
71.3¢/ $1
WAGE / INCOME GAP [ $ ]
0.41
INEQUALITY / GINI INDEX
4,568
TOTAL POPULATION
2,167
MALE POPULATION
2,401
FEMALE POPULATION
90.25
MALES / 100 FEMALES
110.80
FEMALES / 100 MALES
36.9
MEDIAN AGE
2.8
AVG FAMILY SIZE
2.2
AVG HOUSEHOLD SIZE
2,520
LABOR FORCE [ PEOPLE ]
68.6%
PERCENT IN LABOR FORCE
6.8%
UNEMPLOYMENT RATE
Sauk Centre Zip Codes
Sauk Centre Area Codes
Income in Sauk Centre
Income Overview in Sauk Centre
Per Capita Income in Sauk Centre is $32,533, while median incomes of families and households are $76,458 and $68,094 respectively.
| Characteristic | Number | Measure |
| Per Capita Income | 4,568 | $32,533 |
| Median Family Income | 1,132 | $76,458 |
| Mean Family Income | 1,132 | $92,597 |
| Median Household Income | 1,965 | $68,094 |
| Mean Household Income | 1,965 | $75,018 |
| Income Deficit | 1,132 | $0 |
| Wage / Income Gap (%) | 4,568 | 28.66% |
| Wage / Income Gap ($) | 4,568 | 71.34¢ per $1 |
| Gini / Inequality Index | 4,568 | 0.41 |
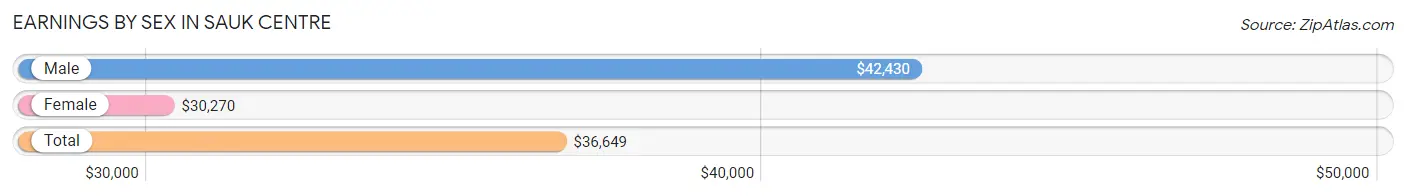
Earnings by Sex in Sauk Centre
Average Earnings in Sauk Centre are $36,649, $42,430 for men and $30,270 for women, a difference of 28.7%.
| Sex | Number | Average Earnings |
| Male | 1,378 (53.8%) | $42,430 |
| Female | 1,181 (46.2%) | $30,270 |
| Total | 2,559 (100.0%) | $36,649 |
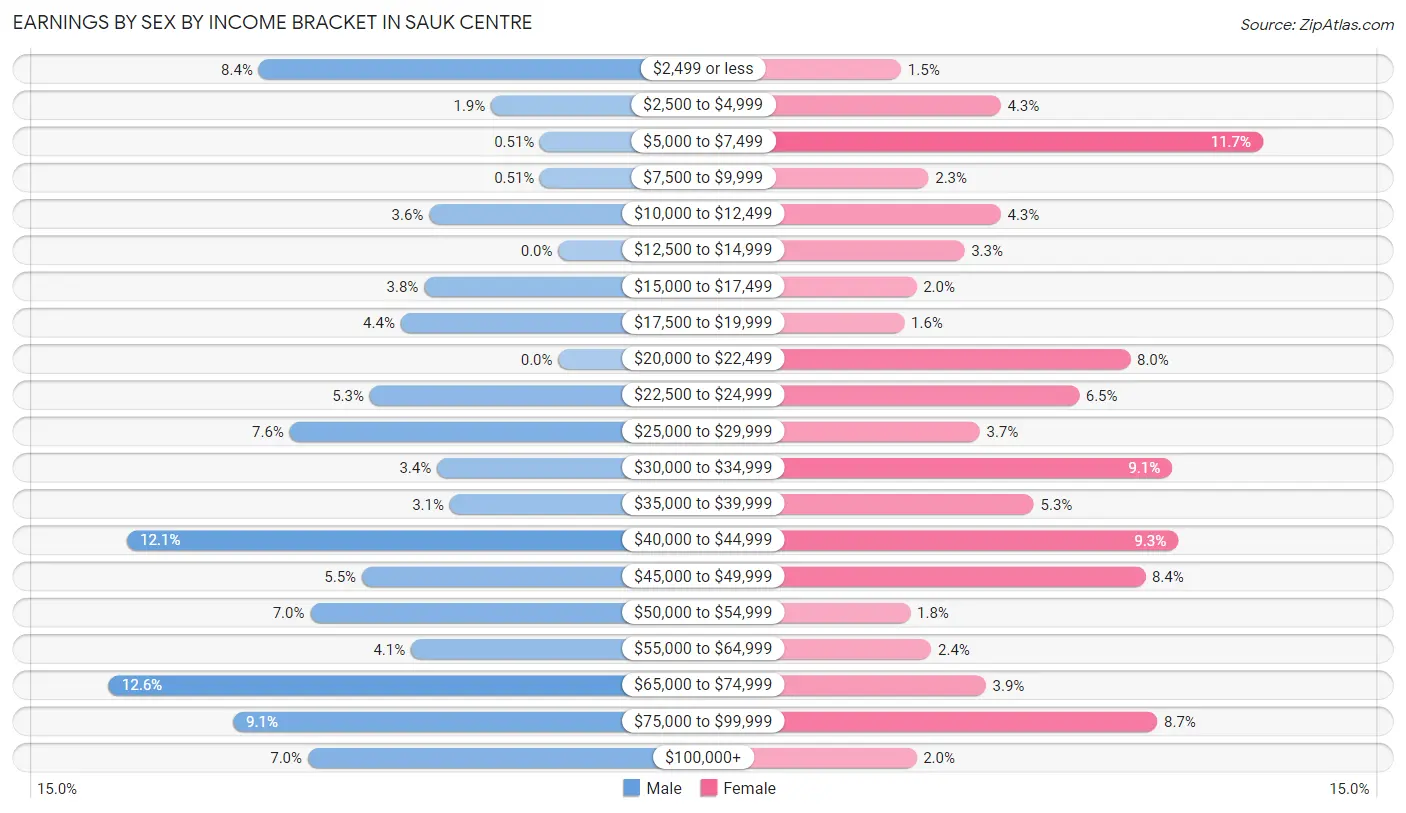
Earnings by Sex by Income Bracket in Sauk Centre
The most common earnings brackets in Sauk Centre are $65,000 to $74,999 for men (174 | 12.6%) and $5,000 to $7,499 for women (138 | 11.7%).
| Income | Male | Female |
| $2,499 or less | 116 (8.4%) | 18 (1.5%) |
| $2,500 to $4,999 | 26 (1.9%) | 51 (4.3%) |
| $5,000 to $7,499 | 7 (0.5%) | 138 (11.7%) |
| $7,500 to $9,999 | 7 (0.5%) | 27 (2.3%) |
| $10,000 to $12,499 | 50 (3.6%) | 51 (4.3%) |
| $12,500 to $14,999 | 0 (0.0%) | 39 (3.3%) |
| $15,000 to $17,499 | 52 (3.8%) | 23 (1.9%) |
| $17,500 to $19,999 | 61 (4.4%) | 19 (1.6%) |
| $20,000 to $22,499 | 0 (0.0%) | 94 (8.0%) |
| $22,500 to $24,999 | 73 (5.3%) | 77 (6.5%) |
| $25,000 to $29,999 | 104 (7.5%) | 44 (3.7%) |
| $30,000 to $34,999 | 47 (3.4%) | 108 (9.1%) |
| $35,000 to $39,999 | 42 (3.0%) | 62 (5.2%) |
| $40,000 to $44,999 | 167 (12.1%) | 110 (9.3%) |
| $45,000 to $49,999 | 76 (5.5%) | 99 (8.4%) |
| $50,000 to $54,999 | 96 (7.0%) | 21 (1.8%) |
| $55,000 to $64,999 | 57 (4.1%) | 28 (2.4%) |
| $65,000 to $74,999 | 174 (12.6%) | 46 (3.9%) |
| $75,000 to $99,999 | 126 (9.1%) | 103 (8.7%) |
| $100,000+ | 97 (7.0%) | 23 (1.9%) |
| Total | 1,378 (100.0%) | 1,181 (100.0%) |
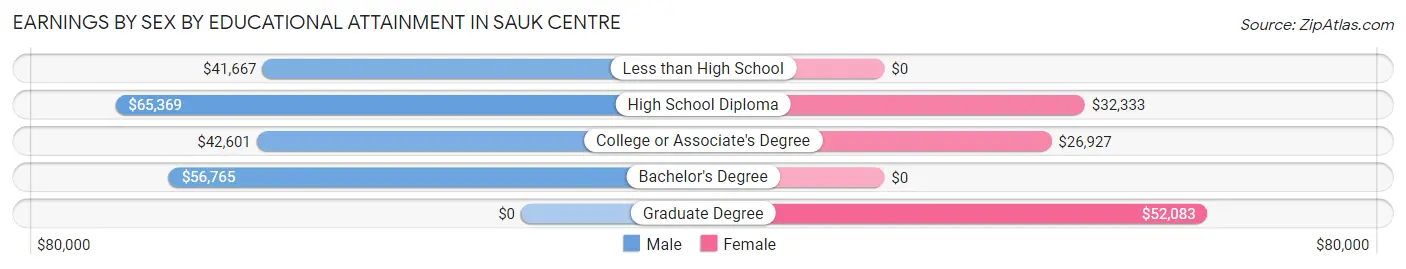
Earnings by Sex by Educational Attainment in Sauk Centre
Average earnings in Sauk Centre are $46,151 for men and $32,000 for women, a difference of 30.7%. Men with an educational attainment of high school diploma enjoy the highest average annual earnings of $65,369, while those with less than high school education earn the least with $41,667. Women with an educational attainment of graduate degree earn the most with the average annual earnings of $52,083, while those with college or associate's degree education have the smallest earnings of $26,927.
| Educational Attainment | Male Income | Female Income |
| Less than High School | $41,667 | $0 |
| High School Diploma | $65,369 | $32,333 |
| College or Associate's Degree | $42,601 | $26,927 |
| Bachelor's Degree | $56,765 | $0 |
| Graduate Degree | - | - |
| Total | $46,151 | $32,000 |
Family Income in Sauk Centre
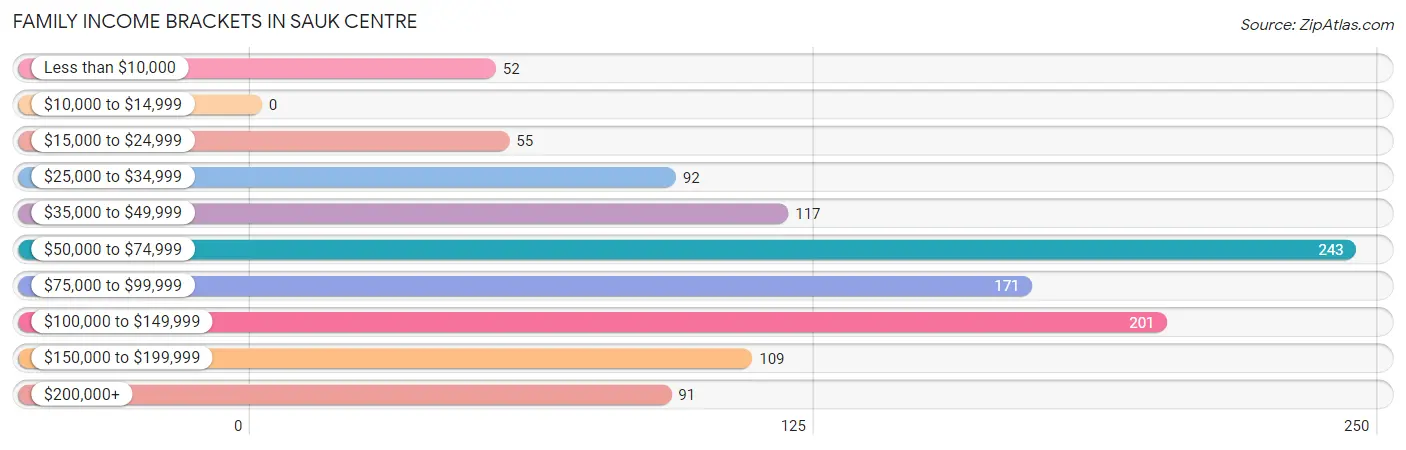
Family Income Brackets in Sauk Centre
According to the Sauk Centre family income data, there are 243 families falling into the $50,000 to $74,999 income range, which is the most common income bracket and makes up 21.5% of all families.
| Income Bracket | # Families | % Families |
| Less than $10,000 | 52 | 4.6% |
| $10,000 to $14,999 | 0 | 0.0% |
| $15,000 to $24,999 | 55 | 4.9% |
| $25,000 to $34,999 | 92 | 8.1% |
| $35,000 to $49,999 | 117 | 10.3% |
| $50,000 to $74,999 | 243 | 21.5% |
| $75,000 to $99,999 | 171 | 15.1% |
| $100,000 to $149,999 | 201 | 17.8% |
| $150,000 to $199,999 | 109 | 9.6% |
| $200,000+ | 91 | 8.0% |
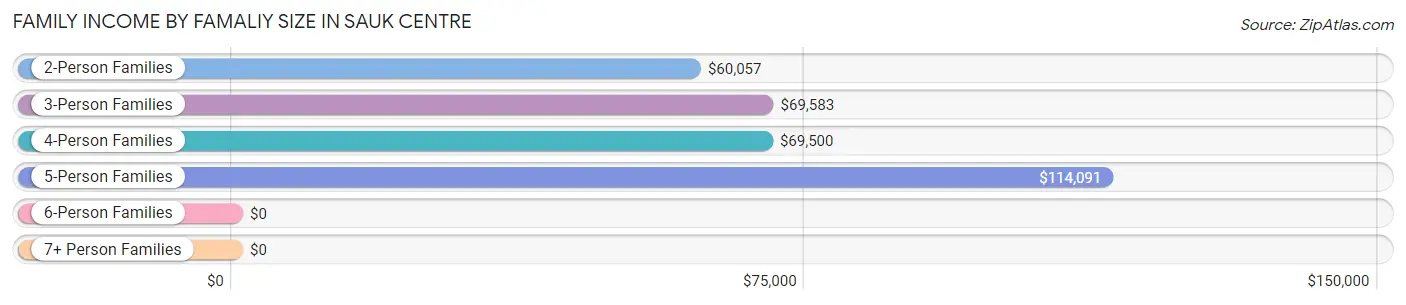
Family Income by Famaliy Size in Sauk Centre
5-person families (98 | 8.7%) account for the highest median family income in Sauk Centre with $114,091 per family, while 2-person families (579 | 51.1%) have the highest median income of $30,028 per family member.
| Income Bracket | # Families | Median Income |
| 2-Person Families | 579 (51.1%) | $60,057 |
| 3-Person Families | 294 (26.0%) | $69,583 |
| 4-Person Families | 142 (12.5%) | $69,500 |
| 5-Person Families | 98 (8.7%) | $114,091 |
| 6-Person Families | 0 (0.0%) | $0 |
| 7+ Person Families | 19 (1.7%) | $0 |
| Total | 1,132 (100.0%) | $76,458 |
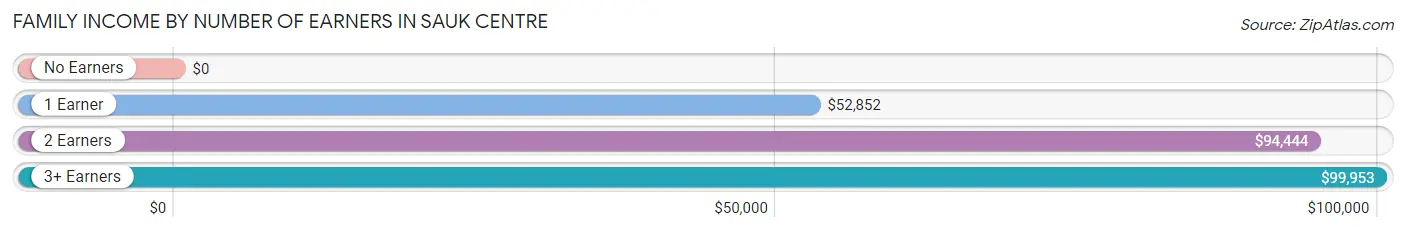
Family Income by Number of Earners in Sauk Centre
| Number of Earners | # Families | Median Income |
| No Earners | 183 (16.2%) | $0 |
| 1 Earner | 325 (28.7%) | $52,852 |
| 2 Earners | 496 (43.8%) | $94,444 |
| 3+ Earners | 128 (11.3%) | $99,953 |
| Total | 1,132 (100.0%) | $76,458 |
Household Income in Sauk Centre
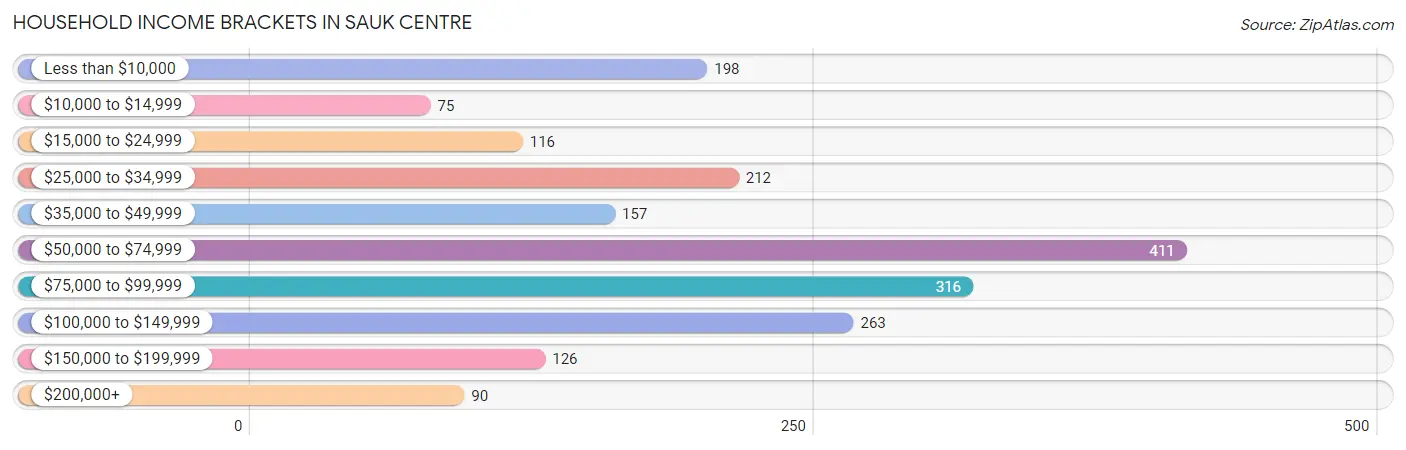
Household Income Brackets in Sauk Centre
With 411 households falling in the category, the $50,000 to $74,999 income range is the most frequent in Sauk Centre, accounting for 20.9% of all households. In contrast, only 75 households (3.8%) fall into the $10,000 to $14,999 income bracket, making it the least populous group.
| Income Bracket | # Households | % Households |
| Less than $10,000 | 198 | 10.1% |
| $10,000 to $14,999 | 75 | 3.8% |
| $15,000 to $24,999 | 116 | 5.9% |
| $25,000 to $34,999 | 212 | 10.8% |
| $35,000 to $49,999 | 157 | 8.0% |
| $50,000 to $74,999 | 411 | 20.9% |
| $75,000 to $99,999 | 316 | 16.1% |
| $100,000 to $149,999 | 263 | 13.4% |
| $150,000 to $199,999 | 126 | 6.4% |
| $200,000+ | 90 | 4.6% |
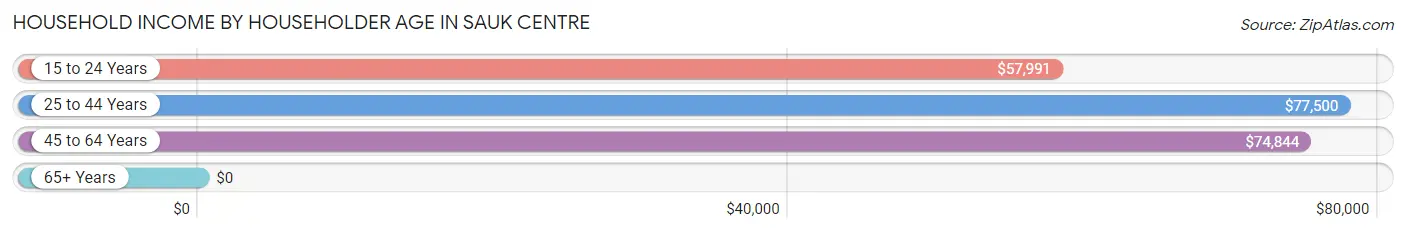
Household Income by Householder Age in Sauk Centre
The median household income in Sauk Centre is $68,094, with the highest median household income of $77,500 found in the 25 to 44 years age bracket for the primary householder. A total of 606 households (30.8%) fall into this category. Meanwhile, the 65+ years age bracket for the primary householder has the lowest median household income of $0, with 608 households (30.9%) in this group.
| Income Bracket | # Households | Median Income |
| 15 to 24 Years | 159 (8.1%) | $57,991 |
| 25 to 44 Years | 606 (30.8%) | $77,500 |
| 45 to 64 Years | 592 (30.1%) | $74,844 |
| 65+ Years | 608 (30.9%) | $0 |
| Total | 1,965 (100.0%) | $68,094 |
Poverty in Sauk Centre
Income Below Poverty by Sex and Age in Sauk Centre
With 14.5% poverty level for males and 17.3% for females among the residents of Sauk Centre, 12 to 14 year old males and 18 to 24 year old females are the most vulnerable to poverty, with 24 males (51.1%) and 124 females (44.8%) in their respective age groups living below the poverty level.
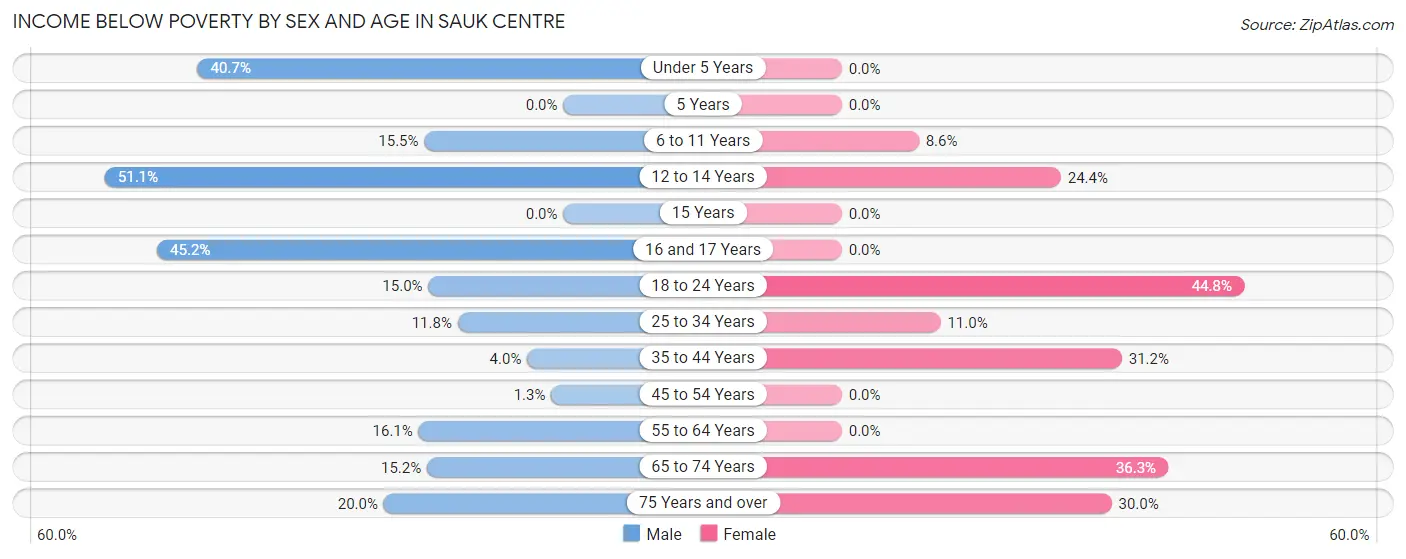
| Age Bracket | Male | Female |
| Under 5 Years | 22 (40.7%) | 0 (0.0%) |
| 5 Years | 0 (0.0%) | 0 (0.0%) |
| 6 to 11 Years | 24 (15.5%) | 21 (8.6%) |
| 12 to 14 Years | 24 (51.1%) | 10 (24.4%) |
| 15 Years | 0 (0.0%) | 0 (0.0%) |
| 16 and 17 Years | 19 (45.2%) | 0 (0.0%) |
| 18 to 24 Years | 26 (15.0%) | 124 (44.8%) |
| 25 to 34 Years | 54 (11.8%) | 39 (11.0%) |
| 35 to 44 Years | 9 (4.0%) | 58 (31.2%) |
| 45 to 54 Years | 2 (1.3%) | 0 (0.0%) |
| 55 to 64 Years | 59 (16.1%) | 0 (0.0%) |
| 65 to 74 Years | 34 (15.2%) | 73 (36.3%) |
| 75 Years and over | 32 (20.0%) | 85 (30.0%) |
| Total | 305 (14.5%) | 410 (17.3%) |
Income Above Poverty by Sex and Age in Sauk Centre
According to the poverty statistics in Sauk Centre, males aged 5 years and females aged under 5 years are the age groups that are most secure financially, with 100.0% of males and 100.0% of females in these age groups living above the poverty line.
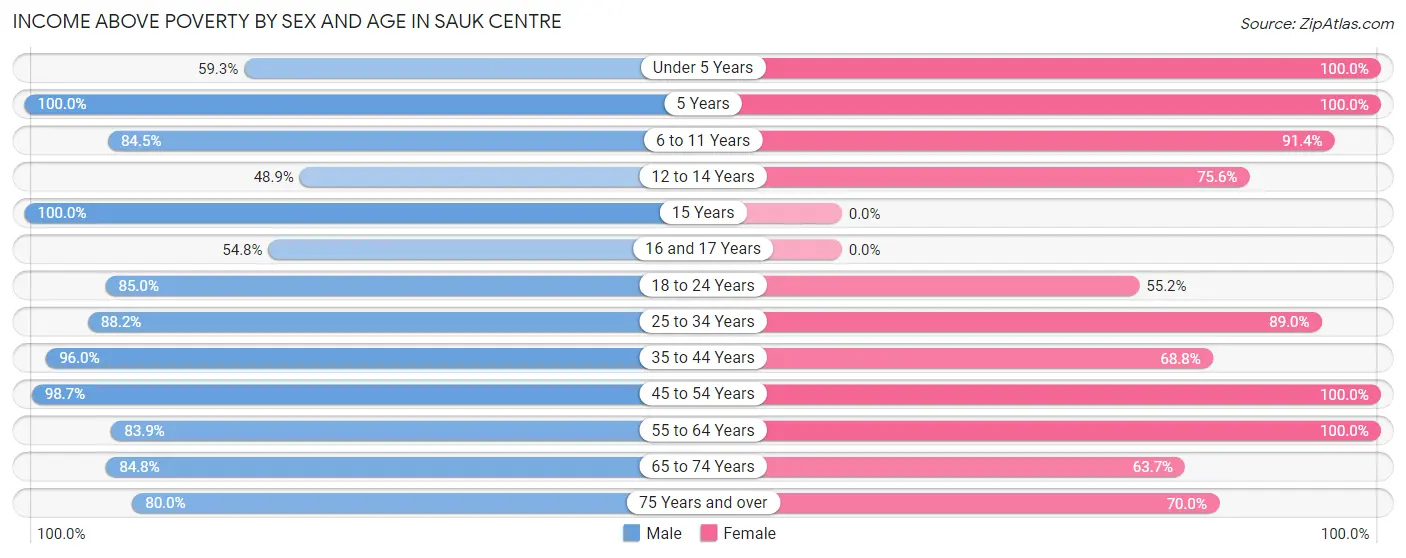
| Age Bracket | Male | Female |
| Under 5 Years | 32 (59.3%) | 280 (100.0%) |
| 5 Years | 36 (100.0%) | 26 (100.0%) |
| 6 to 11 Years | 131 (84.5%) | 224 (91.4%) |
| 12 to 14 Years | 23 (48.9%) | 31 (75.6%) |
| 15 Years | 10 (100.0%) | 0 (0.0%) |
| 16 and 17 Years | 23 (54.8%) | 0 (0.0%) |
| 18 to 24 Years | 147 (85.0%) | 153 (55.2%) |
| 25 to 34 Years | 405 (88.2%) | 316 (89.0%) |
| 35 to 44 Years | 215 (96.0%) | 128 (68.8%) |
| 45 to 54 Years | 147 (98.7%) | 174 (100.0%) |
| 55 to 64 Years | 307 (83.9%) | 302 (100.0%) |
| 65 to 74 Years | 190 (84.8%) | 128 (63.7%) |
| 75 Years and over | 128 (80.0%) | 198 (70.0%) |
| Total | 1,794 (85.5%) | 1,960 (82.7%) |
Income Below Poverty Among Married-Couple Families in Sauk Centre
The poverty statistics for married-couple families in Sauk Centre show that 5.2% or 41 of the total 788 families live below the poverty line. Families with no children have the highest poverty rate of 7.5%, comprising of 41 families. On the other hand, families with 1 or 2 children have the lowest poverty rate of 0.0%, which includes 0 families.
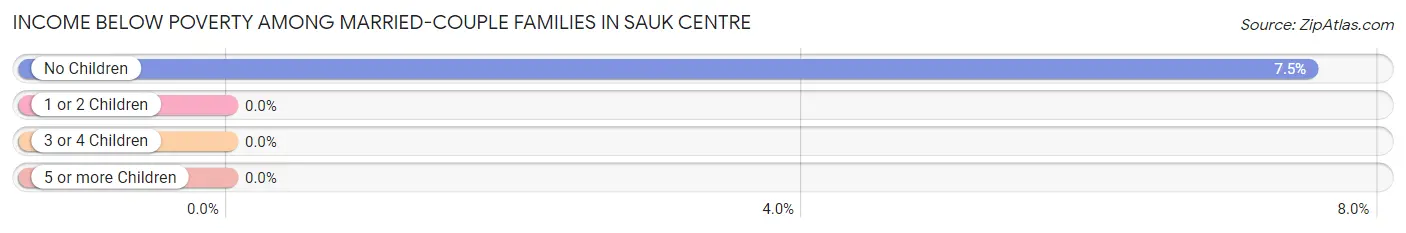
| Children | Above Poverty | Below Poverty |
| No Children | 504 (92.5%) | 41 (7.5%) |
| 1 or 2 Children | 126 (100.0%) | 0 (0.0%) |
| 3 or 4 Children | 98 (100.0%) | 0 (0.0%) |
| 5 or more Children | 19 (100.0%) | 0 (0.0%) |
| Total | 747 (94.8%) | 41 (5.2%) |
Income Below Poverty Among Single-Parent Households in Sauk Centre
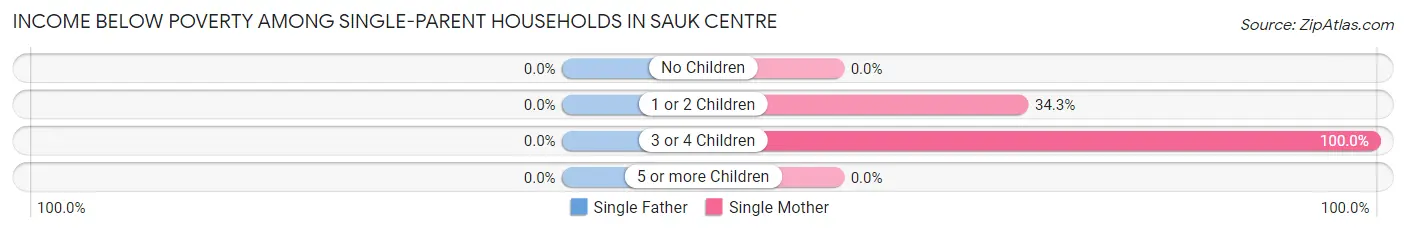
| Children | Single Father | Single Mother |
| No Children | 0 (0.0%) | 0 (0.0%) |
| 1 or 2 Children | 0 (0.0%) | 34 (34.3%) |
| 3 or 4 Children | 0 (0.0%) | 22 (100.0%) |
| 5 or more Children | 0 (0.0%) | 0 (0.0%) |
| Total | 0 (0.0%) | 56 (23.3%) |
Income Below Poverty Among Married-Couple vs Single-Parent Households in Sauk Centre
The poverty data for Sauk Centre shows that 41 of the married-couple family households (5.2%) and 56 of the single-parent households (16.3%) are living below the poverty level. Within the married-couple family households, those with no children have the highest poverty rate, with 41 households (7.5%) falling below the poverty line. Among the single-parent households, those with 3 or 4 children have the highest poverty rate, with 22 household (100.0%) living below poverty.
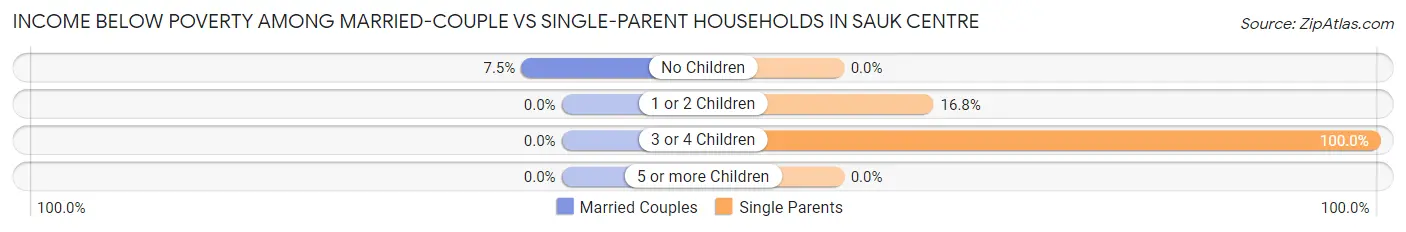
| Children | Married-Couple Families | Single-Parent Households |
| No Children | 41 (7.5%) | 0 (0.0%) |
| 1 or 2 Children | 0 (0.0%) | 34 (16.8%) |
| 3 or 4 Children | 0 (0.0%) | 22 (100.0%) |
| 5 or more Children | 0 (0.0%) | 0 (0.0%) |
| Total | 41 (5.2%) | 56 (16.3%) |
Race in Sauk Centre
The most populous races in Sauk Centre are White / Caucasian (3,987 | 87.3%), Hispanic or Latino (369 | 8.1%), and Two or more Races (222 | 4.9%).
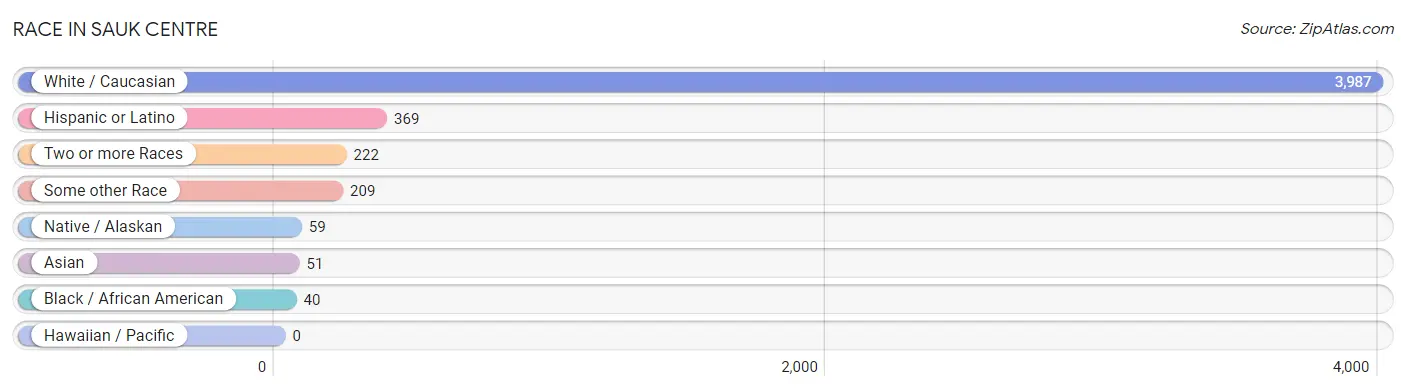
| Race | # Population | % Population |
| Asian | 51 | 1.1% |
| Black / African American | 40 | 0.9% |
| Hawaiian / Pacific | 0 | 0.0% |
| Hispanic or Latino | 369 | 8.1% |
| Native / Alaskan | 59 | 1.3% |
| White / Caucasian | 3,987 | 87.3% |
| Two or more Races | 222 | 4.9% |
| Some other Race | 209 | 4.6% |
| Total | 4,568 | 100.0% |
Ancestry in Sauk Centre
The most populous ancestries reported in Sauk Centre are German (2,044 | 44.8%), Norwegian (580 | 12.7%), Irish (322 | 7.0%), Mexican (275 | 6.0%), and Polish (263 | 5.8%), together accounting for 76.3% of all Sauk Centre residents.
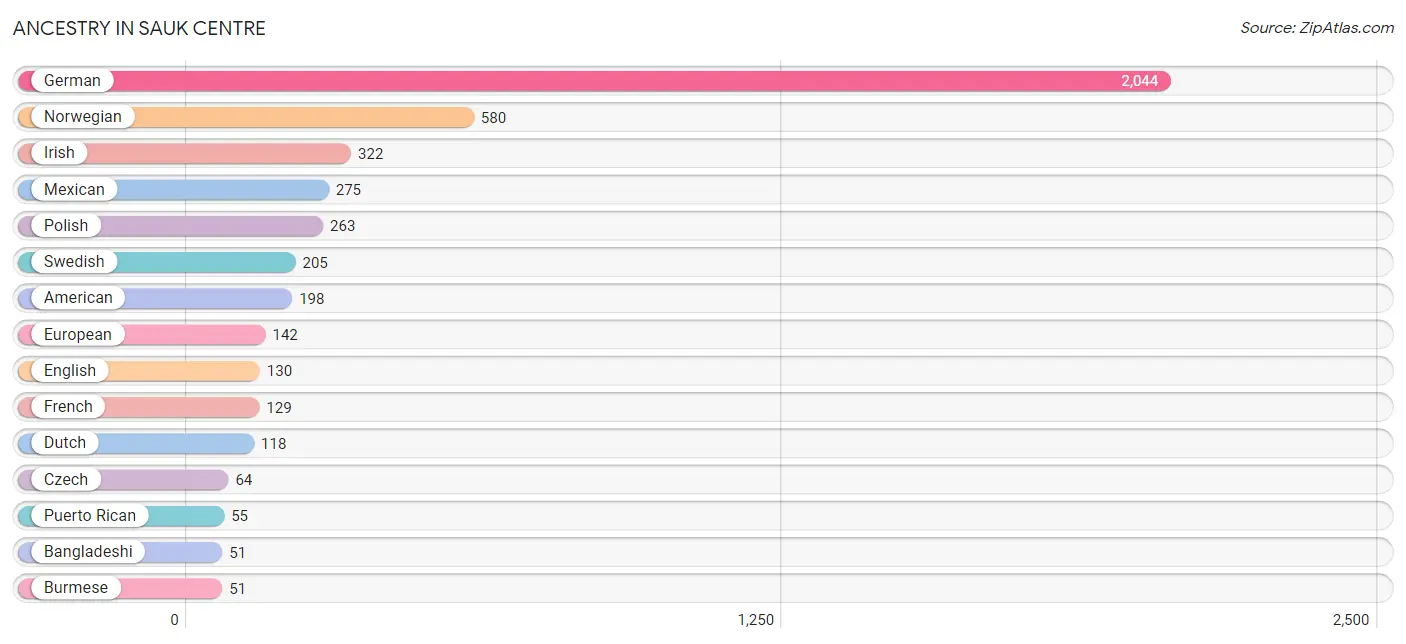
| Ancestry | # Population | % Population |
| American | 198 | 4.3% |
| Austrian | 14 | 0.3% |
| Bangladeshi | 51 | 1.1% |
| Brazilian | 34 | 0.7% |
| British | 17 | 0.4% |
| Burmese | 51 | 1.1% |
| Central American | 39 | 0.9% |
| Chippewa | 23 | 0.5% |
| Czech | 64 | 1.4% |
| Danish | 5 | 0.1% |
| Dutch | 118 | 2.6% |
| English | 130 | 2.9% |
| European | 142 | 3.1% |
| Finnish | 21 | 0.5% |
| French | 129 | 2.8% |
| German | 2,044 | 44.8% |
| Guatemalan | 27 | 0.6% |
| Honduran | 12 | 0.3% |
| Icelander | 7 | 0.2% |
| Indian (Asian) | 48 | 1.1% |
| Irish | 322 | 7.0% |
| Italian | 13 | 0.3% |
| Mexican | 275 | 6.0% |
| Native Hawaiian | 48 | 1.1% |
| Northern European | 13 | 0.3% |
| Norwegian | 580 | 12.7% |
| Polish | 263 | 5.8% |
| Puerto Rican | 55 | 1.2% |
| Scandinavian | 19 | 0.4% |
| Sioux | 24 | 0.5% |
| Swedish | 205 | 4.5% |
| Ukrainian | 22 | 0.5% | View All 32 Rows |
Immigrants in Sauk Centre
The most numerous immigrant groups reported in Sauk Centre came from Central America (81 | 1.8%), Latin America (81 | 1.8%), Mexico (69 | 1.5%), Europe (15 | 0.3%), and Honduras (12 | 0.3%), together accounting for 5.6% of all Sauk Centre residents.

| Immigration Origin | # Population | % Population |
| Central America | 81 | 1.8% |
| Eastern Europe | 10 | 0.2% |
| Europe | 15 | 0.3% |
| Germany | 5 | 0.1% |
| Honduras | 12 | 0.3% |
| Latin America | 81 | 1.8% |
| Mexico | 69 | 1.5% |
| Russia | 10 | 0.2% |
| Western Europe | 5 | 0.1% | View All 9 Rows |
Sex and Age in Sauk Centre
Sex and Age in Sauk Centre
The most populous age groups in Sauk Centre are 25 to 29 Years (245 | 11.3%) for men and Under 5 Years (280 | 11.7%) for women.
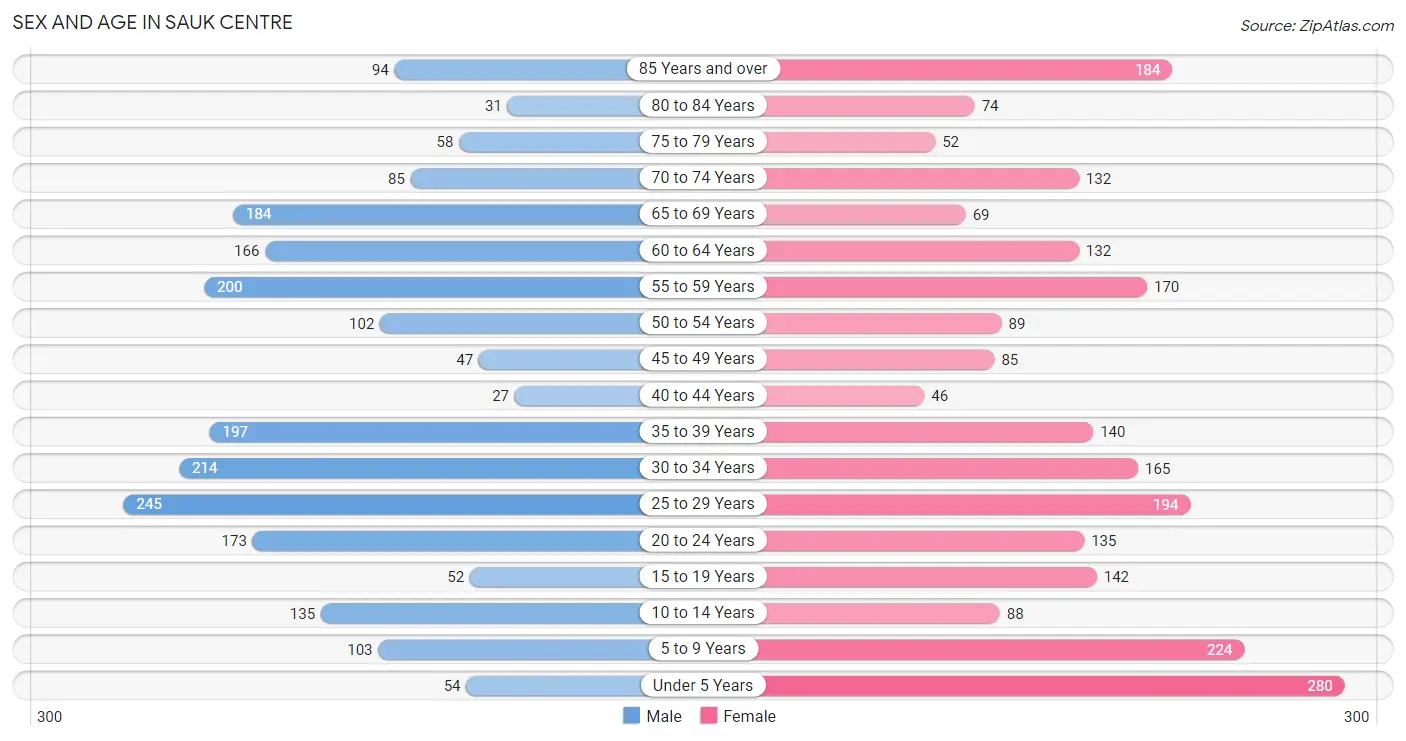
| Age Bracket | Male | Female |
| Under 5 Years | 54 (2.5%) | 280 (11.7%) |
| 5 to 9 Years | 103 (4.8%) | 224 (9.3%) |
| 10 to 14 Years | 135 (6.2%) | 88 (3.7%) |
| 15 to 19 Years | 52 (2.4%) | 142 (5.9%) |
| 20 to 24 Years | 173 (8.0%) | 135 (5.6%) |
| 25 to 29 Years | 245 (11.3%) | 194 (8.1%) |
| 30 to 34 Years | 214 (9.9%) | 165 (6.9%) |
| 35 to 39 Years | 197 (9.1%) | 140 (5.8%) |
| 40 to 44 Years | 27 (1.3%) | 46 (1.9%) |
| 45 to 49 Years | 47 (2.2%) | 85 (3.5%) |
| 50 to 54 Years | 102 (4.7%) | 89 (3.7%) |
| 55 to 59 Years | 200 (9.2%) | 170 (7.1%) |
| 60 to 64 Years | 166 (7.7%) | 132 (5.5%) |
| 65 to 69 Years | 184 (8.5%) | 69 (2.9%) |
| 70 to 74 Years | 85 (3.9%) | 132 (5.5%) |
| 75 to 79 Years | 58 (2.7%) | 52 (2.2%) |
| 80 to 84 Years | 31 (1.4%) | 74 (3.1%) |
| 85 Years and over | 94 (4.3%) | 184 (7.7%) |
| Total | 2,167 (100.0%) | 2,401 (100.0%) |
Families and Households in Sauk Centre
Median Family Size in Sauk Centre
The median family size in Sauk Centre is 2.83 persons per family, with married-couple families (788 | 69.6%) accounting for the largest median family size of 2.96 persons per family. On the other hand, single female/mother families (240 | 21.2%) represent the smallest median family size with 2.51 persons per family.
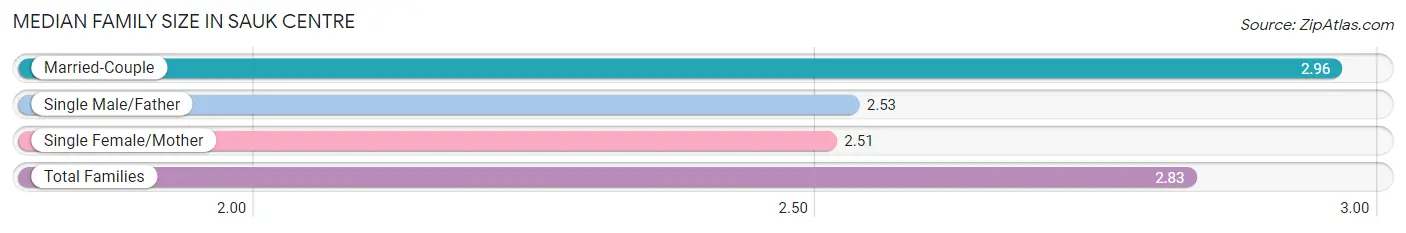
| Family Type | # Families | Family Size |
| Married-Couple | 788 (69.6%) | 2.96 |
| Single Male/Father | 104 (9.2%) | 2.53 |
| Single Female/Mother | 240 (21.2%) | 2.51 |
| Total Families | 1,132 (100.0%) | 2.83 |
Median Household Size in Sauk Centre
The median household size in Sauk Centre is 2.25 persons per household, with single male/father households (104 | 5.3%) accounting for the largest median household size of 3.27 persons per household. non-family households (833 | 42.4%) represent the smallest median household size with 1.23 persons per household.
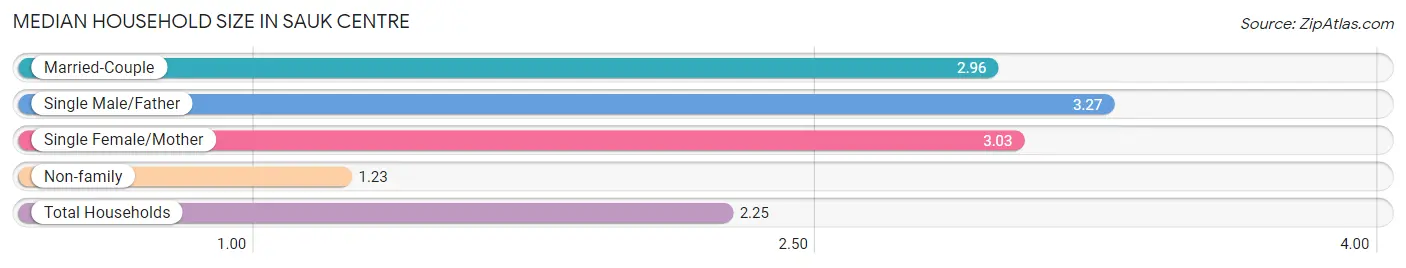
| Household Type | # Households | Household Size |
| Married-Couple | 788 (40.1%) | 2.96 |
| Single Male/Father | 104 (5.3%) | 3.27 |
| Single Female/Mother | 240 (12.2%) | 3.03 |
| Non-family | 833 (42.4%) | 1.23 |
| Total Households | 1,965 (100.0%) | 2.25 |
Household Size by Marriage Status in Sauk Centre
Out of a total of 1,965 households in Sauk Centre, 1,132 (57.6%) are family households, while 833 (42.4%) are nonfamily households. The most numerous type of family households are 2-person households, comprising 509, and the most common type of nonfamily households are 1-person households, comprising 579.
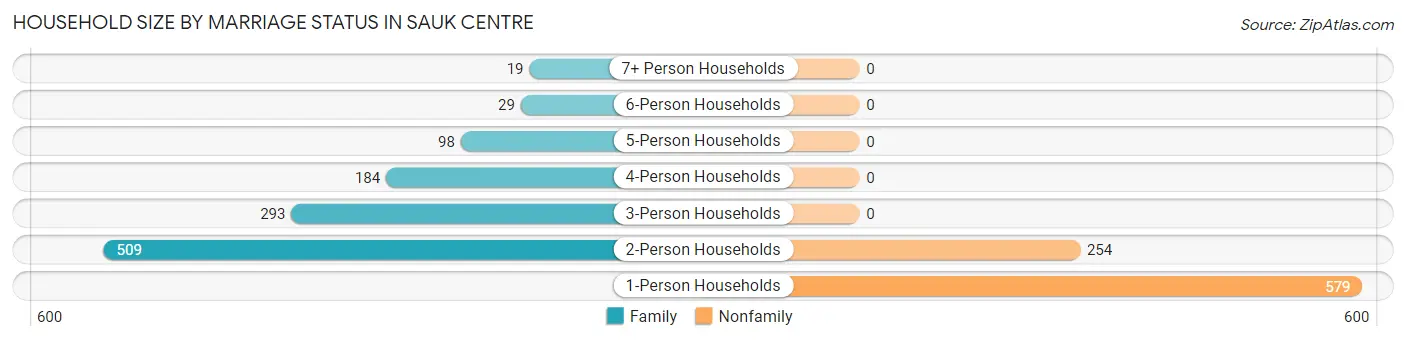
| Household Size | Family Households | Nonfamily Households |
| 1-Person Households | - | 579 (29.5%) |
| 2-Person Households | 509 (25.9%) | 254 (12.9%) |
| 3-Person Households | 293 (14.9%) | 0 (0.0%) |
| 4-Person Households | 184 (9.4%) | 0 (0.0%) |
| 5-Person Households | 98 (5.0%) | 0 (0.0%) |
| 6-Person Households | 29 (1.5%) | 0 (0.0%) |
| 7+ Person Households | 19 (1.0%) | 0 (0.0%) |
| Total | 1,132 (57.6%) | 833 (42.4%) |
Female Fertility in Sauk Centre
Fertility by Age in Sauk Centre
Average fertility rate in Sauk Centre is 12.0 births per 1,000 women. Women in the age bracket of 20 to 34 years have the highest fertility rate with 22.0 births per 1,000 women. Women in the age bracket of 20 to 34 years acount for 100.0% of all women with births.
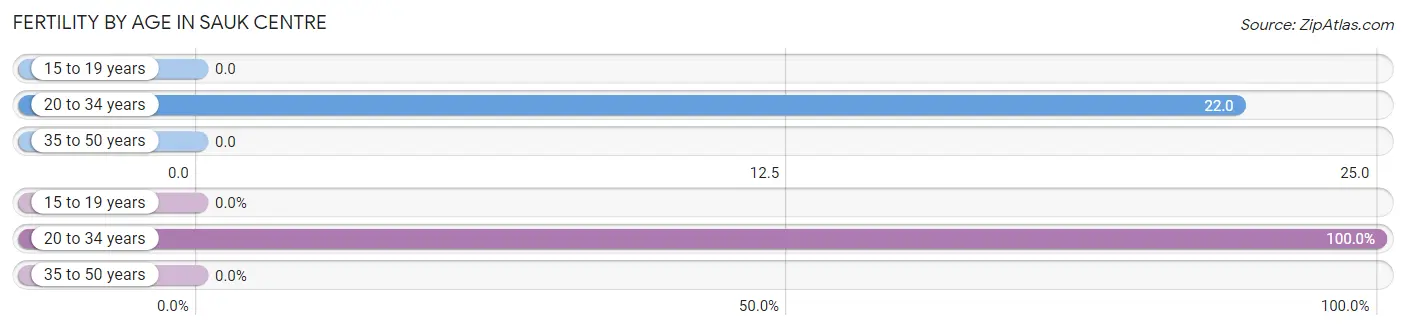
| Age Bracket | Women with Births | Births / 1,000 Women |
| 15 to 19 years | 0 (0.0%) | 0.0 |
| 20 to 34 years | 11 (100.0%) | 22.0 |
| 35 to 50 years | 0 (0.0%) | 0.0 |
| Total | 11 (100.0%) | 12.0 |
Fertility by Age by Marriage Status in Sauk Centre
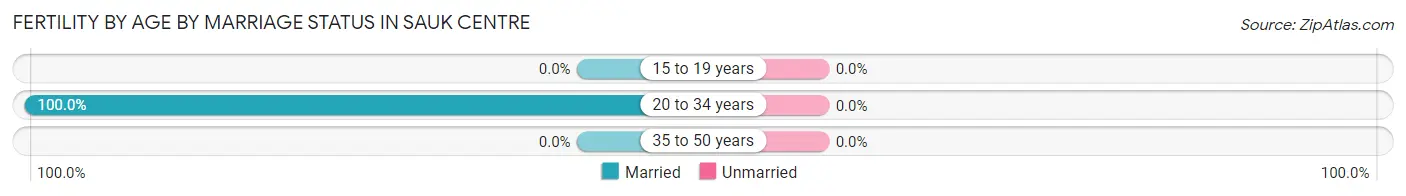
| Age Bracket | Married | Unmarried |
| 15 to 19 years | 0 (0.0%) | 0 (0.0%) |
| 20 to 34 years | 11 (100.0%) | 0 (0.0%) |
| 35 to 50 years | 0 (0.0%) | 0 (0.0%) |
| Total | 11 (100.0%) | 0 (0.0%) |
Fertility by Education in Sauk Centre
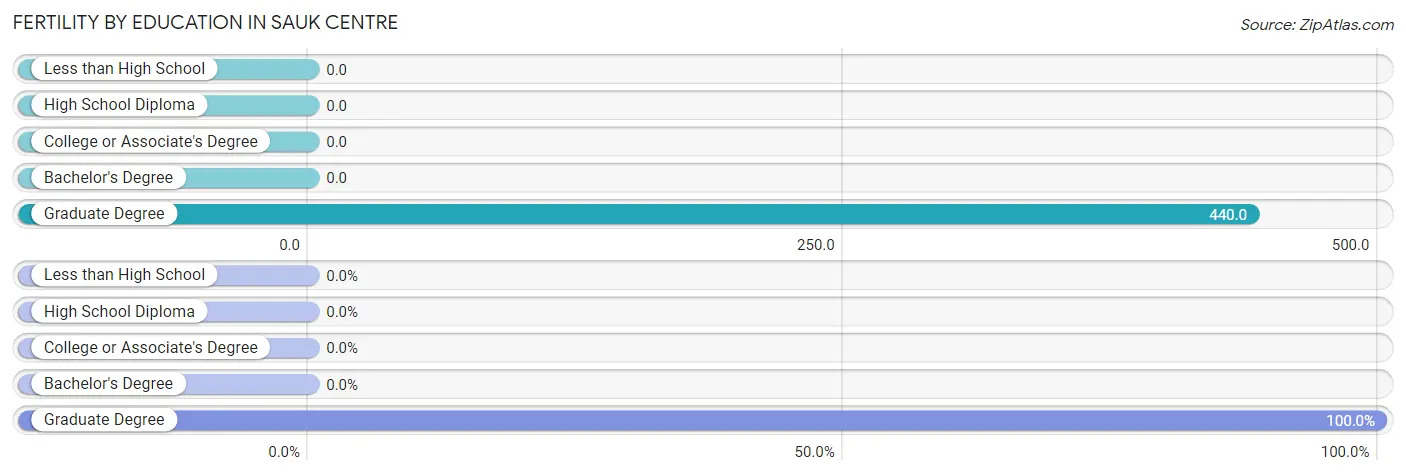
| Educational Attainment | Women with Births | Births / 1,000 Women |
| Less than High School | 0 (0.0%) | 0.0 |
| High School Diploma | 0 (0.0%) | 0.0 |
| College or Associate's Degree | 0 (0.0%) | 0.0 |
| Bachelor's Degree | 0 (0.0%) | 0.0 |
| Graduate Degree | 11 (100.0%) | 440.0 |
| Total | 11 (100.0%) | 12.0 |
Fertility by Education by Marriage Status in Sauk Centre
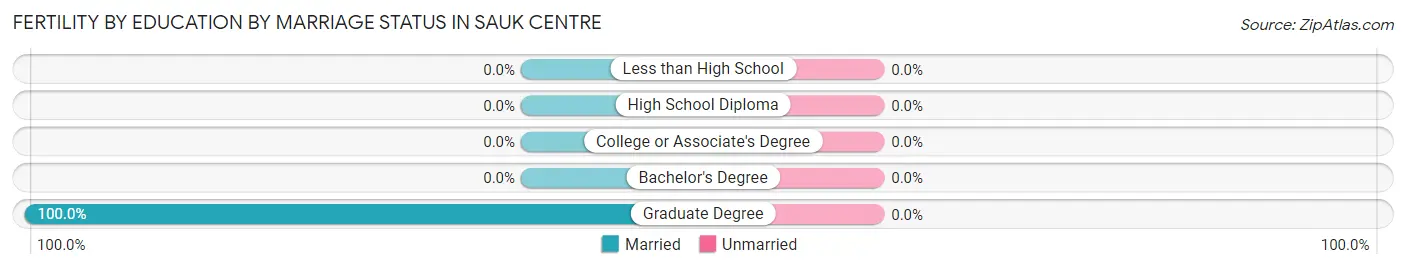
| Educational Attainment | Married | Unmarried |
| Less than High School | 0 (0.0%) | 0 (0.0%) |
| High School Diploma | 0 (0.0%) | 0 (0.0%) |
| College or Associate's Degree | 0 (0.0%) | 0 (0.0%) |
| Bachelor's Degree | 0 (0.0%) | 0 (0.0%) |
| Graduate Degree | 11 (100.0%) | 0 (0.0%) |
| Total | 11 (100.0%) | 0 (0.0%) |
Employment Characteristics in Sauk Centre
Employment by Class of Employer in Sauk Centre
Among the 2,264 employed individuals in Sauk Centre, private company employees (1,545 | 68.2%), not-for-profit organizations (271 | 12.0%), and local government employees (206 | 9.1%) make up the most common classes of employment.
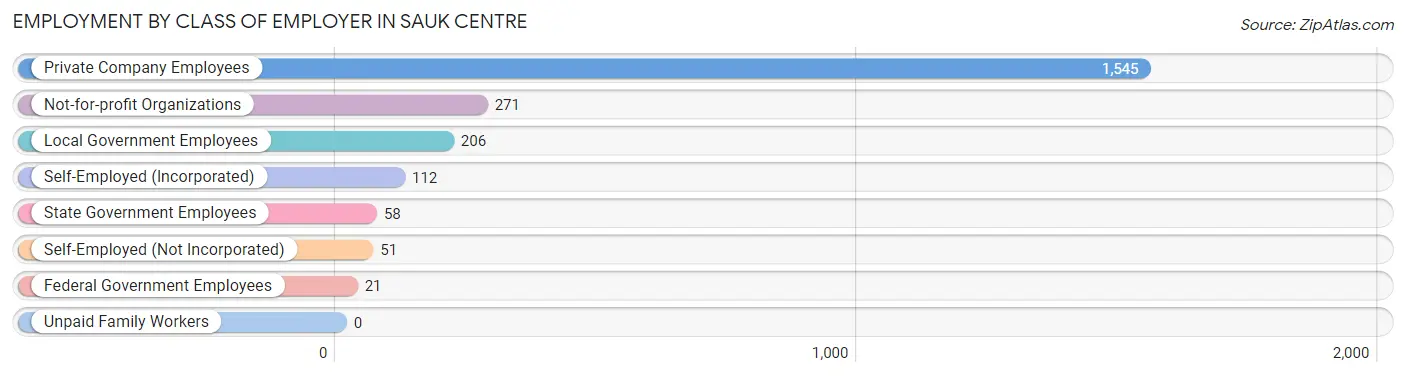
| Employer Class | # Employees | % Employees |
| Private Company Employees | 1,545 | 68.2% |
| Self-Employed (Incorporated) | 112 | 5.0% |
| Self-Employed (Not Incorporated) | 51 | 2.2% |
| Not-for-profit Organizations | 271 | 12.0% |
| Local Government Employees | 206 | 9.1% |
| State Government Employees | 58 | 2.6% |
| Federal Government Employees | 21 | 0.9% |
| Unpaid Family Workers | 0 | 0.0% |
| Total | 2,264 | 100.0% |
Employment Status by Age in Sauk Centre
According to the labor force statistics for Sauk Centre, out of the total population over 16 years of age (3,674), 68.6% or 2,520 individuals are in the labor force, with 6.8% or 171 of them unemployed. The age group with the highest labor force participation rate is 20 to 24 years, with 100.0% or 308 individuals in the labor force. Within the labor force, the 25 to 29 years age range has the highest percentage of unemployed individuals, with 17.3% or 69 of them being unemployed.
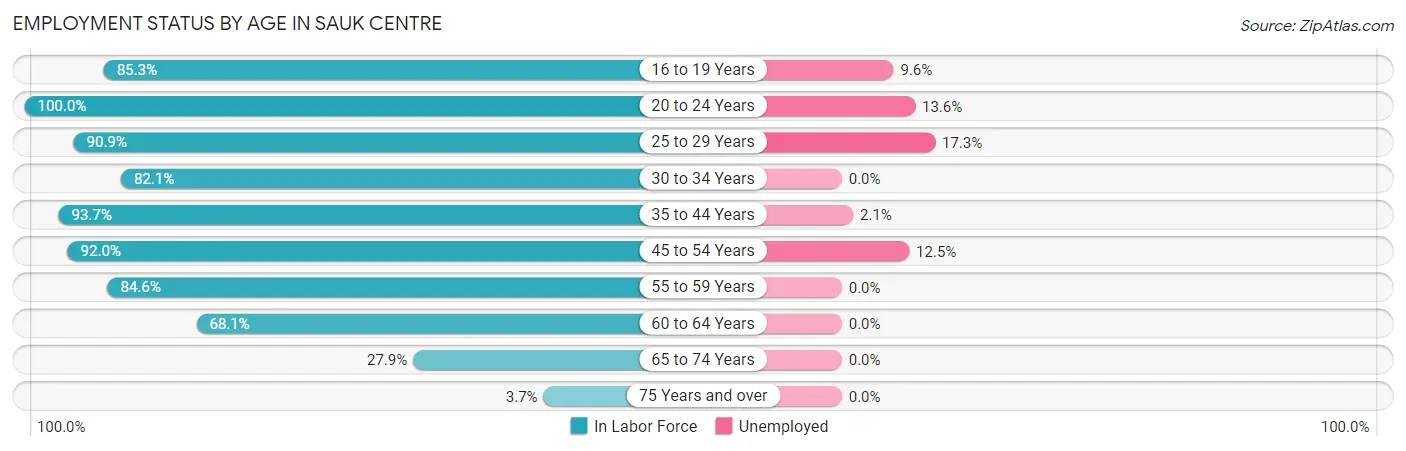
| Age Bracket | In Labor Force | Unemployed |
| 16 to 19 Years | 157 (85.3%) | 15 (9.6%) |
| 20 to 24 Years | 308 (100.0%) | 42 (13.6%) |
| 25 to 29 Years | 399 (90.9%) | 69 (17.3%) |
| 30 to 34 Years | 311 (82.1%) | 0 (0.0%) |
| 35 to 44 Years | 384 (93.7%) | 8 (2.1%) |
| 45 to 54 Years | 297 (92.0%) | 37 (12.5%) |
| 55 to 59 Years | 313 (84.6%) | 0 (0.0%) |
| 60 to 64 Years | 203 (68.1%) | 0 (0.0%) |
| 65 to 74 Years | 131 (27.9%) | 0 (0.0%) |
| 75 Years and over | 18 (3.7%) | 0 (0.0%) |
| Total | 2,520 (68.6%) | 171 (6.8%) |
Employment Status by Educational Attainment in Sauk Centre
According to labor force statistics for Sauk Centre, 85.9% of individuals (1,906) out of the total population between 25 and 64 years of age (2,219) are in the labor force, with 6.0% or 114 of them being unemployed. The group with the highest labor force participation rate are those with the educational attainment of bachelor's degree or higher, with 91.4% or 374 individuals in the labor force. Within the labor force, individuals with high school diploma education have the highest percentage of unemployment, with 10.5% or 50 of them being unemployed.
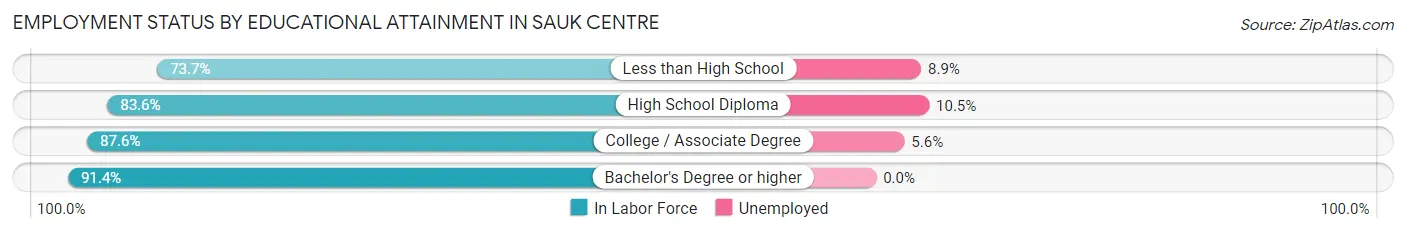
| Educational Attainment | In Labor Force | Unemployed |
| Less than High School | 157 (73.7%) | 19 (8.9%) |
| High School Diploma | 478 (83.6%) | 60 (10.5%) |
| College / Associate Degree | 898 (87.6%) | 57 (5.6%) |
| Bachelor's Degree or higher | 374 (91.4%) | 0 (0.0%) |
| Total | 1,906 (85.9%) | 133 (6.0%) |
Employment Occupations by Sex in Sauk Centre
Management, Business, Science and Arts Occupations
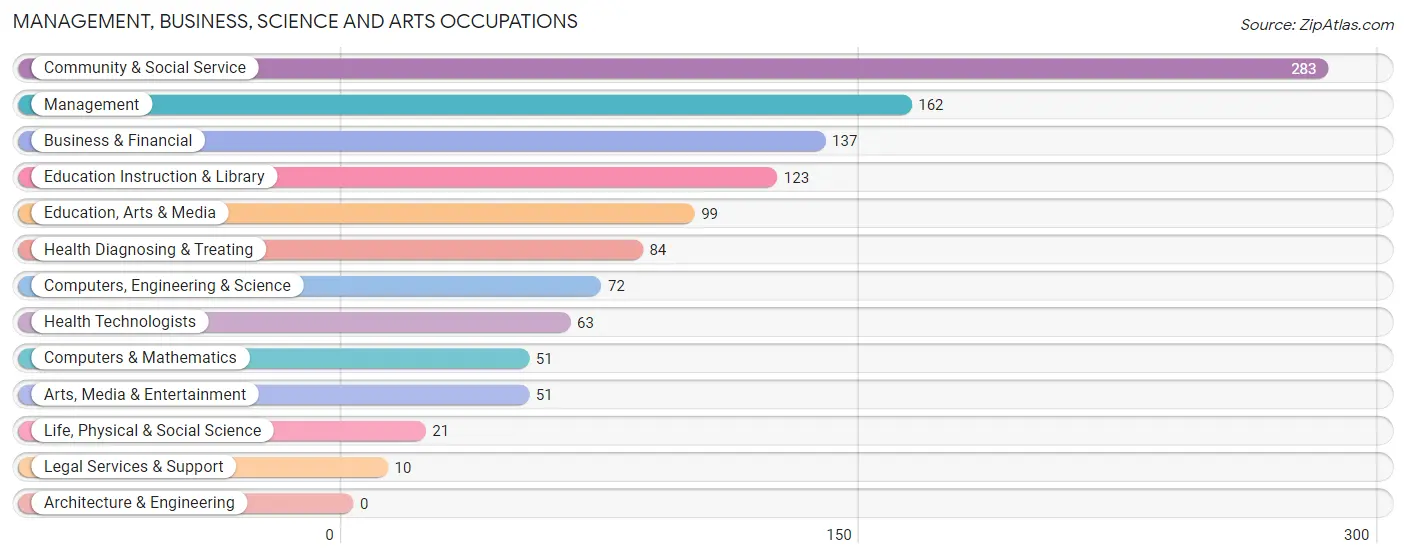
The most common Management, Business, Science and Arts occupations in Sauk Centre are Community & Social Service (283 | 12.0%), Management (162 | 6.9%), Business & Financial (137 | 5.8%), Education Instruction & Library (123 | 5.2%), and Education, Arts & Media (99 | 4.2%).
Management, Business, Science and Arts Occupations by Sex
Within the Management, Business, Science and Arts occupations in Sauk Centre, the most male-oriented occupations are Education, Arts & Media (78.8%), Education Instruction & Library (78.0%), and Community & Social Service (73.5%), while the most female-oriented occupations are Legal Services & Support (100.0%), Health Diagnosing & Treating (84.5%), and Business & Financial (83.9%).
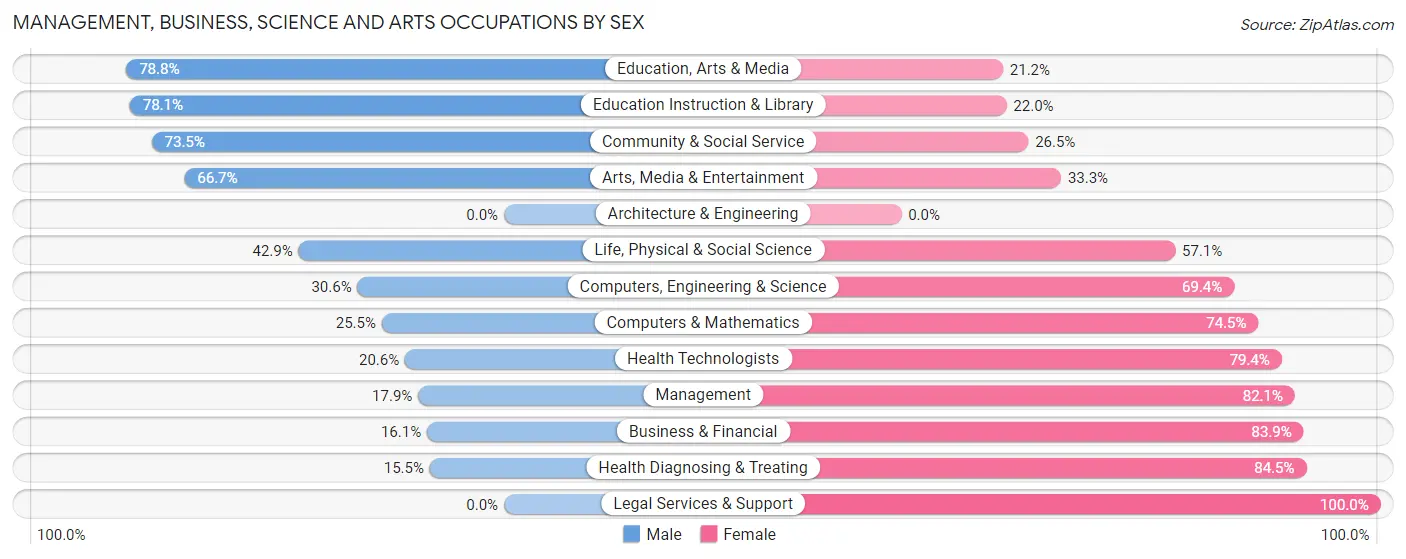
| Occupation | Male | Female |
| Management | 29 (17.9%) | 133 (82.1%) |
| Business & Financial | 22 (16.1%) | 115 (83.9%) |
| Computers, Engineering & Science | 22 (30.6%) | 50 (69.4%) |
| Computers & Mathematics | 13 (25.5%) | 38 (74.5%) |
| Architecture & Engineering | 0 (0.0%) | 0 (0.0%) |
| Life, Physical & Social Science | 9 (42.9%) | 12 (57.1%) |
| Community & Social Service | 208 (73.5%) | 75 (26.5%) |
| Education, Arts & Media | 78 (78.8%) | 21 (21.2%) |
| Legal Services & Support | 0 (0.0%) | 10 (100.0%) |
| Education Instruction & Library | 96 (78.0%) | 27 (22.0%) |
| Arts, Media & Entertainment | 34 (66.7%) | 17 (33.3%) |
| Health Diagnosing & Treating | 13 (15.5%) | 71 (84.5%) |
| Health Technologists | 13 (20.6%) | 50 (79.4%) |
| Total (Category) | 294 (39.8%) | 444 (60.2%) |
| Total (Overall) | 1,268 (54.0%) | 1,082 (46.0%) |
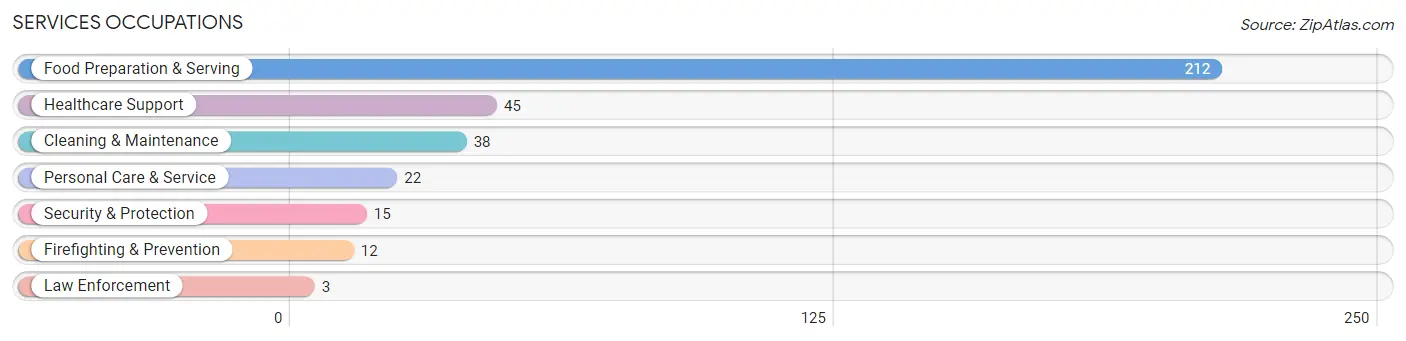
Services Occupations
The most common Services occupations in Sauk Centre are Food Preparation & Serving (212 | 9.0%), Healthcare Support (45 | 1.9%), Cleaning & Maintenance (38 | 1.6%), Personal Care & Service (22 | 0.9%), and Security & Protection (15 | 0.6%).
Services Occupations by Sex
Within the Services occupations in Sauk Centre, the most male-oriented occupations are Law Enforcement (100.0%), Cleaning & Maintenance (78.9%), and Food Preparation & Serving (34.9%), while the most female-oriented occupations are Healthcare Support (100.0%), Firefighting & Prevention (100.0%), and Personal Care & Service (100.0%).
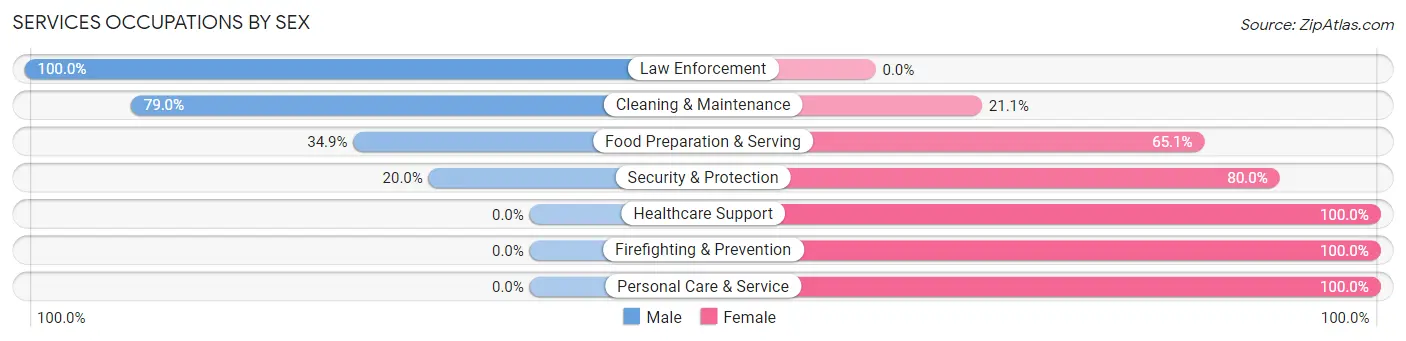
| Occupation | Male | Female |
| Healthcare Support | 0 (0.0%) | 45 (100.0%) |
| Security & Protection | 3 (20.0%) | 12 (80.0%) |
| Firefighting & Prevention | 0 (0.0%) | 12 (100.0%) |
| Law Enforcement | 3 (100.0%) | 0 (0.0%) |
| Food Preparation & Serving | 74 (34.9%) | 138 (65.1%) |
| Cleaning & Maintenance | 30 (78.9%) | 8 (21.0%) |
| Personal Care & Service | 0 (0.0%) | 22 (100.0%) |
| Total (Category) | 107 (32.2%) | 225 (67.8%) |
| Total (Overall) | 1,268 (54.0%) | 1,082 (46.0%) |
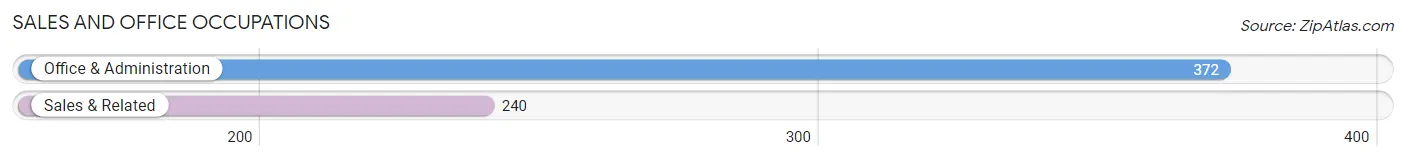
Sales and Office Occupations
The most common Sales and Office occupations in Sauk Centre are Office & Administration (372 | 15.8%), and Sales & Related (240 | 10.2%).
Sales and Office Occupations by Sex
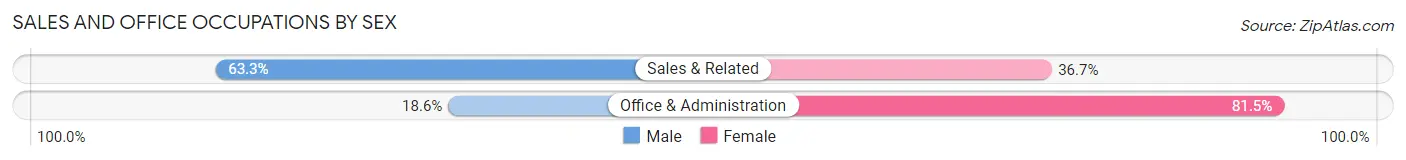
| Occupation | Male | Female |
| Sales & Related | 152 (63.3%) | 88 (36.7%) |
| Office & Administration | 69 (18.5%) | 303 (81.5%) |
| Total (Category) | 221 (36.1%) | 391 (63.9%) |
| Total (Overall) | 1,268 (54.0%) | 1,082 (46.0%) |
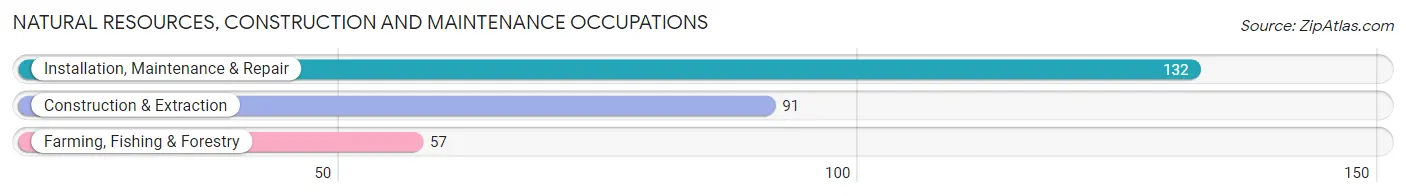
Natural Resources, Construction and Maintenance Occupations
The most common Natural Resources, Construction and Maintenance occupations in Sauk Centre are Installation, Maintenance & Repair (132 | 5.6%), Construction & Extraction (91 | 3.9%), and Farming, Fishing & Forestry (57 | 2.4%).
Natural Resources, Construction and Maintenance Occupations by Sex
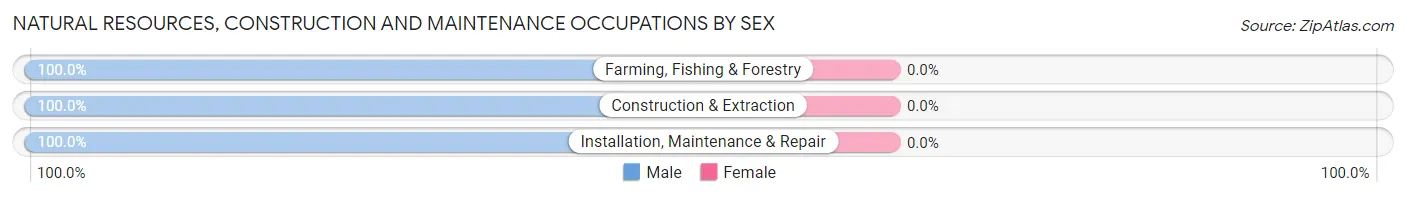
| Occupation | Male | Female |
| Farming, Fishing & Forestry | 57 (100.0%) | 0 (0.0%) |
| Construction & Extraction | 91 (100.0%) | 0 (0.0%) |
| Installation, Maintenance & Repair | 132 (100.0%) | 0 (0.0%) |
| Total (Category) | 280 (100.0%) | 0 (0.0%) |
| Total (Overall) | 1,268 (54.0%) | 1,082 (46.0%) |
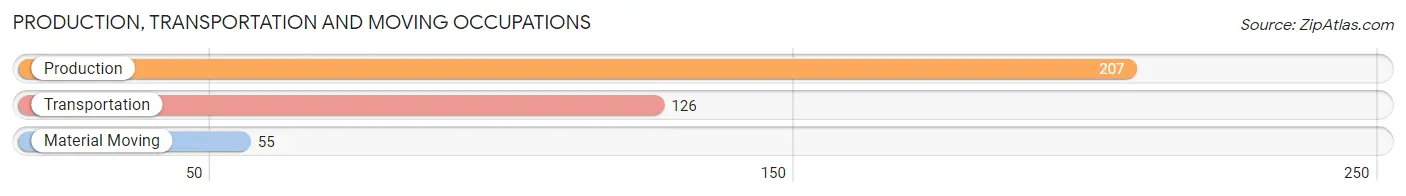
Production, Transportation and Moving Occupations
The most common Production, Transportation and Moving occupations in Sauk Centre are Production (207 | 8.8%), Transportation (126 | 5.4%), and Material Moving (55 | 2.3%).
Production, Transportation and Moving Occupations by Sex
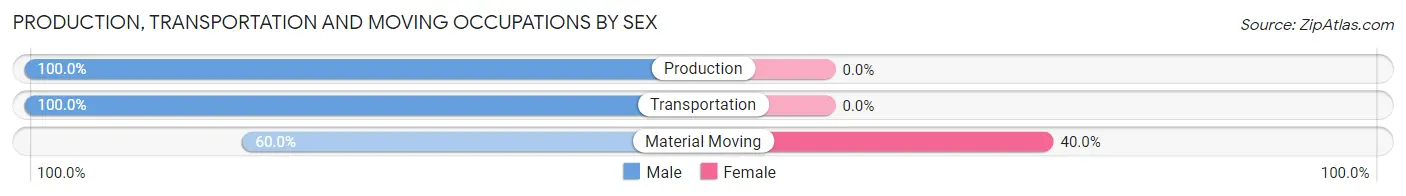
| Occupation | Male | Female |
| Production | 207 (100.0%) | 0 (0.0%) |
| Transportation | 126 (100.0%) | 0 (0.0%) |
| Material Moving | 33 (60.0%) | 22 (40.0%) |
| Total (Category) | 366 (94.3%) | 22 (5.7%) |
| Total (Overall) | 1,268 (54.0%) | 1,082 (46.0%) |
Employment Industries by Sex in Sauk Centre
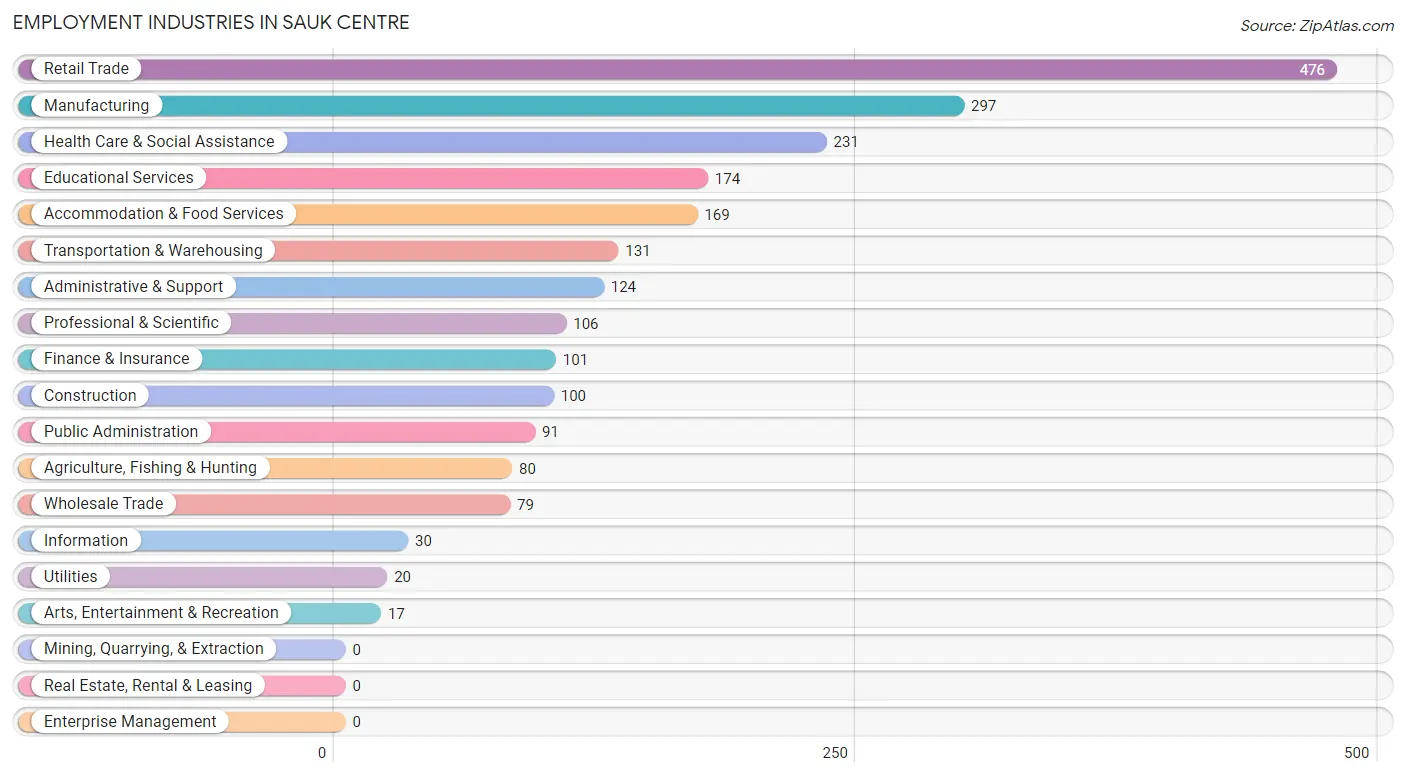
Employment Industries in Sauk Centre
The major employment industries in Sauk Centre include Retail Trade (476 | 20.3%), Manufacturing (297 | 12.6%), Health Care & Social Assistance (231 | 9.8%), Educational Services (174 | 7.4%), and Accommodation & Food Services (169 | 7.2%).
Employment Industries by Sex in Sauk Centre
The Sauk Centre industries that see more men than women are Agriculture, Fishing & Hunting (100.0%), Construction (100.0%), and Information (100.0%), whereas the industries that tend to have a higher number of women are Accommodation & Food Services (95.9%), Health Care & Social Assistance (90.9%), and Administrative & Support (88.7%).
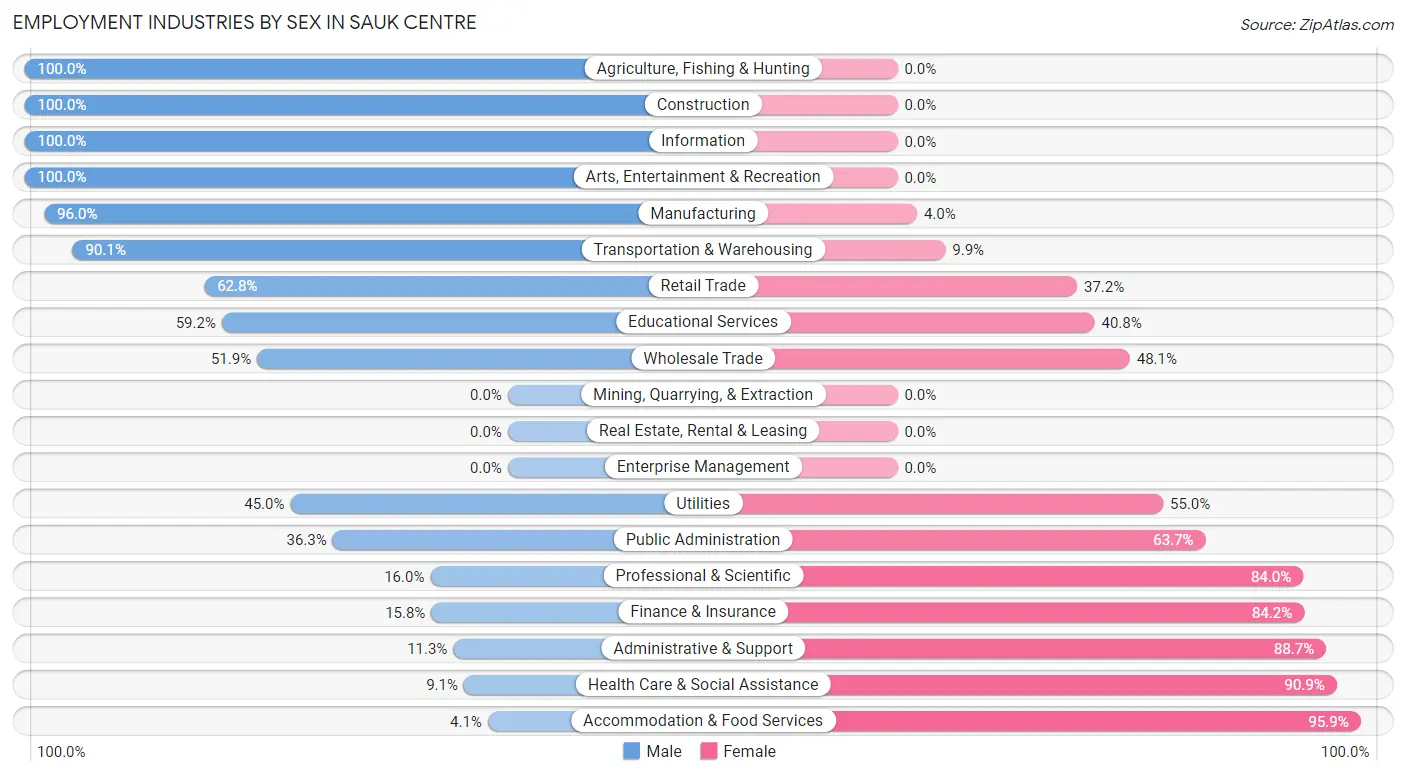
| Industry | Male | Female |
| Agriculture, Fishing & Hunting | 80 (100.0%) | 0 (0.0%) |
| Mining, Quarrying, & Extraction | 0 (0.0%) | 0 (0.0%) |
| Construction | 100 (100.0%) | 0 (0.0%) |
| Manufacturing | 285 (96.0%) | 12 (4.0%) |
| Wholesale Trade | 41 (51.9%) | 38 (48.1%) |
| Retail Trade | 299 (62.8%) | 177 (37.2%) |
| Transportation & Warehousing | 118 (90.1%) | 13 (9.9%) |
| Utilities | 9 (45.0%) | 11 (55.0%) |
| Information | 30 (100.0%) | 0 (0.0%) |
| Finance & Insurance | 16 (15.8%) | 85 (84.2%) |
| Real Estate, Rental & Leasing | 0 (0.0%) | 0 (0.0%) |
| Professional & Scientific | 17 (16.0%) | 89 (84.0%) |
| Enterprise Management | 0 (0.0%) | 0 (0.0%) |
| Administrative & Support | 14 (11.3%) | 110 (88.7%) |
| Educational Services | 103 (59.2%) | 71 (40.8%) |
| Health Care & Social Assistance | 21 (9.1%) | 210 (90.9%) |
| Arts, Entertainment & Recreation | 17 (100.0%) | 0 (0.0%) |
| Accommodation & Food Services | 7 (4.1%) | 162 (95.9%) |
| Public Administration | 33 (36.3%) | 58 (63.7%) |
| Total | 1,268 (54.0%) | 1,082 (46.0%) |
Education in Sauk Centre
School Enrollment in Sauk Centre
The most common levels of schooling among the 865 students in Sauk Centre are elementary school (205 | 23.7%), middle school (172 | 19.9%), and kindergarten (123 | 14.2%).
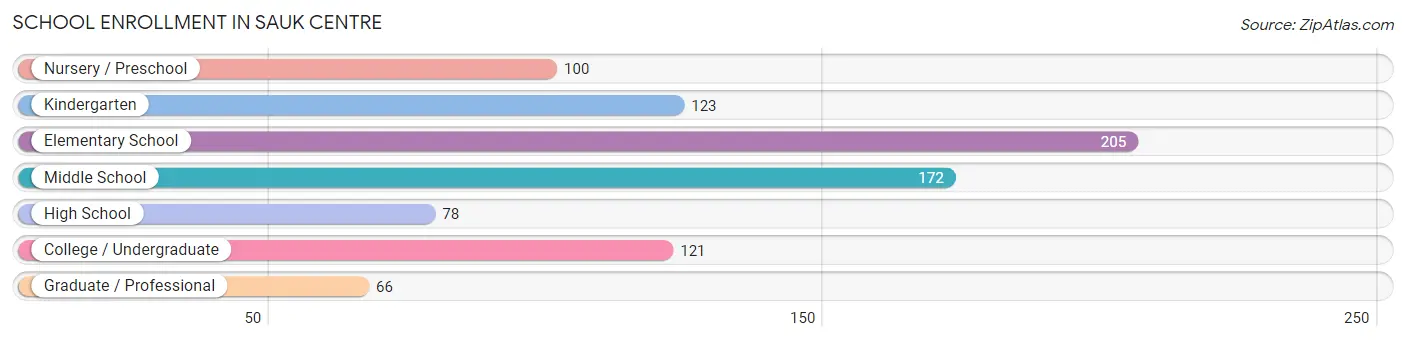
| School Level | # Students | % Students |
| Nursery / Preschool | 100 | 11.6% |
| Kindergarten | 123 | 14.2% |
| Elementary School | 205 | 23.7% |
| Middle School | 172 | 19.9% |
| High School | 78 | 9.0% |
| College / Undergraduate | 121 | 14.0% |
| Graduate / Professional | 66 | 7.6% |
| Total | 865 | 100.0% |
School Enrollment by Age by Funding Source in Sauk Centre
Out of a total of 865 students who are enrolled in schools in Sauk Centre, 259 (29.9%) attend a private institution, while the remaining 606 (70.1%) are enrolled in public schools. The age group of 35 years and over has the highest likelihood of being enrolled in private schools, with 52 (85.3% in the age bracket) enrolled. Conversely, the age group of 3 to 4 year olds has the lowest likelihood of being enrolled in a private school, with 60 (100.0% in the age bracket) attending a public institution.
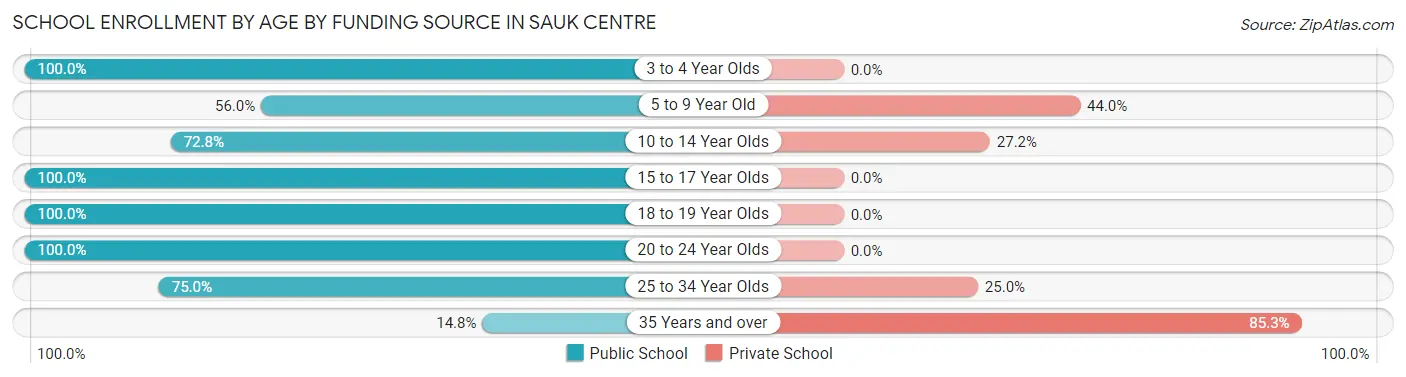
| Age Bracket | Public School | Private School |
| 3 to 4 Year Olds | 60 (100.0%) | 0 (0.0%) |
| 5 to 9 Year Old | 183 (56.0%) | 144 (44.0%) |
| 10 to 14 Year Olds | 155 (72.8%) | 58 (27.2%) |
| 15 to 17 Year Olds | 52 (100.0%) | 0 (0.0%) |
| 18 to 19 Year Olds | 34 (100.0%) | 0 (0.0%) |
| 20 to 24 Year Olds | 98 (100.0%) | 0 (0.0%) |
| 25 to 34 Year Olds | 15 (75.0%) | 5 (25.0%) |
| 35 Years and over | 9 (14.7%) | 52 (85.3%) |
| Total | 606 (70.1%) | 259 (29.9%) |
Educational Attainment by Field of Study in Sauk Centre
Education (203 | 33.7%), business (122 | 20.2%), liberal arts & history (98 | 16.3%), engineering (45 | 7.5%), and science & technology (41 | 6.8%) are the most common fields of study among 603 individuals in Sauk Centre who have obtained a bachelor's degree or higher.
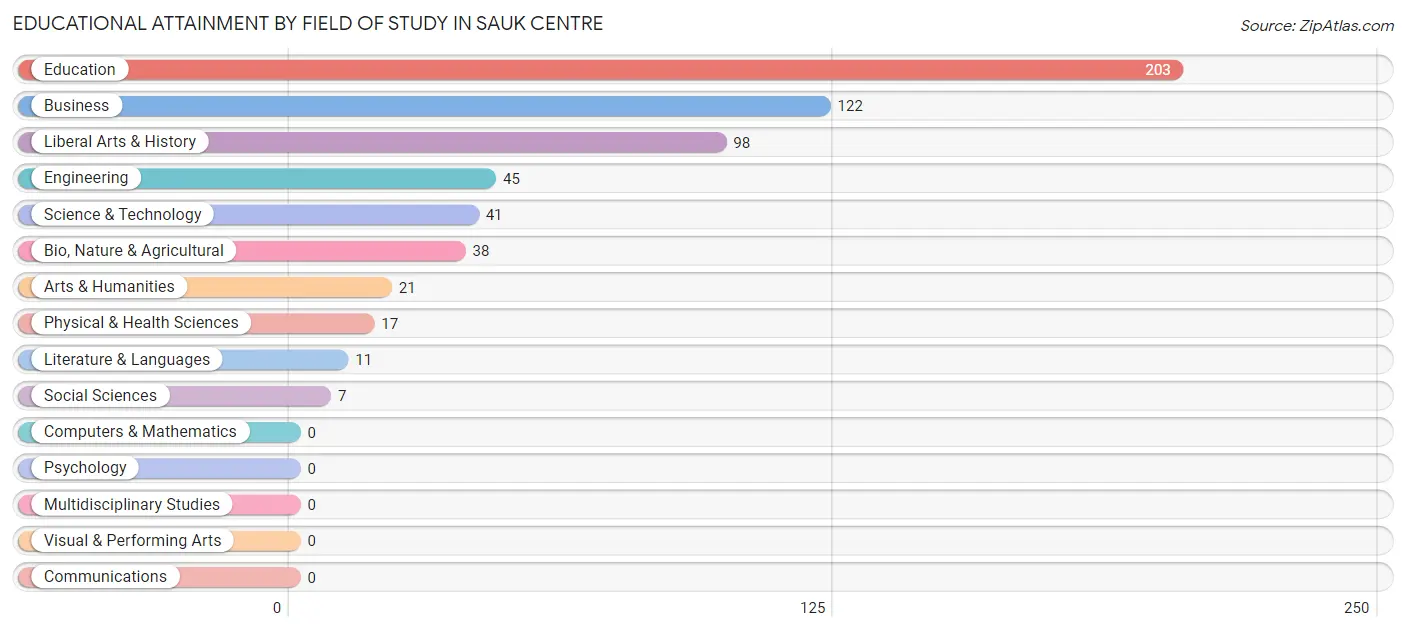
| Field of Study | # Graduates | % Graduates |
| Computers & Mathematics | 0 | 0.0% |
| Bio, Nature & Agricultural | 38 | 6.3% |
| Physical & Health Sciences | 17 | 2.8% |
| Psychology | 0 | 0.0% |
| Social Sciences | 7 | 1.2% |
| Engineering | 45 | 7.5% |
| Multidisciplinary Studies | 0 | 0.0% |
| Science & Technology | 41 | 6.8% |
| Business | 122 | 20.2% |
| Education | 203 | 33.7% |
| Literature & Languages | 11 | 1.8% |
| Liberal Arts & History | 98 | 16.3% |
| Visual & Performing Arts | 0 | 0.0% |
| Communications | 0 | 0.0% |
| Arts & Humanities | 21 | 3.5% |
| Total | 603 | 100.0% |
Transportation & Commute in Sauk Centre
Vehicle Availability by Sex in Sauk Centre
The most prevalent vehicle ownership categories in Sauk Centre are males with 2 vehicles (466, accounting for 39.4%) and females with 2 vehicles (480, making up 43.1%).
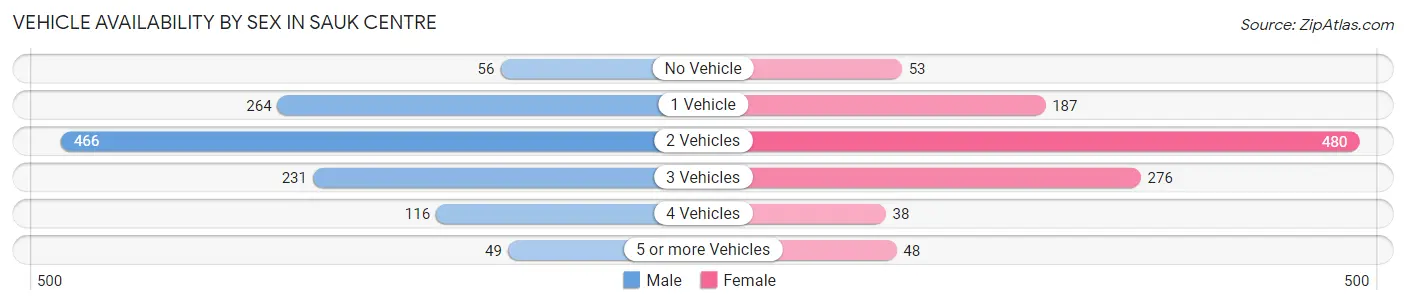
| Vehicles Available | Male | Female |
| No Vehicle | 56 (4.7%) | 53 (4.9%) |
| 1 Vehicle | 264 (22.3%) | 187 (17.3%) |
| 2 Vehicles | 466 (39.4%) | 480 (44.4%) |
| 3 Vehicles | 231 (19.5%) | 276 (25.5%) |
| 4 Vehicles | 116 (9.8%) | 38 (3.5%) |
| 5 or more Vehicles | 49 (4.2%) | 48 (4.4%) |
| Total | 1,182 (100.0%) | 1,082 (100.0%) |
Commute Time in Sauk Centre
The most frequently occuring commute durations in Sauk Centre are 5 to 9 minutes (572 commuters, 27.5%), less than 5 minutes (365 commuters, 17.5%), and 10 to 14 minutes (364 commuters, 17.5%).
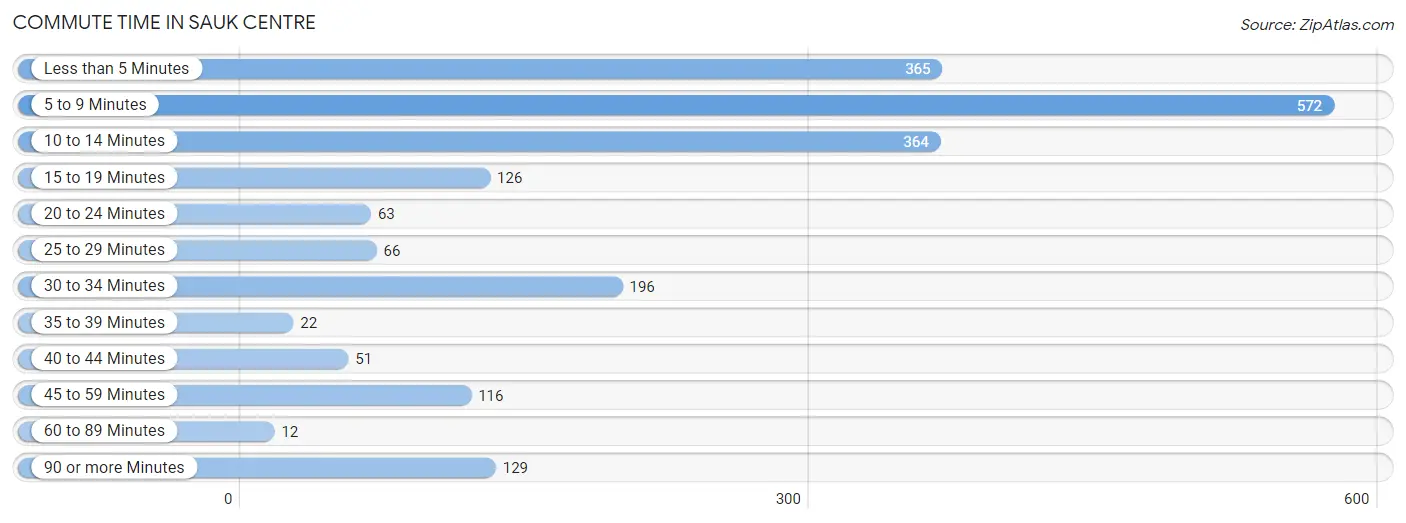
| Commute Time | # Commuters | % Commuters |
| Less than 5 Minutes | 365 | 17.5% |
| 5 to 9 Minutes | 572 | 27.5% |
| 10 to 14 Minutes | 364 | 17.5% |
| 15 to 19 Minutes | 126 | 6.0% |
| 20 to 24 Minutes | 63 | 3.0% |
| 25 to 29 Minutes | 66 | 3.2% |
| 30 to 34 Minutes | 196 | 9.4% |
| 35 to 39 Minutes | 22 | 1.1% |
| 40 to 44 Minutes | 51 | 2.5% |
| 45 to 59 Minutes | 116 | 5.6% |
| 60 to 89 Minutes | 12 | 0.6% |
| 90 or more Minutes | 129 | 6.2% |
Commute Time by Sex in Sauk Centre
The most common commute times in Sauk Centre are 5 to 9 minutes (246 commuters, 21.8%) for males and 5 to 9 minutes (326 commuters, 34.2%) for females.
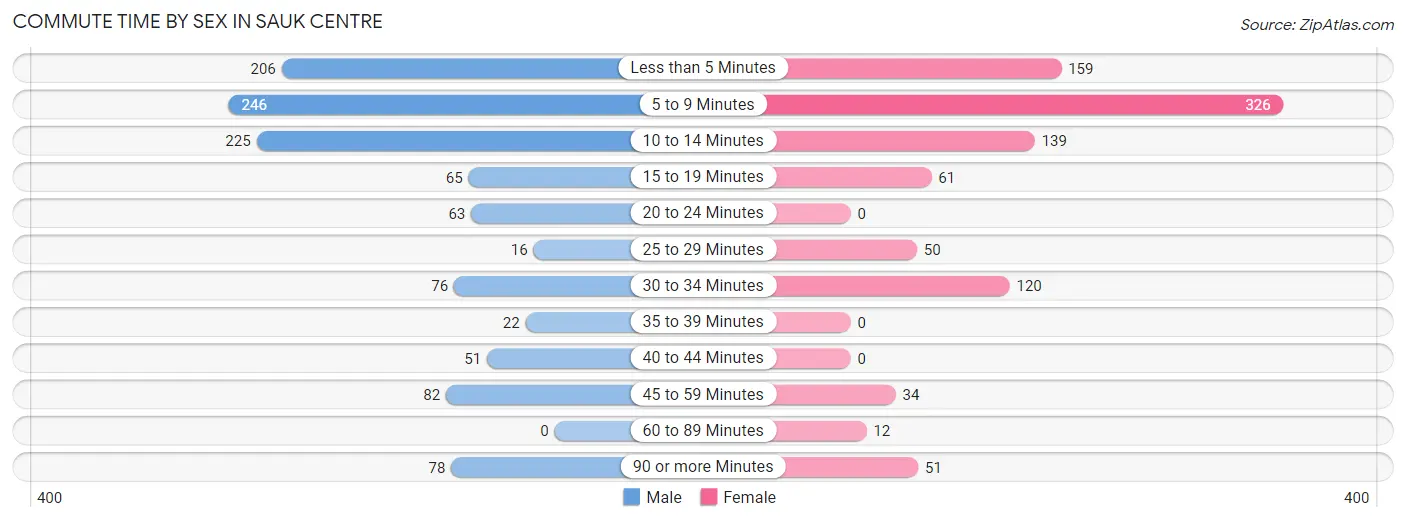
| Commute Time | Male | Female |
| Less than 5 Minutes | 206 (18.2%) | 159 (16.7%) |
| 5 to 9 Minutes | 246 (21.8%) | 326 (34.2%) |
| 10 to 14 Minutes | 225 (19.9%) | 139 (14.6%) |
| 15 to 19 Minutes | 65 (5.8%) | 61 (6.4%) |
| 20 to 24 Minutes | 63 (5.6%) | 0 (0.0%) |
| 25 to 29 Minutes | 16 (1.4%) | 50 (5.2%) |
| 30 to 34 Minutes | 76 (6.7%) | 120 (12.6%) |
| 35 to 39 Minutes | 22 (1.9%) | 0 (0.0%) |
| 40 to 44 Minutes | 51 (4.5%) | 0 (0.0%) |
| 45 to 59 Minutes | 82 (7.3%) | 34 (3.6%) |
| 60 to 89 Minutes | 0 (0.0%) | 12 (1.3%) |
| 90 or more Minutes | 78 (6.9%) | 51 (5.4%) |
Time of Departure to Work by Sex in Sauk Centre
The most frequent times of departure to work in Sauk Centre are 8:00 AM to 8:29 AM (196, 17.3%) for males and 7:30 AM to 7:59 AM (303, 31.8%) for females.
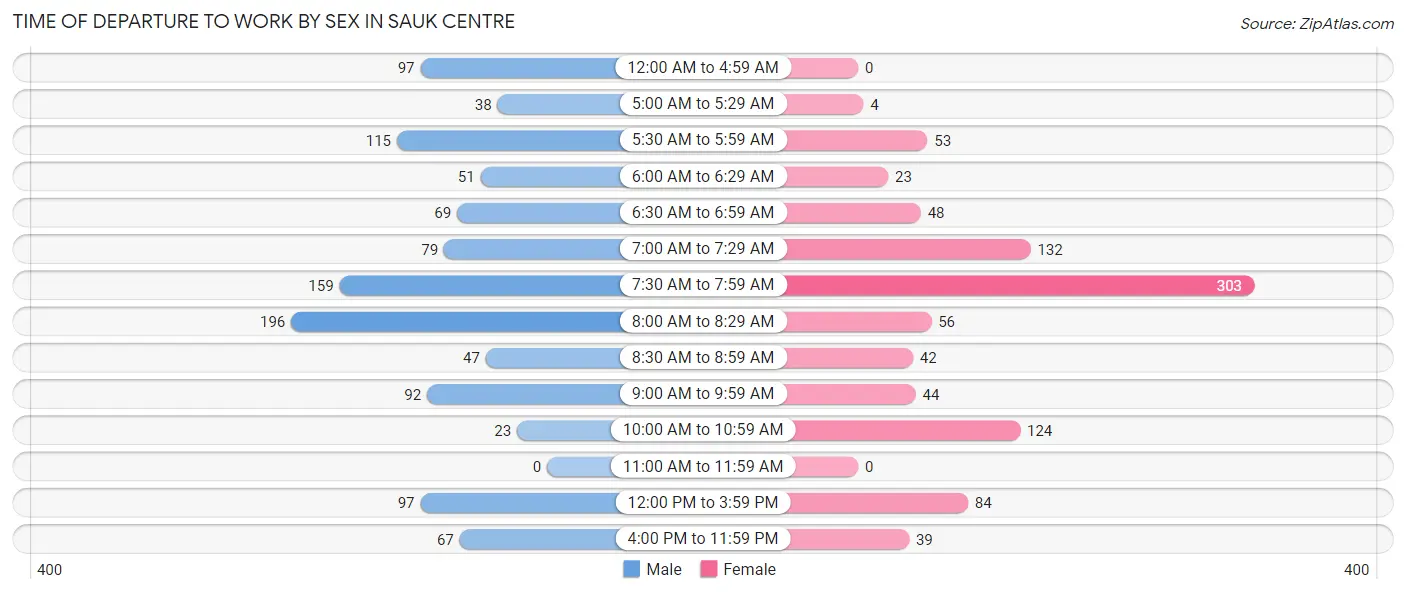
| Time of Departure | Male | Female |
| 12:00 AM to 4:59 AM | 97 (8.6%) | 0 (0.0%) |
| 5:00 AM to 5:29 AM | 38 (3.4%) | 4 (0.4%) |
| 5:30 AM to 5:59 AM | 115 (10.2%) | 53 (5.6%) |
| 6:00 AM to 6:29 AM | 51 (4.5%) | 23 (2.4%) |
| 6:30 AM to 6:59 AM | 69 (6.1%) | 48 (5.0%) |
| 7:00 AM to 7:29 AM | 79 (7.0%) | 132 (13.9%) |
| 7:30 AM to 7:59 AM | 159 (14.1%) | 303 (31.8%) |
| 8:00 AM to 8:29 AM | 196 (17.3%) | 56 (5.9%) |
| 8:30 AM to 8:59 AM | 47 (4.2%) | 42 (4.4%) |
| 9:00 AM to 9:59 AM | 92 (8.1%) | 44 (4.6%) |
| 10:00 AM to 10:59 AM | 23 (2.0%) | 124 (13.0%) |
| 11:00 AM to 11:59 AM | 0 (0.0%) | 0 (0.0%) |
| 12:00 PM to 3:59 PM | 97 (8.6%) | 84 (8.8%) |
| 4:00 PM to 11:59 PM | 67 (5.9%) | 39 (4.1%) |
| Total | 1,130 (100.0%) | 952 (100.0%) |
Housing Occupancy in Sauk Centre
Occupancy by Ownership in Sauk Centre
Of the total 1,965 dwellings in Sauk Centre, owner-occupied units account for 1,128 (57.4%), while renter-occupied units make up 837 (42.6%).
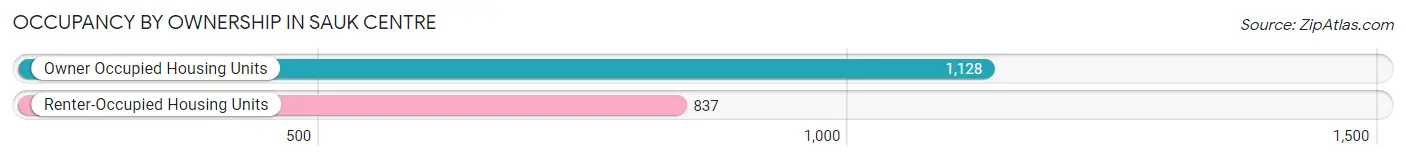
| Occupancy | # Housing Units | % Housing Units |
| Owner Occupied Housing Units | 1,128 | 57.4% |
| Renter-Occupied Housing Units | 837 | 42.6% |
| Total Occupied Housing Units | 1,965 | 100.0% |
Occupancy by Household Size in Sauk Centre
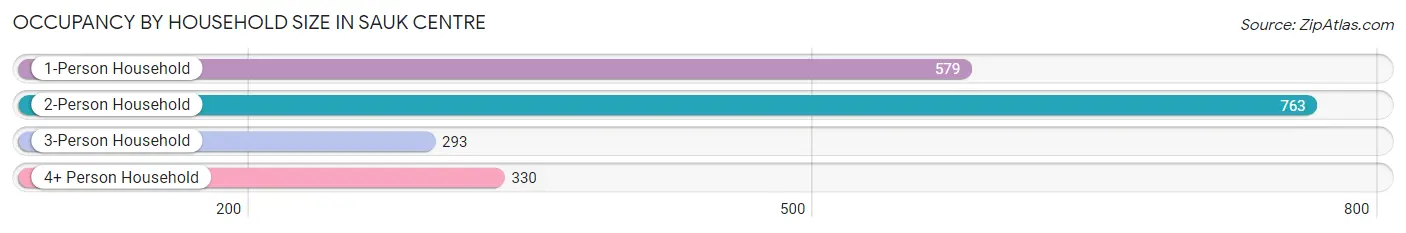
| Household Size | # Housing Units | % Housing Units |
| 1-Person Household | 579 | 29.5% |
| 2-Person Household | 763 | 38.8% |
| 3-Person Household | 293 | 14.9% |
| 4+ Person Household | 330 | 16.8% |
| Total Housing Units | 1,965 | 100.0% |
Occupancy by Ownership by Household Size in Sauk Centre
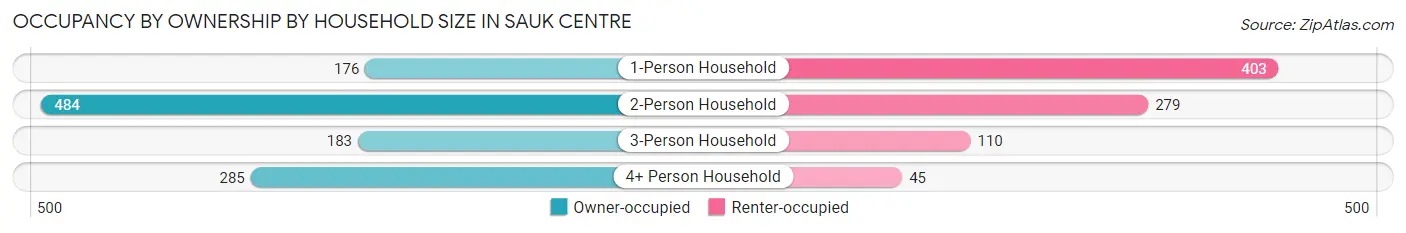
| Household Size | Owner-occupied | Renter-occupied |
| 1-Person Household | 176 (30.4%) | 403 (69.6%) |
| 2-Person Household | 484 (63.4%) | 279 (36.6%) |
| 3-Person Household | 183 (62.5%) | 110 (37.5%) |
| 4+ Person Household | 285 (86.4%) | 45 (13.6%) |
| Total Housing Units | 1,128 (57.4%) | 837 (42.6%) |
Occupancy by Educational Attainment in Sauk Centre
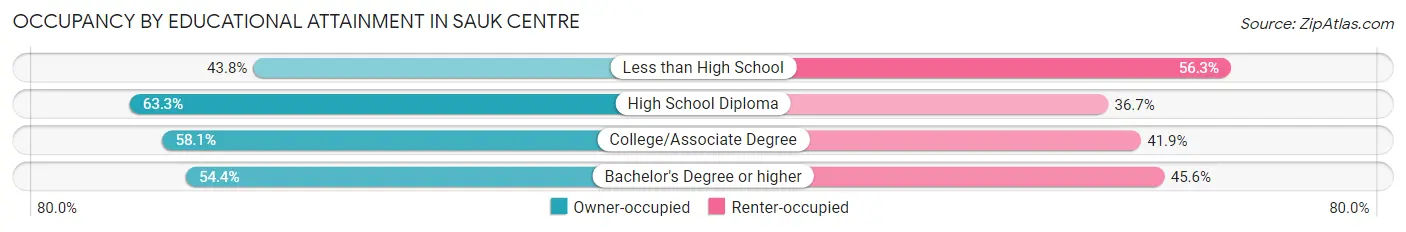
| Household Size | Owner-occupied | Renter-occupied |
| Less than High School | 98 (43.8%) | 126 (56.2%) |
| High School Diploma | 395 (63.3%) | 229 (36.7%) |
| College/Associate Degree | 430 (58.1%) | 310 (41.9%) |
| Bachelor's Degree or higher | 205 (54.4%) | 172 (45.6%) |
Occupancy by Age of Householder in Sauk Centre
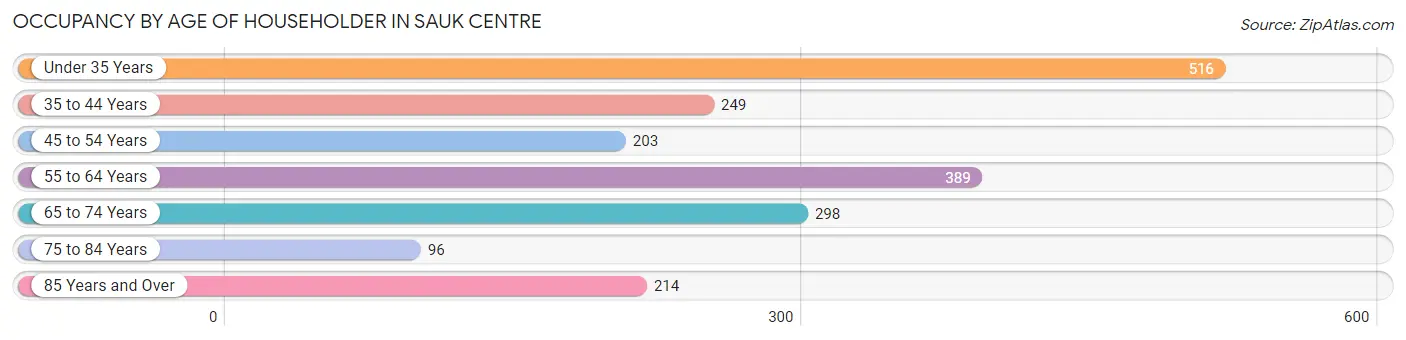
| Age Bracket | # Households | % Households |
| Under 35 Years | 516 | 26.3% |
| 35 to 44 Years | 249 | 12.7% |
| 45 to 54 Years | 203 | 10.3% |
| 55 to 64 Years | 389 | 19.8% |
| 65 to 74 Years | 298 | 15.2% |
| 75 to 84 Years | 96 | 4.9% |
| 85 Years and Over | 214 | 10.9% |
| Total | 1,965 | 100.0% |
Housing Finances in Sauk Centre
Median Income by Occupancy in Sauk Centre
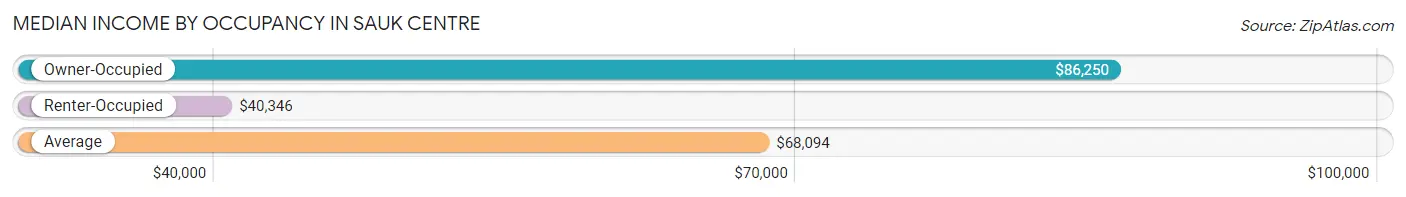
| Occupancy Type | # Households | Median Income |
| Owner-Occupied | 1,128 (57.4%) | $86,250 |
| Renter-Occupied | 837 (42.6%) | $40,346 |
| Average | 1,965 (100.0%) | $68,094 |
Occupancy by Householder Income Bracket in Sauk Centre
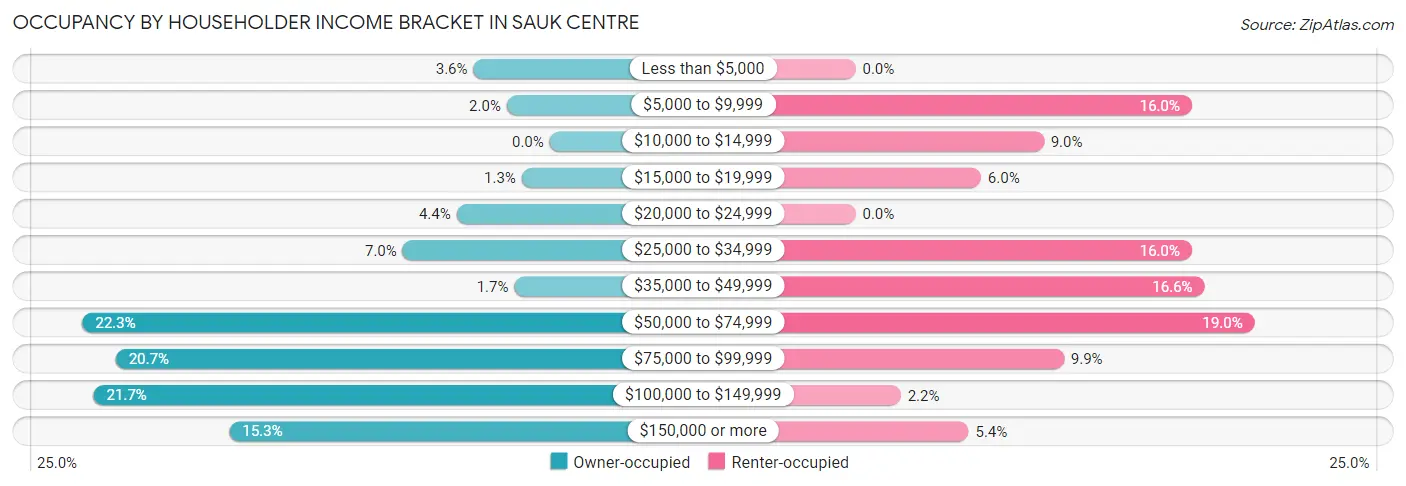
| Income Bracket | Owner-occupied | Renter-occupied |
| Less than $5,000 | 41 (3.6%) | 0 (0.0%) |
| $5,000 to $9,999 | 23 (2.0%) | 134 (16.0%) |
| $10,000 to $14,999 | 0 (0.0%) | 75 (9.0%) |
| $15,000 to $19,999 | 15 (1.3%) | 50 (6.0%) |
| $20,000 to $24,999 | 50 (4.4%) | 0 (0.0%) |
| $25,000 to $34,999 | 79 (7.0%) | 134 (16.0%) |
| $35,000 to $49,999 | 19 (1.7%) | 139 (16.6%) |
| $50,000 to $74,999 | 251 (22.3%) | 159 (19.0%) |
| $75,000 to $99,999 | 233 (20.7%) | 83 (9.9%) |
| $100,000 to $149,999 | 245 (21.7%) | 18 (2.1%) |
| $150,000 or more | 172 (15.2%) | 45 (5.4%) |
| Total | 1,128 (100.0%) | 837 (100.0%) |
Monthly Housing Cost Tiers in Sauk Centre
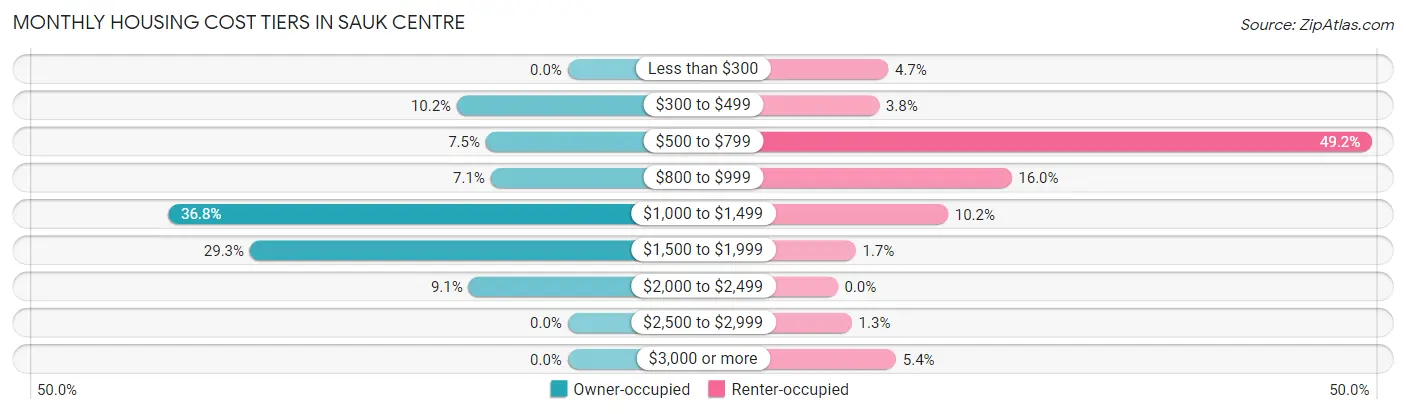
| Monthly Cost | Owner-occupied | Renter-occupied |
| Less than $300 | 0 (0.0%) | 39 (4.7%) |
| $300 to $499 | 115 (10.2%) | 32 (3.8%) |
| $500 to $799 | 85 (7.5%) | 412 (49.2%) |
| $800 to $999 | 80 (7.1%) | 134 (16.0%) |
| $1,000 to $1,499 | 415 (36.8%) | 85 (10.2%) |
| $1,500 to $1,999 | 330 (29.3%) | 14 (1.7%) |
| $2,000 to $2,499 | 103 (9.1%) | 0 (0.0%) |
| $2,500 to $2,999 | 0 (0.0%) | 11 (1.3%) |
| $3,000 or more | 0 (0.0%) | 45 (5.4%) |
| Total | 1,128 (100.0%) | 837 (100.0%) |
Physical Housing Characteristics in Sauk Centre
Housing Structures in Sauk Centre
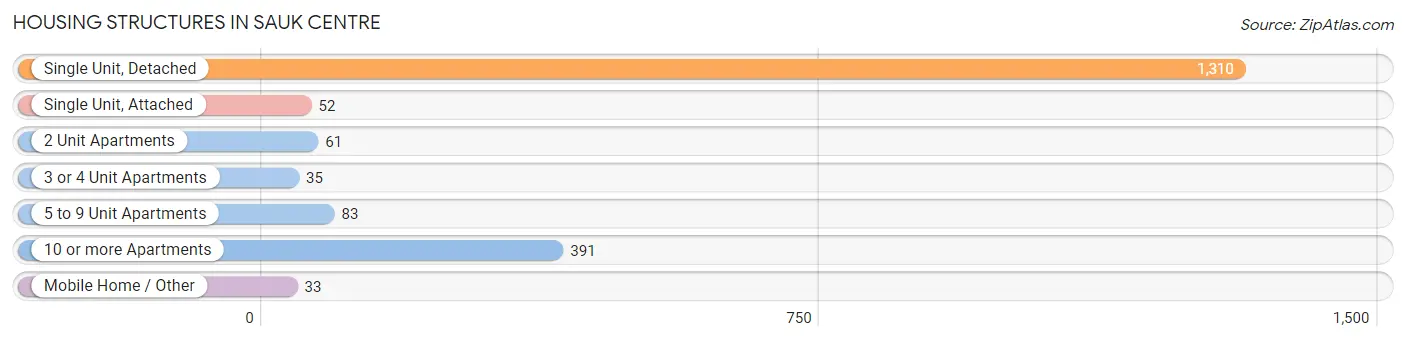
| Structure Type | # Housing Units | % Housing Units |
| Single Unit, Detached | 1,310 | 66.7% |
| Single Unit, Attached | 52 | 2.6% |
| 2 Unit Apartments | 61 | 3.1% |
| 3 or 4 Unit Apartments | 35 | 1.8% |
| 5 to 9 Unit Apartments | 83 | 4.2% |
| 10 or more Apartments | 391 | 19.9% |
| Mobile Home / Other | 33 | 1.7% |
| Total | 1,965 | 100.0% |
Housing Structures by Occupancy in Sauk Centre
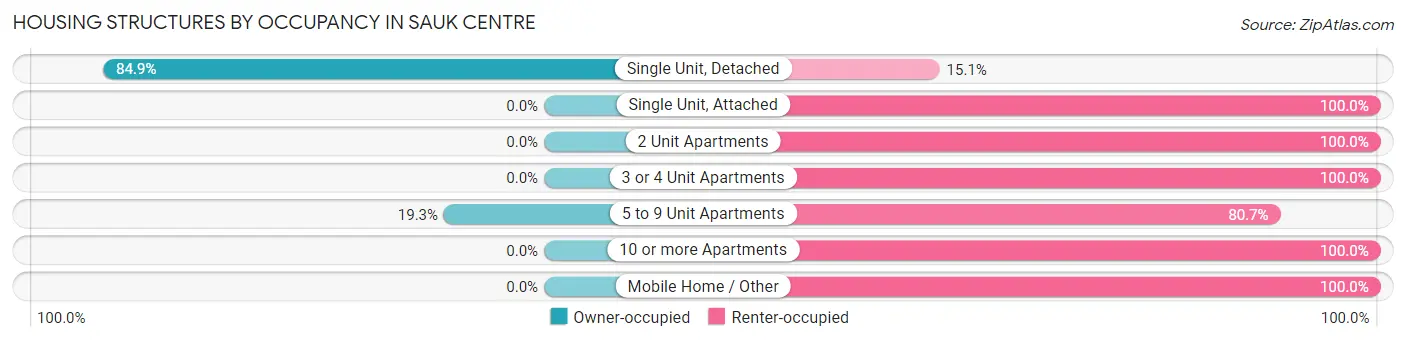
| Structure Type | Owner-occupied | Renter-occupied |
| Single Unit, Detached | 1,112 (84.9%) | 198 (15.1%) |
| Single Unit, Attached | 0 (0.0%) | 52 (100.0%) |
| 2 Unit Apartments | 0 (0.0%) | 61 (100.0%) |
| 3 or 4 Unit Apartments | 0 (0.0%) | 35 (100.0%) |
| 5 to 9 Unit Apartments | 16 (19.3%) | 67 (80.7%) |
| 10 or more Apartments | 0 (0.0%) | 391 (100.0%) |
| Mobile Home / Other | 0 (0.0%) | 33 (100.0%) |
| Total | 1,128 (57.4%) | 837 (42.6%) |
Housing Structures by Number of Rooms in Sauk Centre
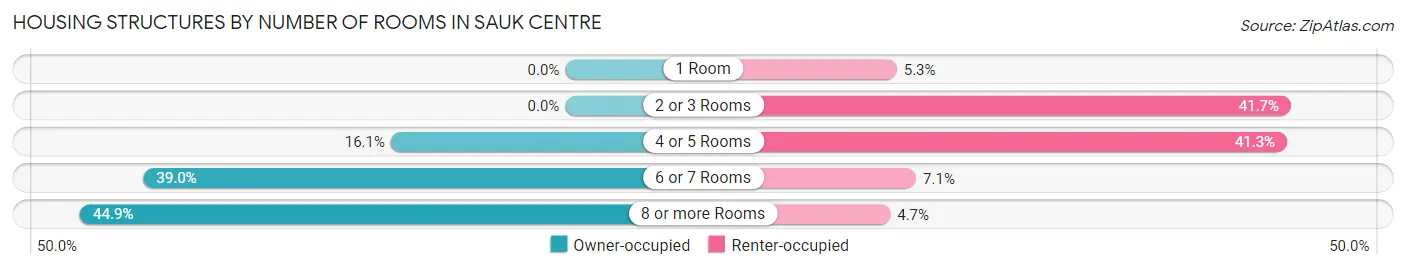
| Number of Rooms | Owner-occupied | Renter-occupied |
| 1 Room | 0 (0.0%) | 44 (5.3%) |
| 2 or 3 Rooms | 0 (0.0%) | 349 (41.7%) |
| 4 or 5 Rooms | 182 (16.1%) | 346 (41.3%) |
| 6 or 7 Rooms | 440 (39.0%) | 59 (7.0%) |
| 8 or more Rooms | 506 (44.9%) | 39 (4.7%) |
| Total | 1,128 (100.0%) | 837 (100.0%) |
Housing Structure by Heating Type in Sauk Centre
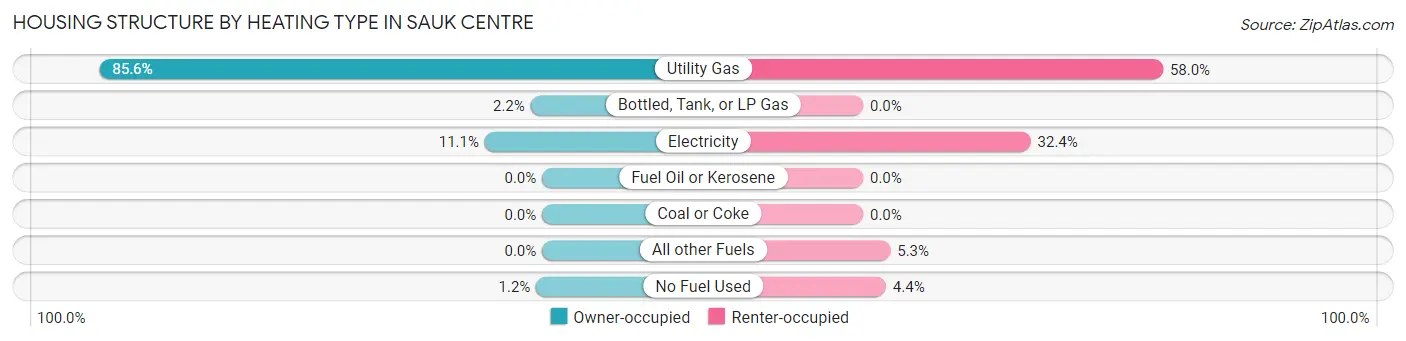
| Heating Type | Owner-occupied | Renter-occupied |
| Utility Gas | 965 (85.6%) | 485 (58.0%) |
| Bottled, Tank, or LP Gas | 25 (2.2%) | 0 (0.0%) |
| Electricity | 125 (11.1%) | 271 (32.4%) |
| Fuel Oil or Kerosene | 0 (0.0%) | 0 (0.0%) |
| Coal or Coke | 0 (0.0%) | 0 (0.0%) |
| All other Fuels | 0 (0.0%) | 44 (5.3%) |
| No Fuel Used | 13 (1.1%) | 37 (4.4%) |
| Total | 1,128 (100.0%) | 837 (100.0%) |
Household Vehicle Usage in Sauk Centre
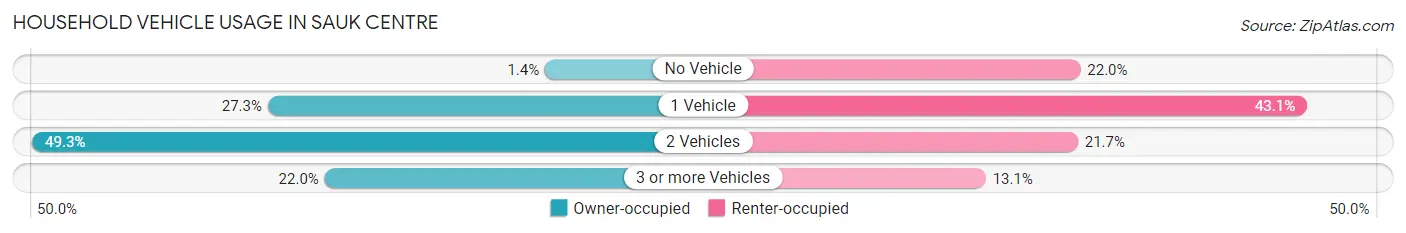
| Vehicles per Household | Owner-occupied | Renter-occupied |
| No Vehicle | 16 (1.4%) | 184 (22.0%) |
| 1 Vehicle | 308 (27.3%) | 361 (43.1%) |
| 2 Vehicles | 556 (49.3%) | 182 (21.7%) |
| 3 or more Vehicles | 248 (22.0%) | 110 (13.1%) |
| Total | 1,128 (100.0%) | 837 (100.0%) |
Real Estate & Mortgages in Sauk Centre
Real Estate and Mortgage Overview in Sauk Centre
| Characteristic | Without Mortgage | With Mortgage |
| Housing Units | 257 | 871 |
| Median Property Value | $219,900 | $179,000 |
| Median Household Income | $91,927 | $136 |
| Monthly Housing Costs | $623 | $0 |
| Real Estate Taxes | $2,658 | $16 |
Property Value by Mortgage Status in Sauk Centre
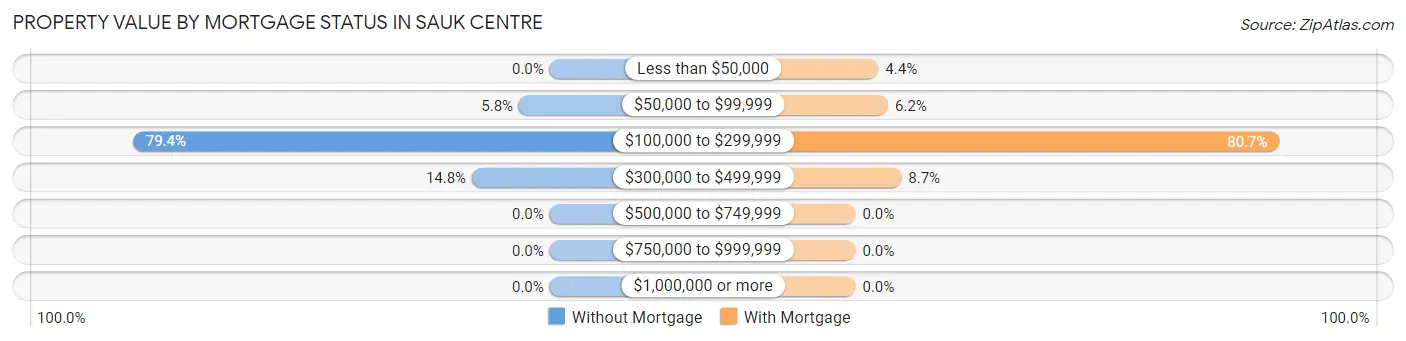
| Property Value | Without Mortgage | With Mortgage |
| Less than $50,000 | 0 (0.0%) | 38 (4.4%) |
| $50,000 to $99,999 | 15 (5.8%) | 54 (6.2%) |
| $100,000 to $299,999 | 204 (79.4%) | 703 (80.7%) |
| $300,000 to $499,999 | 38 (14.8%) | 76 (8.7%) |
| $500,000 to $749,999 | 0 (0.0%) | 0 (0.0%) |
| $750,000 to $999,999 | 0 (0.0%) | 0 (0.0%) |
| $1,000,000 or more | 0 (0.0%) | 0 (0.0%) |
| Total | 257 (100.0%) | 871 (100.0%) |
Household Income by Mortgage Status in Sauk Centre
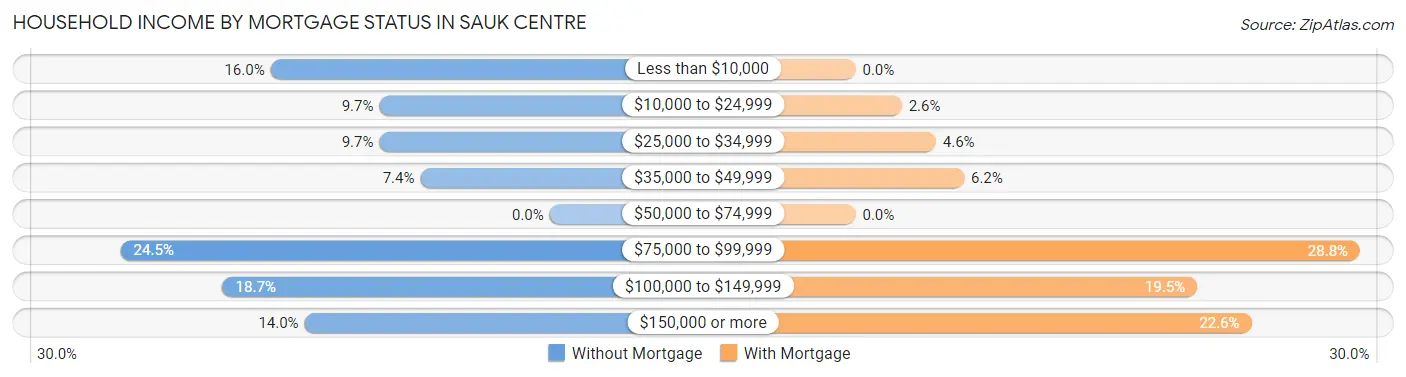
| Household Income | Without Mortgage | With Mortgage |
| Less than $10,000 | 41 (16.0%) | 0 (0.0%) |
| $10,000 to $24,999 | 25 (9.7%) | 23 (2.6%) |
| $25,000 to $34,999 | 25 (9.7%) | 40 (4.6%) |
| $35,000 to $49,999 | 19 (7.4%) | 54 (6.2%) |
| $50,000 to $74,999 | 0 (0.0%) | 0 (0.0%) |
| $75,000 to $99,999 | 63 (24.5%) | 251 (28.8%) |
| $100,000 to $149,999 | 48 (18.7%) | 170 (19.5%) |
| $150,000 or more | 36 (14.0%) | 197 (22.6%) |
| Total | 257 (100.0%) | 871 (100.0%) |
Property Value to Household Income Ratio in Sauk Centre
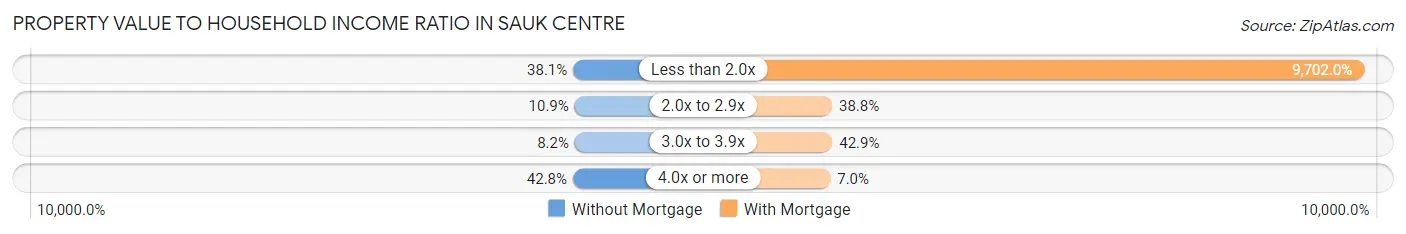
| Value-to-Income Ratio | Without Mortgage | With Mortgage |
| Less than 2.0x | 98 (38.1%) | 84,504 (9,701.9%) |
| 2.0x to 2.9x | 28 (10.9%) | 338 (38.8%) |
| 3.0x to 3.9x | 21 (8.2%) | 374 (42.9%) |
| 4.0x or more | 110 (42.8%) | 61 (7.0%) |
| Total | 257 (100.0%) | 871 (100.0%) |
Real Estate Taxes by Mortgage Status in Sauk Centre
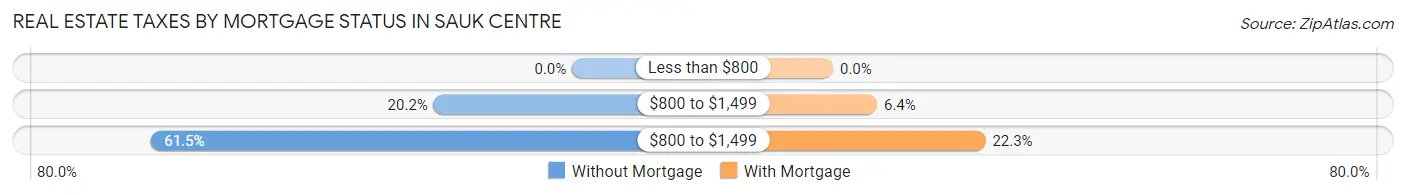
| Property Taxes | Without Mortgage | With Mortgage |
| Less than $800 | 0 (0.0%) | 0 (0.0%) |
| $800 to $1,499 | 52 (20.2%) | 56 (6.4%) |
| $800 to $1,499 | 158 (61.5%) | 194 (22.3%) |
| Total | 257 (100.0%) | 871 (100.0%) |
Health & Disability in Sauk Centre
Health Insurance Coverage by Age in Sauk Centre
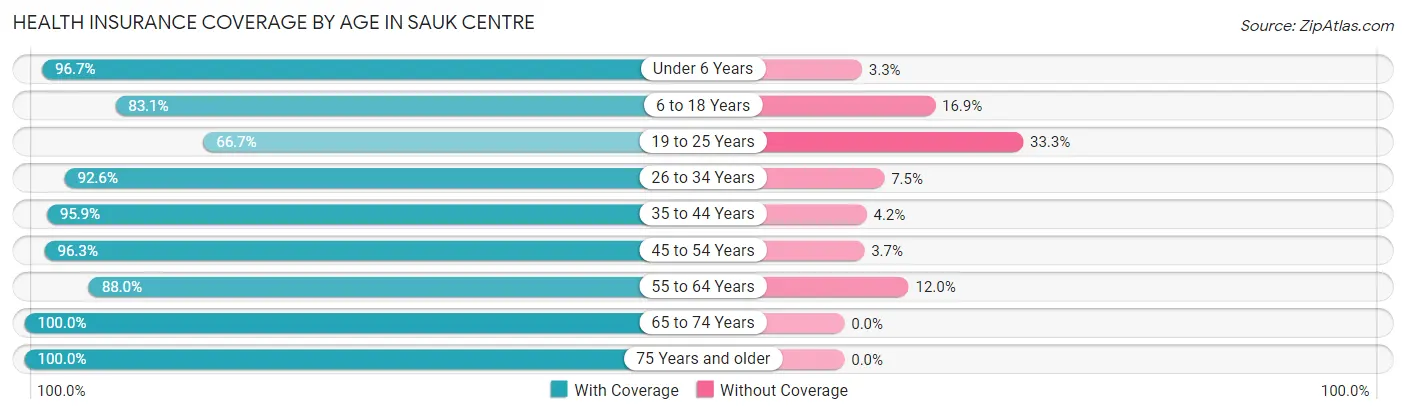
| Age Bracket | With Coverage | Without Coverage |
| Under 6 Years | 383 (96.7%) | 13 (3.3%) |
| 6 to 18 Years | 501 (83.1%) | 102 (16.9%) |
| 19 to 25 Years | 344 (66.7%) | 172 (33.3%) |
| 26 to 34 Years | 634 (92.5%) | 51 (7.4%) |
| 35 to 44 Years | 393 (95.9%) | 17 (4.2%) |
| 45 to 54 Years | 311 (96.3%) | 12 (3.7%) |
| 55 to 64 Years | 588 (88.0%) | 80 (12.0%) |
| 65 to 74 Years | 425 (100.0%) | 0 (0.0%) |
| 75 Years and older | 443 (100.0%) | 0 (0.0%) |
| Total | 4,022 (90.0%) | 447 (10.0%) |
Health Insurance Coverage by Citizenship Status in Sauk Centre
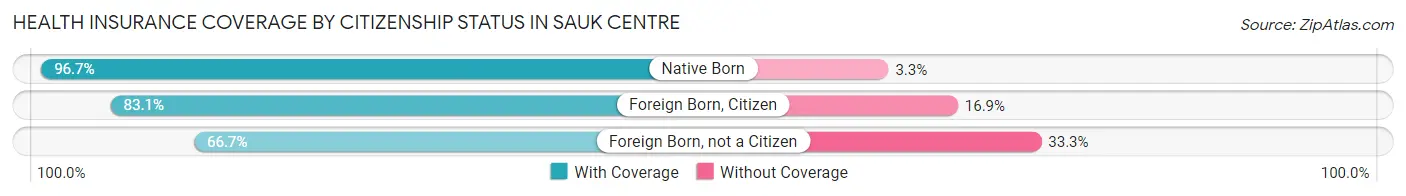
| Citizenship Status | With Coverage | Without Coverage |
| Native Born | 383 (96.7%) | 13 (3.3%) |
| Foreign Born, Citizen | 501 (83.1%) | 102 (16.9%) |
| Foreign Born, not a Citizen | 344 (66.7%) | 172 (33.3%) |
Health Insurance Coverage by Household Income in Sauk Centre
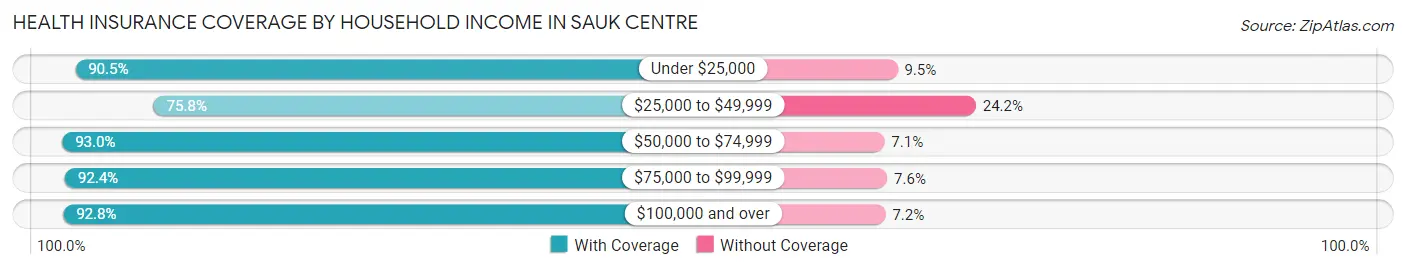
| Household Income | With Coverage | Without Coverage |
| Under $25,000 | 534 (90.5%) | 56 (9.5%) |
| $25,000 to $49,999 | 502 (75.8%) | 160 (24.2%) |
| $50,000 to $74,999 | 778 (92.9%) | 59 (7.0%) |
| $75,000 to $99,999 | 881 (92.4%) | 72 (7.6%) |
| $100,000 and over | 1,281 (92.8%) | 100 (7.2%) |
Public vs Private Health Insurance Coverage by Age in Sauk Centre
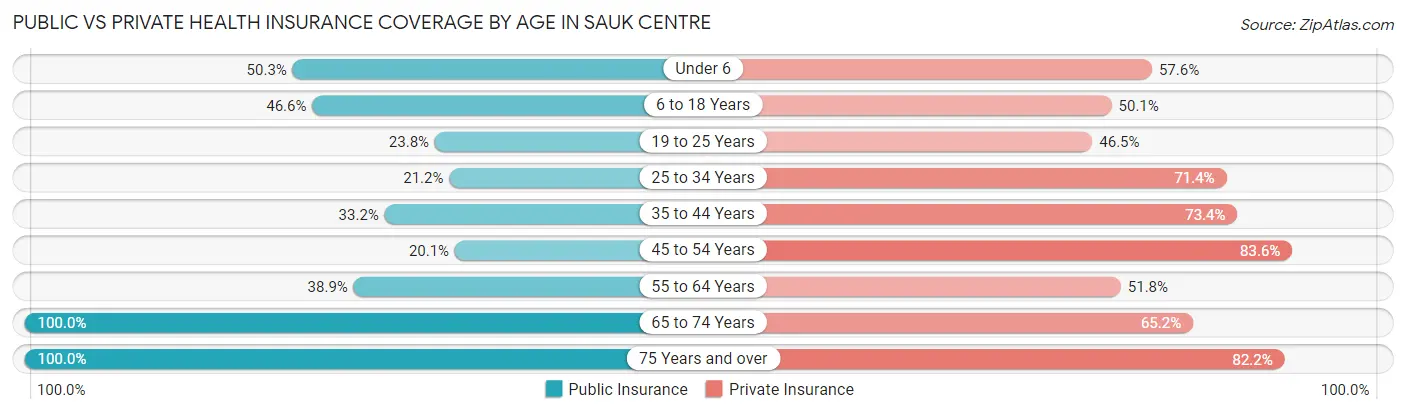
| Age Bracket | Public Insurance | Private Insurance |
| Under 6 | 199 (50.2%) | 228 (57.6%) |
| 6 to 18 Years | 281 (46.6%) | 302 (50.1%) |
| 19 to 25 Years | 123 (23.8%) | 240 (46.5%) |
| 25 to 34 Years | 145 (21.2%) | 489 (71.4%) |
| 35 to 44 Years | 136 (33.2%) | 301 (73.4%) |
| 45 to 54 Years | 65 (20.1%) | 270 (83.6%) |
| 55 to 64 Years | 260 (38.9%) | 346 (51.8%) |
| 65 to 74 Years | 425 (100.0%) | 277 (65.2%) |
| 75 Years and over | 443 (100.0%) | 364 (82.2%) |
| Total | 2,077 (46.5%) | 2,817 (63.0%) |
Disability Status by Sex by Age in Sauk Centre
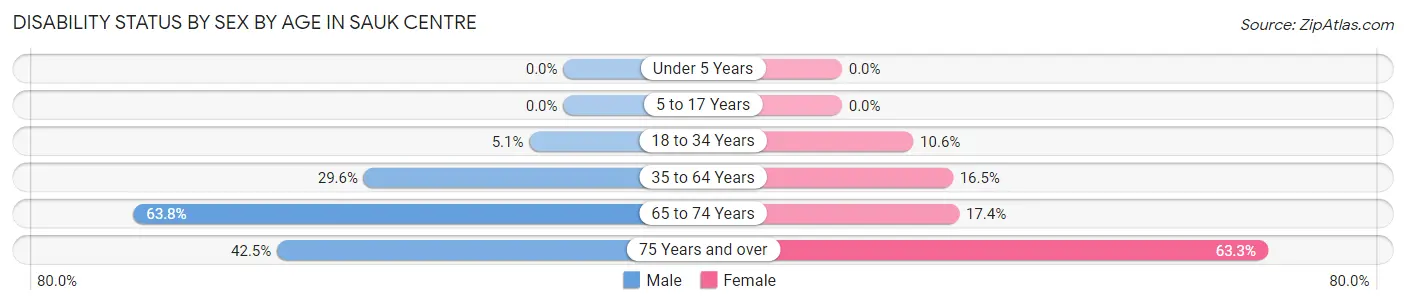
| Age Bracket | Male | Female |
| Under 5 Years | 0 (0.0%) | 0 (0.0%) |
| 5 to 17 Years | 0 (0.0%) | 0 (0.0%) |
| 18 to 34 Years | 32 (5.1%) | 67 (10.6%) |
| 35 to 64 Years | 219 (29.6%) | 109 (16.5%) |
| 65 to 74 Years | 143 (63.8%) | 35 (17.4%) |
| 75 Years and over | 68 (42.5%) | 179 (63.2%) |
Disability Class by Sex by Age in Sauk Centre
Disability Class: Hearing Difficulty
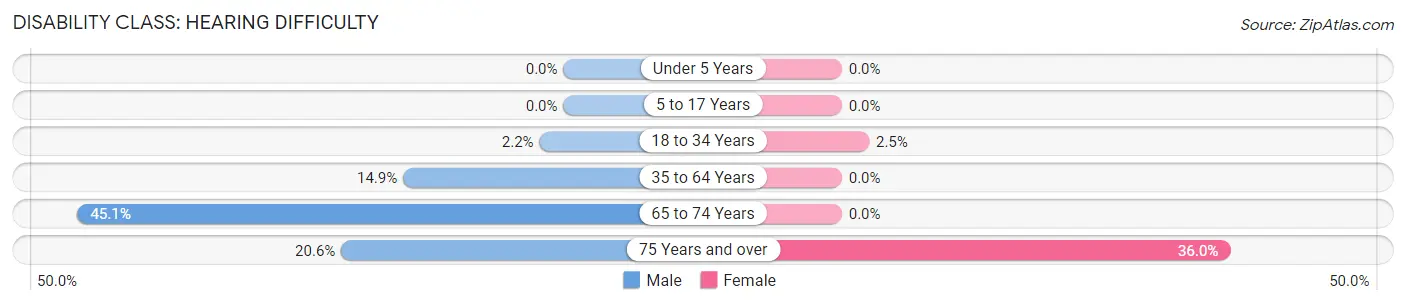
| Age Bracket | Male | Female |
| Under 5 Years | 0 (0.0%) | 0 (0.0%) |
| 5 to 17 Years | 0 (0.0%) | 0 (0.0%) |
| 18 to 34 Years | 14 (2.2%) | 16 (2.5%) |
| 35 to 64 Years | 110 (14.9%) | 0 (0.0%) |
| 65 to 74 Years | 101 (45.1%) | 0 (0.0%) |
| 75 Years and over | 33 (20.6%) | 102 (36.0%) |
Disability Class: Vision Difficulty
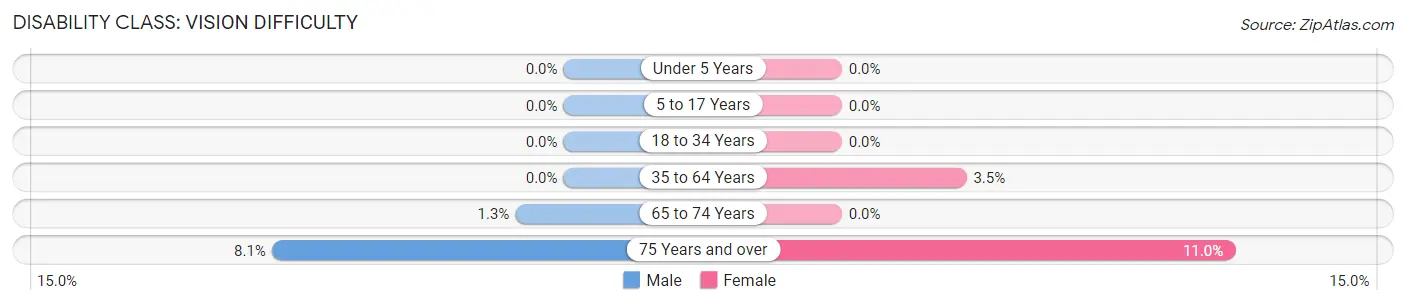
| Age Bracket | Male | Female |
| Under 5 Years | 0 (0.0%) | 0 (0.0%) |
| 5 to 17 Years | 0 (0.0%) | 0 (0.0%) |
| 18 to 34 Years | 0 (0.0%) | 0 (0.0%) |
| 35 to 64 Years | 0 (0.0%) | 23 (3.5%) |
| 65 to 74 Years | 3 (1.3%) | 0 (0.0%) |
| 75 Years and over | 13 (8.1%) | 31 (11.0%) |
Disability Class: Cognitive Difficulty
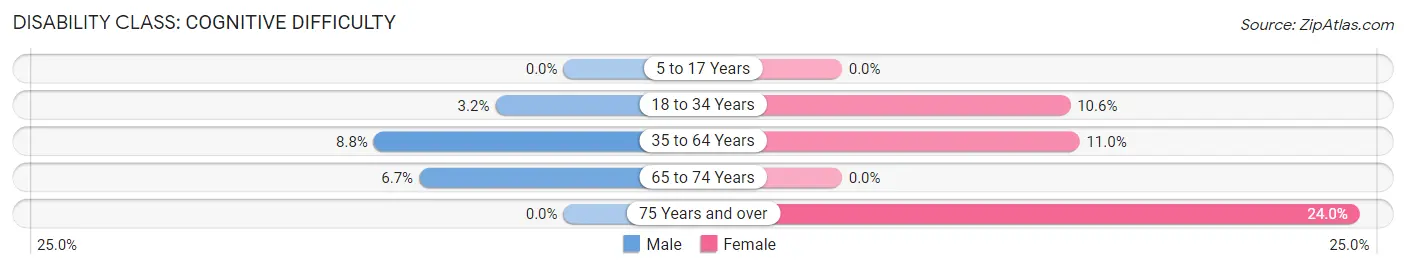
| Age Bracket | Male | Female |
| 5 to 17 Years | 0 (0.0%) | 0 (0.0%) |
| 18 to 34 Years | 20 (3.2%) | 67 (10.6%) |
| 35 to 64 Years | 65 (8.8%) | 73 (11.0%) |
| 65 to 74 Years | 15 (6.7%) | 0 (0.0%) |
| 75 Years and over | 0 (0.0%) | 68 (24.0%) |
Disability Class: Ambulatory Difficulty
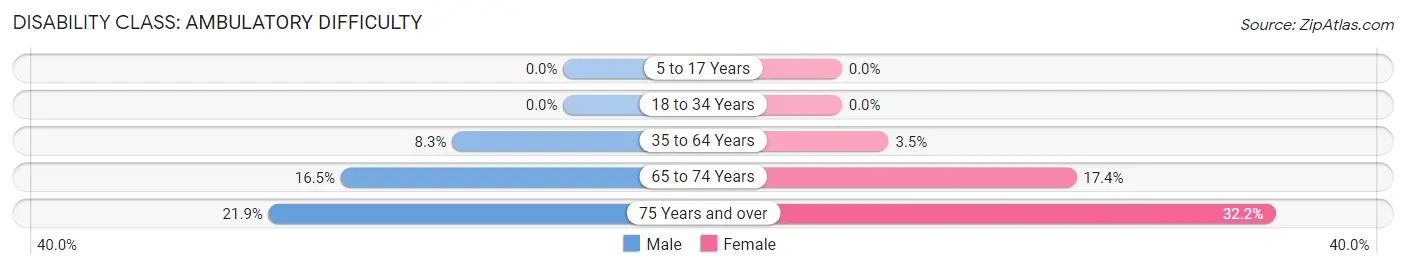
| Age Bracket | Male | Female |
| 5 to 17 Years | 0 (0.0%) | 0 (0.0%) |
| 18 to 34 Years | 0 (0.0%) | 0 (0.0%) |
| 35 to 64 Years | 61 (8.3%) | 23 (3.5%) |
| 65 to 74 Years | 37 (16.5%) | 35 (17.4%) |
| 75 Years and over | 35 (21.9%) | 91 (32.2%) |
Disability Class: Self-Care Difficulty
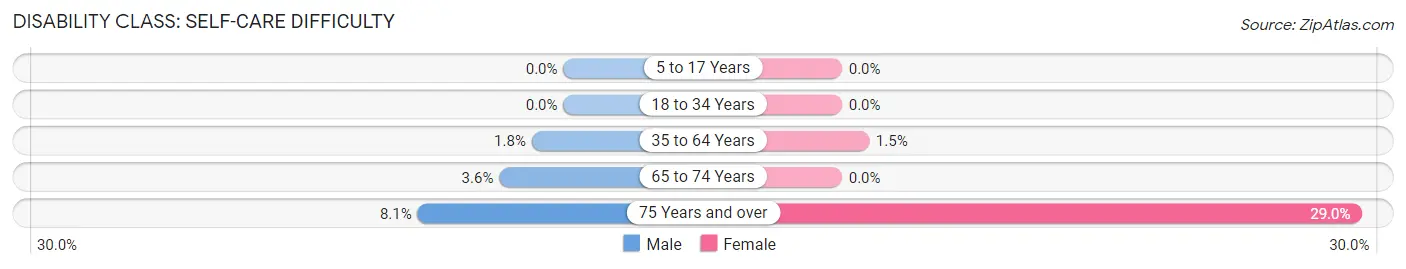
| Age Bracket | Male | Female |
| 5 to 17 Years | 0 (0.0%) | 0 (0.0%) |
| 18 to 34 Years | 0 (0.0%) | 0 (0.0%) |
| 35 to 64 Years | 13 (1.8%) | 10 (1.5%) |
| 65 to 74 Years | 8 (3.6%) | 0 (0.0%) |
| 75 Years and over | 13 (8.1%) | 82 (29.0%) |
Technology Access in Sauk Centre
Computing Device Access in Sauk Centre
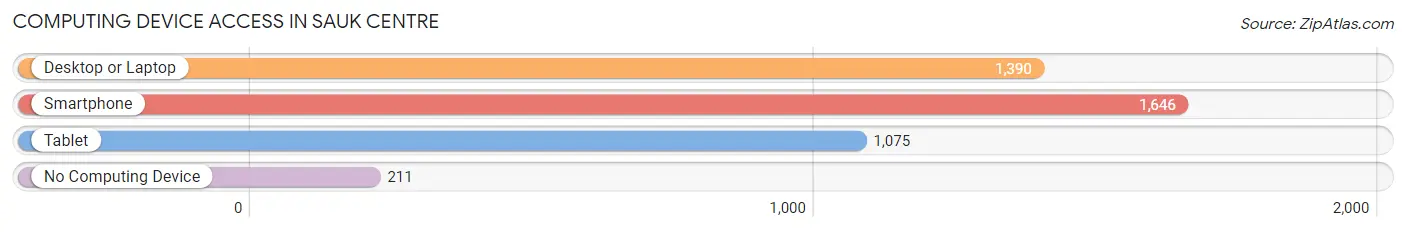
| Device Type | # Households | % Households |
| Desktop or Laptop | 1,390 | 70.7% |
| Smartphone | 1,646 | 83.8% |
| Tablet | 1,075 | 54.7% |
| No Computing Device | 211 | 10.7% |
| Total | 1,965 | 100.0% |
Internet Access in Sauk Centre
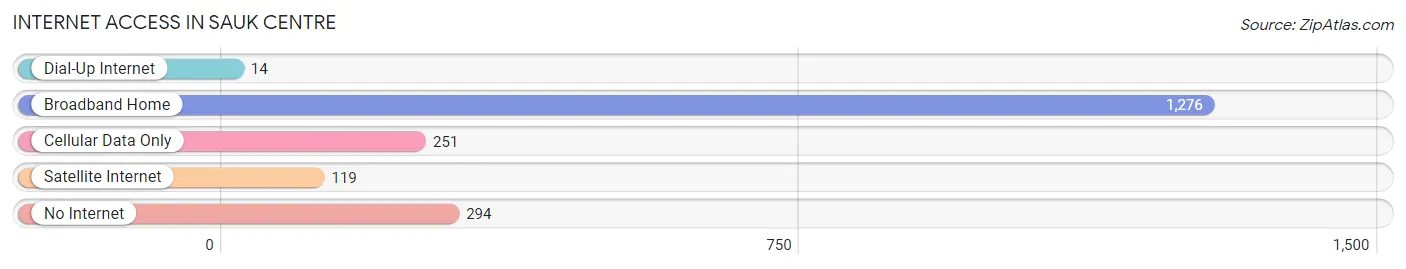
| Internet Type | # Households | % Households |
| Dial-Up Internet | 14 | 0.7% |
| Broadband Home | 1,276 | 64.9% |
| Cellular Data Only | 251 | 12.8% |
| Satellite Internet | 119 | 6.1% |
| No Internet | 294 | 15.0% |
| Total | 1,965 | 100.0% |
Sauk Centre Summary
Sauk Centre is a city located in Stearns County, Minnesota, United States. The population was 4,317 at the 2010 census. It is the birthplace of Sinclair Lewis, the first American to win the Nobel Prize in Literature.
History
Sauk Centre was founded in 1856 by settlers from Sauk Rapids, Minnesota. The city was named after the Sauk River, which runs through the city. The first settlers were mostly German immigrants, and the city was originally known as "Sauk Rapids on the Prairie". The city was incorporated in 1872.
In the late 19th century, Sauk Centre was a major stop on the Great Northern Railway. The city was also home to a number of businesses, including a flour mill, a brewery, and a brickyard.
In the early 20th century, Sauk Centre became a popular tourist destination. The city was home to a number of resorts, including the Sauk Centre Hotel, which was built in 1906. The hotel was a popular destination for wealthy tourists from the Twin Cities.
In 1920, Sauk Centre was the birthplace of Sinclair Lewis, the first American to win the Nobel Prize in Literature. Lewis wrote about his hometown in his novel Main Street, which was published in 1920.
Geography
Sauk Centre is located at 45 41 25 North 94 59 45 West 45 690278 94 995833
According to the United States Census Bureau, the city has a total area of 3.2 square miles (8.3 km2), all of it land.
Economy
Sauk Centre's economy is largely based on agriculture and tourism. The city is home to a number of farms, as well as a number of businesses related to tourism, such as hotels, restaurants, and retail stores.
The city is also home to a number of manufacturing companies, including a plastics manufacturer, a metal fabricator, and a printing company.
Demographics
As of the census of 2010, there were 4,317 people, 1,717 households, and 1,093 families residing in the city. The population density was 1,346.2 people per square mile (520.2/km2). There were 1,845 housing units at an average density of 576.3 per square mile (223.2/km2). The racial makeup of the city was 97.2% White, 0.3% African American, 0.3% Native American, 0.4% Asian, 0.2% from other races, and 1.6% from two or more races. Hispanic or Latino of any race were 1.2% of the population.
There were 1,717 households, out of which 30.2% had children under the age of 18 living with them, 48.2% were married couples living together, 10.3% had a female householder with no husband present, and 36.7% were non-families. 32.2% of all households were made up of individuals, and 16.2% had someone living alone who was 65 years of age or older. The average household size was 2.41 and the average family size was 3.04.
In the city, the population was spread out, with 25.2% under the age of 18, 8.2% from 18 to 24, 25.2% from 25 to 44, 21.2% from 45 to 64, and 20.2% who were 65 years of age or older. The median age was 38 years. For every 100 females, there were 91.2 males. For every 100 females age 18 and over, there were 87.2 males.
The median income for a household in the city was $37,917, and the median income for a family was $45,938. Males had a median income of $31,964 versus $22,917 for females. The per capita income for the city was $18,945. About 6.2% of families and 8.7% of the population were below the poverty line, including 10.2% of those under age 18 and 8.2% of those age 65 or over.
Common Questions
What is Per Capita Income in Sauk Centre?
Per Capita income in Sauk Centre is $32,533.
What is the Median Family Income in Sauk Centre?
Median Family Income in Sauk Centre is $76,458.
What is the Median Household income in Sauk Centre?
Median Household Income in Sauk Centre is $68,094.
What is Income or Wage Gap in Sauk Centre?
Income or Wage Gap in Sauk Centre is 28.7%.
Women in Sauk Centre earn 71.3 cents for every dollar earned by a man.
What is Inequality or Gini Index in Sauk Centre?
Inequality or Gini Index in Sauk Centre is 0.41.
What is the Total Population of Sauk Centre?
Total Population of Sauk Centre is 4,568.
What is the Total Male Population of Sauk Centre?
Total Male Population of Sauk Centre is 2,167.
What is the Total Female Population of Sauk Centre?
Total Female Population of Sauk Centre is 2,401.
What is the Ratio of Males per 100 Females in Sauk Centre?
There are 90.25 Males per 100 Females in Sauk Centre.
What is the Ratio of Females per 100 Males in Sauk Centre?
There are 110.80 Females per 100 Males in Sauk Centre.
What is the Median Population Age in Sauk Centre?
Median Population Age in Sauk Centre is 36.9 Years.
What is the Average Family Size in Sauk Centre
Average Family Size in Sauk Centre is 2.8 People.
What is the Average Household Size in Sauk Centre
Average Household Size in Sauk Centre is 2.2 People.
How Large is the Labor Force in Sauk Centre?
There are 2,520 People in the Labor Forcein in Sauk Centre.
What is the Percentage of People in the Labor Force in Sauk Centre?
68.6% of People are in the Labor Force in Sauk Centre.
What is the Unemployment Rate in Sauk Centre?
Unemployment Rate in Sauk Centre is 6.8%.