Westbrook, MN Map & Demographics
Westbrook Map
Westbrook Overview
$26,643
PER CAPITA INCOME
$75,313
AVG FAMILY INCOME
$40,278
AVG HOUSEHOLD INCOME
70.5%
WAGE / INCOME GAP [ % ]
29.5¢/ $1
WAGE / INCOME GAP [ $ ]
0.45
INEQUALITY / GINI INDEX
832
TOTAL POPULATION
389
MALE POPULATION
443
FEMALE POPULATION
87.81
MALES / 100 FEMALES
113.88
FEMALES / 100 MALES
42.5
MEDIAN AGE
3.1
AVG FAMILY SIZE
2.1
AVG HOUSEHOLD SIZE
396
LABOR FORCE [ PEOPLE ]
59.6%
PERCENT IN LABOR FORCE
1.0%
UNEMPLOYMENT RATE
Westbrook Zip Codes
Westbrook Area Codes
Income in Westbrook
Income Overview in Westbrook
Per Capita Income in Westbrook is $26,643, while median incomes of families and households are $75,313 and $40,278 respectively.
| Characteristic | Number | Measure |
| Per Capita Income | 832 | $26,643 |
| Median Family Income | 182 | $75,313 |
| Mean Family Income | 182 | $79,401 |
| Median Household Income | 388 | $40,278 |
| Mean Household Income | 388 | $53,938 |
| Income Deficit | 182 | $0 |
| Wage / Income Gap (%) | 832 | 70.53% |
| Wage / Income Gap ($) | 832 | 29.47¢ per $1 |
| Gini / Inequality Index | 832 | 0.45 |
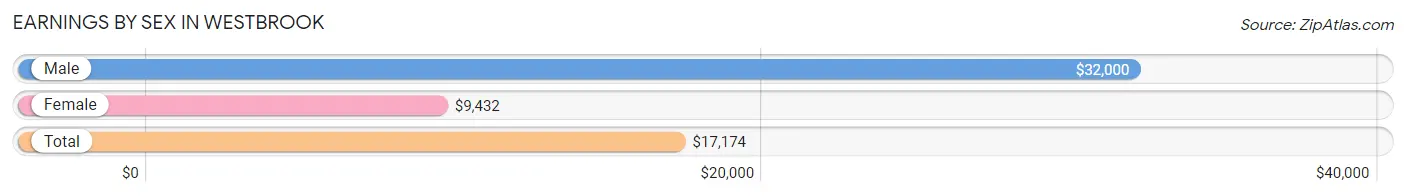
Earnings by Sex in Westbrook
Average Earnings in Westbrook are $17,174, $32,000 for men and $9,432 for women, a difference of 70.5%.
| Sex | Number | Average Earnings |
| Male | 256 (53.6%) | $32,000 |
| Female | 222 (46.4%) | $9,432 |
| Total | 478 (100.0%) | $17,174 |
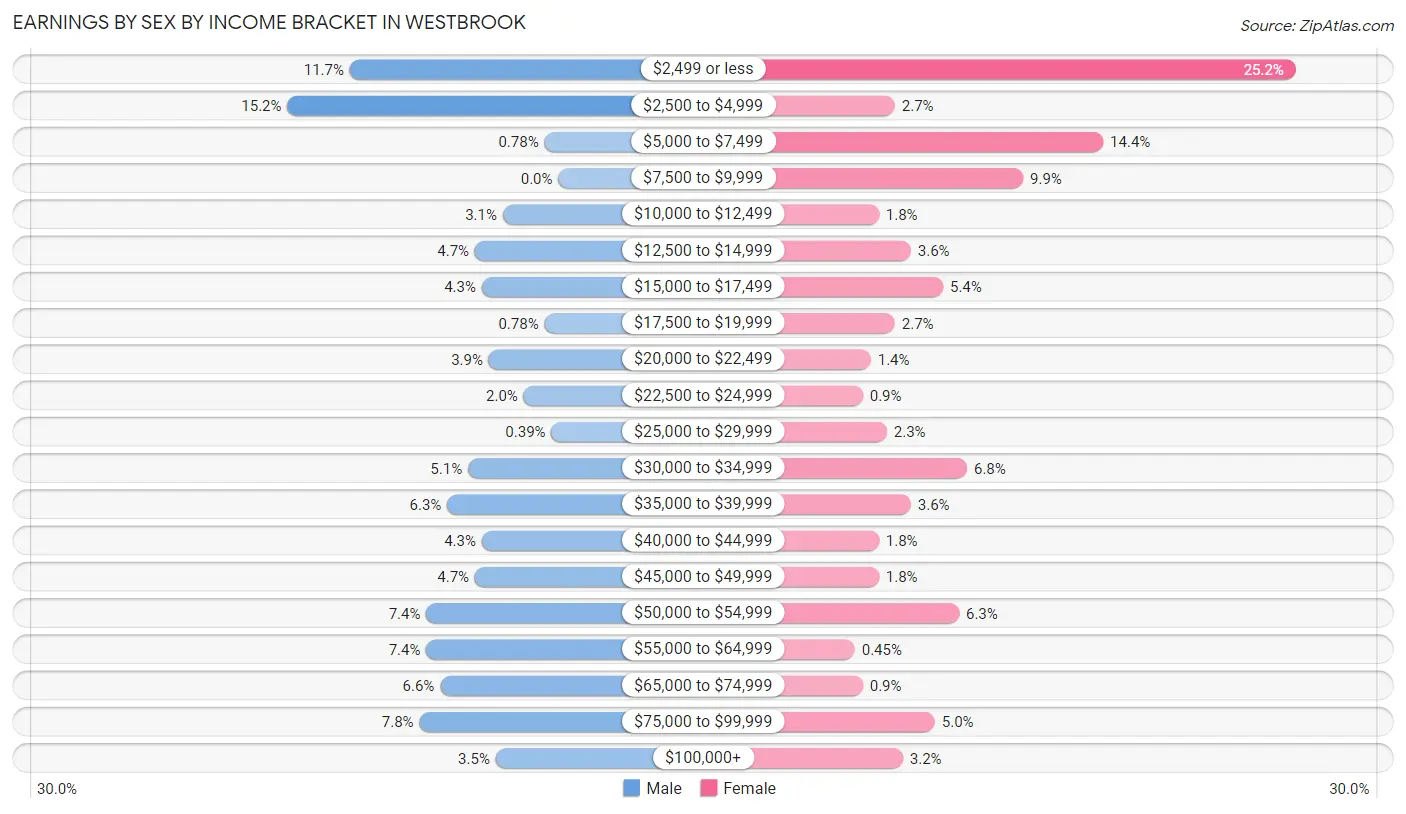
Earnings by Sex by Income Bracket in Westbrook
The most common earnings brackets in Westbrook are $2,500 to $4,999 for men (39 | 15.2%) and $2,499 or less for women (56 | 25.2%).
| Income | Male | Female |
| $2,499 or less | 30 (11.7%) | 56 (25.2%) |
| $2,500 to $4,999 | 39 (15.2%) | 6 (2.7%) |
| $5,000 to $7,499 | 2 (0.8%) | 32 (14.4%) |
| $7,500 to $9,999 | 0 (0.0%) | 22 (9.9%) |
| $10,000 to $12,499 | 8 (3.1%) | 4 (1.8%) |
| $12,500 to $14,999 | 12 (4.7%) | 8 (3.6%) |
| $15,000 to $17,499 | 11 (4.3%) | 12 (5.4%) |
| $17,500 to $19,999 | 2 (0.8%) | 6 (2.7%) |
| $20,000 to $22,499 | 10 (3.9%) | 3 (1.3%) |
| $22,500 to $24,999 | 5 (1.9%) | 2 (0.9%) |
| $25,000 to $29,999 | 1 (0.4%) | 5 (2.2%) |
| $30,000 to $34,999 | 13 (5.1%) | 15 (6.8%) |
| $35,000 to $39,999 | 16 (6.2%) | 8 (3.6%) |
| $40,000 to $44,999 | 11 (4.3%) | 4 (1.8%) |
| $45,000 to $49,999 | 12 (4.7%) | 4 (1.8%) |
| $50,000 to $54,999 | 19 (7.4%) | 14 (6.3%) |
| $55,000 to $64,999 | 19 (7.4%) | 1 (0.4%) |
| $65,000 to $74,999 | 17 (6.6%) | 2 (0.9%) |
| $75,000 to $99,999 | 20 (7.8%) | 11 (5.0%) |
| $100,000+ | 9 (3.5%) | 7 (3.2%) |
| Total | 256 (100.0%) | 222 (100.0%) |
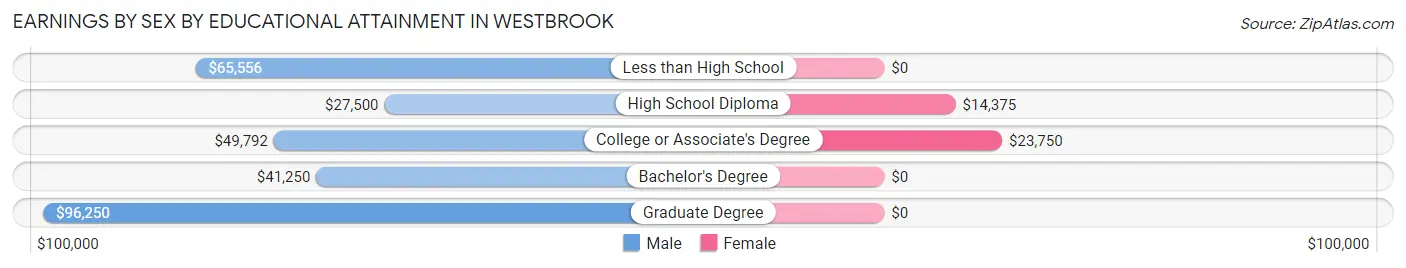
Earnings by Sex by Educational Attainment in Westbrook
Average earnings in Westbrook are $40,313 for men and $15,875 for women, a difference of 60.6%. Men with an educational attainment of graduate degree enjoy the highest average annual earnings of $96,250, while those with high school diploma education earn the least with $27,500. Women with an educational attainment of college or associate's degree earn the most with the average annual earnings of $23,750, while those with high school diploma education have the smallest earnings of $14,375.
| Educational Attainment | Male Income | Female Income |
| Less than High School | $65,556 | $0 |
| High School Diploma | $27,500 | $14,375 |
| College or Associate's Degree | $49,792 | $23,750 |
| Bachelor's Degree | $41,250 | $0 |
| Graduate Degree | $96,250 | $0 |
| Total | $40,313 | $15,875 |
Family Income in Westbrook
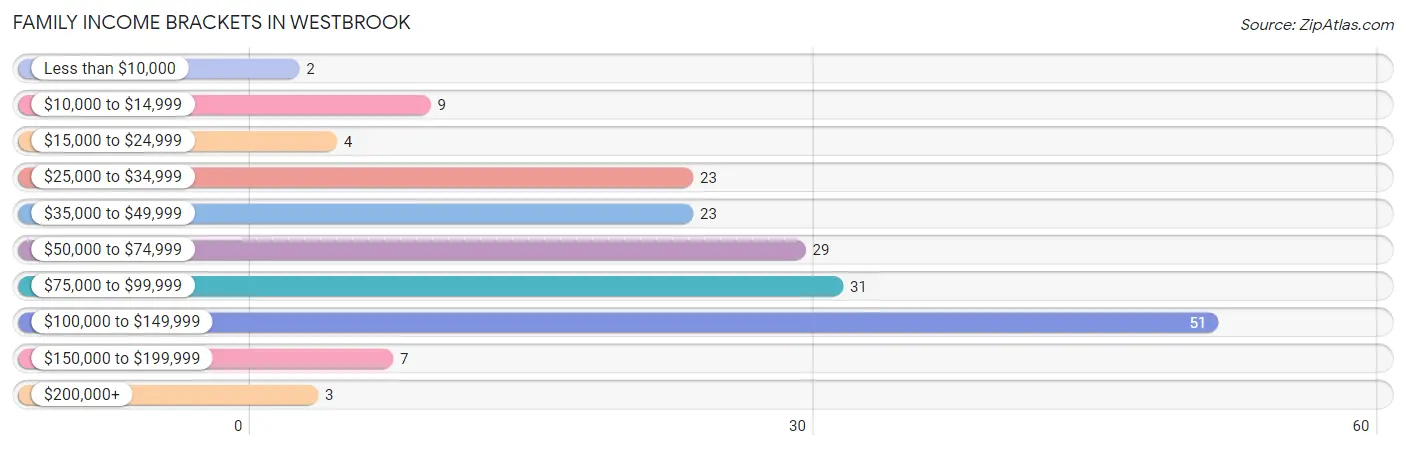
Family Income Brackets in Westbrook
According to the Westbrook family income data, there are 51 families falling into the $100,000 to $149,999 income range, which is the most common income bracket and makes up 28.0% of all families. Conversely, the less than $10,000 income bracket is the least frequent group with only 2 families (1.1%) belonging to this category.
| Income Bracket | # Families | % Families |
| Less than $10,000 | 2 | 1.1% |
| $10,000 to $14,999 | 9 | 4.9% |
| $15,000 to $24,999 | 4 | 2.2% |
| $25,000 to $34,999 | 23 | 12.6% |
| $35,000 to $49,999 | 23 | 12.6% |
| $50,000 to $74,999 | 29 | 15.9% |
| $75,000 to $99,999 | 31 | 17.0% |
| $100,000 to $149,999 | 51 | 28.0% |
| $150,000 to $199,999 | 7 | 3.8% |
| $200,000+ | 3 | 1.6% |
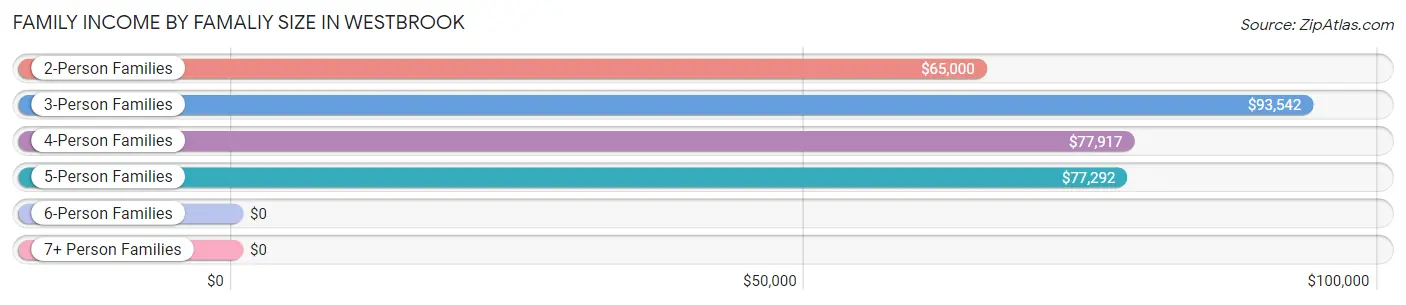
Family Income by Famaliy Size in Westbrook
3-person families (44 | 24.2%) account for the highest median family income in Westbrook with $93,542 per family, while 2-person families (90 | 49.4%) have the highest median income of $32,500 per family member.
| Income Bracket | # Families | Median Income |
| 2-Person Families | 90 (49.4%) | $65,000 |
| 3-Person Families | 44 (24.2%) | $93,542 |
| 4-Person Families | 21 (11.5%) | $77,917 |
| 5-Person Families | 19 (10.4%) | $77,292 |
| 6-Person Families | 7 (3.8%) | $0 |
| 7+ Person Families | 1 (0.5%) | $0 |
| Total | 182 (100.0%) | $75,313 |
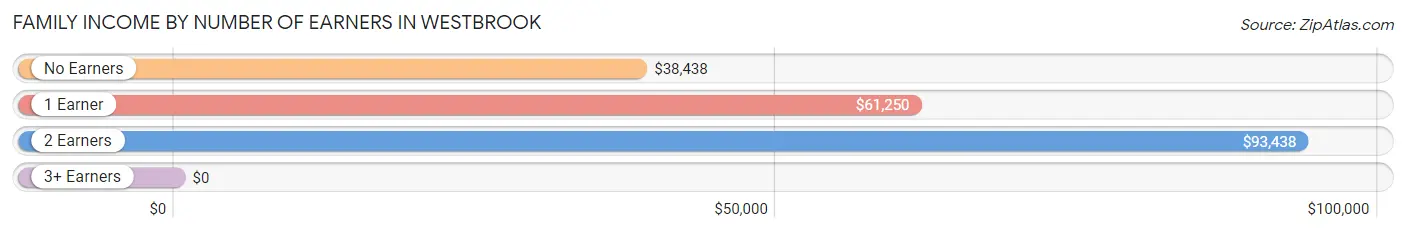
Family Income by Number of Earners in Westbrook
| Number of Earners | # Families | Median Income |
| No Earners | 33 (18.1%) | $38,438 |
| 1 Earner | 45 (24.7%) | $61,250 |
| 2 Earners | 99 (54.4%) | $93,438 |
| 3+ Earners | 5 (2.8%) | $0 |
| Total | 182 (100.0%) | $75,313 |
Household Income in Westbrook
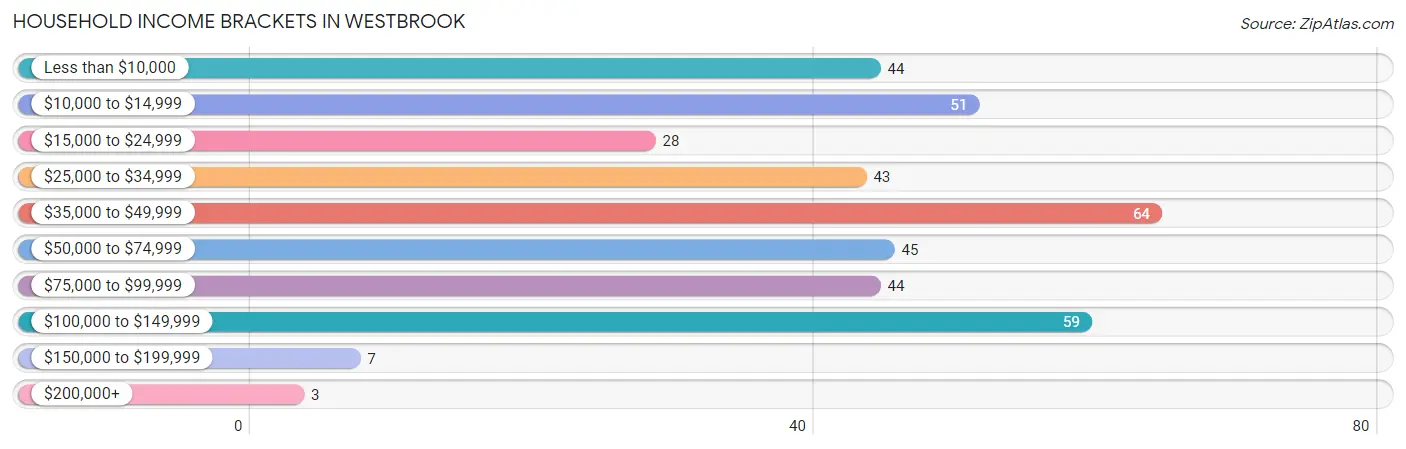
Household Income Brackets in Westbrook
With 64 households falling in the category, the $35,000 to $49,999 income range is the most frequent in Westbrook, accounting for 16.5% of all households. In contrast, only 3 households (0.8%) fall into the $200,000+ income bracket, making it the least populous group.
| Income Bracket | # Households | % Households |
| Less than $10,000 | 44 | 11.3% |
| $10,000 to $14,999 | 51 | 13.1% |
| $15,000 to $24,999 | 28 | 7.2% |
| $25,000 to $34,999 | 43 | 11.1% |
| $35,000 to $49,999 | 64 | 16.5% |
| $50,000 to $74,999 | 45 | 11.6% |
| $75,000 to $99,999 | 44 | 11.3% |
| $100,000 to $149,999 | 59 | 15.2% |
| $150,000 to $199,999 | 7 | 1.8% |
| $200,000+ | 3 | 0.8% |
Household Income by Householder Age in Westbrook
The median household income in Westbrook is $40,278, with the highest median household income of $75,278 found in the 25 to 44 years age bracket for the primary householder. A total of 76 households (19.6%) fall into this category. Meanwhile, the 45 to 64 years age bracket for the primary householder has the lowest median household income of $0, with 113 households (29.1%) in this group.
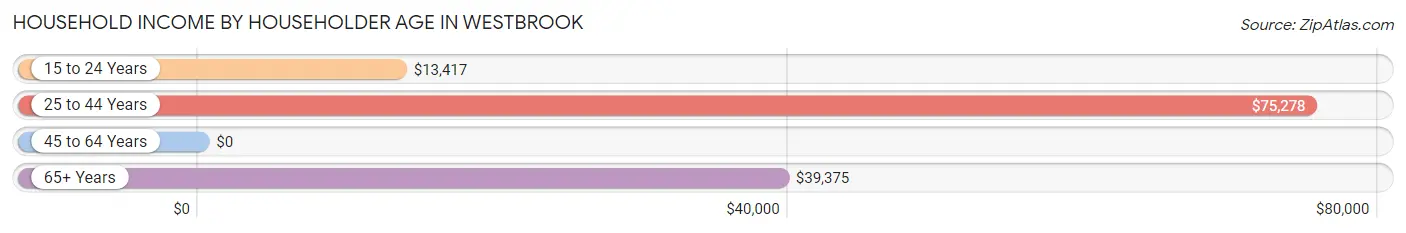
| Income Bracket | # Households | Median Income |
| 15 to 24 Years | 74 (19.1%) | $13,417 |
| 25 to 44 Years | 76 (19.6%) | $75,278 |
| 45 to 64 Years | 113 (29.1%) | $0 |
| 65+ Years | 125 (32.2%) | $39,375 |
| Total | 388 (100.0%) | $40,278 |
Poverty in Westbrook
Income Below Poverty by Sex and Age in Westbrook
With 13.7% poverty level for males and 23.1% for females among the residents of Westbrook, 16 and 17 year old males and 18 to 24 year old females are the most vulnerable to poverty, with 4 males (66.7%) and 43 females (87.8%) in their respective age groups living below the poverty level.
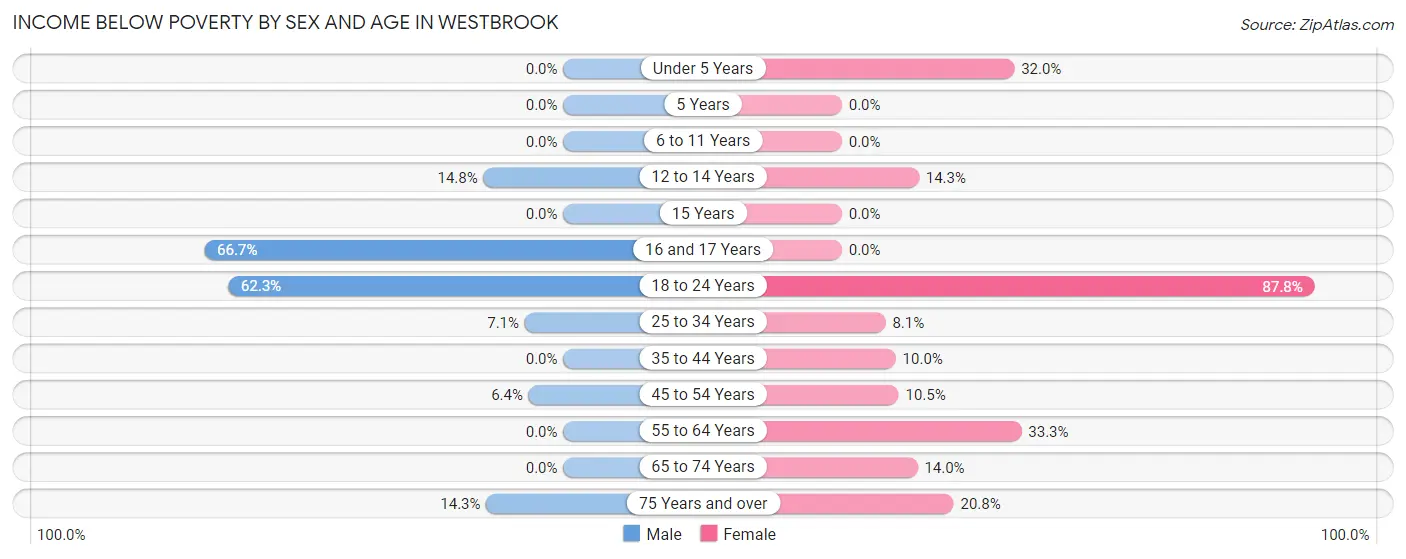
| Age Bracket | Male | Female |
| Under 5 Years | 0 (0.0%) | 8 (32.0%) |
| 5 Years | 0 (0.0%) | 0 (0.0%) |
| 6 to 11 Years | 0 (0.0%) | 0 (0.0%) |
| 12 to 14 Years | 4 (14.8%) | 5 (14.3%) |
| 15 Years | 0 (0.0%) | 0 (0.0%) |
| 16 and 17 Years | 4 (66.7%) | 0 (0.0%) |
| 18 to 24 Years | 33 (62.3%) | 43 (87.8%) |
| 25 to 34 Years | 2 (7.1%) | 3 (8.1%) |
| 35 to 44 Years | 0 (0.0%) | 7 (10.0%) |
| 45 to 54 Years | 5 (6.4%) | 4 (10.5%) |
| 55 to 64 Years | 0 (0.0%) | 10 (33.3%) |
| 65 to 74 Years | 0 (0.0%) | 8 (14.0%) |
| 75 Years and over | 4 (14.3%) | 11 (20.7%) |
| Total | 52 (13.7%) | 99 (23.1%) |
Income Above Poverty by Sex and Age in Westbrook
According to the poverty statistics in Westbrook, males aged under 5 years and females aged 5 years are the age groups that are most secure financially, with 100.0% of males and 100.0% of females in these age groups living above the poverty line.
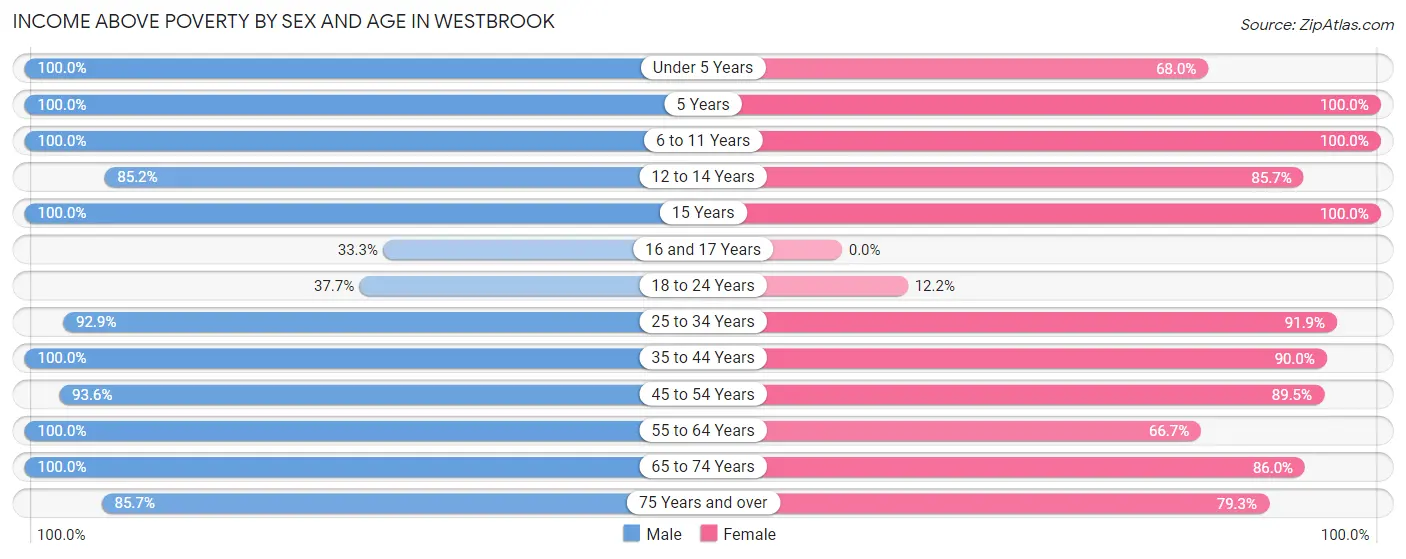
| Age Bracket | Male | Female |
| Under 5 Years | 17 (100.0%) | 17 (68.0%) |
| 5 Years | 6 (100.0%) | 4 (100.0%) |
| 6 to 11 Years | 7 (100.0%) | 23 (100.0%) |
| 12 to 14 Years | 23 (85.2%) | 30 (85.7%) |
| 15 Years | 13 (100.0%) | 7 (100.0%) |
| 16 and 17 Years | 2 (33.3%) | 0 (0.0%) |
| 18 to 24 Years | 20 (37.7%) | 6 (12.2%) |
| 25 to 34 Years | 26 (92.9%) | 34 (91.9%) |
| 35 to 44 Years | 43 (100.0%) | 63 (90.0%) |
| 45 to 54 Years | 73 (93.6%) | 34 (89.5%) |
| 55 to 64 Years | 35 (100.0%) | 20 (66.7%) |
| 65 to 74 Years | 40 (100.0%) | 49 (86.0%) |
| 75 Years and over | 24 (85.7%) | 42 (79.2%) |
| Total | 329 (86.4%) | 329 (76.9%) |
Income Below Poverty Among Married-Couple Families in Westbrook
The poverty statistics for married-couple families in Westbrook show that 5.1% or 7 of the total 138 families live below the poverty line. Families with 1 or 2 children have the highest poverty rate of 6.1%, comprising of 3 families. On the other hand, families with 3 or 4 children have the lowest poverty rate of 0.0%, which includes 0 families.
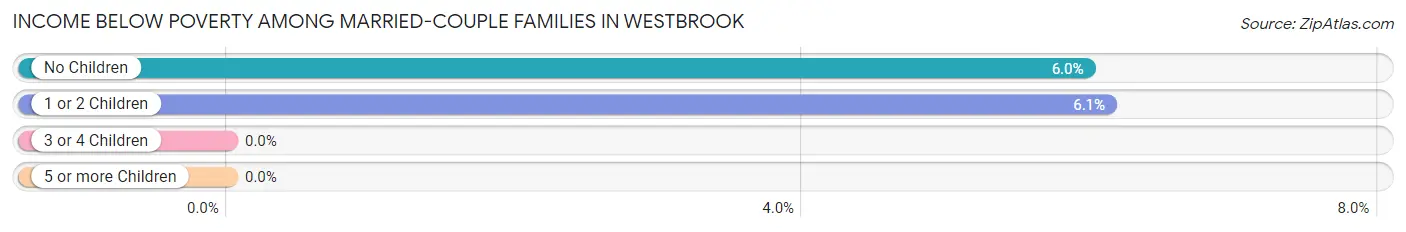
| Children | Above Poverty | Below Poverty |
| No Children | 63 (94.0%) | 4 (6.0%) |
| 1 or 2 Children | 46 (93.9%) | 3 (6.1%) |
| 3 or 4 Children | 21 (100.0%) | 0 (0.0%) |
| 5 or more Children | 1 (100.0%) | 0 (0.0%) |
| Total | 131 (94.9%) | 7 (5.1%) |
Income Below Poverty Among Single-Parent Households in Westbrook
According to the poverty data in Westbrook, 10.0% or 2 single-father households and 29.2% or 7 single-mother households are living below the poverty line. Among single-father households, those with 3 or 4 children have the highest poverty rate, with 2 households (100.0%) experiencing poverty. Likewise, among single-mother households, those with 1 or 2 children have the highest poverty rate, with 7 households (46.7%) falling below the poverty line.
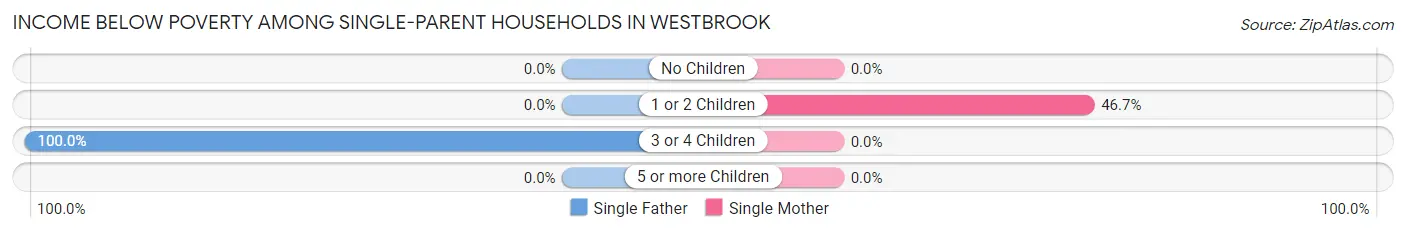
| Children | Single Father | Single Mother |
| No Children | 0 (0.0%) | 0 (0.0%) |
| 1 or 2 Children | 0 (0.0%) | 7 (46.7%) |
| 3 or 4 Children | 2 (100.0%) | 0 (0.0%) |
| 5 or more Children | 0 (0.0%) | 0 (0.0%) |
| Total | 2 (10.0%) | 7 (29.2%) |
Income Below Poverty Among Married-Couple vs Single-Parent Households in Westbrook
The poverty data for Westbrook shows that 7 of the married-couple family households (5.1%) and 9 of the single-parent households (20.4%) are living below the poverty level. Within the married-couple family households, those with 1 or 2 children have the highest poverty rate, with 3 households (6.1%) falling below the poverty line. Among the single-parent households, those with 3 or 4 children have the highest poverty rate, with 2 household (100.0%) living below poverty.
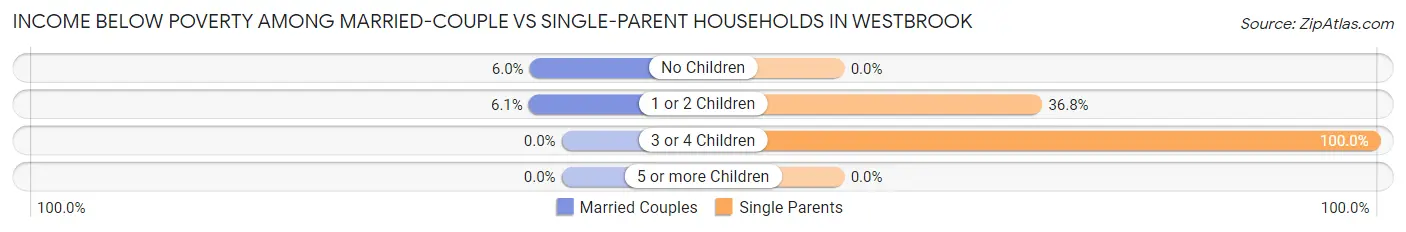
| Children | Married-Couple Families | Single-Parent Households |
| No Children | 4 (6.0%) | 0 (0.0%) |
| 1 or 2 Children | 3 (6.1%) | 7 (36.8%) |
| 3 or 4 Children | 0 (0.0%) | 2 (100.0%) |
| 5 or more Children | 0 (0.0%) | 0 (0.0%) |
| Total | 7 (5.1%) | 9 (20.4%) |
Race in Westbrook
The most populous races in Westbrook are White / Caucasian (753 | 90.5%), Asian (39 | 4.7%), and Two or more Races (25 | 3.0%).
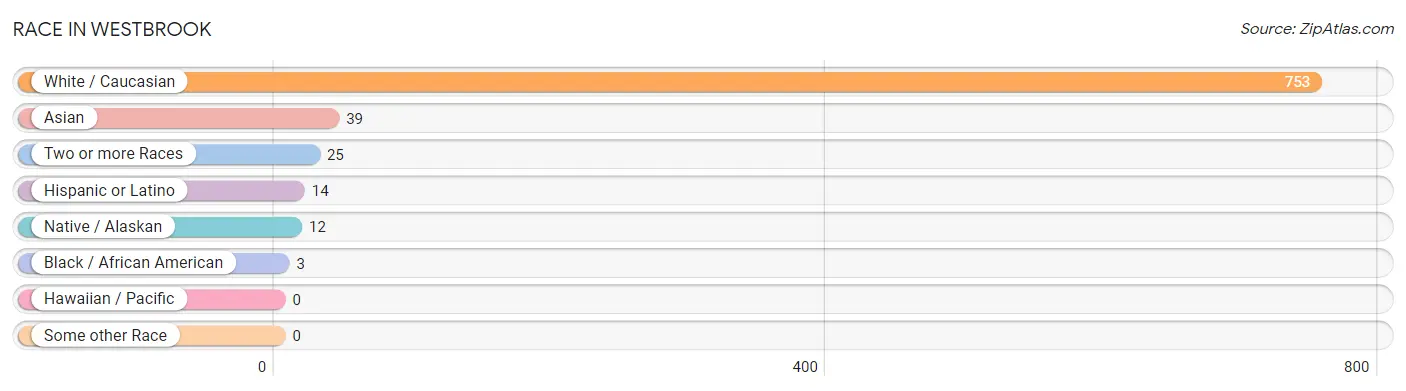
| Race | # Population | % Population |
| Asian | 39 | 4.7% |
| Black / African American | 3 | 0.4% |
| Hawaiian / Pacific | 0 | 0.0% |
| Hispanic or Latino | 14 | 1.7% |
| Native / Alaskan | 12 | 1.4% |
| White / Caucasian | 753 | 90.5% |
| Two or more Races | 25 | 3.0% |
| Some other Race | 0 | 0.0% |
| Total | 832 | 100.0% |
Ancestry in Westbrook
The most populous ancestries reported in Westbrook are German (371 | 44.6%), Norwegian (120 | 14.4%), Irish (65 | 7.8%), Danish (64 | 7.7%), and English (58 | 7.0%), together accounting for 81.5% of all Westbrook residents.
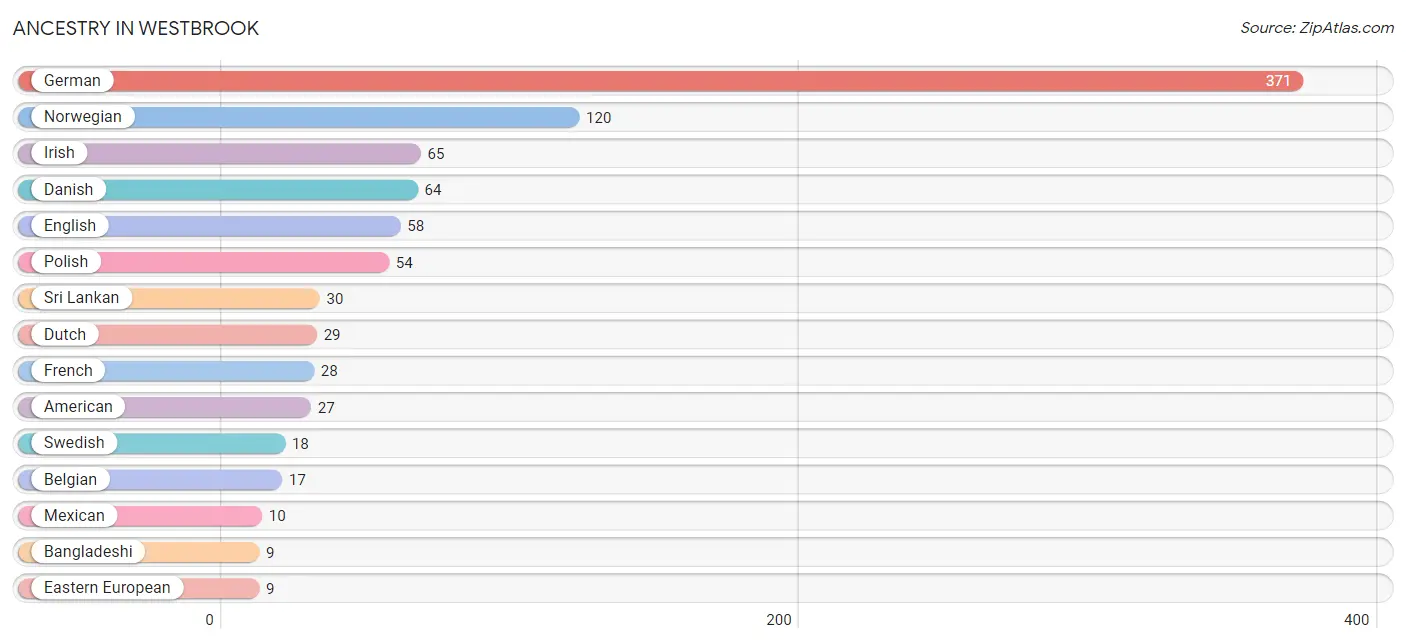
| Ancestry | # Population | % Population |
| American | 27 | 3.3% |
| Austrian | 2 | 0.2% |
| Bangladeshi | 9 | 1.1% |
| Belgian | 17 | 2.0% |
| Cherokee | 2 | 0.2% |
| Crow | 3 | 0.4% |
| Czech | 2 | 0.2% |
| Danish | 64 | 7.7% |
| Dutch | 29 | 3.5% |
| Eastern European | 9 | 1.1% |
| English | 58 | 7.0% |
| Finnish | 2 | 0.2% |
| French | 28 | 3.4% |
| French Canadian | 5 | 0.6% |
| German | 371 | 44.6% |
| Irish | 65 | 7.8% |
| Mexican | 10 | 1.2% |
| Northern European | 6 | 0.7% |
| Norwegian | 120 | 14.4% |
| Pakistani | 4 | 0.5% |
| Polish | 54 | 6.5% |
| Russian | 8 | 1.0% |
| Scandinavian | 5 | 0.6% |
| Scottish | 6 | 0.7% |
| Spanish | 4 | 0.5% |
| Sri Lankan | 30 | 3.6% |
| Swedish | 18 | 2.2% |
| Swiss | 3 | 0.4% | View All 28 Rows |
Immigrants in Westbrook
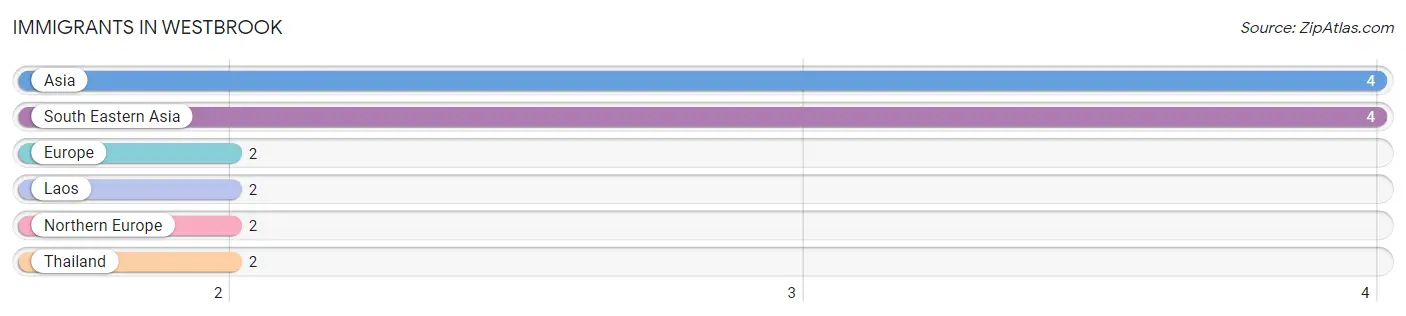
The most numerous immigrant groups reported in Westbrook came from Asia (4 | 0.5%), South Eastern Asia (4 | 0.5%), Europe (2 | 0.2%), Laos (2 | 0.2%), and Northern Europe (2 | 0.2%), together accounting for 1.7% of all Westbrook residents.
| Immigration Origin | # Population | % Population |
| Asia | 4 | 0.5% |
| Europe | 2 | 0.2% |
| Laos | 2 | 0.2% |
| Northern Europe | 2 | 0.2% |
| South Eastern Asia | 4 | 0.5% |
| Thailand | 2 | 0.2% | View All 6 Rows |
Sex and Age in Westbrook
Sex and Age in Westbrook
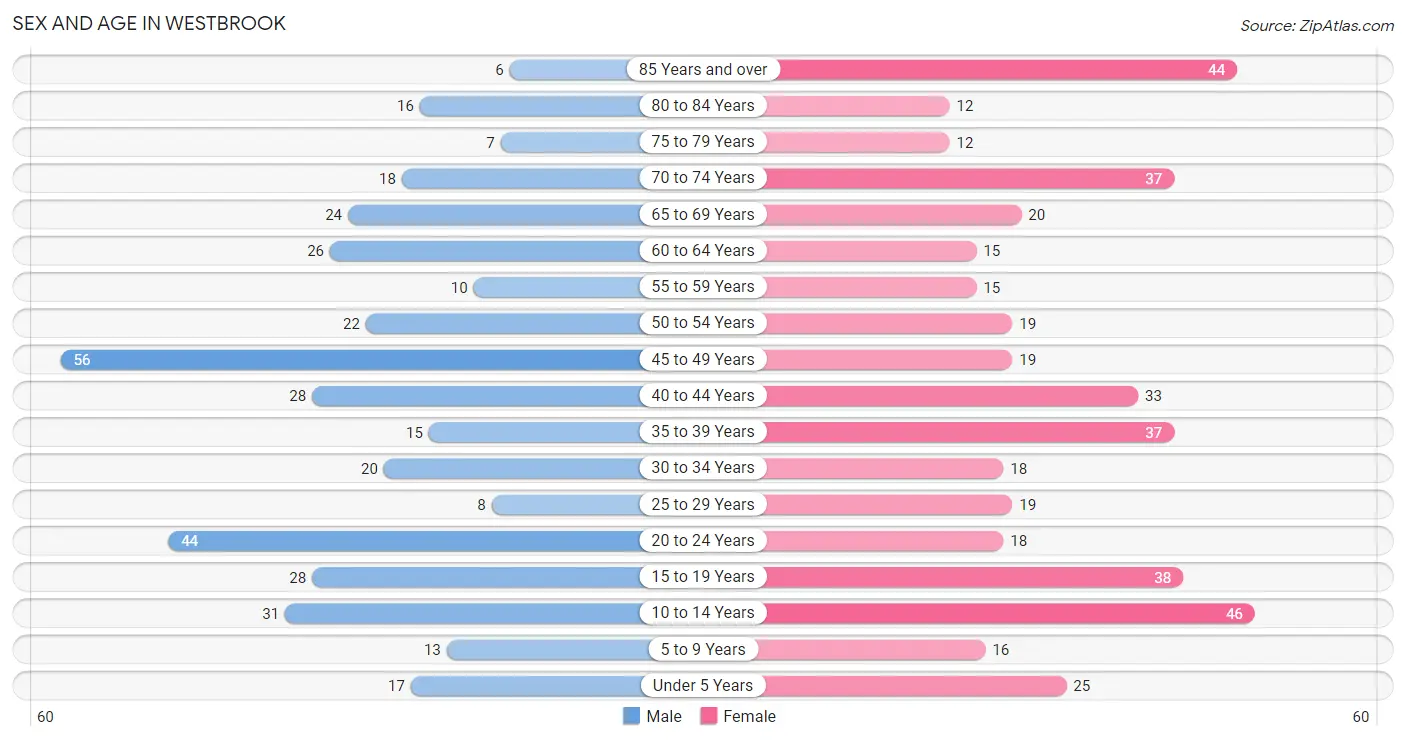
The most populous age groups in Westbrook are 45 to 49 Years (56 | 14.4%) for men and 10 to 14 Years (46 | 10.4%) for women.
| Age Bracket | Male | Female |
| Under 5 Years | 17 (4.4%) | 25 (5.6%) |
| 5 to 9 Years | 13 (3.3%) | 16 (3.6%) |
| 10 to 14 Years | 31 (8.0%) | 46 (10.4%) |
| 15 to 19 Years | 28 (7.2%) | 38 (8.6%) |
| 20 to 24 Years | 44 (11.3%) | 18 (4.1%) |
| 25 to 29 Years | 8 (2.1%) | 19 (4.3%) |
| 30 to 34 Years | 20 (5.1%) | 18 (4.1%) |
| 35 to 39 Years | 15 (3.9%) | 37 (8.4%) |
| 40 to 44 Years | 28 (7.2%) | 33 (7.4%) |
| 45 to 49 Years | 56 (14.4%) | 19 (4.3%) |
| 50 to 54 Years | 22 (5.7%) | 19 (4.3%) |
| 55 to 59 Years | 10 (2.6%) | 15 (3.4%) |
| 60 to 64 Years | 26 (6.7%) | 15 (3.4%) |
| 65 to 69 Years | 24 (6.2%) | 20 (4.5%) |
| 70 to 74 Years | 18 (4.6%) | 37 (8.4%) |
| 75 to 79 Years | 7 (1.8%) | 12 (2.7%) |
| 80 to 84 Years | 16 (4.1%) | 12 (2.7%) |
| 85 Years and over | 6 (1.5%) | 44 (9.9%) |
| Total | 389 (100.0%) | 443 (100.0%) |
Families and Households in Westbrook
Median Family Size in Westbrook
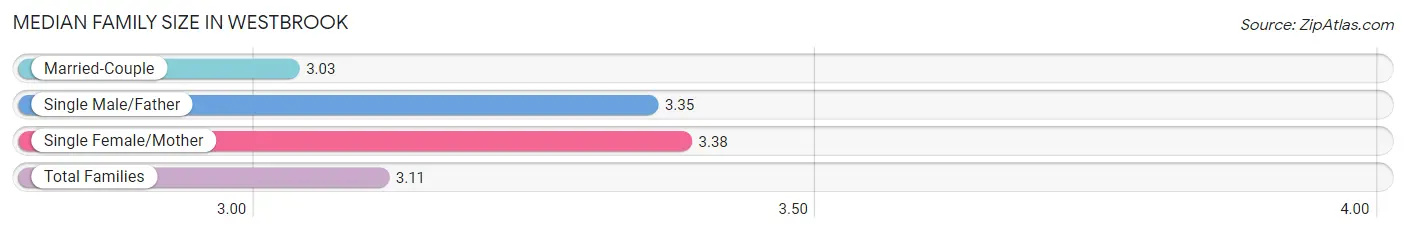
The median family size in Westbrook is 3.11 persons per family, with single female/mother families (24 | 13.2%) accounting for the largest median family size of 3.38 persons per family. On the other hand, married-couple families (138 | 75.8%) represent the smallest median family size with 3.03 persons per family.
| Family Type | # Families | Family Size |
| Married-Couple | 138 (75.8%) | 3.03 |
| Single Male/Father | 20 (11.0%) | 3.35 |
| Single Female/Mother | 24 (13.2%) | 3.38 |
| Total Families | 182 (100.0%) | 3.11 |
Median Household Size in Westbrook
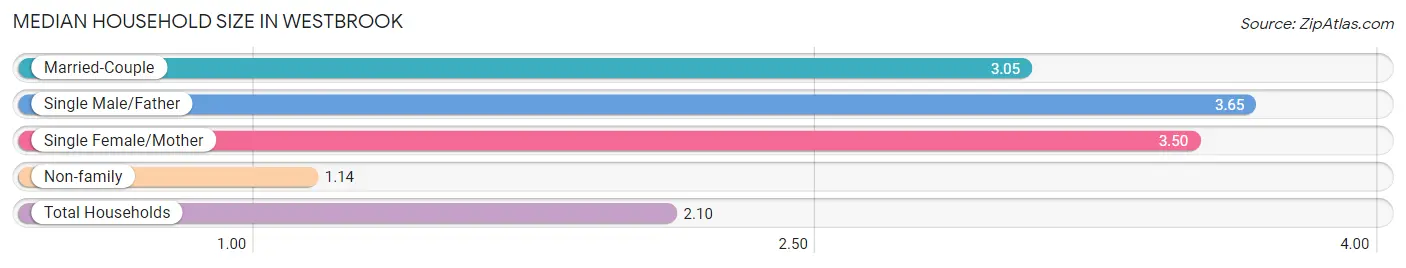
The median household size in Westbrook is 2.10 persons per household, with single male/father households (20 | 5.1%) accounting for the largest median household size of 3.65 persons per household. non-family households (206 | 53.1%) represent the smallest median household size with 1.14 persons per household.
| Household Type | # Households | Household Size |
| Married-Couple | 138 (35.6%) | 3.05 |
| Single Male/Father | 20 (5.1%) | 3.65 |
| Single Female/Mother | 24 (6.2%) | 3.50 |
| Non-family | 206 (53.1%) | 1.14 |
| Total Households | 388 (100.0%) | 2.10 |
Household Size by Marriage Status in Westbrook
Out of a total of 388 households in Westbrook, 182 (46.9%) are family households, while 206 (53.1%) are nonfamily households. The most numerous type of family households are 2-person households, comprising 87, and the most common type of nonfamily households are 1-person households, comprising 154.
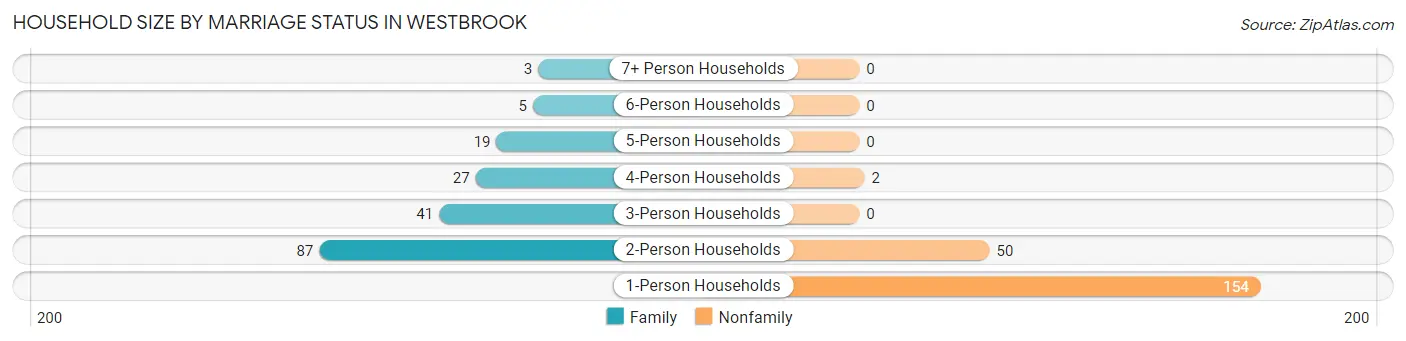
| Household Size | Family Households | Nonfamily Households |
| 1-Person Households | - | 154 (39.7%) |
| 2-Person Households | 87 (22.4%) | 50 (12.9%) |
| 3-Person Households | 41 (10.6%) | 0 (0.0%) |
| 4-Person Households | 27 (7.0%) | 2 (0.5%) |
| 5-Person Households | 19 (4.9%) | 0 (0.0%) |
| 6-Person Households | 5 (1.3%) | 0 (0.0%) |
| 7+ Person Households | 3 (0.8%) | 0 (0.0%) |
| Total | 182 (46.9%) | 206 (53.1%) |
Female Fertility in Westbrook
Fertility by Age in Westbrook
Average fertility rate in Westbrook is 43.0 births per 1,000 women. Women in the age bracket of 20 to 34 years have the highest fertility rate with 109.0 births per 1,000 women. Women in the age bracket of 20 to 34 years acount for 75.0% of all women with births.
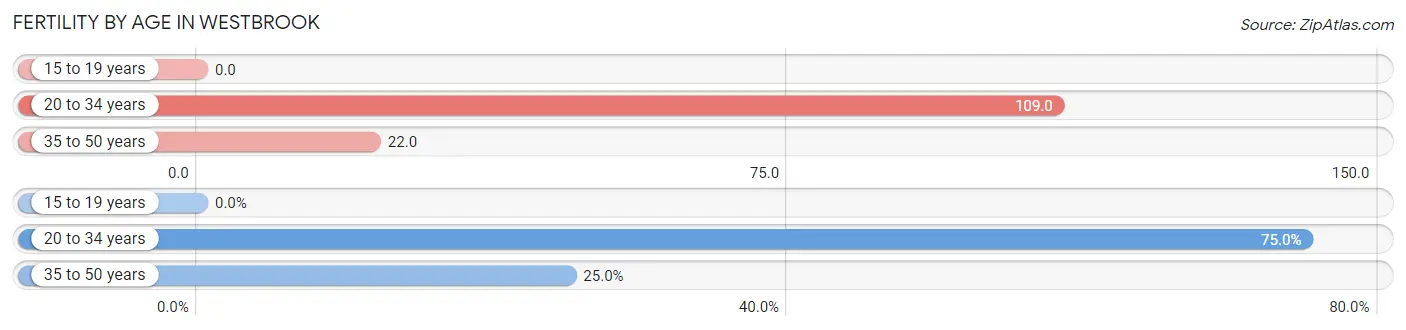
| Age Bracket | Women with Births | Births / 1,000 Women |
| 15 to 19 years | 0 (0.0%) | 0.0 |
| 20 to 34 years | 6 (75.0%) | 109.0 |
| 35 to 50 years | 2 (25.0%) | 22.0 |
| Total | 8 (100.0%) | 43.0 |
Fertility by Age by Marriage Status in Westbrook
37.5% of women with births (8) in Westbrook are married. The highest percentage of unmarried women with births falls into 35 to 50 years age bracket with 100.0% of them unmarried at the time of birth, while the lowest percentage of unmarried women with births belong to 20 to 34 years age bracket with 50.0% of them unmarried.
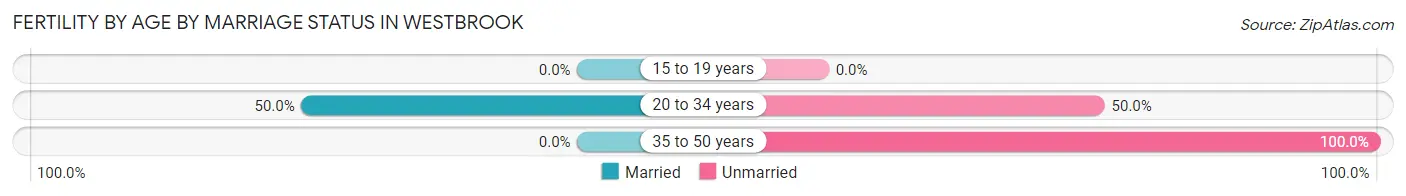
| Age Bracket | Married | Unmarried |
| 15 to 19 years | 0 (0.0%) | 0 (0.0%) |
| 20 to 34 years | 3 (50.0%) | 3 (50.0%) |
| 35 to 50 years | 0 (0.0%) | 2 (100.0%) |
| Total | 3 (37.5%) | 5 (62.5%) |
Fertility by Education in Westbrook
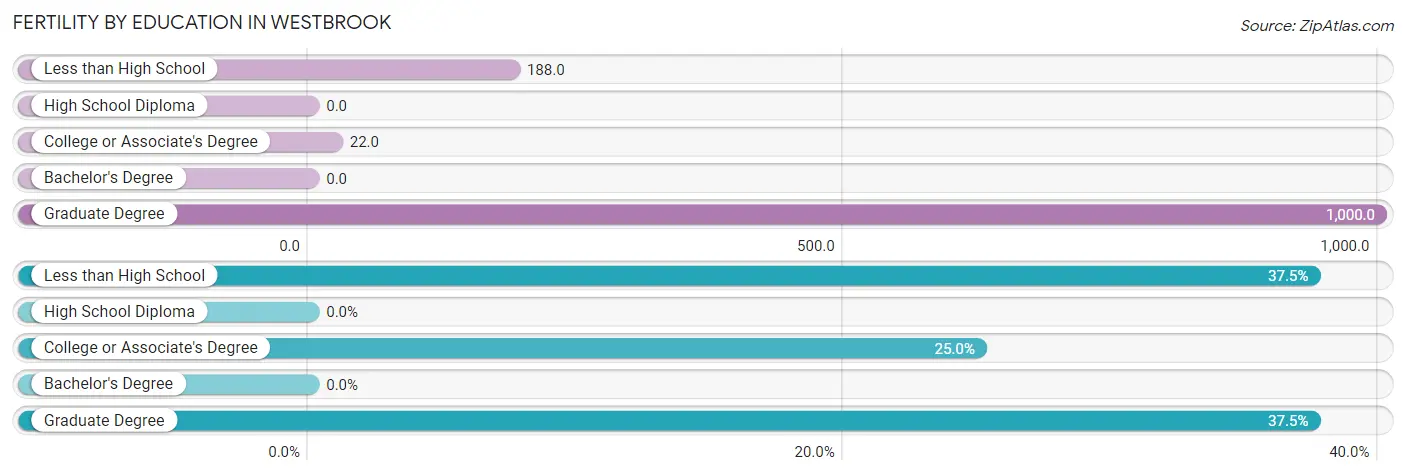
| Educational Attainment | Women with Births | Births / 1,000 Women |
| Less than High School | 3 (37.5%) | 188.0 |
| High School Diploma | 0 (0.0%) | 0.0 |
| College or Associate's Degree | 2 (25.0%) | 22.0 |
| Bachelor's Degree | 0 (0.0%) | 0.0 |
| Graduate Degree | 3 (37.5%) | 1,000.0 |
| Total | 8 (100.0%) | 43.0 |
Fertility by Education by Marriage Status in Westbrook
62.5% of women with births in Westbrook are unmarried. Women with the educational attainment of graduate degree are most likely to be married with 100.0% of them married at childbirth, while women with the educational attainment of less than high school are least likely to be married with 100.0% of them unmarried at childbirth.
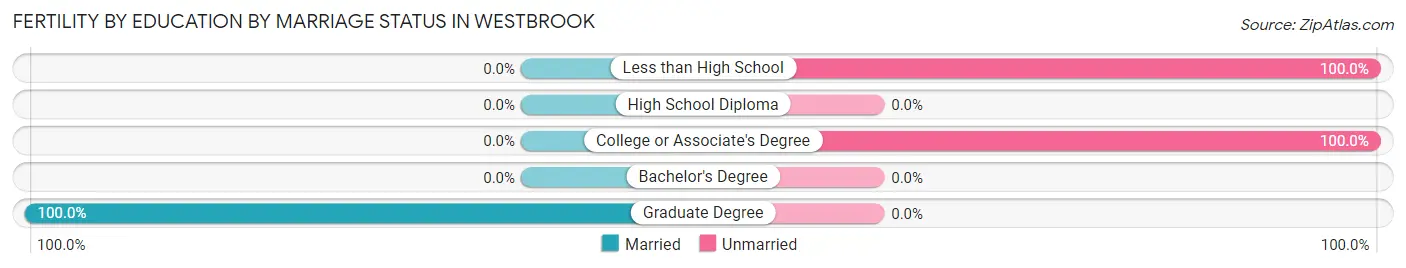
| Educational Attainment | Married | Unmarried |
| Less than High School | 0 (0.0%) | 3 (100.0%) |
| High School Diploma | 0 (0.0%) | 0 (0.0%) |
| College or Associate's Degree | 0 (0.0%) | 2 (100.0%) |
| Bachelor's Degree | 0 (0.0%) | 0 (0.0%) |
| Graduate Degree | 3 (100.0%) | 0 (0.0%) |
| Total | 3 (37.5%) | 5 (62.5%) |
Employment Characteristics in Westbrook
Employment by Class of Employer in Westbrook
Among the 388 employed individuals in Westbrook, private company employees (264 | 68.0%), self-employed (not incorporated) (52 | 13.4%), and not-for-profit organizations (34 | 8.8%) make up the most common classes of employment.
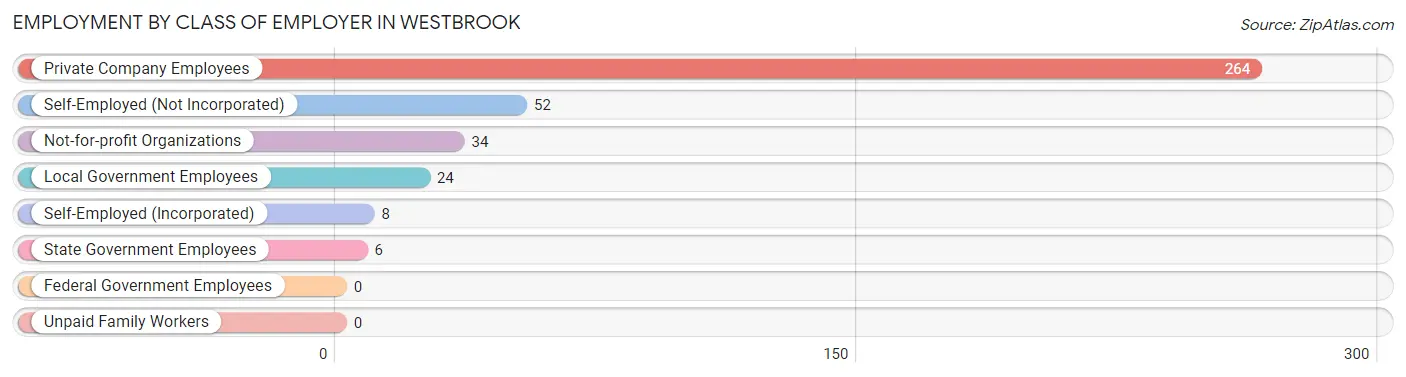
| Employer Class | # Employees | % Employees |
| Private Company Employees | 264 | 68.0% |
| Self-Employed (Incorporated) | 8 | 2.1% |
| Self-Employed (Not Incorporated) | 52 | 13.4% |
| Not-for-profit Organizations | 34 | 8.8% |
| Local Government Employees | 24 | 6.2% |
| State Government Employees | 6 | 1.5% |
| Federal Government Employees | 0 | 0.0% |
| Unpaid Family Workers | 0 | 0.0% |
| Total | 388 | 100.0% |
Employment Status by Age in Westbrook
According to the labor force statistics for Westbrook, out of the total population over 16 years of age (664), 59.6% or 396 individuals are in the labor force, with 1.0% or 4 of them unemployed. The age group with the highest labor force participation rate is 25 to 29 years, with 88.9% or 24 individuals in the labor force. Within the labor force, the 35 to 44 years age range has the highest percentage of unemployed individuals, with 5.8% or 4 of them being unemployed.
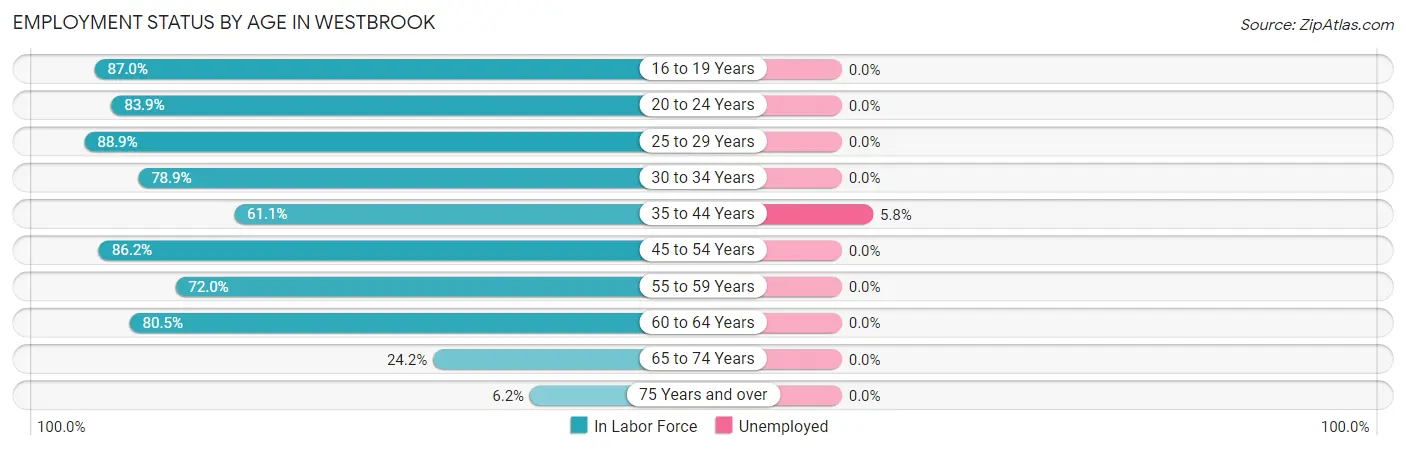
| Age Bracket | In Labor Force | Unemployed |
| 16 to 19 Years | 40 (87.0%) | 0 (0.0%) |
| 20 to 24 Years | 52 (83.9%) | 0 (0.0%) |
| 25 to 29 Years | 24 (88.9%) | 0 (0.0%) |
| 30 to 34 Years | 30 (78.9%) | 0 (0.0%) |
| 35 to 44 Years | 69 (61.1%) | 4 (5.8%) |
| 45 to 54 Years | 100 (86.2%) | 0 (0.0%) |
| 55 to 59 Years | 18 (72.0%) | 0 (0.0%) |
| 60 to 64 Years | 33 (80.5%) | 0 (0.0%) |
| 65 to 74 Years | 24 (24.2%) | 0 (0.0%) |
| 75 Years and over | 6 (6.2%) | 0 (0.0%) |
| Total | 396 (59.6%) | 4 (1.0%) |
Employment Status by Educational Attainment in Westbrook
According to labor force statistics for Westbrook, 76.1% of individuals (274) out of the total population between 25 and 64 years of age (360) are in the labor force, with 1.5% or 4 of them being unemployed. The group with the highest labor force participation rate are those with the educational attainment of less than high school, with 94.4% or 17 individuals in the labor force. Within the labor force, individuals with college / associate degree education have the highest percentage of unemployment, with 2.2% or 2 of them being unemployed.
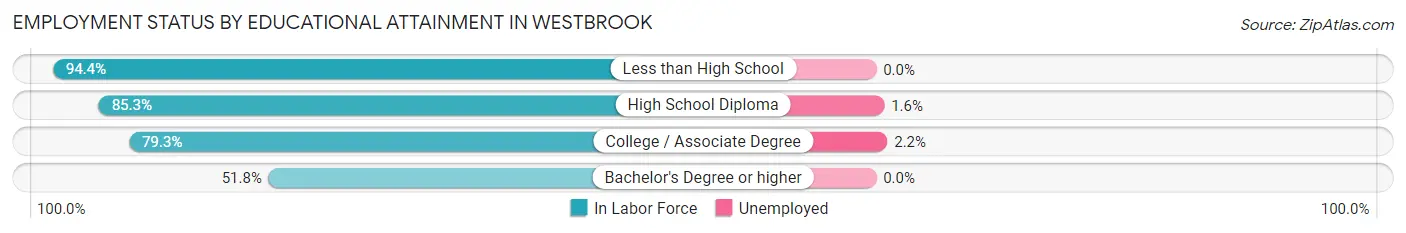
| Educational Attainment | In Labor Force | Unemployed |
| Less than High School | 17 (94.4%) | 0 (0.0%) |
| High School Diploma | 122 (85.3%) | 2 (1.6%) |
| College / Associate Degree | 92 (79.3%) | 3 (2.2%) |
| Bachelor's Degree or higher | 43 (51.8%) | 0 (0.0%) |
| Total | 274 (76.1%) | 5 (1.5%) |
Employment Occupations by Sex in Westbrook
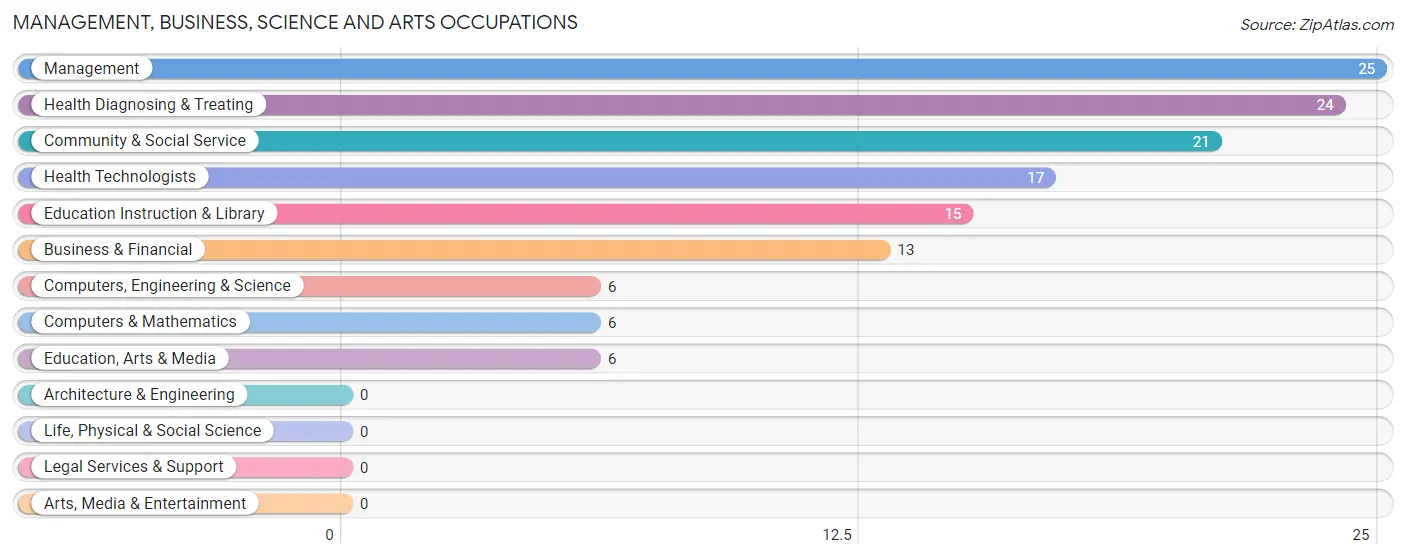
Management, Business, Science and Arts Occupations
The most common Management, Business, Science and Arts occupations in Westbrook are Management (25 | 6.4%), Health Diagnosing & Treating (24 | 6.1%), Community & Social Service (21 | 5.4%), Health Technologists (17 | 4.3%), and Education Instruction & Library (15 | 3.8%).
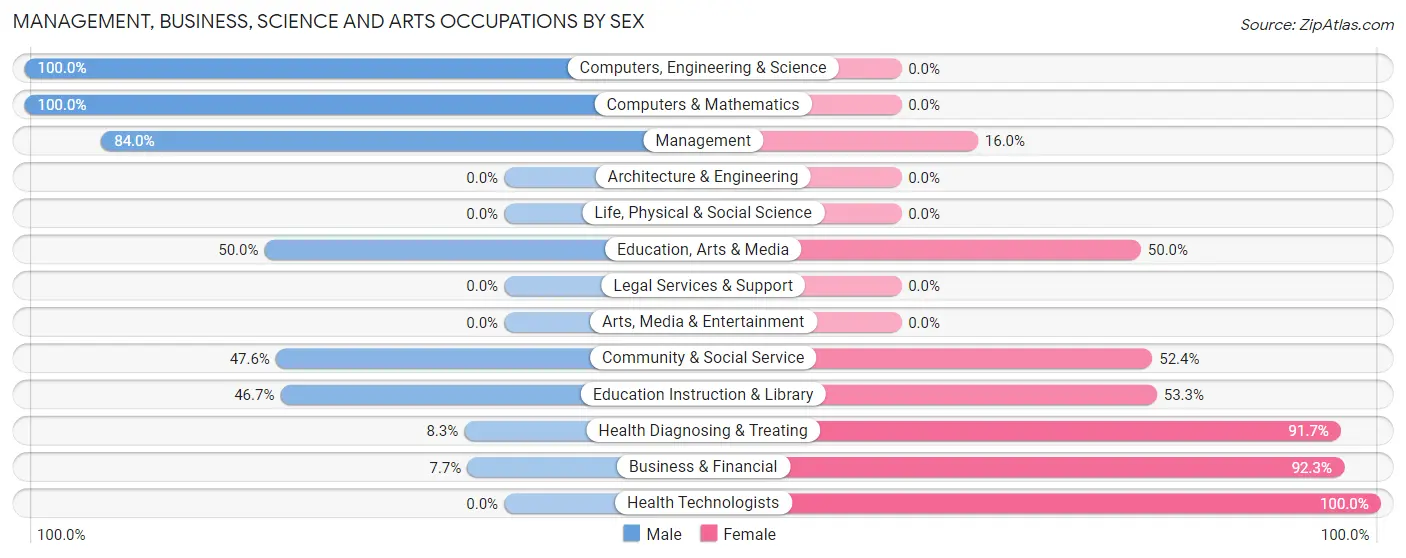
Management, Business, Science and Arts Occupations by Sex
Within the Management, Business, Science and Arts occupations in Westbrook, the most male-oriented occupations are Computers, Engineering & Science (100.0%), Computers & Mathematics (100.0%), and Management (84.0%), while the most female-oriented occupations are Health Technologists (100.0%), Business & Financial (92.3%), and Health Diagnosing & Treating (91.7%).
| Occupation | Male | Female |
| Management | 21 (84.0%) | 4 (16.0%) |
| Business & Financial | 1 (7.7%) | 12 (92.3%) |
| Computers, Engineering & Science | 6 (100.0%) | 0 (0.0%) |
| Computers & Mathematics | 6 (100.0%) | 0 (0.0%) |
| Architecture & Engineering | 0 (0.0%) | 0 (0.0%) |
| Life, Physical & Social Science | 0 (0.0%) | 0 (0.0%) |
| Community & Social Service | 10 (47.6%) | 11 (52.4%) |
| Education, Arts & Media | 3 (50.0%) | 3 (50.0%) |
| Legal Services & Support | 0 (0.0%) | 0 (0.0%) |
| Education Instruction & Library | 7 (46.7%) | 8 (53.3%) |
| Arts, Media & Entertainment | 0 (0.0%) | 0 (0.0%) |
| Health Diagnosing & Treating | 2 (8.3%) | 22 (91.7%) |
| Health Technologists | 0 (0.0%) | 17 (100.0%) |
| Total (Category) | 40 (44.9%) | 49 (55.1%) |
| Total (Overall) | 240 (61.2%) | 152 (38.8%) |
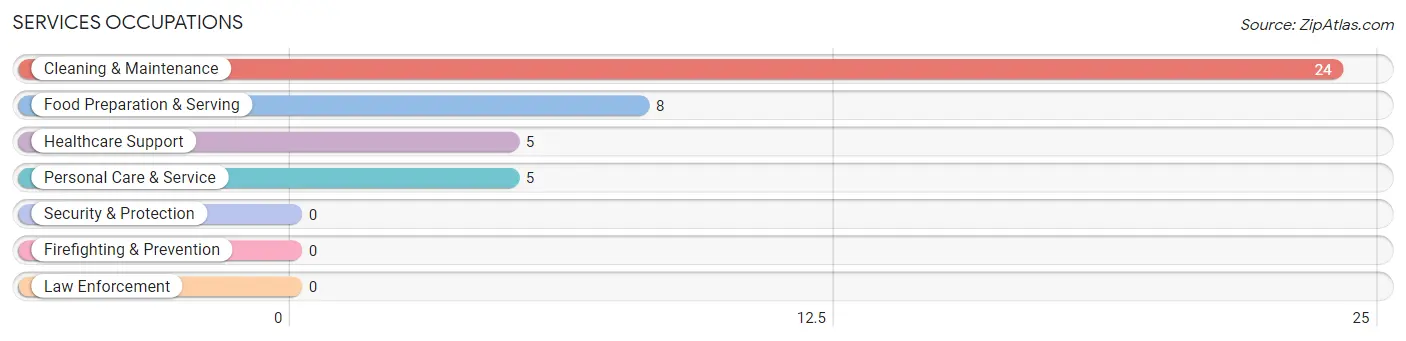
Services Occupations
The most common Services occupations in Westbrook are Cleaning & Maintenance (24 | 6.1%), Food Preparation & Serving (8 | 2.0%), Healthcare Support (5 | 1.3%), and Personal Care & Service (5 | 1.3%).
Services Occupations by Sex
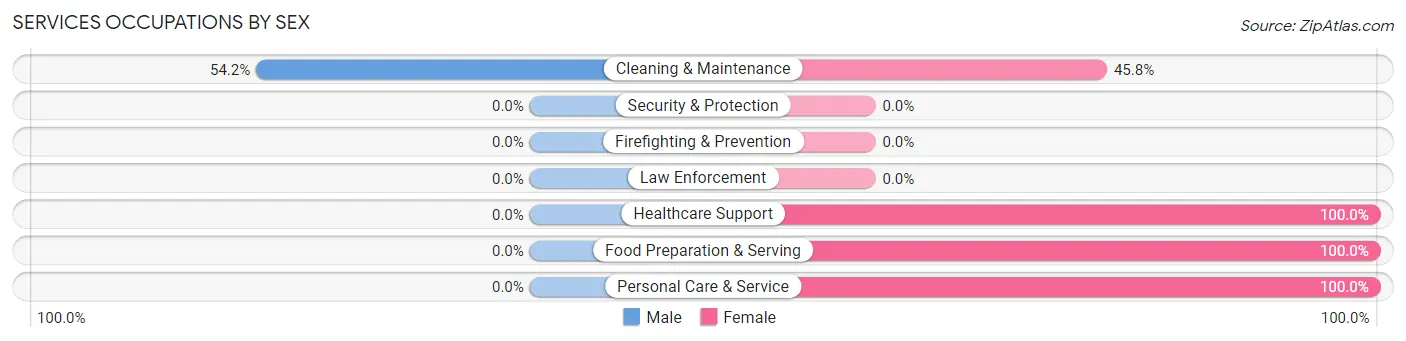
| Occupation | Male | Female |
| Healthcare Support | 0 (0.0%) | 5 (100.0%) |
| Security & Protection | 0 (0.0%) | 0 (0.0%) |
| Firefighting & Prevention | 0 (0.0%) | 0 (0.0%) |
| Law Enforcement | 0 (0.0%) | 0 (0.0%) |
| Food Preparation & Serving | 0 (0.0%) | 8 (100.0%) |
| Cleaning & Maintenance | 13 (54.2%) | 11 (45.8%) |
| Personal Care & Service | 0 (0.0%) | 5 (100.0%) |
| Total (Category) | 13 (30.9%) | 29 (69.1%) |
| Total (Overall) | 240 (61.2%) | 152 (38.8%) |
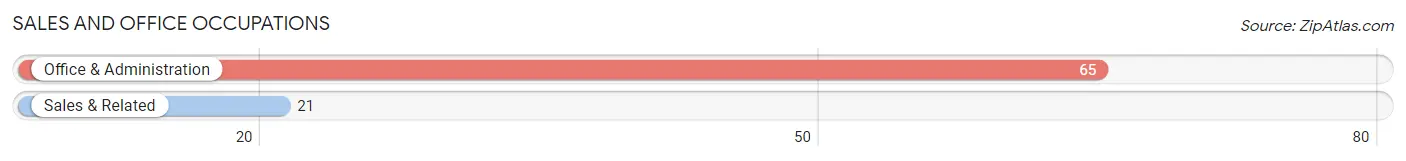
Sales and Office Occupations
The most common Sales and Office occupations in Westbrook are Office & Administration (65 | 16.6%), and Sales & Related (21 | 5.4%).
Sales and Office Occupations by Sex

| Occupation | Male | Female |
| Sales & Related | 16 (76.2%) | 5 (23.8%) |
| Office & Administration | 11 (16.9%) | 54 (83.1%) |
| Total (Category) | 27 (31.4%) | 59 (68.6%) |
| Total (Overall) | 240 (61.2%) | 152 (38.8%) |
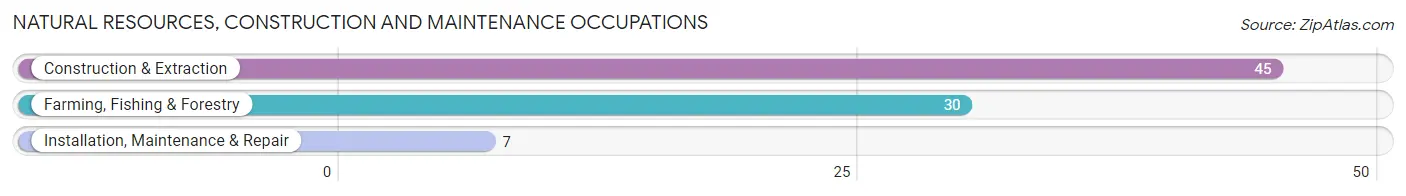
Natural Resources, Construction and Maintenance Occupations
The most common Natural Resources, Construction and Maintenance occupations in Westbrook are Construction & Extraction (45 | 11.5%), Farming, Fishing & Forestry (30 | 7.6%), and Installation, Maintenance & Repair (7 | 1.8%).
Natural Resources, Construction and Maintenance Occupations by Sex
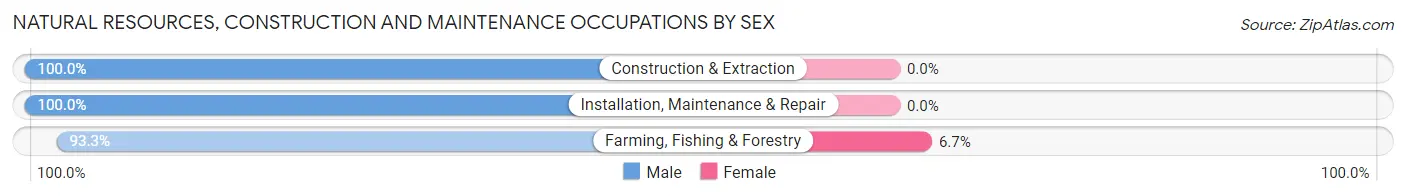
| Occupation | Male | Female |
| Farming, Fishing & Forestry | 28 (93.3%) | 2 (6.7%) |
| Construction & Extraction | 45 (100.0%) | 0 (0.0%) |
| Installation, Maintenance & Repair | 7 (100.0%) | 0 (0.0%) |
| Total (Category) | 80 (97.6%) | 2 (2.4%) |
| Total (Overall) | 240 (61.2%) | 152 (38.8%) |
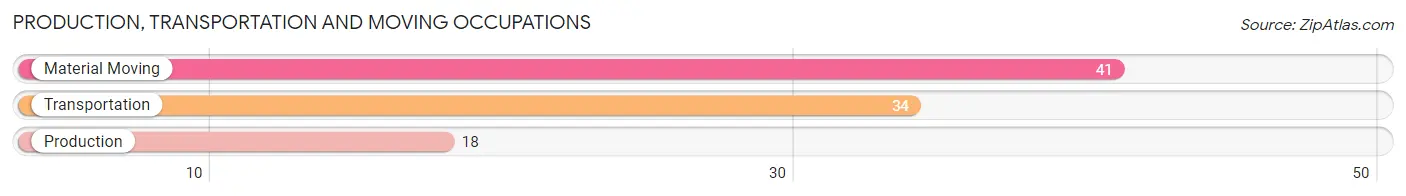
Production, Transportation and Moving Occupations
The most common Production, Transportation and Moving occupations in Westbrook are Material Moving (41 | 10.5%), Transportation (34 | 8.7%), and Production (18 | 4.6%).
Production, Transportation and Moving Occupations by Sex
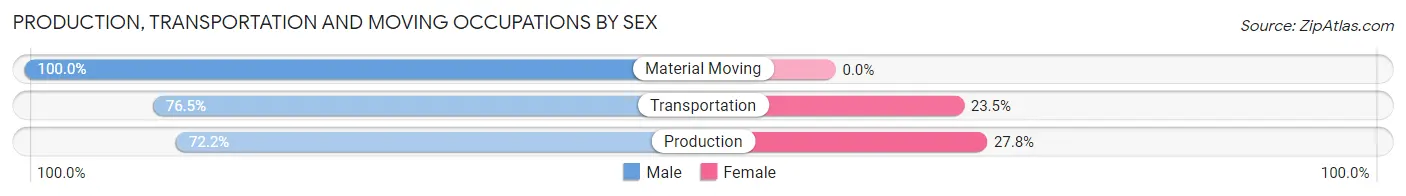
| Occupation | Male | Female |
| Production | 13 (72.2%) | 5 (27.8%) |
| Transportation | 26 (76.5%) | 8 (23.5%) |
| Material Moving | 41 (100.0%) | 0 (0.0%) |
| Total (Category) | 80 (86.0%) | 13 (14.0%) |
| Total (Overall) | 240 (61.2%) | 152 (38.8%) |
Employment Industries by Sex in Westbrook
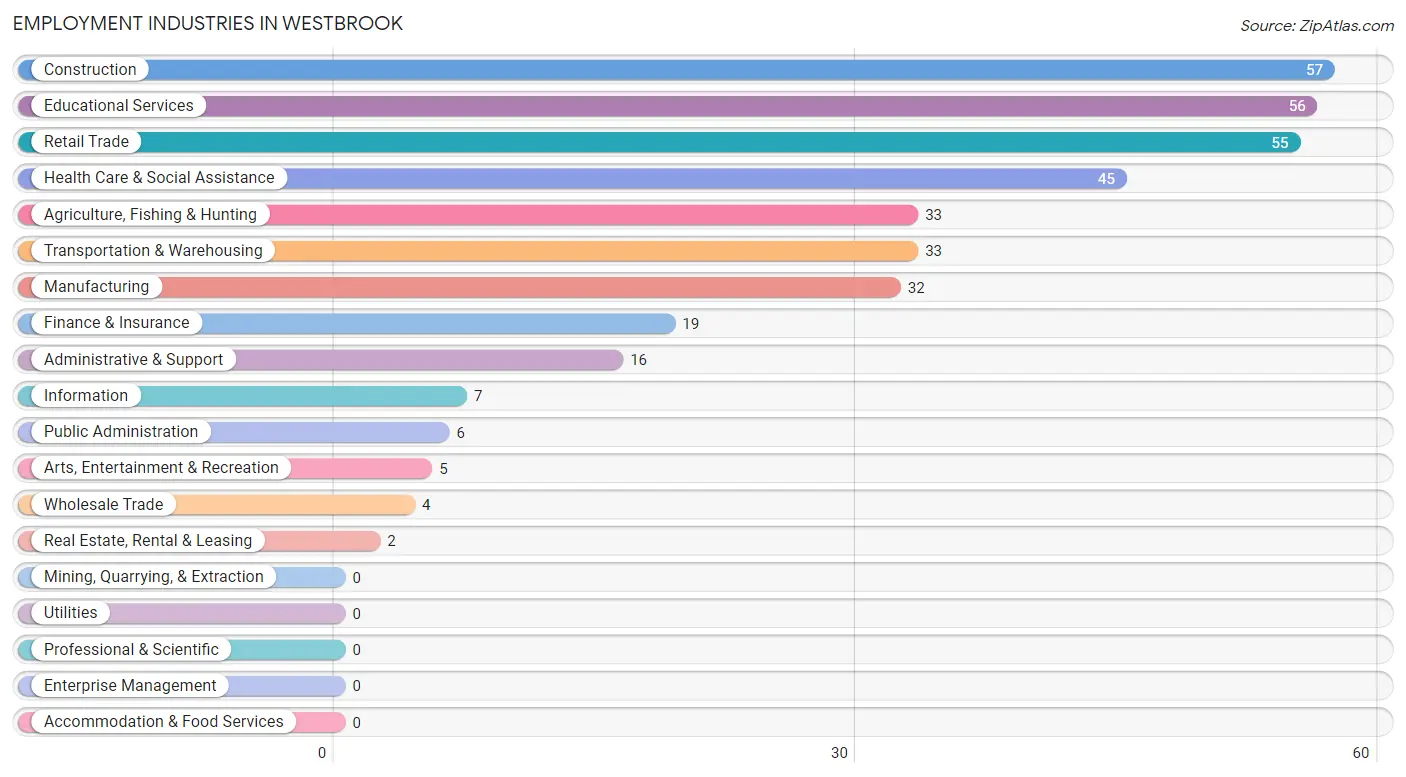
Employment Industries in Westbrook
The major employment industries in Westbrook include Construction (57 | 14.5%), Educational Services (56 | 14.3%), Retail Trade (55 | 14.0%), Health Care & Social Assistance (45 | 11.5%), and Agriculture, Fishing & Hunting (33 | 8.4%).
Employment Industries by Sex in Westbrook
The Westbrook industries that see more men than women are Wholesale Trade (100.0%), Real Estate, Rental & Leasing (100.0%), and Arts, Entertainment & Recreation (100.0%), whereas the industries that tend to have a higher number of women are Public Administration (100.0%), Health Care & Social Assistance (95.6%), and Finance & Insurance (84.2%).
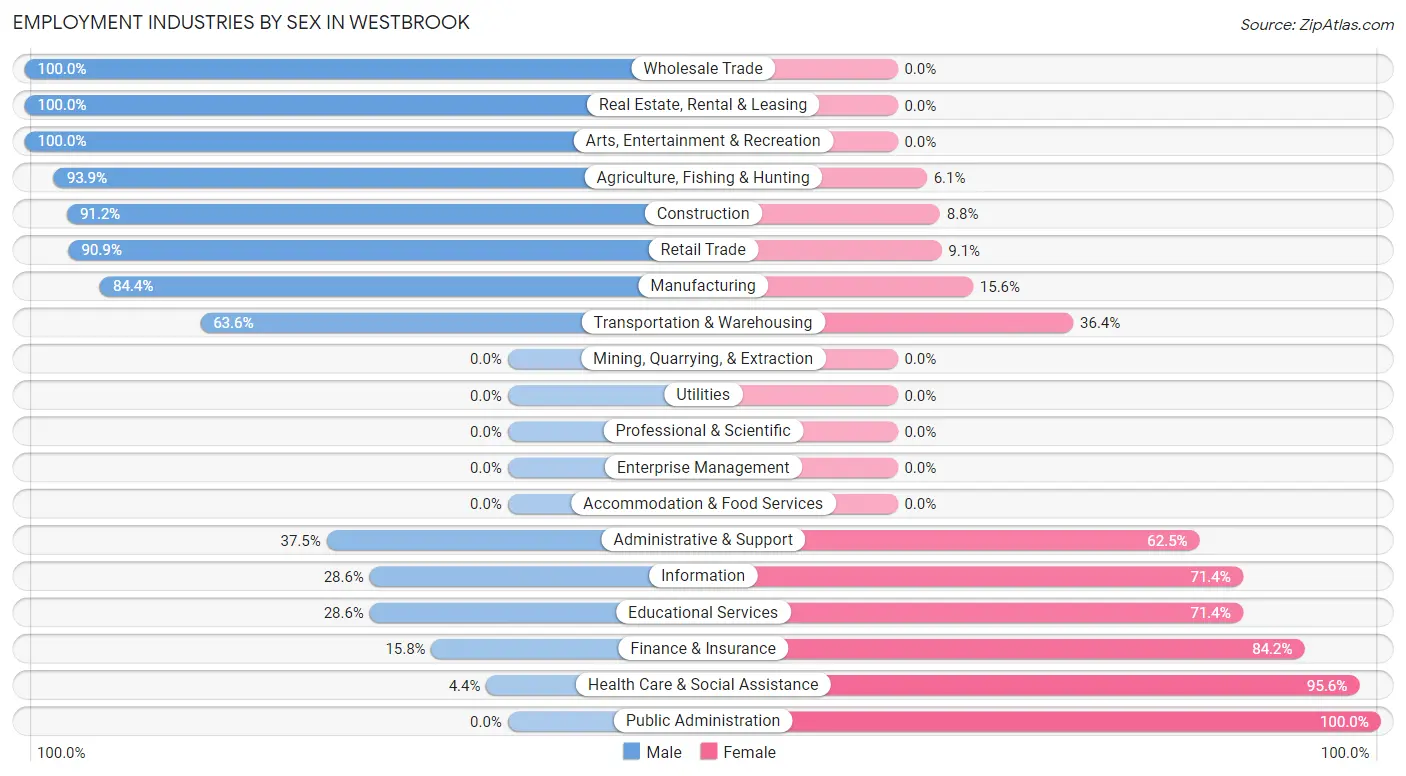
| Industry | Male | Female |
| Agriculture, Fishing & Hunting | 31 (93.9%) | 2 (6.1%) |
| Mining, Quarrying, & Extraction | 0 (0.0%) | 0 (0.0%) |
| Construction | 52 (91.2%) | 5 (8.8%) |
| Manufacturing | 27 (84.4%) | 5 (15.6%) |
| Wholesale Trade | 4 (100.0%) | 0 (0.0%) |
| Retail Trade | 50 (90.9%) | 5 (9.1%) |
| Transportation & Warehousing | 21 (63.6%) | 12 (36.4%) |
| Utilities | 0 (0.0%) | 0 (0.0%) |
| Information | 2 (28.6%) | 5 (71.4%) |
| Finance & Insurance | 3 (15.8%) | 16 (84.2%) |
| Real Estate, Rental & Leasing | 2 (100.0%) | 0 (0.0%) |
| Professional & Scientific | 0 (0.0%) | 0 (0.0%) |
| Enterprise Management | 0 (0.0%) | 0 (0.0%) |
| Administrative & Support | 6 (37.5%) | 10 (62.5%) |
| Educational Services | 16 (28.6%) | 40 (71.4%) |
| Health Care & Social Assistance | 2 (4.4%) | 43 (95.6%) |
| Arts, Entertainment & Recreation | 5 (100.0%) | 0 (0.0%) |
| Accommodation & Food Services | 0 (0.0%) | 0 (0.0%) |
| Public Administration | 0 (0.0%) | 6 (100.0%) |
| Total | 240 (61.2%) | 152 (38.8%) |
Education in Westbrook
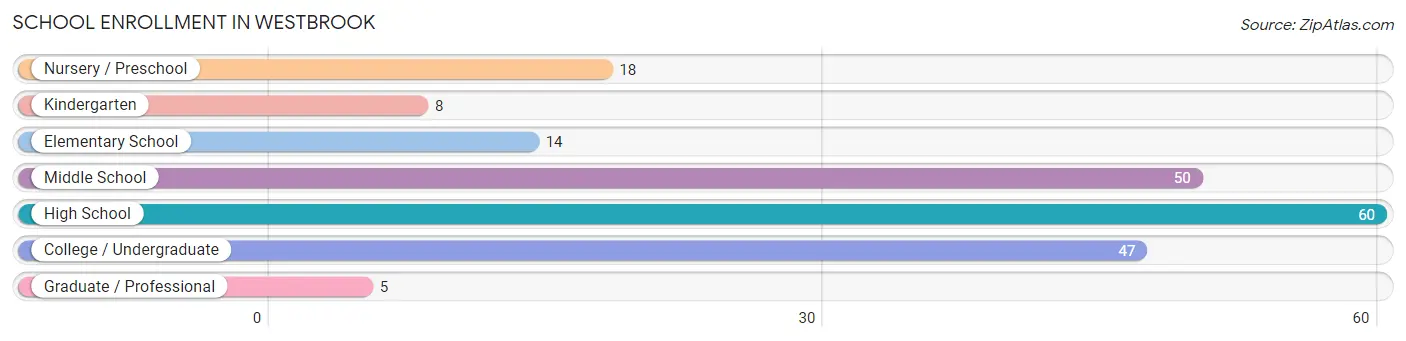
School Enrollment in Westbrook
The most common levels of schooling among the 202 students in Westbrook are high school (60 | 29.7%), middle school (50 | 24.7%), and college / undergraduate (47 | 23.3%).
| School Level | # Students | % Students |
| Nursery / Preschool | 18 | 8.9% |
| Kindergarten | 8 | 4.0% |
| Elementary School | 14 | 6.9% |
| Middle School | 50 | 24.7% |
| High School | 60 | 29.7% |
| College / Undergraduate | 47 | 23.3% |
| Graduate / Professional | 5 | 2.5% |
| Total | 202 | 100.0% |
School Enrollment by Age by Funding Source in Westbrook
Out of a total of 202 students who are enrolled in schools in Westbrook, 2 (1.0%) attend a private institution, while the remaining 200 (99.0%) are enrolled in public schools. The age group of 5 to 9 year old has the highest likelihood of being enrolled in private schools, with 2 (6.9% in the age bracket) enrolled. Conversely, the age group of 3 to 4 year olds has the lowest likelihood of being enrolled in a private school, with 10 (100.0% in the age bracket) attending a public institution.
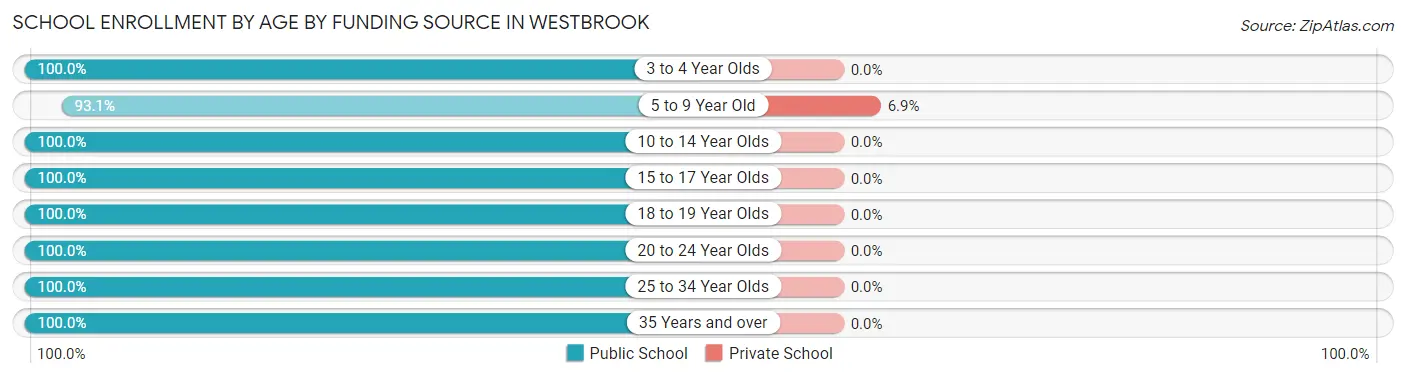
| Age Bracket | Public School | Private School |
| 3 to 4 Year Olds | 10 (100.0%) | 0 (0.0%) |
| 5 to 9 Year Old | 27 (93.1%) | 2 (6.9%) |
| 10 to 14 Year Olds | 77 (100.0%) | 0 (0.0%) |
| 15 to 17 Year Olds | 26 (100.0%) | 0 (0.0%) |
| 18 to 19 Year Olds | 39 (100.0%) | 0 (0.0%) |
| 20 to 24 Year Olds | 10 (100.0%) | 0 (0.0%) |
| 25 to 34 Year Olds | 2 (100.0%) | 0 (0.0%) |
| 35 Years and over | 9 (100.0%) | 0 (0.0%) |
| Total | 200 (99.0%) | 2 (1.0%) |
Educational Attainment by Field of Study in Westbrook
Bio, nature & agricultural (38 | 27.9%), education (37 | 27.2%), science & technology (22 | 16.2%), social sciences (13 | 9.6%), and liberal arts & history (10 | 7.3%) are the most common fields of study among 136 individuals in Westbrook who have obtained a bachelor's degree or higher.
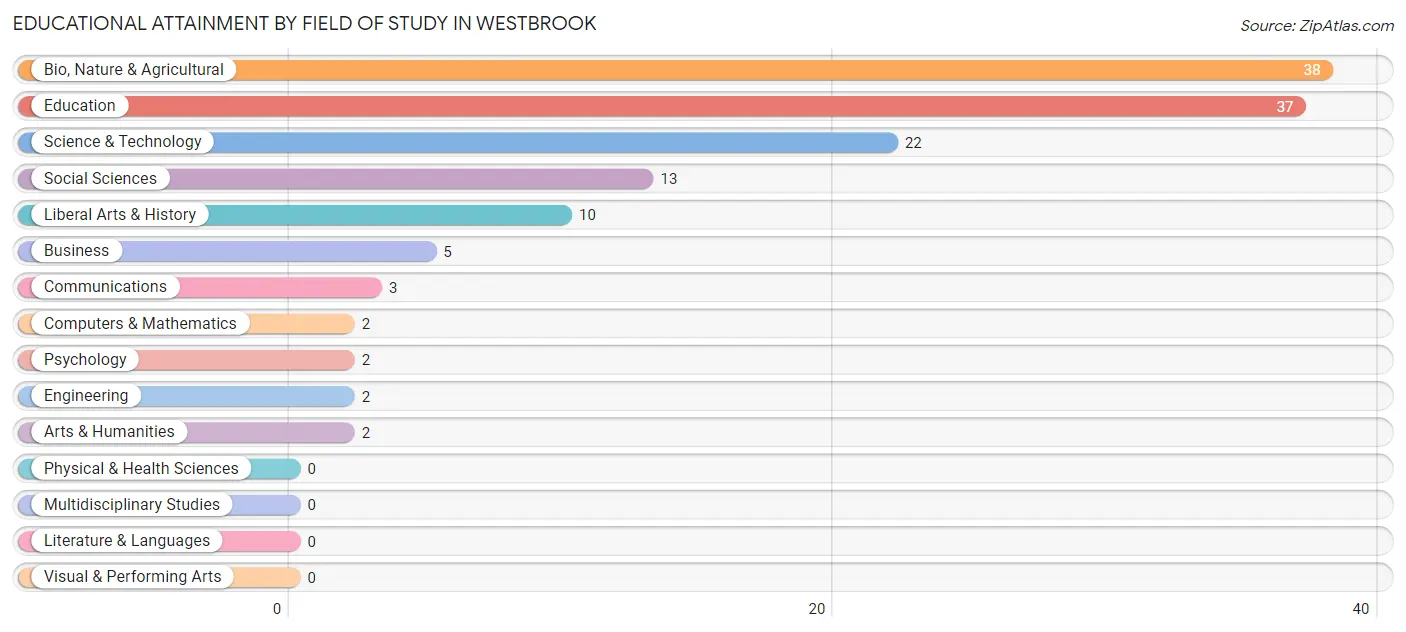
| Field of Study | # Graduates | % Graduates |
| Computers & Mathematics | 2 | 1.5% |
| Bio, Nature & Agricultural | 38 | 27.9% |
| Physical & Health Sciences | 0 | 0.0% |
| Psychology | 2 | 1.5% |
| Social Sciences | 13 | 9.6% |
| Engineering | 2 | 1.5% |
| Multidisciplinary Studies | 0 | 0.0% |
| Science & Technology | 22 | 16.2% |
| Business | 5 | 3.7% |
| Education | 37 | 27.2% |
| Literature & Languages | 0 | 0.0% |
| Liberal Arts & History | 10 | 7.3% |
| Visual & Performing Arts | 0 | 0.0% |
| Communications | 3 | 2.2% |
| Arts & Humanities | 2 | 1.5% |
| Total | 136 | 100.0% |
Transportation & Commute in Westbrook
Vehicle Availability by Sex in Westbrook
The most prevalent vehicle ownership categories in Westbrook are males with 2 vehicles (113, accounting for 47.3%) and females with 2 vehicles (67, making up 75.8%).
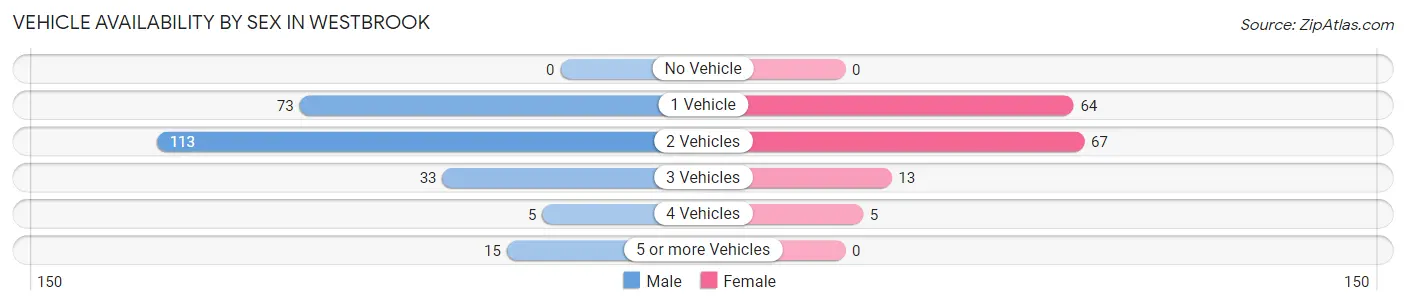
| Vehicles Available | Male | Female |
| No Vehicle | 0 (0.0%) | 0 (0.0%) |
| 1 Vehicle | 73 (30.5%) | 64 (42.9%) |
| 2 Vehicles | 113 (47.3%) | 67 (45.0%) |
| 3 Vehicles | 33 (13.8%) | 13 (8.7%) |
| 4 Vehicles | 5 (2.1%) | 5 (3.4%) |
| 5 or more Vehicles | 15 (6.3%) | 0 (0.0%) |
| Total | 239 (100.0%) | 149 (100.0%) |
Commute Time in Westbrook
The most frequently occuring commute durations in Westbrook are less than 5 minutes (115 commuters, 31.0%), 30 to 34 minutes (70 commuters, 18.9%), and 15 to 19 minutes (50 commuters, 13.5%).
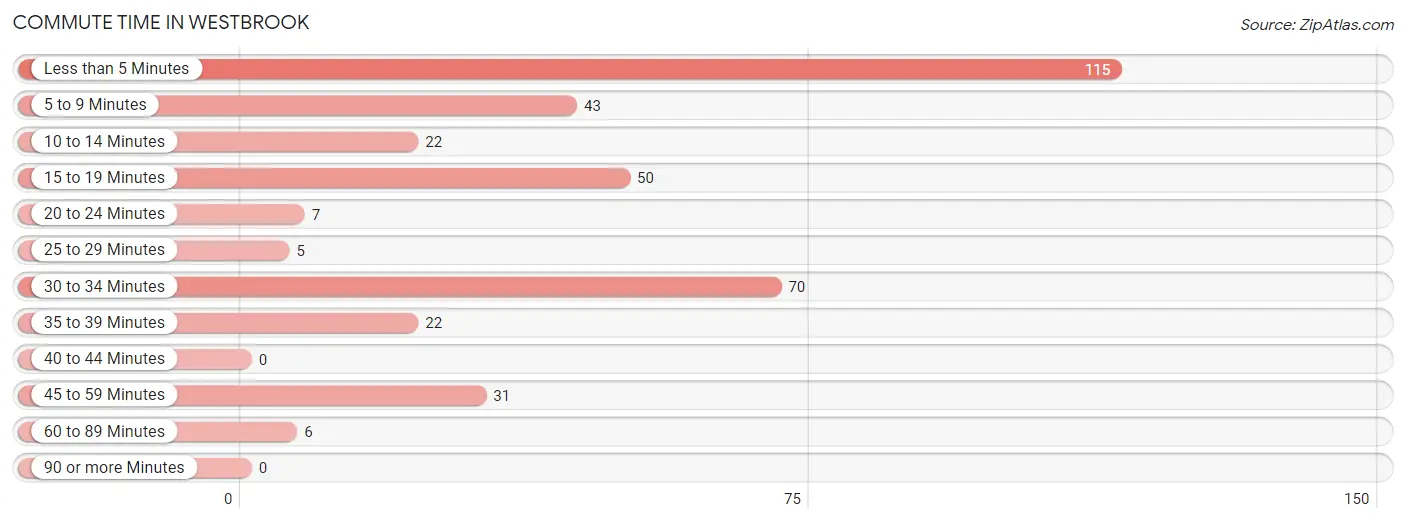
| Commute Time | # Commuters | % Commuters |
| Less than 5 Minutes | 115 | 31.0% |
| 5 to 9 Minutes | 43 | 11.6% |
| 10 to 14 Minutes | 22 | 5.9% |
| 15 to 19 Minutes | 50 | 13.5% |
| 20 to 24 Minutes | 7 | 1.9% |
| 25 to 29 Minutes | 5 | 1.3% |
| 30 to 34 Minutes | 70 | 18.9% |
| 35 to 39 Minutes | 22 | 5.9% |
| 40 to 44 Minutes | 0 | 0.0% |
| 45 to 59 Minutes | 31 | 8.4% |
| 60 to 89 Minutes | 6 | 1.6% |
| 90 or more Minutes | 0 | 0.0% |
Commute Time by Sex in Westbrook
The most common commute times in Westbrook are 30 to 34 minutes (63 commuters, 26.5%) for males and less than 5 minutes (57 commuters, 42.9%) for females.
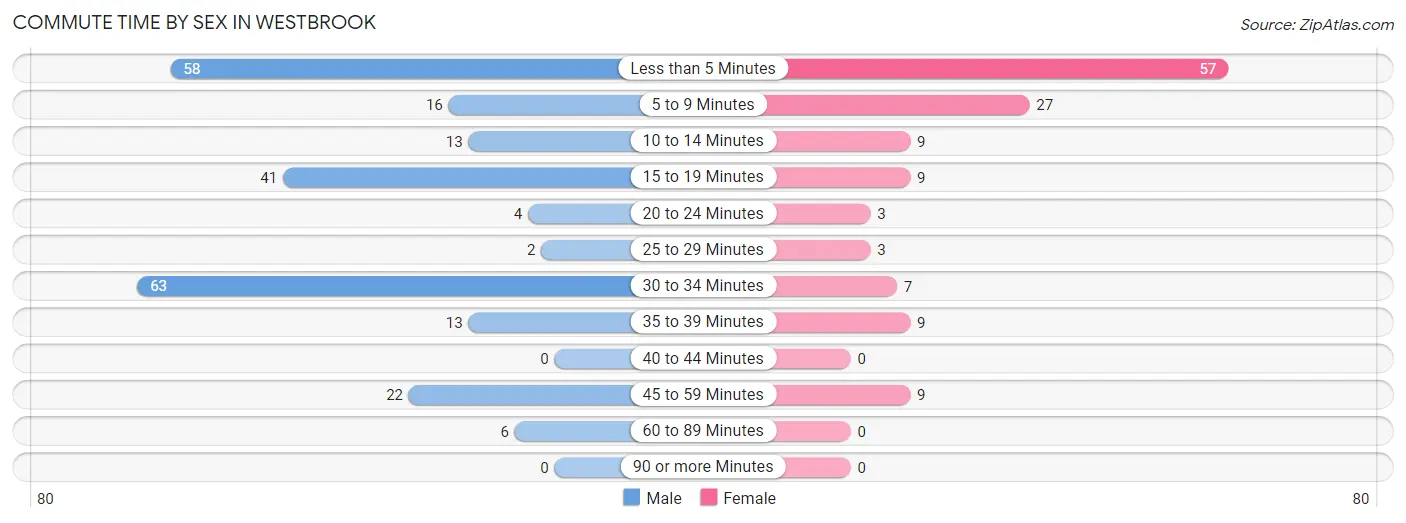
| Commute Time | Male | Female |
| Less than 5 Minutes | 58 (24.4%) | 57 (42.9%) |
| 5 to 9 Minutes | 16 (6.7%) | 27 (20.3%) |
| 10 to 14 Minutes | 13 (5.5%) | 9 (6.8%) |
| 15 to 19 Minutes | 41 (17.2%) | 9 (6.8%) |
| 20 to 24 Minutes | 4 (1.7%) | 3 (2.3%) |
| 25 to 29 Minutes | 2 (0.8%) | 3 (2.3%) |
| 30 to 34 Minutes | 63 (26.5%) | 7 (5.3%) |
| 35 to 39 Minutes | 13 (5.5%) | 9 (6.8%) |
| 40 to 44 Minutes | 0 (0.0%) | 0 (0.0%) |
| 45 to 59 Minutes | 22 (9.2%) | 9 (6.8%) |
| 60 to 89 Minutes | 6 (2.5%) | 0 (0.0%) |
| 90 or more Minutes | 0 (0.0%) | 0 (0.0%) |
Time of Departure to Work by Sex in Westbrook
The most frequent times of departure to work in Westbrook are 6:30 AM to 6:59 AM (38, 16.0%) for males and 5:30 AM to 5:59 AM (33, 24.8%) for females.
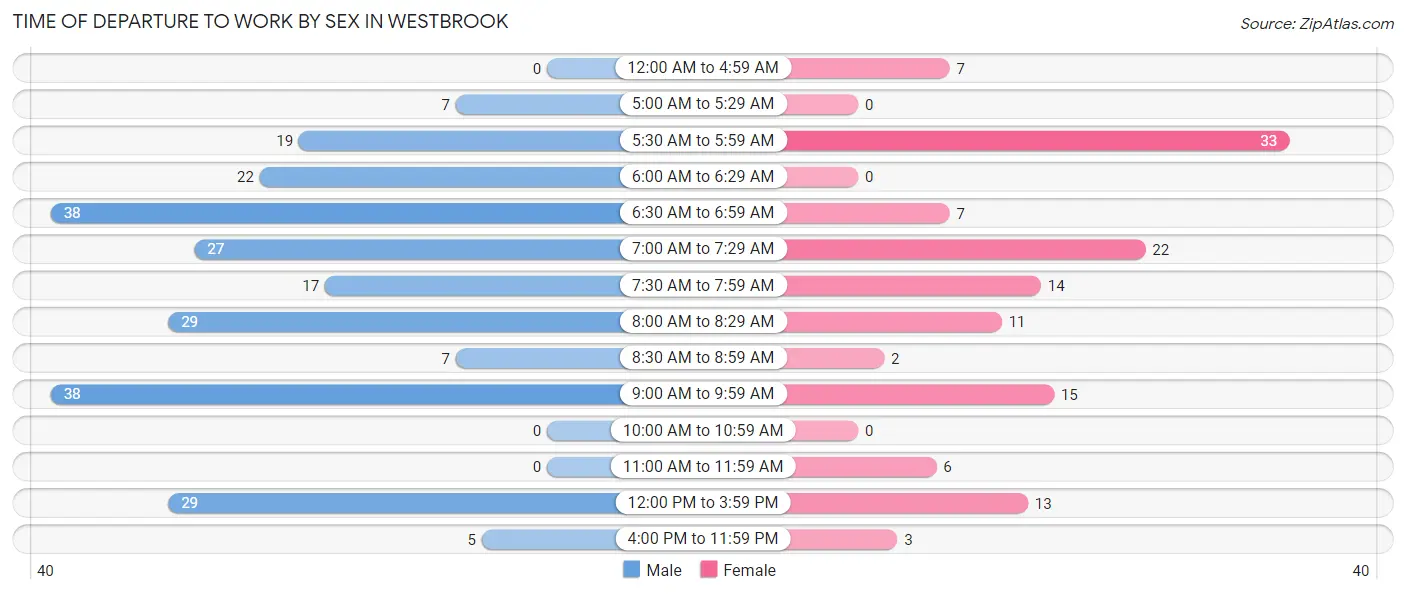
| Time of Departure | Male | Female |
| 12:00 AM to 4:59 AM | 0 (0.0%) | 7 (5.3%) |
| 5:00 AM to 5:29 AM | 7 (2.9%) | 0 (0.0%) |
| 5:30 AM to 5:59 AM | 19 (8.0%) | 33 (24.8%) |
| 6:00 AM to 6:29 AM | 22 (9.2%) | 0 (0.0%) |
| 6:30 AM to 6:59 AM | 38 (16.0%) | 7 (5.3%) |
| 7:00 AM to 7:29 AM | 27 (11.3%) | 22 (16.5%) |
| 7:30 AM to 7:59 AM | 17 (7.1%) | 14 (10.5%) |
| 8:00 AM to 8:29 AM | 29 (12.2%) | 11 (8.3%) |
| 8:30 AM to 8:59 AM | 7 (2.9%) | 2 (1.5%) |
| 9:00 AM to 9:59 AM | 38 (16.0%) | 15 (11.3%) |
| 10:00 AM to 10:59 AM | 0 (0.0%) | 0 (0.0%) |
| 11:00 AM to 11:59 AM | 0 (0.0%) | 6 (4.5%) |
| 12:00 PM to 3:59 PM | 29 (12.2%) | 13 (9.8%) |
| 4:00 PM to 11:59 PM | 5 (2.1%) | 3 (2.3%) |
| Total | 238 (100.0%) | 133 (100.0%) |
Housing Occupancy in Westbrook
Occupancy by Ownership in Westbrook
Of the total 388 dwellings in Westbrook, owner-occupied units account for 274 (70.6%), while renter-occupied units make up 114 (29.4%).
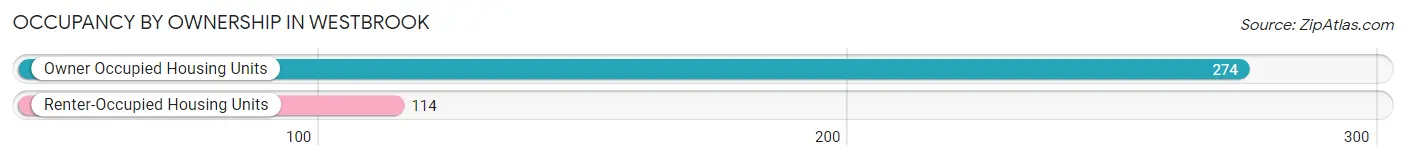
| Occupancy | # Housing Units | % Housing Units |
| Owner Occupied Housing Units | 274 | 70.6% |
| Renter-Occupied Housing Units | 114 | 29.4% |
| Total Occupied Housing Units | 388 | 100.0% |
Occupancy by Household Size in Westbrook
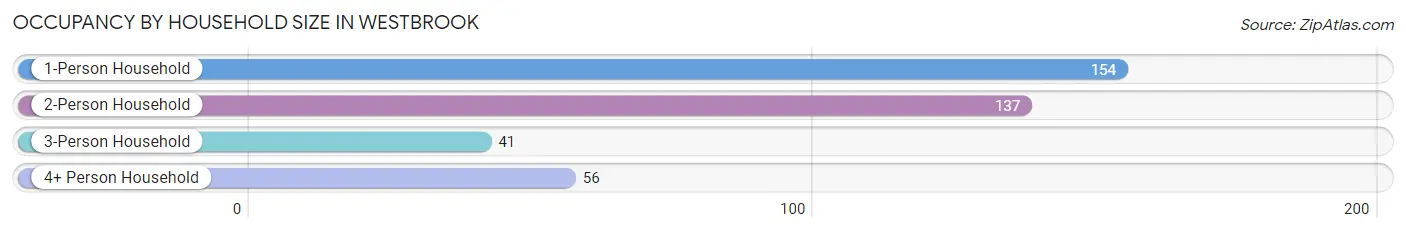
| Household Size | # Housing Units | % Housing Units |
| 1-Person Household | 154 | 39.7% |
| 2-Person Household | 137 | 35.3% |
| 3-Person Household | 41 | 10.6% |
| 4+ Person Household | 56 | 14.4% |
| Total Housing Units | 388 | 100.0% |
Occupancy by Ownership by Household Size in Westbrook
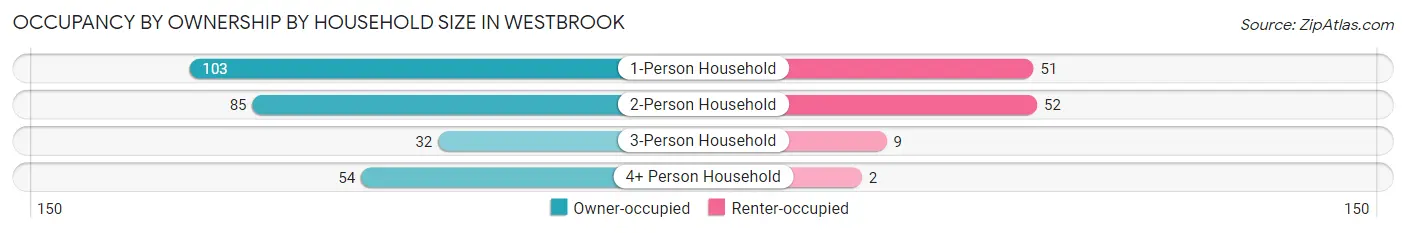
| Household Size | Owner-occupied | Renter-occupied |
| 1-Person Household | 103 (66.9%) | 51 (33.1%) |
| 2-Person Household | 85 (62.0%) | 52 (38.0%) |
| 3-Person Household | 32 (78.0%) | 9 (22.0%) |
| 4+ Person Household | 54 (96.4%) | 2 (3.6%) |
| Total Housing Units | 274 (70.6%) | 114 (29.4%) |
Occupancy by Educational Attainment in Westbrook
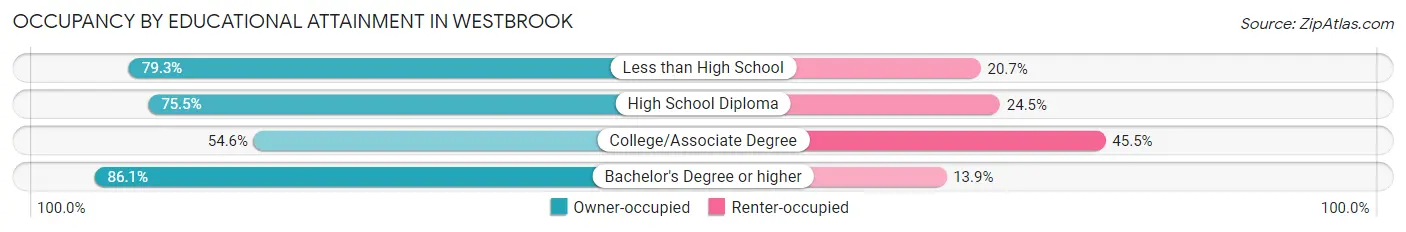
| Household Size | Owner-occupied | Renter-occupied |
| Less than High School | 23 (79.3%) | 6 (20.7%) |
| High School Diploma | 117 (75.5%) | 38 (24.5%) |
| College/Associate Degree | 72 (54.5%) | 60 (45.5%) |
| Bachelor's Degree or higher | 62 (86.1%) | 10 (13.9%) |
Occupancy by Age of Householder in Westbrook
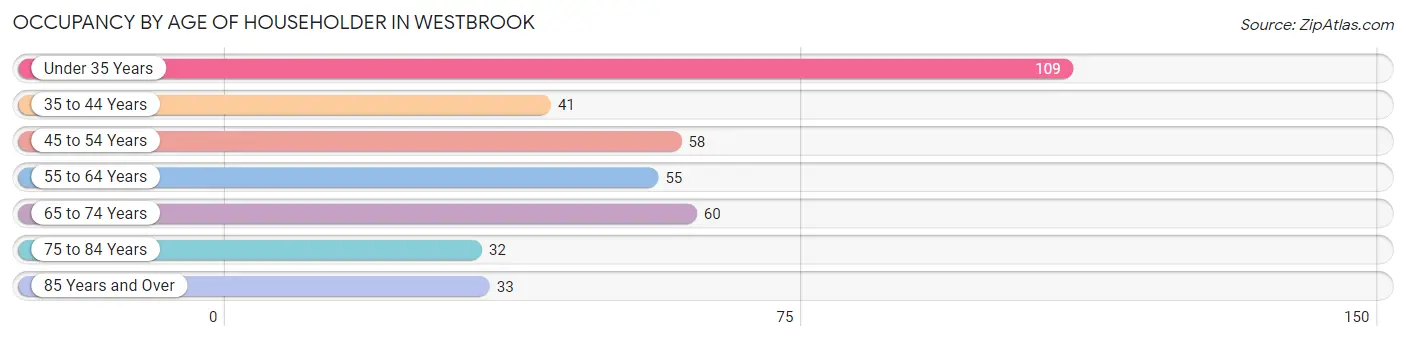
| Age Bracket | # Households | % Households |
| Under 35 Years | 109 | 28.1% |
| 35 to 44 Years | 41 | 10.6% |
| 45 to 54 Years | 58 | 14.9% |
| 55 to 64 Years | 55 | 14.2% |
| 65 to 74 Years | 60 | 15.5% |
| 75 to 84 Years | 32 | 8.3% |
| 85 Years and Over | 33 | 8.5% |
| Total | 388 | 100.0% |
Housing Finances in Westbrook
Median Income by Occupancy in Westbrook
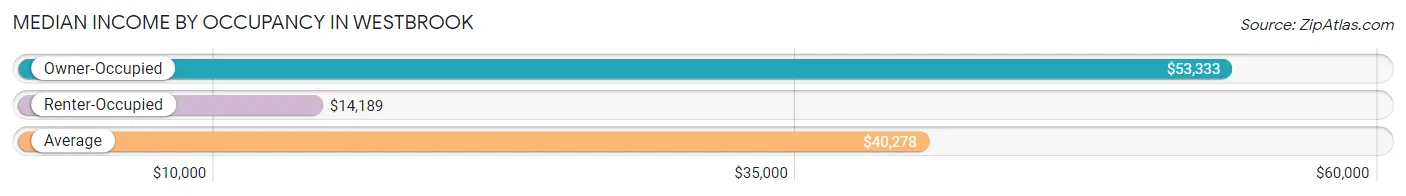
| Occupancy Type | # Households | Median Income |
| Owner-Occupied | 274 (70.6%) | $53,333 |
| Renter-Occupied | 114 (29.4%) | $14,189 |
| Average | 388 (100.0%) | $40,278 |
Occupancy by Householder Income Bracket in Westbrook
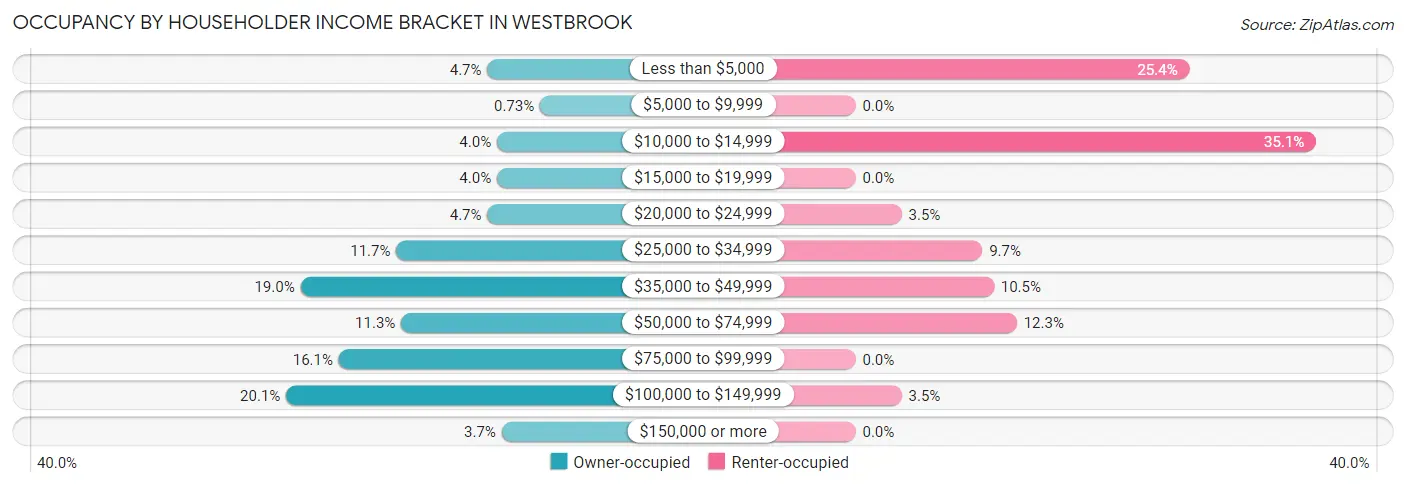
| Income Bracket | Owner-occupied | Renter-occupied |
| Less than $5,000 | 13 (4.7%) | 29 (25.4%) |
| $5,000 to $9,999 | 2 (0.7%) | 0 (0.0%) |
| $10,000 to $14,999 | 11 (4.0%) | 40 (35.1%) |
| $15,000 to $19,999 | 11 (4.0%) | 0 (0.0%) |
| $20,000 to $24,999 | 13 (4.7%) | 4 (3.5%) |
| $25,000 to $34,999 | 32 (11.7%) | 11 (9.7%) |
| $35,000 to $49,999 | 52 (19.0%) | 12 (10.5%) |
| $50,000 to $74,999 | 31 (11.3%) | 14 (12.3%) |
| $75,000 to $99,999 | 44 (16.1%) | 0 (0.0%) |
| $100,000 to $149,999 | 55 (20.1%) | 4 (3.5%) |
| $150,000 or more | 10 (3.6%) | 0 (0.0%) |
| Total | 274 (100.0%) | 114 (100.0%) |
Monthly Housing Cost Tiers in Westbrook
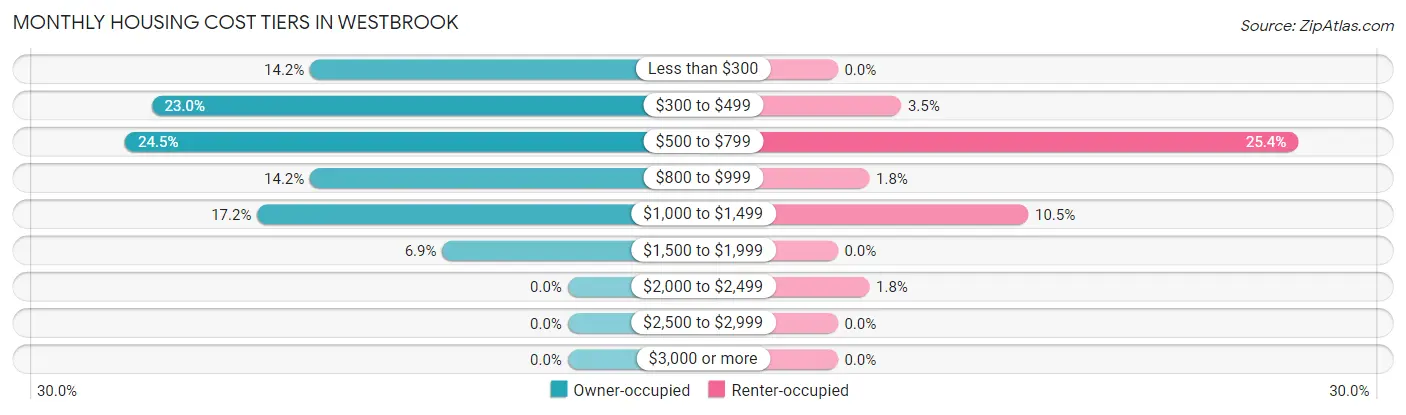
| Monthly Cost | Owner-occupied | Renter-occupied |
| Less than $300 | 39 (14.2%) | 0 (0.0%) |
| $300 to $499 | 63 (23.0%) | 4 (3.5%) |
| $500 to $799 | 67 (24.4%) | 29 (25.4%) |
| $800 to $999 | 39 (14.2%) | 2 (1.8%) |
| $1,000 to $1,499 | 47 (17.2%) | 12 (10.5%) |
| $1,500 to $1,999 | 19 (6.9%) | 0 (0.0%) |
| $2,000 to $2,499 | 0 (0.0%) | 2 (1.8%) |
| $2,500 to $2,999 | 0 (0.0%) | 0 (0.0%) |
| $3,000 or more | 0 (0.0%) | 0 (0.0%) |
| Total | 274 (100.0%) | 114 (100.0%) |
Physical Housing Characteristics in Westbrook
Housing Structures in Westbrook
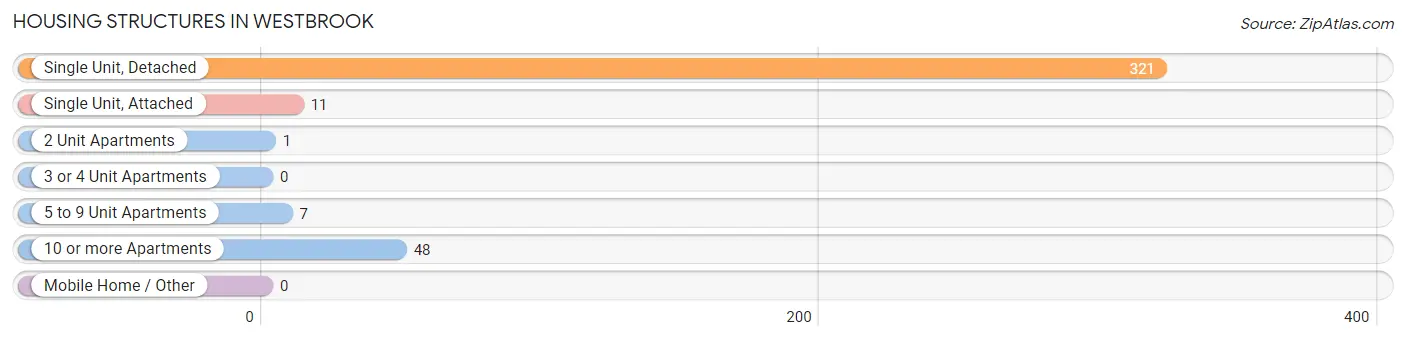
| Structure Type | # Housing Units | % Housing Units |
| Single Unit, Detached | 321 | 82.7% |
| Single Unit, Attached | 11 | 2.8% |
| 2 Unit Apartments | 1 | 0.3% |
| 3 or 4 Unit Apartments | 0 | 0.0% |
| 5 to 9 Unit Apartments | 7 | 1.8% |
| 10 or more Apartments | 48 | 12.4% |
| Mobile Home / Other | 0 | 0.0% |
| Total | 388 | 100.0% |
Housing Structures by Occupancy in Westbrook
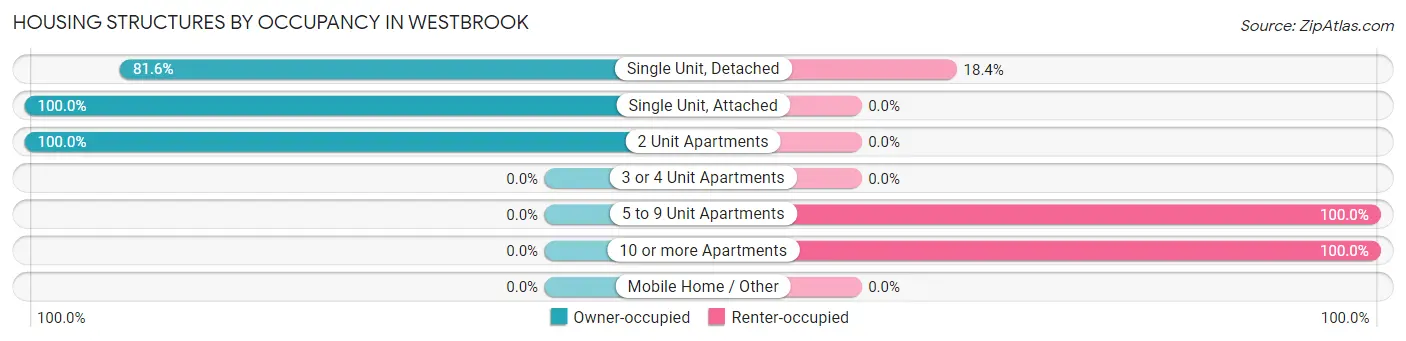
| Structure Type | Owner-occupied | Renter-occupied |
| Single Unit, Detached | 262 (81.6%) | 59 (18.4%) |
| Single Unit, Attached | 11 (100.0%) | 0 (0.0%) |
| 2 Unit Apartments | 1 (100.0%) | 0 (0.0%) |
| 3 or 4 Unit Apartments | 0 (0.0%) | 0 (0.0%) |
| 5 to 9 Unit Apartments | 0 (0.0%) | 7 (100.0%) |
| 10 or more Apartments | 0 (0.0%) | 48 (100.0%) |
| Mobile Home / Other | 0 (0.0%) | 0 (0.0%) |
| Total | 274 (70.6%) | 114 (29.4%) |
Housing Structures by Number of Rooms in Westbrook
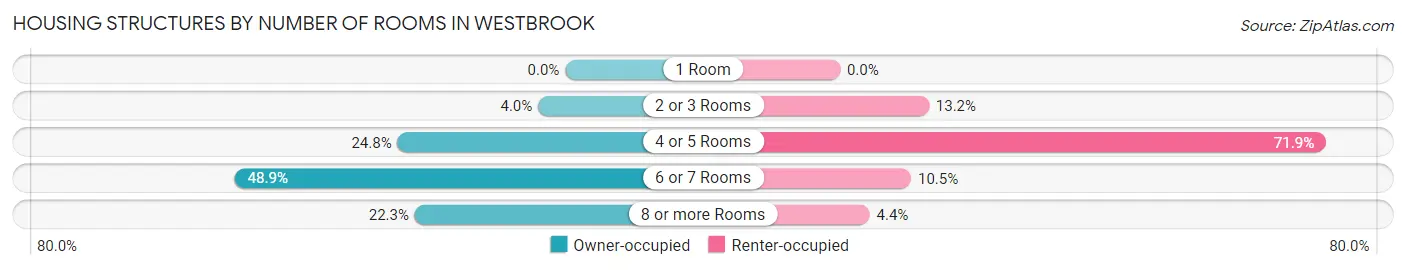
| Number of Rooms | Owner-occupied | Renter-occupied |
| 1 Room | 0 (0.0%) | 0 (0.0%) |
| 2 or 3 Rooms | 11 (4.0%) | 15 (13.2%) |
| 4 or 5 Rooms | 68 (24.8%) | 82 (71.9%) |
| 6 or 7 Rooms | 134 (48.9%) | 12 (10.5%) |
| 8 or more Rooms | 61 (22.3%) | 5 (4.4%) |
| Total | 274 (100.0%) | 114 (100.0%) |
Housing Structure by Heating Type in Westbrook
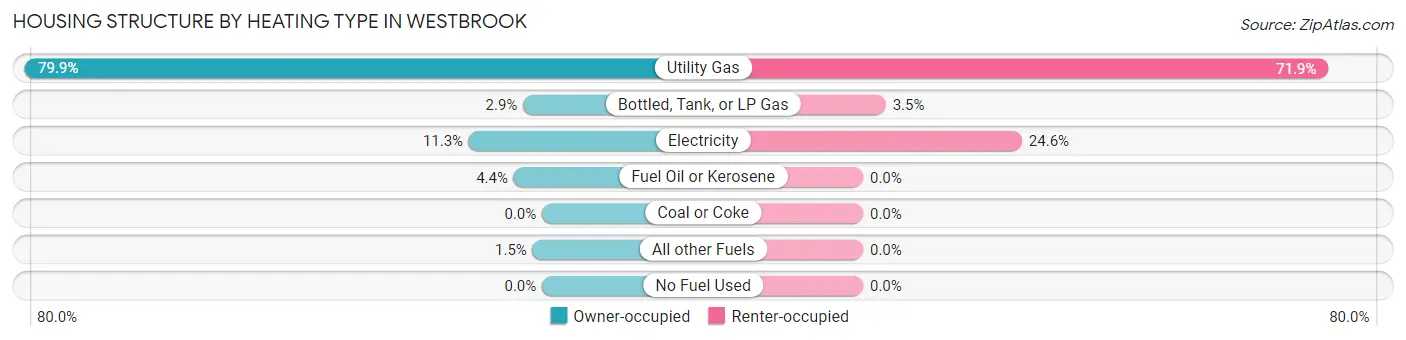
| Heating Type | Owner-occupied | Renter-occupied |
| Utility Gas | 219 (79.9%) | 82 (71.9%) |
| Bottled, Tank, or LP Gas | 8 (2.9%) | 4 (3.5%) |
| Electricity | 31 (11.3%) | 28 (24.6%) |
| Fuel Oil or Kerosene | 12 (4.4%) | 0 (0.0%) |
| Coal or Coke | 0 (0.0%) | 0 (0.0%) |
| All other Fuels | 4 (1.5%) | 0 (0.0%) |
| No Fuel Used | 0 (0.0%) | 0 (0.0%) |
| Total | 274 (100.0%) | 114 (100.0%) |
Household Vehicle Usage in Westbrook
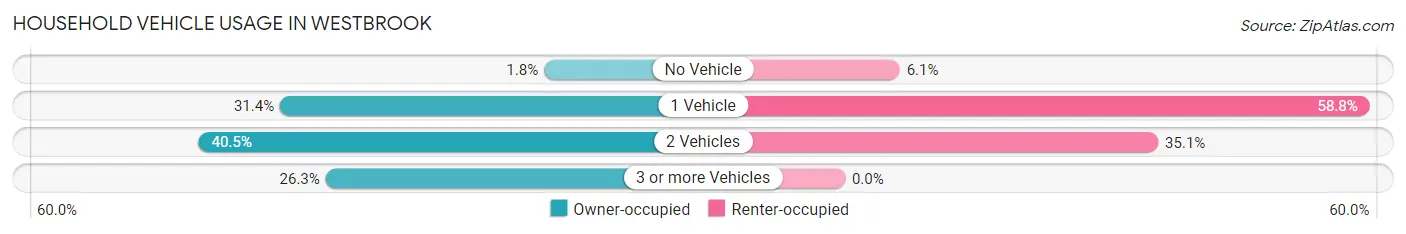
| Vehicles per Household | Owner-occupied | Renter-occupied |
| No Vehicle | 5 (1.8%) | 7 (6.1%) |
| 1 Vehicle | 86 (31.4%) | 67 (58.8%) |
| 2 Vehicles | 111 (40.5%) | 40 (35.1%) |
| 3 or more Vehicles | 72 (26.3%) | 0 (0.0%) |
| Total | 274 (100.0%) | 114 (100.0%) |
Real Estate & Mortgages in Westbrook
Real Estate and Mortgage Overview in Westbrook
| Characteristic | Without Mortgage | With Mortgage |
| Housing Units | 147 | 127 |
| Median Property Value | $56,500 | $83,900 |
| Median Household Income | $40,417 | $5 |
| Monthly Housing Costs | $438 | $0 |
| Real Estate Taxes | $963 | $0 |
Property Value by Mortgage Status in Westbrook
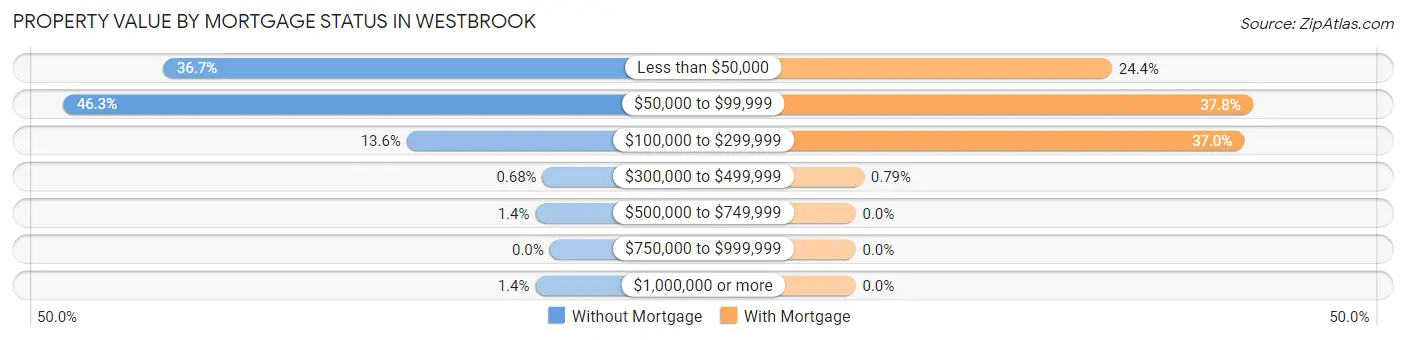
| Property Value | Without Mortgage | With Mortgage |
| Less than $50,000 | 54 (36.7%) | 31 (24.4%) |
| $50,000 to $99,999 | 68 (46.3%) | 48 (37.8%) |
| $100,000 to $299,999 | 20 (13.6%) | 47 (37.0%) |
| $300,000 to $499,999 | 1 (0.7%) | 1 (0.8%) |
| $500,000 to $749,999 | 2 (1.4%) | 0 (0.0%) |
| $750,000 to $999,999 | 0 (0.0%) | 0 (0.0%) |
| $1,000,000 or more | 2 (1.4%) | 0 (0.0%) |
| Total | 147 (100.0%) | 127 (100.0%) |
Household Income by Mortgage Status in Westbrook
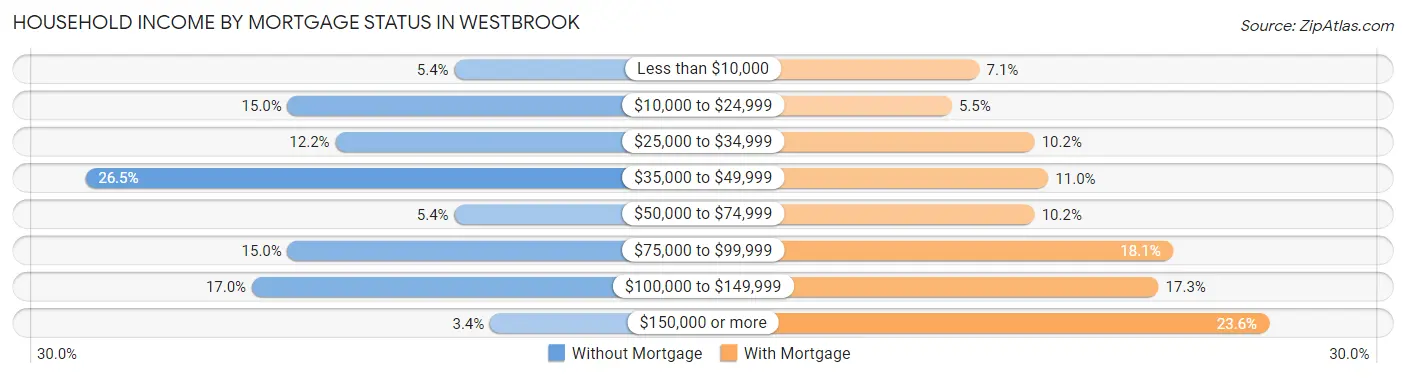
| Household Income | Without Mortgage | With Mortgage |
| Less than $10,000 | 8 (5.4%) | 9 (7.1%) |
| $10,000 to $24,999 | 22 (15.0%) | 7 (5.5%) |
| $25,000 to $34,999 | 18 (12.2%) | 13 (10.2%) |
| $35,000 to $49,999 | 39 (26.5%) | 14 (11.0%) |
| $50,000 to $74,999 | 8 (5.4%) | 13 (10.2%) |
| $75,000 to $99,999 | 22 (15.0%) | 23 (18.1%) |
| $100,000 to $149,999 | 25 (17.0%) | 22 (17.3%) |
| $150,000 or more | 5 (3.4%) | 30 (23.6%) |
| Total | 147 (100.0%) | 127 (100.0%) |
Property Value to Household Income Ratio in Westbrook
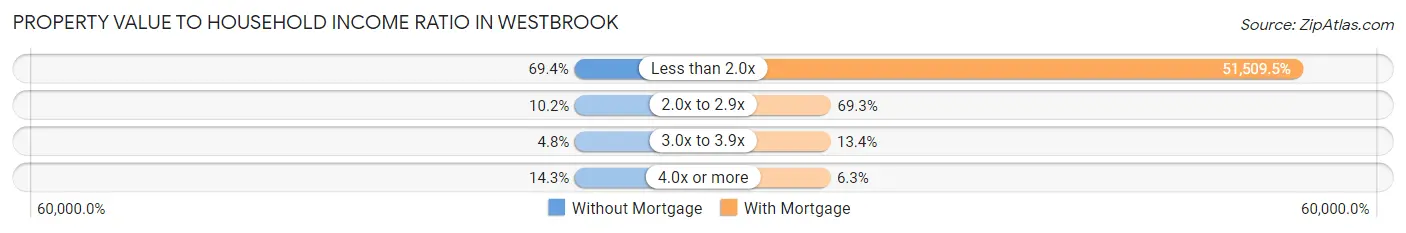
| Value-to-Income Ratio | Without Mortgage | With Mortgage |
| Less than 2.0x | 102 (69.4%) | 65,417 (51,509.5%) |
| 2.0x to 2.9x | 15 (10.2%) | 88 (69.3%) |
| 3.0x to 3.9x | 7 (4.8%) | 17 (13.4%) |
| 4.0x or more | 21 (14.3%) | 8 (6.3%) |
| Total | 147 (100.0%) | 127 (100.0%) |
Real Estate Taxes by Mortgage Status in Westbrook
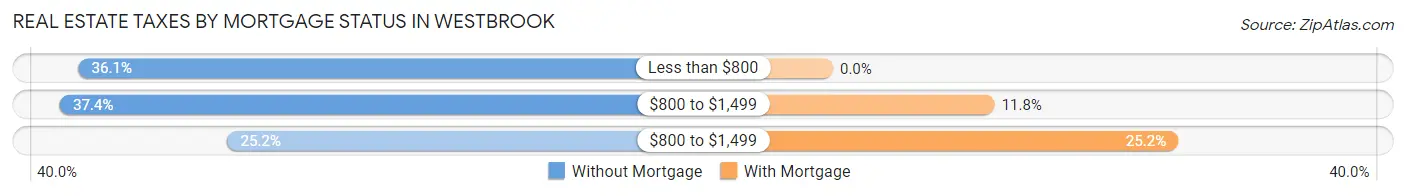
| Property Taxes | Without Mortgage | With Mortgage |
| Less than $800 | 53 (36.0%) | 0 (0.0%) |
| $800 to $1,499 | 55 (37.4%) | 15 (11.8%) |
| $800 to $1,499 | 37 (25.2%) | 32 (25.2%) |
| Total | 147 (100.0%) | 127 (100.0%) |
Health & Disability in Westbrook
Health Insurance Coverage by Age in Westbrook
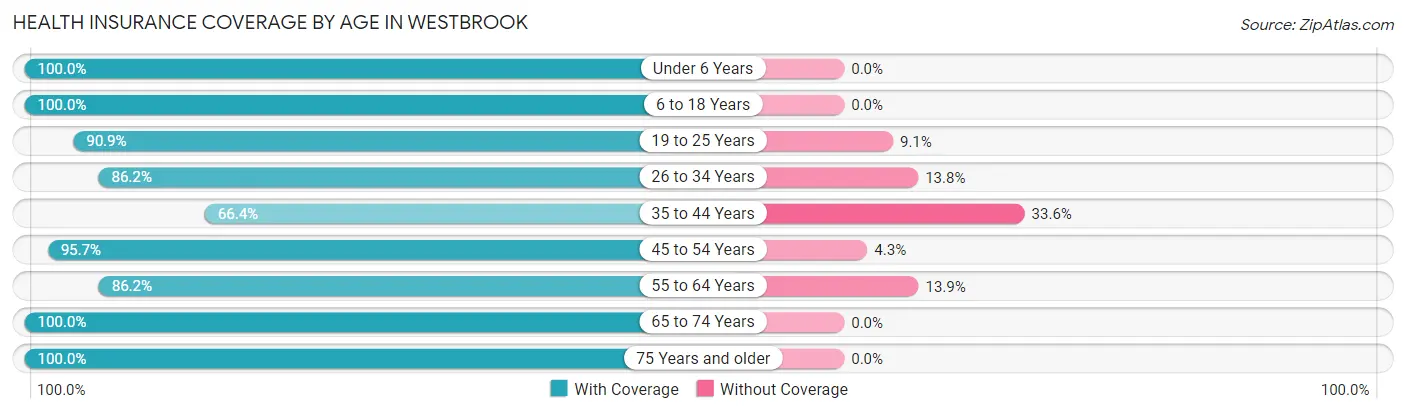
| Age Bracket | With Coverage | Without Coverage |
| Under 6 Years | 52 (100.0%) | 0 (0.0%) |
| 6 to 18 Years | 132 (100.0%) | 0 (0.0%) |
| 19 to 25 Years | 90 (90.9%) | 9 (9.1%) |
| 26 to 34 Years | 50 (86.2%) | 8 (13.8%) |
| 35 to 44 Years | 75 (66.4%) | 38 (33.6%) |
| 45 to 54 Years | 111 (95.7%) | 5 (4.3%) |
| 55 to 64 Years | 56 (86.2%) | 9 (13.9%) |
| 65 to 74 Years | 97 (100.0%) | 0 (0.0%) |
| 75 Years and older | 81 (100.0%) | 0 (0.0%) |
| Total | 744 (91.5%) | 69 (8.5%) |
Health Insurance Coverage by Citizenship Status in Westbrook
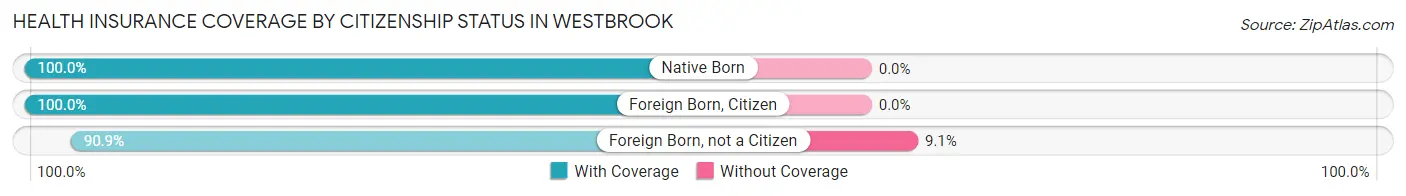
| Citizenship Status | With Coverage | Without Coverage |
| Native Born | 52 (100.0%) | 0 (0.0%) |
| Foreign Born, Citizen | 132 (100.0%) | 0 (0.0%) |
| Foreign Born, not a Citizen | 90 (90.9%) | 9 (9.1%) |
Health Insurance Coverage by Household Income in Westbrook
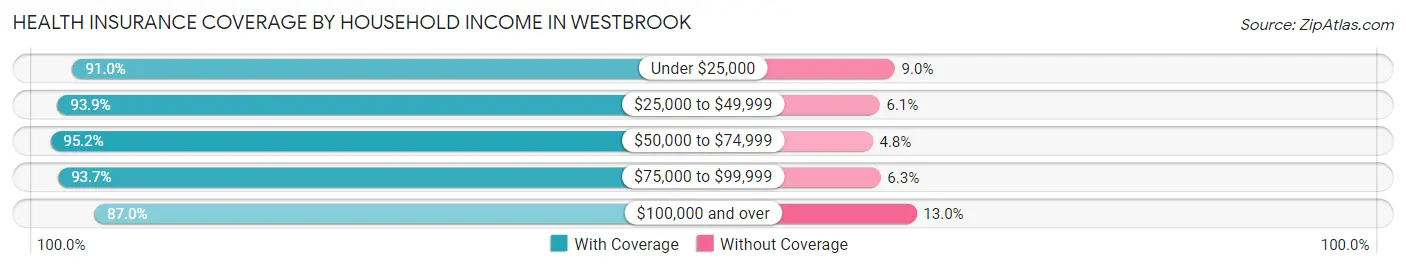
| Household Income | With Coverage | Without Coverage |
| Under $25,000 | 132 (91.0%) | 13 (9.0%) |
| $25,000 to $49,999 | 214 (93.9%) | 14 (6.1%) |
| $50,000 to $74,999 | 79 (95.2%) | 4 (4.8%) |
| $75,000 to $99,999 | 119 (93.7%) | 8 (6.3%) |
| $100,000 and over | 200 (87.0%) | 30 (13.0%) |
Public vs Private Health Insurance Coverage by Age in Westbrook
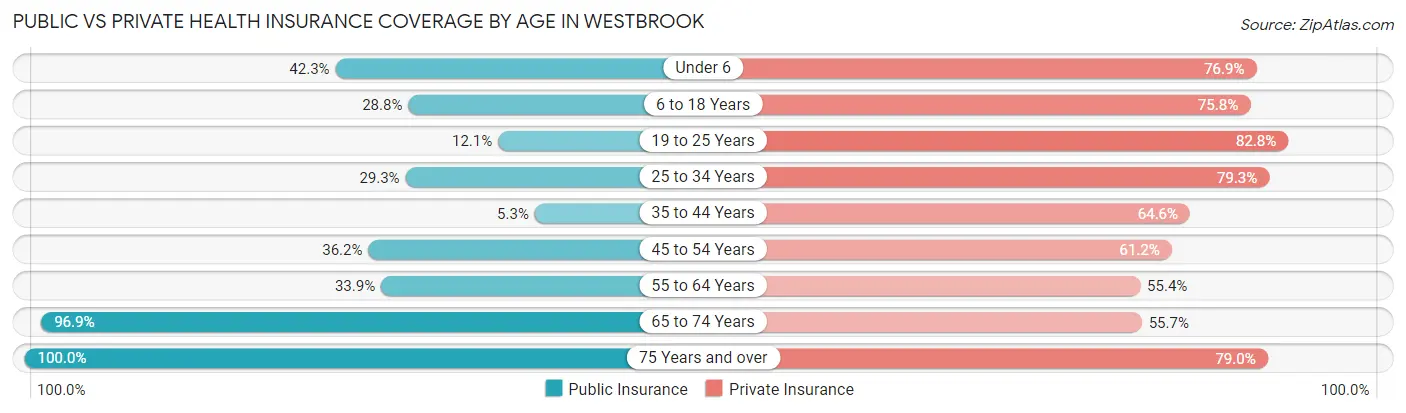
| Age Bracket | Public Insurance | Private Insurance |
| Under 6 | 22 (42.3%) | 40 (76.9%) |
| 6 to 18 Years | 38 (28.8%) | 100 (75.8%) |
| 19 to 25 Years | 12 (12.1%) | 82 (82.8%) |
| 25 to 34 Years | 17 (29.3%) | 46 (79.3%) |
| 35 to 44 Years | 6 (5.3%) | 73 (64.6%) |
| 45 to 54 Years | 42 (36.2%) | 71 (61.2%) |
| 55 to 64 Years | 22 (33.9%) | 36 (55.4%) |
| 65 to 74 Years | 94 (96.9%) | 54 (55.7%) |
| 75 Years and over | 81 (100.0%) | 64 (79.0%) |
| Total | 334 (41.1%) | 566 (69.6%) |
Disability Status by Sex by Age in Westbrook
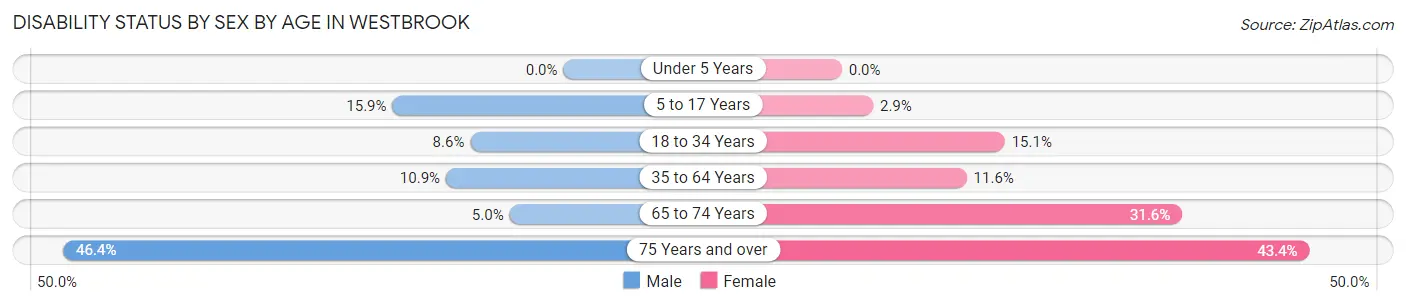
| Age Bracket | Male | Female |
| Under 5 Years | 0 (0.0%) | 0 (0.0%) |
| 5 to 17 Years | 10 (15.9%) | 2 (2.9%) |
| 18 to 34 Years | 7 (8.6%) | 13 (15.1%) |
| 35 to 64 Years | 17 (10.9%) | 16 (11.6%) |
| 65 to 74 Years | 2 (5.0%) | 18 (31.6%) |
| 75 Years and over | 13 (46.4%) | 23 (43.4%) |
Disability Class by Sex by Age in Westbrook
Disability Class: Hearing Difficulty
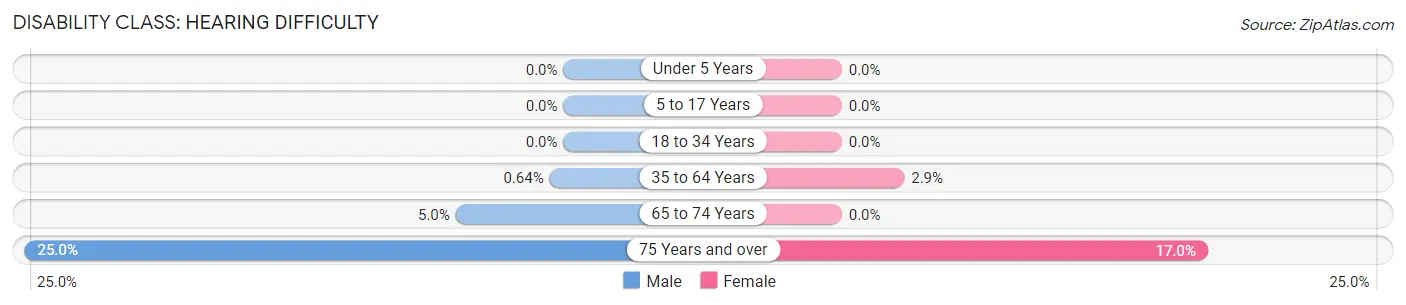
| Age Bracket | Male | Female |
| Under 5 Years | 0 (0.0%) | 0 (0.0%) |
| 5 to 17 Years | 0 (0.0%) | 0 (0.0%) |
| 18 to 34 Years | 0 (0.0%) | 0 (0.0%) |
| 35 to 64 Years | 1 (0.6%) | 4 (2.9%) |
| 65 to 74 Years | 2 (5.0%) | 0 (0.0%) |
| 75 Years and over | 7 (25.0%) | 9 (17.0%) |
Disability Class: Vision Difficulty
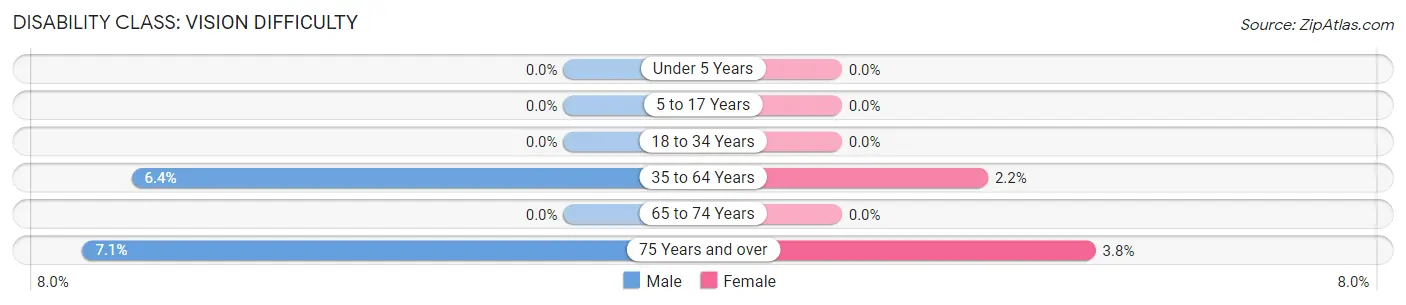
| Age Bracket | Male | Female |
| Under 5 Years | 0 (0.0%) | 0 (0.0%) |
| 5 to 17 Years | 0 (0.0%) | 0 (0.0%) |
| 18 to 34 Years | 0 (0.0%) | 0 (0.0%) |
| 35 to 64 Years | 10 (6.4%) | 3 (2.2%) |
| 65 to 74 Years | 0 (0.0%) | 0 (0.0%) |
| 75 Years and over | 2 (7.1%) | 2 (3.8%) |
Disability Class: Cognitive Difficulty
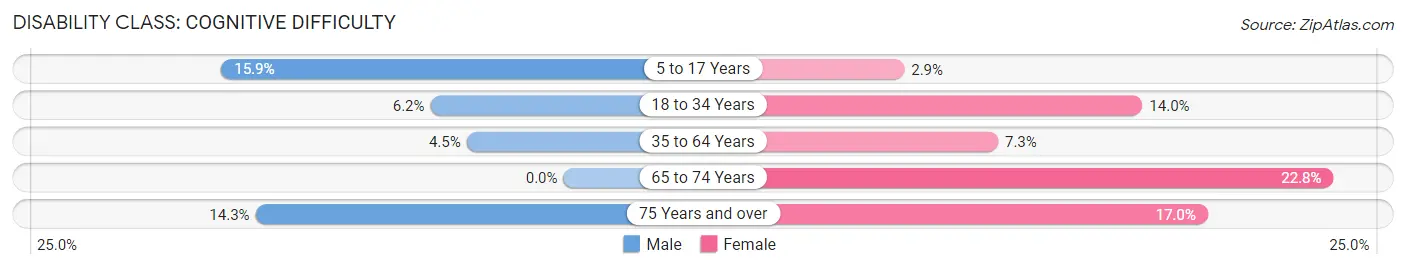
| Age Bracket | Male | Female |
| 5 to 17 Years | 10 (15.9%) | 2 (2.9%) |
| 18 to 34 Years | 5 (6.2%) | 12 (14.0%) |
| 35 to 64 Years | 7 (4.5%) | 10 (7.2%) |
| 65 to 74 Years | 0 (0.0%) | 13 (22.8%) |
| 75 Years and over | 4 (14.3%) | 9 (17.0%) |
Disability Class: Ambulatory Difficulty
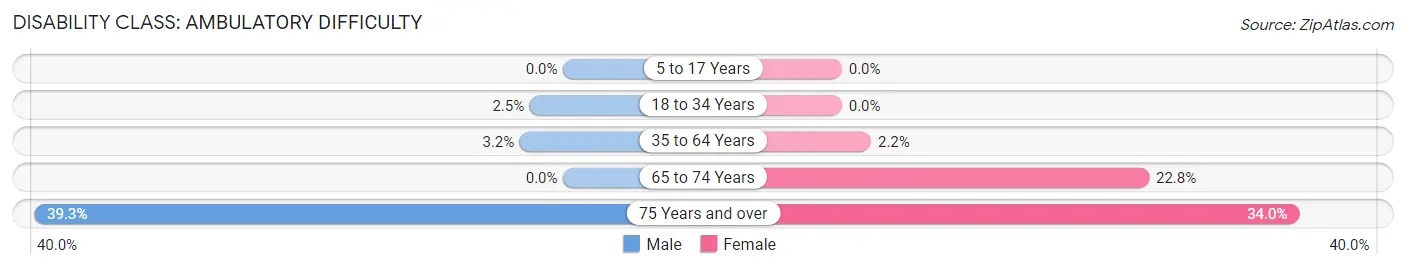
| Age Bracket | Male | Female |
| 5 to 17 Years | 0 (0.0%) | 0 (0.0%) |
| 18 to 34 Years | 2 (2.5%) | 0 (0.0%) |
| 35 to 64 Years | 5 (3.2%) | 3 (2.2%) |
| 65 to 74 Years | 0 (0.0%) | 13 (22.8%) |
| 75 Years and over | 11 (39.3%) | 18 (34.0%) |
Disability Class: Self-Care Difficulty
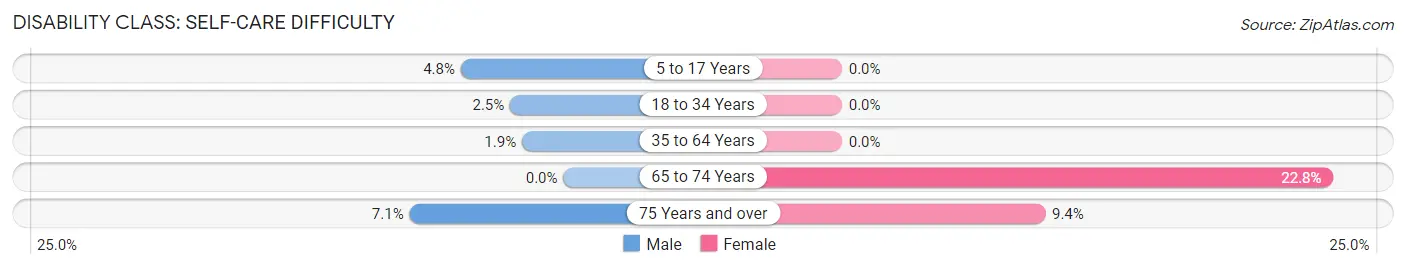
| Age Bracket | Male | Female |
| 5 to 17 Years | 3 (4.8%) | 0 (0.0%) |
| 18 to 34 Years | 2 (2.5%) | 0 (0.0%) |
| 35 to 64 Years | 3 (1.9%) | 0 (0.0%) |
| 65 to 74 Years | 0 (0.0%) | 13 (22.8%) |
| 75 Years and over | 2 (7.1%) | 5 (9.4%) |
Technology Access in Westbrook
Computing Device Access in Westbrook
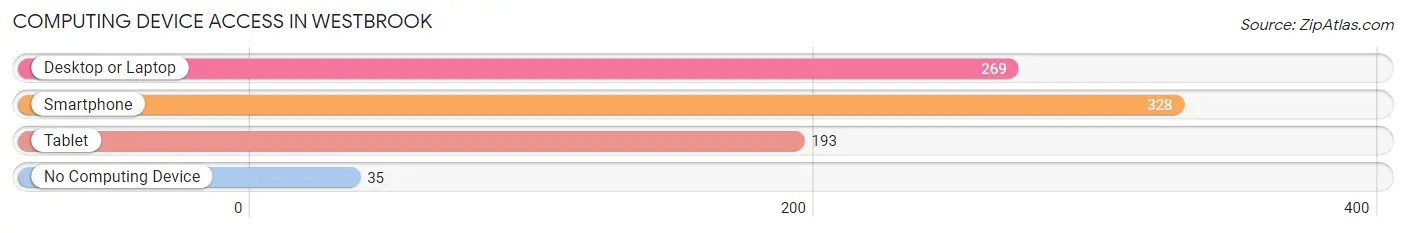
| Device Type | # Households | % Households |
| Desktop or Laptop | 269 | 69.3% |
| Smartphone | 328 | 84.5% |
| Tablet | 193 | 49.7% |
| No Computing Device | 35 | 9.0% |
| Total | 388 | 100.0% |
Internet Access in Westbrook
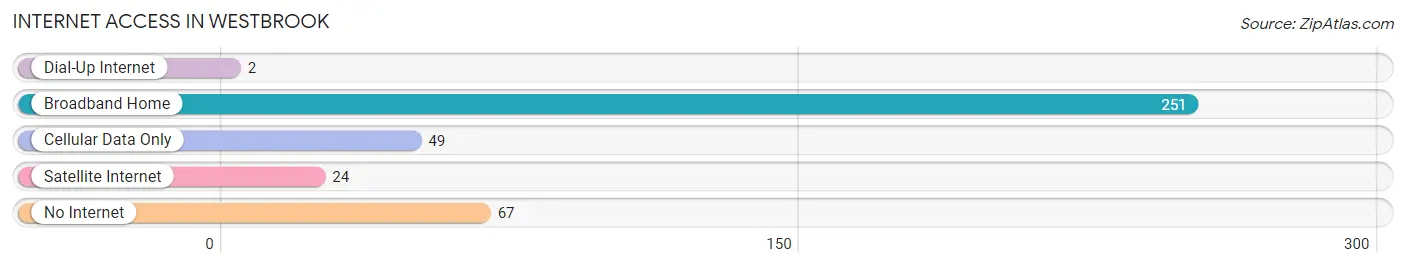
| Internet Type | # Households | % Households |
| Dial-Up Internet | 2 | 0.5% |
| Broadband Home | 251 | 64.7% |
| Cellular Data Only | 49 | 12.6% |
| Satellite Internet | 24 | 6.2% |
| No Internet | 67 | 17.3% |
| Total | 388 | 100.0% |
Westbrook Summary
Westbrook, Minnesota is a small city located in Cottonwood County in the southwestern part of the state. It is situated on the banks of the Cottonwood River, and is home to a population of approximately 1,400 people. The city is known for its rich history, diverse geography, and vibrant economy.
History
Westbrook was founded in 1871 by a group of settlers from Wisconsin. The city was named after the nearby Westbrook Creek, which was named after a settler from Wisconsin. The city was incorporated in 1881 and quickly grew to become a thriving agricultural center. The city was home to a variety of businesses, including a flour mill, a creamery, a lumber mill, and a brickyard.
In the early 1900s, Westbrook experienced a period of growth and prosperity. The city was home to a variety of businesses, including a bank, a hotel, a newspaper, and a variety of stores. The city also had a thriving agricultural industry, with a variety of crops being grown in the area.
Geography
Westbrook is located in the southwestern part of Minnesota, in Cottonwood County. The city is situated on the banks of the Cottonwood River, and is surrounded by rolling hills and farmland. The city is located approximately 30 miles from the Iowa border, and is approximately 90 miles from the Twin Cities.
The city has a total area of 1.2 square miles, all of which is land. The city has a humid continental climate, with hot summers and cold winters. The average temperature in the summer is around 75 degrees Fahrenheit, and the average temperature in the winter is around 20 degrees Fahrenheit.
Economy
Westbrook’s economy is largely based on agriculture. The city is home to a variety of farms, which produce a variety of crops, including corn, soybeans, and wheat. The city is also home to a variety of businesses, including a bank, a hotel, a newspaper, and a variety of stores.
The city is also home to a variety of manufacturing businesses, including a flour mill, a creamery, a lumber mill, and a brickyard. The city is also home to a variety of service businesses, including a hospital, a library, and a variety of restaurants.
Demographics
As of the 2010 census, the population of Westbrook was 1,400. The city has a population density of 1,100 people per square mile. The median age of the population is 43.7 years, and the median household income is $45,000.
The racial makeup of the city is 97.3% White, 0.7% African American, 0.3% Native American, 0.3% Asian, and 1.4% from other races. The city is home to a variety of religious denominations, including Lutheran, Catholic, and Methodist.
Conclusion
Westbrook, Minnesota is a small city located in Cottonwood County in the southwestern part of the state. It is situated on the banks of the Cottonwood River, and is home to a population of approximately 1,400 people. The city is known for its rich history, diverse geography, and vibrant economy. The city is largely based on agriculture, and is home to a variety of businesses, including a flour mill, a creamery, a lumber mill, and a brickyard. The city has a population density of 1,100 people per square mile, and the median age of the population is 43.7 years. Westbrook is a vibrant city with a rich history and a diverse economy.
Common Questions
What is Per Capita Income in Westbrook?
Per Capita income in Westbrook is $26,643.
What is the Median Family Income in Westbrook?
Median Family Income in Westbrook is $75,313.
What is the Median Household income in Westbrook?
Median Household Income in Westbrook is $40,278.
What is Income or Wage Gap in Westbrook?
Income or Wage Gap in Westbrook is 70.5%.
Women in Westbrook earn 29.5 cents for every dollar earned by a man.
What is Inequality or Gini Index in Westbrook?
Inequality or Gini Index in Westbrook is 0.45.
What is the Total Population of Westbrook?
Total Population of Westbrook is 832.
What is the Total Male Population of Westbrook?
Total Male Population of Westbrook is 389.
What is the Total Female Population of Westbrook?
Total Female Population of Westbrook is 443.
What is the Ratio of Males per 100 Females in Westbrook?
There are 87.81 Males per 100 Females in Westbrook.
What is the Ratio of Females per 100 Males in Westbrook?
There are 113.88 Females per 100 Males in Westbrook.
What is the Median Population Age in Westbrook?
Median Population Age in Westbrook is 42.5 Years.
What is the Average Family Size in Westbrook
Average Family Size in Westbrook is 3.1 People.
What is the Average Household Size in Westbrook
Average Household Size in Westbrook is 2.1 People.
How Large is the Labor Force in Westbrook?
There are 396 People in the Labor Forcein in Westbrook.
What is the Percentage of People in the Labor Force in Westbrook?
59.6% of People are in the Labor Force in Westbrook.
What is the Unemployment Rate in Westbrook?
Unemployment Rate in Westbrook is 1.0%.