Chisholm, MN Map & Demographics
Chisholm Map
Chisholm Overview
$34,124
PER CAPITA INCOME
$64,458
AVG FAMILY INCOME
$47,792
AVG HOUSEHOLD INCOME
27.5%
WAGE / INCOME GAP [ % ]
72.5¢/ $1
WAGE / INCOME GAP [ $ ]
0.56
INEQUALITY / GINI INDEX
4,759
TOTAL POPULATION
2,383
MALE POPULATION
2,376
FEMALE POPULATION
100.29
MALES / 100 FEMALES
99.71
FEMALES / 100 MALES
52.4
MEDIAN AGE
3.0
AVG FAMILY SIZE
2.4
AVG HOUSEHOLD SIZE
2,009
LABOR FORCE [ PEOPLE ]
50.6%
PERCENT IN LABOR FORCE
5.7%
UNEMPLOYMENT RATE
Chisholm Zip Codes
Chisholm Area Codes
Income in Chisholm
Income Overview in Chisholm
Per Capita Income in Chisholm is $34,124, while median incomes of families and households are $64,458 and $47,792 respectively.
| Characteristic | Number | Measure |
| Per Capita Income | 4,759 | $34,124 |
| Median Family Income | 971 | $64,458 |
| Mean Family Income | 971 | $84,340 |
| Median Household Income | 1,948 | $47,792 |
| Mean Household Income | 1,948 | $81,870 |
| Income Deficit | 971 | $0 |
| Wage / Income Gap (%) | 4,759 | 27.45% |
| Wage / Income Gap ($) | 4,759 | 72.55¢ per $1 |
| Gini / Inequality Index | 4,759 | 0.56 |
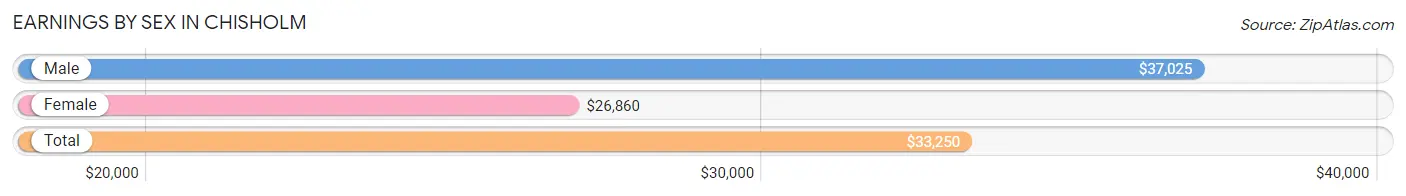
Earnings by Sex in Chisholm
Average Earnings in Chisholm are $33,250, $37,025 for men and $26,860 for women, a difference of 27.5%.
| Sex | Number | Average Earnings |
| Male | 1,101 (52.2%) | $37,025 |
| Female | 1,010 (47.8%) | $26,860 |
| Total | 2,111 (100.0%) | $33,250 |
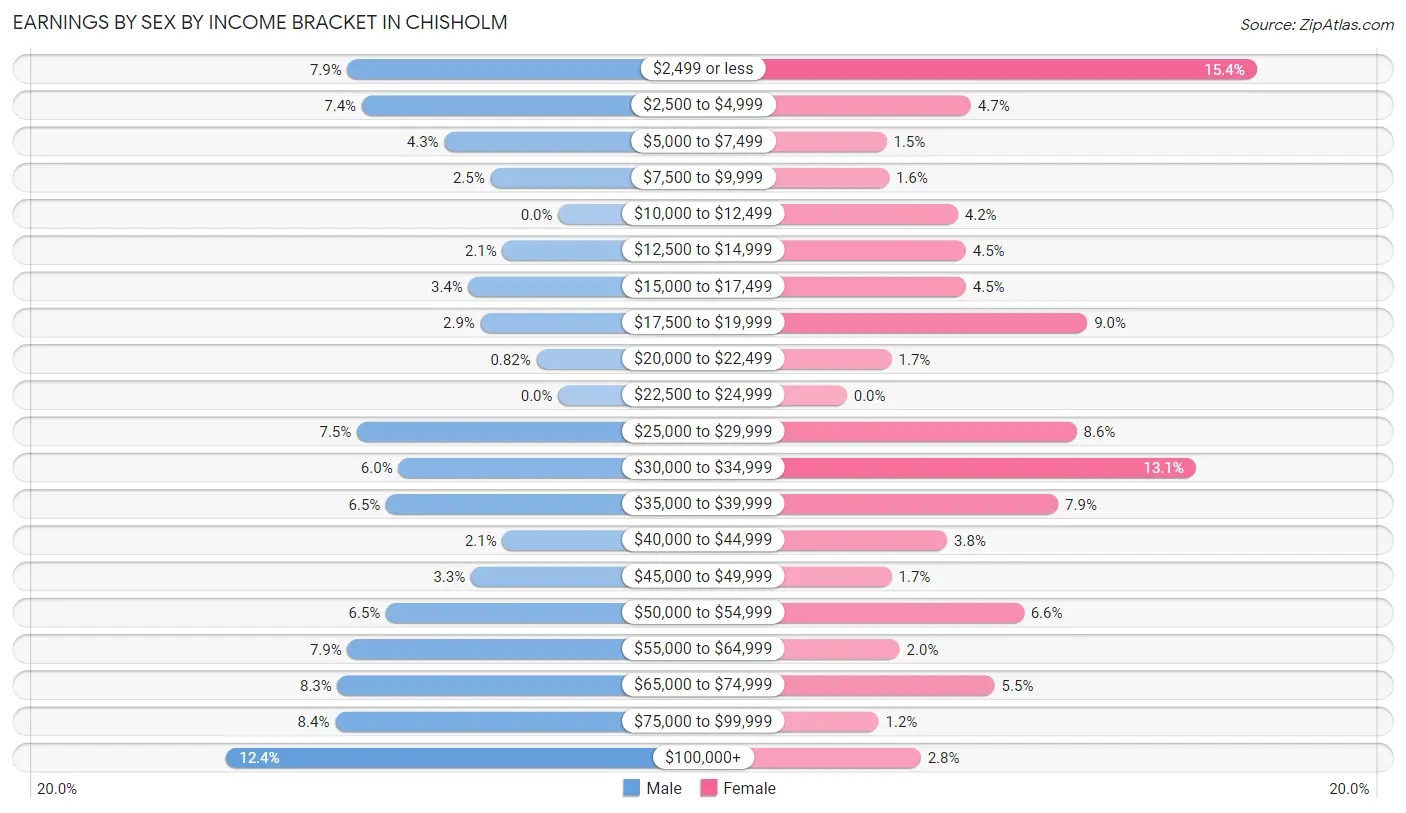
Earnings by Sex by Income Bracket in Chisholm
The most common earnings brackets in Chisholm are $100,000+ for men (137 | 12.4%) and $2,499 or less for women (155 | 15.3%).
| Income | Male | Female |
| $2,499 or less | 87 (7.9%) | 155 (15.3%) |
| $2,500 to $4,999 | 81 (7.4%) | 47 (4.6%) |
| $5,000 to $7,499 | 47 (4.3%) | 15 (1.5%) |
| $7,500 to $9,999 | 28 (2.5%) | 16 (1.6%) |
| $10,000 to $12,499 | 0 (0.0%) | 42 (4.2%) |
| $12,500 to $14,999 | 23 (2.1%) | 45 (4.5%) |
| $15,000 to $17,499 | 37 (3.4%) | 45 (4.5%) |
| $17,500 to $19,999 | 32 (2.9%) | 91 (9.0%) |
| $20,000 to $22,499 | 9 (0.8%) | 17 (1.7%) |
| $22,500 to $24,999 | 0 (0.0%) | 0 (0.0%) |
| $25,000 to $29,999 | 83 (7.5%) | 87 (8.6%) |
| $30,000 to $34,999 | 66 (6.0%) | 132 (13.1%) |
| $35,000 to $39,999 | 71 (6.5%) | 80 (7.9%) |
| $40,000 to $44,999 | 23 (2.1%) | 38 (3.8%) |
| $45,000 to $49,999 | 36 (3.3%) | 17 (1.7%) |
| $50,000 to $54,999 | 71 (6.5%) | 67 (6.6%) |
| $55,000 to $64,999 | 87 (7.9%) | 20 (2.0%) |
| $65,000 to $74,999 | 91 (8.3%) | 56 (5.5%) |
| $75,000 to $99,999 | 92 (8.4%) | 12 (1.2%) |
| $100,000+ | 137 (12.4%) | 28 (2.8%) |
| Total | 1,101 (100.0%) | 1,010 (100.0%) |
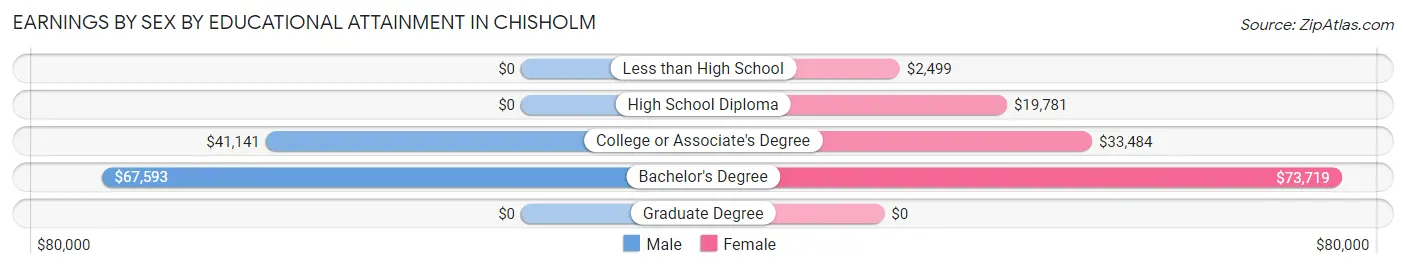
Earnings by Sex by Educational Attainment in Chisholm
Average earnings in Chisholm are $53,750 for men and $29,773 for women, a difference of 44.6%. Men with an educational attainment of bachelor's degree enjoy the highest average annual earnings of $67,593, while those with college or associate's degree education earn the least with $41,141. Women with an educational attainment of bachelor's degree earn the most with the average annual earnings of $73,719, while those with less than high school education have the smallest earnings of $2,499.
| Educational Attainment | Male Income | Female Income |
| Less than High School | - | - |
| High School Diploma | - | - |
| College or Associate's Degree | $41,141 | $33,484 |
| Bachelor's Degree | $67,593 | $73,719 |
| Graduate Degree | - | - |
| Total | $53,750 | $29,773 |
Family Income in Chisholm
Family Income Brackets in Chisholm
According to the Chisholm family income data, there are 173 families falling into the $75,000 to $99,999 income range, which is the most common income bracket and makes up 17.8% of all families. Conversely, the $150,000 to $199,999 income bracket is the least frequent group with only 4 families (0.4%) belonging to this category.
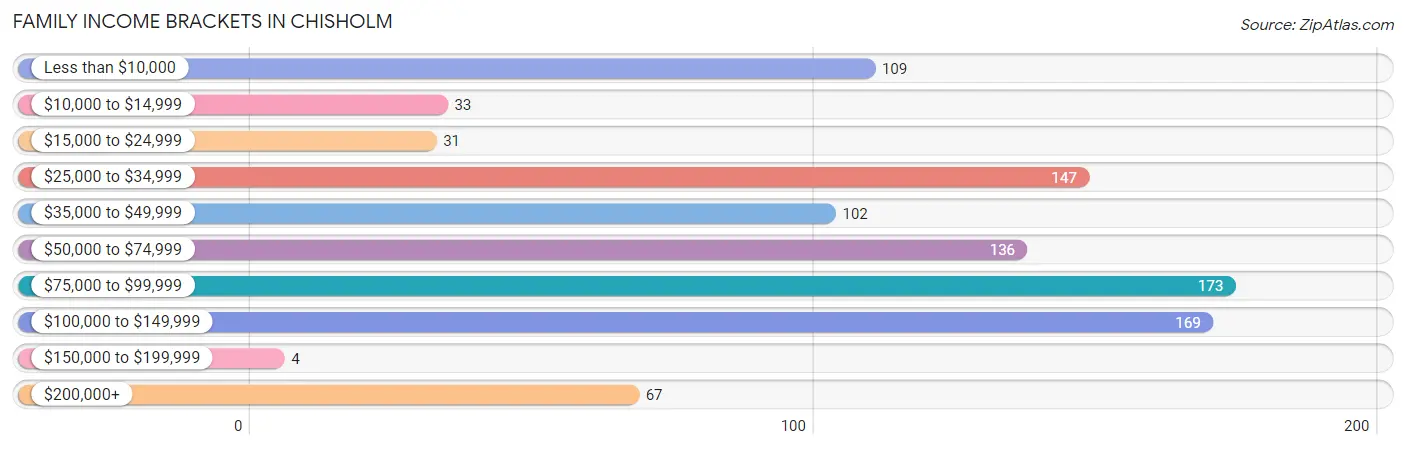
| Income Bracket | # Families | % Families |
| Less than $10,000 | 109 | 11.2% |
| $10,000 to $14,999 | 33 | 3.4% |
| $15,000 to $24,999 | 31 | 3.2% |
| $25,000 to $34,999 | 147 | 15.1% |
| $35,000 to $49,999 | 102 | 10.5% |
| $50,000 to $74,999 | 136 | 14.0% |
| $75,000 to $99,999 | 173 | 17.8% |
| $100,000 to $149,999 | 169 | 17.4% |
| $150,000 to $199,999 | 4 | 0.4% |
| $200,000+ | 67 | 6.9% |
Family Income by Famaliy Size in Chisholm
5-person families (136 | 14.0%) account for the highest median family income in Chisholm with $87,250 per family, while 3-person families (164 | 16.9%) have the highest median income of $23,611 per family member.
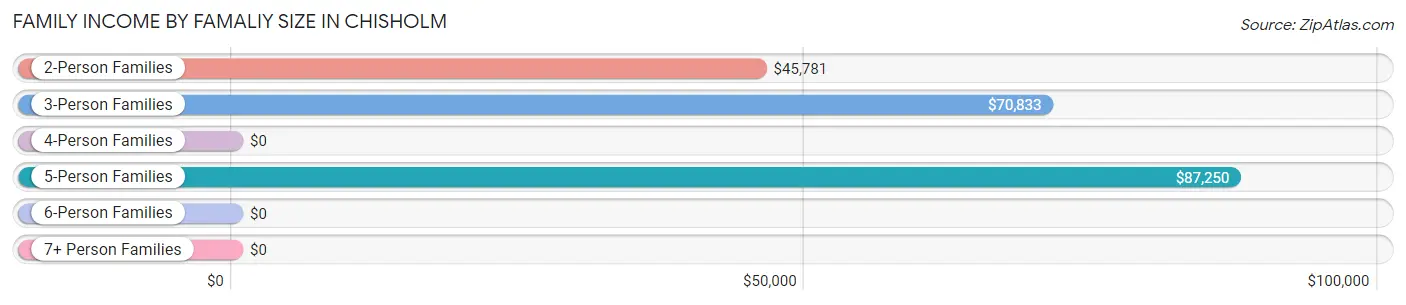
| Income Bracket | # Families | Median Income |
| 2-Person Families | 469 (48.3%) | $45,781 |
| 3-Person Families | 164 (16.9%) | $70,833 |
| 4-Person Families | 179 (18.4%) | $0 |
| 5-Person Families | 136 (14.0%) | $87,250 |
| 6-Person Families | 0 (0.0%) | $0 |
| 7+ Person Families | 23 (2.4%) | $0 |
| Total | 971 (100.0%) | $64,458 |
Family Income by Number of Earners in Chisholm
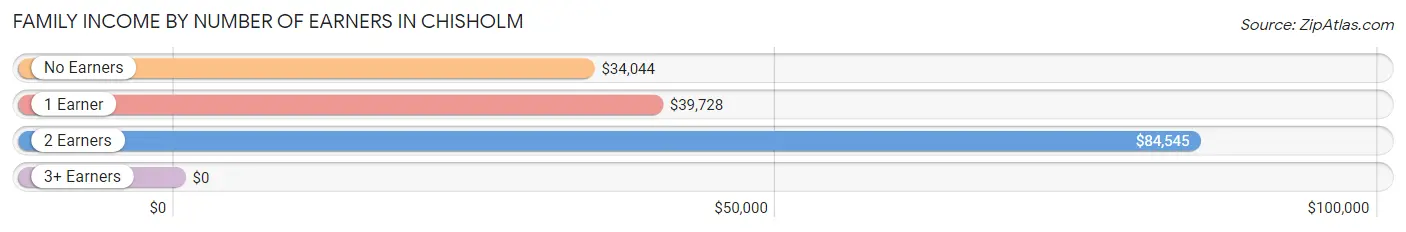
| Number of Earners | # Families | Median Income |
| No Earners | 138 (14.2%) | $34,044 |
| 1 Earner | 489 (50.4%) | $39,728 |
| 2 Earners | 234 (24.1%) | $84,545 |
| 3+ Earners | 110 (11.3%) | $0 |
| Total | 971 (100.0%) | $64,458 |
Household Income in Chisholm
Household Income Brackets in Chisholm
With 294 households falling in the category, the $25,000 to $34,999 income range is the most frequent in Chisholm, accounting for 15.1% of all households. In contrast, only 4 households (0.2%) fall into the $150,000 to $199,999 income bracket, making it the least populous group.
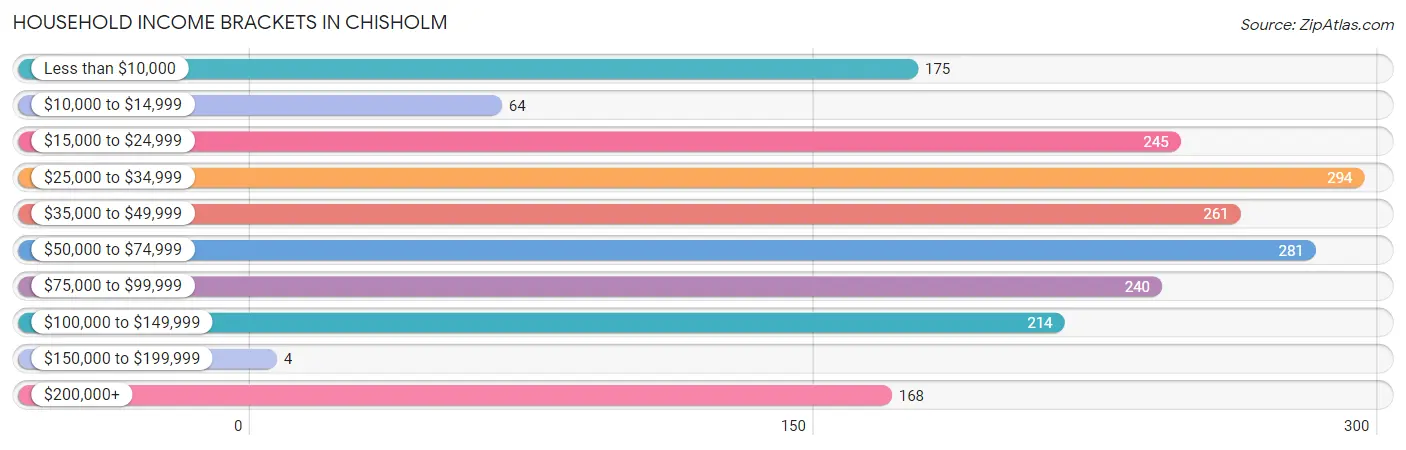
| Income Bracket | # Households | % Households |
| Less than $10,000 | 175 | 9.0% |
| $10,000 to $14,999 | 64 | 3.3% |
| $15,000 to $24,999 | 245 | 12.6% |
| $25,000 to $34,999 | 294 | 15.1% |
| $35,000 to $49,999 | 261 | 13.4% |
| $50,000 to $74,999 | 281 | 14.4% |
| $75,000 to $99,999 | 240 | 12.3% |
| $100,000 to $149,999 | 214 | 11.0% |
| $150,000 to $199,999 | 4 | 0.2% |
| $200,000+ | 168 | 8.6% |
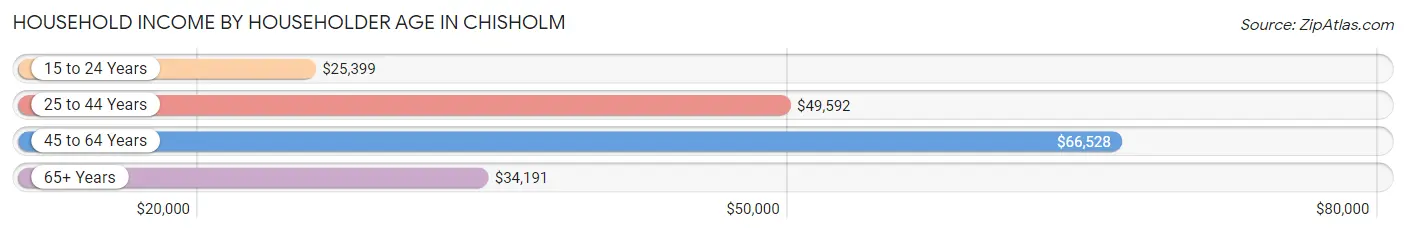
Household Income by Householder Age in Chisholm
The median household income in Chisholm is $47,792, with the highest median household income of $66,528 found in the 45 to 64 years age bracket for the primary householder. A total of 730 households (37.5%) fall into this category. Meanwhile, the 15 to 24 years age bracket for the primary householder has the lowest median household income of $25,399, with 79 households (4.1%) in this group.
| Income Bracket | # Households | Median Income |
| 15 to 24 Years | 79 (4.1%) | $25,399 |
| 25 to 44 Years | 469 (24.1%) | $49,592 |
| 45 to 64 Years | 730 (37.5%) | $66,528 |
| 65+ Years | 670 (34.4%) | $34,191 |
| Total | 1,948 (100.0%) | $47,792 |
Poverty in Chisholm
Income Below Poverty by Sex and Age in Chisholm
With 22.1% poverty level for males and 16.5% for females among the residents of Chisholm, 5 year old males and 5 year old females are the most vulnerable to poverty, with 66 males (85.7%) and 18 females (62.1%) in their respective age groups living below the poverty level.
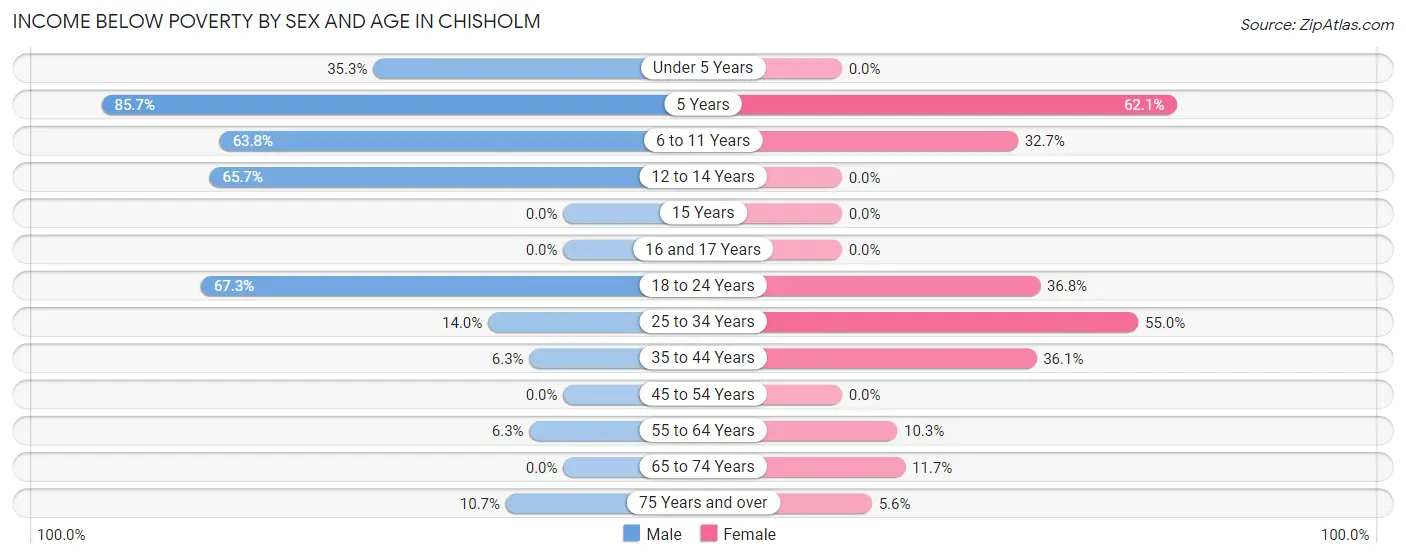
| Age Bracket | Male | Female |
| Under 5 Years | 42 (35.3%) | 0 (0.0%) |
| 5 Years | 66 (85.7%) | 18 (62.1%) |
| 6 to 11 Years | 81 (63.8%) | 32 (32.7%) |
| 12 to 14 Years | 86 (65.6%) | 0 (0.0%) |
| 15 Years | 0 (0.0%) | 0 (0.0%) |
| 16 and 17 Years | 0 (0.0%) | 0 (0.0%) |
| 18 to 24 Years | 150 (67.3%) | 32 (36.8%) |
| 25 to 34 Years | 38 (14.0%) | 121 (55.0%) |
| 35 to 44 Years | 9 (6.3%) | 61 (36.1%) |
| 45 to 54 Years | 0 (0.0%) | 0 (0.0%) |
| 55 to 64 Years | 17 (6.3%) | 43 (10.3%) |
| 65 to 74 Years | 0 (0.0%) | 64 (11.7%) |
| 75 Years and over | 24 (10.7%) | 14 (5.6%) |
| Total | 513 (22.1%) | 385 (16.5%) |
Income Above Poverty by Sex and Age in Chisholm
According to the poverty statistics in Chisholm, males aged 15 years and females aged 12 to 14 years are the age groups that are most secure financially, with 100.0% of males and 100.0% of females in these age groups living above the poverty line.
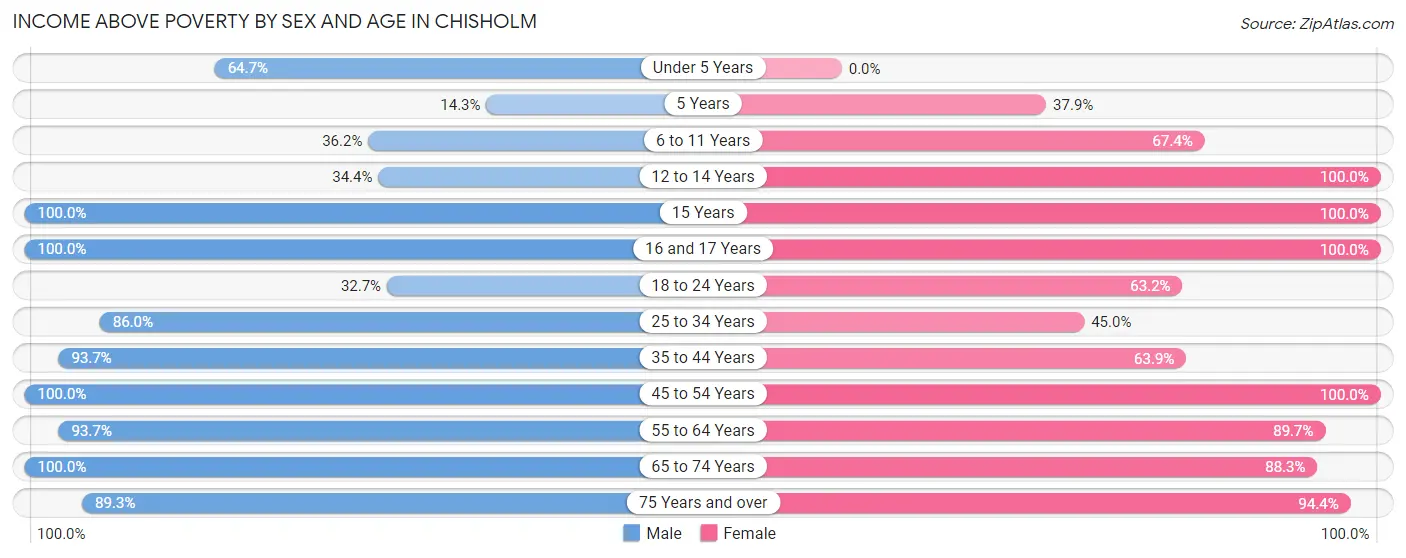
| Age Bracket | Male | Female |
| Under 5 Years | 77 (64.7%) | 0 (0.0%) |
| 5 Years | 11 (14.3%) | 11 (37.9%) |
| 6 to 11 Years | 46 (36.2%) | 66 (67.3%) |
| 12 to 14 Years | 45 (34.4%) | 88 (100.0%) |
| 15 Years | 28 (100.0%) | 57 (100.0%) |
| 16 and 17 Years | 78 (100.0%) | 141 (100.0%) |
| 18 to 24 Years | 73 (32.7%) | 55 (63.2%) |
| 25 to 34 Years | 234 (86.0%) | 99 (45.0%) |
| 35 to 44 Years | 134 (93.7%) | 108 (63.9%) |
| 45 to 54 Years | 283 (100.0%) | 222 (100.0%) |
| 55 to 64 Years | 253 (93.7%) | 376 (89.7%) |
| 65 to 74 Years | 344 (100.0%) | 481 (88.3%) |
| 75 Years and over | 201 (89.3%) | 238 (94.4%) |
| Total | 1,807 (77.9%) | 1,942 (83.5%) |
Income Below Poverty Among Married-Couple Families in Chisholm
The poverty statistics for married-couple families in Chisholm show that 5.1% or 30 of the total 585 families live below the poverty line. Families with no children have the highest poverty rate of 8.1%, comprising of 30 families. On the other hand, families with 1 or 2 children have the lowest poverty rate of 0.0%, which includes 0 families.
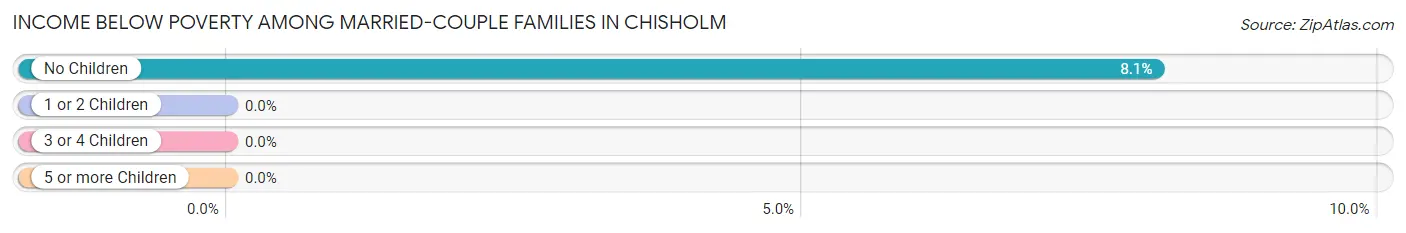
| Children | Above Poverty | Below Poverty |
| No Children | 342 (91.9%) | 30 (8.1%) |
| 1 or 2 Children | 180 (100.0%) | 0 (0.0%) |
| 3 or 4 Children | 10 (100.0%) | 0 (0.0%) |
| 5 or more Children | 23 (100.0%) | 0 (0.0%) |
| Total | 555 (94.9%) | 30 (5.1%) |
Income Below Poverty Among Single-Parent Households in Chisholm
According to the poverty data in Chisholm, 30.3% or 20 single-father households and 44.7% or 143 single-mother households are living below the poverty line. Among single-father households, those with 3 or 4 children have the highest poverty rate, with 20 households (46.5%) experiencing poverty. Likewise, among single-mother households, those with 3 or 4 children have the highest poverty rate, with 67 households (100.0%) falling below the poverty line.
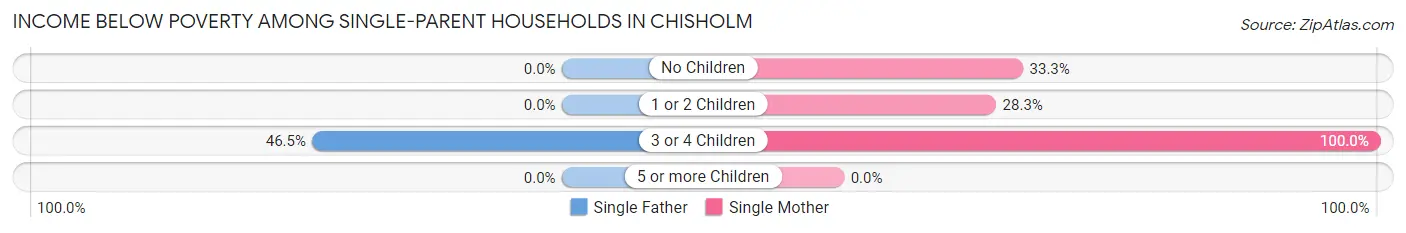
| Children | Single Father | Single Mother |
| No Children | 0 (0.0%) | 29 (33.3%) |
| 1 or 2 Children | 0 (0.0%) | 47 (28.3%) |
| 3 or 4 Children | 20 (46.5%) | 67 (100.0%) |
| 5 or more Children | 0 (0.0%) | 0 (0.0%) |
| Total | 20 (30.3%) | 143 (44.7%) |
Income Below Poverty Among Married-Couple vs Single-Parent Households in Chisholm
The poverty data for Chisholm shows that 30 of the married-couple family households (5.1%) and 163 of the single-parent households (42.2%) are living below the poverty level. Within the married-couple family households, those with no children have the highest poverty rate, with 30 households (8.1%) falling below the poverty line. Among the single-parent households, those with 3 or 4 children have the highest poverty rate, with 87 household (79.1%) living below poverty.
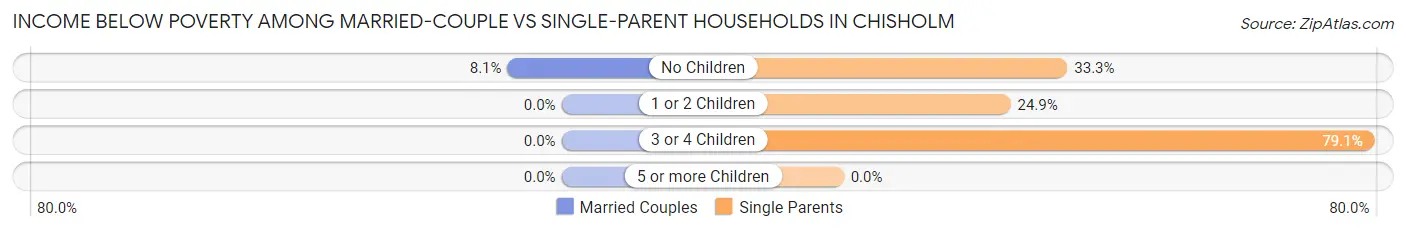
| Children | Married-Couple Families | Single-Parent Households |
| No Children | 30 (8.1%) | 29 (33.3%) |
| 1 or 2 Children | 0 (0.0%) | 47 (24.9%) |
| 3 or 4 Children | 0 (0.0%) | 87 (79.1%) |
| 5 or more Children | 0 (0.0%) | 0 (0.0%) |
| Total | 30 (5.1%) | 163 (42.2%) |
Race in Chisholm
The most populous races in Chisholm are White / Caucasian (4,576 | 96.2%), Two or more Races (115 | 2.4%), and Black / African American (41 | 0.9%).
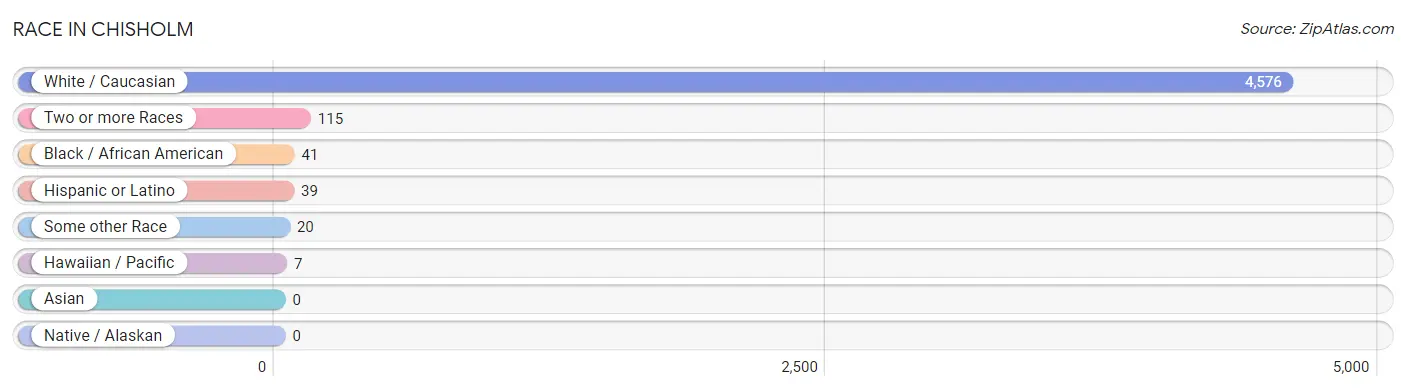
| Race | # Population | % Population |
| Asian | 0 | 0.0% |
| Black / African American | 41 | 0.9% |
| Hawaiian / Pacific | 7 | 0.2% |
| Hispanic or Latino | 39 | 0.8% |
| Native / Alaskan | 0 | 0.0% |
| White / Caucasian | 4,576 | 96.2% |
| Two or more Races | 115 | 2.4% |
| Some other Race | 20 | 0.4% |
| Total | 4,759 | 100.0% |
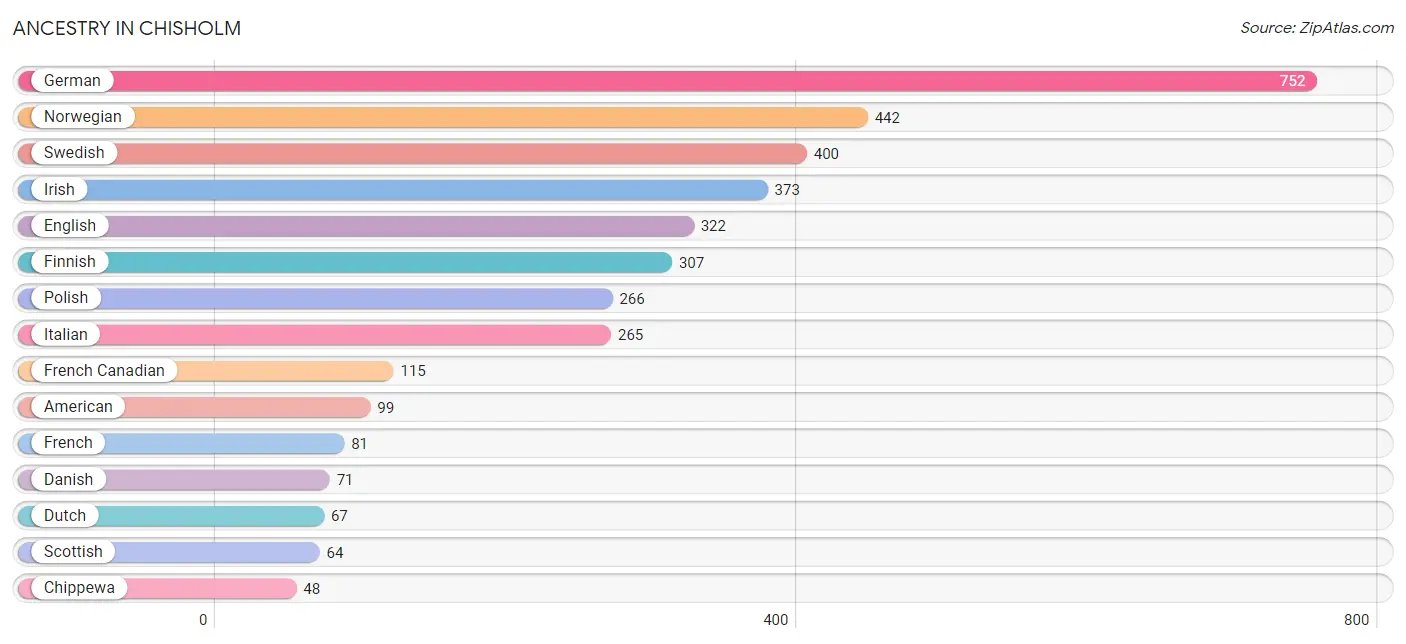
Ancestry in Chisholm
The most populous ancestries reported in Chisholm are German (752 | 15.8%), Norwegian (442 | 9.3%), Swedish (400 | 8.4%), Irish (373 | 7.8%), and English (322 | 6.8%), together accounting for 48.1% of all Chisholm residents.
| Ancestry | # Population | % Population |
| African | 11 | 0.2% |
| American | 99 | 2.1% |
| Austrian | 39 | 0.8% |
| Belgian | 4 | 0.1% |
| Bolivian | 20 | 0.4% |
| British | 19 | 0.4% |
| Canadian | 16 | 0.3% |
| Central American | 19 | 0.4% |
| Cherokee | 13 | 0.3% |
| Chippewa | 48 | 1.0% |
| Croatian | 26 | 0.5% |
| Czech | 13 | 0.3% |
| Danish | 71 | 1.5% |
| Dutch | 67 | 1.4% |
| English | 322 | 6.8% |
| European | 38 | 0.8% |
| Finnish | 307 | 6.5% |
| French | 81 | 1.7% |
| French Canadian | 115 | 2.4% |
| German | 752 | 15.8% |
| Hungarian | 8 | 0.2% |
| Irish | 373 | 7.8% |
| Italian | 265 | 5.6% |
| Northern European | 26 | 0.5% |
| Norwegian | 442 | 9.3% |
| Panamanian | 19 | 0.4% |
| Polish | 266 | 5.6% |
| Russian | 28 | 0.6% |
| Scotch-Irish | 16 | 0.3% |
| Scottish | 64 | 1.3% |
| Serbian | 30 | 0.6% |
| Slovene | 34 | 0.7% |
| South American | 20 | 0.4% |
| Subsaharan African | 11 | 0.2% |
| Swedish | 400 | 8.4% | View All 35 Rows |
Immigrants in Chisholm
The most numerous immigrant groups reported in Chisholm came from , and Canada (19 | 0.4%), together accounting for 0.4% of all Chisholm residents.

| Immigration Origin | # Population | % Population |
| Canada | 19 | 0.4% | View All 1 Rows |
Sex and Age in Chisholm
Sex and Age in Chisholm
The most populous age groups in Chisholm are 50 to 54 Years (230 | 9.7%) for men and 65 to 69 Years (341 | 14.3%) for women.
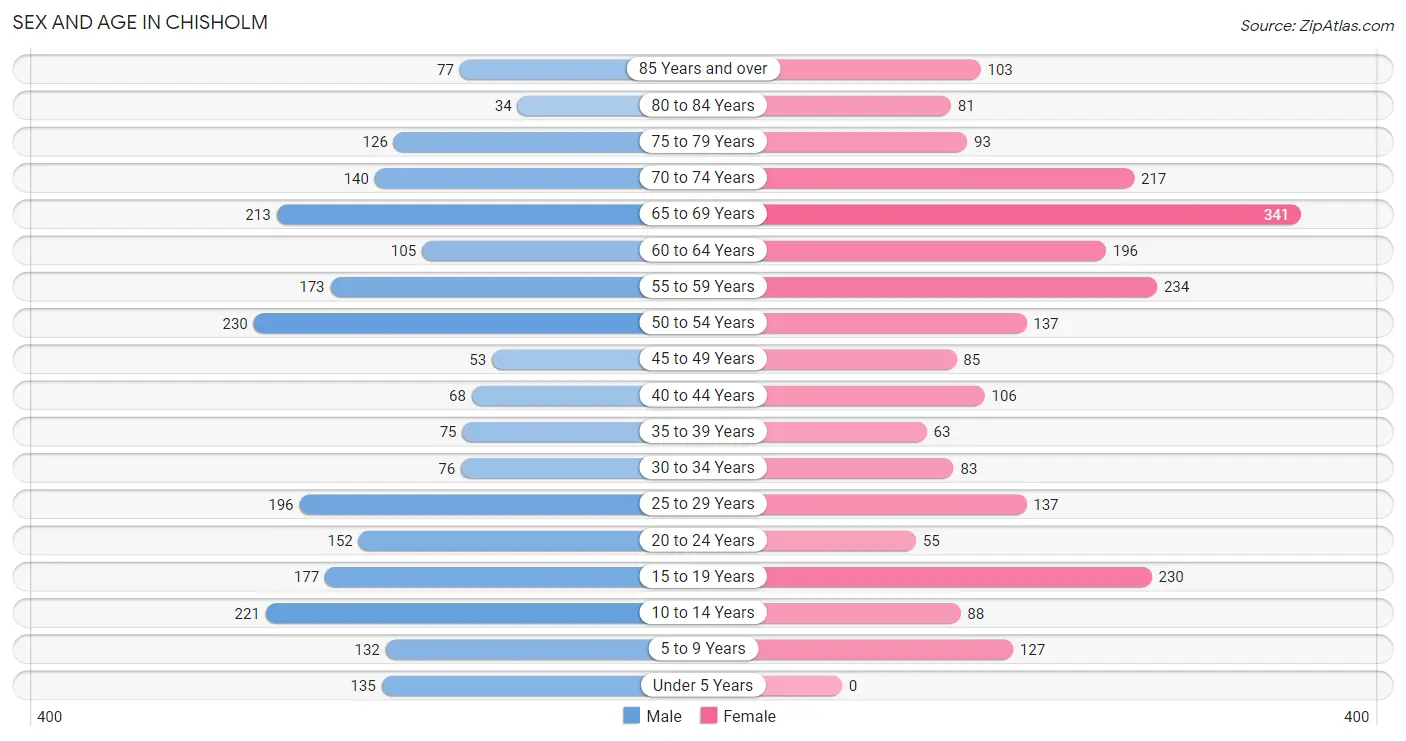
| Age Bracket | Male | Female |
| Under 5 Years | 135 (5.7%) | 0 (0.0%) |
| 5 to 9 Years | 132 (5.5%) | 127 (5.3%) |
| 10 to 14 Years | 221 (9.3%) | 88 (3.7%) |
| 15 to 19 Years | 177 (7.4%) | 230 (9.7%) |
| 20 to 24 Years | 152 (6.4%) | 55 (2.3%) |
| 25 to 29 Years | 196 (8.2%) | 137 (5.8%) |
| 30 to 34 Years | 76 (3.2%) | 83 (3.5%) |
| 35 to 39 Years | 75 (3.2%) | 63 (2.6%) |
| 40 to 44 Years | 68 (2.9%) | 106 (4.5%) |
| 45 to 49 Years | 53 (2.2%) | 85 (3.6%) |
| 50 to 54 Years | 230 (9.7%) | 137 (5.8%) |
| 55 to 59 Years | 173 (7.3%) | 234 (9.9%) |
| 60 to 64 Years | 105 (4.4%) | 196 (8.3%) |
| 65 to 69 Years | 213 (8.9%) | 341 (14.3%) |
| 70 to 74 Years | 140 (5.9%) | 217 (9.1%) |
| 75 to 79 Years | 126 (5.3%) | 93 (3.9%) |
| 80 to 84 Years | 34 (1.4%) | 81 (3.4%) |
| 85 Years and over | 77 (3.2%) | 103 (4.3%) |
| Total | 2,383 (100.0%) | 2,376 (100.0%) |
Families and Households in Chisholm
Median Family Size in Chisholm
The median family size in Chisholm is 3.02 persons per family, with single male/father families (66 | 6.8%) accounting for the largest median family size of 3.71 persons per family. On the other hand, married-couple families (585 | 60.3%) represent the smallest median family size with 2.75 persons per family.
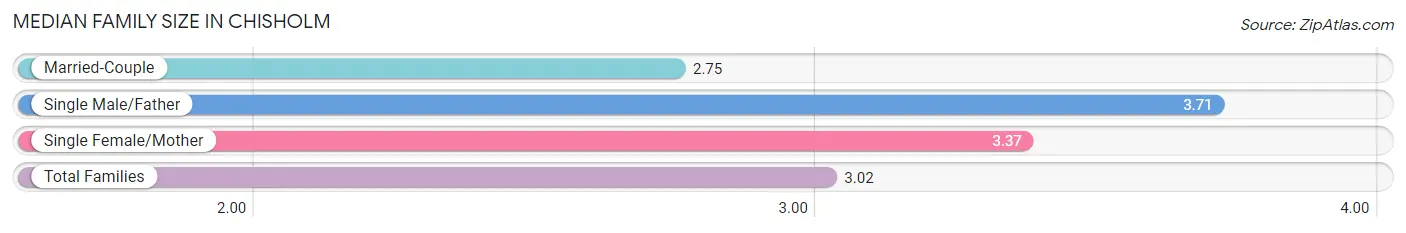
| Family Type | # Families | Family Size |
| Married-Couple | 585 (60.3%) | 2.75 |
| Single Male/Father | 66 (6.8%) | 3.71 |
| Single Female/Mother | 320 (33.0%) | 3.37 |
| Total Families | 971 (100.0%) | 3.02 |
Median Household Size in Chisholm
The median household size in Chisholm is 2.37 persons per household, with single female/mother households (320 | 16.4%) accounting for the largest median household size of 4.72 persons per household. non-family households (977 | 50.1%) represent the smallest median household size with 1.21 persons per household.
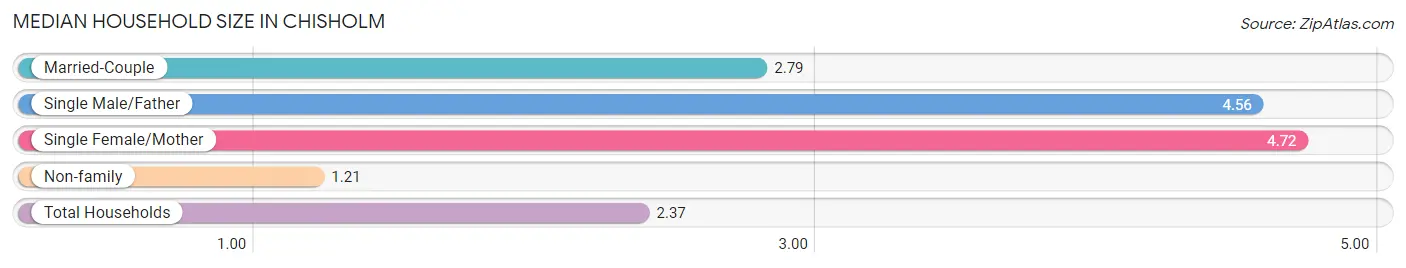
| Household Type | # Households | Household Size |
| Married-Couple | 585 (30.0%) | 2.79 |
| Single Male/Father | 66 (3.4%) | 4.56 |
| Single Female/Mother | 320 (16.4%) | 4.72 |
| Non-family | 977 (50.1%) | 1.21 |
| Total Households | 1,948 (100.0%) | 2.37 |
Household Size by Marriage Status in Chisholm
Out of a total of 1,948 households in Chisholm, 971 (49.8%) are family households, while 977 (50.1%) are nonfamily households. The most numerous type of family households are 2-person households, comprising 363, and the most common type of nonfamily households are 1-person households, comprising 818.
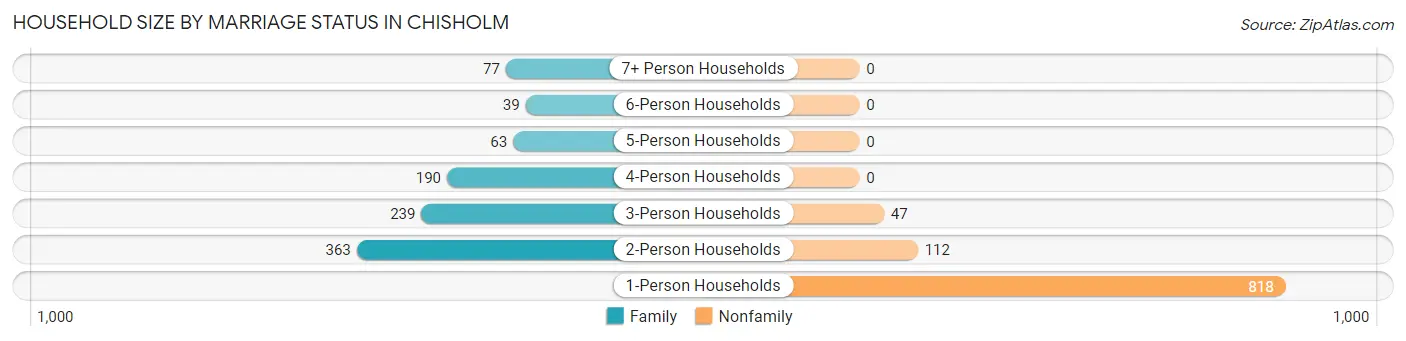
| Household Size | Family Households | Nonfamily Households |
| 1-Person Households | - | 818 (42.0%) |
| 2-Person Households | 363 (18.6%) | 112 (5.8%) |
| 3-Person Households | 239 (12.3%) | 47 (2.4%) |
| 4-Person Households | 190 (9.8%) | 0 (0.0%) |
| 5-Person Households | 63 (3.2%) | 0 (0.0%) |
| 6-Person Households | 39 (2.0%) | 0 (0.0%) |
| 7+ Person Households | 77 (4.0%) | 0 (0.0%) |
| Total | 971 (49.8%) | 977 (50.1%) |
Female Fertility in Chisholm
Fertility by Age in Chisholm
Average fertility rate in Chisholm is 42.0 births per 1,000 women. Women in the age bracket of 20 to 34 years have the highest fertility rate with 65.0 births per 1,000 women. Women in the age bracket of 20 to 34 years acount for 56.2% of all women with births.
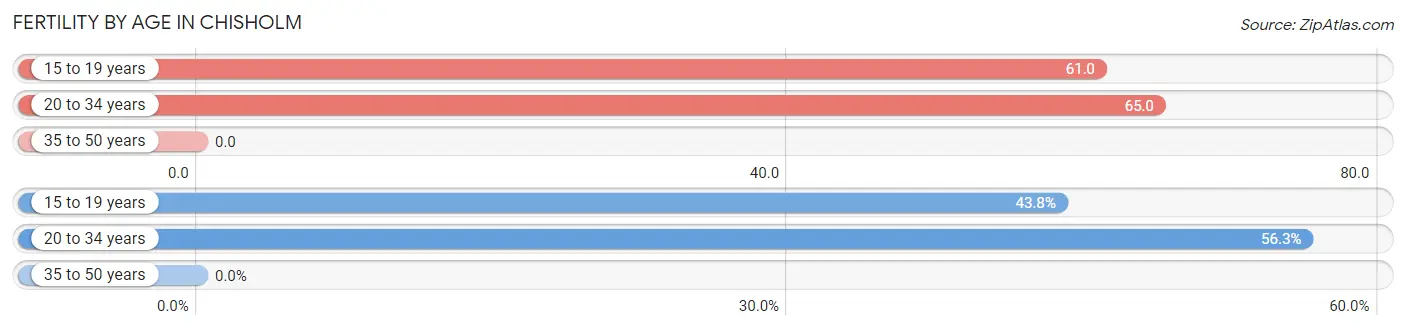
| Age Bracket | Women with Births | Births / 1,000 Women |
| 15 to 19 years | 14 (43.8%) | 61.0 |
| 20 to 34 years | 18 (56.2%) | 65.0 |
| 35 to 50 years | 0 (0.0%) | 0.0 |
| Total | 32 (100.0%) | 42.0 |
Fertility by Age by Marriage Status in Chisholm
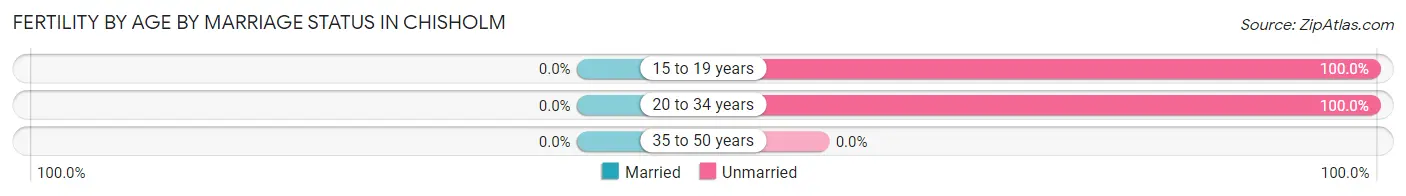
| Age Bracket | Married | Unmarried |
| 15 to 19 years | 0 (0.0%) | 14 (100.0%) |
| 20 to 34 years | 0 (0.0%) | 18 (100.0%) |
| 35 to 50 years | 0 (0.0%) | 0 (0.0%) |
| Total | 0 (0.0%) | 32 (100.0%) |
Fertility by Education in Chisholm
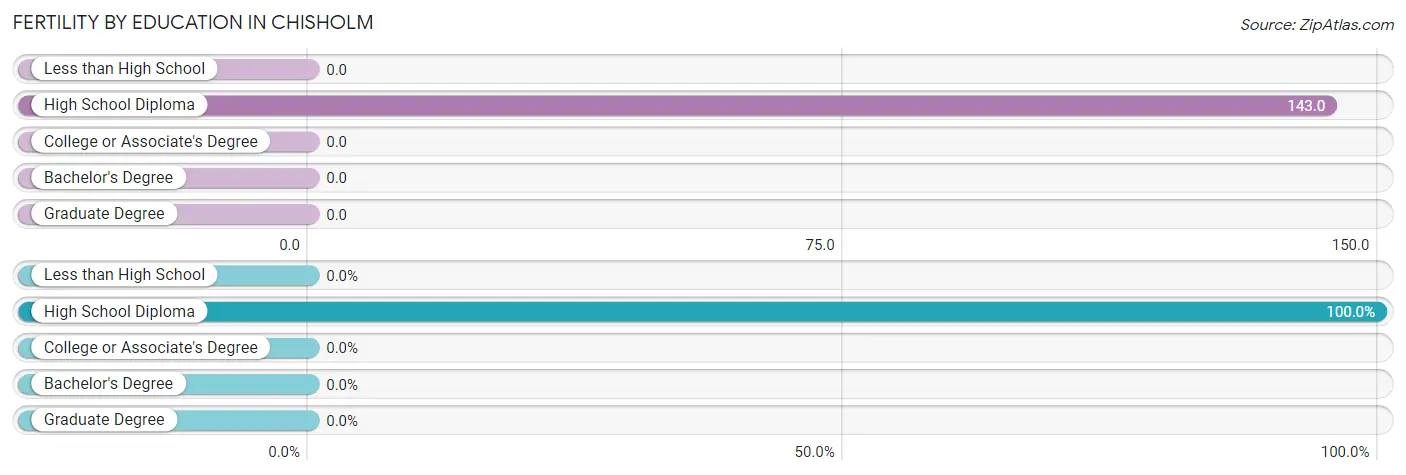
| Educational Attainment | Women with Births | Births / 1,000 Women |
| Less than High School | 0 (0.0%) | 0.0 |
| High School Diploma | 32 (100.0%) | 143.0 |
| College or Associate's Degree | 0 (0.0%) | 0.0 |
| Bachelor's Degree | 0 (0.0%) | 0.0 |
| Graduate Degree | 0 (0.0%) | 0.0 |
| Total | 32 (100.0%) | 42.0 |
Fertility by Education by Marriage Status in Chisholm
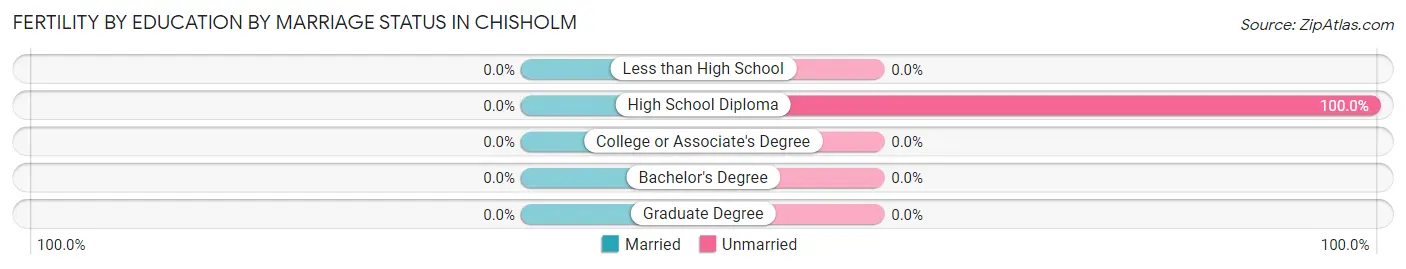
| Educational Attainment | Married | Unmarried |
| Less than High School | 0 (0.0%) | 0 (0.0%) |
| High School Diploma | 0 (0.0%) | 32 (100.0%) |
| College or Associate's Degree | 0 (0.0%) | 0 (0.0%) |
| Bachelor's Degree | 0 (0.0%) | 0 (0.0%) |
| Graduate Degree | 0 (0.0%) | 0 (0.0%) |
| Total | 0 (0.0%) | 32 (100.0%) |
Employment Characteristics in Chisholm
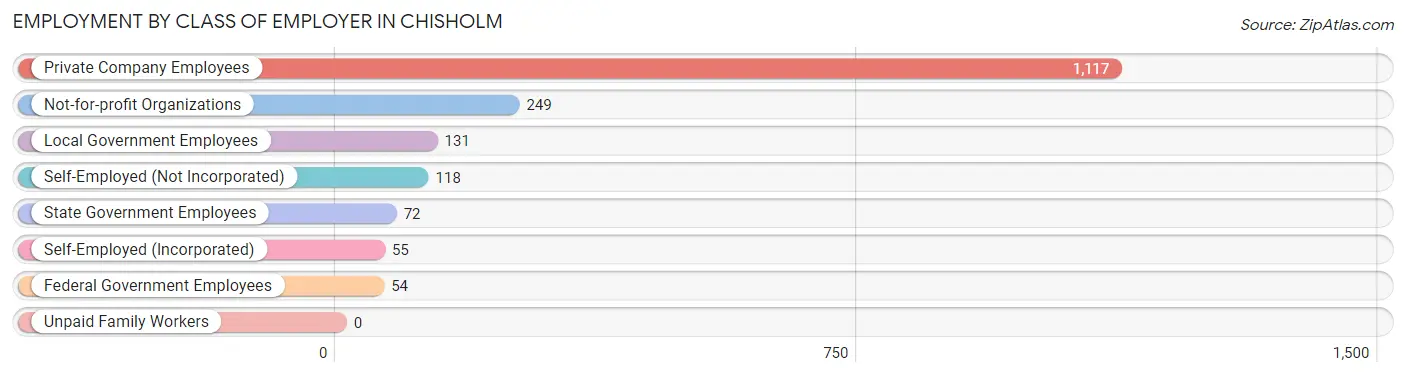
Employment by Class of Employer in Chisholm
Among the 1,796 employed individuals in Chisholm, private company employees (1,117 | 62.2%), not-for-profit organizations (249 | 13.9%), and local government employees (131 | 7.3%) make up the most common classes of employment.
| Employer Class | # Employees | % Employees |
| Private Company Employees | 1,117 | 62.2% |
| Self-Employed (Incorporated) | 55 | 3.1% |
| Self-Employed (Not Incorporated) | 118 | 6.6% |
| Not-for-profit Organizations | 249 | 13.9% |
| Local Government Employees | 131 | 7.3% |
| State Government Employees | 72 | 4.0% |
| Federal Government Employees | 54 | 3.0% |
| Unpaid Family Workers | 0 | 0.0% |
| Total | 1,796 | 100.0% |
Employment Status by Age in Chisholm
According to the labor force statistics for Chisholm, out of the total population over 16 years of age (3,971), 50.6% or 2,009 individuals are in the labor force, with 5.7% or 115 of them unemployed. The age group with the highest labor force participation rate is 30 to 34 years, with 100.0% or 159 individuals in the labor force. Within the labor force, the 30 to 34 years age range has the highest percentage of unemployed individuals, with 30.2% or 48 of them being unemployed.
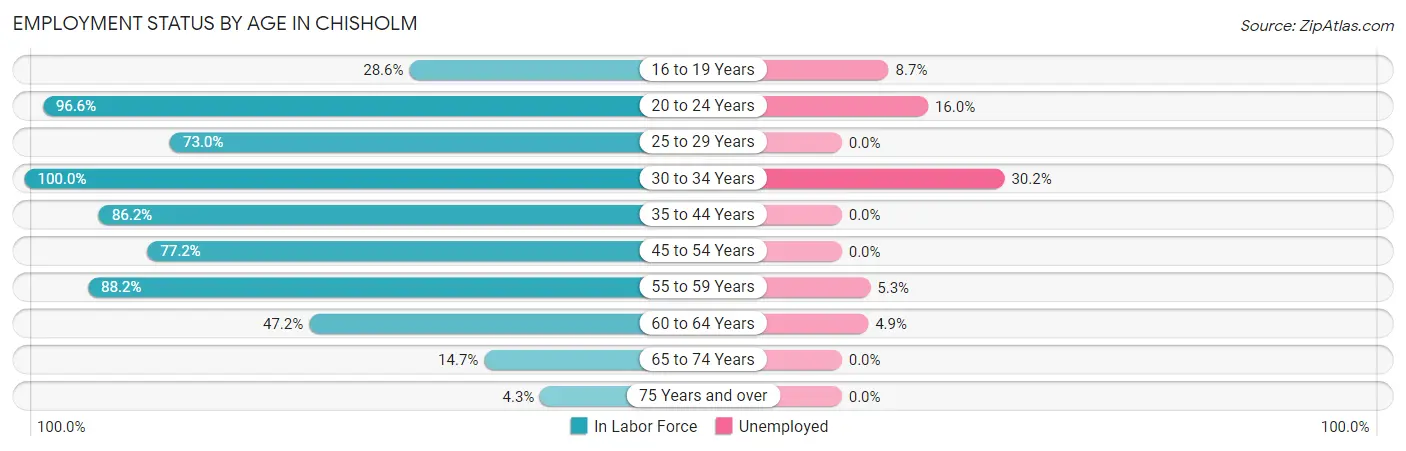
| Age Bracket | In Labor Force | Unemployed |
| 16 to 19 Years | 92 (28.6%) | 8 (8.7%) |
| 20 to 24 Years | 200 (96.6%) | 32 (16.0%) |
| 25 to 29 Years | 243 (73.0%) | 0 (0.0%) |
| 30 to 34 Years | 159 (100.0%) | 48 (30.2%) |
| 35 to 44 Years | 269 (86.2%) | 0 (0.0%) |
| 45 to 54 Years | 390 (77.2%) | 0 (0.0%) |
| 55 to 59 Years | 359 (88.2%) | 19 (5.3%) |
| 60 to 64 Years | 142 (47.2%) | 7 (4.9%) |
| 65 to 74 Years | 134 (14.7%) | 0 (0.0%) |
| 75 Years and over | 22 (4.3%) | 0 (0.0%) |
| Total | 2,009 (50.6%) | 115 (5.7%) |
Employment Status by Educational Attainment in Chisholm
According to labor force statistics for Chisholm, 77.4% of individuals (1,561) out of the total population between 25 and 64 years of age (2,017) are in the labor force, with 4.7% or 73 of them being unemployed. The group with the highest labor force participation rate are those with the educational attainment of less than high school, with 100.0% or 105 individuals in the labor force. Within the labor force, individuals with less than high school education have the highest percentage of unemployment, with 45.7% or 48 of them being unemployed.
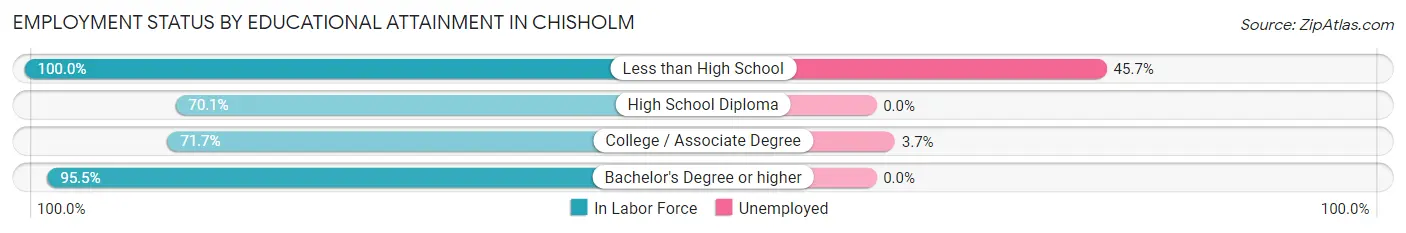
| Educational Attainment | In Labor Force | Unemployed |
| Less than High School | 105 (100.0%) | 48 (45.7%) |
| High School Diploma | 365 (70.1%) | 0 (0.0%) |
| College / Associate Degree | 711 (71.7%) | 37 (3.7%) |
| Bachelor's Degree or higher | 381 (95.5%) | 0 (0.0%) |
| Total | 1,561 (77.4%) | 95 (4.7%) |
Employment Occupations by Sex in Chisholm
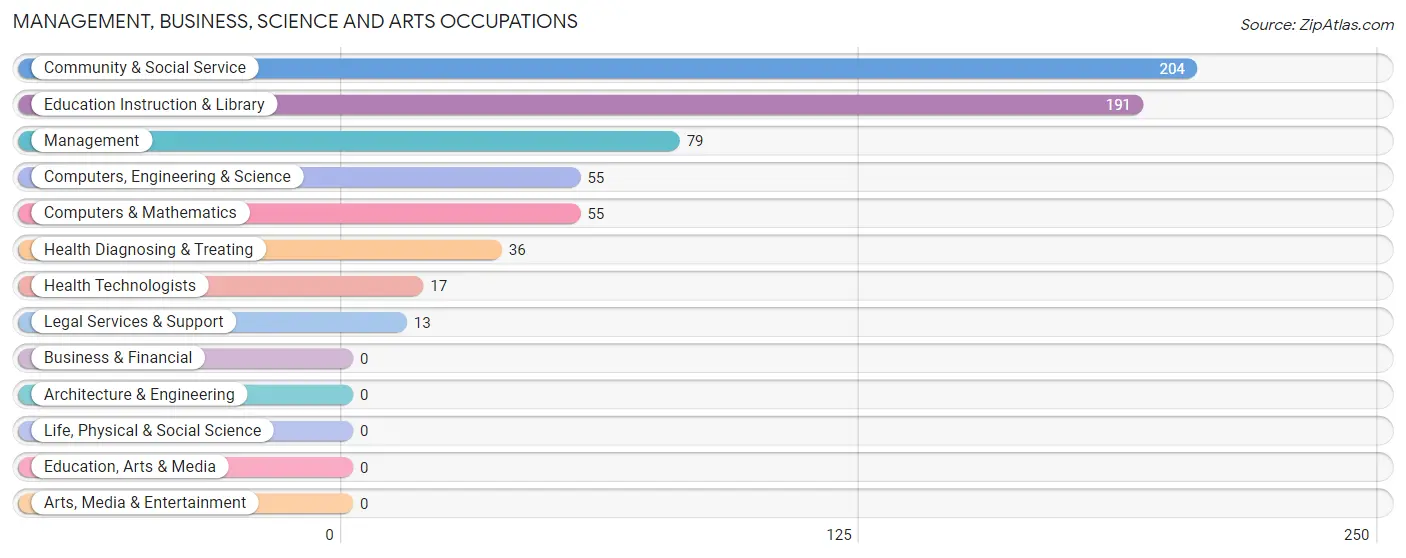
Management, Business, Science and Arts Occupations
The most common Management, Business, Science and Arts occupations in Chisholm are Community & Social Service (204 | 10.8%), Education Instruction & Library (191 | 10.1%), Management (79 | 4.2%), Computers, Engineering & Science (55 | 2.9%), and Computers & Mathematics (55 | 2.9%).
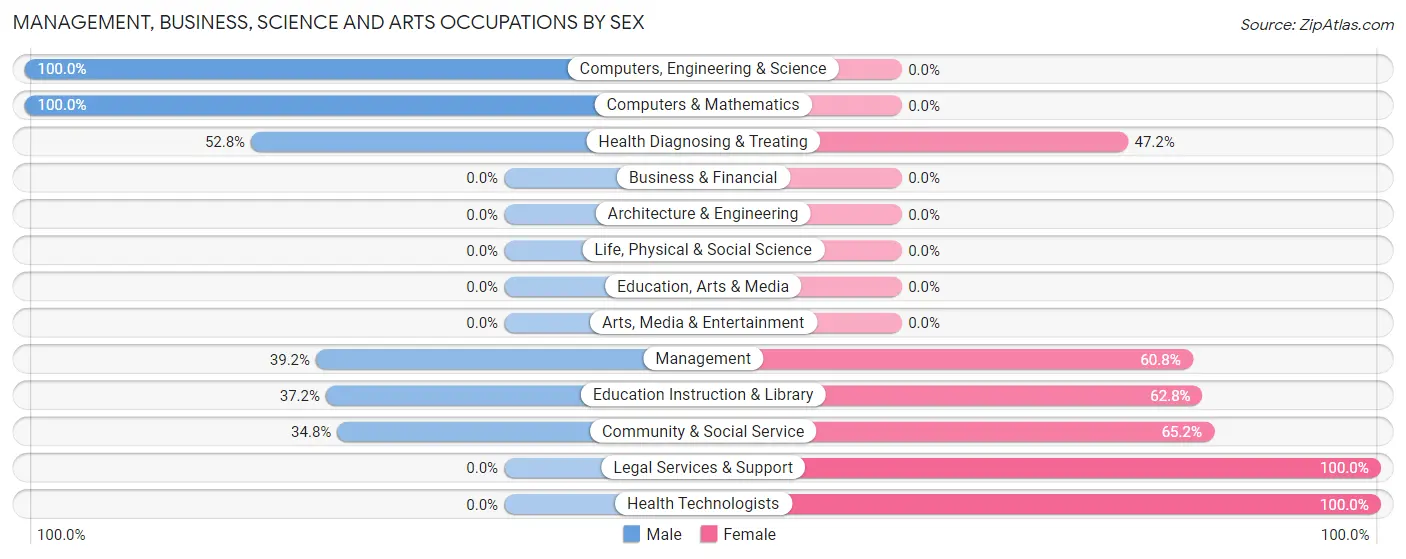
Management, Business, Science and Arts Occupations by Sex
Within the Management, Business, Science and Arts occupations in Chisholm, the most male-oriented occupations are Computers, Engineering & Science (100.0%), Computers & Mathematics (100.0%), and Health Diagnosing & Treating (52.8%), while the most female-oriented occupations are Legal Services & Support (100.0%), Health Technologists (100.0%), and Community & Social Service (65.2%).
| Occupation | Male | Female |
| Management | 31 (39.2%) | 48 (60.8%) |
| Business & Financial | 0 (0.0%) | 0 (0.0%) |
| Computers, Engineering & Science | 55 (100.0%) | 0 (0.0%) |
| Computers & Mathematics | 55 (100.0%) | 0 (0.0%) |
| Architecture & Engineering | 0 (0.0%) | 0 (0.0%) |
| Life, Physical & Social Science | 0 (0.0%) | 0 (0.0%) |
| Community & Social Service | 71 (34.8%) | 133 (65.2%) |
| Education, Arts & Media | 0 (0.0%) | 0 (0.0%) |
| Legal Services & Support | 0 (0.0%) | 13 (100.0%) |
| Education Instruction & Library | 71 (37.2%) | 120 (62.8%) |
| Arts, Media & Entertainment | 0 (0.0%) | 0 (0.0%) |
| Health Diagnosing & Treating | 19 (52.8%) | 17 (47.2%) |
| Health Technologists | 0 (0.0%) | 17 (100.0%) |
| Total (Category) | 176 (47.1%) | 198 (52.9%) |
| Total (Overall) | 1,004 (52.9%) | 892 (47.0%) |
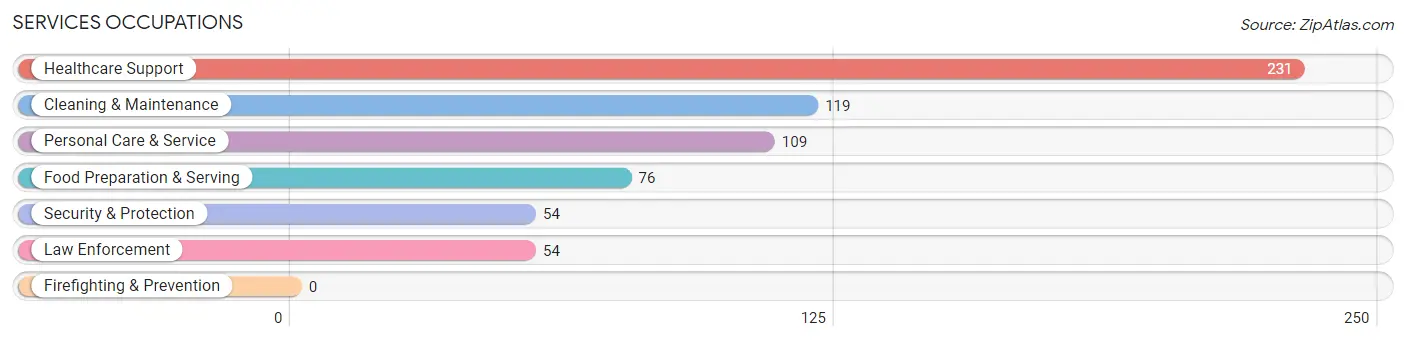
Services Occupations
The most common Services occupations in Chisholm are Healthcare Support (231 | 12.2%), Cleaning & Maintenance (119 | 6.3%), Personal Care & Service (109 | 5.8%), Food Preparation & Serving (76 | 4.0%), and Security & Protection (54 | 2.9%).
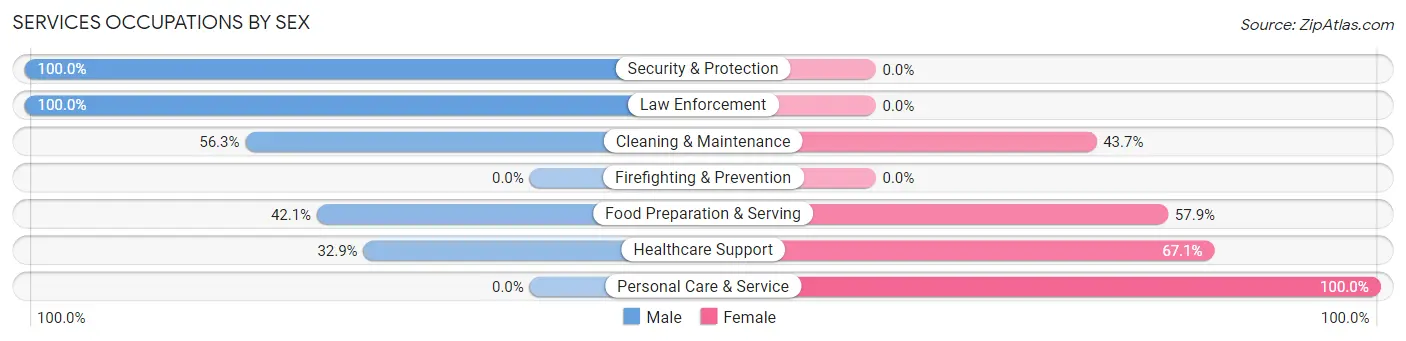
Services Occupations by Sex
Within the Services occupations in Chisholm, the most male-oriented occupations are Security & Protection (100.0%), Law Enforcement (100.0%), and Cleaning & Maintenance (56.3%), while the most female-oriented occupations are Personal Care & Service (100.0%), Healthcare Support (67.1%), and Food Preparation & Serving (57.9%).
| Occupation | Male | Female |
| Healthcare Support | 76 (32.9%) | 155 (67.1%) |
| Security & Protection | 54 (100.0%) | 0 (0.0%) |
| Firefighting & Prevention | 0 (0.0%) | 0 (0.0%) |
| Law Enforcement | 54 (100.0%) | 0 (0.0%) |
| Food Preparation & Serving | 32 (42.1%) | 44 (57.9%) |
| Cleaning & Maintenance | 67 (56.3%) | 52 (43.7%) |
| Personal Care & Service | 0 (0.0%) | 109 (100.0%) |
| Total (Category) | 229 (38.9%) | 360 (61.1%) |
| Total (Overall) | 1,004 (52.9%) | 892 (47.0%) |
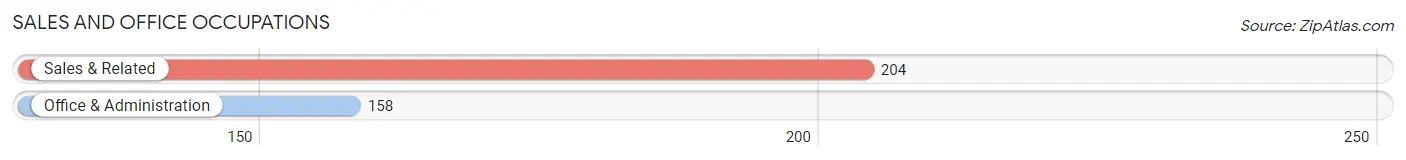
Sales and Office Occupations
The most common Sales and Office occupations in Chisholm are Sales & Related (204 | 10.8%), and Office & Administration (158 | 8.3%).
Sales and Office Occupations by Sex
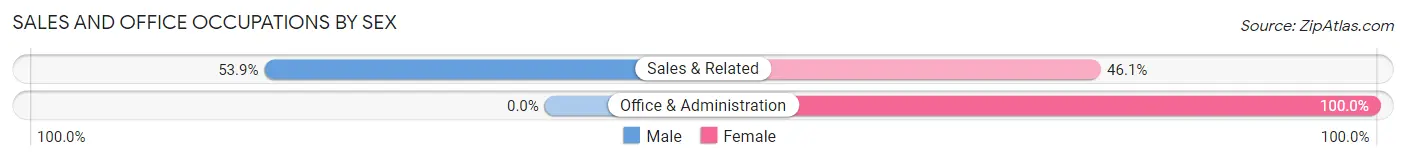
| Occupation | Male | Female |
| Sales & Related | 110 (53.9%) | 94 (46.1%) |
| Office & Administration | 0 (0.0%) | 158 (100.0%) |
| Total (Category) | 110 (30.4%) | 252 (69.6%) |
| Total (Overall) | 1,004 (52.9%) | 892 (47.0%) |
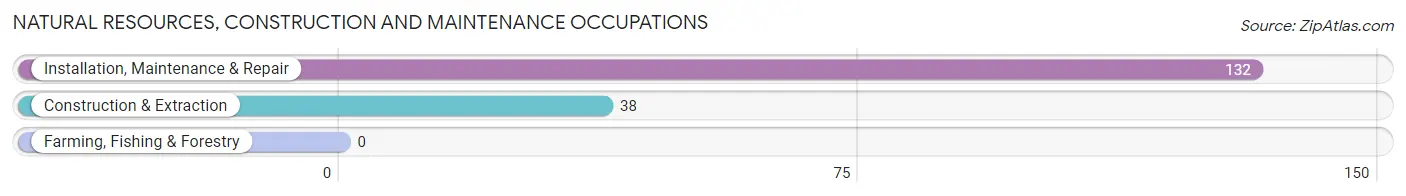
Natural Resources, Construction and Maintenance Occupations
The most common Natural Resources, Construction and Maintenance occupations in Chisholm are Installation, Maintenance & Repair (132 | 7.0%), and Construction & Extraction (38 | 2.0%).
Natural Resources, Construction and Maintenance Occupations by Sex
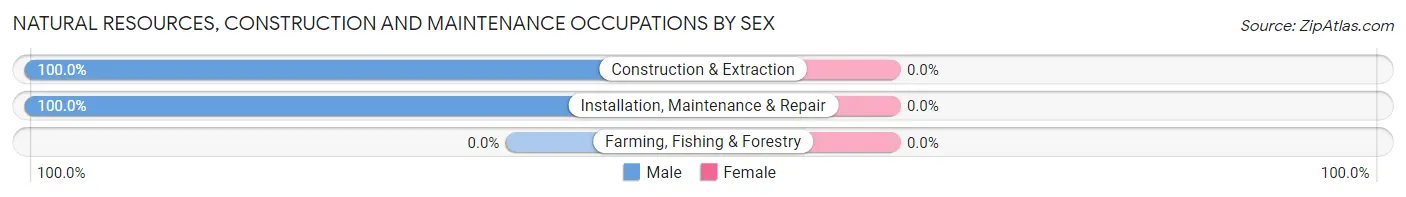
| Occupation | Male | Female |
| Farming, Fishing & Forestry | 0 (0.0%) | 0 (0.0%) |
| Construction & Extraction | 38 (100.0%) | 0 (0.0%) |
| Installation, Maintenance & Repair | 132 (100.0%) | 0 (0.0%) |
| Total (Category) | 170 (100.0%) | 0 (0.0%) |
| Total (Overall) | 1,004 (52.9%) | 892 (47.0%) |
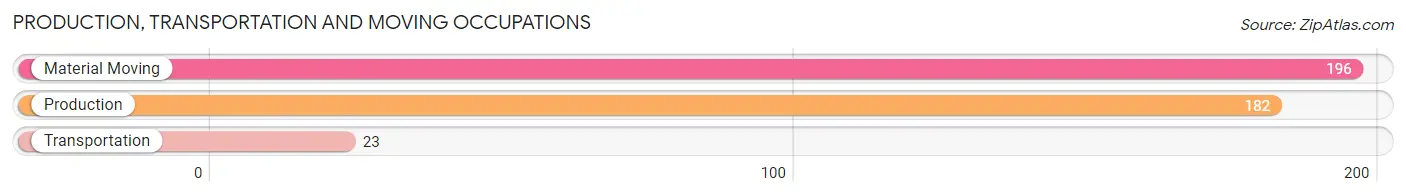
Production, Transportation and Moving Occupations
The most common Production, Transportation and Moving occupations in Chisholm are Material Moving (196 | 10.3%), Production (182 | 9.6%), and Transportation (23 | 1.2%).
Production, Transportation and Moving Occupations by Sex
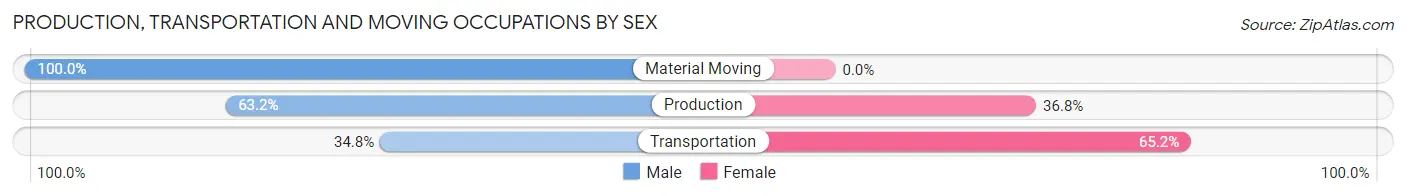
| Occupation | Male | Female |
| Production | 115 (63.2%) | 67 (36.8%) |
| Transportation | 8 (34.8%) | 15 (65.2%) |
| Material Moving | 196 (100.0%) | 0 (0.0%) |
| Total (Category) | 319 (79.5%) | 82 (20.4%) |
| Total (Overall) | 1,004 (52.9%) | 892 (47.0%) |
Employment Industries by Sex in Chisholm
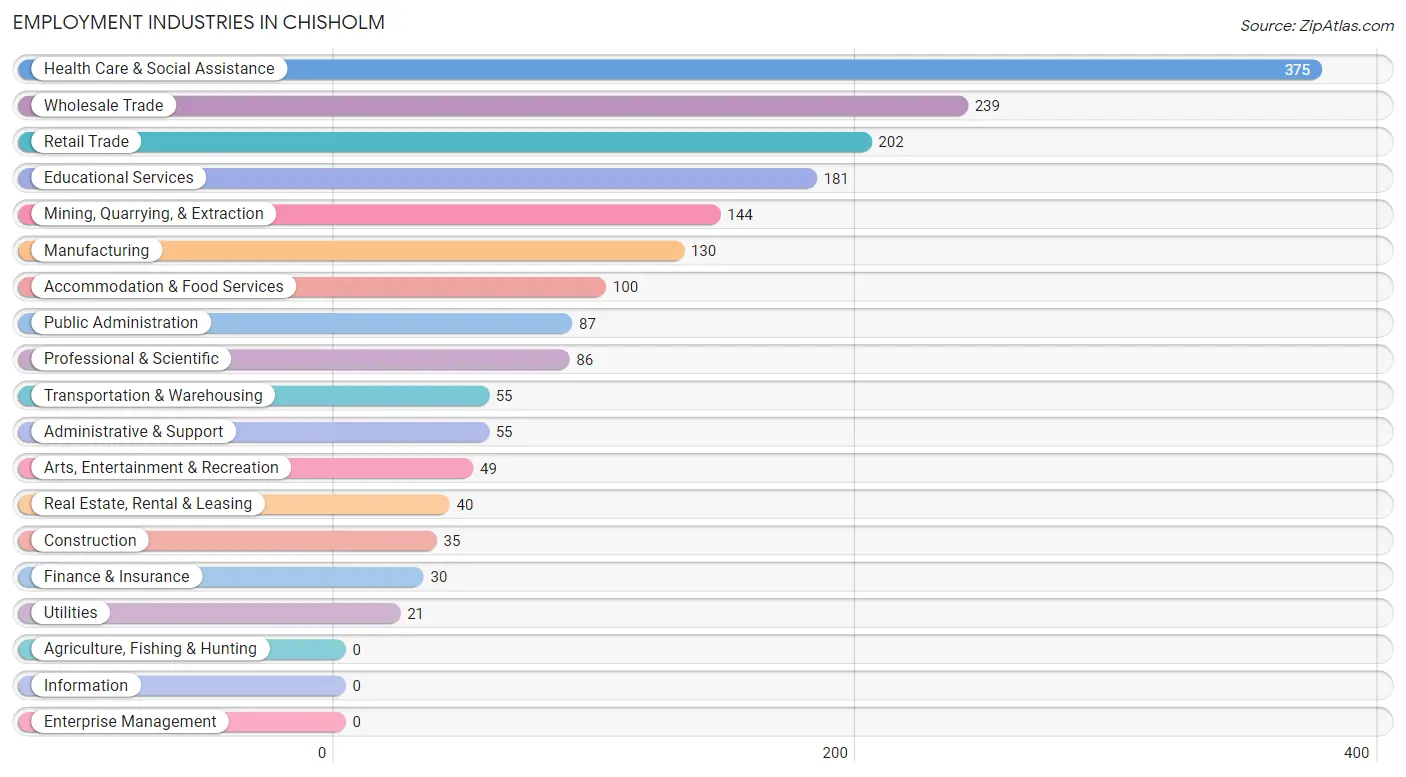
Employment Industries in Chisholm
The major employment industries in Chisholm include Health Care & Social Assistance (375 | 19.8%), Wholesale Trade (239 | 12.6%), Retail Trade (202 | 10.6%), Educational Services (181 | 9.6%), and Mining, Quarrying, & Extraction (144 | 7.6%).
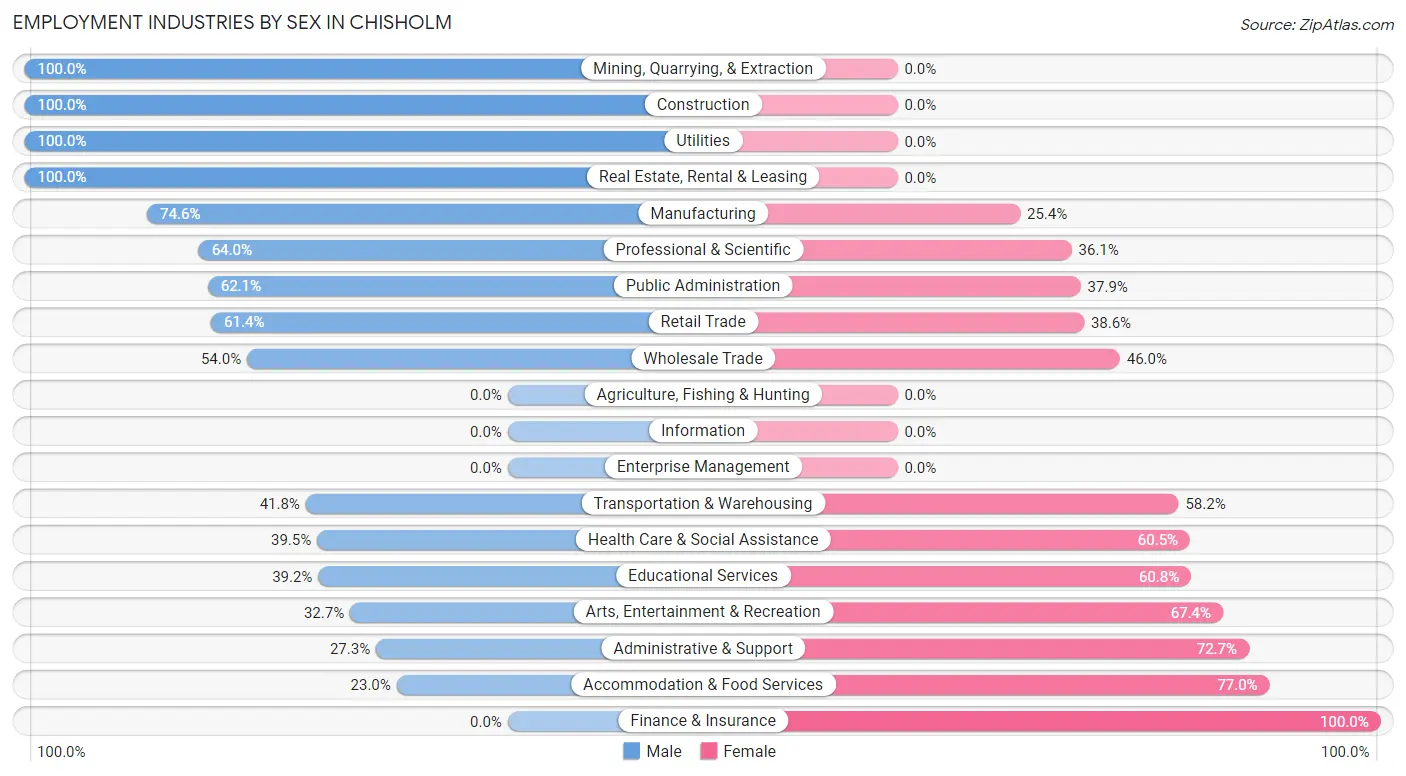
Employment Industries by Sex in Chisholm
The Chisholm industries that see more men than women are Mining, Quarrying, & Extraction (100.0%), Construction (100.0%), and Utilities (100.0%), whereas the industries that tend to have a higher number of women are Finance & Insurance (100.0%), Accommodation & Food Services (77.0%), and Administrative & Support (72.7%).
| Industry | Male | Female |
| Agriculture, Fishing & Hunting | 0 (0.0%) | 0 (0.0%) |
| Mining, Quarrying, & Extraction | 144 (100.0%) | 0 (0.0%) |
| Construction | 35 (100.0%) | 0 (0.0%) |
| Manufacturing | 97 (74.6%) | 33 (25.4%) |
| Wholesale Trade | 129 (54.0%) | 110 (46.0%) |
| Retail Trade | 124 (61.4%) | 78 (38.6%) |
| Transportation & Warehousing | 23 (41.8%) | 32 (58.2%) |
| Utilities | 21 (100.0%) | 0 (0.0%) |
| Information | 0 (0.0%) | 0 (0.0%) |
| Finance & Insurance | 0 (0.0%) | 30 (100.0%) |
| Real Estate, Rental & Leasing | 40 (100.0%) | 0 (0.0%) |
| Professional & Scientific | 55 (63.9%) | 31 (36.0%) |
| Enterprise Management | 0 (0.0%) | 0 (0.0%) |
| Administrative & Support | 15 (27.3%) | 40 (72.7%) |
| Educational Services | 71 (39.2%) | 110 (60.8%) |
| Health Care & Social Assistance | 148 (39.5%) | 227 (60.5%) |
| Arts, Entertainment & Recreation | 16 (32.7%) | 33 (67.3%) |
| Accommodation & Food Services | 23 (23.0%) | 77 (77.0%) |
| Public Administration | 54 (62.1%) | 33 (37.9%) |
| Total | 1,004 (52.9%) | 892 (47.0%) |
Education in Chisholm
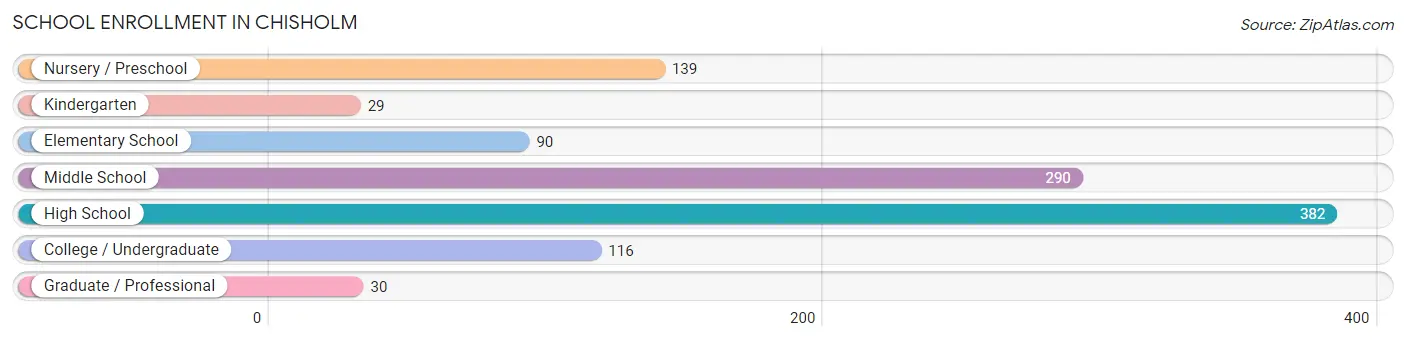
School Enrollment in Chisholm
The most common levels of schooling among the 1,076 students in Chisholm are high school (382 | 35.5%), middle school (290 | 27.0%), and nursery / preschool (139 | 12.9%).
| School Level | # Students | % Students |
| Nursery / Preschool | 139 | 12.9% |
| Kindergarten | 29 | 2.7% |
| Elementary School | 90 | 8.4% |
| Middle School | 290 | 27.0% |
| High School | 382 | 35.5% |
| College / Undergraduate | 116 | 10.8% |
| Graduate / Professional | 30 | 2.8% |
| Total | 1,076 | 100.0% |
School Enrollment by Age by Funding Source in Chisholm
Out of a total of 1,076 students who are enrolled in schools in Chisholm, 41 (3.8%) attend a private institution, while the remaining 1,035 (96.2%) are enrolled in public schools. The age group of 35 years and over has the highest likelihood of being enrolled in private schools, with 19 (27.1% in the age bracket) enrolled. Conversely, the age group of 3 to 4 year olds has the lowest likelihood of being enrolled in a private school, with 44 (100.0% in the age bracket) attending a public institution.
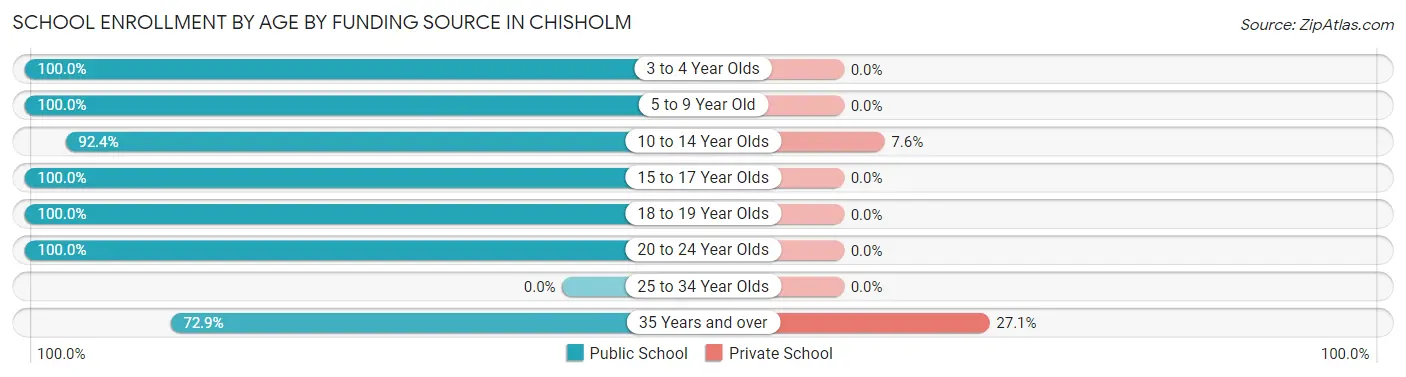
| Age Bracket | Public School | Private School |
| 3 to 4 Year Olds | 44 (100.0%) | 0 (0.0%) |
| 5 to 9 Year Old | 214 (100.0%) | 0 (0.0%) |
| 10 to 14 Year Olds | 268 (92.4%) | 22 (7.6%) |
| 15 to 17 Year Olds | 304 (100.0%) | 0 (0.0%) |
| 18 to 19 Year Olds | 103 (100.0%) | 0 (0.0%) |
| 20 to 24 Year Olds | 51 (100.0%) | 0 (0.0%) |
| 25 to 34 Year Olds | 0 (0.0%) | 0 (0.0%) |
| 35 Years and over | 51 (72.9%) | 19 (27.1%) |
| Total | 1,035 (96.2%) | 41 (3.8%) |
Educational Attainment by Field of Study in Chisholm
Education (174 | 27.8%), business (84 | 13.4%), visual & performing arts (78 | 12.5%), bio, nature & agricultural (54 | 8.6%), and science & technology (52 | 8.3%) are the most common fields of study among 626 individuals in Chisholm who have obtained a bachelor's degree or higher.
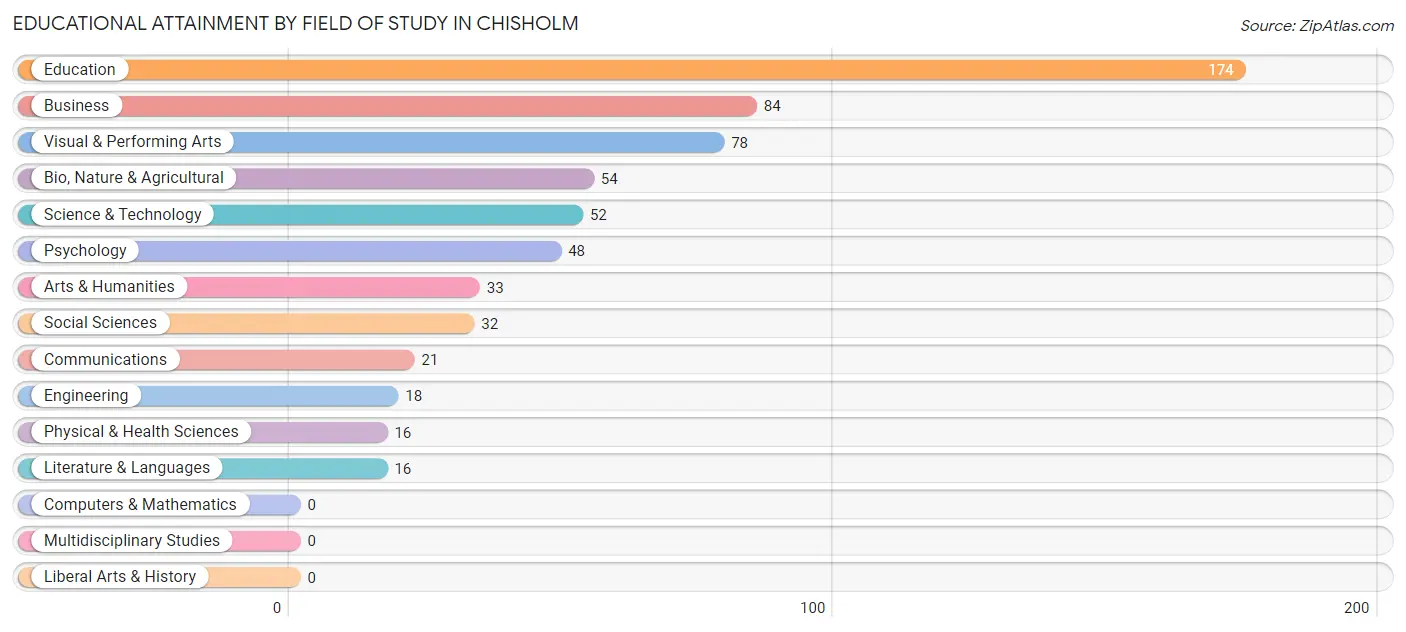
| Field of Study | # Graduates | % Graduates |
| Computers & Mathematics | 0 | 0.0% |
| Bio, Nature & Agricultural | 54 | 8.6% |
| Physical & Health Sciences | 16 | 2.6% |
| Psychology | 48 | 7.7% |
| Social Sciences | 32 | 5.1% |
| Engineering | 18 | 2.9% |
| Multidisciplinary Studies | 0 | 0.0% |
| Science & Technology | 52 | 8.3% |
| Business | 84 | 13.4% |
| Education | 174 | 27.8% |
| Literature & Languages | 16 | 2.6% |
| Liberal Arts & History | 0 | 0.0% |
| Visual & Performing Arts | 78 | 12.5% |
| Communications | 21 | 3.4% |
| Arts & Humanities | 33 | 5.3% |
| Total | 626 | 100.0% |
Transportation & Commute in Chisholm
Vehicle Availability by Sex in Chisholm
The most prevalent vehicle ownership categories in Chisholm are males with 2 vehicles (388, accounting for 40.9%) and females with 2 vehicles (283, making up 48.4%).
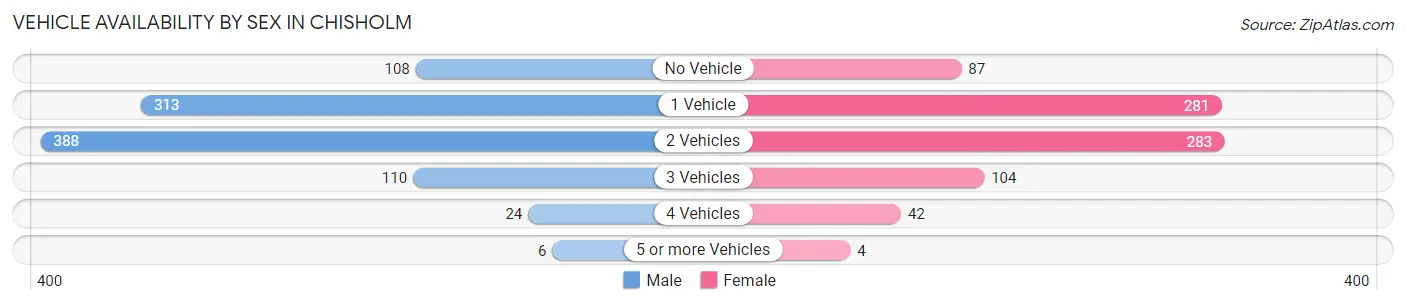
| Vehicles Available | Male | Female |
| No Vehicle | 108 (11.4%) | 87 (10.9%) |
| 1 Vehicle | 313 (33.0%) | 281 (35.1%) |
| 2 Vehicles | 388 (40.9%) | 283 (35.3%) |
| 3 Vehicles | 110 (11.6%) | 104 (13.0%) |
| 4 Vehicles | 24 (2.5%) | 42 (5.2%) |
| 5 or more Vehicles | 6 (0.6%) | 4 (0.5%) |
| Total | 949 (100.0%) | 801 (100.0%) |
Commute Time in Chisholm
The most frequently occuring commute durations in Chisholm are 5 to 9 minutes (410 commuters, 23.8%), 10 to 14 minutes (323 commuters, 18.8%), and 15 to 19 minutes (280 commuters, 16.3%).
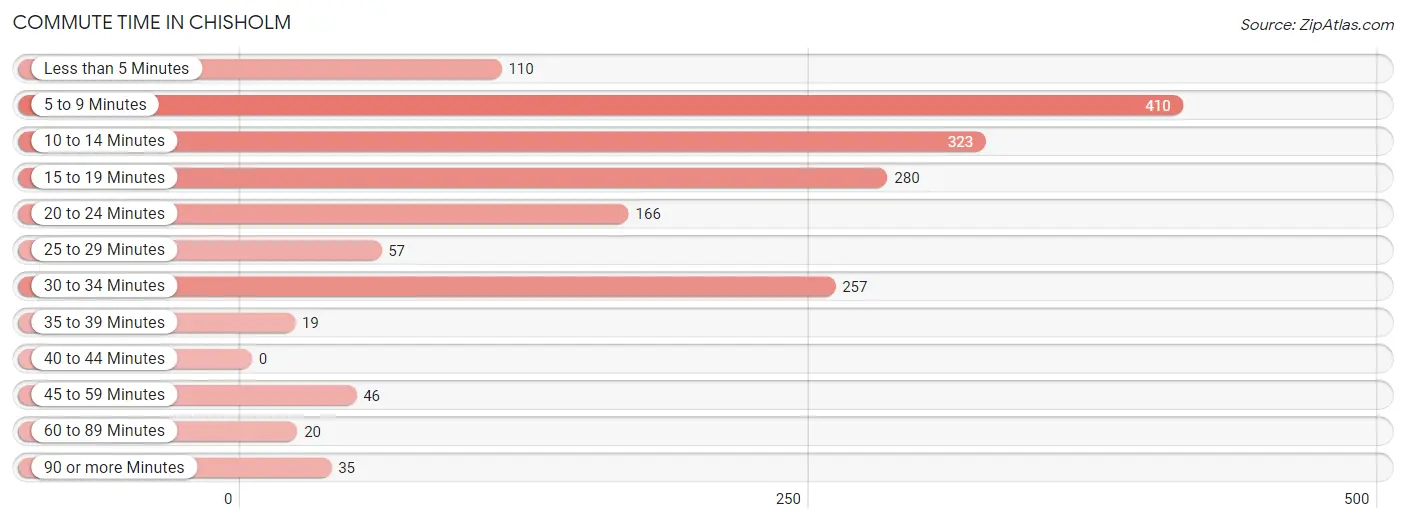
| Commute Time | # Commuters | % Commuters |
| Less than 5 Minutes | 110 | 6.4% |
| 5 to 9 Minutes | 410 | 23.8% |
| 10 to 14 Minutes | 323 | 18.8% |
| 15 to 19 Minutes | 280 | 16.3% |
| 20 to 24 Minutes | 166 | 9.6% |
| 25 to 29 Minutes | 57 | 3.3% |
| 30 to 34 Minutes | 257 | 14.9% |
| 35 to 39 Minutes | 19 | 1.1% |
| 40 to 44 Minutes | 0 | 0.0% |
| 45 to 59 Minutes | 46 | 2.7% |
| 60 to 89 Minutes | 20 | 1.2% |
| 90 or more Minutes | 35 | 2.0% |
Commute Time by Sex in Chisholm
The most common commute times in Chisholm are 30 to 34 minutes (237 commuters, 25.7%) for males and 5 to 9 minutes (266 commuters, 33.2%) for females.
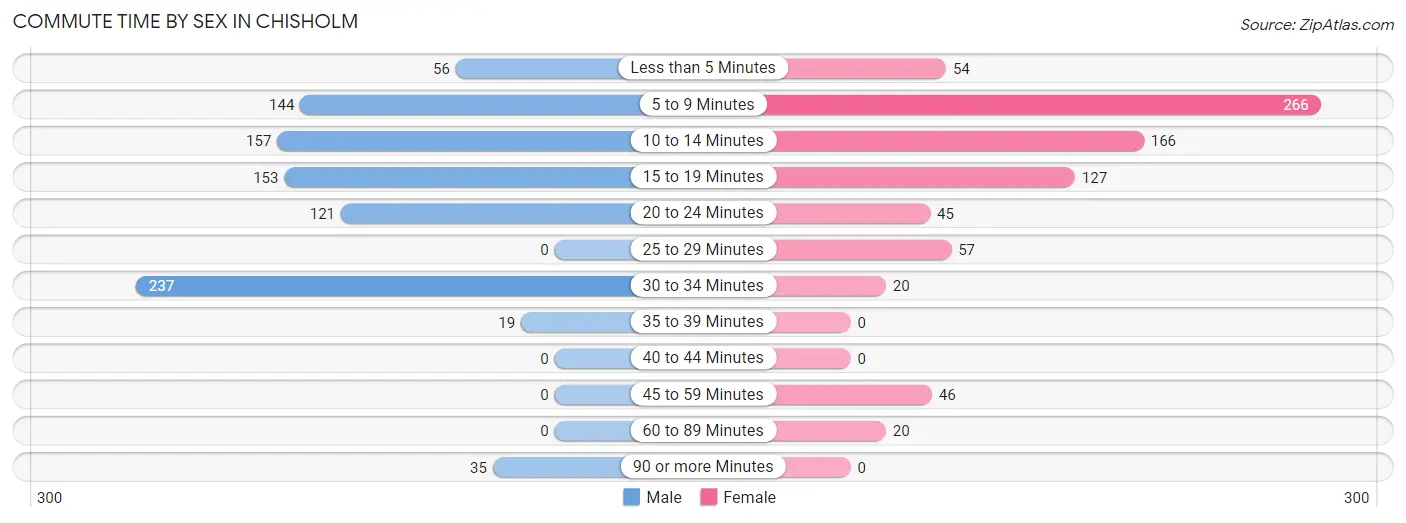
| Commute Time | Male | Female |
| Less than 5 Minutes | 56 (6.1%) | 54 (6.7%) |
| 5 to 9 Minutes | 144 (15.6%) | 266 (33.2%) |
| 10 to 14 Minutes | 157 (17.0%) | 166 (20.7%) |
| 15 to 19 Minutes | 153 (16.6%) | 127 (15.9%) |
| 20 to 24 Minutes | 121 (13.1%) | 45 (5.6%) |
| 25 to 29 Minutes | 0 (0.0%) | 57 (7.1%) |
| 30 to 34 Minutes | 237 (25.7%) | 20 (2.5%) |
| 35 to 39 Minutes | 19 (2.1%) | 0 (0.0%) |
| 40 to 44 Minutes | 0 (0.0%) | 0 (0.0%) |
| 45 to 59 Minutes | 0 (0.0%) | 46 (5.7%) |
| 60 to 89 Minutes | 0 (0.0%) | 20 (2.5%) |
| 90 or more Minutes | 35 (3.8%) | 0 (0.0%) |
Time of Departure to Work by Sex in Chisholm
The most frequent times of departure to work in Chisholm are 12:00 PM to 3:59 PM (253, 27.4%) for males and 7:30 AM to 7:59 AM (161, 20.1%) for females.
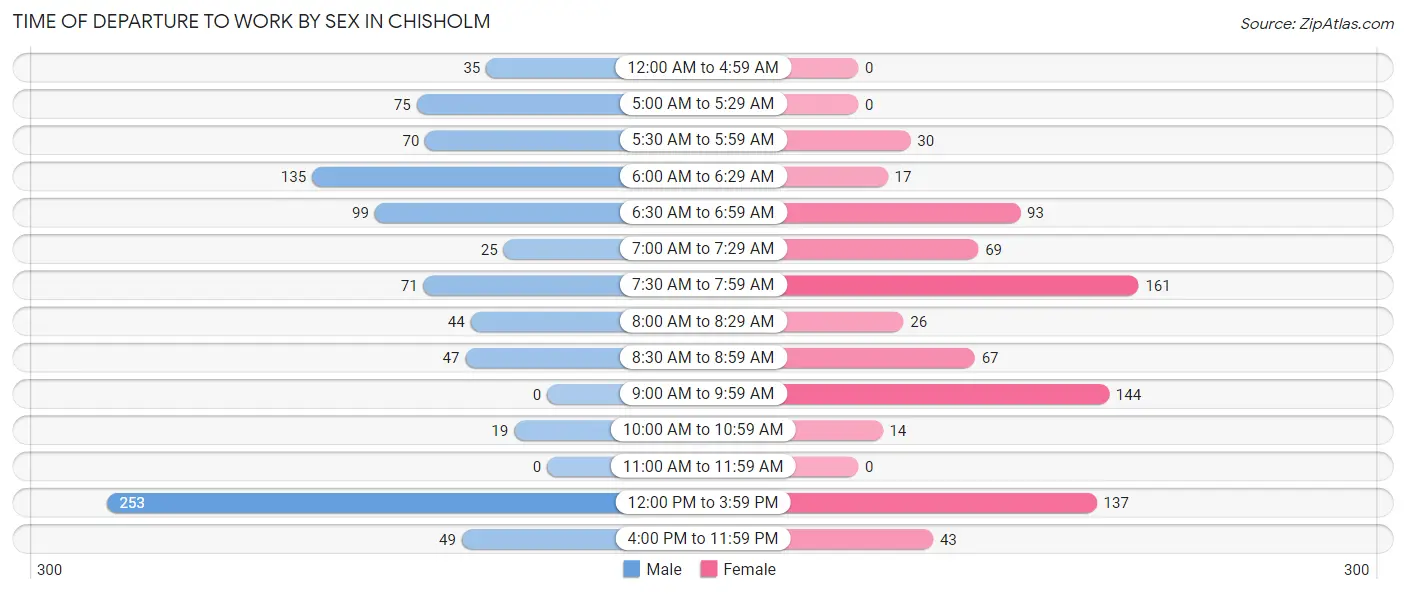
| Time of Departure | Male | Female |
| 12:00 AM to 4:59 AM | 35 (3.8%) | 0 (0.0%) |
| 5:00 AM to 5:29 AM | 75 (8.1%) | 0 (0.0%) |
| 5:30 AM to 5:59 AM | 70 (7.6%) | 30 (3.7%) |
| 6:00 AM to 6:29 AM | 135 (14.6%) | 17 (2.1%) |
| 6:30 AM to 6:59 AM | 99 (10.7%) | 93 (11.6%) |
| 7:00 AM to 7:29 AM | 25 (2.7%) | 69 (8.6%) |
| 7:30 AM to 7:59 AM | 71 (7.7%) | 161 (20.1%) |
| 8:00 AM to 8:29 AM | 44 (4.8%) | 26 (3.3%) |
| 8:30 AM to 8:59 AM | 47 (5.1%) | 67 (8.4%) |
| 9:00 AM to 9:59 AM | 0 (0.0%) | 144 (18.0%) |
| 10:00 AM to 10:59 AM | 19 (2.1%) | 14 (1.8%) |
| 11:00 AM to 11:59 AM | 0 (0.0%) | 0 (0.0%) |
| 12:00 PM to 3:59 PM | 253 (27.4%) | 137 (17.1%) |
| 4:00 PM to 11:59 PM | 49 (5.3%) | 43 (5.4%) |
| Total | 922 (100.0%) | 801 (100.0%) |
Housing Occupancy in Chisholm
Occupancy by Ownership in Chisholm
Of the total 1,948 dwellings in Chisholm, owner-occupied units account for 1,384 (71.1%), while renter-occupied units make up 564 (28.9%).

| Occupancy | # Housing Units | % Housing Units |
| Owner Occupied Housing Units | 1,384 | 71.1% |
| Renter-Occupied Housing Units | 564 | 28.9% |
| Total Occupied Housing Units | 1,948 | 100.0% |
Occupancy by Household Size in Chisholm
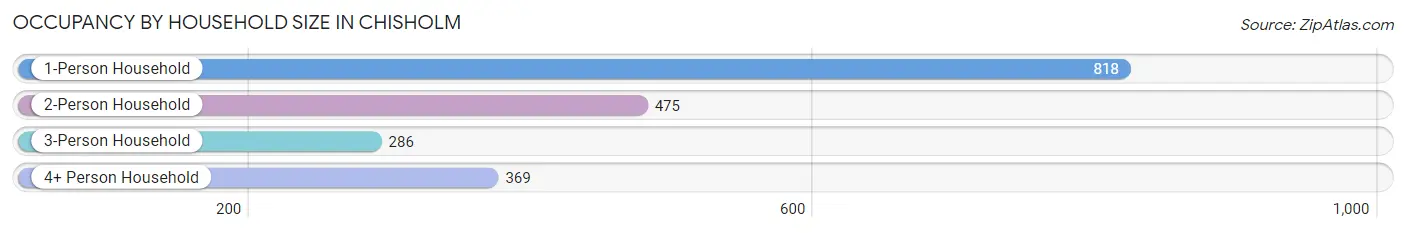
| Household Size | # Housing Units | % Housing Units |
| 1-Person Household | 818 | 42.0% |
| 2-Person Household | 475 | 24.4% |
| 3-Person Household | 286 | 14.7% |
| 4+ Person Household | 369 | 18.9% |
| Total Housing Units | 1,948 | 100.0% |
Occupancy by Ownership by Household Size in Chisholm
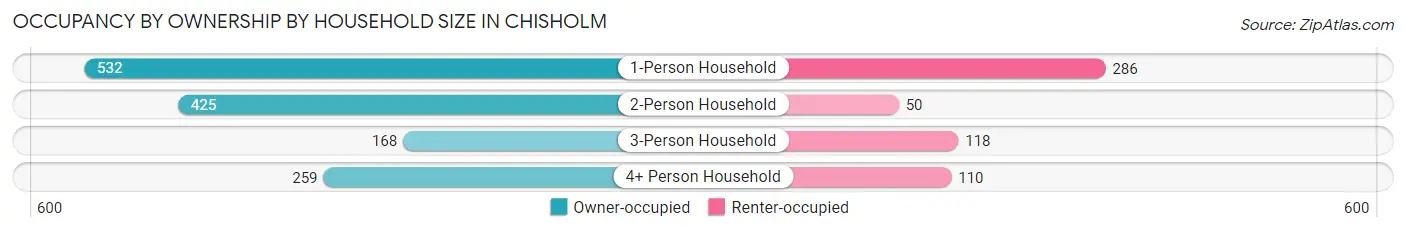
| Household Size | Owner-occupied | Renter-occupied |
| 1-Person Household | 532 (65.0%) | 286 (35.0%) |
| 2-Person Household | 425 (89.5%) | 50 (10.5%) |
| 3-Person Household | 168 (58.7%) | 118 (41.3%) |
| 4+ Person Household | 259 (70.2%) | 110 (29.8%) |
| Total Housing Units | 1,384 (71.1%) | 564 (28.9%) |
Occupancy by Educational Attainment in Chisholm
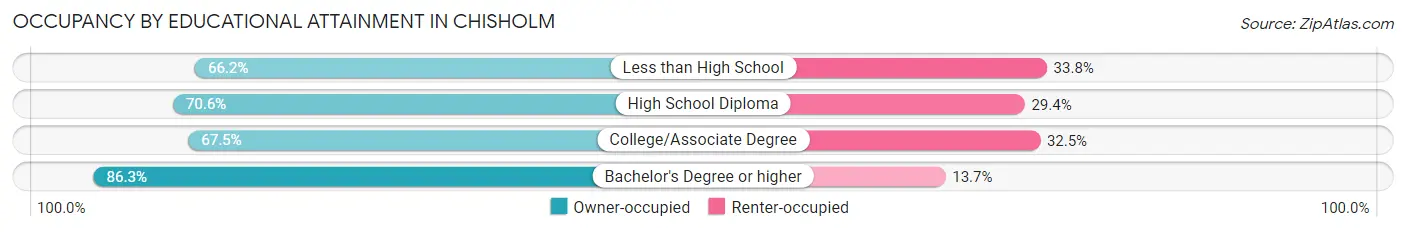
| Household Size | Owner-occupied | Renter-occupied |
| Less than High School | 94 (66.2%) | 48 (33.8%) |
| High School Diploma | 456 (70.6%) | 190 (29.4%) |
| College/Associate Degree | 601 (67.5%) | 289 (32.5%) |
| Bachelor's Degree or higher | 233 (86.3%) | 37 (13.7%) |
Occupancy by Age of Householder in Chisholm
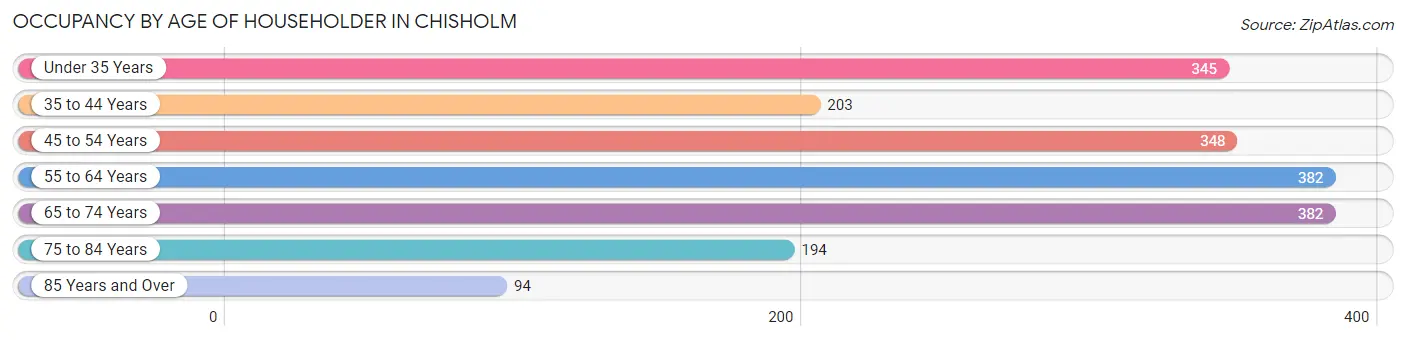
| Age Bracket | # Households | % Households |
| Under 35 Years | 345 | 17.7% |
| 35 to 44 Years | 203 | 10.4% |
| 45 to 54 Years | 348 | 17.9% |
| 55 to 64 Years | 382 | 19.6% |
| 65 to 74 Years | 382 | 19.6% |
| 75 to 84 Years | 194 | 10.0% |
| 85 Years and Over | 94 | 4.8% |
| Total | 1,948 | 100.0% |
Housing Finances in Chisholm
Median Income by Occupancy in Chisholm
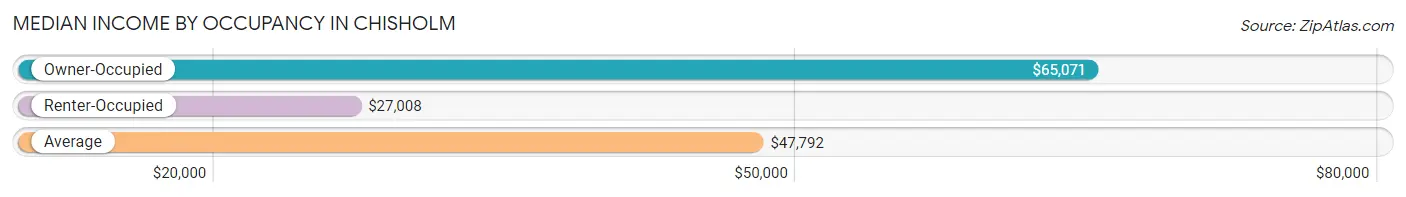
| Occupancy Type | # Households | Median Income |
| Owner-Occupied | 1,384 (71.1%) | $65,071 |
| Renter-Occupied | 564 (28.9%) | $27,008 |
| Average | 1,948 (100.0%) | $47,792 |
Occupancy by Householder Income Bracket in Chisholm
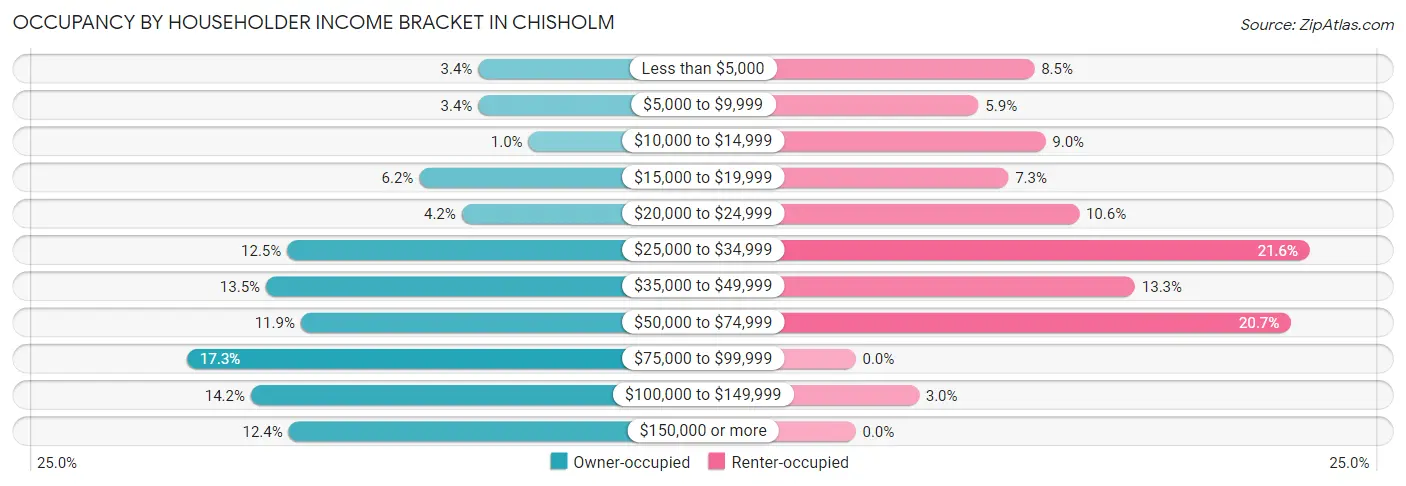
| Income Bracket | Owner-occupied | Renter-occupied |
| Less than $5,000 | 47 (3.4%) | 48 (8.5%) |
| $5,000 to $9,999 | 47 (3.4%) | 33 (5.9%) |
| $10,000 to $14,999 | 14 (1.0%) | 51 (9.0%) |
| $15,000 to $19,999 | 86 (6.2%) | 41 (7.3%) |
| $20,000 to $24,999 | 58 (4.2%) | 60 (10.6%) |
| $25,000 to $34,999 | 173 (12.5%) | 122 (21.6%) |
| $35,000 to $49,999 | 187 (13.5%) | 75 (13.3%) |
| $50,000 to $74,999 | 164 (11.8%) | 117 (20.7%) |
| $75,000 to $99,999 | 239 (17.3%) | 0 (0.0%) |
| $100,000 to $149,999 | 197 (14.2%) | 17 (3.0%) |
| $150,000 or more | 172 (12.4%) | 0 (0.0%) |
| Total | 1,384 (100.0%) | 564 (100.0%) |
Monthly Housing Cost Tiers in Chisholm
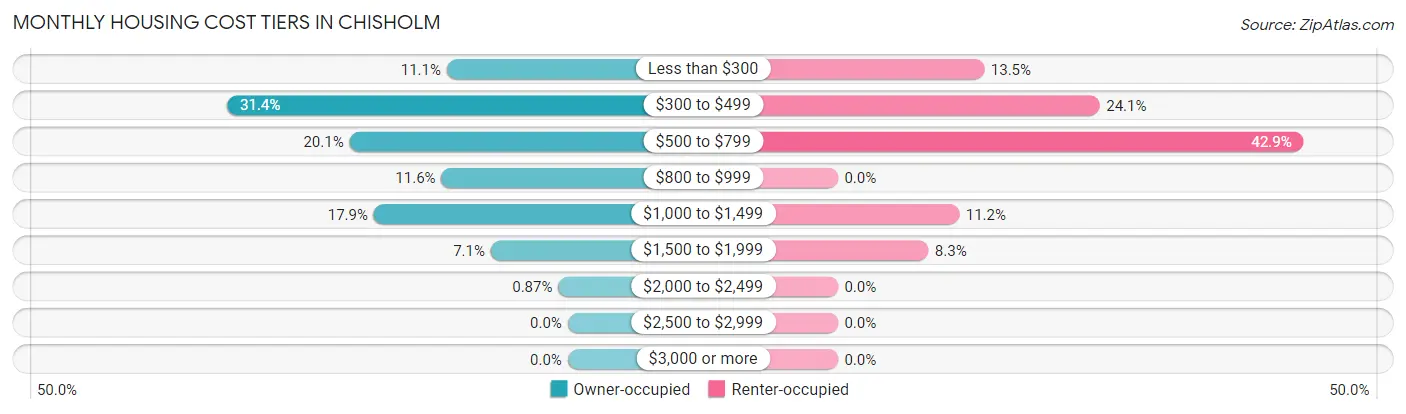
| Monthly Cost | Owner-occupied | Renter-occupied |
| Less than $300 | 154 (11.1%) | 76 (13.5%) |
| $300 to $499 | 434 (31.4%) | 136 (24.1%) |
| $500 to $799 | 278 (20.1%) | 242 (42.9%) |
| $800 to $999 | 161 (11.6%) | 0 (0.0%) |
| $1,000 to $1,499 | 247 (17.8%) | 63 (11.2%) |
| $1,500 to $1,999 | 98 (7.1%) | 47 (8.3%) |
| $2,000 to $2,499 | 12 (0.9%) | 0 (0.0%) |
| $2,500 to $2,999 | 0 (0.0%) | 0 (0.0%) |
| $3,000 or more | 0 (0.0%) | 0 (0.0%) |
| Total | 1,384 (100.0%) | 564 (100.0%) |
Physical Housing Characteristics in Chisholm
Housing Structures in Chisholm
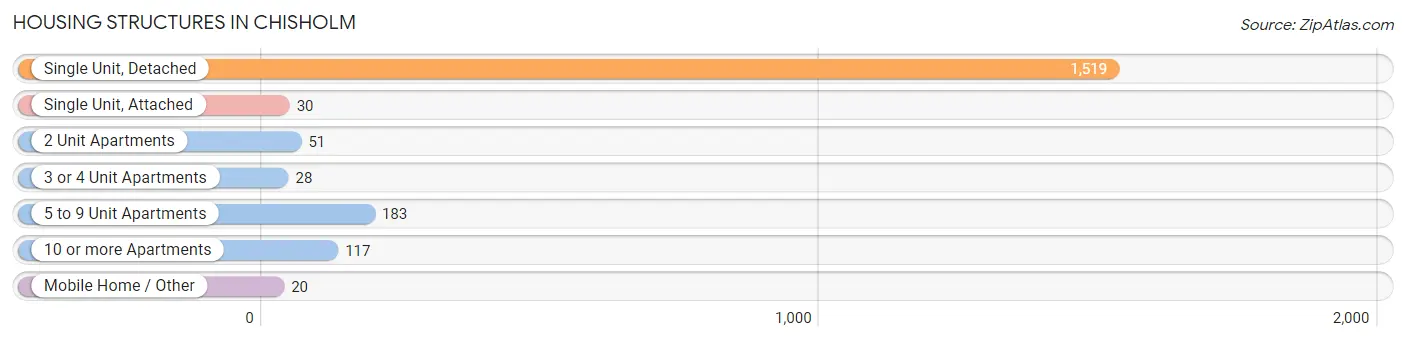
| Structure Type | # Housing Units | % Housing Units |
| Single Unit, Detached | 1,519 | 78.0% |
| Single Unit, Attached | 30 | 1.5% |
| 2 Unit Apartments | 51 | 2.6% |
| 3 or 4 Unit Apartments | 28 | 1.4% |
| 5 to 9 Unit Apartments | 183 | 9.4% |
| 10 or more Apartments | 117 | 6.0% |
| Mobile Home / Other | 20 | 1.0% |
| Total | 1,948 | 100.0% |
Housing Structures by Occupancy in Chisholm
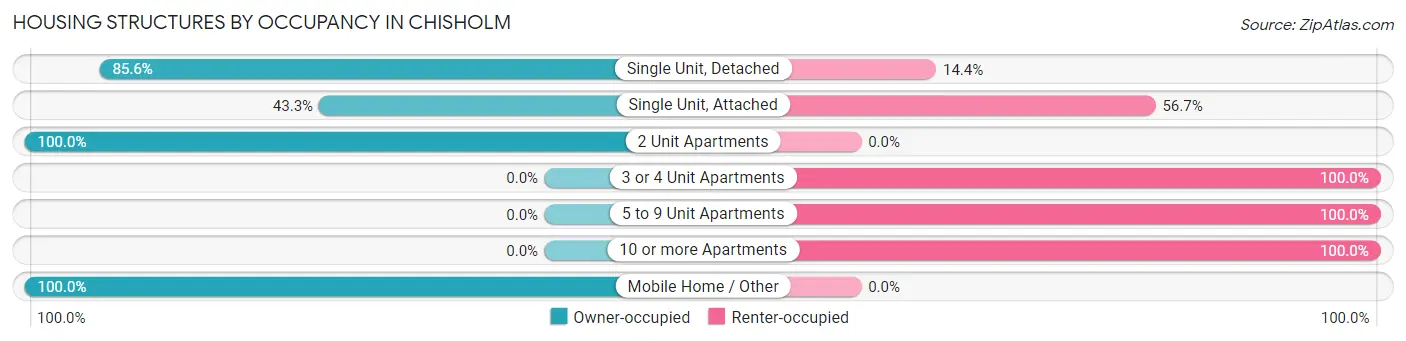
| Structure Type | Owner-occupied | Renter-occupied |
| Single Unit, Detached | 1,300 (85.6%) | 219 (14.4%) |
| Single Unit, Attached | 13 (43.3%) | 17 (56.7%) |
| 2 Unit Apartments | 51 (100.0%) | 0 (0.0%) |
| 3 or 4 Unit Apartments | 0 (0.0%) | 28 (100.0%) |
| 5 to 9 Unit Apartments | 0 (0.0%) | 183 (100.0%) |
| 10 or more Apartments | 0 (0.0%) | 117 (100.0%) |
| Mobile Home / Other | 20 (100.0%) | 0 (0.0%) |
| Total | 1,384 (71.1%) | 564 (28.9%) |
Housing Structures by Number of Rooms in Chisholm
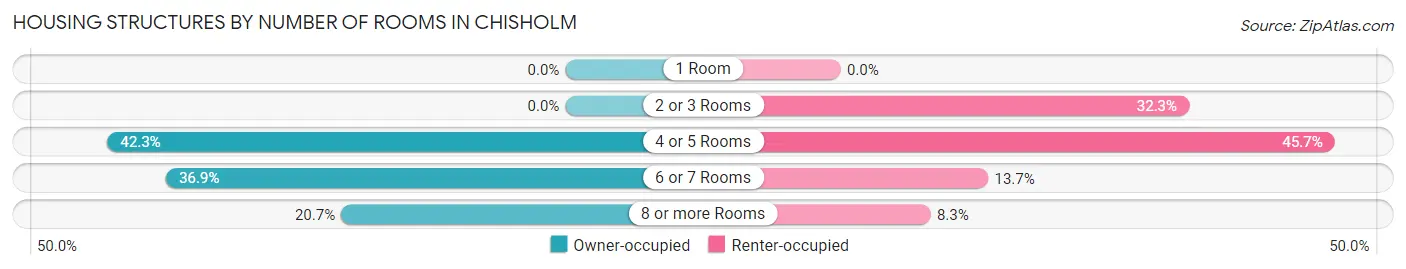
| Number of Rooms | Owner-occupied | Renter-occupied |
| 1 Room | 0 (0.0%) | 0 (0.0%) |
| 2 or 3 Rooms | 0 (0.0%) | 182 (32.3%) |
| 4 or 5 Rooms | 586 (42.3%) | 258 (45.7%) |
| 6 or 7 Rooms | 511 (36.9%) | 77 (13.7%) |
| 8 or more Rooms | 287 (20.7%) | 47 (8.3%) |
| Total | 1,384 (100.0%) | 564 (100.0%) |
Housing Structure by Heating Type in Chisholm
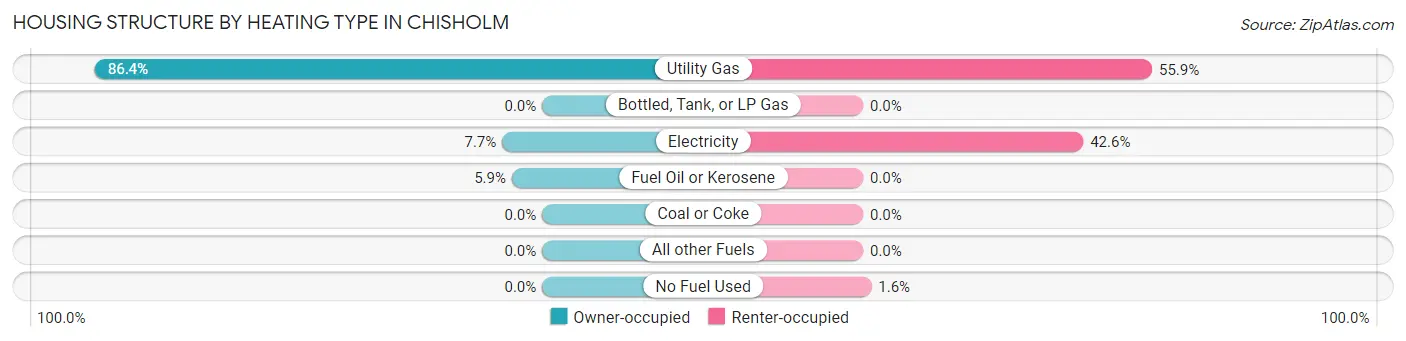
| Heating Type | Owner-occupied | Renter-occupied |
| Utility Gas | 1,196 (86.4%) | 315 (55.8%) |
| Bottled, Tank, or LP Gas | 0 (0.0%) | 0 (0.0%) |
| Electricity | 107 (7.7%) | 240 (42.5%) |
| Fuel Oil or Kerosene | 81 (5.9%) | 0 (0.0%) |
| Coal or Coke | 0 (0.0%) | 0 (0.0%) |
| All other Fuels | 0 (0.0%) | 0 (0.0%) |
| No Fuel Used | 0 (0.0%) | 9 (1.6%) |
| Total | 1,384 (100.0%) | 564 (100.0%) |
Household Vehicle Usage in Chisholm
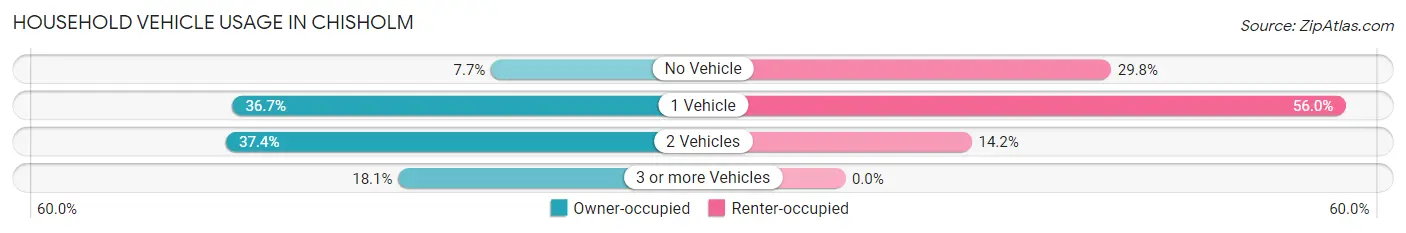
| Vehicles per Household | Owner-occupied | Renter-occupied |
| No Vehicle | 107 (7.7%) | 168 (29.8%) |
| 1 Vehicle | 508 (36.7%) | 316 (56.0%) |
| 2 Vehicles | 518 (37.4%) | 80 (14.2%) |
| 3 or more Vehicles | 251 (18.1%) | 0 (0.0%) |
| Total | 1,384 (100.0%) | 564 (100.0%) |
Real Estate & Mortgages in Chisholm
Real Estate and Mortgage Overview in Chisholm
| Characteristic | Without Mortgage | With Mortgage |
| Housing Units | 685 | 699 |
| Median Property Value | $86,700 | $109,100 |
| Median Household Income | $43,906 | $91 |
| Monthly Housing Costs | $379 | $0 |
| Real Estate Taxes | $1,025 | $4 |
Property Value by Mortgage Status in Chisholm
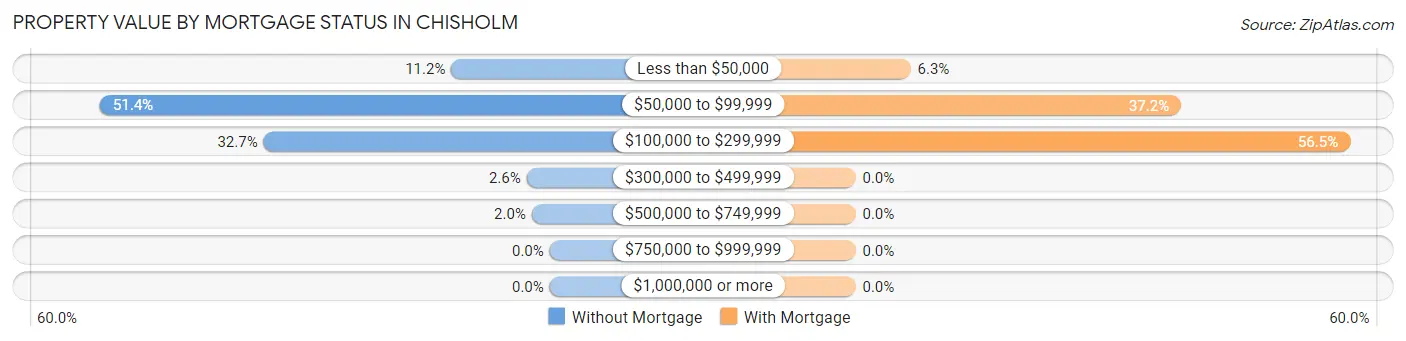
| Property Value | Without Mortgage | With Mortgage |
| Less than $50,000 | 77 (11.2%) | 44 (6.3%) |
| $50,000 to $99,999 | 352 (51.4%) | 260 (37.2%) |
| $100,000 to $299,999 | 224 (32.7%) | 395 (56.5%) |
| $300,000 to $499,999 | 18 (2.6%) | 0 (0.0%) |
| $500,000 to $749,999 | 14 (2.0%) | 0 (0.0%) |
| $750,000 to $999,999 | 0 (0.0%) | 0 (0.0%) |
| $1,000,000 or more | 0 (0.0%) | 0 (0.0%) |
| Total | 685 (100.0%) | 699 (100.0%) |
Household Income by Mortgage Status in Chisholm
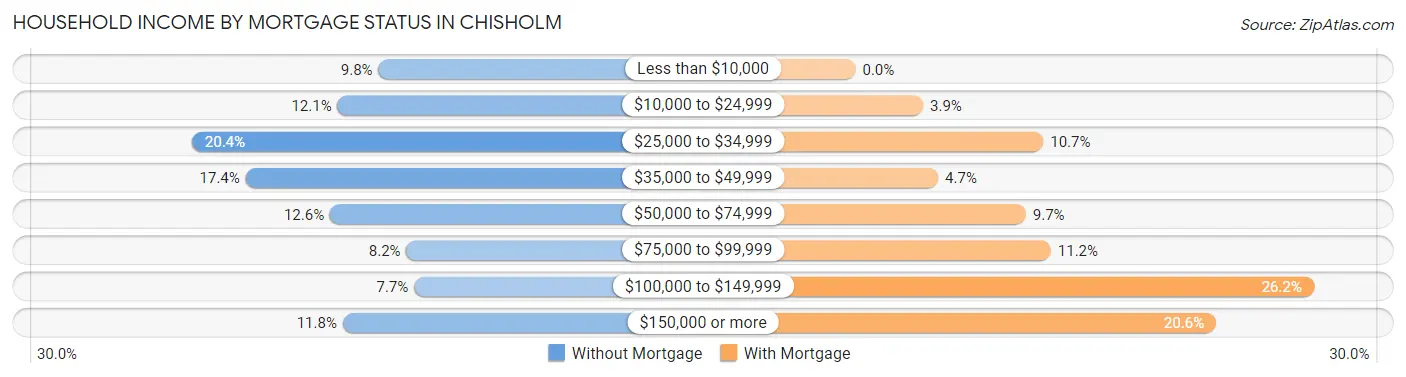
| Household Income | Without Mortgage | With Mortgage |
| Less than $10,000 | 67 (9.8%) | 0 (0.0%) |
| $10,000 to $24,999 | 83 (12.1%) | 27 (3.9%) |
| $25,000 to $34,999 | 140 (20.4%) | 75 (10.7%) |
| $35,000 to $49,999 | 119 (17.4%) | 33 (4.7%) |
| $50,000 to $74,999 | 86 (12.6%) | 68 (9.7%) |
| $75,000 to $99,999 | 56 (8.2%) | 78 (11.2%) |
| $100,000 to $149,999 | 53 (7.7%) | 183 (26.2%) |
| $150,000 or more | 81 (11.8%) | 144 (20.6%) |
| Total | 685 (100.0%) | 699 (100.0%) |
Property Value to Household Income Ratio in Chisholm
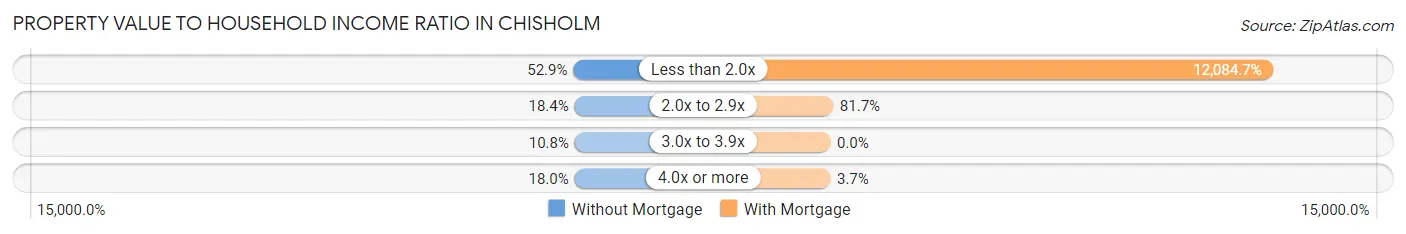
| Value-to-Income Ratio | Without Mortgage | With Mortgage |
| Less than 2.0x | 362 (52.8%) | 84,472 (12,084.7%) |
| 2.0x to 2.9x | 126 (18.4%) | 571 (81.7%) |
| 3.0x to 3.9x | 74 (10.8%) | 0 (0.0%) |
| 4.0x or more | 123 (18.0%) | 26 (3.7%) |
| Total | 685 (100.0%) | 699 (100.0%) |
Real Estate Taxes by Mortgage Status in Chisholm
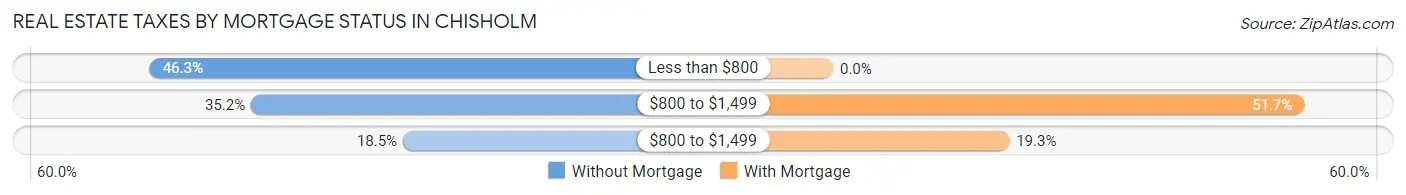
| Property Taxes | Without Mortgage | With Mortgage |
| Less than $800 | 317 (46.3%) | 0 (0.0%) |
| $800 to $1,499 | 241 (35.2%) | 361 (51.6%) |
| $800 to $1,499 | 127 (18.5%) | 135 (19.3%) |
| Total | 685 (100.0%) | 699 (100.0%) |
Health & Disability in Chisholm
Health Insurance Coverage by Age in Chisholm
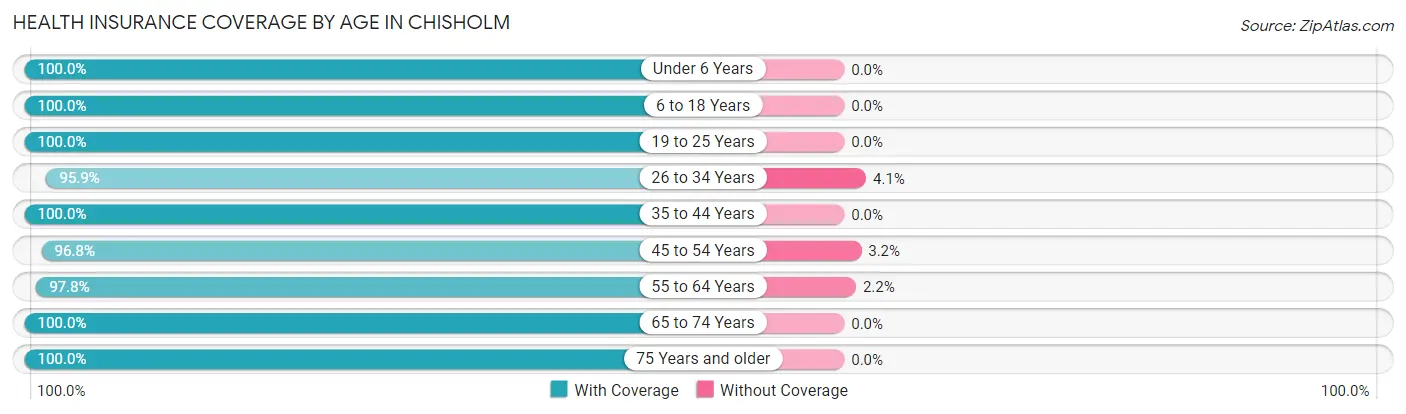
| Age Bracket | With Coverage | Without Coverage |
| Under 6 Years | 241 (100.0%) | 0 (0.0%) |
| 6 to 18 Years | 851 (100.0%) | 0 (0.0%) |
| 19 to 25 Years | 225 (100.0%) | 0 (0.0%) |
| 26 to 34 Years | 472 (95.9%) | 20 (4.1%) |
| 35 to 44 Years | 312 (100.0%) | 0 (0.0%) |
| 45 to 54 Years | 489 (96.8%) | 16 (3.2%) |
| 55 to 64 Years | 674 (97.8%) | 15 (2.2%) |
| 65 to 74 Years | 889 (100.0%) | 0 (0.0%) |
| 75 Years and older | 477 (100.0%) | 0 (0.0%) |
| Total | 4,630 (98.9%) | 51 (1.1%) |
Health Insurance Coverage by Citizenship Status in Chisholm
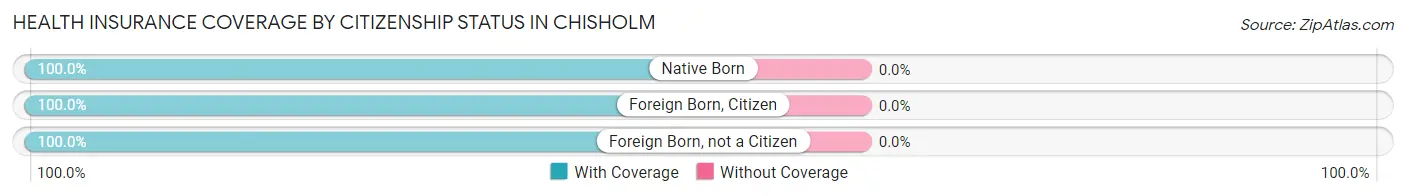
| Citizenship Status | With Coverage | Without Coverage |
| Native Born | 241 (100.0%) | 0 (0.0%) |
| Foreign Born, Citizen | 851 (100.0%) | 0 (0.0%) |
| Foreign Born, not a Citizen | 225 (100.0%) | 0 (0.0%) |
Health Insurance Coverage by Household Income in Chisholm
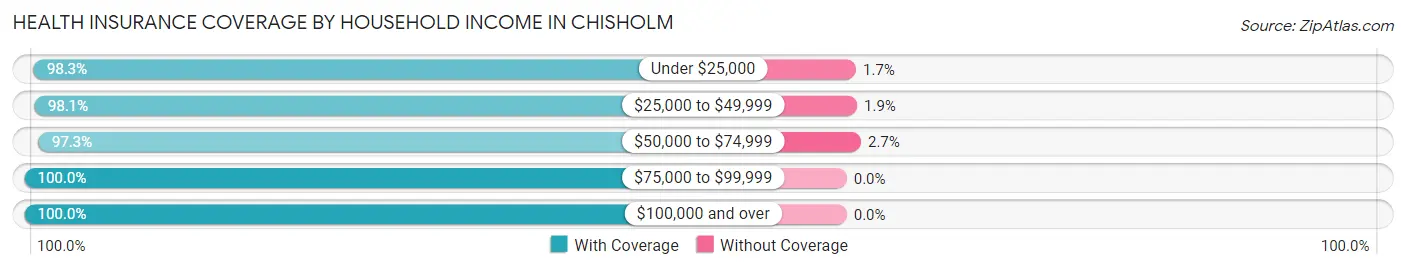
| Household Income | With Coverage | Without Coverage |
| Under $25,000 | 848 (98.3%) | 15 (1.7%) |
| $25,000 to $49,999 | 1,014 (98.1%) | 20 (1.9%) |
| $50,000 to $74,999 | 583 (97.3%) | 16 (2.7%) |
| $75,000 to $99,999 | 804 (100.0%) | 0 (0.0%) |
| $100,000 and over | 1,321 (100.0%) | 0 (0.0%) |
Public vs Private Health Insurance Coverage by Age in Chisholm
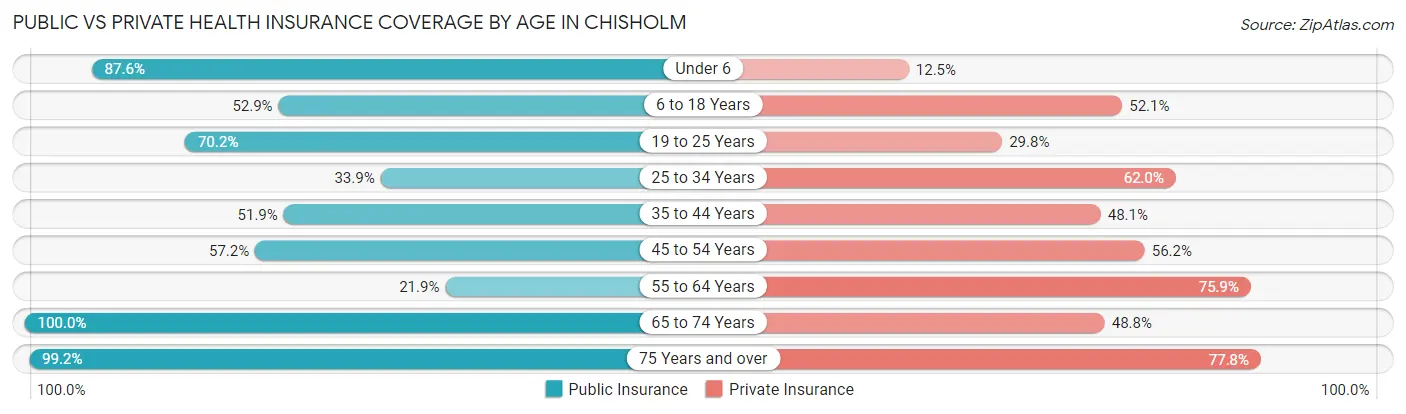
| Age Bracket | Public Insurance | Private Insurance |
| Under 6 | 211 (87.5%) | 30 (12.4%) |
| 6 to 18 Years | 450 (52.9%) | 443 (52.1%) |
| 19 to 25 Years | 158 (70.2%) | 67 (29.8%) |
| 25 to 34 Years | 167 (33.9%) | 305 (62.0%) |
| 35 to 44 Years | 162 (51.9%) | 150 (48.1%) |
| 45 to 54 Years | 289 (57.2%) | 284 (56.2%) |
| 55 to 64 Years | 151 (21.9%) | 523 (75.9%) |
| 65 to 74 Years | 889 (100.0%) | 434 (48.8%) |
| 75 Years and over | 473 (99.2%) | 371 (77.8%) |
| Total | 2,950 (63.0%) | 2,607 (55.7%) |
Disability Status by Sex by Age in Chisholm
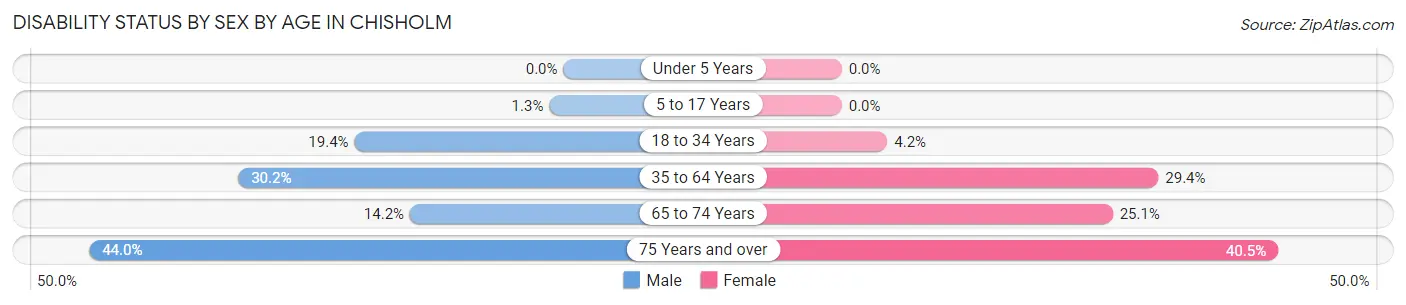
| Age Bracket | Male | Female |
| Under 5 Years | 0 (0.0%) | 0 (0.0%) |
| 5 to 17 Years | 6 (1.3%) | 0 (0.0%) |
| 18 to 34 Years | 96 (19.4%) | 13 (4.2%) |
| 35 to 64 Years | 210 (30.2%) | 238 (29.4%) |
| 65 to 74 Years | 49 (14.2%) | 137 (25.1%) |
| 75 Years and over | 99 (44.0%) | 102 (40.5%) |
Disability Class by Sex by Age in Chisholm
Disability Class: Hearing Difficulty
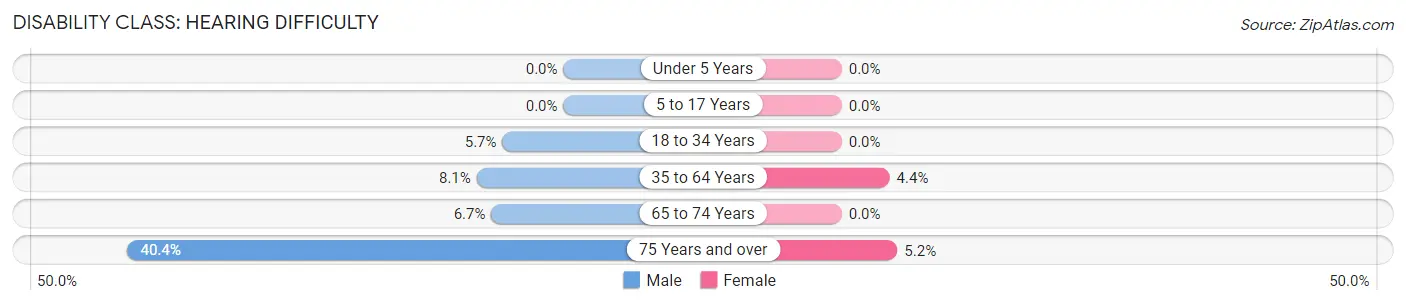
| Age Bracket | Male | Female |
| Under 5 Years | 0 (0.0%) | 0 (0.0%) |
| 5 to 17 Years | 0 (0.0%) | 0 (0.0%) |
| 18 to 34 Years | 28 (5.7%) | 0 (0.0%) |
| 35 to 64 Years | 56 (8.1%) | 36 (4.4%) |
| 65 to 74 Years | 23 (6.7%) | 0 (0.0%) |
| 75 Years and over | 91 (40.4%) | 13 (5.2%) |
Disability Class: Vision Difficulty
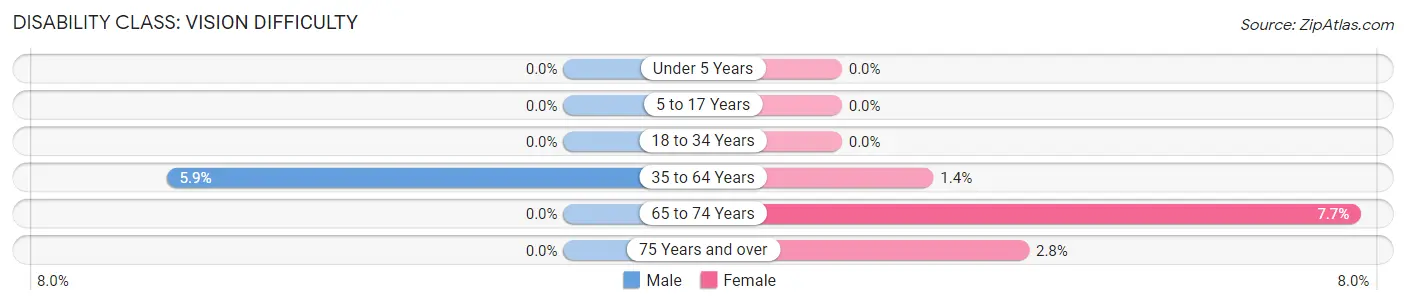
| Age Bracket | Male | Female |
| Under 5 Years | 0 (0.0%) | 0 (0.0%) |
| 5 to 17 Years | 0 (0.0%) | 0 (0.0%) |
| 18 to 34 Years | 0 (0.0%) | 0 (0.0%) |
| 35 to 64 Years | 41 (5.9%) | 11 (1.4%) |
| 65 to 74 Years | 0 (0.0%) | 42 (7.7%) |
| 75 Years and over | 0 (0.0%) | 7 (2.8%) |
Disability Class: Cognitive Difficulty
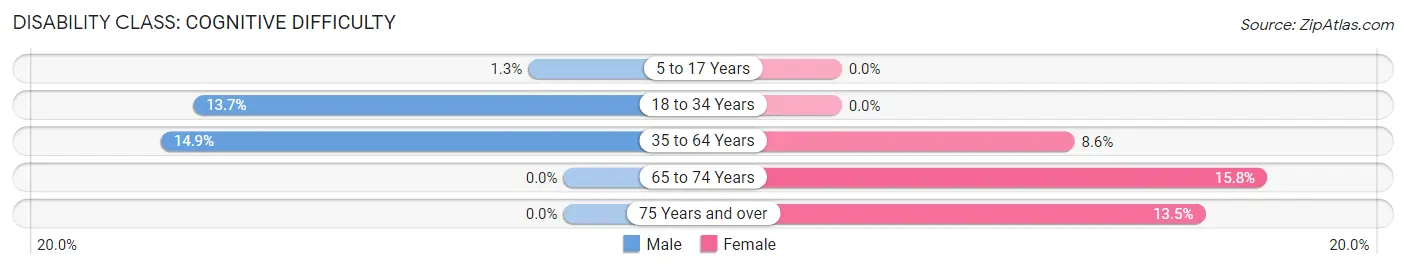
| Age Bracket | Male | Female |
| 5 to 17 Years | 6 (1.3%) | 0 (0.0%) |
| 18 to 34 Years | 68 (13.7%) | 0 (0.0%) |
| 35 to 64 Years | 104 (14.9%) | 70 (8.6%) |
| 65 to 74 Years | 0 (0.0%) | 86 (15.8%) |
| 75 Years and over | 0 (0.0%) | 34 (13.5%) |
Disability Class: Ambulatory Difficulty
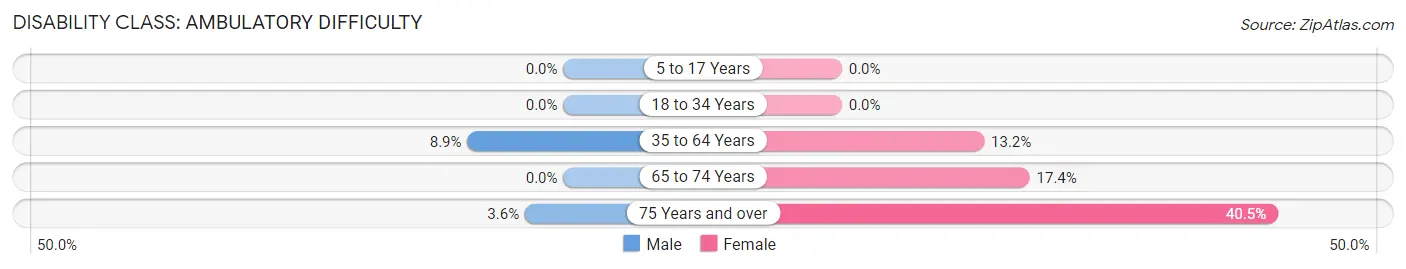
| Age Bracket | Male | Female |
| 5 to 17 Years | 0 (0.0%) | 0 (0.0%) |
| 18 to 34 Years | 0 (0.0%) | 0 (0.0%) |
| 35 to 64 Years | 62 (8.9%) | 107 (13.2%) |
| 65 to 74 Years | 0 (0.0%) | 95 (17.4%) |
| 75 Years and over | 8 (3.6%) | 102 (40.5%) |
Disability Class: Self-Care Difficulty
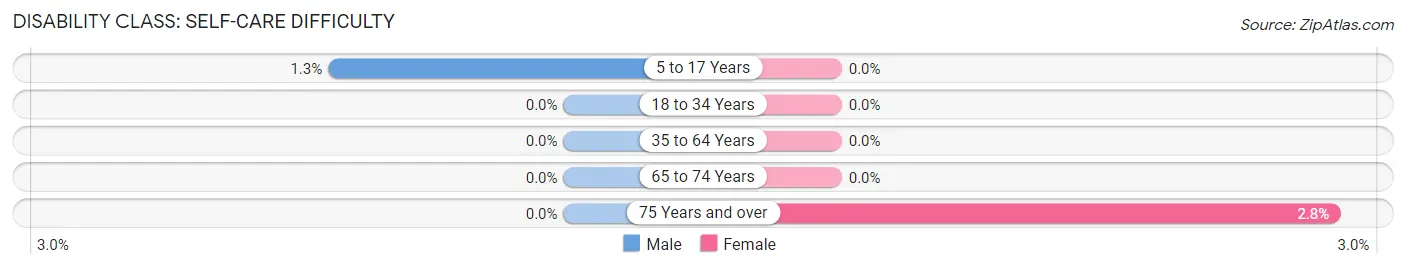
| Age Bracket | Male | Female |
| 5 to 17 Years | 6 (1.3%) | 0 (0.0%) |
| 18 to 34 Years | 0 (0.0%) | 0 (0.0%) |
| 35 to 64 Years | 0 (0.0%) | 0 (0.0%) |
| 65 to 74 Years | 0 (0.0%) | 0 (0.0%) |
| 75 Years and over | 0 (0.0%) | 7 (2.8%) |
Technology Access in Chisholm
Computing Device Access in Chisholm
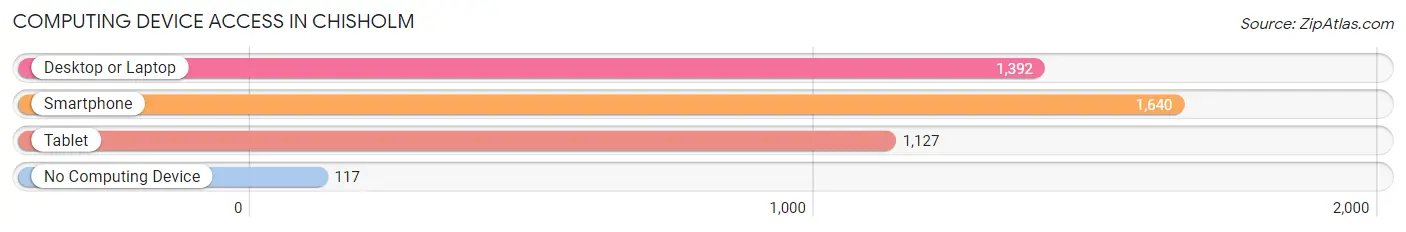
| Device Type | # Households | % Households |
| Desktop or Laptop | 1,392 | 71.5% |
| Smartphone | 1,640 | 84.2% |
| Tablet | 1,127 | 57.9% |
| No Computing Device | 117 | 6.0% |
| Total | 1,948 | 100.0% |
Internet Access in Chisholm
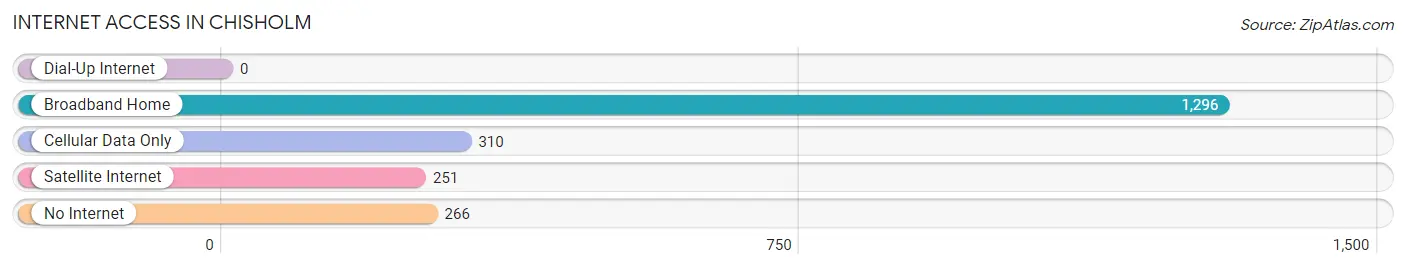
| Internet Type | # Households | % Households |
| Dial-Up Internet | 0 | 0.0% |
| Broadband Home | 1,296 | 66.5% |
| Cellular Data Only | 310 | 15.9% |
| Satellite Internet | 251 | 12.9% |
| No Internet | 266 | 13.7% |
| Total | 1,948 | 100.0% |
Chisholm Summary
Chisholm, Minnesota is a small city located in the northeastern part of the state, in St. Louis County. It is situated on the Mesabi Iron Range, a major iron ore mining region in the United States. The city has a population of about 5,000 people and is the county seat of St. Louis County.
History
The area that is now Chisholm was first settled in the late 1800s by Finnish and Swedish immigrants. The city was officially incorporated in 1892 and was named after Alexander Chisholm, a local businessman and politician. The city quickly grew as a result of the iron ore mining industry in the area. By the early 1900s, Chisholm had become a major hub for the mining industry, with several large mines in the area.
In the early 20th century, Chisholm was a major center for labor organizing. The city was the site of the 1912 Mesabi Range Strike, a major labor dispute between the miners and the mining companies. The strike was eventually resolved in favor of the miners, and the city became a major center for labor rights in the region.
Geography
Chisholm is located in the northeastern part of Minnesota, in St. Louis County. The city is situated on the Mesabi Iron Range, a major iron ore mining region in the United States. The city is located on the banks of the Embarrass River, which flows through the city. The city is surrounded by forests and lakes, and is located about 30 miles from Duluth, Minnesota.
Economy
The economy of Chisholm is largely based on the iron ore mining industry. The city is home to several large iron ore mines, and the mining industry is the main source of employment in the city. In addition to mining, the city also has a number of other industries, including manufacturing, retail, and tourism.
Demographics
As of the 2010 census, the population of Chisholm was 5,092. The racial makeup of the city was 94.3% White, 0.7% African American, 0.3% Native American, 0.2% Asian, 0.1% Pacific Islander, and 4.4% from other races. The median household income in the city was $37,941, and the median family income was $45,941. The per capita income in the city was $20,845.
Conclusion
Chisholm, Minnesota is a small city located in the northeastern part of the state, in St. Louis County. It is situated on the Mesabi Iron Range, a major iron ore mining region in the United States. The city has a population of about 5,000 people and is the county seat of St. Louis County. The economy of Chisholm is largely based on the iron ore mining industry, and the city is home to several large iron ore mines. The racial makeup of the city is 94.3% White, 0.7% African American, 0.3% Native American, 0.2% Asian, 0.1% Pacific Islander, and 4.4% from other races. The median household income in the city was $37,941, and the median family income was $45,941. The per capita income in the city was $20,845.
Common Questions
What is Per Capita Income in Chisholm?
Per Capita income in Chisholm is $34,124.
What is the Median Family Income in Chisholm?
Median Family Income in Chisholm is $64,458.
What is the Median Household income in Chisholm?
Median Household Income in Chisholm is $47,792.
What is Income or Wage Gap in Chisholm?
Income or Wage Gap in Chisholm is 27.5%.
Women in Chisholm earn 72.5 cents for every dollar earned by a man.
What is Inequality or Gini Index in Chisholm?
Inequality or Gini Index in Chisholm is 0.56.
What is the Total Population of Chisholm?
Total Population of Chisholm is 4,759.
What is the Total Male Population of Chisholm?
Total Male Population of Chisholm is 2,383.
What is the Total Female Population of Chisholm?
Total Female Population of Chisholm is 2,376.
What is the Ratio of Males per 100 Females in Chisholm?
There are 100.29 Males per 100 Females in Chisholm.
What is the Ratio of Females per 100 Males in Chisholm?
There are 99.71 Females per 100 Males in Chisholm.
What is the Median Population Age in Chisholm?
Median Population Age in Chisholm is 52.4 Years.
What is the Average Family Size in Chisholm
Average Family Size in Chisholm is 3.0 People.
What is the Average Household Size in Chisholm
Average Household Size in Chisholm is 2.4 People.
How Large is the Labor Force in Chisholm?
There are 2,009 People in the Labor Forcein in Chisholm.
What is the Percentage of People in the Labor Force in Chisholm?
50.6% of People are in the Labor Force in Chisholm.
What is the Unemployment Rate in Chisholm?
Unemployment Rate in Chisholm is 5.7%.