Zip Codes with the Highest Percentage of Households with Income Below $10,000 in Saint Paul, MN

RELATED REPORTS & OPTIONS

Household Income | $0-10k
Population
Families and Households
Female Fertility
Female Fertility (Unmarried)
Race (Community Size)
Race (Percentage)
Ancestry (Community Size)
AfghanAfricanAlbanianAlsatianAmericanApacheArabArgentineanArmenianAustralianAustrianBahamianBangladeshiBarbadianBelgianBelizeanBhutaneseBlackfeetBrazilianBritishBritish West IndianBulgarianBurmeseCambodianCanadianCarpatho RusynCelticCentral AmericanCentral American IndianCherokeeChickasawChileanChippewaChoctawColombianCosta RicanCreeCroatianCubanCzechCzechoslovakianDanishDominicanDutchEastern EuropeanEcuadorianEgyptianEnglishEstonianEthiopianEuropeanFilipinoFinnishFrenchFrench American IndianFrench CanadianGermanGerman RussianGhanaianGreekGuamanian / ChamorroGuatemalanGuyaneseHaitianHonduranHopiHungarianIcelanderIndian (Asian)IndonesianInupiatIranianIraqiIrishIroquoisIsraeliItalianJamaicanJapaneseJordanianKenyanKoreanLaotianLatvianLebaneseLiberianLithuanianLuxembourgerMacedonianMalaysianMalteseMenomineeMexicanMexican American IndianMongolianMoroccanNative HawaiianNavajoNew ZealanderNicaraguanNigerianNorthern EuropeanNorwegianPakistaniPalestinianPanamanianParaguayanPennsylvania GermanPeruvianPolishPortuguesePotawatomiPuerto RicanPuget Sound SalishRomanianRussianSalvadoranSamoanScandinavianScotch-IrishScottishSeminoleSerbianSiouxSlavicSlovakSloveneSomaliSouth AfricanSouth AmericanSouth American IndianSpaniardSpanishSpanish AmericanSri LankanSubsaharan AfricanSudaneseSwedishSwissSyrianThaiTrinidadian and TobagonianTurkishU.S. Virgin IslanderUgandanUkrainianUruguayanVenezuelanVietnameseWelshWest IndianYugoslavianZimbabwean
Ancestry (Percentage)
AfghanAfricanAlbanianAlsatianAmericanApacheArabArgentineanArmenianAustralianAustrianBahamianBangladeshiBarbadianBelgianBelizeanBhutaneseBlackfeetBrazilianBritishBritish West IndianBulgarianBurmeseCambodianCanadianCarpatho RusynCelticCentral AmericanCentral American IndianCherokeeChickasawChileanChippewaChoctawColombianCosta RicanCreeCroatianCubanCzechCzechoslovakianDanishDominicanDutchEastern EuropeanEcuadorianEgyptianEnglishEstonianEthiopianEuropeanFilipinoFinnishFrenchFrench American IndianFrench CanadianGermanGerman RussianGhanaianGreekGuamanian / ChamorroGuatemalanGuyaneseHaitianHonduranHopiHungarianIcelanderIndian (Asian)IndonesianInupiatIranianIraqiIrishIroquoisIsraeliItalianJamaicanJapaneseJordanianKenyanKoreanLaotianLatvianLebaneseLiberianLithuanianLuxembourgerMacedonianMalaysianMalteseMenomineeMexicanMexican American IndianMongolianMoroccanNative HawaiianNavajoNew ZealanderNicaraguanNigerianNorthern EuropeanNorwegianPakistaniPalestinianPanamanianParaguayanPennsylvania GermanPeruvianPolishPortuguesePotawatomiPuerto RicanPuget Sound SalishRomanianRussianSalvadoranSamoanScandinavianScotch-IrishScottishSeminoleSerbianSiouxSlavicSlovakSloveneSomaliSouth AfricanSouth AmericanSouth American IndianSpaniardSpanishSpanish AmericanSri LankanSubsaharan AfricanSudaneseSwedishSwissSyrianThaiTrinidadian and TobagonianTurkishU.S. Virgin IslanderUgandanUkrainianUruguayanVenezuelanVietnameseWelshWest IndianYugoslavianZimbabwean
Immigrant Origin (Total)
AfghanistanAfricaArgentinaArmeniaAsiaAustraliaAustriaBahamasBangladeshBarbadosBelarusBelgiumBelizeBoliviaBosnia and HerzegovinaBrazilBulgariaBurma / MyanmarCambodiaCameroonCanadaCaribbeanCentral AmericaChileChinaColombiaCongoCosta RicaCroatiaCubaCzechoslovakiaDenmarkDominican RepublicEastern AfricaEastern AsiaEastern EuropeEcuadorEgyptEl SalvadorEnglandEritreaEthiopiaEuropeFranceGermanyGhanaGreeceGuatemalaGuyanaHaitiHondurasHong KongHungaryIndiaIndonesiaIranIraqIrelandIsraelItalyJamaicaJapanJordanKazakhstanKenyaKoreaKuwaitLaosLatin AmericaLatviaLebanonLiberiaMalaysiaMexicoMiddle AfricaMoldovaMoroccoNepalNetherlandsNicaraguaNigeriaNorth MacedoniaNorthern AfricaNorthern EuropeNorwayOceaniaPakistanPanamaPeruPhilippinesPolandPortugalRomaniaRussiaSaudi ArabiaScotlandSerbiaSierra LeoneSingaporeSomaliaSouth AfricaSouth AmericaSouth Central AsiaSouth Eastern AsiaSouthern EuropeSpainSri LankaSudanSwedenSwitzerlandTaiwanThailandTrinidad and TobagoTurkeyUgandaUkraineUruguayVenezuelaVietnamWestern AfricaWestern AsiaWestern EuropeYemenZaireZimbabwe
Immigrant Origin (Percentage)
AfghanistanAfricaArgentinaArmeniaAsiaAustraliaAustriaBahamasBangladeshBarbadosBelarusBelgiumBelizeBoliviaBosnia and HerzegovinaBrazilBulgariaBurma / MyanmarCambodiaCameroonCanadaCaribbeanCentral AmericaChileChinaColombiaCongoCosta RicaCroatiaCubaCzechoslovakiaDenmarkDominican RepublicEastern AfricaEastern AsiaEastern EuropeEcuadorEgyptEl SalvadorEnglandEritreaEthiopiaEuropeFranceGermanyGhanaGreeceGuatemalaGuyanaHaitiHondurasHong KongHungaryIndiaIndonesiaIranIraqIrelandIsraelItalyJamaicaJapanJordanKazakhstanKenyaKoreaKuwaitLaosLatin AmericaLatviaLebanonLiberiaMalaysiaMexicoMiddle AfricaMoldovaMoroccoNepalNetherlandsNicaraguaNigeriaNorth MacedoniaNorthern AfricaNorthern EuropeNorwayOceaniaPakistanPanamaPeruPhilippinesPolandPortugalRomaniaRussiaSaudi ArabiaScotlandSerbiaSierra LeoneSingaporeSomaliaSouth AfricaSouth AmericaSouth Central AsiaSouth Eastern AsiaSouthern EuropeSpainSri LankaSudanSwedenSwitzerlandTaiwanThailandTrinidad and TobagoTurkeyUgandaUkraineUruguayVenezuelaVietnamWestern AfricaWestern AsiaWestern EuropeYemenZaireZimbabwe
Income
Income (Families)
Income (Households)
Poverty
Poverty (Families)
Unemployment
Employment Occupations
Employment Industries
Employer Class
Commute Time
Commute Means
School Enrollment
Education by Degree Field
Occupancy
Finances
Physical Characteristics
Saint Paul
Compare Zip Codes
Comparison Subject

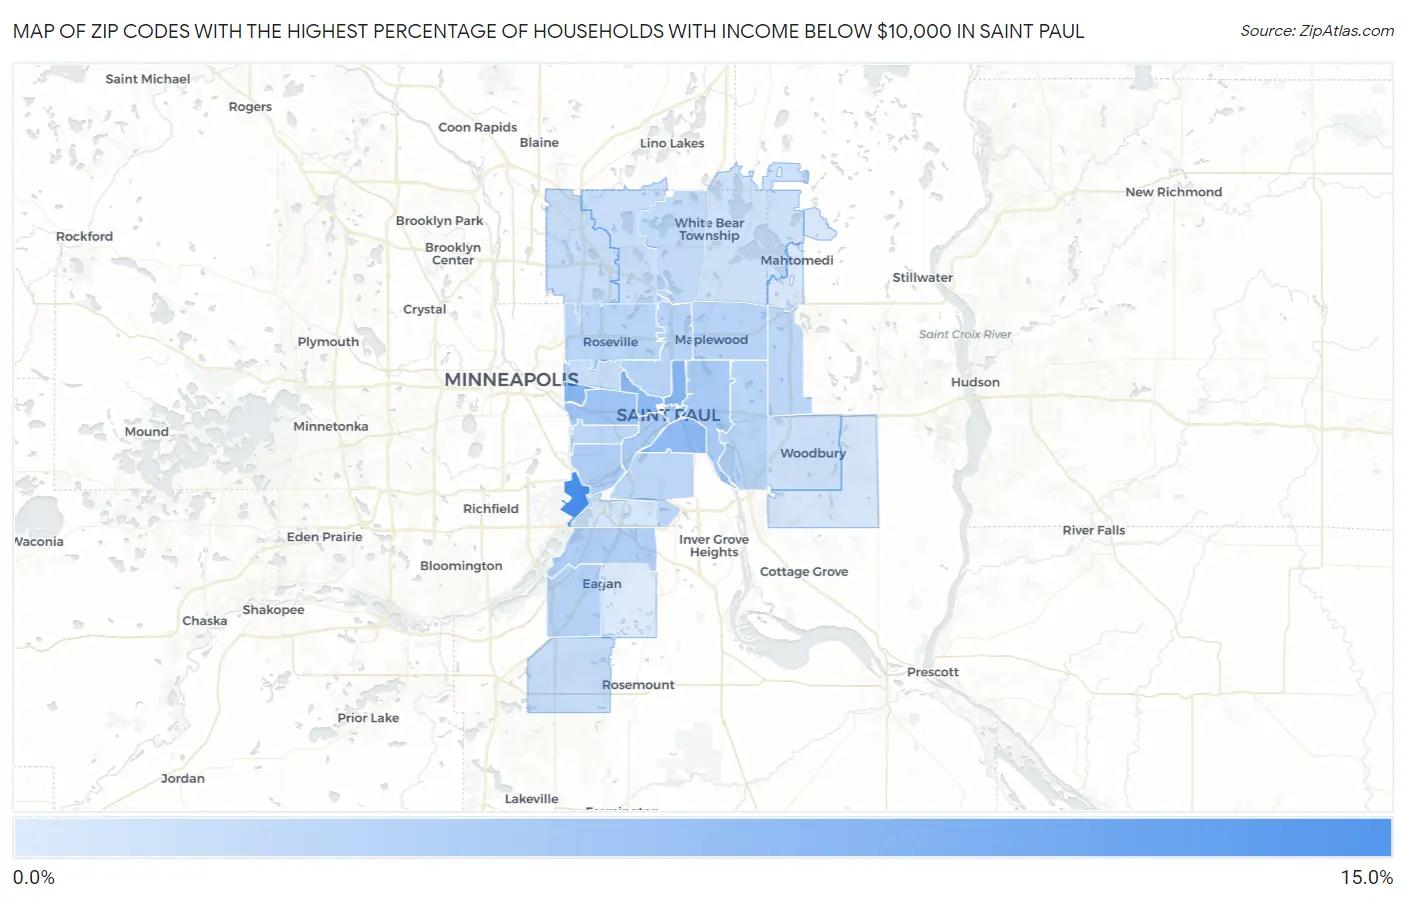
Map of Zip Codes with the Highest Percentage of Households with Income Below $10,000 in Saint Paul

0.0%
15.0%
Zip Codes with the Highest Percentage of Households with Income Below $10,000 in Saint Paul Map

Zip Codes with the Highest Percentage of Households with Income Below $10,000 in Saint Paul, MN

Zip Code Households with Income < $10k vs State vs National
1.5511115.0%3.6%(+11.4)#134.9%(+10.1)#1,533
2.551308.9%3.6%(+5.30)#414.9%(+4.00)#4,514
3.551148.5%3.6%(+4.90)#464.9%(+3.60)#4,963
4.551038.1%3.6%(+4.50)#524.9%(+3.20)#5,430
5.551077.9%3.6%(+4.30)#554.9%(+3.00)#5,697
6.551046.2%3.6%(+2.60)#1064.9%(+1.30)#8,516
7.551015.5%3.6%(+1.90)#1384.9%(+0.600)#10,292
8.551065.4%3.6%(+1.80)#1454.9%(+0.500)#10,435
9.551025.2%3.6%(+1.60)#1634.9%(+0.300)#11,105
10.551164.6%3.6%(+1.000)#2124.9%(-0.300)#13,037
11.551214.4%3.6%(+0.800)#2354.9%(-0.500)#13,804
12.551224.1%3.6%(+0.500)#2724.9%(-0.800)#14,855
13.551173.9%3.6%(+0.300)#2984.9%(-1.00)#15,595
14.551093.8%3.6%(+0.200)#3134.9%(-1.10)#16,005
15.551193.7%3.6%(+0.100)#3264.9%(-1.20)#16,388
16.551133.7%3.6%(+0.100)#3274.9%(-1.20)#16,396
17.551283.4%3.6%(-0.200)#3714.9%(-1.50)#17,673
18.551183.3%3.6%(-0.300)#3894.9%(-1.60)#18,104
19.551053.3%3.6%(-0.300)#3914.9%(-1.60)#18,110
20.551272.7%3.6%(-0.900)#4854.9%(-2.20)#20,754
21.551242.6%3.6%(-1.00)#5004.9%(-2.30)#21,049
22.551262.4%3.6%(-1.20)#5394.9%(-2.50)#22,042
23.551082.4%3.6%(-1.20)#5404.9%(-2.50)#22,096
24.551122.2%3.6%(-1.40)#5744.9%(-2.70)#22,833
25.551251.8%3.6%(-1.80)#6504.9%(-3.10)#24,336
26.551101.7%3.6%(-1.90)#6694.9%(-3.20)#24,696
27.551291.1%3.6%(-2.50)#7504.9%(-3.80)#26,518
28.551201.1%3.6%(-2.50)#7544.9%(-3.80)#26,606
29.551150.80%3.6%(-2.80)#7884.9%(-4.10)#27,284
30.551230.40%3.6%(-3.20)#8144.9%(-4.50)#27,988

Common Questions

What are the Top 10 Zip Codes with the Highest Percentage of Households with Income Below $10,000 in Saint Paul, MN?
Top 10 Zip Codes with the Highest Percentage of Households with Income Below $10,000 in Saint Paul, MN are:
#1
15.0%
#2
8.9%
#3
8.5%
#4
8.1%
#5
7.9%
#6
6.2%
#7
5.5%
#8
5.4%
#9
5.2%
#10
4.6%
What zip code has the Highest Percentage of Households with Income Below $10,000 in Saint Paul, MN?
55111 has the Highest Percentage of Households with Income Below $10,000 in Saint Paul, MN with 15.0%.
What is the Percentage of Households with Income Below $10,000 in Minnesota?
Percentage of Households with Income Below $10,000 in Minnesota is 3.6%.
What is the Percentage of Households with Income Below $10,000 in the United States?
Percentage of Households with Income Below $10,000 in the United States is 4.9%.