Zip Codes with the Highest Percentage of Households with Income Below $10,000 in Minneapolis, MN

RELATED REPORTS & OPTIONS

Household Income | $0-10k
Population
Families and Households
Female Fertility
Female Fertility (Unmarried)
Race (Community Size)
Race (Percentage)
Ancestry (Community Size)
AfghanAfricanAlaska NativeAlbanianAlsatianAmericanApacheArabArgentineanArmenianAssyrian / Chaldean / SyriacAustralianAustrianBahamianBangladeshiBarbadianBasqueBelgianBelizeanBhutaneseBlackfeetBolivianBrazilianBritishBritish West IndianBulgarianBurmeseCajunCambodianCanadianCape VerdeanCarpatho RusynCelticCentral AmericanCentral American IndianCherokeeCheyenneChickasawChileanChippewaChoctawColombianComancheCosta RicanCreeCreekCroatianCrowCubanCypriotCzechCzechoslovakianDanishDominicanDutchEastern EuropeanEcuadorianEgyptianEnglishEstonianEthiopianEuropeanFijianFilipinoFinnishFrenchFrench American IndianFrench CanadianGermanGerman RussianGhanaianGreekGuamanian / ChamorroGuatemalanGuyaneseHaitianHonduranHungarianIcelanderIndian (Asian)IndonesianInupiatIranianIraqiIrishIroquoisIsraeliItalianJamaicanJapaneseJordanianKenyanKoreanLaotianLatvianLebaneseLiberianLithuanianLuxembourgerMacedonianMalaysianMalteseMenomineeMexicanMexican American IndianMongolianMoroccanNative HawaiianNavajoNicaraguanNigerianNorthern EuropeanNorwegianOkinawanOsagePakistaniPalestinianPanamanianParaguayanPennsylvania GermanPeruvianPolishPortuguesePotawatomiPuerto RicanRomanianRussianSalvadoranSamoanScandinavianScotch-IrishScottishSenegaleseSerbianSierra LeoneanSiouxSlavicSlovakSloveneSomaliSouth AfricanSouth AmericanSouth American IndianSoviet UnionSpaniardSpanishSri LankanSubsaharan AfricanSudaneseSwedishSwissSyrianThaiTonganTrinidadian and TobagonianTurkishUgandanUkrainianUruguayanVenezuelanVietnameseWelshWest IndianYugoslavian
Ancestry (Percentage)
AfghanAfricanAlaska NativeAlbanianAlsatianAmericanApacheArabArgentineanArmenianAssyrian / Chaldean / SyriacAustralianAustrianBahamianBangladeshiBarbadianBasqueBelgianBelizeanBhutaneseBlackfeetBolivianBrazilianBritishBritish West IndianBulgarianBurmeseCajunCambodianCanadianCape VerdeanCarpatho RusynCelticCentral AmericanCentral American IndianCherokeeCheyenneChickasawChileanChippewaChoctawColombianComancheCosta RicanCreeCreekCroatianCrowCubanCypriotCzechCzechoslovakianDanishDominicanDutchEastern EuropeanEcuadorianEgyptianEnglishEstonianEthiopianEuropeanFijianFilipinoFinnishFrenchFrench American IndianFrench CanadianGermanGerman RussianGhanaianGreekGuamanian / ChamorroGuatemalanGuyaneseHaitianHonduranHungarianIcelanderIndian (Asian)IndonesianInupiatIranianIraqiIrishIroquoisIsraeliItalianJamaicanJapaneseJordanianKenyanKoreanLaotianLatvianLebaneseLiberianLithuanianLuxembourgerMacedonianMalaysianMalteseMenomineeMexicanMexican American IndianMongolianMoroccanNative HawaiianNavajoNicaraguanNigerianNorthern EuropeanNorwegianOkinawanOsagePakistaniPalestinianPanamanianParaguayanPennsylvania GermanPeruvianPolishPortuguesePotawatomiPuerto RicanRomanianRussianSalvadoranSamoanScandinavianScotch-IrishScottishSenegaleseSerbianSierra LeoneanSiouxSlavicSlovakSloveneSomaliSouth AfricanSouth AmericanSouth American IndianSoviet UnionSpaniardSpanishSri LankanSubsaharan AfricanSudaneseSwedishSwissSyrianThaiTonganTrinidadian and TobagonianTurkishUgandanUkrainianUruguayanVenezuelanVietnameseWelshWest IndianYugoslavian
Immigrant Origin (Total)
AfghanistanAfricaAlbaniaArgentinaAsiaAustraliaAustriaBahamasBangladeshBarbadosBelarusBelgiumBelizeBoliviaBosnia and HerzegovinaBrazilBulgariaBurma / MyanmarCabo VerdeCambodiaCameroonCanadaCaribbeanCentral AmericaChileChinaColombiaCongoCosta RicaCroatiaCubaCzechoslovakiaDenmarkDominican RepublicEastern AfricaEastern AsiaEastern EuropeEcuadorEgyptEl SalvadorEnglandEritreaEthiopiaEuropeFranceGermanyGhanaGreeceGuatemalaGuyanaHaitiHondurasHong KongHungaryIndiaIndonesiaIranIraqIrelandIsraelItalyJamaicaJapanJordanKazakhstanKenyaKoreaKuwaitLaosLatin AmericaLatviaLebanonLiberiaLithuaniaMalaysiaMexicoMicronesiaMiddle AfricaMoldovaMoroccoNepalNetherlandsNicaraguaNigeriaNorthern AfricaNorthern EuropeNorwayOceaniaPakistanPanamaPeruPhilippinesPolandRomaniaRussiaSaudi ArabiaScotlandSenegalSerbiaSierra LeoneSingaporeSomaliaSouth AfricaSouth AmericaSouth Central AsiaSouth Eastern AsiaSouthern EuropeSpainSri LankaSudanSwedenSwitzerlandSyriaTaiwanThailandTrinidad and TobagoTurkeyUgandaUkraineUruguayUzbekistanVenezuelaVietnamWestern AfricaWestern AsiaWestern EuropeYemenZaireZimbabwe
Immigrant Origin (Percentage)
AfghanistanAfricaAlbaniaArgentinaAsiaAustraliaAustriaBahamasBangladeshBarbadosBelarusBelgiumBelizeBoliviaBosnia and HerzegovinaBrazilBulgariaBurma / MyanmarCabo VerdeCambodiaCameroonCanadaCaribbeanCentral AmericaChileChinaColombiaCongoCosta RicaCroatiaCubaCzechoslovakiaDenmarkDominican RepublicEastern AfricaEastern AsiaEastern EuropeEcuadorEgyptEl SalvadorEnglandEritreaEthiopiaEuropeFranceGermanyGhanaGreeceGuatemalaGuyanaHaitiHondurasHong KongHungaryIndiaIndonesiaIranIraqIrelandIsraelItalyJamaicaJapanJordanKazakhstanKenyaKoreaKuwaitLaosLatin AmericaLatviaLebanonLiberiaLithuaniaMalaysiaMexicoMicronesiaMiddle AfricaMoldovaMoroccoNepalNetherlandsNicaraguaNigeriaNorthern AfricaNorthern EuropeNorwayOceaniaPakistanPanamaPeruPhilippinesPolandRomaniaRussiaSaudi ArabiaScotlandSenegalSerbiaSierra LeoneSingaporeSomaliaSouth AfricaSouth AmericaSouth Central AsiaSouth Eastern AsiaSouthern EuropeSpainSri LankaSudanSwedenSwitzerlandSyriaTaiwanThailandTrinidad and TobagoTurkeyUgandaUkraineUruguayUzbekistanVenezuelaVietnamWestern AfricaWestern AsiaWestern EuropeYemenZaireZimbabwe
Income
Income (Families)
Income (Households)
Poverty
Poverty (Families)
Unemployment
Employment Occupations
Employment Industries
Employer Class
Commute Time
Commute Means
School Enrollment
Education by Degree Field
Occupancy
Finances
Physical Characteristics
Minneapolis
Compare Zip Codes
Comparison Subject

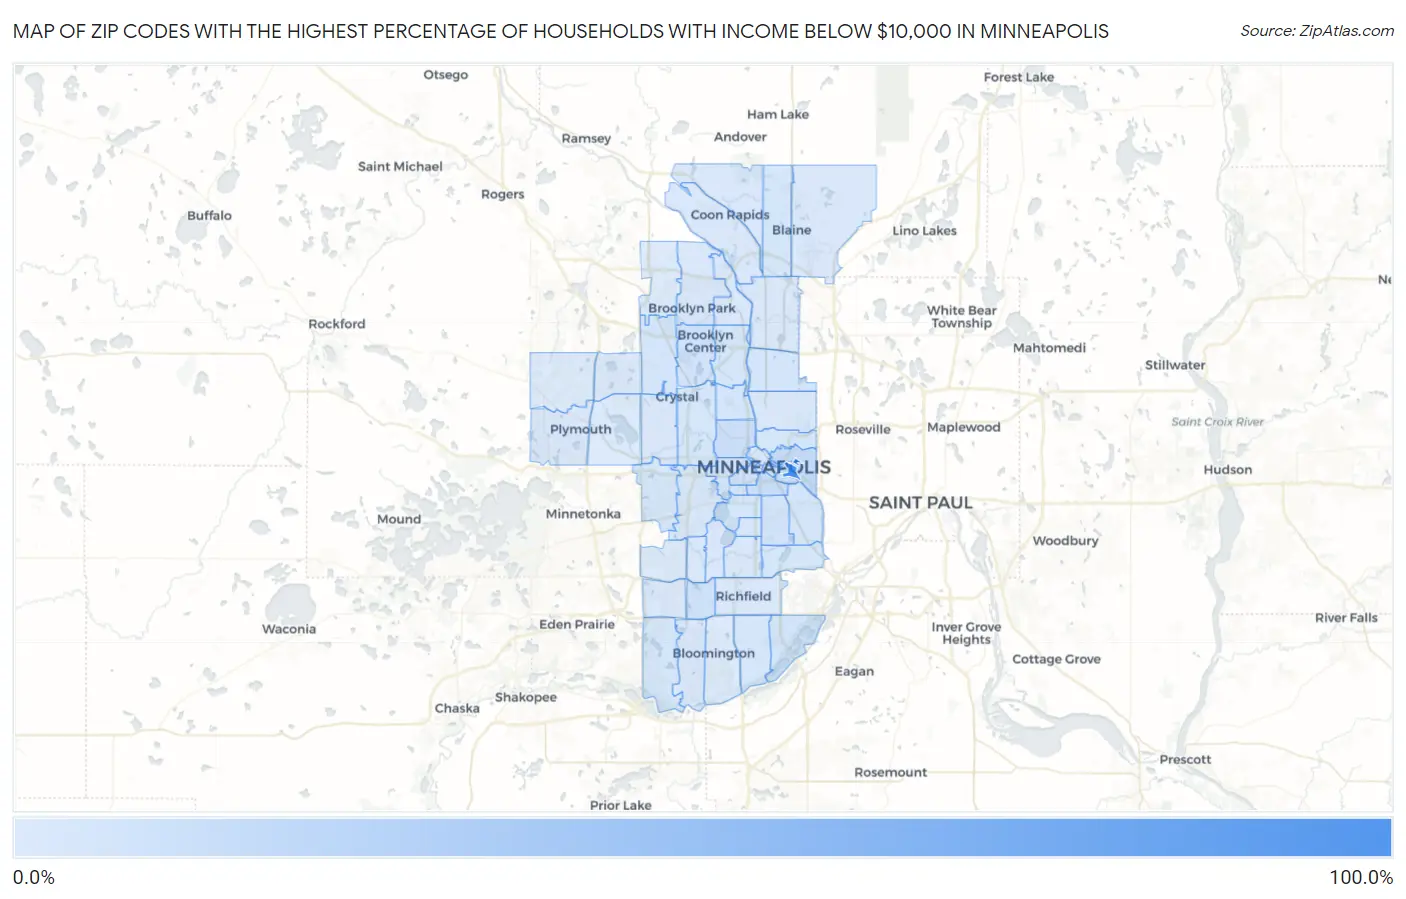
Map of Zip Codes with the Highest Percentage of Households with Income Below $10,000 in Minneapolis

0.0%
100.0%
Zip Codes with the Highest Percentage of Households with Income Below $10,000 in Minneapolis Map

Zip Codes with the Highest Percentage of Households with Income Below $10,000 in Minneapolis, MN

Zip Code Households with Income < $10k vs State vs National
1.55455100.0%3.6%(+96.4)#14.9%(+95.1)#1
2.5545412.0%3.6%(+8.40)#234.9%(+7.10)#2,460
3.5541411.8%3.6%(+8.20)#264.9%(+6.90)#2,540
4.5540410.9%3.6%(+7.30)#324.9%(+6.00)#3,000
5.5541110.0%3.6%(+6.40)#374.9%(+5.10)#3,567
6.554357.5%3.6%(+3.90)#664.9%(+2.60)#6,230
7.554037.1%3.6%(+3.50)#754.9%(+2.20)#6,803
8.554076.8%3.6%(+3.20)#844.9%(+1.90)#7,309
9.554296.3%3.6%(+2.70)#1014.9%(+1.40)#8,333
10.554055.6%3.6%(+2.00)#1274.9%(+0.700)#10,012
11.554255.6%3.6%(+2.00)#1284.9%(+0.700)#10,030
12.554155.3%3.6%(+1.70)#1544.9%(+0.400)#10,861
13.554215.2%3.6%(+1.60)#1614.9%(+0.300)#11,064
14.554125.2%3.6%(+1.60)#1624.9%(+0.300)#11,088
15.554285.0%3.6%(+1.40)#1744.9%(+0.100)#11,678
16.554064.8%3.6%(+1.20)#1924.9%(-0.100)#12,301
17.554084.8%3.6%(+1.20)#1934.9%(-0.100)#12,310
18.554344.5%3.6%(+0.900)#2204.9%(-0.400)#13,359
19.554304.5%3.6%(+0.900)#2214.9%(-0.400)#13,389
20.554024.4%3.6%(+0.800)#2414.9%(-0.500)#13,976
21.554204.3%3.6%(+0.700)#2454.9%(-0.600)#14,105
22.554134.2%3.6%(+0.600)#2664.9%(-0.700)#14,556
23.554223.9%3.6%(+0.300)#3004.9%(-1.00)#15,642
24.554173.8%3.6%(+0.200)#3164.9%(-1.10)#16,045
25.554263.6%3.6%(=0.000)#3434.9%(-1.30)#16,868
26.554383.6%3.6%(=0.000)#3444.9%(-1.30)#16,906
27.554273.2%3.6%(-0.400)#4074.9%(-1.70)#18,528
28.554093.2%3.6%(-0.400)#4094.9%(-1.70)#18,608
29.554163.1%3.6%(-0.500)#4204.9%(-1.80)#18,903
30.554182.9%3.6%(-0.700)#4534.9%(-2.00)#19,829
31.554322.6%3.6%(-1.00)#5014.9%(-2.30)#21,096
32.554192.6%3.6%(-1.00)#5024.9%(-2.30)#21,107
33.554422.5%3.6%(-1.10)#5254.9%(-2.40)#21,657
34.554012.4%3.6%(-1.20)#5414.9%(-2.50)#22,121
35.554242.4%3.6%(-1.20)#5424.9%(-2.50)#22,128
36.554232.3%3.6%(-1.30)#5534.9%(-2.60)#22,433
37.554372.3%3.6%(-1.30)#5544.9%(-2.60)#22,491
38.554332.2%3.6%(-1.40)#5754.9%(-2.70)#22,857
39.554472.0%3.6%(-1.60)#6174.9%(-2.90)#23,644
40.554391.9%3.6%(-1.70)#6364.9%(-3.00)#24,089
41.554491.7%3.6%(-1.90)#6704.9%(-3.20)#24,705
42.554441.7%3.6%(-1.90)#6714.9%(-3.20)#24,756
43.554481.6%3.6%(-2.00)#6894.9%(-3.30)#25,093
44.554101.6%3.6%(-2.00)#6904.9%(-3.30)#25,111
45.554431.5%3.6%(-2.10)#7014.9%(-3.40)#25,407
46.554461.4%3.6%(-2.20)#7134.9%(-3.50)#25,722
47.554311.4%3.6%(-2.20)#7144.9%(-3.50)#25,737
48.554411.1%3.6%(-2.50)#7514.9%(-3.80)#26,537
49.554361.1%3.6%(-2.50)#7534.9%(-3.80)#26,547
50.554450.90%3.6%(-2.70)#7754.9%(-4.00)#27,045

Common Questions

What are the Top 10 Zip Codes with the Highest Percentage of Households with Income Below $10,000 in Minneapolis, MN?
Top 10 Zip Codes with the Highest Percentage of Households with Income Below $10,000 in Minneapolis, MN are:
#1
100.0%
#2
12.0%
#3
11.8%
#4
10.9%
#5
10.0%
#6
7.5%
#7
7.1%
#8
6.8%
#9
6.3%
#10
5.6%
What zip code has the Highest Percentage of Households with Income Below $10,000 in Minneapolis, MN?
55455 has the Highest Percentage of Households with Income Below $10,000 in Minneapolis, MN with 100.0%.
What is the Percentage of Households with Income Below $10,000 in Minneapolis, MN?
Percentage of Households with Income Below $10,000 in Minneapolis is 5.9%.
What is the Percentage of Households with Income Below $10,000 in Minnesota?
Percentage of Households with Income Below $10,000 in Minnesota is 3.6%.
What is the Percentage of Households with Income Below $10,000 in the United States?
Percentage of Households with Income Below $10,000 in the United States is 4.9%.