Breckenridge, MN Map & Demographics
Breckenridge Map
Breckenridge Overview
$35,658
PER CAPITA INCOME
$82,625
AVG FAMILY INCOME
$57,094
AVG HOUSEHOLD INCOME
35.5%
WAGE / INCOME GAP [ % ]
64.5¢/ $1
WAGE / INCOME GAP [ $ ]
0.50
INEQUALITY / GINI INDEX
3,390
TOTAL POPULATION
1,768
MALE POPULATION
1,622
FEMALE POPULATION
109.00
MALES / 100 FEMALES
91.74
FEMALES / 100 MALES
41.3
MEDIAN AGE
3.1
AVG FAMILY SIZE
2.3
AVG HOUSEHOLD SIZE
1,761
LABOR FORCE [ PEOPLE ]
64.1%
PERCENT IN LABOR FORCE
7.5%
UNEMPLOYMENT RATE
Breckenridge Zip Codes
Breckenridge Area Codes
Income in Breckenridge
Income Overview in Breckenridge
Per Capita Income in Breckenridge is $35,658, while median incomes of families and households are $82,625 and $57,094 respectively.
| Characteristic | Number | Measure |
| Per Capita Income | 3,390 | $35,658 |
| Median Family Income | 716 | $82,625 |
| Mean Family Income | 716 | $93,261 |
| Median Household Income | 1,441 | $57,094 |
| Mean Household Income | 1,441 | $79,555 |
| Income Deficit | 716 | $0 |
| Wage / Income Gap (%) | 3,390 | 35.45% |
| Wage / Income Gap ($) | 3,390 | 64.55¢ per $1 |
| Gini / Inequality Index | 3,390 | 0.50 |
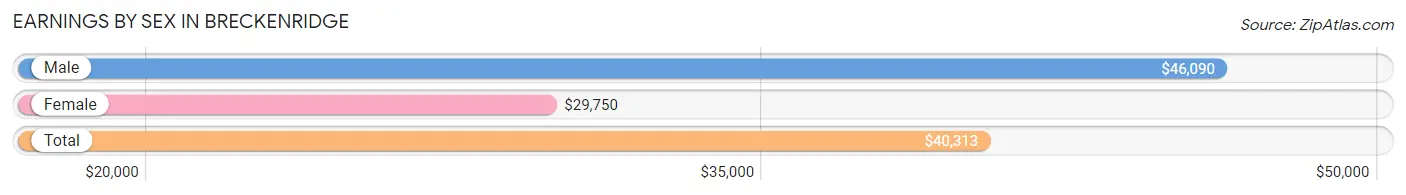
Earnings by Sex in Breckenridge
Average Earnings in Breckenridge are $40,313, $46,090 for men and $29,750 for women, a difference of 35.4%.
| Sex | Number | Average Earnings |
| Male | 1,062 (57.3%) | $46,090 |
| Female | 792 (42.7%) | $29,750 |
| Total | 1,854 (100.0%) | $40,313 |
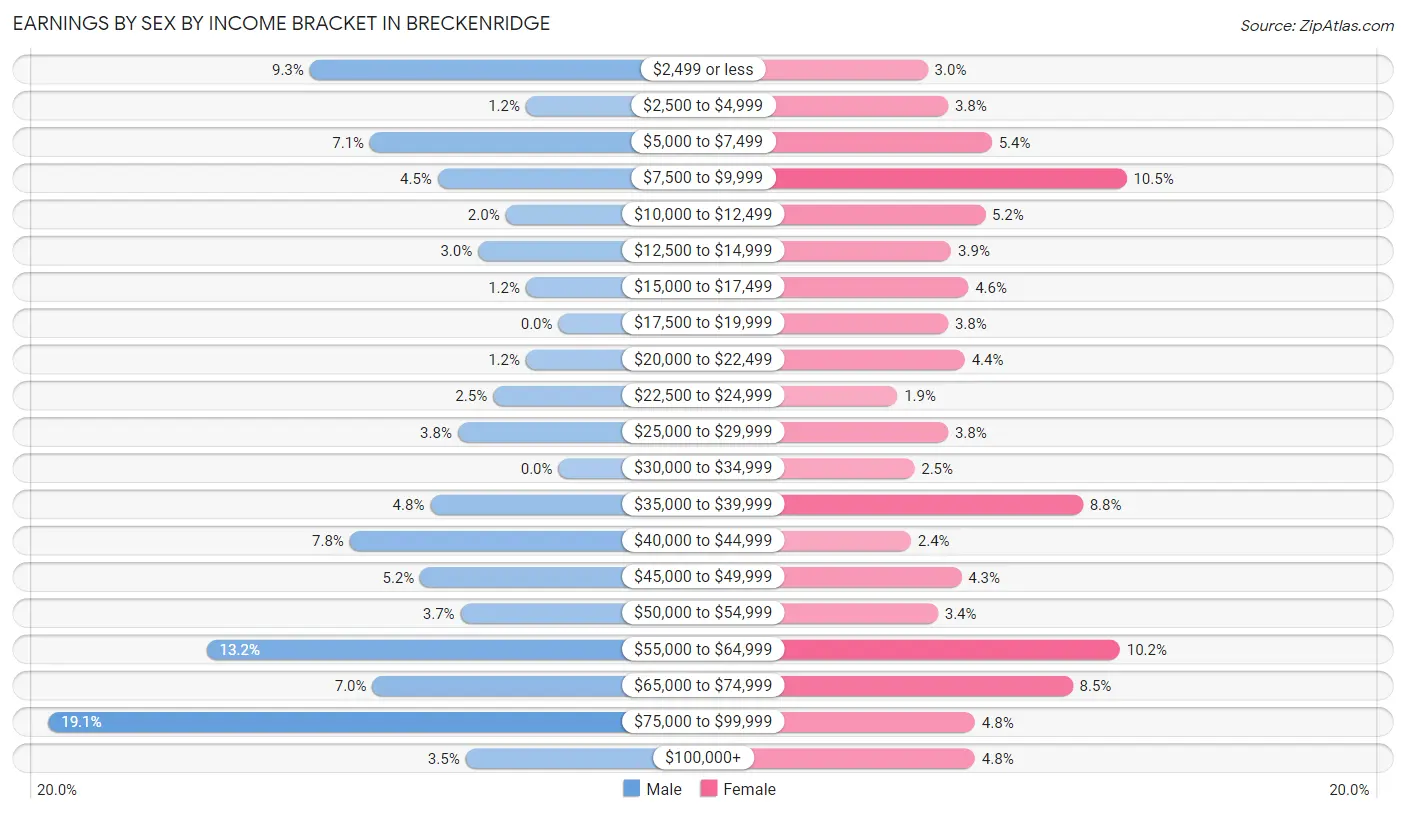
Earnings by Sex by Income Bracket in Breckenridge
The most common earnings brackets in Breckenridge are $75,000 to $99,999 for men (203 | 19.1%) and $7,500 to $9,999 for women (83 | 10.5%).
| Income | Male | Female |
| $2,499 or less | 99 (9.3%) | 24 (3.0%) |
| $2,500 to $4,999 | 13 (1.2%) | 30 (3.8%) |
| $5,000 to $7,499 | 75 (7.1%) | 43 (5.4%) |
| $7,500 to $9,999 | 48 (4.5%) | 83 (10.5%) |
| $10,000 to $12,499 | 21 (2.0%) | 41 (5.2%) |
| $12,500 to $14,999 | 32 (3.0%) | 31 (3.9%) |
| $15,000 to $17,499 | 13 (1.2%) | 36 (4.5%) |
| $17,500 to $19,999 | 0 (0.0%) | 30 (3.8%) |
| $20,000 to $22,499 | 13 (1.2%) | 35 (4.4%) |
| $22,500 to $24,999 | 26 (2.5%) | 15 (1.9%) |
| $25,000 to $29,999 | 40 (3.8%) | 30 (3.8%) |
| $30,000 to $34,999 | 0 (0.0%) | 20 (2.5%) |
| $35,000 to $39,999 | 51 (4.8%) | 70 (8.8%) |
| $40,000 to $44,999 | 83 (7.8%) | 19 (2.4%) |
| $45,000 to $49,999 | 55 (5.2%) | 34 (4.3%) |
| $50,000 to $54,999 | 39 (3.7%) | 27 (3.4%) |
| $55,000 to $64,999 | 140 (13.2%) | 81 (10.2%) |
| $65,000 to $74,999 | 74 (7.0%) | 67 (8.5%) |
| $75,000 to $99,999 | 203 (19.1%) | 38 (4.8%) |
| $100,000+ | 37 (3.5%) | 38 (4.8%) |
| Total | 1,062 (100.0%) | 792 (100.0%) |
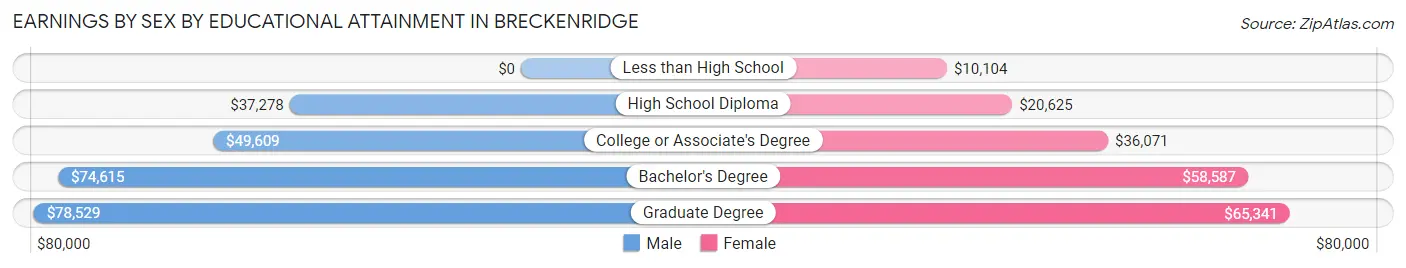
Earnings by Sex by Educational Attainment in Breckenridge
Average earnings in Breckenridge are $48,516 for men and $35,400 for women, a difference of 27.0%. Men with an educational attainment of graduate degree enjoy the highest average annual earnings of $78,529, while those with high school diploma education earn the least with $37,278. Women with an educational attainment of graduate degree earn the most with the average annual earnings of $65,341, while those with less than high school education have the smallest earnings of $10,104.
| Educational Attainment | Male Income | Female Income |
| Less than High School | - | - |
| High School Diploma | $37,278 | $20,625 |
| College or Associate's Degree | $49,609 | $36,071 |
| Bachelor's Degree | $74,615 | $58,587 |
| Graduate Degree | $78,529 | $65,341 |
| Total | $48,516 | $35,400 |
Family Income in Breckenridge
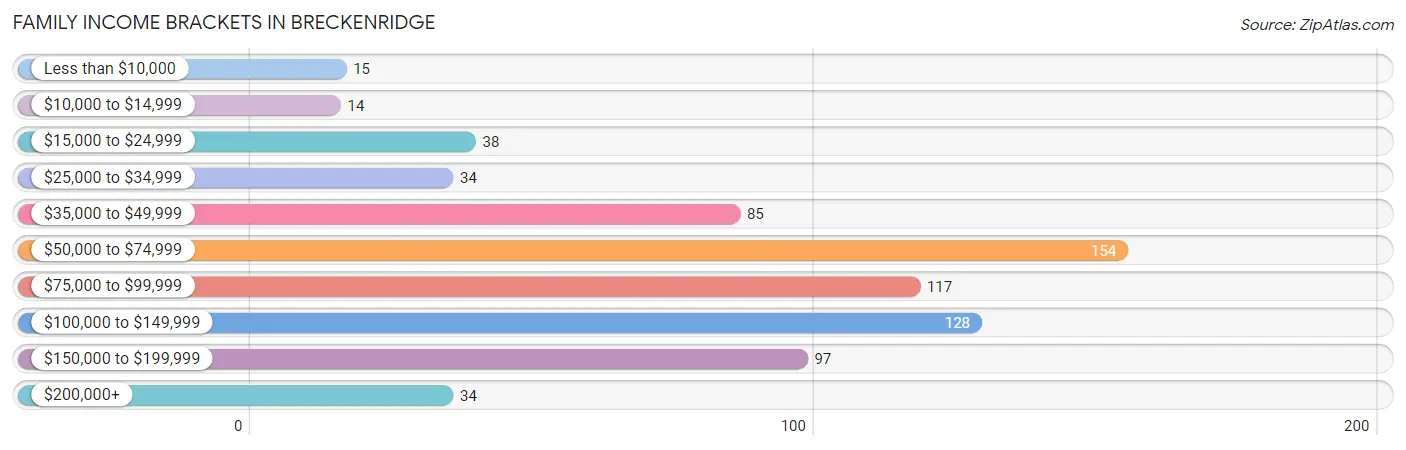
Family Income Brackets in Breckenridge
According to the Breckenridge family income data, there are 154 families falling into the $50,000 to $74,999 income range, which is the most common income bracket and makes up 21.5% of all families. Conversely, the $10,000 to $14,999 income bracket is the least frequent group with only 14 families (2.0%) belonging to this category.
| Income Bracket | # Families | % Families |
| Less than $10,000 | 15 | 2.1% |
| $10,000 to $14,999 | 14 | 2.0% |
| $15,000 to $24,999 | 38 | 5.3% |
| $25,000 to $34,999 | 34 | 4.7% |
| $35,000 to $49,999 | 85 | 11.9% |
| $50,000 to $74,999 | 154 | 21.5% |
| $75,000 to $99,999 | 117 | 16.3% |
| $100,000 to $149,999 | 128 | 17.9% |
| $150,000 to $199,999 | 97 | 13.5% |
| $200,000+ | 34 | 4.7% |
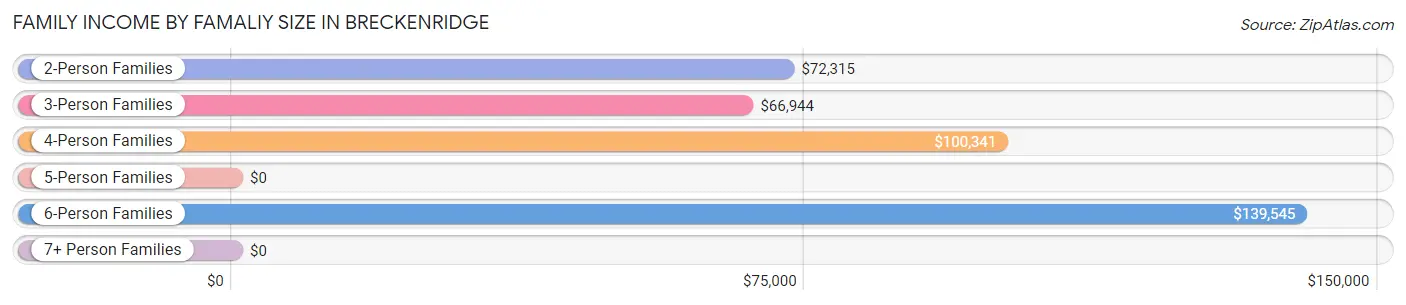
Family Income by Famaliy Size in Breckenridge
6-person families (48 | 6.7%) account for the highest median family income in Breckenridge with $139,545 per family, while 2-person families (324 | 45.3%) have the highest median income of $36,158 per family member.
| Income Bracket | # Families | Median Income |
| 2-Person Families | 324 (45.3%) | $72,315 |
| 3-Person Families | 180 (25.1%) | $66,944 |
| 4-Person Families | 123 (17.2%) | $100,341 |
| 5-Person Families | 28 (3.9%) | $0 |
| 6-Person Families | 48 (6.7%) | $139,545 |
| 7+ Person Families | 13 (1.8%) | $0 |
| Total | 716 (100.0%) | $82,625 |
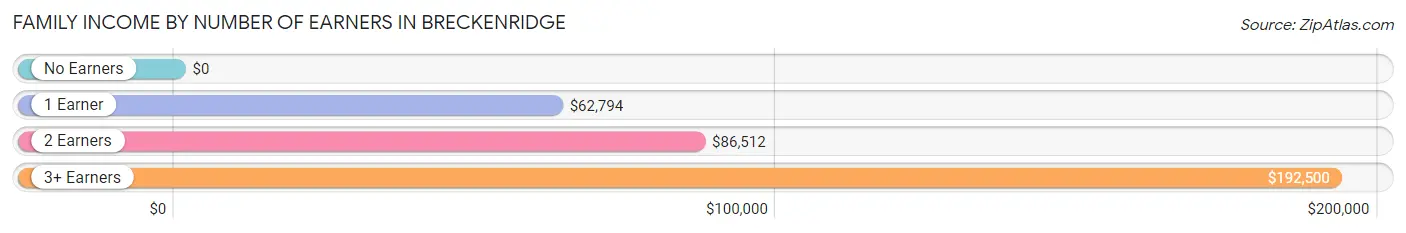
Family Income by Number of Earners in Breckenridge
| Number of Earners | # Families | Median Income |
| No Earners | 58 (8.1%) | $0 |
| 1 Earner | 172 (24.0%) | $62,794 |
| 2 Earners | 436 (60.9%) | $86,512 |
| 3+ Earners | 50 (7.0%) | $192,500 |
| Total | 716 (100.0%) | $82,625 |
Household Income in Breckenridge
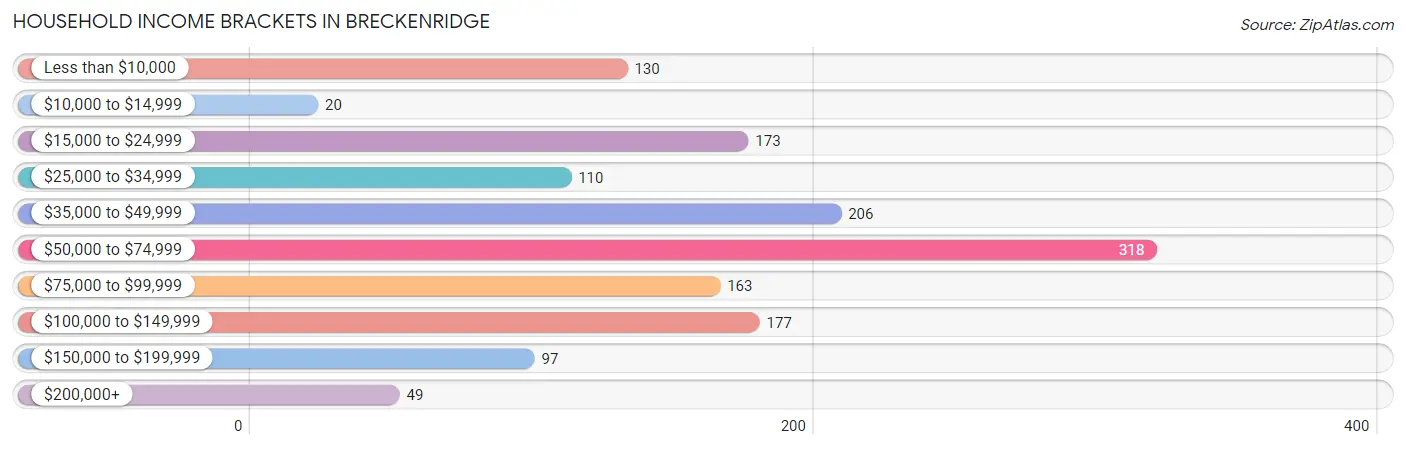
Household Income Brackets in Breckenridge
With 318 households falling in the category, the $50,000 to $74,999 income range is the most frequent in Breckenridge, accounting for 22.1% of all households. In contrast, only 20 households (1.4%) fall into the $10,000 to $14,999 income bracket, making it the least populous group.
| Income Bracket | # Households | % Households |
| Less than $10,000 | 130 | 9.0% |
| $10,000 to $14,999 | 20 | 1.4% |
| $15,000 to $24,999 | 173 | 12.0% |
| $25,000 to $34,999 | 110 | 7.6% |
| $35,000 to $49,999 | 206 | 14.3% |
| $50,000 to $74,999 | 318 | 22.1% |
| $75,000 to $99,999 | 163 | 11.3% |
| $100,000 to $149,999 | 177 | 12.3% |
| $150,000 to $199,999 | 97 | 6.7% |
| $200,000+ | 49 | 3.4% |
Household Income by Householder Age in Breckenridge
The median household income in Breckenridge is $57,094, with the highest median household income of $69,355 found in the 45 to 64 years age bracket for the primary householder. A total of 568 households (39.4%) fall into this category. Meanwhile, the 65+ years age bracket for the primary householder has the lowest median household income of $38,278, with 331 households (23.0%) in this group.
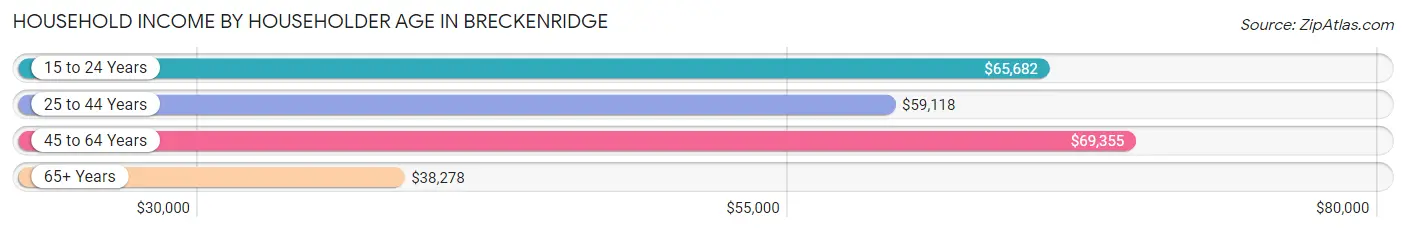
| Income Bracket | # Households | Median Income |
| 15 to 24 Years | 128 (8.9%) | $65,682 |
| 25 to 44 Years | 414 (28.7%) | $59,118 |
| 45 to 64 Years | 568 (39.4%) | $69,355 |
| 65+ Years | 331 (23.0%) | $38,278 |
| Total | 1,441 (100.0%) | $57,094 |
Poverty in Breckenridge
Income Below Poverty by Sex and Age in Breckenridge
With 13.4% poverty level for males and 28.7% for females among the residents of Breckenridge, 5 year old males and 18 to 24 year old females are the most vulnerable to poverty, with 11 males (44.0%) and 59 females (57.8%) in their respective age groups living below the poverty level.
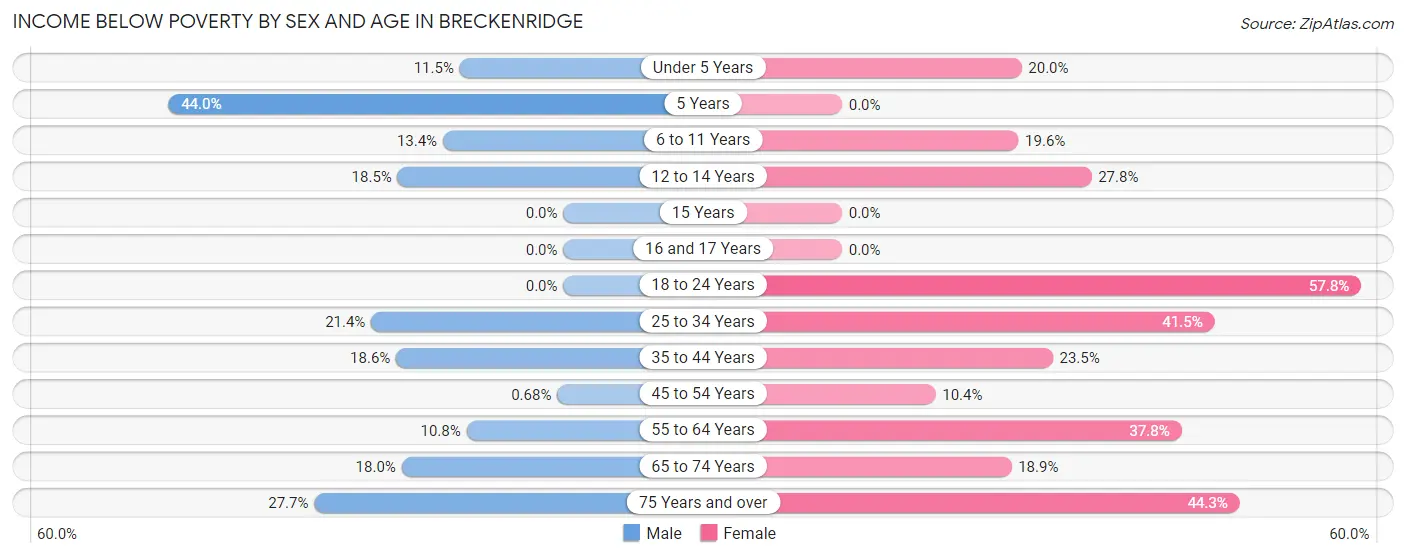
| Age Bracket | Male | Female |
| Under 5 Years | 12 (11.5%) | 14 (20.0%) |
| 5 Years | 11 (44.0%) | 0 (0.0%) |
| 6 to 11 Years | 11 (13.4%) | 22 (19.6%) |
| 12 to 14 Years | 19 (18.4%) | 15 (27.8%) |
| 15 Years | 0 (0.0%) | 0 (0.0%) |
| 16 and 17 Years | 0 (0.0%) | 0 (0.0%) |
| 18 to 24 Years | 0 (0.0%) | 59 (57.8%) |
| 25 to 34 Years | 46 (21.4%) | 66 (41.5%) |
| 35 to 44 Years | 35 (18.6%) | 50 (23.5%) |
| 45 to 54 Years | 1 (0.7%) | 23 (10.4%) |
| 55 to 64 Years | 29 (10.8%) | 101 (37.8%) |
| 65 to 74 Years | 29 (18.0%) | 20 (18.9%) |
| 75 Years and over | 38 (27.7%) | 74 (44.3%) |
| Total | 231 (13.4%) | 444 (28.7%) |
Income Above Poverty by Sex and Age in Breckenridge
According to the poverty statistics in Breckenridge, males aged 15 years and females aged 5 years are the age groups that are most secure financially, with 100.0% of males and 100.0% of females in these age groups living above the poverty line.
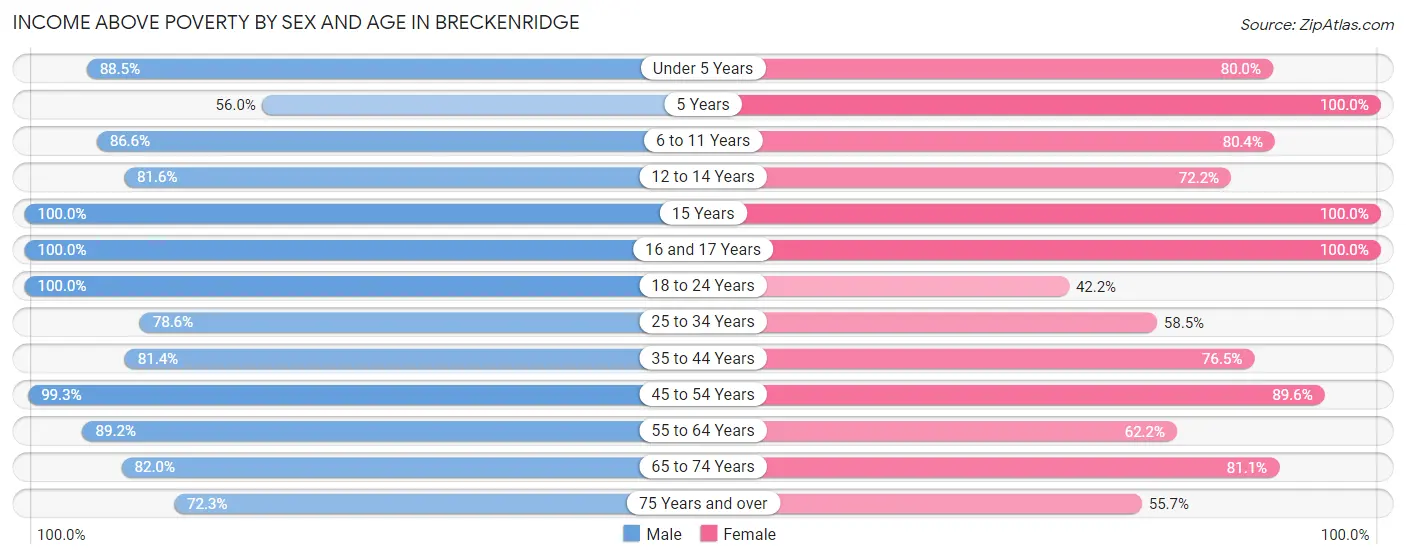
| Age Bracket | Male | Female |
| Under 5 Years | 92 (88.5%) | 56 (80.0%) |
| 5 Years | 14 (56.0%) | 22 (100.0%) |
| 6 to 11 Years | 71 (86.6%) | 90 (80.4%) |
| 12 to 14 Years | 84 (81.6%) | 39 (72.2%) |
| 15 Years | 19 (100.0%) | 33 (100.0%) |
| 16 and 17 Years | 48 (100.0%) | 21 (100.0%) |
| 18 to 24 Years | 225 (100.0%) | 43 (42.2%) |
| 25 to 34 Years | 169 (78.6%) | 93 (58.5%) |
| 35 to 44 Years | 153 (81.4%) | 163 (76.5%) |
| 45 to 54 Years | 145 (99.3%) | 198 (89.6%) |
| 55 to 64 Years | 240 (89.2%) | 166 (62.2%) |
| 65 to 74 Years | 132 (82.0%) | 86 (81.1%) |
| 75 Years and over | 99 (72.3%) | 93 (55.7%) |
| Total | 1,491 (86.6%) | 1,103 (71.3%) |
Income Below Poverty Among Married-Couple Families in Breckenridge
The poverty statistics for married-couple families in Breckenridge show that 5.7% or 29 of the total 505 families live below the poverty line. Families with 1 or 2 children have the highest poverty rate of 16.9%, comprising of 29 families. On the other hand, families with no children have the lowest poverty rate of 0.0%, which includes 0 families.
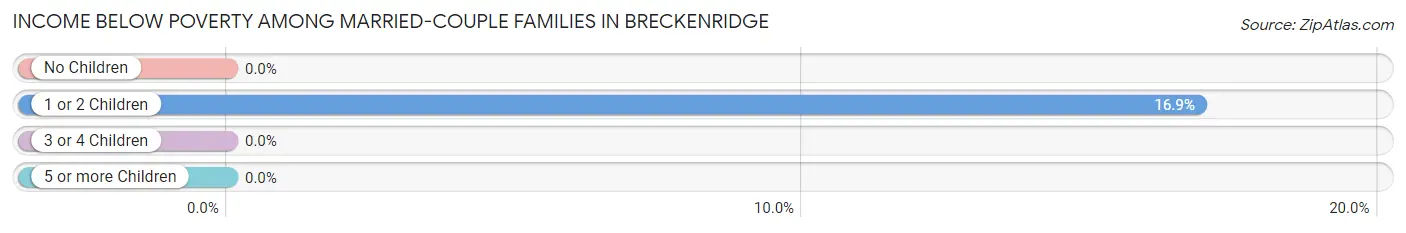
| Children | Above Poverty | Below Poverty |
| No Children | 251 (100.0%) | 0 (0.0%) |
| 1 or 2 Children | 143 (83.1%) | 29 (16.9%) |
| 3 or 4 Children | 82 (100.0%) | 0 (0.0%) |
| 5 or more Children | 0 (0.0%) | 0 (0.0%) |
| Total | 476 (94.3%) | 29 (5.7%) |
Income Below Poverty Among Single-Parent Households in Breckenridge
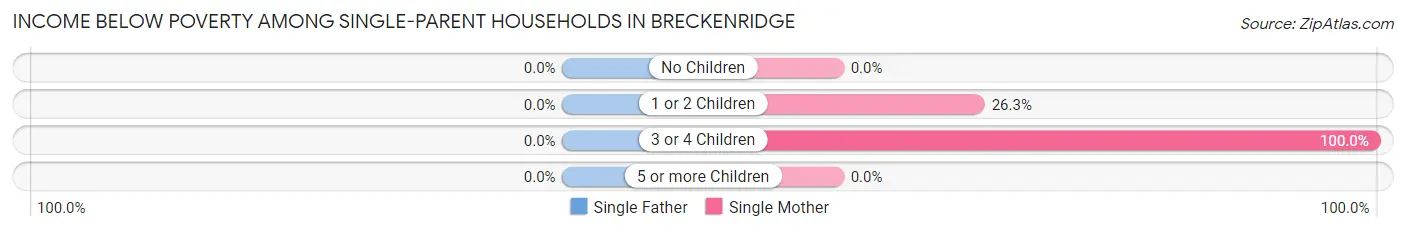
| Children | Single Father | Single Mother |
| No Children | 0 (0.0%) | 0 (0.0%) |
| 1 or 2 Children | 0 (0.0%) | 36 (26.3%) |
| 3 or 4 Children | 0 (0.0%) | 14 (100.0%) |
| 5 or more Children | 0 (0.0%) | 0 (0.0%) |
| Total | 0 (0.0%) | 50 (26.0%) |
Income Below Poverty Among Married-Couple vs Single-Parent Households in Breckenridge
The poverty data for Breckenridge shows that 29 of the married-couple family households (5.7%) and 50 of the single-parent households (23.7%) are living below the poverty level. Within the married-couple family households, those with 1 or 2 children have the highest poverty rate, with 29 households (16.9%) falling below the poverty line. Among the single-parent households, those with 3 or 4 children have the highest poverty rate, with 14 household (100.0%) living below poverty.
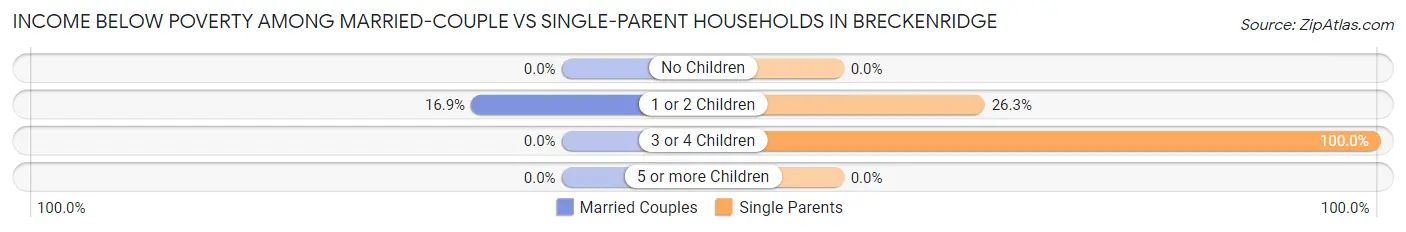
| Children | Married-Couple Families | Single-Parent Households |
| No Children | 0 (0.0%) | 0 (0.0%) |
| 1 or 2 Children | 29 (16.9%) | 36 (26.3%) |
| 3 or 4 Children | 0 (0.0%) | 14 (100.0%) |
| 5 or more Children | 0 (0.0%) | 0 (0.0%) |
| Total | 29 (5.7%) | 50 (23.7%) |
Race in Breckenridge
The most populous races in Breckenridge are White / Caucasian (3,233 | 95.4%), Hispanic or Latino (113 | 3.3%), and Some other Race (76 | 2.2%).
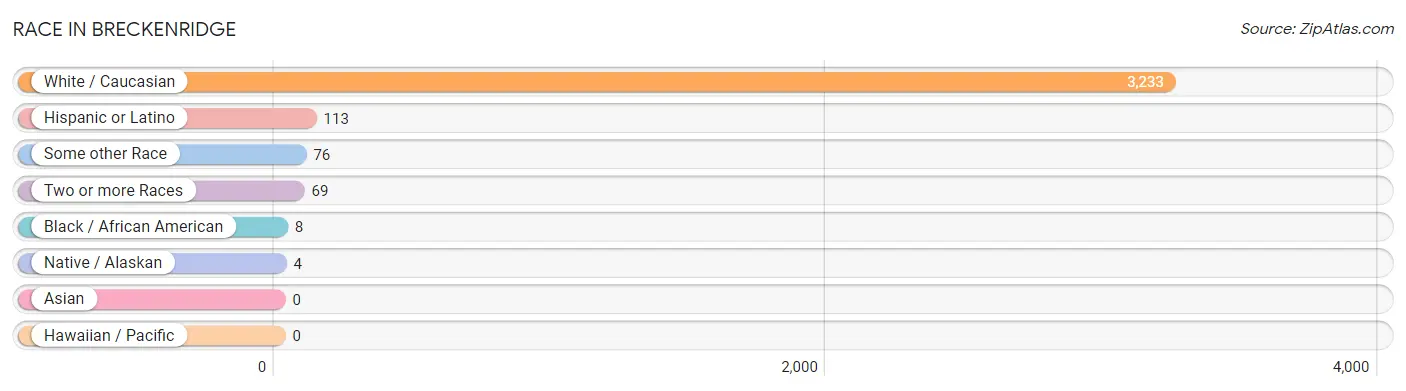
| Race | # Population | % Population |
| Asian | 0 | 0.0% |
| Black / African American | 8 | 0.2% |
| Hawaiian / Pacific | 0 | 0.0% |
| Hispanic or Latino | 113 | 3.3% |
| Native / Alaskan | 4 | 0.1% |
| White / Caucasian | 3,233 | 95.4% |
| Two or more Races | 69 | 2.0% |
| Some other Race | 76 | 2.2% |
| Total | 3,390 | 100.0% |
Ancestry in Breckenridge
The most populous ancestries reported in Breckenridge are German (1,462 | 43.1%), Norwegian (781 | 23.0%), Polish (243 | 7.2%), Irish (221 | 6.5%), and English (197 | 5.8%), together accounting for 85.7% of all Breckenridge residents.
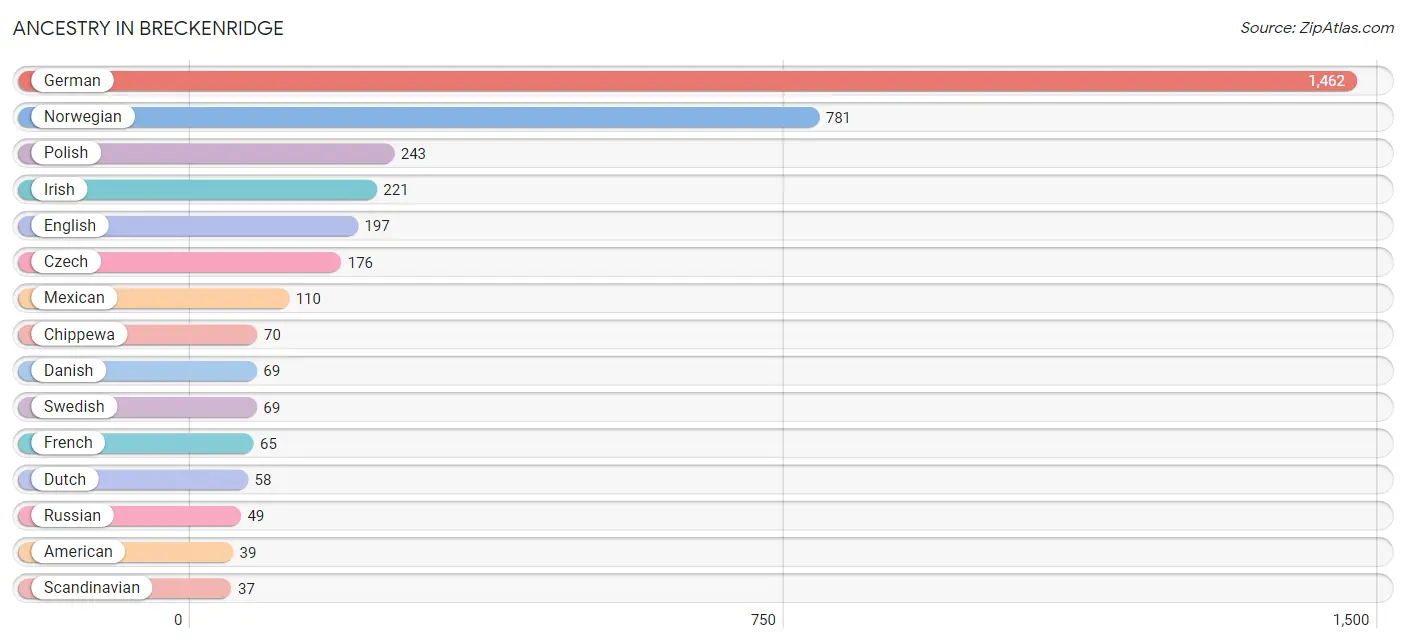
| Ancestry | # Population | % Population |
| American | 39 | 1.1% |
| Austrian | 5 | 0.2% |
| Belgian | 10 | 0.3% |
| Central American | 3 | 0.1% |
| Chippewa | 70 | 2.1% |
| Croatian | 5 | 0.2% |
| Czech | 176 | 5.2% |
| Czechoslovakian | 36 | 1.1% |
| Danish | 69 | 2.0% |
| Dutch | 58 | 1.7% |
| English | 197 | 5.8% |
| European | 15 | 0.4% |
| Finnish | 28 | 0.8% |
| French | 65 | 1.9% |
| French Canadian | 24 | 0.7% |
| German | 1,462 | 43.1% |
| Honduran | 3 | 0.1% |
| Irish | 221 | 6.5% |
| Italian | 10 | 0.3% |
| Mexican | 110 | 3.2% |
| Norwegian | 781 | 23.0% |
| Polish | 243 | 7.2% |
| Russian | 49 | 1.5% |
| Scandinavian | 37 | 1.1% |
| Scotch-Irish | 9 | 0.3% |
| Serbian | 17 | 0.5% |
| Swedish | 69 | 2.0% |
| Ukrainian | 28 | 0.8% | View All 28 Rows |
Immigrants in Breckenridge
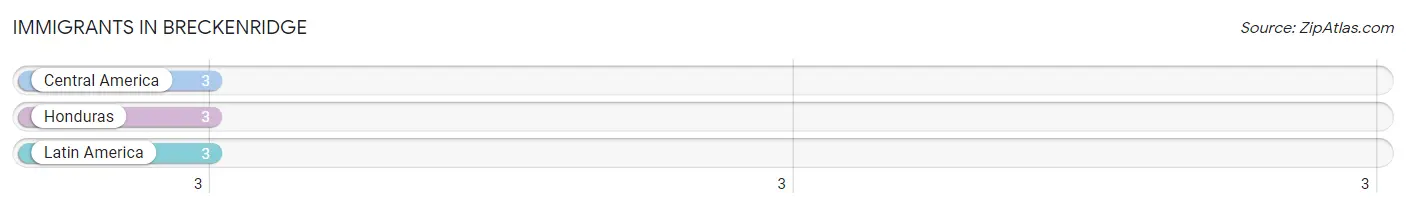
The most numerous immigrant groups reported in Breckenridge came from Central America (3 | 0.1%), Honduras (3 | 0.1%), and Latin America (3 | 0.1%), together accounting for 0.3% of all Breckenridge residents.
| Immigration Origin | # Population | % Population |
| Central America | 3 | 0.1% |
| Honduras | 3 | 0.1% |
| Latin America | 3 | 0.1% | View All 3 Rows |
Sex and Age in Breckenridge
Sex and Age in Breckenridge
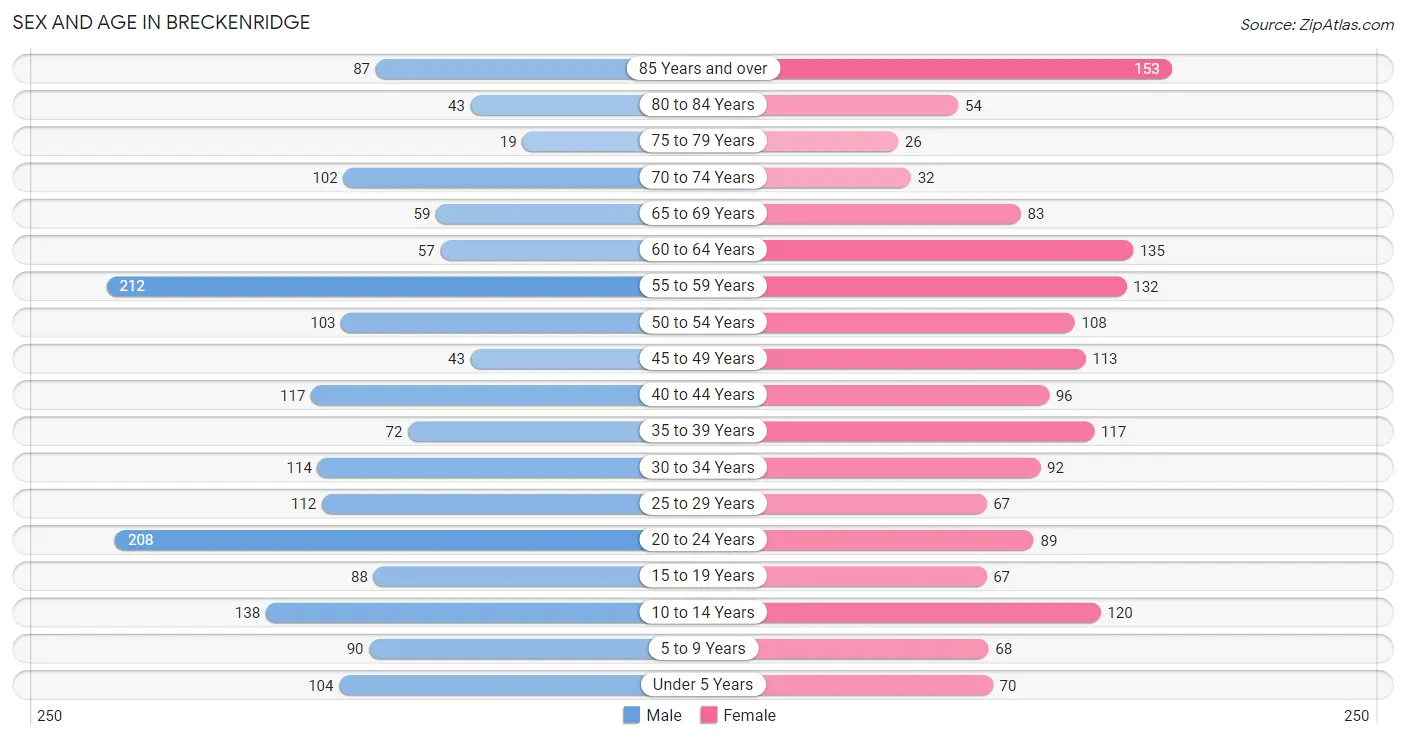
The most populous age groups in Breckenridge are 55 to 59 Years (212 | 12.0%) for men and 85 Years and over (153 | 9.4%) for women.
| Age Bracket | Male | Female |
| Under 5 Years | 104 (5.9%) | 70 (4.3%) |
| 5 to 9 Years | 90 (5.1%) | 68 (4.2%) |
| 10 to 14 Years | 138 (7.8%) | 120 (7.4%) |
| 15 to 19 Years | 88 (5.0%) | 67 (4.1%) |
| 20 to 24 Years | 208 (11.8%) | 89 (5.5%) |
| 25 to 29 Years | 112 (6.3%) | 67 (4.1%) |
| 30 to 34 Years | 114 (6.5%) | 92 (5.7%) |
| 35 to 39 Years | 72 (4.1%) | 117 (7.2%) |
| 40 to 44 Years | 117 (6.6%) | 96 (5.9%) |
| 45 to 49 Years | 43 (2.4%) | 113 (7.0%) |
| 50 to 54 Years | 103 (5.8%) | 108 (6.7%) |
| 55 to 59 Years | 212 (12.0%) | 132 (8.1%) |
| 60 to 64 Years | 57 (3.2%) | 135 (8.3%) |
| 65 to 69 Years | 59 (3.3%) | 83 (5.1%) |
| 70 to 74 Years | 102 (5.8%) | 32 (2.0%) |
| 75 to 79 Years | 19 (1.1%) | 26 (1.6%) |
| 80 to 84 Years | 43 (2.4%) | 54 (3.3%) |
| 85 Years and over | 87 (4.9%) | 153 (9.4%) |
| Total | 1,768 (100.0%) | 1,622 (100.0%) |
Families and Households in Breckenridge
Median Family Size in Breckenridge
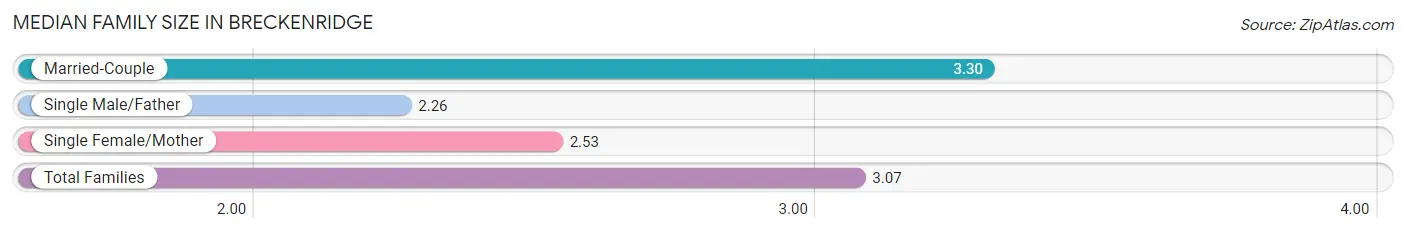
The median family size in Breckenridge is 3.07 persons per family, with married-couple families (505 | 70.5%) accounting for the largest median family size of 3.3 persons per family. On the other hand, single male/father families (19 | 2.6%) represent the smallest median family size with 2.26 persons per family.
| Family Type | # Families | Family Size |
| Married-Couple | 505 (70.5%) | 3.30 |
| Single Male/Father | 19 (2.6%) | 2.26 |
| Single Female/Mother | 192 (26.8%) | 2.53 |
| Total Families | 716 (100.0%) | 3.07 |
Median Household Size in Breckenridge
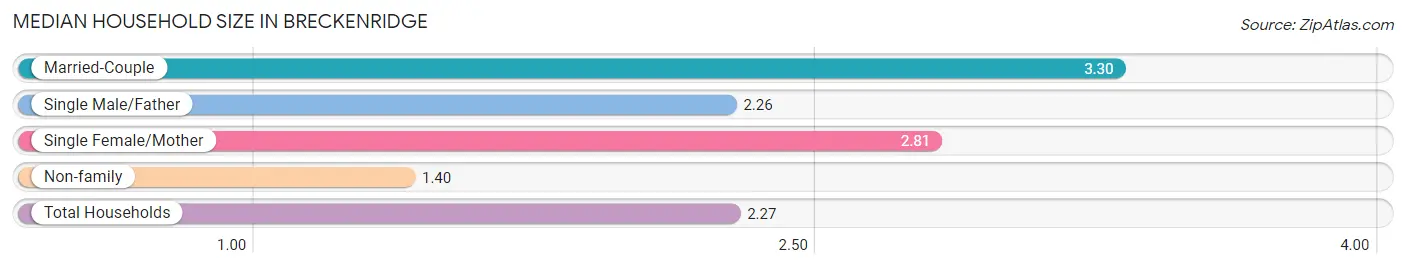
The median household size in Breckenridge is 2.27 persons per household, with married-couple households (505 | 35.0%) accounting for the largest median household size of 3.3 persons per household. non-family households (725 | 50.3%) represent the smallest median household size with 1.40 persons per household.
| Household Type | # Households | Household Size |
| Married-Couple | 505 (35.0%) | 3.30 |
| Single Male/Father | 19 (1.3%) | 2.26 |
| Single Female/Mother | 192 (13.3%) | 2.81 |
| Non-family | 725 (50.3%) | 1.40 |
| Total Households | 1,441 (100.0%) | 2.27 |
Household Size by Marriage Status in Breckenridge
Out of a total of 1,441 households in Breckenridge, 716 (49.7%) are family households, while 725 (50.3%) are nonfamily households. The most numerous type of family households are 2-person households, comprising 315, and the most common type of nonfamily households are 1-person households, comprising 537.
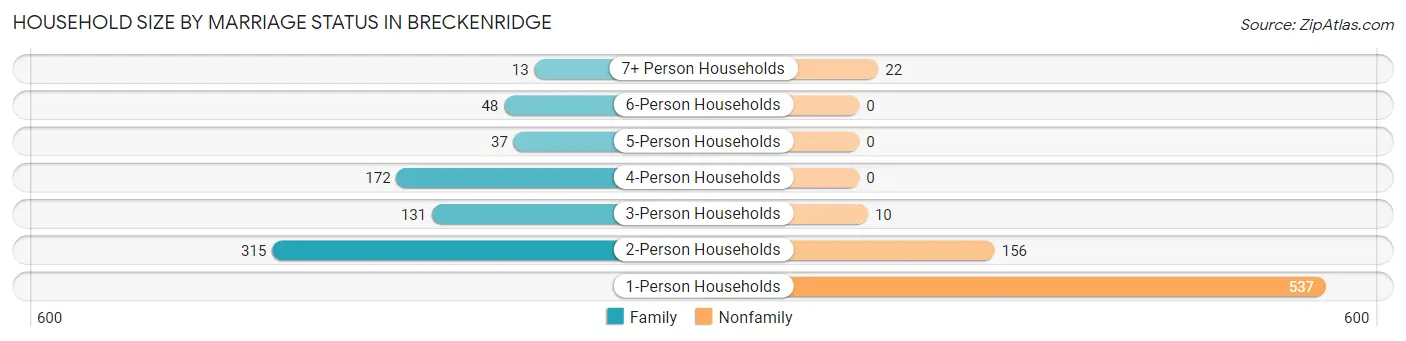
| Household Size | Family Households | Nonfamily Households |
| 1-Person Households | - | 537 (37.3%) |
| 2-Person Households | 315 (21.9%) | 156 (10.8%) |
| 3-Person Households | 131 (9.1%) | 10 (0.7%) |
| 4-Person Households | 172 (11.9%) | 0 (0.0%) |
| 5-Person Households | 37 (2.6%) | 0 (0.0%) |
| 6-Person Households | 48 (3.3%) | 0 (0.0%) |
| 7+ Person Households | 13 (0.9%) | 22 (1.5%) |
| Total | 716 (49.7%) | 725 (50.3%) |
Female Fertility in Breckenridge
Fertility by Age in Breckenridge
Average fertility rate in Breckenridge is 91.0 births per 1,000 women. Women in the age bracket of 20 to 34 years have the highest fertility rate with 194.0 births per 1,000 women. Women in the age bracket of 20 to 34 years acount for 81.4% of all women with births.
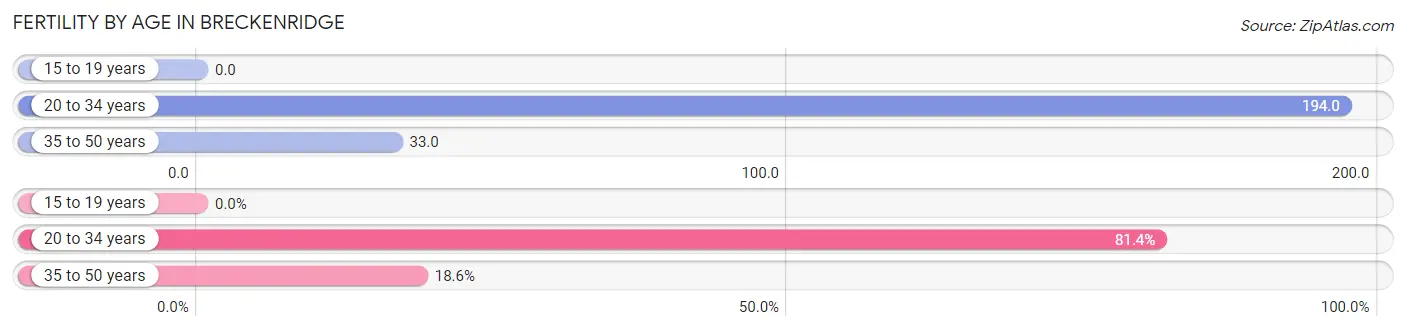
| Age Bracket | Women with Births | Births / 1,000 Women |
| 15 to 19 years | 0 (0.0%) | 0.0 |
| 20 to 34 years | 48 (81.4%) | 194.0 |
| 35 to 50 years | 11 (18.6%) | 33.0 |
| Total | 59 (100.0%) | 91.0 |
Fertility by Age by Marriage Status in Breckenridge
59.3% of women with births (59) in Breckenridge are married. The highest percentage of unmarried women with births falls into 20 to 34 years age bracket with 50.0% of them unmarried at the time of birth, while the lowest percentage of unmarried women with births belong to 35 to 50 years age bracket with 0.0% of them unmarried.
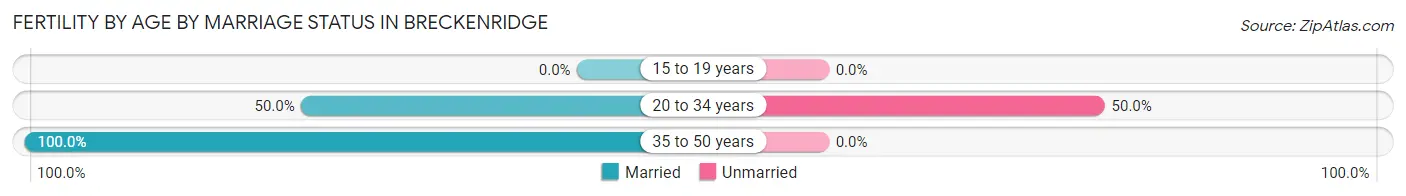
| Age Bracket | Married | Unmarried |
| 15 to 19 years | 0 (0.0%) | 0 (0.0%) |
| 20 to 34 years | 24 (50.0%) | 24 (50.0%) |
| 35 to 50 years | 11 (100.0%) | 0 (0.0%) |
| Total | 35 (59.3%) | 24 (40.7%) |
Fertility by Education in Breckenridge
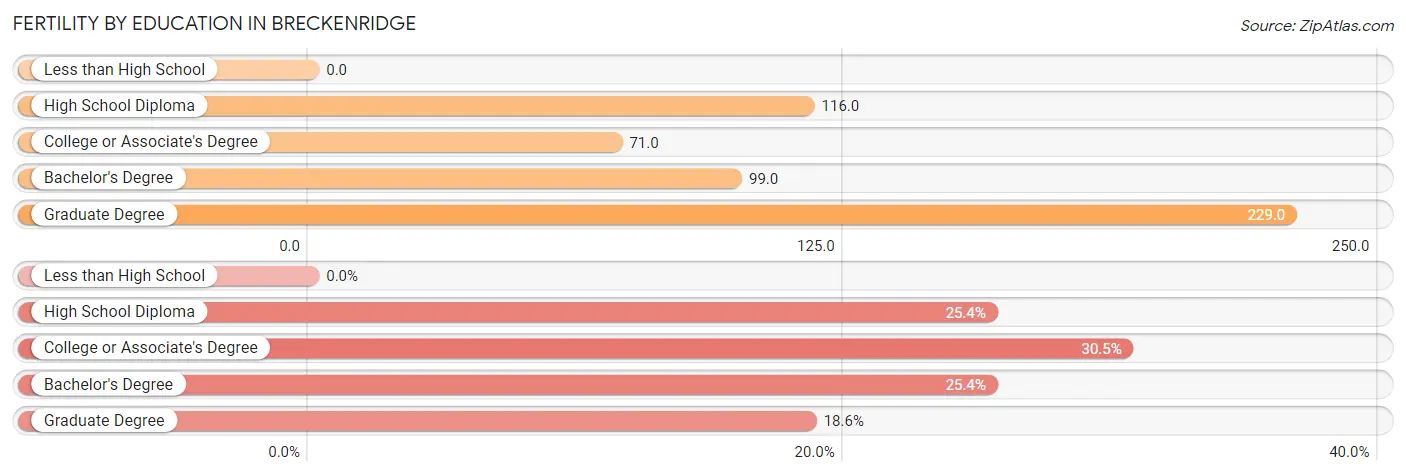
| Educational Attainment | Women with Births | Births / 1,000 Women |
| Less than High School | 0 (0.0%) | 0.0 |
| High School Diploma | 15 (25.4%) | 116.0 |
| College or Associate's Degree | 18 (30.5%) | 71.0 |
| Bachelor's Degree | 15 (25.4%) | 99.0 |
| Graduate Degree | 11 (18.6%) | 229.0 |
| Total | 59 (100.0%) | 91.0 |
Fertility by Education by Marriage Status in Breckenridge
40.7% of women with births in Breckenridge are unmarried. Women with the educational attainment of college or associate's degree are most likely to be married with 100.0% of them married at childbirth, while women with the educational attainment of high school diploma are least likely to be married with 100.0% of them unmarried at childbirth.
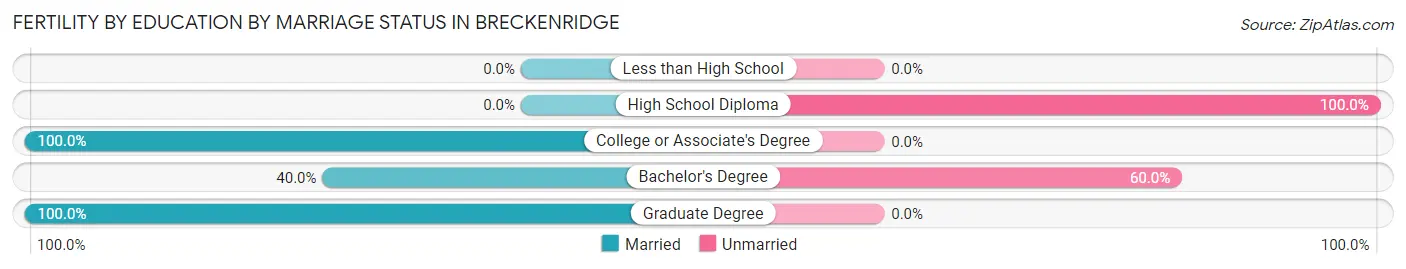
| Educational Attainment | Married | Unmarried |
| Less than High School | 0 (0.0%) | 0 (0.0%) |
| High School Diploma | 0 (0.0%) | 15 (100.0%) |
| College or Associate's Degree | 18 (100.0%) | 0 (0.0%) |
| Bachelor's Degree | 6 (40.0%) | 9 (60.0%) |
| Graduate Degree | 11 (100.0%) | 0 (0.0%) |
| Total | 35 (59.3%) | 24 (40.7%) |
Employment Characteristics in Breckenridge
Employment by Class of Employer in Breckenridge
Among the 1,587 employed individuals in Breckenridge, private company employees (1,007 | 63.4%), local government employees (169 | 10.6%), and not-for-profit organizations (168 | 10.6%) make up the most common classes of employment.
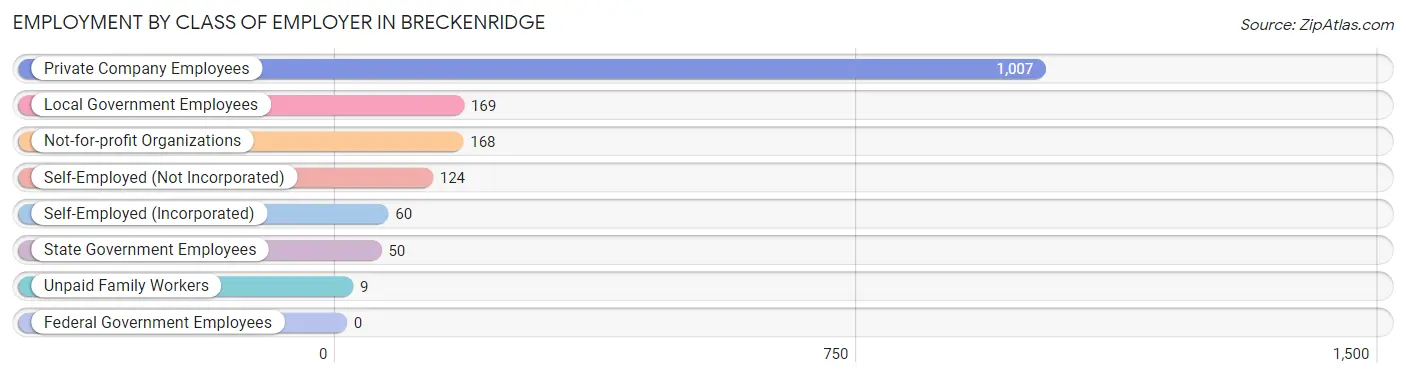
| Employer Class | # Employees | % Employees |
| Private Company Employees | 1,007 | 63.4% |
| Self-Employed (Incorporated) | 60 | 3.8% |
| Self-Employed (Not Incorporated) | 124 | 7.8% |
| Not-for-profit Organizations | 168 | 10.6% |
| Local Government Employees | 169 | 10.6% |
| State Government Employees | 50 | 3.2% |
| Federal Government Employees | 0 | 0.0% |
| Unpaid Family Workers | 9 | 0.6% |
| Total | 1,587 | 100.0% |
Employment Status by Age in Breckenridge
According to the labor force statistics for Breckenridge, out of the total population over 16 years of age (2,748), 64.1% or 1,761 individuals are in the labor force, with 7.5% or 132 of them unemployed. The age group with the highest labor force participation rate is 20 to 24 years, with 89.2% or 265 individuals in the labor force. Within the labor force, the 20 to 24 years age range has the highest percentage of unemployed individuals, with 25.7% or 68 of them being unemployed.
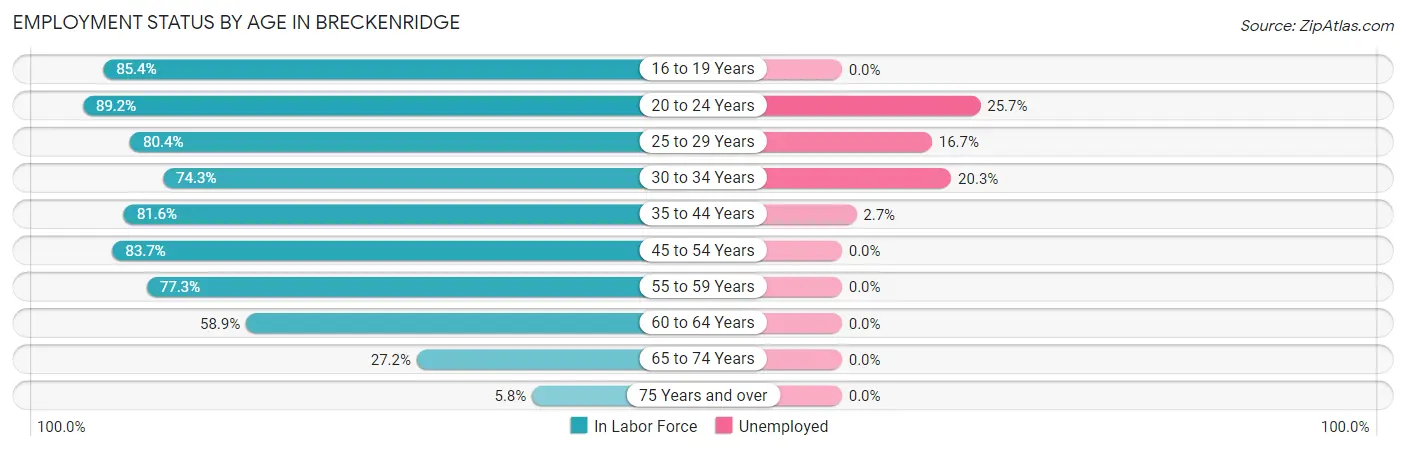
| Age Bracket | In Labor Force | Unemployed |
| 16 to 19 Years | 88 (85.4%) | 0 (0.0%) |
| 20 to 24 Years | 265 (89.2%) | 68 (25.7%) |
| 25 to 29 Years | 144 (80.4%) | 24 (16.7%) |
| 30 to 34 Years | 153 (74.3%) | 31 (20.3%) |
| 35 to 44 Years | 328 (81.6%) | 9 (2.7%) |
| 45 to 54 Years | 307 (83.7%) | 0 (0.0%) |
| 55 to 59 Years | 266 (77.3%) | 0 (0.0%) |
| 60 to 64 Years | 113 (58.9%) | 0 (0.0%) |
| 65 to 74 Years | 75 (27.2%) | 0 (0.0%) |
| 75 Years and over | 22 (5.8%) | 0 (0.0%) |
| Total | 1,761 (64.1%) | 132 (7.5%) |
Employment Status by Educational Attainment in Breckenridge
According to labor force statistics for Breckenridge, 77.6% of individuals (1,311) out of the total population between 25 and 64 years of age (1,690) are in the labor force, with 4.9% or 64 of them being unemployed. The group with the highest labor force participation rate are those with the educational attainment of college / associate degree, with 84.6% or 542 individuals in the labor force. Within the labor force, individuals with bachelor's degree or higher education have the highest percentage of unemployment, with 8.1% or 33 of them being unemployed.
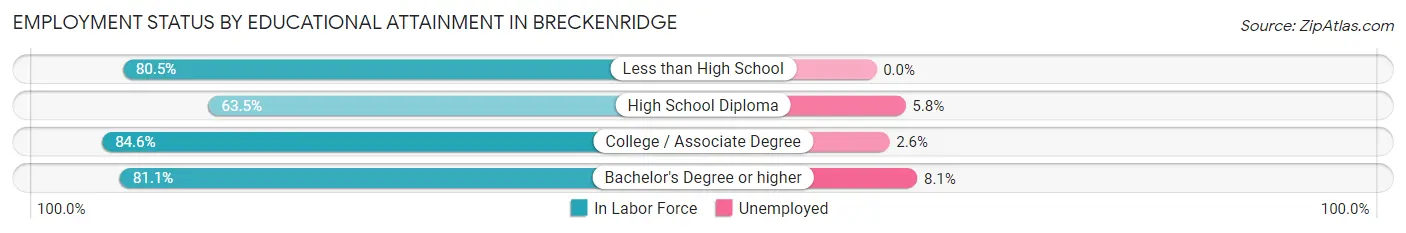
| Educational Attainment | In Labor Force | Unemployed |
| Less than High School | 70 (80.5%) | 0 (0.0%) |
| High School Diploma | 292 (63.5%) | 27 (5.8%) |
| College / Associate Degree | 542 (84.6%) | 17 (2.6%) |
| Bachelor's Degree or higher | 407 (81.1%) | 41 (8.1%) |
| Total | 1,311 (77.6%) | 83 (4.9%) |
Employment Occupations by Sex in Breckenridge
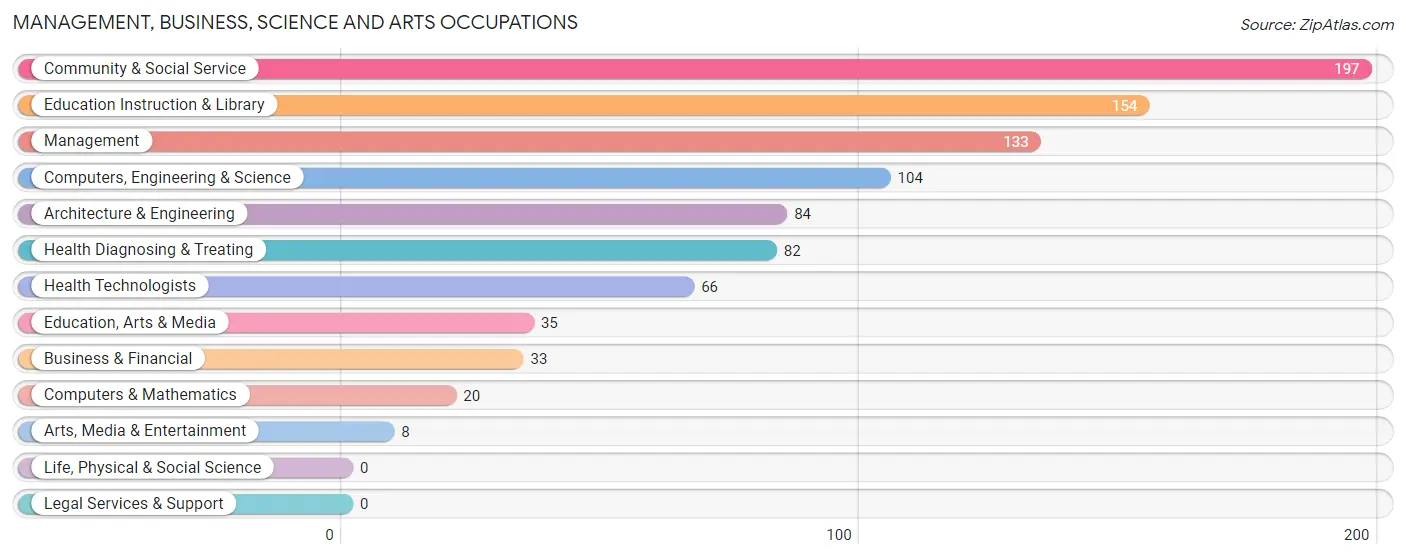
Management, Business, Science and Arts Occupations
The most common Management, Business, Science and Arts occupations in Breckenridge are Community & Social Service (197 | 12.1%), Education Instruction & Library (154 | 9.5%), Management (133 | 8.2%), Computers, Engineering & Science (104 | 6.4%), and Architecture & Engineering (84 | 5.2%).
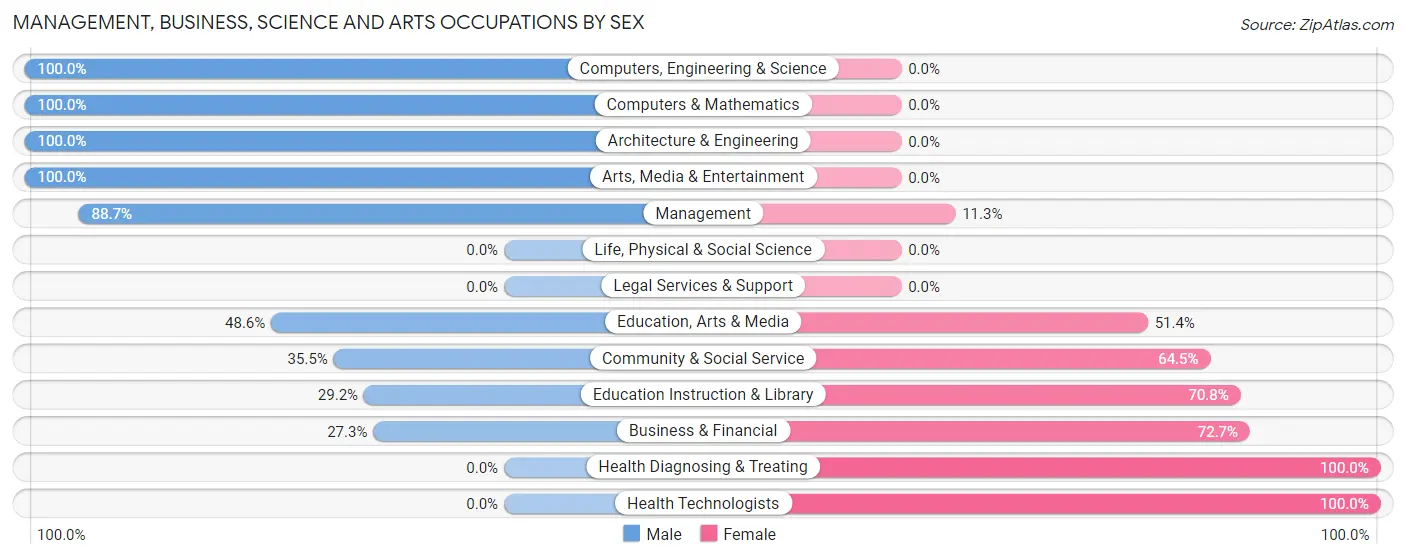
Management, Business, Science and Arts Occupations by Sex
Within the Management, Business, Science and Arts occupations in Breckenridge, the most male-oriented occupations are Computers, Engineering & Science (100.0%), Computers & Mathematics (100.0%), and Architecture & Engineering (100.0%), while the most female-oriented occupations are Health Diagnosing & Treating (100.0%), Health Technologists (100.0%), and Business & Financial (72.7%).
| Occupation | Male | Female |
| Management | 118 (88.7%) | 15 (11.3%) |
| Business & Financial | 9 (27.3%) | 24 (72.7%) |
| Computers, Engineering & Science | 104 (100.0%) | 0 (0.0%) |
| Computers & Mathematics | 20 (100.0%) | 0 (0.0%) |
| Architecture & Engineering | 84 (100.0%) | 0 (0.0%) |
| Life, Physical & Social Science | 0 (0.0%) | 0 (0.0%) |
| Community & Social Service | 70 (35.5%) | 127 (64.5%) |
| Education, Arts & Media | 17 (48.6%) | 18 (51.4%) |
| Legal Services & Support | 0 (0.0%) | 0 (0.0%) |
| Education Instruction & Library | 45 (29.2%) | 109 (70.8%) |
| Arts, Media & Entertainment | 8 (100.0%) | 0 (0.0%) |
| Health Diagnosing & Treating | 0 (0.0%) | 82 (100.0%) |
| Health Technologists | 0 (0.0%) | 66 (100.0%) |
| Total (Category) | 301 (54.8%) | 248 (45.2%) |
| Total (Overall) | 959 (58.9%) | 670 (41.1%) |
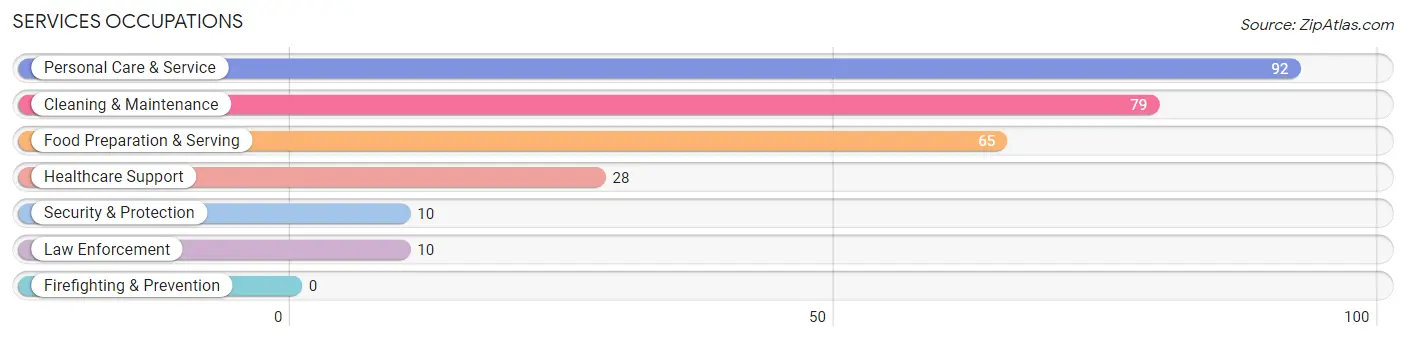
Services Occupations
The most common Services occupations in Breckenridge are Personal Care & Service (92 | 5.7%), Cleaning & Maintenance (79 | 4.9%), Food Preparation & Serving (65 | 4.0%), Healthcare Support (28 | 1.7%), and Security & Protection (10 | 0.6%).
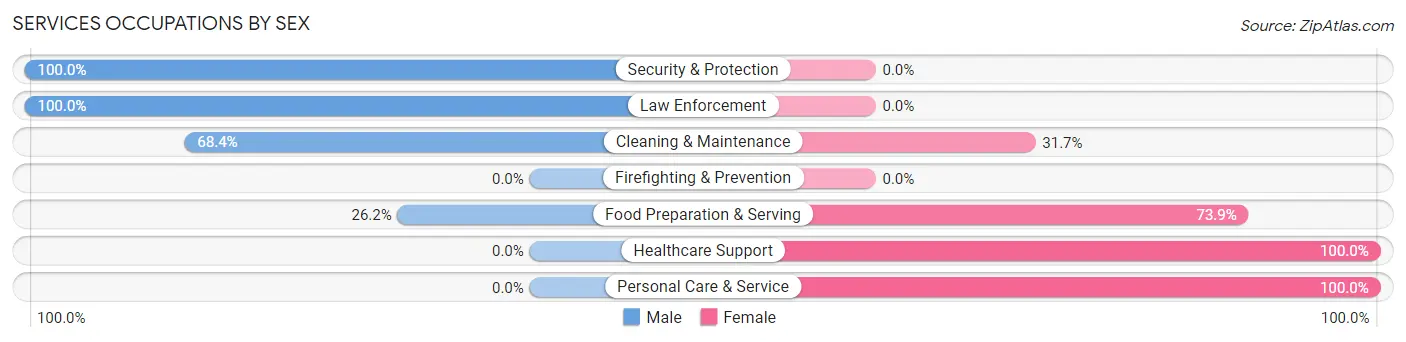
Services Occupations by Sex
Within the Services occupations in Breckenridge, the most male-oriented occupations are Security & Protection (100.0%), Law Enforcement (100.0%), and Cleaning & Maintenance (68.3%), while the most female-oriented occupations are Healthcare Support (100.0%), Personal Care & Service (100.0%), and Food Preparation & Serving (73.9%).
| Occupation | Male | Female |
| Healthcare Support | 0 (0.0%) | 28 (100.0%) |
| Security & Protection | 10 (100.0%) | 0 (0.0%) |
| Firefighting & Prevention | 0 (0.0%) | 0 (0.0%) |
| Law Enforcement | 10 (100.0%) | 0 (0.0%) |
| Food Preparation & Serving | 17 (26.2%) | 48 (73.9%) |
| Cleaning & Maintenance | 54 (68.3%) | 25 (31.7%) |
| Personal Care & Service | 0 (0.0%) | 92 (100.0%) |
| Total (Category) | 81 (29.6%) | 193 (70.4%) |
| Total (Overall) | 959 (58.9%) | 670 (41.1%) |
Sales and Office Occupations
The most common Sales and Office occupations in Breckenridge are Sales & Related (174 | 10.7%), and Office & Administration (129 | 7.9%).
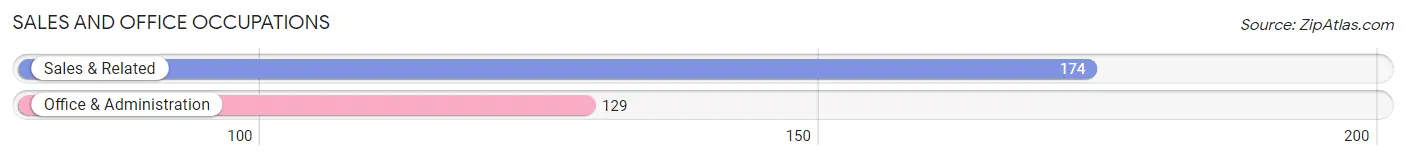
Sales and Office Occupations by Sex
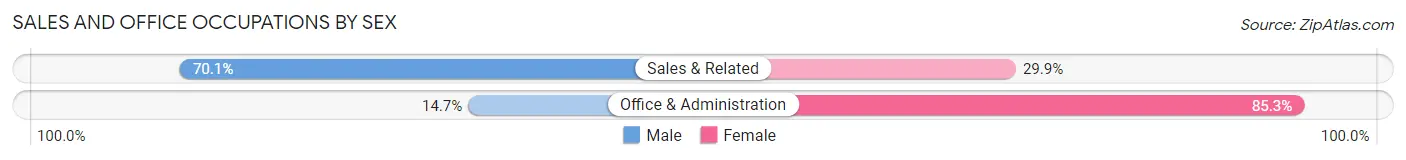
| Occupation | Male | Female |
| Sales & Related | 122 (70.1%) | 52 (29.9%) |
| Office & Administration | 19 (14.7%) | 110 (85.3%) |
| Total (Category) | 141 (46.5%) | 162 (53.5%) |
| Total (Overall) | 959 (58.9%) | 670 (41.1%) |
Natural Resources, Construction and Maintenance Occupations
The most common Natural Resources, Construction and Maintenance occupations in Breckenridge are Installation, Maintenance & Repair (111 | 6.8%), Construction & Extraction (103 | 6.3%), and Farming, Fishing & Forestry (32 | 2.0%).
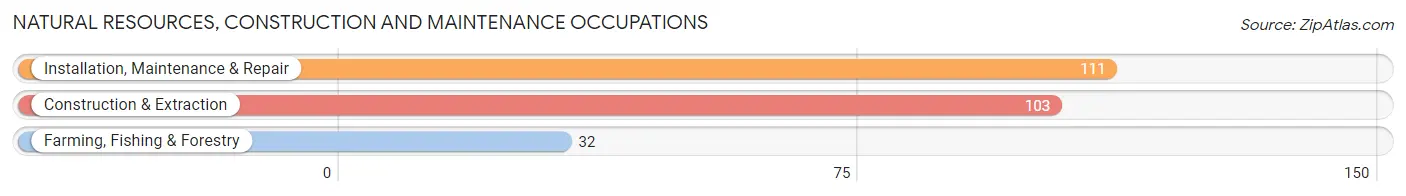
Natural Resources, Construction and Maintenance Occupations by Sex
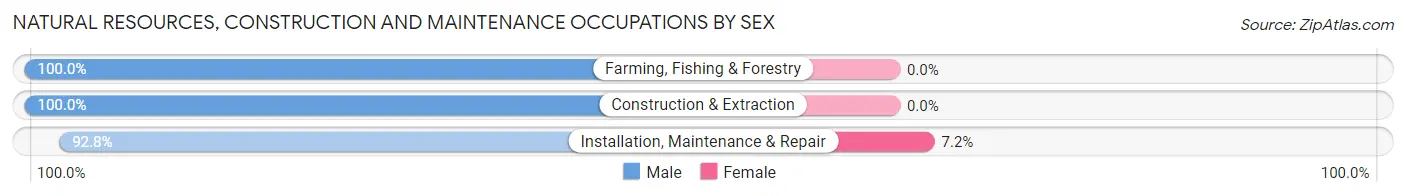
| Occupation | Male | Female |
| Farming, Fishing & Forestry | 32 (100.0%) | 0 (0.0%) |
| Construction & Extraction | 103 (100.0%) | 0 (0.0%) |
| Installation, Maintenance & Repair | 103 (92.8%) | 8 (7.2%) |
| Total (Category) | 238 (96.8%) | 8 (3.3%) |
| Total (Overall) | 959 (58.9%) | 670 (41.1%) |
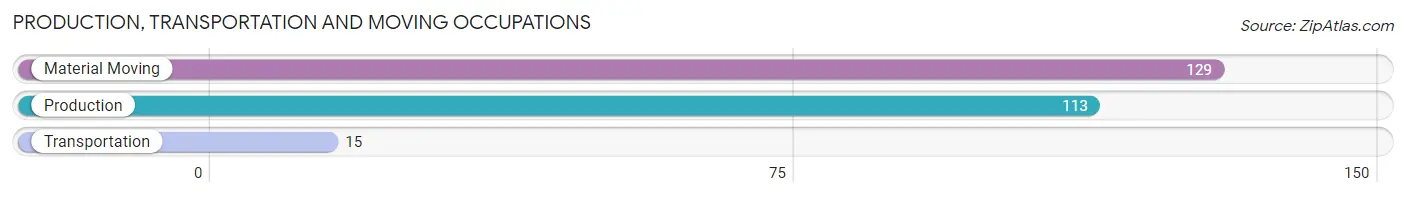
Production, Transportation and Moving Occupations
The most common Production, Transportation and Moving occupations in Breckenridge are Material Moving (129 | 7.9%), Production (113 | 6.9%), and Transportation (15 | 0.9%).
Production, Transportation and Moving Occupations by Sex
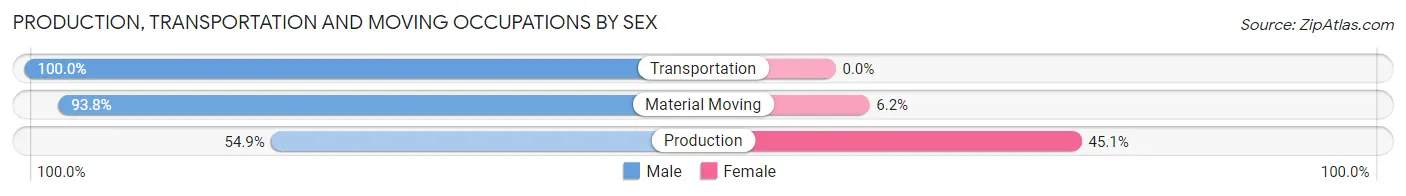
| Occupation | Male | Female |
| Production | 62 (54.9%) | 51 (45.1%) |
| Transportation | 15 (100.0%) | 0 (0.0%) |
| Material Moving | 121 (93.8%) | 8 (6.2%) |
| Total (Category) | 198 (77.0%) | 59 (23.0%) |
| Total (Overall) | 959 (58.9%) | 670 (41.1%) |
Employment Industries by Sex in Breckenridge
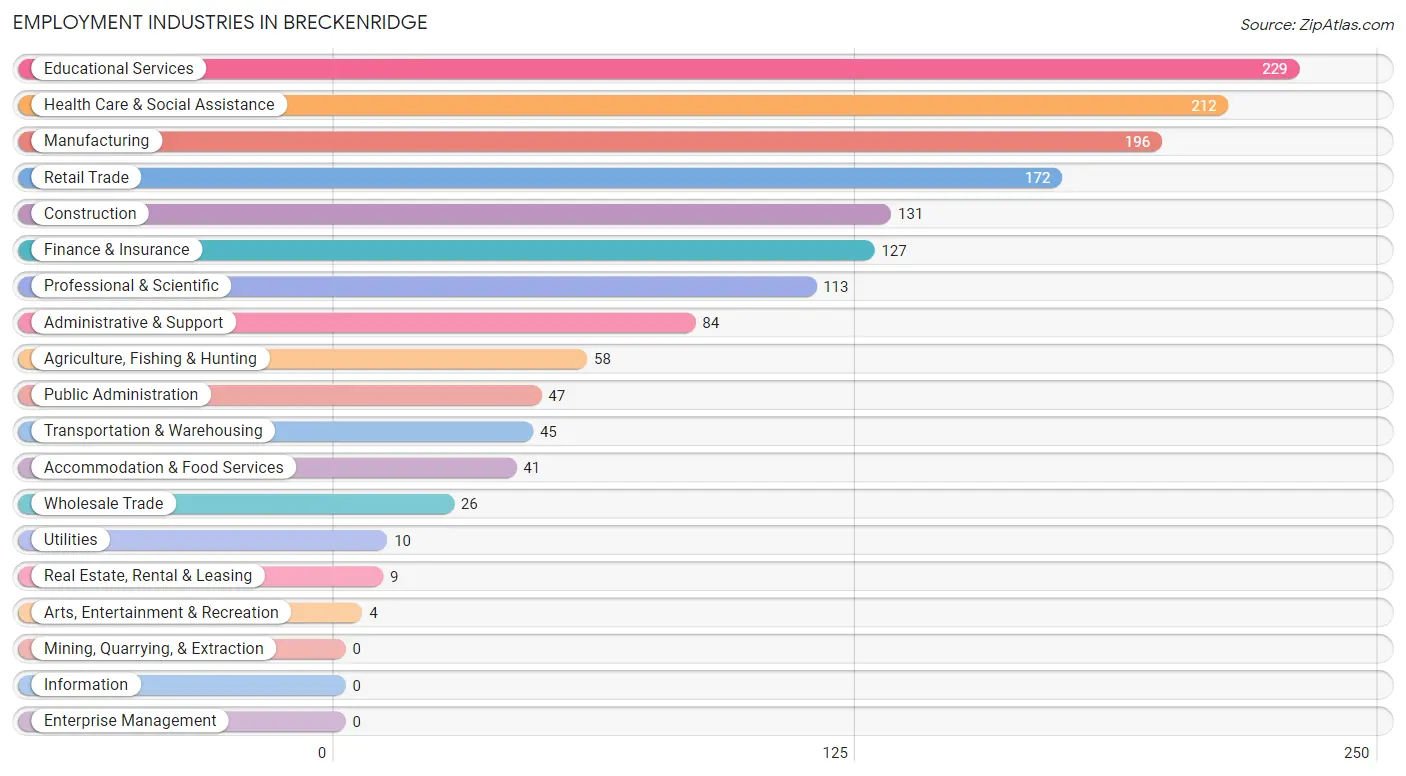
Employment Industries in Breckenridge
The major employment industries in Breckenridge include Educational Services (229 | 14.1%), Health Care & Social Assistance (212 | 13.0%), Manufacturing (196 | 12.0%), Retail Trade (172 | 10.6%), and Construction (131 | 8.0%).
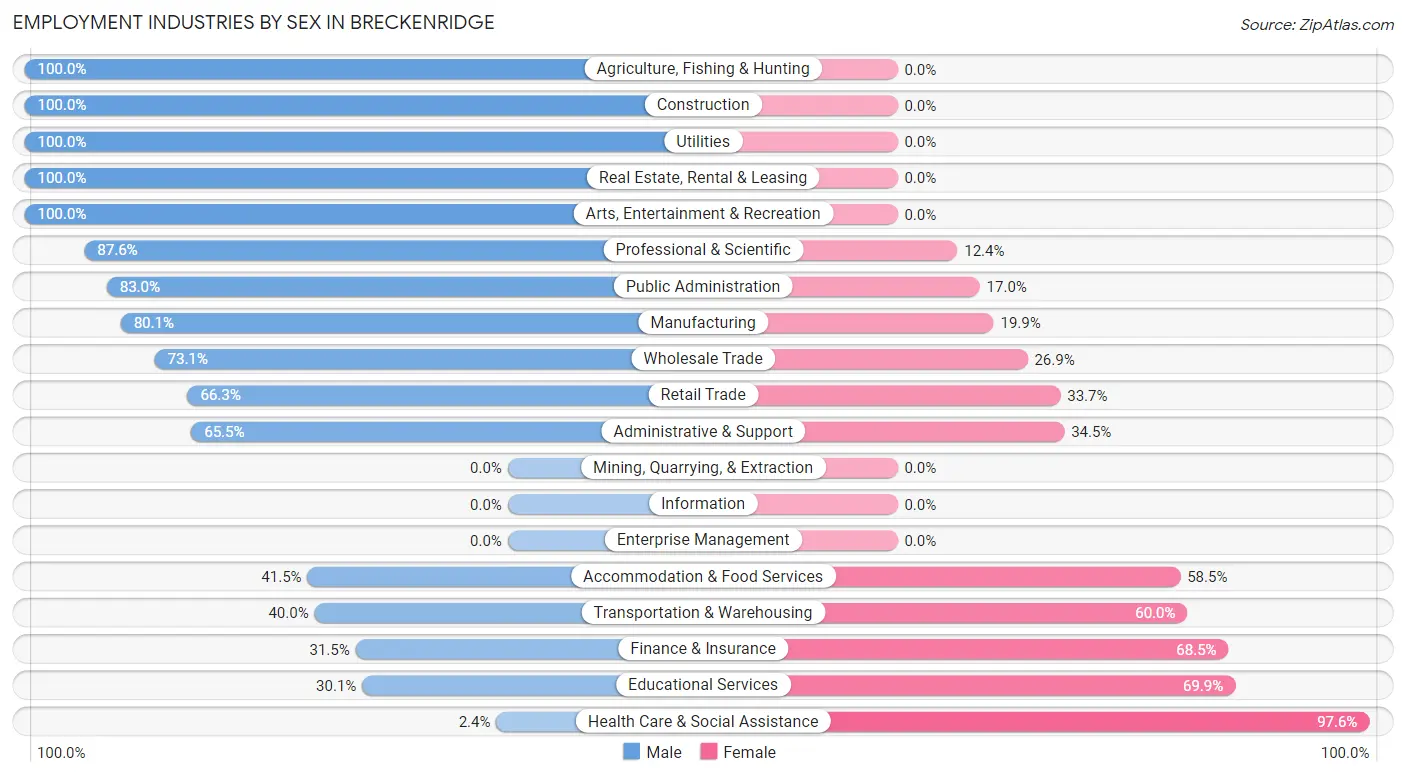
Employment Industries by Sex in Breckenridge
The Breckenridge industries that see more men than women are Agriculture, Fishing & Hunting (100.0%), Construction (100.0%), and Utilities (100.0%), whereas the industries that tend to have a higher number of women are Health Care & Social Assistance (97.6%), Educational Services (69.9%), and Finance & Insurance (68.5%).
| Industry | Male | Female |
| Agriculture, Fishing & Hunting | 58 (100.0%) | 0 (0.0%) |
| Mining, Quarrying, & Extraction | 0 (0.0%) | 0 (0.0%) |
| Construction | 131 (100.0%) | 0 (0.0%) |
| Manufacturing | 157 (80.1%) | 39 (19.9%) |
| Wholesale Trade | 19 (73.1%) | 7 (26.9%) |
| Retail Trade | 114 (66.3%) | 58 (33.7%) |
| Transportation & Warehousing | 18 (40.0%) | 27 (60.0%) |
| Utilities | 10 (100.0%) | 0 (0.0%) |
| Information | 0 (0.0%) | 0 (0.0%) |
| Finance & Insurance | 40 (31.5%) | 87 (68.5%) |
| Real Estate, Rental & Leasing | 9 (100.0%) | 0 (0.0%) |
| Professional & Scientific | 99 (87.6%) | 14 (12.4%) |
| Enterprise Management | 0 (0.0%) | 0 (0.0%) |
| Administrative & Support | 55 (65.5%) | 29 (34.5%) |
| Educational Services | 69 (30.1%) | 160 (69.9%) |
| Health Care & Social Assistance | 5 (2.4%) | 207 (97.6%) |
| Arts, Entertainment & Recreation | 4 (100.0%) | 0 (0.0%) |
| Accommodation & Food Services | 17 (41.5%) | 24 (58.5%) |
| Public Administration | 39 (83.0%) | 8 (17.0%) |
| Total | 959 (58.9%) | 670 (41.1%) |
Education in Breckenridge
School Enrollment in Breckenridge
The most common levels of schooling among the 685 students in Breckenridge are middle school (231 | 33.7%), high school (152 | 22.2%), and elementary school (104 | 15.2%).
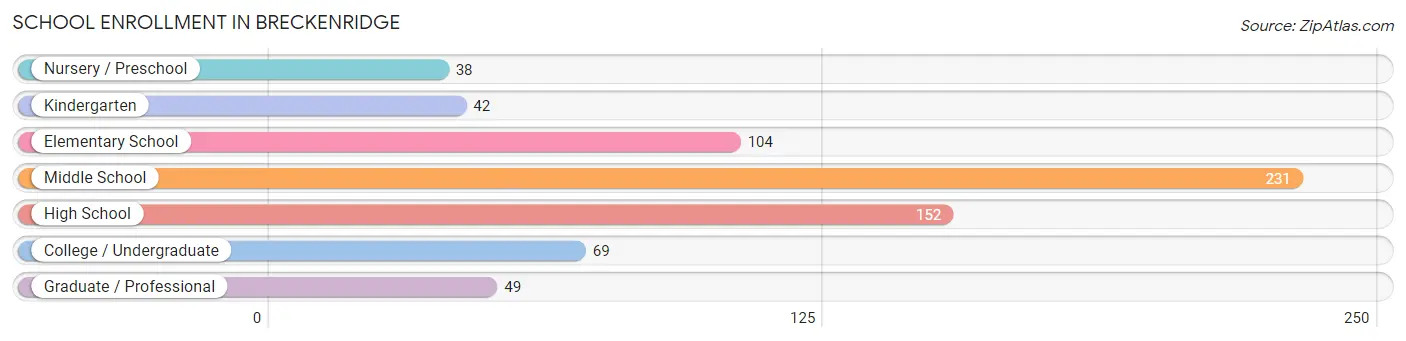
| School Level | # Students | % Students |
| Nursery / Preschool | 38 | 5.6% |
| Kindergarten | 42 | 6.1% |
| Elementary School | 104 | 15.2% |
| Middle School | 231 | 33.7% |
| High School | 152 | 22.2% |
| College / Undergraduate | 69 | 10.1% |
| Graduate / Professional | 49 | 7.1% |
| Total | 685 | 100.0% |
School Enrollment by Age by Funding Source in Breckenridge
Out of a total of 685 students who are enrolled in schools in Breckenridge, 134 (19.6%) attend a private institution, while the remaining 551 (80.4%) are enrolled in public schools. The age group of 3 to 4 year olds has the highest likelihood of being enrolled in private schools, with 8 (61.5% in the age bracket) enrolled. Conversely, the age group of 18 to 19 year olds has the lowest likelihood of being enrolled in a private school, with 13 (100.0% in the age bracket) attending a public institution.
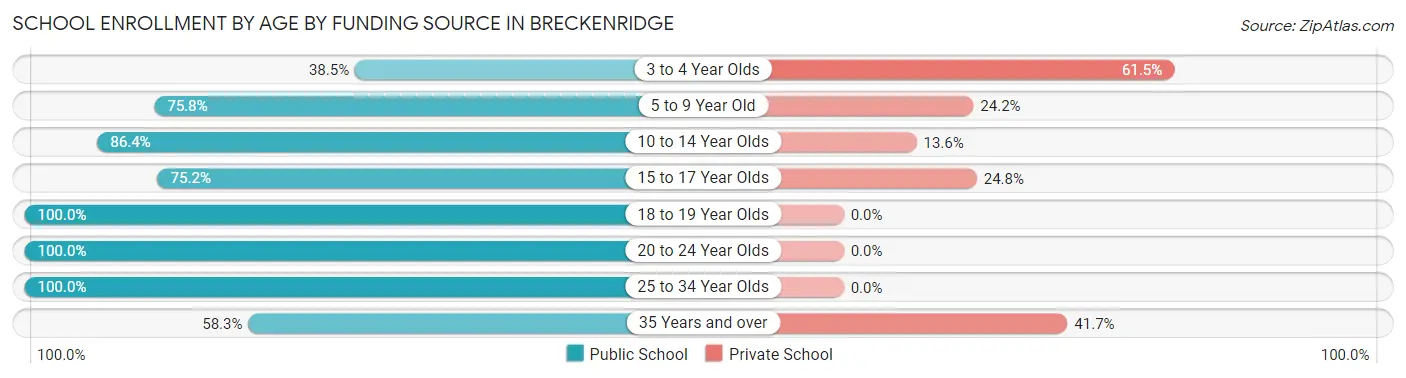
| Age Bracket | Public School | Private School |
| 3 to 4 Year Olds | 5 (38.5%) | 8 (61.5%) |
| 5 to 9 Year Old | 113 (75.8%) | 36 (24.2%) |
| 10 to 14 Year Olds | 223 (86.4%) | 35 (13.6%) |
| 15 to 17 Year Olds | 91 (75.2%) | 30 (24.8%) |
| 18 to 19 Year Olds | 13 (100.0%) | 0 (0.0%) |
| 20 to 24 Year Olds | 46 (100.0%) | 0 (0.0%) |
| 25 to 34 Year Olds | 25 (100.0%) | 0 (0.0%) |
| 35 Years and over | 35 (58.3%) | 25 (41.7%) |
| Total | 551 (80.4%) | 134 (19.6%) |
Educational Attainment by Field of Study in Breckenridge
Education (152 | 22.3%), business (125 | 18.3%), science & technology (108 | 15.8%), bio, nature & agricultural (60 | 8.8%), and literature & languages (50 | 7.3%) are the most common fields of study among 682 individuals in Breckenridge who have obtained a bachelor's degree or higher.
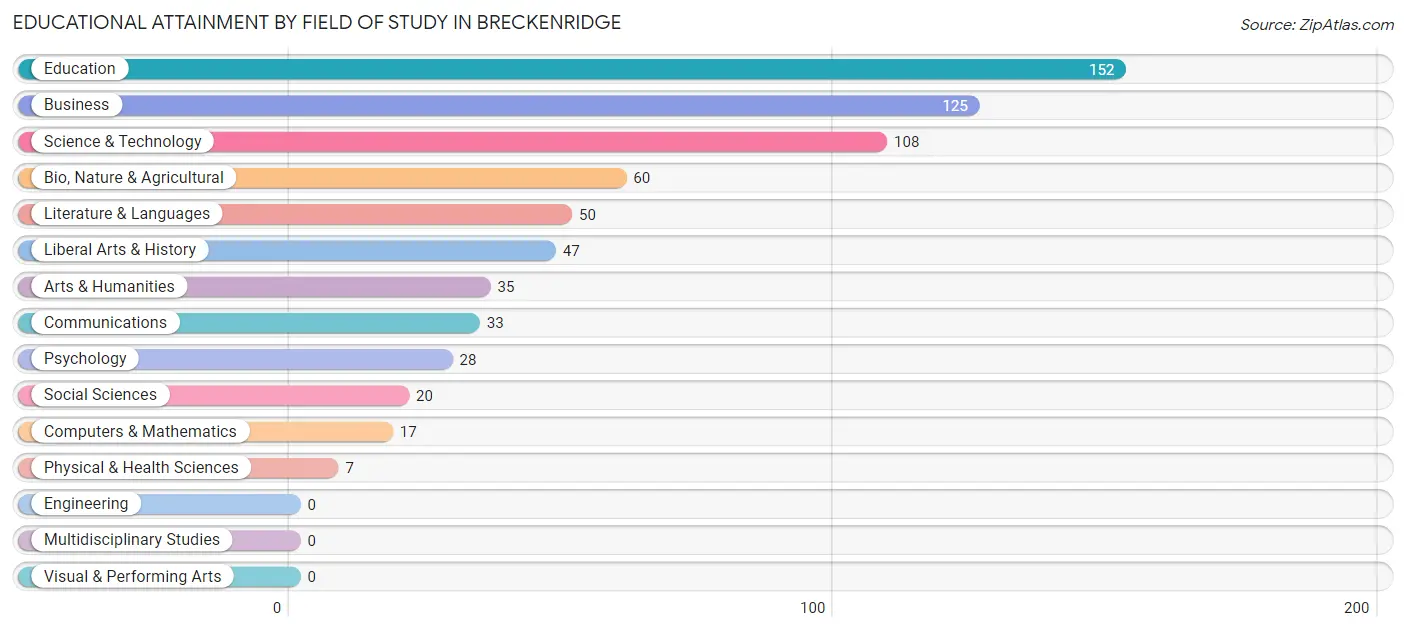
| Field of Study | # Graduates | % Graduates |
| Computers & Mathematics | 17 | 2.5% |
| Bio, Nature & Agricultural | 60 | 8.8% |
| Physical & Health Sciences | 7 | 1.0% |
| Psychology | 28 | 4.1% |
| Social Sciences | 20 | 2.9% |
| Engineering | 0 | 0.0% |
| Multidisciplinary Studies | 0 | 0.0% |
| Science & Technology | 108 | 15.8% |
| Business | 125 | 18.3% |
| Education | 152 | 22.3% |
| Literature & Languages | 50 | 7.3% |
| Liberal Arts & History | 47 | 6.9% |
| Visual & Performing Arts | 0 | 0.0% |
| Communications | 33 | 4.8% |
| Arts & Humanities | 35 | 5.1% |
| Total | 682 | 100.0% |
Transportation & Commute in Breckenridge
Vehicle Availability by Sex in Breckenridge
The most prevalent vehicle ownership categories in Breckenridge are males with 2 vehicles (444, accounting for 48.7%) and females with 2 vehicles (336, making up 66.7%).
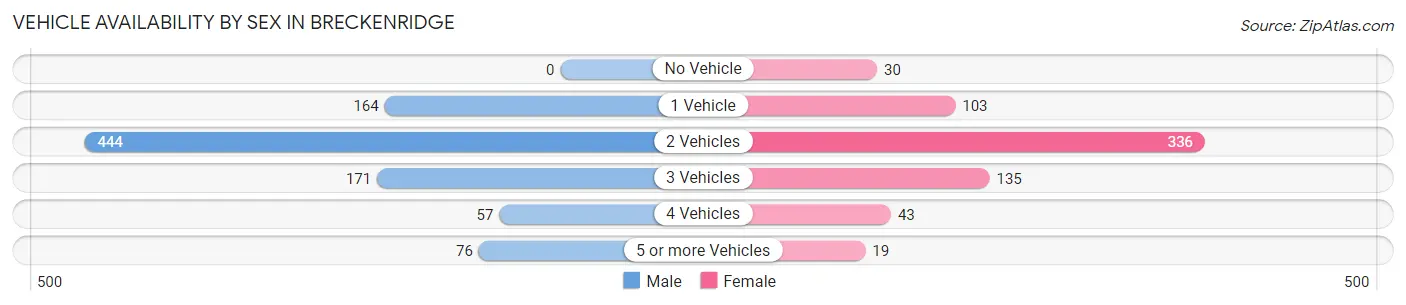
| Vehicles Available | Male | Female |
| No Vehicle | 0 (0.0%) | 30 (4.5%) |
| 1 Vehicle | 164 (18.0%) | 103 (15.5%) |
| 2 Vehicles | 444 (48.7%) | 336 (50.4%) |
| 3 Vehicles | 171 (18.8%) | 135 (20.3%) |
| 4 Vehicles | 57 (6.2%) | 43 (6.5%) |
| 5 or more Vehicles | 76 (8.3%) | 19 (2.9%) |
| Total | 912 (100.0%) | 666 (100.0%) |
Commute Time in Breckenridge
The most frequently occuring commute durations in Breckenridge are 5 to 9 minutes (494 commuters, 33.9%), 10 to 14 minutes (476 commuters, 32.6%), and 15 to 19 minutes (139 commuters, 9.5%).
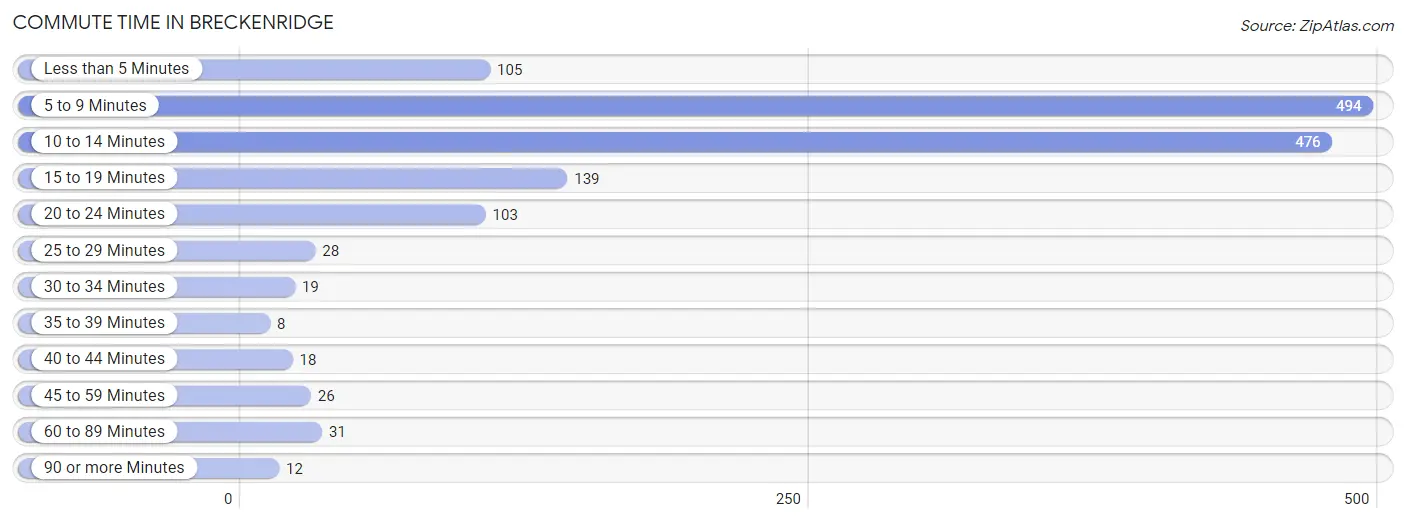
| Commute Time | # Commuters | % Commuters |
| Less than 5 Minutes | 105 | 7.2% |
| 5 to 9 Minutes | 494 | 33.9% |
| 10 to 14 Minutes | 476 | 32.6% |
| 15 to 19 Minutes | 139 | 9.5% |
| 20 to 24 Minutes | 103 | 7.1% |
| 25 to 29 Minutes | 28 | 1.9% |
| 30 to 34 Minutes | 19 | 1.3% |
| 35 to 39 Minutes | 8 | 0.5% |
| 40 to 44 Minutes | 18 | 1.2% |
| 45 to 59 Minutes | 26 | 1.8% |
| 60 to 89 Minutes | 31 | 2.1% |
| 90 or more Minutes | 12 | 0.8% |
Commute Time by Sex in Breckenridge
The most common commute times in Breckenridge are 10 to 14 minutes (315 commuters, 37.1%) for males and 5 to 9 minutes (271 commuters, 44.5%) for females.
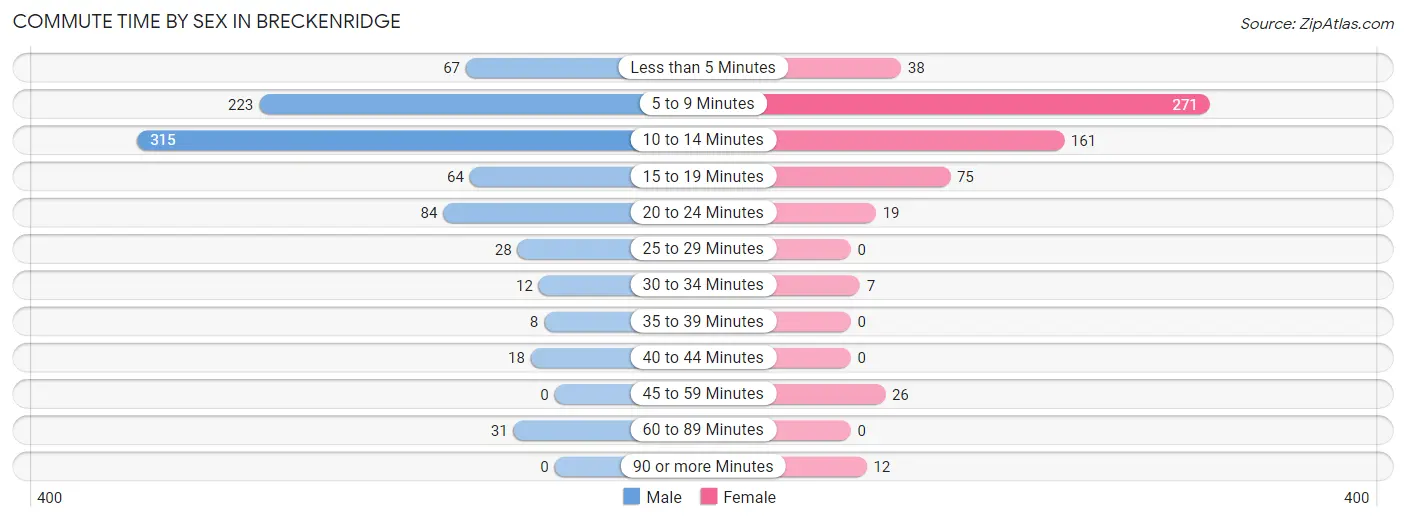
| Commute Time | Male | Female |
| Less than 5 Minutes | 67 (7.9%) | 38 (6.2%) |
| 5 to 9 Minutes | 223 (26.2%) | 271 (44.5%) |
| 10 to 14 Minutes | 315 (37.1%) | 161 (26.4%) |
| 15 to 19 Minutes | 64 (7.5%) | 75 (12.3%) |
| 20 to 24 Minutes | 84 (9.9%) | 19 (3.1%) |
| 25 to 29 Minutes | 28 (3.3%) | 0 (0.0%) |
| 30 to 34 Minutes | 12 (1.4%) | 7 (1.1%) |
| 35 to 39 Minutes | 8 (0.9%) | 0 (0.0%) |
| 40 to 44 Minutes | 18 (2.1%) | 0 (0.0%) |
| 45 to 59 Minutes | 0 (0.0%) | 26 (4.3%) |
| 60 to 89 Minutes | 31 (3.6%) | 0 (0.0%) |
| 90 or more Minutes | 0 (0.0%) | 12 (2.0%) |
Time of Departure to Work by Sex in Breckenridge
The most frequent times of departure to work in Breckenridge are 7:30 AM to 7:59 AM (218, 25.7%) for males and 7:30 AM to 7:59 AM (264, 43.3%) for females.
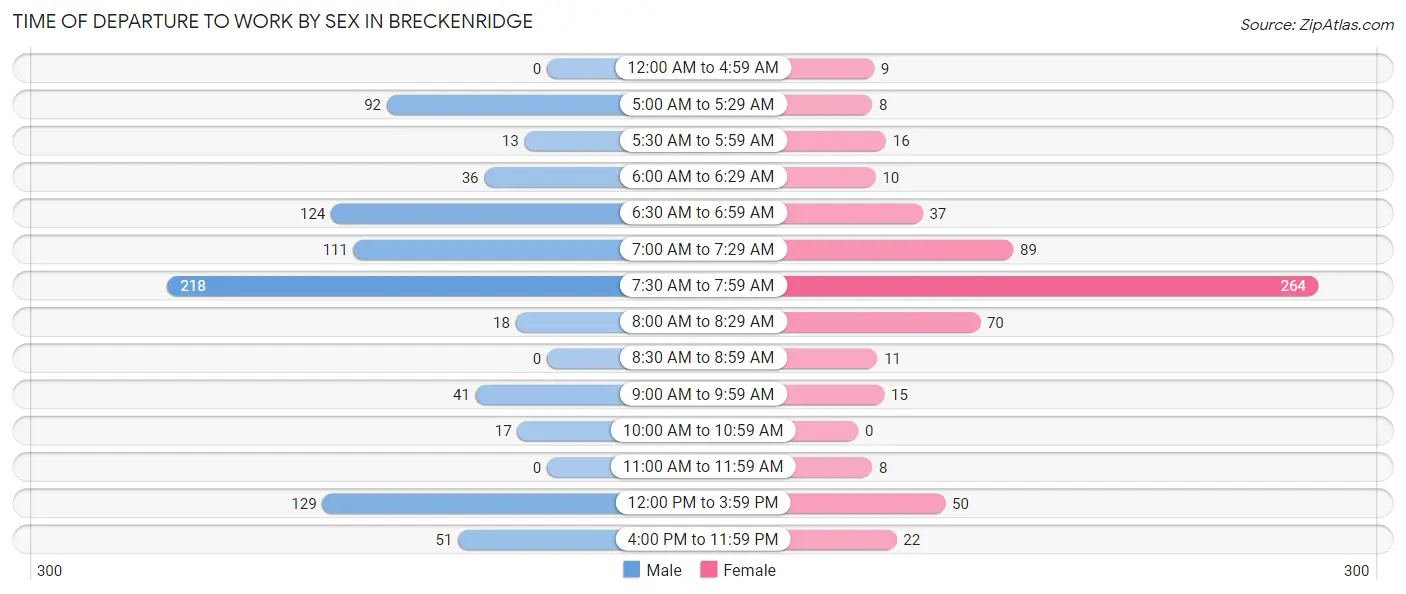
| Time of Departure | Male | Female |
| 12:00 AM to 4:59 AM | 0 (0.0%) | 9 (1.5%) |
| 5:00 AM to 5:29 AM | 92 (10.8%) | 8 (1.3%) |
| 5:30 AM to 5:59 AM | 13 (1.5%) | 16 (2.6%) |
| 6:00 AM to 6:29 AM | 36 (4.2%) | 10 (1.6%) |
| 6:30 AM to 6:59 AM | 124 (14.6%) | 37 (6.1%) |
| 7:00 AM to 7:29 AM | 111 (13.1%) | 89 (14.6%) |
| 7:30 AM to 7:59 AM | 218 (25.7%) | 264 (43.3%) |
| 8:00 AM to 8:29 AM | 18 (2.1%) | 70 (11.5%) |
| 8:30 AM to 8:59 AM | 0 (0.0%) | 11 (1.8%) |
| 9:00 AM to 9:59 AM | 41 (4.8%) | 15 (2.5%) |
| 10:00 AM to 10:59 AM | 17 (2.0%) | 0 (0.0%) |
| 11:00 AM to 11:59 AM | 0 (0.0%) | 8 (1.3%) |
| 12:00 PM to 3:59 PM | 129 (15.2%) | 50 (8.2%) |
| 4:00 PM to 11:59 PM | 51 (6.0%) | 22 (3.6%) |
| Total | 850 (100.0%) | 609 (100.0%) |
Housing Occupancy in Breckenridge
Occupancy by Ownership in Breckenridge
Of the total 1,441 dwellings in Breckenridge, owner-occupied units account for 1,034 (71.8%), while renter-occupied units make up 407 (28.2%).
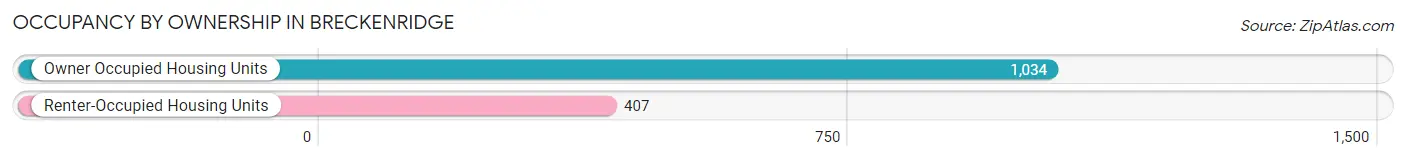
| Occupancy | # Housing Units | % Housing Units |
| Owner Occupied Housing Units | 1,034 | 71.8% |
| Renter-Occupied Housing Units | 407 | 28.2% |
| Total Occupied Housing Units | 1,441 | 100.0% |
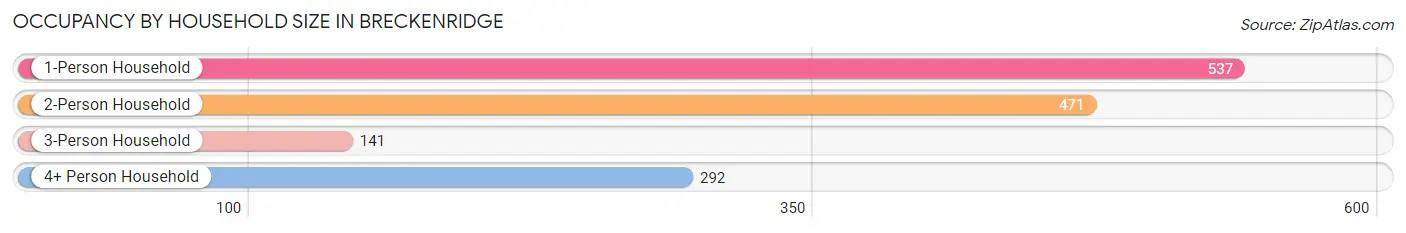
Occupancy by Household Size in Breckenridge
| Household Size | # Housing Units | % Housing Units |
| 1-Person Household | 537 | 37.3% |
| 2-Person Household | 471 | 32.7% |
| 3-Person Household | 141 | 9.8% |
| 4+ Person Household | 292 | 20.3% |
| Total Housing Units | 1,441 | 100.0% |
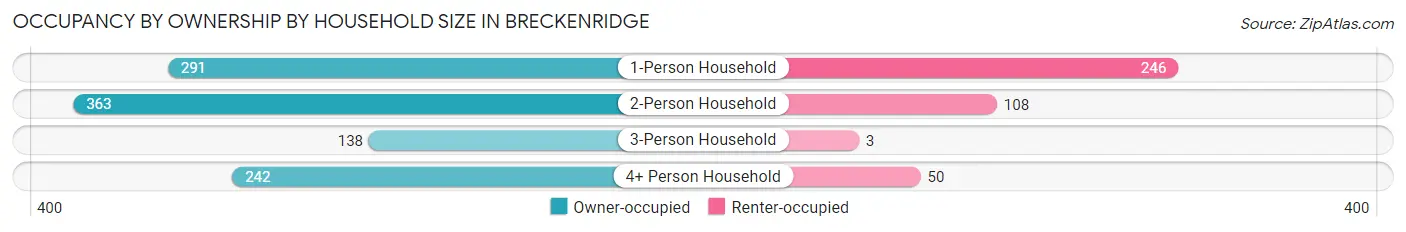
Occupancy by Ownership by Household Size in Breckenridge
| Household Size | Owner-occupied | Renter-occupied |
| 1-Person Household | 291 (54.2%) | 246 (45.8%) |
| 2-Person Household | 363 (77.1%) | 108 (22.9%) |
| 3-Person Household | 138 (97.9%) | 3 (2.1%) |
| 4+ Person Household | 242 (82.9%) | 50 (17.1%) |
| Total Housing Units | 1,034 (71.8%) | 407 (28.2%) |
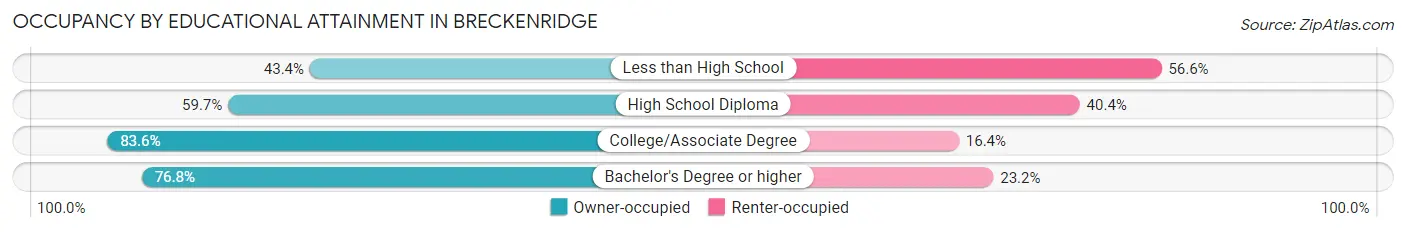
Occupancy by Educational Attainment in Breckenridge
| Household Size | Owner-occupied | Renter-occupied |
| Less than High School | 53 (43.4%) | 69 (56.6%) |
| High School Diploma | 241 (59.7%) | 163 (40.4%) |
| College/Associate Degree | 459 (83.6%) | 90 (16.4%) |
| Bachelor's Degree or higher | 281 (76.8%) | 85 (23.2%) |
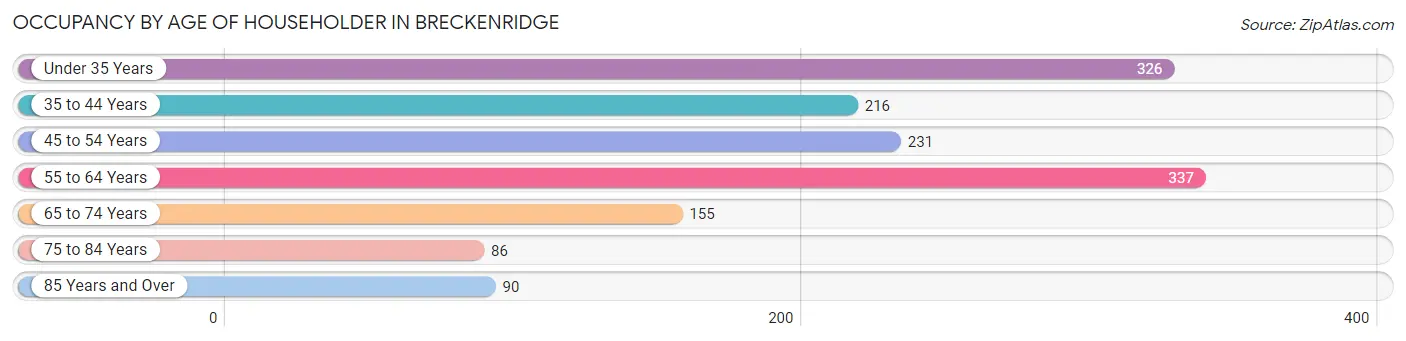
Occupancy by Age of Householder in Breckenridge
| Age Bracket | # Households | % Households |
| Under 35 Years | 326 | 22.6% |
| 35 to 44 Years | 216 | 15.0% |
| 45 to 54 Years | 231 | 16.0% |
| 55 to 64 Years | 337 | 23.4% |
| 65 to 74 Years | 155 | 10.8% |
| 75 to 84 Years | 86 | 6.0% |
| 85 Years and Over | 90 | 6.2% |
| Total | 1,441 | 100.0% |
Housing Finances in Breckenridge
Median Income by Occupancy in Breckenridge
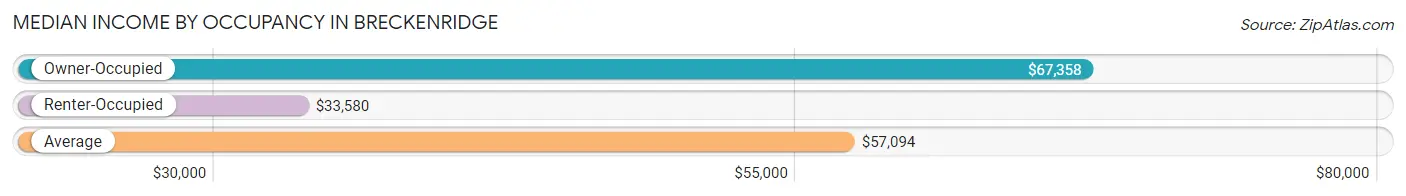
| Occupancy Type | # Households | Median Income |
| Owner-Occupied | 1,034 (71.8%) | $67,358 |
| Renter-Occupied | 407 (28.2%) | $33,580 |
| Average | 1,441 (100.0%) | $57,094 |
Occupancy by Householder Income Bracket in Breckenridge
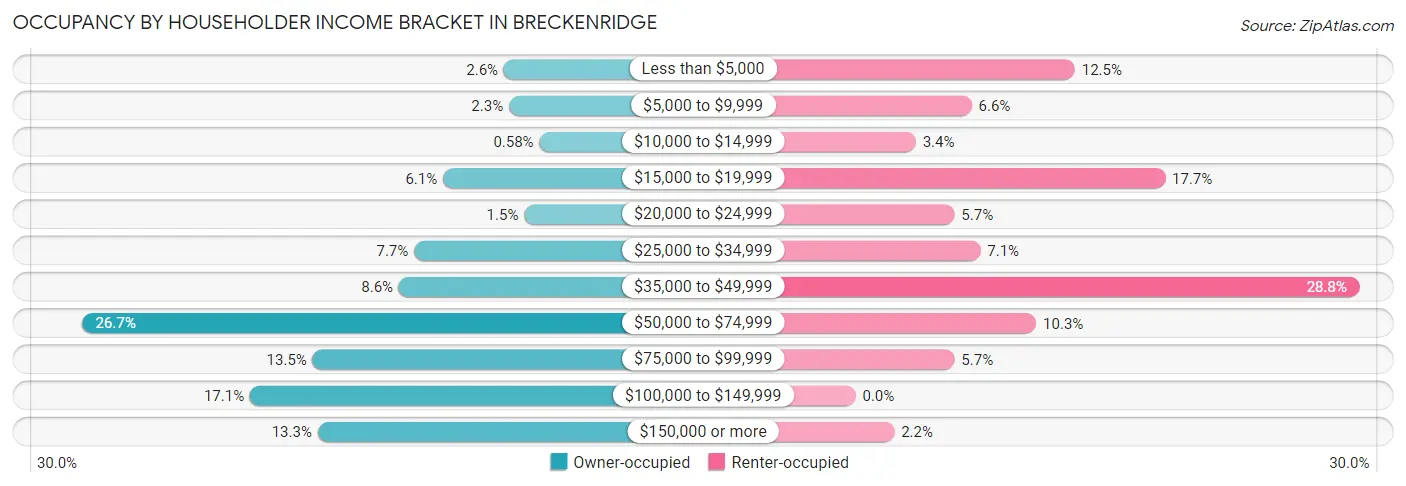
| Income Bracket | Owner-occupied | Renter-occupied |
| Less than $5,000 | 27 (2.6%) | 51 (12.5%) |
| $5,000 to $9,999 | 24 (2.3%) | 27 (6.6%) |
| $10,000 to $14,999 | 6 (0.6%) | 14 (3.4%) |
| $15,000 to $19,999 | 63 (6.1%) | 72 (17.7%) |
| $20,000 to $24,999 | 15 (1.5%) | 23 (5.7%) |
| $25,000 to $34,999 | 80 (7.7%) | 29 (7.1%) |
| $35,000 to $49,999 | 89 (8.6%) | 117 (28.7%) |
| $50,000 to $74,999 | 276 (26.7%) | 42 (10.3%) |
| $75,000 to $99,999 | 140 (13.5%) | 23 (5.7%) |
| $100,000 to $149,999 | 177 (17.1%) | 0 (0.0%) |
| $150,000 or more | 137 (13.3%) | 9 (2.2%) |
| Total | 1,034 (100.0%) | 407 (100.0%) |
Monthly Housing Cost Tiers in Breckenridge
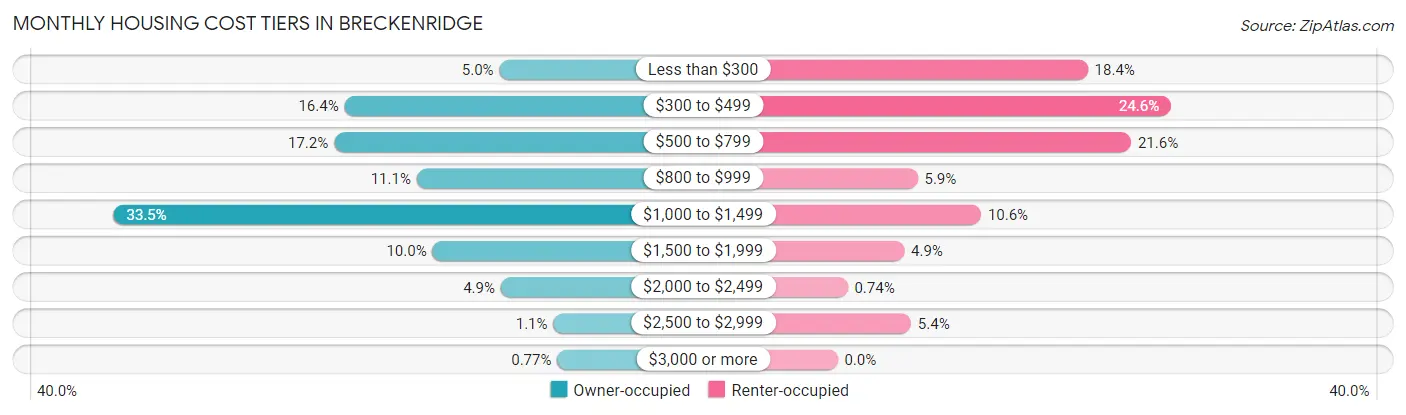
| Monthly Cost | Owner-occupied | Renter-occupied |
| Less than $300 | 52 (5.0%) | 75 (18.4%) |
| $300 to $499 | 170 (16.4%) | 100 (24.6%) |
| $500 to $799 | 178 (17.2%) | 88 (21.6%) |
| $800 to $999 | 115 (11.1%) | 24 (5.9%) |
| $1,000 to $1,499 | 346 (33.5%) | 43 (10.6%) |
| $1,500 to $1,999 | 103 (10.0%) | 20 (4.9%) |
| $2,000 to $2,499 | 51 (4.9%) | 3 (0.7%) |
| $2,500 to $2,999 | 11 (1.1%) | 22 (5.4%) |
| $3,000 or more | 8 (0.8%) | 0 (0.0%) |
| Total | 1,034 (100.0%) | 407 (100.0%) |
Physical Housing Characteristics in Breckenridge
Housing Structures in Breckenridge
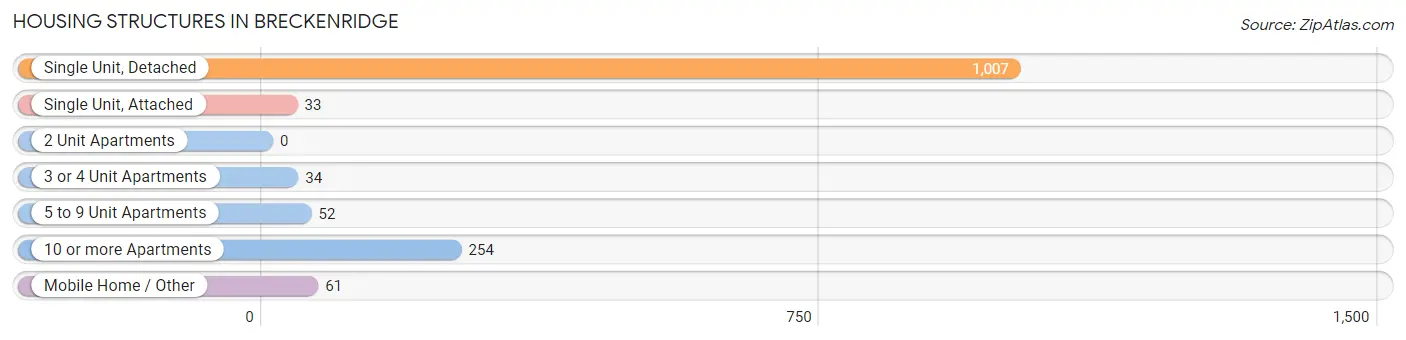
| Structure Type | # Housing Units | % Housing Units |
| Single Unit, Detached | 1,007 | 69.9% |
| Single Unit, Attached | 33 | 2.3% |
| 2 Unit Apartments | 0 | 0.0% |
| 3 or 4 Unit Apartments | 34 | 2.4% |
| 5 to 9 Unit Apartments | 52 | 3.6% |
| 10 or more Apartments | 254 | 17.6% |
| Mobile Home / Other | 61 | 4.2% |
| Total | 1,441 | 100.0% |
Housing Structures by Occupancy in Breckenridge
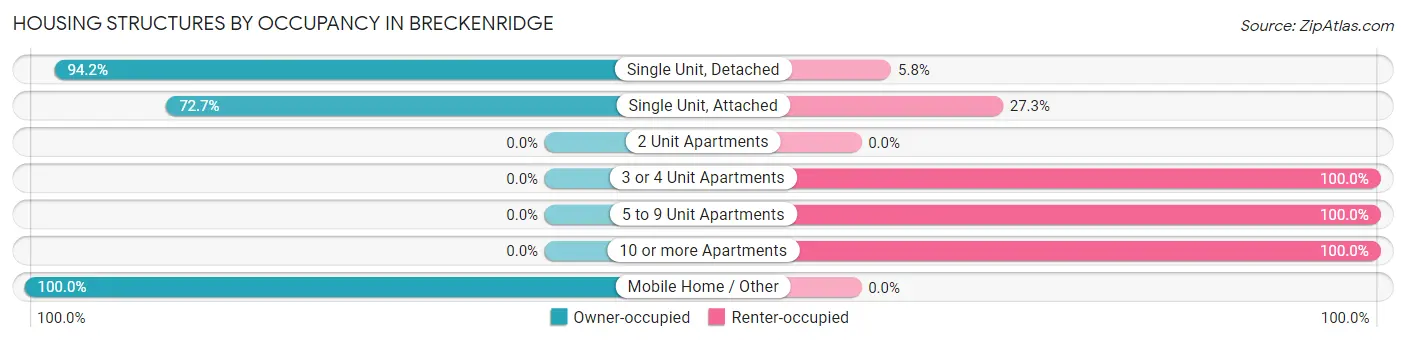
| Structure Type | Owner-occupied | Renter-occupied |
| Single Unit, Detached | 949 (94.2%) | 58 (5.8%) |
| Single Unit, Attached | 24 (72.7%) | 9 (27.3%) |
| 2 Unit Apartments | 0 (0.0%) | 0 (0.0%) |
| 3 or 4 Unit Apartments | 0 (0.0%) | 34 (100.0%) |
| 5 to 9 Unit Apartments | 0 (0.0%) | 52 (100.0%) |
| 10 or more Apartments | 0 (0.0%) | 254 (100.0%) |
| Mobile Home / Other | 61 (100.0%) | 0 (0.0%) |
| Total | 1,034 (71.8%) | 407 (28.2%) |
Housing Structures by Number of Rooms in Breckenridge
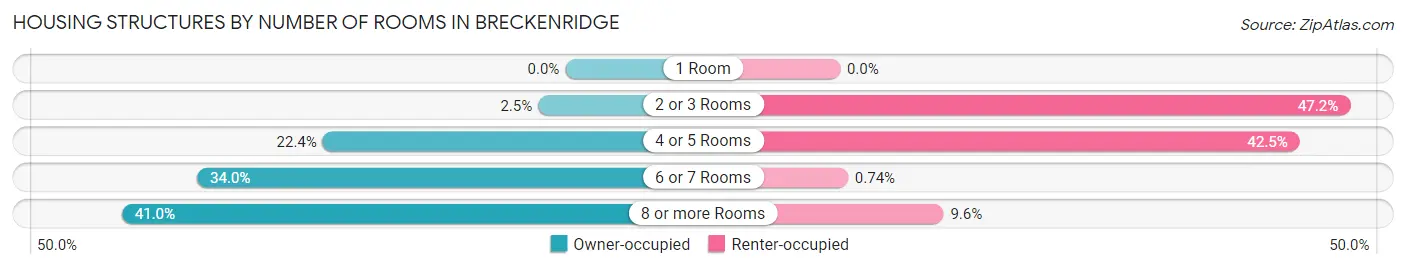
| Number of Rooms | Owner-occupied | Renter-occupied |
| 1 Room | 0 (0.0%) | 0 (0.0%) |
| 2 or 3 Rooms | 26 (2.5%) | 192 (47.2%) |
| 4 or 5 Rooms | 232 (22.4%) | 173 (42.5%) |
| 6 or 7 Rooms | 352 (34.0%) | 3 (0.7%) |
| 8 or more Rooms | 424 (41.0%) | 39 (9.6%) |
| Total | 1,034 (100.0%) | 407 (100.0%) |
Housing Structure by Heating Type in Breckenridge
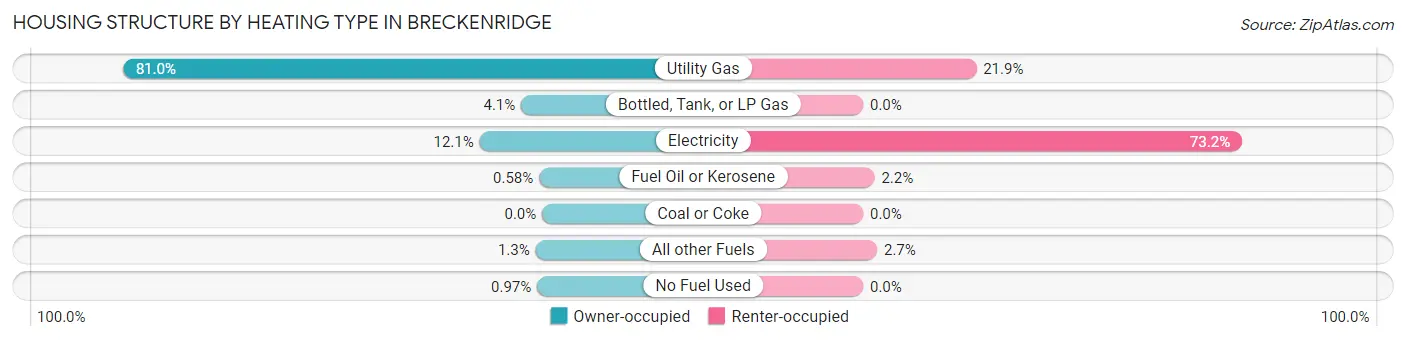
| Heating Type | Owner-occupied | Renter-occupied |
| Utility Gas | 838 (81.0%) | 89 (21.9%) |
| Bottled, Tank, or LP Gas | 42 (4.1%) | 0 (0.0%) |
| Electricity | 125 (12.1%) | 298 (73.2%) |
| Fuel Oil or Kerosene | 6 (0.6%) | 9 (2.2%) |
| Coal or Coke | 0 (0.0%) | 0 (0.0%) |
| All other Fuels | 13 (1.3%) | 11 (2.7%) |
| No Fuel Used | 10 (1.0%) | 0 (0.0%) |
| Total | 1,034 (100.0%) | 407 (100.0%) |
Household Vehicle Usage in Breckenridge
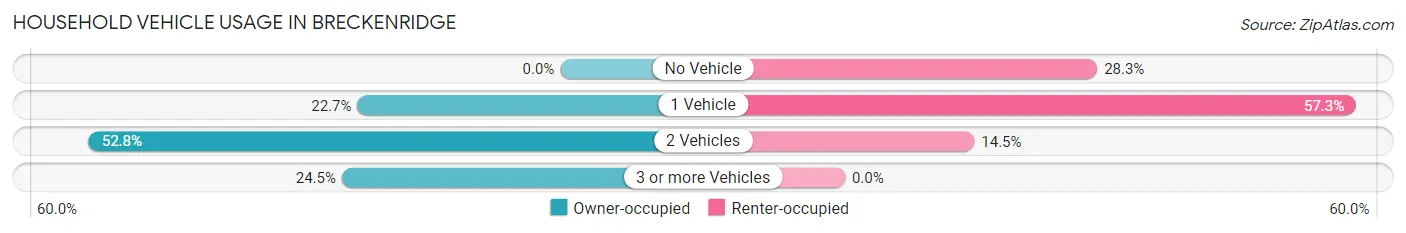
| Vehicles per Household | Owner-occupied | Renter-occupied |
| No Vehicle | 0 (0.0%) | 115 (28.3%) |
| 1 Vehicle | 235 (22.7%) | 233 (57.3%) |
| 2 Vehicles | 546 (52.8%) | 59 (14.5%) |
| 3 or more Vehicles | 253 (24.5%) | 0 (0.0%) |
| Total | 1,034 (100.0%) | 407 (100.0%) |
Real Estate & Mortgages in Breckenridge
Real Estate and Mortgage Overview in Breckenridge
| Characteristic | Without Mortgage | With Mortgage |
| Housing Units | 343 | 691 |
| Median Property Value | $103,400 | $155,700 |
| Median Household Income | $58,750 | $82 |
| Monthly Housing Costs | $435 | $8 |
| Real Estate Taxes | $1,017 | $0 |
Property Value by Mortgage Status in Breckenridge
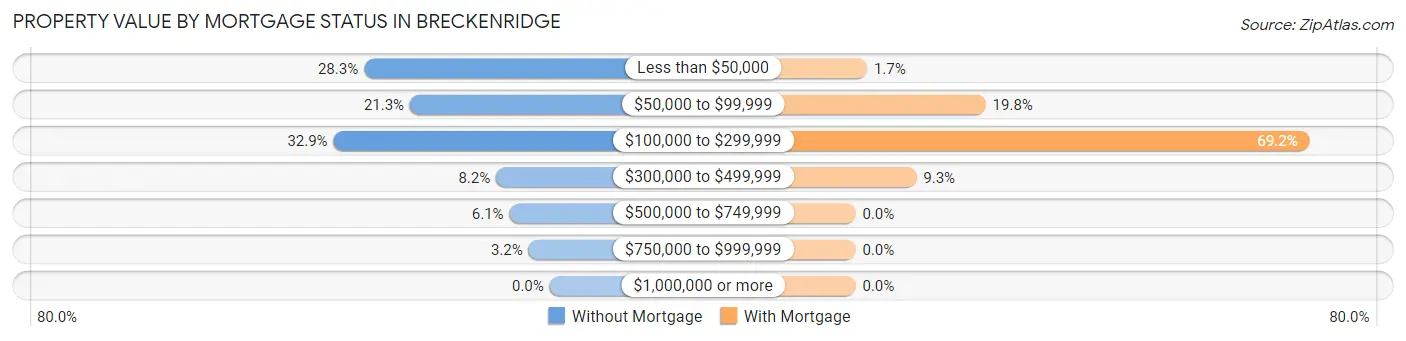
| Property Value | Without Mortgage | With Mortgage |
| Less than $50,000 | 97 (28.3%) | 12 (1.7%) |
| $50,000 to $99,999 | 73 (21.3%) | 137 (19.8%) |
| $100,000 to $299,999 | 113 (32.9%) | 478 (69.2%) |
| $300,000 to $499,999 | 28 (8.2%) | 64 (9.3%) |
| $500,000 to $749,999 | 21 (6.1%) | 0 (0.0%) |
| $750,000 to $999,999 | 11 (3.2%) | 0 (0.0%) |
| $1,000,000 or more | 0 (0.0%) | 0 (0.0%) |
| Total | 343 (100.0%) | 691 (100.0%) |
Household Income by Mortgage Status in Breckenridge
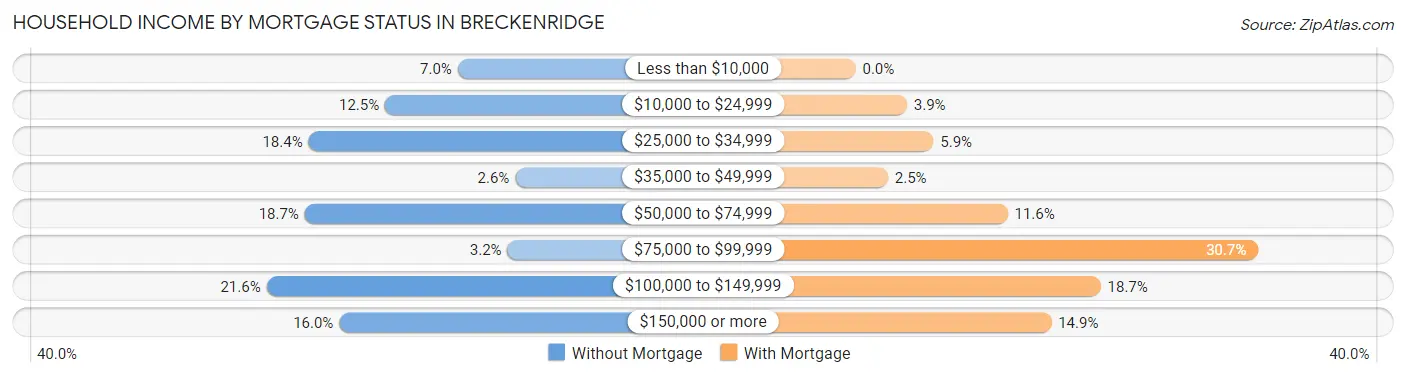
| Household Income | Without Mortgage | With Mortgage |
| Less than $10,000 | 24 (7.0%) | 0 (0.0%) |
| $10,000 to $24,999 | 43 (12.5%) | 27 (3.9%) |
| $25,000 to $34,999 | 63 (18.4%) | 41 (5.9%) |
| $35,000 to $49,999 | 9 (2.6%) | 17 (2.5%) |
| $50,000 to $74,999 | 64 (18.7%) | 80 (11.6%) |
| $75,000 to $99,999 | 11 (3.2%) | 212 (30.7%) |
| $100,000 to $149,999 | 74 (21.6%) | 129 (18.7%) |
| $150,000 or more | 55 (16.0%) | 103 (14.9%) |
| Total | 343 (100.0%) | 691 (100.0%) |
Property Value to Household Income Ratio in Breckenridge
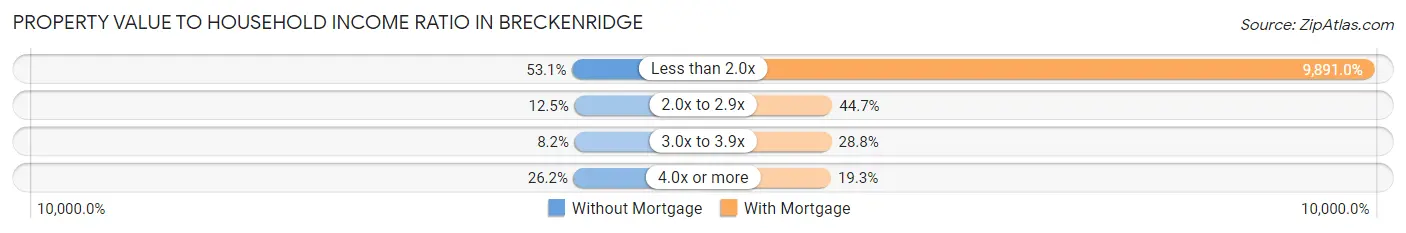
| Value-to-Income Ratio | Without Mortgage | With Mortgage |
| Less than 2.0x | 182 (53.1%) | 68,347 (9,891.0%) |
| 2.0x to 2.9x | 43 (12.5%) | 309 (44.7%) |
| 3.0x to 3.9x | 28 (8.2%) | 199 (28.8%) |
| 4.0x or more | 90 (26.2%) | 133 (19.3%) |
| Total | 343 (100.0%) | 691 (100.0%) |
Real Estate Taxes by Mortgage Status in Breckenridge
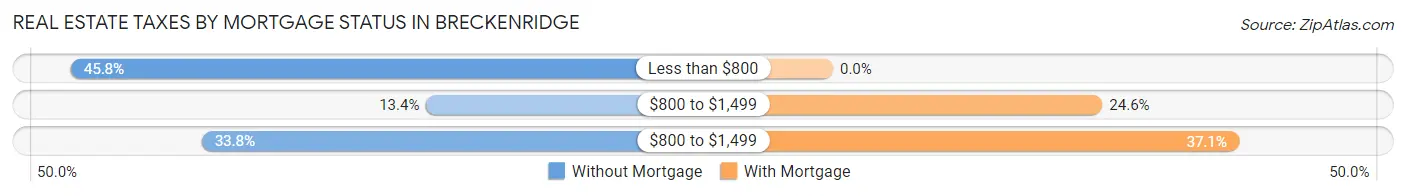
| Property Taxes | Without Mortgage | With Mortgage |
| Less than $800 | 157 (45.8%) | 0 (0.0%) |
| $800 to $1,499 | 46 (13.4%) | 170 (24.6%) |
| $800 to $1,499 | 116 (33.8%) | 256 (37.0%) |
| Total | 343 (100.0%) | 691 (100.0%) |
Health & Disability in Breckenridge
Health Insurance Coverage by Age in Breckenridge
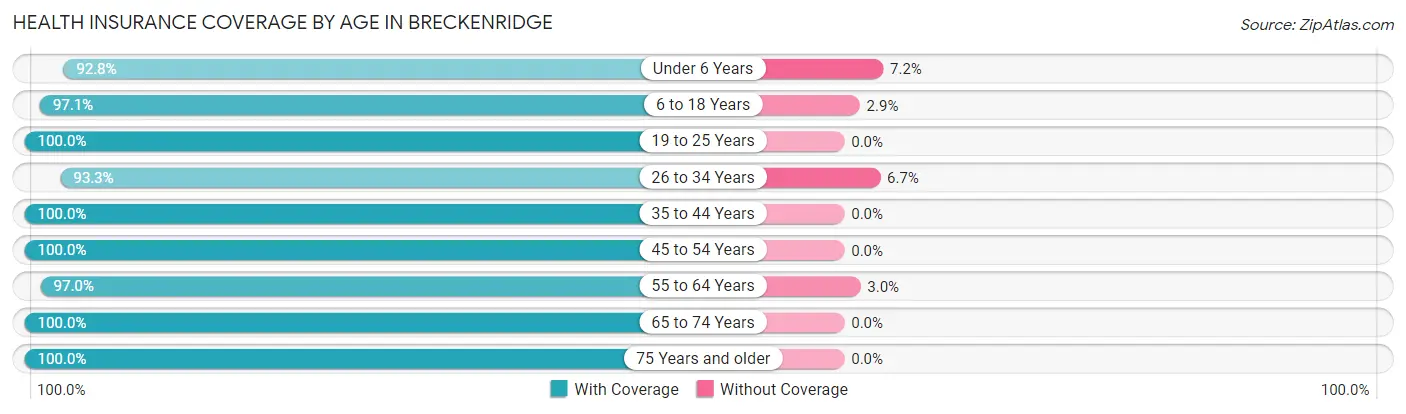
| Age Bracket | With Coverage | Without Coverage |
| Under 6 Years | 205 (92.8%) | 16 (7.2%) |
| 6 to 18 Years | 509 (97.1%) | 15 (2.9%) |
| 19 to 25 Years | 337 (100.0%) | 0 (0.0%) |
| 26 to 34 Years | 308 (93.3%) | 22 (6.7%) |
| 35 to 44 Years | 401 (100.0%) | 0 (0.0%) |
| 45 to 54 Years | 367 (100.0%) | 0 (0.0%) |
| 55 to 64 Years | 520 (97.0%) | 16 (3.0%) |
| 65 to 74 Years | 267 (100.0%) | 0 (0.0%) |
| 75 Years and older | 304 (100.0%) | 0 (0.0%) |
| Total | 3,218 (97.9%) | 69 (2.1%) |
Health Insurance Coverage by Citizenship Status in Breckenridge
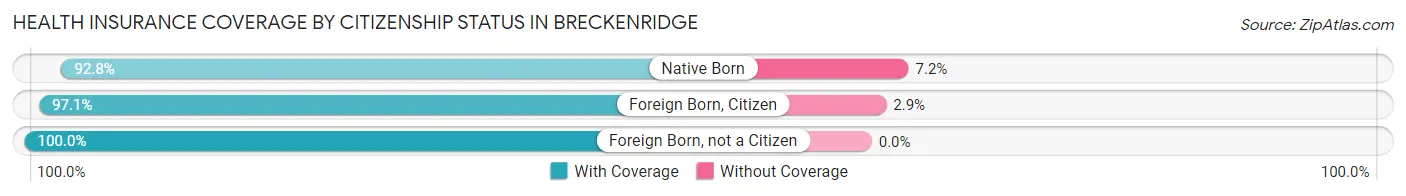
| Citizenship Status | With Coverage | Without Coverage |
| Native Born | 205 (92.8%) | 16 (7.2%) |
| Foreign Born, Citizen | 509 (97.1%) | 15 (2.9%) |
| Foreign Born, not a Citizen | 337 (100.0%) | 0 (0.0%) |
Health Insurance Coverage by Household Income in Breckenridge
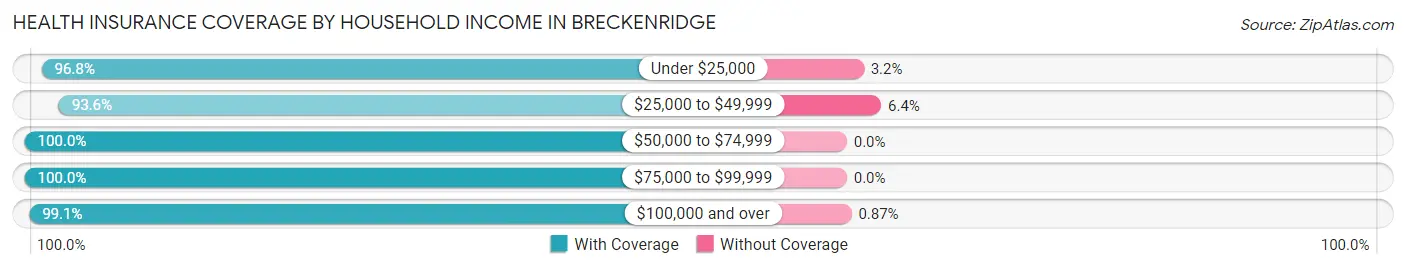
| Household Income | With Coverage | Without Coverage |
| Under $25,000 | 489 (96.8%) | 16 (3.2%) |
| $25,000 to $49,999 | 641 (93.6%) | 44 (6.4%) |
| $50,000 to $74,999 | 606 (100.0%) | 0 (0.0%) |
| $75,000 to $99,999 | 436 (100.0%) | 0 (0.0%) |
| $100,000 and over | 1,023 (99.1%) | 9 (0.9%) |
Public vs Private Health Insurance Coverage by Age in Breckenridge
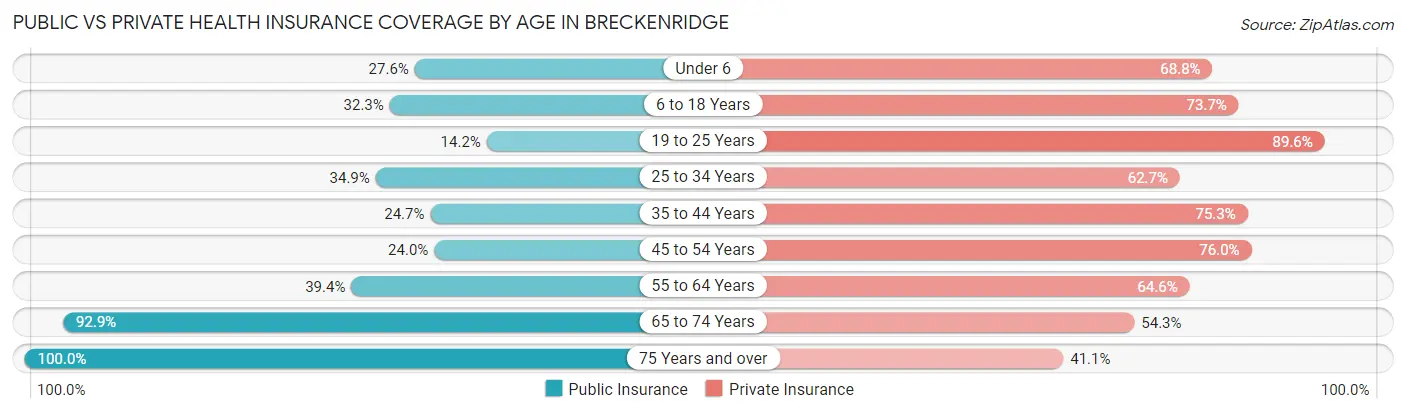
| Age Bracket | Public Insurance | Private Insurance |
| Under 6 | 61 (27.6%) | 152 (68.8%) |
| 6 to 18 Years | 169 (32.3%) | 386 (73.7%) |
| 19 to 25 Years | 48 (14.2%) | 302 (89.6%) |
| 25 to 34 Years | 115 (34.8%) | 207 (62.7%) |
| 35 to 44 Years | 99 (24.7%) | 302 (75.3%) |
| 45 to 54 Years | 88 (24.0%) | 279 (76.0%) |
| 55 to 64 Years | 211 (39.4%) | 346 (64.5%) |
| 65 to 74 Years | 248 (92.9%) | 145 (54.3%) |
| 75 Years and over | 304 (100.0%) | 125 (41.1%) |
| Total | 1,343 (40.9%) | 2,244 (68.3%) |
Disability Status by Sex by Age in Breckenridge
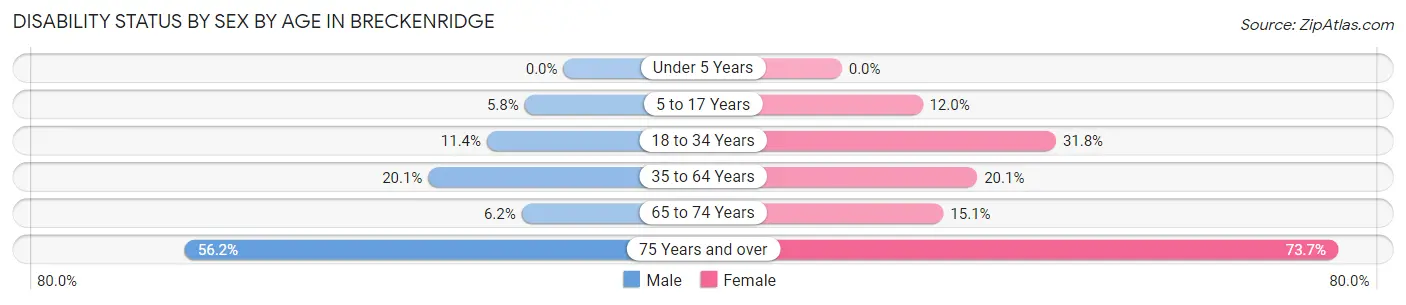
| Age Bracket | Male | Female |
| Under 5 Years | 0 (0.0%) | 0 (0.0%) |
| 5 to 17 Years | 17 (5.8%) | 29 (12.0%) |
| 18 to 34 Years | 50 (11.4%) | 83 (31.8%) |
| 35 to 64 Years | 121 (20.1%) | 141 (20.1%) |
| 65 to 74 Years | 10 (6.2%) | 16 (15.1%) |
| 75 Years and over | 77 (56.2%) | 123 (73.7%) |
Disability Class by Sex by Age in Breckenridge
Disability Class: Hearing Difficulty
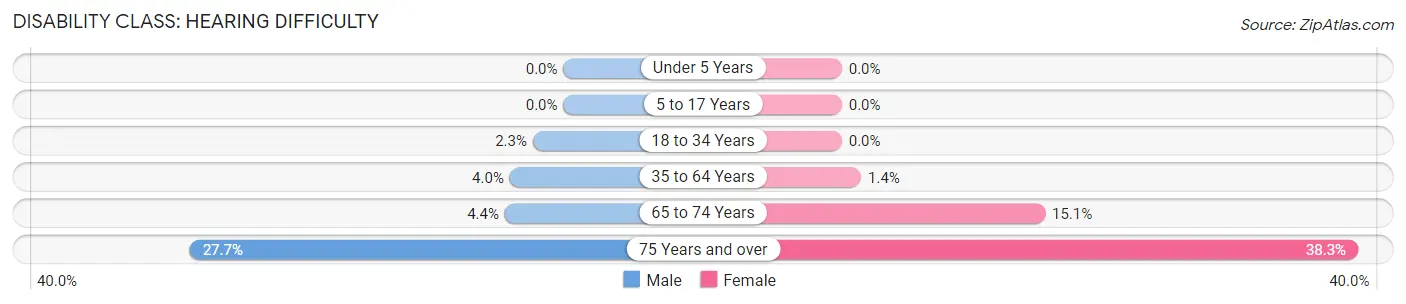
| Age Bracket | Male | Female |
| Under 5 Years | 0 (0.0%) | 0 (0.0%) |
| 5 to 17 Years | 0 (0.0%) | 0 (0.0%) |
| 18 to 34 Years | 10 (2.3%) | 0 (0.0%) |
| 35 to 64 Years | 24 (4.0%) | 10 (1.4%) |
| 65 to 74 Years | 7 (4.3%) | 16 (15.1%) |
| 75 Years and over | 38 (27.7%) | 64 (38.3%) |
Disability Class: Vision Difficulty
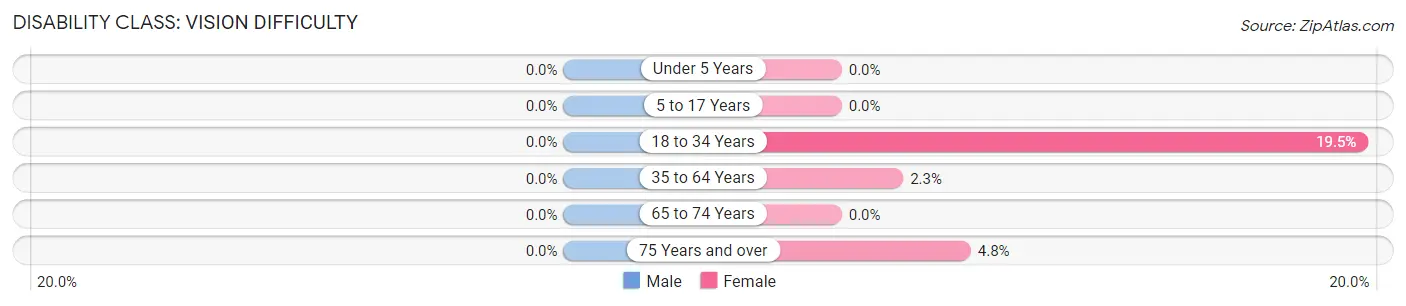
| Age Bracket | Male | Female |
| Under 5 Years | 0 (0.0%) | 0 (0.0%) |
| 5 to 17 Years | 0 (0.0%) | 0 (0.0%) |
| 18 to 34 Years | 0 (0.0%) | 51 (19.5%) |
| 35 to 64 Years | 0 (0.0%) | 16 (2.3%) |
| 65 to 74 Years | 0 (0.0%) | 0 (0.0%) |
| 75 Years and over | 0 (0.0%) | 8 (4.8%) |
Disability Class: Cognitive Difficulty
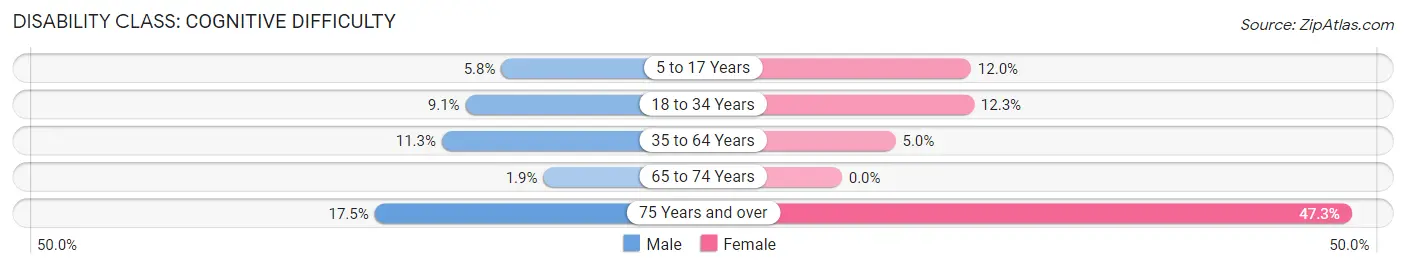
| Age Bracket | Male | Female |
| 5 to 17 Years | 17 (5.8%) | 29 (12.0%) |
| 18 to 34 Years | 40 (9.1%) | 32 (12.3%) |
| 35 to 64 Years | 68 (11.3%) | 35 (5.0%) |
| 65 to 74 Years | 3 (1.9%) | 0 (0.0%) |
| 75 Years and over | 24 (17.5%) | 79 (47.3%) |
Disability Class: Ambulatory Difficulty
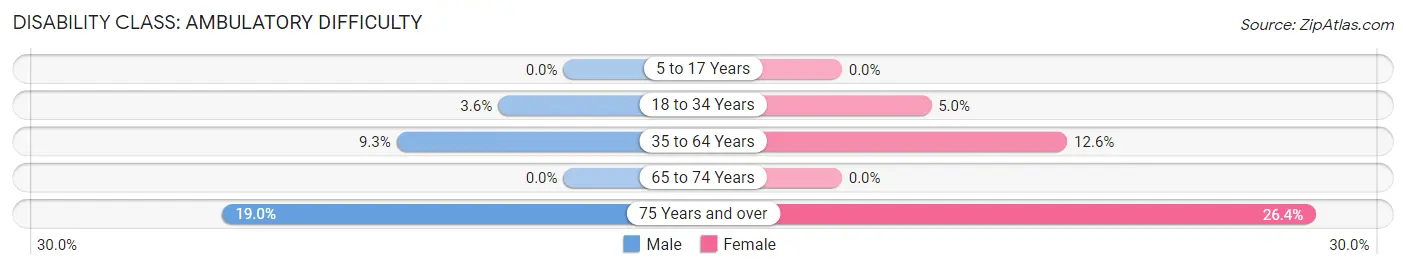
| Age Bracket | Male | Female |
| 5 to 17 Years | 0 (0.0%) | 0 (0.0%) |
| 18 to 34 Years | 16 (3.6%) | 13 (5.0%) |
| 35 to 64 Years | 56 (9.3%) | 88 (12.6%) |
| 65 to 74 Years | 0 (0.0%) | 0 (0.0%) |
| 75 Years and over | 26 (19.0%) | 44 (26.4%) |
Disability Class: Self-Care Difficulty
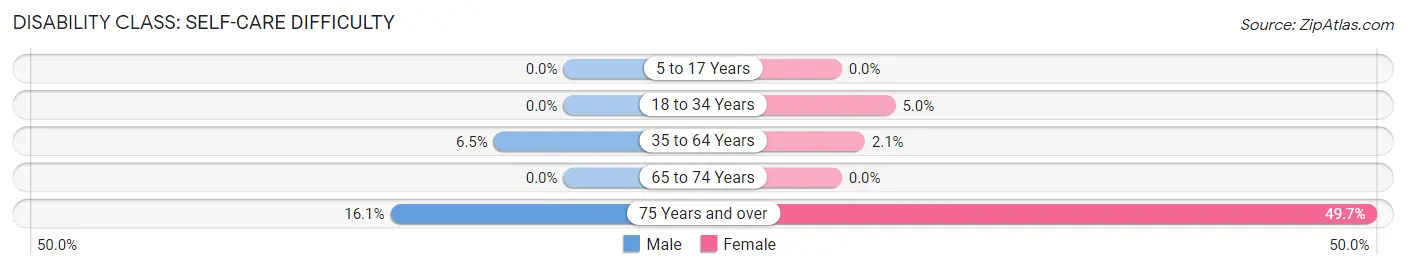
| Age Bracket | Male | Female |
| 5 to 17 Years | 0 (0.0%) | 0 (0.0%) |
| 18 to 34 Years | 0 (0.0%) | 13 (5.0%) |
| 35 to 64 Years | 39 (6.5%) | 15 (2.1%) |
| 65 to 74 Years | 0 (0.0%) | 0 (0.0%) |
| 75 Years and over | 22 (16.1%) | 83 (49.7%) |
Technology Access in Breckenridge
Computing Device Access in Breckenridge
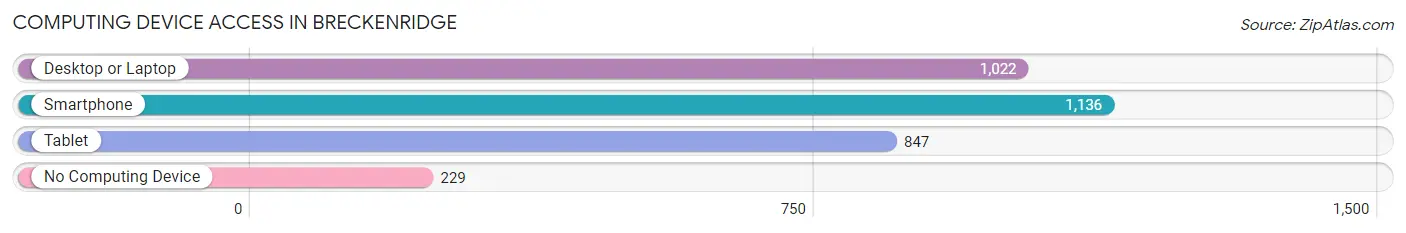
| Device Type | # Households | % Households |
| Desktop or Laptop | 1,022 | 70.9% |
| Smartphone | 1,136 | 78.8% |
| Tablet | 847 | 58.8% |
| No Computing Device | 229 | 15.9% |
| Total | 1,441 | 100.0% |
Internet Access in Breckenridge
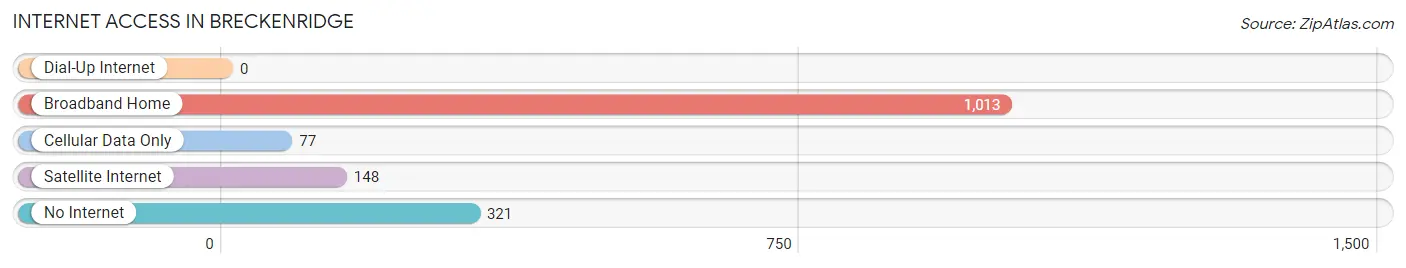
| Internet Type | # Households | % Households |
| Dial-Up Internet | 0 | 0.0% |
| Broadband Home | 1,013 | 70.3% |
| Cellular Data Only | 77 | 5.3% |
| Satellite Internet | 148 | 10.3% |
| No Internet | 321 | 22.3% |
| Total | 1,441 | 100.0% |
Breckenridge Summary
Breckenridge, Minnesota is a small city located in Wilkin County, in the northwestern part of the state. It is situated on the banks of the Red River of the North, and is the county seat of Wilkin County. The city has a population of approximately 3,000 people, and is part of the Wahpeton-Breckenridge Micropolitan Statistical Area.
History
The area that is now Breckenridge was first settled in 1871 by a group of Norwegian immigrants. The city was named after John C. Breckenridge, a former Vice President of the United States. The city was officially incorporated in 1881.
In the early 1900s, Breckenridge was a thriving agricultural and commercial center. The city was home to a number of businesses, including a flour mill, a creamery, a lumber yard, and a brickyard. The city also had a number of churches, schools, and a hospital.
In the 1950s, the city began to experience a decline in population and economic activity. This was due in part to the decline of the agricultural industry in the area, as well as the increasing popularity of suburban living. In the late 1970s, the city began to experience a resurgence in population and economic activity. This was due in part to the development of the nearby Red River Valley, which provided new opportunities for employment and recreation.
Geography
Breckenridge is located in Wilkin County, in the northwestern part of the state. It is situated on the banks of the Red River of the North, and is the county seat of Wilkin County. The city has a total area of 2.2 square miles, all of which is land.
The city is located in a flat, open area, with the Red River of the North to the east and the Otter Tail River to the west. The city is surrounded by agricultural land, and is located near the cities of Wahpeton, North Dakota and Moorhead, Minnesota.
Economy
Breckenridge is a small city with a population of approximately 3,000 people. The city’s economy is largely based on agriculture, with the majority of the population employed in the farming and ranching industries. The city is also home to a number of small businesses, including restaurants, retail stores, and service providers.
The city is also home to a number of manufacturing companies, including a plastics manufacturer, a metal fabricator, and a food processing plant. The city is also home to a number of healthcare providers, including a hospital, a nursing home, and a number of clinics.
Demographics
As of the 2010 census, the population of Breckenridge was 3,039. The racial makeup of the city was 97.2% White, 0.7% African American, 0.3% Native American, 0.3% Asian, 0.1% Pacific Islander, 0.3% from other races, and 1.2% from two or more races. Hispanic or Latino of any race were 1.2% of the population.
The median income for a household in the city was $41,944, and the median income for a family was $50,938. The per capita income for the city was $20,845. About 8.2% of families and 10.2% of the population were below the poverty line, including 14.2% of those under age 18 and 8.2% of those age 65 or over.
Common Questions
What is Per Capita Income in Breckenridge?
Per Capita income in Breckenridge is $35,658.
What is the Median Family Income in Breckenridge?
Median Family Income in Breckenridge is $82,625.
What is the Median Household income in Breckenridge?
Median Household Income in Breckenridge is $57,094.
What is Income or Wage Gap in Breckenridge?
Income or Wage Gap in Breckenridge is 35.5%.
Women in Breckenridge earn 64.5 cents for every dollar earned by a man.
What is Inequality or Gini Index in Breckenridge?
Inequality or Gini Index in Breckenridge is 0.50.
What is the Total Population of Breckenridge?
Total Population of Breckenridge is 3,390.
What is the Total Male Population of Breckenridge?
Total Male Population of Breckenridge is 1,768.
What is the Total Female Population of Breckenridge?
Total Female Population of Breckenridge is 1,622.
What is the Ratio of Males per 100 Females in Breckenridge?
There are 109.00 Males per 100 Females in Breckenridge.
What is the Ratio of Females per 100 Males in Breckenridge?
There are 91.74 Females per 100 Males in Breckenridge.
What is the Median Population Age in Breckenridge?
Median Population Age in Breckenridge is 41.3 Years.
What is the Average Family Size in Breckenridge
Average Family Size in Breckenridge is 3.1 People.
What is the Average Household Size in Breckenridge
Average Household Size in Breckenridge is 2.3 People.
How Large is the Labor Force in Breckenridge?
There are 1,761 People in the Labor Forcein in Breckenridge.
What is the Percentage of People in the Labor Force in Breckenridge?
64.1% of People are in the Labor Force in Breckenridge.
What is the Unemployment Rate in Breckenridge?
Unemployment Rate in Breckenridge is 7.5%.