Boxholm, IA Map & Demographics
Boxholm Map
Boxholm Overview
$26,443
PER CAPITA INCOME
$46,250
AVG FAMILY INCOME
$45,625
AVG HOUSEHOLD INCOME
37.8%
WAGE / INCOME GAP [ % ]
62.2¢/ $1
WAGE / INCOME GAP [ $ ]
0.39
INEQUALITY / GINI INDEX
138
TOTAL POPULATION
69
MALE POPULATION
69
FEMALE POPULATION
100.00
MALES / 100 FEMALES
100.00
FEMALES / 100 MALES
42.5
MEDIAN AGE
2.9
AVG FAMILY SIZE
2.1
AVG HOUSEHOLD SIZE
55
LABOR FORCE [ PEOPLE ]
50.5%
PERCENT IN LABOR FORCE
15.1%
UNEMPLOYMENT RATE
Boxholm Zip Codes
Boxholm Area Codes
Income in Boxholm
Income Overview in Boxholm
Per Capita Income in Boxholm is $26,443, while median incomes of families and households are $46,250 and $45,625 respectively.
| Characteristic | Number | Measure |
| Per Capita Income | 138 | $26,443 |
| Median Family Income | 34 | $46,250 |
| Mean Family Income | 34 | $65,850 |
| Median Household Income | 65 | $45,625 |
| Mean Household Income | 65 | $54,889 |
| Income Deficit | 34 | $0 |
| Wage / Income Gap (%) | 138 | 37.84% |
| Wage / Income Gap ($) | 138 | 62.16¢ per $1 |
| Gini / Inequality Index | 138 | 0.39 |
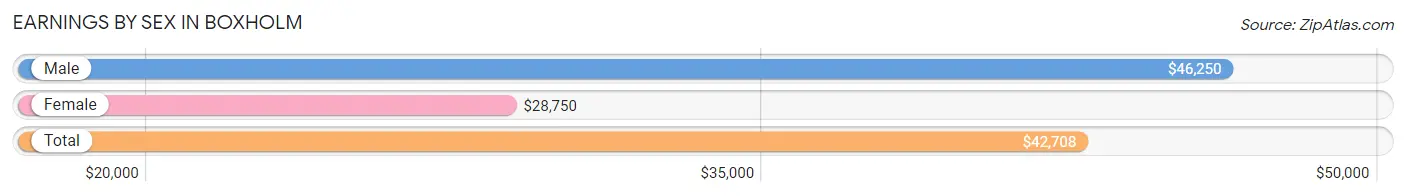
Earnings by Sex in Boxholm
Average Earnings in Boxholm are $42,708, $46,250 for men and $28,750 for women, a difference of 37.8%.
| Sex | Number | Average Earnings |
| Male | 28 (50.9%) | $46,250 |
| Female | 27 (49.1%) | $28,750 |
| Total | 55 (100.0%) | $42,708 |
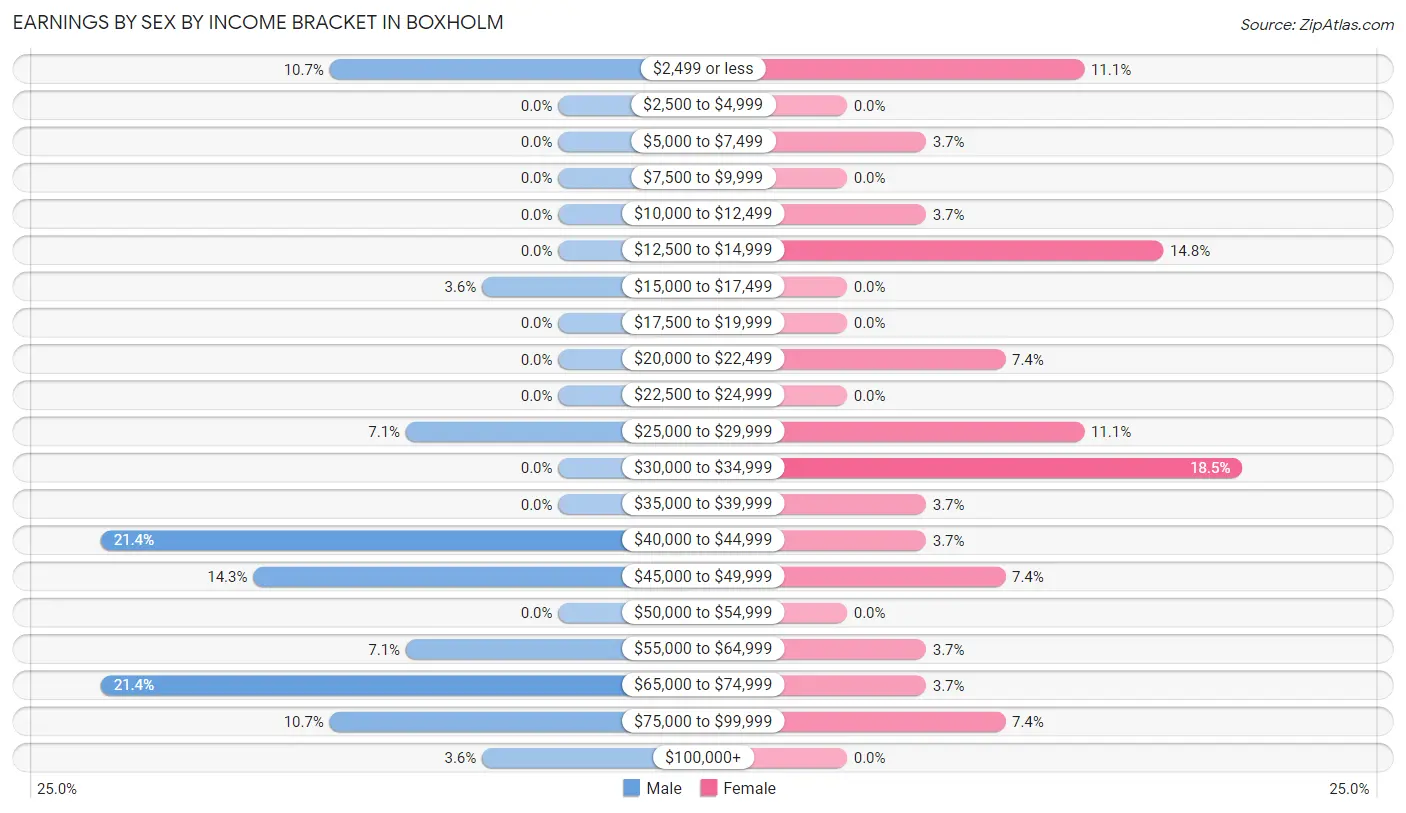
Earnings by Sex by Income Bracket in Boxholm
The most common earnings brackets in Boxholm are $40,000 to $44,999 for men (6 | 21.4%) and $30,000 to $34,999 for women (5 | 18.5%).
| Income | Male | Female |
| $2,499 or less | 3 (10.7%) | 3 (11.1%) |
| $2,500 to $4,999 | 0 (0.0%) | 0 (0.0%) |
| $5,000 to $7,499 | 0 (0.0%) | 1 (3.7%) |
| $7,500 to $9,999 | 0 (0.0%) | 0 (0.0%) |
| $10,000 to $12,499 | 0 (0.0%) | 1 (3.7%) |
| $12,500 to $14,999 | 0 (0.0%) | 4 (14.8%) |
| $15,000 to $17,499 | 1 (3.6%) | 0 (0.0%) |
| $17,500 to $19,999 | 0 (0.0%) | 0 (0.0%) |
| $20,000 to $22,499 | 0 (0.0%) | 2 (7.4%) |
| $22,500 to $24,999 | 0 (0.0%) | 0 (0.0%) |
| $25,000 to $29,999 | 2 (7.1%) | 3 (11.1%) |
| $30,000 to $34,999 | 0 (0.0%) | 5 (18.5%) |
| $35,000 to $39,999 | 0 (0.0%) | 1 (3.7%) |
| $40,000 to $44,999 | 6 (21.4%) | 1 (3.7%) |
| $45,000 to $49,999 | 4 (14.3%) | 2 (7.4%) |
| $50,000 to $54,999 | 0 (0.0%) | 0 (0.0%) |
| $55,000 to $64,999 | 2 (7.1%) | 1 (3.7%) |
| $65,000 to $74,999 | 6 (21.4%) | 1 (3.7%) |
| $75,000 to $99,999 | 3 (10.7%) | 2 (7.4%) |
| $100,000+ | 1 (3.6%) | 0 (0.0%) |
| Total | 28 (100.0%) | 27 (100.0%) |
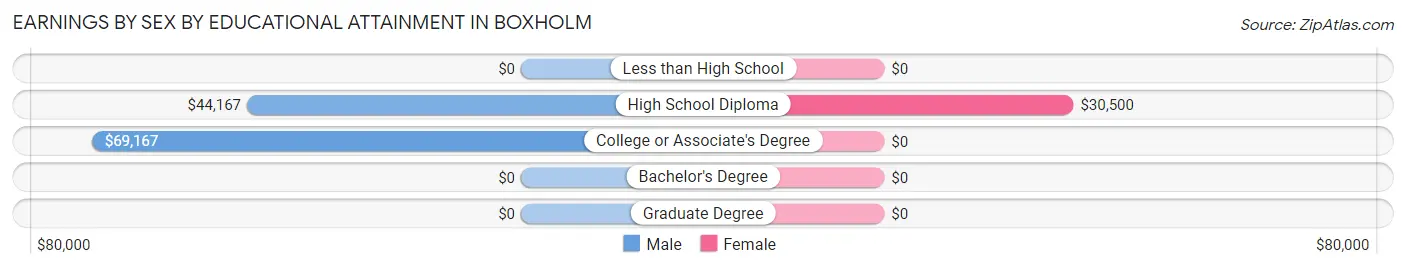
Earnings by Sex by Educational Attainment in Boxholm
Average earnings in Boxholm are $46,250 for men and $28,750 for women, a difference of 37.8%. Men with an educational attainment of college or associate's degree enjoy the highest average annual earnings of $69,167, while those with high school diploma education earn the least with $44,167. Women with an educational attainment of high school diploma earn the most with the average annual earnings of $30,500, while those with high school diploma education have the smallest earnings of $30,500.
| Educational Attainment | Male Income | Female Income |
| Less than High School | - | - |
| High School Diploma | $44,167 | $30,500 |
| College or Associate's Degree | $69,167 | $0 |
| Bachelor's Degree | - | - |
| Graduate Degree | - | - |
| Total | $46,250 | $28,750 |
Family Income in Boxholm
Family Income Brackets in Boxholm
According to the Boxholm family income data, there are 8 families falling into the $35,000 to $49,999 income range, which is the most common income bracket and makes up 23.5% of all families.
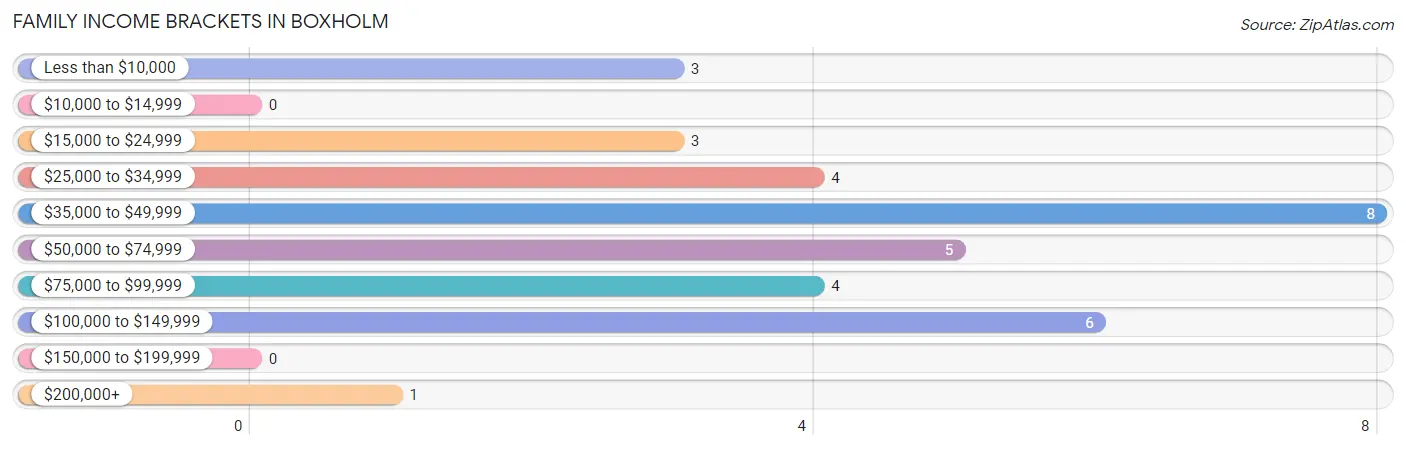
| Income Bracket | # Families | % Families |
| Less than $10,000 | 3 | 8.8% |
| $10,000 to $14,999 | 0 | 0.0% |
| $15,000 to $24,999 | 3 | 8.8% |
| $25,000 to $34,999 | 4 | 11.8% |
| $35,000 to $49,999 | 8 | 23.5% |
| $50,000 to $74,999 | 5 | 14.7% |
| $75,000 to $99,999 | 4 | 11.8% |
| $100,000 to $149,999 | 6 | 17.6% |
| $150,000 to $199,999 | 0 | 0.0% |
| $200,000+ | 1 | 2.9% |
Family Income by Famaliy Size in Boxholm
3-person families (5 | 14.7%) account for the highest median family income in Boxholm with $130,625 per family, while 3-person families (5 | 14.7%) have the highest median income of $43,542 per family member.
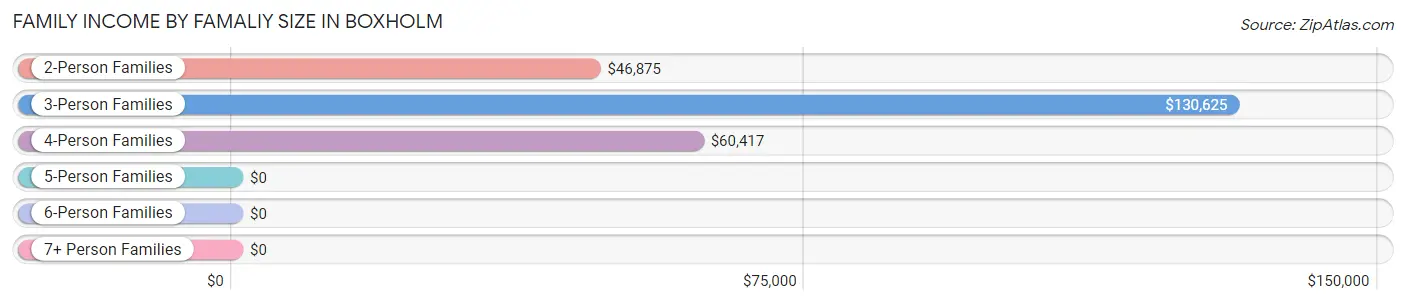
| Income Bracket | # Families | Median Income |
| 2-Person Families | 17 (50.0%) | $46,875 |
| 3-Person Families | 5 (14.7%) | $130,625 |
| 4-Person Families | 7 (20.6%) | $60,417 |
| 5-Person Families | 5 (14.7%) | $0 |
| 6-Person Families | 0 (0.0%) | $0 |
| 7+ Person Families | 0 (0.0%) | $0 |
| Total | 34 (100.0%) | $46,250 |
Family Income by Number of Earners in Boxholm
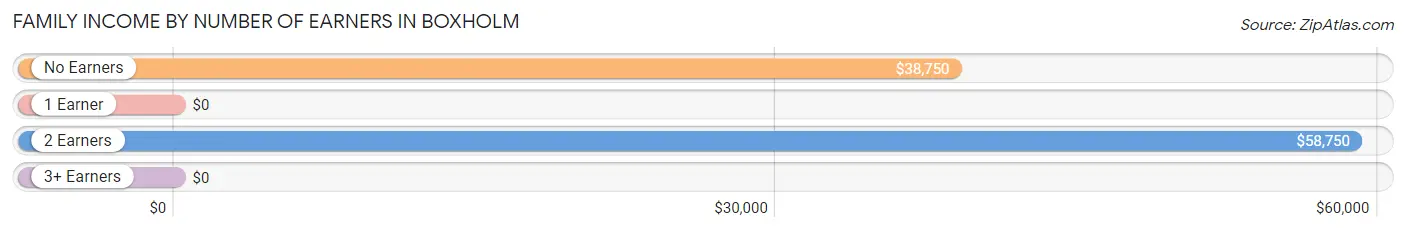
| Number of Earners | # Families | Median Income |
| No Earners | 11 (32.4%) | $38,750 |
| 1 Earner | 7 (20.6%) | $0 |
| 2 Earners | 14 (41.2%) | $58,750 |
| 3+ Earners | 2 (5.9%) | $0 |
| Total | 34 (100.0%) | $46,250 |
Household Income in Boxholm
Household Income Brackets in Boxholm
With 15 households falling in the category, the $50,000 to $74,999 income range is the most frequent in Boxholm, accounting for 23.1% of all households.
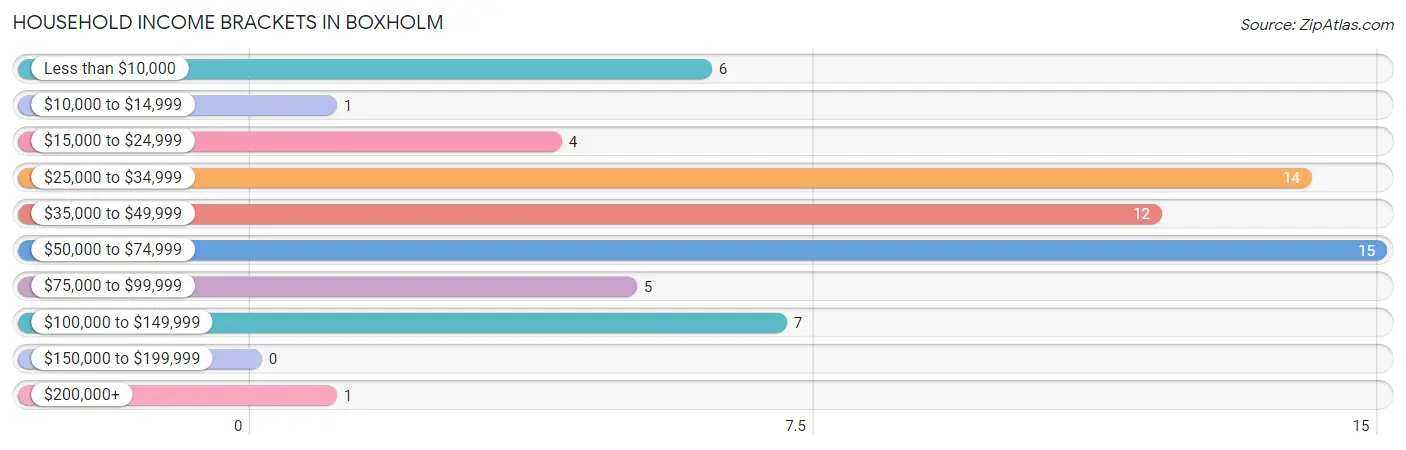
| Income Bracket | # Households | % Households |
| Less than $10,000 | 6 | 9.2% |
| $10,000 to $14,999 | 1 | 1.5% |
| $15,000 to $24,999 | 4 | 6.2% |
| $25,000 to $34,999 | 14 | 21.5% |
| $35,000 to $49,999 | 12 | 18.5% |
| $50,000 to $74,999 | 15 | 23.1% |
| $75,000 to $99,999 | 5 | 7.7% |
| $100,000 to $149,999 | 7 | 10.8% |
| $150,000 to $199,999 | 0 | 0.0% |
| $200,000+ | 1 | 1.5% |
Household Income by Householder Age in Boxholm
The median household income in Boxholm is $45,625, with the highest median household income of $53,750 found in the 45 to 64 years age bracket for the primary householder. A total of 24 households (36.9%) fall into this category. Meanwhile, the 15 to 24 years age bracket for the primary householder has the lowest median household income of $0, with 2 households (3.1%) in this group.
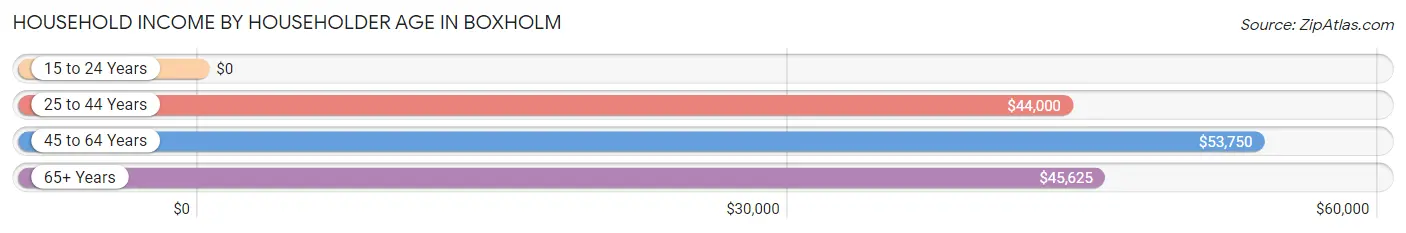
| Income Bracket | # Households | Median Income |
| 15 to 24 Years | 2 (3.1%) | $0 |
| 25 to 44 Years | 16 (24.6%) | $44,000 |
| 45 to 64 Years | 24 (36.9%) | $53,750 |
| 65+ Years | 23 (35.4%) | $45,625 |
| Total | 65 (100.0%) | $45,625 |
Poverty in Boxholm
Income Below Poverty by Sex and Age in Boxholm
With 8.7% poverty level for males and 17.4% for females among the residents of Boxholm, 12 to 14 year old males and 45 to 54 year old females are the most vulnerable to poverty, with 2 males (40.0%) and 6 females (60.0%) in their respective age groups living below the poverty level.
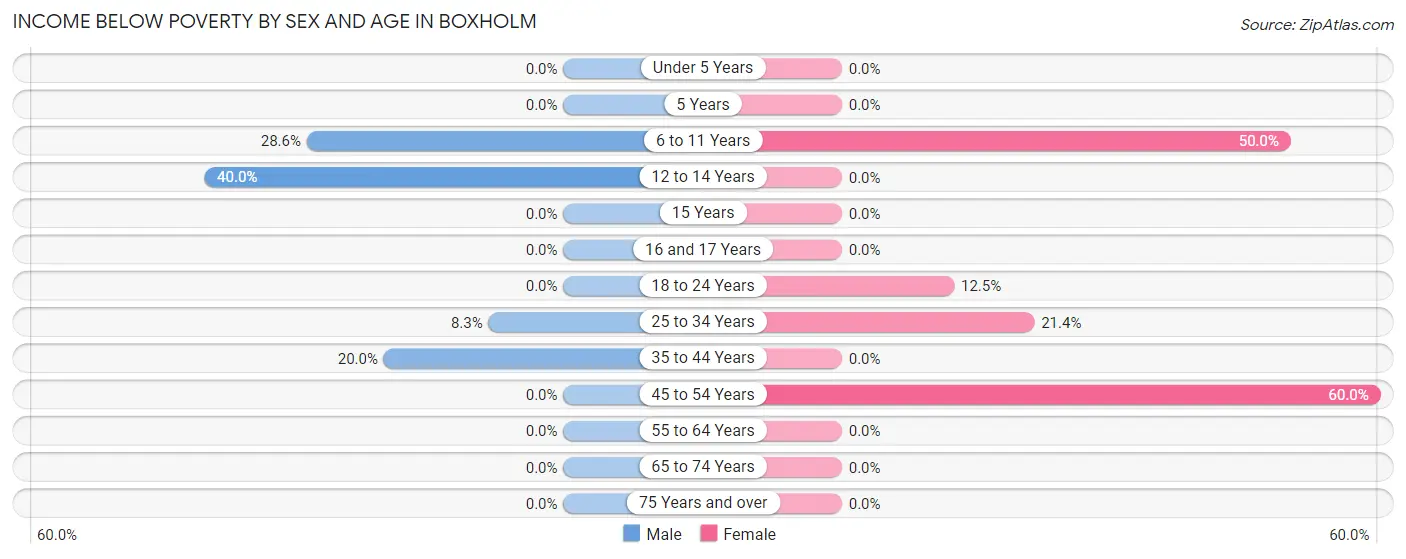
| Age Bracket | Male | Female |
| Under 5 Years | 0 (0.0%) | 0 (0.0%) |
| 5 Years | 0 (0.0%) | 0 (0.0%) |
| 6 to 11 Years | 2 (28.6%) | 2 (50.0%) |
| 12 to 14 Years | 2 (40.0%) | 0 (0.0%) |
| 15 Years | 0 (0.0%) | 0 (0.0%) |
| 16 and 17 Years | 0 (0.0%) | 0 (0.0%) |
| 18 to 24 Years | 0 (0.0%) | 1 (12.5%) |
| 25 to 34 Years | 1 (8.3%) | 3 (21.4%) |
| 35 to 44 Years | 1 (20.0%) | 0 (0.0%) |
| 45 to 54 Years | 0 (0.0%) | 6 (60.0%) |
| 55 to 64 Years | 0 (0.0%) | 0 (0.0%) |
| 65 to 74 Years | 0 (0.0%) | 0 (0.0%) |
| 75 Years and over | 0 (0.0%) | 0 (0.0%) |
| Total | 6 (8.7%) | 12 (17.4%) |
Income Above Poverty by Sex and Age in Boxholm
According to the poverty statistics in Boxholm, males aged under 5 years and females aged under 5 years are the age groups that are most secure financially, with 100.0% of males and 100.0% of females in these age groups living above the poverty line.
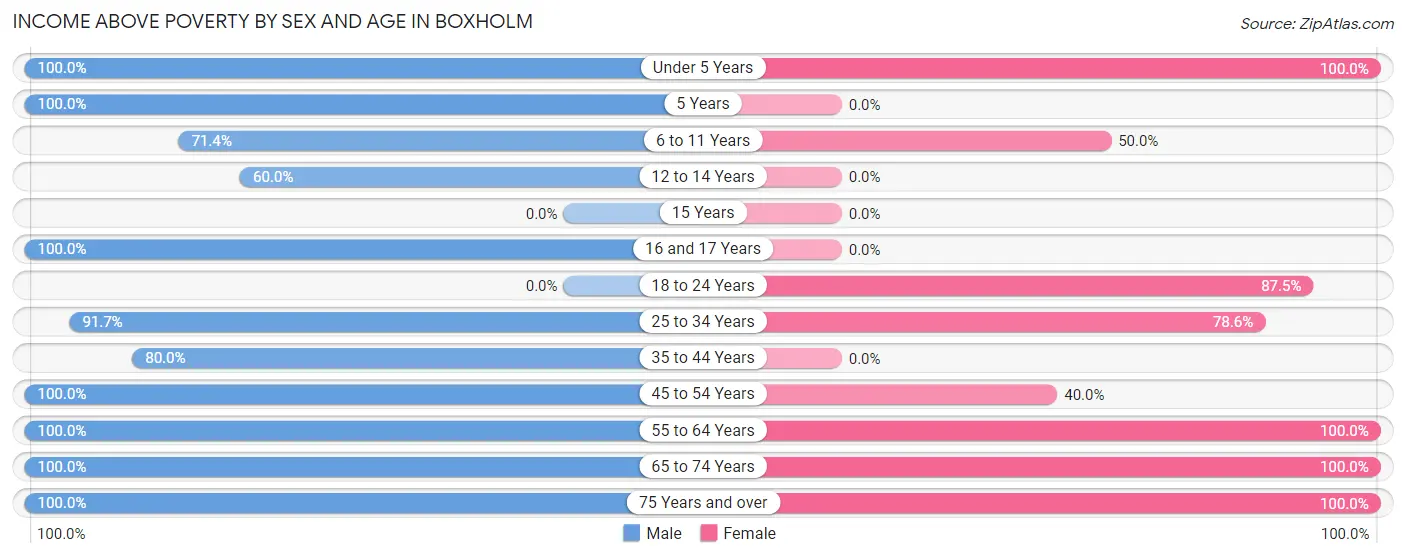
| Age Bracket | Male | Female |
| Under 5 Years | 4 (100.0%) | 5 (100.0%) |
| 5 Years | 4 (100.0%) | 0 (0.0%) |
| 6 to 11 Years | 5 (71.4%) | 2 (50.0%) |
| 12 to 14 Years | 3 (60.0%) | 0 (0.0%) |
| 15 Years | 0 (0.0%) | 0 (0.0%) |
| 16 and 17 Years | 1 (100.0%) | 0 (0.0%) |
| 18 to 24 Years | 0 (0.0%) | 7 (87.5%) |
| 25 to 34 Years | 11 (91.7%) | 11 (78.6%) |
| 35 to 44 Years | 4 (80.0%) | 0 (0.0%) |
| 45 to 54 Years | 3 (100.0%) | 4 (40.0%) |
| 55 to 64 Years | 12 (100.0%) | 12 (100.0%) |
| 65 to 74 Years | 4 (100.0%) | 9 (100.0%) |
| 75 Years and over | 12 (100.0%) | 7 (100.0%) |
| Total | 63 (91.3%) | 57 (82.6%) |
Income Below Poverty Among Married-Couple Families in Boxholm
The poverty statistics for married-couple families in Boxholm show that 10.0% or 3 of the total 30 families live below the poverty line. Families with 1 or 2 children have the highest poverty rate of 60.0%, comprising of 3 families. On the other hand, families with no children have the lowest poverty rate of 0.0%, which includes 0 families.
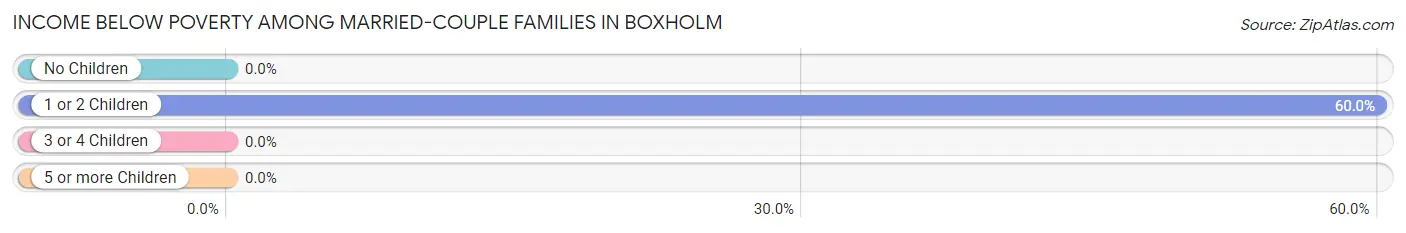
| Children | Above Poverty | Below Poverty |
| No Children | 20 (100.0%) | 0 (0.0%) |
| 1 or 2 Children | 2 (40.0%) | 3 (60.0%) |
| 3 or 4 Children | 5 (100.0%) | 0 (0.0%) |
| 5 or more Children | 0 (0.0%) | 0 (0.0%) |
| Total | 27 (90.0%) | 3 (10.0%) |
Income Below Poverty Among Single-Parent Households in Boxholm
According to the poverty data in Boxholm, 50.0% or 1 single-father households and 100.0% or 2 single-mother households are living below the poverty line. Among single-father households, those with 1 or 2 children have the highest poverty rate, with 1 households (100.0%) experiencing poverty. Likewise, among single-mother households, those with no children have the highest poverty rate, with 2 households (100.0%) falling below the poverty line.
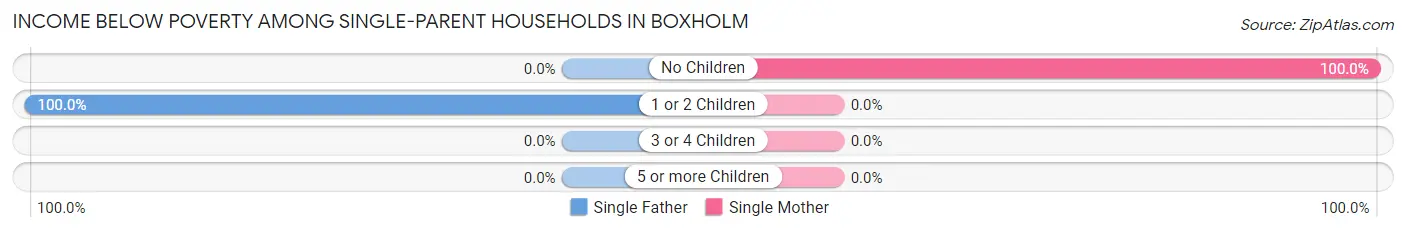
| Children | Single Father | Single Mother |
| No Children | 0 (0.0%) | 2 (100.0%) |
| 1 or 2 Children | 1 (100.0%) | 0 (0.0%) |
| 3 or 4 Children | 0 (0.0%) | 0 (0.0%) |
| 5 or more Children | 0 (0.0%) | 0 (0.0%) |
| Total | 1 (50.0%) | 2 (100.0%) |
Income Below Poverty Among Married-Couple vs Single-Parent Households in Boxholm
The poverty data for Boxholm shows that 3 of the married-couple family households (10.0%) and 3 of the single-parent households (75.0%) are living below the poverty level. Within the married-couple family households, those with 1 or 2 children have the highest poverty rate, with 3 households (60.0%) falling below the poverty line. Among the single-parent households, those with no children have the highest poverty rate, with 2 household (100.0%) living below poverty.
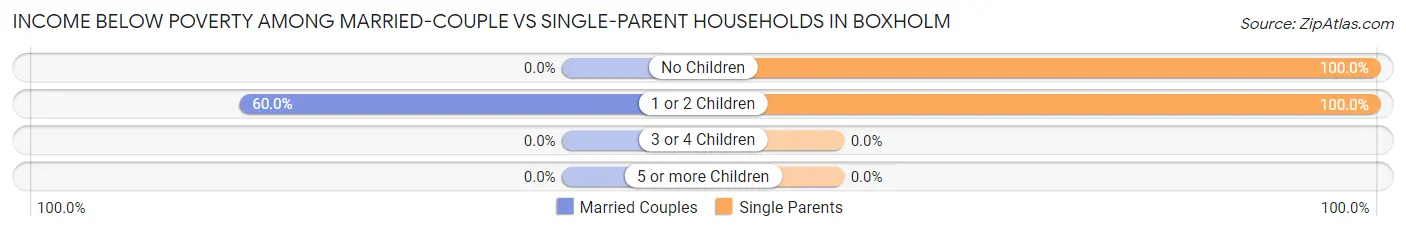
| Children | Married-Couple Families | Single-Parent Households |
| No Children | 0 (0.0%) | 2 (100.0%) |
| 1 or 2 Children | 3 (60.0%) | 1 (100.0%) |
| 3 or 4 Children | 0 (0.0%) | 0 (0.0%) |
| 5 or more Children | 0 (0.0%) | 0 (0.0%) |
| Total | 3 (10.0%) | 3 (75.0%) |
Race in Boxholm
The most populous races in Boxholm are White / Caucasian (136 | 98.6%), Hispanic or Latino (2 | 1.5%), and Two or more Races (2 | 1.5%).
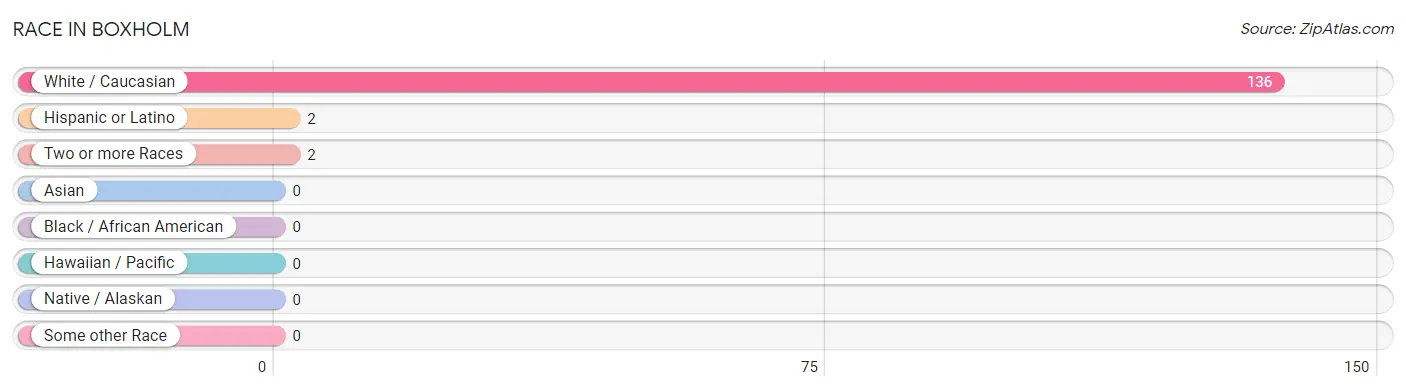
| Race | # Population | % Population |
| Asian | 0 | 0.0% |
| Black / African American | 0 | 0.0% |
| Hawaiian / Pacific | 0 | 0.0% |
| Hispanic or Latino | 2 | 1.5% |
| Native / Alaskan | 0 | 0.0% |
| White / Caucasian | 136 | 98.6% |
| Two or more Races | 2 | 1.5% |
| Some other Race | 0 | 0.0% |
| Total | 138 | 100.0% |
Ancestry in Boxholm
The most populous ancestries reported in Boxholm are German (36 | 26.1%), Dutch (27 | 19.6%), English (17 | 12.3%), Irish (17 | 12.3%), and Swedish (15 | 10.9%), together accounting for 81.2% of all Boxholm residents.
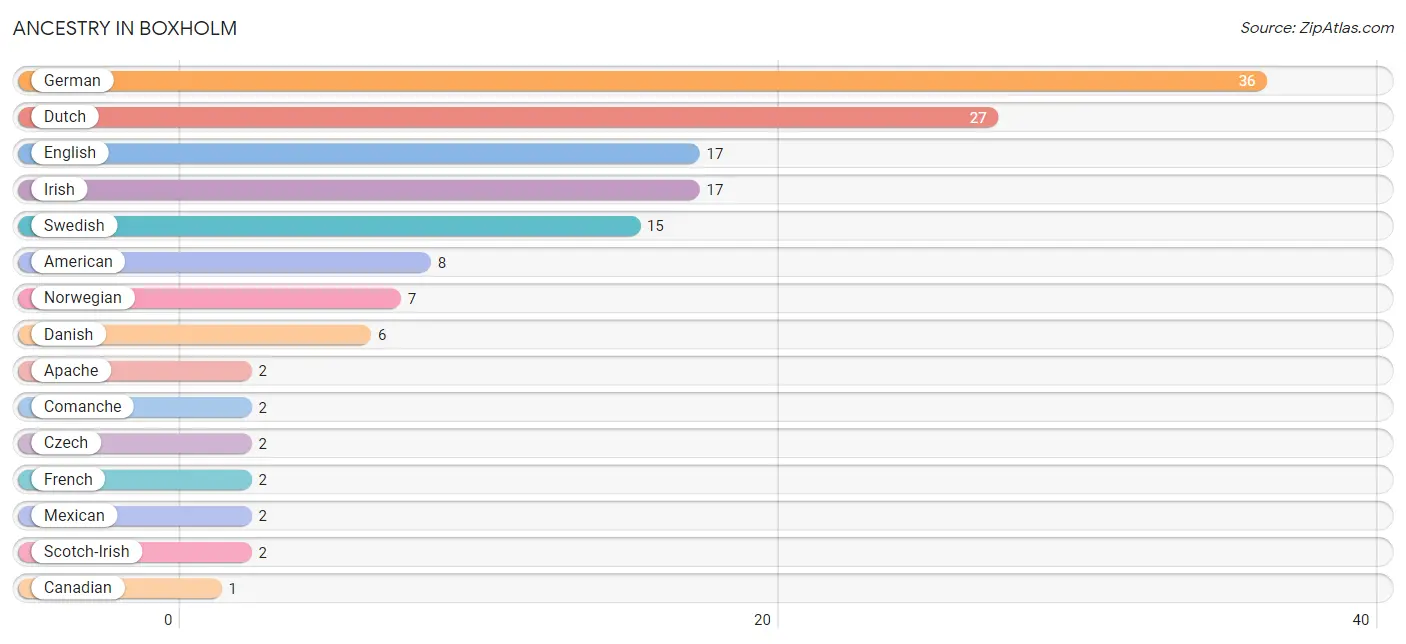
| Ancestry | # Population | % Population |
| American | 8 | 5.8% |
| Apache | 2 | 1.5% |
| Canadian | 1 | 0.7% |
| Comanche | 2 | 1.5% |
| Czech | 2 | 1.5% |
| Danish | 6 | 4.3% |
| Dutch | 27 | 19.6% |
| English | 17 | 12.3% |
| French | 2 | 1.5% |
| German | 36 | 26.1% |
| Irish | 17 | 12.3% |
| Mexican | 2 | 1.5% |
| Norwegian | 7 | 5.1% |
| Russian | 1 | 0.7% |
| Scotch-Irish | 2 | 1.5% |
| Swedish | 15 | 10.9% |
| Welsh | 1 | 0.7% | View All 17 Rows |
Immigrants in Boxholm

| Immigration Origin | # Population | % Population | View All 0 Rows |
Sex and Age in Boxholm
Sex and Age in Boxholm
The most populous age groups in Boxholm are 5 to 9 Years (11 | 15.9%) for men and 25 to 29 Years (9 | 13.0%) for women.
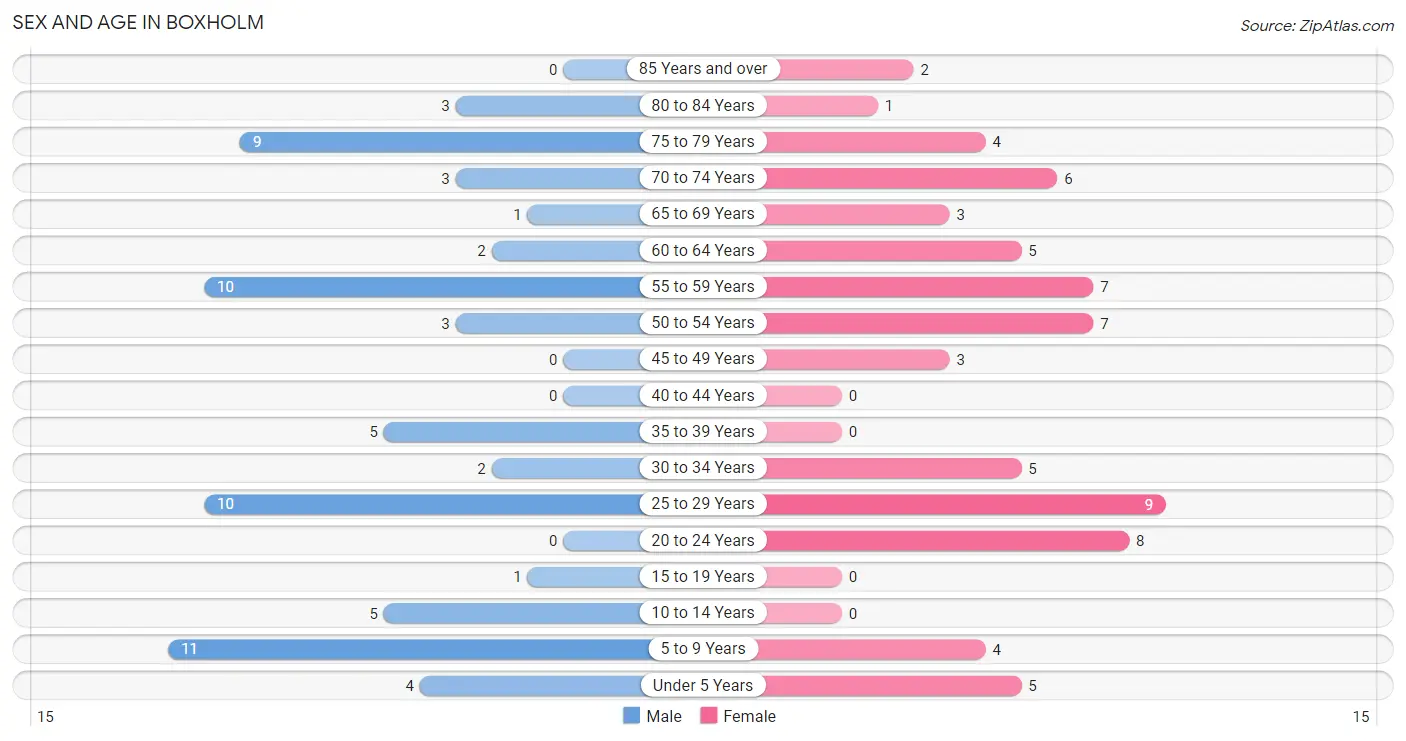
| Age Bracket | Male | Female |
| Under 5 Years | 4 (5.8%) | 5 (7.2%) |
| 5 to 9 Years | 11 (15.9%) | 4 (5.8%) |
| 10 to 14 Years | 5 (7.2%) | 0 (0.0%) |
| 15 to 19 Years | 1 (1.5%) | 0 (0.0%) |
| 20 to 24 Years | 0 (0.0%) | 8 (11.6%) |
| 25 to 29 Years | 10 (14.5%) | 9 (13.0%) |
| 30 to 34 Years | 2 (2.9%) | 5 (7.2%) |
| 35 to 39 Years | 5 (7.2%) | 0 (0.0%) |
| 40 to 44 Years | 0 (0.0%) | 0 (0.0%) |
| 45 to 49 Years | 0 (0.0%) | 3 (4.3%) |
| 50 to 54 Years | 3 (4.3%) | 7 (10.1%) |
| 55 to 59 Years | 10 (14.5%) | 7 (10.1%) |
| 60 to 64 Years | 2 (2.9%) | 5 (7.2%) |
| 65 to 69 Years | 1 (1.5%) | 3 (4.3%) |
| 70 to 74 Years | 3 (4.3%) | 6 (8.7%) |
| 75 to 79 Years | 9 (13.0%) | 4 (5.8%) |
| 80 to 84 Years | 3 (4.3%) | 1 (1.5%) |
| 85 Years and over | 0 (0.0%) | 2 (2.9%) |
| Total | 69 (100.0%) | 69 (100.0%) |
Families and Households in Boxholm
Median Family Size in Boxholm
The median family size in Boxholm is 2.94 persons per family, with single male/father families (2 | 5.9%) accounting for the largest median family size of 6.5 persons per family. On the other hand, single female/mother families (2 | 5.9%) represent the smallest median family size with 1.50 persons per family.
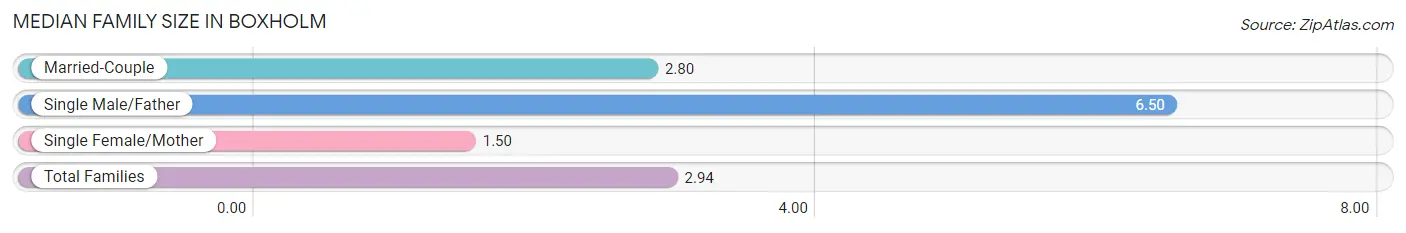
| Family Type | # Families | Family Size |
| Married-Couple | 30 (88.2%) | 2.80 |
| Single Male/Father | 2 (5.9%) | 6.50 |
| Single Female/Mother | 2 (5.9%) | 1.50 |
| Total Families | 34 (100.0%) | 2.94 |
Median Household Size in Boxholm
The median household size in Boxholm is 2.12 persons per household, with single male/father households (2 | 3.1%) accounting for the largest median household size of 7.5 persons per household. non-family households (31 | 47.7%) represent the smallest median household size with 1.16 persons per household.
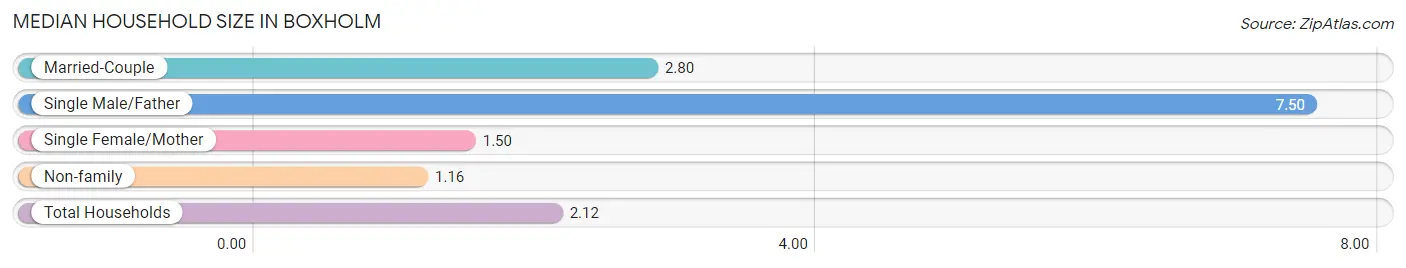
| Household Type | # Households | Household Size |
| Married-Couple | 30 (46.2%) | 2.80 |
| Single Male/Father | 2 (3.1%) | 7.50 |
| Single Female/Mother | 2 (3.1%) | 1.50 |
| Non-family | 31 (47.7%) | 1.16 |
| Total Households | 65 (100.0%) | 2.12 |
Household Size by Marriage Status in Boxholm
Out of a total of 65 households in Boxholm, 34 (52.3%) are family households, while 31 (47.7%) are nonfamily households. The most numerous type of family households are 2-person households, comprising 17, and the most common type of nonfamily households are 1-person households, comprising 29.
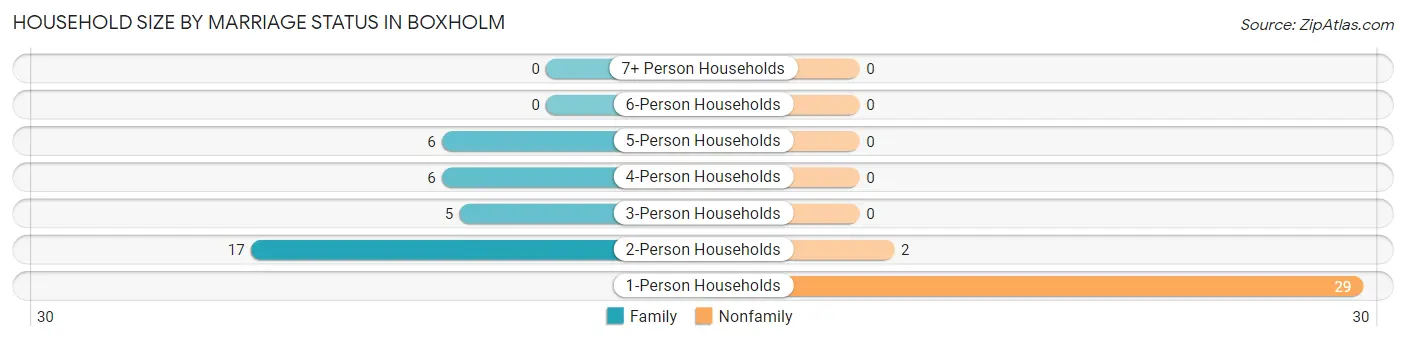
| Household Size | Family Households | Nonfamily Households |
| 1-Person Households | - | 29 (44.6%) |
| 2-Person Households | 17 (26.2%) | 2 (3.1%) |
| 3-Person Households | 5 (7.7%) | 0 (0.0%) |
| 4-Person Households | 6 (9.2%) | 0 (0.0%) |
| 5-Person Households | 6 (9.2%) | 0 (0.0%) |
| 6-Person Households | 0 (0.0%) | 0 (0.0%) |
| 7+ Person Households | 0 (0.0%) | 0 (0.0%) |
| Total | 34 (52.3%) | 31 (47.7%) |
Female Fertility in Boxholm
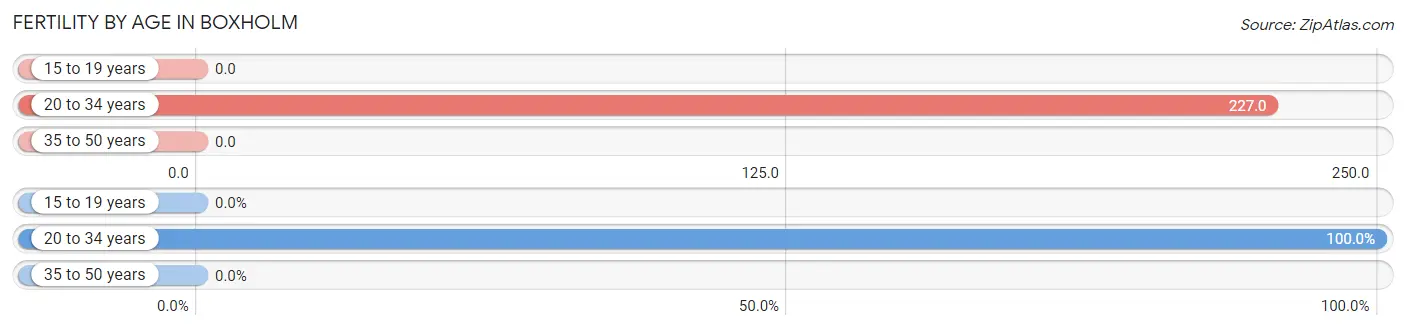
Fertility by Age in Boxholm
Average fertility rate in Boxholm is 185.0 births per 1,000 women. Women in the age bracket of 20 to 34 years have the highest fertility rate with 227.0 births per 1,000 women. Women in the age bracket of 20 to 34 years acount for 100.0% of all women with births.
| Age Bracket | Women with Births | Births / 1,000 Women |
| 15 to 19 years | 0 (0.0%) | 0.0 |
| 20 to 34 years | 5 (100.0%) | 227.0 |
| 35 to 50 years | 0 (0.0%) | 0.0 |
| Total | 5 (100.0%) | 185.0 |
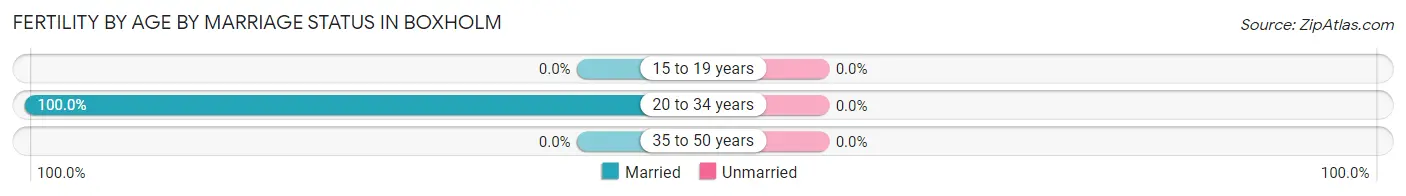
Fertility by Age by Marriage Status in Boxholm
| Age Bracket | Married | Unmarried |
| 15 to 19 years | 0 (0.0%) | 0 (0.0%) |
| 20 to 34 years | 5 (100.0%) | 0 (0.0%) |
| 35 to 50 years | 0 (0.0%) | 0 (0.0%) |
| Total | 5 (100.0%) | 0 (0.0%) |
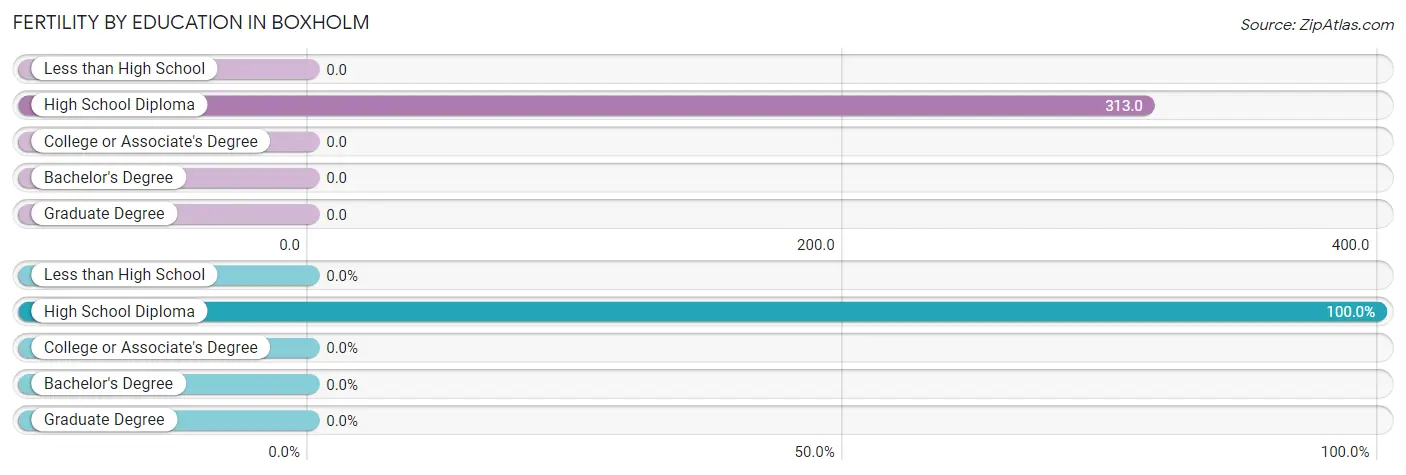
Fertility by Education in Boxholm
| Educational Attainment | Women with Births | Births / 1,000 Women |
| Less than High School | 0 (0.0%) | 0.0 |
| High School Diploma | 5 (100.0%) | 313.0 |
| College or Associate's Degree | 0 (0.0%) | 0.0 |
| Bachelor's Degree | 0 (0.0%) | 0.0 |
| Graduate Degree | 0 (0.0%) | 0.0 |
| Total | 5 (100.0%) | 185.0 |
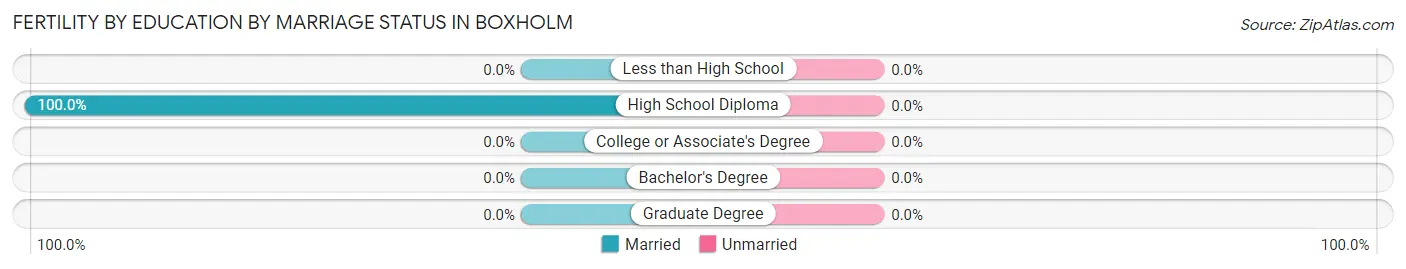
Fertility by Education by Marriage Status in Boxholm
| Educational Attainment | Married | Unmarried |
| Less than High School | 0 (0.0%) | 0 (0.0%) |
| High School Diploma | 5 (100.0%) | 0 (0.0%) |
| College or Associate's Degree | 0 (0.0%) | 0 (0.0%) |
| Bachelor's Degree | 0 (0.0%) | 0 (0.0%) |
| Graduate Degree | 0 (0.0%) | 0 (0.0%) |
| Total | 5 (100.0%) | 0 (0.0%) |
Employment Characteristics in Boxholm
Employment by Class of Employer in Boxholm
Among the 46 employed individuals in Boxholm, private company employees (35 | 76.1%), federal government employees (4 | 8.7%), and not-for-profit organizations (3 | 6.5%) make up the most common classes of employment.
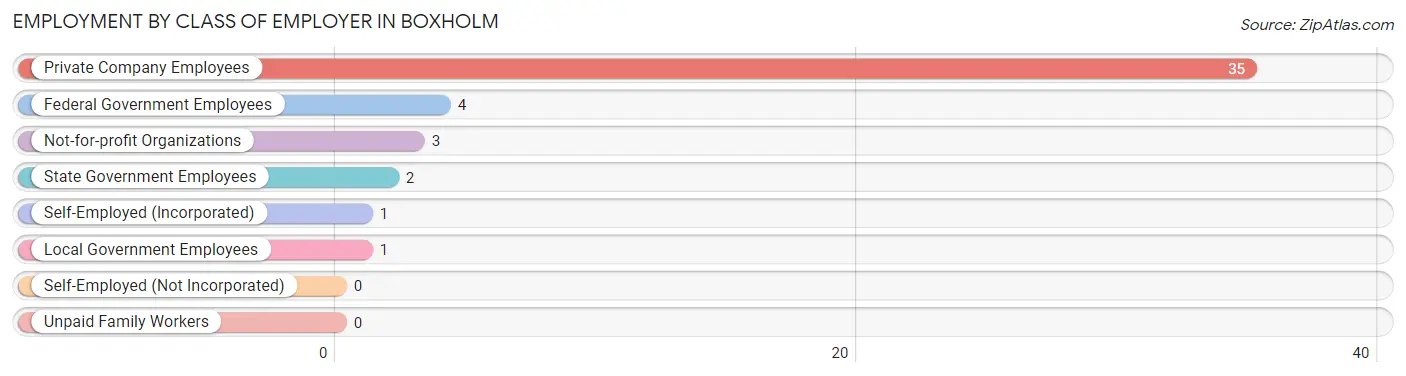
| Employer Class | # Employees | % Employees |
| Private Company Employees | 35 | 76.1% |
| Self-Employed (Incorporated) | 1 | 2.2% |
| Self-Employed (Not Incorporated) | 0 | 0.0% |
| Not-for-profit Organizations | 3 | 6.5% |
| Local Government Employees | 1 | 2.2% |
| State Government Employees | 2 | 4.3% |
| Federal Government Employees | 4 | 8.7% |
| Unpaid Family Workers | 0 | 0.0% |
| Total | 46 | 100.0% |
Employment Status by Age in Boxholm
According to the labor force statistics for Boxholm, out of the total population over 16 years of age (109), 50.5% or 55 individuals are in the labor force, with 15.1% or 8 of them unemployed. The age group with the highest labor force participation rate is 55 to 59 years, with 94.1% or 16 individuals in the labor force. Within the labor force, the 45 to 54 years age range has the highest percentage of unemployed individuals, with 60.0% or 6 of them being unemployed.
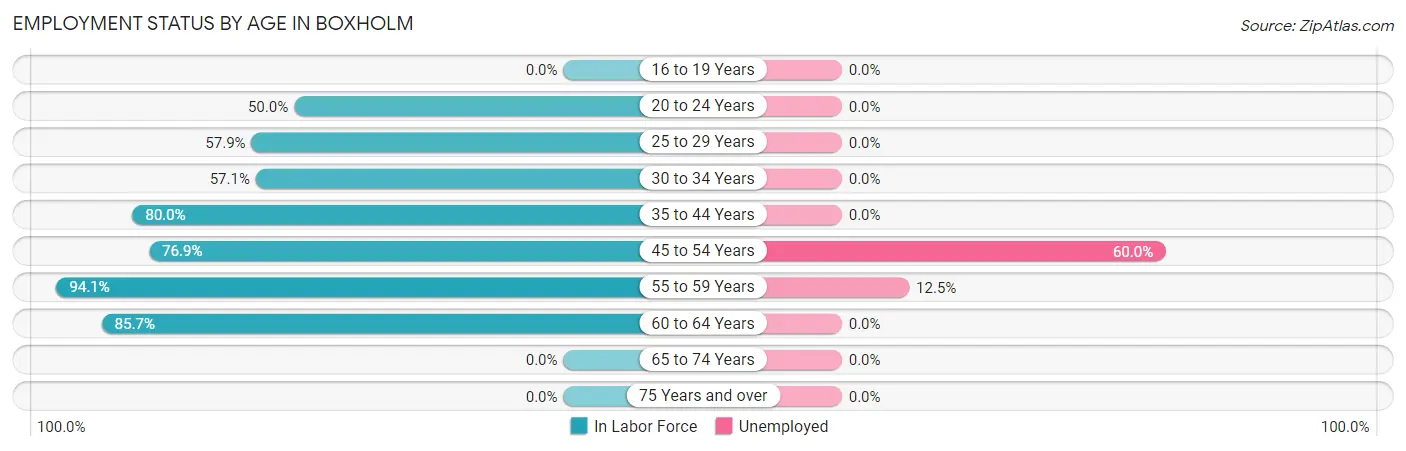
| Age Bracket | In Labor Force | Unemployed |
| 16 to 19 Years | 0 (0.0%) | 0 (0.0%) |
| 20 to 24 Years | 4 (50.0%) | 0 (0.0%) |
| 25 to 29 Years | 11 (57.9%) | 0 (0.0%) |
| 30 to 34 Years | 4 (57.1%) | 0 (0.0%) |
| 35 to 44 Years | 4 (80.0%) | 0 (0.0%) |
| 45 to 54 Years | 10 (76.9%) | 6 (60.0%) |
| 55 to 59 Years | 16 (94.1%) | 2 (12.5%) |
| 60 to 64 Years | 6 (85.7%) | 0 (0.0%) |
| 65 to 74 Years | 0 (0.0%) | 0 (0.0%) |
| 75 Years and over | 0 (0.0%) | 0 (0.0%) |
| Total | 55 (50.5%) | 8 (15.1%) |
Employment Status by Educational Attainment in Boxholm
According to labor force statistics for Boxholm, 75.0% of individuals (51) out of the total population between 25 and 64 years of age (68) are in the labor force, with 16.3% or 8 of them being unemployed. The group with the highest labor force participation rate are those with the educational attainment of less than high school, with 100.0% or 3 individuals in the labor force. Within the labor force, individuals with less than high school education have the highest percentage of unemployment, with 100.0% or 3 of them being unemployed.
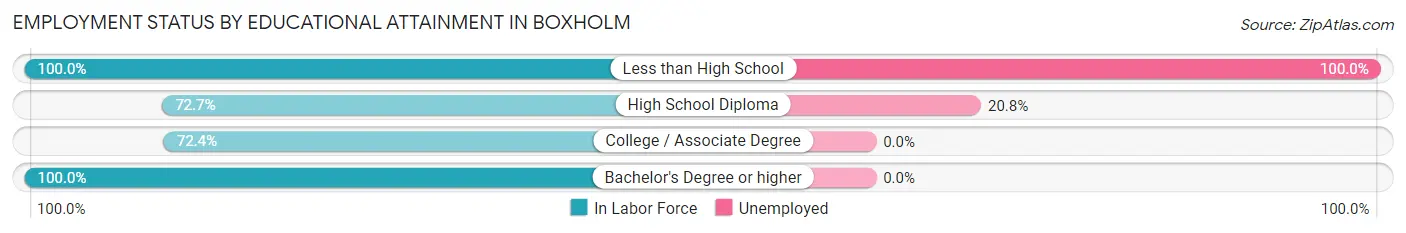
| Educational Attainment | In Labor Force | Unemployed |
| Less than High School | 3 (100.0%) | 3 (100.0%) |
| High School Diploma | 24 (72.7%) | 7 (20.8%) |
| College / Associate Degree | 21 (72.4%) | 0 (0.0%) |
| Bachelor's Degree or higher | 3 (100.0%) | 0 (0.0%) |
| Total | 51 (75.0%) | 11 (16.3%) |
Employment Occupations by Sex in Boxholm
Management, Business, Science and Arts Occupations
The most common Management, Business, Science and Arts occupations in Boxholm are Management (8 | 17.8%), Health Diagnosing & Treating (3 | 6.7%), Community & Social Service (1 | 2.2%), Education Instruction & Library (1 | 2.2%), and Health Technologists (1 | 2.2%).
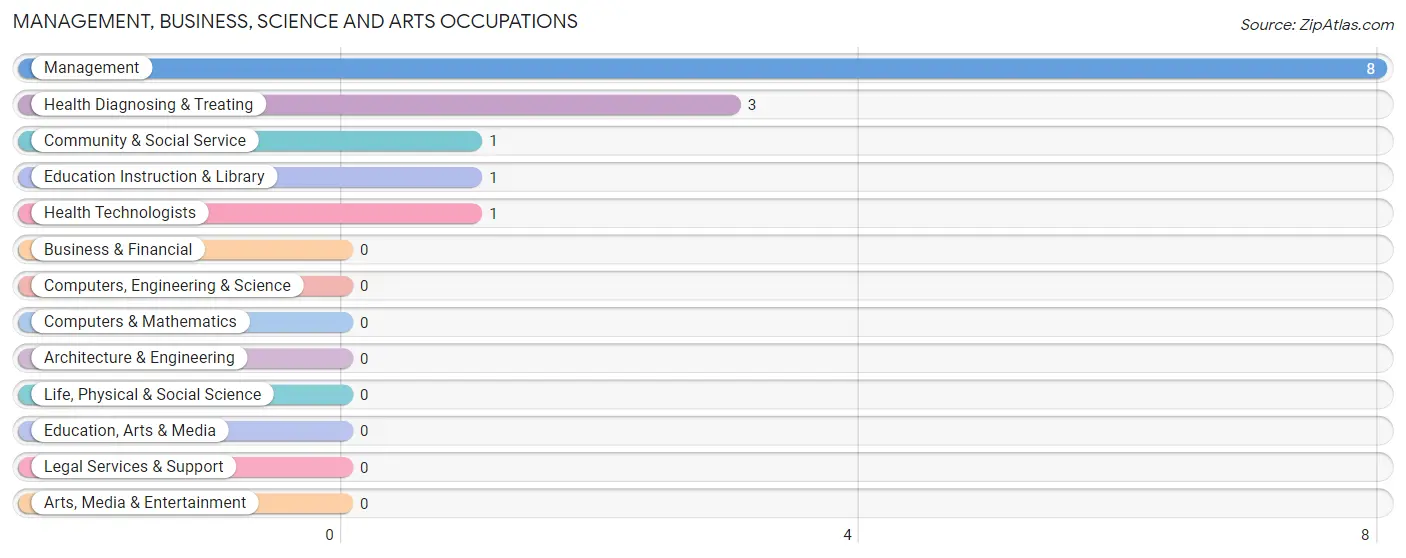
Management, Business, Science and Arts Occupations by Sex
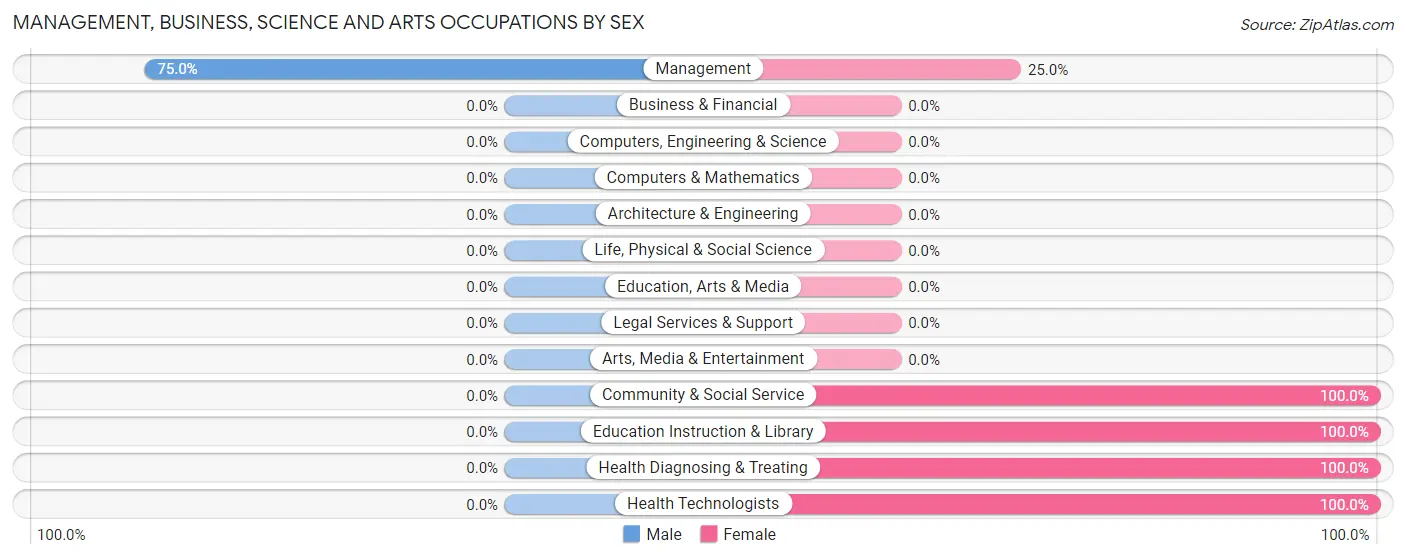
| Occupation | Male | Female |
| Management | 6 (75.0%) | 2 (25.0%) |
| Business & Financial | 0 (0.0%) | 0 (0.0%) |
| Computers, Engineering & Science | 0 (0.0%) | 0 (0.0%) |
| Computers & Mathematics | 0 (0.0%) | 0 (0.0%) |
| Architecture & Engineering | 0 (0.0%) | 0 (0.0%) |
| Life, Physical & Social Science | 0 (0.0%) | 0 (0.0%) |
| Community & Social Service | 0 (0.0%) | 1 (100.0%) |
| Education, Arts & Media | 0 (0.0%) | 0 (0.0%) |
| Legal Services & Support | 0 (0.0%) | 0 (0.0%) |
| Education Instruction & Library | 0 (0.0%) | 1 (100.0%) |
| Arts, Media & Entertainment | 0 (0.0%) | 0 (0.0%) |
| Health Diagnosing & Treating | 0 (0.0%) | 3 (100.0%) |
| Health Technologists | 0 (0.0%) | 1 (100.0%) |
| Total (Category) | 6 (50.0%) | 6 (50.0%) |
| Total (Overall) | 24 (53.3%) | 21 (46.7%) |
Services Occupations
The most common Services occupations in Boxholm are Healthcare Support (4 | 8.9%), Personal Care & Service (2 | 4.4%), and Food Preparation & Serving (1 | 2.2%).
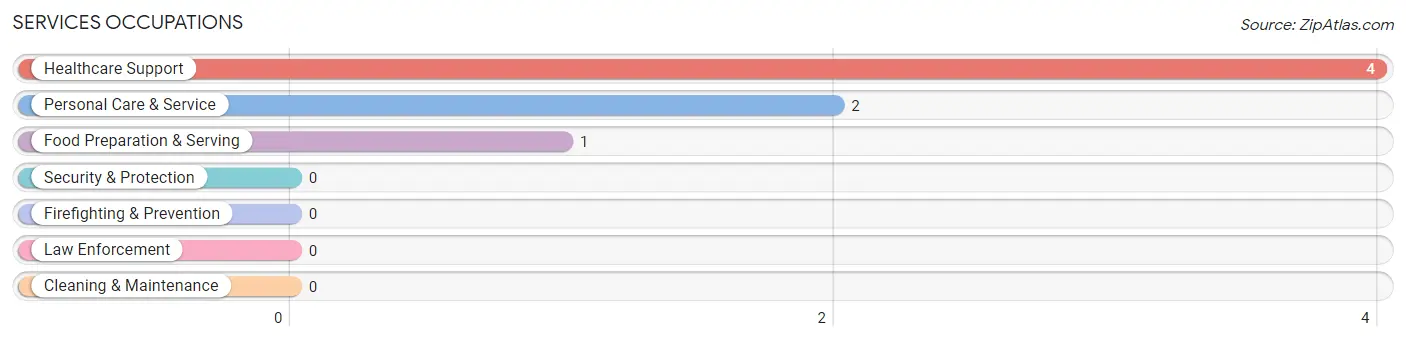
Services Occupations by Sex
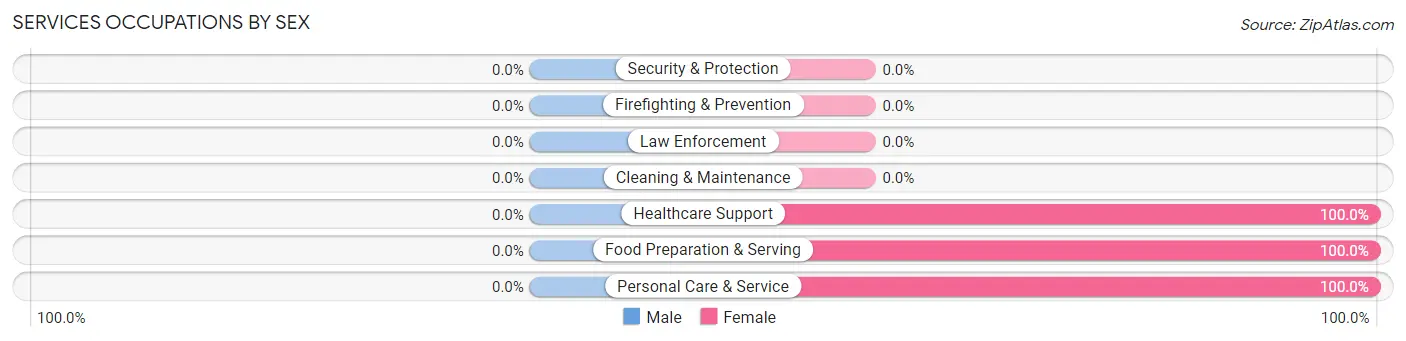
| Occupation | Male | Female |
| Healthcare Support | 0 (0.0%) | 4 (100.0%) |
| Security & Protection | 0 (0.0%) | 0 (0.0%) |
| Firefighting & Prevention | 0 (0.0%) | 0 (0.0%) |
| Law Enforcement | 0 (0.0%) | 0 (0.0%) |
| Food Preparation & Serving | 0 (0.0%) | 1 (100.0%) |
| Cleaning & Maintenance | 0 (0.0%) | 0 (0.0%) |
| Personal Care & Service | 0 (0.0%) | 2 (100.0%) |
| Total (Category) | 0 (0.0%) | 7 (100.0%) |
| Total (Overall) | 24 (53.3%) | 21 (46.7%) |
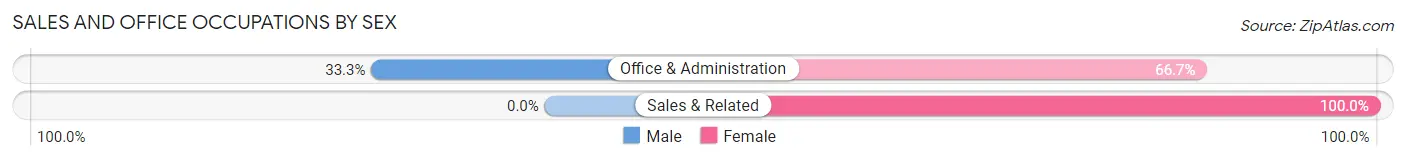
Sales and Office Occupations
The most common Sales and Office occupations in Boxholm are Office & Administration (6 | 13.3%), and Sales & Related (1 | 2.2%).
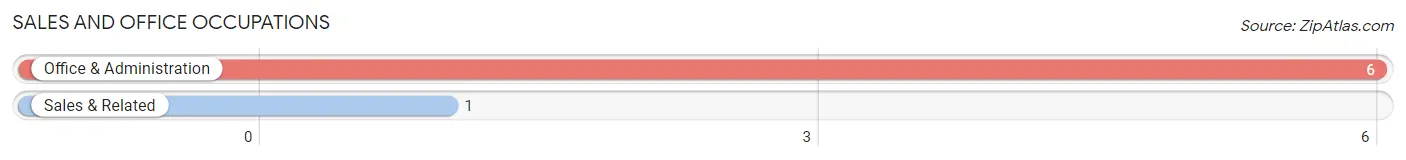
Sales and Office Occupations by Sex
| Occupation | Male | Female |
| Sales & Related | 0 (0.0%) | 1 (100.0%) |
| Office & Administration | 2 (33.3%) | 4 (66.7%) |
| Total (Category) | 2 (28.6%) | 5 (71.4%) |
| Total (Overall) | 24 (53.3%) | 21 (46.7%) |
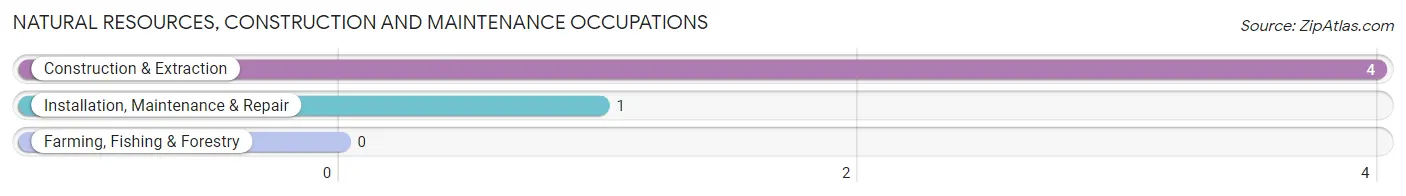
Natural Resources, Construction and Maintenance Occupations
The most common Natural Resources, Construction and Maintenance occupations in Boxholm are Construction & Extraction (4 | 8.9%), and Installation, Maintenance & Repair (1 | 2.2%).
Natural Resources, Construction and Maintenance Occupations by Sex
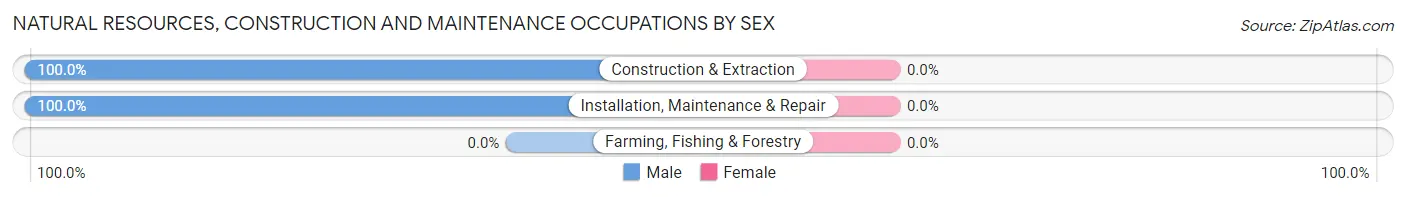
| Occupation | Male | Female |
| Farming, Fishing & Forestry | 0 (0.0%) | 0 (0.0%) |
| Construction & Extraction | 4 (100.0%) | 0 (0.0%) |
| Installation, Maintenance & Repair | 1 (100.0%) | 0 (0.0%) |
| Total (Category) | 5 (100.0%) | 0 (0.0%) |
| Total (Overall) | 24 (53.3%) | 21 (46.7%) |
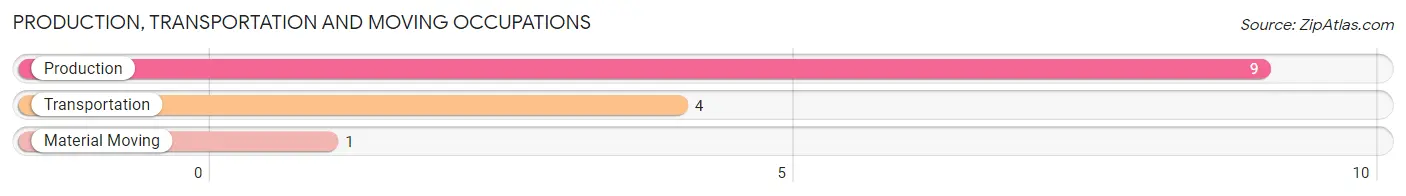
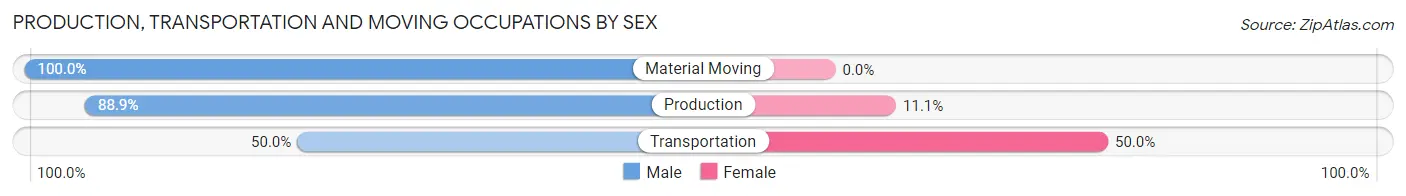
Production, Transportation and Moving Occupations
The most common Production, Transportation and Moving occupations in Boxholm are Production (9 | 20.0%), Transportation (4 | 8.9%), and Material Moving (1 | 2.2%).
Production, Transportation and Moving Occupations by Sex
| Occupation | Male | Female |
| Production | 8 (88.9%) | 1 (11.1%) |
| Transportation | 2 (50.0%) | 2 (50.0%) |
| Material Moving | 1 (100.0%) | 0 (0.0%) |
| Total (Category) | 11 (78.6%) | 3 (21.4%) |
| Total (Overall) | 24 (53.3%) | 21 (46.7%) |
Employment Industries by Sex in Boxholm
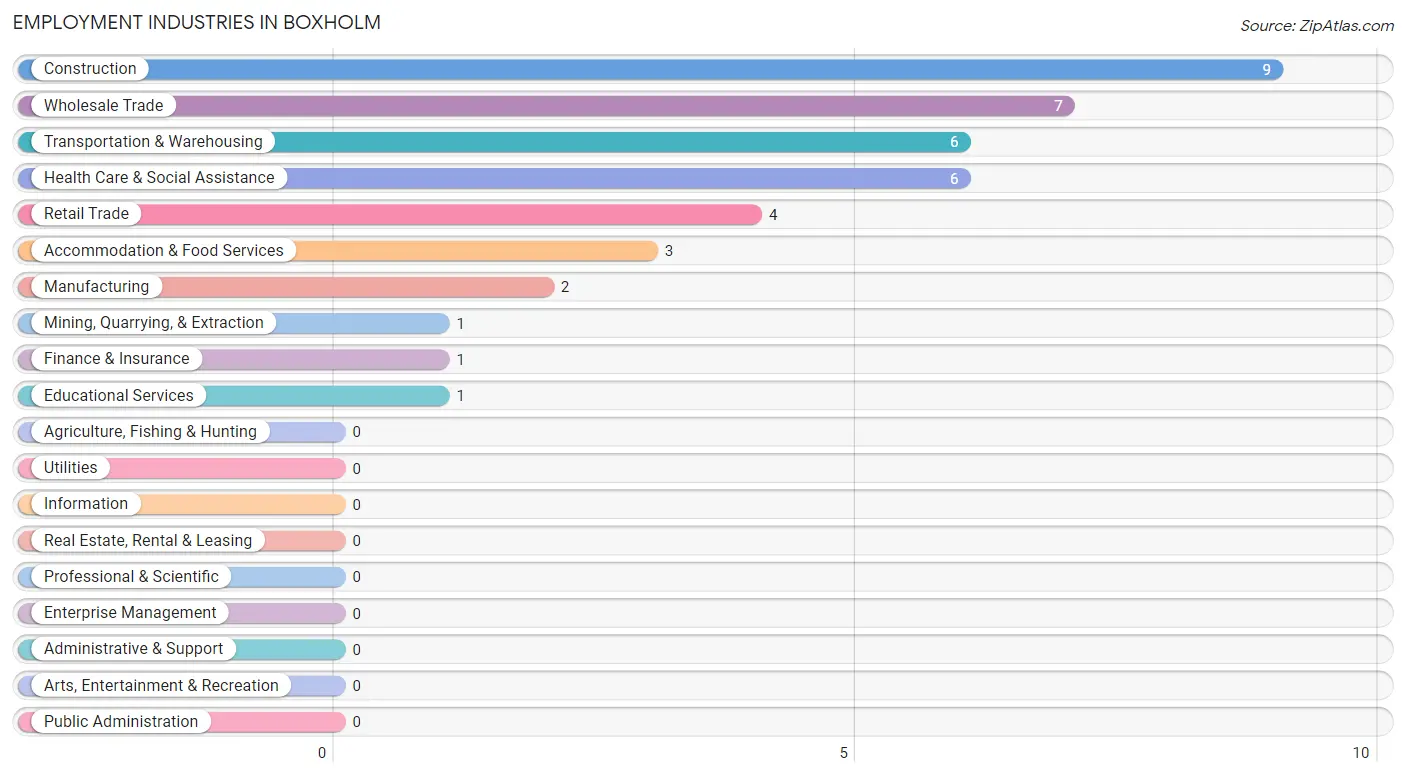
Employment Industries in Boxholm
The major employment industries in Boxholm include Construction (9 | 20.0%), Wholesale Trade (7 | 15.6%), Transportation & Warehousing (6 | 13.3%), Health Care & Social Assistance (6 | 13.3%), and Retail Trade (4 | 8.9%).
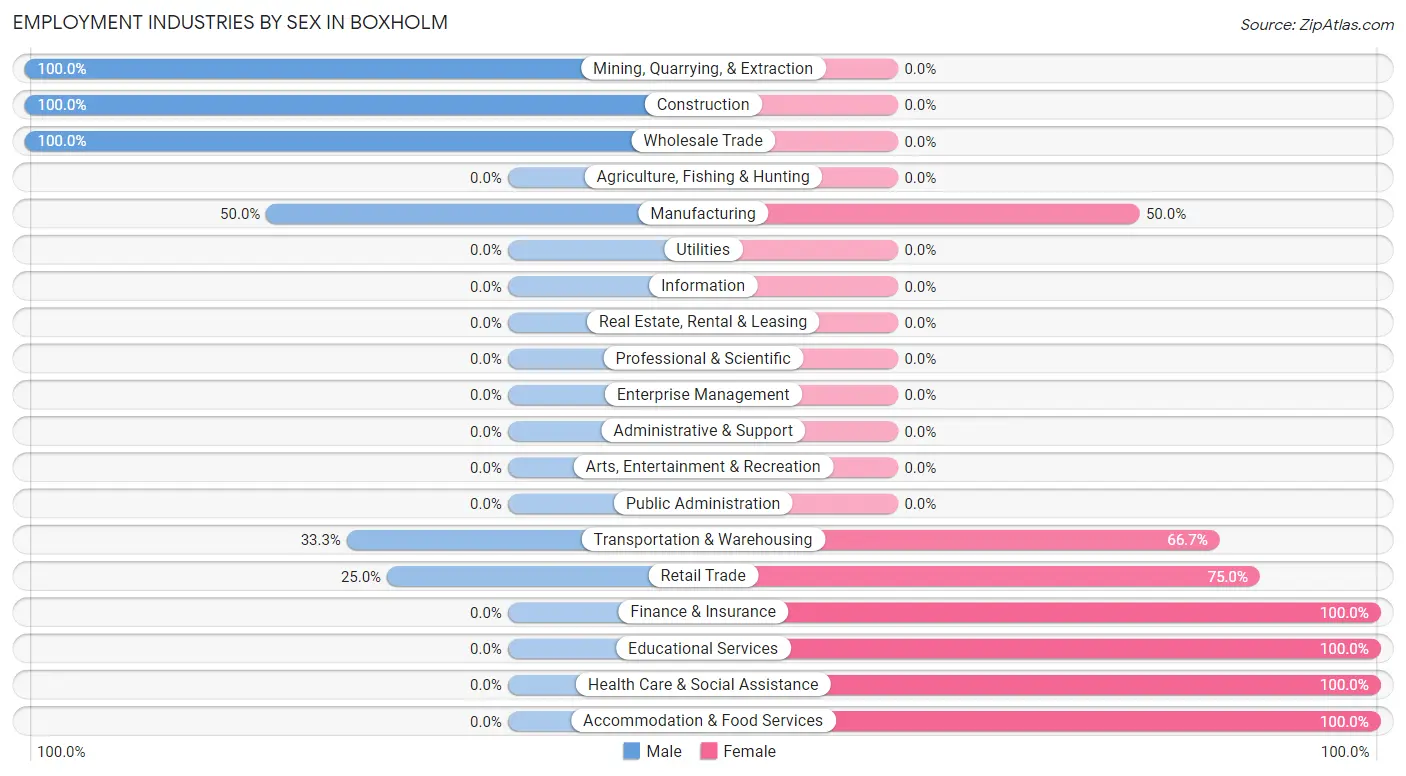
Employment Industries by Sex in Boxholm
The Boxholm industries that see more men than women are Mining, Quarrying, & Extraction (100.0%), Construction (100.0%), and Wholesale Trade (100.0%), whereas the industries that tend to have a higher number of women are Finance & Insurance (100.0%), Educational Services (100.0%), and Health Care & Social Assistance (100.0%).
| Industry | Male | Female |
| Agriculture, Fishing & Hunting | 0 (0.0%) | 0 (0.0%) |
| Mining, Quarrying, & Extraction | 1 (100.0%) | 0 (0.0%) |
| Construction | 9 (100.0%) | 0 (0.0%) |
| Manufacturing | 1 (50.0%) | 1 (50.0%) |
| Wholesale Trade | 7 (100.0%) | 0 (0.0%) |
| Retail Trade | 1 (25.0%) | 3 (75.0%) |
| Transportation & Warehousing | 2 (33.3%) | 4 (66.7%) |
| Utilities | 0 (0.0%) | 0 (0.0%) |
| Information | 0 (0.0%) | 0 (0.0%) |
| Finance & Insurance | 0 (0.0%) | 1 (100.0%) |
| Real Estate, Rental & Leasing | 0 (0.0%) | 0 (0.0%) |
| Professional & Scientific | 0 (0.0%) | 0 (0.0%) |
| Enterprise Management | 0 (0.0%) | 0 (0.0%) |
| Administrative & Support | 0 (0.0%) | 0 (0.0%) |
| Educational Services | 0 (0.0%) | 1 (100.0%) |
| Health Care & Social Assistance | 0 (0.0%) | 6 (100.0%) |
| Arts, Entertainment & Recreation | 0 (0.0%) | 0 (0.0%) |
| Accommodation & Food Services | 0 (0.0%) | 3 (100.0%) |
| Public Administration | 0 (0.0%) | 0 (0.0%) |
| Total | 24 (53.3%) | 21 (46.7%) |
Education in Boxholm
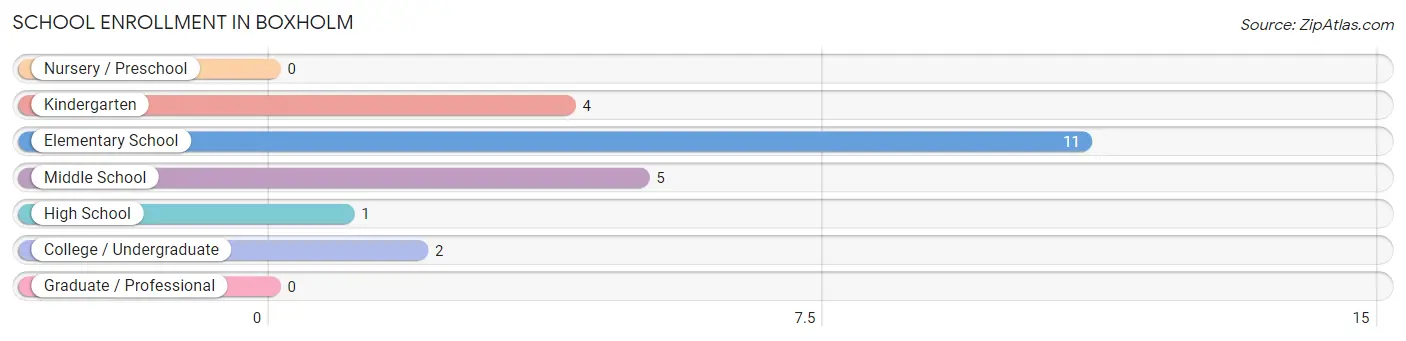
School Enrollment in Boxholm
The most common levels of schooling among the 23 students in Boxholm are elementary school (11 | 47.8%), middle school (5 | 21.7%), and kindergarten (4 | 17.4%).
| School Level | # Students | % Students |
| Nursery / Preschool | 0 | 0.0% |
| Kindergarten | 4 | 17.4% |
| Elementary School | 11 | 47.8% |
| Middle School | 5 | 21.7% |
| High School | 1 | 4.3% |
| College / Undergraduate | 2 | 8.7% |
| Graduate / Professional | 0 | 0.0% |
| Total | 23 | 100.0% |
School Enrollment by Age by Funding Source in Boxholm
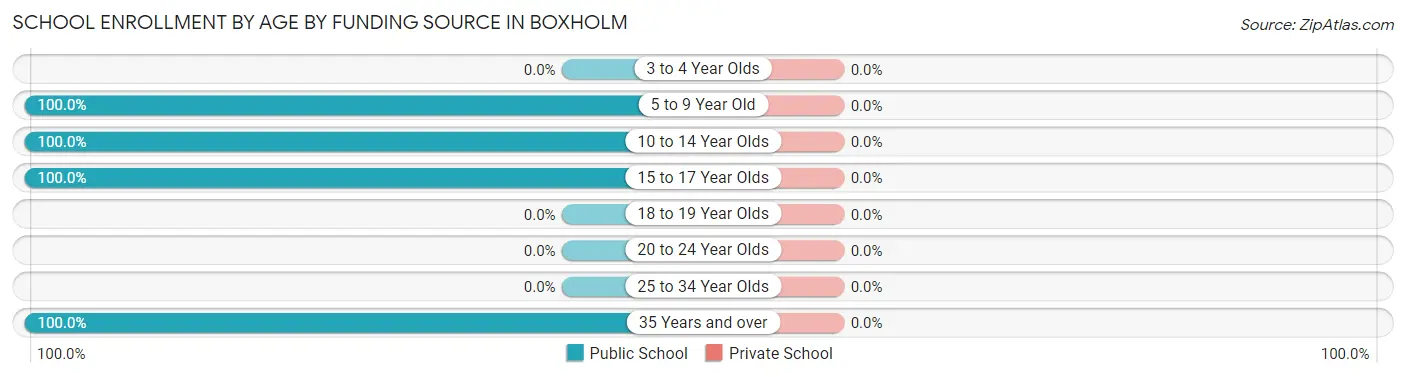
| Age Bracket | Public School | Private School |
| 3 to 4 Year Olds | 0 (0.0%) | 0 (0.0%) |
| 5 to 9 Year Old | 15 (100.0%) | 0 (0.0%) |
| 10 to 14 Year Olds | 5 (100.0%) | 0 (0.0%) |
| 15 to 17 Year Olds | 1 (100.0%) | 0 (0.0%) |
| 18 to 19 Year Olds | 0 (0.0%) | 0 (0.0%) |
| 20 to 24 Year Olds | 0 (0.0%) | 0 (0.0%) |
| 25 to 34 Year Olds | 0 (0.0%) | 0 (0.0%) |
| 35 Years and over | 2 (100.0%) | 0 (0.0%) |
| Total | 23 (100.0%) | 0 (0.0%) |
Educational Attainment by Field of Study in Boxholm
Education (3 | 42.9%), bio, nature & agricultural (2 | 28.6%), and business (2 | 28.6%) are the most common fields of study among 7 individuals in Boxholm who have obtained a bachelor's degree or higher.
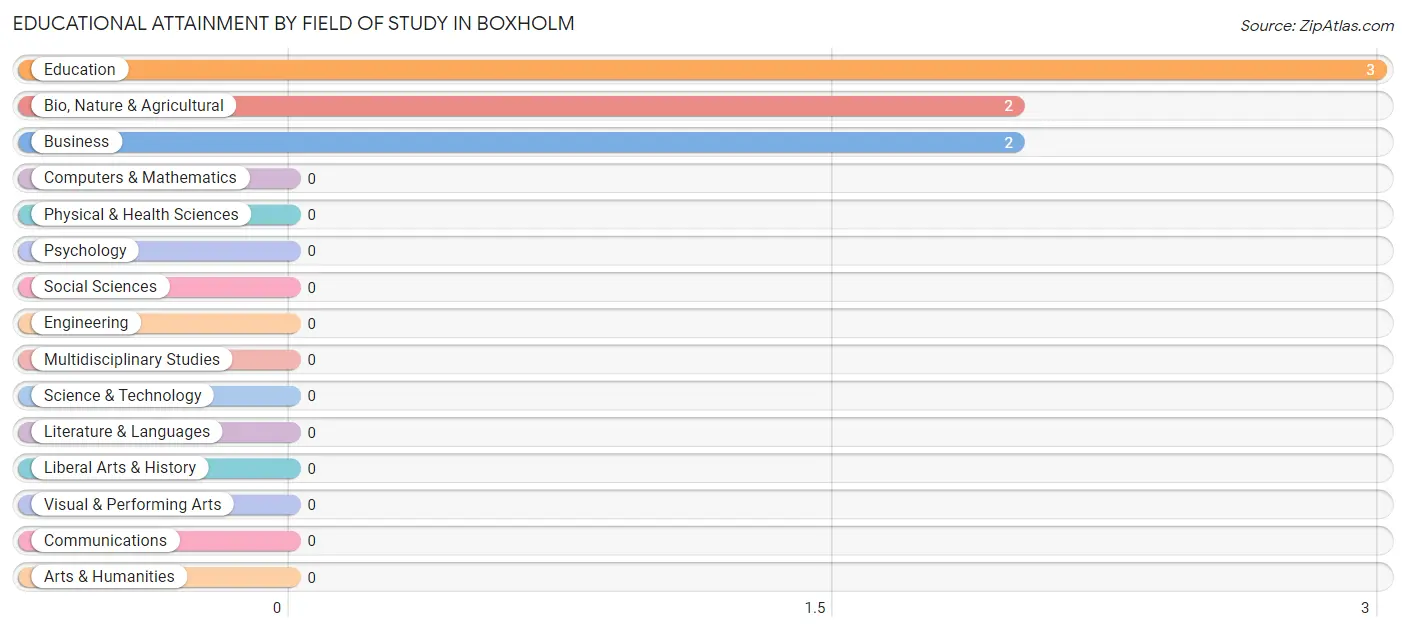
| Field of Study | # Graduates | % Graduates |
| Computers & Mathematics | 0 | 0.0% |
| Bio, Nature & Agricultural | 2 | 28.6% |
| Physical & Health Sciences | 0 | 0.0% |
| Psychology | 0 | 0.0% |
| Social Sciences | 0 | 0.0% |
| Engineering | 0 | 0.0% |
| Multidisciplinary Studies | 0 | 0.0% |
| Science & Technology | 0 | 0.0% |
| Business | 2 | 28.6% |
| Education | 3 | 42.9% |
| Literature & Languages | 0 | 0.0% |
| Liberal Arts & History | 0 | 0.0% |
| Visual & Performing Arts | 0 | 0.0% |
| Communications | 0 | 0.0% |
| Arts & Humanities | 0 | 0.0% |
| Total | 7 | 100.0% |
Transportation & Commute in Boxholm
Vehicle Availability by Sex in Boxholm
The most prevalent vehicle ownership categories in Boxholm are males with 2 vehicles (8, accounting for 33.3%) and females with 2 vehicles (3, making up 36.4%).
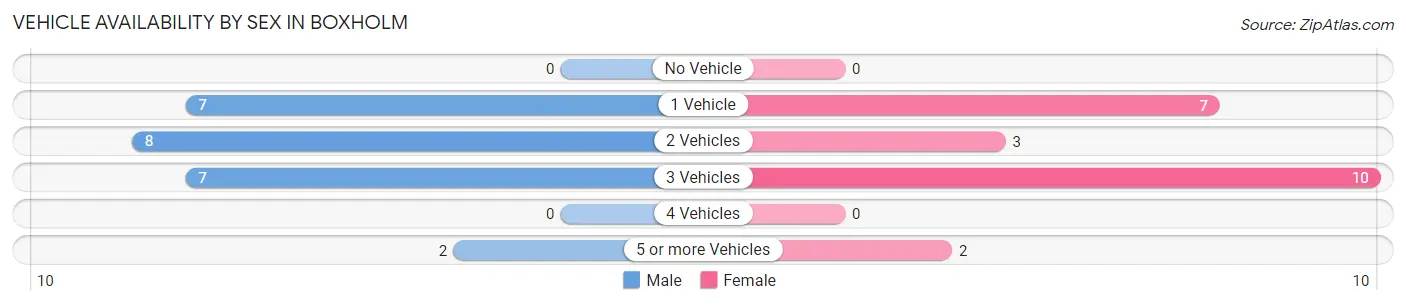
| Vehicles Available | Male | Female |
| No Vehicle | 0 (0.0%) | 0 (0.0%) |
| 1 Vehicle | 7 (29.2%) | 7 (31.8%) |
| 2 Vehicles | 8 (33.3%) | 3 (13.6%) |
| 3 Vehicles | 7 (29.2%) | 10 (45.5%) |
| 4 Vehicles | 0 (0.0%) | 0 (0.0%) |
| 5 or more Vehicles | 2 (8.3%) | 2 (9.1%) |
| Total | 24 (100.0%) | 22 (100.0%) |
Commute Time in Boxholm
The most frequently occuring commute durations in Boxholm are 45 to 59 minutes (20 commuters, 43.5%), 25 to 29 minutes (7 commuters, 15.2%), and 35 to 39 minutes (5 commuters, 10.9%).
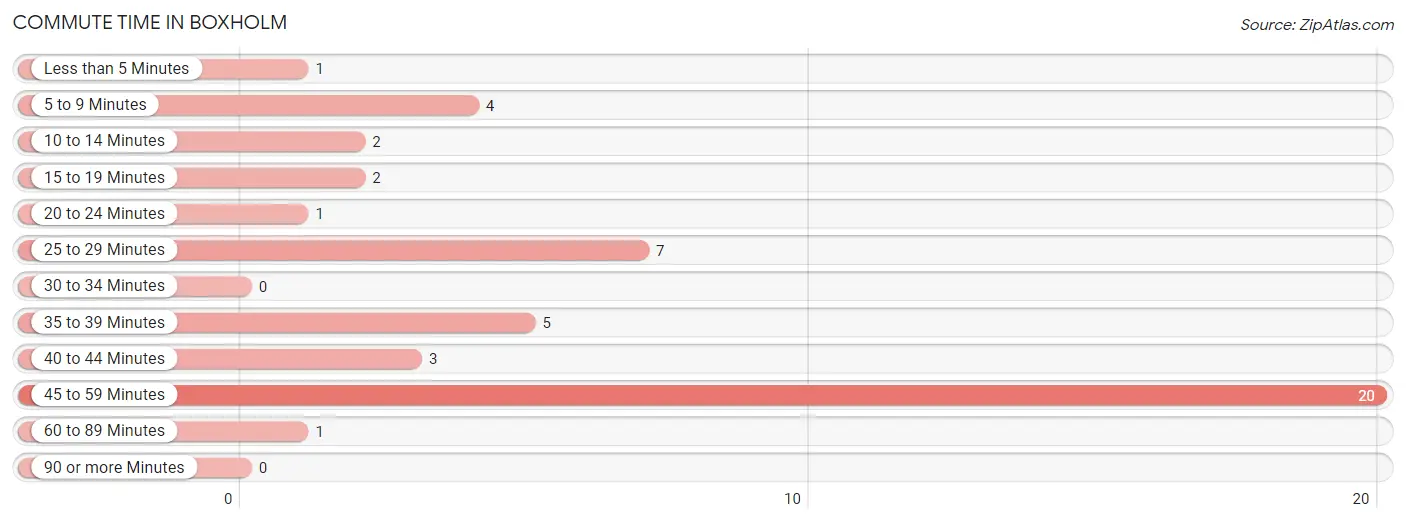
| Commute Time | # Commuters | % Commuters |
| Less than 5 Minutes | 1 | 2.2% |
| 5 to 9 Minutes | 4 | 8.7% |
| 10 to 14 Minutes | 2 | 4.3% |
| 15 to 19 Minutes | 2 | 4.3% |
| 20 to 24 Minutes | 1 | 2.2% |
| 25 to 29 Minutes | 7 | 15.2% |
| 30 to 34 Minutes | 0 | 0.0% |
| 35 to 39 Minutes | 5 | 10.9% |
| 40 to 44 Minutes | 3 | 6.5% |
| 45 to 59 Minutes | 20 | 43.5% |
| 60 to 89 Minutes | 1 | 2.2% |
| 90 or more Minutes | 0 | 0.0% |
Commute Time by Sex in Boxholm
The most common commute times in Boxholm are 45 to 59 minutes (13 commuters, 54.2%) for males and 45 to 59 minutes (7 commuters, 31.8%) for females.
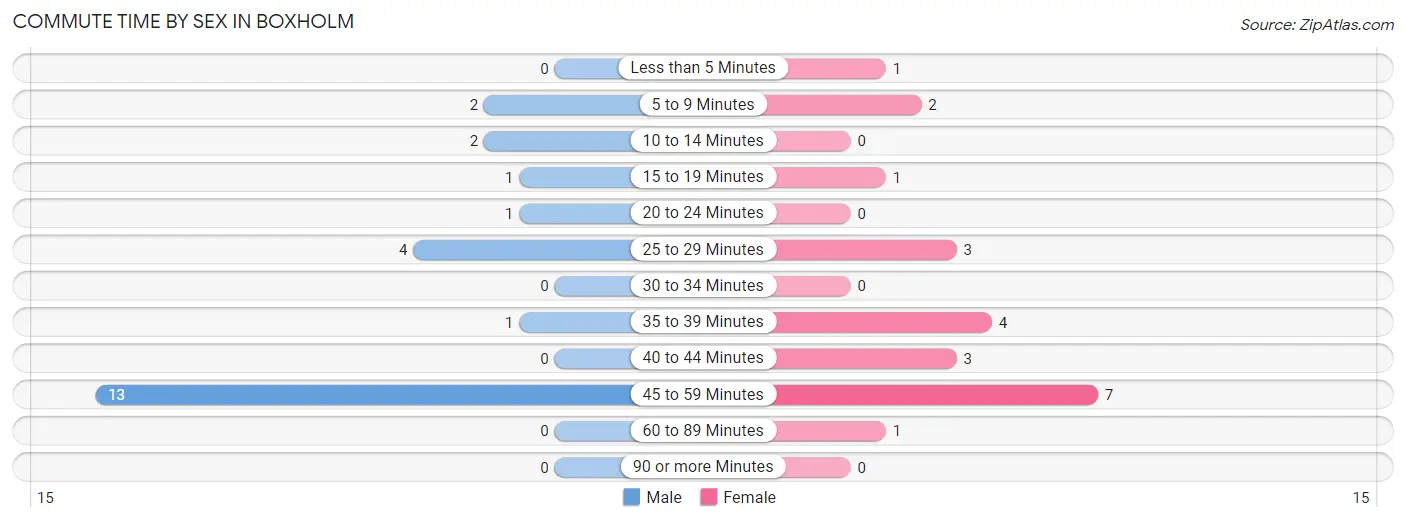
| Commute Time | Male | Female |
| Less than 5 Minutes | 0 (0.0%) | 1 (4.5%) |
| 5 to 9 Minutes | 2 (8.3%) | 2 (9.1%) |
| 10 to 14 Minutes | 2 (8.3%) | 0 (0.0%) |
| 15 to 19 Minutes | 1 (4.2%) | 1 (4.5%) |
| 20 to 24 Minutes | 1 (4.2%) | 0 (0.0%) |
| 25 to 29 Minutes | 4 (16.7%) | 3 (13.6%) |
| 30 to 34 Minutes | 0 (0.0%) | 0 (0.0%) |
| 35 to 39 Minutes | 1 (4.2%) | 4 (18.2%) |
| 40 to 44 Minutes | 0 (0.0%) | 3 (13.6%) |
| 45 to 59 Minutes | 13 (54.2%) | 7 (31.8%) |
| 60 to 89 Minutes | 0 (0.0%) | 1 (4.5%) |
| 90 or more Minutes | 0 (0.0%) | 0 (0.0%) |
Time of Departure to Work by Sex in Boxholm
The most frequent times of departure to work in Boxholm are 7:00 AM to 7:29 AM (8, 33.3%) for males and 6:30 AM to 6:59 AM (5, 22.7%) for females.
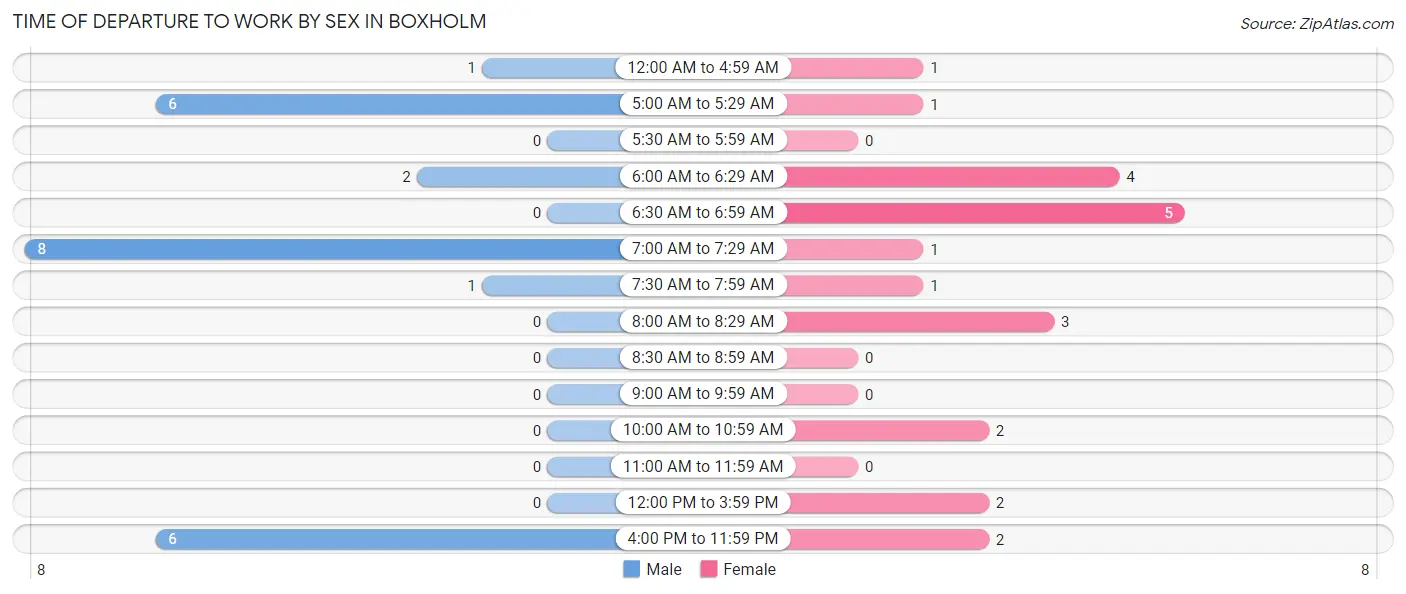
| Time of Departure | Male | Female |
| 12:00 AM to 4:59 AM | 1 (4.2%) | 1 (4.5%) |
| 5:00 AM to 5:29 AM | 6 (25.0%) | 1 (4.5%) |
| 5:30 AM to 5:59 AM | 0 (0.0%) | 0 (0.0%) |
| 6:00 AM to 6:29 AM | 2 (8.3%) | 4 (18.2%) |
| 6:30 AM to 6:59 AM | 0 (0.0%) | 5 (22.7%) |
| 7:00 AM to 7:29 AM | 8 (33.3%) | 1 (4.5%) |
| 7:30 AM to 7:59 AM | 1 (4.2%) | 1 (4.5%) |
| 8:00 AM to 8:29 AM | 0 (0.0%) | 3 (13.6%) |
| 8:30 AM to 8:59 AM | 0 (0.0%) | 0 (0.0%) |
| 9:00 AM to 9:59 AM | 0 (0.0%) | 0 (0.0%) |
| 10:00 AM to 10:59 AM | 0 (0.0%) | 2 (9.1%) |
| 11:00 AM to 11:59 AM | 0 (0.0%) | 0 (0.0%) |
| 12:00 PM to 3:59 PM | 0 (0.0%) | 2 (9.1%) |
| 4:00 PM to 11:59 PM | 6 (25.0%) | 2 (9.1%) |
| Total | 24 (100.0%) | 22 (100.0%) |
Housing Occupancy in Boxholm
Occupancy by Ownership in Boxholm
Of the total 65 dwellings in Boxholm, owner-occupied units account for 54 (83.1%), while renter-occupied units make up 11 (16.9%).
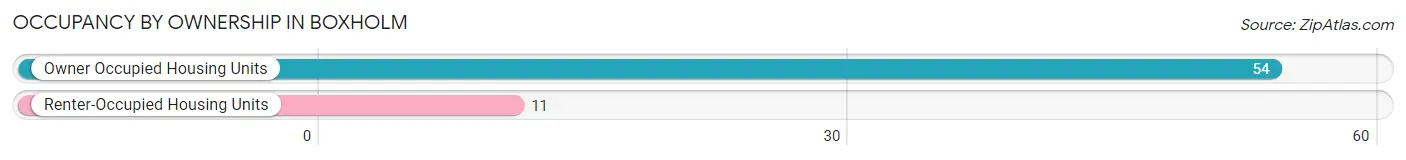
| Occupancy | # Housing Units | % Housing Units |
| Owner Occupied Housing Units | 54 | 83.1% |
| Renter-Occupied Housing Units | 11 | 16.9% |
| Total Occupied Housing Units | 65 | 100.0% |
Occupancy by Household Size in Boxholm
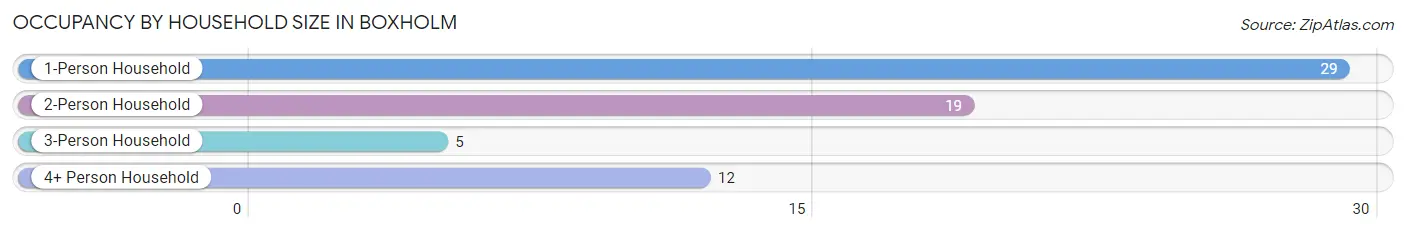
| Household Size | # Housing Units | % Housing Units |
| 1-Person Household | 29 | 44.6% |
| 2-Person Household | 19 | 29.2% |
| 3-Person Household | 5 | 7.7% |
| 4+ Person Household | 12 | 18.5% |
| Total Housing Units | 65 | 100.0% |
Occupancy by Ownership by Household Size in Boxholm
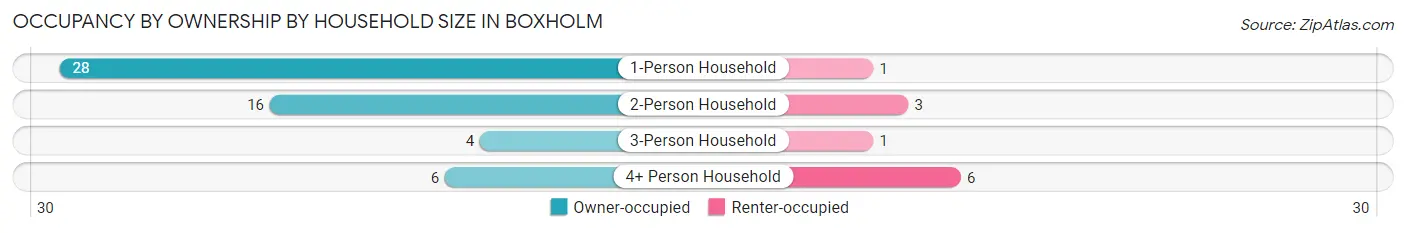
| Household Size | Owner-occupied | Renter-occupied |
| 1-Person Household | 28 (96.6%) | 1 (3.5%) |
| 2-Person Household | 16 (84.2%) | 3 (15.8%) |
| 3-Person Household | 4 (80.0%) | 1 (20.0%) |
| 4+ Person Household | 6 (50.0%) | 6 (50.0%) |
| Total Housing Units | 54 (83.1%) | 11 (16.9%) |
Occupancy by Educational Attainment in Boxholm
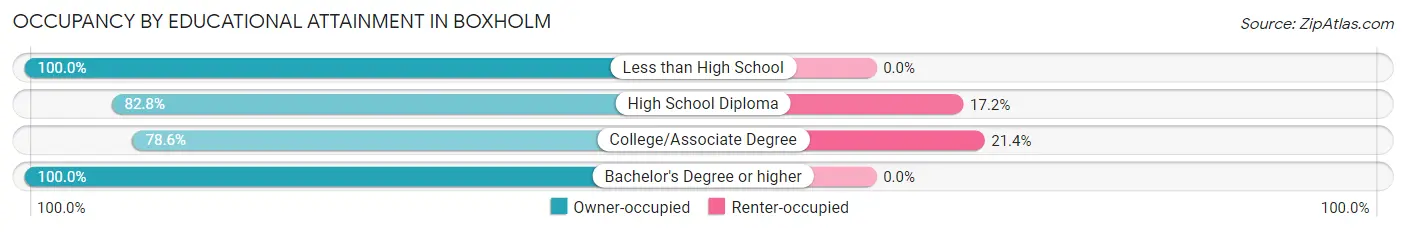
| Household Size | Owner-occupied | Renter-occupied |
| Less than High School | 3 (100.0%) | 0 (0.0%) |
| High School Diploma | 24 (82.8%) | 5 (17.2%) |
| College/Associate Degree | 22 (78.6%) | 6 (21.4%) |
| Bachelor's Degree or higher | 5 (100.0%) | 0 (0.0%) |
Occupancy by Age of Householder in Boxholm
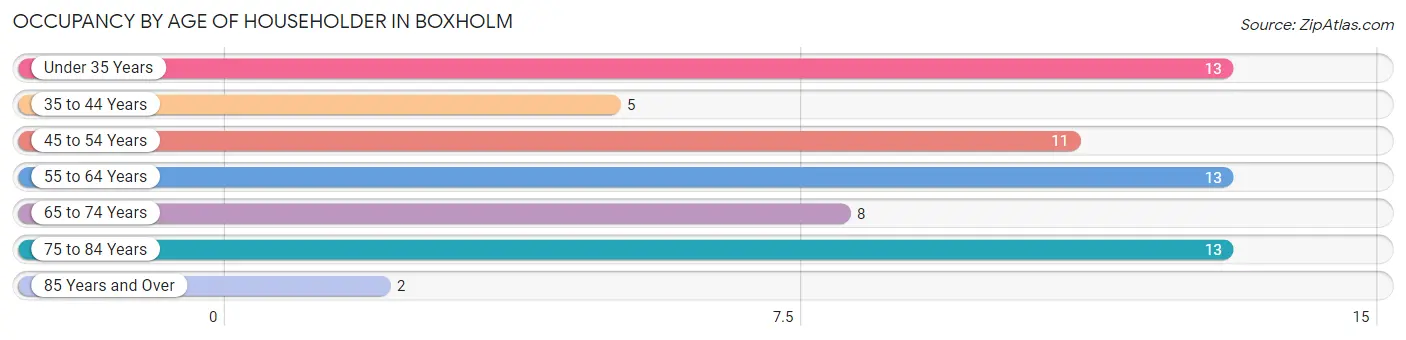
| Age Bracket | # Households | % Households |
| Under 35 Years | 13 | 20.0% |
| 35 to 44 Years | 5 | 7.7% |
| 45 to 54 Years | 11 | 16.9% |
| 55 to 64 Years | 13 | 20.0% |
| 65 to 74 Years | 8 | 12.3% |
| 75 to 84 Years | 13 | 20.0% |
| 85 Years and Over | 2 | 3.1% |
| Total | 65 | 100.0% |
Housing Finances in Boxholm
Median Income by Occupancy in Boxholm
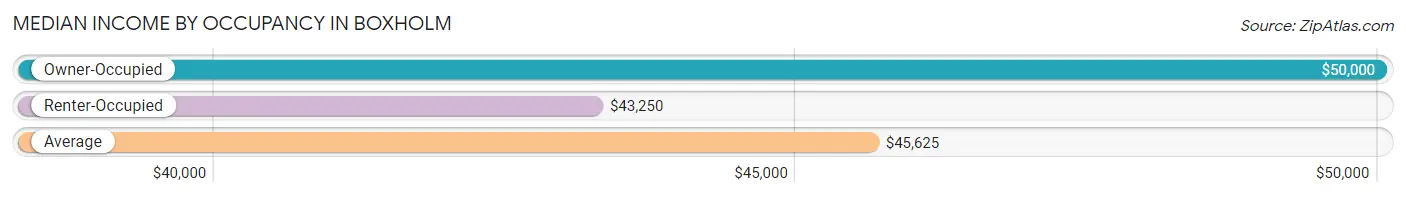
| Occupancy Type | # Households | Median Income |
| Owner-Occupied | 54 (83.1%) | $50,000 |
| Renter-Occupied | 11 (16.9%) | $43,250 |
| Average | 65 (100.0%) | $45,625 |
Occupancy by Householder Income Bracket in Boxholm
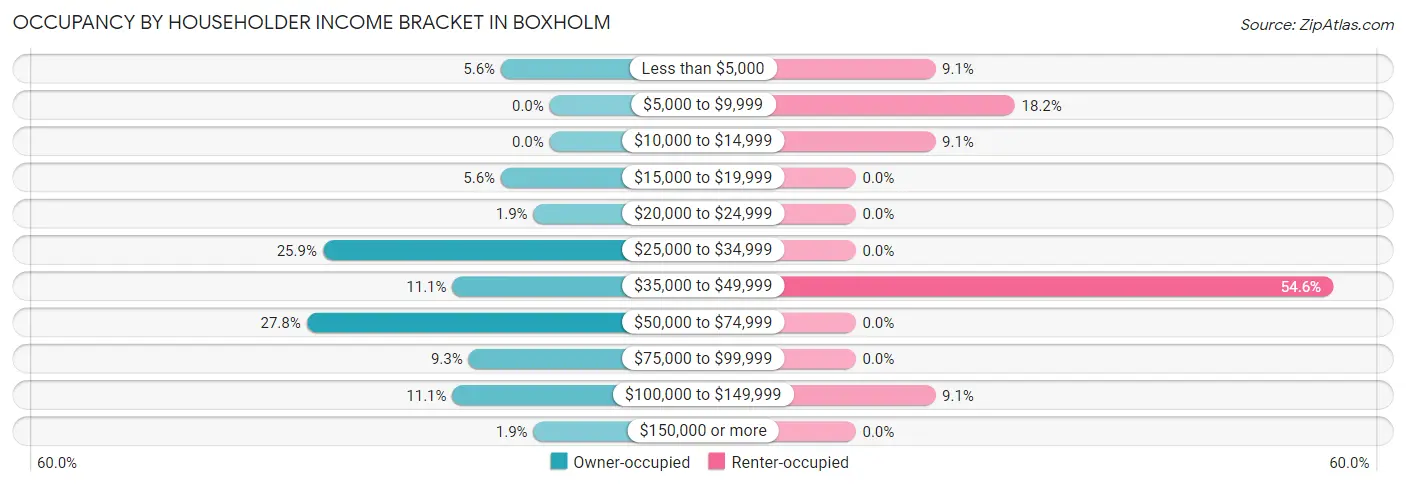
| Income Bracket | Owner-occupied | Renter-occupied |
| Less than $5,000 | 3 (5.6%) | 1 (9.1%) |
| $5,000 to $9,999 | 0 (0.0%) | 2 (18.2%) |
| $10,000 to $14,999 | 0 (0.0%) | 1 (9.1%) |
| $15,000 to $19,999 | 3 (5.6%) | 0 (0.0%) |
| $20,000 to $24,999 | 1 (1.8%) | 0 (0.0%) |
| $25,000 to $34,999 | 14 (25.9%) | 0 (0.0%) |
| $35,000 to $49,999 | 6 (11.1%) | 6 (54.5%) |
| $50,000 to $74,999 | 15 (27.8%) | 0 (0.0%) |
| $75,000 to $99,999 | 5 (9.3%) | 0 (0.0%) |
| $100,000 to $149,999 | 6 (11.1%) | 1 (9.1%) |
| $150,000 or more | 1 (1.8%) | 0 (0.0%) |
| Total | 54 (100.0%) | 11 (100.0%) |
Monthly Housing Cost Tiers in Boxholm
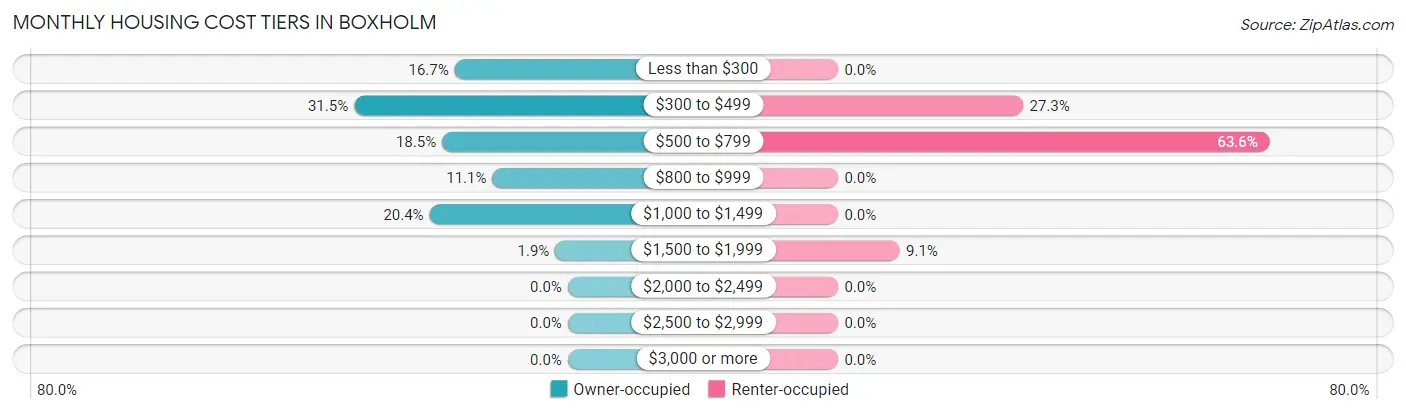
| Monthly Cost | Owner-occupied | Renter-occupied |
| Less than $300 | 9 (16.7%) | 0 (0.0%) |
| $300 to $499 | 17 (31.5%) | 3 (27.3%) |
| $500 to $799 | 10 (18.5%) | 7 (63.6%) |
| $800 to $999 | 6 (11.1%) | 0 (0.0%) |
| $1,000 to $1,499 | 11 (20.4%) | 0 (0.0%) |
| $1,500 to $1,999 | 1 (1.8%) | 1 (9.1%) |
| $2,000 to $2,499 | 0 (0.0%) | 0 (0.0%) |
| $2,500 to $2,999 | 0 (0.0%) | 0 (0.0%) |
| $3,000 or more | 0 (0.0%) | 0 (0.0%) |
| Total | 54 (100.0%) | 11 (100.0%) |
Physical Housing Characteristics in Boxholm
Housing Structures in Boxholm
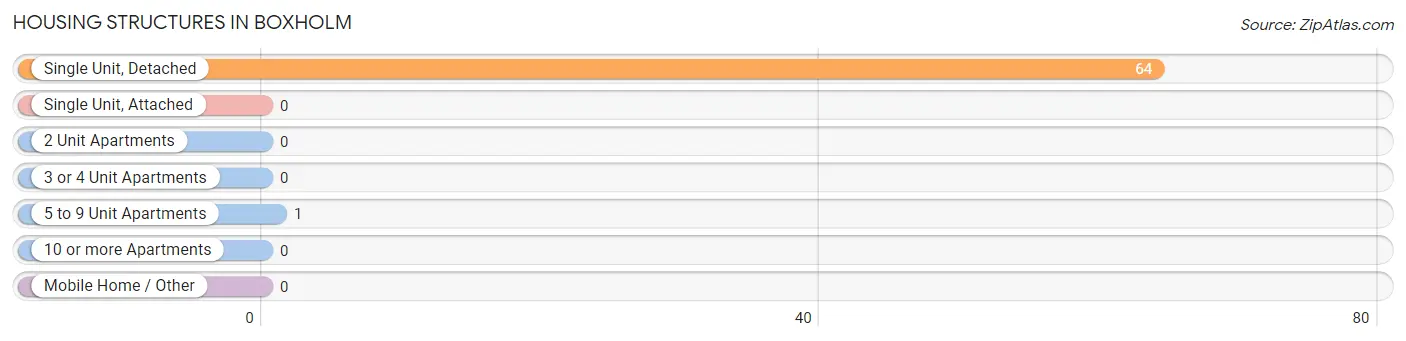
| Structure Type | # Housing Units | % Housing Units |
| Single Unit, Detached | 64 | 98.5% |
| Single Unit, Attached | 0 | 0.0% |
| 2 Unit Apartments | 0 | 0.0% |
| 3 or 4 Unit Apartments | 0 | 0.0% |
| 5 to 9 Unit Apartments | 1 | 1.5% |
| 10 or more Apartments | 0 | 0.0% |
| Mobile Home / Other | 0 | 0.0% |
| Total | 65 | 100.0% |
Housing Structures by Occupancy in Boxholm
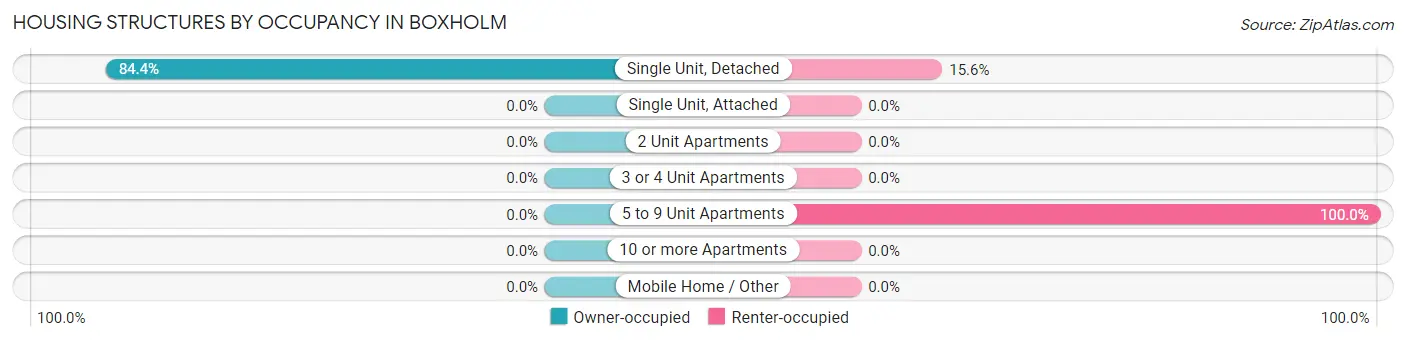
| Structure Type | Owner-occupied | Renter-occupied |
| Single Unit, Detached | 54 (84.4%) | 10 (15.6%) |
| Single Unit, Attached | 0 (0.0%) | 0 (0.0%) |
| 2 Unit Apartments | 0 (0.0%) | 0 (0.0%) |
| 3 or 4 Unit Apartments | 0 (0.0%) | 0 (0.0%) |
| 5 to 9 Unit Apartments | 0 (0.0%) | 1 (100.0%) |
| 10 or more Apartments | 0 (0.0%) | 0 (0.0%) |
| Mobile Home / Other | 0 (0.0%) | 0 (0.0%) |
| Total | 54 (83.1%) | 11 (16.9%) |
Housing Structures by Number of Rooms in Boxholm
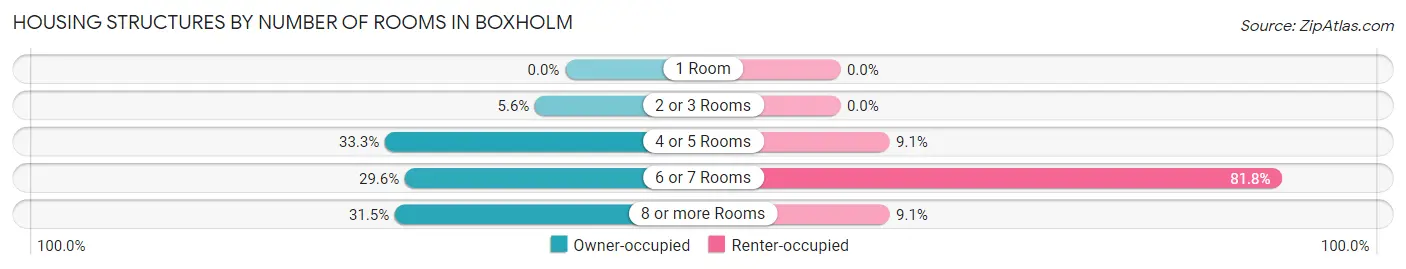
| Number of Rooms | Owner-occupied | Renter-occupied |
| 1 Room | 0 (0.0%) | 0 (0.0%) |
| 2 or 3 Rooms | 3 (5.6%) | 0 (0.0%) |
| 4 or 5 Rooms | 18 (33.3%) | 1 (9.1%) |
| 6 or 7 Rooms | 16 (29.6%) | 9 (81.8%) |
| 8 or more Rooms | 17 (31.5%) | 1 (9.1%) |
| Total | 54 (100.0%) | 11 (100.0%) |
Housing Structure by Heating Type in Boxholm
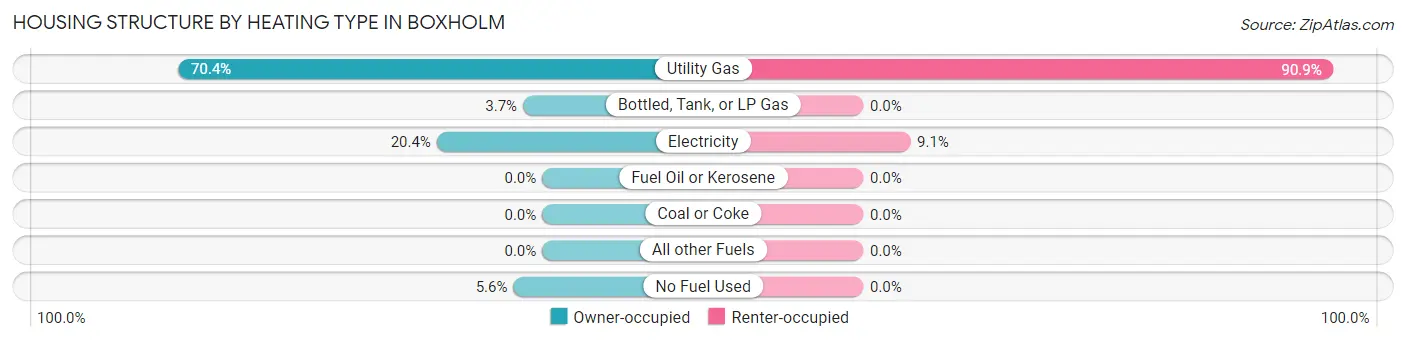
| Heating Type | Owner-occupied | Renter-occupied |
| Utility Gas | 38 (70.4%) | 10 (90.9%) |
| Bottled, Tank, or LP Gas | 2 (3.7%) | 0 (0.0%) |
| Electricity | 11 (20.4%) | 1 (9.1%) |
| Fuel Oil or Kerosene | 0 (0.0%) | 0 (0.0%) |
| Coal or Coke | 0 (0.0%) | 0 (0.0%) |
| All other Fuels | 0 (0.0%) | 0 (0.0%) |
| No Fuel Used | 3 (5.6%) | 0 (0.0%) |
| Total | 54 (100.0%) | 11 (100.0%) |
Household Vehicle Usage in Boxholm
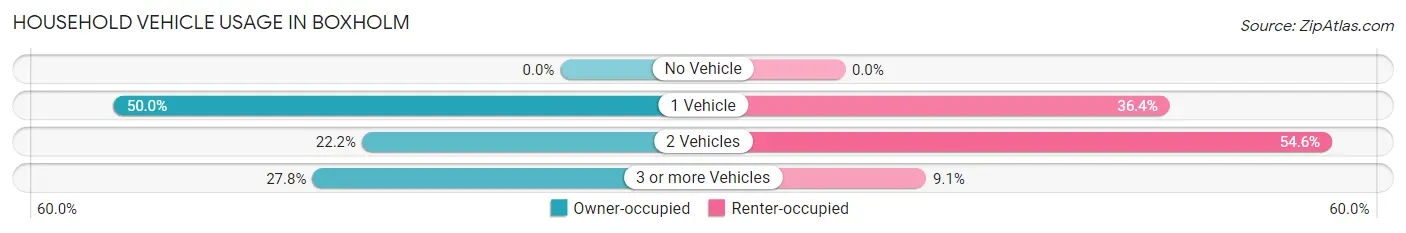
| Vehicles per Household | Owner-occupied | Renter-occupied |
| No Vehicle | 0 (0.0%) | 0 (0.0%) |
| 1 Vehicle | 27 (50.0%) | 4 (36.4%) |
| 2 Vehicles | 12 (22.2%) | 6 (54.5%) |
| 3 or more Vehicles | 15 (27.8%) | 1 (9.1%) |
| Total | 54 (100.0%) | 11 (100.0%) |
Real Estate & Mortgages in Boxholm
Real Estate and Mortgage Overview in Boxholm
| Characteristic | Without Mortgage | With Mortgage |
| Housing Units | 33 | 21 |
| Median Property Value | $87,500 | $69,200 |
| Median Household Income | $45,625 | $1 |
| Monthly Housing Costs | $394 | $0 |
| Real Estate Taxes | $1,192 | $0 |
Property Value by Mortgage Status in Boxholm
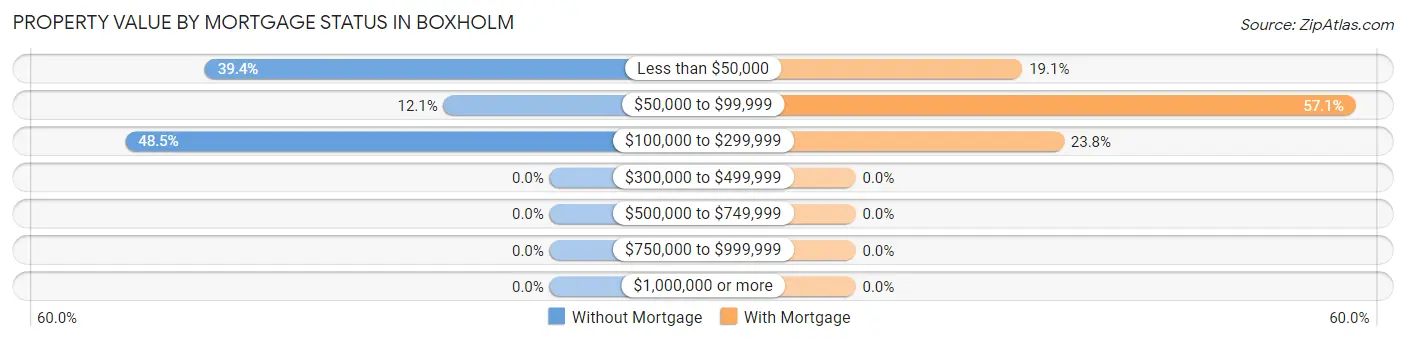
| Property Value | Without Mortgage | With Mortgage |
| Less than $50,000 | 13 (39.4%) | 4 (19.1%) |
| $50,000 to $99,999 | 4 (12.1%) | 12 (57.1%) |
| $100,000 to $299,999 | 16 (48.5%) | 5 (23.8%) |
| $300,000 to $499,999 | 0 (0.0%) | 0 (0.0%) |
| $500,000 to $749,999 | 0 (0.0%) | 0 (0.0%) |
| $750,000 to $999,999 | 0 (0.0%) | 0 (0.0%) |
| $1,000,000 or more | 0 (0.0%) | 0 (0.0%) |
| Total | 33 (100.0%) | 21 (100.0%) |
Household Income by Mortgage Status in Boxholm
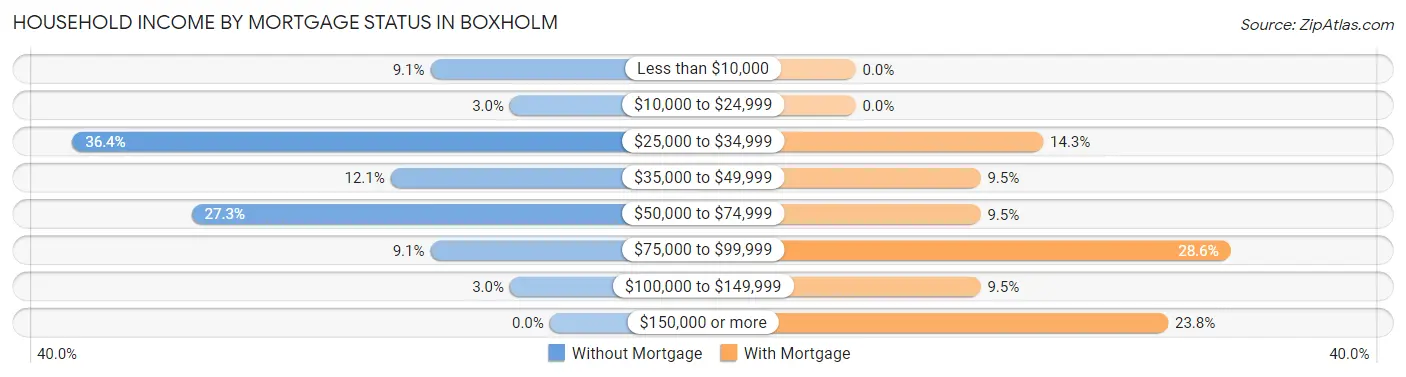
| Household Income | Without Mortgage | With Mortgage |
| Less than $10,000 | 3 (9.1%) | 0 (0.0%) |
| $10,000 to $24,999 | 1 (3.0%) | 0 (0.0%) |
| $25,000 to $34,999 | 12 (36.4%) | 3 (14.3%) |
| $35,000 to $49,999 | 4 (12.1%) | 2 (9.5%) |
| $50,000 to $74,999 | 9 (27.3%) | 2 (9.5%) |
| $75,000 to $99,999 | 3 (9.1%) | 6 (28.6%) |
| $100,000 to $149,999 | 1 (3.0%) | 2 (9.5%) |
| $150,000 or more | 0 (0.0%) | 5 (23.8%) |
| Total | 33 (100.0%) | 21 (100.0%) |
Property Value to Household Income Ratio in Boxholm
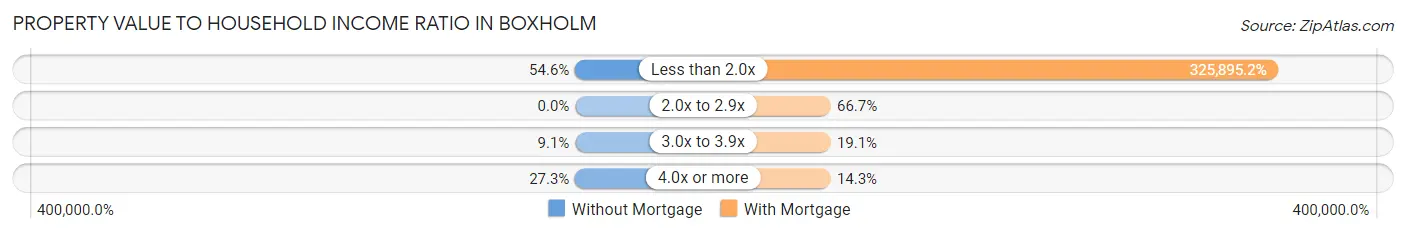
| Value-to-Income Ratio | Without Mortgage | With Mortgage |
| Less than 2.0x | 18 (54.5%) | 68,438 (325,895.2%) |
| 2.0x to 2.9x | 0 (0.0%) | 14 (66.7%) |
| 3.0x to 3.9x | 3 (9.1%) | 4 (19.1%) |
| 4.0x or more | 9 (27.3%) | 3 (14.3%) |
| Total | 33 (100.0%) | 21 (100.0%) |
Real Estate Taxes by Mortgage Status in Boxholm
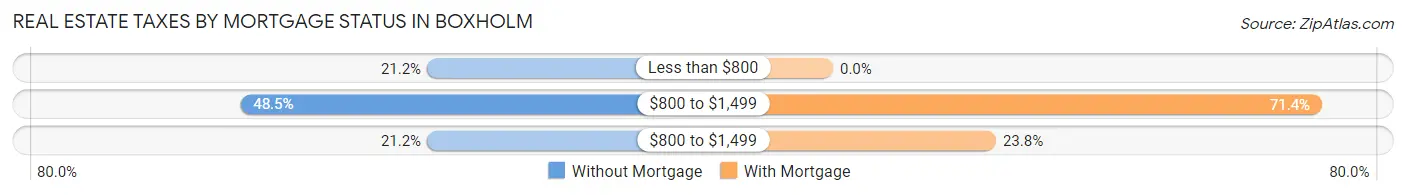
| Property Taxes | Without Mortgage | With Mortgage |
| Less than $800 | 7 (21.2%) | 0 (0.0%) |
| $800 to $1,499 | 16 (48.5%) | 15 (71.4%) |
| $800 to $1,499 | 7 (21.2%) | 5 (23.8%) |
| Total | 33 (100.0%) | 21 (100.0%) |
Health & Disability in Boxholm
Health Insurance Coverage by Age in Boxholm
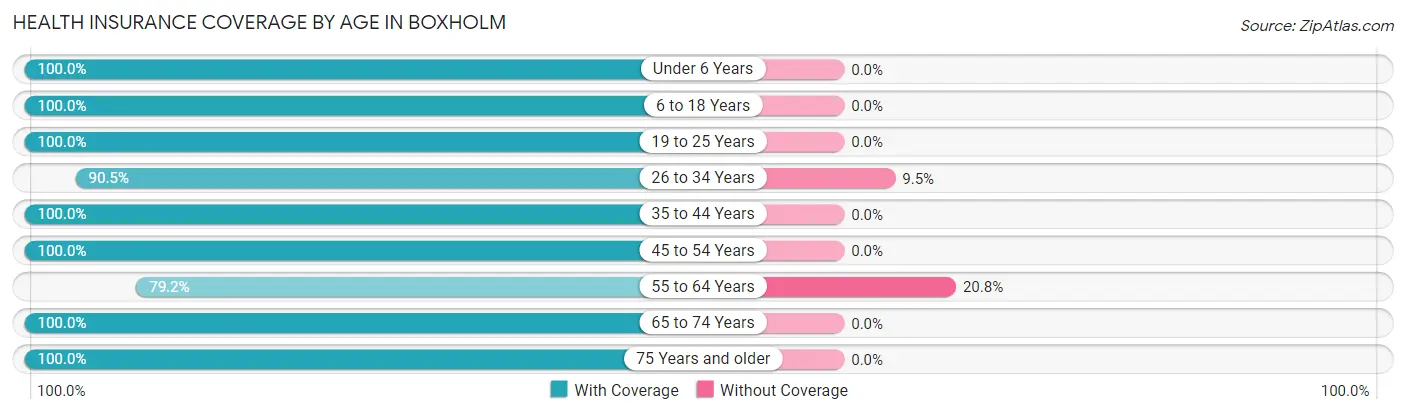
| Age Bracket | With Coverage | Without Coverage |
| Under 6 Years | 13 (100.0%) | 0 (0.0%) |
| 6 to 18 Years | 17 (100.0%) | 0 (0.0%) |
| 19 to 25 Years | 11 (100.0%) | 0 (0.0%) |
| 26 to 34 Years | 19 (90.5%) | 2 (9.5%) |
| 35 to 44 Years | 5 (100.0%) | 0 (0.0%) |
| 45 to 54 Years | 13 (100.0%) | 0 (0.0%) |
| 55 to 64 Years | 19 (79.2%) | 5 (20.8%) |
| 65 to 74 Years | 13 (100.0%) | 0 (0.0%) |
| 75 Years and older | 19 (100.0%) | 0 (0.0%) |
| Total | 129 (94.9%) | 7 (5.1%) |
Health Insurance Coverage by Citizenship Status in Boxholm
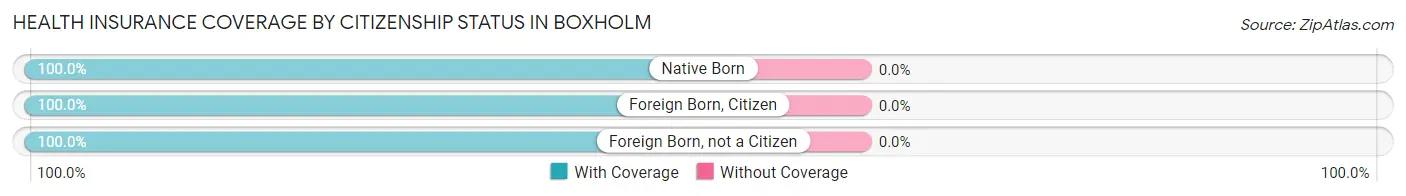
| Citizenship Status | With Coverage | Without Coverage |
| Native Born | 13 (100.0%) | 0 (0.0%) |
| Foreign Born, Citizen | 17 (100.0%) | 0 (0.0%) |
| Foreign Born, not a Citizen | 11 (100.0%) | 0 (0.0%) |
Health Insurance Coverage by Household Income in Boxholm
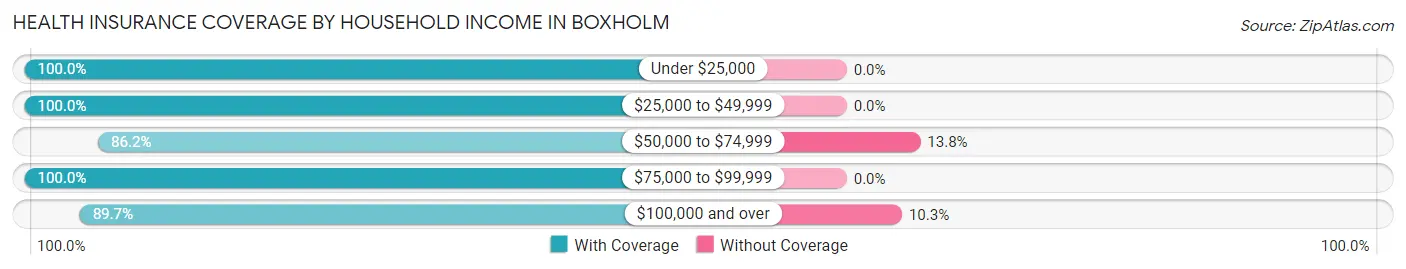
| Household Income | With Coverage | Without Coverage |
| Under $25,000 | 19 (100.0%) | 0 (0.0%) |
| $25,000 to $49,999 | 53 (100.0%) | 0 (0.0%) |
| $50,000 to $74,999 | 25 (86.2%) | 4 (13.8%) |
| $75,000 to $99,999 | 6 (100.0%) | 0 (0.0%) |
| $100,000 and over | 26 (89.7%) | 3 (10.3%) |
Public vs Private Health Insurance Coverage by Age in Boxholm
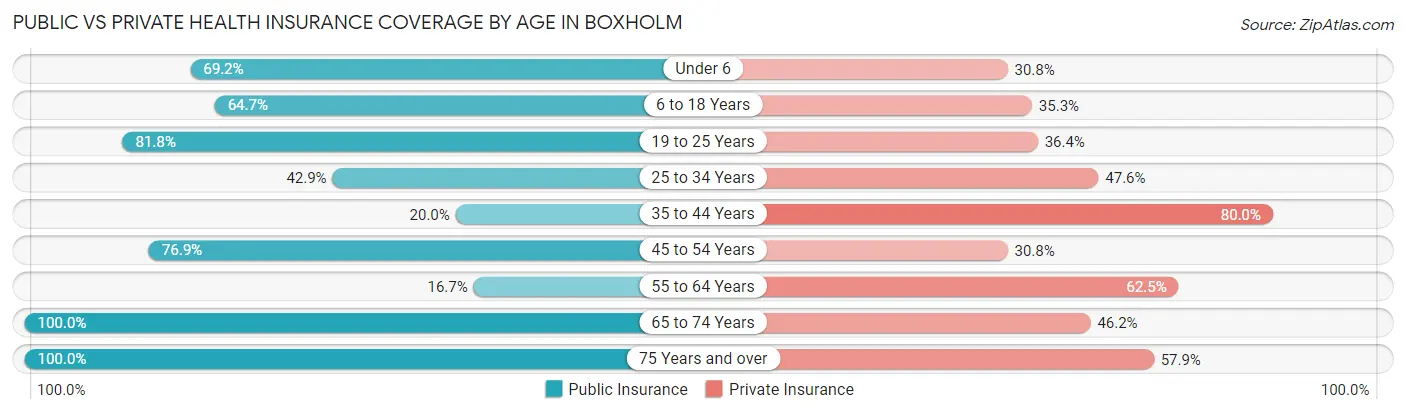
| Age Bracket | Public Insurance | Private Insurance |
| Under 6 | 9 (69.2%) | 4 (30.8%) |
| 6 to 18 Years | 11 (64.7%) | 6 (35.3%) |
| 19 to 25 Years | 9 (81.8%) | 4 (36.4%) |
| 25 to 34 Years | 9 (42.9%) | 10 (47.6%) |
| 35 to 44 Years | 1 (20.0%) | 4 (80.0%) |
| 45 to 54 Years | 10 (76.9%) | 4 (30.8%) |
| 55 to 64 Years | 4 (16.7%) | 15 (62.5%) |
| 65 to 74 Years | 13 (100.0%) | 6 (46.2%) |
| 75 Years and over | 19 (100.0%) | 11 (57.9%) |
| Total | 85 (62.5%) | 64 (47.1%) |
Disability Status by Sex by Age in Boxholm
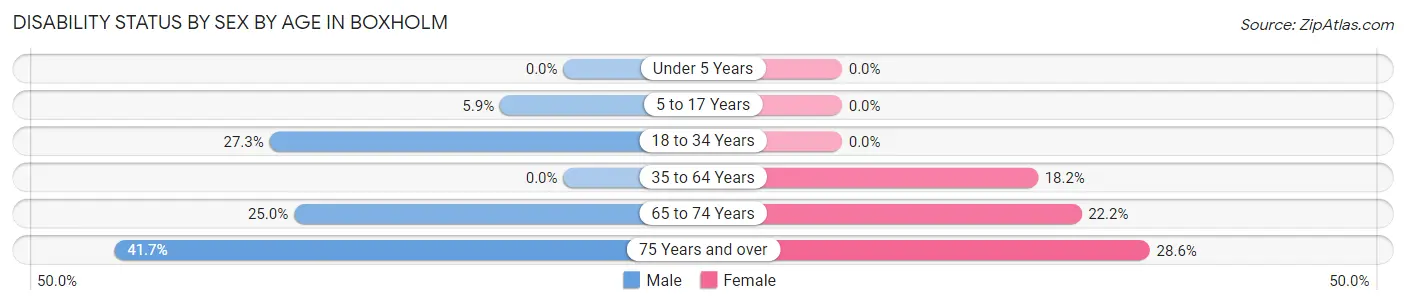
| Age Bracket | Male | Female |
| Under 5 Years | 0 (0.0%) | 0 (0.0%) |
| 5 to 17 Years | 1 (5.9%) | 0 (0.0%) |
| 18 to 34 Years | 3 (27.3%) | 0 (0.0%) |
| 35 to 64 Years | 0 (0.0%) | 4 (18.2%) |
| 65 to 74 Years | 1 (25.0%) | 2 (22.2%) |
| 75 Years and over | 5 (41.7%) | 2 (28.6%) |
Disability Class by Sex by Age in Boxholm
Disability Class: Hearing Difficulty
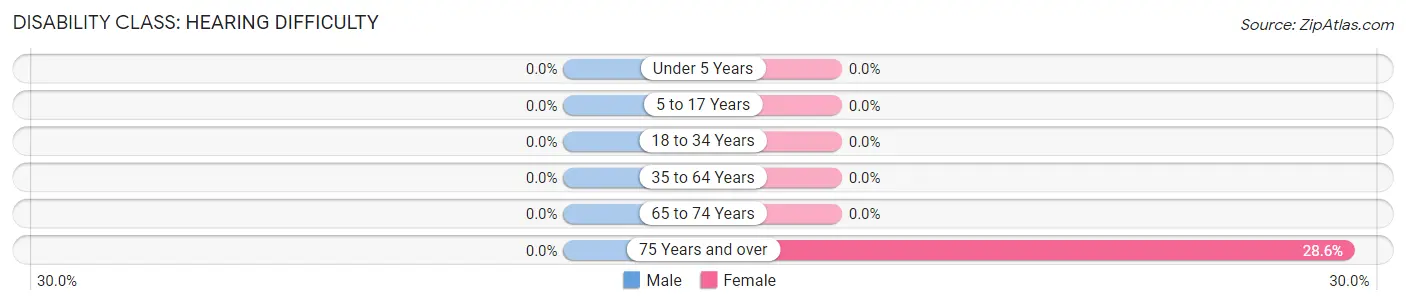
| Age Bracket | Male | Female |
| Under 5 Years | 0 (0.0%) | 0 (0.0%) |
| 5 to 17 Years | 0 (0.0%) | 0 (0.0%) |
| 18 to 34 Years | 0 (0.0%) | 0 (0.0%) |
| 35 to 64 Years | 0 (0.0%) | 0 (0.0%) |
| 65 to 74 Years | 0 (0.0%) | 0 (0.0%) |
| 75 Years and over | 0 (0.0%) | 2 (28.6%) |
Disability Class: Vision Difficulty
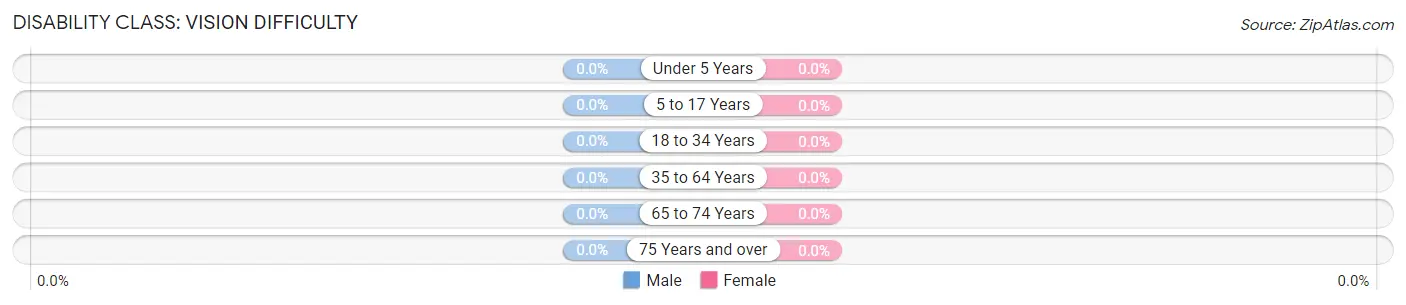
| Age Bracket | Male | Female |
| Under 5 Years | 0 (0.0%) | 0 (0.0%) |
| 5 to 17 Years | 0 (0.0%) | 0 (0.0%) |
| 18 to 34 Years | 0 (0.0%) | 0 (0.0%) |
| 35 to 64 Years | 0 (0.0%) | 0 (0.0%) |
| 65 to 74 Years | 0 (0.0%) | 0 (0.0%) |
| 75 Years and over | 0 (0.0%) | 0 (0.0%) |
Disability Class: Cognitive Difficulty
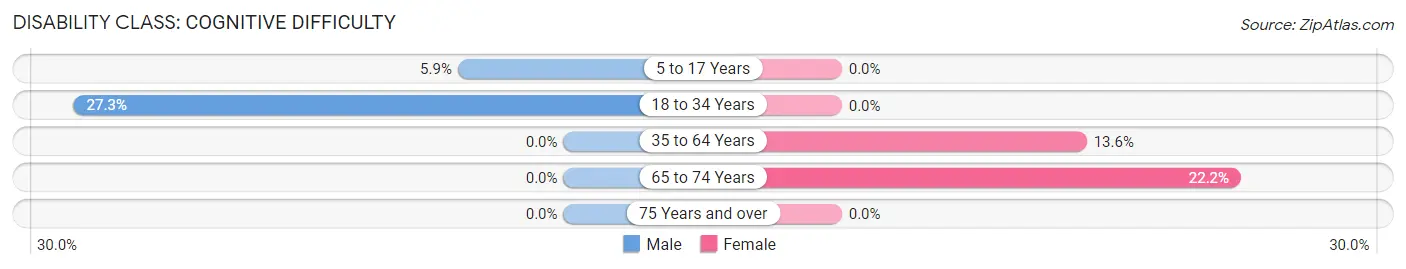
| Age Bracket | Male | Female |
| 5 to 17 Years | 1 (5.9%) | 0 (0.0%) |
| 18 to 34 Years | 3 (27.3%) | 0 (0.0%) |
| 35 to 64 Years | 0 (0.0%) | 3 (13.6%) |
| 65 to 74 Years | 0 (0.0%) | 2 (22.2%) |
| 75 Years and over | 0 (0.0%) | 0 (0.0%) |
Disability Class: Ambulatory Difficulty
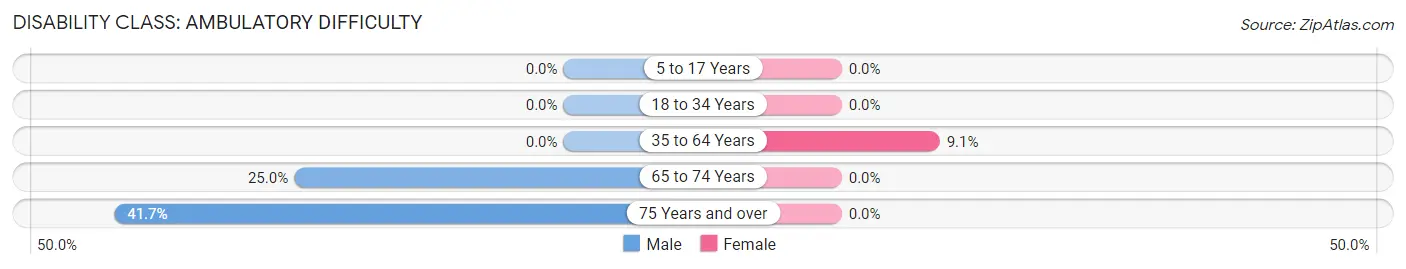
| Age Bracket | Male | Female |
| 5 to 17 Years | 0 (0.0%) | 0 (0.0%) |
| 18 to 34 Years | 0 (0.0%) | 0 (0.0%) |
| 35 to 64 Years | 0 (0.0%) | 2 (9.1%) |
| 65 to 74 Years | 1 (25.0%) | 0 (0.0%) |
| 75 Years and over | 5 (41.7%) | 0 (0.0%) |
Disability Class: Self-Care Difficulty
| Age Bracket | Male | Female |
| 5 to 17 Years | 0 (0.0%) | 0 (0.0%) |
| 18 to 34 Years | 0 (0.0%) | 0 (0.0%) |
| 35 to 64 Years | 0 (0.0%) | 0 (0.0%) |
| 65 to 74 Years | 0 (0.0%) | 0 (0.0%) |
| 75 Years and over | 0 (0.0%) | 0 (0.0%) |
Technology Access in Boxholm
Computing Device Access in Boxholm
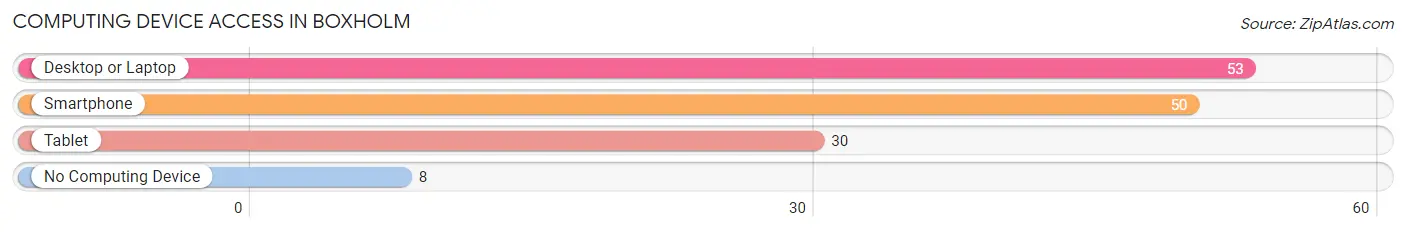
| Device Type | # Households | % Households |
| Desktop or Laptop | 53 | 81.5% |
| Smartphone | 50 | 76.9% |
| Tablet | 30 | 46.2% |
| No Computing Device | 8 | 12.3% |
| Total | 65 | 100.0% |
Internet Access in Boxholm
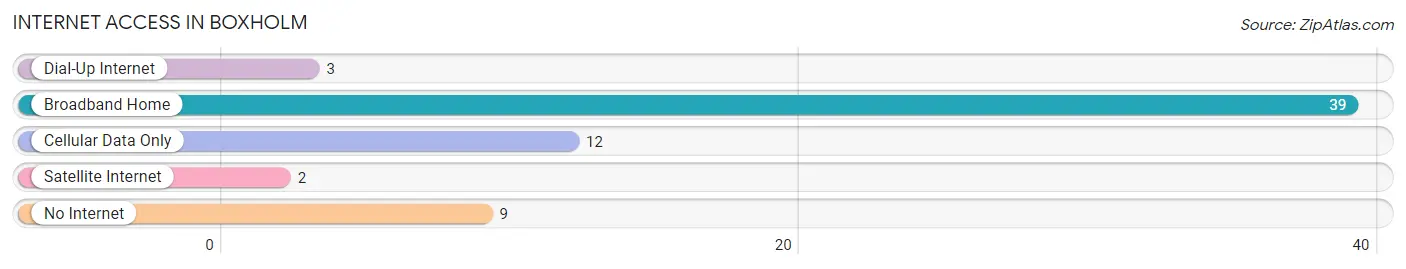
| Internet Type | # Households | % Households |
| Dial-Up Internet | 3 | 4.6% |
| Broadband Home | 39 | 60.0% |
| Cellular Data Only | 12 | 18.5% |
| Satellite Internet | 2 | 3.1% |
| No Internet | 9 | 13.9% |
| Total | 65 | 100.0% |
Boxholm Summary
Boxholm is a small city located in the state of Iowa, in the United States. It is located in the western part of the state, in Boone County, and is part of the Des Moines–West Des Moines Metropolitan Statistical Area. The population of Boxholm was estimated to be 545 in 2020.
History
Boxholm was founded in 1881 by a group of Swedish immigrants who had recently arrived in the United States. The town was named after the Swedish city of Boxholm, which is located in the province of Östergötland. The immigrants were attracted to the area due to its fertile soil and abundant natural resources.
The first settlers in Boxholm were primarily farmers, and the town quickly grew to become a thriving agricultural community. In 1883, the first school was built, and in 1885, the first church was established. By the early 1900s, the town had grown to include a post office, a bank, a hotel, and several stores.
In the early 20th century, Boxholm began to experience a decline in population as many of its residents moved away to larger cities in search of better economic opportunities. However, the town was able to remain relatively stable due to its strong agricultural base.
Geography
Boxholm is located in western Iowa, in Boone County. It is situated at the intersection of U.S. Route 169 and Iowa Highway 17. The city is located approximately 25 miles northwest of Des Moines, the state capital.
The terrain around Boxholm is mostly flat, with some rolling hills in the surrounding area. The city is located in the Des Moines River Valley, and the Des Moines River runs through the city. The climate in Boxholm is humid continental, with hot summers and cold winters.
Economy
The economy of Boxholm is primarily based on agriculture. The city is home to several large farms, and the surrounding area is known for its production of corn, soybeans, and other crops. In addition, the city is home to several small businesses, including a grocery store, a hardware store, and a restaurant.
The city is also home to a number of manufacturing companies, including a plastics manufacturer and a metal fabrication company. The city is served by the Des Moines International Airport, which is located approximately 25 miles away.
Demographics
As of the 2020 census, the population of Boxholm was estimated to be 545. The racial makeup of the city was 97.3% White, 0.7% African American, 0.4% Native American, 0.2% Asian, and 1.4% from other races. The median household income in Boxholm was $45,000, and the median home value was $125,000.
Conclusion
Boxholm is a small city located in western Iowa, in Boone County. It was founded in 1881 by a group of Swedish immigrants, and the city has remained relatively stable due to its strong agricultural base. The economy of Boxholm is primarily based on agriculture, and the city is also home to several small businesses and manufacturing companies. As of the 2020 census, the population of Boxholm was estimated to be 545.
Common Questions
What is Per Capita Income in Boxholm?
Per Capita income in Boxholm is $26,443.
What is the Median Family Income in Boxholm?
Median Family Income in Boxholm is $46,250.
What is the Median Household income in Boxholm?
Median Household Income in Boxholm is $45,625.
What is Income or Wage Gap in Boxholm?
Income or Wage Gap in Boxholm is 37.8%.
Women in Boxholm earn 62.2 cents for every dollar earned by a man.
What is Inequality or Gini Index in Boxholm?
Inequality or Gini Index in Boxholm is 0.39.
What is the Total Population of Boxholm?
Total Population of Boxholm is 138.
What is the Total Male Population of Boxholm?
Total Male Population of Boxholm is 69.
What is the Total Female Population of Boxholm?
Total Female Population of Boxholm is 69.
What is the Ratio of Males per 100 Females in Boxholm?
There are 100.00 Males per 100 Females in Boxholm.
What is the Ratio of Females per 100 Males in Boxholm?
There are 100.00 Females per 100 Males in Boxholm.
What is the Median Population Age in Boxholm?
Median Population Age in Boxholm is 42.5 Years.
What is the Average Family Size in Boxholm
Average Family Size in Boxholm is 2.9 People.
What is the Average Household Size in Boxholm
Average Household Size in Boxholm is 2.1 People.
How Large is the Labor Force in Boxholm?
There are 55 People in the Labor Forcein in Boxholm.
What is the Percentage of People in the Labor Force in Boxholm?
50.5% of People are in the Labor Force in Boxholm.
What is the Unemployment Rate in Boxholm?
Unemployment Rate in Boxholm is 15.1%.