West Burlington, IA Map & Demographics
West Burlington Map
West Burlington Overview
$30,264
PER CAPITA INCOME
$70,417
AVG FAMILY INCOME
$42,721
AVG HOUSEHOLD INCOME
20.9%
WAGE / INCOME GAP [ % ]
79.1¢/ $1
WAGE / INCOME GAP [ $ ]
0.54
INEQUALITY / GINI INDEX
3,184
TOTAL POPULATION
1,714
MALE POPULATION
1,470
FEMALE POPULATION
116.60
MALES / 100 FEMALES
85.76
FEMALES / 100 MALES
38.3
MEDIAN AGE
3.0
AVG FAMILY SIZE
2.3
AVG HOUSEHOLD SIZE
1,491
LABOR FORCE [ PEOPLE ]
58.2%
PERCENT IN LABOR FORCE
1.5%
UNEMPLOYMENT RATE
West Burlington Zip Codes
West Burlington Area Codes
Income in West Burlington
Income Overview in West Burlington
Per Capita Income in West Burlington is $30,264, while median incomes of families and households are $70,417 and $42,721 respectively.
| Characteristic | Number | Measure |
| Per Capita Income | 3,184 | $30,264 |
| Median Family Income | 660 | $70,417 |
| Mean Family Income | 660 | $89,507 |
| Median Household Income | 1,267 | $42,721 |
| Mean Household Income | 1,267 | $74,760 |
| Income Deficit | 660 | $0 |
| Wage / Income Gap (%) | 3,184 | 20.87% |
| Wage / Income Gap ($) | 3,184 | 79.13¢ per $1 |
| Gini / Inequality Index | 3,184 | 0.54 |
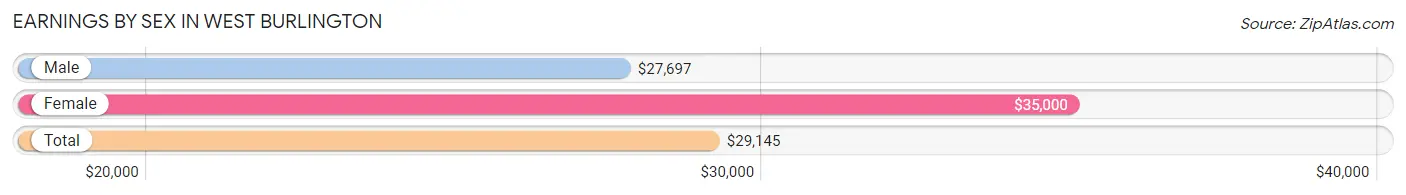
Earnings by Sex in West Burlington
Average Earnings in West Burlington are $29,145, $27,697 for men and $35,000 for women, a difference of 20.9%.
| Sex | Number | Average Earnings |
| Male | 910 (55.3%) | $27,697 |
| Female | 734 (44.7%) | $35,000 |
| Total | 1,644 (100.0%) | $29,145 |
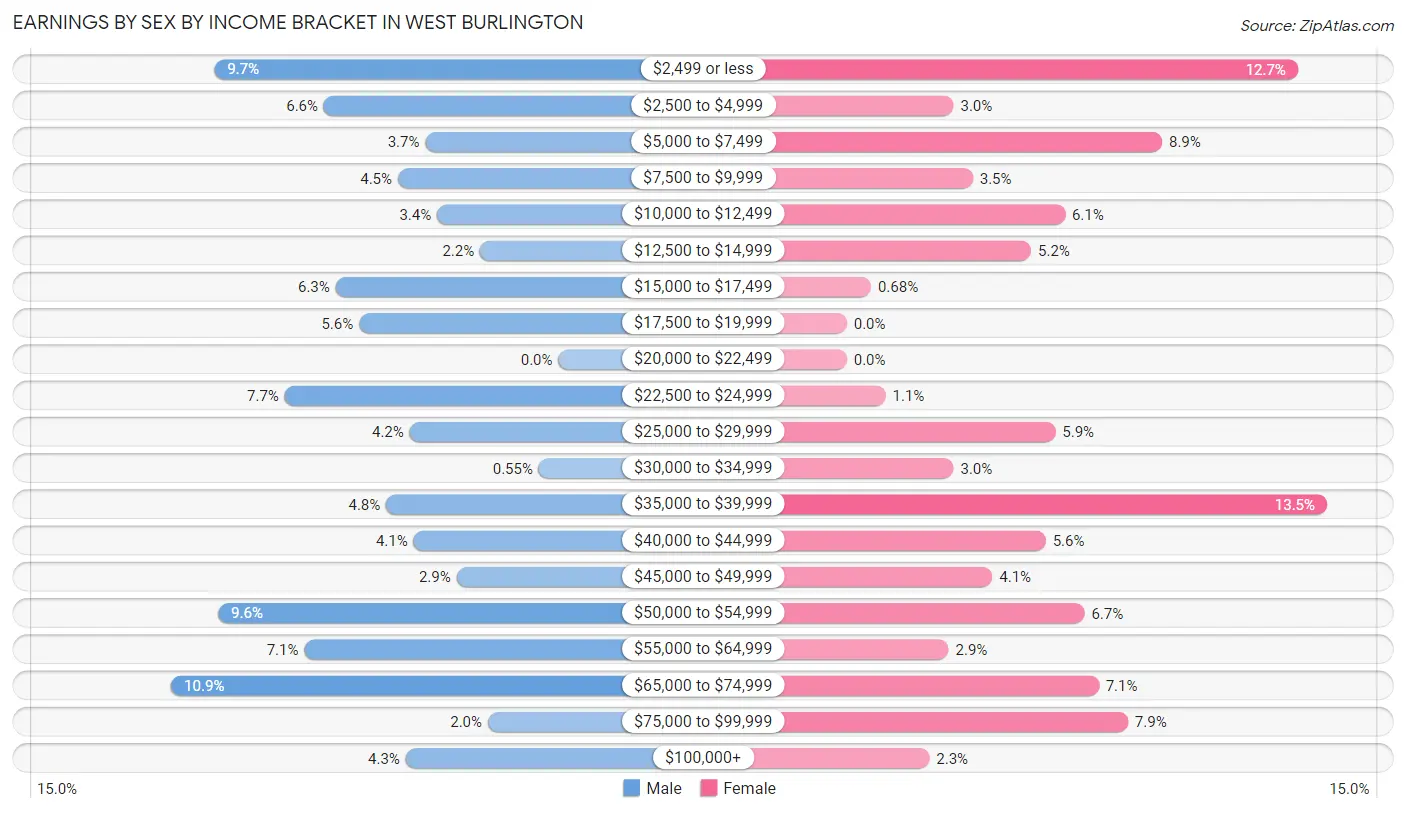
Earnings by Sex by Income Bracket in West Burlington
The most common earnings brackets in West Burlington are $65,000 to $74,999 for men (99 | 10.9%) and $35,000 to $39,999 for women (99 | 13.5%).
| Income | Male | Female |
| $2,499 or less | 88 (9.7%) | 93 (12.7%) |
| $2,500 to $4,999 | 60 (6.6%) | 22 (3.0%) |
| $5,000 to $7,499 | 34 (3.7%) | 65 (8.9%) |
| $7,500 to $9,999 | 41 (4.5%) | 26 (3.5%) |
| $10,000 to $12,499 | 31 (3.4%) | 45 (6.1%) |
| $12,500 to $14,999 | 20 (2.2%) | 38 (5.2%) |
| $15,000 to $17,499 | 57 (6.3%) | 5 (0.7%) |
| $17,500 to $19,999 | 51 (5.6%) | 0 (0.0%) |
| $20,000 to $22,499 | 0 (0.0%) | 0 (0.0%) |
| $22,500 to $24,999 | 70 (7.7%) | 8 (1.1%) |
| $25,000 to $29,999 | 38 (4.2%) | 43 (5.9%) |
| $30,000 to $34,999 | 5 (0.5%) | 22 (3.0%) |
| $35,000 to $39,999 | 44 (4.8%) | 99 (13.5%) |
| $40,000 to $44,999 | 37 (4.1%) | 41 (5.6%) |
| $45,000 to $49,999 | 26 (2.9%) | 30 (4.1%) |
| $50,000 to $54,999 | 87 (9.6%) | 49 (6.7%) |
| $55,000 to $64,999 | 65 (7.1%) | 21 (2.9%) |
| $65,000 to $74,999 | 99 (10.9%) | 52 (7.1%) |
| $75,000 to $99,999 | 18 (2.0%) | 58 (7.9%) |
| $100,000+ | 39 (4.3%) | 17 (2.3%) |
| Total | 910 (100.0%) | 734 (100.0%) |
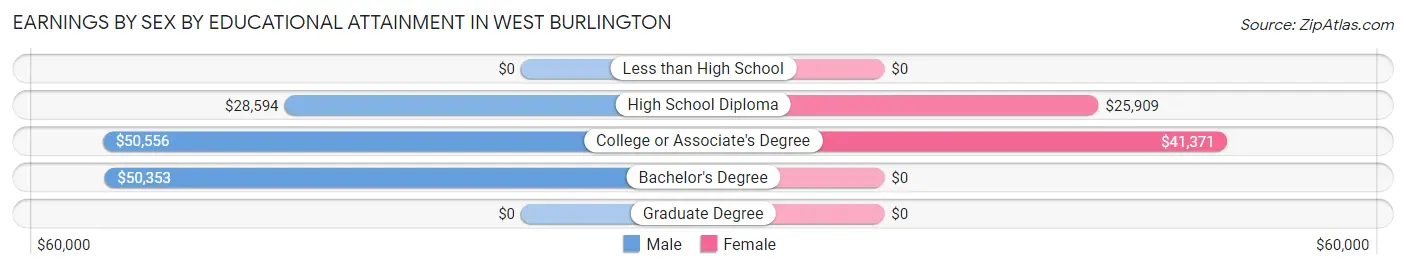
Earnings by Sex by Educational Attainment in West Burlington
Average earnings in West Burlington are $42,366 for men and $37,346 for women, a difference of 11.8%. Men with an educational attainment of college or associate's degree enjoy the highest average annual earnings of $50,556, while those with high school diploma education earn the least with $28,594. Women with an educational attainment of college or associate's degree earn the most with the average annual earnings of $41,371, while those with high school diploma education have the smallest earnings of $25,909.
| Educational Attainment | Male Income | Female Income |
| Less than High School | - | - |
| High School Diploma | $28,594 | $25,909 |
| College or Associate's Degree | $50,556 | $41,371 |
| Bachelor's Degree | $50,353 | $0 |
| Graduate Degree | - | - |
| Total | $42,366 | $37,346 |
Family Income in West Burlington
Family Income Brackets in West Burlington
According to the West Burlington family income data, there are 126 families falling into the $50,000 to $74,999 income range, which is the most common income bracket and makes up 19.1% of all families. Conversely, the $15,000 to $24,999 income bracket is the least frequent group with only 22 families (3.3%) belonging to this category.
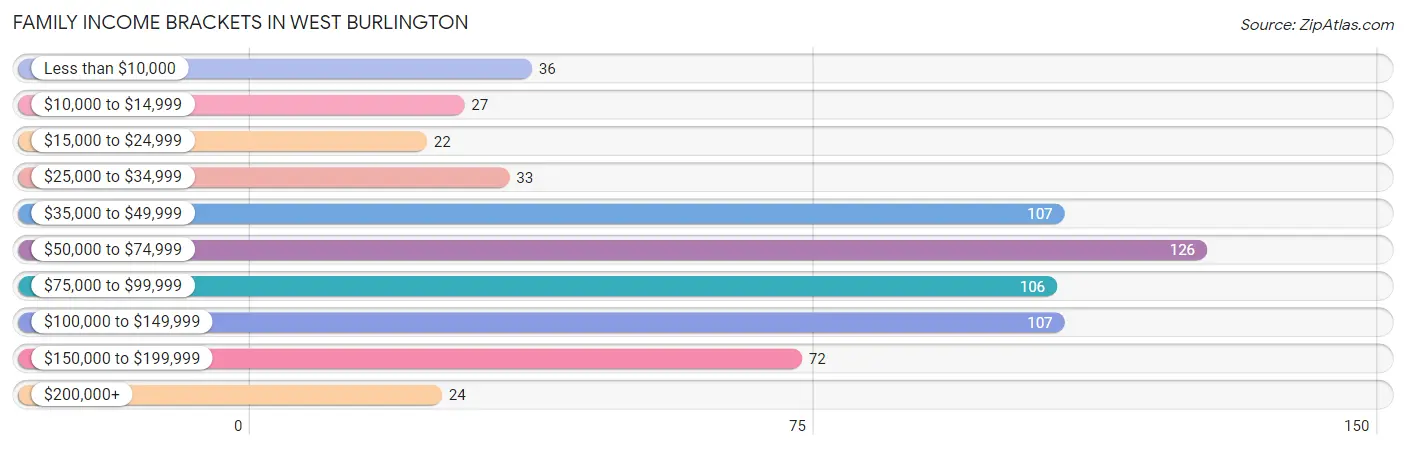
| Income Bracket | # Families | % Families |
| Less than $10,000 | 36 | 5.5% |
| $10,000 to $14,999 | 27 | 4.1% |
| $15,000 to $24,999 | 22 | 3.3% |
| $25,000 to $34,999 | 33 | 5.0% |
| $35,000 to $49,999 | 107 | 16.2% |
| $50,000 to $74,999 | 126 | 19.1% |
| $75,000 to $99,999 | 106 | 16.1% |
| $100,000 to $149,999 | 107 | 16.2% |
| $150,000 to $199,999 | 72 | 10.9% |
| $200,000+ | 24 | 3.6% |
Family Income by Famaliy Size in West Burlington
5-person families (45 | 6.8%) account for the highest median family income in West Burlington with $96,875 per family, while 3-person families (160 | 24.2%) have the highest median income of $31,548 per family member.
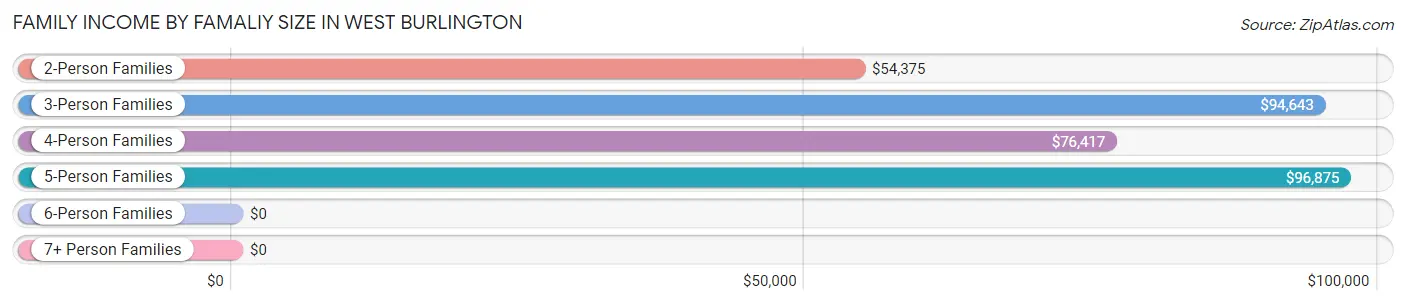
| Income Bracket | # Families | Median Income |
| 2-Person Families | 271 (41.1%) | $54,375 |
| 3-Person Families | 160 (24.2%) | $94,643 |
| 4-Person Families | 177 (26.8%) | $76,417 |
| 5-Person Families | 45 (6.8%) | $96,875 |
| 6-Person Families | 0 (0.0%) | $0 |
| 7+ Person Families | 7 (1.1%) | $0 |
| Total | 660 (100.0%) | $70,417 |
Family Income by Number of Earners in West Burlington
The median family income in West Burlington is $70,417, with families comprising 3+ earners (99) having the highest median family income of $103,424, while families with no earners (128) have the lowest median family income of $44,643, accounting for 15.0% and 19.4% of families, respectively.
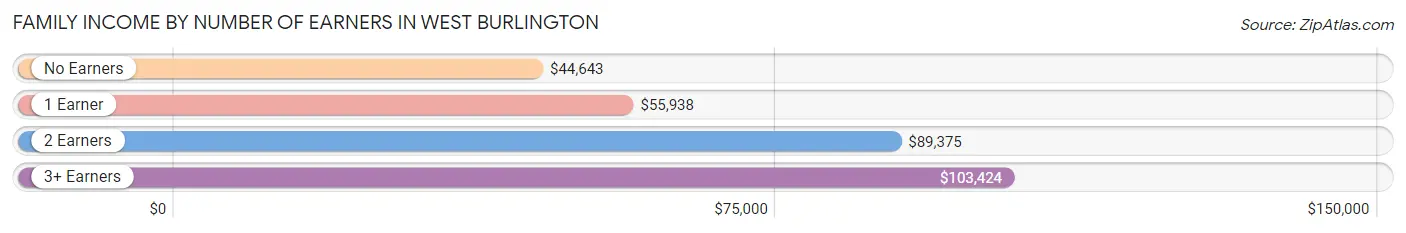
| Number of Earners | # Families | Median Income |
| No Earners | 128 (19.4%) | $44,643 |
| 1 Earner | 131 (19.9%) | $55,938 |
| 2 Earners | 302 (45.8%) | $89,375 |
| 3+ Earners | 99 (15.0%) | $103,424 |
| Total | 660 (100.0%) | $70,417 |
Household Income in West Burlington
Household Income Brackets in West Burlington
With 275 households falling in the category, the $35,000 to $49,999 income range is the most frequent in West Burlington, accounting for 21.7% of all households. In contrast, only 46 households (3.6%) fall into the $200,000+ income bracket, making it the least populous group.
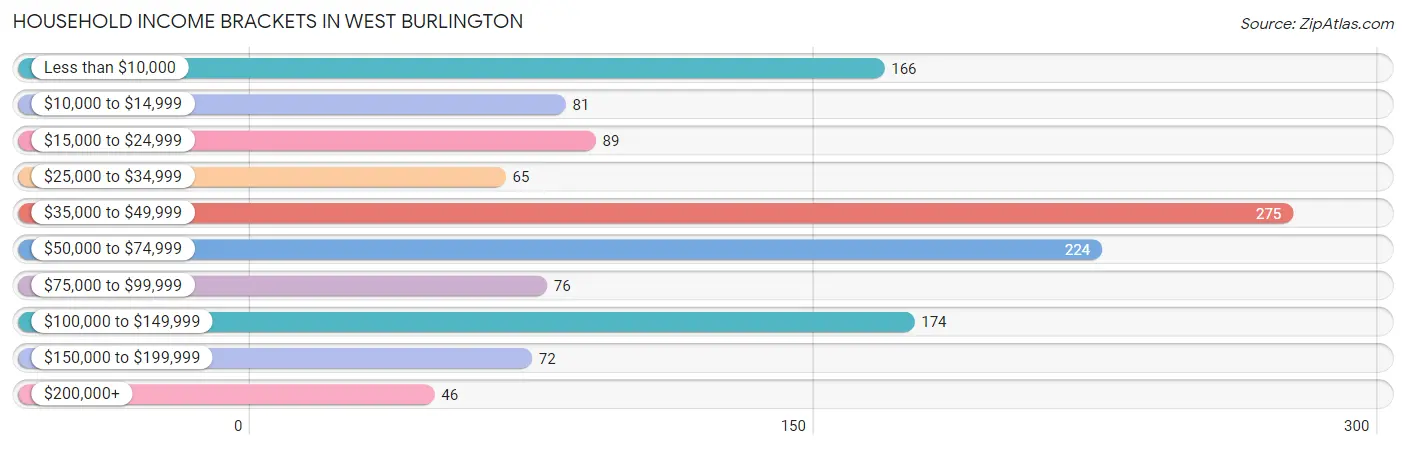
| Income Bracket | # Households | % Households |
| Less than $10,000 | 166 | 13.1% |
| $10,000 to $14,999 | 81 | 6.4% |
| $15,000 to $24,999 | 89 | 7.0% |
| $25,000 to $34,999 | 65 | 5.1% |
| $35,000 to $49,999 | 275 | 21.7% |
| $50,000 to $74,999 | 224 | 17.7% |
| $75,000 to $99,999 | 76 | 6.0% |
| $100,000 to $149,999 | 174 | 13.7% |
| $150,000 to $199,999 | 72 | 5.7% |
| $200,000+ | 46 | 3.6% |
Household Income by Householder Age in West Burlington
The median household income in West Burlington is $42,721, with the highest median household income of $72,644 found in the 25 to 44 years age bracket for the primary householder. A total of 509 households (40.2%) fall into this category. Meanwhile, the 15 to 24 years age bracket for the primary householder has the lowest median household income of $0, with 65 households (5.1%) in this group.
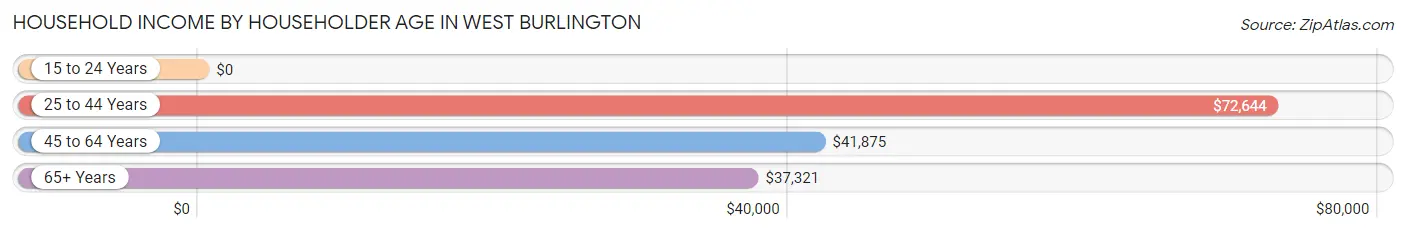
| Income Bracket | # Households | Median Income |
| 15 to 24 Years | 65 (5.1%) | $0 |
| 25 to 44 Years | 509 (40.2%) | $72,644 |
| 45 to 64 Years | 388 (30.6%) | $41,875 |
| 65+ Years | 305 (24.1%) | $37,321 |
| Total | 1,267 (100.0%) | $42,721 |
Poverty in West Burlington
Income Below Poverty by Sex and Age in West Burlington
With 20.3% poverty level for males and 17.0% for females among the residents of West Burlington, 5 year old males and 45 to 54 year old females are the most vulnerable to poverty, with 48 males (100.0%) and 75 females (42.6%) in their respective age groups living below the poverty level.
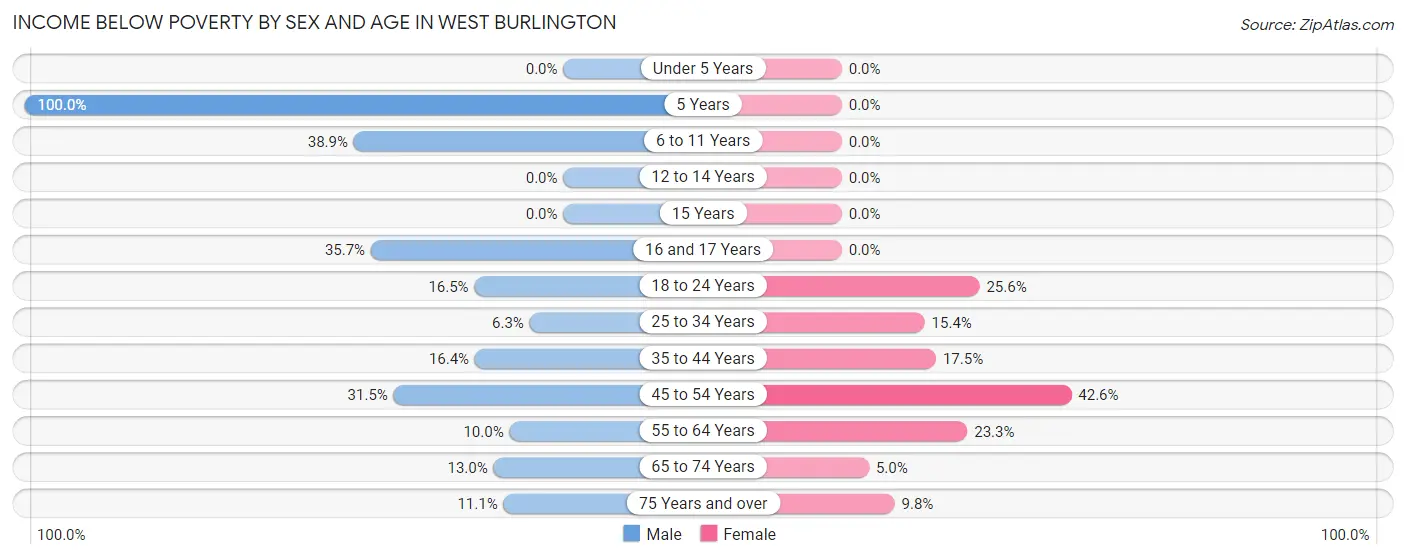
| Age Bracket | Male | Female |
| Under 5 Years | 0 (0.0%) | 0 (0.0%) |
| 5 Years | 48 (100.0%) | 0 (0.0%) |
| 6 to 11 Years | 70 (38.9%) | 0 (0.0%) |
| 12 to 14 Years | 0 (0.0%) | 0 (0.0%) |
| 15 Years | 0 (0.0%) | 0 (0.0%) |
| 16 and 17 Years | 10 (35.7%) | 0 (0.0%) |
| 18 to 24 Years | 33 (16.5%) | 34 (25.6%) |
| 25 to 34 Years | 14 (6.2%) | 10 (15.4%) |
| 35 to 44 Years | 32 (16.4%) | 54 (17.5%) |
| 45 to 54 Years | 40 (31.5%) | 75 (42.6%) |
| 55 to 64 Years | 17 (10.0%) | 34 (23.3%) |
| 65 to 74 Years | 7 (13.0%) | 7 (5.0%) |
| 75 Years and over | 10 (11.1%) | 15 (9.8%) |
| Total | 281 (20.3%) | 229 (17.0%) |
Income Above Poverty by Sex and Age in West Burlington
According to the poverty statistics in West Burlington, males aged under 5 years and females aged 5 years are the age groups that are most secure financially, with 100.0% of males and 100.0% of females in these age groups living above the poverty line.
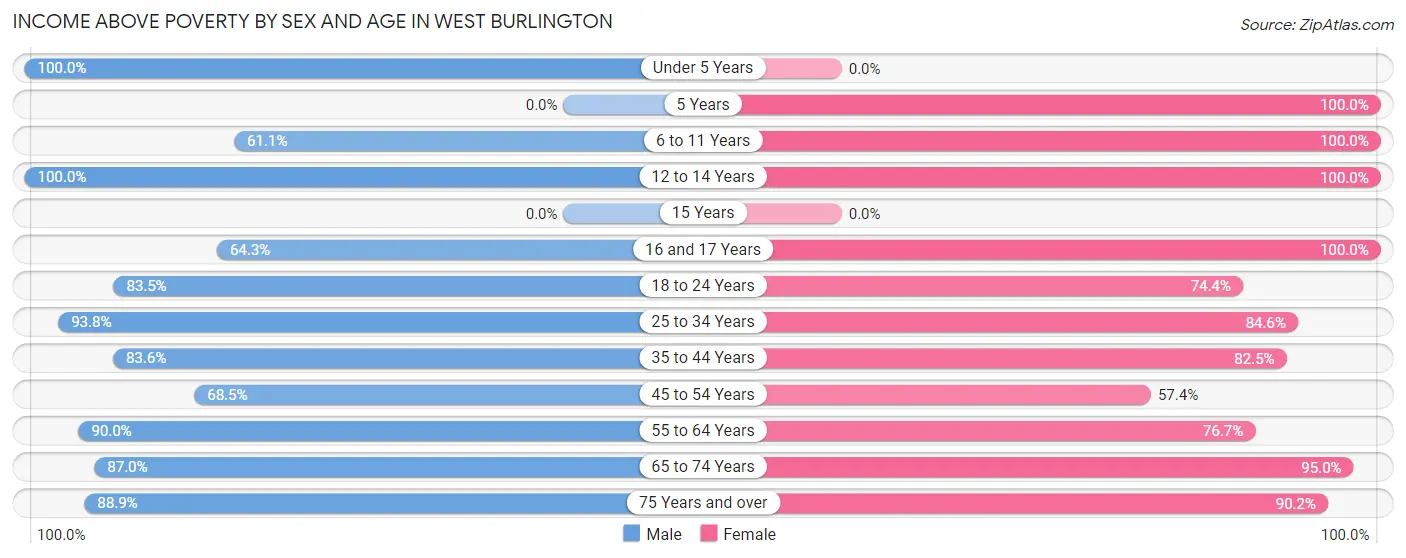
| Age Bracket | Male | Female |
| Under 5 Years | 57 (100.0%) | 0 (0.0%) |
| 5 Years | 0 (0.0%) | 8 (100.0%) |
| 6 to 11 Years | 110 (61.1%) | 41 (100.0%) |
| 12 to 14 Years | 9 (100.0%) | 101 (100.0%) |
| 15 Years | 0 (0.0%) | 0 (0.0%) |
| 16 and 17 Years | 18 (64.3%) | 73 (100.0%) |
| 18 to 24 Years | 167 (83.5%) | 99 (74.4%) |
| 25 to 34 Years | 210 (93.8%) | 55 (84.6%) |
| 35 to 44 Years | 163 (83.6%) | 255 (82.5%) |
| 45 to 54 Years | 87 (68.5%) | 101 (57.4%) |
| 55 to 64 Years | 153 (90.0%) | 112 (76.7%) |
| 65 to 74 Years | 47 (87.0%) | 132 (95.0%) |
| 75 Years and over | 80 (88.9%) | 138 (90.2%) |
| Total | 1,101 (79.7%) | 1,115 (83.0%) |
Income Below Poverty Among Married-Couple Families in West Burlington
The poverty statistics for married-couple families in West Burlington show that 9.8% or 42 of the total 429 families live below the poverty line. Families with 1 or 2 children have the highest poverty rate of 19.8%, comprising of 32 families. On the other hand, families with 3 or 4 children have the lowest poverty rate of 0.0%, which includes 0 families.
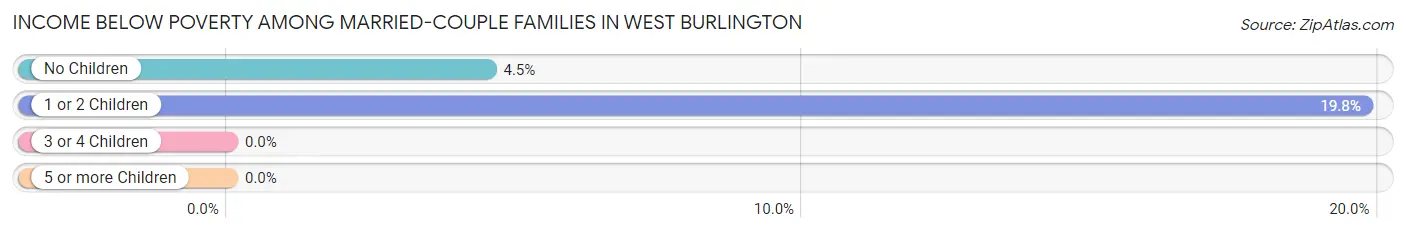
| Children | Above Poverty | Below Poverty |
| No Children | 212 (95.5%) | 10 (4.5%) |
| 1 or 2 Children | 130 (80.2%) | 32 (19.8%) |
| 3 or 4 Children | 45 (100.0%) | 0 (0.0%) |
| 5 or more Children | 0 (0.0%) | 0 (0.0%) |
| Total | 387 (90.2%) | 42 (9.8%) |
Income Below Poverty Among Single-Parent Households in West Burlington
According to the poverty data in West Burlington, 47.8% or 11 single-father households and 11.5% or 24 single-mother households are living below the poverty line. Among single-father households, those with no children have the highest poverty rate, with 11 households (47.8%) experiencing poverty. Likewise, among single-mother households, those with 1 or 2 children have the highest poverty rate, with 21 households (14.5%) falling below the poverty line.
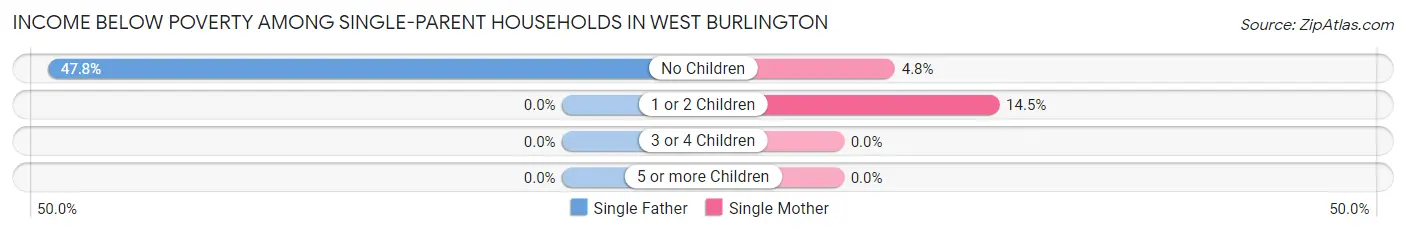
| Children | Single Father | Single Mother |
| No Children | 11 (47.8%) | 3 (4.8%) |
| 1 or 2 Children | 0 (0.0%) | 21 (14.5%) |
| 3 or 4 Children | 0 (0.0%) | 0 (0.0%) |
| 5 or more Children | 0 (0.0%) | 0 (0.0%) |
| Total | 11 (47.8%) | 24 (11.5%) |
Income Below Poverty Among Married-Couple vs Single-Parent Households in West Burlington
The poverty data for West Burlington shows that 42 of the married-couple family households (9.8%) and 35 of the single-parent households (15.1%) are living below the poverty level. Within the married-couple family households, those with 1 or 2 children have the highest poverty rate, with 32 households (19.8%) falling below the poverty line. Among the single-parent households, those with no children have the highest poverty rate, with 14 household (16.3%) living below poverty.
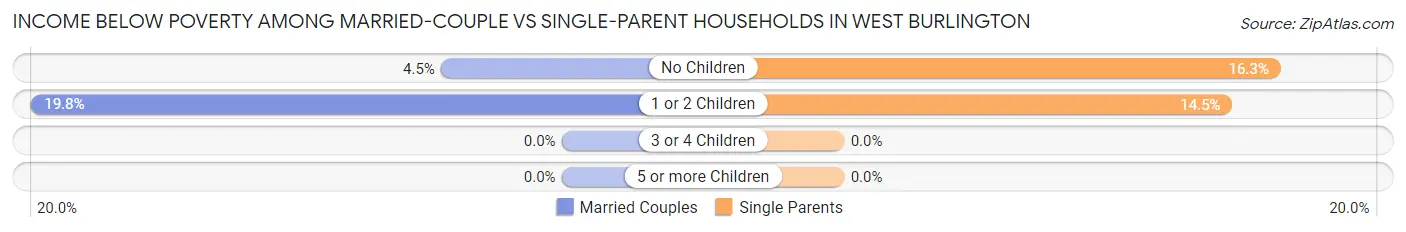
| Children | Married-Couple Families | Single-Parent Households |
| No Children | 10 (4.5%) | 14 (16.3%) |
| 1 or 2 Children | 32 (19.8%) | 21 (14.5%) |
| 3 or 4 Children | 0 (0.0%) | 0 (0.0%) |
| 5 or more Children | 0 (0.0%) | 0 (0.0%) |
| Total | 42 (9.8%) | 35 (15.1%) |
Race in West Burlington
The most populous races in West Burlington are White / Caucasian (2,401 | 75.4%), Black / African American (523 | 16.4%), and Two or more Races (260 | 8.2%).
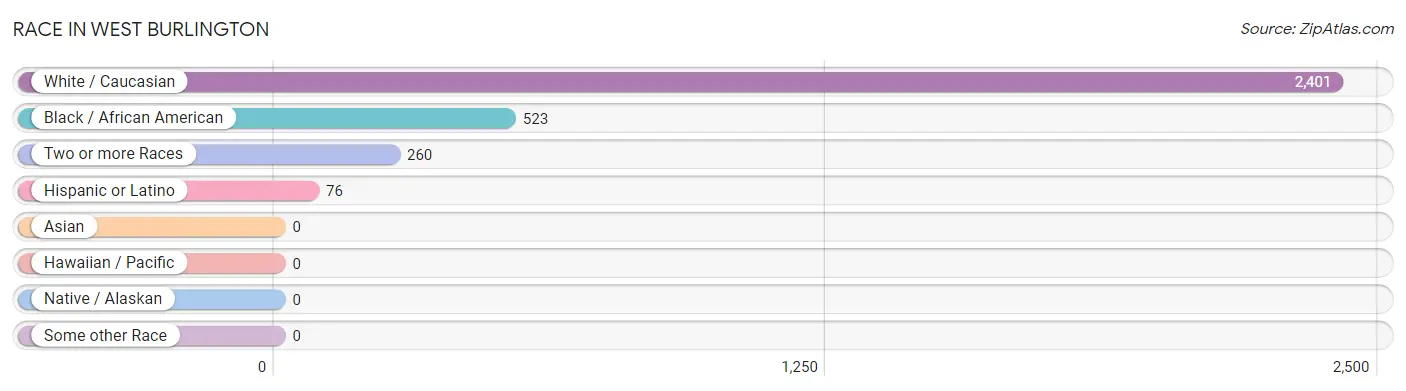
| Race | # Population | % Population |
| Asian | 0 | 0.0% |
| Black / African American | 523 | 16.4% |
| Hawaiian / Pacific | 0 | 0.0% |
| Hispanic or Latino | 76 | 2.4% |
| Native / Alaskan | 0 | 0.0% |
| White / Caucasian | 2,401 | 75.4% |
| Two or more Races | 260 | 8.2% |
| Some other Race | 0 | 0.0% |
| Total | 3,184 | 100.0% |
Ancestry in West Burlington
The most populous ancestries reported in West Burlington are German (681 | 21.4%), English (253 | 8.0%), Irish (228 | 7.2%), Norwegian (159 | 5.0%), and American (79 | 2.5%), together accounting for 44.0% of all West Burlington residents.
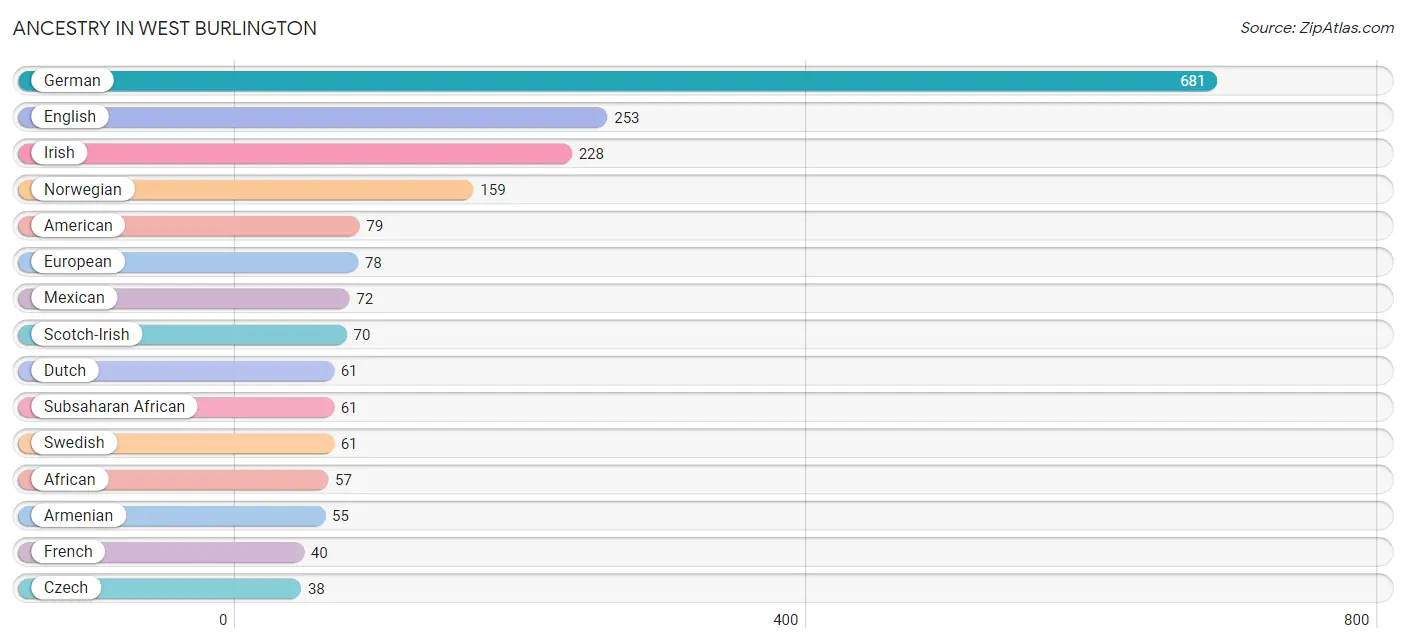
| Ancestry | # Population | % Population |
| African | 57 | 1.8% |
| American | 79 | 2.5% |
| Argentinean | 4 | 0.1% |
| Armenian | 55 | 1.7% |
| British | 7 | 0.2% |
| Burmese | 20 | 0.6% |
| Canadian | 10 | 0.3% |
| Czech | 38 | 1.2% |
| Dutch | 61 | 1.9% |
| English | 253 | 8.0% |
| European | 78 | 2.5% |
| French | 40 | 1.3% |
| German | 681 | 21.4% |
| Irish | 228 | 7.2% |
| Italian | 36 | 1.1% |
| Mexican | 72 | 2.3% |
| Nigerian | 4 | 0.1% |
| Northern European | 8 | 0.3% |
| Norwegian | 159 | 5.0% |
| Polish | 5 | 0.2% |
| Portuguese | 18 | 0.6% |
| Scotch-Irish | 70 | 2.2% |
| Scottish | 27 | 0.9% |
| South American | 4 | 0.1% |
| Subsaharan African | 61 | 1.9% |
| Swedish | 61 | 1.9% |
| Swiss | 10 | 0.3% |
| Welsh | 13 | 0.4% | View All 28 Rows |
Immigrants in West Burlington
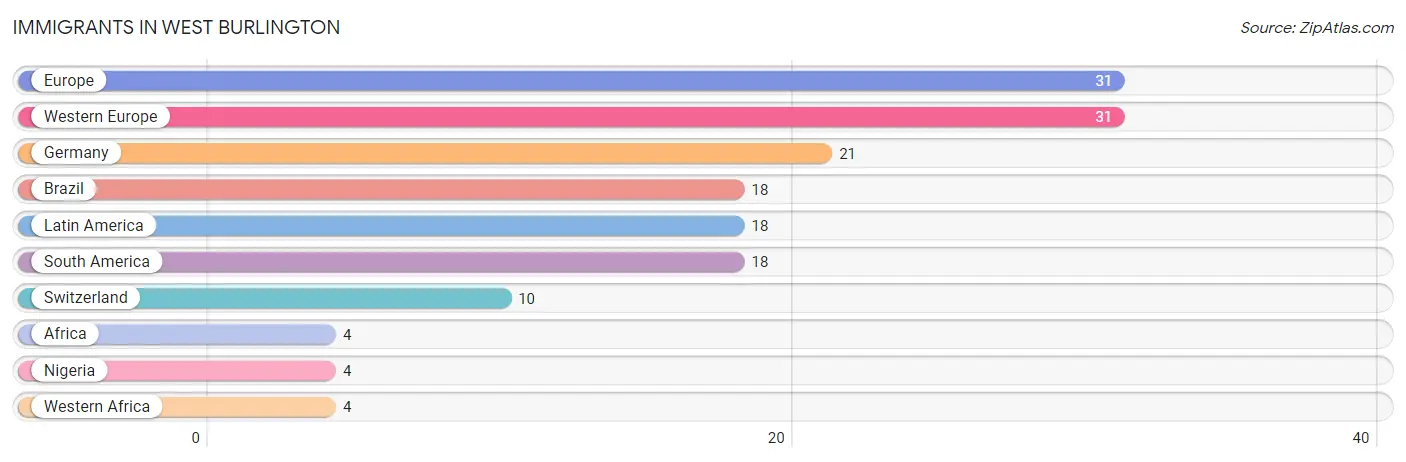
The most numerous immigrant groups reported in West Burlington came from Europe (31 | 1.0%), Western Europe (31 | 1.0%), Germany (21 | 0.7%), Brazil (18 | 0.6%), and Latin America (18 | 0.6%), together accounting for 3.7% of all West Burlington residents.
| Immigration Origin | # Population | % Population |
| Africa | 4 | 0.1% |
| Brazil | 18 | 0.6% |
| Europe | 31 | 1.0% |
| Germany | 21 | 0.7% |
| Latin America | 18 | 0.6% |
| Nigeria | 4 | 0.1% |
| South America | 18 | 0.6% |
| Switzerland | 10 | 0.3% |
| Western Africa | 4 | 0.1% |
| Western Europe | 31 | 1.0% | View All 10 Rows |
Sex and Age in West Burlington
Sex and Age in West Burlington
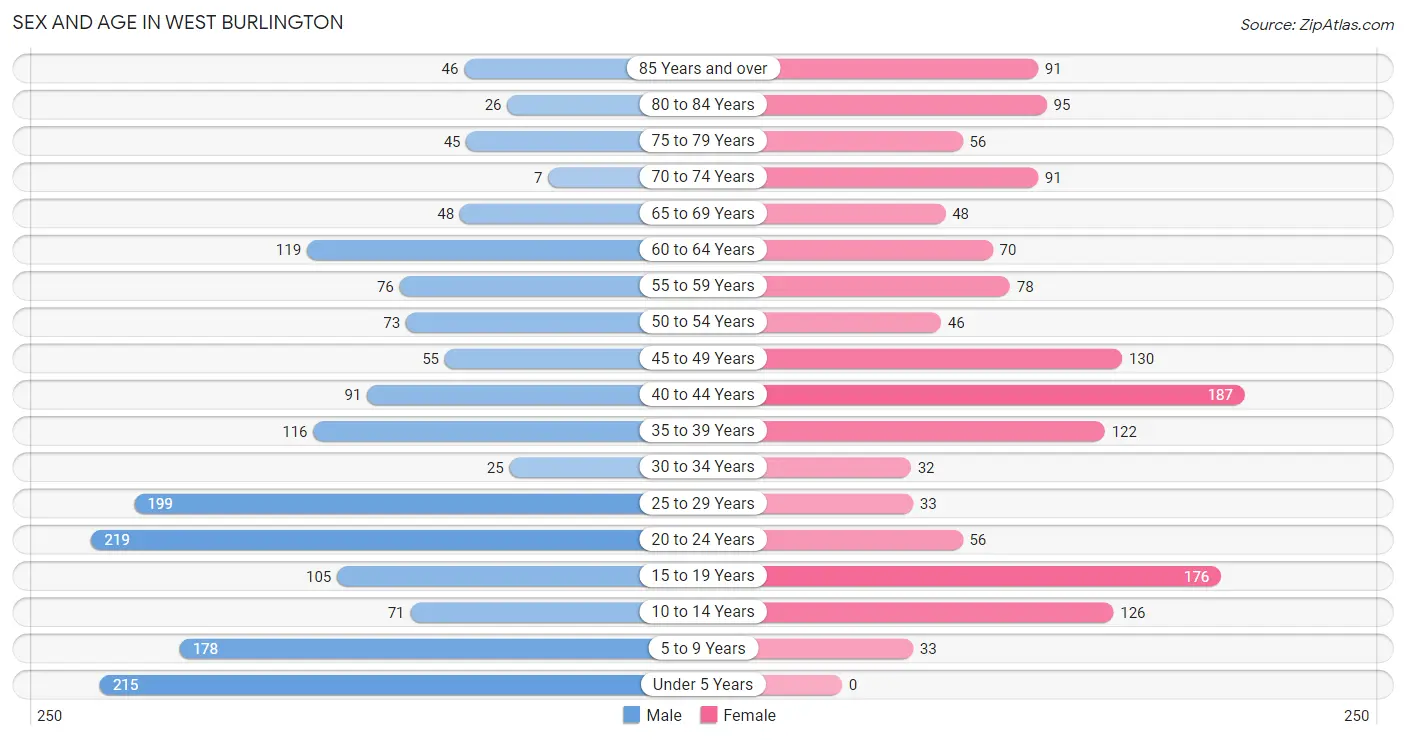
The most populous age groups in West Burlington are 20 to 24 Years (219 | 12.8%) for men and 40 to 44 Years (187 | 12.7%) for women.
| Age Bracket | Male | Female |
| Under 5 Years | 215 (12.5%) | 0 (0.0%) |
| 5 to 9 Years | 178 (10.4%) | 33 (2.2%) |
| 10 to 14 Years | 71 (4.1%) | 126 (8.6%) |
| 15 to 19 Years | 105 (6.1%) | 176 (12.0%) |
| 20 to 24 Years | 219 (12.8%) | 56 (3.8%) |
| 25 to 29 Years | 199 (11.6%) | 33 (2.2%) |
| 30 to 34 Years | 25 (1.5%) | 32 (2.2%) |
| 35 to 39 Years | 116 (6.8%) | 122 (8.3%) |
| 40 to 44 Years | 91 (5.3%) | 187 (12.7%) |
| 45 to 49 Years | 55 (3.2%) | 130 (8.8%) |
| 50 to 54 Years | 73 (4.3%) | 46 (3.1%) |
| 55 to 59 Years | 76 (4.4%) | 78 (5.3%) |
| 60 to 64 Years | 119 (6.9%) | 70 (4.8%) |
| 65 to 69 Years | 48 (2.8%) | 48 (3.3%) |
| 70 to 74 Years | 7 (0.4%) | 91 (6.2%) |
| 75 to 79 Years | 45 (2.6%) | 56 (3.8%) |
| 80 to 84 Years | 26 (1.5%) | 95 (6.5%) |
| 85 Years and over | 46 (2.7%) | 91 (6.2%) |
| Total | 1,714 (100.0%) | 1,470 (100.0%) |
Families and Households in West Burlington
Median Family Size in West Burlington
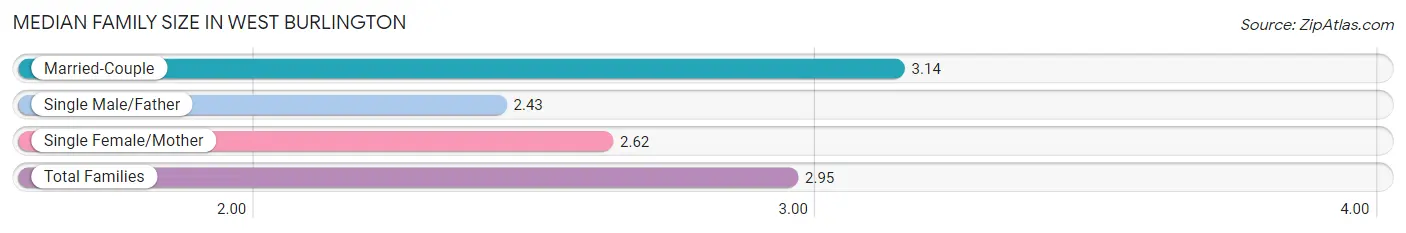
The median family size in West Burlington is 2.95 persons per family, with married-couple families (429 | 65.0%) accounting for the largest median family size of 3.14 persons per family. On the other hand, single male/father families (23 | 3.5%) represent the smallest median family size with 2.43 persons per family.
| Family Type | # Families | Family Size |
| Married-Couple | 429 (65.0%) | 3.14 |
| Single Male/Father | 23 (3.5%) | 2.43 |
| Single Female/Mother | 208 (31.5%) | 2.62 |
| Total Families | 660 (100.0%) | 2.95 |
Median Household Size in West Burlington
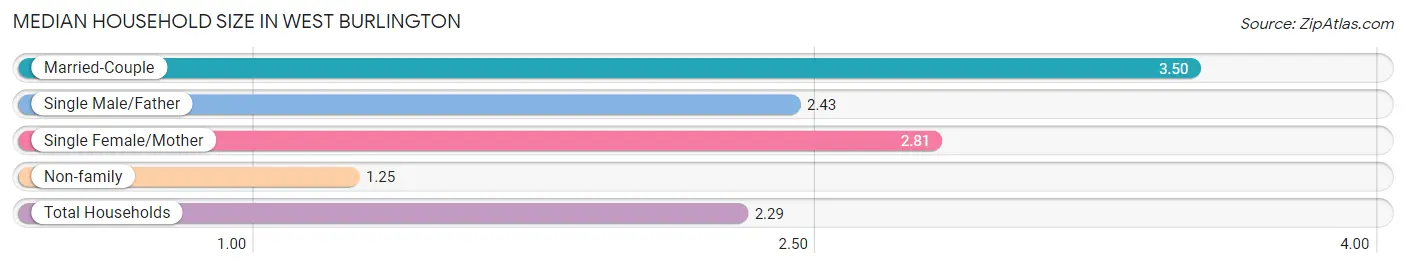
The median household size in West Burlington is 2.29 persons per household, with married-couple households (429 | 33.9%) accounting for the largest median household size of 3.5 persons per household. non-family households (607 | 47.9%) represent the smallest median household size with 1.25 persons per household.
| Household Type | # Households | Household Size |
| Married-Couple | 429 (33.9%) | 3.50 |
| Single Male/Father | 23 (1.8%) | 2.43 |
| Single Female/Mother | 208 (16.4%) | 2.81 |
| Non-family | 607 (47.9%) | 1.25 |
| Total Households | 1,267 (100.0%) | 2.29 |
Household Size by Marriage Status in West Burlington
Out of a total of 1,267 households in West Burlington, 660 (52.1%) are family households, while 607 (47.9%) are nonfamily households. The most numerous type of family households are 2-person households, comprising 266, and the most common type of nonfamily households are 1-person households, comprising 466.
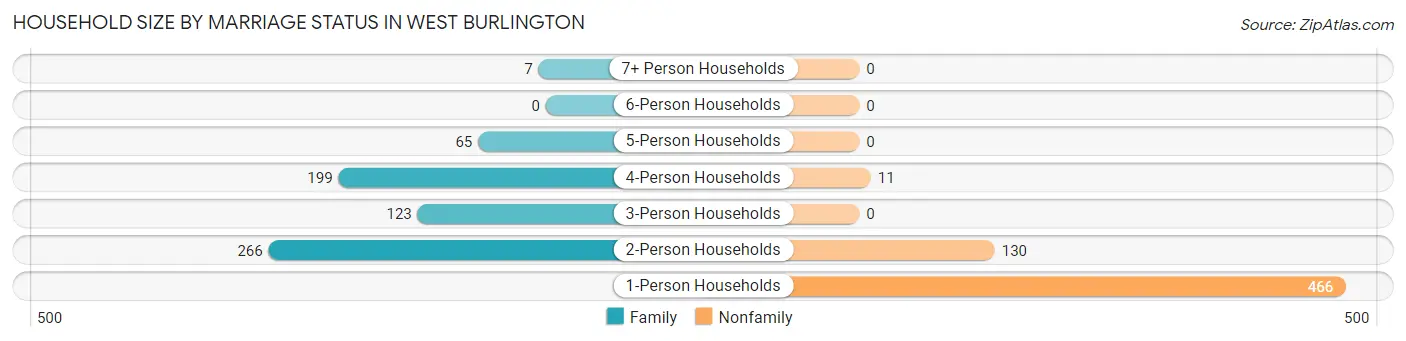
| Household Size | Family Households | Nonfamily Households |
| 1-Person Households | - | 466 (36.8%) |
| 2-Person Households | 266 (21.0%) | 130 (10.3%) |
| 3-Person Households | 123 (9.7%) | 0 (0.0%) |
| 4-Person Households | 199 (15.7%) | 11 (0.9%) |
| 5-Person Households | 65 (5.1%) | 0 (0.0%) |
| 6-Person Households | 0 (0.0%) | 0 (0.0%) |
| 7+ Person Households | 7 (0.5%) | 0 (0.0%) |
| Total | 660 (52.1%) | 607 (47.9%) |
Female Fertility in West Burlington
Fertility by Age in West Burlington
Average fertility rate in West Burlington is 63.0 births per 1,000 women. Women in the age bracket of 20 to 34 years have the highest fertility rate with 256.0 births per 1,000 women. Women in the age bracket of 20 to 34 years acount for 67.4% of all women with births.
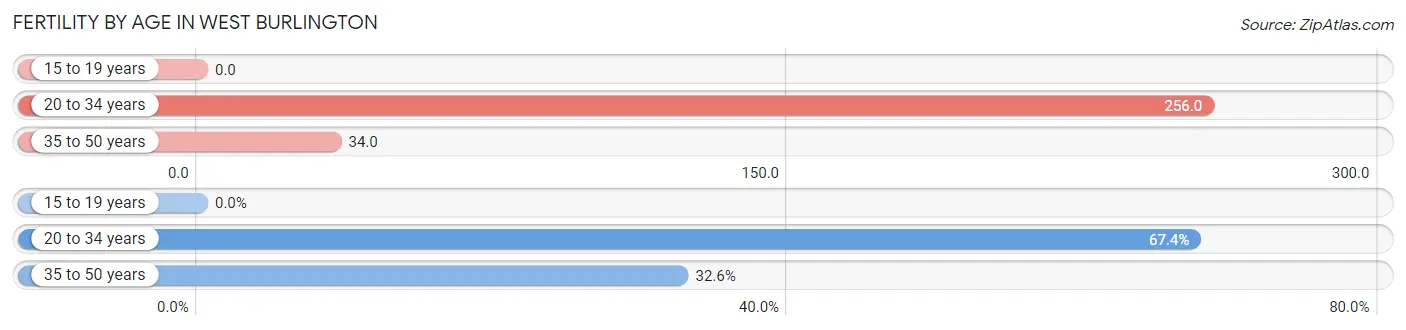
| Age Bracket | Women with Births | Births / 1,000 Women |
| 15 to 19 years | 0 (0.0%) | 0.0 |
| 20 to 34 years | 31 (67.4%) | 256.0 |
| 35 to 50 years | 15 (32.6%) | 34.0 |
| Total | 46 (100.0%) | 63.0 |
Fertility by Age by Marriage Status in West Burlington
67.4% of women with births (46) in West Burlington are married. The highest percentage of unmarried women with births falls into 35 to 50 years age bracket with 100.0% of them unmarried at the time of birth, while the lowest percentage of unmarried women with births belong to 20 to 34 years age bracket with 0.0% of them unmarried.
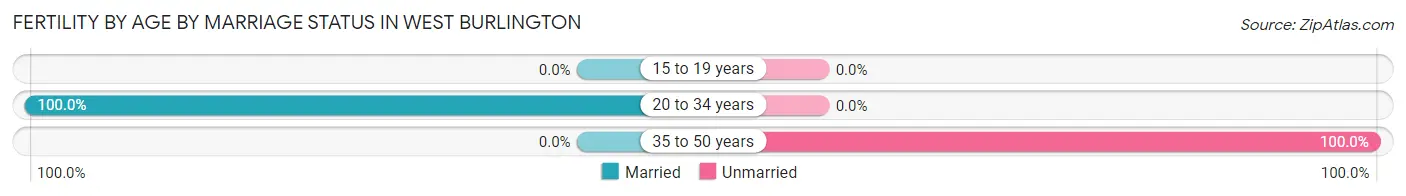
| Age Bracket | Married | Unmarried |
| 15 to 19 years | 0 (0.0%) | 0 (0.0%) |
| 20 to 34 years | 31 (100.0%) | 0 (0.0%) |
| 35 to 50 years | 0 (0.0%) | 15 (100.0%) |
| Total | 31 (67.4%) | 15 (32.6%) |
Fertility by Education in West Burlington
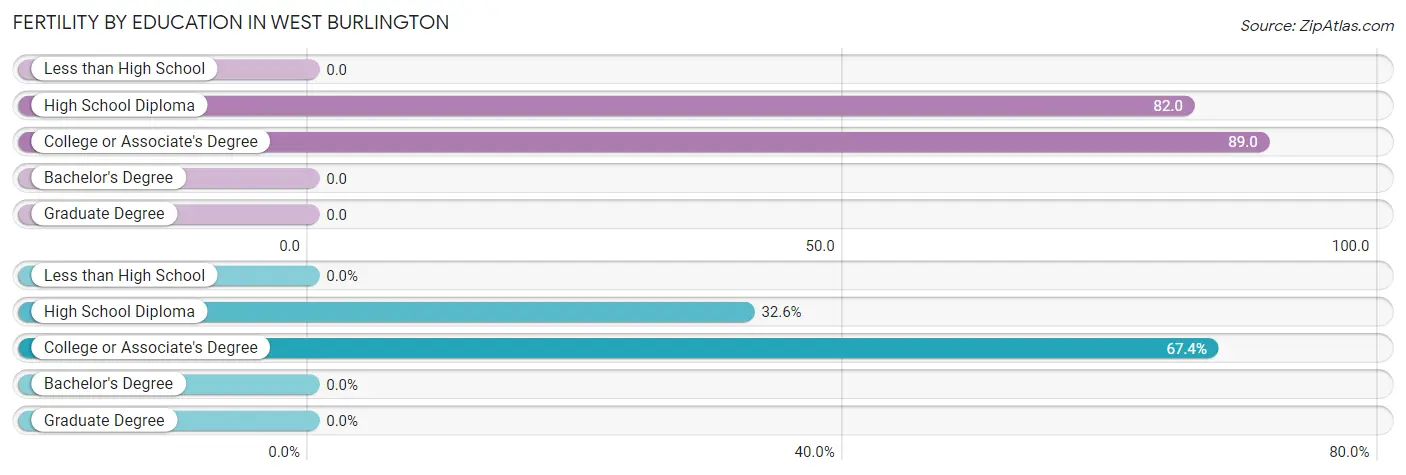
| Educational Attainment | Women with Births | Births / 1,000 Women |
| Less than High School | 0 (0.0%) | 0.0 |
| High School Diploma | 15 (32.6%) | 82.0 |
| College or Associate's Degree | 31 (67.4%) | 89.0 |
| Bachelor's Degree | 0 (0.0%) | 0.0 |
| Graduate Degree | 0 (0.0%) | 0.0 |
| Total | 46 (100.0%) | 63.0 |
Fertility by Education by Marriage Status in West Burlington
32.6% of women with births in West Burlington are unmarried. Women with the educational attainment of college or associate's degree are most likely to be married with 100.0% of them married at childbirth, while women with the educational attainment of high school diploma are least likely to be married with 100.0% of them unmarried at childbirth.
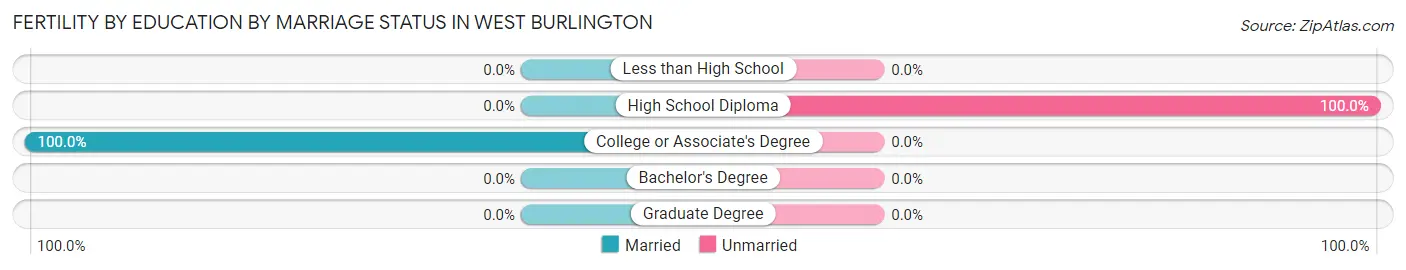
| Educational Attainment | Married | Unmarried |
| Less than High School | 0 (0.0%) | 0 (0.0%) |
| High School Diploma | 0 (0.0%) | 15 (100.0%) |
| College or Associate's Degree | 31 (100.0%) | 0 (0.0%) |
| Bachelor's Degree | 0 (0.0%) | 0 (0.0%) |
| Graduate Degree | 0 (0.0%) | 0 (0.0%) |
| Total | 31 (67.4%) | 15 (32.6%) |
Employment Characteristics in West Burlington
Employment by Class of Employer in West Burlington
Among the 1,410 employed individuals in West Burlington, private company employees (1,049 | 74.4%), local government employees (131 | 9.3%), and self-employed (not incorporated) (67 | 4.8%) make up the most common classes of employment.
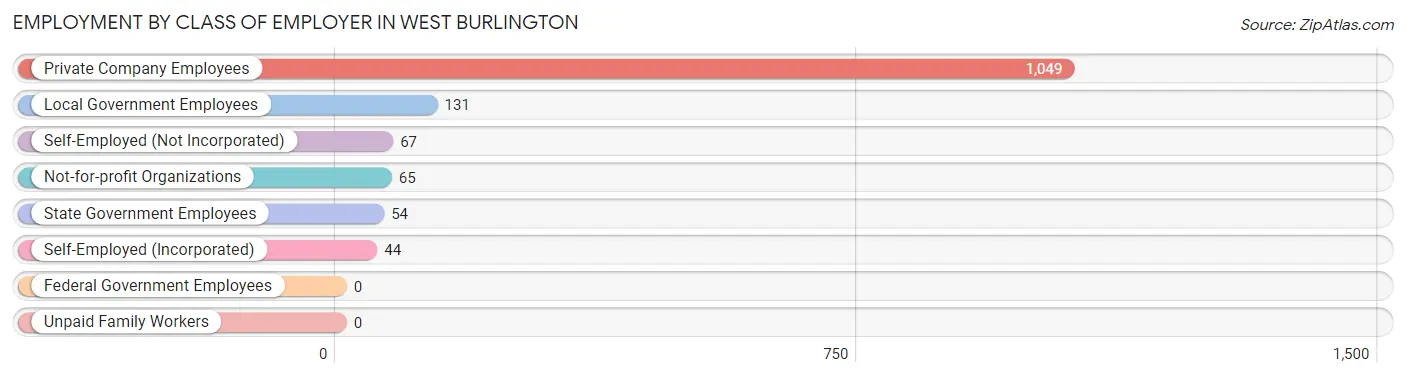
| Employer Class | # Employees | % Employees |
| Private Company Employees | 1,049 | 74.4% |
| Self-Employed (Incorporated) | 44 | 3.1% |
| Self-Employed (Not Incorporated) | 67 | 4.8% |
| Not-for-profit Organizations | 65 | 4.6% |
| Local Government Employees | 131 | 9.3% |
| State Government Employees | 54 | 3.8% |
| Federal Government Employees | 0 | 0.0% |
| Unpaid Family Workers | 0 | 0.0% |
| Total | 1,410 | 100.0% |
Employment Status by Age in West Burlington
According to the labor force statistics for West Burlington, out of the total population over 16 years of age (2,561), 58.2% or 1,491 individuals are in the labor force, with 1.5% or 22 of them unemployed. The age group with the highest labor force participation rate is 25 to 29 years, with 100.0% or 232 individuals in the labor force. Within the labor force, the 20 to 24 years age range has the highest percentage of unemployed individuals, with 7.6% or 13 of them being unemployed.
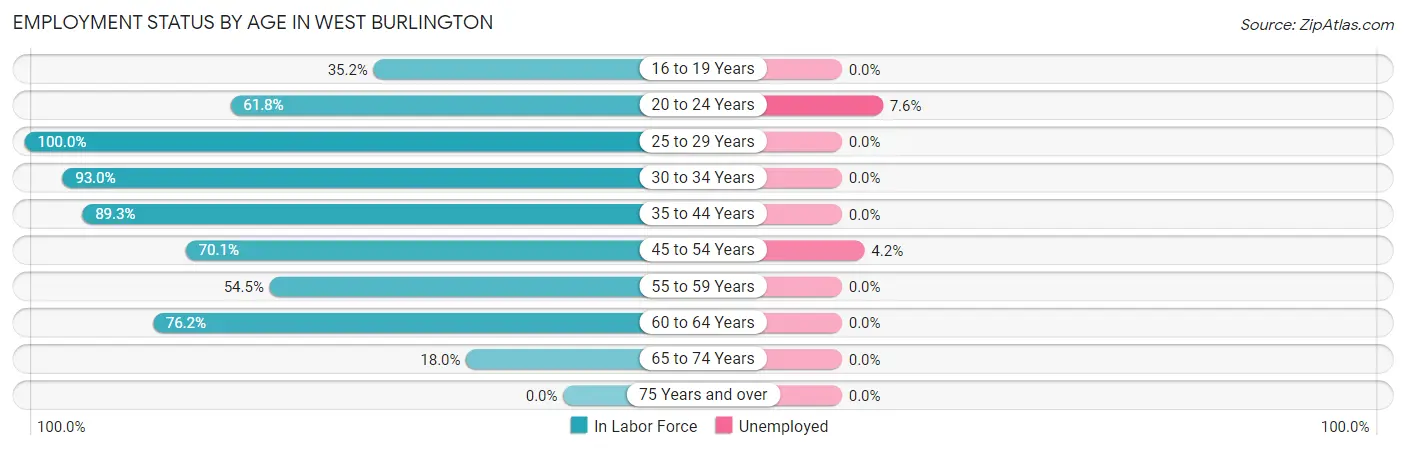
| Age Bracket | In Labor Force | Unemployed |
| 16 to 19 Years | 99 (35.2%) | 0 (0.0%) |
| 20 to 24 Years | 170 (61.8%) | 13 (7.6%) |
| 25 to 29 Years | 232 (100.0%) | 0 (0.0%) |
| 30 to 34 Years | 53 (93.0%) | 0 (0.0%) |
| 35 to 44 Years | 461 (89.3%) | 0 (0.0%) |
| 45 to 54 Years | 213 (70.1%) | 9 (4.2%) |
| 55 to 59 Years | 84 (54.5%) | 0 (0.0%) |
| 60 to 64 Years | 144 (76.2%) | 0 (0.0%) |
| 65 to 74 Years | 35 (18.0%) | 0 (0.0%) |
| 75 Years and over | 0 (0.0%) | 0 (0.0%) |
| Total | 1,491 (58.2%) | 22 (1.5%) |
Employment Status by Educational Attainment in West Burlington
According to labor force statistics for West Burlington, 81.7% of individuals (1,186) out of the total population between 25 and 64 years of age (1,452) are in the labor force, with 0.8% or 9 of them being unemployed. The group with the highest labor force participation rate are those with the educational attainment of bachelor's degree or higher, with 90.9% or 358 individuals in the labor force. Within the labor force, individuals with high school diploma education have the highest percentage of unemployment, with 2.8% or 9 of them being unemployed.
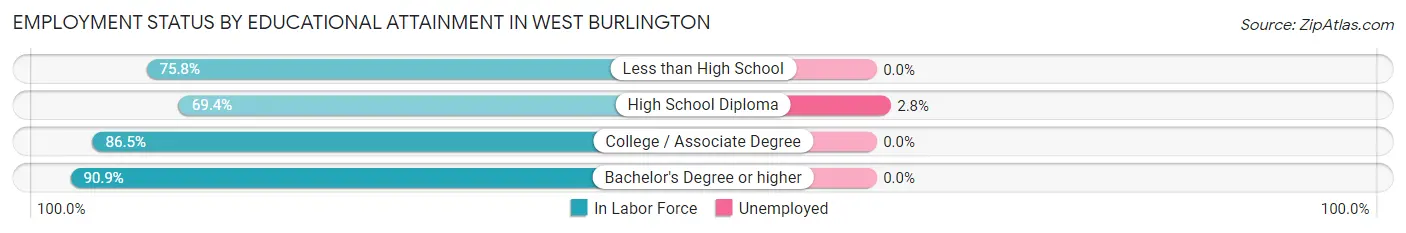
| Educational Attainment | In Labor Force | Unemployed |
| Less than High School | 47 (75.8%) | 0 (0.0%) |
| High School Diploma | 322 (69.4%) | 13 (2.8%) |
| College / Associate Degree | 460 (86.5%) | 0 (0.0%) |
| Bachelor's Degree or higher | 358 (90.9%) | 0 (0.0%) |
| Total | 1,186 (81.7%) | 12 (0.8%) |
Employment Occupations by Sex in West Burlington
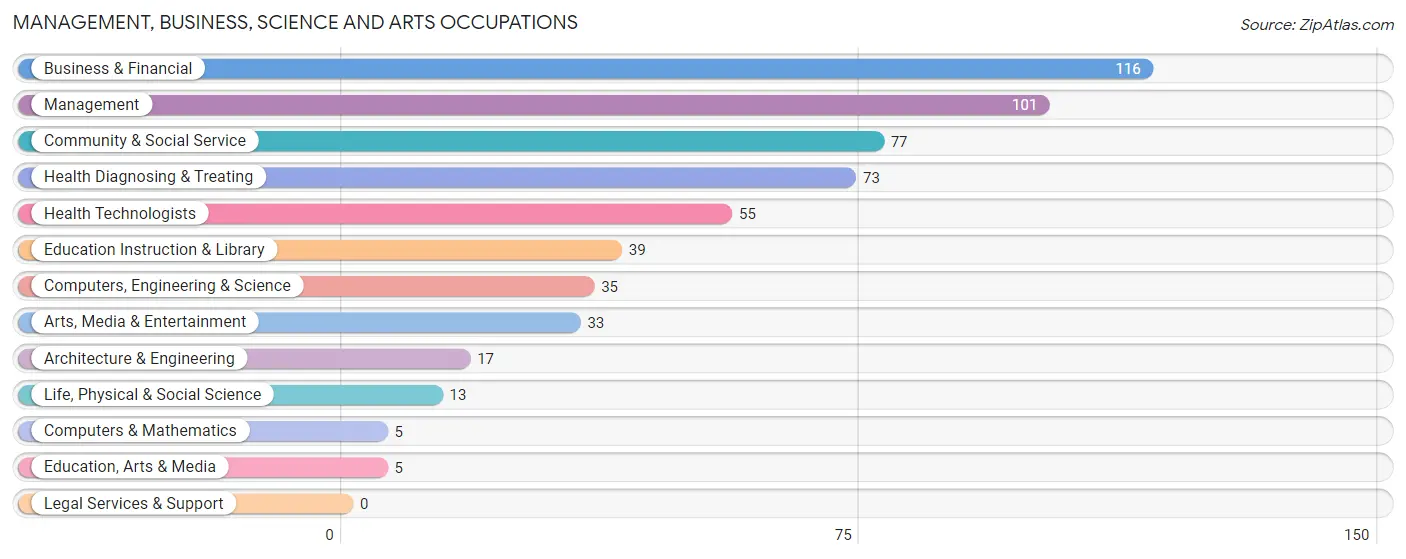
Management, Business, Science and Arts Occupations
The most common Management, Business, Science and Arts occupations in West Burlington are Business & Financial (116 | 7.9%), Management (101 | 6.9%), Community & Social Service (77 | 5.2%), Health Diagnosing & Treating (73 | 5.0%), and Health Technologists (55 | 3.7%).
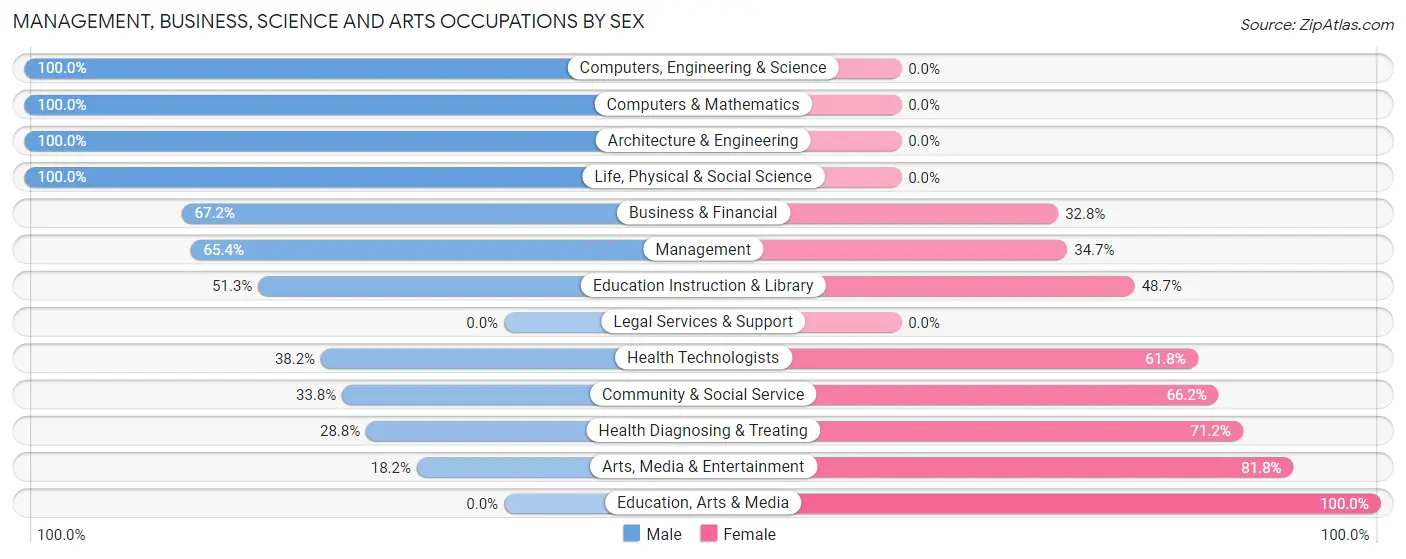
Management, Business, Science and Arts Occupations by Sex
Within the Management, Business, Science and Arts occupations in West Burlington, the most male-oriented occupations are Computers, Engineering & Science (100.0%), Computers & Mathematics (100.0%), and Architecture & Engineering (100.0%), while the most female-oriented occupations are Education, Arts & Media (100.0%), Arts, Media & Entertainment (81.8%), and Health Diagnosing & Treating (71.2%).
| Occupation | Male | Female |
| Management | 66 (65.3%) | 35 (34.6%) |
| Business & Financial | 78 (67.2%) | 38 (32.8%) |
| Computers, Engineering & Science | 35 (100.0%) | 0 (0.0%) |
| Computers & Mathematics | 5 (100.0%) | 0 (0.0%) |
| Architecture & Engineering | 17 (100.0%) | 0 (0.0%) |
| Life, Physical & Social Science | 13 (100.0%) | 0 (0.0%) |
| Community & Social Service | 26 (33.8%) | 51 (66.2%) |
| Education, Arts & Media | 0 (0.0%) | 5 (100.0%) |
| Legal Services & Support | 0 (0.0%) | 0 (0.0%) |
| Education Instruction & Library | 20 (51.3%) | 19 (48.7%) |
| Arts, Media & Entertainment | 6 (18.2%) | 27 (81.8%) |
| Health Diagnosing & Treating | 21 (28.8%) | 52 (71.2%) |
| Health Technologists | 21 (38.2%) | 34 (61.8%) |
| Total (Category) | 226 (56.2%) | 176 (43.8%) |
| Total (Overall) | 789 (53.7%) | 680 (46.3%) |
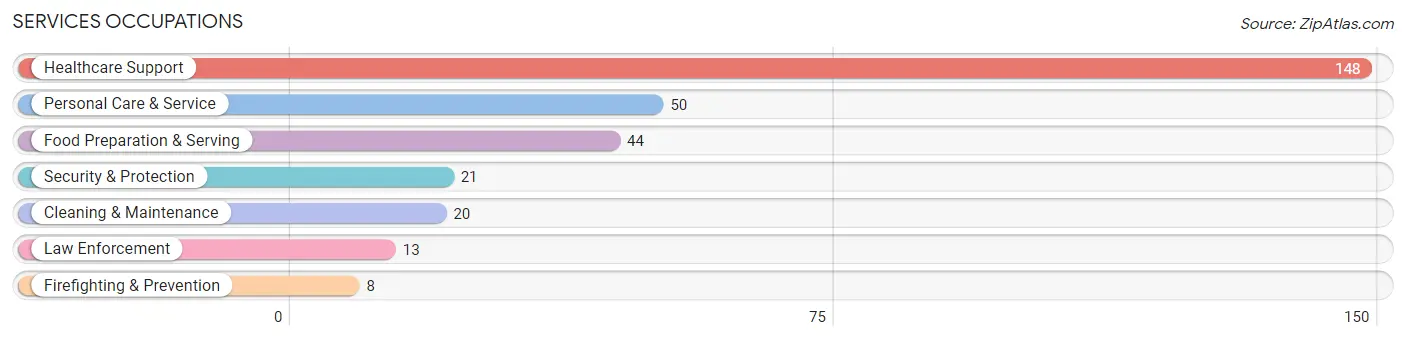
Services Occupations
The most common Services occupations in West Burlington are Healthcare Support (148 | 10.1%), Personal Care & Service (50 | 3.4%), Food Preparation & Serving (44 | 3.0%), Security & Protection (21 | 1.4%), and Cleaning & Maintenance (20 | 1.4%).
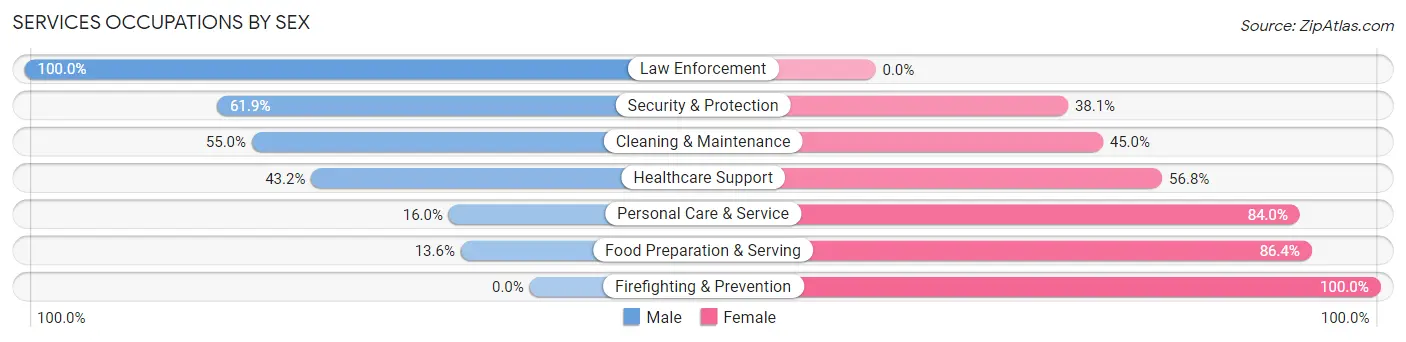
Services Occupations by Sex
Within the Services occupations in West Burlington, the most male-oriented occupations are Law Enforcement (100.0%), Security & Protection (61.9%), and Cleaning & Maintenance (55.0%), while the most female-oriented occupations are Firefighting & Prevention (100.0%), Food Preparation & Serving (86.4%), and Personal Care & Service (84.0%).
| Occupation | Male | Female |
| Healthcare Support | 64 (43.2%) | 84 (56.8%) |
| Security & Protection | 13 (61.9%) | 8 (38.1%) |
| Firefighting & Prevention | 0 (0.0%) | 8 (100.0%) |
| Law Enforcement | 13 (100.0%) | 0 (0.0%) |
| Food Preparation & Serving | 6 (13.6%) | 38 (86.4%) |
| Cleaning & Maintenance | 11 (55.0%) | 9 (45.0%) |
| Personal Care & Service | 8 (16.0%) | 42 (84.0%) |
| Total (Category) | 102 (36.0%) | 181 (64.0%) |
| Total (Overall) | 789 (53.7%) | 680 (46.3%) |
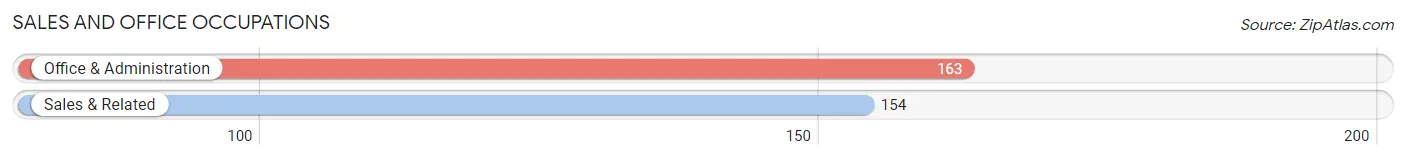
Sales and Office Occupations
The most common Sales and Office occupations in West Burlington are Office & Administration (163 | 11.1%), and Sales & Related (154 | 10.5%).
Sales and Office Occupations by Sex
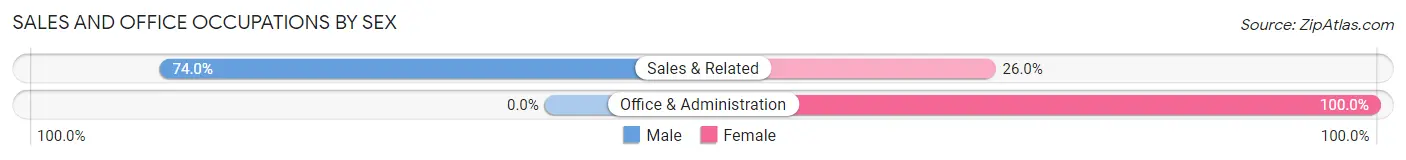
| Occupation | Male | Female |
| Sales & Related | 114 (74.0%) | 40 (26.0%) |
| Office & Administration | 0 (0.0%) | 163 (100.0%) |
| Total (Category) | 114 (36.0%) | 203 (64.0%) |
| Total (Overall) | 789 (53.7%) | 680 (46.3%) |
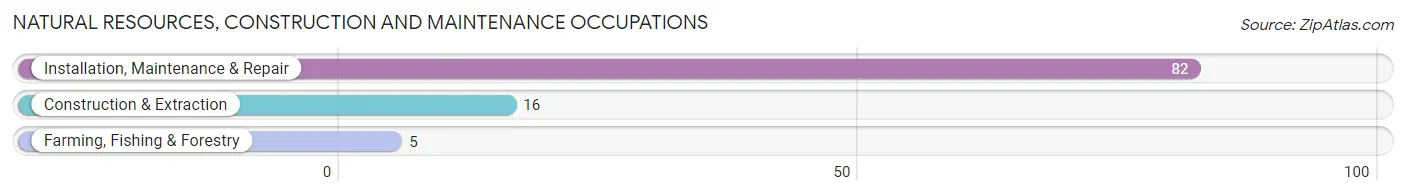
Natural Resources, Construction and Maintenance Occupations
The most common Natural Resources, Construction and Maintenance occupations in West Burlington are Installation, Maintenance & Repair (82 | 5.6%), Construction & Extraction (16 | 1.1%), and Farming, Fishing & Forestry (5 | 0.3%).
Natural Resources, Construction and Maintenance Occupations by Sex
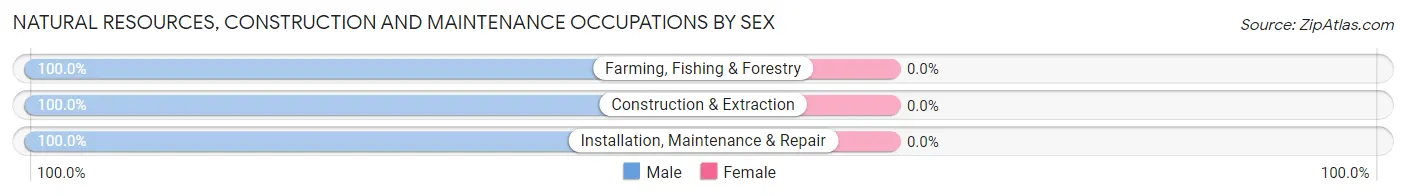
| Occupation | Male | Female |
| Farming, Fishing & Forestry | 5 (100.0%) | 0 (0.0%) |
| Construction & Extraction | 16 (100.0%) | 0 (0.0%) |
| Installation, Maintenance & Repair | 82 (100.0%) | 0 (0.0%) |
| Total (Category) | 103 (100.0%) | 0 (0.0%) |
| Total (Overall) | 789 (53.7%) | 680 (46.3%) |
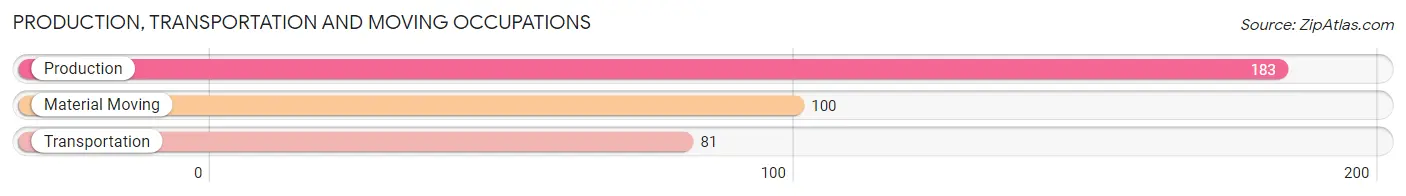
Production, Transportation and Moving Occupations
The most common Production, Transportation and Moving occupations in West Burlington are Production (183 | 12.5%), Material Moving (100 | 6.8%), and Transportation (81 | 5.5%).
Production, Transportation and Moving Occupations by Sex
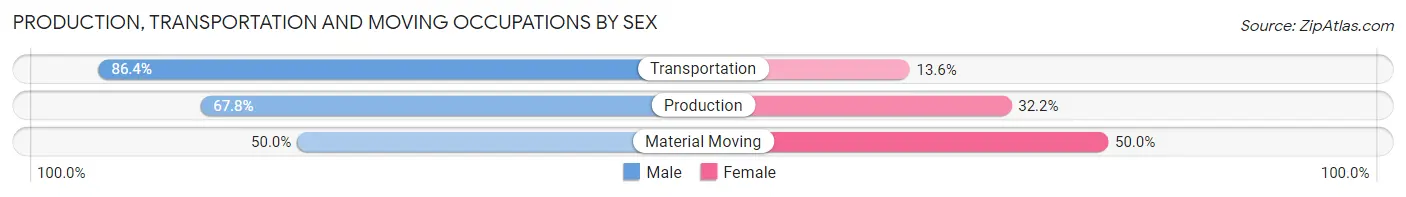
| Occupation | Male | Female |
| Production | 124 (67.8%) | 59 (32.2%) |
| Transportation | 70 (86.4%) | 11 (13.6%) |
| Material Moving | 50 (50.0%) | 50 (50.0%) |
| Total (Category) | 244 (67.0%) | 120 (33.0%) |
| Total (Overall) | 789 (53.7%) | 680 (46.3%) |
Employment Industries by Sex in West Burlington
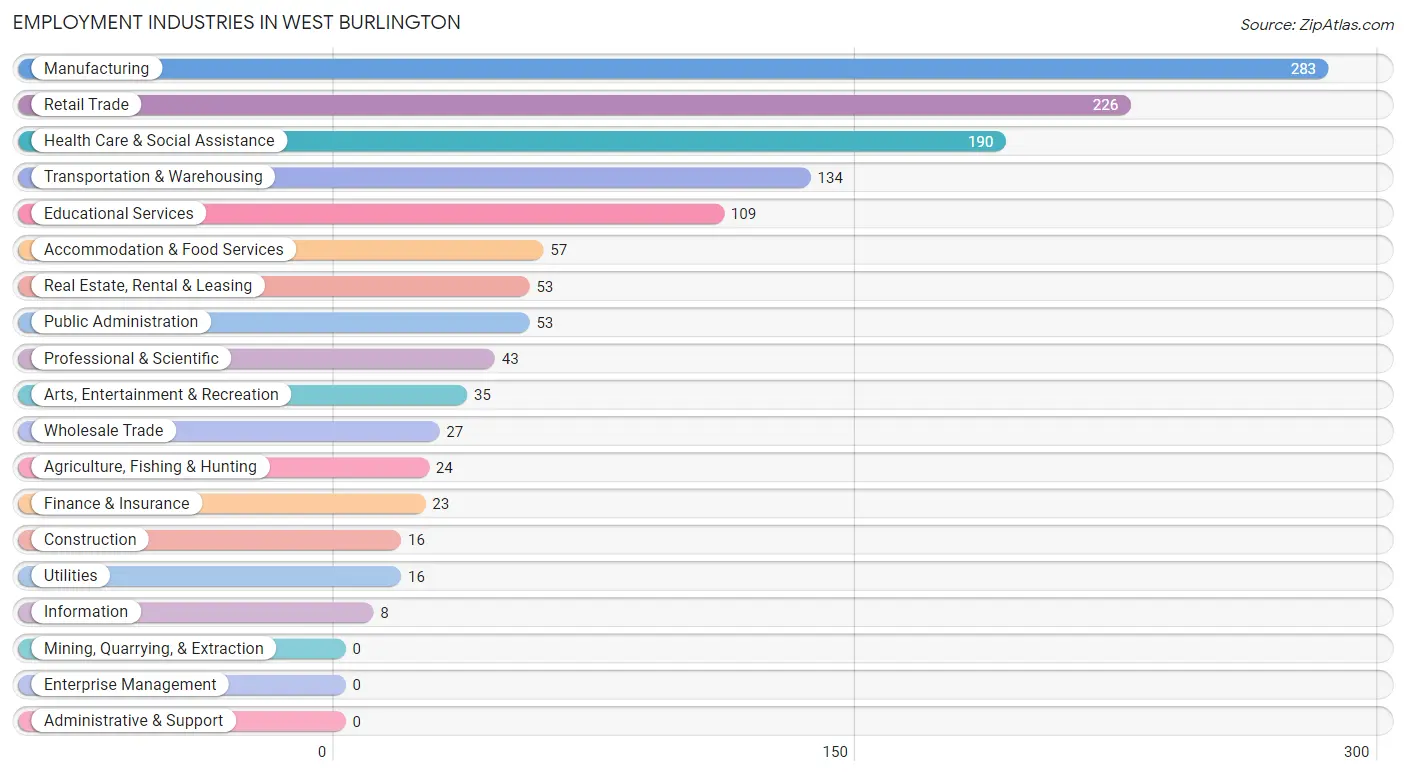
Employment Industries in West Burlington
The major employment industries in West Burlington include Manufacturing (283 | 19.3%), Retail Trade (226 | 15.4%), Health Care & Social Assistance (190 | 12.9%), Transportation & Warehousing (134 | 9.1%), and Educational Services (109 | 7.4%).
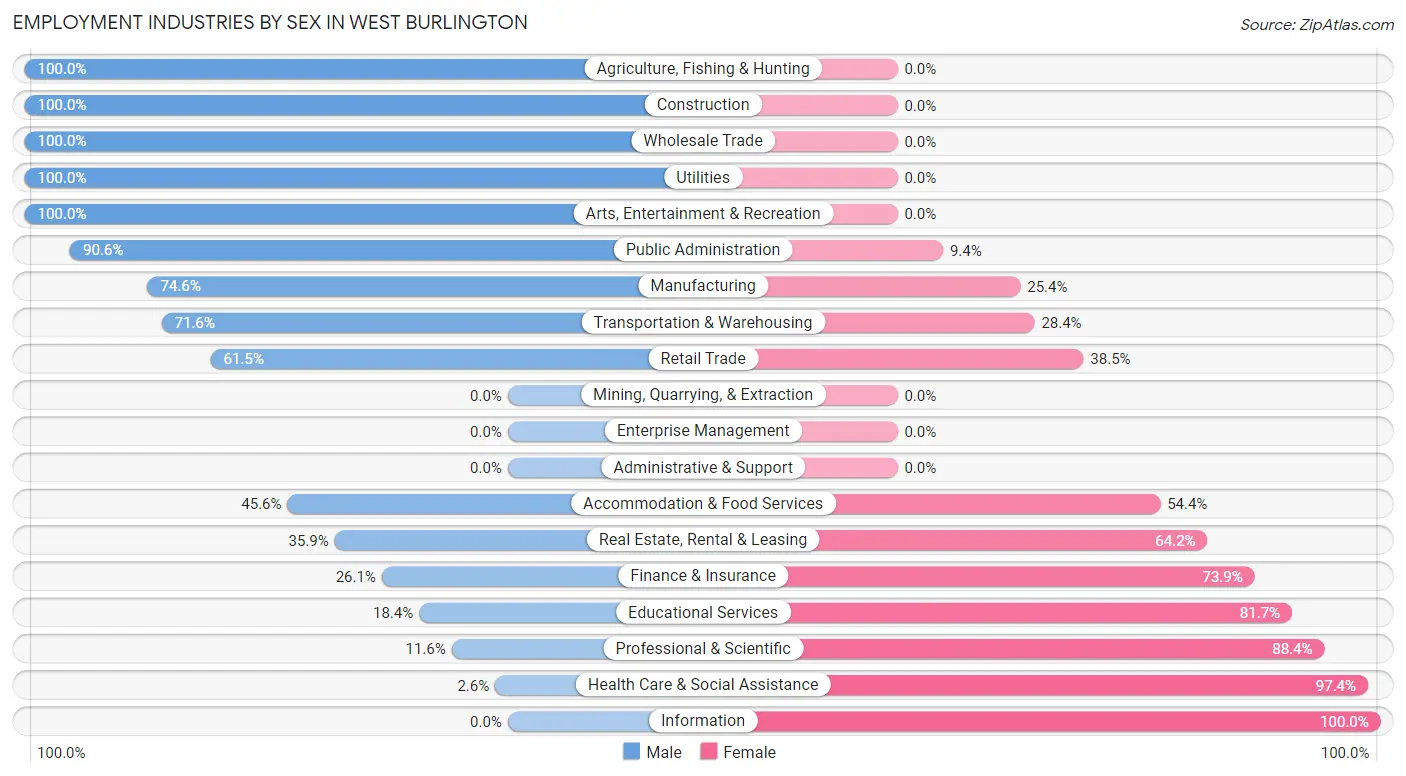
Employment Industries by Sex in West Burlington
The West Burlington industries that see more men than women are Agriculture, Fishing & Hunting (100.0%), Construction (100.0%), and Wholesale Trade (100.0%), whereas the industries that tend to have a higher number of women are Information (100.0%), Health Care & Social Assistance (97.4%), and Professional & Scientific (88.4%).
| Industry | Male | Female |
| Agriculture, Fishing & Hunting | 24 (100.0%) | 0 (0.0%) |
| Mining, Quarrying, & Extraction | 0 (0.0%) | 0 (0.0%) |
| Construction | 16 (100.0%) | 0 (0.0%) |
| Manufacturing | 211 (74.6%) | 72 (25.4%) |
| Wholesale Trade | 27 (100.0%) | 0 (0.0%) |
| Retail Trade | 139 (61.5%) | 87 (38.5%) |
| Transportation & Warehousing | 96 (71.6%) | 38 (28.4%) |
| Utilities | 16 (100.0%) | 0 (0.0%) |
| Information | 0 (0.0%) | 8 (100.0%) |
| Finance & Insurance | 6 (26.1%) | 17 (73.9%) |
| Real Estate, Rental & Leasing | 19 (35.8%) | 34 (64.1%) |
| Professional & Scientific | 5 (11.6%) | 38 (88.4%) |
| Enterprise Management | 0 (0.0%) | 0 (0.0%) |
| Administrative & Support | 0 (0.0%) | 0 (0.0%) |
| Educational Services | 20 (18.3%) | 89 (81.7%) |
| Health Care & Social Assistance | 5 (2.6%) | 185 (97.4%) |
| Arts, Entertainment & Recreation | 35 (100.0%) | 0 (0.0%) |
| Accommodation & Food Services | 26 (45.6%) | 31 (54.4%) |
| Public Administration | 48 (90.6%) | 5 (9.4%) |
| Total | 789 (53.7%) | 680 (46.3%) |
Education in West Burlington
School Enrollment in West Burlington
The most common levels of schooling among the 845 students in West Burlington are college / undergraduate (266 | 31.5%), middle school (188 | 22.3%), and high school (150 | 17.7%).
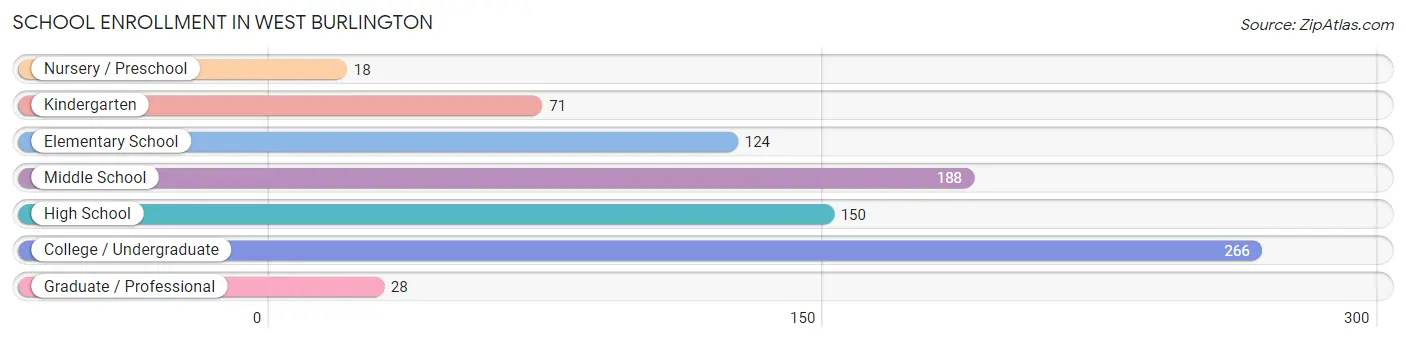
| School Level | # Students | % Students |
| Nursery / Preschool | 18 | 2.1% |
| Kindergarten | 71 | 8.4% |
| Elementary School | 124 | 14.7% |
| Middle School | 188 | 22.3% |
| High School | 150 | 17.7% |
| College / Undergraduate | 266 | 31.5% |
| Graduate / Professional | 28 | 3.3% |
| Total | 845 | 100.0% |
School Enrollment by Age by Funding Source in West Burlington
Out of a total of 845 students who are enrolled in schools in West Burlington, 62 (7.3%) attend a private institution, while the remaining 783 (92.7%) are enrolled in public schools. The age group of 25 to 34 year olds has the highest likelihood of being enrolled in private schools, with 28 (100.0% in the age bracket) enrolled. Conversely, the age group of 3 to 4 year olds has the lowest likelihood of being enrolled in a private school, with 10 (100.0% in the age bracket) attending a public institution.
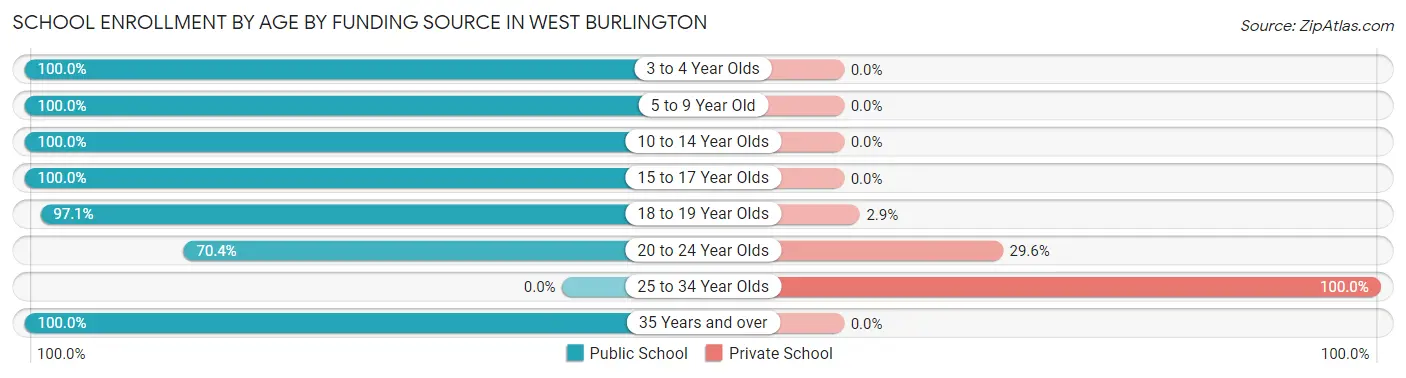
| Age Bracket | Public School | Private School |
| 3 to 4 Year Olds | 10 (100.0%) | 0 (0.0%) |
| 5 to 9 Year Old | 203 (100.0%) | 0 (0.0%) |
| 10 to 14 Year Olds | 188 (100.0%) | 0 (0.0%) |
| 15 to 17 Year Olds | 101 (100.0%) | 0 (0.0%) |
| 18 to 19 Year Olds | 165 (97.1%) | 5 (2.9%) |
| 20 to 24 Year Olds | 69 (70.4%) | 29 (29.6%) |
| 25 to 34 Year Olds | 0 (0.0%) | 28 (100.0%) |
| 35 Years and over | 47 (100.0%) | 0 (0.0%) |
| Total | 783 (92.7%) | 62 (7.3%) |
Educational Attainment by Field of Study in West Burlington
Engineering (154 | 28.8%), business (125 | 23.4%), education (52 | 9.7%), arts & humanities (49 | 9.2%), and bio, nature & agricultural (47 | 8.8%) are the most common fields of study among 534 individuals in West Burlington who have obtained a bachelor's degree or higher.
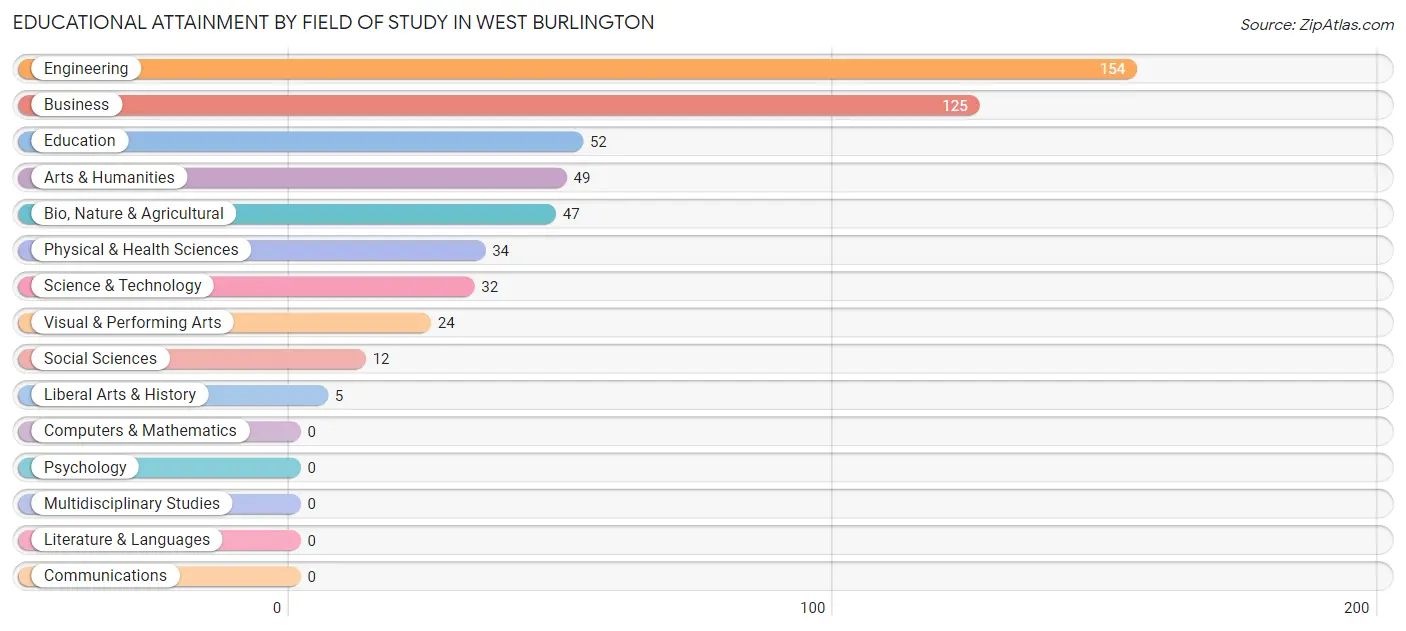
| Field of Study | # Graduates | % Graduates |
| Computers & Mathematics | 0 | 0.0% |
| Bio, Nature & Agricultural | 47 | 8.8% |
| Physical & Health Sciences | 34 | 6.4% |
| Psychology | 0 | 0.0% |
| Social Sciences | 12 | 2.2% |
| Engineering | 154 | 28.8% |
| Multidisciplinary Studies | 0 | 0.0% |
| Science & Technology | 32 | 6.0% |
| Business | 125 | 23.4% |
| Education | 52 | 9.7% |
| Literature & Languages | 0 | 0.0% |
| Liberal Arts & History | 5 | 0.9% |
| Visual & Performing Arts | 24 | 4.5% |
| Communications | 0 | 0.0% |
| Arts & Humanities | 49 | 9.2% |
| Total | 534 | 100.0% |
Transportation & Commute in West Burlington
Vehicle Availability by Sex in West Burlington
The most prevalent vehicle ownership categories in West Burlington are males with 5 or more vehicles (202, accounting for 26.8%) and females with 5 or more vehicles (72, making up 32.0%).
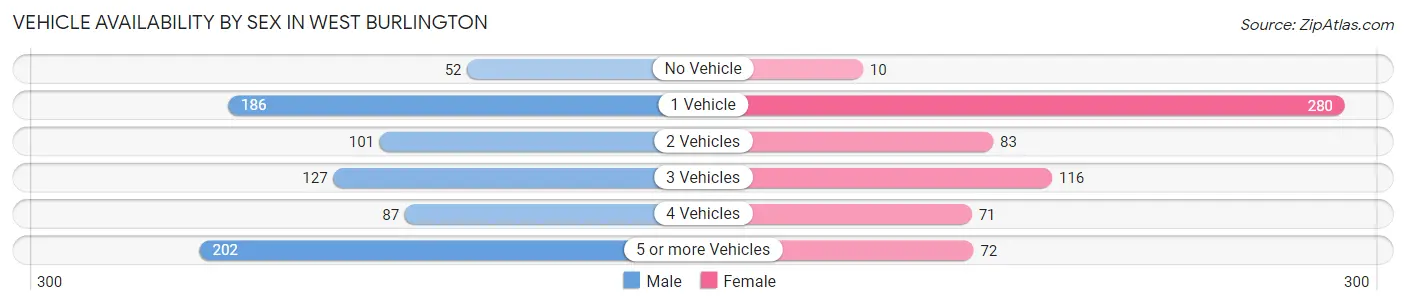
| Vehicles Available | Male | Female |
| No Vehicle | 52 (6.9%) | 10 (1.6%) |
| 1 Vehicle | 186 (24.6%) | 280 (44.3%) |
| 2 Vehicles | 101 (13.4%) | 83 (13.1%) |
| 3 Vehicles | 127 (16.8%) | 116 (18.3%) |
| 4 Vehicles | 87 (11.5%) | 71 (11.2%) |
| 5 or more Vehicles | 202 (26.8%) | 72 (11.4%) |
| Total | 755 (100.0%) | 632 (100.0%) |
Commute Time in West Burlington
The most frequently occuring commute durations in West Burlington are 5 to 9 minutes (362 commuters, 26.3%), 10 to 14 minutes (354 commuters, 25.7%), and 15 to 19 minutes (327 commuters, 23.8%).
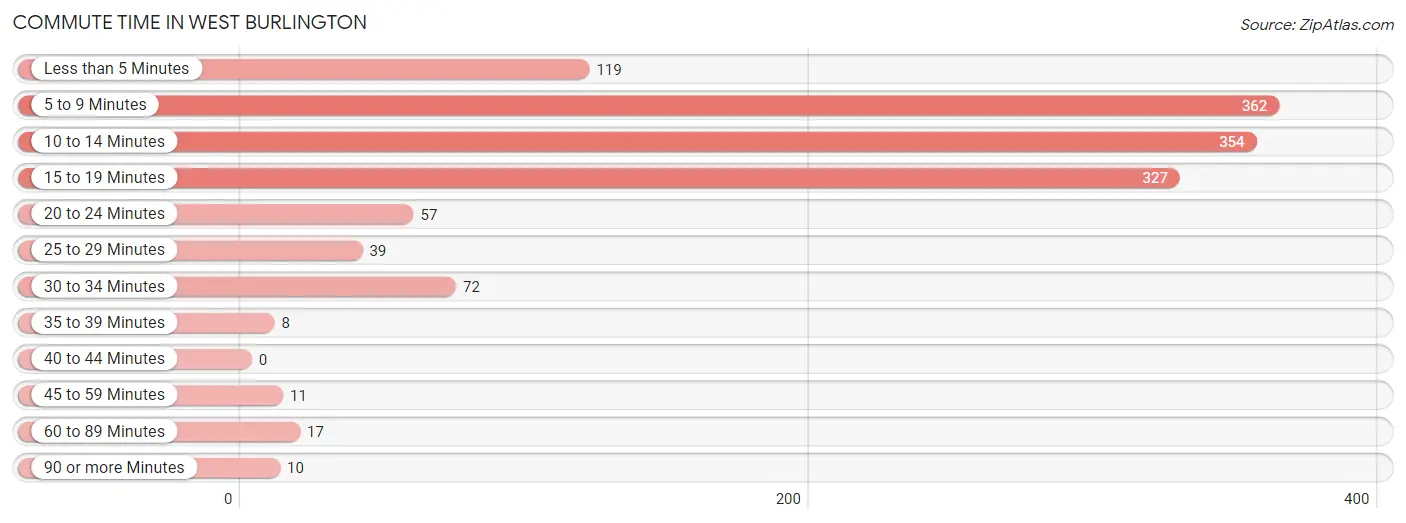
| Commute Time | # Commuters | % Commuters |
| Less than 5 Minutes | 119 | 8.6% |
| 5 to 9 Minutes | 362 | 26.3% |
| 10 to 14 Minutes | 354 | 25.7% |
| 15 to 19 Minutes | 327 | 23.8% |
| 20 to 24 Minutes | 57 | 4.1% |
| 25 to 29 Minutes | 39 | 2.8% |
| 30 to 34 Minutes | 72 | 5.2% |
| 35 to 39 Minutes | 8 | 0.6% |
| 40 to 44 Minutes | 0 | 0.0% |
| 45 to 59 Minutes | 11 | 0.8% |
| 60 to 89 Minutes | 17 | 1.2% |
| 90 or more Minutes | 10 | 0.7% |
Commute Time by Sex in West Burlington
The most common commute times in West Burlington are 15 to 19 minutes (249 commuters, 33.1%) for males and 10 to 14 minutes (194 commuters, 31.1%) for females.
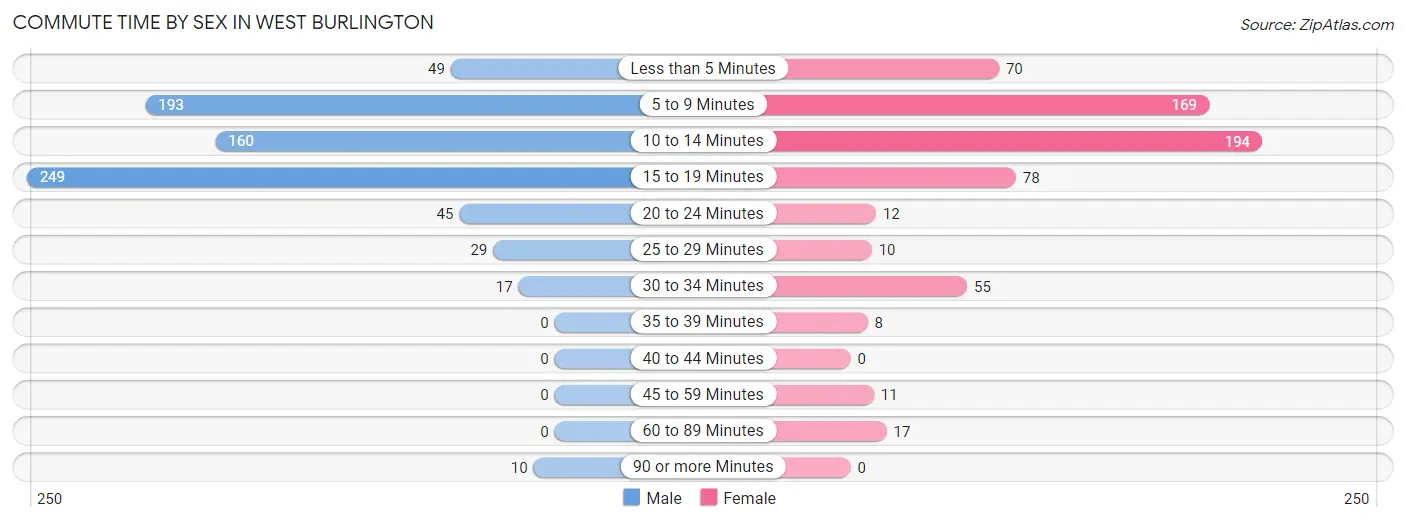
| Commute Time | Male | Female |
| Less than 5 Minutes | 49 (6.5%) | 70 (11.2%) |
| 5 to 9 Minutes | 193 (25.7%) | 169 (27.1%) |
| 10 to 14 Minutes | 160 (21.3%) | 194 (31.1%) |
| 15 to 19 Minutes | 249 (33.1%) | 78 (12.5%) |
| 20 to 24 Minutes | 45 (6.0%) | 12 (1.9%) |
| 25 to 29 Minutes | 29 (3.9%) | 10 (1.6%) |
| 30 to 34 Minutes | 17 (2.3%) | 55 (8.8%) |
| 35 to 39 Minutes | 0 (0.0%) | 8 (1.3%) |
| 40 to 44 Minutes | 0 (0.0%) | 0 (0.0%) |
| 45 to 59 Minutes | 0 (0.0%) | 11 (1.8%) |
| 60 to 89 Minutes | 0 (0.0%) | 17 (2.7%) |
| 90 or more Minutes | 10 (1.3%) | 0 (0.0%) |
Time of Departure to Work by Sex in West Burlington
The most frequent times of departure to work in West Burlington are 7:30 AM to 7:59 AM (160, 21.3%) for males and 8:00 AM to 8:29 AM (135, 21.6%) for females.
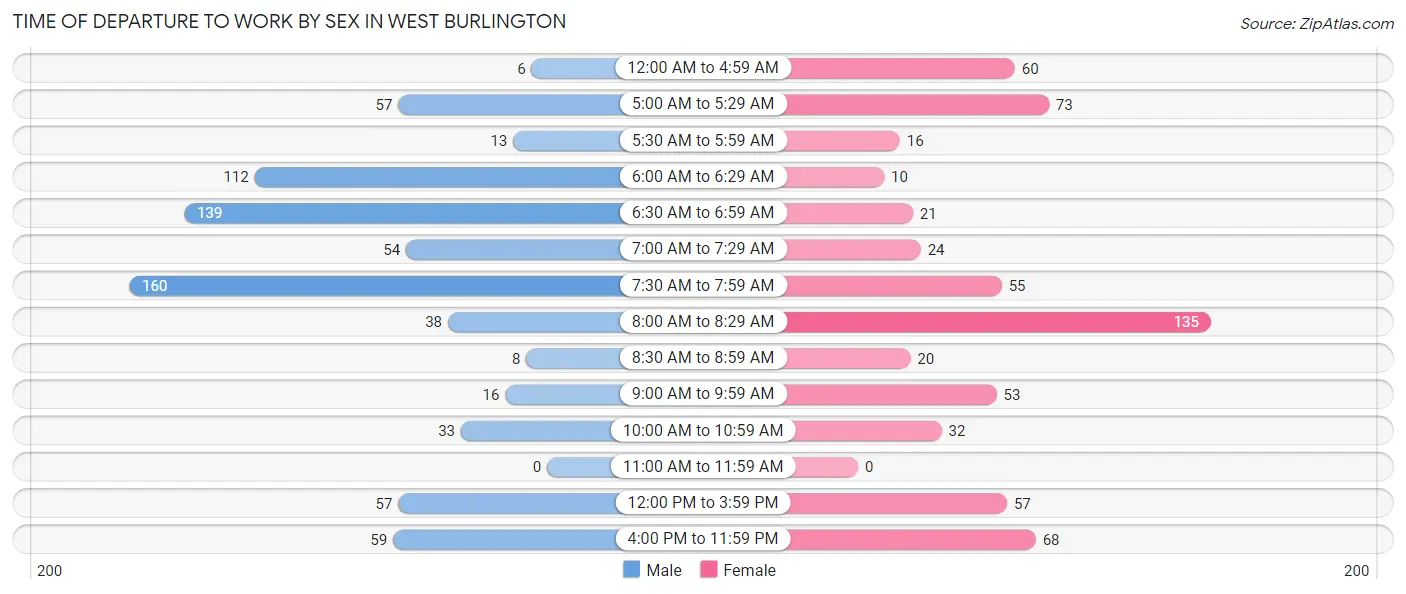
| Time of Departure | Male | Female |
| 12:00 AM to 4:59 AM | 6 (0.8%) | 60 (9.6%) |
| 5:00 AM to 5:29 AM | 57 (7.6%) | 73 (11.7%) |
| 5:30 AM to 5:59 AM | 13 (1.7%) | 16 (2.6%) |
| 6:00 AM to 6:29 AM | 112 (14.9%) | 10 (1.6%) |
| 6:30 AM to 6:59 AM | 139 (18.5%) | 21 (3.4%) |
| 7:00 AM to 7:29 AM | 54 (7.2%) | 24 (3.8%) |
| 7:30 AM to 7:59 AM | 160 (21.3%) | 55 (8.8%) |
| 8:00 AM to 8:29 AM | 38 (5.1%) | 135 (21.6%) |
| 8:30 AM to 8:59 AM | 8 (1.1%) | 20 (3.2%) |
| 9:00 AM to 9:59 AM | 16 (2.1%) | 53 (8.5%) |
| 10:00 AM to 10:59 AM | 33 (4.4%) | 32 (5.1%) |
| 11:00 AM to 11:59 AM | 0 (0.0%) | 0 (0.0%) |
| 12:00 PM to 3:59 PM | 57 (7.6%) | 57 (9.1%) |
| 4:00 PM to 11:59 PM | 59 (7.9%) | 68 (10.9%) |
| Total | 752 (100.0%) | 624 (100.0%) |
Housing Occupancy in West Burlington
Occupancy by Ownership in West Burlington
Of the total 1,267 dwellings in West Burlington, owner-occupied units account for 656 (51.8%), while renter-occupied units make up 611 (48.2%).
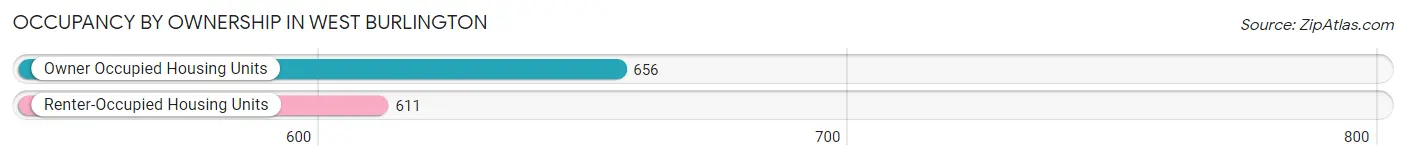
| Occupancy | # Housing Units | % Housing Units |
| Owner Occupied Housing Units | 656 | 51.8% |
| Renter-Occupied Housing Units | 611 | 48.2% |
| Total Occupied Housing Units | 1,267 | 100.0% |
Occupancy by Household Size in West Burlington
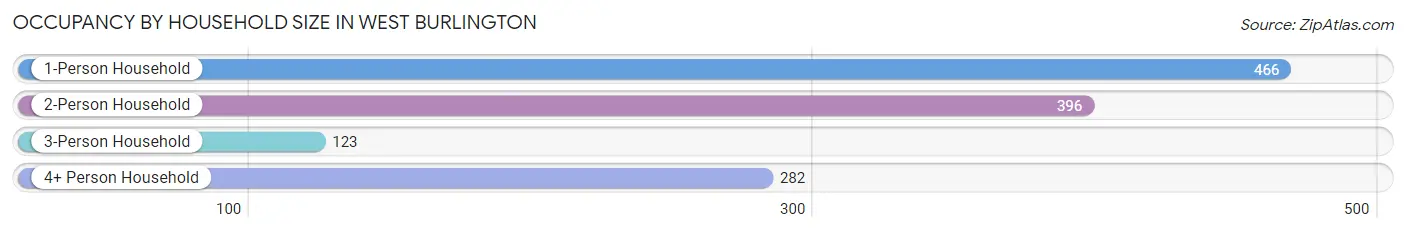
| Household Size | # Housing Units | % Housing Units |
| 1-Person Household | 466 | 36.8% |
| 2-Person Household | 396 | 31.2% |
| 3-Person Household | 123 | 9.7% |
| 4+ Person Household | 282 | 22.3% |
| Total Housing Units | 1,267 | 100.0% |
Occupancy by Ownership by Household Size in West Burlington
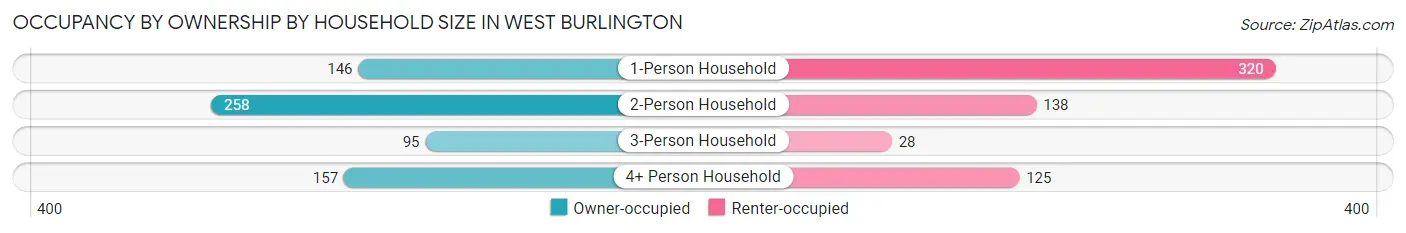
| Household Size | Owner-occupied | Renter-occupied |
| 1-Person Household | 146 (31.3%) | 320 (68.7%) |
| 2-Person Household | 258 (65.1%) | 138 (34.8%) |
| 3-Person Household | 95 (77.2%) | 28 (22.8%) |
| 4+ Person Household | 157 (55.7%) | 125 (44.3%) |
| Total Housing Units | 656 (51.8%) | 611 (48.2%) |
Occupancy by Educational Attainment in West Burlington
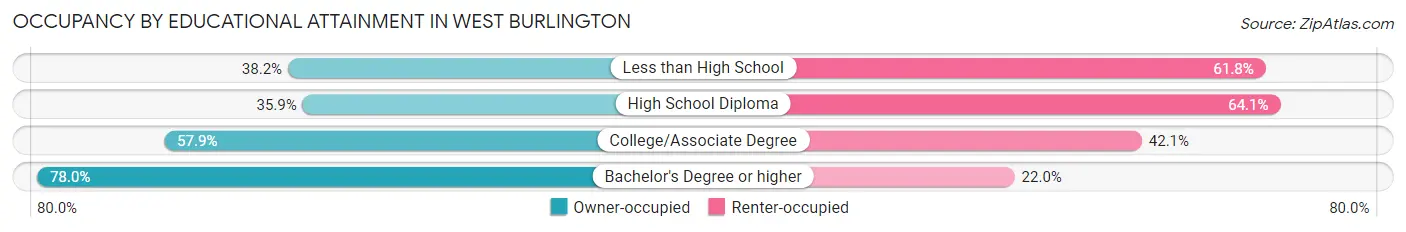
| Household Size | Owner-occupied | Renter-occupied |
| Less than High School | 39 (38.2%) | 63 (61.8%) |
| High School Diploma | 167 (35.9%) | 298 (64.1%) |
| College/Associate Degree | 276 (57.9%) | 201 (42.1%) |
| Bachelor's Degree or higher | 174 (78.0%) | 49 (22.0%) |
Occupancy by Age of Householder in West Burlington
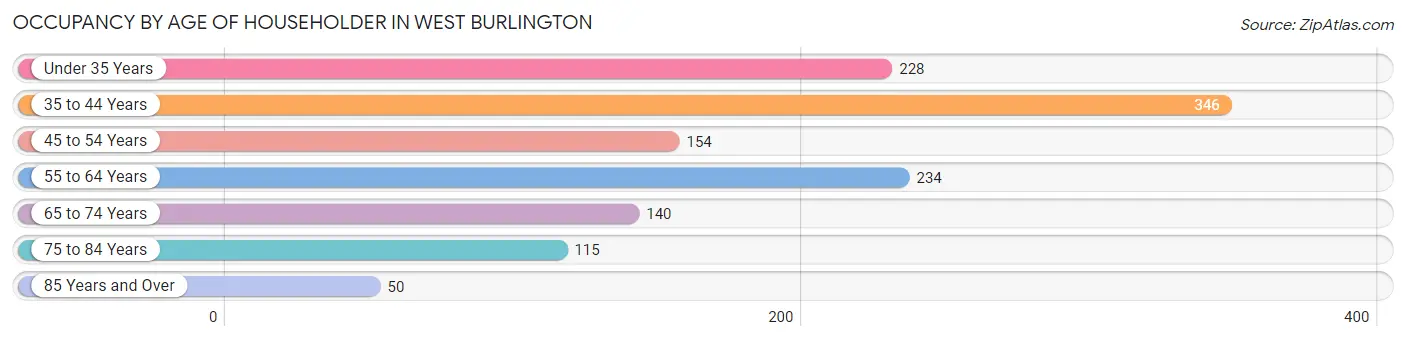
| Age Bracket | # Households | % Households |
| Under 35 Years | 228 | 18.0% |
| 35 to 44 Years | 346 | 27.3% |
| 45 to 54 Years | 154 | 12.1% |
| 55 to 64 Years | 234 | 18.5% |
| 65 to 74 Years | 140 | 11.1% |
| 75 to 84 Years | 115 | 9.1% |
| 85 Years and Over | 50 | 4.0% |
| Total | 1,267 | 100.0% |
Housing Finances in West Burlington
Median Income by Occupancy in West Burlington
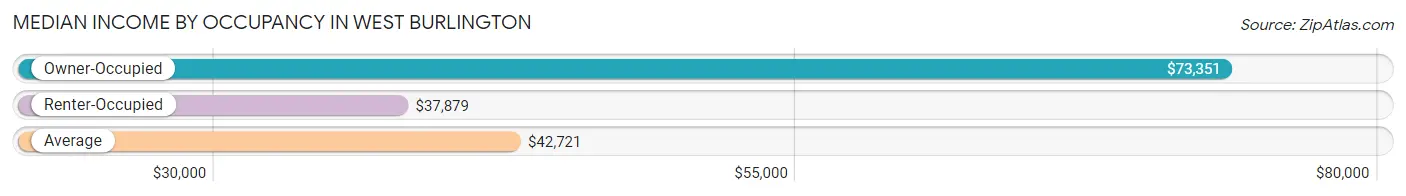
| Occupancy Type | # Households | Median Income |
| Owner-Occupied | 656 (51.8%) | $73,351 |
| Renter-Occupied | 611 (48.2%) | $37,879 |
| Average | 1,267 (100.0%) | $42,721 |
Occupancy by Householder Income Bracket in West Burlington
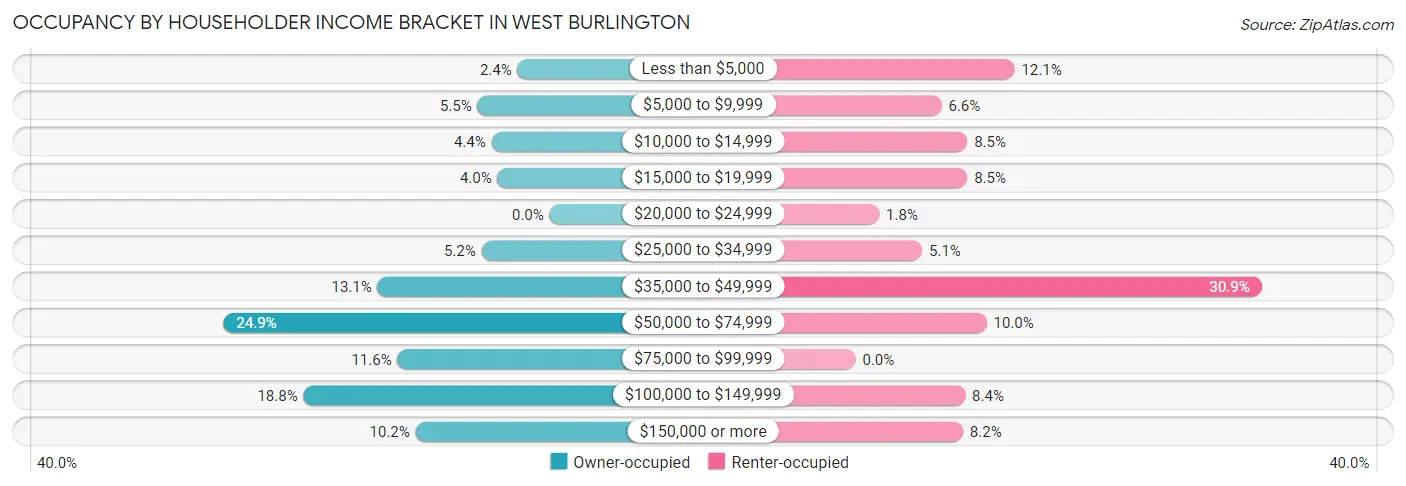
| Income Bracket | Owner-occupied | Renter-occupied |
| Less than $5,000 | 16 (2.4%) | 74 (12.1%) |
| $5,000 to $9,999 | 36 (5.5%) | 40 (6.6%) |
| $10,000 to $14,999 | 29 (4.4%) | 52 (8.5%) |
| $15,000 to $19,999 | 26 (4.0%) | 52 (8.5%) |
| $20,000 to $24,999 | 0 (0.0%) | 11 (1.8%) |
| $25,000 to $34,999 | 34 (5.2%) | 31 (5.1%) |
| $35,000 to $49,999 | 86 (13.1%) | 189 (30.9%) |
| $50,000 to $74,999 | 163 (24.8%) | 61 (10.0%) |
| $75,000 to $99,999 | 76 (11.6%) | 0 (0.0%) |
| $100,000 to $149,999 | 123 (18.8%) | 51 (8.4%) |
| $150,000 or more | 67 (10.2%) | 50 (8.2%) |
| Total | 656 (100.0%) | 611 (100.0%) |
Monthly Housing Cost Tiers in West Burlington
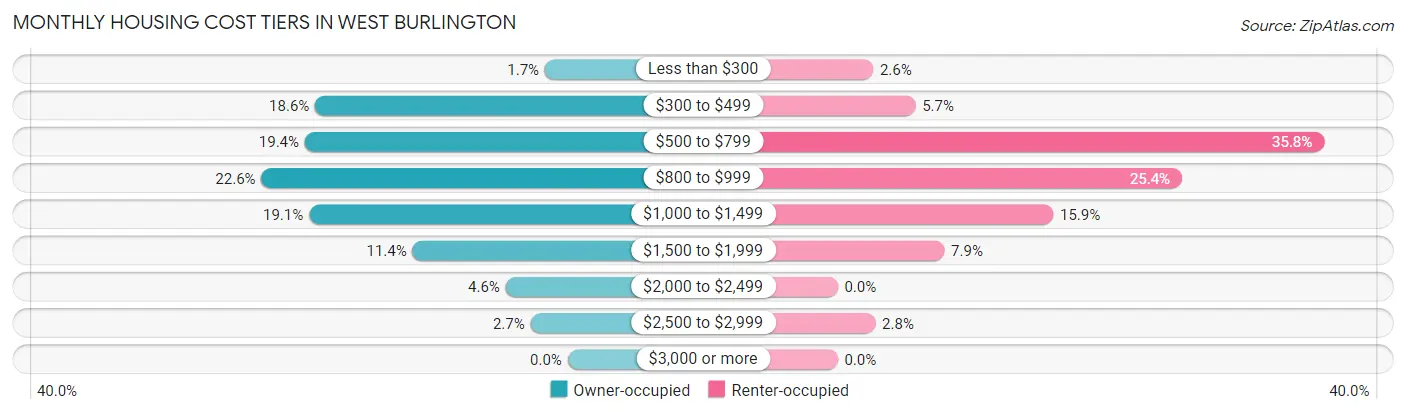
| Monthly Cost | Owner-occupied | Renter-occupied |
| Less than $300 | 11 (1.7%) | 16 (2.6%) |
| $300 to $499 | 122 (18.6%) | 35 (5.7%) |
| $500 to $799 | 127 (19.4%) | 219 (35.8%) |
| $800 to $999 | 148 (22.6%) | 155 (25.4%) |
| $1,000 to $1,499 | 125 (19.1%) | 97 (15.9%) |
| $1,500 to $1,999 | 75 (11.4%) | 48 (7.9%) |
| $2,000 to $2,499 | 30 (4.6%) | 0 (0.0%) |
| $2,500 to $2,999 | 18 (2.7%) | 17 (2.8%) |
| $3,000 or more | 0 (0.0%) | 0 (0.0%) |
| Total | 656 (100.0%) | 611 (100.0%) |
Physical Housing Characteristics in West Burlington
Housing Structures in West Burlington
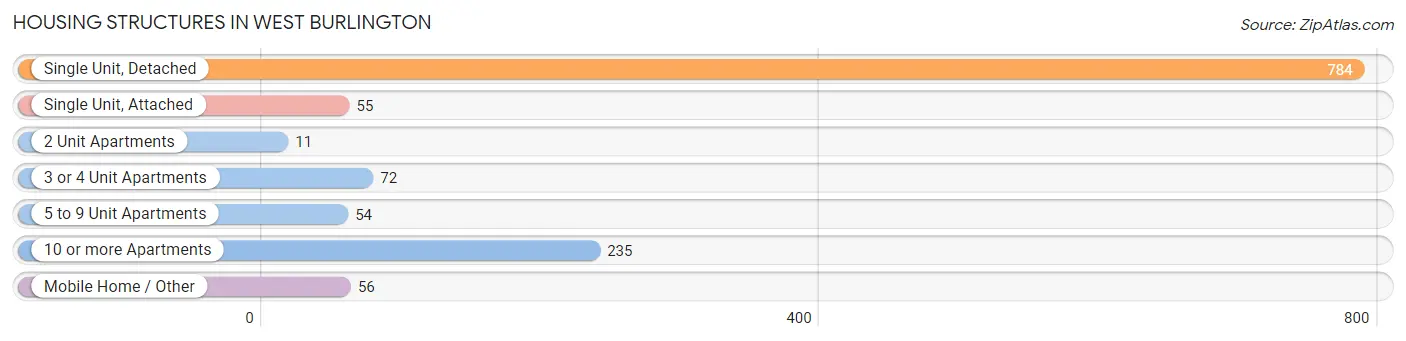
| Structure Type | # Housing Units | % Housing Units |
| Single Unit, Detached | 784 | 61.9% |
| Single Unit, Attached | 55 | 4.3% |
| 2 Unit Apartments | 11 | 0.9% |
| 3 or 4 Unit Apartments | 72 | 5.7% |
| 5 to 9 Unit Apartments | 54 | 4.3% |
| 10 or more Apartments | 235 | 18.5% |
| Mobile Home / Other | 56 | 4.4% |
| Total | 1,267 | 100.0% |
Housing Structures by Occupancy in West Burlington
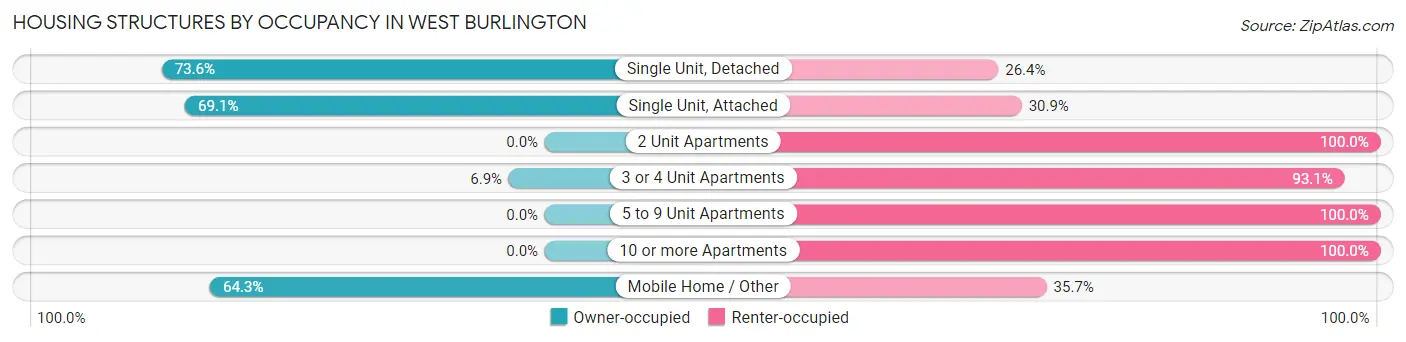
| Structure Type | Owner-occupied | Renter-occupied |
| Single Unit, Detached | 577 (73.6%) | 207 (26.4%) |
| Single Unit, Attached | 38 (69.1%) | 17 (30.9%) |
| 2 Unit Apartments | 0 (0.0%) | 11 (100.0%) |
| 3 or 4 Unit Apartments | 5 (6.9%) | 67 (93.1%) |
| 5 to 9 Unit Apartments | 0 (0.0%) | 54 (100.0%) |
| 10 or more Apartments | 0 (0.0%) | 235 (100.0%) |
| Mobile Home / Other | 36 (64.3%) | 20 (35.7%) |
| Total | 656 (51.8%) | 611 (48.2%) |
Housing Structures by Number of Rooms in West Burlington
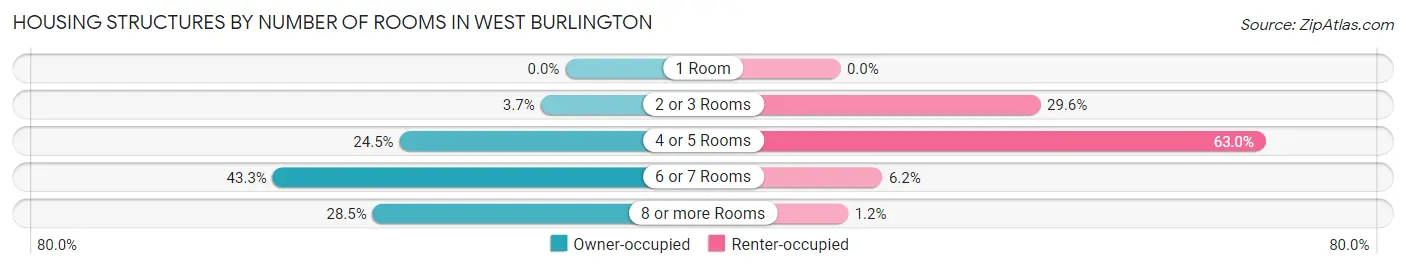
| Number of Rooms | Owner-occupied | Renter-occupied |
| 1 Room | 0 (0.0%) | 0 (0.0%) |
| 2 or 3 Rooms | 24 (3.7%) | 181 (29.6%) |
| 4 or 5 Rooms | 161 (24.5%) | 385 (63.0%) |
| 6 or 7 Rooms | 284 (43.3%) | 38 (6.2%) |
| 8 or more Rooms | 187 (28.5%) | 7 (1.1%) |
| Total | 656 (100.0%) | 611 (100.0%) |
Housing Structure by Heating Type in West Burlington
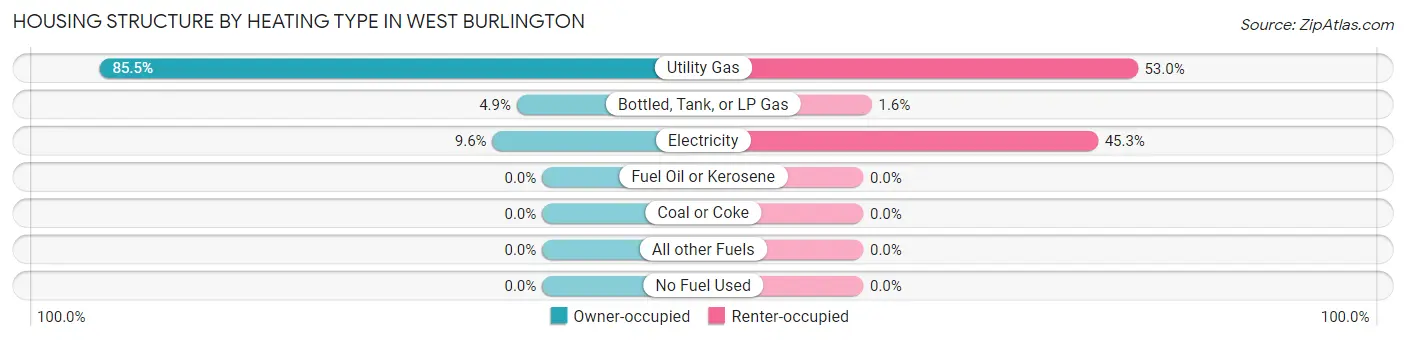
| Heating Type | Owner-occupied | Renter-occupied |
| Utility Gas | 561 (85.5%) | 324 (53.0%) |
| Bottled, Tank, or LP Gas | 32 (4.9%) | 10 (1.6%) |
| Electricity | 63 (9.6%) | 277 (45.3%) |
| Fuel Oil or Kerosene | 0 (0.0%) | 0 (0.0%) |
| Coal or Coke | 0 (0.0%) | 0 (0.0%) |
| All other Fuels | 0 (0.0%) | 0 (0.0%) |
| No Fuel Used | 0 (0.0%) | 0 (0.0%) |
| Total | 656 (100.0%) | 611 (100.0%) |
Household Vehicle Usage in West Burlington
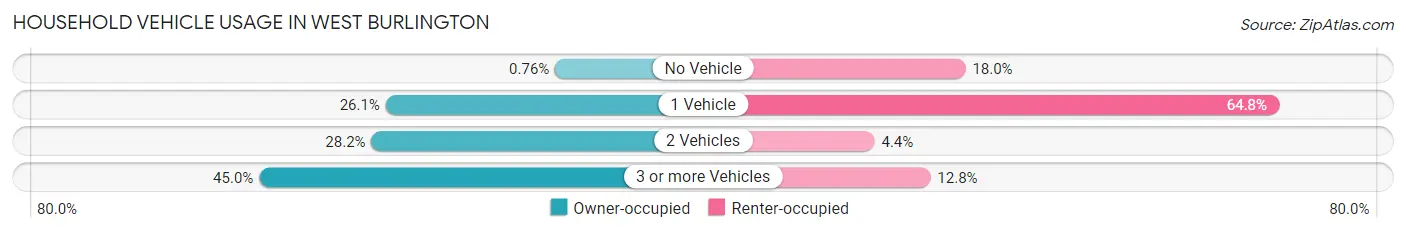
| Vehicles per Household | Owner-occupied | Renter-occupied |
| No Vehicle | 5 (0.8%) | 110 (18.0%) |
| 1 Vehicle | 171 (26.1%) | 396 (64.8%) |
| 2 Vehicles | 185 (28.2%) | 27 (4.4%) |
| 3 or more Vehicles | 295 (45.0%) | 78 (12.8%) |
| Total | 656 (100.0%) | 611 (100.0%) |
Real Estate & Mortgages in West Burlington
Real Estate and Mortgage Overview in West Burlington
| Characteristic | Without Mortgage | With Mortgage |
| Housing Units | 246 | 410 |
| Median Property Value | $110,600 | $144,100 |
| Median Household Income | $55,208 | $37 |
| Monthly Housing Costs | $491 | $0 |
| Real Estate Taxes | $1,873 | $6 |
Property Value by Mortgage Status in West Burlington
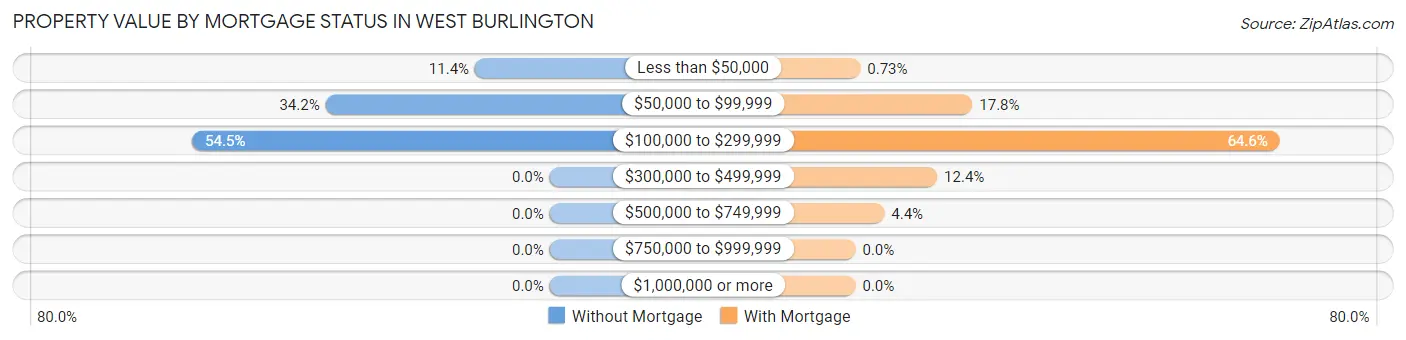
| Property Value | Without Mortgage | With Mortgage |
| Less than $50,000 | 28 (11.4%) | 3 (0.7%) |
| $50,000 to $99,999 | 84 (34.2%) | 73 (17.8%) |
| $100,000 to $299,999 | 134 (54.5%) | 265 (64.6%) |
| $300,000 to $499,999 | 0 (0.0%) | 51 (12.4%) |
| $500,000 to $749,999 | 0 (0.0%) | 18 (4.4%) |
| $750,000 to $999,999 | 0 (0.0%) | 0 (0.0%) |
| $1,000,000 or more | 0 (0.0%) | 0 (0.0%) |
| Total | 246 (100.0%) | 410 (100.0%) |
Household Income by Mortgage Status in West Burlington
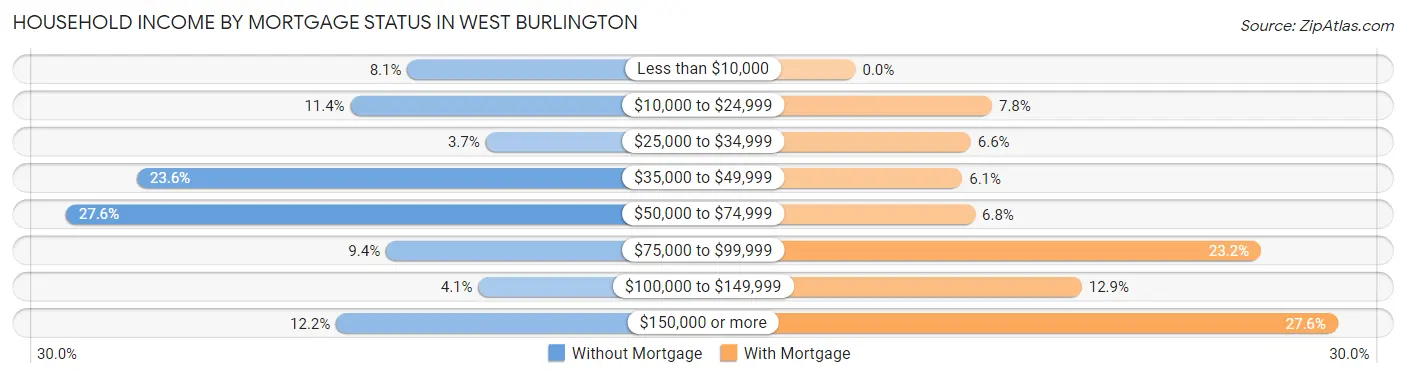
| Household Income | Without Mortgage | With Mortgage |
| Less than $10,000 | 20 (8.1%) | 0 (0.0%) |
| $10,000 to $24,999 | 28 (11.4%) | 32 (7.8%) |
| $25,000 to $34,999 | 9 (3.7%) | 27 (6.6%) |
| $35,000 to $49,999 | 58 (23.6%) | 25 (6.1%) |
| $50,000 to $74,999 | 68 (27.6%) | 28 (6.8%) |
| $75,000 to $99,999 | 23 (9.3%) | 95 (23.2%) |
| $100,000 to $149,999 | 10 (4.1%) | 53 (12.9%) |
| $150,000 or more | 30 (12.2%) | 113 (27.6%) |
| Total | 246 (100.0%) | 410 (100.0%) |
Property Value to Household Income Ratio in West Burlington
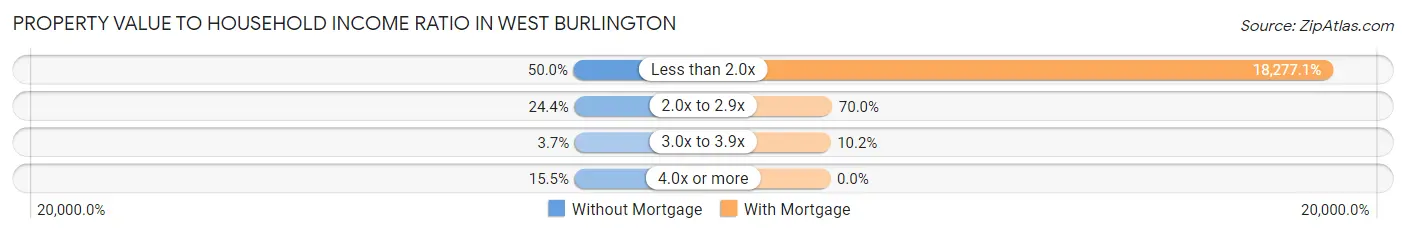
| Value-to-Income Ratio | Without Mortgage | With Mortgage |
| Less than 2.0x | 123 (50.0%) | 74,936 (18,277.1%) |
| 2.0x to 2.9x | 60 (24.4%) | 287 (70.0%) |
| 3.0x to 3.9x | 9 (3.7%) | 42 (10.2%) |
| 4.0x or more | 38 (15.4%) | 0 (0.0%) |
| Total | 246 (100.0%) | 410 (100.0%) |
Real Estate Taxes by Mortgage Status in West Burlington
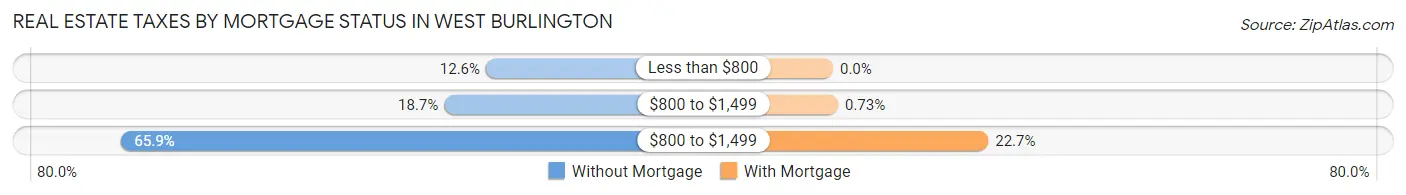
| Property Taxes | Without Mortgage | With Mortgage |
| Less than $800 | 31 (12.6%) | 0 (0.0%) |
| $800 to $1,499 | 46 (18.7%) | 3 (0.7%) |
| $800 to $1,499 | 162 (65.8%) | 93 (22.7%) |
| Total | 246 (100.0%) | 410 (100.0%) |
Health & Disability in West Burlington
Health Insurance Coverage by Age in West Burlington
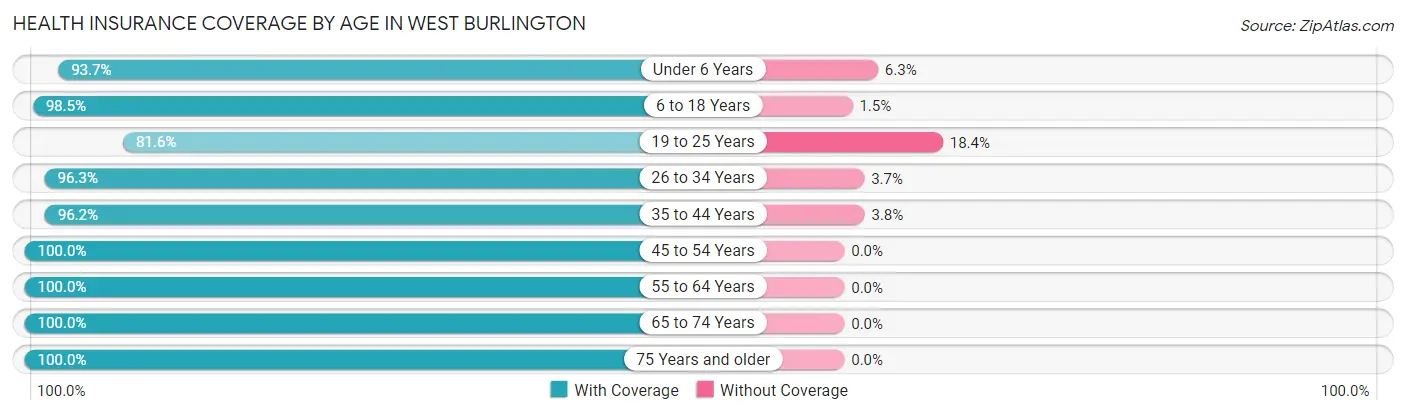
| Age Bracket | With Coverage | Without Coverage |
| Under 6 Years | 254 (93.7%) | 17 (6.3%) |
| 6 to 18 Years | 585 (98.5%) | 9 (1.5%) |
| 19 to 25 Years | 271 (81.6%) | 61 (18.4%) |
| 26 to 34 Years | 259 (96.3%) | 10 (3.7%) |
| 35 to 44 Years | 485 (96.2%) | 19 (3.8%) |
| 45 to 54 Years | 303 (100.0%) | 0 (0.0%) |
| 55 to 64 Years | 316 (100.0%) | 0 (0.0%) |
| 65 to 74 Years | 193 (100.0%) | 0 (0.0%) |
| 75 Years and older | 243 (100.0%) | 0 (0.0%) |
| Total | 2,909 (96.2%) | 116 (3.8%) |
Health Insurance Coverage by Citizenship Status in West Burlington
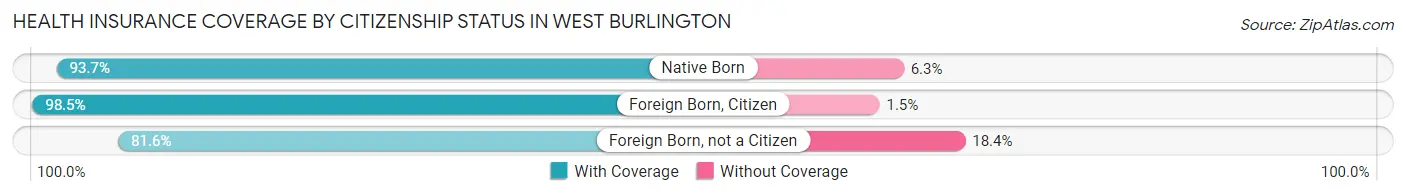
| Citizenship Status | With Coverage | Without Coverage |
| Native Born | 254 (93.7%) | 17 (6.3%) |
| Foreign Born, Citizen | 585 (98.5%) | 9 (1.5%) |
| Foreign Born, not a Citizen | 271 (81.6%) | 61 (18.4%) |
Health Insurance Coverage by Household Income in West Burlington
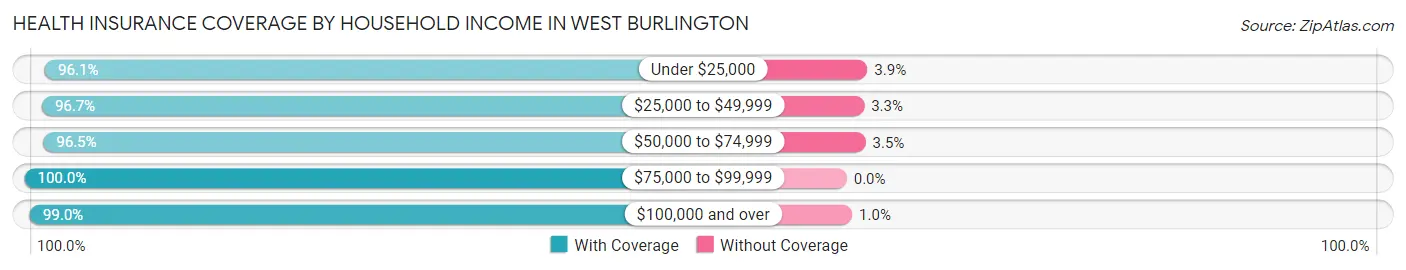
| Household Income | With Coverage | Without Coverage |
| Under $25,000 | 523 (96.1%) | 21 (3.9%) |
| $25,000 to $49,999 | 563 (96.7%) | 19 (3.3%) |
| $50,000 to $74,999 | 466 (96.5%) | 17 (3.5%) |
| $75,000 to $99,999 | 396 (100.0%) | 0 (0.0%) |
| $100,000 and over | 890 (99.0%) | 9 (1.0%) |
Public vs Private Health Insurance Coverage by Age in West Burlington
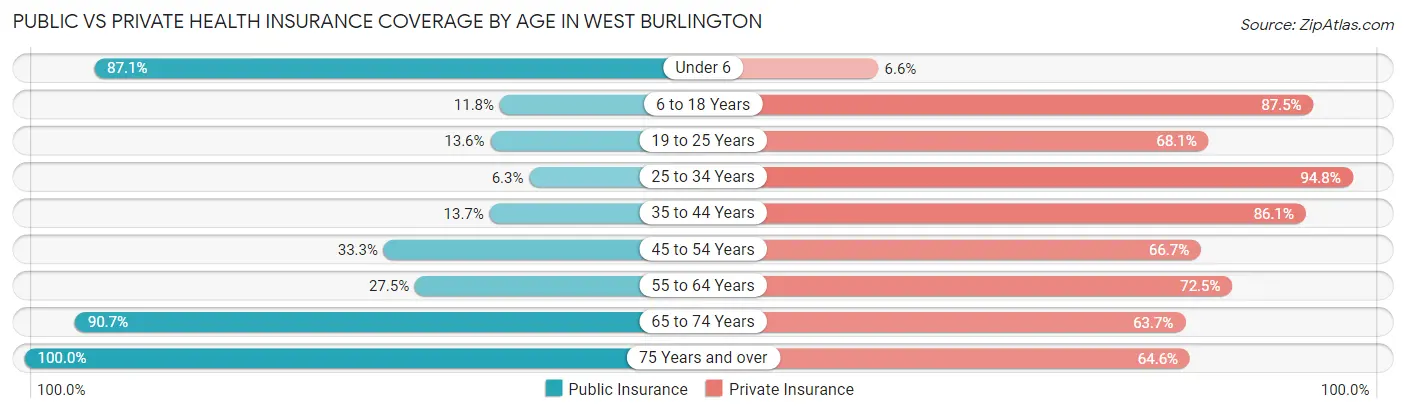
| Age Bracket | Public Insurance | Private Insurance |
| Under 6 | 236 (87.1%) | 18 (6.6%) |
| 6 to 18 Years | 70 (11.8%) | 520 (87.5%) |
| 19 to 25 Years | 45 (13.6%) | 226 (68.1%) |
| 25 to 34 Years | 17 (6.3%) | 255 (94.8%) |
| 35 to 44 Years | 69 (13.7%) | 434 (86.1%) |
| 45 to 54 Years | 101 (33.3%) | 202 (66.7%) |
| 55 to 64 Years | 87 (27.5%) | 229 (72.5%) |
| 65 to 74 Years | 175 (90.7%) | 123 (63.7%) |
| 75 Years and over | 243 (100.0%) | 157 (64.6%) |
| Total | 1,043 (34.5%) | 2,164 (71.5%) |
Disability Status by Sex by Age in West Burlington
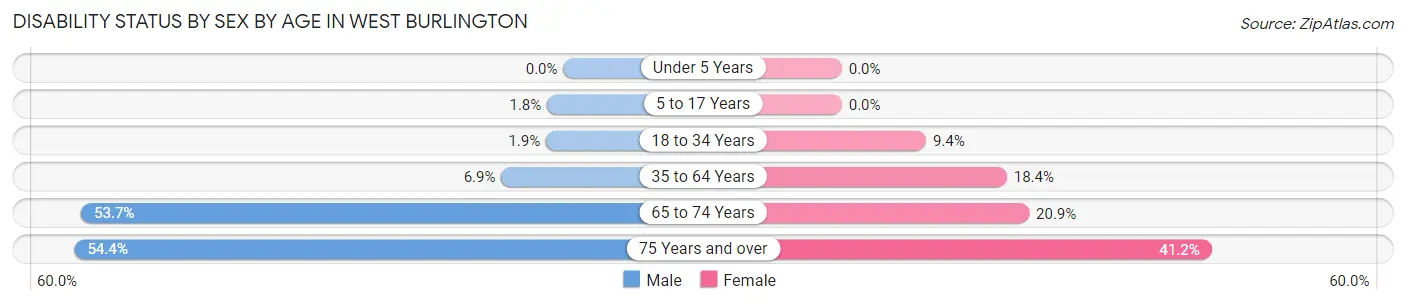
| Age Bracket | Male | Female |
| Under 5 Years | 0 (0.0%) | 0 (0.0%) |
| 5 to 17 Years | 5 (1.8%) | 0 (0.0%) |
| 18 to 34 Years | 10 (1.9%) | 21 (9.4%) |
| 35 to 64 Years | 34 (6.9%) | 116 (18.4%) |
| 65 to 74 Years | 29 (53.7%) | 29 (20.9%) |
| 75 Years and over | 49 (54.4%) | 63 (41.2%) |
Disability Class by Sex by Age in West Burlington
Disability Class: Hearing Difficulty
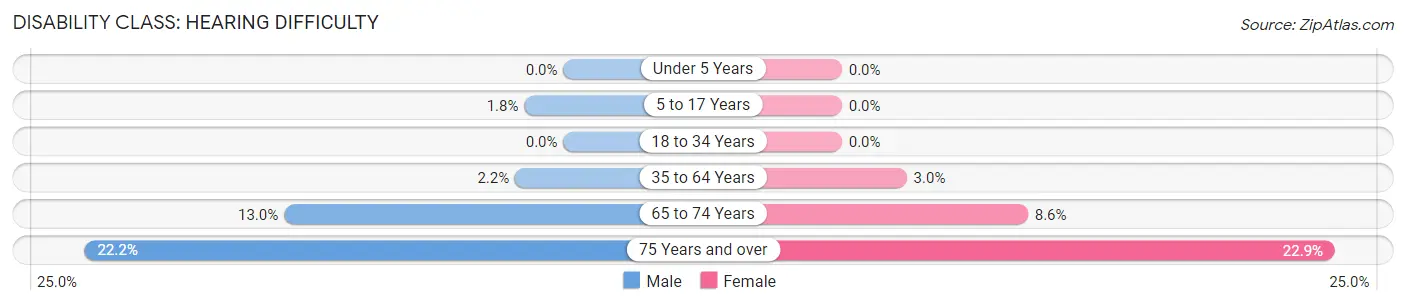
| Age Bracket | Male | Female |
| Under 5 Years | 0 (0.0%) | 0 (0.0%) |
| 5 to 17 Years | 5 (1.8%) | 0 (0.0%) |
| 18 to 34 Years | 0 (0.0%) | 0 (0.0%) |
| 35 to 64 Years | 11 (2.2%) | 19 (3.0%) |
| 65 to 74 Years | 7 (13.0%) | 12 (8.6%) |
| 75 Years and over | 20 (22.2%) | 35 (22.9%) |
Disability Class: Vision Difficulty
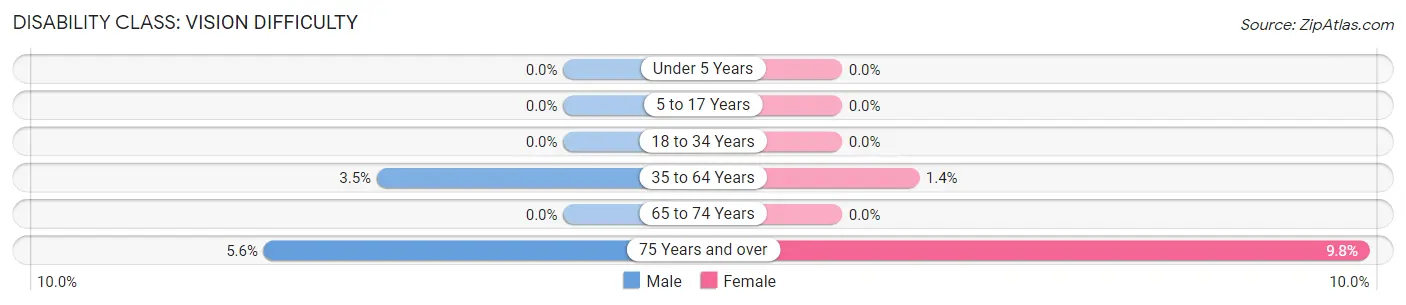
| Age Bracket | Male | Female |
| Under 5 Years | 0 (0.0%) | 0 (0.0%) |
| 5 to 17 Years | 0 (0.0%) | 0 (0.0%) |
| 18 to 34 Years | 0 (0.0%) | 0 (0.0%) |
| 35 to 64 Years | 17 (3.5%) | 9 (1.4%) |
| 65 to 74 Years | 0 (0.0%) | 0 (0.0%) |
| 75 Years and over | 5 (5.6%) | 15 (9.8%) |
Disability Class: Cognitive Difficulty
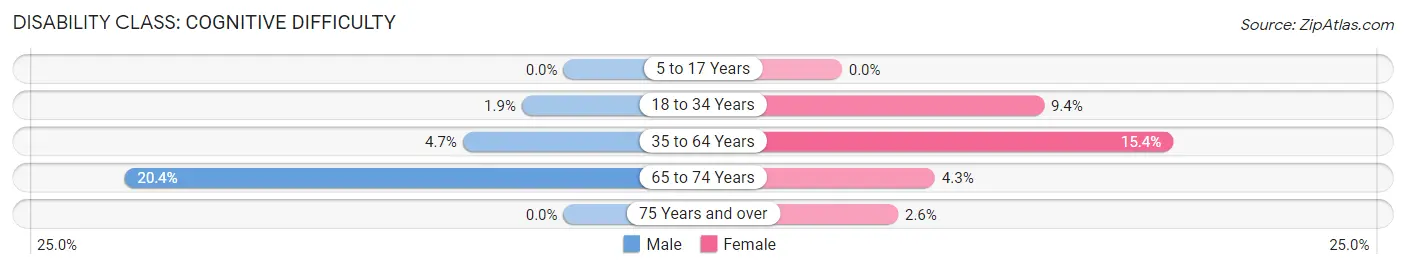
| Age Bracket | Male | Female |
| 5 to 17 Years | 0 (0.0%) | 0 (0.0%) |
| 18 to 34 Years | 10 (1.9%) | 21 (9.4%) |
| 35 to 64 Years | 23 (4.7%) | 97 (15.4%) |
| 65 to 74 Years | 11 (20.4%) | 6 (4.3%) |
| 75 Years and over | 0 (0.0%) | 4 (2.6%) |
Disability Class: Ambulatory Difficulty
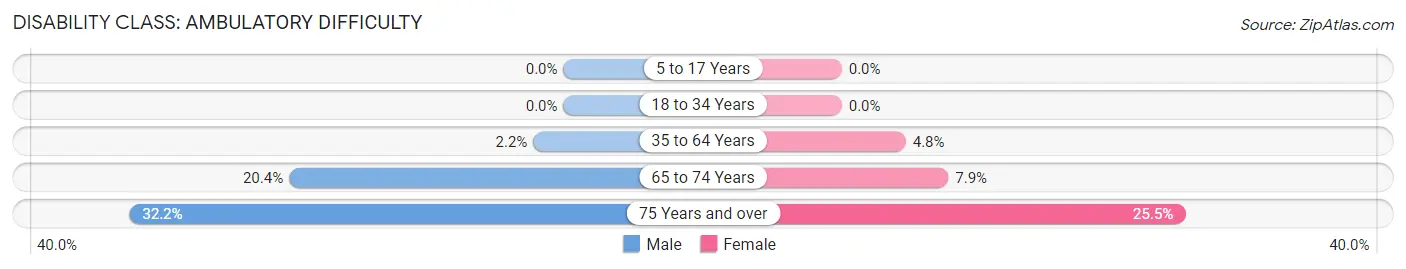
| Age Bracket | Male | Female |
| 5 to 17 Years | 0 (0.0%) | 0 (0.0%) |
| 18 to 34 Years | 0 (0.0%) | 0 (0.0%) |
| 35 to 64 Years | 11 (2.2%) | 30 (4.8%) |
| 65 to 74 Years | 11 (20.4%) | 11 (7.9%) |
| 75 Years and over | 29 (32.2%) | 39 (25.5%) |
Disability Class: Self-Care Difficulty
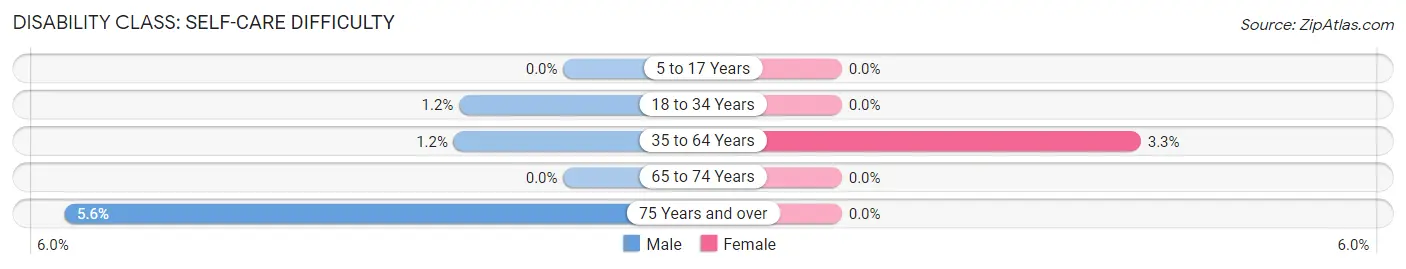
| Age Bracket | Male | Female |
| 5 to 17 Years | 0 (0.0%) | 0 (0.0%) |
| 18 to 34 Years | 6 (1.2%) | 0 (0.0%) |
| 35 to 64 Years | 6 (1.2%) | 21 (3.3%) |
| 65 to 74 Years | 0 (0.0%) | 0 (0.0%) |
| 75 Years and over | 5 (5.6%) | 0 (0.0%) |
Technology Access in West Burlington
Computing Device Access in West Burlington
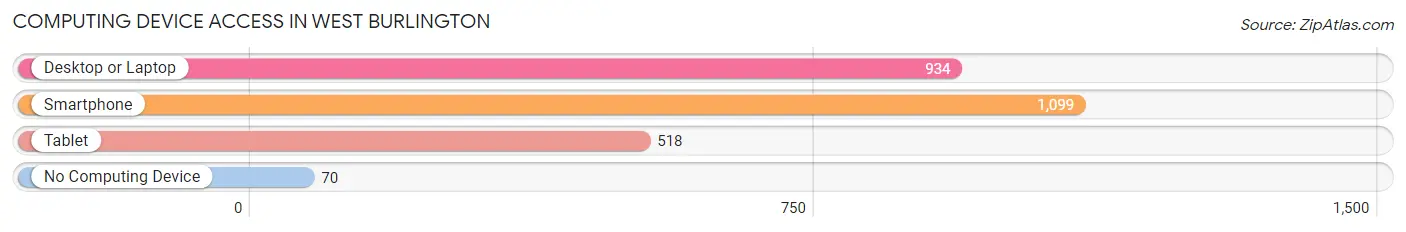
| Device Type | # Households | % Households |
| Desktop or Laptop | 934 | 73.7% |
| Smartphone | 1,099 | 86.7% |
| Tablet | 518 | 40.9% |
| No Computing Device | 70 | 5.5% |
| Total | 1,267 | 100.0% |
Internet Access in West Burlington
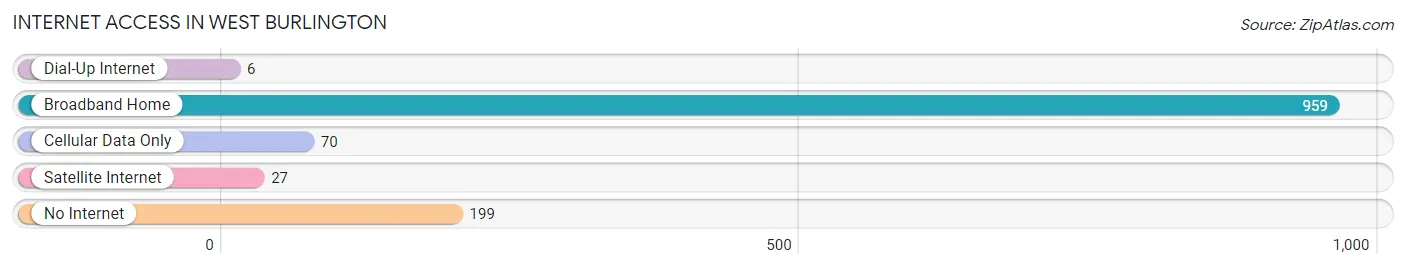
| Internet Type | # Households | % Households |
| Dial-Up Internet | 6 | 0.5% |
| Broadband Home | 959 | 75.7% |
| Cellular Data Only | 70 | 5.5% |
| Satellite Internet | 27 | 2.1% |
| No Internet | 199 | 15.7% |
| Total | 1,267 | 100.0% |
West Burlington Summary
Burlington, Iowa is a city located in Des Moines County, Iowa, United States. It is the county seat of Des Moines County and the largest city in the state of Iowa. The population was 25,663 at the 2010 census, making it the largest city in the state. Burlington is the center of a micropolitan area including West Burlington, Iowa and Middletown, Iowa, and is part of the Greater Burlington area which encompasses all of Des Moines County, Iowa.
History
Burlington was founded in 1833 by settlers from Burlington, Vermont. The city was named after the Vermont city, and was the first city in Iowa to be named after a city in another state. The city was incorporated in 1837 and became the county seat of Des Moines County in 1838.
The city grew rapidly in the 19th century, and by the turn of the century it had become a major industrial center. The city was home to several large factories, including the Burlington Car Works, which produced railroad cars, and the Burlington Iron Works, which produced iron and steel products. The city also had a large number of breweries, including the Burlington Brewing Company, which was the largest brewery in the state.
In the early 20th century, the city was a major center for the manufacture of agricultural equipment, including tractors and combines. The city was also home to several large meatpacking plants, including the Burlington Packing Company, which was the largest meatpacking plant in the state.
The city was also home to several large manufacturing companies, including the Burlington Manufacturing Company, which produced a variety of products, including furniture, clothing, and toys. The city was also home to several large retail stores, including the Burlington Department Store, which was the largest department store in the state.
Geography
Burlington is located in southeastern Iowa, at the intersection of U.S. Route 34 and Iowa Highway 61. The city is situated on the banks of the Mississippi River, and is located approximately 100 miles (160 km) south of Des Moines, the state capital.
The city has a total area of 16.2 square miles (41.8 km2), of which 15.9 square miles (41.2 km2) is land and 0.3 square miles (0.8 km2) is water. The city is located in the Central Lowland region of the Midwest, and is part of the Driftless Area, which is characterized by its rolling hills and valleys.
Economy
Burlington is a major industrial center, and is home to several large manufacturing companies, including the Burlington Manufacturing Company, which produces a variety of products, including furniture, clothing, and toys. The city is also home to several large retail stores, including the Burlington Department Store, which is the largest department store in the state.
The city is also home to several large meatpacking plants, including the Burlington Packing Company, which is the largest meatpacking plant in the state. The city is also home to several large breweries, including the Burlington Brewing Company, which is the largest brewery in the state.
The city is also home to several large agricultural equipment manufacturers, including the Burlington Tractor Company, which produces tractors and combines. The city is also home to several large food processing companies, including the Burlington Food Company, which produces a variety of food products.
Demographics
As of the 2010 census, the population of Burlington was 25,663. The racial makeup of the city was 87.3% White, 8.2% African American, 0.4% Native American, 1.2% Asian, 0.1% Pacific Islander, 0.7% from other races, and 2.1% from two or more races. Hispanic or Latino of any race were 2.7% of the population.
The median income for a household in the city was $37,945, and the median income for a family was $45,945. The per capita income for the city was $20,945. About 11.3% of families and 14.2% of the population were below the poverty line, including 20.2% of those under age 18 and 8.2% of those age 65 or over.
Common Questions
What is Per Capita Income in West Burlington?
Per Capita income in West Burlington is $30,264.
What is the Median Family Income in West Burlington?
Median Family Income in West Burlington is $70,417.
What is the Median Household income in West Burlington?
Median Household Income in West Burlington is $42,721.
What is Income or Wage Gap in West Burlington?
Income or Wage Gap in West Burlington is 20.9%.
Women in West Burlington earn 79.1 cents for every dollar earned by a man.
What is Inequality or Gini Index in West Burlington?
Inequality or Gini Index in West Burlington is 0.54.
What is the Total Population of West Burlington?
Total Population of West Burlington is 3,184.
What is the Total Male Population of West Burlington?
Total Male Population of West Burlington is 1,714.
What is the Total Female Population of West Burlington?
Total Female Population of West Burlington is 1,470.
What is the Ratio of Males per 100 Females in West Burlington?
There are 116.60 Males per 100 Females in West Burlington.
What is the Ratio of Females per 100 Males in West Burlington?
There are 85.76 Females per 100 Males in West Burlington.
What is the Median Population Age in West Burlington?
Median Population Age in West Burlington is 38.3 Years.
What is the Average Family Size in West Burlington
Average Family Size in West Burlington is 3.0 People.
What is the Average Household Size in West Burlington
Average Household Size in West Burlington is 2.3 People.
How Large is the Labor Force in West Burlington?
There are 1,491 People in the Labor Forcein in West Burlington.
What is the Percentage of People in the Labor Force in West Burlington?
58.2% of People are in the Labor Force in West Burlington.
What is the Unemployment Rate in West Burlington?
Unemployment Rate in West Burlington is 1.5%.