Allison, IA Map & Demographics
Allison Map
Allison Overview
$34,878
PER CAPITA INCOME
$92,222
AVG FAMILY INCOME
$61,458
AVG HOUSEHOLD INCOME
17.1%
WAGE / INCOME GAP [ % ]
82.9¢/ $1
WAGE / INCOME GAP [ $ ]
0.43
INEQUALITY / GINI INDEX
980
TOTAL POPULATION
522
MALE POPULATION
458
FEMALE POPULATION
113.97
MALES / 100 FEMALES
87.74
FEMALES / 100 MALES
45.3
MEDIAN AGE
2.8
AVG FAMILY SIZE
2.1
AVG HOUSEHOLD SIZE
500
LABOR FORCE [ PEOPLE ]
59.6%
PERCENT IN LABOR FORCE
0.6%
UNEMPLOYMENT RATE
Allison Zip Codes
Allison Area Codes
Income in Allison
Income Overview in Allison
Per Capita Income in Allison is $34,878, while median incomes of families and households are $92,222 and $61,458 respectively.
| Characteristic | Number | Measure |
| Per Capita Income | 980 | $34,878 |
| Median Family Income | 244 | $92,222 |
| Mean Family Income | 244 | $99,222 |
| Median Household Income | 437 | $61,458 |
| Mean Household Income | 437 | $72,569 |
| Income Deficit | 244 | $0 |
| Wage / Income Gap (%) | 980 | 17.13% |
| Wage / Income Gap ($) | 980 | 82.87¢ per $1 |
| Gini / Inequality Index | 980 | 0.43 |
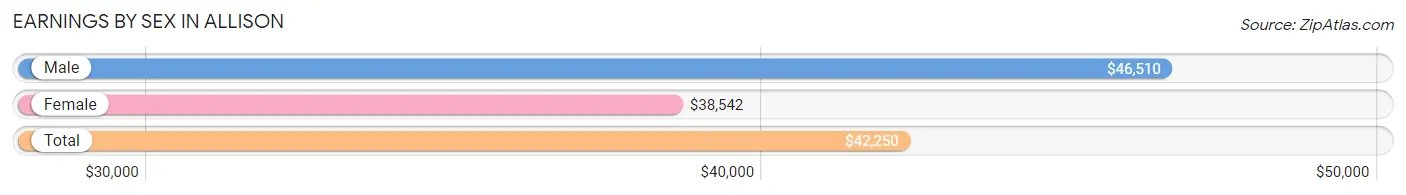
Earnings by Sex in Allison
Average Earnings in Allison are $42,250, $46,510 for men and $38,542 for women, a difference of 17.1%.
| Sex | Number | Average Earnings |
| Male | 307 (57.3%) | $46,510 |
| Female | 229 (42.7%) | $38,542 |
| Total | 536 (100.0%) | $42,250 |
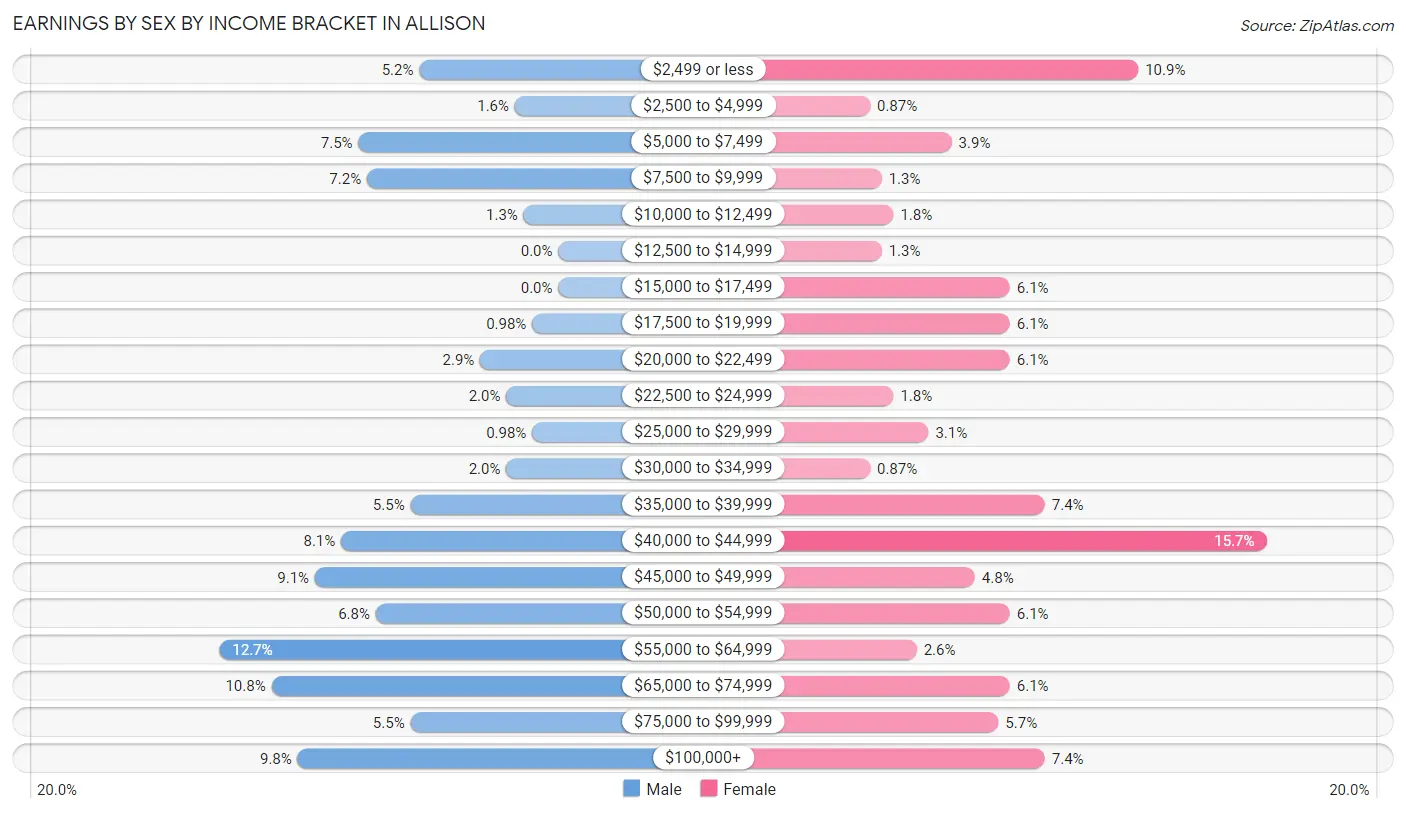
Earnings by Sex by Income Bracket in Allison
The most common earnings brackets in Allison are $55,000 to $64,999 for men (39 | 12.7%) and $40,000 to $44,999 for women (36 | 15.7%).
| Income | Male | Female |
| $2,499 or less | 16 (5.2%) | 25 (10.9%) |
| $2,500 to $4,999 | 5 (1.6%) | 2 (0.9%) |
| $5,000 to $7,499 | 23 (7.5%) | 9 (3.9%) |
| $7,500 to $9,999 | 22 (7.2%) | 3 (1.3%) |
| $10,000 to $12,499 | 4 (1.3%) | 4 (1.8%) |
| $12,500 to $14,999 | 0 (0.0%) | 3 (1.3%) |
| $15,000 to $17,499 | 0 (0.0%) | 14 (6.1%) |
| $17,500 to $19,999 | 3 (1.0%) | 14 (6.1%) |
| $20,000 to $22,499 | 9 (2.9%) | 14 (6.1%) |
| $22,500 to $24,999 | 6 (1.9%) | 4 (1.8%) |
| $25,000 to $29,999 | 3 (1.0%) | 7 (3.1%) |
| $30,000 to $34,999 | 6 (1.9%) | 2 (0.9%) |
| $35,000 to $39,999 | 17 (5.5%) | 17 (7.4%) |
| $40,000 to $44,999 | 25 (8.1%) | 36 (15.7%) |
| $45,000 to $49,999 | 28 (9.1%) | 11 (4.8%) |
| $50,000 to $54,999 | 21 (6.8%) | 14 (6.1%) |
| $55,000 to $64,999 | 39 (12.7%) | 6 (2.6%) |
| $65,000 to $74,999 | 33 (10.7%) | 14 (6.1%) |
| $75,000 to $99,999 | 17 (5.5%) | 13 (5.7%) |
| $100,000+ | 30 (9.8%) | 17 (7.4%) |
| Total | 307 (100.0%) | 229 (100.0%) |
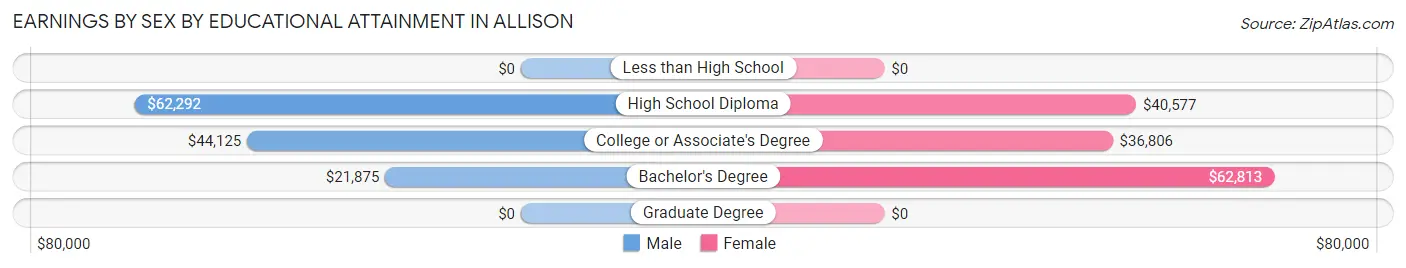
Earnings by Sex by Educational Attainment in Allison
Average earnings in Allison are $48,125 for men and $40,300 for women, a difference of 16.3%. Men with an educational attainment of high school diploma enjoy the highest average annual earnings of $62,292, while those with bachelor's degree education earn the least with $21,875. Women with an educational attainment of bachelor's degree earn the most with the average annual earnings of $62,813, while those with college or associate's degree education have the smallest earnings of $36,806.
| Educational Attainment | Male Income | Female Income |
| Less than High School | - | - |
| High School Diploma | $62,292 | $40,577 |
| College or Associate's Degree | $44,125 | $36,806 |
| Bachelor's Degree | $21,875 | $62,813 |
| Graduate Degree | - | - |
| Total | $48,125 | $40,300 |
Family Income in Allison
Family Income Brackets in Allison
According to the Allison family income data, there are 59 families falling into the $100,000 to $149,999 income range, which is the most common income bracket and makes up 24.2% of all families. Conversely, the $10,000 to $14,999 income bracket is the least frequent group with only 1 families (0.4%) belonging to this category.
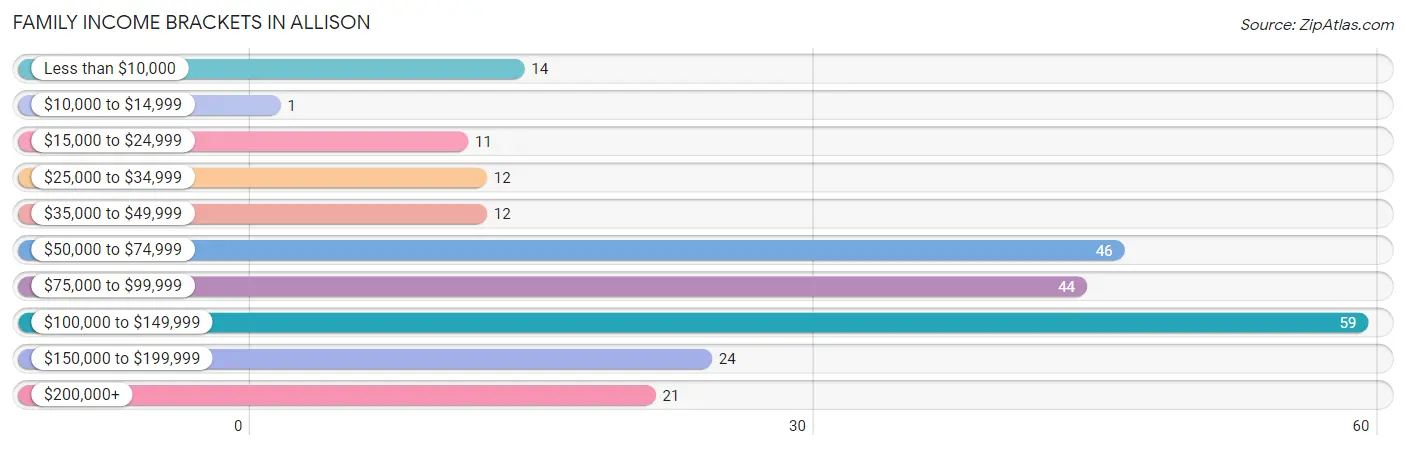
| Income Bracket | # Families | % Families |
| Less than $10,000 | 14 | 5.7% |
| $10,000 to $14,999 | 1 | 0.4% |
| $15,000 to $24,999 | 11 | 4.5% |
| $25,000 to $34,999 | 12 | 4.9% |
| $35,000 to $49,999 | 12 | 4.9% |
| $50,000 to $74,999 | 46 | 18.9% |
| $75,000 to $99,999 | 44 | 18.0% |
| $100,000 to $149,999 | 59 | 24.2% |
| $150,000 to $199,999 | 24 | 9.8% |
| $200,000+ | 21 | 8.6% |
Family Income by Famaliy Size in Allison
2-person families (153 | 62.7%) account for the highest median family income in Allison with $92,250 per family, while 2-person families (153 | 62.7%) have the highest median income of $46,125 per family member.
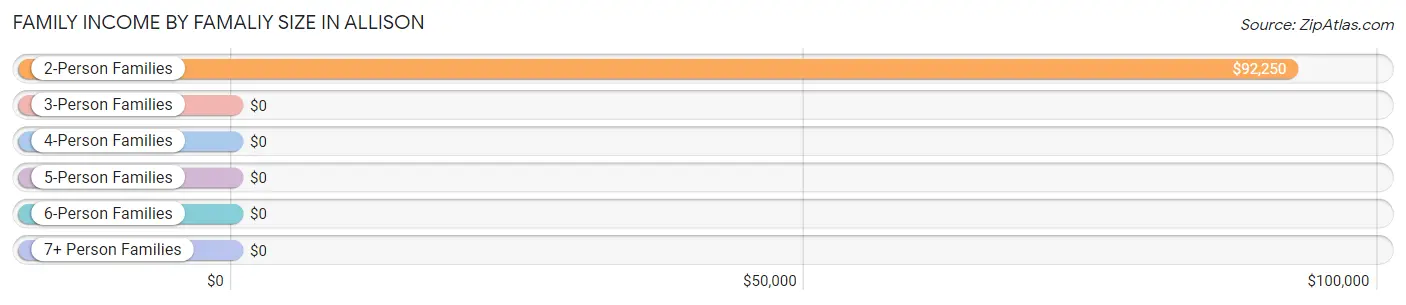
| Income Bracket | # Families | Median Income |
| 2-Person Families | 153 (62.7%) | $92,250 |
| 3-Person Families | 39 (16.0%) | $0 |
| 4-Person Families | 41 (16.8%) | $0 |
| 5-Person Families | 9 (3.7%) | $0 |
| 6-Person Families | 2 (0.8%) | $0 |
| 7+ Person Families | 0 (0.0%) | $0 |
| Total | 244 (100.0%) | $92,222 |
Family Income by Number of Earners in Allison
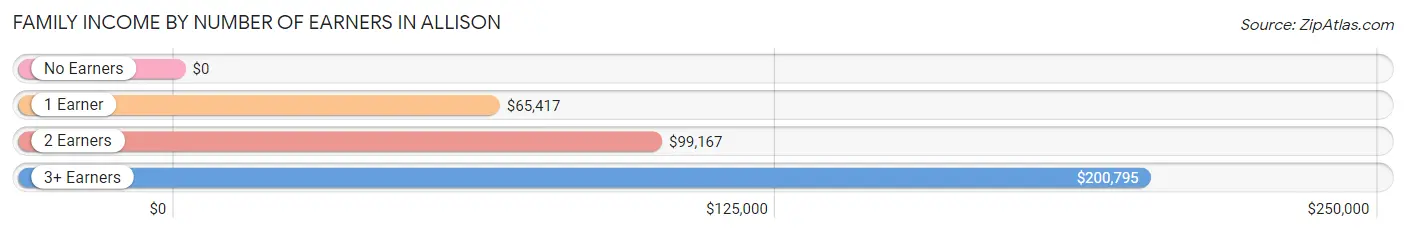
| Number of Earners | # Families | Median Income |
| No Earners | 38 (15.6%) | $0 |
| 1 Earner | 79 (32.4%) | $65,417 |
| 2 Earners | 104 (42.6%) | $99,167 |
| 3+ Earners | 23 (9.4%) | $200,795 |
| Total | 244 (100.0%) | $92,222 |
Household Income in Allison
Household Income Brackets in Allison
With 81 households falling in the category, the $50,000 to $74,999 income range is the most frequent in Allison, accounting for 18.5% of all households. In contrast, only 14 households (3.2%) fall into the $10,000 to $14,999 income bracket, making it the least populous group.
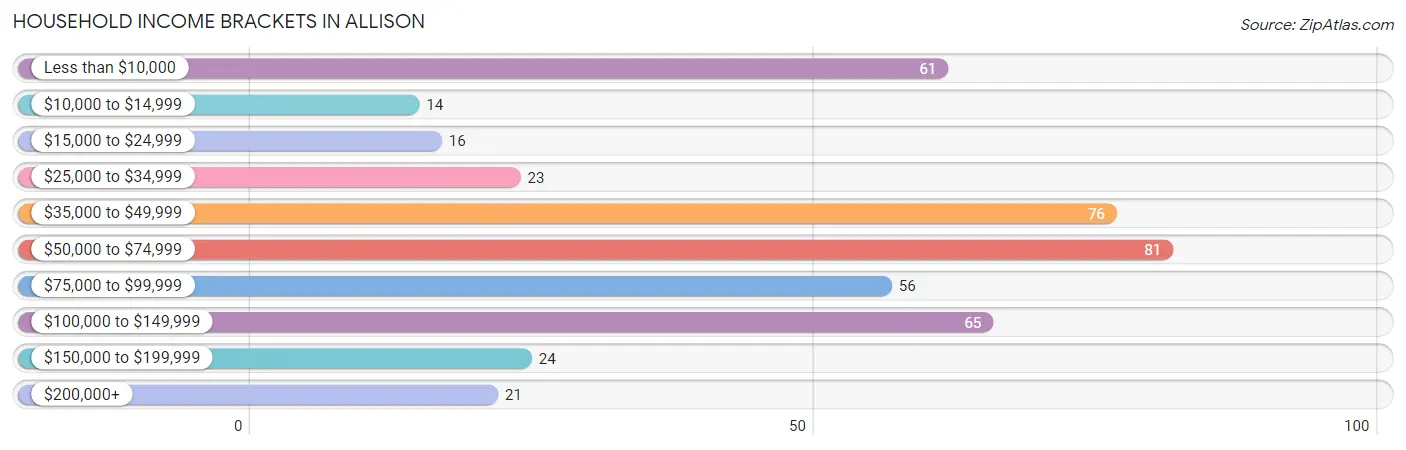
| Income Bracket | # Households | % Households |
| Less than $10,000 | 61 | 14.0% |
| $10,000 to $14,999 | 14 | 3.2% |
| $15,000 to $24,999 | 16 | 3.7% |
| $25,000 to $34,999 | 23 | 5.3% |
| $35,000 to $49,999 | 76 | 17.4% |
| $50,000 to $74,999 | 81 | 18.5% |
| $75,000 to $99,999 | 56 | 12.8% |
| $100,000 to $149,999 | 65 | 14.9% |
| $150,000 to $199,999 | 24 | 5.5% |
| $200,000+ | 21 | 4.8% |
Household Income by Householder Age in Allison
The median household income in Allison is $61,458, with the highest median household income of $65,417 found in the 25 to 44 years age bracket for the primary householder. A total of 155 households (35.5%) fall into this category. Meanwhile, the 15 to 24 years age bracket for the primary householder has the lowest median household income of $0, with 33 households (7.5%) in this group.
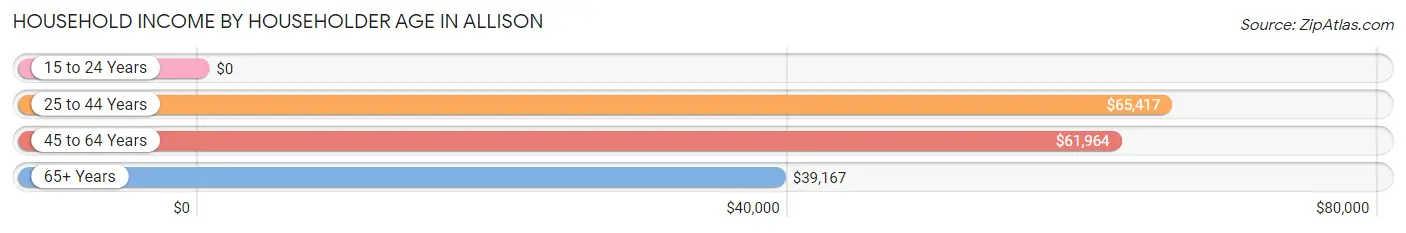
| Income Bracket | # Households | Median Income |
| 15 to 24 Years | 33 (7.5%) | $0 |
| 25 to 44 Years | 155 (35.5%) | $65,417 |
| 45 to 64 Years | 139 (31.8%) | $61,964 |
| 65+ Years | 110 (25.2%) | $39,167 |
| Total | 437 (100.0%) | $61,458 |
Poverty in Allison
Income Below Poverty by Sex and Age in Allison
With 12.4% poverty level for males and 17.5% for females among the residents of Allison, 25 to 34 year old males and 25 to 34 year old females are the most vulnerable to poverty, with 26 males (37.7%) and 29 females (54.7%) in their respective age groups living below the poverty level.
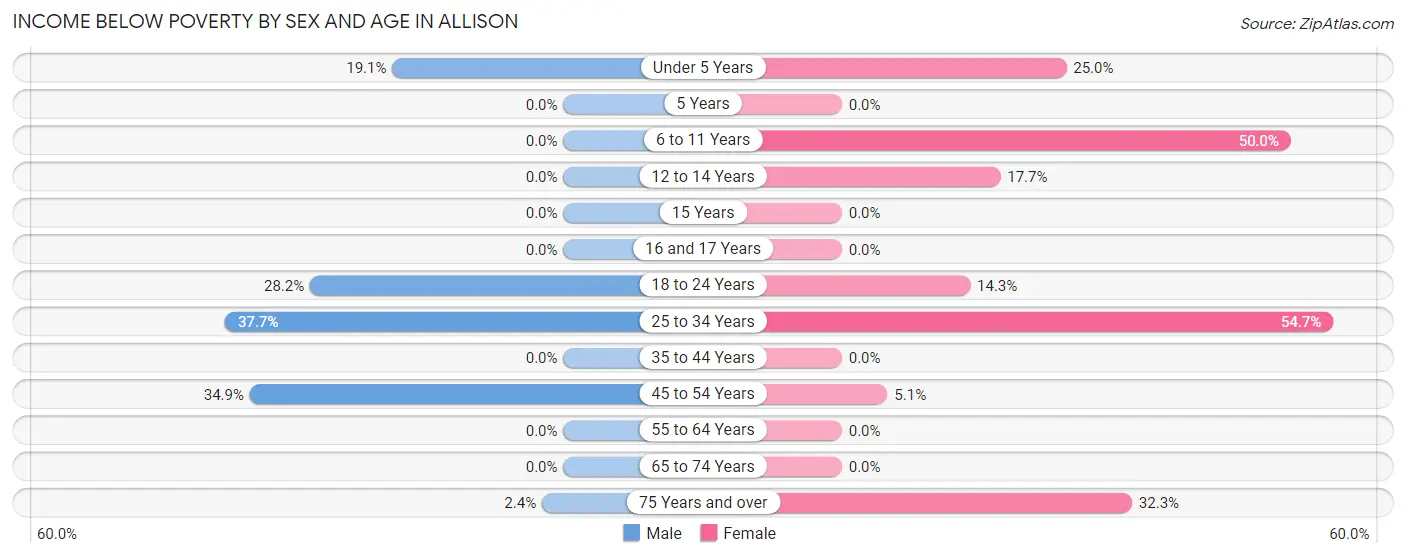
| Age Bracket | Male | Female |
| Under 5 Years | 4 (19.1%) | 4 (25.0%) |
| 5 Years | 0 (0.0%) | 0 (0.0%) |
| 6 to 11 Years | 0 (0.0%) | 10 (50.0%) |
| 12 to 14 Years | 0 (0.0%) | 3 (17.6%) |
| 15 Years | 0 (0.0%) | 0 (0.0%) |
| 16 and 17 Years | 0 (0.0%) | 0 (0.0%) |
| 18 to 24 Years | 11 (28.2%) | 3 (14.3%) |
| 25 to 34 Years | 26 (37.7%) | 29 (54.7%) |
| 35 to 44 Years | 0 (0.0%) | 0 (0.0%) |
| 45 to 54 Years | 22 (34.9%) | 3 (5.1%) |
| 55 to 64 Years | 0 (0.0%) | 0 (0.0%) |
| 65 to 74 Years | 0 (0.0%) | 0 (0.0%) |
| 75 Years and over | 1 (2.4%) | 21 (32.3%) |
| Total | 64 (12.4%) | 73 (17.5%) |
Income Above Poverty by Sex and Age in Allison
According to the poverty statistics in Allison, males aged 6 to 11 years and females aged 5 years are the age groups that are most secure financially, with 100.0% of males and 100.0% of females in these age groups living above the poverty line.
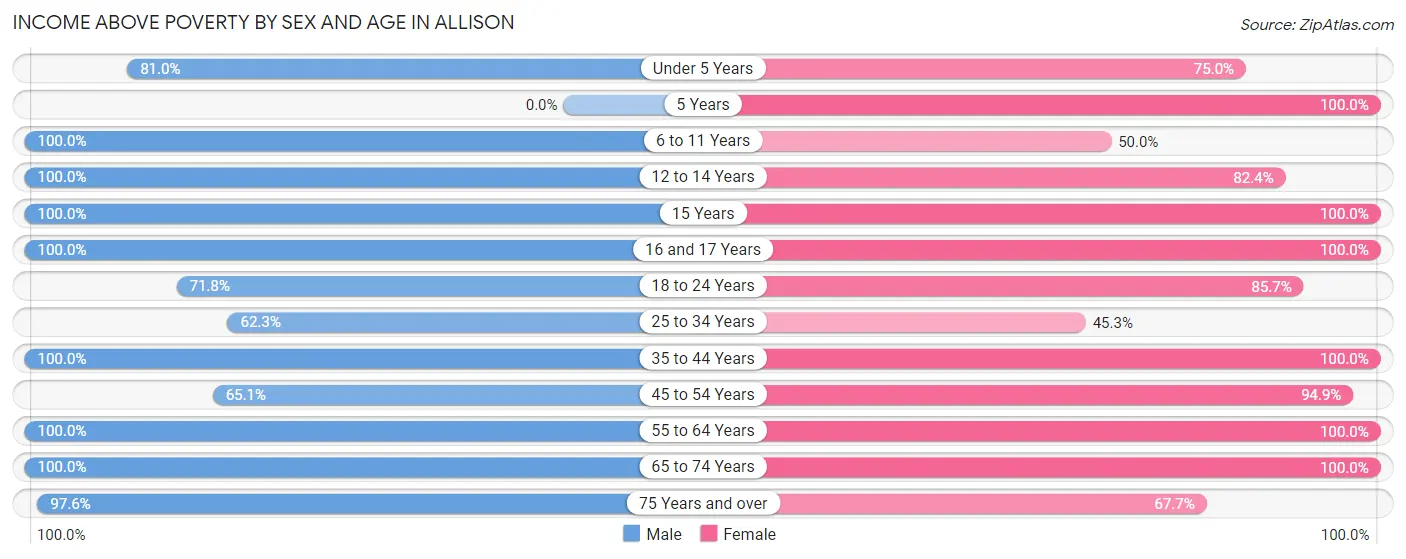
| Age Bracket | Male | Female |
| Under 5 Years | 17 (80.9%) | 12 (75.0%) |
| 5 Years | 0 (0.0%) | 3 (100.0%) |
| 6 to 11 Years | 16 (100.0%) | 10 (50.0%) |
| 12 to 14 Years | 12 (100.0%) | 14 (82.4%) |
| 15 Years | 27 (100.0%) | 9 (100.0%) |
| 16 and 17 Years | 34 (100.0%) | 2 (100.0%) |
| 18 to 24 Years | 28 (71.8%) | 18 (85.7%) |
| 25 to 34 Years | 43 (62.3%) | 24 (45.3%) |
| 35 to 44 Years | 78 (100.0%) | 44 (100.0%) |
| 45 to 54 Years | 41 (65.1%) | 56 (94.9%) |
| 55 to 64 Years | 53 (100.0%) | 59 (100.0%) |
| 65 to 74 Years | 60 (100.0%) | 50 (100.0%) |
| 75 Years and over | 41 (97.6%) | 44 (67.7%) |
| Total | 450 (87.5%) | 345 (82.5%) |
Income Below Poverty Among Married-Couple Families in Allison
The poverty statistics for married-couple families in Allison show that 0.5% or 1 of the total 190 families live below the poverty line. Families with no children have the highest poverty rate of 0.8%, comprising of 1 families. On the other hand, families with 1 or 2 children have the lowest poverty rate of 0.0%, which includes 0 families.
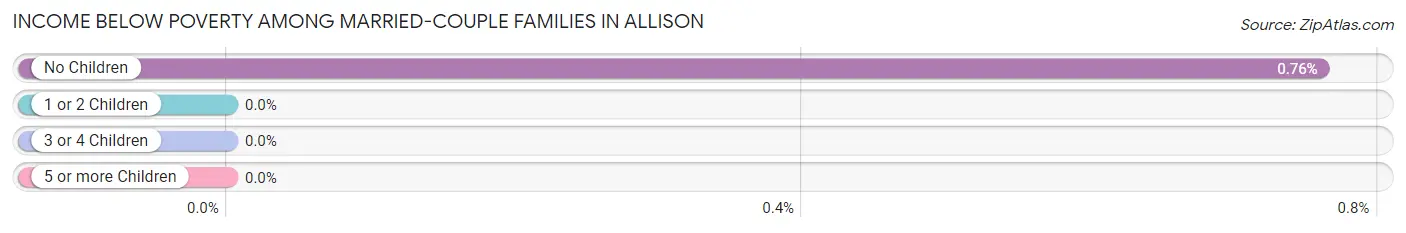
| Children | Above Poverty | Below Poverty |
| No Children | 130 (99.2%) | 1 (0.8%) |
| 1 or 2 Children | 52 (100.0%) | 0 (0.0%) |
| 3 or 4 Children | 7 (100.0%) | 0 (0.0%) |
| 5 or more Children | 0 (0.0%) | 0 (0.0%) |
| Total | 189 (99.5%) | 1 (0.5%) |
Income Below Poverty Among Single-Parent Households in Allison
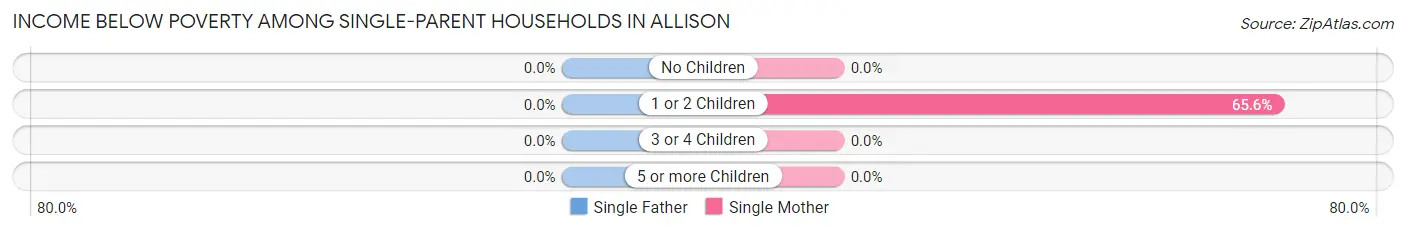
| Children | Single Father | Single Mother |
| No Children | 0 (0.0%) | 0 (0.0%) |
| 1 or 2 Children | 0 (0.0%) | 21 (65.6%) |
| 3 or 4 Children | 0 (0.0%) | 0 (0.0%) |
| 5 or more Children | 0 (0.0%) | 0 (0.0%) |
| Total | 0 (0.0%) | 21 (53.8%) |
Income Below Poverty Among Married-Couple vs Single-Parent Households in Allison
The poverty data for Allison shows that 1 of the married-couple family households (0.5%) and 21 of the single-parent households (38.9%) are living below the poverty level. Within the married-couple family households, those with no children have the highest poverty rate, with 1 households (0.8%) falling below the poverty line. Among the single-parent households, those with 1 or 2 children have the highest poverty rate, with 21 household (48.8%) living below poverty.
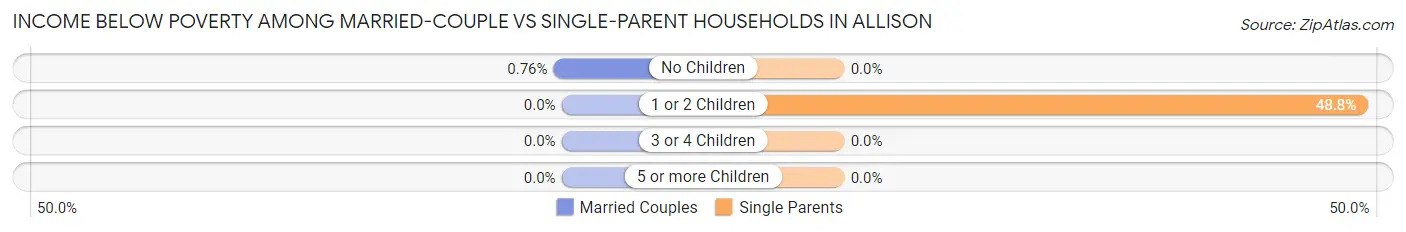
| Children | Married-Couple Families | Single-Parent Households |
| No Children | 1 (0.8%) | 0 (0.0%) |
| 1 or 2 Children | 0 (0.0%) | 21 (48.8%) |
| 3 or 4 Children | 0 (0.0%) | 0 (0.0%) |
| 5 or more Children | 0 (0.0%) | 0 (0.0%) |
| Total | 1 (0.5%) | 21 (38.9%) |
Race in Allison
The most populous races in Allison are White / Caucasian (976 | 99.6%), Black / African American (3 | 0.3%), and Two or more Races (1 | 0.1%).
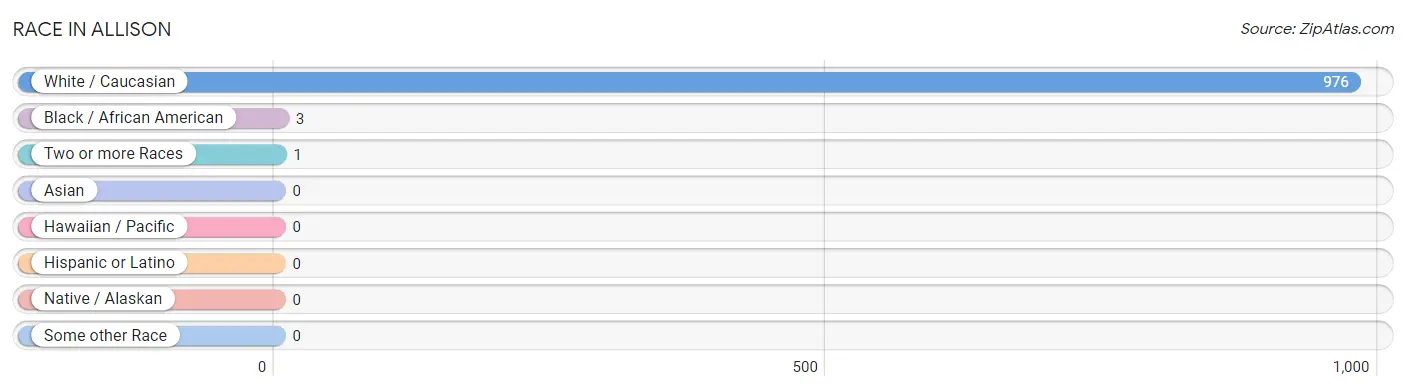
| Race | # Population | % Population |
| Asian | 0 | 0.0% |
| Black / African American | 3 | 0.3% |
| Hawaiian / Pacific | 0 | 0.0% |
| Hispanic or Latino | 0 | 0.0% |
| Native / Alaskan | 0 | 0.0% |
| White / Caucasian | 976 | 99.6% |
| Two or more Races | 1 | 0.1% |
| Some other Race | 0 | 0.0% |
| Total | 980 | 100.0% |
Ancestry in Allison
The most populous ancestries reported in Allison are German (462 | 47.1%), American (80 | 8.2%), Irish (61 | 6.2%), Norwegian (37 | 3.8%), and Dutch (31 | 3.2%), together accounting for 68.5% of all Allison residents.
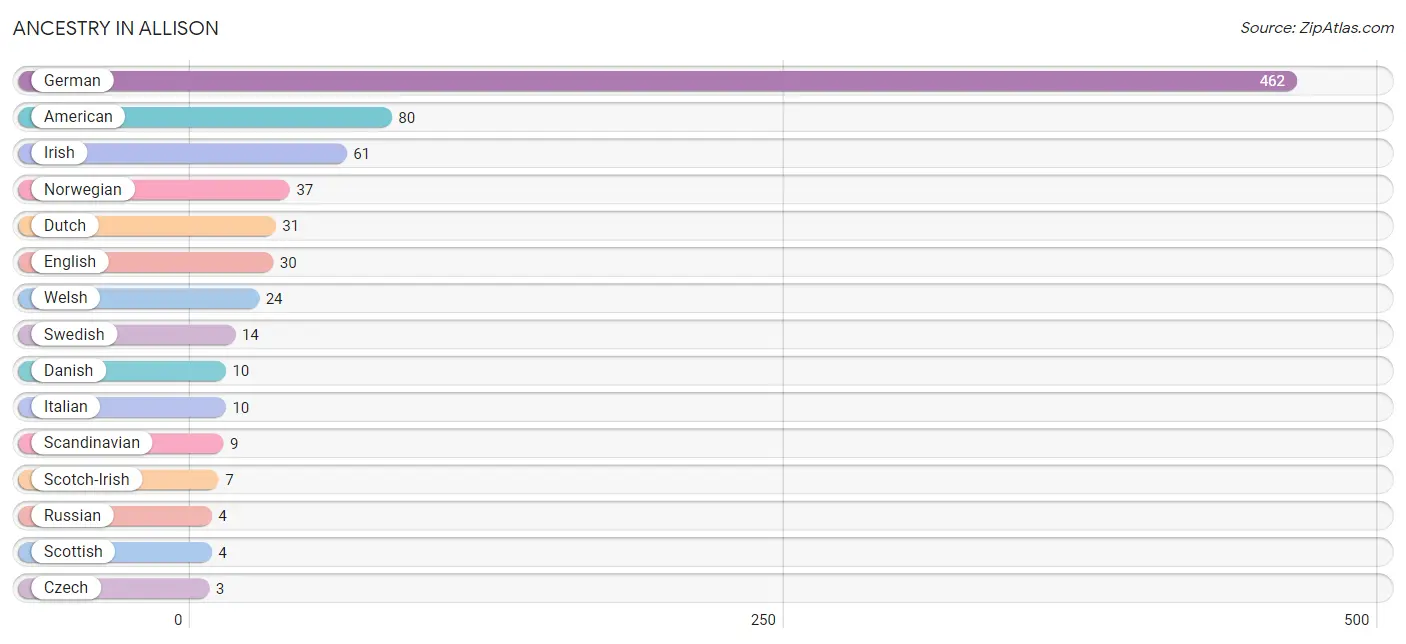
| Ancestry | # Population | % Population |
| American | 80 | 8.2% |
| Czech | 3 | 0.3% |
| Danish | 10 | 1.0% |
| Dutch | 31 | 3.2% |
| Eastern European | 2 | 0.2% |
| English | 30 | 3.1% |
| French | 3 | 0.3% |
| German | 462 | 47.1% |
| Irish | 61 | 6.2% |
| Italian | 10 | 1.0% |
| Norwegian | 37 | 3.8% |
| Polish | 2 | 0.2% |
| Russian | 4 | 0.4% |
| Scandinavian | 9 | 0.9% |
| Scotch-Irish | 7 | 0.7% |
| Scottish | 4 | 0.4% |
| Swedish | 14 | 1.4% |
| Welsh | 24 | 2.5% | View All 18 Rows |
Immigrants in Allison
The most numerous immigrant groups reported in Allison came from Africa (1 | 0.1%), Liberia (1 | 0.1%), and Western Africa (1 | 0.1%), together accounting for 0.3% of all Allison residents.
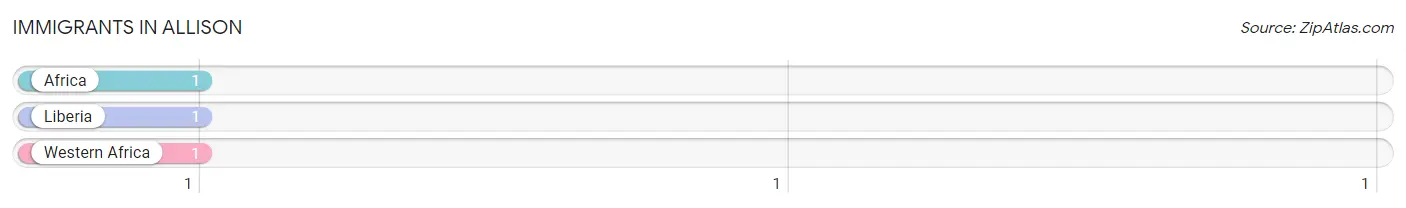
| Immigration Origin | # Population | % Population |
| Africa | 1 | 0.1% |
| Liberia | 1 | 0.1% |
| Western Africa | 1 | 0.1% | View All 3 Rows |
Sex and Age in Allison
Sex and Age in Allison
The most populous age groups in Allison are 15 to 19 Years (61 | 11.7%) for men and 25 to 29 Years (43 | 9.4%) for women.
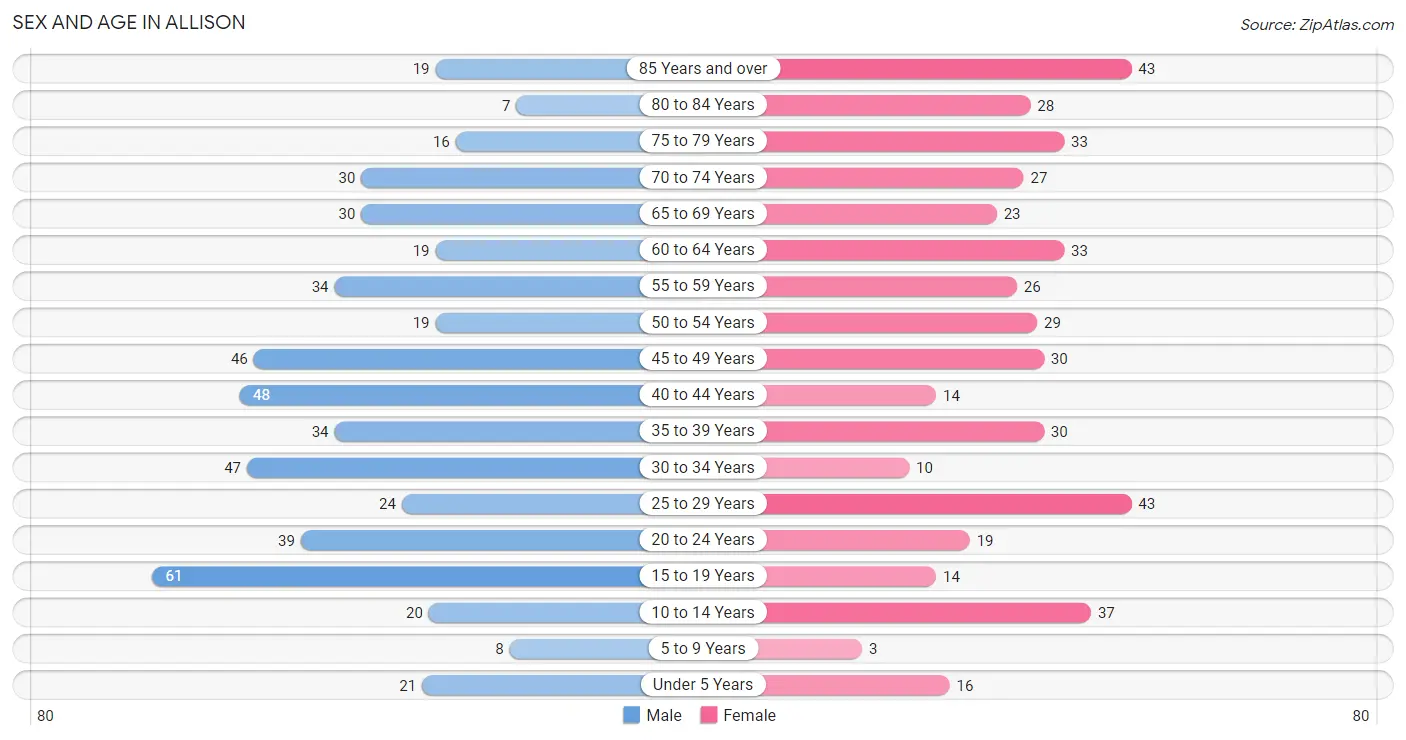
| Age Bracket | Male | Female |
| Under 5 Years | 21 (4.0%) | 16 (3.5%) |
| 5 to 9 Years | 8 (1.5%) | 3 (0.7%) |
| 10 to 14 Years | 20 (3.8%) | 37 (8.1%) |
| 15 to 19 Years | 61 (11.7%) | 14 (3.1%) |
| 20 to 24 Years | 39 (7.5%) | 19 (4.2%) |
| 25 to 29 Years | 24 (4.6%) | 43 (9.4%) |
| 30 to 34 Years | 47 (9.0%) | 10 (2.2%) |
| 35 to 39 Years | 34 (6.5%) | 30 (6.6%) |
| 40 to 44 Years | 48 (9.2%) | 14 (3.1%) |
| 45 to 49 Years | 46 (8.8%) | 30 (6.6%) |
| 50 to 54 Years | 19 (3.6%) | 29 (6.3%) |
| 55 to 59 Years | 34 (6.5%) | 26 (5.7%) |
| 60 to 64 Years | 19 (3.6%) | 33 (7.2%) |
| 65 to 69 Years | 30 (5.8%) | 23 (5.0%) |
| 70 to 74 Years | 30 (5.8%) | 27 (5.9%) |
| 75 to 79 Years | 16 (3.1%) | 33 (7.2%) |
| 80 to 84 Years | 7 (1.3%) | 28 (6.1%) |
| 85 Years and over | 19 (3.6%) | 43 (9.4%) |
| Total | 522 (100.0%) | 458 (100.0%) |
Families and Households in Allison
Median Family Size in Allison
The median family size in Allison is 2.80 persons per family, with single male/father families (15 | 6.1%) accounting for the largest median family size of 3.6 persons per family. On the other hand, single female/mother families (39 | 16.0%) represent the smallest median family size with 2.54 persons per family.
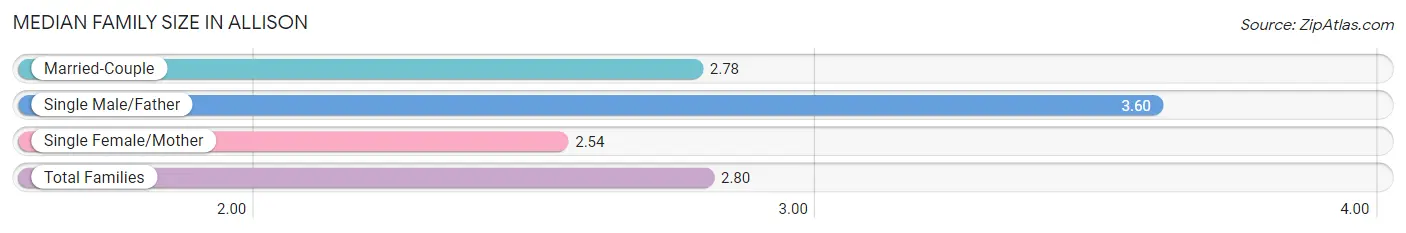
| Family Type | # Families | Family Size |
| Married-Couple | 190 (77.9%) | 2.78 |
| Single Male/Father | 15 (6.1%) | 3.60 |
| Single Female/Mother | 39 (16.0%) | 2.54 |
| Total Families | 244 (100.0%) | 2.80 |
Median Household Size in Allison
The median household size in Allison is 2.13 persons per household, with single male/father households (15 | 3.4%) accounting for the largest median household size of 3.8 persons per household. non-family households (193 | 44.2%) represent the smallest median household size with 1.18 persons per household.
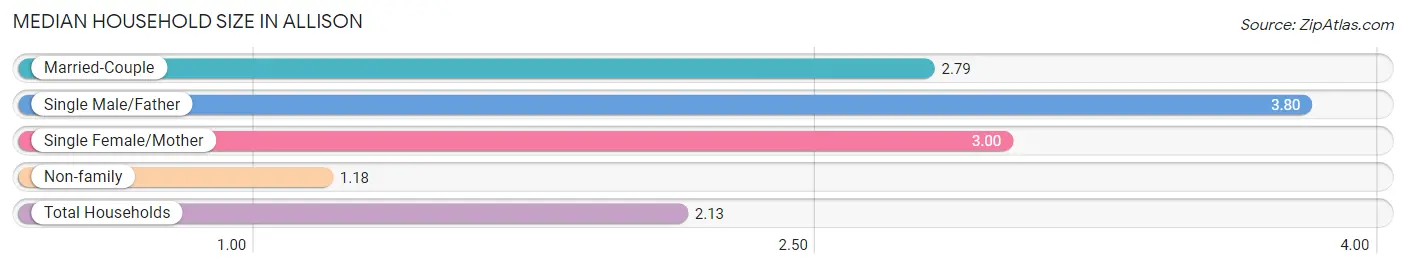
| Household Type | # Households | Household Size |
| Married-Couple | 190 (43.5%) | 2.79 |
| Single Male/Father | 15 (3.4%) | 3.80 |
| Single Female/Mother | 39 (8.9%) | 3.00 |
| Non-family | 193 (44.2%) | 1.18 |
| Total Households | 437 (100.0%) | 2.13 |
Household Size by Marriage Status in Allison
Out of a total of 437 households in Allison, 244 (55.8%) are family households, while 193 (44.2%) are nonfamily households. The most numerous type of family households are 2-person households, comprising 143, and the most common type of nonfamily households are 1-person households, comprising 167.
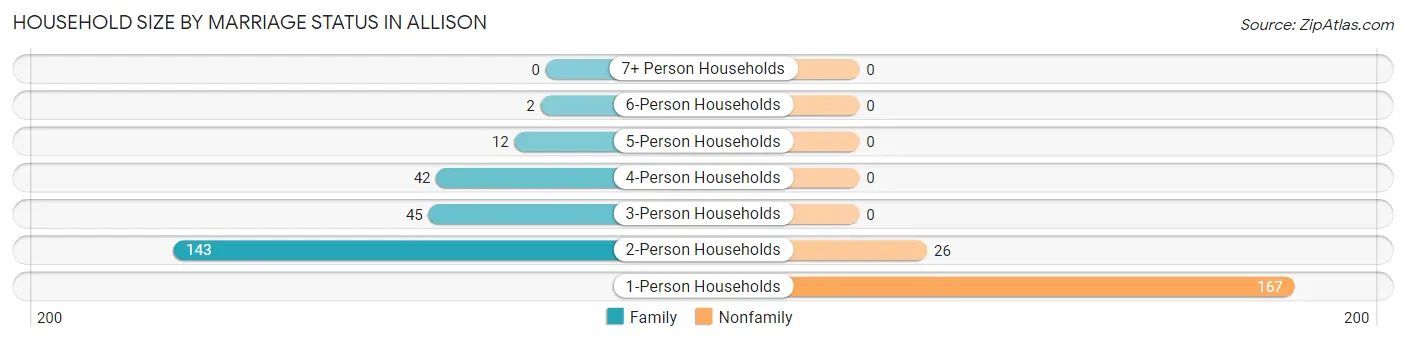
| Household Size | Family Households | Nonfamily Households |
| 1-Person Households | - | 167 (38.2%) |
| 2-Person Households | 143 (32.7%) | 26 (5.9%) |
| 3-Person Households | 45 (10.3%) | 0 (0.0%) |
| 4-Person Households | 42 (9.6%) | 0 (0.0%) |
| 5-Person Households | 12 (2.8%) | 0 (0.0%) |
| 6-Person Households | 2 (0.5%) | 0 (0.0%) |
| 7+ Person Households | 0 (0.0%) | 0 (0.0%) |
| Total | 244 (55.8%) | 193 (44.2%) |
Female Fertility in Allison
Fertility by Age in Allison
Average fertility rate in Allison is 69.0 births per 1,000 women. Women in the age bracket of 20 to 34 years have the highest fertility rate with 97.0 births per 1,000 women. Women in the age bracket of 20 to 34 years acount for 63.6% of all women with births.
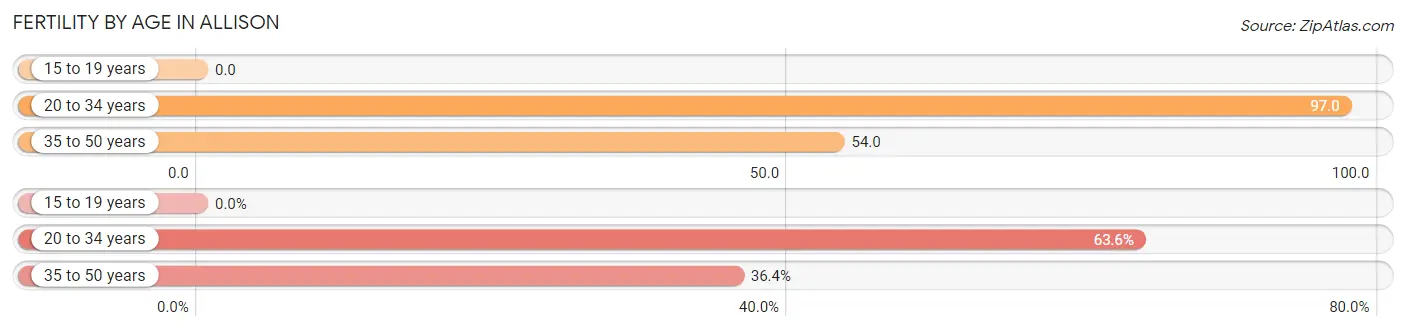
| Age Bracket | Women with Births | Births / 1,000 Women |
| 15 to 19 years | 0 (0.0%) | 0.0 |
| 20 to 34 years | 7 (63.6%) | 97.0 |
| 35 to 50 years | 4 (36.4%) | 54.0 |
| Total | 11 (100.0%) | 69.0 |
Fertility by Age by Marriage Status in Allison
63.6% of women with births (11) in Allison are married. The highest percentage of unmarried women with births falls into 20 to 34 years age bracket with 57.1% of them unmarried at the time of birth, while the lowest percentage of unmarried women with births belong to 35 to 50 years age bracket with 0.0% of them unmarried.
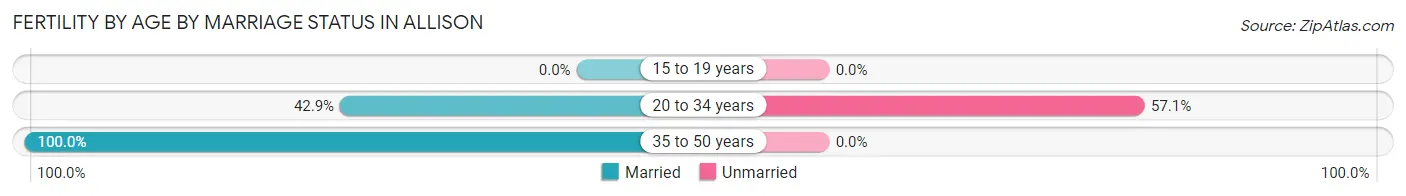
| Age Bracket | Married | Unmarried |
| 15 to 19 years | 0 (0.0%) | 0 (0.0%) |
| 20 to 34 years | 3 (42.9%) | 4 (57.1%) |
| 35 to 50 years | 4 (100.0%) | 0 (0.0%) |
| Total | 7 (63.6%) | 4 (36.4%) |
Fertility by Education in Allison
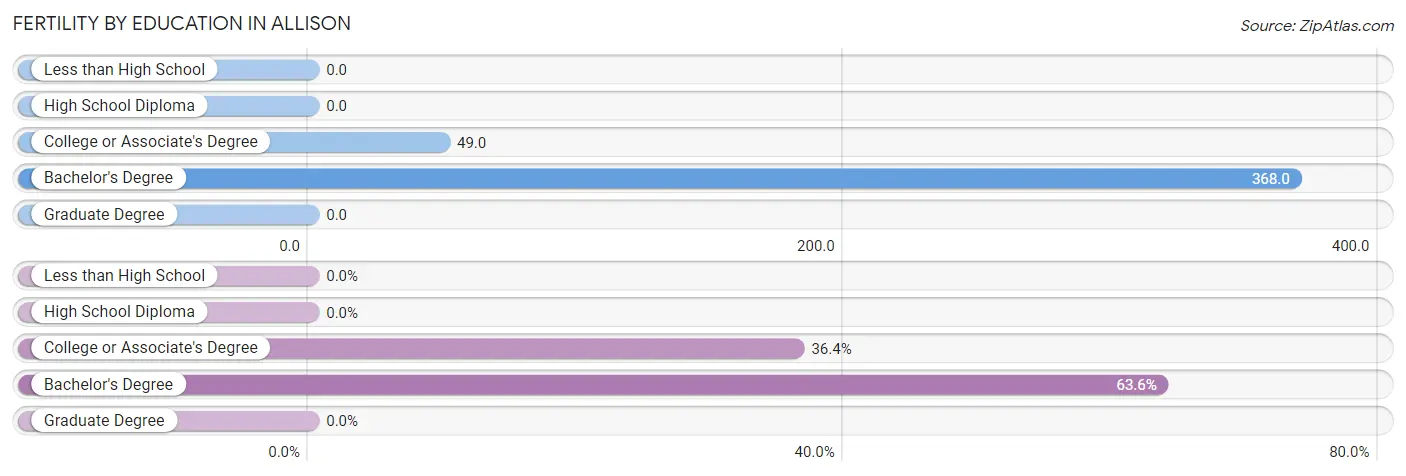
| Educational Attainment | Women with Births | Births / 1,000 Women |
| Less than High School | 0 (0.0%) | 0.0 |
| High School Diploma | 0 (0.0%) | 0.0 |
| College or Associate's Degree | 4 (36.4%) | 49.0 |
| Bachelor's Degree | 7 (63.6%) | 368.0 |
| Graduate Degree | 0 (0.0%) | 0.0 |
| Total | 11 (100.0%) | 69.0 |
Fertility by Education by Marriage Status in Allison
36.4% of women with births in Allison are unmarried. Women with the educational attainment of bachelor's degree are most likely to be married with 100.0% of them married at childbirth, while women with the educational attainment of college or associate's degree are least likely to be married with 100.0% of them unmarried at childbirth.
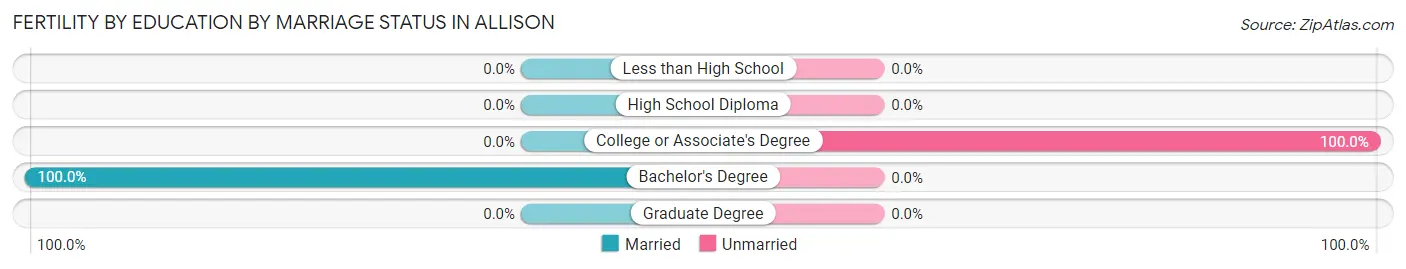
| Educational Attainment | Married | Unmarried |
| Less than High School | 0 (0.0%) | 0 (0.0%) |
| High School Diploma | 0 (0.0%) | 0 (0.0%) |
| College or Associate's Degree | 0 (0.0%) | 4 (100.0%) |
| Bachelor's Degree | 7 (100.0%) | 0 (0.0%) |
| Graduate Degree | 0 (0.0%) | 0 (0.0%) |
| Total | 7 (63.6%) | 4 (36.4%) |
Employment Characteristics in Allison
Employment by Class of Employer in Allison
Among the 497 employed individuals in Allison, private company employees (357 | 71.8%), local government employees (63 | 12.7%), and self-employed (not incorporated) (46 | 9.3%) make up the most common classes of employment.
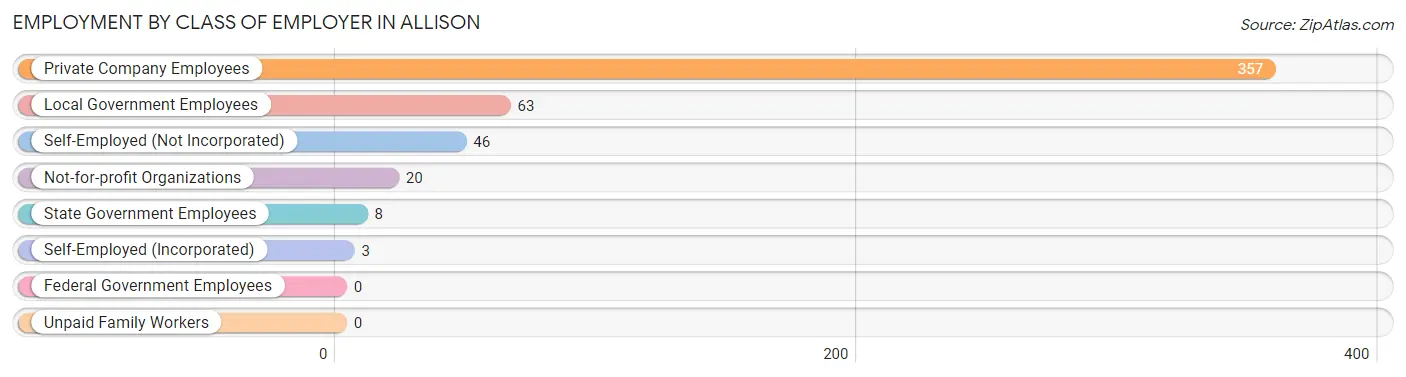
| Employer Class | # Employees | % Employees |
| Private Company Employees | 357 | 71.8% |
| Self-Employed (Incorporated) | 3 | 0.6% |
| Self-Employed (Not Incorporated) | 46 | 9.3% |
| Not-for-profit Organizations | 20 | 4.0% |
| Local Government Employees | 63 | 12.7% |
| State Government Employees | 8 | 1.6% |
| Federal Government Employees | 0 | 0.0% |
| Unpaid Family Workers | 0 | 0.0% |
| Total | 497 | 100.0% |
Employment Status by Age in Allison
According to the labor force statistics for Allison, out of the total population over 16 years of age (839), 59.6% or 500 individuals are in the labor force, with 0.6% or 3 of them unemployed. The age group with the highest labor force participation rate is 35 to 44 years, with 96.8% or 122 individuals in the labor force. Within the labor force, the 35 to 44 years age range has the highest percentage of unemployed individuals, with 2.5% or 3 of them being unemployed.
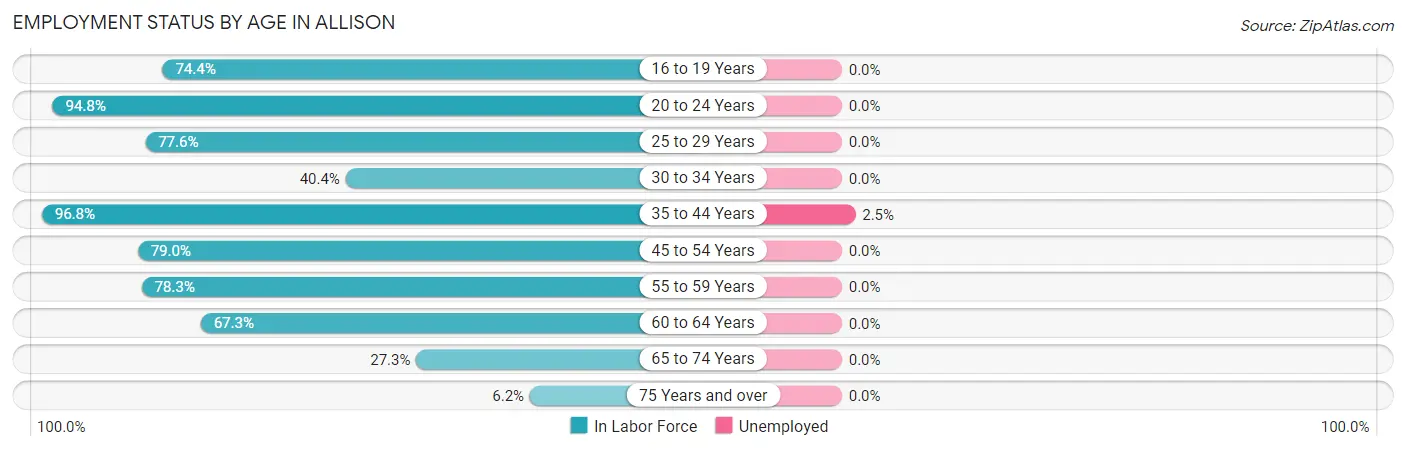
| Age Bracket | In Labor Force | Unemployed |
| 16 to 19 Years | 29 (74.4%) | 0 (0.0%) |
| 20 to 24 Years | 55 (94.8%) | 0 (0.0%) |
| 25 to 29 Years | 52 (77.6%) | 0 (0.0%) |
| 30 to 34 Years | 23 (40.4%) | 0 (0.0%) |
| 35 to 44 Years | 122 (96.8%) | 3 (2.5%) |
| 45 to 54 Years | 98 (79.0%) | 0 (0.0%) |
| 55 to 59 Years | 47 (78.3%) | 0 (0.0%) |
| 60 to 64 Years | 35 (67.3%) | 0 (0.0%) |
| 65 to 74 Years | 30 (27.3%) | 0 (0.0%) |
| 75 Years and over | 9 (6.2%) | 0 (0.0%) |
| Total | 500 (59.6%) | 3 (0.6%) |
Employment Status by Educational Attainment in Allison
According to labor force statistics for Allison, 77.6% of individuals (377) out of the total population between 25 and 64 years of age (486) are in the labor force, with 0.8% or 3 of them being unemployed. The group with the highest labor force participation rate are those with the educational attainment of bachelor's degree or higher, with 87.3% or 62 individuals in the labor force. Within the labor force, individuals with high school diploma education have the highest percentage of unemployment, with 2.1% or 3 of them being unemployed.
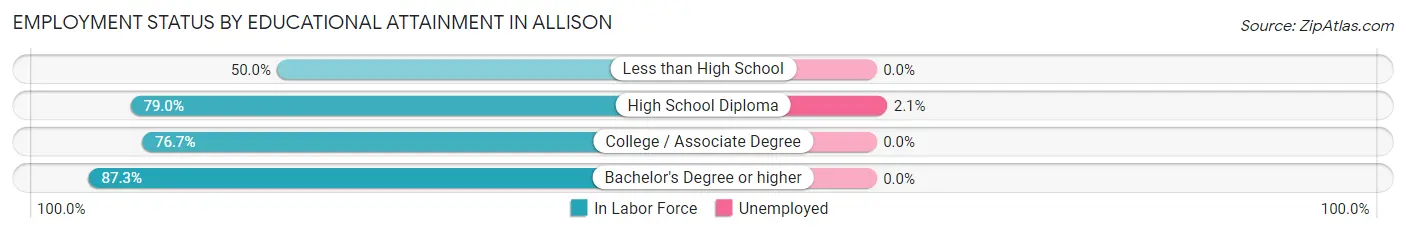
| Educational Attainment | In Labor Force | Unemployed |
| Less than High School | 14 (50.0%) | 0 (0.0%) |
| High School Diploma | 143 (79.0%) | 4 (2.1%) |
| College / Associate Degree | 158 (76.7%) | 0 (0.0%) |
| Bachelor's Degree or higher | 62 (87.3%) | 0 (0.0%) |
| Total | 377 (77.6%) | 4 (0.8%) |
Employment Occupations by Sex in Allison
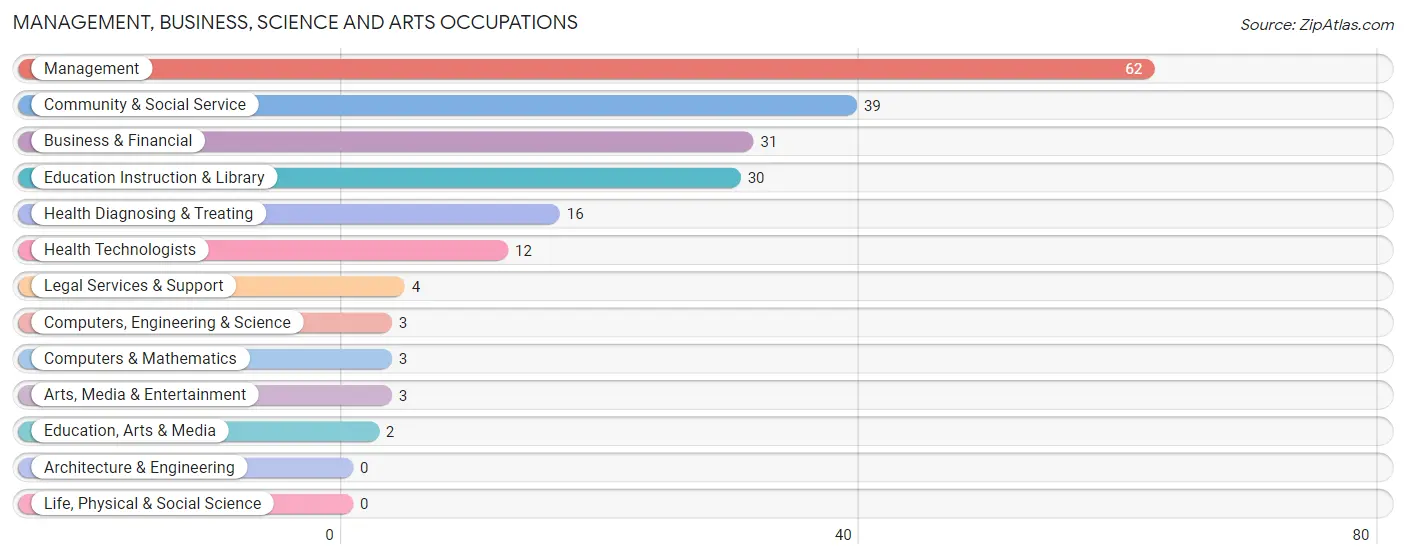
Management, Business, Science and Arts Occupations
The most common Management, Business, Science and Arts occupations in Allison are Management (62 | 12.5%), Community & Social Service (39 | 7.9%), Business & Financial (31 | 6.2%), Education Instruction & Library (30 | 6.0%), and Health Diagnosing & Treating (16 | 3.2%).
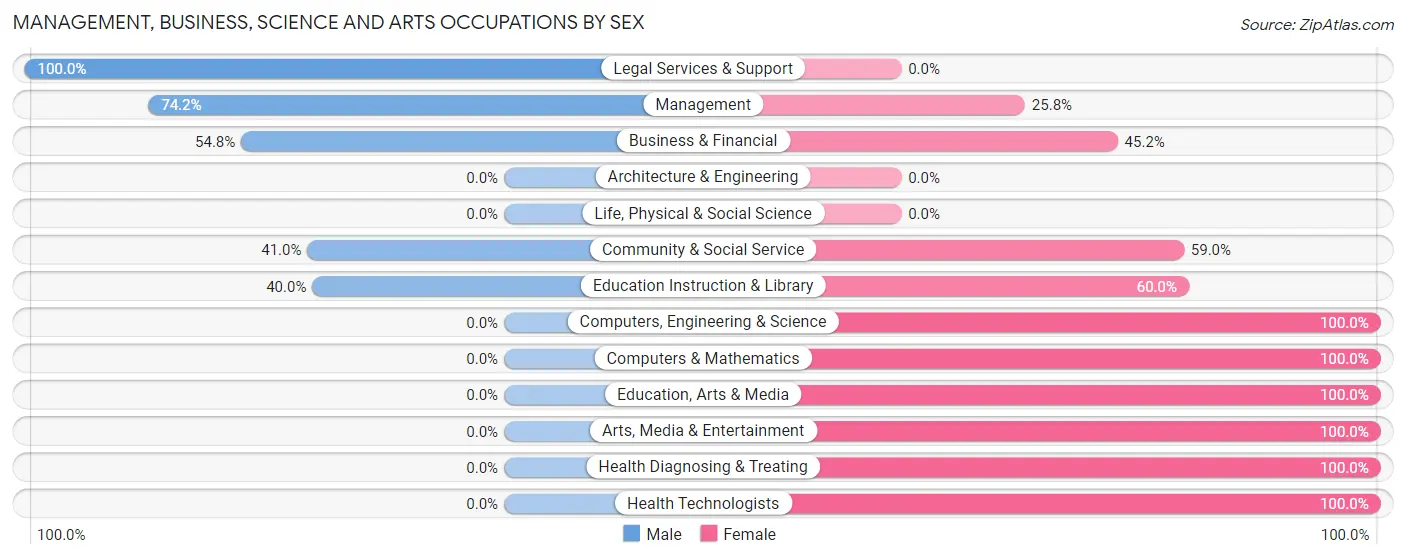
Management, Business, Science and Arts Occupations by Sex
Within the Management, Business, Science and Arts occupations in Allison, the most male-oriented occupations are Legal Services & Support (100.0%), Management (74.2%), and Business & Financial (54.8%), while the most female-oriented occupations are Computers, Engineering & Science (100.0%), Computers & Mathematics (100.0%), and Education, Arts & Media (100.0%).
| Occupation | Male | Female |
| Management | 46 (74.2%) | 16 (25.8%) |
| Business & Financial | 17 (54.8%) | 14 (45.2%) |
| Computers, Engineering & Science | 0 (0.0%) | 3 (100.0%) |
| Computers & Mathematics | 0 (0.0%) | 3 (100.0%) |
| Architecture & Engineering | 0 (0.0%) | 0 (0.0%) |
| Life, Physical & Social Science | 0 (0.0%) | 0 (0.0%) |
| Community & Social Service | 16 (41.0%) | 23 (59.0%) |
| Education, Arts & Media | 0 (0.0%) | 2 (100.0%) |
| Legal Services & Support | 4 (100.0%) | 0 (0.0%) |
| Education Instruction & Library | 12 (40.0%) | 18 (60.0%) |
| Arts, Media & Entertainment | 0 (0.0%) | 3 (100.0%) |
| Health Diagnosing & Treating | 0 (0.0%) | 16 (100.0%) |
| Health Technologists | 0 (0.0%) | 12 (100.0%) |
| Total (Category) | 79 (52.3%) | 72 (47.7%) |
| Total (Overall) | 288 (58.0%) | 209 (42.0%) |
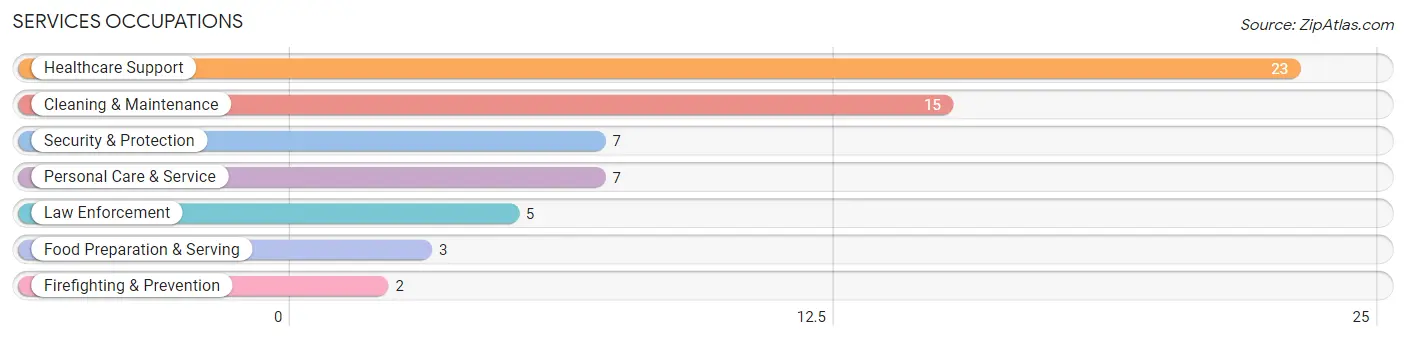
Services Occupations
The most common Services occupations in Allison are Healthcare Support (23 | 4.6%), Cleaning & Maintenance (15 | 3.0%), Security & Protection (7 | 1.4%), Personal Care & Service (7 | 1.4%), and Law Enforcement (5 | 1.0%).
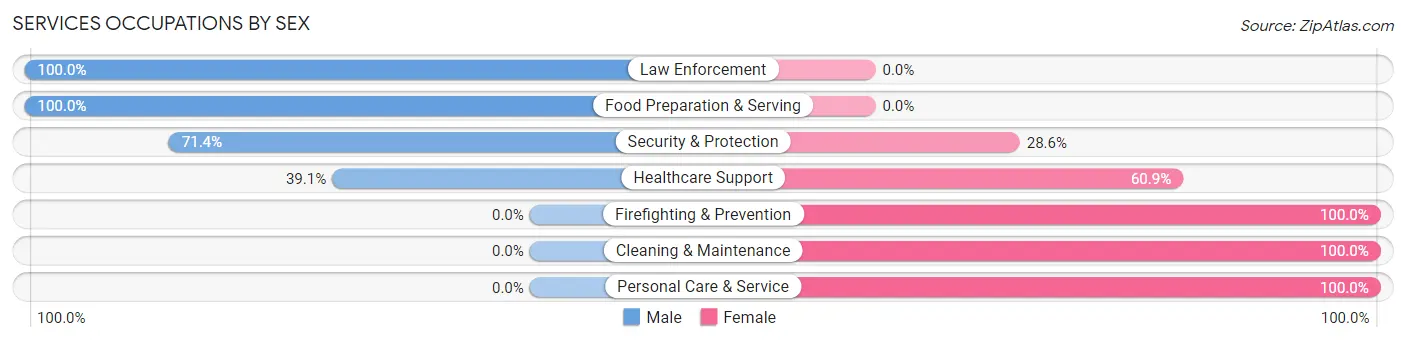
Services Occupations by Sex
Within the Services occupations in Allison, the most male-oriented occupations are Law Enforcement (100.0%), Food Preparation & Serving (100.0%), and Security & Protection (71.4%), while the most female-oriented occupations are Firefighting & Prevention (100.0%), Cleaning & Maintenance (100.0%), and Personal Care & Service (100.0%).
| Occupation | Male | Female |
| Healthcare Support | 9 (39.1%) | 14 (60.9%) |
| Security & Protection | 5 (71.4%) | 2 (28.6%) |
| Firefighting & Prevention | 0 (0.0%) | 2 (100.0%) |
| Law Enforcement | 5 (100.0%) | 0 (0.0%) |
| Food Preparation & Serving | 3 (100.0%) | 0 (0.0%) |
| Cleaning & Maintenance | 0 (0.0%) | 15 (100.0%) |
| Personal Care & Service | 0 (0.0%) | 7 (100.0%) |
| Total (Category) | 17 (30.9%) | 38 (69.1%) |
| Total (Overall) | 288 (58.0%) | 209 (42.0%) |
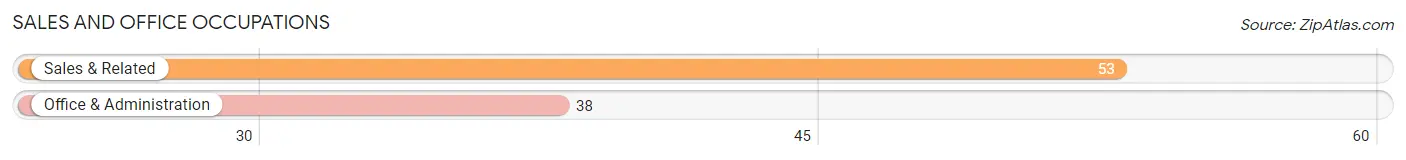
Sales and Office Occupations
The most common Sales and Office occupations in Allison are Sales & Related (53 | 10.7%), and Office & Administration (38 | 7.6%).
Sales and Office Occupations by Sex
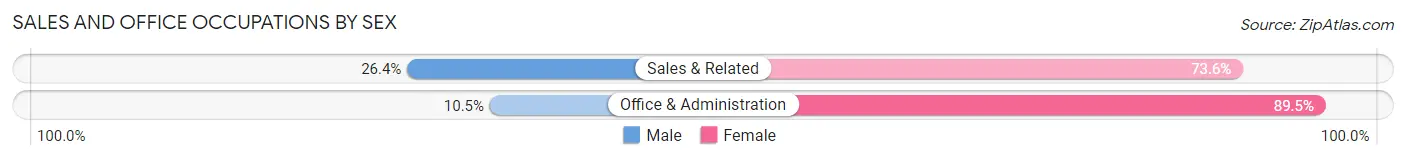
| Occupation | Male | Female |
| Sales & Related | 14 (26.4%) | 39 (73.6%) |
| Office & Administration | 4 (10.5%) | 34 (89.5%) |
| Total (Category) | 18 (19.8%) | 73 (80.2%) |
| Total (Overall) | 288 (58.0%) | 209 (42.0%) |
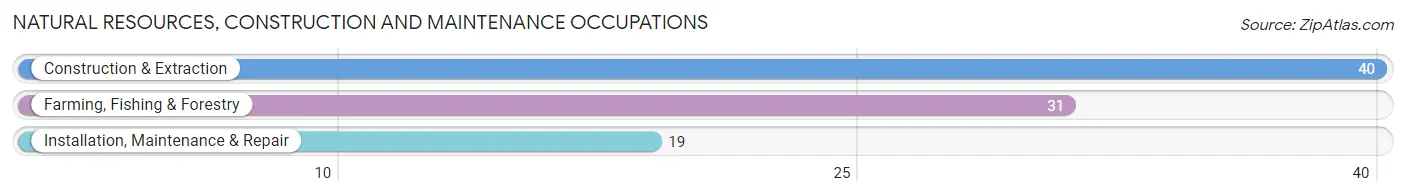
Natural Resources, Construction and Maintenance Occupations
The most common Natural Resources, Construction and Maintenance occupations in Allison are Construction & Extraction (40 | 8.1%), Farming, Fishing & Forestry (31 | 6.2%), and Installation, Maintenance & Repair (19 | 3.8%).
Natural Resources, Construction and Maintenance Occupations by Sex
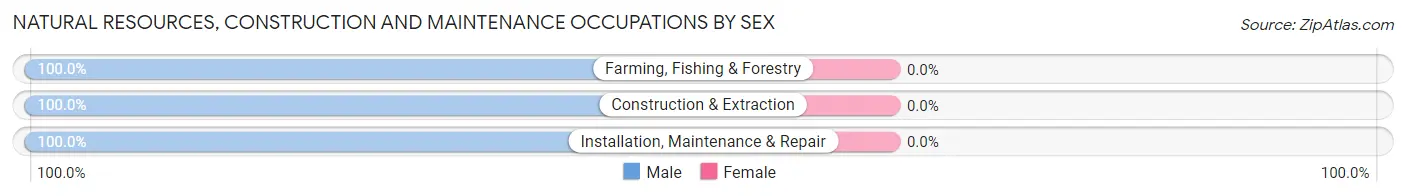
| Occupation | Male | Female |
| Farming, Fishing & Forestry | 31 (100.0%) | 0 (0.0%) |
| Construction & Extraction | 40 (100.0%) | 0 (0.0%) |
| Installation, Maintenance & Repair | 19 (100.0%) | 0 (0.0%) |
| Total (Category) | 90 (100.0%) | 0 (0.0%) |
| Total (Overall) | 288 (58.0%) | 209 (42.0%) |
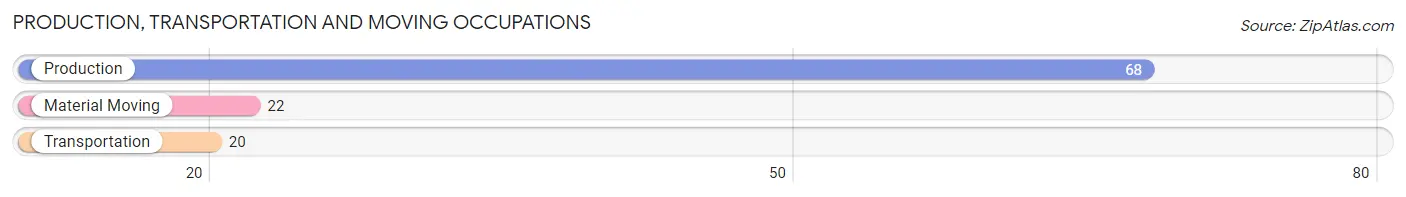
Production, Transportation and Moving Occupations
The most common Production, Transportation and Moving occupations in Allison are Production (68 | 13.7%), Material Moving (22 | 4.4%), and Transportation (20 | 4.0%).
Production, Transportation and Moving Occupations by Sex
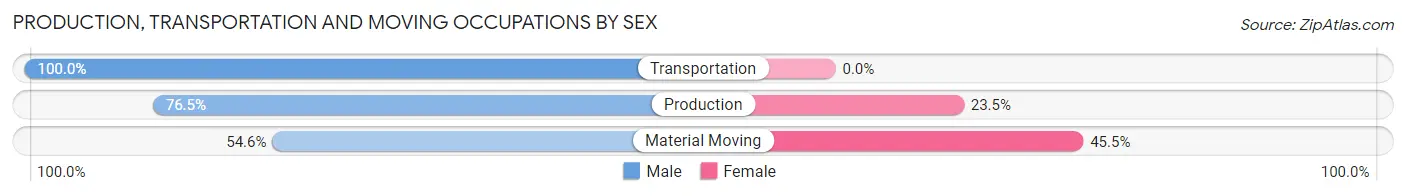
| Occupation | Male | Female |
| Production | 52 (76.5%) | 16 (23.5%) |
| Transportation | 20 (100.0%) | 0 (0.0%) |
| Material Moving | 12 (54.5%) | 10 (45.5%) |
| Total (Category) | 84 (76.4%) | 26 (23.6%) |
| Total (Overall) | 288 (58.0%) | 209 (42.0%) |
Employment Industries by Sex in Allison
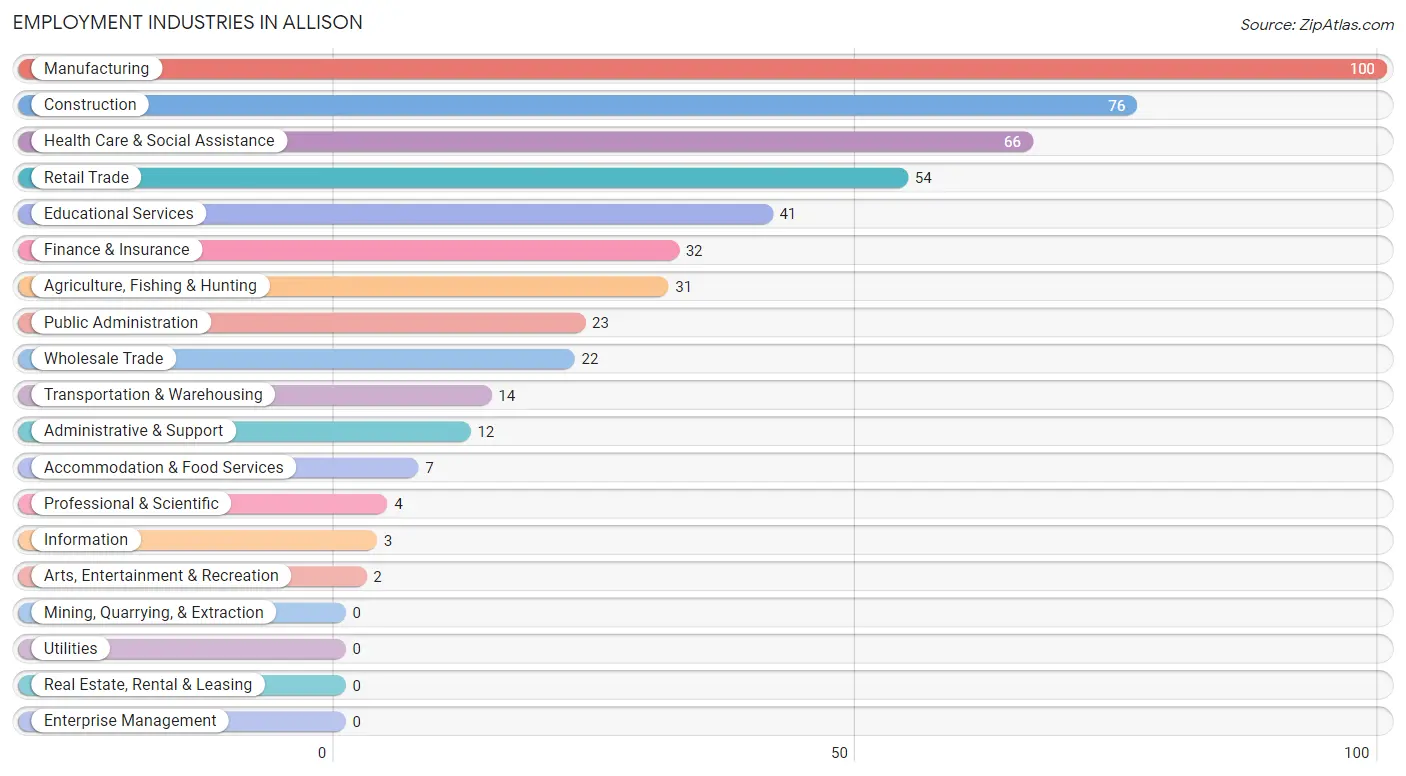
Employment Industries in Allison
The major employment industries in Allison include Manufacturing (100 | 20.1%), Construction (76 | 15.3%), Health Care & Social Assistance (66 | 13.3%), Retail Trade (54 | 10.9%), and Educational Services (41 | 8.3%).
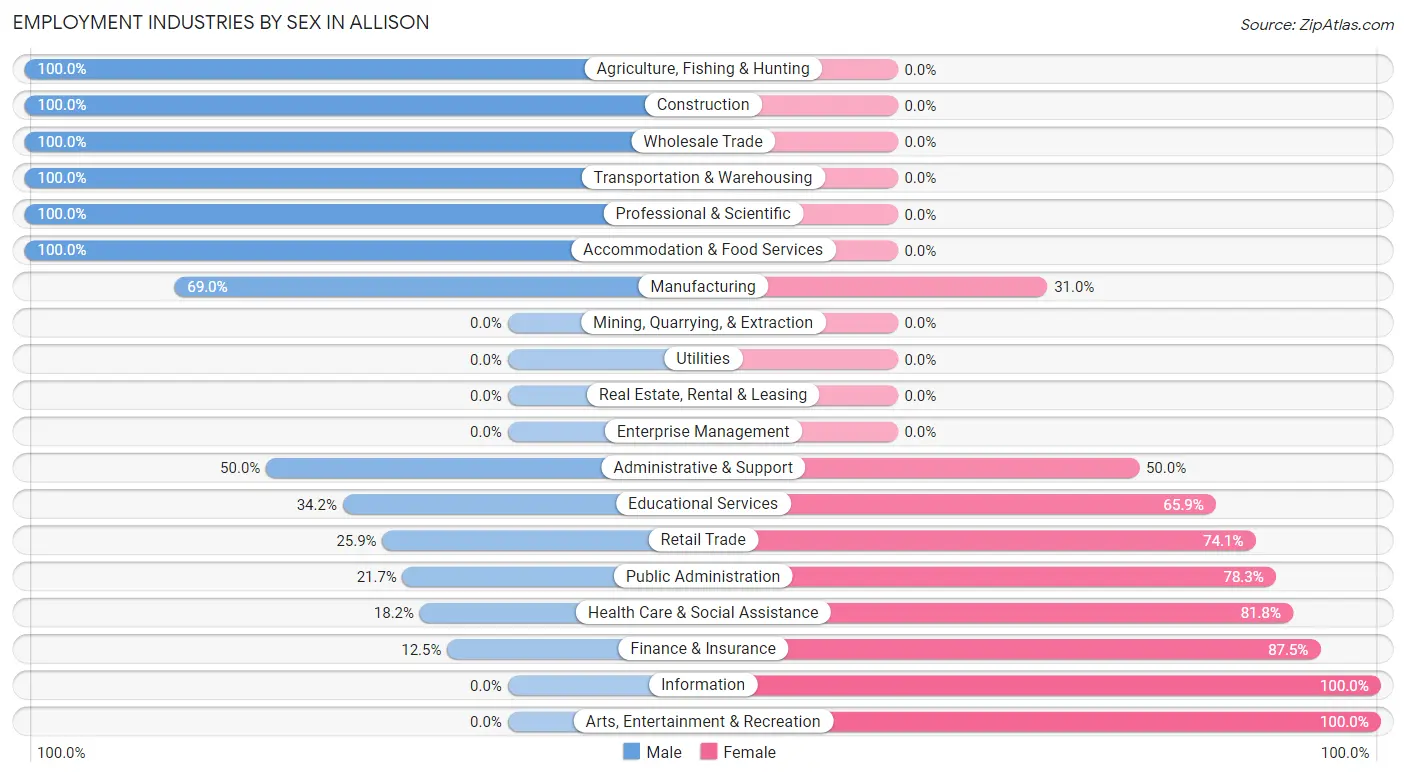
Employment Industries by Sex in Allison
The Allison industries that see more men than women are Agriculture, Fishing & Hunting (100.0%), Construction (100.0%), and Wholesale Trade (100.0%), whereas the industries that tend to have a higher number of women are Information (100.0%), Arts, Entertainment & Recreation (100.0%), and Finance & Insurance (87.5%).
| Industry | Male | Female |
| Agriculture, Fishing & Hunting | 31 (100.0%) | 0 (0.0%) |
| Mining, Quarrying, & Extraction | 0 (0.0%) | 0 (0.0%) |
| Construction | 76 (100.0%) | 0 (0.0%) |
| Manufacturing | 69 (69.0%) | 31 (31.0%) |
| Wholesale Trade | 22 (100.0%) | 0 (0.0%) |
| Retail Trade | 14 (25.9%) | 40 (74.1%) |
| Transportation & Warehousing | 14 (100.0%) | 0 (0.0%) |
| Utilities | 0 (0.0%) | 0 (0.0%) |
| Information | 0 (0.0%) | 3 (100.0%) |
| Finance & Insurance | 4 (12.5%) | 28 (87.5%) |
| Real Estate, Rental & Leasing | 0 (0.0%) | 0 (0.0%) |
| Professional & Scientific | 4 (100.0%) | 0 (0.0%) |
| Enterprise Management | 0 (0.0%) | 0 (0.0%) |
| Administrative & Support | 6 (50.0%) | 6 (50.0%) |
| Educational Services | 14 (34.2%) | 27 (65.8%) |
| Health Care & Social Assistance | 12 (18.2%) | 54 (81.8%) |
| Arts, Entertainment & Recreation | 0 (0.0%) | 2 (100.0%) |
| Accommodation & Food Services | 7 (100.0%) | 0 (0.0%) |
| Public Administration | 5 (21.7%) | 18 (78.3%) |
| Total | 288 (58.0%) | 209 (42.0%) |
Education in Allison
School Enrollment in Allison
The most common levels of schooling among the 169 students in Allison are high school (76 | 45.0%), middle school (57 | 33.7%), and college / undergraduate (15 | 8.9%).
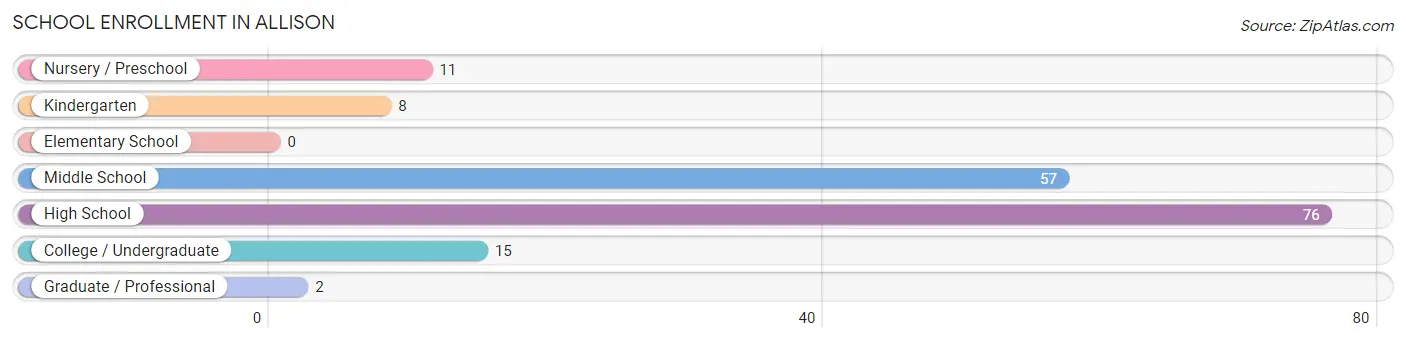
| School Level | # Students | % Students |
| Nursery / Preschool | 11 | 6.5% |
| Kindergarten | 8 | 4.7% |
| Elementary School | 0 | 0.0% |
| Middle School | 57 | 33.7% |
| High School | 76 | 45.0% |
| College / Undergraduate | 15 | 8.9% |
| Graduate / Professional | 2 | 1.2% |
| Total | 169 | 100.0% |
School Enrollment by Age by Funding Source in Allison
Out of a total of 169 students who are enrolled in schools in Allison, 8 (4.7%) attend a private institution, while the remaining 161 (95.3%) are enrolled in public schools. The age group of 25 to 34 year olds has the highest likelihood of being enrolled in private schools, with 8 (80.0% in the age bracket) enrolled. Conversely, the age group of 3 to 4 year olds has the lowest likelihood of being enrolled in a private school, with 8 (100.0% in the age bracket) attending a public institution.
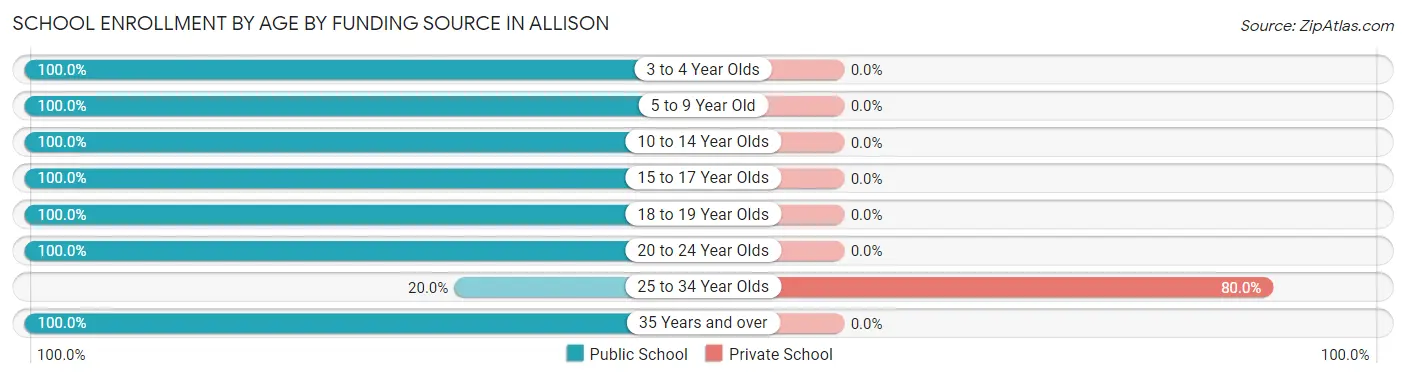
| Age Bracket | Public School | Private School |
| 3 to 4 Year Olds | 8 (100.0%) | 0 (0.0%) |
| 5 to 9 Year Old | 11 (100.0%) | 0 (0.0%) |
| 10 to 14 Year Olds | 57 (100.0%) | 0 (0.0%) |
| 15 to 17 Year Olds | 72 (100.0%) | 0 (0.0%) |
| 18 to 19 Year Olds | 3 (100.0%) | 0 (0.0%) |
| 20 to 24 Year Olds | 7 (100.0%) | 0 (0.0%) |
| 25 to 34 Year Olds | 2 (20.0%) | 8 (80.0%) |
| 35 Years and over | 1 (100.0%) | 0 (0.0%) |
| Total | 161 (95.3%) | 8 (4.7%) |
Educational Attainment by Field of Study in Allison
Education (52 | 37.1%), business (29 | 20.7%), science & technology (19 | 13.6%), social sciences (11 | 7.9%), and visual & performing arts (7 | 5.0%) are the most common fields of study among 140 individuals in Allison who have obtained a bachelor's degree or higher.
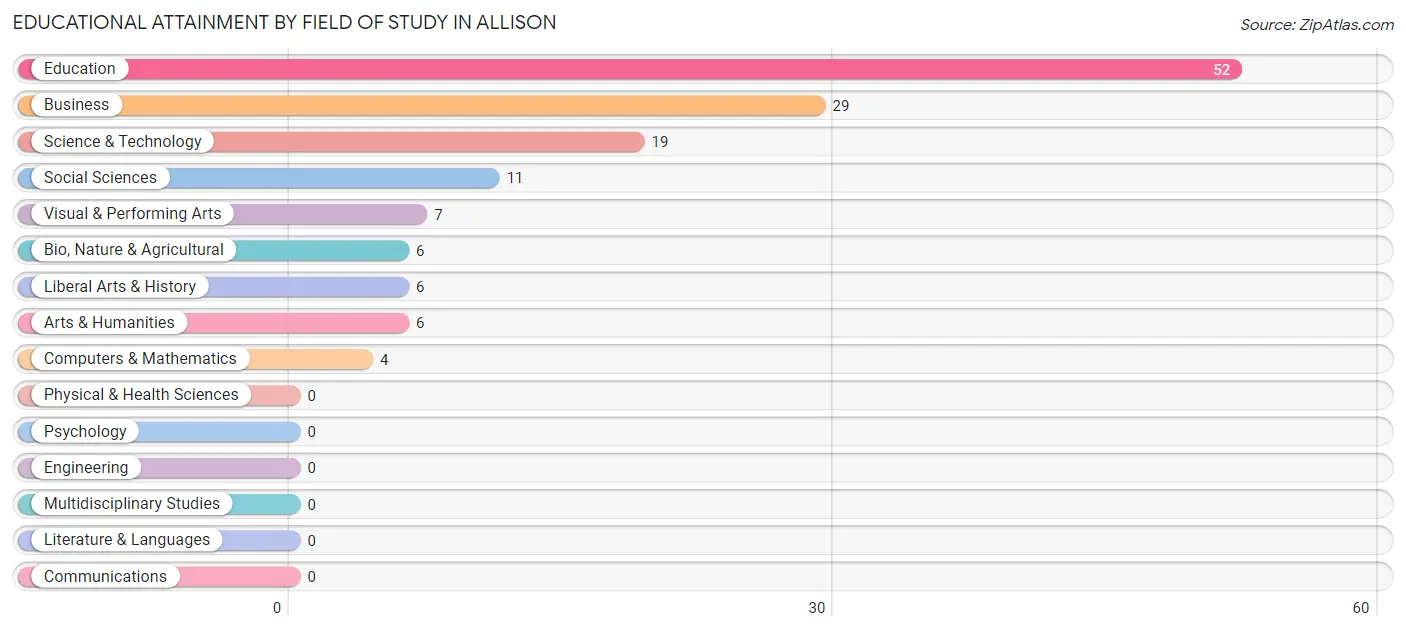
| Field of Study | # Graduates | % Graduates |
| Computers & Mathematics | 4 | 2.9% |
| Bio, Nature & Agricultural | 6 | 4.3% |
| Physical & Health Sciences | 0 | 0.0% |
| Psychology | 0 | 0.0% |
| Social Sciences | 11 | 7.9% |
| Engineering | 0 | 0.0% |
| Multidisciplinary Studies | 0 | 0.0% |
| Science & Technology | 19 | 13.6% |
| Business | 29 | 20.7% |
| Education | 52 | 37.1% |
| Literature & Languages | 0 | 0.0% |
| Liberal Arts & History | 6 | 4.3% |
| Visual & Performing Arts | 7 | 5.0% |
| Communications | 0 | 0.0% |
| Arts & Humanities | 6 | 4.3% |
| Total | 140 | 100.0% |
Transportation & Commute in Allison
Vehicle Availability by Sex in Allison
The most prevalent vehicle ownership categories in Allison are males with 2 vehicles (126, accounting for 43.8%) and females with 2 vehicles (92, making up 60.3%).
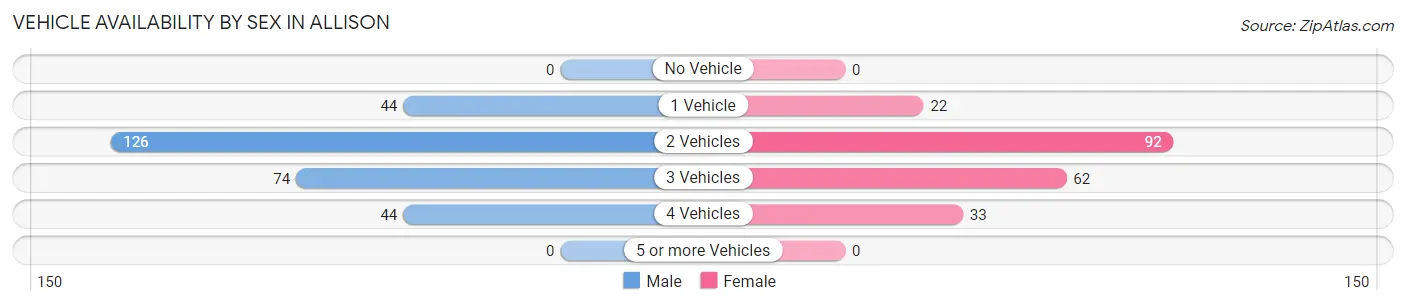
| Vehicles Available | Male | Female |
| No Vehicle | 0 (0.0%) | 0 (0.0%) |
| 1 Vehicle | 44 (15.3%) | 22 (10.5%) |
| 2 Vehicles | 126 (43.8%) | 92 (44.0%) |
| 3 Vehicles | 74 (25.7%) | 62 (29.7%) |
| 4 Vehicles | 44 (15.3%) | 33 (15.8%) |
| 5 or more Vehicles | 0 (0.0%) | 0 (0.0%) |
| Total | 288 (100.0%) | 209 (100.0%) |
Commute Time in Allison
The most frequently occuring commute durations in Allison are 5 to 9 minutes (87 commuters, 17.9%), less than 5 minutes (75 commuters, 15.4%), and 15 to 19 minutes (62 commuters, 12.7%).
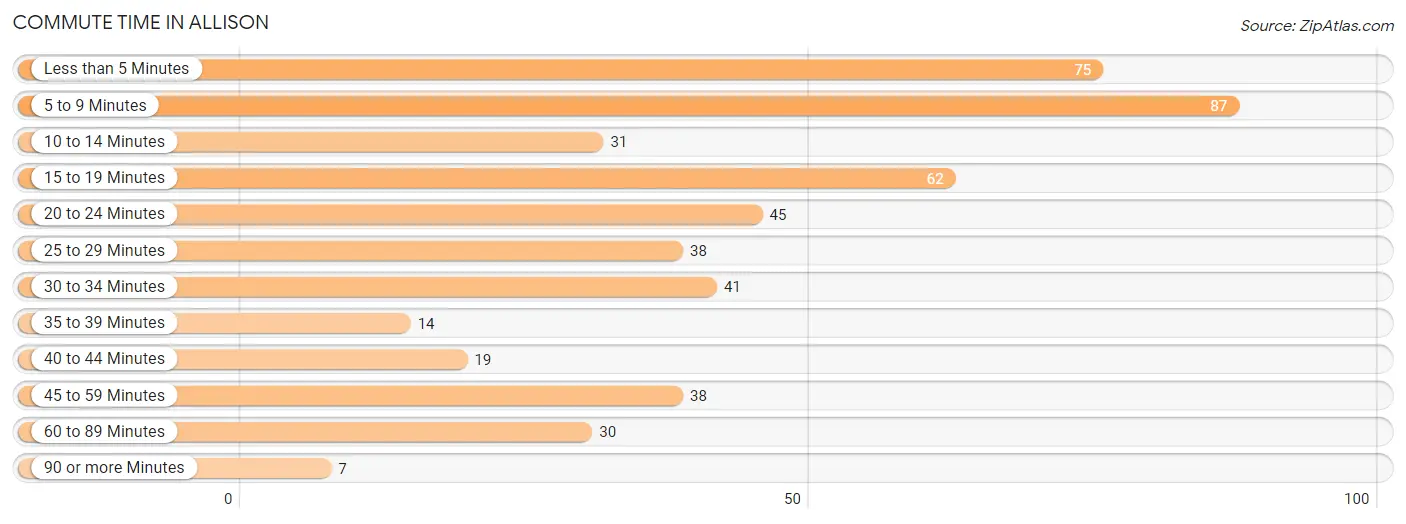
| Commute Time | # Commuters | % Commuters |
| Less than 5 Minutes | 75 | 15.4% |
| 5 to 9 Minutes | 87 | 17.9% |
| 10 to 14 Minutes | 31 | 6.4% |
| 15 to 19 Minutes | 62 | 12.7% |
| 20 to 24 Minutes | 45 | 9.2% |
| 25 to 29 Minutes | 38 | 7.8% |
| 30 to 34 Minutes | 41 | 8.4% |
| 35 to 39 Minutes | 14 | 2.9% |
| 40 to 44 Minutes | 19 | 3.9% |
| 45 to 59 Minutes | 38 | 7.8% |
| 60 to 89 Minutes | 30 | 6.2% |
| 90 or more Minutes | 7 | 1.4% |
Commute Time by Sex in Allison
The most common commute times in Allison are 15 to 19 minutes (46 commuters, 16.0%) for males and 5 to 9 minutes (46 commuters, 23.1%) for females.
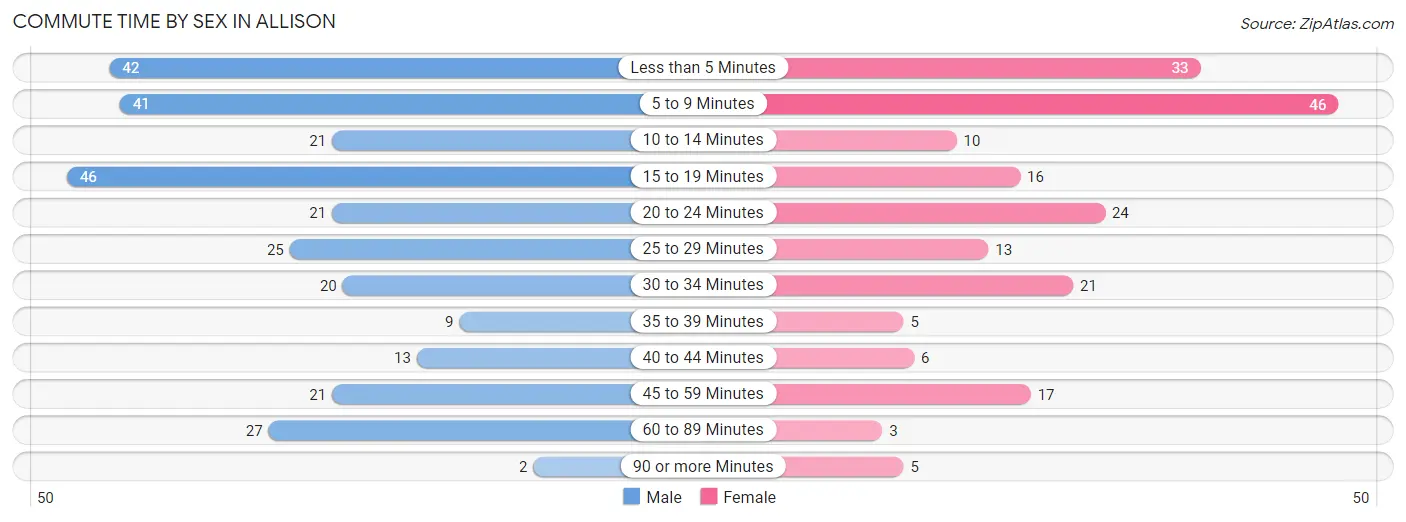
| Commute Time | Male | Female |
| Less than 5 Minutes | 42 (14.6%) | 33 (16.6%) |
| 5 to 9 Minutes | 41 (14.2%) | 46 (23.1%) |
| 10 to 14 Minutes | 21 (7.3%) | 10 (5.0%) |
| 15 to 19 Minutes | 46 (16.0%) | 16 (8.0%) |
| 20 to 24 Minutes | 21 (7.3%) | 24 (12.1%) |
| 25 to 29 Minutes | 25 (8.7%) | 13 (6.5%) |
| 30 to 34 Minutes | 20 (6.9%) | 21 (10.5%) |
| 35 to 39 Minutes | 9 (3.1%) | 5 (2.5%) |
| 40 to 44 Minutes | 13 (4.5%) | 6 (3.0%) |
| 45 to 59 Minutes | 21 (7.3%) | 17 (8.5%) |
| 60 to 89 Minutes | 27 (9.4%) | 3 (1.5%) |
| 90 or more Minutes | 2 (0.7%) | 5 (2.5%) |
Time of Departure to Work by Sex in Allison
The most frequent times of departure to work in Allison are 6:30 AM to 6:59 AM (43, 14.9%) for males and 7:00 AM to 7:29 AM (60, 30.1%) for females.
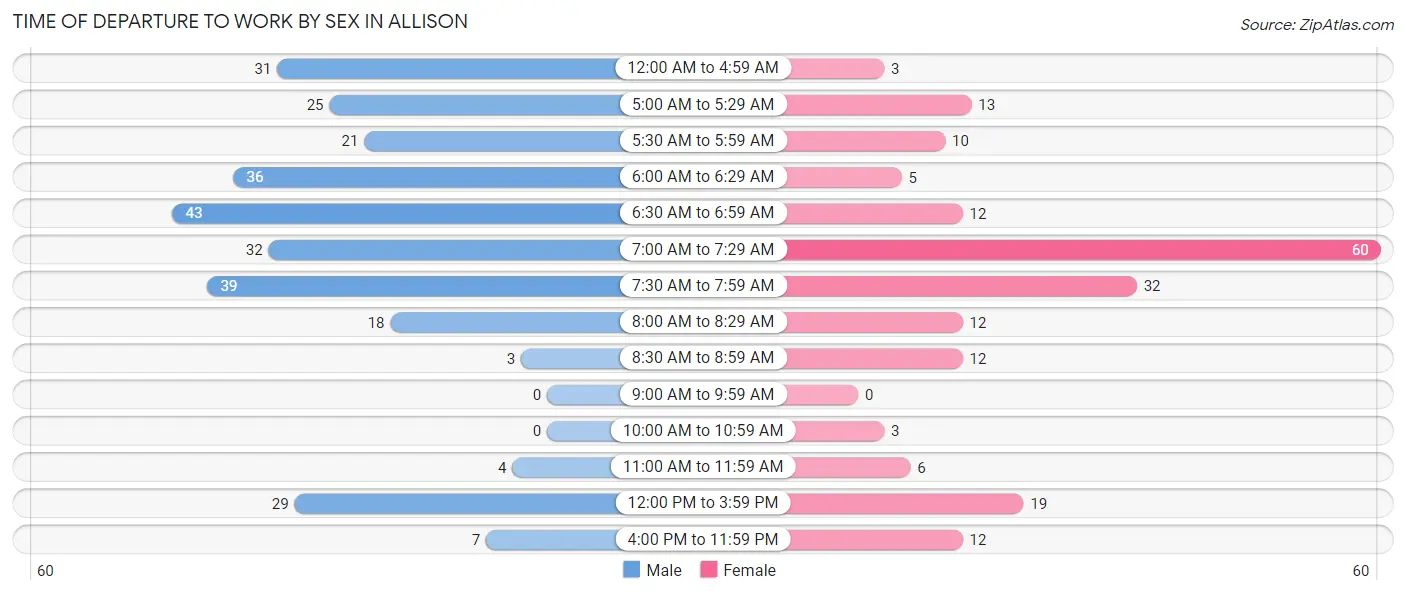
| Time of Departure | Male | Female |
| 12:00 AM to 4:59 AM | 31 (10.8%) | 3 (1.5%) |
| 5:00 AM to 5:29 AM | 25 (8.7%) | 13 (6.5%) |
| 5:30 AM to 5:59 AM | 21 (7.3%) | 10 (5.0%) |
| 6:00 AM to 6:29 AM | 36 (12.5%) | 5 (2.5%) |
| 6:30 AM to 6:59 AM | 43 (14.9%) | 12 (6.0%) |
| 7:00 AM to 7:29 AM | 32 (11.1%) | 60 (30.1%) |
| 7:30 AM to 7:59 AM | 39 (13.5%) | 32 (16.1%) |
| 8:00 AM to 8:29 AM | 18 (6.2%) | 12 (6.0%) |
| 8:30 AM to 8:59 AM | 3 (1.0%) | 12 (6.0%) |
| 9:00 AM to 9:59 AM | 0 (0.0%) | 0 (0.0%) |
| 10:00 AM to 10:59 AM | 0 (0.0%) | 3 (1.5%) |
| 11:00 AM to 11:59 AM | 4 (1.4%) | 6 (3.0%) |
| 12:00 PM to 3:59 PM | 29 (10.1%) | 19 (9.6%) |
| 4:00 PM to 11:59 PM | 7 (2.4%) | 12 (6.0%) |
| Total | 288 (100.0%) | 199 (100.0%) |
Housing Occupancy in Allison
Occupancy by Ownership in Allison
Of the total 437 dwellings in Allison, owner-occupied units account for 316 (72.3%), while renter-occupied units make up 121 (27.7%).
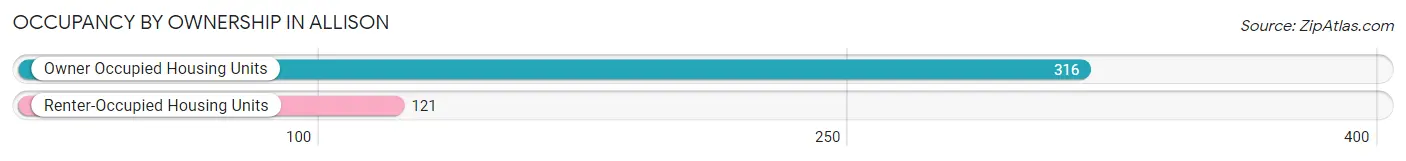
| Occupancy | # Housing Units | % Housing Units |
| Owner Occupied Housing Units | 316 | 72.3% |
| Renter-Occupied Housing Units | 121 | 27.7% |
| Total Occupied Housing Units | 437 | 100.0% |
Occupancy by Household Size in Allison
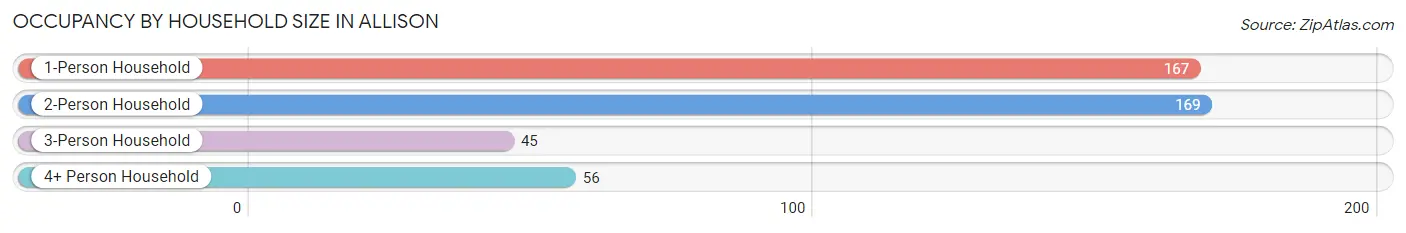
| Household Size | # Housing Units | % Housing Units |
| 1-Person Household | 167 | 38.2% |
| 2-Person Household | 169 | 38.7% |
| 3-Person Household | 45 | 10.3% |
| 4+ Person Household | 56 | 12.8% |
| Total Housing Units | 437 | 100.0% |
Occupancy by Ownership by Household Size in Allison
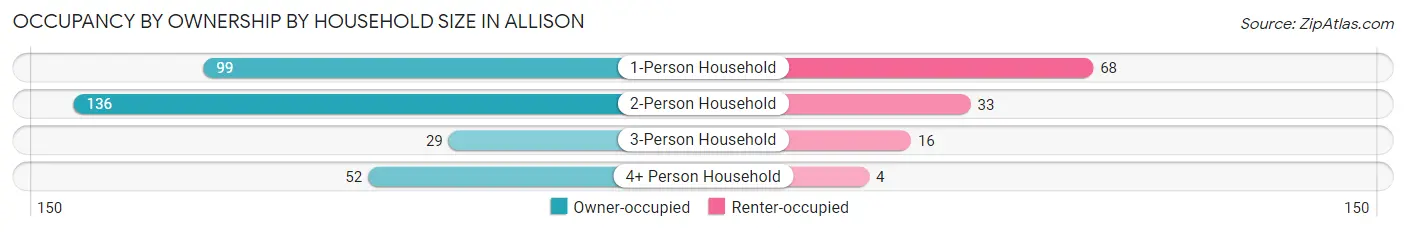
| Household Size | Owner-occupied | Renter-occupied |
| 1-Person Household | 99 (59.3%) | 68 (40.7%) |
| 2-Person Household | 136 (80.5%) | 33 (19.5%) |
| 3-Person Household | 29 (64.4%) | 16 (35.6%) |
| 4+ Person Household | 52 (92.9%) | 4 (7.1%) |
| Total Housing Units | 316 (72.3%) | 121 (27.7%) |
Occupancy by Educational Attainment in Allison
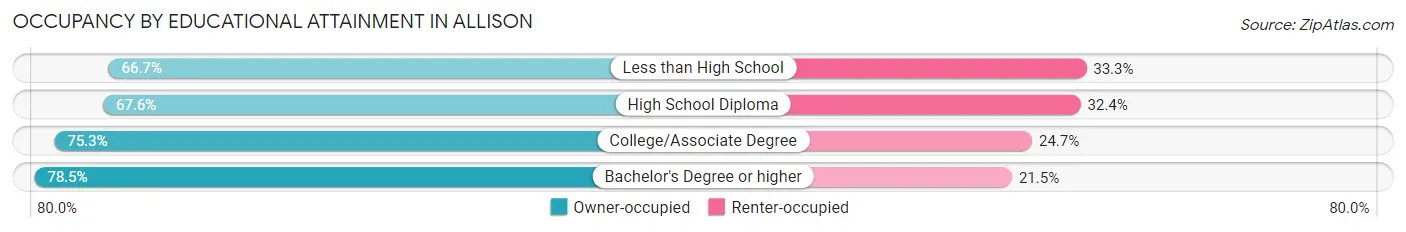
| Household Size | Owner-occupied | Renter-occupied |
| Less than High School | 6 (66.7%) | 3 (33.3%) |
| High School Diploma | 125 (67.6%) | 60 (32.4%) |
| College/Associate Degree | 134 (75.3%) | 44 (24.7%) |
| Bachelor's Degree or higher | 51 (78.5%) | 14 (21.5%) |
Occupancy by Age of Householder in Allison
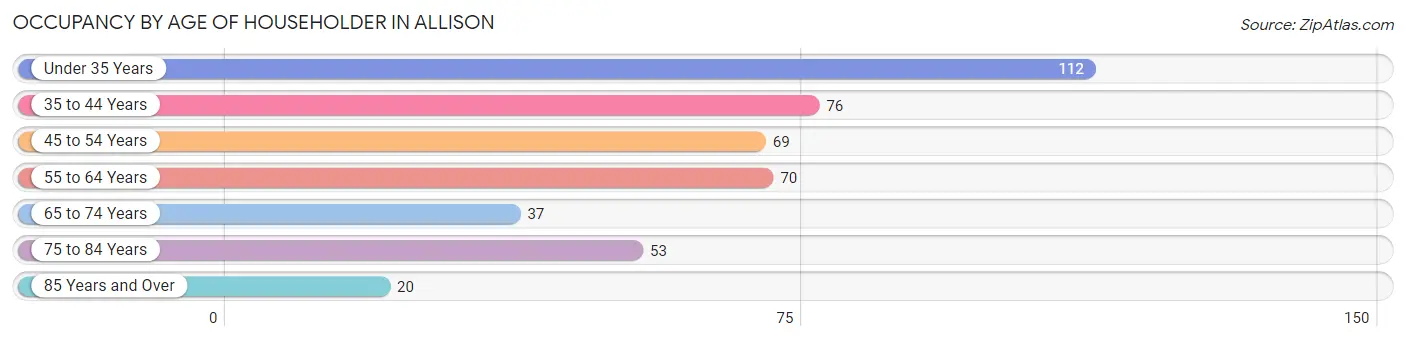
| Age Bracket | # Households | % Households |
| Under 35 Years | 112 | 25.6% |
| 35 to 44 Years | 76 | 17.4% |
| 45 to 54 Years | 69 | 15.8% |
| 55 to 64 Years | 70 | 16.0% |
| 65 to 74 Years | 37 | 8.5% |
| 75 to 84 Years | 53 | 12.1% |
| 85 Years and Over | 20 | 4.6% |
| Total | 437 | 100.0% |
Housing Finances in Allison
Median Income by Occupancy in Allison
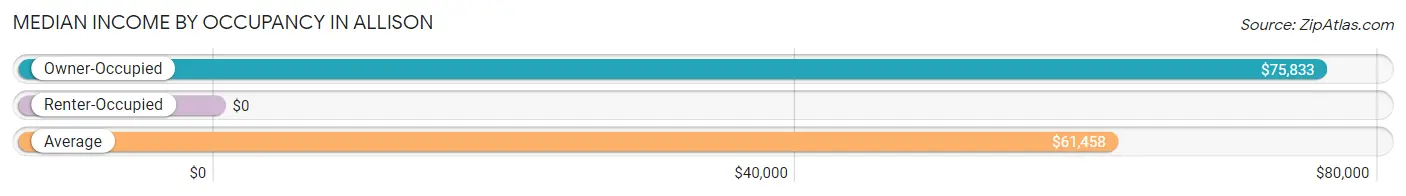
| Occupancy Type | # Households | Median Income |
| Owner-Occupied | 316 (72.3%) | $75,833 |
| Renter-Occupied | 121 (27.7%) | $0 |
| Average | 437 (100.0%) | $61,458 |
Occupancy by Householder Income Bracket in Allison
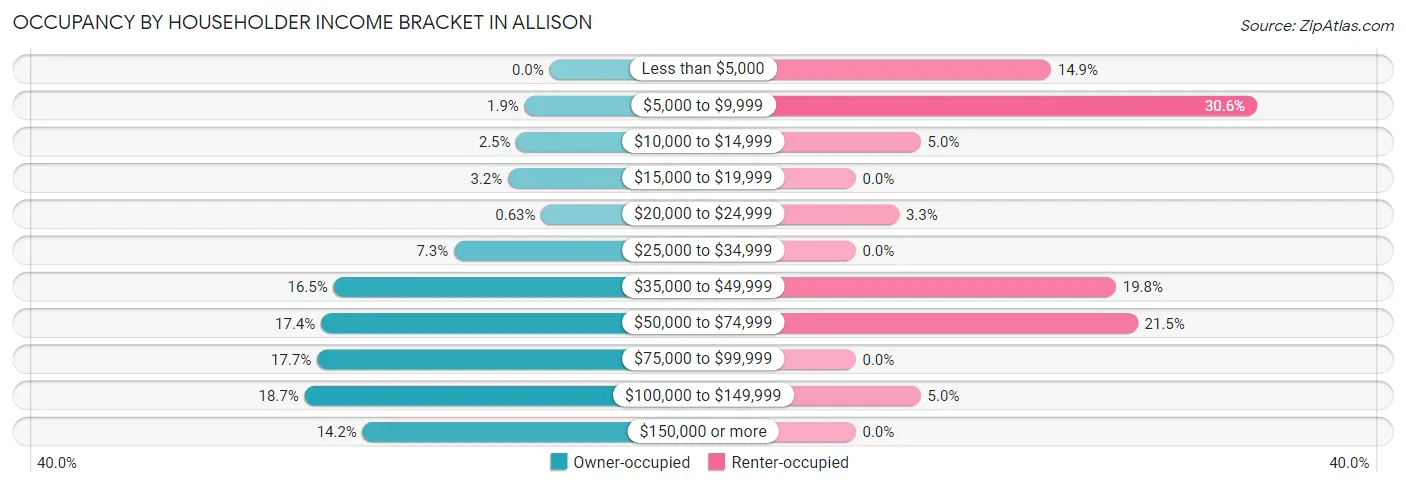
| Income Bracket | Owner-occupied | Renter-occupied |
| Less than $5,000 | 0 (0.0%) | 18 (14.9%) |
| $5,000 to $9,999 | 6 (1.9%) | 37 (30.6%) |
| $10,000 to $14,999 | 8 (2.5%) | 6 (5.0%) |
| $15,000 to $19,999 | 10 (3.2%) | 0 (0.0%) |
| $20,000 to $24,999 | 2 (0.6%) | 4 (3.3%) |
| $25,000 to $34,999 | 23 (7.3%) | 0 (0.0%) |
| $35,000 to $49,999 | 52 (16.5%) | 24 (19.8%) |
| $50,000 to $74,999 | 55 (17.4%) | 26 (21.5%) |
| $75,000 to $99,999 | 56 (17.7%) | 0 (0.0%) |
| $100,000 to $149,999 | 59 (18.7%) | 6 (5.0%) |
| $150,000 or more | 45 (14.2%) | 0 (0.0%) |
| Total | 316 (100.0%) | 121 (100.0%) |
Monthly Housing Cost Tiers in Allison
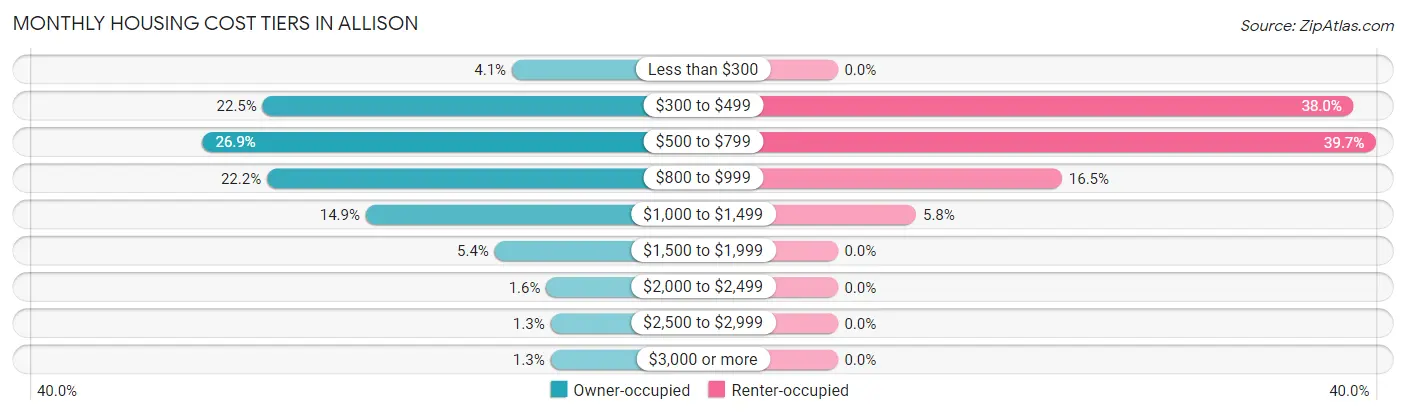
| Monthly Cost | Owner-occupied | Renter-occupied |
| Less than $300 | 13 (4.1%) | 0 (0.0%) |
| $300 to $499 | 71 (22.5%) | 46 (38.0%) |
| $500 to $799 | 85 (26.9%) | 48 (39.7%) |
| $800 to $999 | 70 (22.2%) | 20 (16.5%) |
| $1,000 to $1,499 | 47 (14.9%) | 7 (5.8%) |
| $1,500 to $1,999 | 17 (5.4%) | 0 (0.0%) |
| $2,000 to $2,499 | 5 (1.6%) | 0 (0.0%) |
| $2,500 to $2,999 | 4 (1.3%) | 0 (0.0%) |
| $3,000 or more | 4 (1.3%) | 0 (0.0%) |
| Total | 316 (100.0%) | 121 (100.0%) |
Physical Housing Characteristics in Allison
Housing Structures in Allison
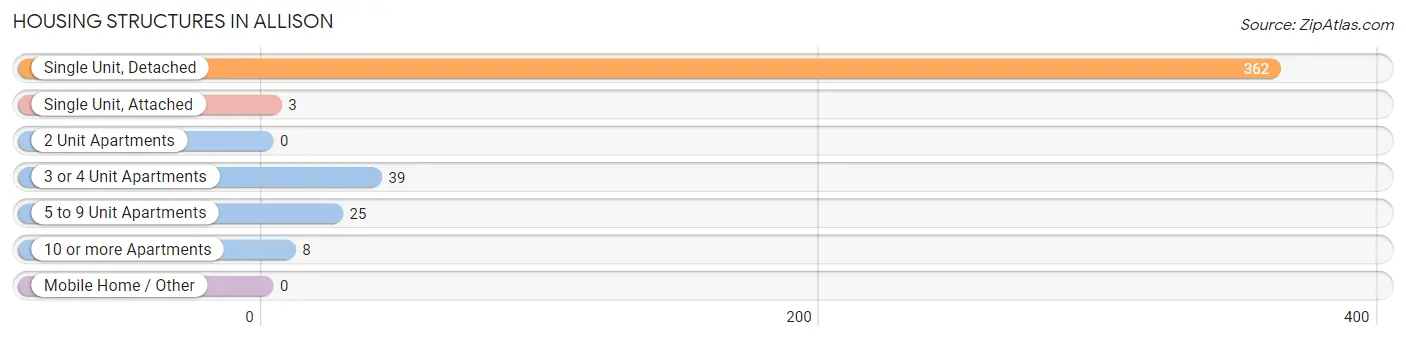
| Structure Type | # Housing Units | % Housing Units |
| Single Unit, Detached | 362 | 82.8% |
| Single Unit, Attached | 3 | 0.7% |
| 2 Unit Apartments | 0 | 0.0% |
| 3 or 4 Unit Apartments | 39 | 8.9% |
| 5 to 9 Unit Apartments | 25 | 5.7% |
| 10 or more Apartments | 8 | 1.8% |
| Mobile Home / Other | 0 | 0.0% |
| Total | 437 | 100.0% |
Housing Structures by Occupancy in Allison
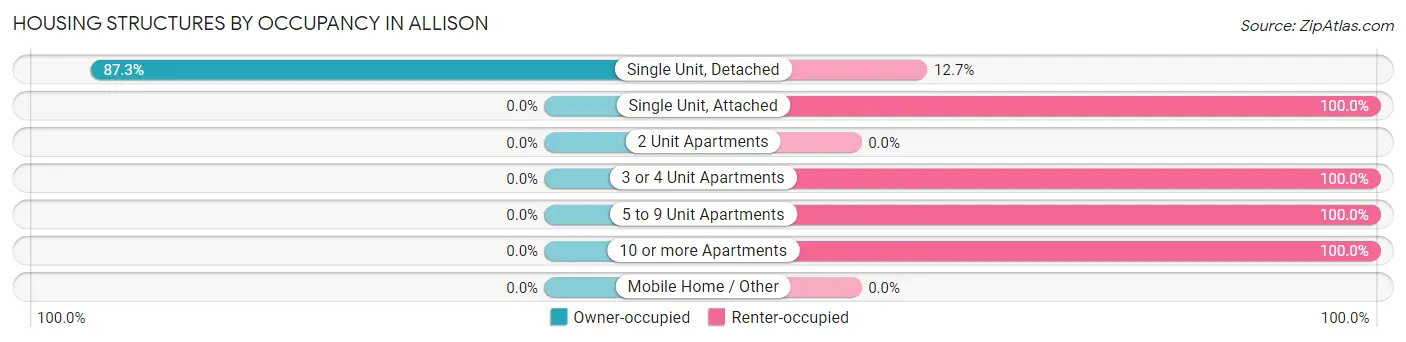
| Structure Type | Owner-occupied | Renter-occupied |
| Single Unit, Detached | 316 (87.3%) | 46 (12.7%) |
| Single Unit, Attached | 0 (0.0%) | 3 (100.0%) |
| 2 Unit Apartments | 0 (0.0%) | 0 (0.0%) |
| 3 or 4 Unit Apartments | 0 (0.0%) | 39 (100.0%) |
| 5 to 9 Unit Apartments | 0 (0.0%) | 25 (100.0%) |
| 10 or more Apartments | 0 (0.0%) | 8 (100.0%) |
| Mobile Home / Other | 0 (0.0%) | 0 (0.0%) |
| Total | 316 (72.3%) | 121 (27.7%) |
Housing Structures by Number of Rooms in Allison
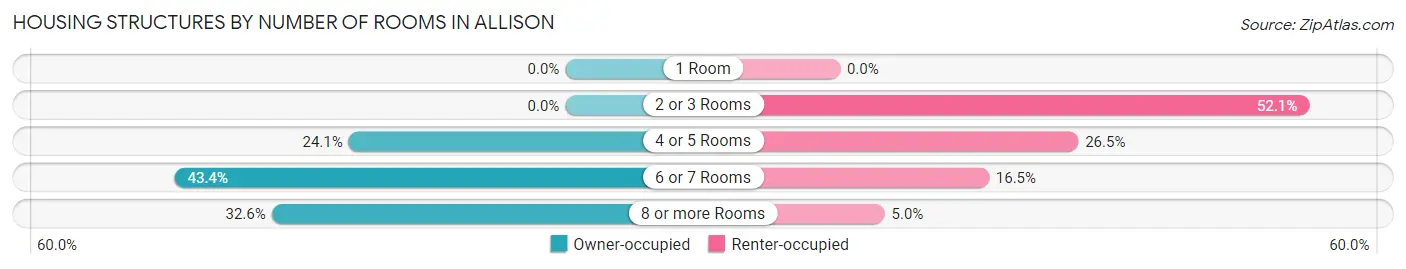
| Number of Rooms | Owner-occupied | Renter-occupied |
| 1 Room | 0 (0.0%) | 0 (0.0%) |
| 2 or 3 Rooms | 0 (0.0%) | 63 (52.1%) |
| 4 or 5 Rooms | 76 (24.0%) | 32 (26.5%) |
| 6 or 7 Rooms | 137 (43.3%) | 20 (16.5%) |
| 8 or more Rooms | 103 (32.6%) | 6 (5.0%) |
| Total | 316 (100.0%) | 121 (100.0%) |
Housing Structure by Heating Type in Allison
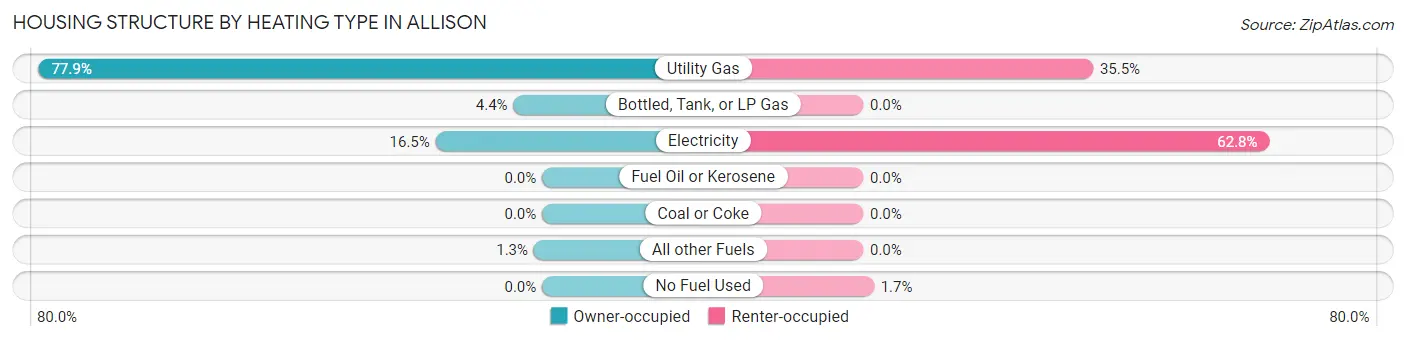
| Heating Type | Owner-occupied | Renter-occupied |
| Utility Gas | 246 (77.8%) | 43 (35.5%) |
| Bottled, Tank, or LP Gas | 14 (4.4%) | 0 (0.0%) |
| Electricity | 52 (16.5%) | 76 (62.8%) |
| Fuel Oil or Kerosene | 0 (0.0%) | 0 (0.0%) |
| Coal or Coke | 0 (0.0%) | 0 (0.0%) |
| All other Fuels | 4 (1.3%) | 0 (0.0%) |
| No Fuel Used | 0 (0.0%) | 2 (1.7%) |
| Total | 316 (100.0%) | 121 (100.0%) |
Household Vehicle Usage in Allison
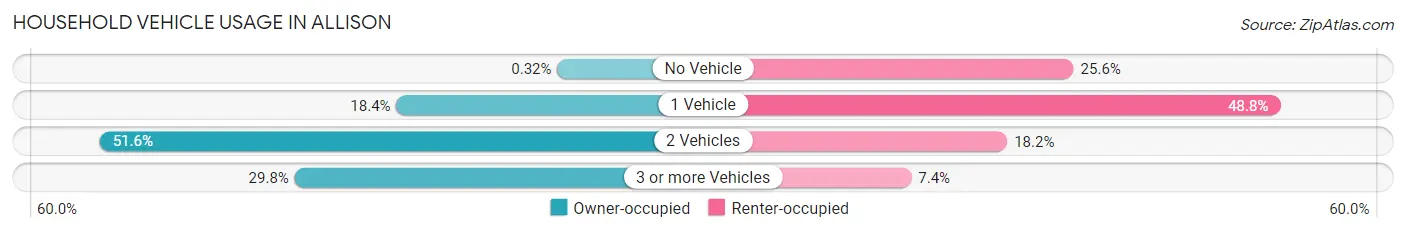
| Vehicles per Household | Owner-occupied | Renter-occupied |
| No Vehicle | 1 (0.3%) | 31 (25.6%) |
| 1 Vehicle | 58 (18.3%) | 59 (48.8%) |
| 2 Vehicles | 163 (51.6%) | 22 (18.2%) |
| 3 or more Vehicles | 94 (29.7%) | 9 (7.4%) |
| Total | 316 (100.0%) | 121 (100.0%) |
Real Estate & Mortgages in Allison
Real Estate and Mortgage Overview in Allison
| Characteristic | Without Mortgage | With Mortgage |
| Housing Units | 126 | 190 |
| Median Property Value | $105,900 | $98,300 |
| Median Household Income | $49,063 | $35 |
| Monthly Housing Costs | $409 | $4 |
| Real Estate Taxes | $1,817 | $0 |
Property Value by Mortgage Status in Allison
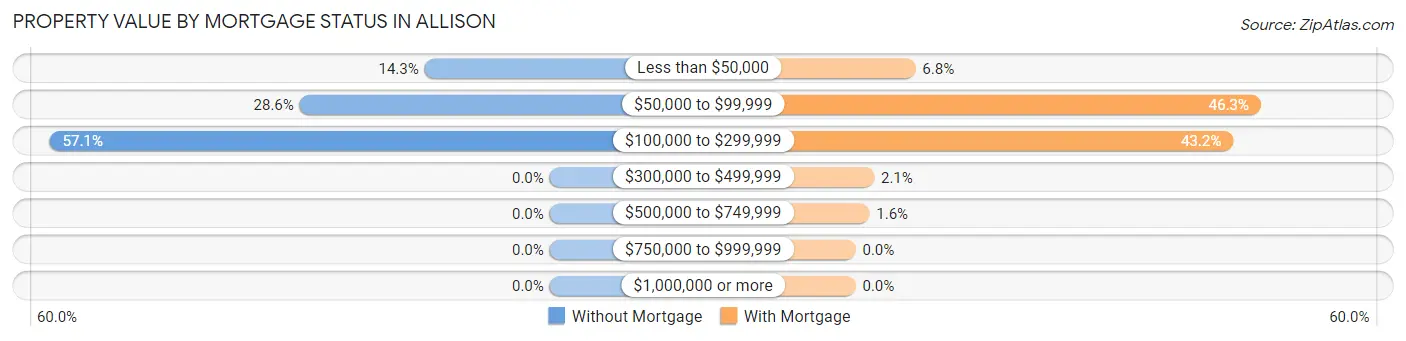
| Property Value | Without Mortgage | With Mortgage |
| Less than $50,000 | 18 (14.3%) | 13 (6.8%) |
| $50,000 to $99,999 | 36 (28.6%) | 88 (46.3%) |
| $100,000 to $299,999 | 72 (57.1%) | 82 (43.2%) |
| $300,000 to $499,999 | 0 (0.0%) | 4 (2.1%) |
| $500,000 to $749,999 | 0 (0.0%) | 3 (1.6%) |
| $750,000 to $999,999 | 0 (0.0%) | 0 (0.0%) |
| $1,000,000 or more | 0 (0.0%) | 0 (0.0%) |
| Total | 126 (100.0%) | 190 (100.0%) |
Household Income by Mortgage Status in Allison
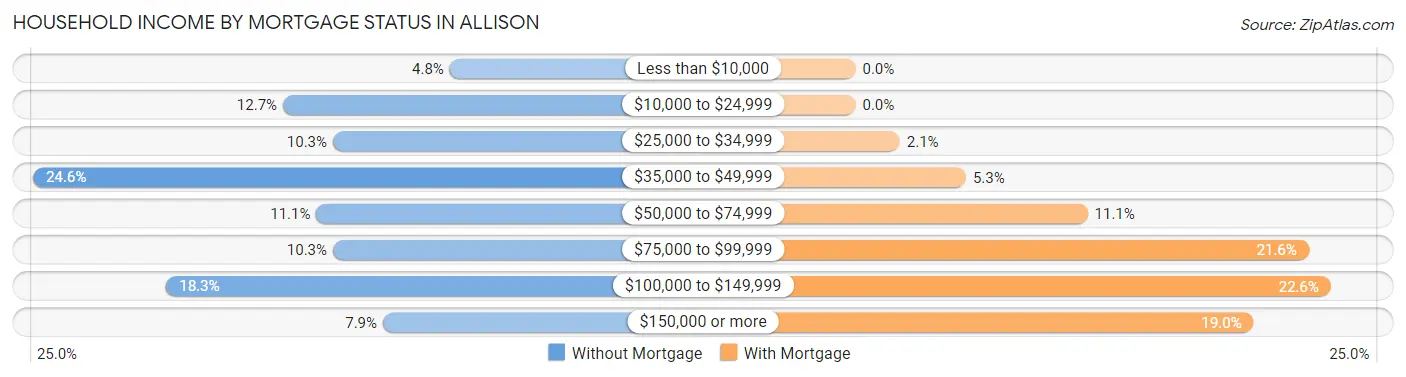
| Household Income | Without Mortgage | With Mortgage |
| Less than $10,000 | 6 (4.8%) | 0 (0.0%) |
| $10,000 to $24,999 | 16 (12.7%) | 0 (0.0%) |
| $25,000 to $34,999 | 13 (10.3%) | 4 (2.1%) |
| $35,000 to $49,999 | 31 (24.6%) | 10 (5.3%) |
| $50,000 to $74,999 | 14 (11.1%) | 21 (11.1%) |
| $75,000 to $99,999 | 13 (10.3%) | 41 (21.6%) |
| $100,000 to $149,999 | 23 (18.2%) | 43 (22.6%) |
| $150,000 or more | 10 (7.9%) | 36 (19.0%) |
| Total | 126 (100.0%) | 190 (100.0%) |
Property Value to Household Income Ratio in Allison
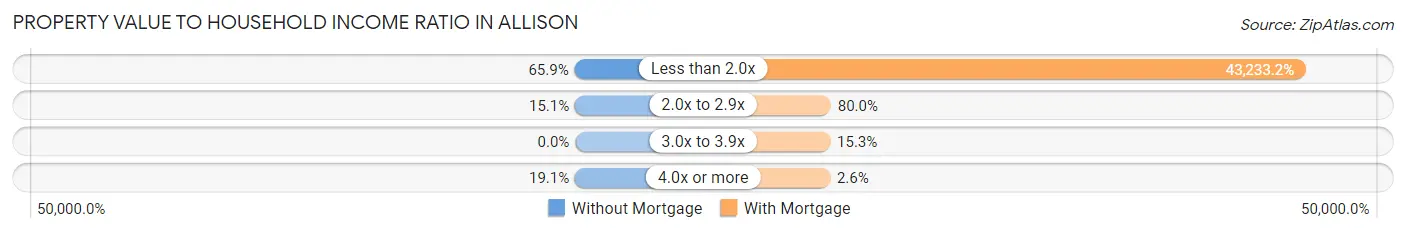
| Value-to-Income Ratio | Without Mortgage | With Mortgage |
| Less than 2.0x | 83 (65.9%) | 82,143 (43,233.2%) |
| 2.0x to 2.9x | 19 (15.1%) | 152 (80.0%) |
| 3.0x to 3.9x | 0 (0.0%) | 29 (15.3%) |
| 4.0x or more | 24 (19.1%) | 5 (2.6%) |
| Total | 126 (100.0%) | 190 (100.0%) |
Real Estate Taxes by Mortgage Status in Allison
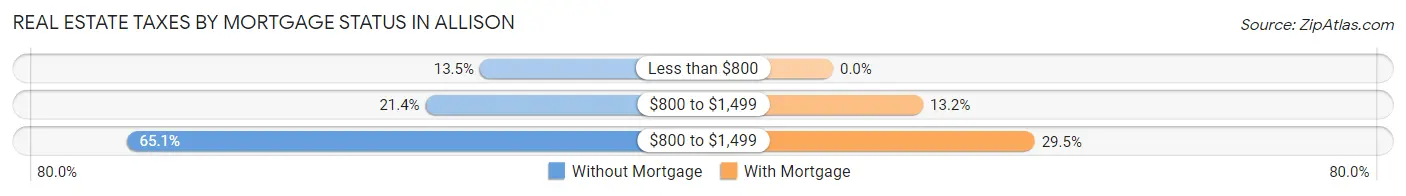
| Property Taxes | Without Mortgage | With Mortgage |
| Less than $800 | 17 (13.5%) | 0 (0.0%) |
| $800 to $1,499 | 27 (21.4%) | 25 (13.2%) |
| $800 to $1,499 | 82 (65.1%) | 56 (29.5%) |
| Total | 126 (100.0%) | 190 (100.0%) |
Health & Disability in Allison
Health Insurance Coverage by Age in Allison
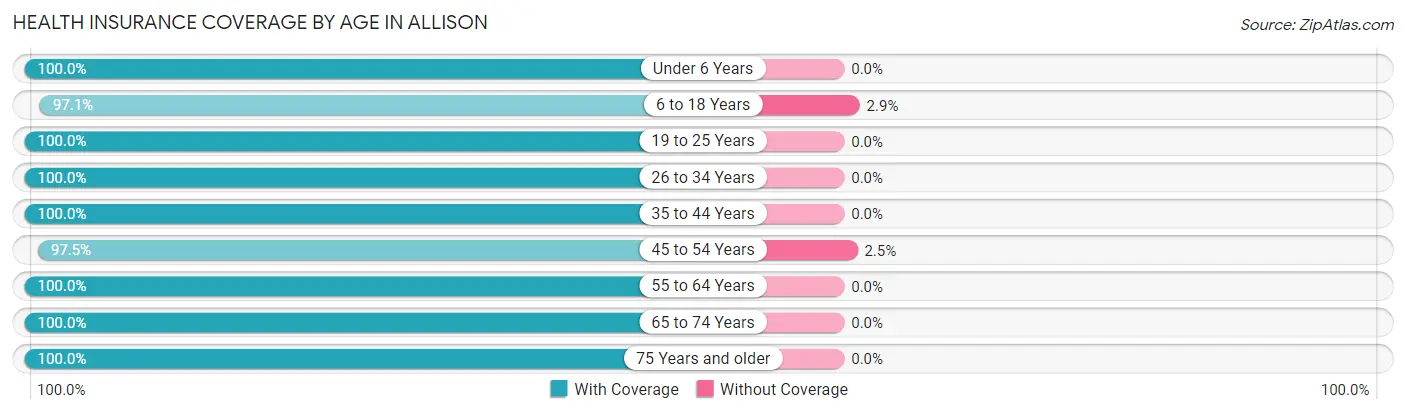
| Age Bracket | With Coverage | Without Coverage |
| Under 6 Years | 40 (100.0%) | 0 (0.0%) |
| 6 to 18 Years | 136 (97.1%) | 4 (2.9%) |
| 19 to 25 Years | 67 (100.0%) | 0 (0.0%) |
| 26 to 34 Years | 112 (100.0%) | 0 (0.0%) |
| 35 to 44 Years | 122 (100.0%) | 0 (0.0%) |
| 45 to 54 Years | 119 (97.5%) | 3 (2.5%) |
| 55 to 64 Years | 112 (100.0%) | 0 (0.0%) |
| 65 to 74 Years | 110 (100.0%) | 0 (0.0%) |
| 75 Years and older | 107 (100.0%) | 0 (0.0%) |
| Total | 925 (99.3%) | 7 (0.7%) |
Health Insurance Coverage by Citizenship Status in Allison
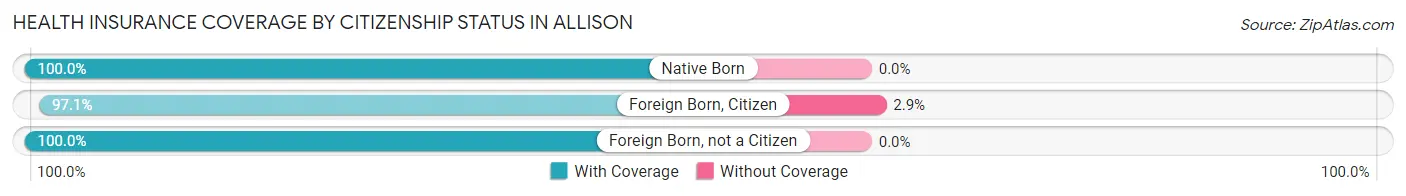
| Citizenship Status | With Coverage | Without Coverage |
| Native Born | 40 (100.0%) | 0 (0.0%) |
| Foreign Born, Citizen | 136 (97.1%) | 4 (2.9%) |
| Foreign Born, not a Citizen | 67 (100.0%) | 0 (0.0%) |
Health Insurance Coverage by Household Income in Allison
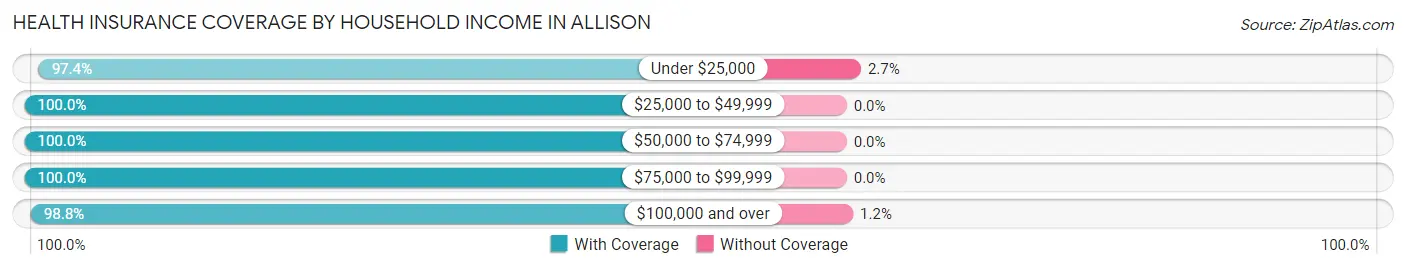
| Household Income | With Coverage | Without Coverage |
| Under $25,000 | 110 (97.4%) | 3 (2.6%) |
| $25,000 to $49,999 | 166 (100.0%) | 0 (0.0%) |
| $50,000 to $74,999 | 171 (100.0%) | 0 (0.0%) |
| $75,000 to $99,999 | 146 (100.0%) | 0 (0.0%) |
| $100,000 and over | 332 (98.8%) | 4 (1.2%) |
Public vs Private Health Insurance Coverage by Age in Allison
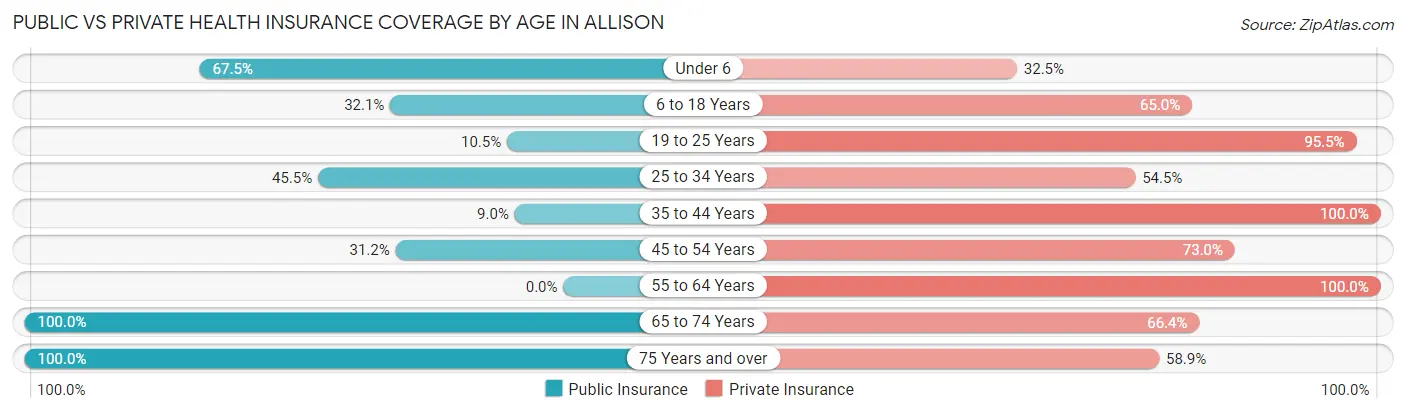
| Age Bracket | Public Insurance | Private Insurance |
| Under 6 | 27 (67.5%) | 13 (32.5%) |
| 6 to 18 Years | 45 (32.1%) | 91 (65.0%) |
| 19 to 25 Years | 7 (10.4%) | 64 (95.5%) |
| 25 to 34 Years | 51 (45.5%) | 61 (54.5%) |
| 35 to 44 Years | 11 (9.0%) | 122 (100.0%) |
| 45 to 54 Years | 38 (31.1%) | 89 (73.0%) |
| 55 to 64 Years | 0 (0.0%) | 112 (100.0%) |
| 65 to 74 Years | 110 (100.0%) | 73 (66.4%) |
| 75 Years and over | 107 (100.0%) | 63 (58.9%) |
| Total | 396 (42.5%) | 688 (73.8%) |
Disability Status by Sex by Age in Allison
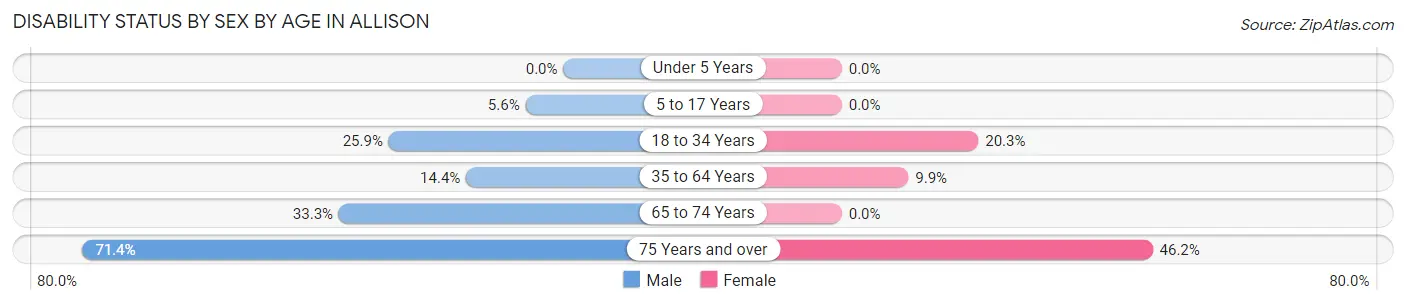
| Age Bracket | Male | Female |
| Under 5 Years | 0 (0.0%) | 0 (0.0%) |
| 5 to 17 Years | 5 (5.6%) | 0 (0.0%) |
| 18 to 34 Years | 28 (25.9%) | 15 (20.3%) |
| 35 to 64 Years | 28 (14.4%) | 16 (9.9%) |
| 65 to 74 Years | 20 (33.3%) | 0 (0.0%) |
| 75 Years and over | 30 (71.4%) | 30 (46.2%) |
Disability Class by Sex by Age in Allison
Disability Class: Hearing Difficulty
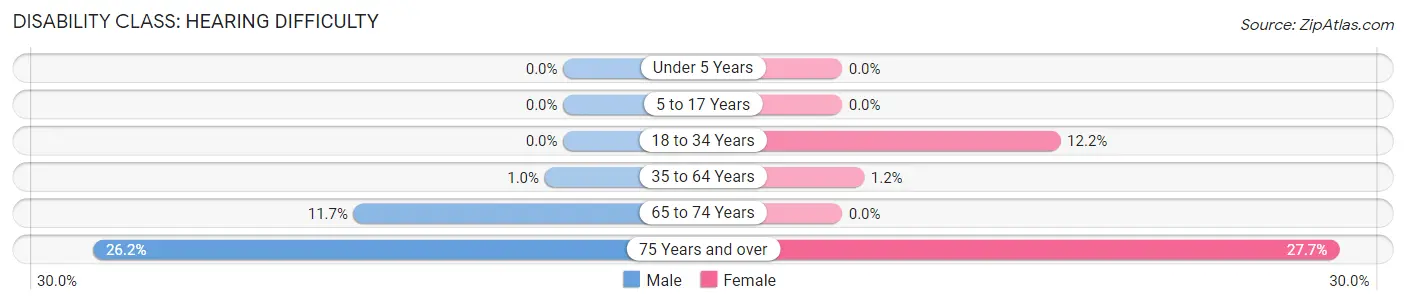
| Age Bracket | Male | Female |
| Under 5 Years | 0 (0.0%) | 0 (0.0%) |
| 5 to 17 Years | 0 (0.0%) | 0 (0.0%) |
| 18 to 34 Years | 0 (0.0%) | 9 (12.2%) |
| 35 to 64 Years | 2 (1.0%) | 2 (1.2%) |
| 65 to 74 Years | 7 (11.7%) | 0 (0.0%) |
| 75 Years and over | 11 (26.2%) | 18 (27.7%) |
Disability Class: Vision Difficulty
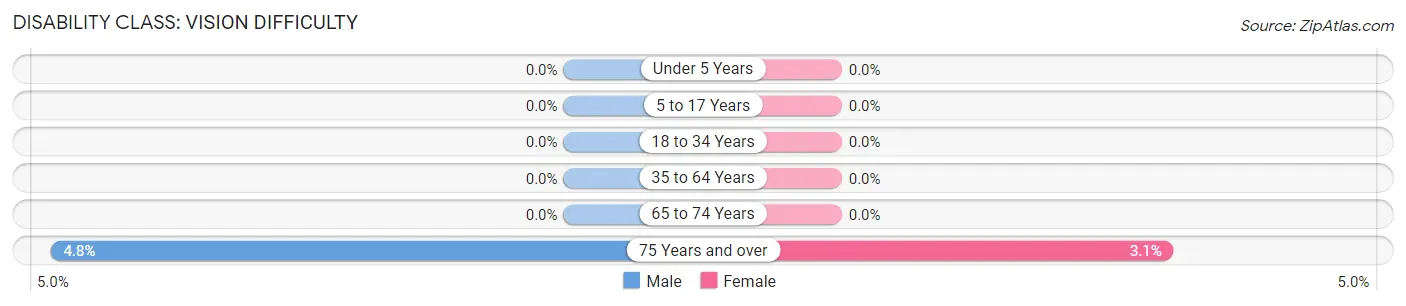
| Age Bracket | Male | Female |
| Under 5 Years | 0 (0.0%) | 0 (0.0%) |
| 5 to 17 Years | 0 (0.0%) | 0 (0.0%) |
| 18 to 34 Years | 0 (0.0%) | 0 (0.0%) |
| 35 to 64 Years | 0 (0.0%) | 0 (0.0%) |
| 65 to 74 Years | 0 (0.0%) | 0 (0.0%) |
| 75 Years and over | 2 (4.8%) | 2 (3.1%) |
Disability Class: Cognitive Difficulty
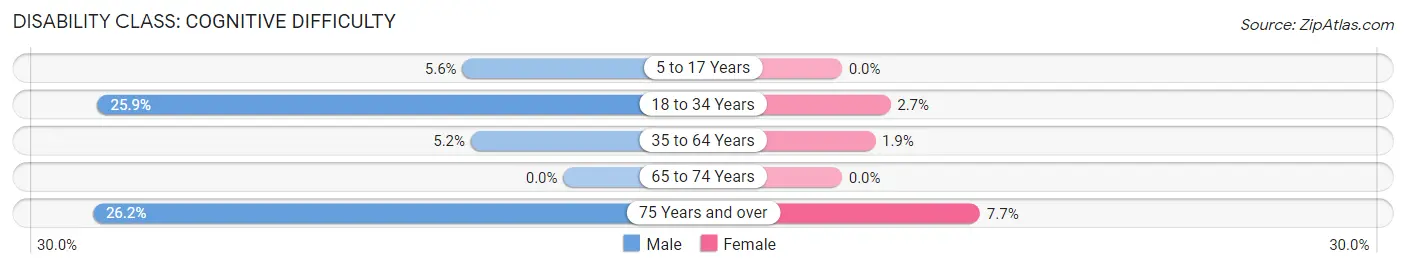
| Age Bracket | Male | Female |
| 5 to 17 Years | 5 (5.6%) | 0 (0.0%) |
| 18 to 34 Years | 28 (25.9%) | 2 (2.7%) |
| 35 to 64 Years | 10 (5.1%) | 3 (1.8%) |
| 65 to 74 Years | 0 (0.0%) | 0 (0.0%) |
| 75 Years and over | 11 (26.2%) | 5 (7.7%) |
Disability Class: Ambulatory Difficulty
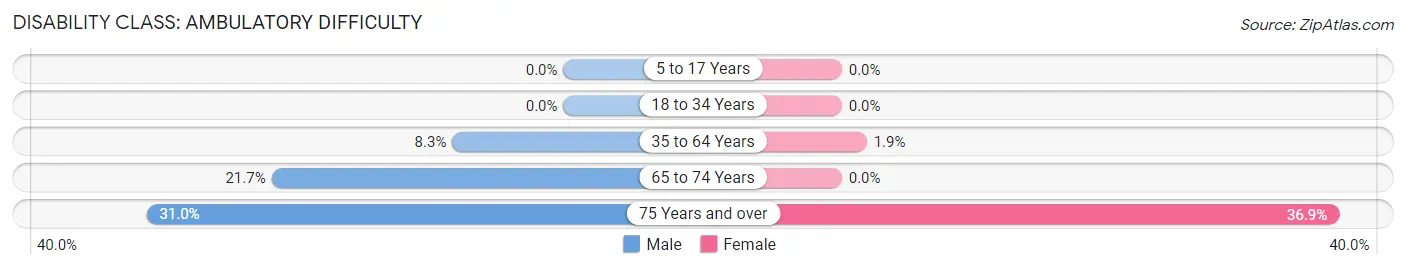
| Age Bracket | Male | Female |
| 5 to 17 Years | 0 (0.0%) | 0 (0.0%) |
| 18 to 34 Years | 0 (0.0%) | 0 (0.0%) |
| 35 to 64 Years | 16 (8.3%) | 3 (1.8%) |
| 65 to 74 Years | 13 (21.7%) | 0 (0.0%) |
| 75 Years and over | 13 (30.9%) | 24 (36.9%) |
Disability Class: Self-Care Difficulty
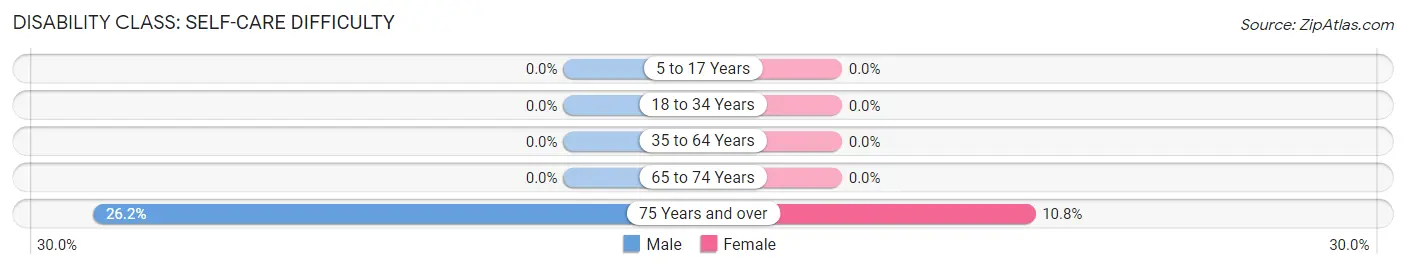
| Age Bracket | Male | Female |
| 5 to 17 Years | 0 (0.0%) | 0 (0.0%) |
| 18 to 34 Years | 0 (0.0%) | 0 (0.0%) |
| 35 to 64 Years | 0 (0.0%) | 0 (0.0%) |
| 65 to 74 Years | 0 (0.0%) | 0 (0.0%) |
| 75 Years and over | 11 (26.2%) | 7 (10.8%) |
Technology Access in Allison
Computing Device Access in Allison
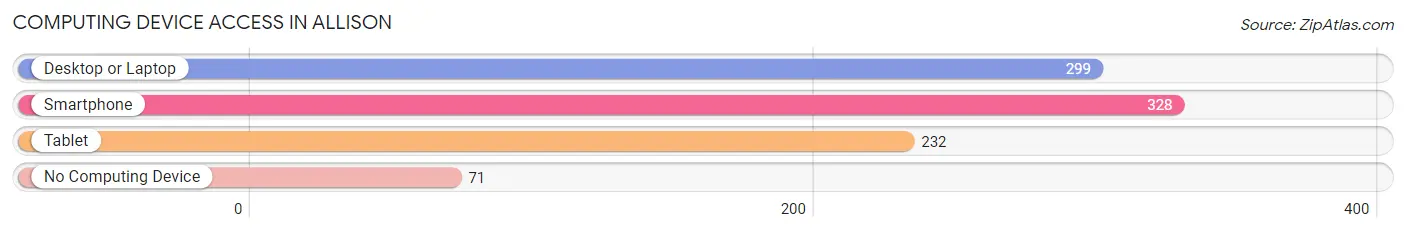
| Device Type | # Households | % Households |
| Desktop or Laptop | 299 | 68.4% |
| Smartphone | 328 | 75.1% |
| Tablet | 232 | 53.1% |
| No Computing Device | 71 | 16.3% |
| Total | 437 | 100.0% |
Internet Access in Allison
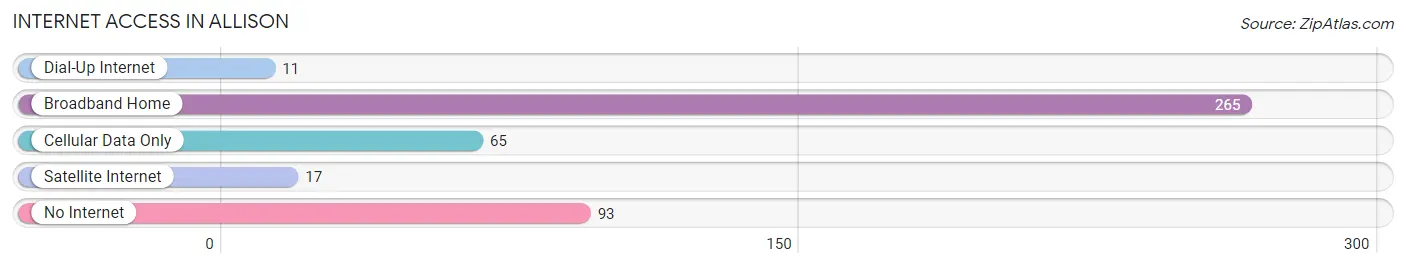
| Internet Type | # Households | % Households |
| Dial-Up Internet | 11 | 2.5% |
| Broadband Home | 265 | 60.6% |
| Cellular Data Only | 65 | 14.9% |
| Satellite Internet | 17 | 3.9% |
| No Internet | 93 | 21.3% |
| Total | 437 | 100.0% |
Allison Summary
Allison, Iowa is a small city located in Butler County, Iowa. It is situated on the banks of the Shell Rock River, and is part of the Waterloo-Cedar Falls Metropolitan Statistical Area. The city has a population of 1,845 as of the 2010 census, and is the county seat of Butler County.
History
Allison was founded in 1856 by a group of settlers from New York. The city was named after William Allison, a prominent local businessman and politician. The city was incorporated in 1872, and the first mayor was elected in 1873.
In the late 19th century, Allison was a thriving agricultural center, with a variety of businesses and industries. The city was also home to a number of churches, schools, and other civic organizations.
Geography
Allison is located at 42°37'45" North, 92°37'45" West (42.629, -92.629). The city is situated on the banks of the Shell Rock River, and is part of the Waterloo-Cedar Falls Metropolitan Statistical Area.
The city has a total area of 1.2 square miles, all of which is land. The terrain is mostly flat, with some rolling hills in the surrounding area.
Economy
Allison's economy is largely based on agriculture and manufacturing. The city is home to a number of businesses, including a feed mill, a grain elevator, a lumber yard, and a variety of other small businesses.
The city is also home to a number of manufacturing companies, including a furniture manufacturer, a plastics manufacturer, and a metal fabrication company.
Demographics
As of the 2010 census, Allison had a population of 1,845. The racial makeup of the city was 97.3% White, 0.3% African American, 0.2% Native American, 0.3% Asian, 0.1% Pacific Islander, 0.7% from other races, and 1.1% from two or more races. Hispanic or Latino of any race were 2.2% of the population.
The median income for a household in the city was $41,250, and the median income for a family was $50,000. The per capita income for the city was $20,845. About 8.3% of families and 10.2% of the population were below the poverty line, including 14.2% of those under age 18 and 8.3% of those age 65 or over.
Common Questions
What is Per Capita Income in Allison?
Per Capita income in Allison is $34,878.
What is the Median Family Income in Allison?
Median Family Income in Allison is $92,222.
What is the Median Household income in Allison?
Median Household Income in Allison is $61,458.
What is Income or Wage Gap in Allison?
Income or Wage Gap in Allison is 17.1%.
Women in Allison earn 82.9 cents for every dollar earned by a man.
What is Inequality or Gini Index in Allison?
Inequality or Gini Index in Allison is 0.43.
What is the Total Population of Allison?
Total Population of Allison is 980.
What is the Total Male Population of Allison?
Total Male Population of Allison is 522.
What is the Total Female Population of Allison?
Total Female Population of Allison is 458.
What is the Ratio of Males per 100 Females in Allison?
There are 113.97 Males per 100 Females in Allison.
What is the Ratio of Females per 100 Males in Allison?
There are 87.74 Females per 100 Males in Allison.
What is the Median Population Age in Allison?
Median Population Age in Allison is 45.3 Years.
What is the Average Family Size in Allison
Average Family Size in Allison is 2.8 People.
What is the Average Household Size in Allison
Average Household Size in Allison is 2.1 People.
How Large is the Labor Force in Allison?
There are 500 People in the Labor Forcein in Allison.
What is the Percentage of People in the Labor Force in Allison?
59.6% of People are in the Labor Force in Allison.
What is the Unemployment Rate in Allison?
Unemployment Rate in Allison is 0.6%.