Bode, IA Map & Demographics
Bode Map
Bode Overview
$26,624
PER CAPITA INCOME
$80,417
AVG FAMILY INCOME
$54,531
AVG HOUSEHOLD INCOME
31.0%
WAGE / INCOME GAP [ % ]
69.0¢/ $1
WAGE / INCOME GAP [ $ ]
0.40
INEQUALITY / GINI INDEX
390
TOTAL POPULATION
203
MALE POPULATION
187
FEMALE POPULATION
108.56
MALES / 100 FEMALES
92.12
FEMALES / 100 MALES
34.6
MEDIAN AGE
3.2
AVG FAMILY SIZE
2.7
AVG HOUSEHOLD SIZE
199
LABOR FORCE [ PEOPLE ]
66.8%
PERCENT IN LABOR FORCE
Bode Zip Codes
Income in Bode
Income Overview in Bode
Per Capita Income in Bode is $26,624, while median incomes of families and households are $80,417 and $54,531 respectively.
| Characteristic | Number | Measure |
| Per Capita Income | 390 | $26,624 |
| Median Family Income | 98 | $80,417 |
| Mean Family Income | 98 | $77,052 |
| Median Household Income | 143 | $54,531 |
| Mean Household Income | 143 | $73,193 |
| Income Deficit | 98 | $0 |
| Wage / Income Gap (%) | 390 | 31.03% |
| Wage / Income Gap ($) | 390 | 68.97¢ per $1 |
| Gini / Inequality Index | 390 | 0.40 |
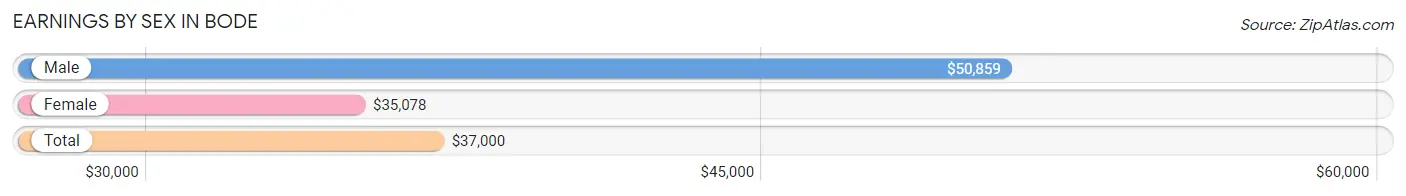
Earnings by Sex in Bode
Average Earnings in Bode are $37,000, $50,859 for men and $35,078 for women, a difference of 31.0%.
| Sex | Number | Average Earnings |
| Male | 95 (46.1%) | $50,859 |
| Female | 111 (53.9%) | $35,078 |
| Total | 206 (100.0%) | $37,000 |
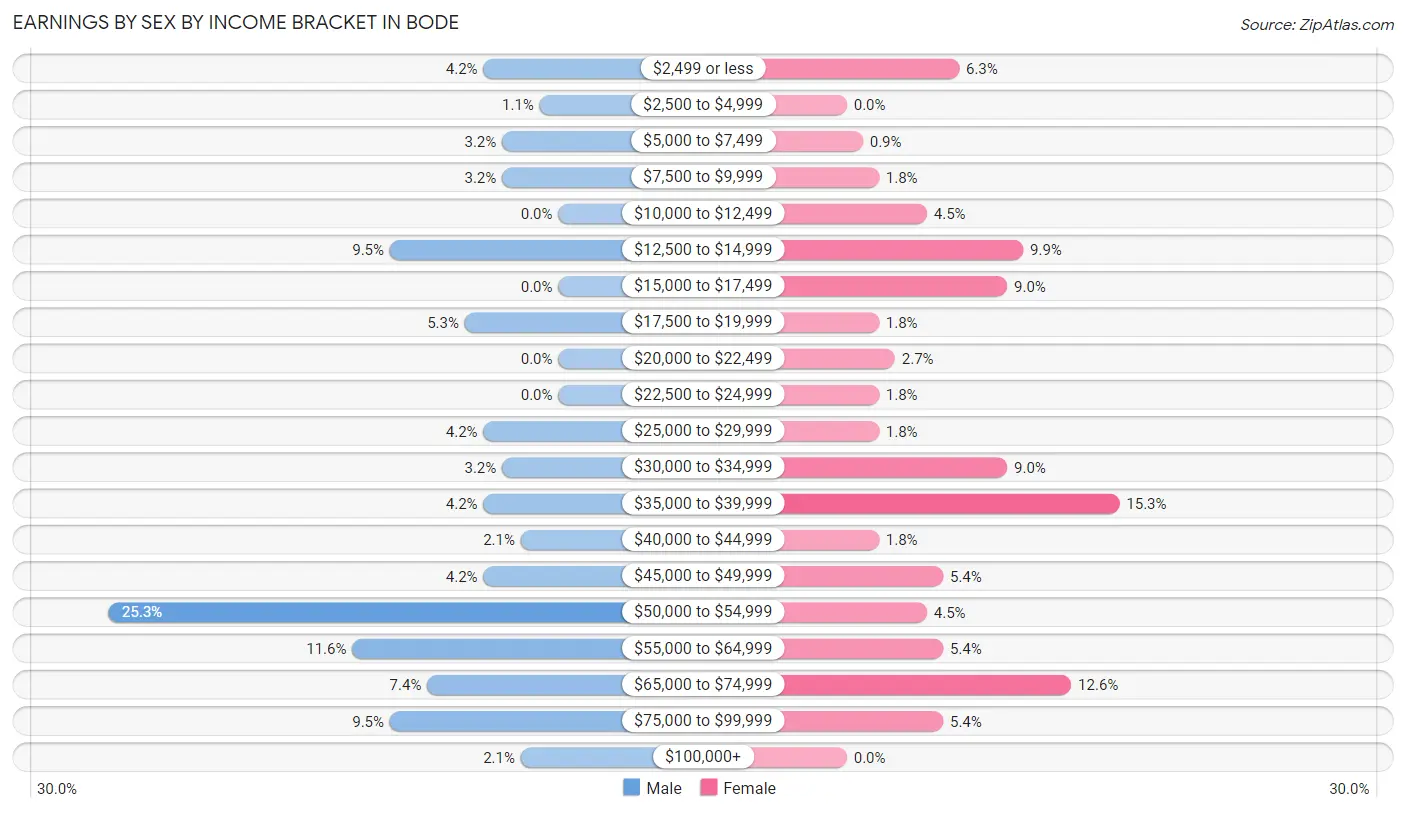
Earnings by Sex by Income Bracket in Bode
The most common earnings brackets in Bode are $50,000 to $54,999 for men (24 | 25.3%) and $35,000 to $39,999 for women (17 | 15.3%).
| Income | Male | Female |
| $2,499 or less | 4 (4.2%) | 7 (6.3%) |
| $2,500 to $4,999 | 1 (1.1%) | 0 (0.0%) |
| $5,000 to $7,499 | 3 (3.2%) | 1 (0.9%) |
| $7,500 to $9,999 | 3 (3.2%) | 2 (1.8%) |
| $10,000 to $12,499 | 0 (0.0%) | 5 (4.5%) |
| $12,500 to $14,999 | 9 (9.5%) | 11 (9.9%) |
| $15,000 to $17,499 | 0 (0.0%) | 10 (9.0%) |
| $17,500 to $19,999 | 5 (5.3%) | 2 (1.8%) |
| $20,000 to $22,499 | 0 (0.0%) | 3 (2.7%) |
| $22,500 to $24,999 | 0 (0.0%) | 2 (1.8%) |
| $25,000 to $29,999 | 4 (4.2%) | 2 (1.8%) |
| $30,000 to $34,999 | 3 (3.2%) | 10 (9.0%) |
| $35,000 to $39,999 | 4 (4.2%) | 17 (15.3%) |
| $40,000 to $44,999 | 2 (2.1%) | 2 (1.8%) |
| $45,000 to $49,999 | 4 (4.2%) | 6 (5.4%) |
| $50,000 to $54,999 | 24 (25.3%) | 5 (4.5%) |
| $55,000 to $64,999 | 11 (11.6%) | 6 (5.4%) |
| $65,000 to $74,999 | 7 (7.4%) | 14 (12.6%) |
| $75,000 to $99,999 | 9 (9.5%) | 6 (5.4%) |
| $100,000+ | 2 (2.1%) | 0 (0.0%) |
| Total | 95 (100.0%) | 111 (100.0%) |
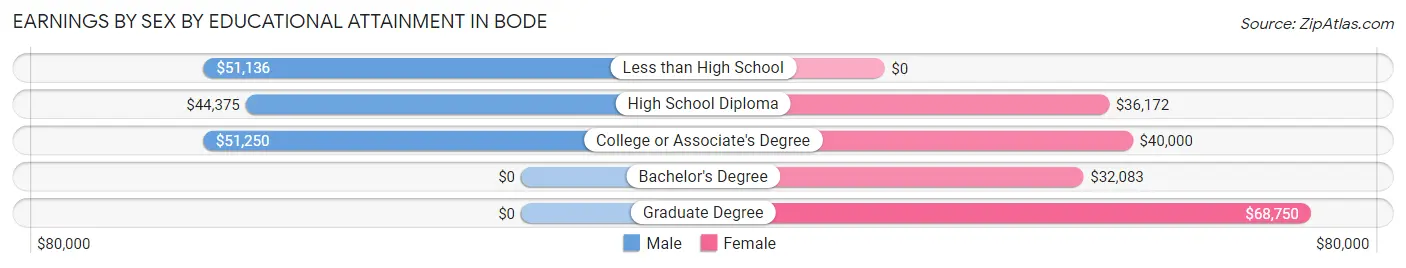
Earnings by Sex by Educational Attainment in Bode
Average earnings in Bode are $51,563 for men and $36,719 for women, a difference of 28.8%. Men with an educational attainment of college or associate's degree enjoy the highest average annual earnings of $51,250, while those with high school diploma education earn the least with $44,375. Women with an educational attainment of graduate degree earn the most with the average annual earnings of $68,750, while those with bachelor's degree education have the smallest earnings of $32,083.
| Educational Attainment | Male Income | Female Income |
| Less than High School | $51,136 | $0 |
| High School Diploma | $44,375 | $36,172 |
| College or Associate's Degree | $51,250 | $40,000 |
| Bachelor's Degree | - | - |
| Graduate Degree | - | - |
| Total | $51,563 | $36,719 |
Family Income in Bode
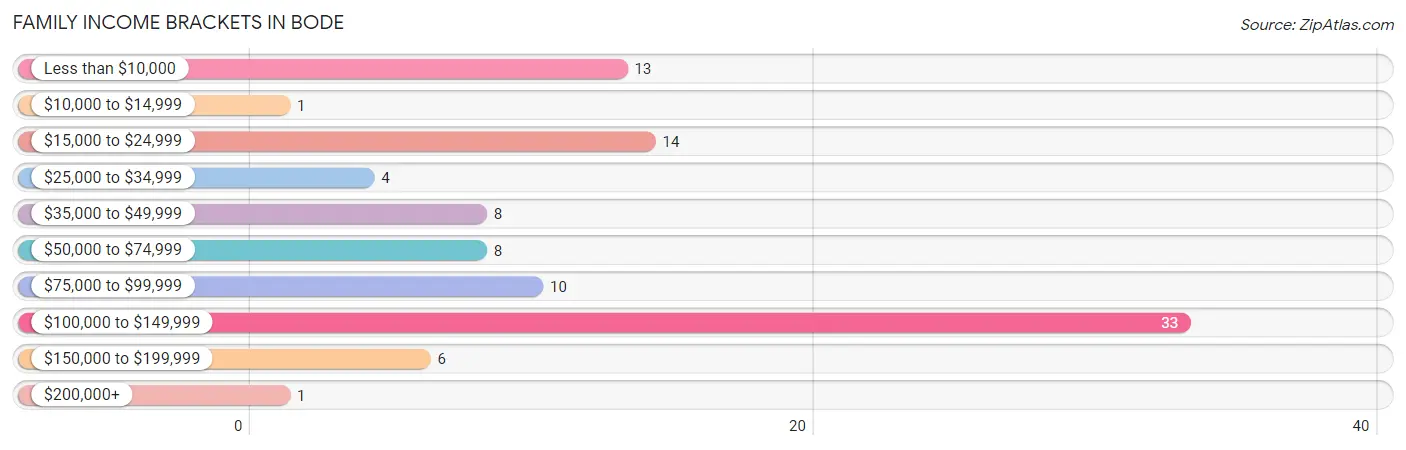
Family Income Brackets in Bode
According to the Bode family income data, there are 33 families falling into the $100,000 to $149,999 income range, which is the most common income bracket and makes up 33.7% of all families. Conversely, the $10,000 to $14,999 income bracket is the least frequent group with only 1 families (1.0%) belonging to this category.
| Income Bracket | # Families | % Families |
| Less than $10,000 | 13 | 13.3% |
| $10,000 to $14,999 | 1 | 1.0% |
| $15,000 to $24,999 | 14 | 14.3% |
| $25,000 to $34,999 | 4 | 4.1% |
| $35,000 to $49,999 | 8 | 8.2% |
| $50,000 to $74,999 | 8 | 8.2% |
| $75,000 to $99,999 | 10 | 10.2% |
| $100,000 to $149,999 | 33 | 33.7% |
| $150,000 to $199,999 | 6 | 6.1% |
| $200,000+ | 1 | 1.0% |
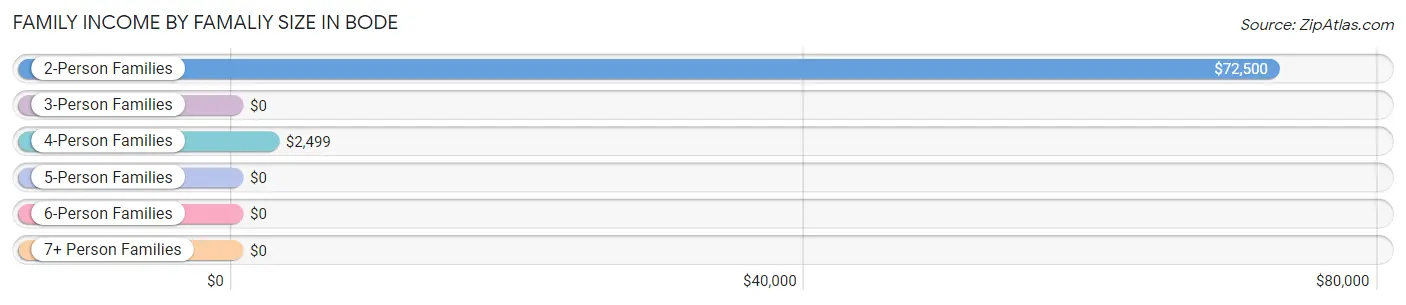
Family Income by Famaliy Size in Bode
2-person families (48 | 49.0%) account for the highest median family income in Bode with $72,500 per family, while 2-person families (48 | 49.0%) have the highest median income of $36,250 per family member.
| Income Bracket | # Families | Median Income |
| 2-Person Families | 48 (49.0%) | $72,500 |
| 3-Person Families | 15 (15.3%) | $0 |
| 4-Person Families | 11 (11.2%) | $2,499 |
| 5-Person Families | 12 (12.2%) | $0 |
| 6-Person Families | 0 (0.0%) | $0 |
| 7+ Person Families | 12 (12.2%) | $0 |
| Total | 98 (100.0%) | $80,417 |
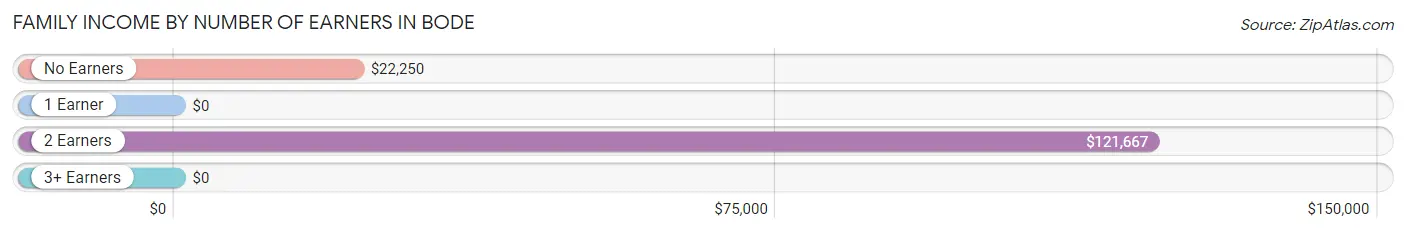
Family Income by Number of Earners in Bode
| Number of Earners | # Families | Median Income |
| No Earners | 23 (23.5%) | $22,250 |
| 1 Earner | 27 (27.6%) | $0 |
| 2 Earners | 36 (36.7%) | $121,667 |
| 3+ Earners | 12 (12.2%) | $0 |
| Total | 98 (100.0%) | $80,417 |
Household Income in Bode
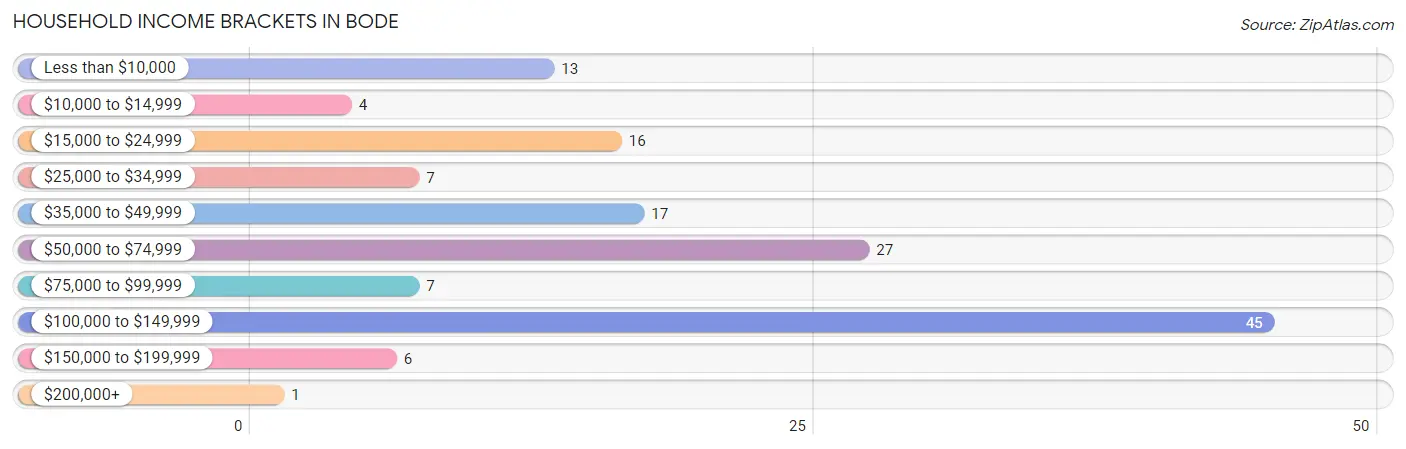
Household Income Brackets in Bode
With 45 households falling in the category, the $100,000 to $149,999 income range is the most frequent in Bode, accounting for 31.5% of all households. In contrast, only 1 households (0.7%) fall into the $200,000+ income bracket, making it the least populous group.
| Income Bracket | # Households | % Households |
| Less than $10,000 | 13 | 9.1% |
| $10,000 to $14,999 | 4 | 2.8% |
| $15,000 to $24,999 | 16 | 11.2% |
| $25,000 to $34,999 | 7 | 4.9% |
| $35,000 to $49,999 | 17 | 11.9% |
| $50,000 to $74,999 | 27 | 18.9% |
| $75,000 to $99,999 | 7 | 4.9% |
| $100,000 to $149,999 | 45 | 31.5% |
| $150,000 to $199,999 | 6 | 4.2% |
| $200,000+ | 1 | 0.7% |
Household Income by Householder Age in Bode
The median household income in Bode is $54,531, with the highest median household income of $90,000 found in the 25 to 44 years age bracket for the primary householder. A total of 60 households (42.0%) fall into this category. Meanwhile, the 15 to 24 years age bracket for the primary householder has the lowest median household income of $0, with 5 households (3.5%) in this group.
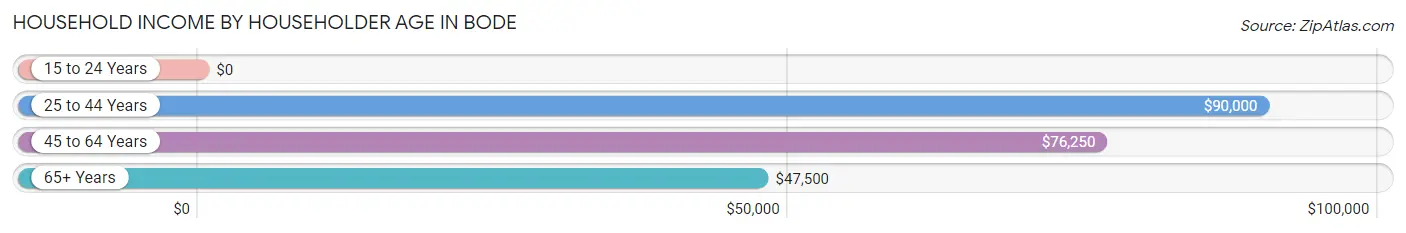
| Income Bracket | # Households | Median Income |
| 15 to 24 Years | 5 (3.5%) | $0 |
| 25 to 44 Years | 60 (42.0%) | $90,000 |
| 45 to 64 Years | 42 (29.4%) | $76,250 |
| 65+ Years | 36 (25.2%) | $47,500 |
| Total | 143 (100.0%) | $54,531 |
Poverty in Bode
Income Below Poverty by Sex and Age in Bode
With 28.6% poverty level for males and 18.7% for females among the residents of Bode, 6 to 11 year old males and 6 to 11 year old females are the most vulnerable to poverty, with 16 males (88.9%) and 5 females (55.6%) in their respective age groups living below the poverty level.
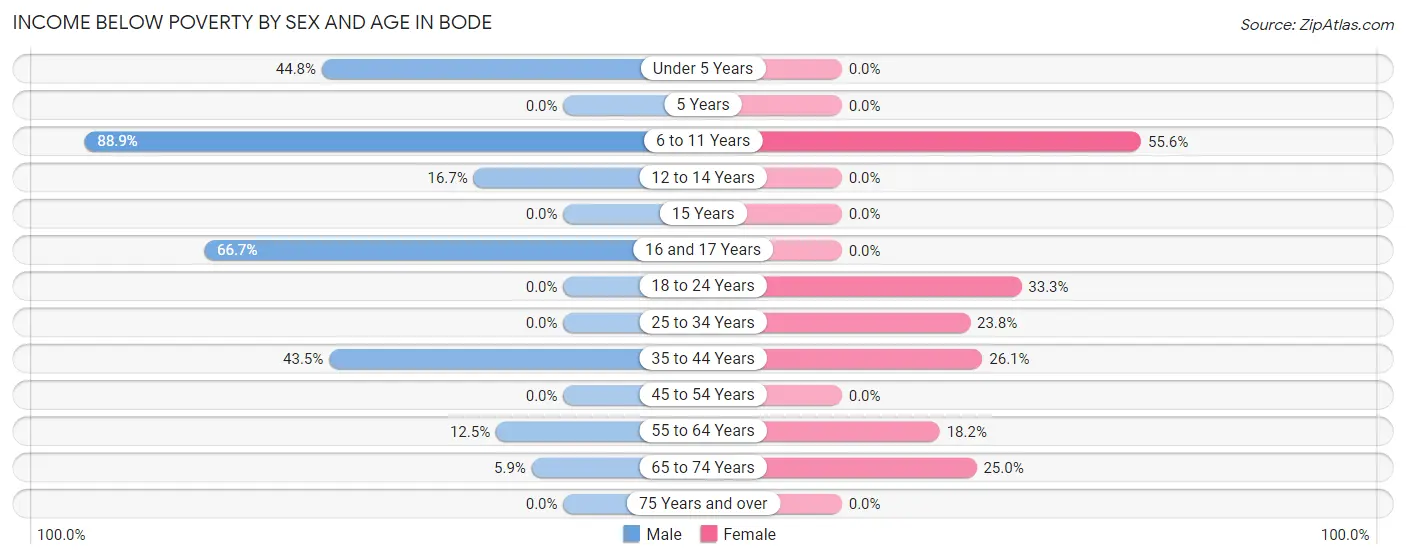
| Age Bracket | Male | Female |
| Under 5 Years | 13 (44.8%) | 0 (0.0%) |
| 5 Years | 0 (0.0%) | 0 (0.0%) |
| 6 to 11 Years | 16 (88.9%) | 5 (55.6%) |
| 12 to 14 Years | 2 (16.7%) | 0 (0.0%) |
| 15 Years | 0 (0.0%) | 0 (0.0%) |
| 16 and 17 Years | 4 (66.7%) | 0 (0.0%) |
| 18 to 24 Years | 0 (0.0%) | 9 (33.3%) |
| 25 to 34 Years | 0 (0.0%) | 10 (23.8%) |
| 35 to 44 Years | 20 (43.5%) | 6 (26.1%) |
| 45 to 54 Years | 0 (0.0%) | 0 (0.0%) |
| 55 to 64 Years | 2 (12.5%) | 2 (18.2%) |
| 65 to 74 Years | 1 (5.9%) | 3 (25.0%) |
| 75 Years and over | 0 (0.0%) | 0 (0.0%) |
| Total | 58 (28.6%) | 35 (18.7%) |
Income Above Poverty by Sex and Age in Bode
According to the poverty statistics in Bode, males aged 15 years and females aged under 5 years are the age groups that are most secure financially, with 100.0% of males and 100.0% of females in these age groups living above the poverty line.
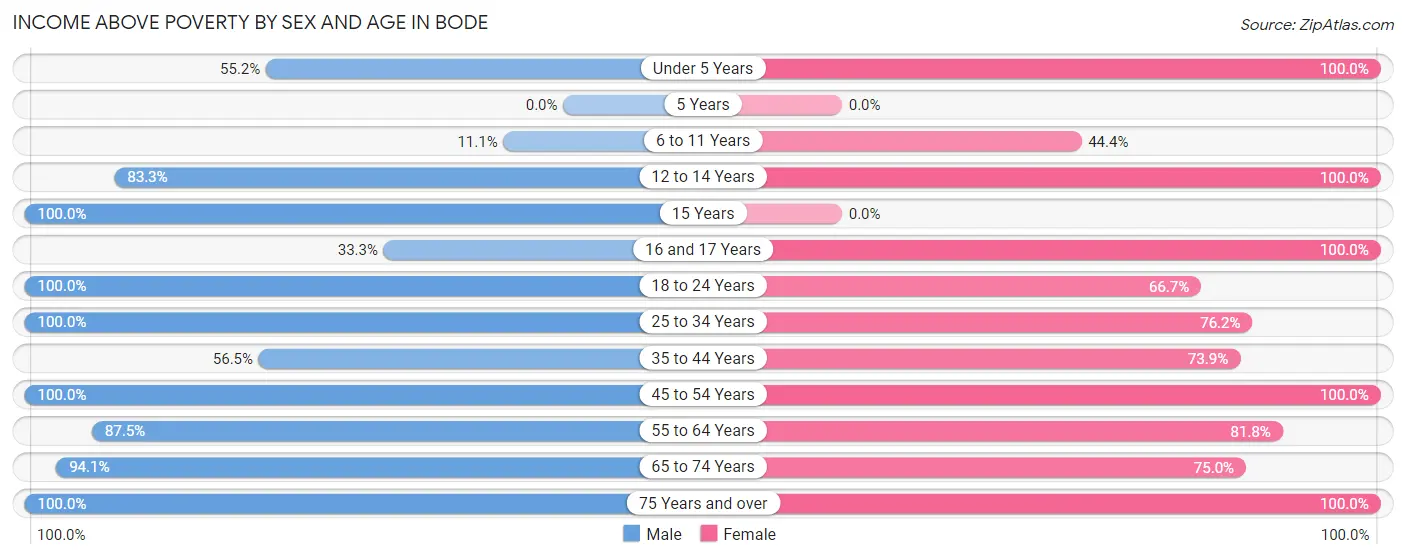
| Age Bracket | Male | Female |
| Under 5 Years | 16 (55.2%) | 8 (100.0%) |
| 5 Years | 0 (0.0%) | 0 (0.0%) |
| 6 to 11 Years | 2 (11.1%) | 4 (44.4%) |
| 12 to 14 Years | 10 (83.3%) | 4 (100.0%) |
| 15 Years | 12 (100.0%) | 0 (0.0%) |
| 16 and 17 Years | 2 (33.3%) | 11 (100.0%) |
| 18 to 24 Years | 3 (100.0%) | 18 (66.7%) |
| 25 to 34 Years | 16 (100.0%) | 32 (76.2%) |
| 35 to 44 Years | 26 (56.5%) | 17 (73.9%) |
| 45 to 54 Years | 17 (100.0%) | 24 (100.0%) |
| 55 to 64 Years | 14 (87.5%) | 9 (81.8%) |
| 65 to 74 Years | 16 (94.1%) | 9 (75.0%) |
| 75 Years and over | 11 (100.0%) | 16 (100.0%) |
| Total | 145 (71.4%) | 152 (81.3%) |
Income Below Poverty Among Married-Couple Families in Bode
The poverty statistics for married-couple families in Bode show that 16.7% or 10 of the total 60 families live below the poverty line. Families with 1 or 2 children have the highest poverty rate of 41.7%, comprising of 5 families. On the other hand, families with no children have the lowest poverty rate of 2.9%, which includes 1 families.
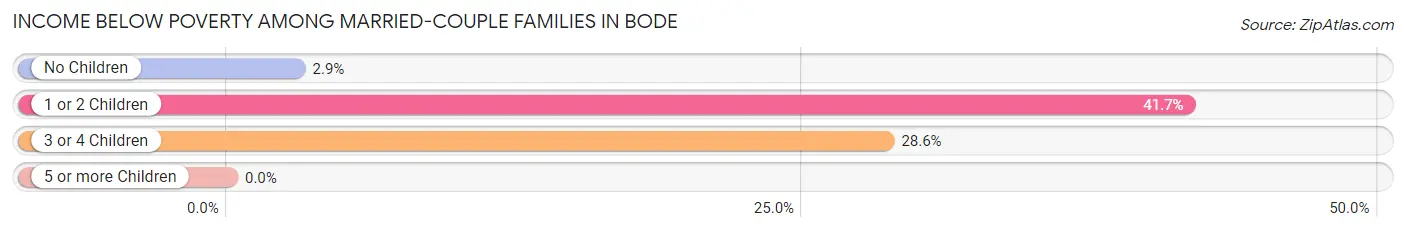
| Children | Above Poverty | Below Poverty |
| No Children | 33 (97.1%) | 1 (2.9%) |
| 1 or 2 Children | 7 (58.3%) | 5 (41.7%) |
| 3 or 4 Children | 10 (71.4%) | 4 (28.6%) |
| 5 or more Children | 0 (0.0%) | 0 (0.0%) |
| Total | 50 (83.3%) | 10 (16.7%) |
Income Below Poverty Among Single-Parent Households in Bode
According to the poverty data in Bode, 45.5% or 5 single-father households and 29.6% or 8 single-mother households are living below the poverty line. Among single-father households, those with 1 or 2 children have the highest poverty rate, with 5 households (83.3%) experiencing poverty. Likewise, among single-mother households, those with 3 or 4 children have the highest poverty rate, with 2 households (100.0%) falling below the poverty line.
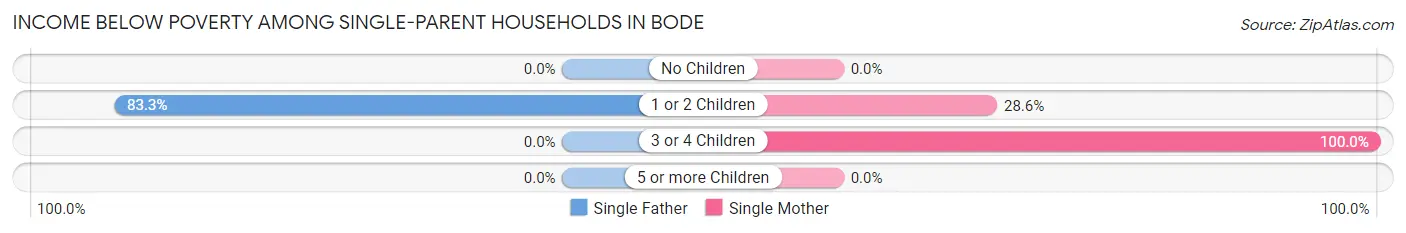
| Children | Single Father | Single Mother |
| No Children | 0 (0.0%) | 0 (0.0%) |
| 1 or 2 Children | 5 (83.3%) | 6 (28.6%) |
| 3 or 4 Children | 0 (0.0%) | 2 (100.0%) |
| 5 or more Children | 0 (0.0%) | 0 (0.0%) |
| Total | 5 (45.5%) | 8 (29.6%) |
Income Below Poverty Among Married-Couple vs Single-Parent Households in Bode
The poverty data for Bode shows that 10 of the married-couple family households (16.7%) and 13 of the single-parent households (34.2%) are living below the poverty level. Within the married-couple family households, those with 1 or 2 children have the highest poverty rate, with 5 households (41.7%) falling below the poverty line. Among the single-parent households, those with 3 or 4 children have the highest poverty rate, with 2 household (100.0%) living below poverty.
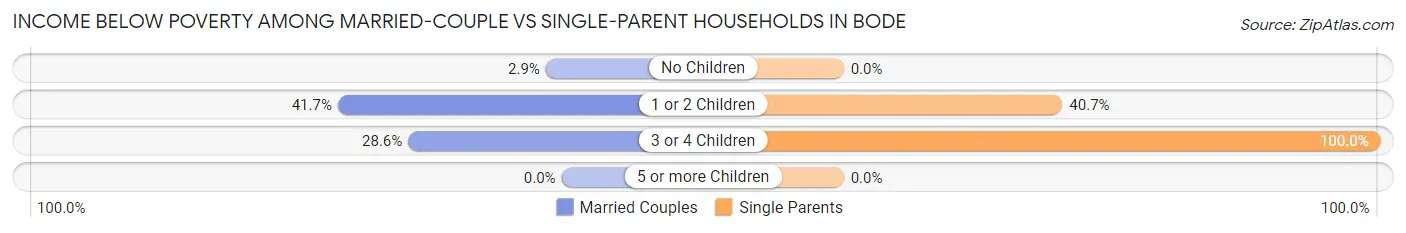
| Children | Married-Couple Families | Single-Parent Households |
| No Children | 1 (2.9%) | 0 (0.0%) |
| 1 or 2 Children | 5 (41.7%) | 11 (40.7%) |
| 3 or 4 Children | 4 (28.6%) | 2 (100.0%) |
| 5 or more Children | 0 (0.0%) | 0 (0.0%) |
| Total | 10 (16.7%) | 13 (34.2%) |
Race in Bode
The most populous races in Bode are White / Caucasian (290 | 74.4%), Hispanic or Latino (86 | 22.1%), and Two or more Races (78 | 20.0%).
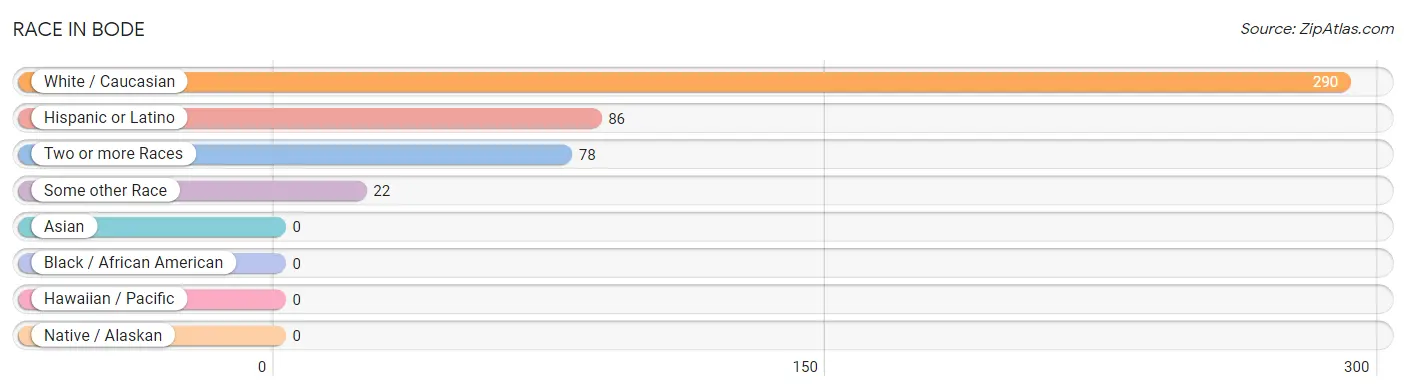
| Race | # Population | % Population |
| Asian | 0 | 0.0% |
| Black / African American | 0 | 0.0% |
| Hawaiian / Pacific | 0 | 0.0% |
| Hispanic or Latino | 86 | 22.1% |
| Native / Alaskan | 0 | 0.0% |
| White / Caucasian | 290 | 74.4% |
| Two or more Races | 78 | 20.0% |
| Some other Race | 22 | 5.6% |
| Total | 390 | 100.0% |
Ancestry in Bode
The most populous ancestries reported in Bode are German (99 | 25.4%), Central American (80 | 20.5%), Guatemalan (64 | 16.4%), Norwegian (63 | 16.2%), and Danish (41 | 10.5%), together accounting for 89.0% of all Bode residents.
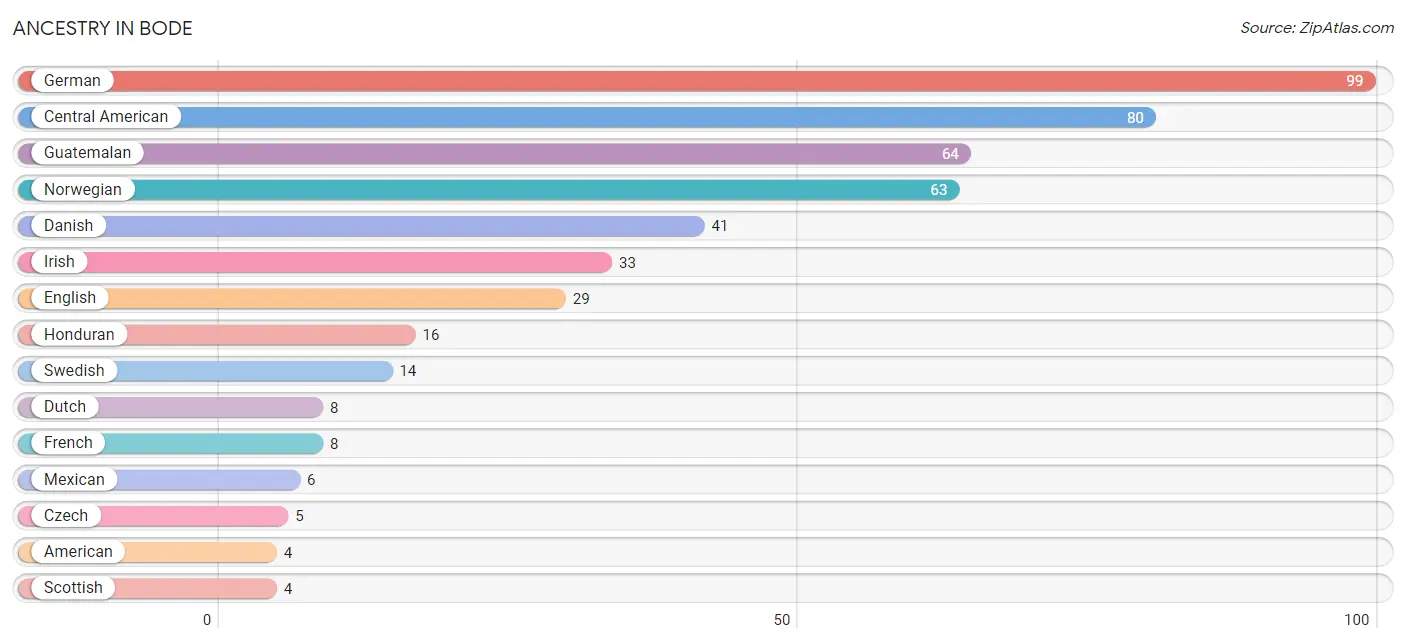
| Ancestry | # Population | % Population |
| American | 4 | 1.0% |
| Central American | 80 | 20.5% |
| Czech | 5 | 1.3% |
| Danish | 41 | 10.5% |
| Dutch | 8 | 2.1% |
| English | 29 | 7.4% |
| French | 8 | 2.1% |
| German | 99 | 25.4% |
| Guatemalan | 64 | 16.4% |
| Honduran | 16 | 4.1% |
| Irish | 33 | 8.5% |
| Italian | 1 | 0.3% |
| Lithuanian | 2 | 0.5% |
| Luxembourger | 1 | 0.3% |
| Mexican | 6 | 1.5% |
| Norwegian | 63 | 16.2% |
| Osage | 1 | 0.3% |
| Scandinavian | 2 | 0.5% |
| Scotch-Irish | 1 | 0.3% |
| Scottish | 4 | 1.0% |
| Swedish | 14 | 3.6% |
| Swiss | 1 | 0.3% | View All 22 Rows |
Immigrants in Bode
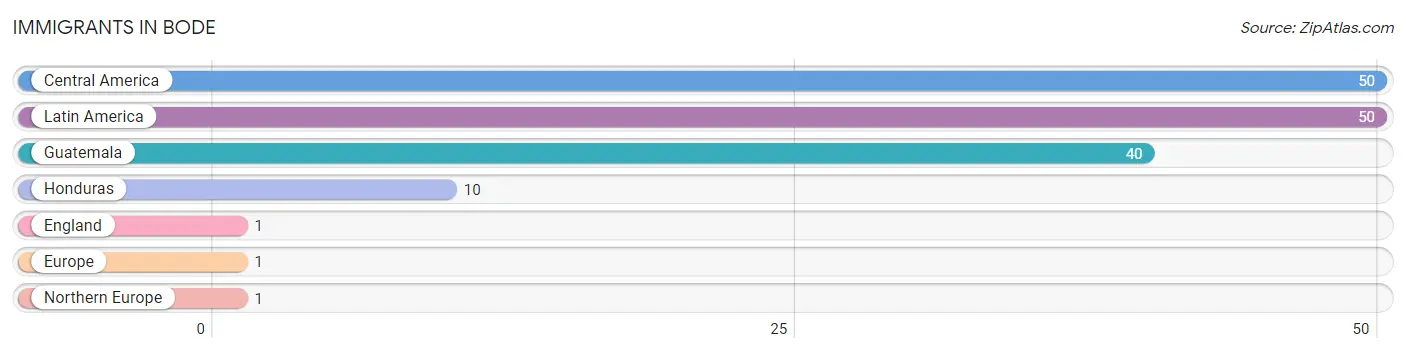
The most numerous immigrant groups reported in Bode came from Central America (50 | 12.8%), Latin America (50 | 12.8%), Guatemala (40 | 10.3%), Honduras (10 | 2.6%), and England (1 | 0.3%), together accounting for 38.7% of all Bode residents.
| Immigration Origin | # Population | % Population |
| Central America | 50 | 12.8% |
| England | 1 | 0.3% |
| Europe | 1 | 0.3% |
| Guatemala | 40 | 10.3% |
| Honduras | 10 | 2.6% |
| Latin America | 50 | 12.8% |
| Northern Europe | 1 | 0.3% | View All 7 Rows |
Sex and Age in Bode
Sex and Age in Bode
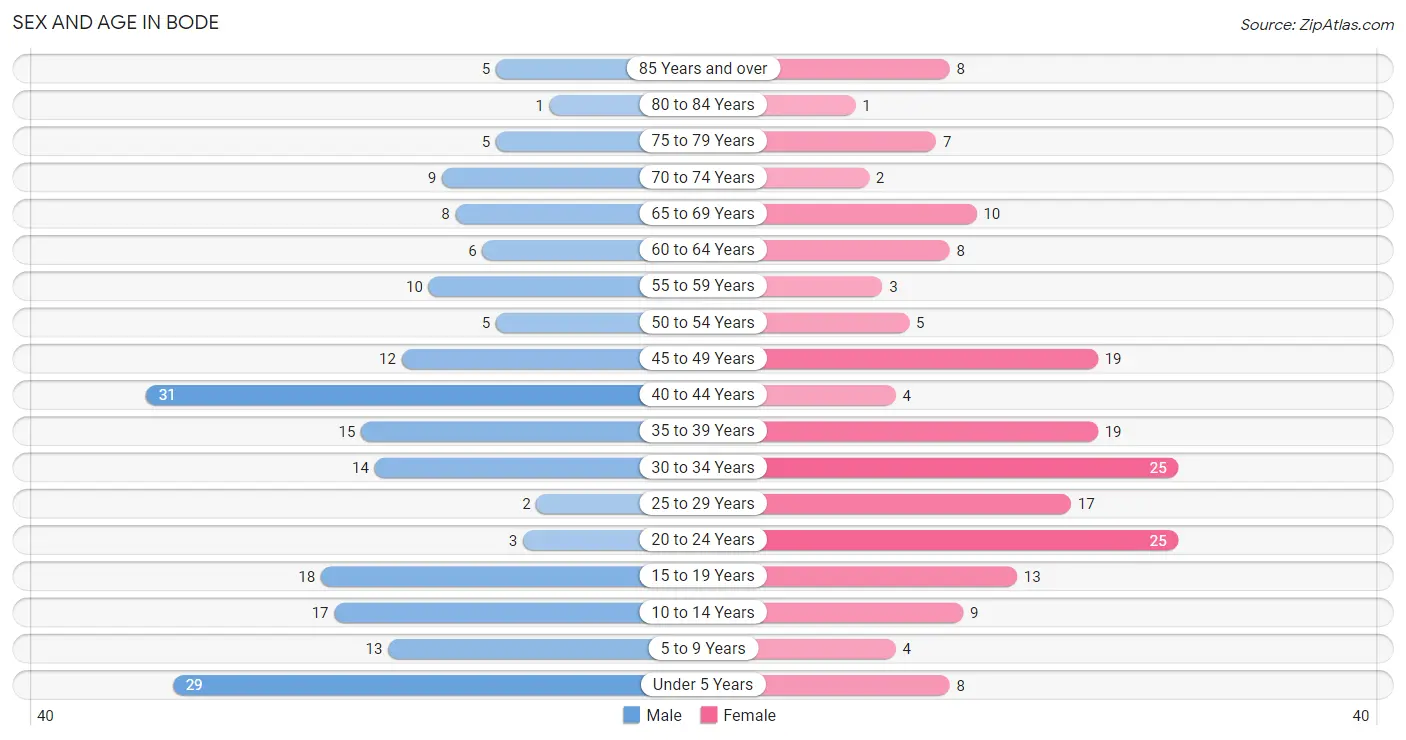
The most populous age groups in Bode are 40 to 44 Years (31 | 15.3%) for men and 20 to 24 Years (25 | 13.4%) for women.
| Age Bracket | Male | Female |
| Under 5 Years | 29 (14.3%) | 8 (4.3%) |
| 5 to 9 Years | 13 (6.4%) | 4 (2.1%) |
| 10 to 14 Years | 17 (8.4%) | 9 (4.8%) |
| 15 to 19 Years | 18 (8.9%) | 13 (7.0%) |
| 20 to 24 Years | 3 (1.5%) | 25 (13.4%) |
| 25 to 29 Years | 2 (1.0%) | 17 (9.1%) |
| 30 to 34 Years | 14 (6.9%) | 25 (13.4%) |
| 35 to 39 Years | 15 (7.4%) | 19 (10.2%) |
| 40 to 44 Years | 31 (15.3%) | 4 (2.1%) |
| 45 to 49 Years | 12 (5.9%) | 19 (10.2%) |
| 50 to 54 Years | 5 (2.5%) | 5 (2.7%) |
| 55 to 59 Years | 10 (4.9%) | 3 (1.6%) |
| 60 to 64 Years | 6 (3.0%) | 8 (4.3%) |
| 65 to 69 Years | 8 (3.9%) | 10 (5.3%) |
| 70 to 74 Years | 9 (4.4%) | 2 (1.1%) |
| 75 to 79 Years | 5 (2.5%) | 7 (3.7%) |
| 80 to 84 Years | 1 (0.5%) | 1 (0.5%) |
| 85 Years and over | 5 (2.5%) | 8 (4.3%) |
| Total | 203 (100.0%) | 187 (100.0%) |
Families and Households in Bode
Median Family Size in Bode
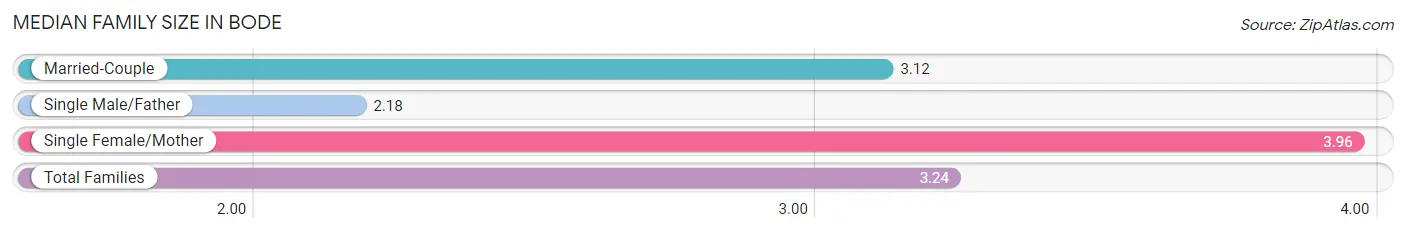
The median family size in Bode is 3.24 persons per family, with single female/mother families (27 | 27.6%) accounting for the largest median family size of 3.96 persons per family. On the other hand, single male/father families (11 | 11.2%) represent the smallest median family size with 2.18 persons per family.
| Family Type | # Families | Family Size |
| Married-Couple | 60 (61.2%) | 3.12 |
| Single Male/Father | 11 (11.2%) | 2.18 |
| Single Female/Mother | 27 (27.6%) | 3.96 |
| Total Families | 98 (100.0%) | 3.24 |
Median Household Size in Bode
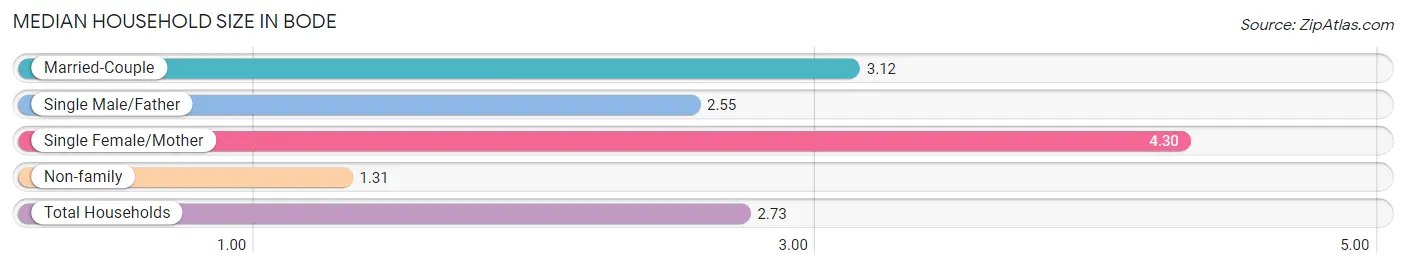
The median household size in Bode is 2.73 persons per household, with single female/mother households (27 | 18.9%) accounting for the largest median household size of 4.3 persons per household. non-family households (45 | 31.5%) represent the smallest median household size with 1.31 persons per household.
| Household Type | # Households | Household Size |
| Married-Couple | 60 (42.0%) | 3.12 |
| Single Male/Father | 11 (7.7%) | 2.55 |
| Single Female/Mother | 27 (18.9%) | 4.30 |
| Non-family | 45 (31.5%) | 1.31 |
| Total Households | 143 (100.0%) | 2.73 |
Household Size by Marriage Status in Bode
Out of a total of 143 households in Bode, 98 (68.5%) are family households, while 45 (31.5%) are nonfamily households. The most numerous type of family households are 2-person households, comprising 43, and the most common type of nonfamily households are 1-person households, comprising 39.
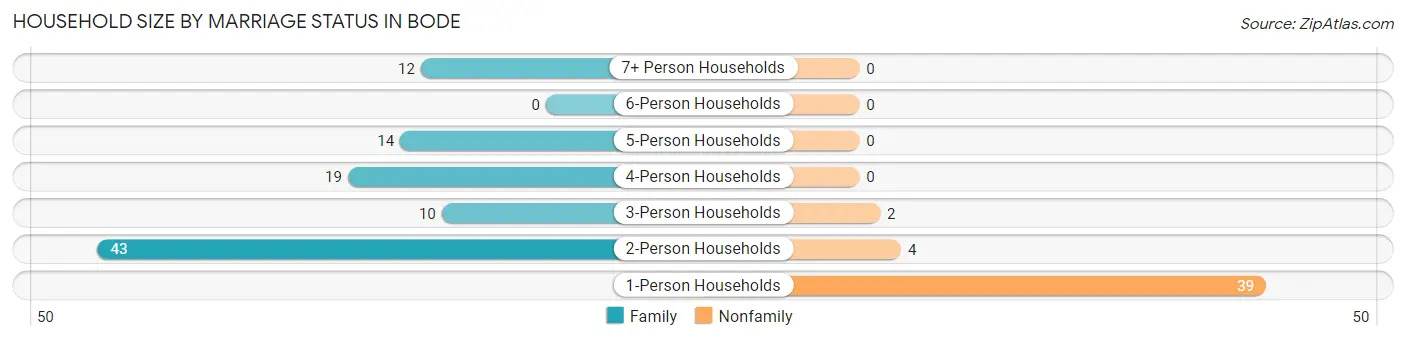
| Household Size | Family Households | Nonfamily Households |
| 1-Person Households | - | 39 (27.3%) |
| 2-Person Households | 43 (30.1%) | 4 (2.8%) |
| 3-Person Households | 10 (7.0%) | 2 (1.4%) |
| 4-Person Households | 19 (13.3%) | 0 (0.0%) |
| 5-Person Households | 14 (9.8%) | 0 (0.0%) |
| 6-Person Households | 0 (0.0%) | 0 (0.0%) |
| 7+ Person Households | 12 (8.4%) | 0 (0.0%) |
| Total | 98 (68.5%) | 45 (31.5%) |
Female Fertility in Bode
Fertility by Age in Bode
Average fertility rate in Bode is 156.0 births per 1,000 women. Women in the age bracket of 20 to 34 years have the highest fertility rate with 284.0 births per 1,000 women. Women in the age bracket of 20 to 34 years acount for 100.0% of all women with births.
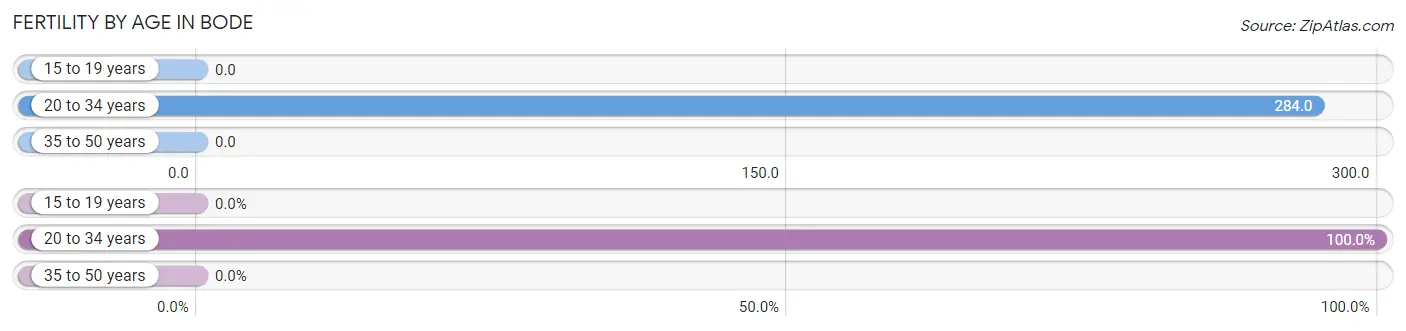
| Age Bracket | Women with Births | Births / 1,000 Women |
| 15 to 19 years | 0 (0.0%) | 0.0 |
| 20 to 34 years | 19 (100.0%) | 284.0 |
| 35 to 50 years | 0 (0.0%) | 0.0 |
| Total | 19 (100.0%) | 156.0 |
Fertility by Age by Marriage Status in Bode
94.7% of women with births (19) in Bode are married. The highest percentage of unmarried women with births falls into 20 to 34 years age bracket with 5.3% of them unmarried at the time of birth, while the lowest percentage of unmarried women with births belong to 20 to 34 years age bracket with 5.3% of them unmarried.
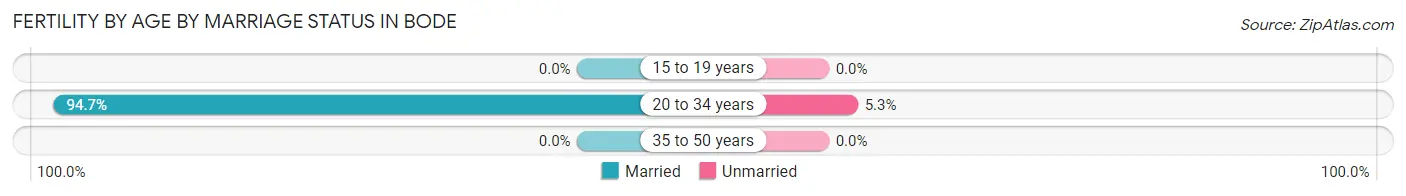
| Age Bracket | Married | Unmarried |
| 15 to 19 years | 0 (0.0%) | 0 (0.0%) |
| 20 to 34 years | 18 (94.7%) | 1 (5.3%) |
| 35 to 50 years | 0 (0.0%) | 0 (0.0%) |
| Total | 18 (94.7%) | 1 (5.3%) |
Fertility by Education in Bode
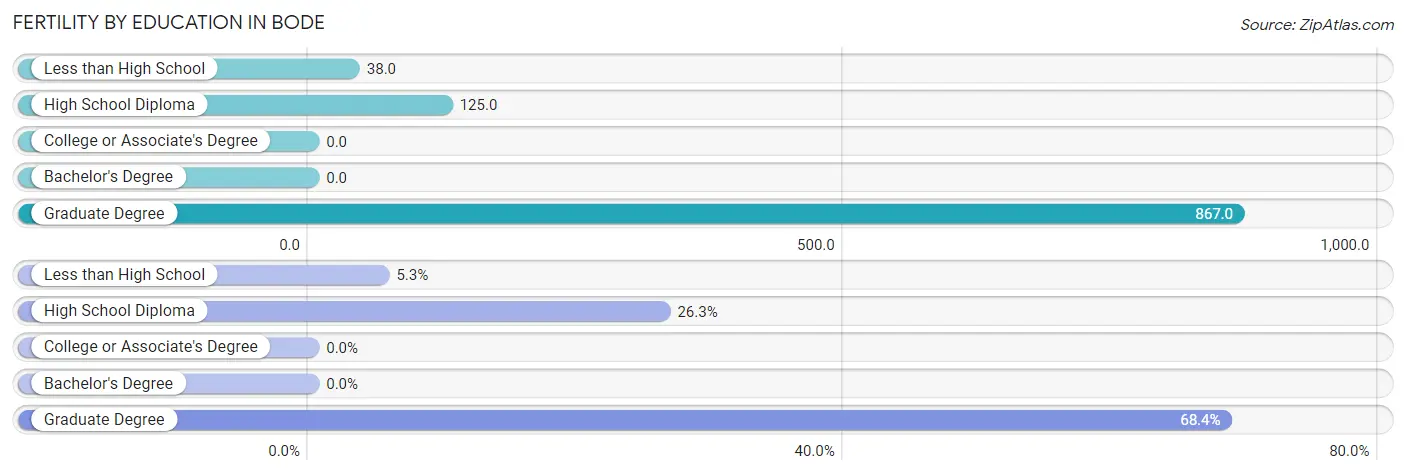
| Educational Attainment | Women with Births | Births / 1,000 Women |
| Less than High School | 1 (5.3%) | 38.0 |
| High School Diploma | 5 (26.3%) | 125.0 |
| College or Associate's Degree | 0 (0.0%) | 0.0 |
| Bachelor's Degree | 0 (0.0%) | 0.0 |
| Graduate Degree | 13 (68.4%) | 867.0 |
| Total | 19 (100.0%) | 156.0 |
Fertility by Education by Marriage Status in Bode
5.3% of women with births in Bode are unmarried. Women with the educational attainment of high school diploma are most likely to be married with 100.0% of them married at childbirth, while women with the educational attainment of less than high school are least likely to be married with 100.0% of them unmarried at childbirth.
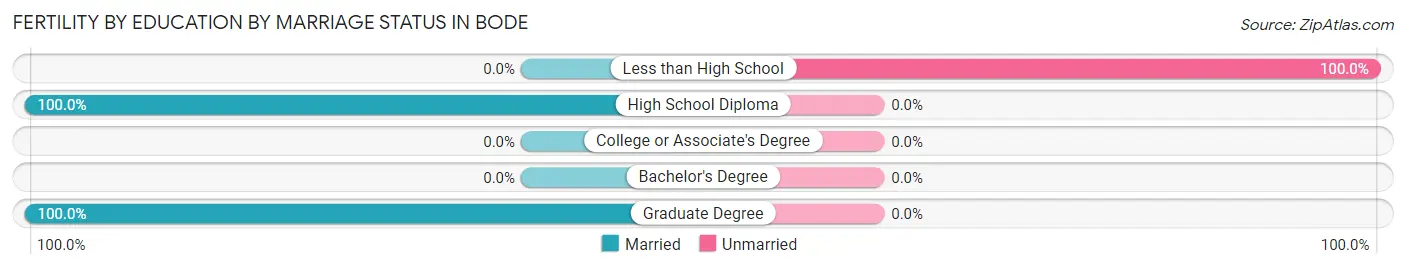
| Educational Attainment | Married | Unmarried |
| Less than High School | 0 (0.0%) | 1 (100.0%) |
| High School Diploma | 5 (100.0%) | 0 (0.0%) |
| College or Associate's Degree | 0 (0.0%) | 0 (0.0%) |
| Bachelor's Degree | 0 (0.0%) | 0 (0.0%) |
| Graduate Degree | 13 (100.0%) | 0 (0.0%) |
| Total | 18 (94.7%) | 1 (5.3%) |
Employment Characteristics in Bode
Employment by Class of Employer in Bode
Among the 199 employed individuals in Bode, private company employees (130 | 65.3%), local government employees (23 | 11.6%), and self-employed (not incorporated) (17 | 8.5%) make up the most common classes of employment.
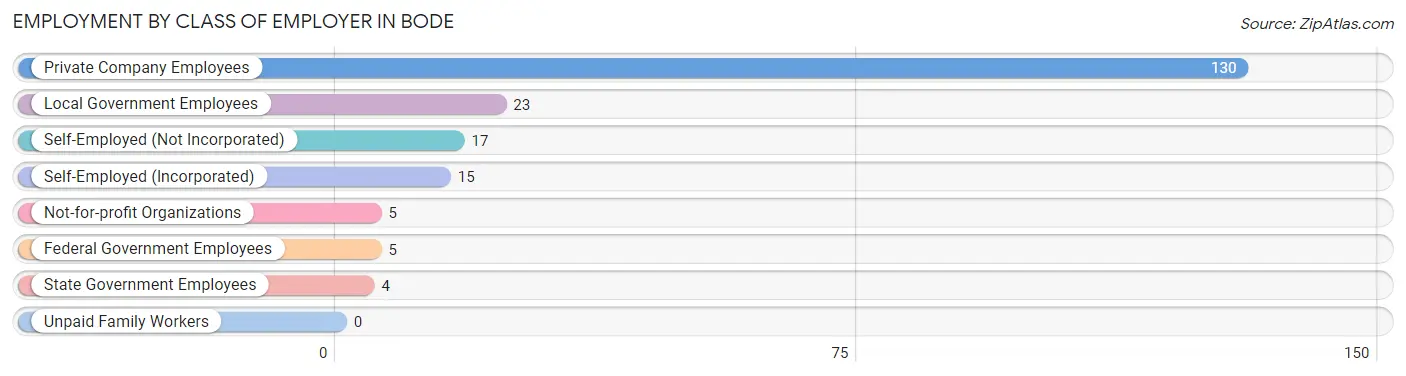
| Employer Class | # Employees | % Employees |
| Private Company Employees | 130 | 65.3% |
| Self-Employed (Incorporated) | 15 | 7.5% |
| Self-Employed (Not Incorporated) | 17 | 8.5% |
| Not-for-profit Organizations | 5 | 2.5% |
| Local Government Employees | 23 | 11.6% |
| State Government Employees | 4 | 2.0% |
| Federal Government Employees | 5 | 2.5% |
| Unpaid Family Workers | 0 | 0.0% |
| Total | 199 | 100.0% |
Employment Status by Age in Bode
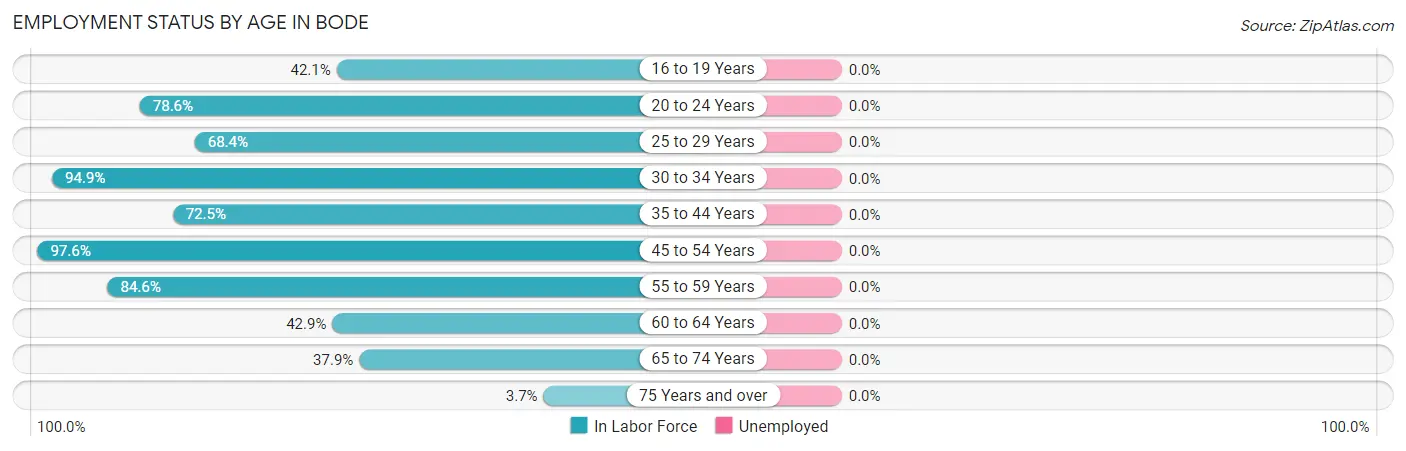
| Age Bracket | In Labor Force | Unemployed |
| 16 to 19 Years | 8 (42.1%) | 0 (0.0%) |
| 20 to 24 Years | 22 (78.6%) | 0 (0.0%) |
| 25 to 29 Years | 13 (68.4%) | 0 (0.0%) |
| 30 to 34 Years | 37 (94.9%) | 0 (0.0%) |
| 35 to 44 Years | 50 (72.5%) | 0 (0.0%) |
| 45 to 54 Years | 40 (97.6%) | 0 (0.0%) |
| 55 to 59 Years | 11 (84.6%) | 0 (0.0%) |
| 60 to 64 Years | 6 (42.9%) | 0 (0.0%) |
| 65 to 74 Years | 11 (37.9%) | 0 (0.0%) |
| 75 Years and over | 1 (3.7%) | 0 (0.0%) |
| Total | 199 (66.8%) | 0 (0.0%) |
Employment Status by Educational Attainment in Bode
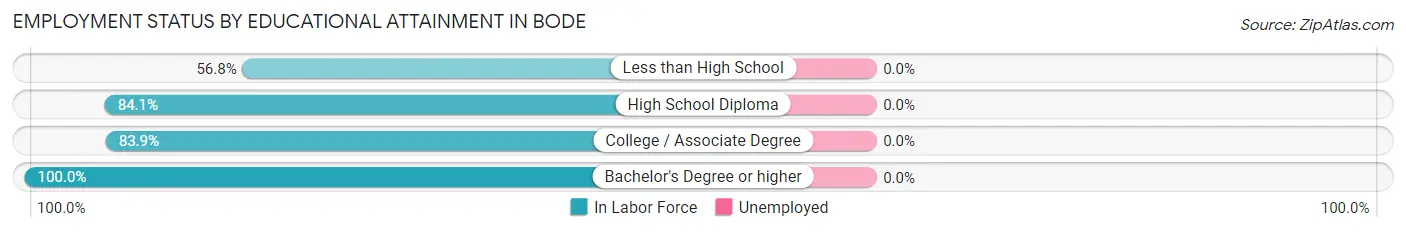
| Educational Attainment | In Labor Force | Unemployed |
| Less than High School | 25 (56.8%) | 0 (0.0%) |
| High School Diploma | 53 (84.1%) | 0 (0.0%) |
| College / Associate Degree | 47 (83.9%) | 0 (0.0%) |
| Bachelor's Degree or higher | 32 (100.0%) | 0 (0.0%) |
| Total | 157 (80.5%) | 0 (0.0%) |
Employment Occupations by Sex in Bode
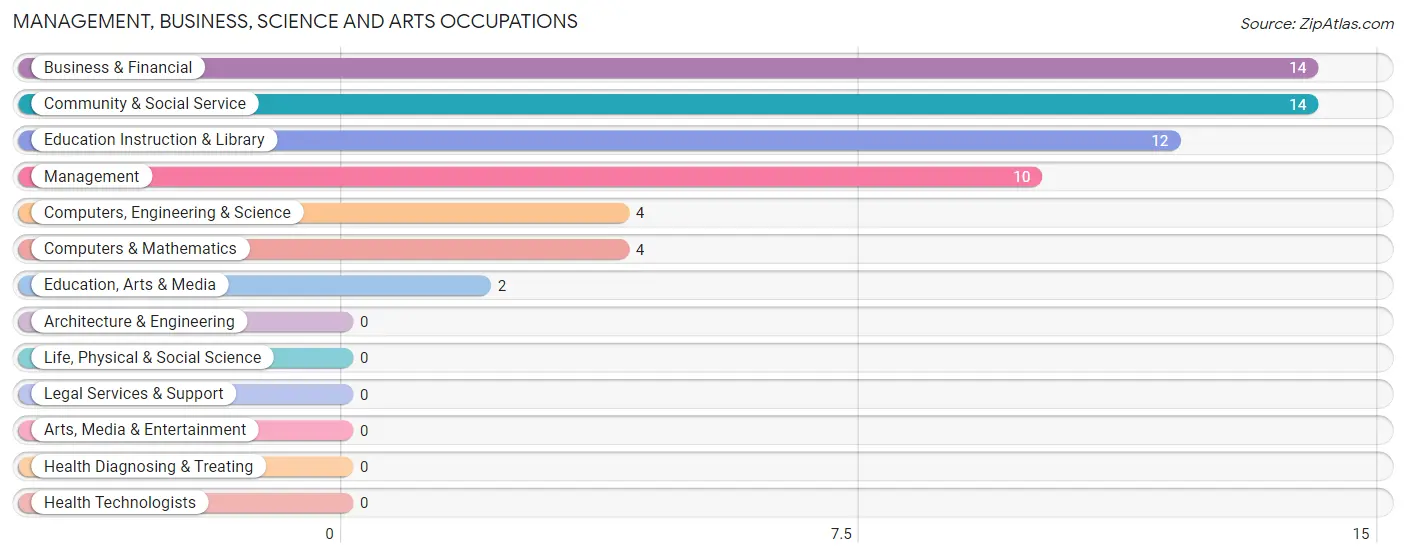
Management, Business, Science and Arts Occupations
The most common Management, Business, Science and Arts occupations in Bode are Business & Financial (14 | 7.0%), Community & Social Service (14 | 7.0%), Education Instruction & Library (12 | 6.0%), Management (10 | 5.0%), and Computers, Engineering & Science (4 | 2.0%).
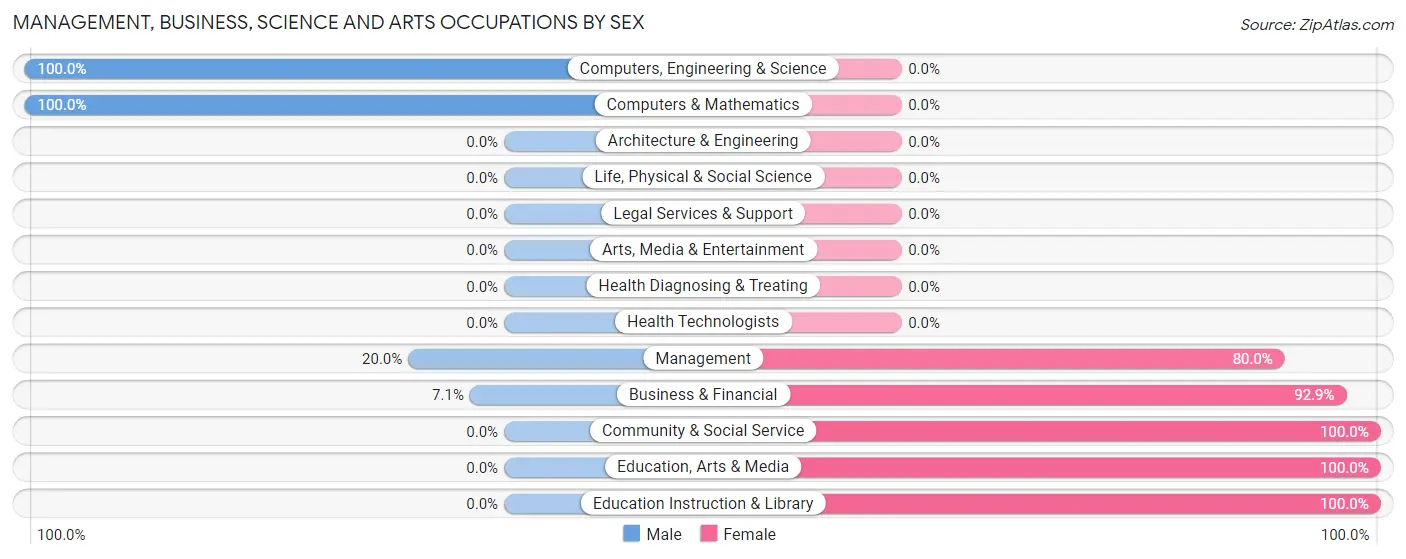
Management, Business, Science and Arts Occupations by Sex
Within the Management, Business, Science and Arts occupations in Bode, the most male-oriented occupations are Computers, Engineering & Science (100.0%), Computers & Mathematics (100.0%), and Management (20.0%), while the most female-oriented occupations are Community & Social Service (100.0%), Education, Arts & Media (100.0%), and Education Instruction & Library (100.0%).
| Occupation | Male | Female |
| Management | 2 (20.0%) | 8 (80.0%) |
| Business & Financial | 1 (7.1%) | 13 (92.9%) |
| Computers, Engineering & Science | 4 (100.0%) | 0 (0.0%) |
| Computers & Mathematics | 4 (100.0%) | 0 (0.0%) |
| Architecture & Engineering | 0 (0.0%) | 0 (0.0%) |
| Life, Physical & Social Science | 0 (0.0%) | 0 (0.0%) |
| Community & Social Service | 0 (0.0%) | 14 (100.0%) |
| Education, Arts & Media | 0 (0.0%) | 2 (100.0%) |
| Legal Services & Support | 0 (0.0%) | 0 (0.0%) |
| Education Instruction & Library | 0 (0.0%) | 12 (100.0%) |
| Arts, Media & Entertainment | 0 (0.0%) | 0 (0.0%) |
| Health Diagnosing & Treating | 0 (0.0%) | 0 (0.0%) |
| Health Technologists | 0 (0.0%) | 0 (0.0%) |
| Total (Category) | 7 (16.7%) | 35 (83.3%) |
| Total (Overall) | 92 (46.2%) | 107 (53.8%) |
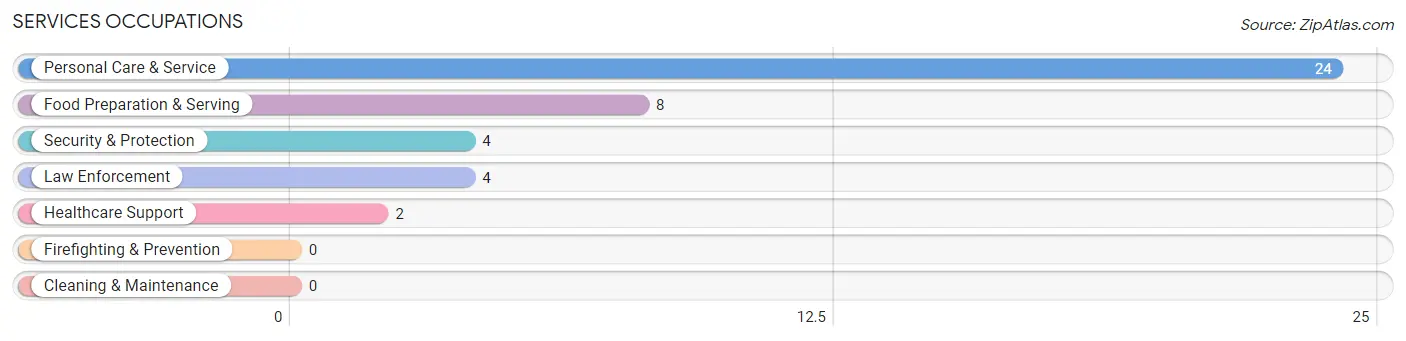
Services Occupations
The most common Services occupations in Bode are Personal Care & Service (24 | 12.1%), Food Preparation & Serving (8 | 4.0%), Security & Protection (4 | 2.0%), Law Enforcement (4 | 2.0%), and Healthcare Support (2 | 1.0%).
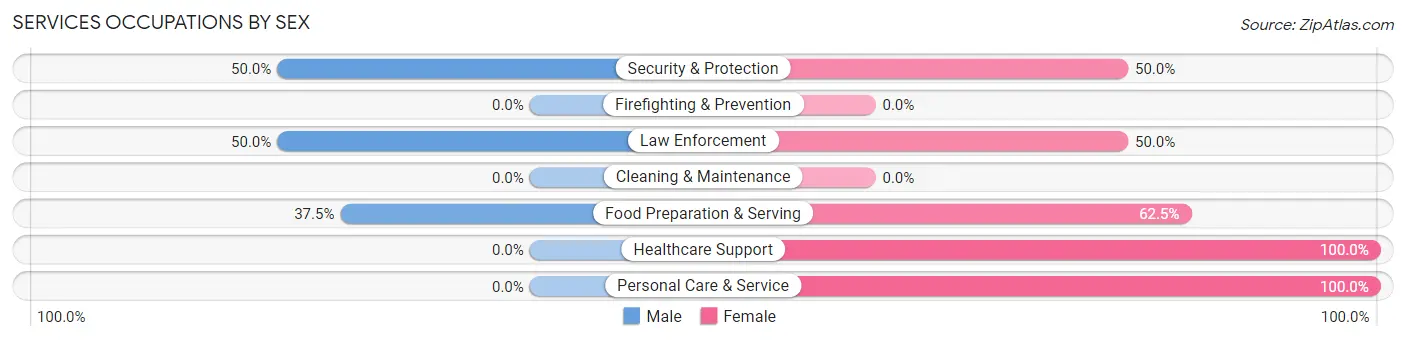
Services Occupations by Sex
Within the Services occupations in Bode, the most male-oriented occupations are Security & Protection (50.0%), Law Enforcement (50.0%), and Food Preparation & Serving (37.5%), while the most female-oriented occupations are Healthcare Support (100.0%), Personal Care & Service (100.0%), and Food Preparation & Serving (62.5%).
| Occupation | Male | Female |
| Healthcare Support | 0 (0.0%) | 2 (100.0%) |
| Security & Protection | 2 (50.0%) | 2 (50.0%) |
| Firefighting & Prevention | 0 (0.0%) | 0 (0.0%) |
| Law Enforcement | 2 (50.0%) | 2 (50.0%) |
| Food Preparation & Serving | 3 (37.5%) | 5 (62.5%) |
| Cleaning & Maintenance | 0 (0.0%) | 0 (0.0%) |
| Personal Care & Service | 0 (0.0%) | 24 (100.0%) |
| Total (Category) | 5 (13.2%) | 33 (86.8%) |
| Total (Overall) | 92 (46.2%) | 107 (53.8%) |
Sales and Office Occupations
The most common Sales and Office occupations in Bode are Office & Administration (20 | 10.1%), and Sales & Related (16 | 8.0%).
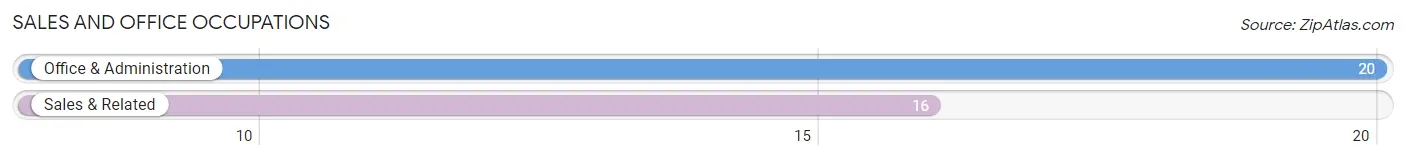
Sales and Office Occupations by Sex
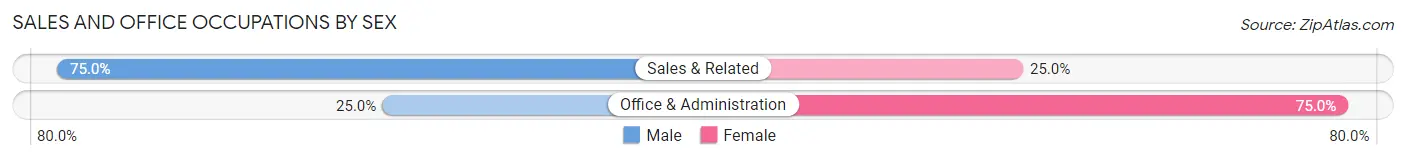
| Occupation | Male | Female |
| Sales & Related | 12 (75.0%) | 4 (25.0%) |
| Office & Administration | 5 (25.0%) | 15 (75.0%) |
| Total (Category) | 17 (47.2%) | 19 (52.8%) |
| Total (Overall) | 92 (46.2%) | 107 (53.8%) |
Natural Resources, Construction and Maintenance Occupations
The most common Natural Resources, Construction and Maintenance occupations in Bode are Construction & Extraction (29 | 14.6%), Farming, Fishing & Forestry (9 | 4.5%), and Installation, Maintenance & Repair (2 | 1.0%).
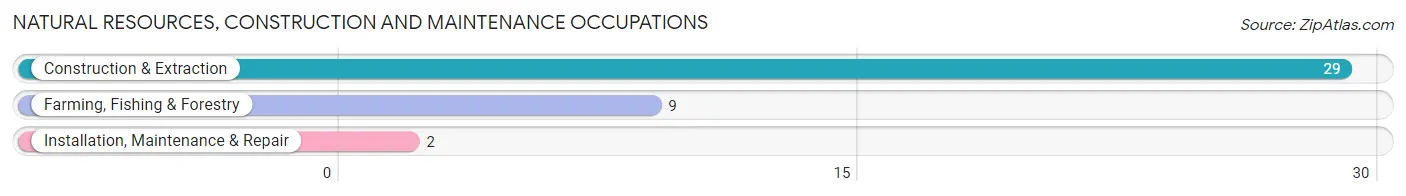
Natural Resources, Construction and Maintenance Occupations by Sex
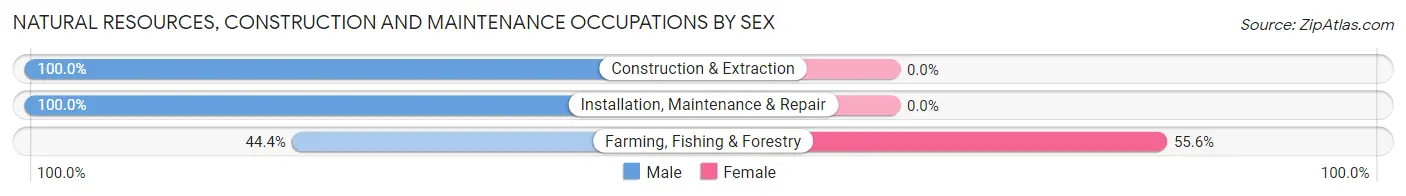
| Occupation | Male | Female |
| Farming, Fishing & Forestry | 4 (44.4%) | 5 (55.6%) |
| Construction & Extraction | 29 (100.0%) | 0 (0.0%) |
| Installation, Maintenance & Repair | 2 (100.0%) | 0 (0.0%) |
| Total (Category) | 35 (87.5%) | 5 (12.5%) |
| Total (Overall) | 92 (46.2%) | 107 (53.8%) |
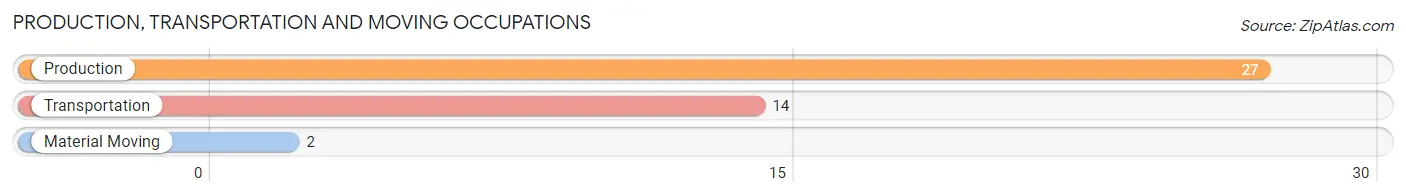
Production, Transportation and Moving Occupations
The most common Production, Transportation and Moving occupations in Bode are Production (27 | 13.6%), Transportation (14 | 7.0%), and Material Moving (2 | 1.0%).
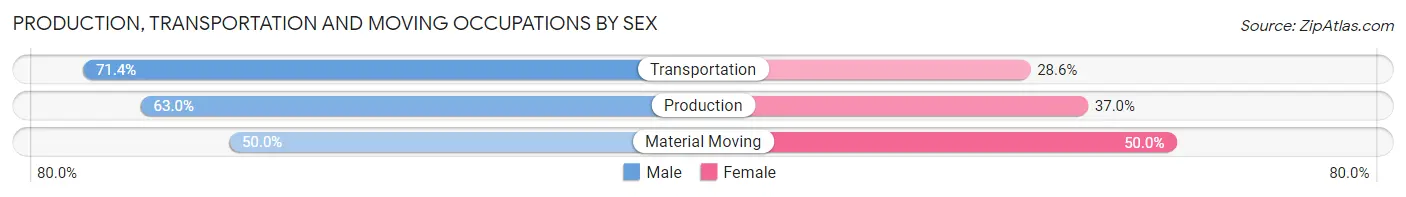
Production, Transportation and Moving Occupations by Sex
| Occupation | Male | Female |
| Production | 17 (63.0%) | 10 (37.0%) |
| Transportation | 10 (71.4%) | 4 (28.6%) |
| Material Moving | 1 (50.0%) | 1 (50.0%) |
| Total (Category) | 28 (65.1%) | 15 (34.9%) |
| Total (Overall) | 92 (46.2%) | 107 (53.8%) |
Employment Industries by Sex in Bode
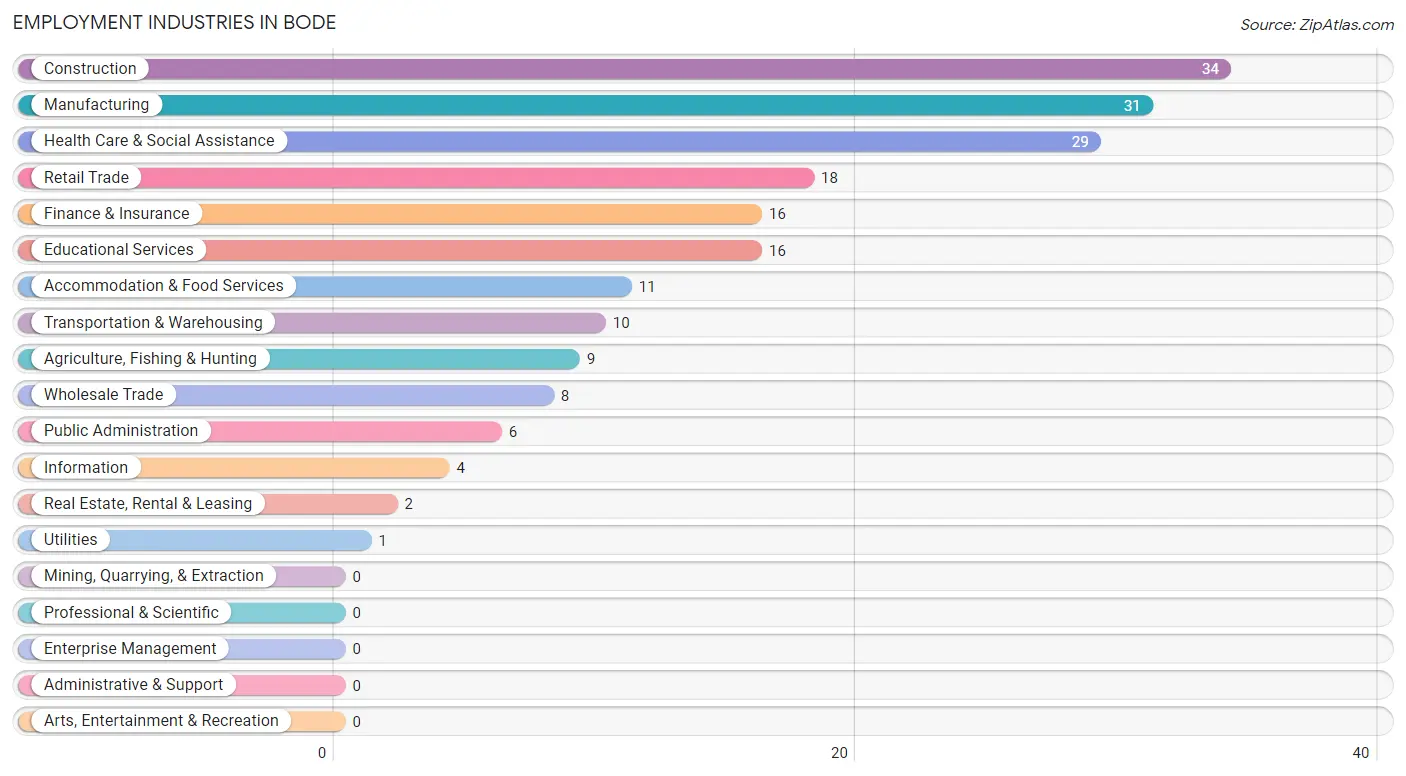
Employment Industries in Bode
The major employment industries in Bode include Construction (34 | 17.1%), Manufacturing (31 | 15.6%), Health Care & Social Assistance (29 | 14.6%), Retail Trade (18 | 9.0%), and Finance & Insurance (16 | 8.0%).
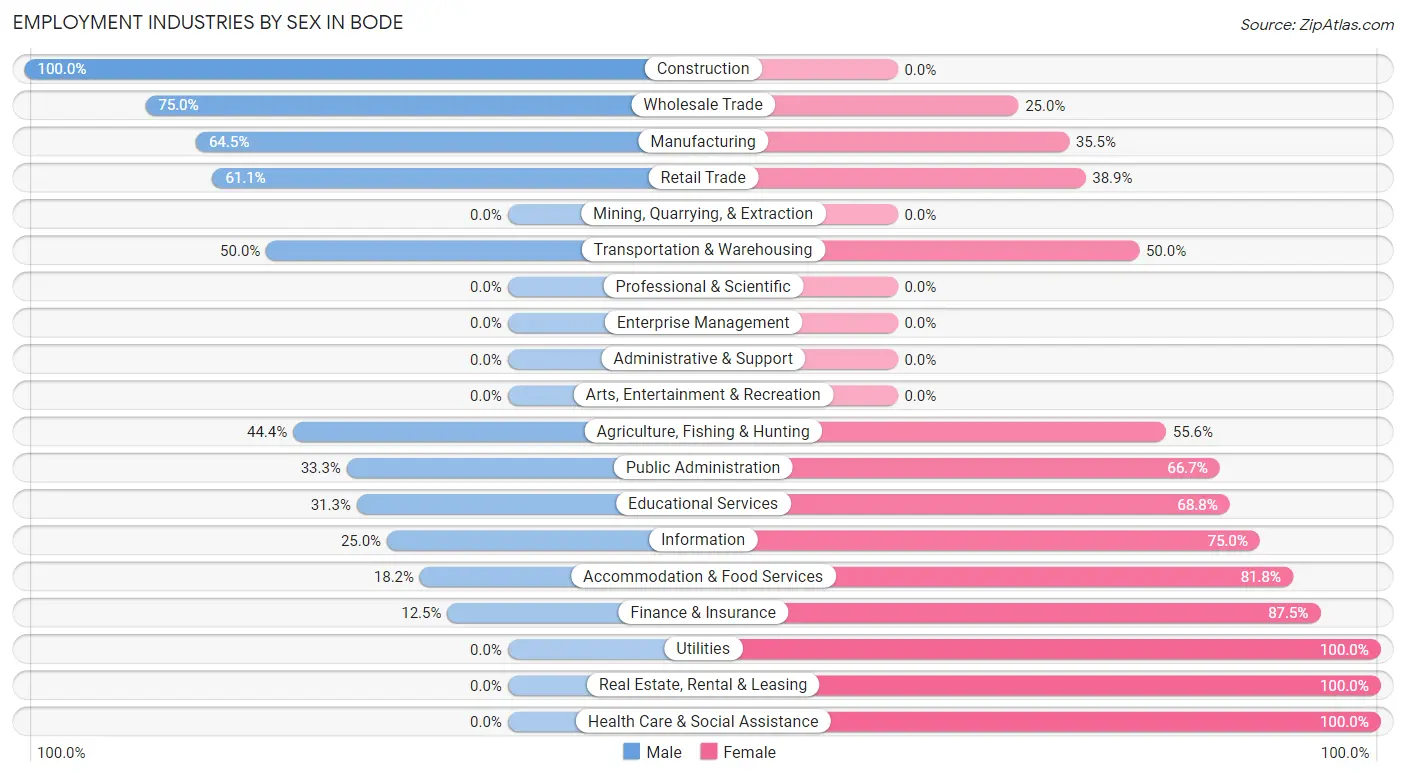
Employment Industries by Sex in Bode
The Bode industries that see more men than women are Construction (100.0%), Wholesale Trade (75.0%), and Manufacturing (64.5%), whereas the industries that tend to have a higher number of women are Utilities (100.0%), Real Estate, Rental & Leasing (100.0%), and Health Care & Social Assistance (100.0%).
| Industry | Male | Female |
| Agriculture, Fishing & Hunting | 4 (44.4%) | 5 (55.6%) |
| Mining, Quarrying, & Extraction | 0 (0.0%) | 0 (0.0%) |
| Construction | 34 (100.0%) | 0 (0.0%) |
| Manufacturing | 20 (64.5%) | 11 (35.5%) |
| Wholesale Trade | 6 (75.0%) | 2 (25.0%) |
| Retail Trade | 11 (61.1%) | 7 (38.9%) |
| Transportation & Warehousing | 5 (50.0%) | 5 (50.0%) |
| Utilities | 0 (0.0%) | 1 (100.0%) |
| Information | 1 (25.0%) | 3 (75.0%) |
| Finance & Insurance | 2 (12.5%) | 14 (87.5%) |
| Real Estate, Rental & Leasing | 0 (0.0%) | 2 (100.0%) |
| Professional & Scientific | 0 (0.0%) | 0 (0.0%) |
| Enterprise Management | 0 (0.0%) | 0 (0.0%) |
| Administrative & Support | 0 (0.0%) | 0 (0.0%) |
| Educational Services | 5 (31.2%) | 11 (68.8%) |
| Health Care & Social Assistance | 0 (0.0%) | 29 (100.0%) |
| Arts, Entertainment & Recreation | 0 (0.0%) | 0 (0.0%) |
| Accommodation & Food Services | 2 (18.2%) | 9 (81.8%) |
| Public Administration | 2 (33.3%) | 4 (66.7%) |
| Total | 92 (46.2%) | 107 (53.8%) |
Education in Bode
School Enrollment in Bode
The most common levels of schooling among the 100 students in Bode are high school (35 | 35.0%), middle school (21 | 21.0%), and elementary school (16 | 16.0%).
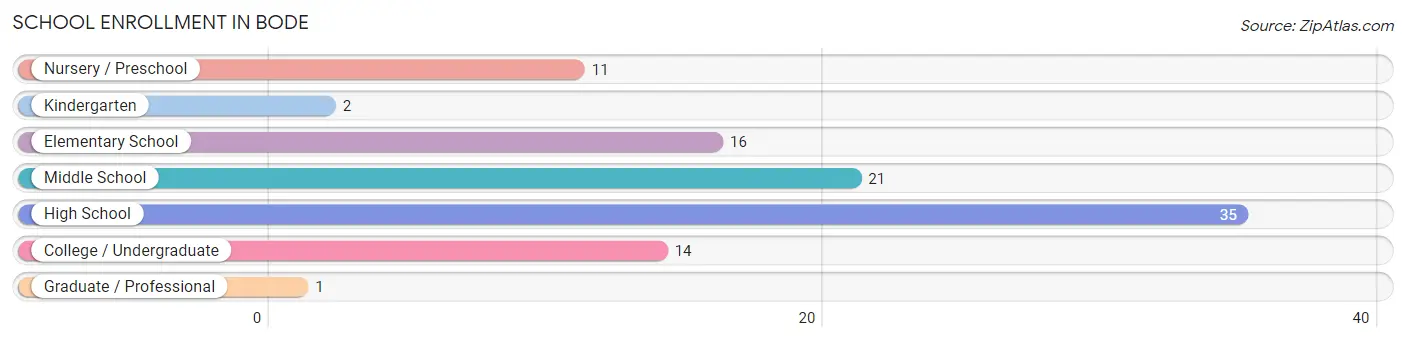
| School Level | # Students | % Students |
| Nursery / Preschool | 11 | 11.0% |
| Kindergarten | 2 | 2.0% |
| Elementary School | 16 | 16.0% |
| Middle School | 21 | 21.0% |
| High School | 35 | 35.0% |
| College / Undergraduate | 14 | 14.0% |
| Graduate / Professional | 1 | 1.0% |
| Total | 100 | 100.0% |
School Enrollment by Age by Funding Source in Bode
Out of a total of 100 students who are enrolled in schools in Bode, 8 (8.0%) attend a private institution, while the remaining 92 (92.0%) are enrolled in public schools. The age group of 15 to 17 year olds has the highest likelihood of being enrolled in private schools, with 4 (13.8% in the age bracket) enrolled. Conversely, the age group of 3 to 4 year olds has the lowest likelihood of being enrolled in a private school, with 11 (100.0% in the age bracket) attending a public institution.
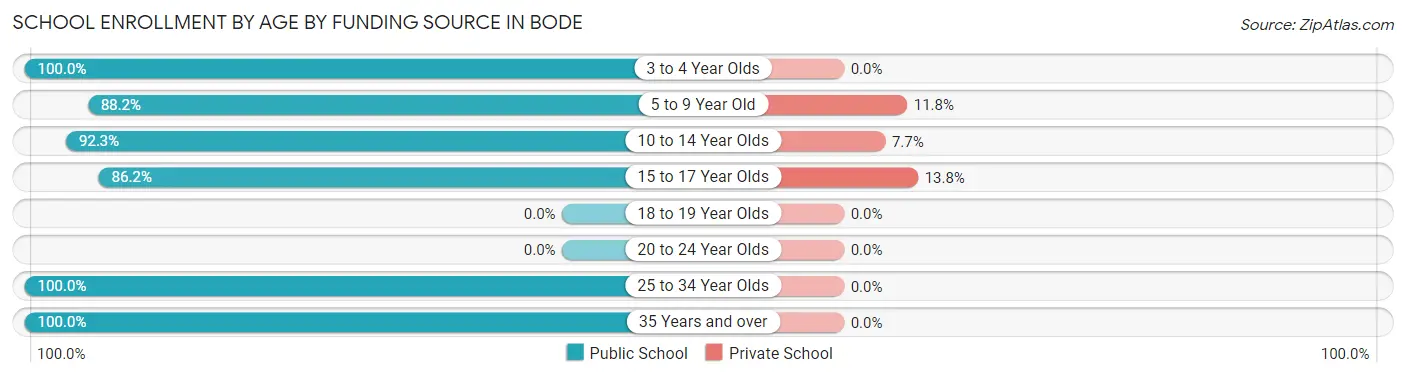
| Age Bracket | Public School | Private School |
| 3 to 4 Year Olds | 11 (100.0%) | 0 (0.0%) |
| 5 to 9 Year Old | 15 (88.2%) | 2 (11.8%) |
| 10 to 14 Year Olds | 24 (92.3%) | 2 (7.7%) |
| 15 to 17 Year Olds | 25 (86.2%) | 4 (13.8%) |
| 18 to 19 Year Olds | 0 (0.0%) | 0 (0.0%) |
| 20 to 24 Year Olds | 0 (0.0%) | 0 (0.0%) |
| 25 to 34 Year Olds | 12 (100.0%) | 0 (0.0%) |
| 35 Years and over | 5 (100.0%) | 0 (0.0%) |
| Total | 92 (92.0%) | 8 (8.0%) |
Educational Attainment by Field of Study in Bode
Bio, nature & agricultural (14 | 36.8%), business (9 | 23.7%), education (9 | 23.7%), arts & humanities (3 | 7.9%), and communications (2 | 5.3%) are the most common fields of study among 38 individuals in Bode who have obtained a bachelor's degree or higher.
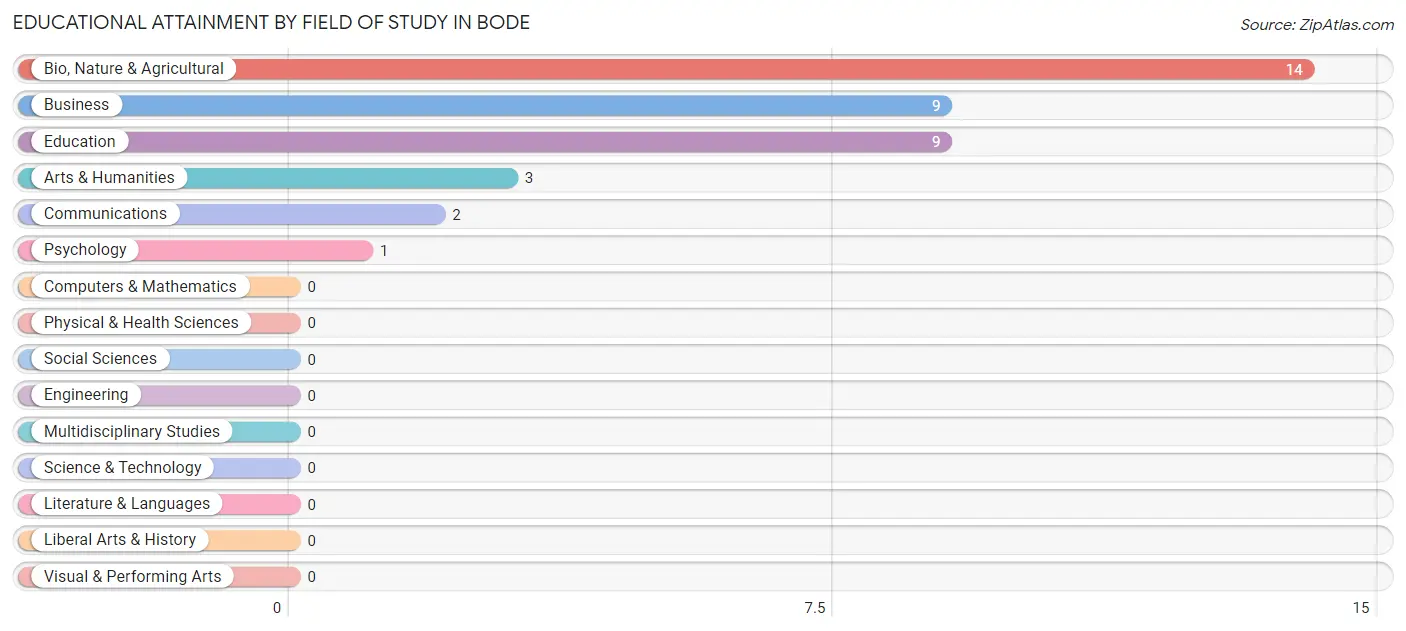
| Field of Study | # Graduates | % Graduates |
| Computers & Mathematics | 0 | 0.0% |
| Bio, Nature & Agricultural | 14 | 36.8% |
| Physical & Health Sciences | 0 | 0.0% |
| Psychology | 1 | 2.6% |
| Social Sciences | 0 | 0.0% |
| Engineering | 0 | 0.0% |
| Multidisciplinary Studies | 0 | 0.0% |
| Science & Technology | 0 | 0.0% |
| Business | 9 | 23.7% |
| Education | 9 | 23.7% |
| Literature & Languages | 0 | 0.0% |
| Liberal Arts & History | 0 | 0.0% |
| Visual & Performing Arts | 0 | 0.0% |
| Communications | 2 | 5.3% |
| Arts & Humanities | 3 | 7.9% |
| Total | 38 | 100.0% |
Transportation & Commute in Bode
Vehicle Availability by Sex in Bode
The most prevalent vehicle ownership categories in Bode are males with 2 vehicles (50, accounting for 54.3%) and females with 2 vehicles (44, making up 46.7%).
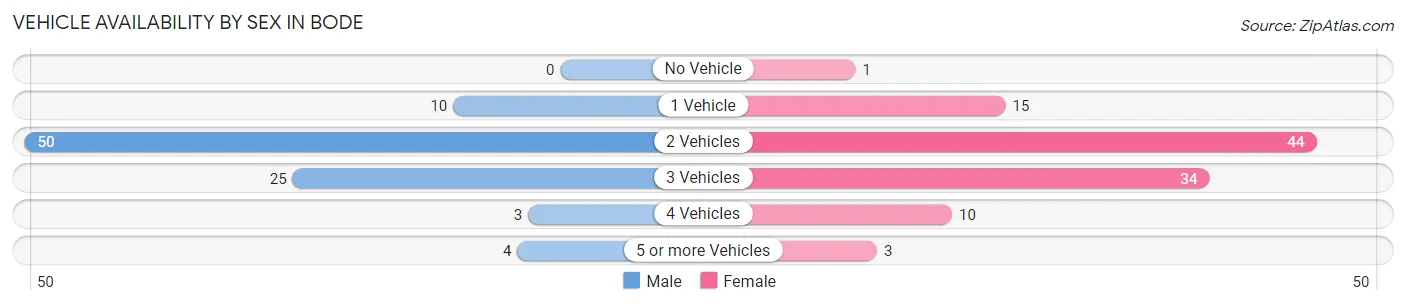
| Vehicles Available | Male | Female |
| No Vehicle | 0 (0.0%) | 1 (0.9%) |
| 1 Vehicle | 10 (10.9%) | 15 (14.0%) |
| 2 Vehicles | 50 (54.3%) | 44 (41.1%) |
| 3 Vehicles | 25 (27.2%) | 34 (31.8%) |
| 4 Vehicles | 3 (3.3%) | 10 (9.3%) |
| 5 or more Vehicles | 4 (4.3%) | 3 (2.8%) |
| Total | 92 (100.0%) | 107 (100.0%) |
Commute Time in Bode
The most frequently occuring commute durations in Bode are 20 to 24 minutes (45 commuters, 23.4%), 5 to 9 minutes (27 commuters, 14.1%), and 15 to 19 minutes (24 commuters, 12.5%).
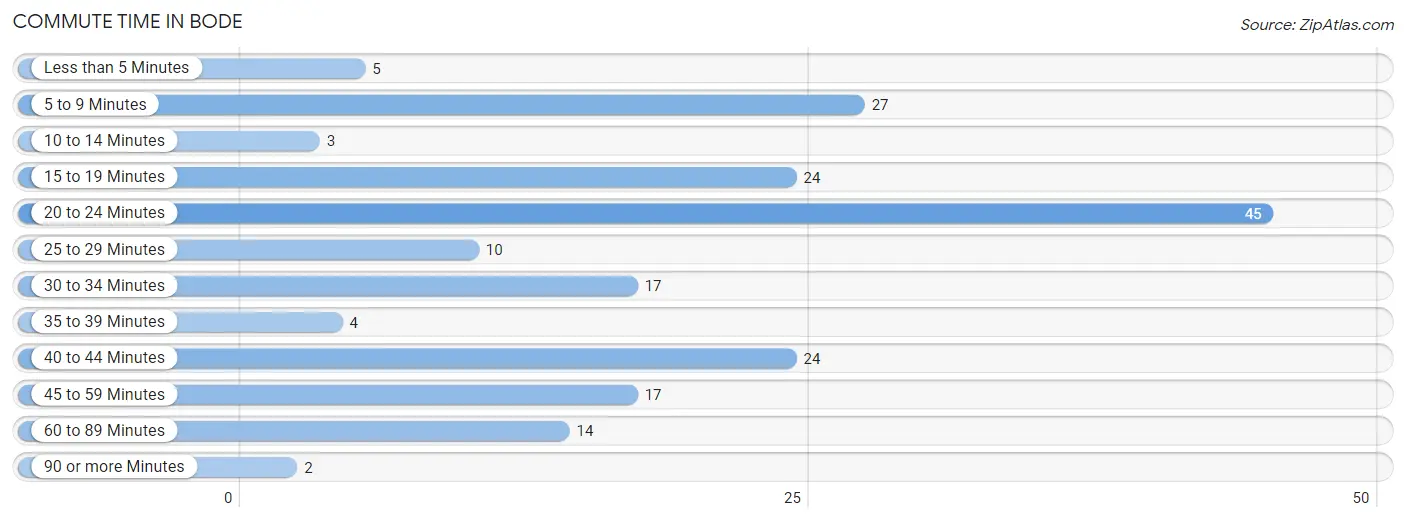
| Commute Time | # Commuters | % Commuters |
| Less than 5 Minutes | 5 | 2.6% |
| 5 to 9 Minutes | 27 | 14.1% |
| 10 to 14 Minutes | 3 | 1.6% |
| 15 to 19 Minutes | 24 | 12.5% |
| 20 to 24 Minutes | 45 | 23.4% |
| 25 to 29 Minutes | 10 | 5.2% |
| 30 to 34 Minutes | 17 | 8.8% |
| 35 to 39 Minutes | 4 | 2.1% |
| 40 to 44 Minutes | 24 | 12.5% |
| 45 to 59 Minutes | 17 | 8.8% |
| 60 to 89 Minutes | 14 | 7.3% |
| 90 or more Minutes | 2 | 1.0% |
Commute Time by Sex in Bode
The most common commute times in Bode are 5 to 9 minutes (19 commuters, 20.6%) for males and 20 to 24 minutes (36 commuters, 36.0%) for females.
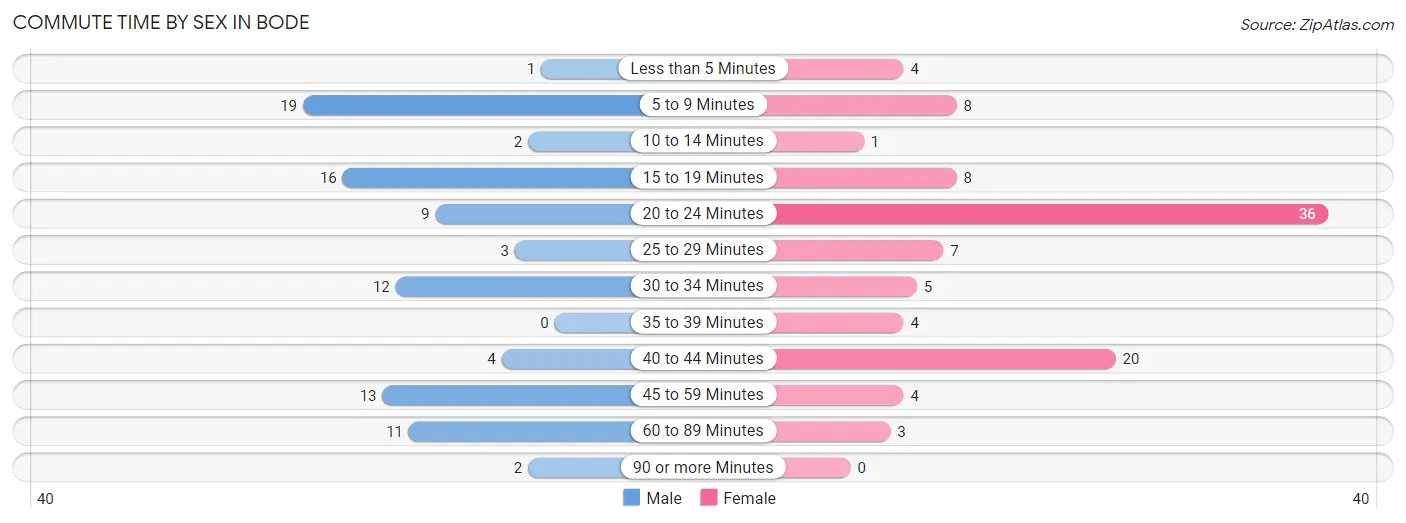
| Commute Time | Male | Female |
| Less than 5 Minutes | 1 (1.1%) | 4 (4.0%) |
| 5 to 9 Minutes | 19 (20.6%) | 8 (8.0%) |
| 10 to 14 Minutes | 2 (2.2%) | 1 (1.0%) |
| 15 to 19 Minutes | 16 (17.4%) | 8 (8.0%) |
| 20 to 24 Minutes | 9 (9.8%) | 36 (36.0%) |
| 25 to 29 Minutes | 3 (3.3%) | 7 (7.0%) |
| 30 to 34 Minutes | 12 (13.0%) | 5 (5.0%) |
| 35 to 39 Minutes | 0 (0.0%) | 4 (4.0%) |
| 40 to 44 Minutes | 4 (4.3%) | 20 (20.0%) |
| 45 to 59 Minutes | 13 (14.1%) | 4 (4.0%) |
| 60 to 89 Minutes | 11 (12.0%) | 3 (3.0%) |
| 90 or more Minutes | 2 (2.2%) | 0 (0.0%) |
Time of Departure to Work by Sex in Bode
The most frequent times of departure to work in Bode are 6:00 AM to 6:29 AM (27, 29.3%) for males and 7:30 AM to 7:59 AM (19, 19.0%) for females.
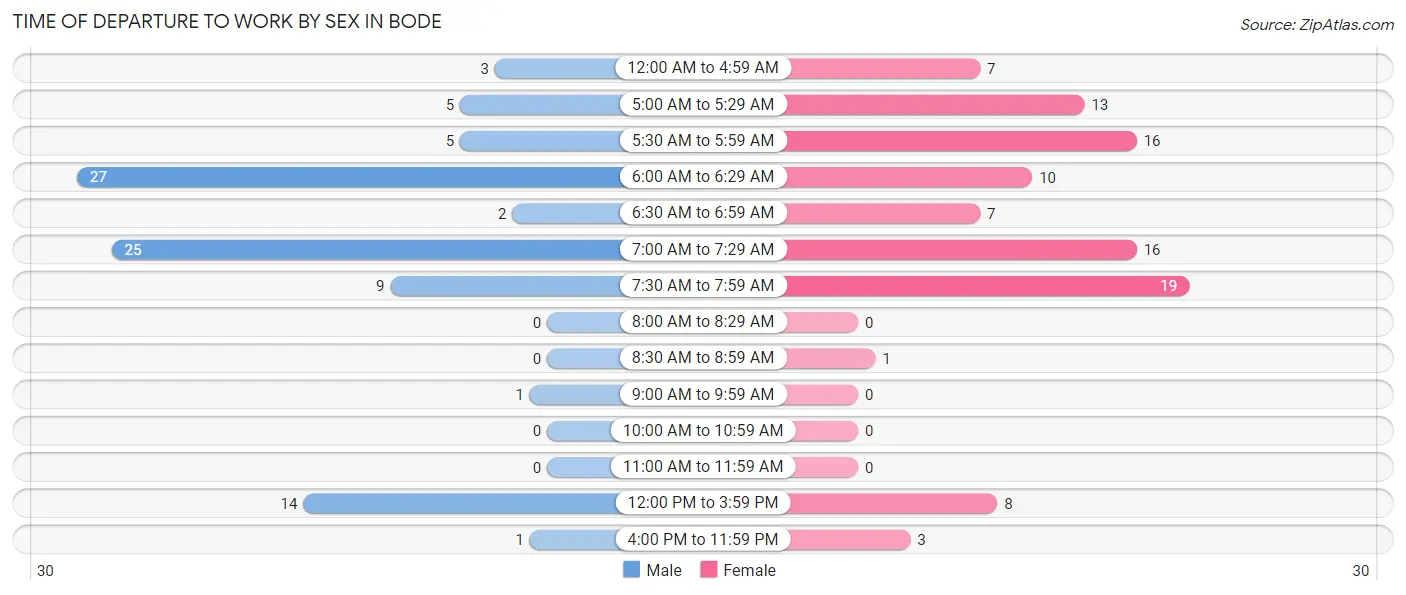
| Time of Departure | Male | Female |
| 12:00 AM to 4:59 AM | 3 (3.3%) | 7 (7.0%) |
| 5:00 AM to 5:29 AM | 5 (5.4%) | 13 (13.0%) |
| 5:30 AM to 5:59 AM | 5 (5.4%) | 16 (16.0%) |
| 6:00 AM to 6:29 AM | 27 (29.3%) | 10 (10.0%) |
| 6:30 AM to 6:59 AM | 2 (2.2%) | 7 (7.0%) |
| 7:00 AM to 7:29 AM | 25 (27.2%) | 16 (16.0%) |
| 7:30 AM to 7:59 AM | 9 (9.8%) | 19 (19.0%) |
| 8:00 AM to 8:29 AM | 0 (0.0%) | 0 (0.0%) |
| 8:30 AM to 8:59 AM | 0 (0.0%) | 1 (1.0%) |
| 9:00 AM to 9:59 AM | 1 (1.1%) | 0 (0.0%) |
| 10:00 AM to 10:59 AM | 0 (0.0%) | 0 (0.0%) |
| 11:00 AM to 11:59 AM | 0 (0.0%) | 0 (0.0%) |
| 12:00 PM to 3:59 PM | 14 (15.2%) | 8 (8.0%) |
| 4:00 PM to 11:59 PM | 1 (1.1%) | 3 (3.0%) |
| Total | 92 (100.0%) | 100 (100.0%) |
Housing Occupancy in Bode
Occupancy by Ownership in Bode
Of the total 143 dwellings in Bode, owner-occupied units account for 103 (72.0%), while renter-occupied units make up 40 (28.0%).
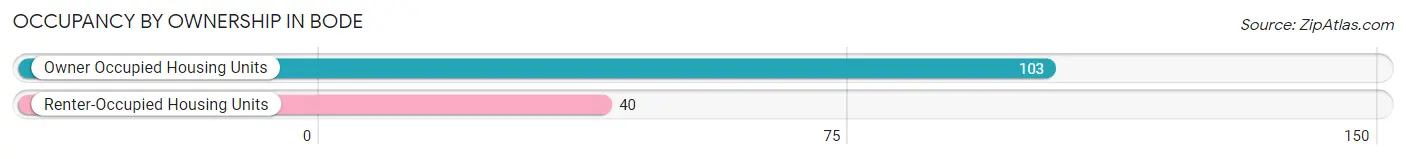
| Occupancy | # Housing Units | % Housing Units |
| Owner Occupied Housing Units | 103 | 72.0% |
| Renter-Occupied Housing Units | 40 | 28.0% |
| Total Occupied Housing Units | 143 | 100.0% |
Occupancy by Household Size in Bode
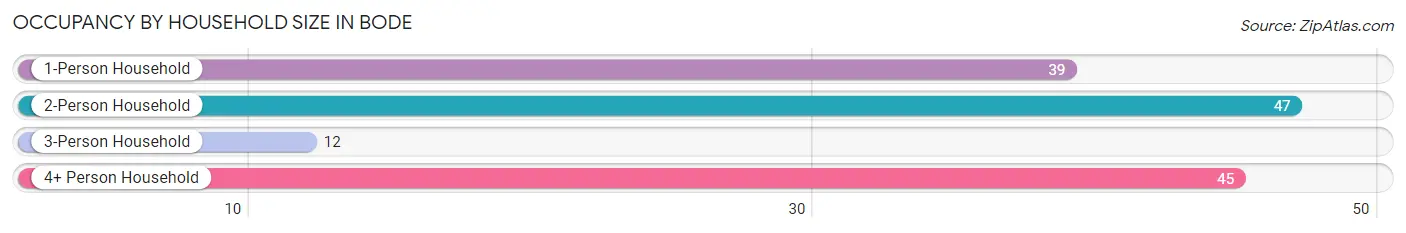
| Household Size | # Housing Units | % Housing Units |
| 1-Person Household | 39 | 27.3% |
| 2-Person Household | 47 | 32.9% |
| 3-Person Household | 12 | 8.4% |
| 4+ Person Household | 45 | 31.5% |
| Total Housing Units | 143 | 100.0% |
Occupancy by Ownership by Household Size in Bode
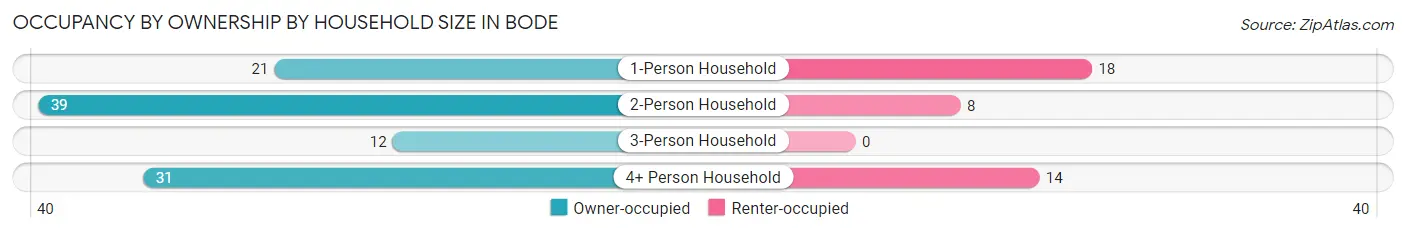
| Household Size | Owner-occupied | Renter-occupied |
| 1-Person Household | 21 (53.8%) | 18 (46.2%) |
| 2-Person Household | 39 (83.0%) | 8 (17.0%) |
| 3-Person Household | 12 (100.0%) | 0 (0.0%) |
| 4+ Person Household | 31 (68.9%) | 14 (31.1%) |
| Total Housing Units | 103 (72.0%) | 40 (28.0%) |
Occupancy by Educational Attainment in Bode
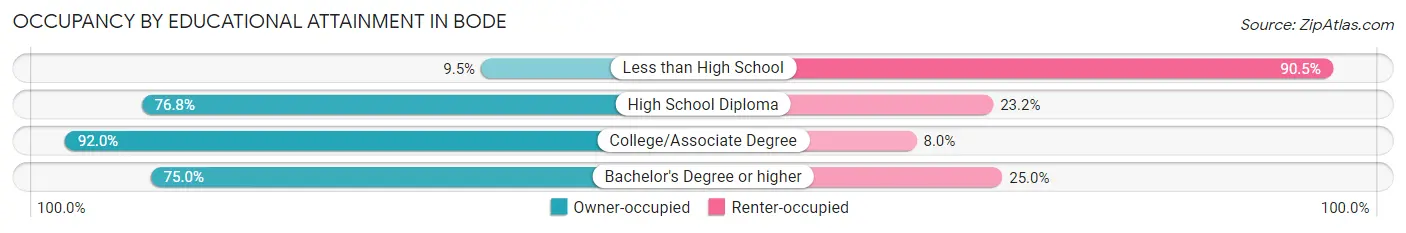
| Household Size | Owner-occupied | Renter-occupied |
| Less than High School | 2 (9.5%) | 19 (90.5%) |
| High School Diploma | 43 (76.8%) | 13 (23.2%) |
| College/Associate Degree | 46 (92.0%) | 4 (8.0%) |
| Bachelor's Degree or higher | 12 (75.0%) | 4 (25.0%) |
Occupancy by Age of Householder in Bode
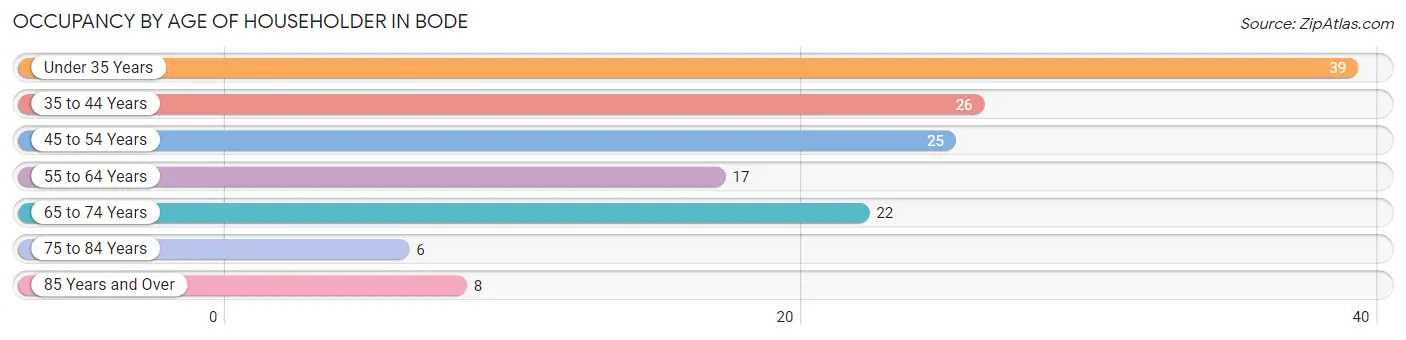
| Age Bracket | # Households | % Households |
| Under 35 Years | 39 | 27.3% |
| 35 to 44 Years | 26 | 18.2% |
| 45 to 54 Years | 25 | 17.5% |
| 55 to 64 Years | 17 | 11.9% |
| 65 to 74 Years | 22 | 15.4% |
| 75 to 84 Years | 6 | 4.2% |
| 85 Years and Over | 8 | 5.6% |
| Total | 143 | 100.0% |
Housing Finances in Bode
Median Income by Occupancy in Bode
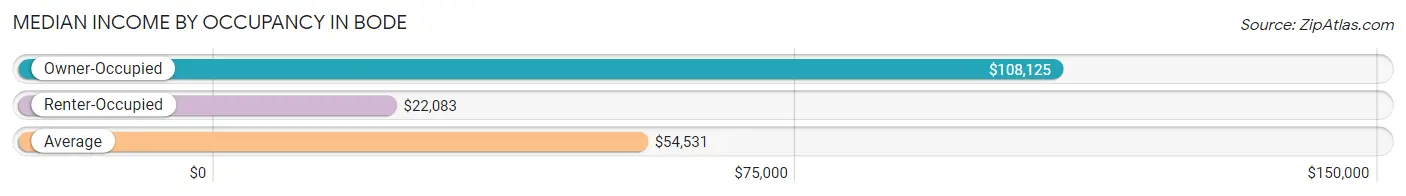
| Occupancy Type | # Households | Median Income |
| Owner-Occupied | 103 (72.0%) | $108,125 |
| Renter-Occupied | 40 (28.0%) | $22,083 |
| Average | 143 (100.0%) | $54,531 |
Occupancy by Householder Income Bracket in Bode
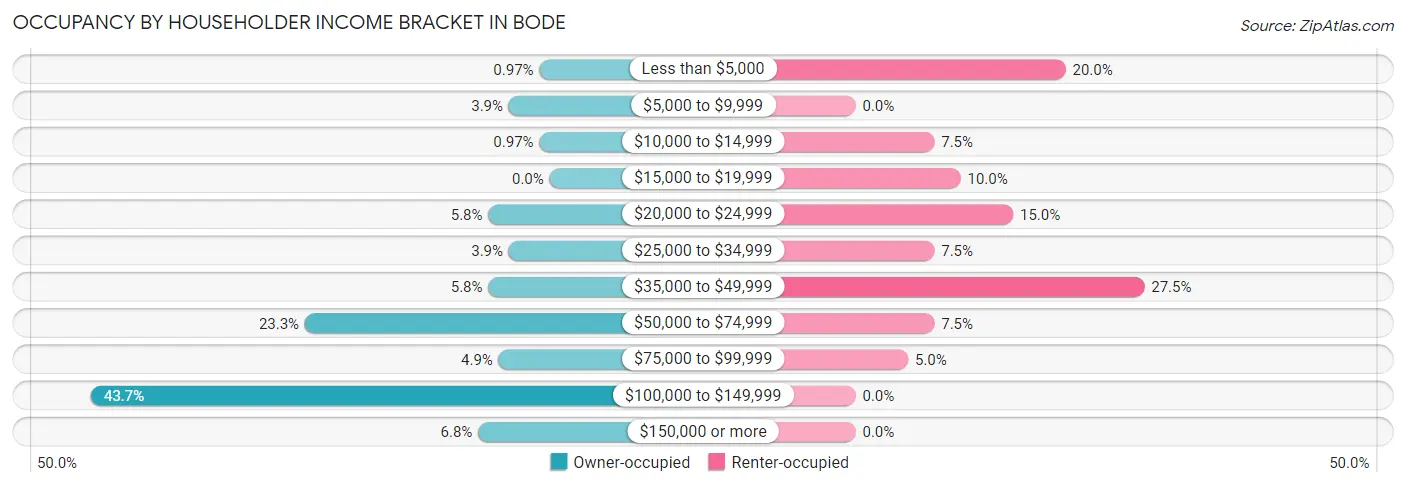
| Income Bracket | Owner-occupied | Renter-occupied |
| Less than $5,000 | 1 (1.0%) | 8 (20.0%) |
| $5,000 to $9,999 | 4 (3.9%) | 0 (0.0%) |
| $10,000 to $14,999 | 1 (1.0%) | 3 (7.5%) |
| $15,000 to $19,999 | 0 (0.0%) | 4 (10.0%) |
| $20,000 to $24,999 | 6 (5.8%) | 6 (15.0%) |
| $25,000 to $34,999 | 4 (3.9%) | 3 (7.5%) |
| $35,000 to $49,999 | 6 (5.8%) | 11 (27.5%) |
| $50,000 to $74,999 | 24 (23.3%) | 3 (7.5%) |
| $75,000 to $99,999 | 5 (4.9%) | 2 (5.0%) |
| $100,000 to $149,999 | 45 (43.7%) | 0 (0.0%) |
| $150,000 or more | 7 (6.8%) | 0 (0.0%) |
| Total | 103 (100.0%) | 40 (100.0%) |
Monthly Housing Cost Tiers in Bode
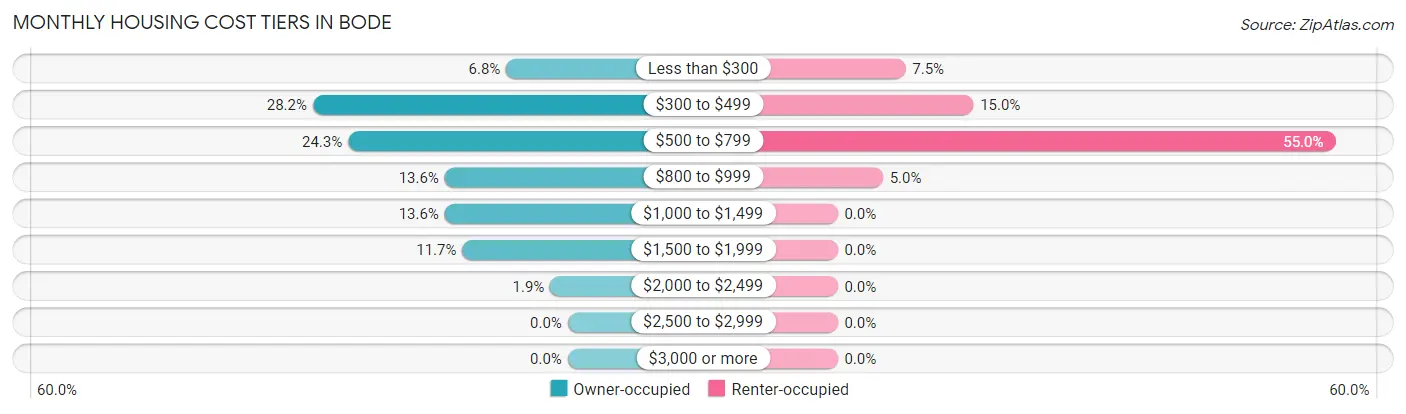
| Monthly Cost | Owner-occupied | Renter-occupied |
| Less than $300 | 7 (6.8%) | 3 (7.5%) |
| $300 to $499 | 29 (28.2%) | 6 (15.0%) |
| $500 to $799 | 25 (24.3%) | 22 (55.0%) |
| $800 to $999 | 14 (13.6%) | 2 (5.0%) |
| $1,000 to $1,499 | 14 (13.6%) | 0 (0.0%) |
| $1,500 to $1,999 | 12 (11.7%) | 0 (0.0%) |
| $2,000 to $2,499 | 2 (1.9%) | 0 (0.0%) |
| $2,500 to $2,999 | 0 (0.0%) | 0 (0.0%) |
| $3,000 or more | 0 (0.0%) | 0 (0.0%) |
| Total | 103 (100.0%) | 40 (100.0%) |
Physical Housing Characteristics in Bode
Housing Structures in Bode
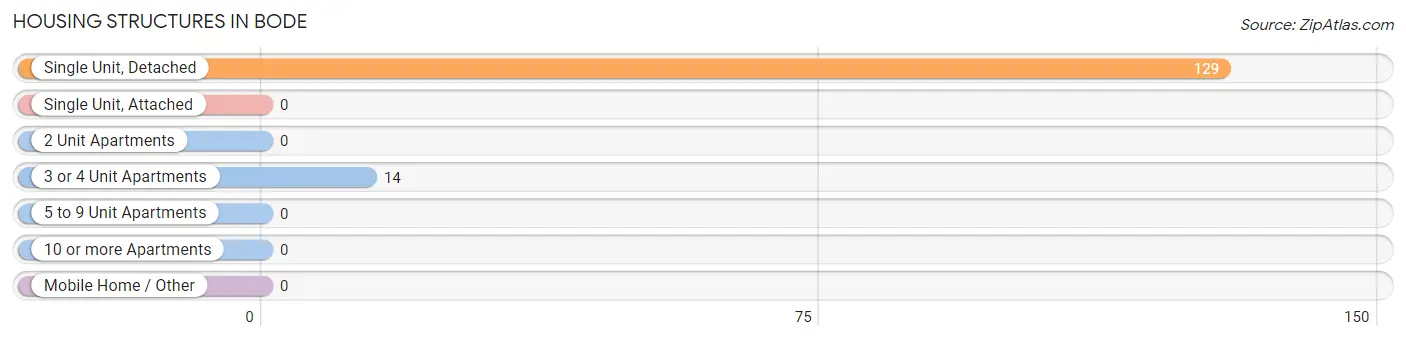
| Structure Type | # Housing Units | % Housing Units |
| Single Unit, Detached | 129 | 90.2% |
| Single Unit, Attached | 0 | 0.0% |
| 2 Unit Apartments | 0 | 0.0% |
| 3 or 4 Unit Apartments | 14 | 9.8% |
| 5 to 9 Unit Apartments | 0 | 0.0% |
| 10 or more Apartments | 0 | 0.0% |
| Mobile Home / Other | 0 | 0.0% |
| Total | 143 | 100.0% |
Housing Structures by Occupancy in Bode
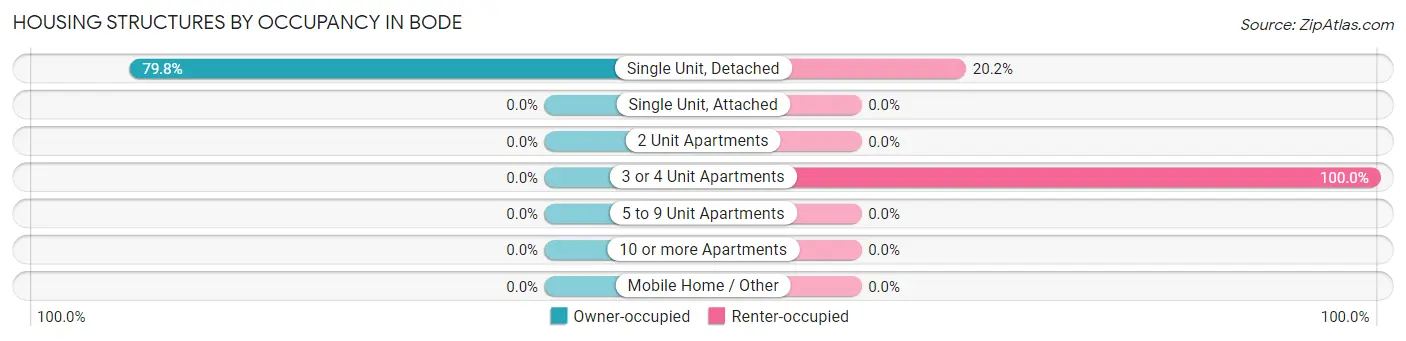
| Structure Type | Owner-occupied | Renter-occupied |
| Single Unit, Detached | 103 (79.8%) | 26 (20.2%) |
| Single Unit, Attached | 0 (0.0%) | 0 (0.0%) |
| 2 Unit Apartments | 0 (0.0%) | 0 (0.0%) |
| 3 or 4 Unit Apartments | 0 (0.0%) | 14 (100.0%) |
| 5 to 9 Unit Apartments | 0 (0.0%) | 0 (0.0%) |
| 10 or more Apartments | 0 (0.0%) | 0 (0.0%) |
| Mobile Home / Other | 0 (0.0%) | 0 (0.0%) |
| Total | 103 (72.0%) | 40 (28.0%) |
Housing Structures by Number of Rooms in Bode
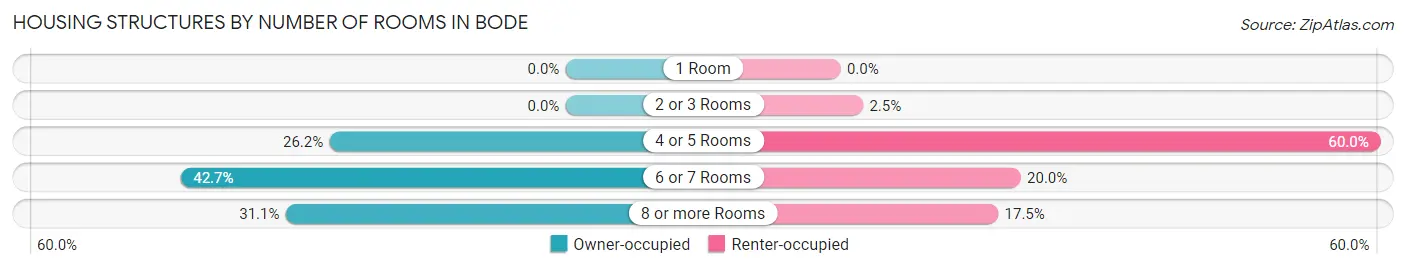
| Number of Rooms | Owner-occupied | Renter-occupied |
| 1 Room | 0 (0.0%) | 0 (0.0%) |
| 2 or 3 Rooms | 0 (0.0%) | 1 (2.5%) |
| 4 or 5 Rooms | 27 (26.2%) | 24 (60.0%) |
| 6 or 7 Rooms | 44 (42.7%) | 8 (20.0%) |
| 8 or more Rooms | 32 (31.1%) | 7 (17.5%) |
| Total | 103 (100.0%) | 40 (100.0%) |
Housing Structure by Heating Type in Bode
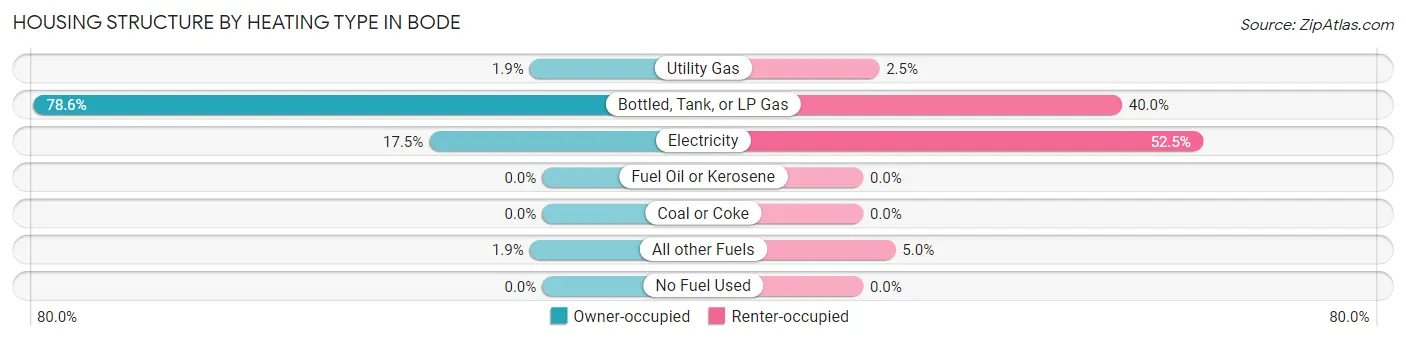
| Heating Type | Owner-occupied | Renter-occupied |
| Utility Gas | 2 (1.9%) | 1 (2.5%) |
| Bottled, Tank, or LP Gas | 81 (78.6%) | 16 (40.0%) |
| Electricity | 18 (17.5%) | 21 (52.5%) |
| Fuel Oil or Kerosene | 0 (0.0%) | 0 (0.0%) |
| Coal or Coke | 0 (0.0%) | 0 (0.0%) |
| All other Fuels | 2 (1.9%) | 2 (5.0%) |
| No Fuel Used | 0 (0.0%) | 0 (0.0%) |
| Total | 103 (100.0%) | 40 (100.0%) |
Household Vehicle Usage in Bode
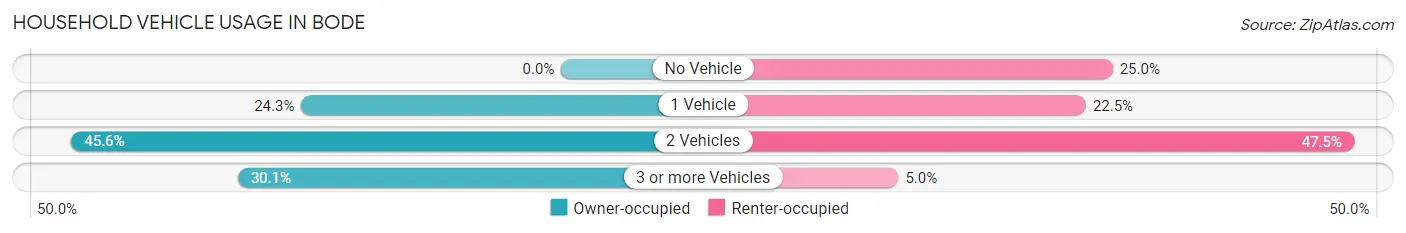
| Vehicles per Household | Owner-occupied | Renter-occupied |
| No Vehicle | 0 (0.0%) | 10 (25.0%) |
| 1 Vehicle | 25 (24.3%) | 9 (22.5%) |
| 2 Vehicles | 47 (45.6%) | 19 (47.5%) |
| 3 or more Vehicles | 31 (30.1%) | 2 (5.0%) |
| Total | 103 (100.0%) | 40 (100.0%) |
Real Estate & Mortgages in Bode
Real Estate and Mortgage Overview in Bode
| Characteristic | Without Mortgage | With Mortgage |
| Housing Units | 48 | 55 |
| Median Property Value | $65,000 | $77,500 |
| Median Household Income | $108,750 | $4 |
| Monthly Housing Costs | $408 | $0 |
| Real Estate Taxes | $867 | $9 |
Property Value by Mortgage Status in Bode
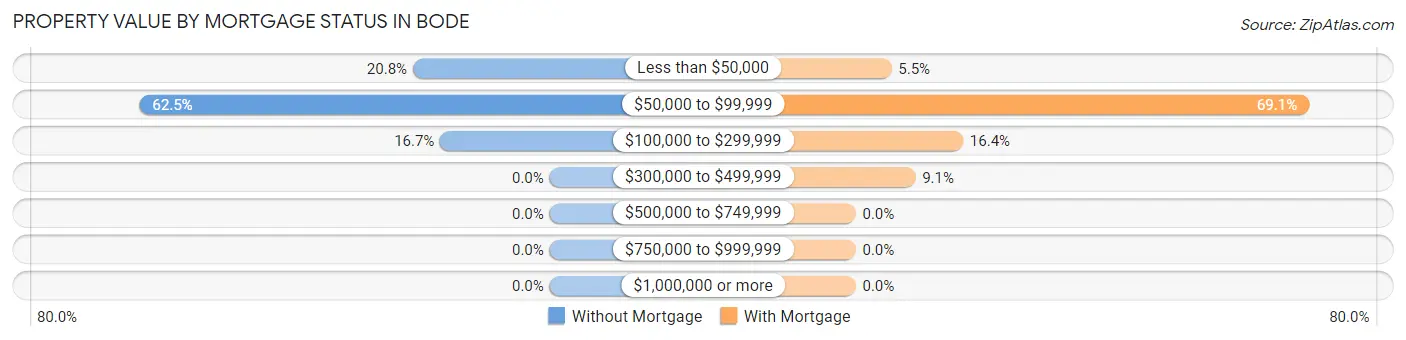
| Property Value | Without Mortgage | With Mortgage |
| Less than $50,000 | 10 (20.8%) | 3 (5.4%) |
| $50,000 to $99,999 | 30 (62.5%) | 38 (69.1%) |
| $100,000 to $299,999 | 8 (16.7%) | 9 (16.4%) |
| $300,000 to $499,999 | 0 (0.0%) | 5 (9.1%) |
| $500,000 to $749,999 | 0 (0.0%) | 0 (0.0%) |
| $750,000 to $999,999 | 0 (0.0%) | 0 (0.0%) |
| $1,000,000 or more | 0 (0.0%) | 0 (0.0%) |
| Total | 48 (100.0%) | 55 (100.0%) |
Household Income by Mortgage Status in Bode
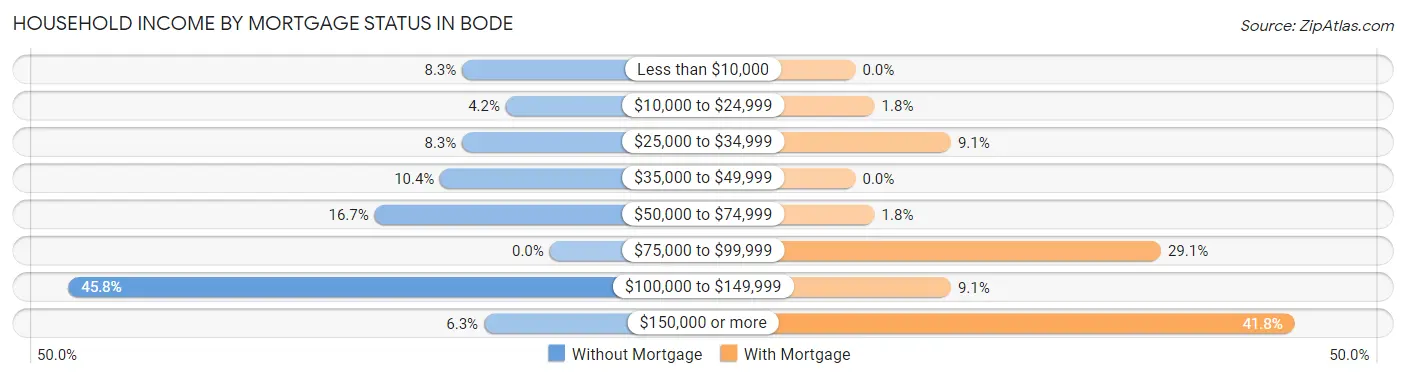
| Household Income | Without Mortgage | With Mortgage |
| Less than $10,000 | 4 (8.3%) | 0 (0.0%) |
| $10,000 to $24,999 | 2 (4.2%) | 1 (1.8%) |
| $25,000 to $34,999 | 4 (8.3%) | 5 (9.1%) |
| $35,000 to $49,999 | 5 (10.4%) | 0 (0.0%) |
| $50,000 to $74,999 | 8 (16.7%) | 1 (1.8%) |
| $75,000 to $99,999 | 0 (0.0%) | 16 (29.1%) |
| $100,000 to $149,999 | 22 (45.8%) | 5 (9.1%) |
| $150,000 or more | 3 (6.2%) | 23 (41.8%) |
| Total | 48 (100.0%) | 55 (100.0%) |
Property Value to Household Income Ratio in Bode
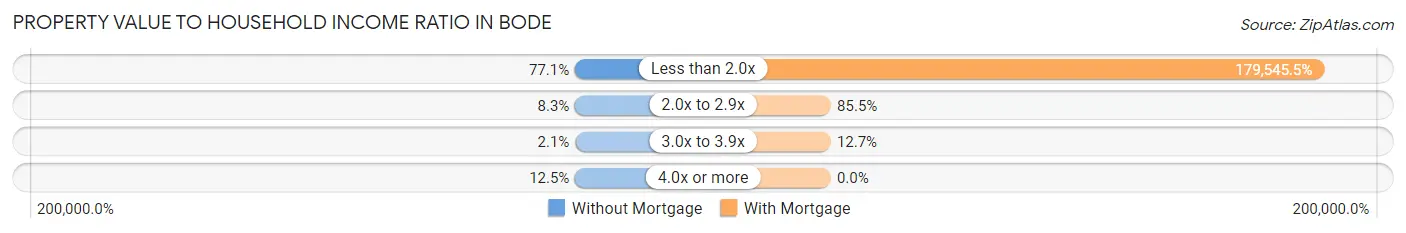
| Value-to-Income Ratio | Without Mortgage | With Mortgage |
| Less than 2.0x | 37 (77.1%) | 98,750 (179,545.5%) |
| 2.0x to 2.9x | 4 (8.3%) | 47 (85.5%) |
| 3.0x to 3.9x | 1 (2.1%) | 7 (12.7%) |
| 4.0x or more | 6 (12.5%) | 0 (0.0%) |
| Total | 48 (100.0%) | 55 (100.0%) |
Real Estate Taxes by Mortgage Status in Bode
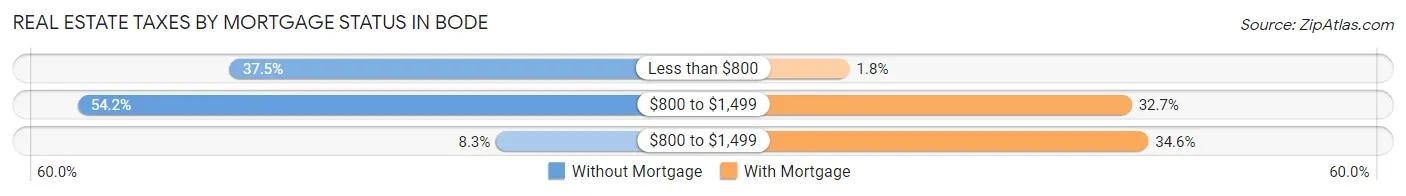
| Property Taxes | Without Mortgage | With Mortgage |
| Less than $800 | 18 (37.5%) | 1 (1.8%) |
| $800 to $1,499 | 26 (54.2%) | 18 (32.7%) |
| $800 to $1,499 | 4 (8.3%) | 19 (34.5%) |
| Total | 48 (100.0%) | 55 (100.0%) |
Health & Disability in Bode
Health Insurance Coverage by Age in Bode
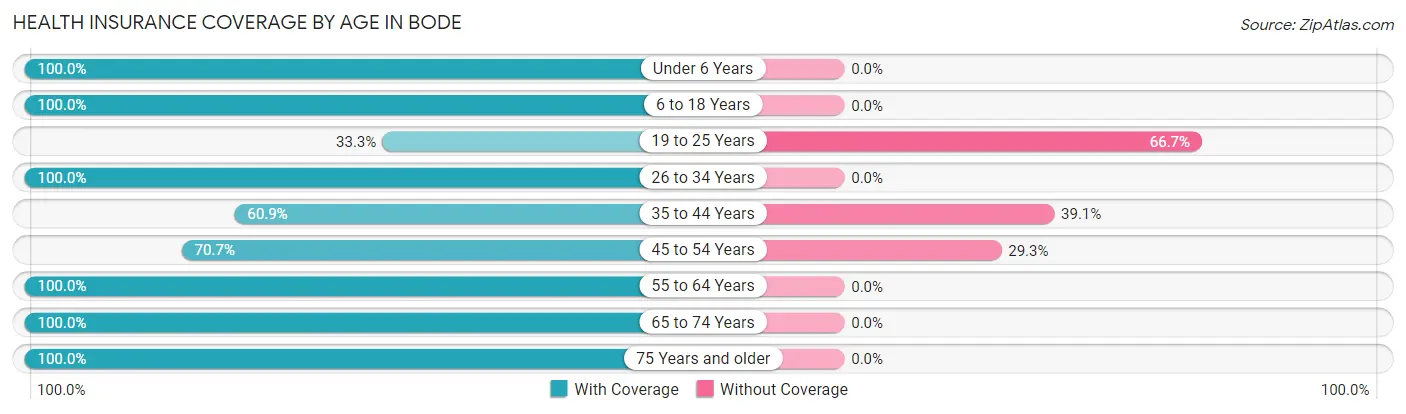
| Age Bracket | With Coverage | Without Coverage |
| Under 6 Years | 37 (100.0%) | 0 (0.0%) |
| 6 to 18 Years | 72 (100.0%) | 0 (0.0%) |
| 19 to 25 Years | 14 (33.3%) | 28 (66.7%) |
| 26 to 34 Years | 46 (100.0%) | 0 (0.0%) |
| 35 to 44 Years | 42 (60.9%) | 27 (39.1%) |
| 45 to 54 Years | 29 (70.7%) | 12 (29.3%) |
| 55 to 64 Years | 27 (100.0%) | 0 (0.0%) |
| 65 to 74 Years | 29 (100.0%) | 0 (0.0%) |
| 75 Years and older | 27 (100.0%) | 0 (0.0%) |
| Total | 323 (82.8%) | 67 (17.2%) |
Health Insurance Coverage by Citizenship Status in Bode
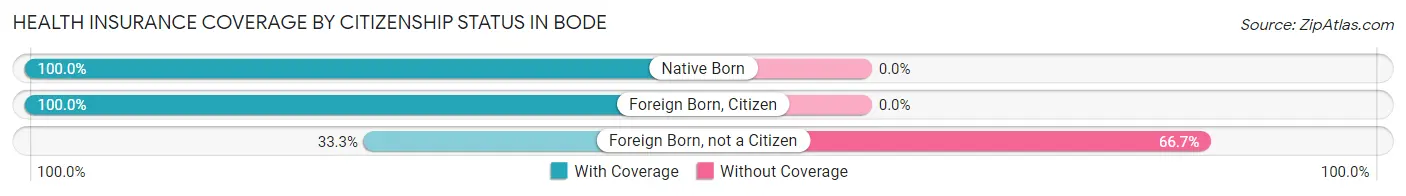
| Citizenship Status | With Coverage | Without Coverage |
| Native Born | 37 (100.0%) | 0 (0.0%) |
| Foreign Born, Citizen | 72 (100.0%) | 0 (0.0%) |
| Foreign Born, not a Citizen | 14 (33.3%) | 28 (66.7%) |
Health Insurance Coverage by Household Income in Bode
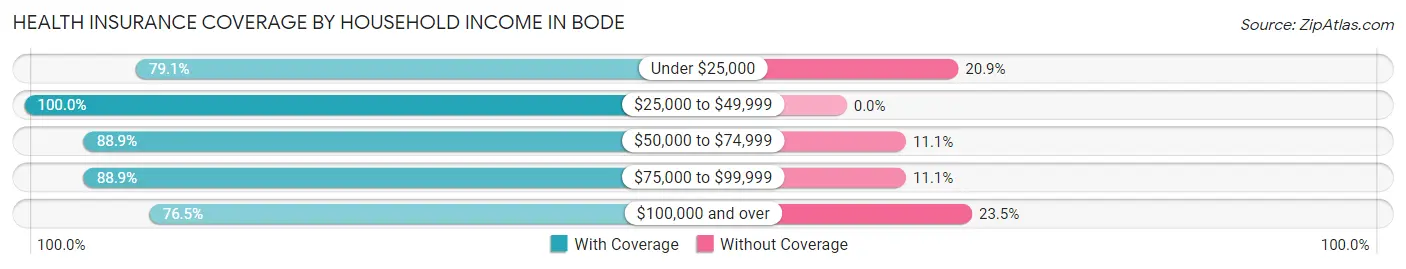
| Household Income | With Coverage | Without Coverage |
| Under $25,000 | 53 (79.1%) | 14 (20.9%) |
| $25,000 to $49,999 | 64 (100.0%) | 0 (0.0%) |
| $50,000 to $74,999 | 40 (88.9%) | 5 (11.1%) |
| $75,000 to $99,999 | 16 (88.9%) | 2 (11.1%) |
| $100,000 and over | 150 (76.5%) | 46 (23.5%) |
Public vs Private Health Insurance Coverage by Age in Bode
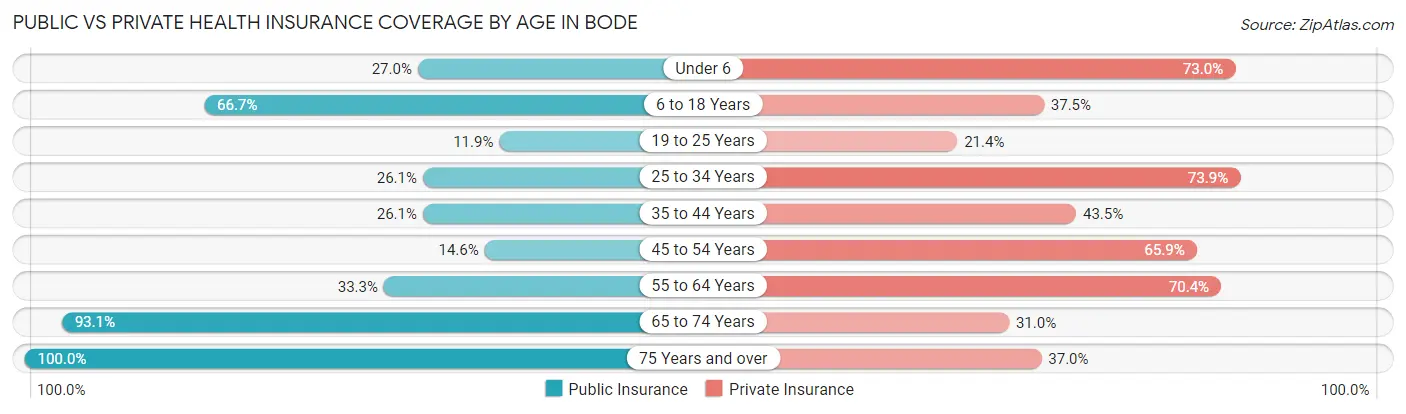
| Age Bracket | Public Insurance | Private Insurance |
| Under 6 | 10 (27.0%) | 27 (73.0%) |
| 6 to 18 Years | 48 (66.7%) | 27 (37.5%) |
| 19 to 25 Years | 5 (11.9%) | 9 (21.4%) |
| 25 to 34 Years | 12 (26.1%) | 34 (73.9%) |
| 35 to 44 Years | 18 (26.1%) | 30 (43.5%) |
| 45 to 54 Years | 6 (14.6%) | 27 (65.8%) |
| 55 to 64 Years | 9 (33.3%) | 19 (70.4%) |
| 65 to 74 Years | 27 (93.1%) | 9 (31.0%) |
| 75 Years and over | 27 (100.0%) | 10 (37.0%) |
| Total | 162 (41.5%) | 192 (49.2%) |
Disability Status by Sex by Age in Bode
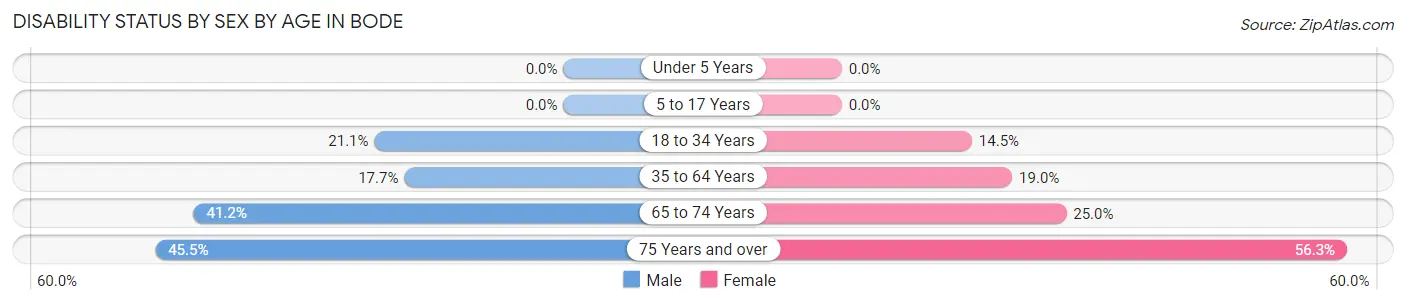
| Age Bracket | Male | Female |
| Under 5 Years | 0 (0.0%) | 0 (0.0%) |
| 5 to 17 Years | 0 (0.0%) | 0 (0.0%) |
| 18 to 34 Years | 4 (21.0%) | 10 (14.5%) |
| 35 to 64 Years | 14 (17.7%) | 11 (19.0%) |
| 65 to 74 Years | 7 (41.2%) | 3 (25.0%) |
| 75 Years and over | 5 (45.5%) | 9 (56.2%) |
Disability Class by Sex by Age in Bode
Disability Class: Hearing Difficulty
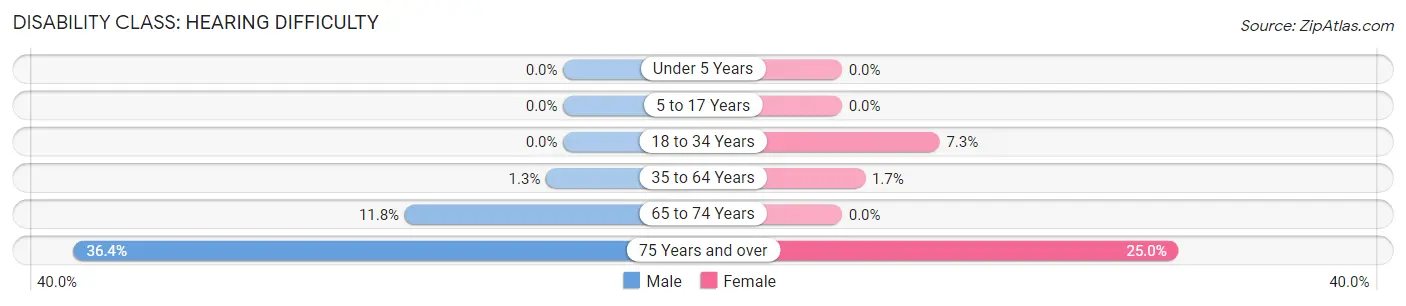
| Age Bracket | Male | Female |
| Under 5 Years | 0 (0.0%) | 0 (0.0%) |
| 5 to 17 Years | 0 (0.0%) | 0 (0.0%) |
| 18 to 34 Years | 0 (0.0%) | 5 (7.2%) |
| 35 to 64 Years | 1 (1.3%) | 1 (1.7%) |
| 65 to 74 Years | 2 (11.8%) | 0 (0.0%) |
| 75 Years and over | 4 (36.4%) | 4 (25.0%) |
Disability Class: Vision Difficulty
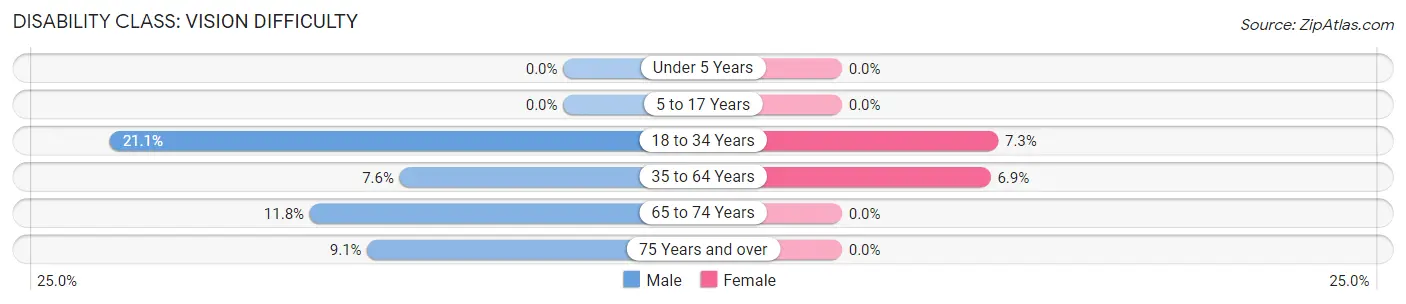
| Age Bracket | Male | Female |
| Under 5 Years | 0 (0.0%) | 0 (0.0%) |
| 5 to 17 Years | 0 (0.0%) | 0 (0.0%) |
| 18 to 34 Years | 4 (21.0%) | 5 (7.2%) |
| 35 to 64 Years | 6 (7.6%) | 4 (6.9%) |
| 65 to 74 Years | 2 (11.8%) | 0 (0.0%) |
| 75 Years and over | 1 (9.1%) | 0 (0.0%) |
Disability Class: Cognitive Difficulty
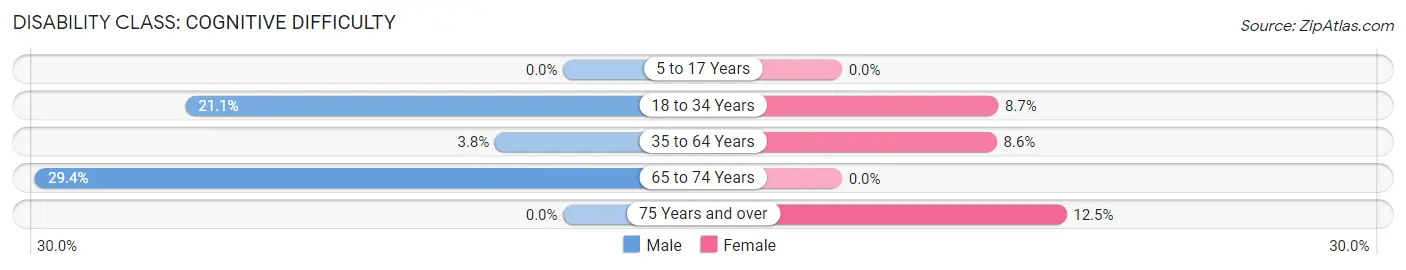
| Age Bracket | Male | Female |
| 5 to 17 Years | 0 (0.0%) | 0 (0.0%) |
| 18 to 34 Years | 4 (21.0%) | 6 (8.7%) |
| 35 to 64 Years | 3 (3.8%) | 5 (8.6%) |
| 65 to 74 Years | 5 (29.4%) | 0 (0.0%) |
| 75 Years and over | 0 (0.0%) | 2 (12.5%) |
Disability Class: Ambulatory Difficulty
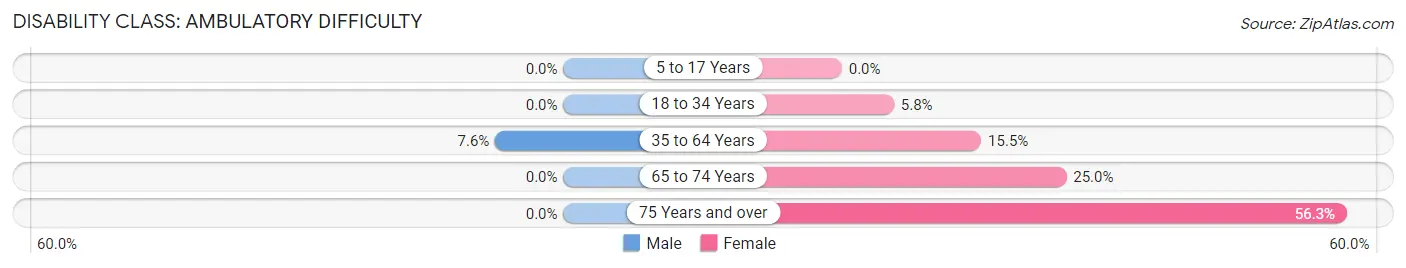
| Age Bracket | Male | Female |
| 5 to 17 Years | 0 (0.0%) | 0 (0.0%) |
| 18 to 34 Years | 0 (0.0%) | 4 (5.8%) |
| 35 to 64 Years | 6 (7.6%) | 9 (15.5%) |
| 65 to 74 Years | 0 (0.0%) | 3 (25.0%) |
| 75 Years and over | 0 (0.0%) | 9 (56.2%) |
Disability Class: Self-Care Difficulty
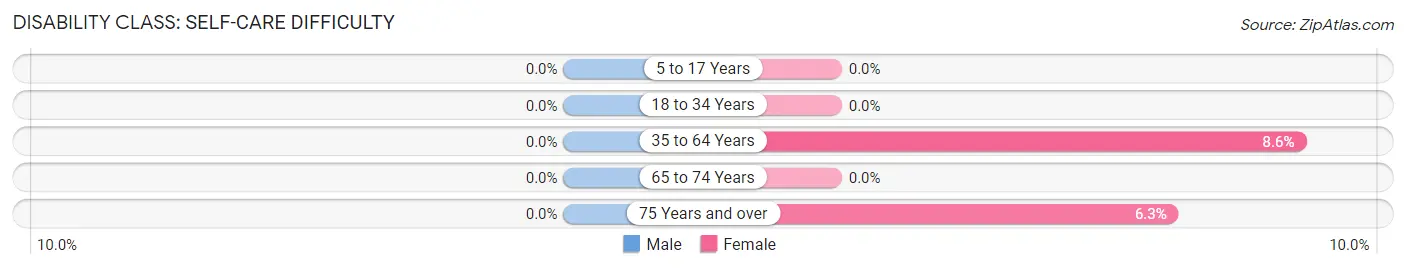
| Age Bracket | Male | Female |
| 5 to 17 Years | 0 (0.0%) | 0 (0.0%) |
| 18 to 34 Years | 0 (0.0%) | 0 (0.0%) |
| 35 to 64 Years | 0 (0.0%) | 5 (8.6%) |
| 65 to 74 Years | 0 (0.0%) | 0 (0.0%) |
| 75 Years and over | 0 (0.0%) | 1 (6.2%) |
Technology Access in Bode
Computing Device Access in Bode
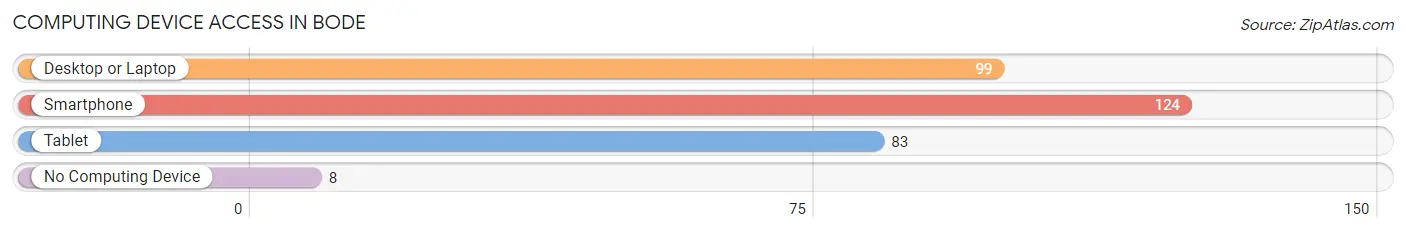
| Device Type | # Households | % Households |
| Desktop or Laptop | 99 | 69.2% |
| Smartphone | 124 | 86.7% |
| Tablet | 83 | 58.0% |
| No Computing Device | 8 | 5.6% |
| Total | 143 | 100.0% |
Internet Access in Bode
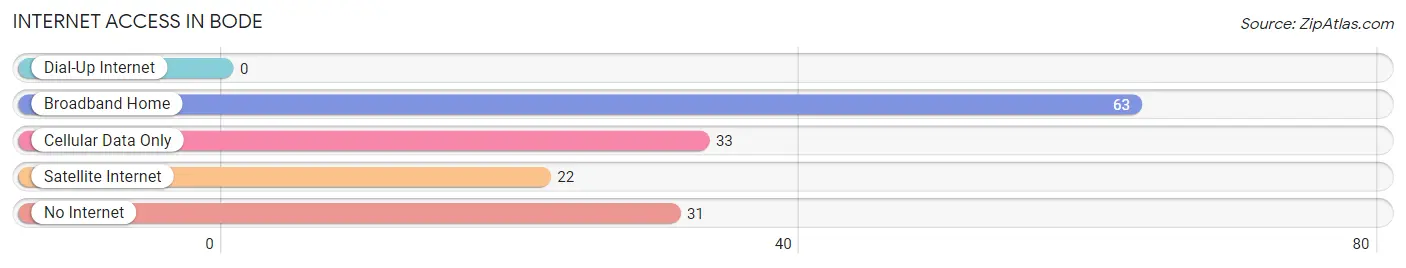
| Internet Type | # Households | % Households |
| Dial-Up Internet | 0 | 0.0% |
| Broadband Home | 63 | 44.1% |
| Cellular Data Only | 33 | 23.1% |
| Satellite Internet | 22 | 15.4% |
| No Internet | 31 | 21.7% |
| Total | 143 | 100.0% |
Bode Summary
Bode is a small city located in the state of Iowa, in the United States. It is located in Humboldt County, and is part of the Fort Dodge, IA Metropolitan Statistical Area. The population of Bode was estimated to be 545 in 2019.
History
Bode was founded in 1881 by a group of Norwegian settlers. The city was named after the Norwegian town of Bode, which was the hometown of the settlers. The settlers were attracted to the area due to its fertile soil and abundant natural resources. The first settlers built a sawmill and a gristmill, and the town quickly grew. By 1883, the town had a post office, a school, a church, and a general store.
In the early 1900s, Bode was a thriving agricultural community. The town was home to several grain elevators, a creamery, and a cheese factory. The town also had a bank, a hotel, and a newspaper.
In the 1950s, Bode began to decline as the population shifted to larger cities. The town’s population dropped from a peak of 845 in 1950 to 545 in 2019.
Geography
Bode is located in the northwest corner of Humboldt County, in the state of Iowa. The city is situated on the banks of the Des Moines River, and is surrounded by rolling hills and farmland. The city is located approximately 30 miles north of Fort Dodge, and is about a two-hour drive from Des Moines.
The climate in Bode is typical of the Midwest, with hot summers and cold winters. The average temperature in July is 79°F, and the average temperature in January is 22°F. The average annual precipitation is 33 inches.
Economy
The economy of Bode is largely based on agriculture. The town is home to several grain elevators, a feed mill, and a fertilizer plant. The town also has a few small businesses, including a grocery store, a hardware store, and a restaurant.
The town is also home to a few manufacturing companies, including a furniture factory and a plastics factory. The town is also home to a few small farms, which produce corn, soybeans, and other crops.
Demographics
The population of Bode was estimated to be 545 in 2019. The population is predominantly white, with a small Hispanic population. The median age of the population is 44.7 years, and the median household income is $45,000.
The town is served by the Bode-Humboldt Community School District, which includes an elementary school, a middle school, and a high school. The town is also home to a public library and a few churches.
Conclusion
Bode is a small city located in the state of Iowa, in the United States. It is located in Humboldt County, and is part of the Fort Dodge, IA Metropolitan Statistical Area. The city was founded in 1881 by a group of Norwegian settlers, and has since become a thriving agricultural community. The economy of Bode is largely based on agriculture, and the town is home to several small businesses and manufacturing companies. The population of Bode was estimated to be 545 in 2019, and the town is served by the Bode-Humboldt Community School District.
Common Questions
What is Per Capita Income in Bode?
Per Capita income in Bode is $26,624.
What is the Median Family Income in Bode?
Median Family Income in Bode is $80,417.
What is the Median Household income in Bode?
Median Household Income in Bode is $54,531.
What is Income or Wage Gap in Bode?
Income or Wage Gap in Bode is 31.0%.
Women in Bode earn 69.0 cents for every dollar earned by a man.
What is Inequality or Gini Index in Bode?
Inequality or Gini Index in Bode is 0.40.
What is the Total Population of Bode?
Total Population of Bode is 390.
What is the Total Male Population of Bode?
Total Male Population of Bode is 203.
What is the Total Female Population of Bode?
Total Female Population of Bode is 187.
What is the Ratio of Males per 100 Females in Bode?
There are 108.56 Males per 100 Females in Bode.
What is the Ratio of Females per 100 Males in Bode?
There are 92.12 Females per 100 Males in Bode.
What is the Median Population Age in Bode?
Median Population Age in Bode is 34.6 Years.
What is the Average Family Size in Bode
Average Family Size in Bode is 3.2 People.
What is the Average Household Size in Bode
Average Household Size in Bode is 2.7 People.
How Large is the Labor Force in Bode?
There are 199 People in the Labor Forcein in Bode.
What is the Percentage of People in the Labor Force in Bode?
66.8% of People are in the Labor Force in Bode.