Duncombe, IA Map & Demographics
Duncombe Map
Duncombe Overview
$32,573
PER CAPITA INCOME
$76,250
AVG FAMILY INCOME
$58,438
AVG HOUSEHOLD INCOME
46.7%
WAGE / INCOME GAP [ % ]
53.3¢/ $1
WAGE / INCOME GAP [ $ ]
$2,133
FAMILY INCOME DEFICIT
0.37
INEQUALITY / GINI INDEX
362
TOTAL POPULATION
192
MALE POPULATION
170
FEMALE POPULATION
112.94
MALES / 100 FEMALES
88.54
FEMALES / 100 MALES
38.8
MEDIAN AGE
3.1
AVG FAMILY SIZE
2.2
AVG HOUSEHOLD SIZE
199
LABOR FORCE [ PEOPLE ]
65.5%
PERCENT IN LABOR FORCE
5.0%
UNEMPLOYMENT RATE
Duncombe Zip Codes
Duncombe Area Codes
Income in Duncombe
Income Overview in Duncombe
Per Capita Income in Duncombe is $32,573, while median incomes of families and households are $76,250 and $58,438 respectively.
| Characteristic | Number | Measure |
| Per Capita Income | 362 | $32,573 |
| Median Family Income | 77 | $76,250 |
| Mean Family Income | 77 | $79,314 |
| Median Household Income | 167 | $58,438 |
| Mean Household Income | 167 | $63,228 |
| Income Deficit | 77 | $2,133 |
| Wage / Income Gap (%) | 362 | 46.67% |
| Wage / Income Gap ($) | 362 | 53.33¢ per $1 |
| Gini / Inequality Index | 362 | 0.37 |
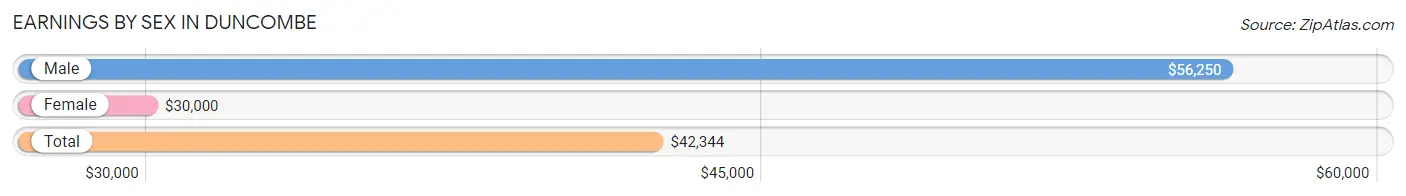
Earnings by Sex in Duncombe
Average Earnings in Duncombe are $42,344, $56,250 for men and $30,000 for women, a difference of 46.7%.
| Sex | Number | Average Earnings |
| Male | 125 (61.0%) | $56,250 |
| Female | 80 (39.0%) | $30,000 |
| Total | 205 (100.0%) | $42,344 |
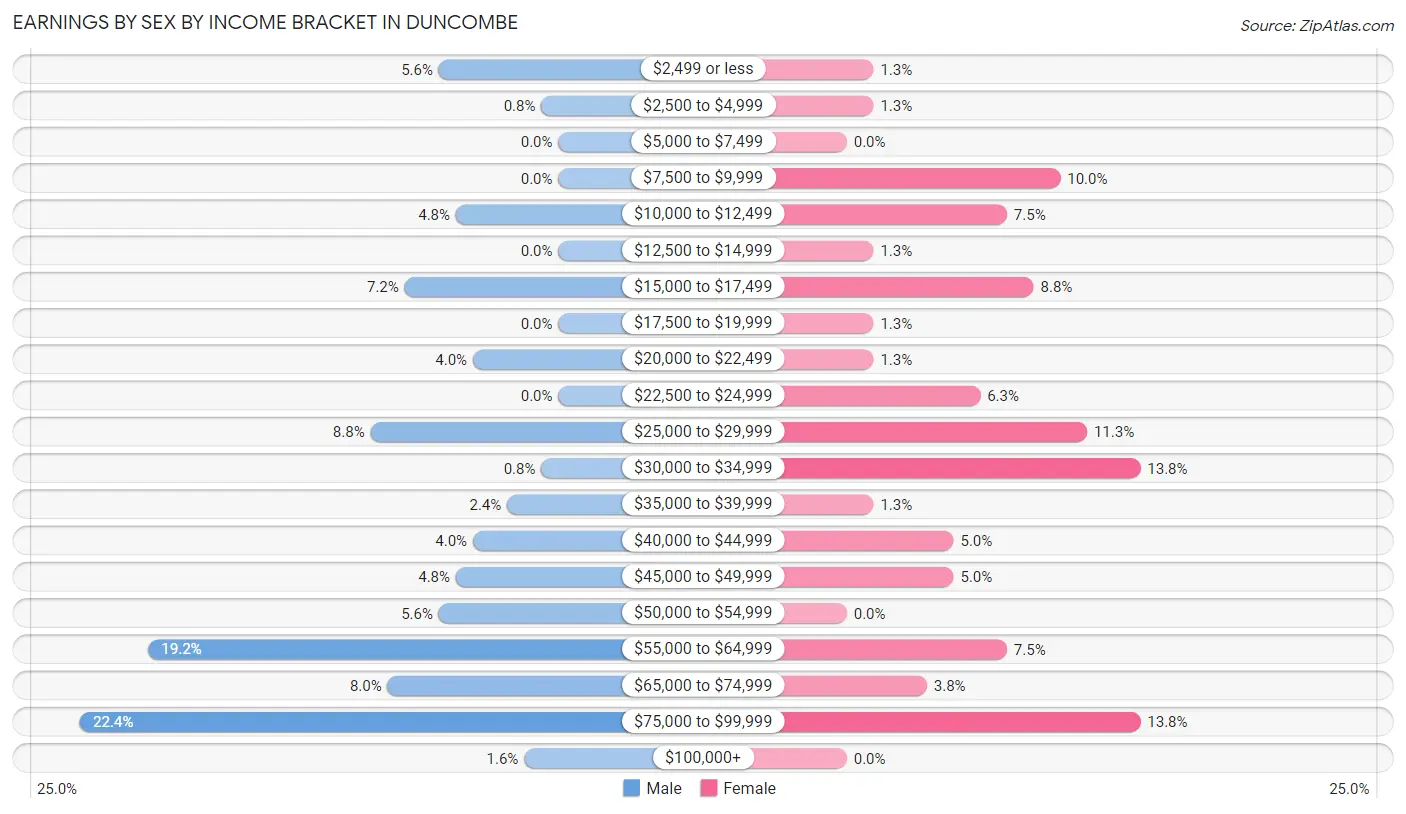
Earnings by Sex by Income Bracket in Duncombe
The most common earnings brackets in Duncombe are $75,000 to $99,999 for men (28 | 22.4%) and $30,000 to $34,999 for women (11 | 13.8%).
| Income | Male | Female |
| $2,499 or less | 7 (5.6%) | 1 (1.3%) |
| $2,500 to $4,999 | 1 (0.8%) | 1 (1.3%) |
| $5,000 to $7,499 | 0 (0.0%) | 0 (0.0%) |
| $7,500 to $9,999 | 0 (0.0%) | 8 (10.0%) |
| $10,000 to $12,499 | 6 (4.8%) | 6 (7.5%) |
| $12,500 to $14,999 | 0 (0.0%) | 1 (1.3%) |
| $15,000 to $17,499 | 9 (7.2%) | 7 (8.7%) |
| $17,500 to $19,999 | 0 (0.0%) | 1 (1.3%) |
| $20,000 to $22,499 | 5 (4.0%) | 1 (1.3%) |
| $22,500 to $24,999 | 0 (0.0%) | 5 (6.2%) |
| $25,000 to $29,999 | 11 (8.8%) | 9 (11.3%) |
| $30,000 to $34,999 | 1 (0.8%) | 11 (13.8%) |
| $35,000 to $39,999 | 3 (2.4%) | 1 (1.3%) |
| $40,000 to $44,999 | 5 (4.0%) | 4 (5.0%) |
| $45,000 to $49,999 | 6 (4.8%) | 4 (5.0%) |
| $50,000 to $54,999 | 7 (5.6%) | 0 (0.0%) |
| $55,000 to $64,999 | 24 (19.2%) | 6 (7.5%) |
| $65,000 to $74,999 | 10 (8.0%) | 3 (3.7%) |
| $75,000 to $99,999 | 28 (22.4%) | 11 (13.8%) |
| $100,000+ | 2 (1.6%) | 0 (0.0%) |
| Total | 125 (100.0%) | 80 (100.0%) |
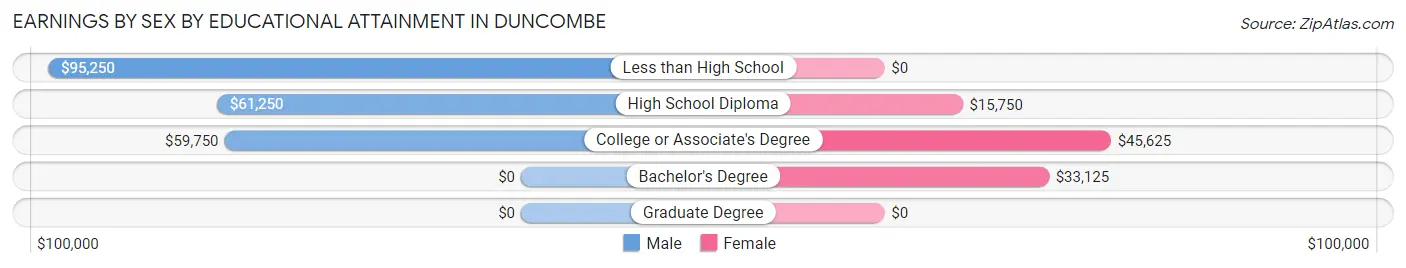
Earnings by Sex by Educational Attainment in Duncombe
Average earnings in Duncombe are $61,563 for men and $33,375 for women, a difference of 45.8%. Men with an educational attainment of less than high school enjoy the highest average annual earnings of $95,250, while those with college or associate's degree education earn the least with $59,750. Women with an educational attainment of college or associate's degree earn the most with the average annual earnings of $45,625, while those with high school diploma education have the smallest earnings of $15,750.
| Educational Attainment | Male Income | Female Income |
| Less than High School | $95,250 | $0 |
| High School Diploma | $61,250 | $15,750 |
| College or Associate's Degree | $59,750 | $45,625 |
| Bachelor's Degree | - | - |
| Graduate Degree | - | - |
| Total | $61,563 | $33,375 |
Family Income in Duncombe
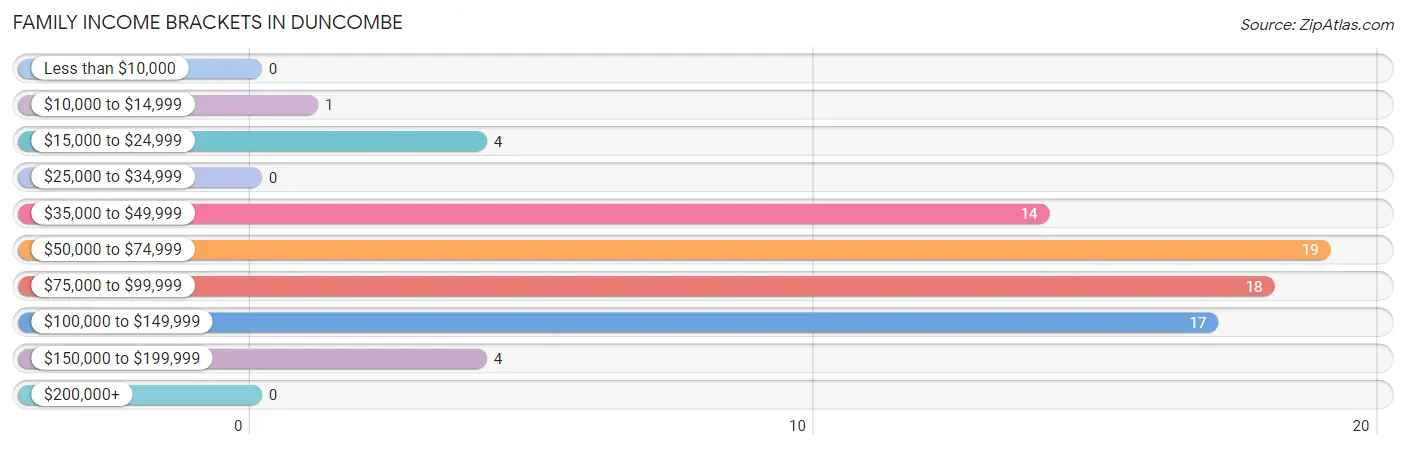
Family Income Brackets in Duncombe
According to the Duncombe family income data, there are 19 families falling into the $50,000 to $74,999 income range, which is the most common income bracket and makes up 24.7% of all families.
| Income Bracket | # Families | % Families |
| Less than $10,000 | 0 | 0.0% |
| $10,000 to $14,999 | 1 | 1.3% |
| $15,000 to $24,999 | 4 | 5.2% |
| $25,000 to $34,999 | 0 | 0.0% |
| $35,000 to $49,999 | 14 | 18.2% |
| $50,000 to $74,999 | 19 | 24.7% |
| $75,000 to $99,999 | 18 | 23.4% |
| $100,000 to $149,999 | 17 | 22.1% |
| $150,000 to $199,999 | 4 | 5.2% |
| $200,000+ | 0 | 0.0% |
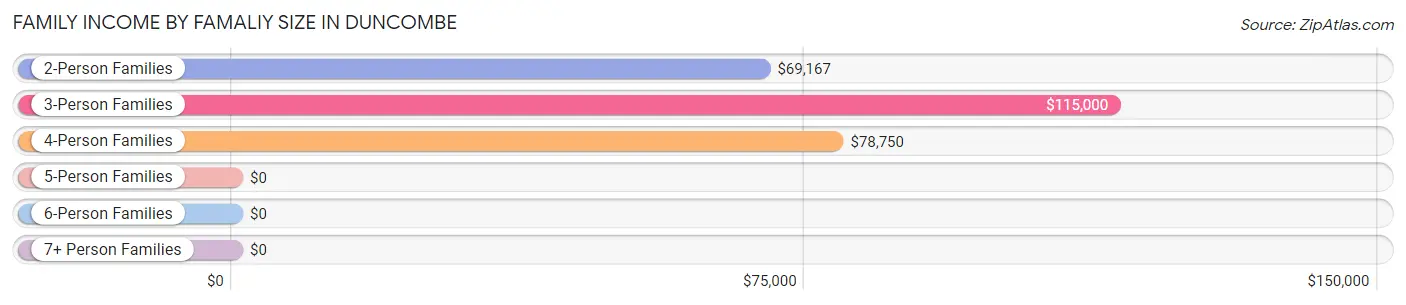
Family Income by Famaliy Size in Duncombe
3-person families (12 | 15.6%) account for the highest median family income in Duncombe with $115,000 per family, while 3-person families (12 | 15.6%) have the highest median income of $38,333 per family member.
| Income Bracket | # Families | Median Income |
| 2-Person Families | 50 (64.9%) | $69,167 |
| 3-Person Families | 12 (15.6%) | $115,000 |
| 4-Person Families | 10 (13.0%) | $78,750 |
| 5-Person Families | 3 (3.9%) | $0 |
| 6-Person Families | 2 (2.6%) | $0 |
| 7+ Person Families | 0 (0.0%) | $0 |
| Total | 77 (100.0%) | $76,250 |
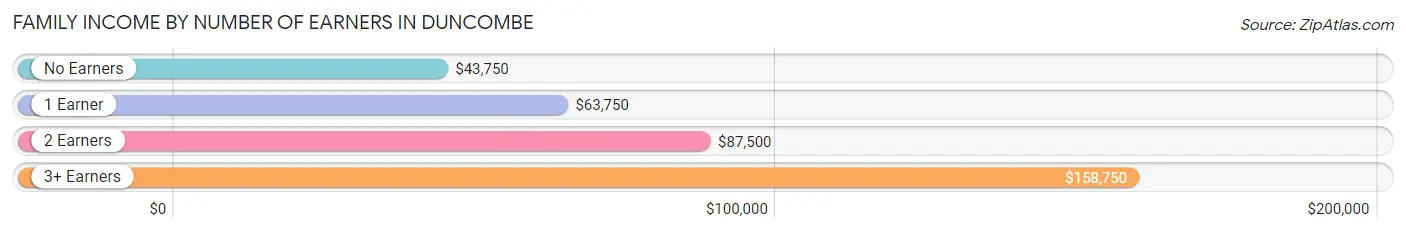
Family Income by Number of Earners in Duncombe
The median family income in Duncombe is $76,250, with families comprising 3+ earners (7) having the highest median family income of $158,750, while families with no earners (16) have the lowest median family income of $43,750, accounting for 9.1% and 20.8% of families, respectively.
| Number of Earners | # Families | Median Income |
| No Earners | 16 (20.8%) | $43,750 |
| 1 Earner | 18 (23.4%) | $63,750 |
| 2 Earners | 36 (46.8%) | $87,500 |
| 3+ Earners | 7 (9.1%) | $158,750 |
| Total | 77 (100.0%) | $76,250 |
Household Income in Duncombe
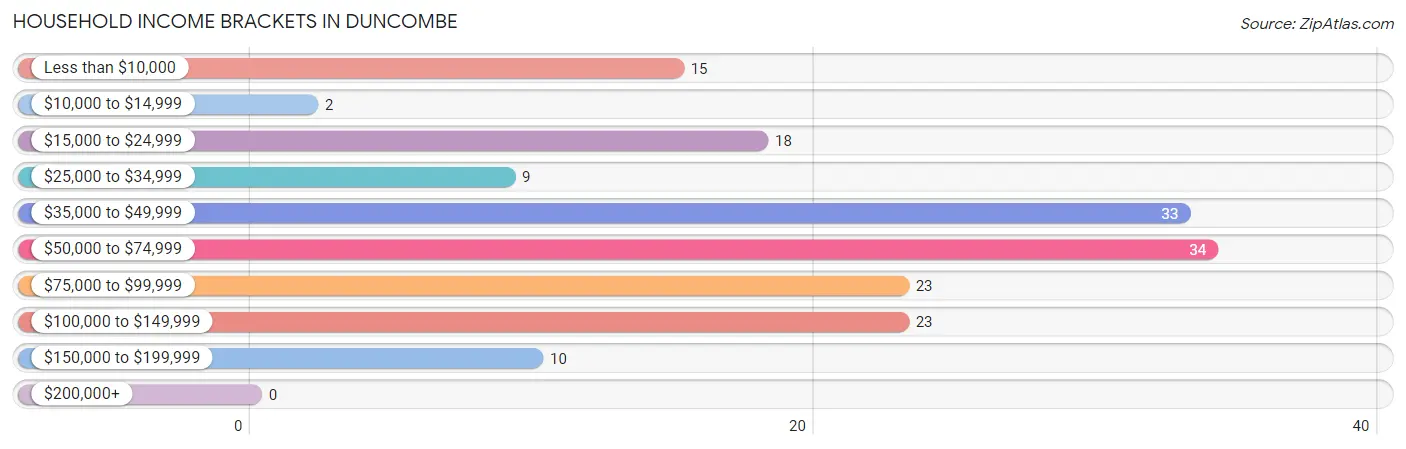
Household Income Brackets in Duncombe
With 34 households falling in the category, the $50,000 to $74,999 income range is the most frequent in Duncombe, accounting for 20.4% of all households.
| Income Bracket | # Households | % Households |
| Less than $10,000 | 15 | 9.0% |
| $10,000 to $14,999 | 2 | 1.2% |
| $15,000 to $24,999 | 18 | 10.8% |
| $25,000 to $34,999 | 9 | 5.4% |
| $35,000 to $49,999 | 33 | 19.8% |
| $50,000 to $74,999 | 34 | 20.4% |
| $75,000 to $99,999 | 23 | 13.8% |
| $100,000 to $149,999 | 23 | 13.8% |
| $150,000 to $199,999 | 10 | 6.0% |
| $200,000+ | 0 | 0.0% |
Household Income by Householder Age in Duncombe
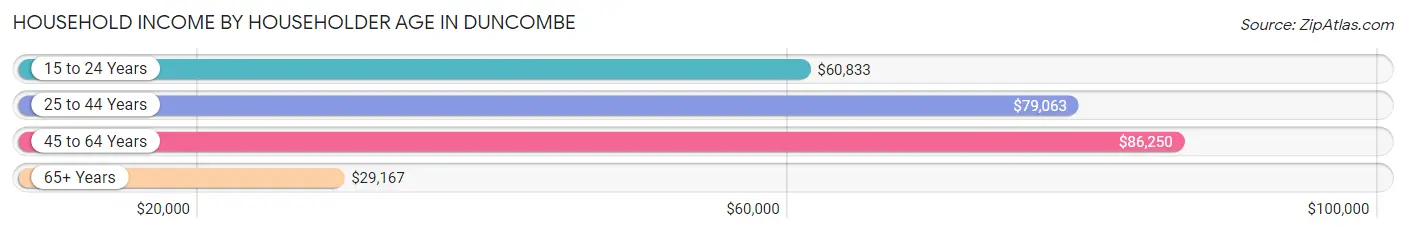
The median household income in Duncombe is $58,438, with the highest median household income of $86,250 found in the 45 to 64 years age bracket for the primary householder. A total of 44 households (26.4%) fall into this category. Meanwhile, the 65+ years age bracket for the primary householder has the lowest median household income of $29,167, with 56 households (33.5%) in this group.
| Income Bracket | # Households | Median Income |
| 15 to 24 Years | 26 (15.6%) | $60,833 |
| 25 to 44 Years | 41 (24.5%) | $79,063 |
| 45 to 64 Years | 44 (26.4%) | $86,250 |
| 65+ Years | 56 (33.5%) | $29,167 |
| Total | 167 (100.0%) | $58,438 |
Poverty in Duncombe
Income Below Poverty by Sex and Age in Duncombe
With 3.1% poverty level for males and 14.7% for females among the residents of Duncombe, 65 to 74 year old males and 75 year old and over females are the most vulnerable to poverty, with 3 males (15.8%) and 13 females (41.9%) in their respective age groups living below the poverty level.
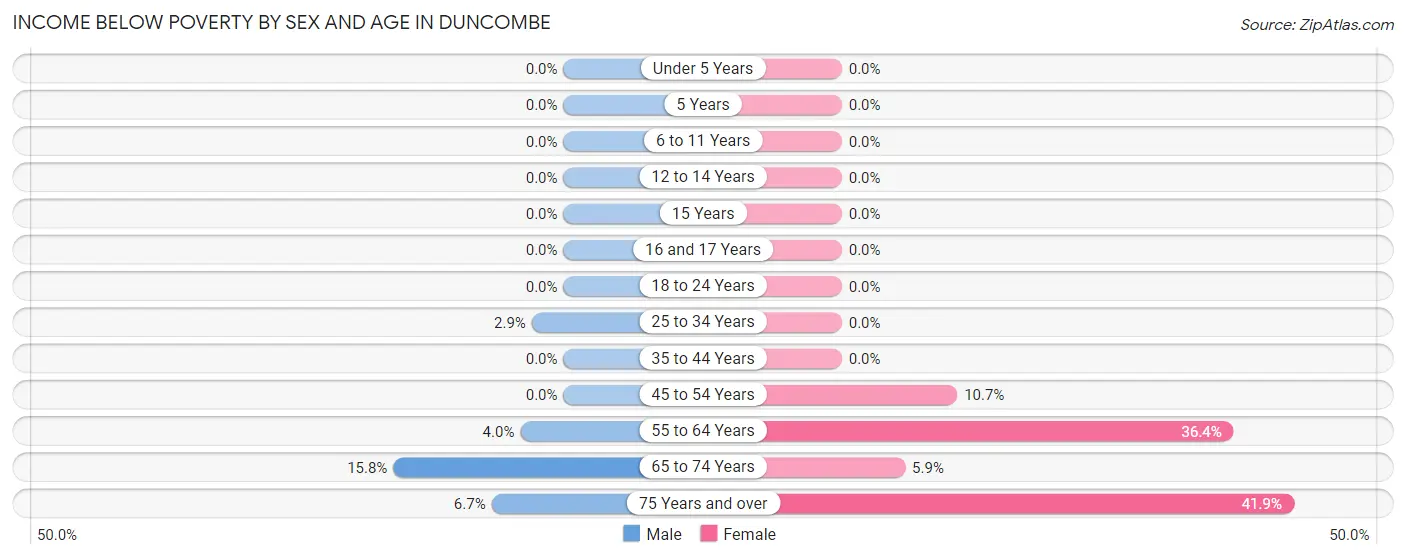
| Age Bracket | Male | Female |
| Under 5 Years | 0 (0.0%) | 0 (0.0%) |
| 5 Years | 0 (0.0%) | 0 (0.0%) |
| 6 to 11 Years | 0 (0.0%) | 0 (0.0%) |
| 12 to 14 Years | 0 (0.0%) | 0 (0.0%) |
| 15 Years | 0 (0.0%) | 0 (0.0%) |
| 16 and 17 Years | 0 (0.0%) | 0 (0.0%) |
| 18 to 24 Years | 0 (0.0%) | 0 (0.0%) |
| 25 to 34 Years | 1 (2.9%) | 0 (0.0%) |
| 35 to 44 Years | 0 (0.0%) | 0 (0.0%) |
| 45 to 54 Years | 0 (0.0%) | 3 (10.7%) |
| 55 to 64 Years | 1 (4.0%) | 8 (36.4%) |
| 65 to 74 Years | 3 (15.8%) | 1 (5.9%) |
| 75 Years and over | 1 (6.7%) | 13 (41.9%) |
| Total | 6 (3.1%) | 25 (14.7%) |
Income Above Poverty by Sex and Age in Duncombe
According to the poverty statistics in Duncombe, males aged under 5 years and females aged under 5 years are the age groups that are most secure financially, with 100.0% of males and 100.0% of females in these age groups living above the poverty line.
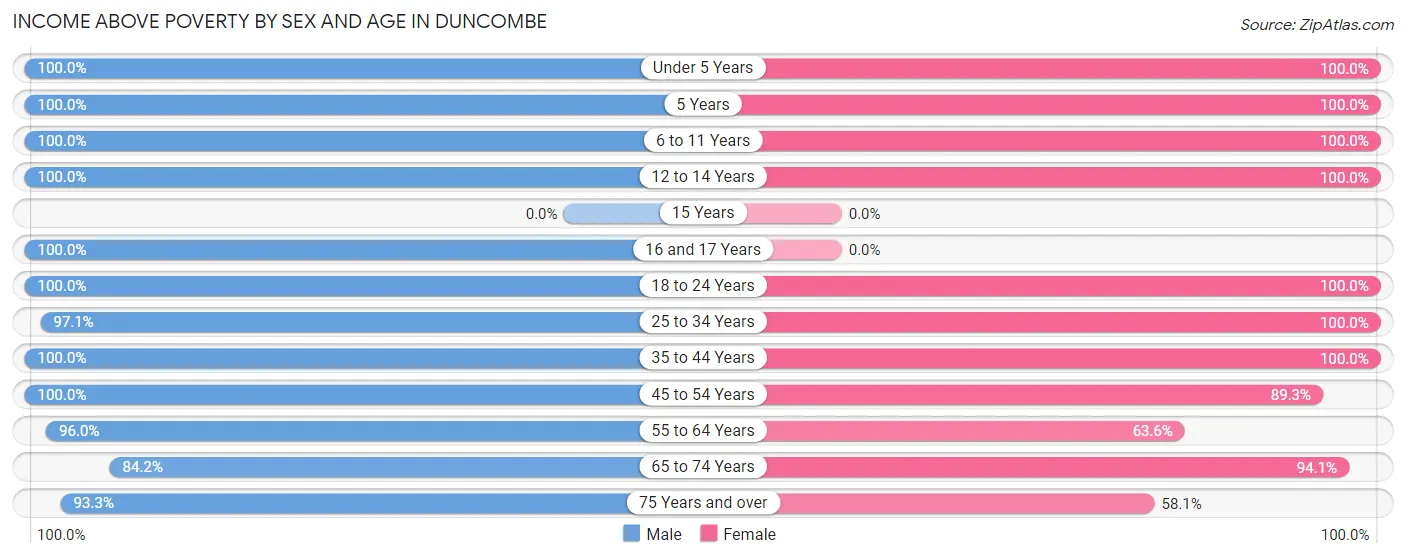
| Age Bracket | Male | Female |
| Under 5 Years | 11 (100.0%) | 6 (100.0%) |
| 5 Years | 3 (100.0%) | 3 (100.0%) |
| 6 to 11 Years | 5 (100.0%) | 18 (100.0%) |
| 12 to 14 Years | 8 (100.0%) | 4 (100.0%) |
| 15 Years | 0 (0.0%) | 0 (0.0%) |
| 16 and 17 Years | 5 (100.0%) | 0 (0.0%) |
| 18 to 24 Years | 49 (100.0%) | 11 (100.0%) |
| 25 to 34 Years | 33 (97.1%) | 19 (100.0%) |
| 35 to 44 Years | 9 (100.0%) | 11 (100.0%) |
| 45 to 54 Years | 9 (100.0%) | 25 (89.3%) |
| 55 to 64 Years | 24 (96.0%) | 14 (63.6%) |
| 65 to 74 Years | 16 (84.2%) | 16 (94.1%) |
| 75 Years and over | 14 (93.3%) | 18 (58.1%) |
| Total | 186 (96.9%) | 145 (85.3%) |
Income Below Poverty Among Married-Couple Families in Duncombe
The poverty statistics for married-couple families in Duncombe show that 4.3% or 3 of the total 69 families live below the poverty line. Families with no children have the highest poverty rate of 6.0%, comprising of 3 families. On the other hand, families with 1 or 2 children have the lowest poverty rate of 0.0%, which includes 0 families.
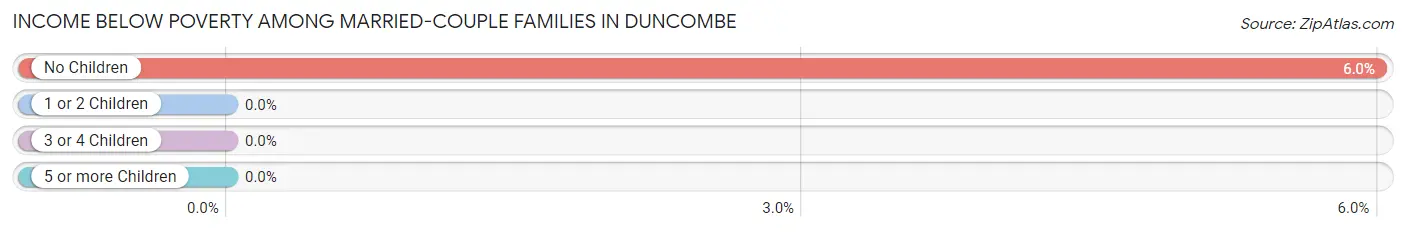
| Children | Above Poverty | Below Poverty |
| No Children | 47 (94.0%) | 3 (6.0%) |
| 1 or 2 Children | 14 (100.0%) | 0 (0.0%) |
| 3 or 4 Children | 5 (100.0%) | 0 (0.0%) |
| 5 or more Children | 0 (0.0%) | 0 (0.0%) |
| Total | 66 (95.7%) | 3 (4.3%) |
Income Below Poverty Among Single-Parent Households in Duncombe
| Children | Single Father | Single Mother |
| No Children | 0 (0.0%) | 0 (0.0%) |
| 1 or 2 Children | 0 (0.0%) | 0 (0.0%) |
| 3 or 4 Children | 0 (0.0%) | 0 (0.0%) |
| 5 or more Children | 0 (0.0%) | 0 (0.0%) |
| Total | 0 (0.0%) | 0 (0.0%) |
Income Below Poverty Among Married-Couple vs Single-Parent Households in Duncombe
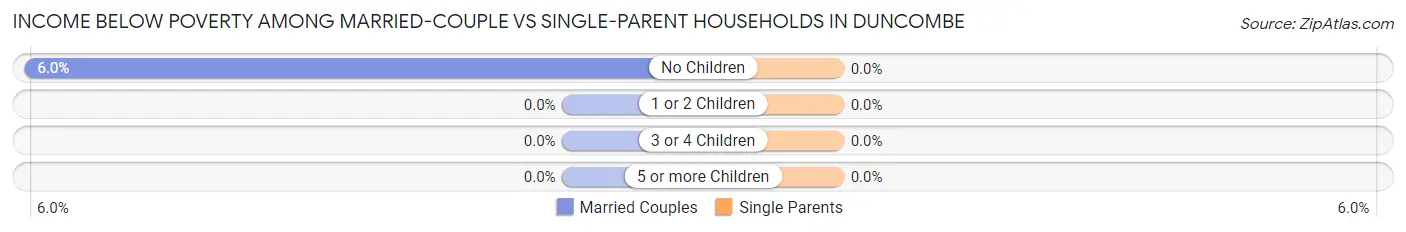
| Children | Married-Couple Families | Single-Parent Households |
| No Children | 3 (6.0%) | 0 (0.0%) |
| 1 or 2 Children | 0 (0.0%) | 0 (0.0%) |
| 3 or 4 Children | 0 (0.0%) | 0 (0.0%) |
| 5 or more Children | 0 (0.0%) | 0 (0.0%) |
| Total | 3 (4.3%) | 0 (0.0%) |
Race in Duncombe
The most populous races in Duncombe are White / Caucasian (334 | 92.3%), Asian (14 | 3.9%), and Two or more Races (10 | 2.8%).
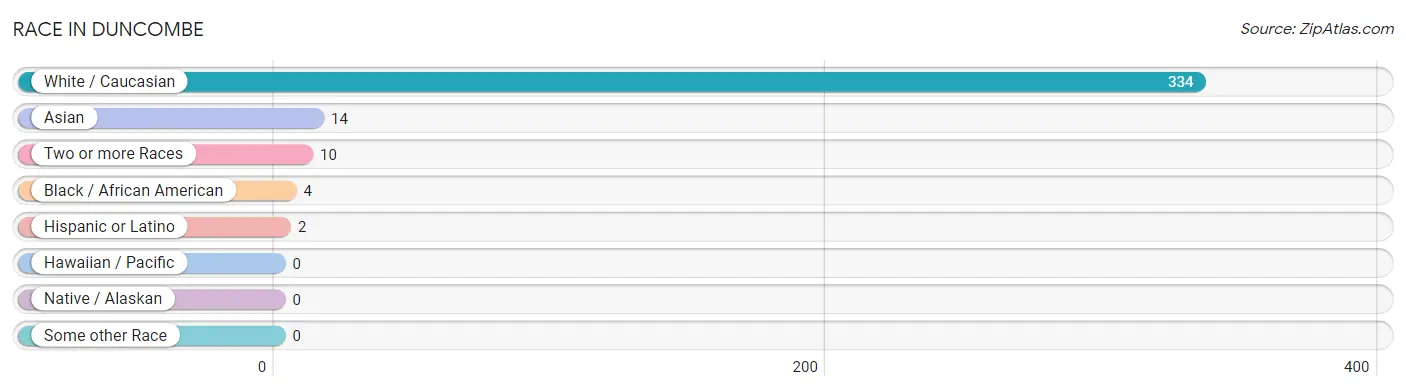
| Race | # Population | % Population |
| Asian | 14 | 3.9% |
| Black / African American | 4 | 1.1% |
| Hawaiian / Pacific | 0 | 0.0% |
| Hispanic or Latino | 2 | 0.5% |
| Native / Alaskan | 0 | 0.0% |
| White / Caucasian | 334 | 92.3% |
| Two or more Races | 10 | 2.8% |
| Some other Race | 0 | 0.0% |
| Total | 362 | 100.0% |
Ancestry in Duncombe
The most populous ancestries reported in Duncombe are German (81 | 22.4%), Norwegian (58 | 16.0%), Irish (51 | 14.1%), English (24 | 6.6%), and Indian (Asian) (14 | 3.9%), together accounting for 63.0% of all Duncombe residents.
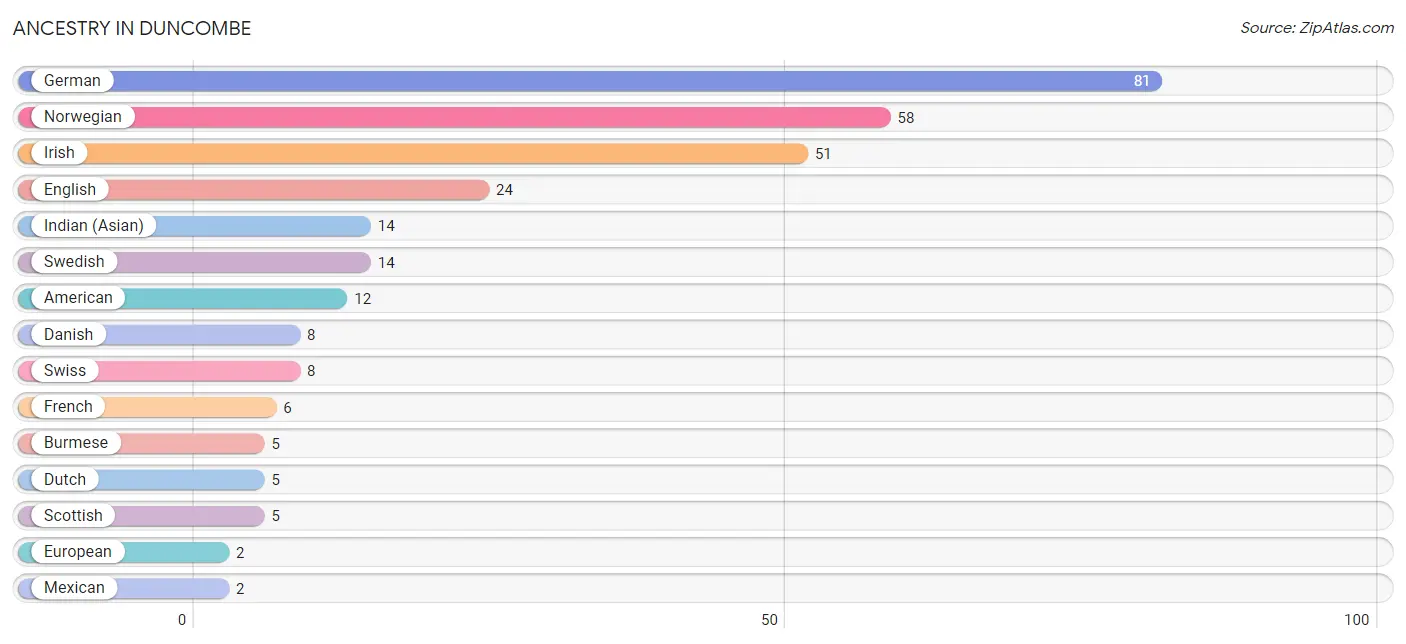
| Ancestry | # Population | % Population |
| American | 12 | 3.3% |
| British | 1 | 0.3% |
| Burmese | 5 | 1.4% |
| Czech | 1 | 0.3% |
| Danish | 8 | 2.2% |
| Dutch | 5 | 1.4% |
| English | 24 | 6.6% |
| European | 2 | 0.5% |
| French | 6 | 1.7% |
| German | 81 | 22.4% |
| Indian (Asian) | 14 | 3.9% |
| Irish | 51 | 14.1% |
| Mexican | 2 | 0.5% |
| Norwegian | 58 | 16.0% |
| Scotch-Irish | 1 | 0.3% |
| Scottish | 5 | 1.4% |
| Swedish | 14 | 3.9% |
| Swiss | 8 | 2.2% |
| Welsh | 2 | 0.5% | View All 19 Rows |
Immigrants in Duncombe
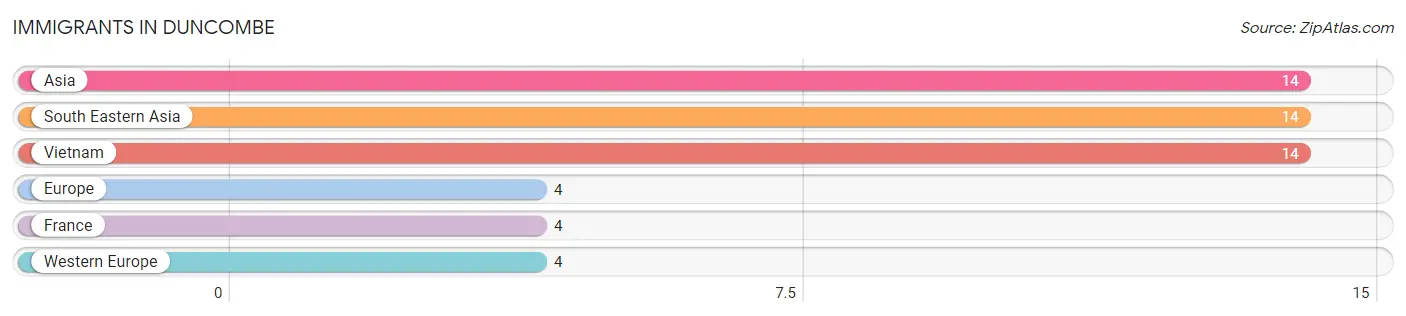
The most numerous immigrant groups reported in Duncombe came from Asia (14 | 3.9%), South Eastern Asia (14 | 3.9%), Vietnam (14 | 3.9%), Europe (4 | 1.1%), and France (4 | 1.1%), together accounting for 13.8% of all Duncombe residents.
| Immigration Origin | # Population | % Population |
| Asia | 14 | 3.9% |
| Europe | 4 | 1.1% |
| France | 4 | 1.1% |
| South Eastern Asia | 14 | 3.9% |
| Vietnam | 14 | 3.9% |
| Western Europe | 4 | 1.1% | View All 6 Rows |
Sex and Age in Duncombe
Sex and Age in Duncombe
The most populous age groups in Duncombe are 20 to 24 Years (30 | 15.6%) for men and 5 to 9 Years (21 | 12.3%) for women.
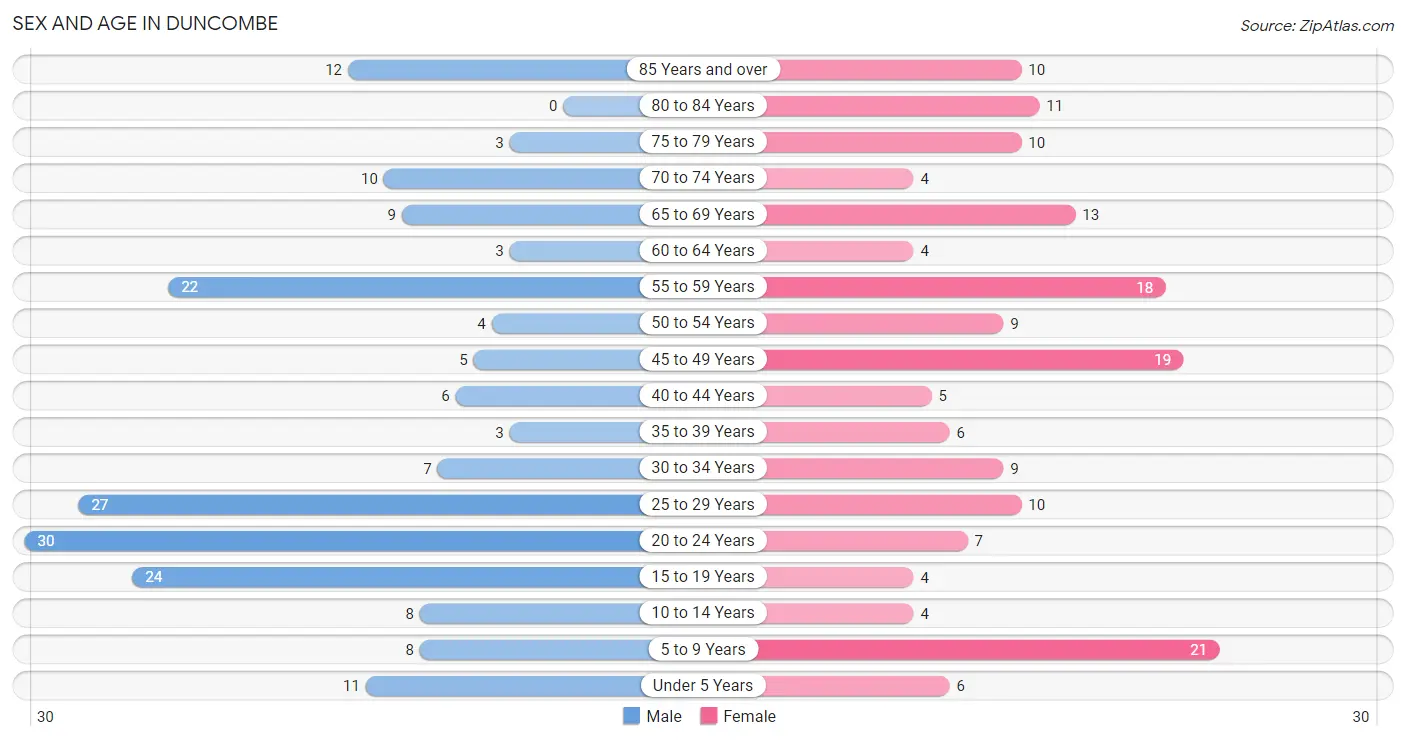
| Age Bracket | Male | Female |
| Under 5 Years | 11 (5.7%) | 6 (3.5%) |
| 5 to 9 Years | 8 (4.2%) | 21 (12.3%) |
| 10 to 14 Years | 8 (4.2%) | 4 (2.4%) |
| 15 to 19 Years | 24 (12.5%) | 4 (2.4%) |
| 20 to 24 Years | 30 (15.6%) | 7 (4.1%) |
| 25 to 29 Years | 27 (14.1%) | 10 (5.9%) |
| 30 to 34 Years | 7 (3.6%) | 9 (5.3%) |
| 35 to 39 Years | 3 (1.6%) | 6 (3.5%) |
| 40 to 44 Years | 6 (3.1%) | 5 (2.9%) |
| 45 to 49 Years | 5 (2.6%) | 19 (11.2%) |
| 50 to 54 Years | 4 (2.1%) | 9 (5.3%) |
| 55 to 59 Years | 22 (11.5%) | 18 (10.6%) |
| 60 to 64 Years | 3 (1.6%) | 4 (2.4%) |
| 65 to 69 Years | 9 (4.7%) | 13 (7.6%) |
| 70 to 74 Years | 10 (5.2%) | 4 (2.4%) |
| 75 to 79 Years | 3 (1.6%) | 10 (5.9%) |
| 80 to 84 Years | 0 (0.0%) | 11 (6.5%) |
| 85 Years and over | 12 (6.2%) | 10 (5.9%) |
| Total | 192 (100.0%) | 170 (100.0%) |
Families and Households in Duncombe
Median Family Size in Duncombe
The median family size in Duncombe is 3.09 persons per family, with married-couple families (69 | 89.6%) accounting for the largest median family size of 3.14 persons per family. On the other hand, single male/father families (2 | 2.6%) represent the smallest median family size with 2.50 persons per family.

| Family Type | # Families | Family Size |
| Married-Couple | 69 (89.6%) | 3.14 |
| Single Male/Father | 2 (2.6%) | 2.50 |
| Single Female/Mother | 6 (7.8%) | 2.67 |
| Total Families | 77 (100.0%) | 3.09 |
Median Household Size in Duncombe
The median household size in Duncombe is 2.17 persons per household, with married-couple households (69 | 41.3%) accounting for the largest median household size of 3.14 persons per household. non-family households (90 | 53.9%) represent the smallest median household size with 1.36 persons per household.
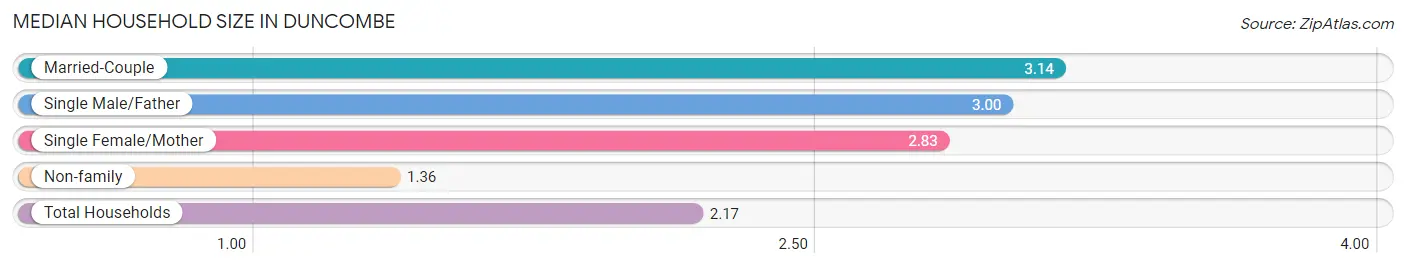
| Household Type | # Households | Household Size |
| Married-Couple | 69 (41.3%) | 3.14 |
| Single Male/Father | 2 (1.2%) | 3.00 |
| Single Female/Mother | 6 (3.6%) | 2.83 |
| Non-family | 90 (53.9%) | 1.36 |
| Total Households | 167 (100.0%) | 2.17 |
Household Size by Marriage Status in Duncombe
Out of a total of 167 households in Duncombe, 77 (46.1%) are family households, while 90 (53.9%) are nonfamily households. The most numerous type of family households are 2-person households, comprising 50, and the most common type of nonfamily households are 1-person households, comprising 63.
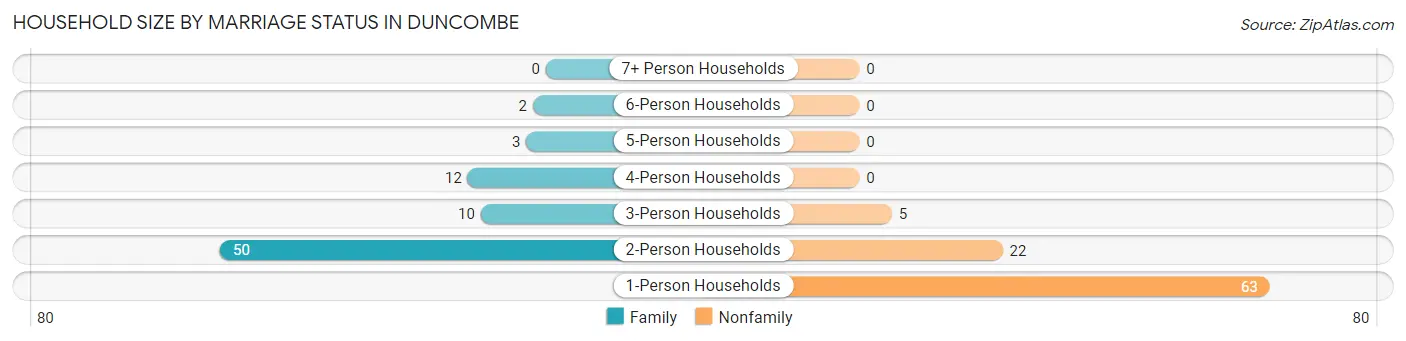
| Household Size | Family Households | Nonfamily Households |
| 1-Person Households | - | 63 (37.7%) |
| 2-Person Households | 50 (29.9%) | 22 (13.2%) |
| 3-Person Households | 10 (6.0%) | 5 (3.0%) |
| 4-Person Households | 12 (7.2%) | 0 (0.0%) |
| 5-Person Households | 3 (1.8%) | 0 (0.0%) |
| 6-Person Households | 2 (1.2%) | 0 (0.0%) |
| 7+ Person Households | 0 (0.0%) | 0 (0.0%) |
| Total | 77 (46.1%) | 90 (53.9%) |
Female Fertility in Duncombe
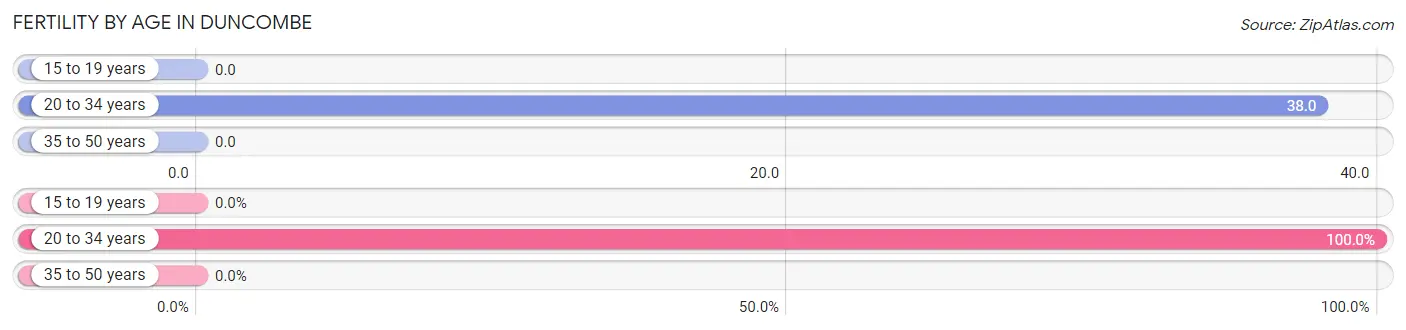
Fertility by Age in Duncombe
Average fertility rate in Duncombe is 16.0 births per 1,000 women. Women in the age bracket of 20 to 34 years have the highest fertility rate with 38.0 births per 1,000 women. Women in the age bracket of 20 to 34 years acount for 100.0% of all women with births.
| Age Bracket | Women with Births | Births / 1,000 Women |
| 15 to 19 years | 0 (0.0%) | 0.0 |
| 20 to 34 years | 1 (100.0%) | 38.0 |
| 35 to 50 years | 0 (0.0%) | 0.0 |
| Total | 1 (100.0%) | 16.0 |
Fertility by Age by Marriage Status in Duncombe
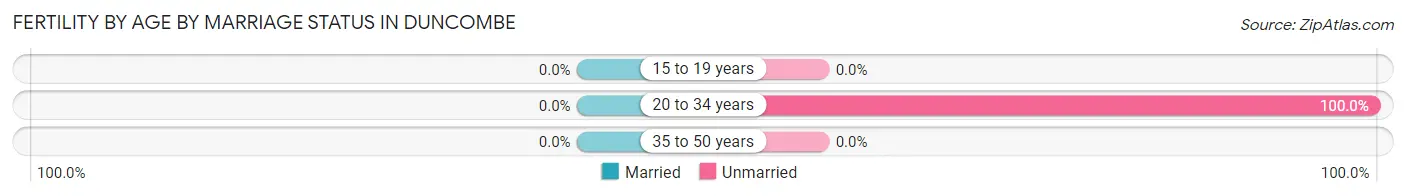
| Age Bracket | Married | Unmarried |
| 15 to 19 years | 0 (0.0%) | 0 (0.0%) |
| 20 to 34 years | 0 (0.0%) | 1 (100.0%) |
| 35 to 50 years | 0 (0.0%) | 0 (0.0%) |
| Total | 0 (0.0%) | 1 (100.0%) |
Fertility by Education in Duncombe
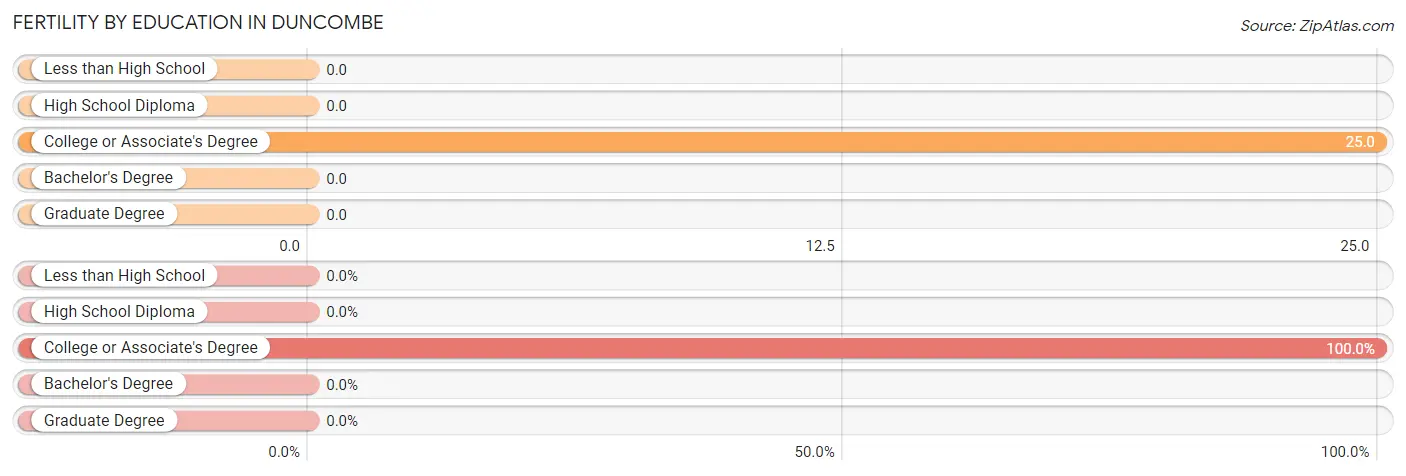
| Educational Attainment | Women with Births | Births / 1,000 Women |
| Less than High School | 0 (0.0%) | 0.0 |
| High School Diploma | 0 (0.0%) | 0.0 |
| College or Associate's Degree | 1 (100.0%) | 25.0 |
| Bachelor's Degree | 0 (0.0%) | 0.0 |
| Graduate Degree | 0 (0.0%) | 0.0 |
| Total | 1 (100.0%) | 16.0 |
Fertility by Education by Marriage Status in Duncombe
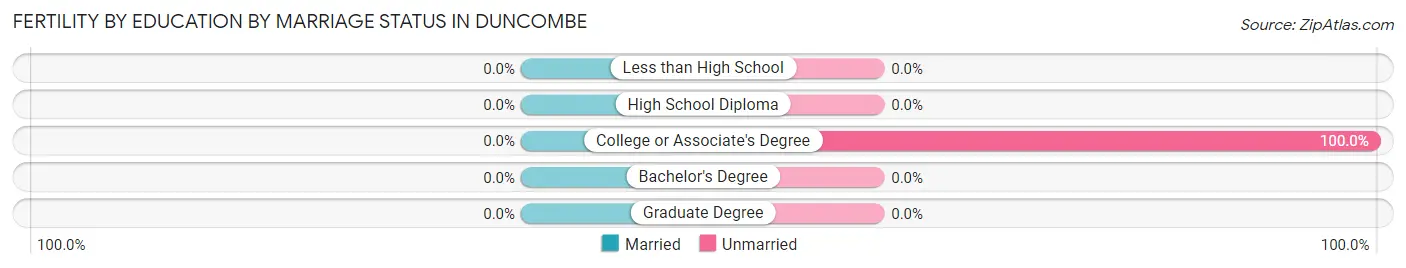
| Educational Attainment | Married | Unmarried |
| Less than High School | 0 (0.0%) | 0 (0.0%) |
| High School Diploma | 0 (0.0%) | 0 (0.0%) |
| College or Associate's Degree | 0 (0.0%) | 1 (100.0%) |
| Bachelor's Degree | 0 (0.0%) | 0 (0.0%) |
| Graduate Degree | 0 (0.0%) | 0 (0.0%) |
| Total | 0 (0.0%) | 1 (100.0%) |
Employment Characteristics in Duncombe
Employment by Class of Employer in Duncombe
Among the 186 employed individuals in Duncombe, private company employees (134 | 72.0%), local government employees (31 | 16.7%), and not-for-profit organizations (13 | 7.0%) make up the most common classes of employment.
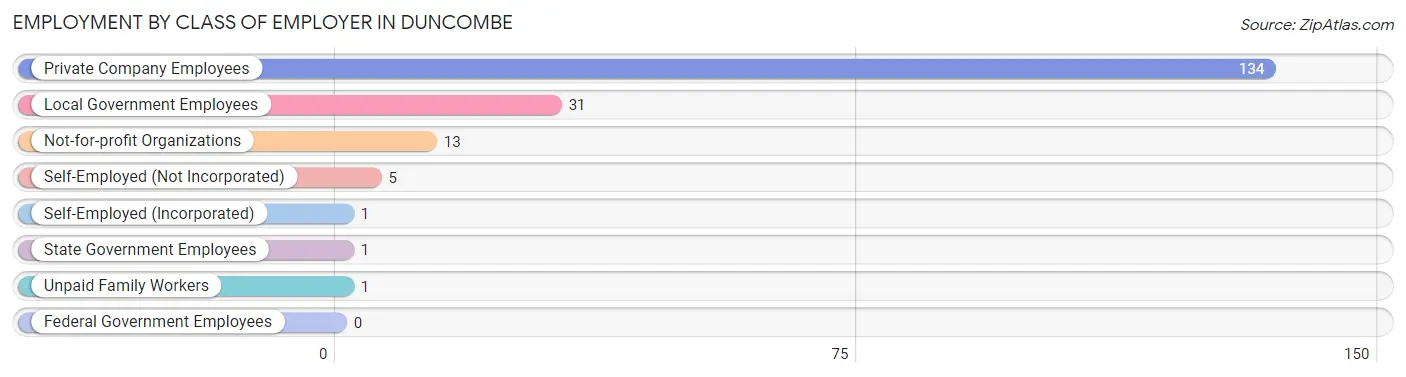
| Employer Class | # Employees | % Employees |
| Private Company Employees | 134 | 72.0% |
| Self-Employed (Incorporated) | 1 | 0.5% |
| Self-Employed (Not Incorporated) | 5 | 2.7% |
| Not-for-profit Organizations | 13 | 7.0% |
| Local Government Employees | 31 | 16.7% |
| State Government Employees | 1 | 0.5% |
| Federal Government Employees | 0 | 0.0% |
| Unpaid Family Workers | 1 | 0.5% |
| Total | 186 | 100.0% |
Employment Status by Age in Duncombe
According to the labor force statistics for Duncombe, out of the total population over 16 years of age (304), 65.5% or 199 individuals are in the labor force, with 5.0% or 10 of them unemployed. The age group with the highest labor force participation rate is 16 to 19 years, with 92.9% or 26 individuals in the labor force. Within the labor force, the 55 to 59 years age range has the highest percentage of unemployed individuals, with 15.6% or 5 of them being unemployed.
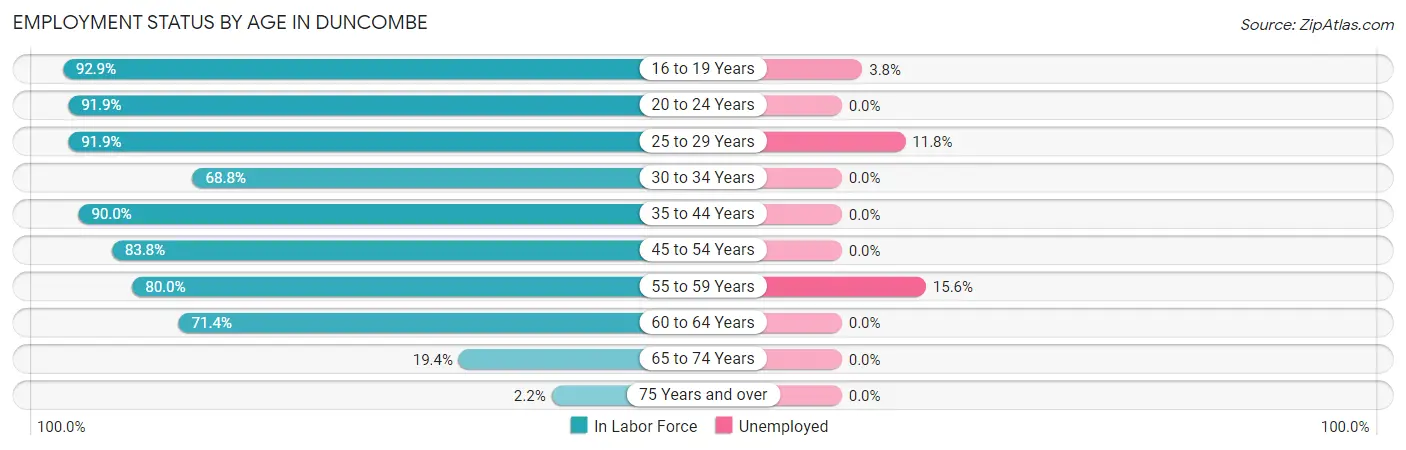
| Age Bracket | In Labor Force | Unemployed |
| 16 to 19 Years | 26 (92.9%) | 1 (3.8%) |
| 20 to 24 Years | 34 (91.9%) | 0 (0.0%) |
| 25 to 29 Years | 34 (91.9%) | 4 (11.8%) |
| 30 to 34 Years | 11 (68.8%) | 0 (0.0%) |
| 35 to 44 Years | 18 (90.0%) | 0 (0.0%) |
| 45 to 54 Years | 31 (83.8%) | 0 (0.0%) |
| 55 to 59 Years | 32 (80.0%) | 5 (15.6%) |
| 60 to 64 Years | 5 (71.4%) | 0 (0.0%) |
| 65 to 74 Years | 7 (19.4%) | 0 (0.0%) |
| 75 Years and over | 1 (2.2%) | 0 (0.0%) |
| Total | 199 (65.5%) | 10 (5.0%) |
Employment Status by Educational Attainment in Duncombe
According to labor force statistics for Duncombe, 83.4% of individuals (131) out of the total population between 25 and 64 years of age (157) are in the labor force, with 6.9% or 9 of them being unemployed. The group with the highest labor force participation rate are those with the educational attainment of bachelor's degree or higher, with 100.0% or 15 individuals in the labor force. Within the labor force, individuals with high school diploma education have the highest percentage of unemployment, with 19.6% or 9 of them being unemployed.
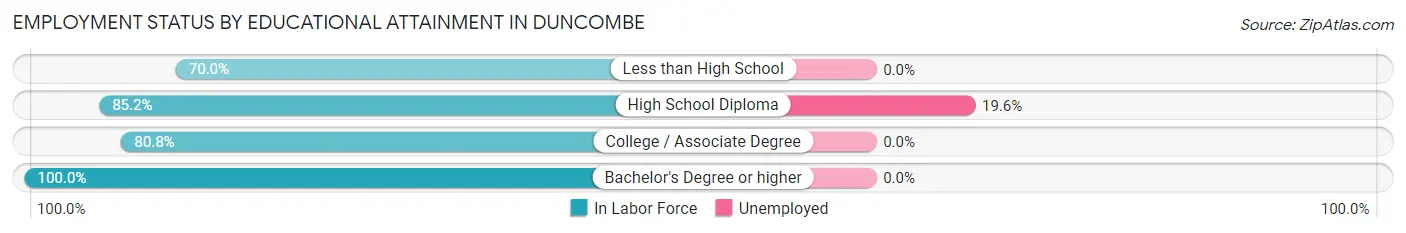
| Educational Attainment | In Labor Force | Unemployed |
| Less than High School | 7 (70.0%) | 0 (0.0%) |
| High School Diploma | 46 (85.2%) | 11 (19.6%) |
| College / Associate Degree | 63 (80.8%) | 0 (0.0%) |
| Bachelor's Degree or higher | 15 (100.0%) | 0 (0.0%) |
| Total | 131 (83.4%) | 11 (6.9%) |
Employment Occupations by Sex in Duncombe
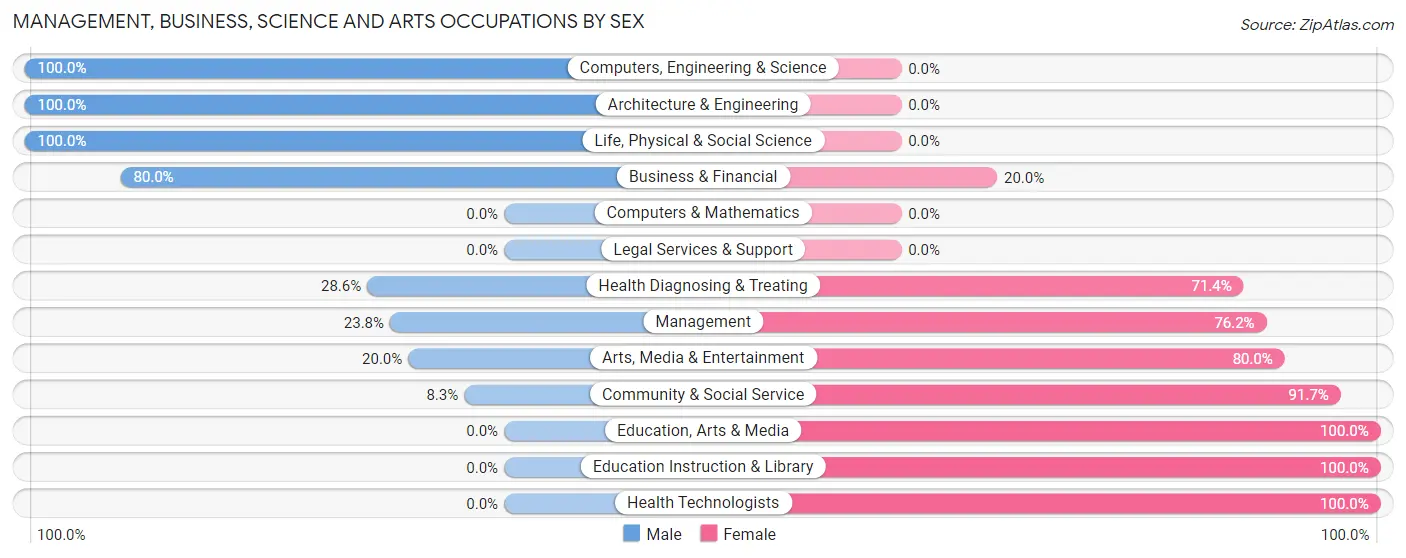
Management, Business, Science and Arts Occupations
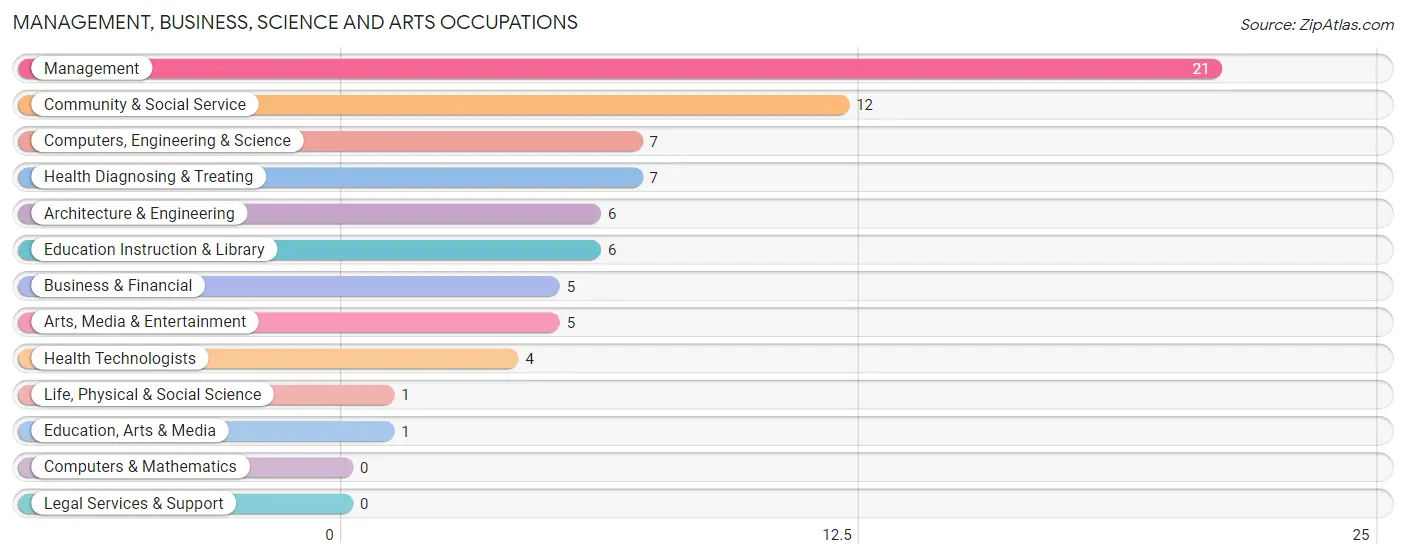
The most common Management, Business, Science and Arts occupations in Duncombe are Management (21 | 11.1%), Community & Social Service (12 | 6.4%), Computers, Engineering & Science (7 | 3.7%), Health Diagnosing & Treating (7 | 3.7%), and Architecture & Engineering (6 | 3.2%).
Management, Business, Science and Arts Occupations by Sex
Within the Management, Business, Science and Arts occupations in Duncombe, the most male-oriented occupations are Computers, Engineering & Science (100.0%), Architecture & Engineering (100.0%), and Life, Physical & Social Science (100.0%), while the most female-oriented occupations are Education, Arts & Media (100.0%), Education Instruction & Library (100.0%), and Health Technologists (100.0%).
| Occupation | Male | Female |
| Management | 5 (23.8%) | 16 (76.2%) |
| Business & Financial | 4 (80.0%) | 1 (20.0%) |
| Computers, Engineering & Science | 7 (100.0%) | 0 (0.0%) |
| Computers & Mathematics | 0 (0.0%) | 0 (0.0%) |
| Architecture & Engineering | 6 (100.0%) | 0 (0.0%) |
| Life, Physical & Social Science | 1 (100.0%) | 0 (0.0%) |
| Community & Social Service | 1 (8.3%) | 11 (91.7%) |
| Education, Arts & Media | 0 (0.0%) | 1 (100.0%) |
| Legal Services & Support | 0 (0.0%) | 0 (0.0%) |
| Education Instruction & Library | 0 (0.0%) | 6 (100.0%) |
| Arts, Media & Entertainment | 1 (20.0%) | 4 (80.0%) |
| Health Diagnosing & Treating | 2 (28.6%) | 5 (71.4%) |
| Health Technologists | 0 (0.0%) | 4 (100.0%) |
| Total (Category) | 19 (36.5%) | 33 (63.5%) |
| Total (Overall) | 118 (62.4%) | 71 (37.6%) |
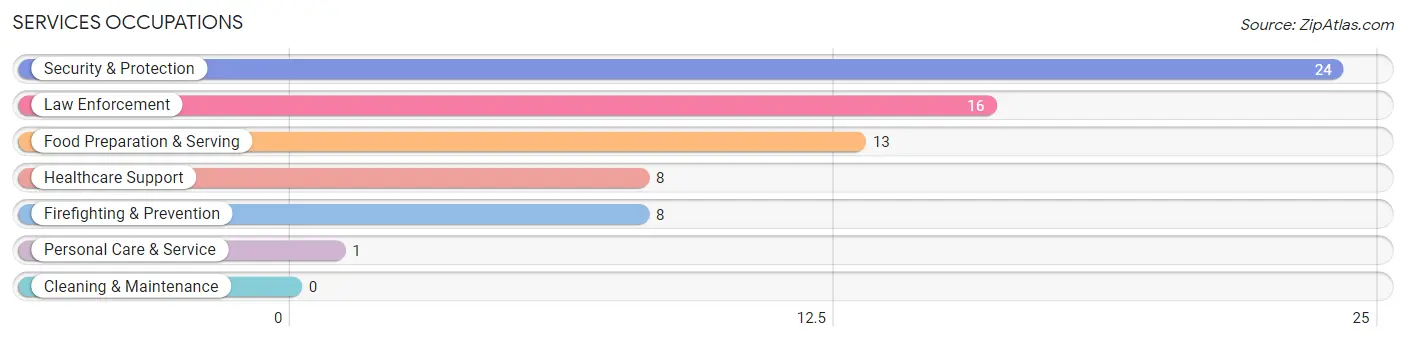
Services Occupations
The most common Services occupations in Duncombe are Security & Protection (24 | 12.7%), Law Enforcement (16 | 8.5%), Food Preparation & Serving (13 | 6.9%), Healthcare Support (8 | 4.2%), and Firefighting & Prevention (8 | 4.2%).
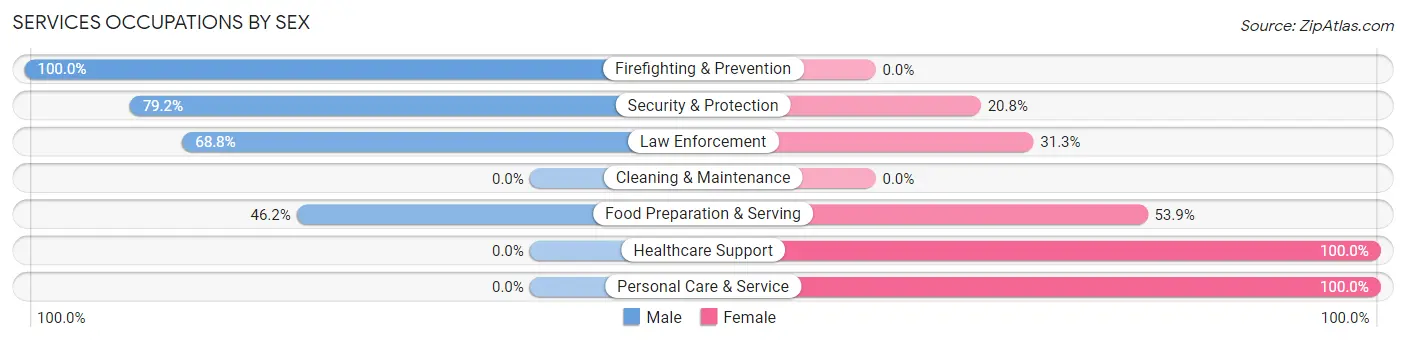
Services Occupations by Sex
Within the Services occupations in Duncombe, the most male-oriented occupations are Firefighting & Prevention (100.0%), Security & Protection (79.2%), and Law Enforcement (68.8%), while the most female-oriented occupations are Healthcare Support (100.0%), Personal Care & Service (100.0%), and Food Preparation & Serving (53.8%).
| Occupation | Male | Female |
| Healthcare Support | 0 (0.0%) | 8 (100.0%) |
| Security & Protection | 19 (79.2%) | 5 (20.8%) |
| Firefighting & Prevention | 8 (100.0%) | 0 (0.0%) |
| Law Enforcement | 11 (68.8%) | 5 (31.2%) |
| Food Preparation & Serving | 6 (46.2%) | 7 (53.8%) |
| Cleaning & Maintenance | 0 (0.0%) | 0 (0.0%) |
| Personal Care & Service | 0 (0.0%) | 1 (100.0%) |
| Total (Category) | 25 (54.3%) | 21 (45.7%) |
| Total (Overall) | 118 (62.4%) | 71 (37.6%) |
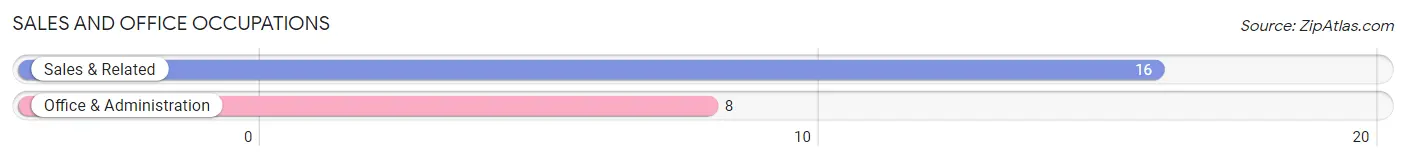
Sales and Office Occupations
The most common Sales and Office occupations in Duncombe are Sales & Related (16 | 8.5%), and Office & Administration (8 | 4.2%).
Sales and Office Occupations by Sex
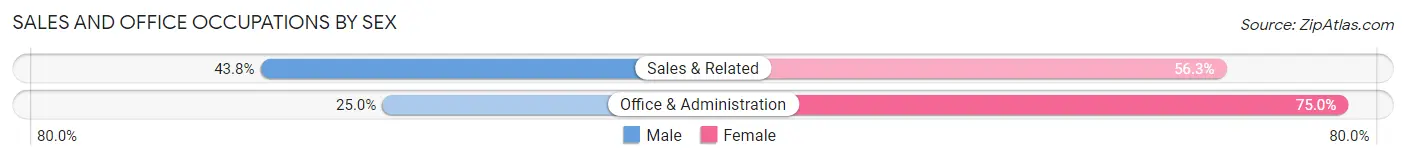
| Occupation | Male | Female |
| Sales & Related | 7 (43.8%) | 9 (56.2%) |
| Office & Administration | 2 (25.0%) | 6 (75.0%) |
| Total (Category) | 9 (37.5%) | 15 (62.5%) |
| Total (Overall) | 118 (62.4%) | 71 (37.6%) |
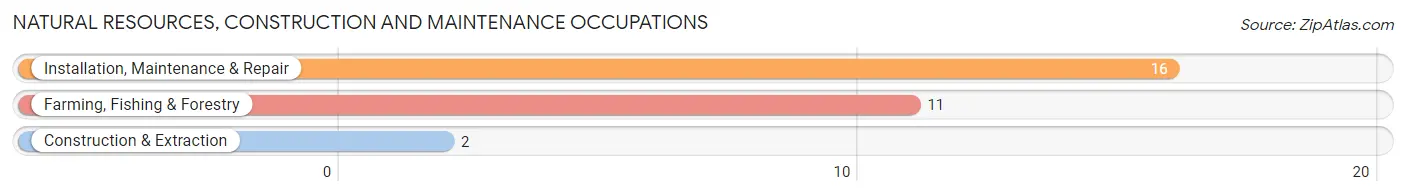
Natural Resources, Construction and Maintenance Occupations
The most common Natural Resources, Construction and Maintenance occupations in Duncombe are Installation, Maintenance & Repair (16 | 8.5%), Farming, Fishing & Forestry (11 | 5.8%), and Construction & Extraction (2 | 1.1%).
Natural Resources, Construction and Maintenance Occupations by Sex
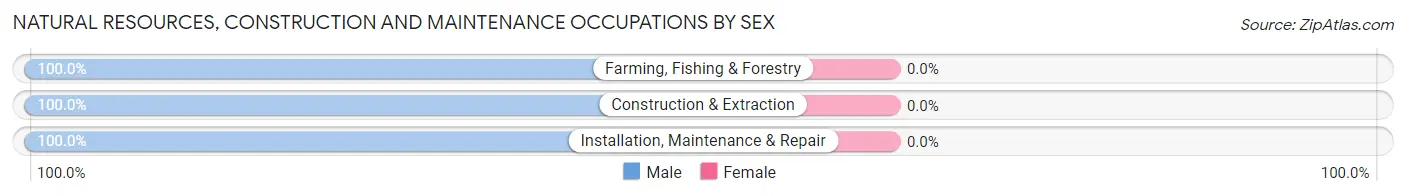
| Occupation | Male | Female |
| Farming, Fishing & Forestry | 11 (100.0%) | 0 (0.0%) |
| Construction & Extraction | 2 (100.0%) | 0 (0.0%) |
| Installation, Maintenance & Repair | 16 (100.0%) | 0 (0.0%) |
| Total (Category) | 29 (100.0%) | 0 (0.0%) |
| Total (Overall) | 118 (62.4%) | 71 (37.6%) |
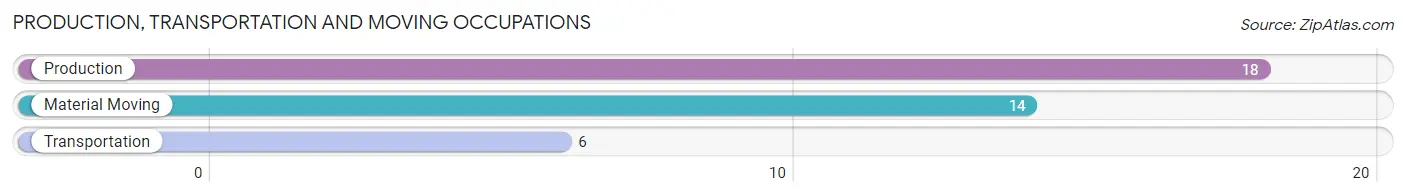
Production, Transportation and Moving Occupations
The most common Production, Transportation and Moving occupations in Duncombe are Production (18 | 9.5%), Material Moving (14 | 7.4%), and Transportation (6 | 3.2%).
Production, Transportation and Moving Occupations by Sex
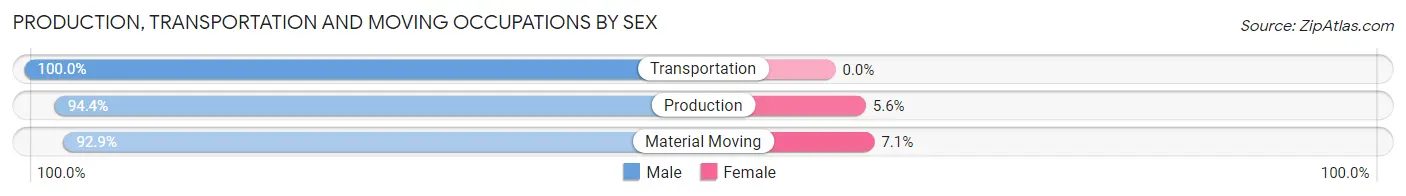
| Occupation | Male | Female |
| Production | 17 (94.4%) | 1 (5.6%) |
| Transportation | 6 (100.0%) | 0 (0.0%) |
| Material Moving | 13 (92.9%) | 1 (7.1%) |
| Total (Category) | 36 (94.7%) | 2 (5.3%) |
| Total (Overall) | 118 (62.4%) | 71 (37.6%) |
Employment Industries by Sex in Duncombe
Employment Industries in Duncombe
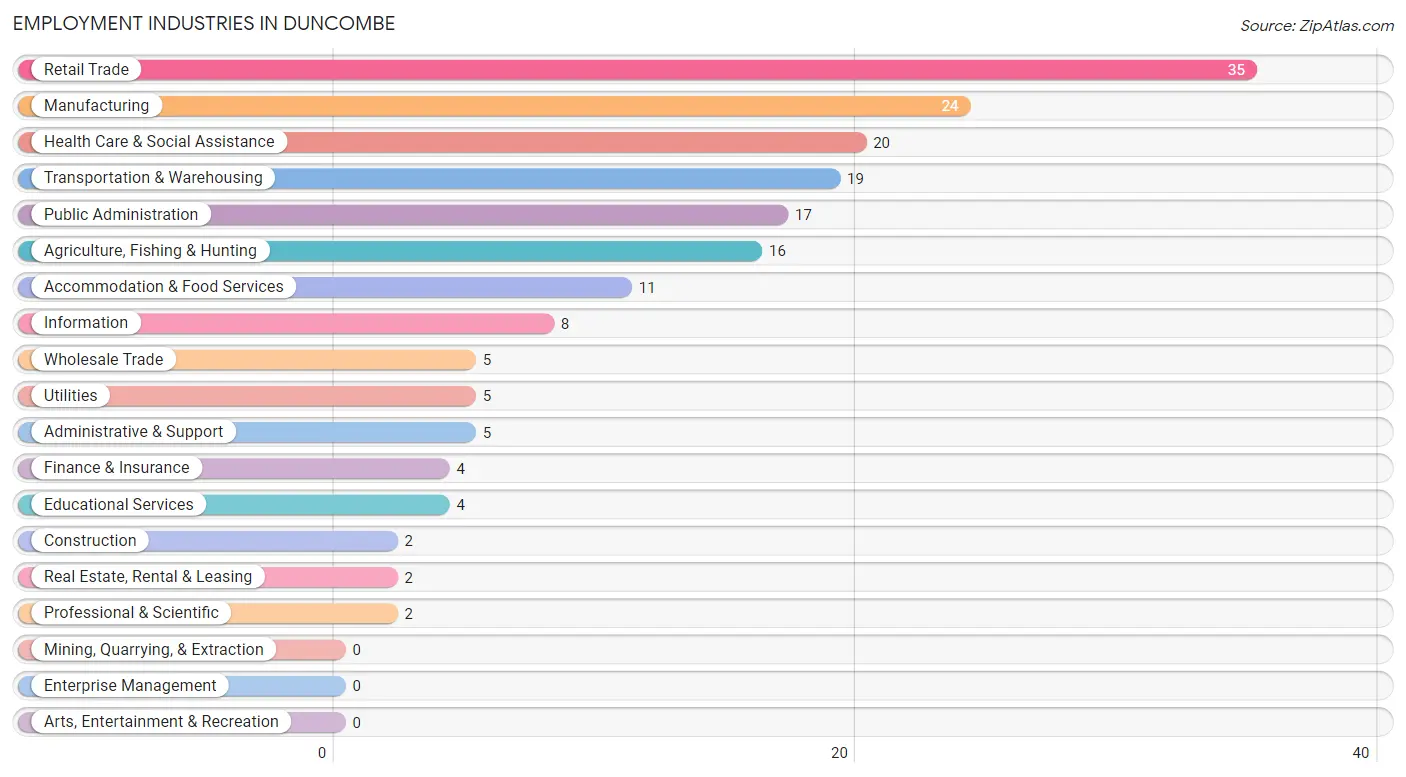
The major employment industries in Duncombe include Retail Trade (35 | 18.5%), Manufacturing (24 | 12.7%), Health Care & Social Assistance (20 | 10.6%), Transportation & Warehousing (19 | 10.1%), and Public Administration (17 | 9.0%).
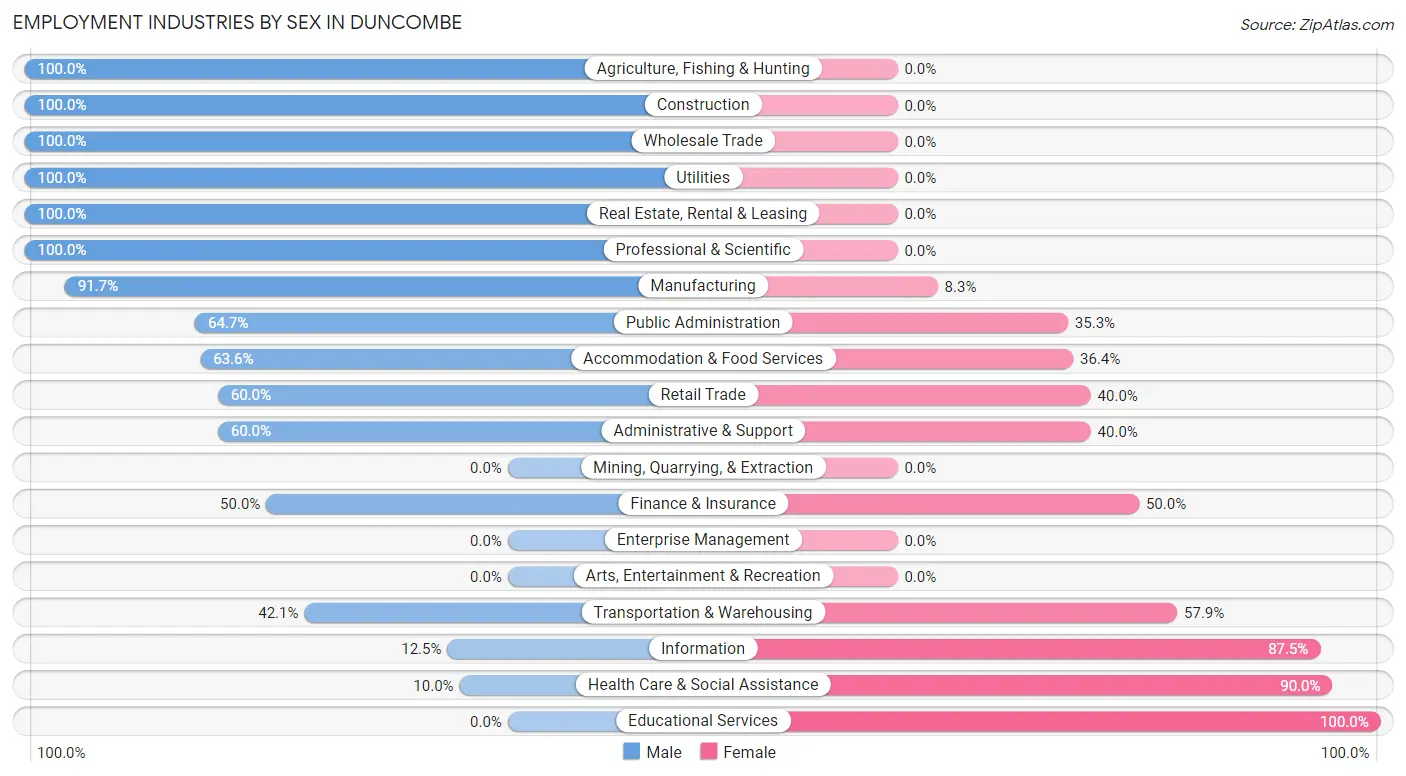
Employment Industries by Sex in Duncombe
The Duncombe industries that see more men than women are Agriculture, Fishing & Hunting (100.0%), Construction (100.0%), and Wholesale Trade (100.0%), whereas the industries that tend to have a higher number of women are Educational Services (100.0%), Health Care & Social Assistance (90.0%), and Information (87.5%).
| Industry | Male | Female |
| Agriculture, Fishing & Hunting | 16 (100.0%) | 0 (0.0%) |
| Mining, Quarrying, & Extraction | 0 (0.0%) | 0 (0.0%) |
| Construction | 2 (100.0%) | 0 (0.0%) |
| Manufacturing | 22 (91.7%) | 2 (8.3%) |
| Wholesale Trade | 5 (100.0%) | 0 (0.0%) |
| Retail Trade | 21 (60.0%) | 14 (40.0%) |
| Transportation & Warehousing | 8 (42.1%) | 11 (57.9%) |
| Utilities | 5 (100.0%) | 0 (0.0%) |
| Information | 1 (12.5%) | 7 (87.5%) |
| Finance & Insurance | 2 (50.0%) | 2 (50.0%) |
| Real Estate, Rental & Leasing | 2 (100.0%) | 0 (0.0%) |
| Professional & Scientific | 2 (100.0%) | 0 (0.0%) |
| Enterprise Management | 0 (0.0%) | 0 (0.0%) |
| Administrative & Support | 3 (60.0%) | 2 (40.0%) |
| Educational Services | 0 (0.0%) | 4 (100.0%) |
| Health Care & Social Assistance | 2 (10.0%) | 18 (90.0%) |
| Arts, Entertainment & Recreation | 0 (0.0%) | 0 (0.0%) |
| Accommodation & Food Services | 7 (63.6%) | 4 (36.4%) |
| Public Administration | 11 (64.7%) | 6 (35.3%) |
| Total | 118 (62.4%) | 71 (37.6%) |
Education in Duncombe
School Enrollment in Duncombe
The most common levels of schooling among the 57 students in Duncombe are elementary school (18 | 31.6%), high school (13 | 22.8%), and college / undergraduate (9 | 15.8%).
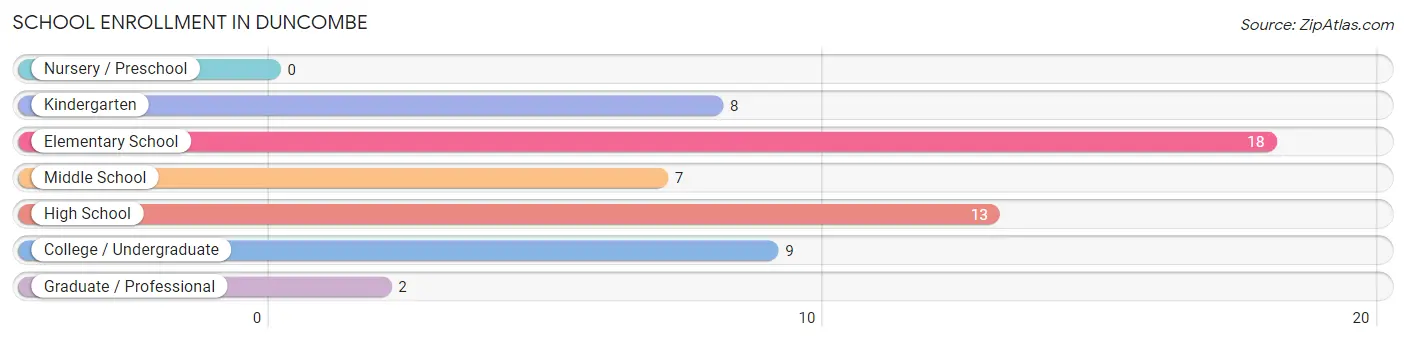
| School Level | # Students | % Students |
| Nursery / Preschool | 0 | 0.0% |
| Kindergarten | 8 | 14.0% |
| Elementary School | 18 | 31.6% |
| Middle School | 7 | 12.3% |
| High School | 13 | 22.8% |
| College / Undergraduate | 9 | 15.8% |
| Graduate / Professional | 2 | 3.5% |
| Total | 57 | 100.0% |
School Enrollment by Age by Funding Source in Duncombe
Out of a total of 57 students who are enrolled in schools in Duncombe, 3 (5.3%) attend a private institution, while the remaining 54 (94.7%) are enrolled in public schools. The age group of 18 to 19 year olds has the highest likelihood of being enrolled in private schools, with 3 (25.0% in the age bracket) enrolled. Conversely, the age group of 5 to 9 year old has the lowest likelihood of being enrolled in a private school, with 26 (100.0% in the age bracket) attending a public institution.
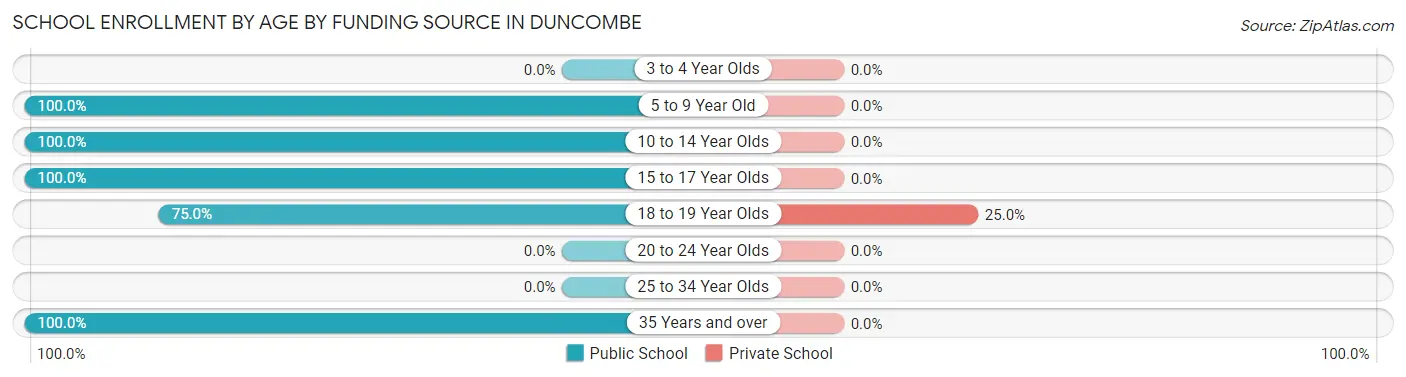
| Age Bracket | Public School | Private School |
| 3 to 4 Year Olds | 0 (0.0%) | 0 (0.0%) |
| 5 to 9 Year Old | 26 (100.0%) | 0 (0.0%) |
| 10 to 14 Year Olds | 12 (100.0%) | 0 (0.0%) |
| 15 to 17 Year Olds | 5 (100.0%) | 0 (0.0%) |
| 18 to 19 Year Olds | 9 (75.0%) | 3 (25.0%) |
| 20 to 24 Year Olds | 0 (0.0%) | 0 (0.0%) |
| 25 to 34 Year Olds | 0 (0.0%) | 0 (0.0%) |
| 35 Years and over | 2 (100.0%) | 0 (0.0%) |
| Total | 54 (94.7%) | 3 (5.3%) |
Educational Attainment by Field of Study in Duncombe
Education (6 | 35.3%), business (5 | 29.4%), communications (3 | 17.6%), bio, nature & agricultural (1 | 5.9%), and science & technology (1 | 5.9%) are the most common fields of study among 17 individuals in Duncombe who have obtained a bachelor's degree or higher.
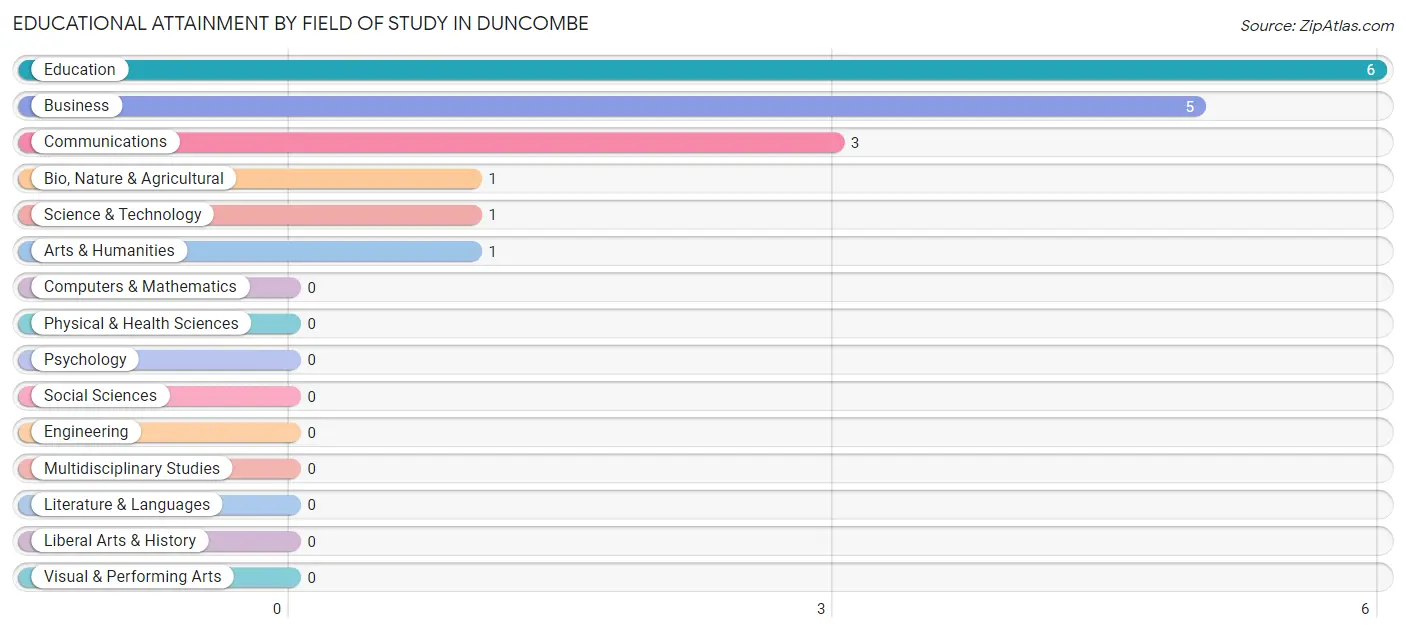
| Field of Study | # Graduates | % Graduates |
| Computers & Mathematics | 0 | 0.0% |
| Bio, Nature & Agricultural | 1 | 5.9% |
| Physical & Health Sciences | 0 | 0.0% |
| Psychology | 0 | 0.0% |
| Social Sciences | 0 | 0.0% |
| Engineering | 0 | 0.0% |
| Multidisciplinary Studies | 0 | 0.0% |
| Science & Technology | 1 | 5.9% |
| Business | 5 | 29.4% |
| Education | 6 | 35.3% |
| Literature & Languages | 0 | 0.0% |
| Liberal Arts & History | 0 | 0.0% |
| Visual & Performing Arts | 0 | 0.0% |
| Communications | 3 | 17.6% |
| Arts & Humanities | 1 | 5.9% |
| Total | 17 | 100.0% |
Transportation & Commute in Duncombe
Vehicle Availability by Sex in Duncombe
The most prevalent vehicle ownership categories in Duncombe are males with 2 vehicles (63, accounting for 54.8%) and females with 2 vehicles (25, making up 88.7%).
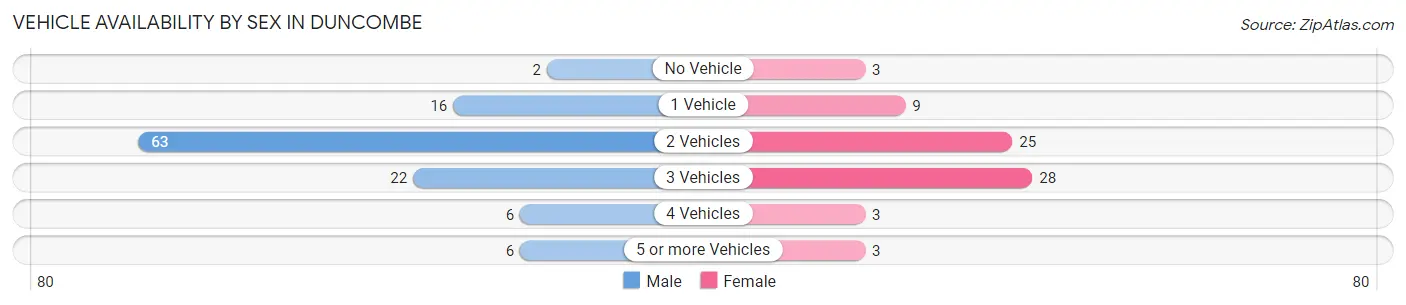
| Vehicles Available | Male | Female |
| No Vehicle | 2 (1.7%) | 3 (4.2%) |
| 1 Vehicle | 16 (13.9%) | 9 (12.7%) |
| 2 Vehicles | 63 (54.8%) | 25 (35.2%) |
| 3 Vehicles | 22 (19.1%) | 28 (39.4%) |
| 4 Vehicles | 6 (5.2%) | 3 (4.2%) |
| 5 or more Vehicles | 6 (5.2%) | 3 (4.2%) |
| Total | 115 (100.0%) | 71 (100.0%) |
Commute Time in Duncombe
The most frequently occuring commute durations in Duncombe are 10 to 14 minutes (45 commuters, 24.3%), 15 to 19 minutes (33 commuters, 17.8%), and 20 to 24 minutes (30 commuters, 16.2%).
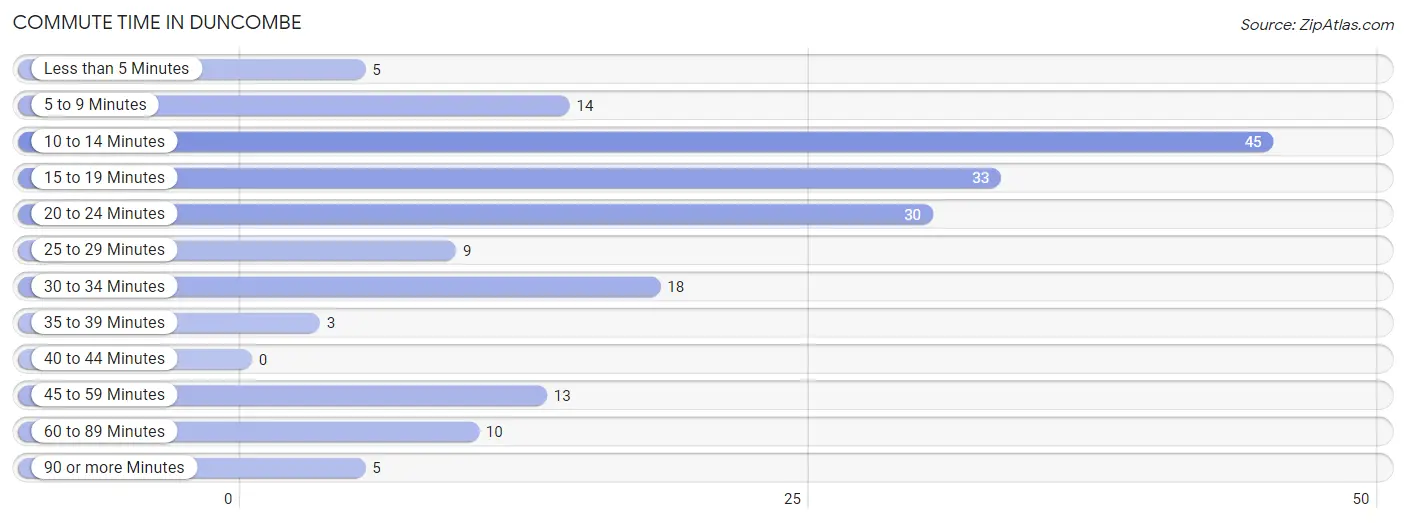
| Commute Time | # Commuters | % Commuters |
| Less than 5 Minutes | 5 | 2.7% |
| 5 to 9 Minutes | 14 | 7.6% |
| 10 to 14 Minutes | 45 | 24.3% |
| 15 to 19 Minutes | 33 | 17.8% |
| 20 to 24 Minutes | 30 | 16.2% |
| 25 to 29 Minutes | 9 | 4.9% |
| 30 to 34 Minutes | 18 | 9.7% |
| 35 to 39 Minutes | 3 | 1.6% |
| 40 to 44 Minutes | 0 | 0.0% |
| 45 to 59 Minutes | 13 | 7.0% |
| 60 to 89 Minutes | 10 | 5.4% |
| 90 or more Minutes | 5 | 2.7% |
Commute Time by Sex in Duncombe
The most common commute times in Duncombe are 10 to 14 minutes (23 commuters, 20.0%) for males and 10 to 14 minutes (22 commuters, 31.4%) for females.
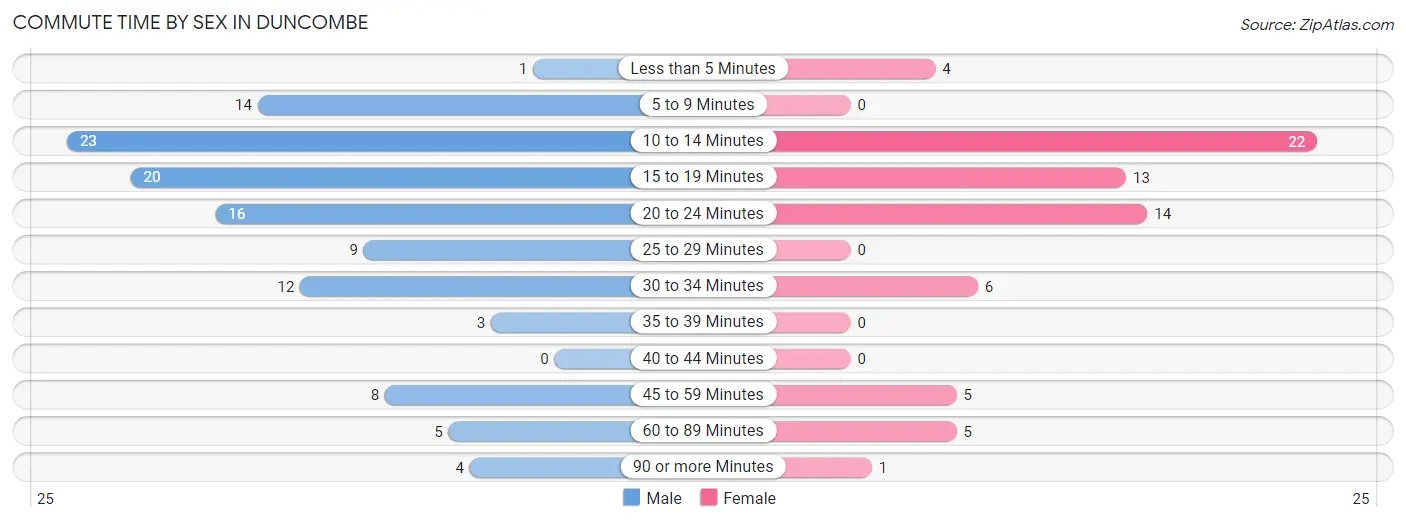
| Commute Time | Male | Female |
| Less than 5 Minutes | 1 (0.9%) | 4 (5.7%) |
| 5 to 9 Minutes | 14 (12.2%) | 0 (0.0%) |
| 10 to 14 Minutes | 23 (20.0%) | 22 (31.4%) |
| 15 to 19 Minutes | 20 (17.4%) | 13 (18.6%) |
| 20 to 24 Minutes | 16 (13.9%) | 14 (20.0%) |
| 25 to 29 Minutes | 9 (7.8%) | 0 (0.0%) |
| 30 to 34 Minutes | 12 (10.4%) | 6 (8.6%) |
| 35 to 39 Minutes | 3 (2.6%) | 0 (0.0%) |
| 40 to 44 Minutes | 0 (0.0%) | 0 (0.0%) |
| 45 to 59 Minutes | 8 (7.0%) | 5 (7.1%) |
| 60 to 89 Minutes | 5 (4.3%) | 5 (7.1%) |
| 90 or more Minutes | 4 (3.5%) | 1 (1.4%) |
Time of Departure to Work by Sex in Duncombe
The most frequent times of departure to work in Duncombe are 7:30 AM to 7:59 AM (24, 20.9%) for males and 7:30 AM to 7:59 AM (25, 35.7%) for females.
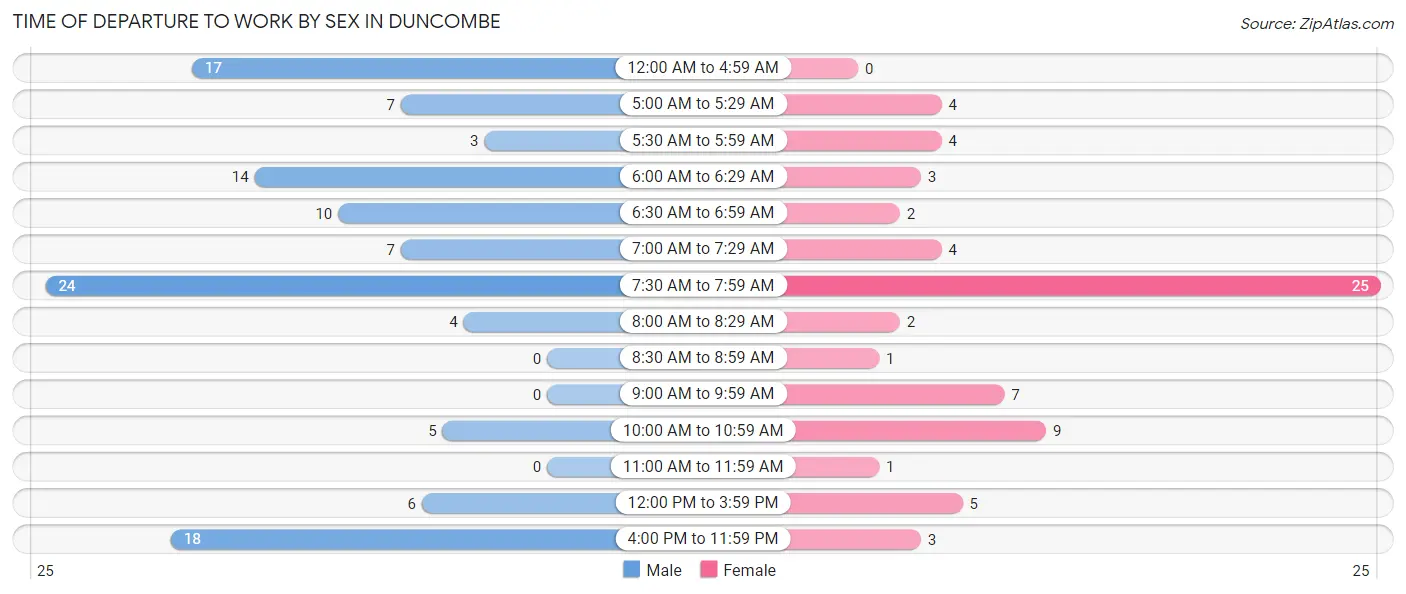
| Time of Departure | Male | Female |
| 12:00 AM to 4:59 AM | 17 (14.8%) | 0 (0.0%) |
| 5:00 AM to 5:29 AM | 7 (6.1%) | 4 (5.7%) |
| 5:30 AM to 5:59 AM | 3 (2.6%) | 4 (5.7%) |
| 6:00 AM to 6:29 AM | 14 (12.2%) | 3 (4.3%) |
| 6:30 AM to 6:59 AM | 10 (8.7%) | 2 (2.9%) |
| 7:00 AM to 7:29 AM | 7 (6.1%) | 4 (5.7%) |
| 7:30 AM to 7:59 AM | 24 (20.9%) | 25 (35.7%) |
| 8:00 AM to 8:29 AM | 4 (3.5%) | 2 (2.9%) |
| 8:30 AM to 8:59 AM | 0 (0.0%) | 1 (1.4%) |
| 9:00 AM to 9:59 AM | 0 (0.0%) | 7 (10.0%) |
| 10:00 AM to 10:59 AM | 5 (4.3%) | 9 (12.9%) |
| 11:00 AM to 11:59 AM | 0 (0.0%) | 1 (1.4%) |
| 12:00 PM to 3:59 PM | 6 (5.2%) | 5 (7.1%) |
| 4:00 PM to 11:59 PM | 18 (15.7%) | 3 (4.3%) |
| Total | 115 (100.0%) | 70 (100.0%) |
Housing Occupancy in Duncombe
Occupancy by Ownership in Duncombe
Of the total 167 dwellings in Duncombe, owner-occupied units account for 100 (59.9%), while renter-occupied units make up 67 (40.1%).
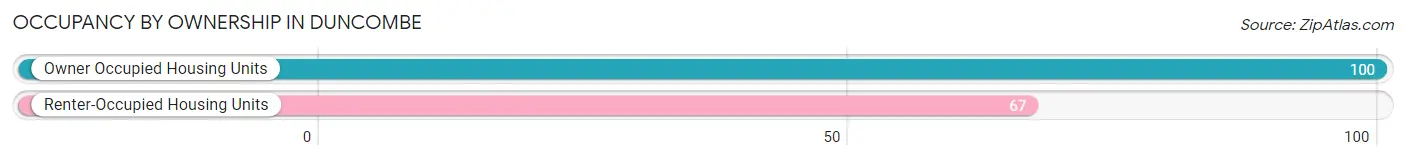
| Occupancy | # Housing Units | % Housing Units |
| Owner Occupied Housing Units | 100 | 59.9% |
| Renter-Occupied Housing Units | 67 | 40.1% |
| Total Occupied Housing Units | 167 | 100.0% |
Occupancy by Household Size in Duncombe
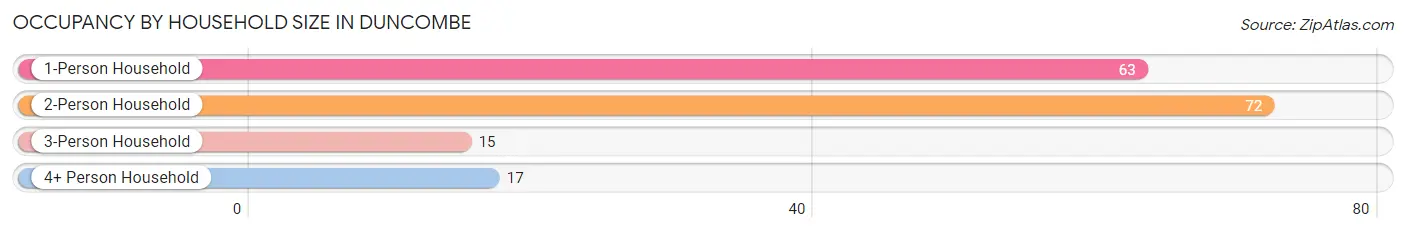
| Household Size | # Housing Units | % Housing Units |
| 1-Person Household | 63 | 37.7% |
| 2-Person Household | 72 | 43.1% |
| 3-Person Household | 15 | 9.0% |
| 4+ Person Household | 17 | 10.2% |
| Total Housing Units | 167 | 100.0% |
Occupancy by Ownership by Household Size in Duncombe
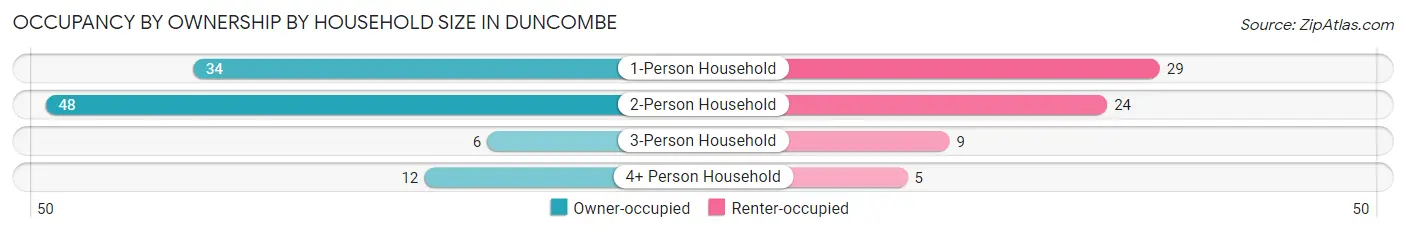
| Household Size | Owner-occupied | Renter-occupied |
| 1-Person Household | 34 (54.0%) | 29 (46.0%) |
| 2-Person Household | 48 (66.7%) | 24 (33.3%) |
| 3-Person Household | 6 (40.0%) | 9 (60.0%) |
| 4+ Person Household | 12 (70.6%) | 5 (29.4%) |
| Total Housing Units | 100 (59.9%) | 67 (40.1%) |
Occupancy by Educational Attainment in Duncombe
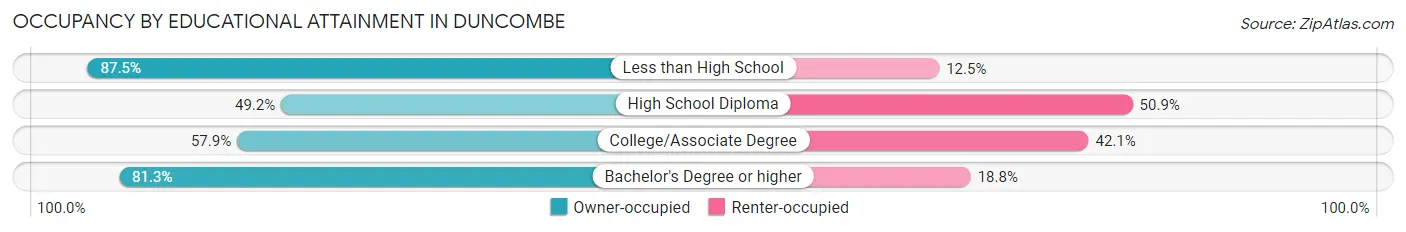
| Household Size | Owner-occupied | Renter-occupied |
| Less than High School | 14 (87.5%) | 2 (12.5%) |
| High School Diploma | 29 (49.1%) | 30 (50.8%) |
| College/Associate Degree | 44 (57.9%) | 32 (42.1%) |
| Bachelor's Degree or higher | 13 (81.2%) | 3 (18.8%) |
Occupancy by Age of Householder in Duncombe
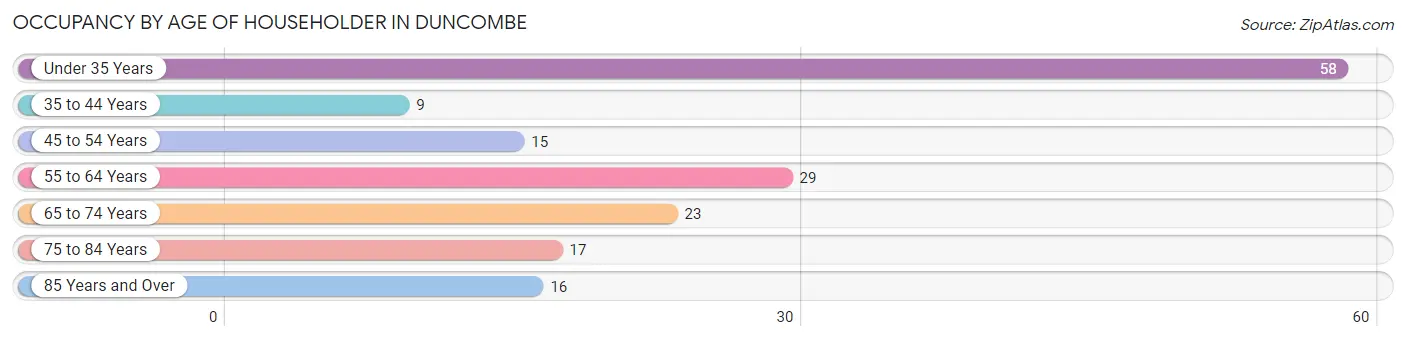
| Age Bracket | # Households | % Households |
| Under 35 Years | 58 | 34.7% |
| 35 to 44 Years | 9 | 5.4% |
| 45 to 54 Years | 15 | 9.0% |
| 55 to 64 Years | 29 | 17.4% |
| 65 to 74 Years | 23 | 13.8% |
| 75 to 84 Years | 17 | 10.2% |
| 85 Years and Over | 16 | 9.6% |
| Total | 167 | 100.0% |
Housing Finances in Duncombe
Median Income by Occupancy in Duncombe
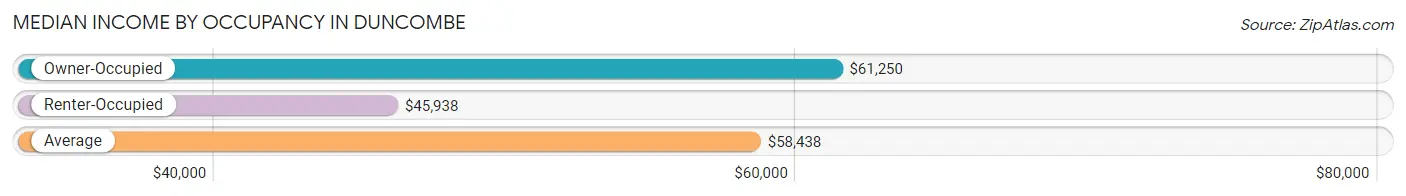
| Occupancy Type | # Households | Median Income |
| Owner-Occupied | 100 (59.9%) | $61,250 |
| Renter-Occupied | 67 (40.1%) | $45,938 |
| Average | 167 (100.0%) | $58,438 |
Occupancy by Householder Income Bracket in Duncombe
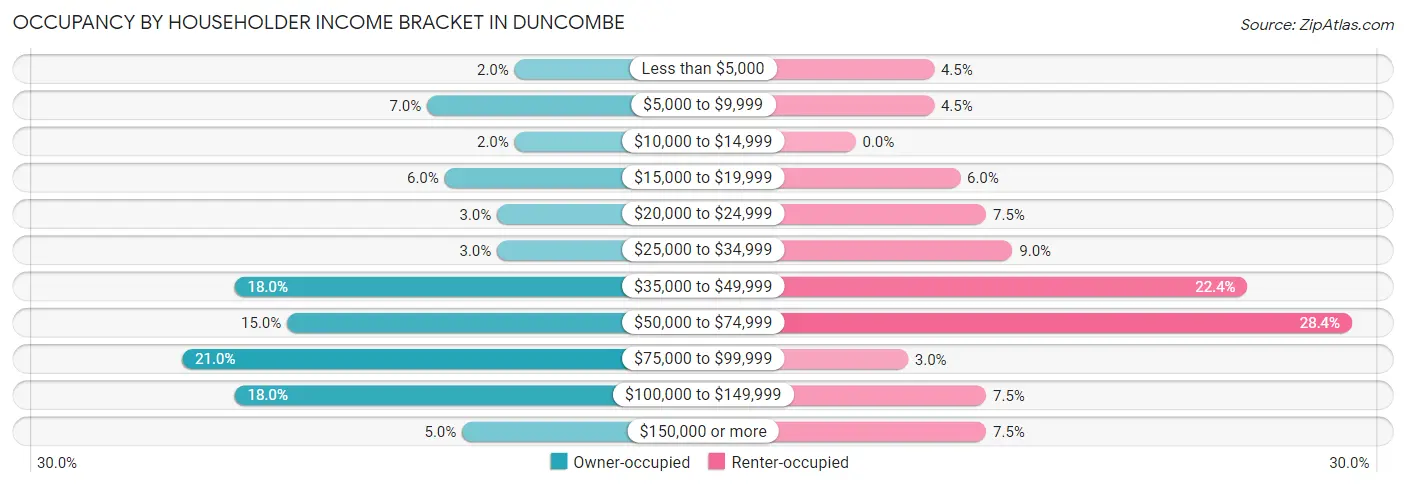
| Income Bracket | Owner-occupied | Renter-occupied |
| Less than $5,000 | 2 (2.0%) | 3 (4.5%) |
| $5,000 to $9,999 | 7 (7.0%) | 3 (4.5%) |
| $10,000 to $14,999 | 2 (2.0%) | 0 (0.0%) |
| $15,000 to $19,999 | 6 (6.0%) | 4 (6.0%) |
| $20,000 to $24,999 | 3 (3.0%) | 5 (7.5%) |
| $25,000 to $34,999 | 3 (3.0%) | 6 (9.0%) |
| $35,000 to $49,999 | 18 (18.0%) | 15 (22.4%) |
| $50,000 to $74,999 | 15 (15.0%) | 19 (28.4%) |
| $75,000 to $99,999 | 21 (21.0%) | 2 (3.0%) |
| $100,000 to $149,999 | 18 (18.0%) | 5 (7.5%) |
| $150,000 or more | 5 (5.0%) | 5 (7.5%) |
| Total | 100 (100.0%) | 67 (100.0%) |
Monthly Housing Cost Tiers in Duncombe
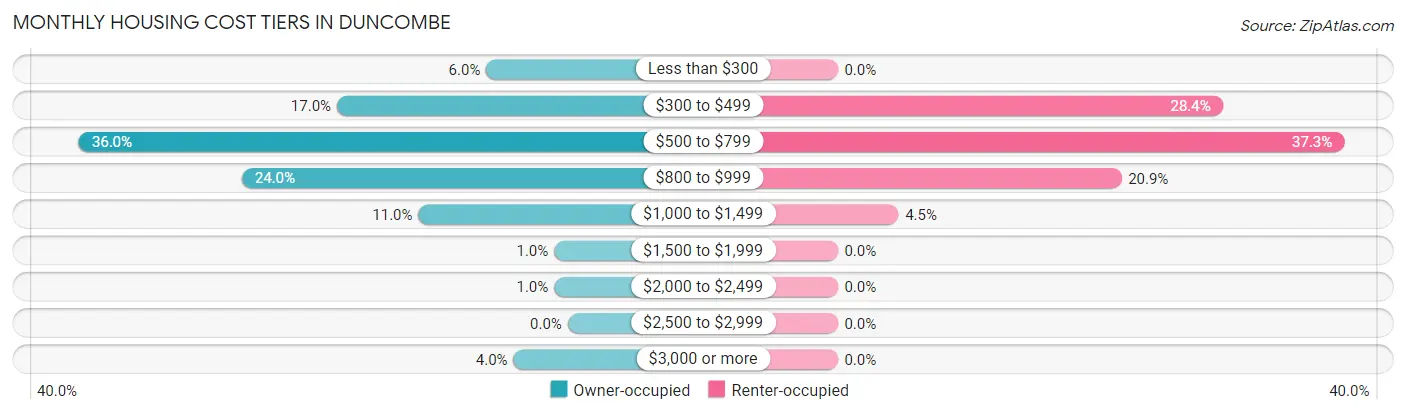
| Monthly Cost | Owner-occupied | Renter-occupied |
| Less than $300 | 6 (6.0%) | 0 (0.0%) |
| $300 to $499 | 17 (17.0%) | 19 (28.4%) |
| $500 to $799 | 36 (36.0%) | 25 (37.3%) |
| $800 to $999 | 24 (24.0%) | 14 (20.9%) |
| $1,000 to $1,499 | 11 (11.0%) | 3 (4.5%) |
| $1,500 to $1,999 | 1 (1.0%) | 0 (0.0%) |
| $2,000 to $2,499 | 1 (1.0%) | 0 (0.0%) |
| $2,500 to $2,999 | 0 (0.0%) | 0 (0.0%) |
| $3,000 or more | 4 (4.0%) | 0 (0.0%) |
| Total | 100 (100.0%) | 67 (100.0%) |
Physical Housing Characteristics in Duncombe
Housing Structures in Duncombe
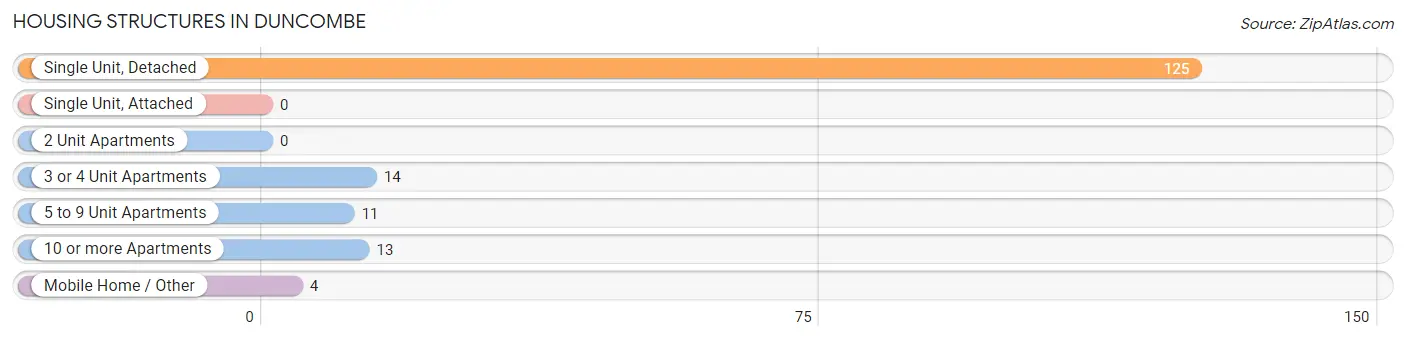
| Structure Type | # Housing Units | % Housing Units |
| Single Unit, Detached | 125 | 74.9% |
| Single Unit, Attached | 0 | 0.0% |
| 2 Unit Apartments | 0 | 0.0% |
| 3 or 4 Unit Apartments | 14 | 8.4% |
| 5 to 9 Unit Apartments | 11 | 6.6% |
| 10 or more Apartments | 13 | 7.8% |
| Mobile Home / Other | 4 | 2.4% |
| Total | 167 | 100.0% |
Housing Structures by Occupancy in Duncombe
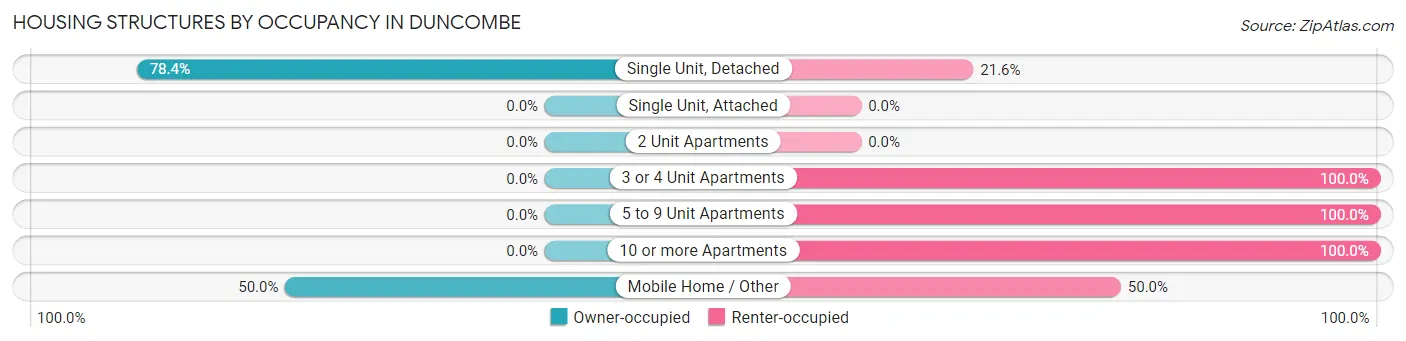
| Structure Type | Owner-occupied | Renter-occupied |
| Single Unit, Detached | 98 (78.4%) | 27 (21.6%) |
| Single Unit, Attached | 0 (0.0%) | 0 (0.0%) |
| 2 Unit Apartments | 0 (0.0%) | 0 (0.0%) |
| 3 or 4 Unit Apartments | 0 (0.0%) | 14 (100.0%) |
| 5 to 9 Unit Apartments | 0 (0.0%) | 11 (100.0%) |
| 10 or more Apartments | 0 (0.0%) | 13 (100.0%) |
| Mobile Home / Other | 2 (50.0%) | 2 (50.0%) |
| Total | 100 (59.9%) | 67 (40.1%) |
Housing Structures by Number of Rooms in Duncombe
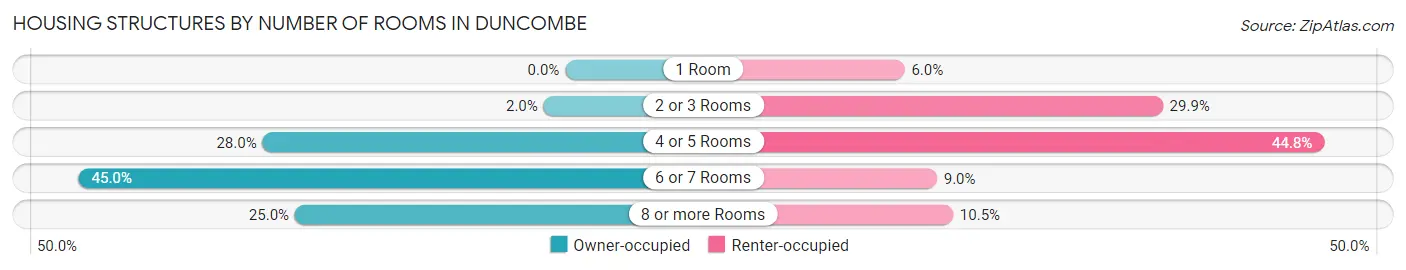
| Number of Rooms | Owner-occupied | Renter-occupied |
| 1 Room | 0 (0.0%) | 4 (6.0%) |
| 2 or 3 Rooms | 2 (2.0%) | 20 (29.8%) |
| 4 or 5 Rooms | 28 (28.0%) | 30 (44.8%) |
| 6 or 7 Rooms | 45 (45.0%) | 6 (9.0%) |
| 8 or more Rooms | 25 (25.0%) | 7 (10.4%) |
| Total | 100 (100.0%) | 67 (100.0%) |
Housing Structure by Heating Type in Duncombe
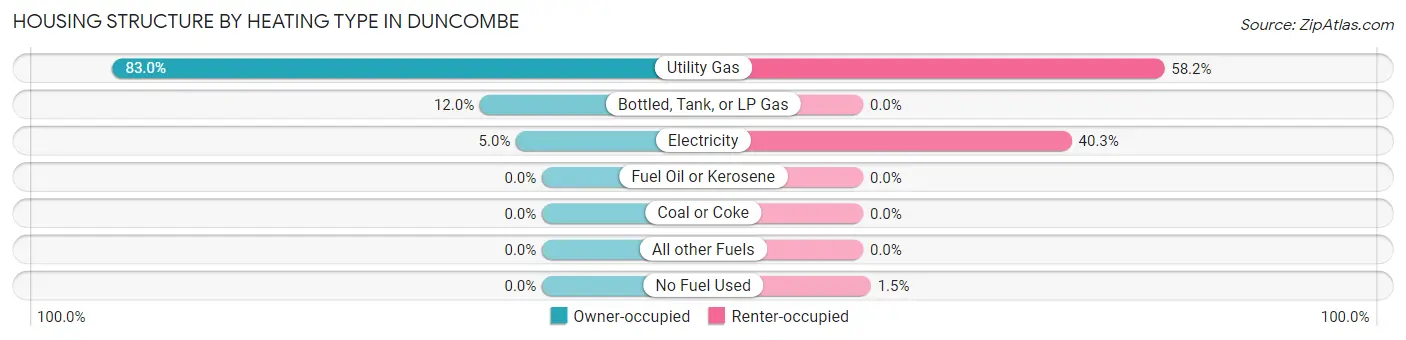
| Heating Type | Owner-occupied | Renter-occupied |
| Utility Gas | 83 (83.0%) | 39 (58.2%) |
| Bottled, Tank, or LP Gas | 12 (12.0%) | 0 (0.0%) |
| Electricity | 5 (5.0%) | 27 (40.3%) |
| Fuel Oil or Kerosene | 0 (0.0%) | 0 (0.0%) |
| Coal or Coke | 0 (0.0%) | 0 (0.0%) |
| All other Fuels | 0 (0.0%) | 0 (0.0%) |
| No Fuel Used | 0 (0.0%) | 1 (1.5%) |
| Total | 100 (100.0%) | 67 (100.0%) |
Household Vehicle Usage in Duncombe
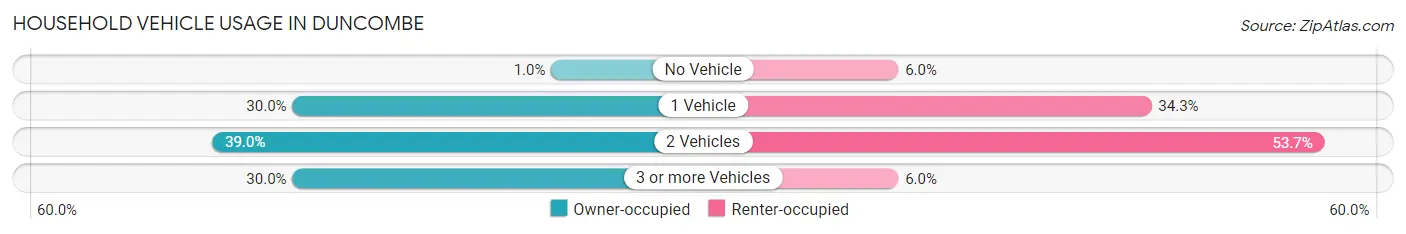
| Vehicles per Household | Owner-occupied | Renter-occupied |
| No Vehicle | 1 (1.0%) | 4 (6.0%) |
| 1 Vehicle | 30 (30.0%) | 23 (34.3%) |
| 2 Vehicles | 39 (39.0%) | 36 (53.7%) |
| 3 or more Vehicles | 30 (30.0%) | 4 (6.0%) |
| Total | 100 (100.0%) | 67 (100.0%) |
Real Estate & Mortgages in Duncombe
Real Estate and Mortgage Overview in Duncombe
| Characteristic | Without Mortgage | With Mortgage |
| Housing Units | 56 | 44 |
| Median Property Value | $104,200 | $98,300 |
| Median Household Income | $44,063 | $5 |
| Monthly Housing Costs | $614 | $0 |
| Real Estate Taxes | $1,365 | $0 |
Property Value by Mortgage Status in Duncombe
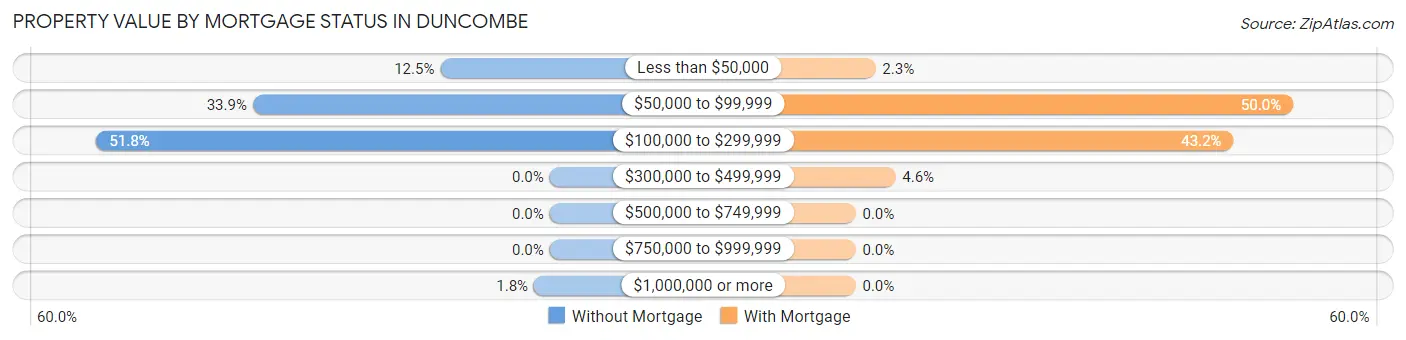
| Property Value | Without Mortgage | With Mortgage |
| Less than $50,000 | 7 (12.5%) | 1 (2.3%) |
| $50,000 to $99,999 | 19 (33.9%) | 22 (50.0%) |
| $100,000 to $299,999 | 29 (51.8%) | 19 (43.2%) |
| $300,000 to $499,999 | 0 (0.0%) | 2 (4.5%) |
| $500,000 to $749,999 | 0 (0.0%) | 0 (0.0%) |
| $750,000 to $999,999 | 0 (0.0%) | 0 (0.0%) |
| $1,000,000 or more | 1 (1.8%) | 0 (0.0%) |
| Total | 56 (100.0%) | 44 (100.0%) |
Household Income by Mortgage Status in Duncombe
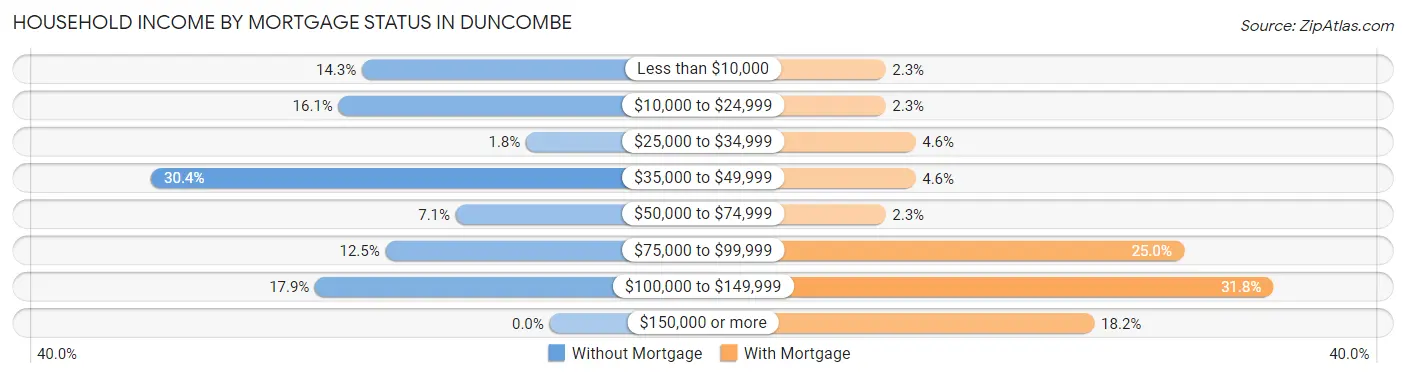
| Household Income | Without Mortgage | With Mortgage |
| Less than $10,000 | 8 (14.3%) | 1 (2.3%) |
| $10,000 to $24,999 | 9 (16.1%) | 1 (2.3%) |
| $25,000 to $34,999 | 1 (1.8%) | 2 (4.5%) |
| $35,000 to $49,999 | 17 (30.4%) | 2 (4.5%) |
| $50,000 to $74,999 | 4 (7.1%) | 1 (2.3%) |
| $75,000 to $99,999 | 7 (12.5%) | 11 (25.0%) |
| $100,000 to $149,999 | 10 (17.9%) | 14 (31.8%) |
| $150,000 or more | 0 (0.0%) | 8 (18.2%) |
| Total | 56 (100.0%) | 44 (100.0%) |
Property Value to Household Income Ratio in Duncombe
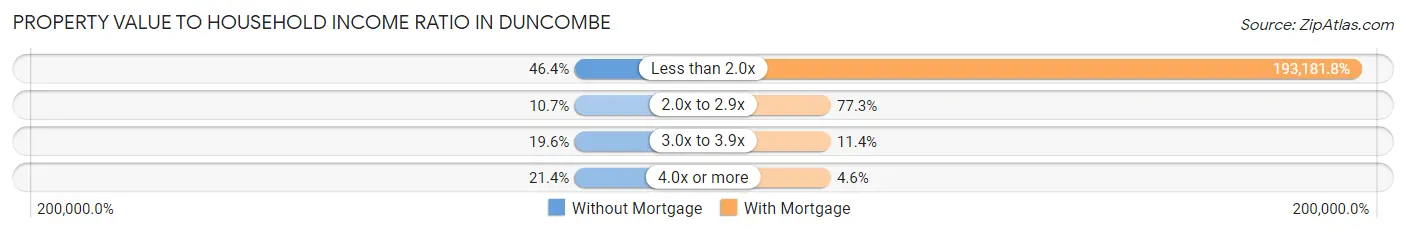
| Value-to-Income Ratio | Without Mortgage | With Mortgage |
| Less than 2.0x | 26 (46.4%) | 85,000 (193,181.8%) |
| 2.0x to 2.9x | 6 (10.7%) | 34 (77.3%) |
| 3.0x to 3.9x | 11 (19.6%) | 5 (11.4%) |
| 4.0x or more | 12 (21.4%) | 2 (4.5%) |
| Total | 56 (100.0%) | 44 (100.0%) |
Real Estate Taxes by Mortgage Status in Duncombe
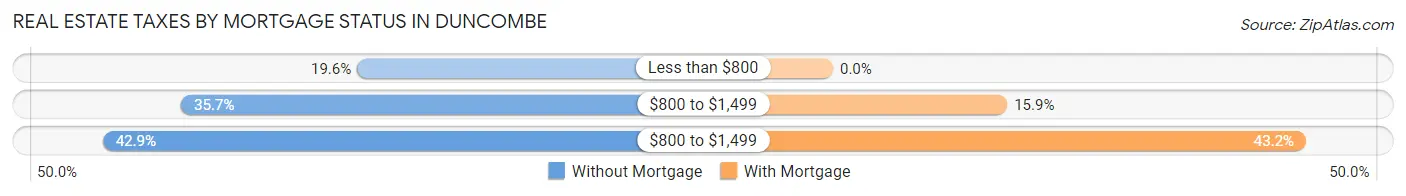
| Property Taxes | Without Mortgage | With Mortgage |
| Less than $800 | 11 (19.6%) | 0 (0.0%) |
| $800 to $1,499 | 20 (35.7%) | 7 (15.9%) |
| $800 to $1,499 | 24 (42.9%) | 19 (43.2%) |
| Total | 56 (100.0%) | 44 (100.0%) |
Health & Disability in Duncombe
Health Insurance Coverage by Age in Duncombe
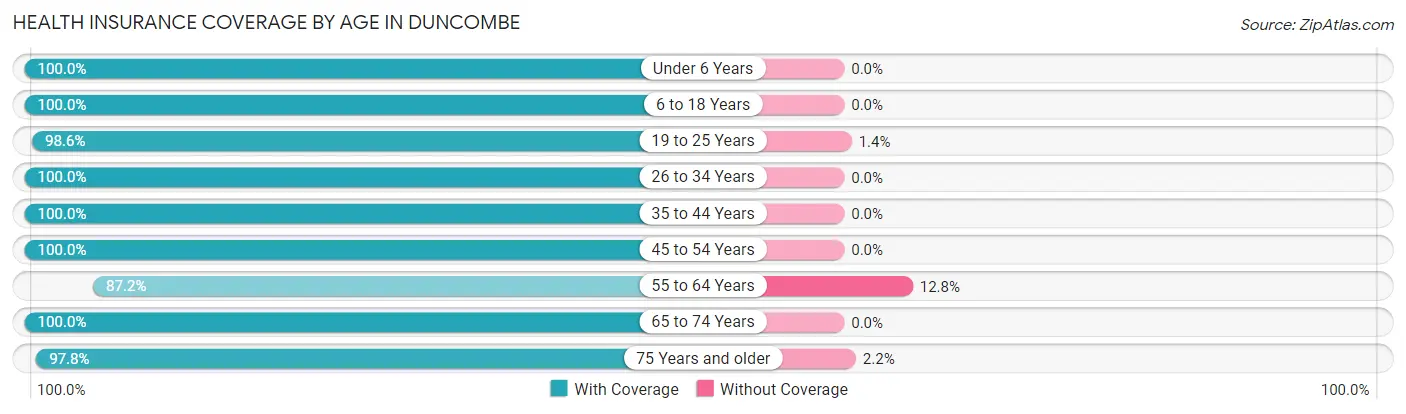
| Age Bracket | With Coverage | Without Coverage |
| Under 6 Years | 23 (100.0%) | 0 (0.0%) |
| 6 to 18 Years | 43 (100.0%) | 0 (0.0%) |
| 19 to 25 Years | 71 (98.6%) | 1 (1.4%) |
| 26 to 34 Years | 38 (100.0%) | 0 (0.0%) |
| 35 to 44 Years | 20 (100.0%) | 0 (0.0%) |
| 45 to 54 Years | 37 (100.0%) | 0 (0.0%) |
| 55 to 64 Years | 41 (87.2%) | 6 (12.8%) |
| 65 to 74 Years | 36 (100.0%) | 0 (0.0%) |
| 75 Years and older | 45 (97.8%) | 1 (2.2%) |
| Total | 354 (97.8%) | 8 (2.2%) |
Health Insurance Coverage by Citizenship Status in Duncombe
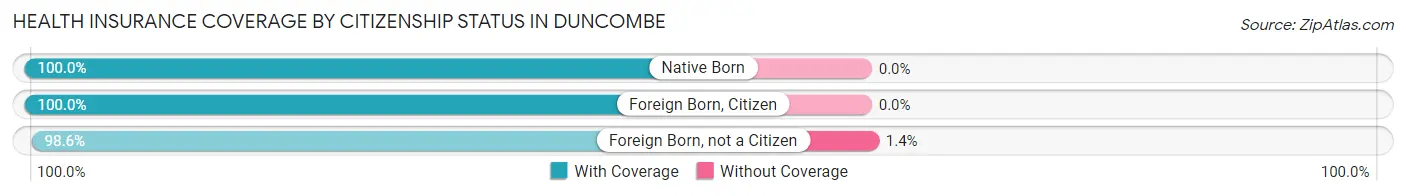
| Citizenship Status | With Coverage | Without Coverage |
| Native Born | 23 (100.0%) | 0 (0.0%) |
| Foreign Born, Citizen | 43 (100.0%) | 0 (0.0%) |
| Foreign Born, not a Citizen | 71 (98.6%) | 1 (1.4%) |
Health Insurance Coverage by Household Income in Duncombe
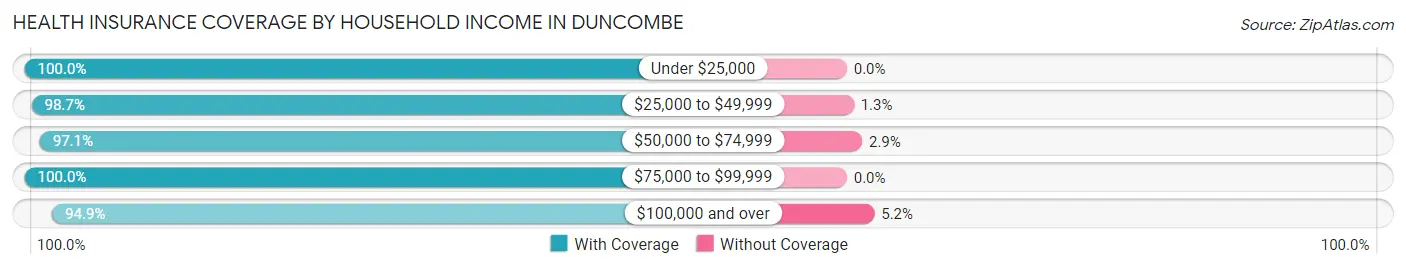
| Household Income | With Coverage | Without Coverage |
| Under $25,000 | 41 (100.0%) | 0 (0.0%) |
| $25,000 to $49,999 | 76 (98.7%) | 1 (1.3%) |
| $50,000 to $74,999 | 68 (97.1%) | 2 (2.9%) |
| $75,000 to $99,999 | 77 (100.0%) | 0 (0.0%) |
| $100,000 and over | 92 (94.9%) | 5 (5.1%) |
Public vs Private Health Insurance Coverage by Age in Duncombe
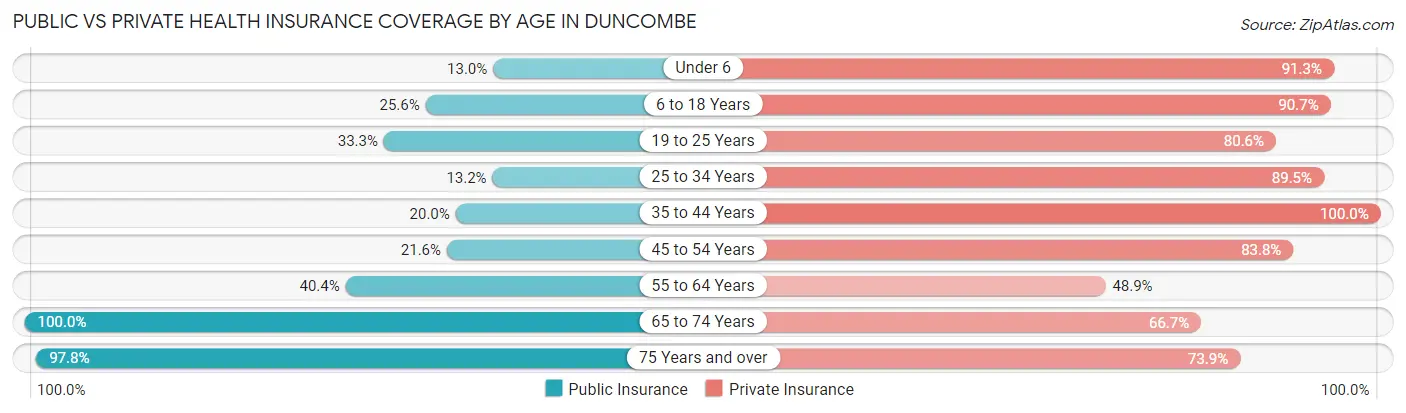
| Age Bracket | Public Insurance | Private Insurance |
| Under 6 | 3 (13.0%) | 21 (91.3%) |
| 6 to 18 Years | 11 (25.6%) | 39 (90.7%) |
| 19 to 25 Years | 24 (33.3%) | 58 (80.6%) |
| 25 to 34 Years | 5 (13.2%) | 34 (89.5%) |
| 35 to 44 Years | 4 (20.0%) | 20 (100.0%) |
| 45 to 54 Years | 8 (21.6%) | 31 (83.8%) |
| 55 to 64 Years | 19 (40.4%) | 23 (48.9%) |
| 65 to 74 Years | 36 (100.0%) | 24 (66.7%) |
| 75 Years and over | 45 (97.8%) | 34 (73.9%) |
| Total | 155 (42.8%) | 284 (78.4%) |
Disability Status by Sex by Age in Duncombe
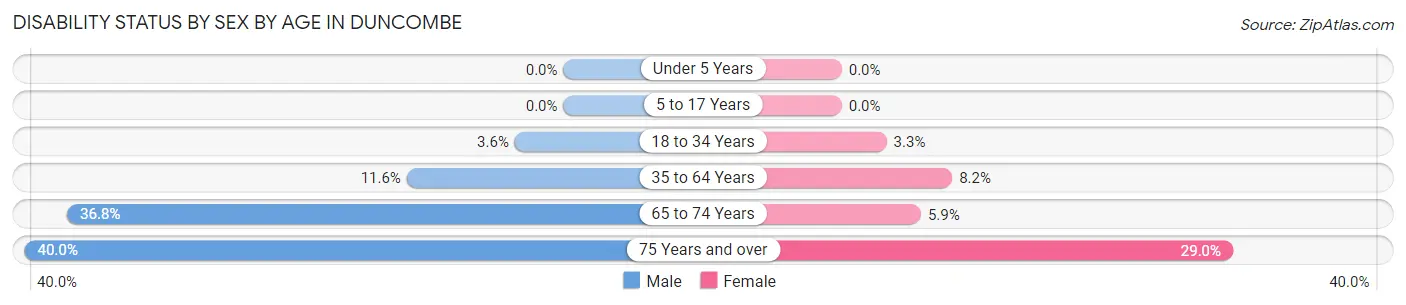
| Age Bracket | Male | Female |
| Under 5 Years | 0 (0.0%) | 0 (0.0%) |
| 5 to 17 Years | 0 (0.0%) | 0 (0.0%) |
| 18 to 34 Years | 3 (3.6%) | 1 (3.3%) |
| 35 to 64 Years | 5 (11.6%) | 5 (8.2%) |
| 65 to 74 Years | 7 (36.8%) | 1 (5.9%) |
| 75 Years and over | 6 (40.0%) | 9 (29.0%) |
Disability Class by Sex by Age in Duncombe
Disability Class: Hearing Difficulty
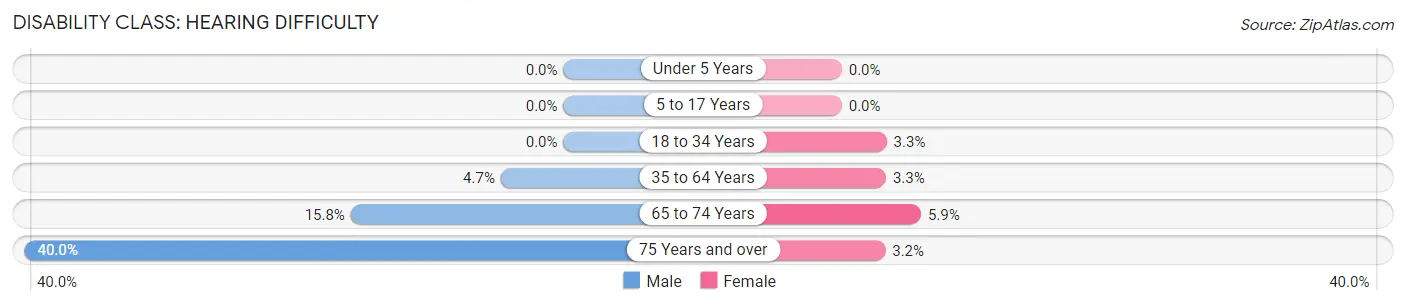
| Age Bracket | Male | Female |
| Under 5 Years | 0 (0.0%) | 0 (0.0%) |
| 5 to 17 Years | 0 (0.0%) | 0 (0.0%) |
| 18 to 34 Years | 0 (0.0%) | 1 (3.3%) |
| 35 to 64 Years | 2 (4.6%) | 2 (3.3%) |
| 65 to 74 Years | 3 (15.8%) | 1 (5.9%) |
| 75 Years and over | 6 (40.0%) | 1 (3.2%) |
Disability Class: Vision Difficulty
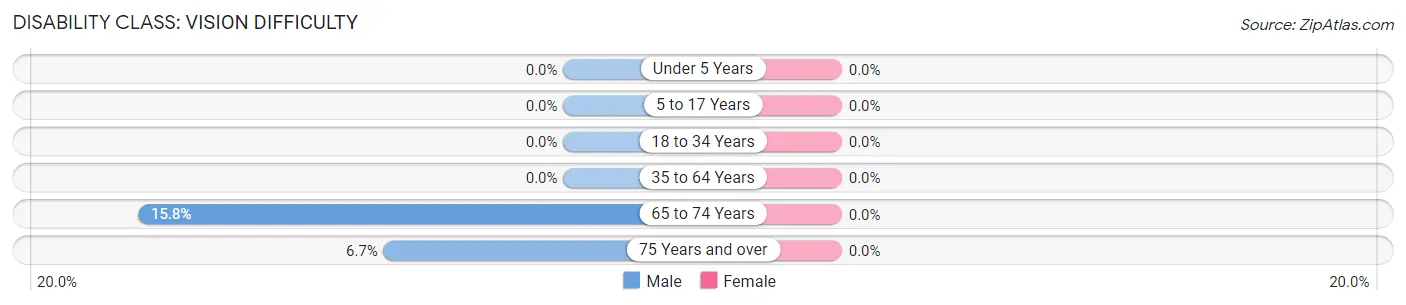
| Age Bracket | Male | Female |
| Under 5 Years | 0 (0.0%) | 0 (0.0%) |
| 5 to 17 Years | 0 (0.0%) | 0 (0.0%) |
| 18 to 34 Years | 0 (0.0%) | 0 (0.0%) |
| 35 to 64 Years | 0 (0.0%) | 0 (0.0%) |
| 65 to 74 Years | 3 (15.8%) | 0 (0.0%) |
| 75 Years and over | 1 (6.7%) | 0 (0.0%) |
Disability Class: Cognitive Difficulty
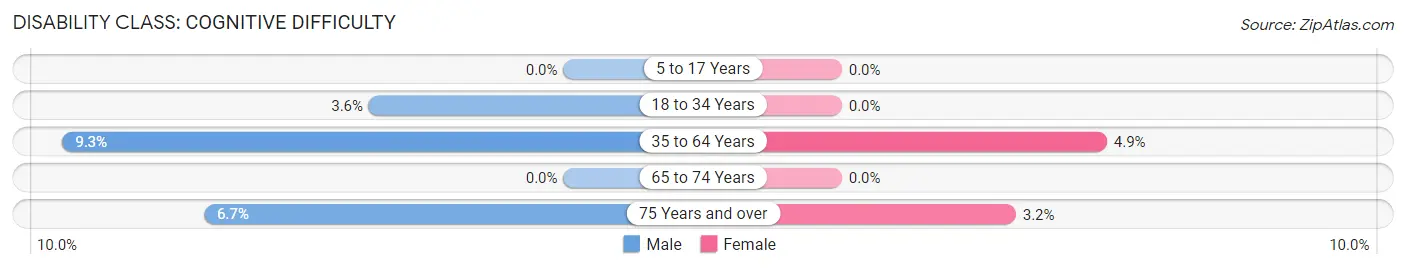
| Age Bracket | Male | Female |
| 5 to 17 Years | 0 (0.0%) | 0 (0.0%) |
| 18 to 34 Years | 3 (3.6%) | 0 (0.0%) |
| 35 to 64 Years | 4 (9.3%) | 3 (4.9%) |
| 65 to 74 Years | 0 (0.0%) | 0 (0.0%) |
| 75 Years and over | 1 (6.7%) | 1 (3.2%) |
Disability Class: Ambulatory Difficulty
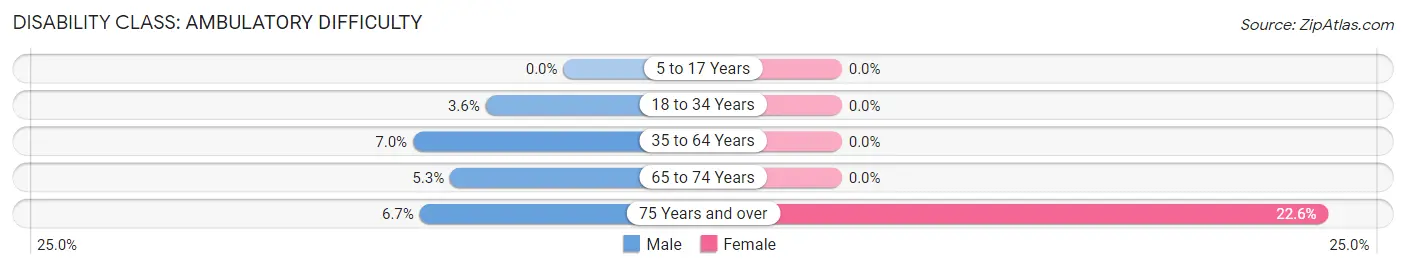
| Age Bracket | Male | Female |
| 5 to 17 Years | 0 (0.0%) | 0 (0.0%) |
| 18 to 34 Years | 3 (3.6%) | 0 (0.0%) |
| 35 to 64 Years | 3 (7.0%) | 0 (0.0%) |
| 65 to 74 Years | 1 (5.3%) | 0 (0.0%) |
| 75 Years and over | 1 (6.7%) | 7 (22.6%) |
Disability Class: Self-Care Difficulty
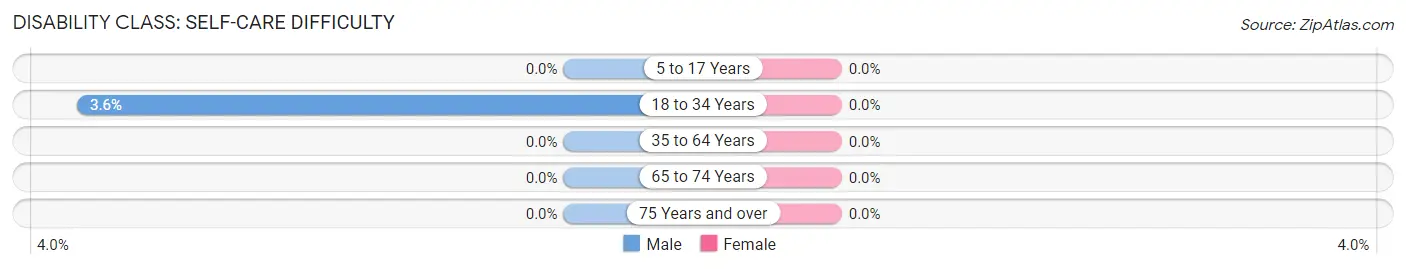
| Age Bracket | Male | Female |
| 5 to 17 Years | 0 (0.0%) | 0 (0.0%) |
| 18 to 34 Years | 3 (3.6%) | 0 (0.0%) |
| 35 to 64 Years | 0 (0.0%) | 0 (0.0%) |
| 65 to 74 Years | 0 (0.0%) | 0 (0.0%) |
| 75 Years and over | 0 (0.0%) | 0 (0.0%) |
Technology Access in Duncombe
Computing Device Access in Duncombe
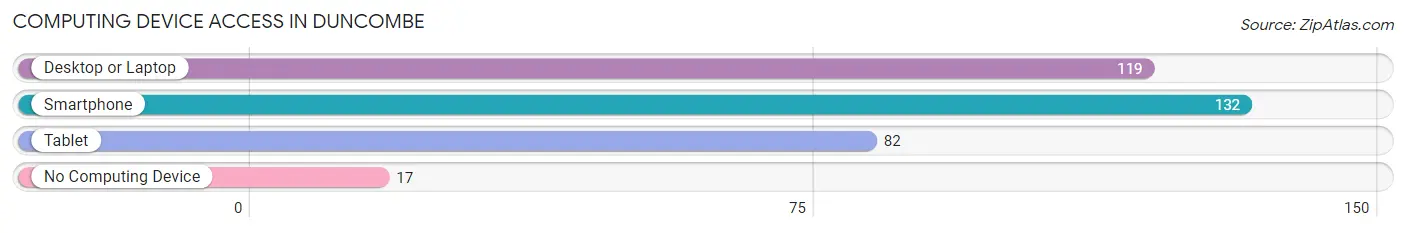
| Device Type | # Households | % Households |
| Desktop or Laptop | 119 | 71.3% |
| Smartphone | 132 | 79.0% |
| Tablet | 82 | 49.1% |
| No Computing Device | 17 | 10.2% |
| Total | 167 | 100.0% |
Internet Access in Duncombe
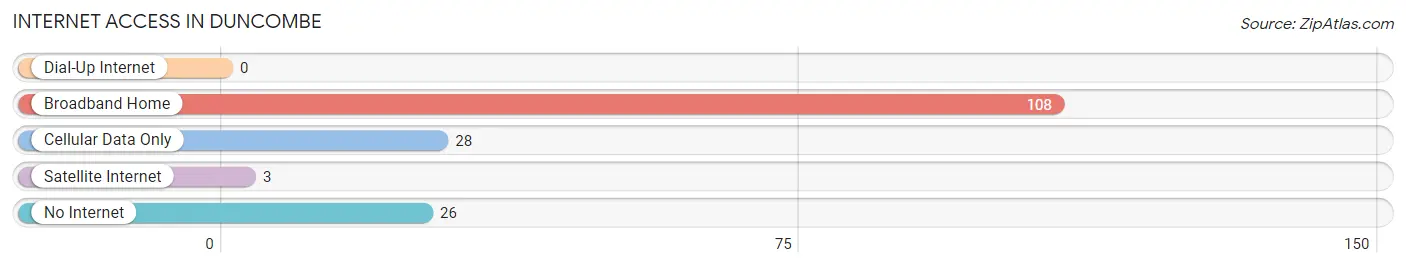
| Internet Type | # Households | % Households |
| Dial-Up Internet | 0 | 0.0% |
| Broadband Home | 108 | 64.7% |
| Cellular Data Only | 28 | 16.8% |
| Satellite Internet | 3 | 1.8% |
| No Internet | 26 | 15.6% |
| Total | 167 | 100.0% |
Duncombe Summary
Duncombe, Iowa is a small town located in Webster County, Iowa. It is situated on the banks of the Des Moines River, approximately 10 miles east of Fort Dodge. The town was founded in 1856 and has a population of approximately 500 people.
Geography
Duncombe is located in the rolling hills of northern Iowa, with an elevation of 1,068 feet above sea level. The town is situated on the banks of the Des Moines River, which provides a scenic backdrop for the town. The town is surrounded by farmland, with the nearest major city being Fort Dodge, located 10 miles to the west.
Climate
Duncombe has a humid continental climate, with hot summers and cold winters. The average high temperature in the summer is around 85 degrees Fahrenheit, while the average low temperature in the winter is around 10 degrees Fahrenheit. The town receives an average of 33 inches of precipitation per year, with most of it falling in the spring and summer months.
Demographics
As of the 2010 census, the population of Duncombe was 498 people. The racial makeup of the town was 97.2% White, 0.2% African American, 0.2% Native American, 0.4% Asian, 0.2% from other races, and 1.8% from two or more races. Hispanic or Latino of any race were 0.8% of the population.
Economy
The economy of Duncombe is largely based on agriculture. The town is home to several farms, which produce corn, soybeans, and other crops. The town also has a few small businesses, including a grocery store, a hardware store, and a few restaurants.
Education
Duncombe is served by the Southeast Webster-Grand Community School District. The district operates one elementary school, one middle school, and one high school. The town also has a public library, which is part of the Fort Dodge Public Library System.
Culture
Duncombe is a small, close-knit community with a strong sense of community pride. The town hosts several annual events, including the Duncombe Days Festival, which is held in June, and the Duncombe Fall Festival, which is held in October. The town also has a number of parks and recreational areas, including a public swimming pool, a skate park, and a disc golf course.
Conclusion
Duncombe, Iowa is a small town located in Webster County, Iowa. It is situated on the banks of the Des Moines River, approximately 10 miles east of Fort Dodge. The town was founded in 1856 and has a population of approximately 500 people. The economy of Duncombe is largely based on agriculture, with the town also having a few small businesses. The town is served by the Southeast Webster-Grand Community School District and has a public library. Duncombe is a small, close-knit community with a strong sense of community pride, and hosts several annual events.
Common Questions
What is Per Capita Income in Duncombe?
Per Capita income in Duncombe is $32,573.
What is the Median Family Income in Duncombe?
Median Family Income in Duncombe is $76,250.
What is the Median Household income in Duncombe?
Median Household Income in Duncombe is $58,438.
What is Income or Wage Gap in Duncombe?
Income or Wage Gap in Duncombe is 46.7%.
Women in Duncombe earn 53.3 cents for every dollar earned by a man.
What is Family Income Deficit in Duncombe?
Family Income Deficit in Duncombe is $2,133.
Families that are below poverty line in Duncombe earn $2,133 less on average than the poverty threshold level.
What is Inequality or Gini Index in Duncombe?
Inequality or Gini Index in Duncombe is 0.37.
What is the Total Population of Duncombe?
Total Population of Duncombe is 362.
What is the Total Male Population of Duncombe?
Total Male Population of Duncombe is 192.
What is the Total Female Population of Duncombe?
Total Female Population of Duncombe is 170.
What is the Ratio of Males per 100 Females in Duncombe?
There are 112.94 Males per 100 Females in Duncombe.
What is the Ratio of Females per 100 Males in Duncombe?
There are 88.54 Females per 100 Males in Duncombe.
What is the Median Population Age in Duncombe?
Median Population Age in Duncombe is 38.8 Years.
What is the Average Family Size in Duncombe
Average Family Size in Duncombe is 3.1 People.
What is the Average Household Size in Duncombe
Average Household Size in Duncombe is 2.2 People.
How Large is the Labor Force in Duncombe?
There are 199 People in the Labor Forcein in Duncombe.
What is the Percentage of People in the Labor Force in Duncombe?
65.5% of People are in the Labor Force in Duncombe.
What is the Unemployment Rate in Duncombe?
Unemployment Rate in Duncombe is 5.0%.